UNITED STATES
SECURITIES AND EXCHANGE COMMISSION
Washington, D.C. 20549
FORM N-CSR
CERTIFIED SHAREHOLDER REPORT OF REGISTERED MANAGEMENT
INVESTMENT COMPANIES
| | |
| Investment Company Act file number: | | 811-03981 |
| |
| Exact name of registrant as specified in charter: | | Prudential World Fund, Inc. |
| |
| Address of principal executive offices: | | Gateway Center 3, |
| | 100 Mulberry Street, |
| | Newark, New Jersey 07102 |
| |
| Name and address of agent for service: | | Deborah A. Docs |
| | Gateway Center 3, |
| | 100 Mulberry Street, |
| | Newark, New Jersey 07102 |
| |
| Registrant’s telephone number, including area code: | | 800-225-1852 |
| |
| Date of fiscal year end: | | 10/31/2012 |
| |
| Date of reporting period: | | 10/31/2012 |
Item 1 – Reports to Stockholders

PRUDENTIAL INVESTMENTS»MUTUAL FUNDS
PRUDENTIAL INTERNATIONAL EQUITY FUND
ANNUAL REPORT · OCTOBER 31, 2012
Fund Type
International Stock
Objective
Long-term growth of capital
This report is not authorized for distribution to prospective investors unless preceded or accompanied by a current prospectus.
The views expressed in this report and information about the Fund’s portfolio holdings are for the period covered by this report and are subject to change thereafter.
Prudential Investments, Prudential, the Prudential logo, the Rock symbol, and Bring Your Challenges are service marks of Prudential Financial, Inc. and its related entities, registered in many jurisdictions worldwide.

December 14, 2012
Dear Shareholder:
We hope you find the annual report for the Prudential International Equity Fund informative and useful. The report covers performance for the 12-month period that ended October 31, 2012.
We recognize that ongoing market volatility may make it a difficult time to be an investor. We continue to believe a prudent response to uncertainty is to maintain a diversified portfolio of funds consistent with your tolerance for risk, time horizon, and financial goals.
Your financial advisor can help you create a diversified investment plan that may include funds covering all the basic asset classes and that reflects your personal investor profile and risk tolerance. Keep in mind, however, that diversification and asset allocation strategies do not assure a profit or protect against loss in declining markets.
Prudential Investments® is dedicated to helping you solve your toughest investment challenges—whether it’s capital growth, reliable income, or protection from market volatility and other risks. We offer the expertise of Prudential Financial’s affiliated asset managers* that strive to be leaders in a broad range of funds to help you stay on course to the future you envision. They also manage money for major corporations and pension funds around the world, which means you benefit from the same expertise, innovation, and attention to risk demanded by today’s most sophisticated investors.
Thank you for choosing the Prudential Investments family of funds.
Sincerely,

Stuart S. Parker, President
Prudential International Equity Fund
*Most of Prudential Investments’ equity funds are advised by Jennison Associates LLC, Quantitative Management Associates LLC (QMA), or Prudential Real Estate Investors. Prudential Investments’ fixed income and money market funds are advised by Prudential Investment Management, Inc. (PIM) through its Prudential Fixed Income unit. Jennison Associates, QMA, and PIM are registered investment advisers and Prudential Financial companies. Prudential Real Estate Investors is a unit of PIM.
| | | | |
| Prudential International Equity Fund | | | 1 | |
Your Fund’s Performance
Performance data quoted represent past performance. Past performance does not guarantee future results. The investment return and principal value of an investment will fluctuate, so that an investor’s shares, when redeemed, may be worth more or less than their original cost. Current performance may be lower or higher than the past performance data quoted. An investor may obtain performance data as of the most recent month-end by visiting our website at www.prudentialfunds.com or by calling (800) 225-1852. Class A shares have a maximum initial sales charge of 5.50%. Gross operating expenses: Class A, 1.67%; Class B, 2.37%; Class C, 2.37%; Class F, 2.12%; Class X, 2.37%; Class Z, 1.37%. Net operating expenses: Class A, 1.67%; Class B, 2.37%; Class C, 2.37%; Class F, 2.12%; Class X, 2.37%; Class Z, 1.37%.
| | | | | | | | | | | | | | |
Cumulative Total Returns (Without Sales Charges) as of 10/31/12 |
| | | One Year | | | Five Years | | | Ten Years | | | Since Inception |
Class A | | | 7.40 | % | | | –33.84 | % | | | 91.27 | % | | — |
Class B | | | 6.50 | | | | –36.16 | | | | 77.43 | | | — |
Class C | | | 6.51 | | | | –36.15 | | | | 77.45 | | | — |
Class F | | | 6.98 | | | | –35.30 | | | | N/A | | | –23.59% (12/18/2006) |
Class X | | | 6.69 | | | | –36.05 | | | | N/A | | | –25.23 (3/19/2007) |
Class Z | | | 7.69 | | | | –33.03 | | | | 95.76 | | | — |
MSCI EAFE ND Index | | | 4.61 | | | | –25.88 | | | | 110.49 | | | — |
Lipper International Large-Cap Core Funds Average | | | 5.85 | | | | –24.96 | | | | 105.67 | | | — |
| | | | | | | | | | | | | | |
Average Annual Total Returns (With Sales Charges) as of 9/30/12 |
| | | One Year | | | Five Years | | | Ten Years | | | Since Inception |
Class A | | | 10.55 | % | | | –8.49 | % | | | 6.80 | % | | — |
Class B | | | 11.17 | | | | –8.28 | | | | 6.63 | | | — |
Class C | | | 15.17 | | | | –8.09 | | | | 6.64 | | | — |
Class F | | | 11.69 | | | | –8.01 | | | | N/A | | | –4.86% (12/18/2006) |
Class X | | | 10.17 | | | | –8.61 | | | | N/A | | | –5.63 (3/19/2007) |
Class Z | | | 17.44 | | | | –7.21 | | | | 7.65 | | | — |
MSCI EAFE ND Index | | | 13.75 | | | | –5.24 | | | | 8.20 | | | — |
Lipper International Large-Cap Core Funds Average | | | 15.37 | | | | –4.95 | | | | 7.78 | | | — |
| | |
| 2 | | Visit our website at www.prudentialfunds.com |
| | | | | | | | | | | | | | | | |
Average Annual Total Returns (With Sales Charges) as of 10/31/12 | |
| | | One Year | | | Five Years | | | Ten Years | | | Since Inception | |
Class A | | | 1.49 | % | | | –8.96 | % | | | 6.10 | % | | | — | |
Class B | | | 1.50 | | | | –8.75 | | | | 5.90 | | | | — | |
Class C | | | 5.51 | | | | –8.58 | | | | 5.90 | | | | — | |
Class F | | | 1.98 | | | | –8.50 | | | | N/A | | | | –4.62% (12/18/2006) | |
Class X | | | 0.69 | | | | –9.05 | | | | N/A | | | | –5.34 (3/19/2007) | |
Class Z | | | 7.69 | | | | –7.71 | | | | 6.95 | | | | — | |
| | | | | | | | | | | | | | | | |
Average Annual Total Returns (Without Sales Charges) as of 10/31/12 | |
| | | One Year | | | Five Years | | | Ten Years | | | Since Inception | |
Class A | | | 7.40 | % | | | –7.93 | % | | | 6.70 | % | | | — | |
Class B | | | 6.50 | | | | –8.58 | | | | 5.90 | | | | — | |
Class C | | | 6.51 | | | | –8.58 | | | | 5.90 | | | | — | |
Class F | | | 6.98 | | | | –8.34 | | | | N/A | | | | –4.48% (12/18/2006) | |
Class X | | | 6.69 | | | | –8.55 | | | | N/A | | | | –5.04 (3/19/2007) | |
Class Z | | | 7.69 | | | | –7.71 | | | | 6.95 | | | | — | |
Growth of a $10,000 Investment
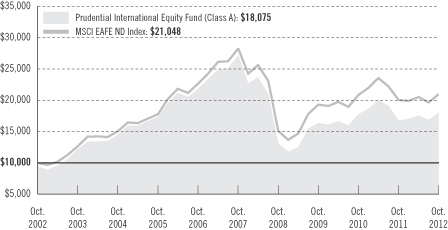
The graph compares a $10,000 investment in the Prudential International Equity Fund (Class A shares) with a similar investment in the MSCI EAFE ND Index by portraying the initial account values at the beginning of the 10-year period for Class A shares (October 31, 2002) and the account values at the end of the current fiscal year (October 31, 2012) as measured on a quarterly basis. For purposes of the graph, and unless otherwise indicated, it has been assumed that (a) the maximum applicable front-end sales charge was deducted from the initial $10,000 investment in Class A shares; (b) all recurring fees (including management fees) were deducted; and (c) all dividends and distributions were reinvested. The line graph provides information for Class A shares only.
| | | | |
| Prudential International Equity Fund | | | 3 | |
Your Fund’s Performance (continued)
As indicated in the tables provided earlier, performance for Class B, Class C, Class F, Class X, and Class Z shares will vary due to the differing charges and expenses applicable to each share class (as indicated in the following paragraphs). Without waiver of fees and/or expense reimbursement, if any, the returns would have been lower.
Total returns and the ending account values in the graph include changes in share price and reinvestment of dividends and capital gains distributions in a hypothetical investment for the periods shown. The Fund’s total returns do not reflect the deduction of income taxes on an individual’s investment. Taxes may reduce your actual investment returns on income or gains paid by the Fund or any gains you may realize if you sell your shares.
Source: Prudential Investments LLC and Lipper Inc.
Inception returns are provided for any share class with less than 10 calendar years of returns.
The average annual total returns take into account applicable sales charges. Class A shares are subject to a maximum front-end sales charge of 5.50% and a 12b-1 fee of 0.30%, annually. All investors who purchase Class A shares in an amount of $1 million or more and sell these shares within 12 months of purchase are subject to a contingent deferred sales charge (CDSC) of 1%. The Class A CDSC is waived for purchases by certain retirement or benefit plans. Under certain circumstances, an exchange may be made from specified share classes of the Fund to one or more other share classes of the Fund. Class B and Class F shares are subject to a declining CDSC of 5%, 4%, 3%, 2%, 1%, and 1%, respectively, for the first six years after purchase and 12b-1 fees of 1% and 0.75%, respectively, annually. Approximately seven years after purchase, Class B and Class F will automatically convert to Class A shares on a quarterly basis. Class C shares are not subject to a front-end sales charge, but charge a CDSC of 1% for shares sold within 12 months from the date of purchase and an annual 12b-1 fee of 1%. Class X shares purchased are not subject to a front-end sales charge, but charge a CDSC of 6% and a 12b-1 fee of 1%. The CDSC for Class X shares declines by 1% annually to 4% in the third and fourth year after purchase, 3% in the fifth year after purchase, 2% in the sixth and seventh year after purchase, 1% in the eighth year after purchase, and 0% in the ninth and 10th year after purchase. Class X shares convert to Class A shares on a monthly basis approximately 10 years after purchase. Class X shares are not offered to new purchases and are available only through exchanges from the same share class of certain other Prudential Investments mutual funds. The returns in the tables and graph reflect the share class expense structure in effect at the close of the fiscal period. The returns in the tables and graph do not reflect the deduction of taxes that a shareholder would pay on Fund distributions or following the redemption of Fund shares.
Benchmark Definitions
Morgan Stanley Capital International Europe, Australasia, and Far East ND Index
The Morgan Stanley Capital International Europe, Australasia, and Far East Net Dividend (MSCI EAFE ND) Index is an unmanaged, weighted index of performance that reflects stock price movements of developed-country markets in Europe, Australasia, and the Far East. The ND version of the MSCI EAFE Index reflects the impact of the maximum withholding taxes on reinvested dividends. MSCI EAFE ND Index Closest Month-End to Inception cumulative total returns as of 10/31/12 are –12.84% for Class F and –16.25% for Class X. MSCI EAFE ND Index Closest Month-End to Inception average annual total returns as of 9/30/12 are –2.50% for Class F and –3.32% for Class X.
| | |
| 4 | | Visit our website at www.prudentialfunds.com |
Lipper International Large-Cap Core Funds Average
The Lipper International Large-Cap Core Funds Average (Lipper Average) represents returns based on an average return of all funds in the Lipper International Large-Cap Core Funds category. Funds in the Lipper Average invest at least 75% of their equity assets in companies strictly outside of the United States with market capitalizations (on a three-year weighted basis) greater than the 250th largest company in the S&P Developed ex-U.S. Broad Market Index (BMI). Large-Cap Core funds typically have an average price-to-cash-flow ratio, price-to-book ratio, and three-year sales-per-share-growth value compared with the S&P Developed ex-U.S. BMI. Lipper Average Closest Month-End to Inception cumulative total returns as of 10/31/12 are –10.94% for Class F and –14.08% for Class X. Lipper Average Closest Month-End to Inception average annual total returns as of 9/30/12 are –2.17% for Class F and –2.91% for Class X.
Investors cannot invest directly in an index or average. The returns for the Index would be lower if they included the effects of sales charges, operating expenses of a mutual fund, or taxes. Returns for the Lipper Average reflect the deduction of operating expenses, but not sales charges or taxes.
| | | | |
Five Largest Holdings in Long-Term Portfolio expressed as a percentage of net assets as of 10/31/12 | | | | |
Roche Holding AG, Pharmaceuticals | | | 1.7 | % |
Nestle SA, Food Products | | | 1.6 | |
BP PLC, Oil, Gas & Consumable Fuels | | | 1.6 | |
Sanofi, Pharmaceuticals | | | 1.6 | |
HSBC Holdings PLC, Commercial Banks | | | 1.4 | |
Holdings reflect only long-term investments and are subject to change.
| | | | |
Five Largest Industries in Long-Term Portfolio expressed as a percentage of net assets as of 10/31/12 | |
Commercial Banks | | | 12.1 | % |
Pharmaceuticals | | | 8.6 | |
Oil, Gas & Consumable Fuels | | | 7.7 | |
Insurance | | | 5.6 | |
Metals & Mining | | | 5.5 | |
Industry weightings reflect only long-term investments and are subject to change.
| | | | |
| Prudential International Equity Fund | | | 5 | |
Strategy and Performance Overview
How did the Fund perform?
Prudential International Equity Fund’s Class A shares gained 7.40% for the 12-month reporting period ended October 31, 2012, outperforming the 4.61% gain of the Morgan Stanley Capital International Europe, Australasia, and Far East Net Dividend Index (MSCI EAFE ND Index) and the 5.85% gain of the Lipper International Large-Cap Core Funds Average.
How did international stock markets perform?
| | • | | Against the background of European debt crises and very sluggish global growth, the international equity markets performed remarkably well as measured by the MSCI EAFE ND Index, which gauges stock markets of economically developed nations other than the United States and Canada. |
| | • | | International markets got off to a slow start and October 2011 stock gains became November losses as European debt levels continued to spiral while the growth rates of European nations slowed. |
| | • | | Uncertainty surrounding the euro zone’s ability to reach a long-term debt crisis solution dominated the headlines for much of first quarter 2012. Standard & Poor’s downgraded the debt of France and nine other euro zone countries and concerns mounted that Greece would default on its sovereign debt. But in late February, the European Central Bank introduced a second three-year lending program to European banks, and in March Greece pushed through one of the largest sovereign debt restructurings in history, bringing some relief to financial markets looking for an indication that progress toward a political solution was being made. |
| | • | | At the end of March, U.S. markets continued to lead international markets primarily due to the perception that many parts of the world had reentered a recession while the U.S. economy showed a slow, but steady, recovery. However, while global markets generally declined in March, most held on to year-to-date gains. |
| | • | | European stocks suffered their worst month of the reporting period in May after concerns mounted that Greece might be forced to pull out of the euro zone and the Spanish banking crisis escalated. |
| | • | | In September, the European Central Bank announced a bond program to purchase, without limit, the debt of struggling governments in an effort to overcome the three-year debt crisis. The action, coming on top of already low government bond yields, boosted investor confidence that the euro zone would not collapse and encouraged investment in the equity market. |
| | |
| 6 | | Visit our website at www.prudentialfunds.com |
| | • | | In October, some of the uncertainties surrounding Europe receded as progress resolving the European debt crisis grew, helping international markets to outperform U.S. markets. The MSCI EAFE ND Index was up for the month while the S&P 500 Index was negative. |
| | • | | The bulk of the value added in the Fund during the reporting period came from the United Kingdom, Germany, and Japan, while an underperformance in Australia limited the added value. |
How did international stock market sectors perform?
| | • | | There was significant disparity in sector returns over the reporting period. Healthcare, consumer staples, and financials posted double-digit gains. In comparison, telecommunications and information technology had single-digit losses. |
| | • | | The Fund uses a well-diversified core strategy that seeks to pick the best stocks in each sector. The Fund maintains a balance between slow-growing value stocks and fast-growing growth stocks. This process added positively to the Fund’s performance in sectors that were down significantly, including technology and utilities, as well as in sectors that experienced significant gains, such as financials. |
| | • | | From a sector perspective, contributions to Fund performance were broad based. Information technology, consumer discretionary, financials, energy, and utilities made solid contributions, while materials and telecommunications modestly detracted. |
Among slowly growing companies, which stocks or related group of stocks contributed most and detracted most from the Fund’s return?
| | • | | QMA places a heavier emphasis on valuation factors, such as price-to-earnings (P/E) and price-to-book (P/B) ratios, when evaluating slower-growing stocks. For faster-growing stocks, QMA’s process places a heavier weighting on news or information about earnings and sales growth. This allows the Fund to potentially add value throughout the full range from slow- to fast-growing companies. |
| | • | | During the past year, equity markets oscillated between optimism and pessimism depending upon whether the European sovereign debt crisis was perceived to be improving or deteriorating. These crosscurrents constrained both slow- and fast-growing stocks. Slow-growing stocks generated essentially benchmark returns, while the faster-growing stocks did only slightly better than the benchmark for the year as a whole. |
| | | | |
| Prudential International Equity Fund | | | 7 | |
Strategy and Performance Overview (continued)
| | • | | The Fund’s sweet spot was in stocks which grew a little slower, although not significantly slower, than average. The returns of this group slightly lagged the benchmark, but the Fund’s holdings in the group significantly outperformed the benchmark. For example, in consumer discretionary and technology, the Fund’s holdings posted double-digit returns although the benchmark had negative returns. Within consumer discretionary, the Fund held an overweight to ITV, which posted a 39% gain. Within technology, the Fund held an overweight to ASML, which advanced 13%. In financials, the Fund held an overweight to Hannover Rueckversicherung and Legal & General, which gained 31% and 22%, respectively. |
| | • | | Among the slowest-growing companies, value added was greatest in industrials where the Fund held an overweight to Yangzijiang Shipbuilding, which returned 48%. |
Among rapidly growing companies, which stocks or related group of stocks contributed most and detracted most from the Fund’s return?
| | • | | The value added of both the Fund’s slowest- and fastest-growing stocks was very modest. The slowest-growing 20% of stocks added about 10 basis points (a basis point is a one-hundredth of a percent), while the fastest-growing 20% detracted by 10 basis points. |
| | • | | Among the fast-growing companies, the Fund did best in information technology with an underweight to Canon, which lost 30%. |
| | |
| 8 | | Visit our website at www.prudentialfunds.com |
Fees and Expenses (Unaudited)
As a shareholder of the Fund, you incur two types of costs: (1) transaction costs, including sales charges (loads) on purchase payments and redemptions, as applicable, and (2) ongoing costs, including management fees, distribution, and/or service (12b-1) fees, and other Fund expenses, as applicable. This example is intended to help you understand your ongoing costs (in dollars) of investing in the Fund and to compare these costs with the ongoing costs of investing in other mutual funds.
The example is based on an investment of $1,000 invested on May 1, 2012, at the beginning of the period, and held through the six-month period ended October 31, 2012. The example is for illustrative purposes only; you should consult the Prospectus for information on initial and subsequent minimum investment requirements.
The Fund’s transfer agent may charge additional fees to holders of certain accounts that are not included in the expenses shown in the table on the following page. These fees apply to individual retirement accounts (IRAs) and Section 403(b) accounts. As of the close of the six-month period covered by the table, IRA fees included an annual maintenance fee of $15 per account (subject to a maximum annual maintenance fee of $25 for all accounts held by the same shareholder). Section 403(b) accounts are charged an annual $25 fiduciary maintenance fee. Some of the fees may vary in amount, or may be waived, based on your total account balance or the number of Prudential Investments funds, including the Fund, that you own. You should consider the additional fees that were charged to your Fund account over the six-month period when you estimate the total ongoing expenses paid over the period and the impact of these fees on your ending account value, as these additional expenses are not reflected in the information provided in the expense table. Additional fees have the effect of reducing investment returns.
Actual Expenses
The first line for each share class in the table on the following page provides information about actual account values and actual expenses. You may use the information on this line, together with the amount you invested, to estimate the expenses that you paid over the period. Simply divide your account value by $1,000 (for example, an $8,600 account value ÷ $1,000 = 8.6), then multiply the result by the number on the first line under the heading “Expenses Paid During the Six-Month Period” to estimate the expenses you paid on your account during this period.
Hypothetical Example for Comparison Purposes
The second line for each share class in the table on the following page provides information about hypothetical account values and hypothetical expenses based on
| | | | |
| Prudential International Equity Fund | | | 9 | |
Fees and Expenses (continued)
the Fund’s actual expense ratio and an assumed rate of return of 5% per year before expenses, which is not the Fund’s actual return. The hypothetical account values and expenses may not be used to estimate the actual ending account balance or expenses you paid for the period. You may use this information to compare the ongoing costs of investing in the Fund and other funds. To do so, compare this 5% hypothetical example with the 5% hypothetical examples that appear in the shareholder reports of the other funds.
Please note that the expenses shown in the table are meant to highlight your ongoing costs only and do not reflect any transactional costs such as sales charges (loads). Therefore, the second line for each share class in the table is useful in comparing ongoing costs only and will not help you determine the relative total costs of owning different funds. In addition, if these transactional costs were included, your costs would have been higher.
| | | | | | | | | | | | | | | | | | |
Prudential
International
Equity Fund | | Beginning Account
Value
May 1, 2012 | | | Ending Account
Value
October 31, 2012 | | | Annualized
Expense Ratio
Based on the
Six-Month Period | | | Expenses Paid
During the
Six-Month Period* | |
| | | | | | | | | | | | | | | | | | |
| Class A | | Actual | | $ | 1,000.00 | | | $ | 1,023.80 | | | | 1.63 | % | | $ | 8.29 | |
| | | Hypothetical | | $ | 1,000.00 | | | $ | 1,016.94 | | | | 1.63 | % | | $ | 8.26 | |
| | | | | | | | | | | | | | | | | | |
| Class B | | Actual | | $ | 1,000.00 | | | $ | 1,019.40 | | | | 2.33 | % | | $ | 11.83 | |
| | | Hypothetical | | $ | 1,000.00 | | | $ | 1,013.42 | | | | 2.33 | % | | $ | 11.79 | |
| | | | | | | | | | | | | | | | | | |
| Class C | | Actual | | $ | 1,000.00 | | | $ | 1,019.40 | | | | 2.33 | % | | $ | 11.83 | |
| | | Hypothetical | | $ | 1,000.00 | | | $ | 1,013.42 | | | | 2.33 | % | | $ | 11.79 | |
| | | | | | | | | | | | | | | | | | |
| Class F | | Actual | | $ | 1,000.00 | | | $ | 1,021.20 | | | | 2.08 | % | | $ | 10.57 | |
| | | Hypothetical | | $ | 1,000.00 | | | $ | 1,014.68 | | | | 2.08 | % | | $ | 10.53 | |
| | | | | | | | | | | | | | | | | | |
| Class X | | Actual | | $ | 1,000.00 | | | $ | 1,021.20 | | | | 2.33 | % | | $ | 11.84 | |
| | | Hypothetical | | $ | 1,000.00 | | | $ | 1,013.42 | | | | 2.33 | % | | $ | 11.79 | |
| | | | | | | | | | | | | | | | | | |
| Class Z | | Actual | | $ | 1,000.00 | | | $ | 1,025.30 | | | | 1.33 | % | | $ | 6.77 | |
| | | Hypothetical | | $ | 1,000.00 | | | $ | 1,018.45 | | | | 1.33 | % | | $ | 6.75 | |
*Fund expenses (net of fee waivers or subsidies, if any) for each share class are equal to the annualized expense ratio for each share class (provided in the table), multiplied by the average account value over the period, multiplied by the 184 days in the six-month period ended October 31, 2012, and divided by the 366 days in the Fund’s fiscal year ended October 31, 2012 (to reflect the six-month period). Expenses presented in the table include the expenses of any underlying funds in which the Fund may invest.
| | |
| 10 | | Visit our website at www.prudentialfunds.com |
Portfolio of Investments
as of October 31, 2012
| | | | | | |
| Shares | | Description | | Value (Note 1) | |
LONG-TERM INVESTMENTS 99.7% | | | | |
COMMON STOCKS 97.4% | | | | |
| |
Australia 7.6% | | | | |
| 42,286 | | Australia & New Zealand Banking Group Ltd. | | $ | 1,117,133 | |
| 68,867 | | BHP Billiton Ltd. | | | 2,448,455 | |
| 110,045 | | Centro Retail Australia | | | 245,600 | |
| 431,934 | | CFS Retail Property Trust | | | 876,566 | |
| 32,964 | | Commonwealth Bank of Australia | | | 1,976,115 | |
| 1,310 | | CSL Ltd. | | | 64,593 | |
| 423,447 | | Fortescue Metals Group Ltd.(a) | | | 1,793,410 | |
| 326,656 | | GPT Group | | | 1,207,150 | |
| 85,476 | | Iluka Resources Ltd.(a) | | | 880,190 | |
| 78,509 | | Incitec Pivot Ltd. | | | 257,530 | |
| 96,497 | | Insurance Australia Group Ltd. | | | 459,777 | |
| 155,019 | | Lend Lease Group | | | 1,395,161 | |
| 30,262 | | National Australia Bank Ltd. | | | 810,157 | |
| 16,967 | | Ramsay Health Care Ltd. | | | 418,477 | |
| 4,214 | | Rio Tinto Ltd. | | | 249,076 | |
| 325,304 | | SP AusNet | | | 357,945 | |
| 46,172 | | Wesfarmers Ltd. | | | 1,666,494 | |
| 627,843 | | Westfield Retail Trust | | | 2,020,380 | |
| 128,500 | | Westpac Banking Corp. | | | 3,402,781 | |
| | | | | | |
| | | | | 21,646,990 | |
| |
Austria 0.2% | | | | |
| 124,862 | | Immofinanz Immobilien Anlagen | | | 482,280 | |
| |
Belgium 0.6% | | | | |
| 20,457 | | Anheuser-Busch InBev NV | | | 1,710,495 | |
| 1,939 | | Delhaize Group SA | | | 74,127 | |
| | | | | | |
| | | | | 1,784,622 | |
| |
Brazil 0.7% | | | | |
| 2,300 | | Companhia Brasileira de Meios de Pagamento | | | 56,904 | |
| 10,600 | | Multiplus SA | | | 246,283 | |
| 12,300 | | Natura Cosmeticos SA | | | 327,931 | |
| 35,531 | | Vale SA (Class B Stock), ADR(a) | | | 650,928 | |
| 42,912 | | Vale SA (Preference) (Class B Stock), ADR | | | 763,405 | |
| | | | | | |
| | | | | 2,045,451 | |
| |
China 0.8% | | | | |
| 438,000 | | China Construction Bank Corp. (Class H Stock) | | | 330,052 | |
See Notes to Financial Statements.
| | | | |
| Prudential International Equity Fund | | | 11 | |
Portfolio of Investments
as of October 31, 2012 continued
| | | | | | |
| Shares | | Description | | Value (Note 1) | |
COMMON STOCKS (Continued) | | | | |
| |
China (cont’d.) | | | | |
| 1,454,000 | | China Minsheng Banking Corp. Ltd. (Class H Stock) | | $ | 1,322,662 | |
| 91,000 | | China Petroleum & Chemical Corp. (Class H Stock) | | | 96,636 | |
| 388,000 | | PICC Property & Casualty Co. Ltd. (Class H Stock) | | | 516,663 | |
| 42,200 | | Zoomlion Heavy Industry Science & Technology Co. Ltd. (Class H Stock) | | | 56,847 | |
| | | | | | |
| | | | | 2,322,860 | |
| |
Colombia 0.1% | | | | |
| 3,600 | | Ecopetrol SA, ADR(a) | | | 213,156 | |
| |
Denmark 1.1% | | | | |
| 6,123 | | Coloplast A/S (Class B Stock) | | | 1,342,616 | |
| 5,463 | | DSV A/S | | | 122,827 | |
| 9,580 | | Novo Nordisk A/S (Class B Stock) | | | 1,543,859 | |
| | | | | | |
| | | | | 3,009,302 | |
| |
Finland 1.5% | | | | |
| 16,935 | | Kone OYJ (Class B Stock) | | | 1,212,747 | |
| 22,980 | | Metso OYJ | | | 806,290 | |
| 50,441 | | Orion OYJ (Class B Stock) | | | 1,247,426 | |
| 28,993 | | Sampo OYJ (Class A Stock) | | | 908,662 | |
| | | | | | |
| | | | | 4,175,125 | |
| |
France 8.3% | | | | |
| 80,880 | | AXA SA | | | 1,285,765 | |
| 24,791 | | Cap Gemini SA | | | 1,042,063 | |
| 9,582 | | Casino Guichard Perrachon SA | | | 836,835 | |
| 17,011 | | CIE Generale DES Etablissements Michelin | | | 1,460,946 | |
| 11,374 | | Dassault Systemes SA | | | 1,198,404 | |
| 36,362 | | Eiffage SA | | | 1,249,190 | |
| 55,060 | | European Aeronautic Defence and Space Co. NV(a) | | | 1,956,131 | |
| 27,756 | | France Telecom SA | | | 309,463 | |
| 73,678 | | GDF Suez | | | 1,690,778 | |
| 1,982 | | ICADE | | | 178,362 | |
| 7,398 | | Imerys SA | | | 415,629 | |
| 6,988 | | Publicis Groupe | | | 376,473 | |
| 16,206 | | Rexel SA | | | 293,339 | |
| 50,437 | | Sanofi | | | 4,433,634 | |
| 16,350 | | Schneider Electric SA | | | 1,022,193 | |
| 2,667 | | Societe BIC SA | | | 325,217 | |
See Notes to Financial Statements.
| | |
| 12 | | Visit our website at www.prudentialfunds.com |
| | | | | | |
| Shares | | Description | | Value (Note 1) | |
COMMON STOCKS (Continued) | | | | |
| |
France (cont’d.) | | | | |
| 2,946 | | Technip SA | | $ | 331,822 | |
| 76,524 | | Total SA | | | 3,850,401 | |
| 1,040 | | Unibail-Rodamco SE | | | 234,348 | |
| 9,411 | | Vinci SA | | | 416,501 | |
| 29,119 | | Vivendi SA | | | 595,763 | |
| | | | | | |
| | | | | 23,503,257 | |
| |
Germany 7.6% | | | | |
| 6,535 | | Adidas AG | | | 556,752 | |
| 8,014 | | Allianz SE | | | 993,648 | |
| 41,361 | | BASF SE | | | 3,427,272 | |
| 29,679 | | Bayer AG | | | 2,584,680 | |
| 9,697 | | Continental AG | | | 971,937 | |
| 6,732 | | Deutsche Bank AG | | | 305,135 | |
| 43,554 | | Deutsche Post AG | | | 863,436 | |
| 94,526 | | Deutsche Telekom AG | | | 1,079,272 | |
| 2,785 | | Fresenius SE & Co. KGaA | | | 317,659 | |
| 24,409 | | Hannover Rueckversicherung AG | | | 1,716,970 | |
| 2,565 | | K+S AG | | | 121,348 | |
| 27,014 | | Lanxess AG | | | 2,231,442 | |
| 5,208 | | Linde AG | | | 875,853 | |
| 9,621 | | Muenchener Rueckversicherungs AG | | | 1,546,303 | |
| 26,226 | | SAP AG | | | 1,910,386 | |
| 55,395 | | Suedzucker AG | | | 2,146,456 | |
| | | | | | |
| | | | | 21,648,549 | |
| |
Hong Kong 3.8% | | | | |
| 508,500 | | BOC Hong Kong Holdings Ltd. | | | 1,564,858 | |
| 46,200 | | Cheung Kong Holdings Ltd. | | | 682,563 | |
| 91,000 | | Cheung Kong Infrastructure Holdings Ltd. | | | 533,081 | |
| 558,000 | | China Citic Bank Corp. Ltd. (Class H Stock) | | | 285,118 | |
| 205,000 | | China Overseas Land & Investment Ltd. | | | 536,964 | |
| 483,000 | | Franshion Properties China Ltd. | | | 147,704 | |
| 234,000 | | Galaxy Entertainment Group Ltd.* | | | 804,653 | |
| 374,750 | | Great Wall Motor Co. Ltd. (Class H Stock) | | | 1,029,951 | |
| 47,000 | | Hysan Development Co. Ltd. | | | 207,708 | |
| 39,500 | | Kerry Properties Ltd. | | | 195,970 | |
| 229,500 | | Link REIT (The) | | | 1,141,570 | |
| 152,000 | | MMG Ltd.* | | | 60,407 | |
| 70,000 | | Power Assets Holdings Ltd. | | | 595,222 | |
See Notes to Financial Statements.
| | | | |
| Prudential International Equity Fund | | | 13 | |
Portfolio of Investments
as of October 31, 2012 continued
| | | | | | |
| Shares | | Description | | Value (Note 1) | |
COMMON STOCKS (Continued) | | | | |
| |
Hong Kong (cont’d.) | | | | |
| 86,000 | | Sino Land Co. Ltd. | | $ | 154,022 | |
| 75,000 | | Sun Hung Kai Properties Ltd. | | | 1,044,187 | |
| 231,000 | | Wharf Holdings Ltd. | | | 1,581,222 | |
| 1,478,000 | | Yuexiu Property Co. Ltd. | | | 406,209 | |
| | | | | | |
| | | | | 10,971,409 | |
| |
India 0.2% | | | | |
| 25,158 | | Tata Motors Ltd., ADR | | | 607,566 | |
| |
Indonesia 0.2% | | | | |
| 25,500 | | PT Astra Agro Lestari TBK | | | 55,619 | |
| 414,000 | | PT Bank Rakyat Indonesia Persero TBK | | | 318,959 | |
| 394,000 | | PT Indofood Sukses Makmur TBK | | | 233,816 | |
| | | | | | |
| | | | | 608,394 | |
| |
Israel 0.5% | | | | |
| 869 | | Delek Group Ltd. | | | 165,246 | |
| 50,844 | | Israel Chemicals Ltd. | | | 636,262 | |
| 913 | | Mellanox Technologies Ltd.* | | | 69,280 | |
| 10,218 | | Teva Pharmaceutical Industries Ltd. | | | 415,177 | |
| 3,400 | | Teva Pharmaceutical Industries Ltd., ADR | | | 137,428 | |
| | | | | | |
| | | | | 1,423,393 | |
| |
Italy 2.3% | | | | |
| 505,443 | | ENEL SpA | | | 1,899,866 | |
| 123,484 | | ENI SpA | | | 2,834,536 | |
| 113,867 | | Fiat Industrial SpA | | | 1,233,097 | |
| 70,822 | | Fiat SpA* | | | 345,151 | |
| 5,128 | | Luxottica Group SpA | | | 195,078 | |
| | | | | | |
| | | | | 6,507,728 | |
| |
Japan 17.6% | | | | |
| 74,400 | | AEON Co. Ltd. | | | 811,755 | |
| 38,000 | | All Nippon Airways Co. Ltd. | | | 80,446 | |
| 427,000 | | Aozora Bank Ltd. | | | 1,203,495 | |
| 27,600 | | Central Japan Railway Co. | | | 2,375,197 | |
| 57,000 | | Chiyoda Corp. | | | 919,654 | |
| 116,000 | | Daicel Corp. | | | 696,029 | |
| 15,000 | | Daihatsu Motor Co. Ltd. | | | 262,683 | |
| 15,000 | | Daiwa House Industry Co. Ltd. | | | 227,170 | |
See Notes to Financial Statements.
| | |
| 14 | | Visit our website at www.prudentialfunds.com |
| | | | | | |
| Shares | | Description | | Value (Note 1) | |
COMMON STOCKS (Continued) | | | | |
| |
Japan (cont’d.) | | | | |
| 8,300 | | Dena Co. Ltd.(a) | | $ | 258,992 | |
| 13,000 | | Denso Corp. | | | 406,952 | |
| 10,500 | | East Japan Railway Co. | | | 720,782 | |
| 178,000 | | Fuji Heavy Industries Ltd. | | | 1,710,209 | |
| 16,460 | | Hakuhodo DY Holdings, Inc. | | | 985,579 | |
| 140,000 | | Hino Motors Ltd. | | | 1,080,296 | |
| 49,200 | | Hitachi Construction Machinery Co. Ltd.(a) | | | 807,982 | |
| 30,000 | | Hitachi High-Technologies Corp. | | | 656,520 | |
| 78,100 | | Hitachi Ltd. | | | 413,833 | |
| 6,300 | | Idemitsu Kosan Co. Ltd. | | | 542,165 | |
| 11,000 | | Isuzu Motors Ltd. | | | 58,149 | |
| 72,300 | | Itochu Corp. | | | 723,634 | |
| 4,300 | | Itochu Techno-Solutions Corp. | | | 222,460 | |
| 78,500 | | Japan Tobacco, Inc. | | | 2,169,247 | |
| 11,000 | | JGC Corp. | | | 378,241 | |
| 35,200 | | KDDI Corp. | | | 2,733,809 | |
| 1,200 | | Keyence Corp. | | | 318,377 | |
| 25,100 | | Kuraray Co. Ltd. | | | 291,466 | |
| 193,722 | | Marubeni Corp. | | | 1,254,594 | |
| 300,300 | | Mitsubishi UFJ Financial Group, Inc. | | | 1,357,989 | |
| 1,790 | | Mitsubishi UFJ Lease & Finance Co. Ltd. | | | 77,134 | |
| 989,200 | | Mizuho Financial Group, Inc. | | | 1,548,916 | |
| 74,000 | | Namco Bandai Holdings, Inc. | | | 1,162,420 | |
| 87,000 | | Nippon Express Co. Ltd. | | | 318,226 | |
| 53,100 | | Nippon Telegraph & Telephone Corp. | | | 2,417,869 | |
| 3,500 | | Nitto Denko Corp. | | | 158,712 | |
| 66 | | NTT DoCoMo, Inc. | | | 96,979 | |
| 3,400 | | Oriental Land Co. Ltd. | | | 463,811 | |
| 2,840 | | ORIX Corp. | | | 291,720 | |
| 18,300 | | Otsuka Corp. | | | 1,492,334 | |
| 2,300 | | Otsuka Holdings Co. Ltd. | | | 70,847 | |
| 294,600 | | Resona Holdings, Inc. | | | 1,273,168 | |
| 23,500 | | Sega Sammy Holdings, Inc. | | | 443,035 | |
| 31,000 | | Seven & I Holdings Co. Ltd. | | | 956,057 | |
| 4,900 | | Shimamura Co. Ltd. | | | 510,685 | |
| 15,400 | | Shimano, Inc. | | | 970,337 | |
| 73,200 | | SoftBank Corp. | | | 2,317,129 | |
| 15,300 | | Sony Corp. | | | 182,841 | |
| 87,500 | | Sumitomo Corp. | | | 1,192,534 | |
| 51,100 | | Sumitomo Mitsui Financial Group, Inc. | | | 1,564,429 | |
See Notes to Financial Statements.
| | | | |
| Prudential International Equity Fund | | | 15 | |
Portfolio of Investments
as of October 31, 2012 continued
| | | | | | |
| Shares | | Description | | Value (Note 1) | |
COMMON STOCKS (Continued) | | | | |
| |
Japan (cont’d.) | | | | |
| 190,000 | | Sumitomo Mitsui Trust Holdings, Inc. | | $ | 575,974 | |
| 41,900 | | Suzuki Motor Corp. | | | 948,957 | |
| 74,600 | | Toyoda Gosei Co., Ltd. | | | 1,467,143 | |
| 19,800 | | Toyota Boshoku Corp. | | | 187,260 | |
| 31,434 | | Toyota Motor Corp. | | | 1,206,880 | |
| 86,100 | | Toyota Tsusho Corp. | | | 1,878,820 | |
| 20,800 | | West Japan Railway Co. | | | 908,030 | |
| 4,539 | | Yahoo! Japan Corp. | | | 1,561,898 | |
| 11,700 | | Yokogawa Electric Corp. | | | 133,078 | |
| | | | | | |
| | | | | 50,044,928 | |
| |
Mexico 0.1% | | | | |
| 106,900 | | Grupo Mexico SAB de CV | | | 342,890 | |
| |
Netherlands 4.6% | | | | |
| 57,352 | | Aegon NV | | | 320,241 | |
| 20,997 | | ASML Holding NV | | | 1,155,282 | |
| 362 | | Gemalto NV | | | 32,666 | |
| 14,320 | | Heineken Holding NV | | | 726,654 | |
| 2,856 | | Heineken NV(a) | | | 176,075 | |
| 150,417 | | Koninklijke Ahold NV | | | 1,915,111 | |
| 4,436 | | Koninklijke DSM NV | | | 227,774 | |
| 46,399 | | Koninklijke Philips Electronics NV | | | 1,160,095 | |
| 102,546 | | Royal Dutch Shell PLC (Class A Stock) | | | 3,516,553 | |
| 76,244 | | Royal Dutch Shell PLC (Class B Stock) | | | 2,695,184 | |
| 34,592 | | Unilever NV - CVA | | | 1,270,209 | |
| | | | | | |
| | | | | 13,195,844 | |
| |
Norway 1.6% | | | | |
| 45,695 | | Seadrill Ltd. | | | 1,849,825 | |
| 37,578 | | Statoil ASA | | | 928,690 | |
| 39,346 | | Yara International ASA | | | 1,853,671 | |
| | | | | | |
| | | | | 4,632,186 | |
| |
Philippines 0.3% | | | | |
| 1,121,900 | | Alliance Global Group, Inc. | | | 405,240 | |
| 44,820 | | San Miguel Corp. | | | 118,700 | |
| 159,810 | | Universal Robina Corp. | | | 278,926 | |
| | | | | | |
| | | | | 802,866 | |
See Notes to Financial Statements.
| | |
| 16 | | Visit our website at www.prudentialfunds.com |
| | | | | | |
| Shares | | Description | | Value (Note 1) | |
COMMON STOCKS (Continued) | | | | |
| |
Portugal 0.1% | | | | |
| 164,930 | | EDP - Energias de Portugal SA | | $ | 448,068 | |
| |
Russia 1.1% | | | | |
| 15,460 | | Gazprom OAO, ADR | | | 141,227 | |
| 9,507 | | LUKOIL OAO, ADR | | | 574,698 | |
| 11,645 | | Sberbank of Russia, OTC, ADR | | | 135,664 | |
| 61,681 | | Sberbank of Russia, XLON, ADR | | | 725,369 | |
| 3,628 | | Sistema JSFC, GDR | | | 66,574 | |
| 165,549 | | Surgutneftegas OAO, ADR | | | 1,440,276 | |
| | | | | | |
| | | | | 3,083,808 | |
| |
Singapore 1.4% | | | | |
| 284,000 | | ComfortDelGro Corp. Ltd. | | | 393,474 | |
| 12,000 | | DBS Group Holdings Ltd. | | | 136,744 | |
| 1,469,000 | | Golden Agri-Resources Ltd. | | | 752,685 | |
| 93,000 | | Keppel Corp. Ltd. | | | 812,740 | |
| 347,000 | | Keppel Land Ltd. | | | 967,208 | |
| 25,000 | | Oversea-Chinese Banking Corp. Ltd. | | | 186,506 | |
| 1,043,000 | | Yangzijiang Shipbuilding Holdings Ltd. | | | 773,827 | |
| | | | | | |
| | | | | 4,023,184 | |
| |
South Africa 1.0% | | | | |
| 9,732 | | Assore Ltd. | | | 401,822 | |
| 10,746 | | Bidvest Group Ltd. | | | 256,484 | |
| 310,455 | | FirstRand Ltd. | | | 1,030,476 | |
| 33,528 | | Imperial Holdings Ltd. | | | 761,690 | |
| 2,400 | | Kumba Iron Ore Ltd., ADR | | | 50,088 | |
| 16,837 | | MTN Group Ltd. | | | 303,587 | |
| | | | | | |
| | | | | 2,804,147 | |
| |
South Korea 1.6% | | | | |
| 5,090 | | Hyundai Marine & Fire Insurance Co. Ltd. | | | 164,517 | |
| 6,988 | | Hyundai Motor Co. | | | 1,438,480 | |
| 2,266 | | Hyundai Motor Co., GDR | | | 69,793 | |
| 16,360 | | Kia Motors Corp. | | | 909,056 | |
| 46,680 | | Korea Exchange Bank* | | | 323,584 | |
| 7,028 | | KT&G Corp. | | | 535,510 | |
| 400 | | Lotte Shopping Co. Ltd. | | | 123,785 | |
| 1,630 | | Samsung Electronics Co. Ltd., GDR | | | 978,956 | |
| | | | | | |
| | | | | 4,543,681 | |
See Notes to Financial Statements.
| | | | |
| Prudential International Equity Fund | | | 17 | |
Portfolio of Investments
as of October 31, 2012 continued
| | | | | | |
| Shares | | Description | | Value (Note 1) | |
COMMON STOCKS (Continued) | | | | |
| |
Spain 2.9% | | | | |
| 22,460 | | ACS Actividades de Construccion y Servicios SA(a) | | $ | 479,464 | |
| 11,066 | | Amadeus IT Holding SA (Class A Stock) | | | 273,953 | |
| 169,386 | | Banco Santander SA | | | 1,270,966 | |
| 66,998 | | Enagas | | | 1,332,110 | |
| 40,506 | | Ferrovial SA | | | 572,267 | |
| 66,650 | | Gas Natural SDG SA | | | 1,034,063 | |
| 246,996 | | Iberdrola SA | | | 1,277,367 | |
| 10,155 | | Inditex SA | | | 1,295,700 | |
| 11,228 | �� | Red Electrica Corp. SA | | | 526,458 | |
| 14,483 | | Repsol YPF SA | | | 289,465 | |
| | | | | | |
| | | | | 8,351,813 | |
| |
Sweden 2.7% | | | | |
| 13,976 | | Boliden AB | | | 244,210 | |
| 36,067 | | Hexagon AB (Class B Stock) | | | 829,776 | |
| 88,352 | | Sandvik AB | | | 1,225,465 | |
| 186,987 | | Skandinaviska Enskilda Banken (Class A Stock) | | | 1,550,496 | |
| 22,115 | | Svenska Handelsbanken AB (Class A Stock) | | | 757,516 | |
| 134,025 | | Swedbank AB (Class A Stock) | | | 2,485,349 | |
| 46,397 | | Volvo AB (Class B Stock) | | | 624,302 | |
| | | | | | |
| | | | | 7,717,114 | |
| |
Switzerland 7.2% | | | | |
| 6,011 | | Actelion Ltd. | | | 289,932 | |
| 249 | | Banque Cantonale Vaudoise | | | 131,946 | |
| 28,420 | | Cie Financiere Richemont SA | | | 1,843,196 | |
| 819 | | Geberit AG | | | 168,848 | |
| 71,763 | | Nestle SA | | | 4,554,057 | |
| 44,681 | | Novartis AG | | | 2,689,112 | |
| 25,619 | | Roche Holding AG | | | 4,926,837 | |
| 3,429 | | Swiss Life Holding AG | | | 431,525 | |
| 39,839 | | Swiss Re AG | | | 2,752,754 | |
| 2,213 | | Swisscom AG | | | 919,370 | |
| 912 | | Syngenta AG | | | 356,261 | |
| 9,056 | | Transocean Ltd. | | | 412,202 | |
| 3,337 | | UBS AG | | | 50,021 | |
| 3,852 | | Zurich Financial Services AG | | | 949,247 | |
| | | | | | |
| | | | | 20,475,308 | |
See Notes to Financial Statements.
| | |
| 18 | | Visit our website at www.prudentialfunds.com |
| | | | | | |
| Shares | | Description | | Value (Note 1) | |
COMMON STOCKS (Continued) | | | | |
| |
Taiwan 0.9% | | | | |
| 62,000 | | Asustek Computer, Inc. | | $ | 664,305 | |
| 347,000 | | Eva Airways Corp.* | | | 201,340 | |
| 411,000 | | Hon Hai Precision Industry Co. Ltd. | | | 1,247,949 | |
| 78,780 | | Realtek Semiconductor Corp. | | | 148,323 | |
| 479,000 | | TECO Electric And Machinery Co. Ltd. | | | 325,482 | |
| | | | | | |
| | | | | 2,587,399 | |
| |
Thailand 0.2% | | | | |
| 188,375 | | Krung Thai Bank PCL | | | 110,628 | |
| 3,700 | | PTT PCL | | | 38,388 | |
| 58,300 | | Siam Commercial Bank PCL | | | 306,242 | |
| | | | | | |
| | | | | 455,258 | |
| |
United Kingdom 18.5% | | | | |
| 435,535 | | Aberdeen Asset Management PLC | | | 2,280,748 | |
| 14,577 | | Admiral Group PLC | | | 260,644 | |
| 28,651 | | Anglo American PLC | | | 879,869 | |
| 4,097 | | ARM Holdings PLC | | | 43,967 | |
| 73,600 | | AstraZeneca PLC | | | 3,417,690 | |
| 41,643 | | Babcock International Group PLC | | | 657,235 | |
| 282,277 | | BAE Systems PLC | | | 1,422,158 | |
| 512,983 | | Barclays PLC | | | 1,883,319 | |
| 7,903 | | BG Group PLC | | | 146,347 | |
| 74,997 | | BHP Billiton PLC | | | 2,402,998 | |
| 623,016 | | BP PLC | | | 4,456,937 | |
| 43,767 | | British American Tobacco | | | 2,167,973 | |
| 532,347 | | BT Group PLC (Class A Stock) | | | 1,825,548 | |
| 64,540 | | Capita PLC | | | 753,021 | |
| 75,925 | | Diageo PLC | | | 2,169,916 | |
| 142,909 | | GlaxoSmithKline PLC | | | 3,197,562 | |
| 409,384 | | HSBC Holdings PLC | | | 4,022,028 | |
| 36,939 | | Imperial Tobacco Group PLC | | | 1,394,892 | |
| 626,686 | | ITV PLC | | | 875,299 | |
| 194,817 | | J Sainsbury PLC | | | 1,114,821 | |
| 300,774 | | Legal & General Group PLC | | | 650,406 | |
| 182,878 | | National Grid PLC | | | 2,085,034 | |
| 7,332 | | Next PLC | | | 421,933 | |
| 432,176 | | Old Mutual PLC | | | 1,199,578 | |
| 9,646 | | Petrofac Ltd. | | | 249,684 | |
| 53,187 | | Prudential PLC | | | 728,277 | |
See Notes to Financial Statements.
| | | | |
| Prudential International Equity Fund | | | 19 | |
Portfolio of Investments
as of October 31, 2012 continued
| | | | | | |
| Shares | | Description | | Value (Note 1) | |
COMMON STOCKS (Continued) | | | | |
| |
United Kingdom (cont’d.) | | | | |
| 22,454 | | Reckitt Benckiser Group PLC | | $ | 1,358,828 | |
| 49,597 | | Rio Tinto PLC | | | 2,484,772 | |
| 7,535 | | Sabmiller PLC | | | 322,779 | |
| 7,565 | | Smiths Group PLC | | | 128,918 | |
| 5,950 | | SSE PLC | | | 139,035 | |
| 74,013 | | Standard Chartered PLC | | | 1,747,995 | |
| 116,692 | | Standard Life PLC | | | 549,874 | |
| 52,385 | | Tate & Lyle PLC | | | 613,738 | |
| 23,107 | | Tesco PLC | | | 119,270 | |
| 2,925 | | TMK OAO, GDR | | | 43,378 | |
| 39,411 | | TUI Travel PLC | | | 159,636 | |
| 12,729 | | Unilever PLC | | | 474,716 | |
| 580,049 | | Vodafone Group PLC | | | 1,574,923 | |
| 173,539 | | WM Morrison Supermarkets PLC | | | 750,256 | |
| 93,937 | | Xstrata PLC | | | 1,484,237 | |
| | | | | | |
| | | | | 52,660,239 | |
| |
United States 0.1% | | | | |
| 400 | | Credicorp Ltd. | | | 51,736 | |
| 1,634 | | Millicom International Cellular SA | | | 141,157 | |
| | | | | | |
| | | | | 192,893 | |
| | | | | | |
| | Total common stocks
(cost $242,686,807) | | | 277,311,708 | |
| | | | | | |
EXCHANGE TRADED FUND 1.0% | | | | |
| |
United States | | | | |
| 50,100 | | iShares MSCI EAFE Index Fund
(cost $2,475,280) | | | 2,683,857 | |
| | | | | | |
PREFERRED STOCKS 1.3% | | | | |
| | |
Brazil 0.4% | | | | | | |
| 9,900 | | AES Tiete SA | | | 112,451 | |
| 22,200 | | Marcopolo SA | | | 130,180 | |
| 45,700 | | Vale SA (Class Preference Stock) | | | 817,899 | |
| | | | | | |
| | | | | 1,060,530 | |
| |
Germany 0.7% | | | | |
| 7,304 | | Henkel AG & Co. KGaA | | | 583,263 | |
| 7,124 | | Volkswagen AG | | | 1,473,702 | |
| | | | | | |
| | | | | 2,056,965 | |
See Notes to Financial Statements.
| | |
| 20 | | Visit our website at www.prudentialfunds.com |
| | | | | | |
| Shares | | Description | | Value (Note 1) | |
PREFERRED STOCKS (Continued) | | | | |
| |
South Korea 0.2% | | | | |
| 1,786 | | Hyundai Motor Co. - 1st Offering | | $ | 109,394 | |
| 8,343 | | Hyundai Motor Co. - 2nd Offering | | | 546,969 | |
| | | | | | |
| | | | | 656,363 | |
| | | | | | |
| | Total preferred stocks
(cost $3,470,277) | | | 3,773,858 | |
| | | | | | |
| | |
| Units | | | | | |
RIGHT | | | | | | |
| | |
Spain | | | | | | |
| 169,366 | | Banco Santander SA
(cost $0)* | | | 33,367 | |
| | | | | | |
| | Total long-term investments
(cost $248,632,364) | | | 283,802,790 | |
| | | | | | |
| |
Principal
Amount (000) | | | |
SHORT-TERM INVESTMENTS 2.9% | | | | |
| |
United State Government Security 0.1% | | | | |
| $ 150 | | U.S. Treasury Bill 0.100%, 12/20/12
(cost $149,980)(b)(c) | | | 149,980 | |
| | | | | | |
| | |
| Shares | | | | | |
| |
Affiliated Money Market Mutual Fund 2.8% | | | | |
| 7,963,741 | | Prudential Investment Portfolios 2 - Prudential Core Taxable Money Market Fund
(cost $7,963,741; includes $7,172,123 of cash collateral received for securities on loan) (Note 3)(d)(e) | | | 7,963,741 | |
| | | | | | |
| | Total short-term investments
(cost $8,113,703) | | | 8,113,721 | |
| | | | | | |
| | Total Investments 102.6%
(cost $256,746,085; Note 5) | | | 291,916,511 | |
| | Liabilities in excess of other assets(f) (2.6%) | | | (7,331,053 | ) |
| | | | | | |
| | Net Assets 100.0% | | $ | 284,585,459 | |
| | | | | | |
See Notes to Financial Statements.
| | | | |
| Prudential International Equity Fund | | | 21 | |
Portfolio of Investments
as of October 31, 2012 continued
The following abbreviations are used in the portfolio descriptions:
ADR—American Depositary Receipt
CVA—Certificate Van Aandelen (Bearer)
GDR—Global Depositary Receipt
OTC—Over-the-Counter
REIT—Real Estate Investment Trust
XLON—London Stock Exchange
| * | Non-income producing security. |
| (a) | All or a portion of security is on loan. The aggregate market value of such securities, including those sold and pending settlement, is $6,584,492; cash collateral of $7,172,123 (included in liabilities) was received with which the Fund purchased highly liquid short-term investments. |
| (b) | Represents security, or a portion thereof, segregated as collateral for futures contract. |
| (c) | Rate quoted represents yield-to-maturity as of purchase date. |
| (d) | Prudential Investments LLC, the manager of the Series, also serves as manager of the Prudential Investment Portfolios 2 - Prudential Core Taxable Money Market Fund. |
| (e) | Represents security, or a portion thereof, purchased with cash collateral received for securities on loan. |
| (f) | Includes net unrealized appreciation (depreciation) on the following derivative contracts held at reporting period end: |
Open futures contracts outstanding at October 31, 2012:
| | | | | | | | | | | | | | | | | | | | |
Number of
Contracts | | | Type | | Expiration
Date | | | Value at
October 31,
2012 | | | Value at
Trade
Date | | | Unrealized
Appreciation/
(Depreciation) | |
| | | | Long Positions: | | | | | | | | | | | | | | | | |
| | 3 | | | DAX Index | | | Dec. 2012 | | | $ | 706,819 | | | $ | 718,955 | | | $ | (12,136 | ) |
| | 6 | | | TOPIX Index | | | Dec. 2012 | | | | 556,934 | | | | 552,115 | | | | 4,819 | |
| | | | | | | | | | | | | | | | | | | | |
| | | | | | | | | | | | | | | | | | $ | (7,317 | ) |
| | | | | | | | | | | | | | | | | | | | |
Various inputs are used in determining the value of the Series’ investments. These inputs are summarized in the three broad levels listed below.
Level 1—quoted prices generally in active markets for identical securities.
Level 2—other significant observable inputs including, but not limited to, quoted prices for similar securities, interest rates and yield curves, prepayment speeds, foreign currency exchange rates and amortized cost.
Level 3—significant unobservable inputs for securities valued in accordance with Board approved fair valuation procedures.
See Notes to Financial Statements.
| | |
| 22 | | Visit our website at www.prudentialfunds.com |
The following is a summary of the inputs used as of October 31, 2012 in valuing such portfolio securities:
| | | | | | | | | | | | |
| | | Level 1 | | | Level 2 | | | Level 3 | |
Investments in Securities | | | | | | | | | | | | |
Common Stocks | | | | | | | | | | | | |
Australia | | $ | 21,646,990 | | | $ | — | | | $ | — | |
Austria | | | 482,280 | | | | — | | | | — | |
Belgium | | | 1,784,622 | | | | — | | | | — | |
Brazil | | | 2,045,451 | | | | — | | | | — | |
China | | | 2,322,860 | | | | — | | | | — | |
Colombia | | | 213,156 | | | | — | | | | — | |
Denmark | | | 3,009,302 | | | | — | | | | — | |
Finland | | | 4,175,125 | | | | — | | | | — | |
France | | | 23,503,257 | | | | — | | | | — | |
Germany | | | 21,648,549 | | | | — | | | | — | |
Hong Kong | | | 10,971,409 | | | | — | | | | — | |
India | | | 607,566 | | | | — | | | | — | |
Indonesia | | | 608,394 | | | | — | | | | — | |
Israel | | | 1,423,393 | | | | — | | | | — | |
Italy | | | 6,507,728 | | | | — | | | | — | |
Japan | | | 50,044,928 | | | | — | | | | — | |
Mexico | | | 342,890 | | | | — | | | | — | |
Netherlands | | | 13,195,844 | | | | — | | | | — | |
Norway | | | 4,632,186 | | | | — | | | | — | |
Philippines | | | 802,866 | | | | — | | | | — | |
Portugal | | | 448,068 | | | | — | | | | — | |
Russia | | | 3,083,808 | | | | — | | | | — | |
Singapore | | | 4,023,184 | | | | — | | | | — | |
South Africa | | | 2,804,147 | | | | — | | | | — | |
South Korea | | | 4,543,681 | | | | — | | | | — | |
Spain | | | 8,351,813 | | | | — | | | | — | |
Sweden | | | 7,717,114 | | | | — | | | | — | |
Switzerland | | | 20,475,308 | | | | — | | | | — | |
Taiwan | | | 2,587,399 | | | | — | | | | — | |
Thailand | | | 455,258 | | | | — | | | | — | |
United Kingdom | | | 52,660,239 | | | | — | | | | — | |
United States | | | 192,893 | | | | — | | | | — | |
Exchange Traded Fund | | | | | | | | | | | | |
United States | | | 2,683,857 | | | | — | | | | — | |
Preferred Stocks | | | | | | | | | | | | |
Brazil | | | 1,060,530 | | | | — | | | | — | |
Germany | | | 2,056,965 | | | | — | | | | — | |
See Notes to Financial Statements.
| | | | |
| Prudential International Equity Fund | | | 23 | |
Portfolio of Investments
as of October 31, 2012 continued
| | | | | | | | | | | | |
| | | Level 1 | | | Level 2 | | | Level 3 | |
Preferred Stocks (continued): | | | | | | | | | | | | |
South Korea | | $ | 656,363 | | | $ | — | | | $ | — | |
Right | | | | | | | | | | | | |
Spain | | | 33,367 | | | | — | | | | — | |
United States Government Security | | | — | | | | 149,980 | | | | — | |
Affiliated Money Market Mutual Fund | | | 7,963,741 | | | | — | | | | — | |
| | | | | | | | | | | | |
| | | 291,766,531 | | | | 149,980 | | | | — | |
Other Financial Instruments* | | | | | | | | | | | | |
Futures Contracts | | | (7,317 | ) | | | — | | | | — | |
| | | | | | | | | | | | |
Total | | $ | 291,759,214 | | | $ | 149,980 | | | $ | — | |
| | | | | | | | | | | | |
| * | Other financial instruments are derivative instruments not reflected in the Portfolio of Investments, such as futures, forwards and swap contracts, which are recorded at the unrealized appreciation/depreciation on the instrument. |
Fair value of Level 2 investments at October 31, 2011 was $282,953,266. An amount of $177,565,416 was transferred into Level 1 from Level 2 at October 31, 2012 as a result of no longer using third-party vendor modeling tools. Such fair values were used to reflect the impact of significant market movements between the time at which the fund normally values its securities and the earlier closing of foreign markets.
It is the Series’ policy to recognize transfers in and transfers out at the fair value as of the beginning of period.
The industry classification of portfolio holdings and liabilities in excess of other assets shown as a percentage of net assets as of October 31, 2012 were as follows:
| | | | |
Commercial Banks | | | 12.1 | % |
Pharmaceuticals | | | 8.6 | |
Oil, Gas & Consumable Fuels | | | 7.7 | |
Insurance | | | 5.6 | |
Metals & Mining | | | 5.5 | |
Chemicals | | | 3.9 | |
Food Products | | | 3.7 | |
Automobiles | | | 3.6 | |
Food & Staples Retailing | | | 2.9 | |
Affiliated Money Market Mutual Fund (including 2.5% of collateral received for securities on loan) | | | 2.8 | |
Machinery | | | 2.8 | |
Real Estate Management & Development | | | 2.8 | |
Wireless Telecommunication Services | | | 2.6 | |
Diversified Telecommunication Services | | | 2.5 | |
Tobacco | | | 2.3 | % |
Real Estate Investment Trusts | | | 2.1 | |
Electric Utilities | | | 2.0 | |
Trading Companies & Distributors | | | 1.9 | |
Beverages | | | 1.8 | |
Road & Rail | | | 1.7 | |
Auto Components | | | 1.6 | |
Construction & Engineering | | | 1.4 | |
Electronic Equipment,
Instruments & Components | | | 1.3 | |
Multi-Utilities | | | 1.3 | |
Aerospace & Defense | | | 1.2 | |
Industrial Conglomerates | | | 1.1 | |
IT Services | | | 1.1 | |
Software | | | 1.1 | |
Textiles, Apparel & Luxury Goods | | | 1.0 | |
See Notes to Financial Statements.
| | |
| 24 | | Visit our website at www.prudentialfunds.com |
| | | | |
Industry (cont’d.) | | | |
Energy Equipment & Services | | | 1.0 | % |
Capital Markets | | | 0.9 | |
Exchange Traded Fund | | | 0.9 | |
Leisure Equipment & Products | | | 0.9 | |
Semiconductors & Semiconductor Equipment | | | 0.9 | |
Gas Utilities | | | 0.8 | |
Household Products | | | 0.7 | |
Internet Software & Services | | | 0.7 | |
Media | | | 0.7 | |
Specialty Retail | | | 0.6 | |
Diversified Financial Services | | | 0.5 | |
Electrical Equipment | | | 0.5 | |
Healthcare Equipment & Supplies | | | 0.5 | |
Hotels, Restaurants & Leisure | | | 0.5 | |
Commercial Services & Supplies | | | 0.4 | |
Air Freight & Logistics | | | 0.3 | |
Distributors | | | 0.3 | % |
Professional Services | | | 0.3 | |
Computers & Peripherals | | | 0.2 | |
Healthcare Providers & Services | | | 0.2 | |
Airlines | | | 0.1 | |
Biotechnology | | | 0.1 | |
Building Products | | | 0.1 | |
Construction Materials | | | 0.1 | |
Household Durables | | | 0.1 | |
Multiline Retail | | | 0.1 | |
Personal Products | | | 0.1 | |
United State Government Security | | | 0.1 | |
| | | | |
| | | 102.6 | |
Liabilities in excess of other assets | | | (2.6 | ) |
| | | | |
| | | 100.0 | % |
| | | | |
The Series invested in derivative instruments during the reporting period. The primary type of risk associated with these derivative instruments is equity risk. The effect of such derivative instruments on the Series’ financial position and financial performance as reflected in the Statement of Assets and Liabilities and Statement of Operations is presented in the summary below.
Fair values of derivative instruments as of October 31, 2012 as presented in the Statement of Assets and Liabilities:
| | | | | | | | | | | | |
Derivatives not designated as hedging
instruments, carried at fair value | | Asset Derivatives | | | Liability Derivatives | |
| | Balance
Sheet Location | | Fair
Value | | | Balance
Sheet Location | | Fair
Value | |
| Equity contracts | | — | | $ | — | | | Due from broker—
variation margin | | $ | 7,317 | * |
| | | | | | | | | | | | |
| * | Includes cumulative appreciation/depreciation as reported in the schedule of open futures contracts. Only unsettled variation margin receivable (payable) is reported within the Statement of Assets and Liabilities. |
The effects of derivative instruments on the Statement of Operations for the year ended October 31, 2012 are as follows:
| | | | | | | | | | | | |
Amount of Realized Gain or (Loss) on Derivatives Recognized in Income | |
Derivatives not designated as hedging
instruments, carried at fair value | | Futures | | | Rights | | | Total | |
Equity contracts | | $ | 318,066 | | | $ | 290,525 | | | $ | 608,591 | |
| | | | | | | | | | | | |
See Notes to Financial Statements.
| | | | |
| Prudential International Equity Fund | | | 25 | |
Portfolio of Investments
as of October 31, 2012 continued
| | | | | | | | | | | | |
Change in Unrealized Appreciation or (Depreciation) on Derivatives Recognized in Income | |
Derivatives not designated as hedging
instruments, carried at fair value | | Futures | | | Rights | | | Total | |
Equity contracts | | $ | (280,363 | ) | | $ | 33,367 | | | $ | (246,996 | ) |
| | | | | | | | | | | | |
For the year ended October 31, 2012, the average value at trade date for futures contracts was $1,366,216.
See Notes to Financial Statements.
| | |
| 26 | | Visit our website at www.prudentialfunds.com |
PRUDENTIAL INVESTMENTS»MUTUAL FUNDS
FINANCIAL STATEMENTS
ANNUAL REPORT · OCTOBER 31, 2012
Prudential International Equity Fund
Statement of Assets and Liabilities
as of October 31, 2012
| | | | |
Assets | | | | |
Investments at value, including securities on loan of $6,584,492: | | | | |
Unaffiliated Investments (cost $248,782,344) | | $ | 283,952,770 | |
Affiliated Investments (cost $7,963,741) | | | 7,963,741 | |
Foreign currency, at value (cost $143,043) | | | 143,283 | |
Cash | | | 1,778 | |
Dividends and interest receivable | | | 780,602 | |
Foreign tax reclaim receivable | | | 726,073 | |
Receivable for Series shares sold | | | 34,338 | |
Prepaid expenses | | | 4,305 | |
Due from broker—variation margin | | | 3,415 | |
| | | | |
Total assets | | | 293,610,305 | |
| | | | |
| |
Liabilities | | | | |
Payable to broker for collateral for securities on loan | | | 7,172,123 | |
Loan payable | | | 984,000 | |
Payable for Series shares reacquired | | | 254,608 | |
Accrued expenses | | | 248,399 | |
Management fee payable | | | 206,367 | |
Affiliated transfer agent fee payable | | | 84,883 | |
Distribution fee payable | | | 74,466 | |
| | | | |
Total liabilities | | | 9,024,846 | |
| | | | |
| |
Net Assets | | $ | 284,585,459 | |
| | | | |
| | | | | |
Net assets were comprised of: | | | | |
Common stock, at par | | $ | 473,652 | |
Paid-in capital in excess of par | | | 502,314,263 | |
| | | | |
| | | 502,787,915 | |
Undistributed net investment income | | | 4,906,387 | |
Accumulated net realized loss on investment and foreign currency transactions | | | (258,281,783 | ) |
Net unrealized appreciation on investments and foreign currencies | | | 35,172,940 | |
| | | | |
Net assets, October 31, 2012 | | $ | 284,585,459 | |
| | | | |
See Notes to Financial Statements.
| | |
| 28 | | Visit our website at www.prudentialfunds.com |
| | | | |
Class A | | | | |
Net asset value and redemption price per share
($209,568,034 ÷ 34,804,848 shares of common stock issued and outstanding) | | $ | 6.02 | |
Maximum sales charge (5.50% of offering price) | | | 0.35 | |
| | | | |
Maximum offering price to public | | $ | 6.37 | |
| | | | |
| |
Class B | | | | |
Net asset value, offering price and redemption price per share
($5,439,363 ÷ 940,388 shares of common stock issued and outstanding) | | $ | 5.78 | |
| | | | |
| |
Class C | | | | |
Net asset value, offering price and redemption price per share
($17,658,314 ÷ 3,053,636 shares of common stock issued and outstanding) | | $ | 5.78 | |
| | | | |
| |
Class F | | | | |
Net asset value, offering price and redemption price per share
($681,060 ÷ 117,661 shares of common stock issued and outstanding) | | $ | 5.79 | |
| | | | |
| |
Class X | | | | |
Net asset value, offering price and redemption price per share
($707,313 ÷ 122,259 shares of common stock issued and outstanding) | | $ | 5.79 | |
| | | | |
| |
Class Z | | | | |
Net asset value, offering price and redemption price per share
($50,531,375 ÷ 8,326,438 shares of common stock issued and outstanding) | | $ | 6.07 | |
| | | | |
See Notes to Financial Statements.
| | | | |
| Prudential International Equity Fund | | | 29 | |
Statement of Operations
Year Ended October 31, 2012
| | | | |
Net Investment Income | | | | |
Income | | | | |
Unaffiliated dividends (net of foreign withholding taxes of $155,269) | | $ | 10,820,472 | |
Affiliated income from securities loaned, net | | | 65,142 | |
Unaffiliated interest income | | | 30,062 | |
Affiliated dividend income | | | 493 | |
| | | | |
Total income | | | 10,916,169 | |
| | | | |
| |
Expenses | | | | |
Management fee | | | 2,411,834 | |
Distribution fee—Class A | | | 612,262 | |
Distribution fee—Class B | | | 58,229 | |
Distribution fee—Class C | | | 190,185 | |
Distribution fee—Class F | | | 7,832 | |
Distribution fee—Class L | | | 32,655 | |
Distribution fee—Class M | | | 1,560 | |
Distribution fee—Class X | | | 10,774 | |
Transfer agent’s fees and expenses (including affiliated expense of $371,200) (Note 3) | | | 935,000 | |
Custodian’s fees and expenses | | | 239,000 | |
Registration fees | | | 90,000 | |
Reports to shareholders | | | 50,000 | |
Audit fee | | | 35,000 | |
Legal fees and expenses | | | 27,000 | |
Directors’ fees | | | 16,000 | |
Insurance | | | 7,000 | |
Loan interest expense (Note 7) | | | 3,430 | |
Miscellaneous | | | 60,526 | |
| | | | |
Total expenses | | | 4,788,287 | |
| | | | |
Net investment income | | | 6,127,882 | |
| | | | |
| |
Realized And Unrealized Gain (Loss) On Investment, Futures And Foreign Currency Transactions | | | | |
Net realized gain (loss) on: | | | | |
Investment transactions | | | (7,173,778 | ) |
Foreign currency transactions | | | (118,730 | ) |
Financial futures transactions | | | 318,066 | |
| | | | |
| | | (6,974,442 | ) |
| | | | |
Net change in unrealized appreciation (depreciation) on: | | | | |
Investments | | | 20,999,044 | |
Foreign currencies | | | (50,341 | ) |
Financial futures contracts | | | (280,363 | ) |
| | | | |
| | | 20,668,340 | |
| | | | |
Net gain on investment and foreign currency transactions | | | 13,693,898 | |
| | | | |
Net Increase In Net Assets Resulting From Operations | | $ | 19,821,780 | |
| | | | |
See Notes to Financial Statements.
| | |
| 30 | | Visit our website at www.prudentialfunds.com |
Statement of Changes in Net Assets
| | | | | | | | |
| | | Year Ended October 31, | |
| | | 2012 | | | 2011 | |
Increase (Decrease) In Net Assets | | | | | | | | |
Operations | | | | | | | | |
Net investment income | | $ | 6,127,882 | | | $ | 5,027,387 | |
Net realized gain (loss) on investment and foreign currency transactions | | | (6,974,442 | ) | | | 17,074,787 | |
Net change in unrealized appreciation (depreciation) on investments and foreign currencies | | | 20,668,340 | | | | (40,027,313 | ) |
| | | | | | | | |
Net increase (decrease) in net assets resulting from operations | | | 19,821,780 | | | | (17,925,139 | ) |
| | | | | | | | |
| | |
Dividends from net investment income (Note 1) | | | | | | | | |
Class A | | | (4,099,544 | ) | | | (4,571,474 | ) |
Class B | | | (85,513 | ) | | | (110,787 | ) |
Class C | | | (268,526 | ) | | | (320,075 | ) |
Class F | | | (23,756 | ) | | | (47,027 | ) |
Class L | | | (145,518 | ) | | | (171,721 | ) |
Class M | | | (8,376 | ) | | | (33,226 | ) |
Class X | | | (19,252 | ) | | | (35,242 | ) |
Class Z | | | (1,011,006 | ) | | | (949,745 | ) |
| | | | | | | | |
| | | (5,661,491 | ) | | | (6,239,297 | ) |
| | | | | | | | |
| | |
Series share transactions (Net of share conversions) (Note 6) | | | | | | | | |
Net proceeds from shares sold | | | 14,167,452 | | | | 19,235,595 | |
Net asset value of shares issued in reinvestment of dividends | | | 5,514,066 | | | | 6,069,976 | |
Cost of shares reacquired | | | (48,997,598 | ) | | | (64,297,912 | ) |
| | | | | | | | |
Net decrease in net assets from Series share transactions | | | (29,316,080 | ) | | | (38,992,341 | ) |
| | | | | | | | |
| | |
Capital Contributions (Note 6) | | | | | | | | |
Proceeds from regulatory settlement | | | — | | | | 1,399,459 | |
| | | | | | | | |
Total decrease | | | (15,155,791 | ) | | | (61,757,318 | ) |
| | |
Net Assets: | | | | | | | | |
Beginning of year | | | 299,741,250 | | | | 361,498,568 | |
| | | | | | | | |
End of year(a) | | $ | 284,585,459 | | | $ | 299,741,250 | |
| | | | | | | | |
(a) Includes undistributed net investment income of: | | $ | 4,906,387 | | | $ | 4,069,143 | |
| | | | | | | | |
See Notes to Financial Statements.
| | | | |
| Prudential International Equity Fund | | | 31 | |
Notes to Financial Statements
Prudential World Fund, Inc. (the “Fund”) is an open-end management investment company, registered under the Investment Company Act of 1940, as amended, (“1940 Act”) and currently consists of five series: Prudential International Equity Fund (the “Series”), Prudential International Value Fund, Prudential Jennison Global Opportunities Fund, Prudential Jennison International Opportunities Fund and Prudential Emerging Markets Debt Local Currency Fund. These financial statements relate to the Prudential International Equity Fund. The financial statements of the other series are not presented herein.
The investment objective of the Series is to achieve long-term growth of capital.
Note 1. Accounting Policies
The following is a summary of significant accounting policies followed by the Fund and the Series in the preparation of its financial statements.
Securities Valuation: The Series holds portfolio securities and other assets that are fair valued at the close of each day the New York Stock Exchange (“NYSE”) is open for trading. Fair value is the price that would be received to sell an asset or paid to transfer a liability in an orderly transaction between market participants on the measurement date. The Board of Trustees (the “Board”) has delegated fair valuation responsibilities to Prudential Investments LLC (“PI” or “Manager”) through the adoption of Valuation Procedures for valuation of the Series’ securities. Under the current Valuation Procedures, a Valuation Committee is established and responsible for supervising the valuation of portfolio securities and other assets. The Valuation Procedures allow the Series to utilize independent pricing vendor services, quotations from market makers and other valuation methods in events when market quotations are not readily available. A record of the Valuation Committee’s actions is subject to review, approval and ratification by the Board at its next regularly scheduled quarterly meeting.
Various inputs are used in determining the value of the Series’ investments, which are summarized in the three broad level hierarchies based on any observable inputs used as described in the table following the Portfolio of Investments. The valuation methodologies and significant inputs used in determining the fair value of securities and other assets classified as Level 1, Level 2 and Level 3 of the hierarchy are as follows:
| | |
| 32 | | Visit our website at www.prudentialfunds.com |
Common stocks, exchange-traded funds and financial derivative instruments (including futures contracts and certain options contracts on securities), that are traded on a national securities exchange are valued at the last sale price as of the close of trading on the applicable exchange. Securities traded via NASDAQ are valued at the NASDAQ official closing price. To the extent these securities are valued at the last sale price or NASDAQ official closing price, they are classified as Level 1 of the fair value hierarchy.
In the event there is no sale or official closing price on such day, these securities are valued at the mean between the last reported bid and asked prices, or at the last bid price in absence of an asked price. These securities are classified as Level 2 of the fair value hierarchy as these inputs are considered as significant other observable inputs to the valuation.
For common stocks traded on foreign securities exchanges, certain valuation adjustments will be applied when events occur after the close of the security’s foreign market and before the Series’ normal pricing time. These securities are valued using pricing vendor services that provide adjustment factors based on information such as local closing price, relevant general and sector indices, currency fluctuations, depositary receipts, and futures, as applicable. Securities valued using such adjustment factors are classified as Level 2 of the fair value hierarchy as the adjustment factors are considered as significant other observable inputs to the valuation.
Investments in open-end, non-exchange-traded mutual funds are valued at their net asset values as of the close of the NYSE on the date of valuation. These securities are classified as Level 1 as they have the ability to be purchased or sold at their net asset values on the date of valuation.
Fixed income securities traded in the over-the-counter market, such as corporate bonds, municipal bonds, U.S. Government agencies, U.S. Treasury obligations, and sovereign issues are usually valued at prices provided by approved independent pricing vendors. The pricing vendors provide these prices usually after evaluating observable inputs including yield curves, credit rating, yield spreads, default rates, cash flows as well as broker/dealer quotations and reported trades. Securities valued using such vendor prices are classified as Level 2 of the fair value hierarchy.
Asset-backed and mortgage-related securities are usually valued by approved independent pricing vendors. The pricing vendors provide the prices using their internal pricing model with input from deal term, tranche level attributes, yield curve, prepayment speeds, and broker/dealer quotes. Securities valued using such vendor prices are classified as Level 2 of the fair value hierarchy.
| | | | |
| Prudential International Equity Fund | | | 33 | |
Notes to Financial Statements
continued
Short-term debt securities of sufficient credit quality, which mature in sixty days or less, are valued at amortized cost, which approximates fair value. The amortized cost method involves valuing a security at its cost on the date of purchase and thereafter assuming a constant amortization to maturity of the difference between the principal amount due at maturity and cost. These securities are categorized as Level 2 of the fair value hierarchy.
Over-the-counter financial derivative instruments, such as option contracts, foreign currency contracts and swaps agreements, are usually valued using pricing vendor services, which derive the valuation based on underlying asset prices, indices, spreads, interest rates, exchange rates and other inputs. These instruments are categorized as Level 2 of the fair value hierarchy.
Securities and other assets that cannot be priced using the methods described above are valued with pricing methodologies approved by the Valuation Committee. In the event there are unobservable inputs used when determining such valuations, the securities will be classified as Level 3 of the fair value hierarchy.
When determining the fair value of securities, some of the factors influencing the valuation include: the nature of any restrictions on disposition of the securities; assessment of the general liquidity of the securities; the issuer’s financial condition and the markets in which it does business; the cost of the investment; the size of the holding and the capitalization of the issuer; the prices of any recent transactions or bids/offers for such securities or any comparable securities; any available analyst media or other reports or information deemed reliable by the investment adviser regarding the issuer or the markets or industry in which it operates. Using fair value to price securities may result in a value that is different from a security’s most recent closing price and from the price used by other mutual funds to calculate their net asset values.
The Series invests in the Prudential Core Taxable Money Market Fund, a portfolio of the Prudential Investment Portfolios 2, registered under the Investment Company Act of 1940, as amended, and managed by PI.
Restricted and Illiquid Securities: The Series may hold up to 15% of its net assets in illiquid securities, including those that are restricted as to disposition under securities law (“restricted securities”). Restricted securities, sometimes referred to as private placements, are valued pursuant to the valuation procedures noted above.
| | |
| 34 | | Visit our website at www.prudentialfunds.com |
Foreign Currency Translation: The books and records of the Series are maintained in U.S. dollars. Foreign currency amounts are translated into U.S. dollars on the following basis:
(i) market value of investment securities, other assets and liabilities at the current rates of exchange;
(ii) purchases and sales of investment securities, income and expenses at the rates of exchange prevailing on the respective dates of such transactions.
Although the net assets of the Series are presented at the foreign exchange rates and market values at the close of the fiscal year, the Series does not isolate that portion of the results of operations arising as a result of changes in the foreign exchange rates from the fluctuations arising from changes in the market prices of securities held at the end of the fiscal year. Similarly, the Series does not isolate the effect of changes in foreign exchange rates from the fluctuations arising from changes in the market prices of portfolio securities sold during the period. Accordingly, realized foreign currency gains or losses are included in the reported net realized gains or losses on investment transactions.
Net realized gains or losses on foreign currency transactions represent net foreign exchange gains or losses from holdings of foreign currencies, currency gains or losses realized between the trade and settlement dates on security transactions, and the difference between the amounts of dividends, interest and foreign withholding taxes recorded on the Series books and the U.S. dollar equivalent amounts actually received or paid. Net unrealized currency gains or losses from valuing foreign currency denominated assets and liabilities (other than investments) at year end exchange rates are reflected as a component of net unrealized appreciation (depreciation) on foreign currencies. Foreign security and currency transactions may involve certain considerations and risks not typically associated with those of domestic origin as a result of, among other factors, the possibility of political and economic instability, or the level of governmental supervision and regulation of foreign securities markets.
Financial Futures Contracts: A financial futures contract is an agreement to purchase (long) or sell (short) an agreed amount of securities at a set price for delivery on a future date. Upon entering into a financial futures contract, the Series is required to pledge to the broker an amount of cash and/or other assets equal to a certain percentage of the contract amount. This amount is known as the “initial margin.” Subsequent payments, known as “variation margin,” are made or received by the Series each day, depending on the daily fluctuations in the value of the underlying security. Such variation margin is recorded for financial statement purposes on a daily
| | | | |
| Prudential International Equity Fund | | | 35 | |
Notes to Financial Statements
continued
basis as unrealized gain or loss. When the contract expires or is closed, the gain or loss is realized and is presented in the Statement of Operations as net realized gain or loss on financial futures transactions. The Series invested in financial futures contracts in order to hedge its existing portfolio securities, or securities the Series intends to purchase, against fluctuations in value caused by changes in prevailing interest rates, value of equities or foreign currency exchange rates. Should interest rates move unexpectedly, the Series may not achieve the anticipated benefits of the financial futures contracts and may realize a loss. The use of futures transactions involves the risk of imperfect correlation in movements in the price of futures contracts, interest rates and the underlying hedged assets.
Financial futures contracts involve elements of both risk in excess of the amounts reflected on the Statement of Assets and Liabilities.
With exchange-traded futures, there is a minimal counterparty credit risk to the Series since the exchanges’ clearinghouse acts as counterparty to all exchange traded futures and guarantees the futures contracts against default.
Securities Lending: The Series may lend its portfolio securities to banks and broker-dealers. The loans are secured by collateral at least equal to the market value of the securities loaned. Collateral pledged by each borrower is invested in a highly liquid short-term money market fund and is marked to market daily, based on the previous day’s market value, such that the value of the collateral exceeds the value of the loaned securities. Loans are subject to termination at the option of the borrower or the Series. Upon termination of the loan, the borrower will return to the Series securities identical to the loaned securities. Should the borrower of the securities fail financially, the Series has the right to repurchase the securities using the collateral in the open market. The Series recognizes income, net of any rebate and securities lending agent fees, for lending its securities, and any interest on the investment of any cash received as collateral. The Series also continues to receive interest and dividends or amounts equivalent thereto, on the securities loaned and recognizes any unrealized gain or loss in the market price of the securities loaned that may occur during the term of the loan.
Warrants and Rights: The Series may hold warrants and rights acquired either through a direct purchase, included as part of a private placement, or pursuant to corporate actions. Warrants and rights entitle the holder to buy a proportionate amount of common stock, or such other security that the issuer may specify, at a specific price and time through the expiration dates. Such warrants and rights are held as long positions
| | |
| 36 | | Visit our website at www.prudentialfunds.com |
by the Series until exercised, sold or expired. Warrants and rights are valued at fair value in accordance with the Board of Trustees’ approved fair valuation procedures.
Securities Transactions and Net Investment Income: Securities transactions are recorded on the trade date. Realized gains or losses from investment and currency transactions are calculated on the identified cost basis. Dividend income is recorded on the ex-dividend date. Interest income, including amortization of premium and accretion of discount on debt securities, as required, is recorded on the accrual basis. Expenses are recorded on the accrual basis, which may require the use of certain estimates by management, that may differ from actual.
Net investment income or loss (other than distribution fees which are charged directly to the respective class) and unrealized and realized gains or losses are allocated daily to each class of shares based upon the relative proportion of adjusted net assets of each class at the beginning of the day.
Dividends and Distributions: The Series expects to pay dividends from net investment income and distributions from net realized capital gains, if any, at least annually. Dividends and distributions to shareholders, which are determined in accordance with federal income tax regulations and which may differ from generally accepted accounting principles, are recorded on the ex-dividend date. Permanent book/tax differences relating to income and gains are reclassified amongst undistributed net investment income, accumulated net realized gain or loss and paid-in capital in excess of par, as appropriate.
Taxes: It is the Series’ policy to continue to meet the requirements of the Internal Revenue Code applicable to regulated investment companies and to distribute all of its taxable net investment income and capital gains, if any, to its shareholders. Therefore, no federal income tax provision is required.
Withholding taxes on foreign dividends are recorded, net of reclaimable amounts, at the time the related income is earned.
Estimates: The preparation of the financial statements requires management to make estimates and assumptions that affect the reported amounts and disclosures in the financial statements. Actual results could differ from those estimates.
Note 2. Agreements
The Fund has a management agreement for the Series with PI. Pursuant to this agreement, PI has responsibility for all investment advisory services and supervises
| | | | |
| Prudential International Equity Fund | | | 37 | |
Notes to Financial Statements
continued
the subadvisor’s performance of such services. PI entered into a subadvisory agreement with Quantitative Management Associates LLC (“QMA”). The subadvisory agreement provides that QMA furnishes investment advisory services in connection with the management of the Series. In connection therewith, QMA is obligated to keep certain books and records of the Series. PI pays for the services of QMA, the cost of compensation of officers of the Series, occupancy and certain clerical and bookkeeping costs of the Series. The Series bears all other costs and expenses.
The management fee paid to PI is computed daily and payable monthly, at an annual rate of .85% of the average daily net assets of the Series up to and including $300 million, .75% of the average daily net assets in excess of $300 million up to and including $1.5 billion and .70% of the Series’ average daily net assets over $1.5 billion. The effective management fee was .85% for the year ended October 31, 2012.
The Series has distribution agreements with Prudential Investment Management Services LLC (“PIMS”) and Prudential Annuities Distributors, Inc. (“PAD”). PIMS and PAD are both affiliates of PI and indirect, wholly-owned subsidiaries of Prudential. PIMS serves as the distributor of the Series’ Class A, Class B, Class C, Class F, and Class Z shares. PIMS, together with PAD, serves as co-distributor of the Series’ Class L, Class M, and Class X shares.
The Series has adopted a separate Distribution and Service plan (each a “Plan” and collectively the “Plans”) for the Class A, Class B, Class C, Class F, Class L, Class M, and Class X shares of the Series in accordance with Rule 12b-1 of the 1940 Act, as amended. No distribution or service fees are paid to PIMS as distributor for the Series’ Class Z shares. Under the Plans, the Series compensates PIMS and PAD a distribution and service fee at the annual rate of .30%, 1.00%, 1.00%, .75%, .50%, 1.00%, and 1.00% of the average daily net assets of the Class A, B, C, F, L, M, and X shares, respectively.
PIMS has advised the Series that they received $48,876 in front-end sales charges resulting from sales of Class A shares during the year ended October 31, 2012. From these fees, PIMS paid such sales charges to broker-dealers, which in turn paid commissions to salespersons and incurred other distribution costs.
PIMS has advised the Series that for the year ended October 31, 2012 it received $563, $11,725, $538, $734 and $43 in contingent deferred sales charges imposed upon redemptions by certain Class A, Class B, Class C, Class F and Class X shareholders, respectively.
| | |
| 38 | | Visit our website at www.prudentialfunds.com |
PI, QMA and PIMS are indirect, wholly-owned subsidiaries of Prudential Financial, Inc. (“Prudential”).
Note 3. Other Transactions with Affiliates
Prudential Mutual Fund Services LLC (“PMFS”), an affiliate of PI and an indirect, wholly-owned subsidiary of Prudential, serves as the Series’ transfer agent. Transfer agent’s fees and expenses in the Statement of Operations include certain out-of-pocket expenses paid to non-affiliates, where applicable.
Prudential Investment Management, Inc. (“PIM”), an indirect, wholly-owned subsidiary of Prudential, is the Series’ security lending agent. For the year ended October 31, 2012, PIM has been compensated approximately $19,500 for these services.
The Series invests in the Prudential Core Taxable Money Market Fund (the “Core Fund”), a series of the Prudential Investment Portfolios 2, registered under the 1940 Act, and managed by PI. Earnings from the Core Fund are disclosed on the Statement of Operations as affiliated dividend income.
Note 4. Portfolio Securities
Purchases and sales of portfolio securities, other than short-term investments, for the year ended October 31, 2012 aggregated $235,293,472 and $262,746,444 respectively.
Note 5. Distributions and Tax Information
Distributions to shareholders, which are determined in accordance with federal income tax regulations and which may differ from generally accepted accounting principles, are recorded on the ex-dividend date. In order to present undistributed net investment income, accumulated net realized loss on investment and foreign currency transactions and paid-in capital in excess of par on the Statement of Assets and Liabilities that more closely represent their tax character, certain adjustments have been made to undistributed net investment income and accumulated net realized loss on investment and foreign currency transactions. For the fiscal year ended October 31, 2012, the adjustments were to increase undistributed net investment income and to increase accumulated net realized loss on investment and foreign currency transactions by $370,853, due to the differences in the treatment for book and tax purposes of certain transactions involving foreign securities and currencies and investments in passive foreign investment companies. Net investment income, net realized gain (loss) on investment, futures and foreign currency transactions and net assets were not affected by this change.
| | | | |
| Prudential International Equity Fund | | | 39 | |
Notes to Financial Statements
continued
For the years ended October 31, 2012 and October 31, 2011, the tax character of dividends paid, as reflected in the Statement of Changes in Net Assets were $5,661,491 and $6,239,297 of ordinary income, respectively.
As of October 31, 2012, the Series had undistributed ordinary income of $5,597,563 on a tax basis.
The United States federal income tax basis of the Series’ investments and the net unrealized appreciation as of October 31, 2012 were as follows:
| | | | | | | | | | |
Tax Basis | | Appreciation | | Depreciation | | Net
Unrealized
Appreciation | | Other Cost
Basis
Adjustments | | Total Net
Unrealized
Appreciation |
| $261,738,198 | | $37,902,572 | | $(7,724,259) | | $30,178,313 | | $2,514 | | $30,180,827 |
The difference between book basis and tax basis were primarily attributable to deferred losses on wash sales and investments in passive foreign investment companies. The other cost basis adjustments are primarily attributable to appreciation (depreciation) of foreign currency, futures and mark-to-market of receivables and payables.
Under the Regulated Investment Company Modernization Act of 2010 (“the Act”), the Series are permitted to carryforward capital losses incurred in the fiscal year ended October 31, 2012 (“post-enactment losses”) for an unlimited period. Post-enactment losses are required to be utilized before the utilization of losses incurred prior to the effective date of the Act. As a result of this ordering rule, capital loss carryforwards related to taxable years ending before October 31, 2012 (“pre-enactment losses”) may have an increased likelihood to expire unused. Additionally, post-enactment capital losses that are carried forward will retain their character as either short-term or long-term capital losses rather than being considered all short-term as under previous law. No capital gains distributions are expected to be paid to shareholders until net gains have been realized in excess of such losses. As of October 31, 2012, the pre and post-enactment losses were approximately:
| | | | |
Post-Enactment Losses: | | $ | 10,497,000 | |
| | | | |
Pre-Enactment Losses: | | | | |
Expiring 2016 | | $ | 51,069,000 | |
Expiring 2017 | | | 184,078,000 | |
Expiring 2018 | | | 8,337,000 | |
| | | | |
| | $ | 243,484,000 | |
| | | | |
| | |
| 40 | | Visit our website at www.prudentialfunds.com |
Management has analyzed the Series’ tax positions taken on federal income tax returns for all open tax years and has concluded that no provision for income tax is required in the Series’ financial statements for the current reporting period. The Series’ federal and state income and federal excise tax returns for tax years for which the applicable statutes of limitations have not expired are subject to examination by the Internal Revenue Service and state departments of revenue.
Note 6. Capital
The Series offers Class A, B, C, F, X and Z shares. Class A shares are sold with a front-end sales charge of up to 5.50%. All investors who purchase Class A shares in an amount of $1 million or more and sell these shares within 12 months of purchase are subject to a contingent deferred sales charge (CDSC) of 1%. The Class A CDSC is waived for purchases by certain retirement and/or benefit plans. Class B and F shares are sold with a CDSC which declines from 5% to zero depending on the period of time the shares are held. Class B and F shares will automatically convert to Class A shares on a quarterly basis approximately seven years after purchase. Class C shares are sold with a CDSC of 1% on shares redeemed within the first 12 months after purchase. As of April 13, 2012, the last conversion of Class M shares to Class A shares was completed. There are no Class M shares outstanding and Class M shares are no longer being offered for sale. As of August 24, 2012, the last conversion of Class L to Class A shares was completed. There are no Class L shares outstanding and Class L shares are no longer being offered for sale. Class X shares are sold with a CDSC which declines from 6% to zero depending on the period of time the shares are held. Class X shares will automatically convert to Class A shares on a quarterly basis approximately ten years after purchase. A special exchange privilege is also available for shareholders who qualify to purchase Class A shares at net asset value. Class Z shares are not subject to any sales or redemption charge and are offered exclusively for sale to a limited group of investors.
Under certain circumstances, an exchange may be made from specified share classes of the Series to one or more other share classes of the Series as presented in the table of transactions in shares of common stock.
During the fiscal year ended October 31, 2011, the Series received $1,399,459, related to settlements of regulatory proceedings involving allegations of improper trading in Series shares. The amounts relating to a former affiliate for the year ended October 31, 2011 was $1,123,251. The per share effect of these amounts is disclosed in the financial highlights.
| | | | |
| Prudential International Equity Fund | | | 41 | |
Notes to Financial Statements
continued
There are 1 billion authorized shares of common stock at $.01 par value per share, designated Class A, Class B, Class C, Class F, Class X, Class New X and Class Z, each of which consists of 225 million, 150 million, 150 million, 50 million, 50 million, 50 million and 225 million authorized shares, respectively.
Transactions in shares of common stock were as follows:
| | | | | | | | |
Class A | | Shares | | | Amount | |
Year ended October 31, 2012: | | | | | | | | |
Shares sold | | | 864,508 | | | $ | 4,905,840 | |
Shares issued in reinvestment of dividends | | | 728,075 | | | | 3,975,267 | |
Shares reacquired | | | (6,177,492 | ) | | | (34,983,562 | ) |
| | | | | | | | |
Net increase (decrease) in shares outstanding before conversion | | | (4,584,909 | ) | | | (26,102,455 | ) |
Shares issued upon conversion from Class B, F, L, M, X and Z | | | 1,928,338 | | | | 11,103,809 | |
Shares reacquired upon conversion into Class Z | | | (25,419 | ) | | | (142,616 | ) |
| | | | | | | | |
Net increase (decrease) in shares outstanding | | | (2,681,990 | ) | | $ | (15,141,262 | ) |
| | | | | | | | |
Year ended October 31, 2011: | | | | | | | | |
Shares sold | | | 1,157,745 | | | $ | 7,274,534 | |
Shares issued in reinvestment of dividends | | | 728,171 | | | | 4,427,283 | |
Shares reacquired | | | (7,310,868 | ) | | | (45,368,737 | ) |
| | | | | | | | |
Net increase (decrease) in shares outstanding before conversion | | | (5,424,952 | ) | | | (33,666,920 | ) |
Shares issued upon conversion from Class B, F, M and X | | | 883,630 | | | | 5,477,217 | |
Shares reacquired upon conversion into Class Z | | | (186,656 | ) | | | (1,187,796 | ) |
| | | | | | | | |
Net increase (decrease) in shares outstanding | | | (4,727,978 | ) | | $ | (29,377,499 | ) |
| | | | | | | | |
Class B | | | | | | |
Year ended October 31, 2012: | | | | | | | | |
Shares sold | | | 111,371 | | | $ | 613,085 | |
Shares issued in reinvestment of dividends | | | 15,550 | | | | 82,106 | |
Shares reacquired | | | (179,800 | ) | | | (991,389 | ) |
| | | | | | | | |
Net increase (decrease) in shares outstanding before conversion | | | (52,879 | ) | | | (296,198 | ) |
Shares reacquired upon conversion into Class A | | | (228,345 | ) | | | (1,240,947 | ) |
| | | | | | | | |
Net increase (decrease) in shares outstanding | | | (281,224 | ) | | $ | (1,537,145 | ) |
| | | | | | | | |
Year ended October 31, 2011: | | | | | | | | |
Shares sold | | | 134,342 | | | $ | 803,818 | |
Shares issued in reinvestment of dividends | | | 18,311 | | | | 107,666 | |
Shares reacquired | | | (240,348 | ) | | | (1,441,980 | ) |
| | | | | | | | |
Net increase (decrease) in shares outstanding before conversion | | | (87,695 | ) | | | (530,496 | ) |
Shares reacquired upon conversion into Class A | | | (233,493 | ) | | | (1,372,829 | ) |
| | | | | | | | |
Net increase (decrease) in shares outstanding | | | (321,188 | ) | | $ | (1,903,325 | ) |
| | | | | | | | |
| | |
| 42 | | Visit our website at www.prudentialfunds.com |
| | | | | | | | |
Class C | | Shares | | | Amount | |
Year ended October 31, 2012: | | | | | | | | |
Shares sold | | | 82,903 | | | $ | 448,880 | |
Shares issued in reinvestment of dividends | | | 48,720 | | | | 256,753 | |
Shares reacquired | | | (953,320 | ) | | | (5,234,986 | ) |
| | | | | | | | |
Net increase (decrease) in shares outstanding | | | (821,697 | ) | | $ | (4,529,353 | ) |
| | | | | | | | |
Year ended October 31, 2011: | | | | | | | | |
Shares sold | | | 285,739 | | | $ | 1,702,762 | |
Shares issued in reinvestment of dividends | | | 52,345 | | | | 307,788 | |
Shares reacquired | | | (948,643 | ) | | | (5,685,795 | ) |
| | | | | | | | |
Net increase (decrease) in shares outstanding before conversion | | | (610,559 | ) | | | (3,675,245 | ) |
Shares reacquired upon conversion into Class Z | | | (151 | ) | | | (831 | ) |
| | | | | | | | |
Net increase (decrease) in shares outstanding | | | (610,710 | ) | | $ | (3,676,076 | ) |
| | | | | | | | |
Class F | | | | | | |
Year ended October 31, 2012: | | | | | | | | |
Shares sold | | | — | | | $ | — | |
Shares issued in reinvestment of dividends | | | 4,166 | | | | 21,956 | |
Shares reacquired | | | (35,112 | ) | | | (191,289 | ) |
| | | | | | | | |
Net increase (decrease) in shares outstanding before conversion | | | (30,946 | ) | | | (169,333 | ) |
Shares reacquired upon conversion into Class A | | | (136,961 | ) | | | (744,258 | ) |
| | | | | | | | |
Net increase (decrease) in shares outstanding | | | (167,907 | ) | | $ | (913,591 | ) |
| | | | | | | | |
Year ended October 31, 2011: | | | | | | | | |
Shares sold | | | 122 | | | $ | 841 | |
Shares issued in reinvestment of dividends | | | 7,787 | | | | 45,709 | |
Shares reacquired | | | (86,360 | ) | | | (524,163 | ) |
| | | | | | | | |
Net increase (decrease) in shares outstanding before conversion | | | (78,451 | ) | | | (477,613 | ) |
Shares reacquired upon conversion into Class A | | | (200,736 | ) | | | (1,188,873 | ) |
| | | | | | | | |
Net increase (decrease) in shares outstanding | | | (279,187 | ) | | $ | (1,666,486 | ) |
| | | | | | | | |
Class L | | | | | | |
Period ended August 24, 2012*: | | | | | | | | |
Shares sold | | | 3,145 | | | $ | 18,342 | |
Shares issued in reinvestment of dividends | | | 25,883 | | | | 141,578 | |
Shares reacquired | | | (216,083 | ) | | | (1,216,032 | ) |
| | | | | | | | |
Net increase (decrease) in shares outstanding before conversion | | | (187,055 | ) | | | (1,056,112 | ) |
Shares reacquired upon conversion into Class A | | | (1,322,525 | ) | | | (7,692,865 | ) |
| | | | | | | | |
Net increase (decrease) in shares outstanding | | | (1,509,580 | ) | | $ | (8,748,977 | ) |
| | | | | | | | |
Year ended October 31, 2011: | | | | | | | | |
Shares sold | | | 6,430 | | | $ | 41,363 | |
Shares issued in reinvestment of dividends | | | 27,508 | | | | 167,799 | |
Shares reacquired | | | (292,840 | ) | | | (1,835,606 | ) |
| | | | | | | | |
Net increase (decrease) in shares outstanding | | | (258,902 | ) | | $ | (1,626,444 | ) |
| | | | | | | | |
| | | | |
| Prudential International Equity Fund | | | 43 | |
Notes to Financial Statements
continued
| | | | | | | | |
Class M | | Shares | | | Amount | |
Period ended April 13, 2012**: | | | | | | | | |
Shares sold | | | 68 | | | $ | 390 | |
Shares issued in reinvestment of dividends | | | 1,251 | | | | 6,604 | |
Shares reacquired | | | (6,526 | ) | | | (33,729 | ) |
| | | | | | | | |
Net increase (decrease) in shares outstanding before conversion | | | (5,207 | ) | | | (26,735 | ) |
Shares reacquired upon conversion into Class A | | | (129,902 | ) | | | (704,453 | ) |
| | | | | | | | |
Net increase (decrease) in shares outstanding | | | (135,109 | ) | | $ | (731,188 | ) |
| | | | | | | | |
Year ended October 31, 2011: | | | | | | | | |
Shares sold | | | 2,102 | | | $ | 12,843 | |
Shares issued in reinvestment of dividends | | | 5,162 | | | | 30,351 | |
Shares reacquired | | | (70,593 | ) | | | (427,774 | ) |
| | | | | | | | |
Net increase (decrease) in shares outstanding before conversion | | | (63,329 | ) | | | (384,580 | ) |
Shares reacquired upon conversion into Class A | | | (304,398 | ) | | | (1,842,076 | ) |
| | | | | | | | |
Net increase (decrease) in shares outstanding | | | (367,727 | ) | | $ | (2,226,656 | ) |
| | | | | | | | |
Class X | | | | | | |
Year ended October 31, 2012: | | | | | | | | |
Shares sold | | | 1,009 | | | $ | 5,961 | |
Shares issued in reinvestment of dividends | | | 3,618 | | | | 19,104 | |
Shares reacquired | | | (38,488 | ) | | | (209,600 | ) |
| | | | | | | | |
Net increase (decrease) in shares outstanding before conversion | | | (33,861 | ) | | | (184,535 | ) |
Shares reacquired upon conversion into Class A | | | (129,227 | ) | | | (708,225 | ) |
| | | | | | | | |
Net increase (decrease) in shares outstanding | | | (163,088 | ) | | $ | (892,760 | ) |
| | | | | | | | |
Year ended October 31, 2011: | | | | | | | | |
Shares sold | | | 3,680 | | | $ | 22,212 | |
Shares issued in reinvestment of dividends | | | 5,872 | | | | 34,525 | |
Shares reacquired | | | (63,117 | ) | | | (377,288 | ) |
| | | | | | | | |
Net increase (decrease) in shares outstanding before conversion | | | (53,565 | ) | | | (320,551 | ) |
Shares reacquired upon conversion into Class A | | | (177,542 | ) | | | (1,073,439 | ) |
| | | | | | | | |
Net increase (decrease) in shares outstanding | | | (231,107 | ) | | $ | (1,393,990 | ) |
| | | | | | | | |
| | |
| 44 | | Visit our website at www.prudentialfunds.com |
| | | | | | | | |
Class Z | | Shares | | | Amount | |
Year ended October 31, 2012: | | | | | | | | |
Shares sold | | | 1,463,078 | | | $ | 8,174,954 | |
Shares issued in reinvestment of dividends | | | 184,098 | | | | 1,010,698 | |
Shares reacquired | | | (1,067,476 | ) | | | (6,137,011 | ) |
| | | | | | | | |
Net increase (decrease) in shares outstanding before conversion | | | 579,700 | | | | 3,048,641 | |
Shares issued upon conversion from Class A and C | | | 25,254 | | | | 142,616 | |
Shares reacquired upon conversion into Class A | | | (2,366 | ) | | | (13,061 | ) |
| | | | | | | | |
Net increase (decrease) in shares outstanding | | | 602,588 | | | $ | 3,178,196 | |
| | | | | | | | |
Year ended October 31, 2011: | | | | | | | | |
Shares sold | | | 1,525,305 | | | $ | 9,377,222 | |
Shares issued in reinvestment of dividends | | | 155,042 | | | | 948,855 | |
Shares reacquired | | | (1,350,436 | ) | | | (8,636,569 | ) |
| | | | | | | | |
Net increase (decrease) in shares outstanding before conversion | | | 329,911 | | | | 1,689,508 | |
Shares issued upon conversion from Class A and C | | | 185,345 | | | | 1,188,627 | |
| | | | | | | | |
Net increase (decrease) in shares outstanding | | | 515,256 | | | $ | 2,878,135 | |
| | | | | | | | |
| * | As of August 24, 2012, the last conversion of Class L shares to Class A shares was completed. There are no Class L shares outstanding and Class L shares are no longer being offered for sale. |
| ** | As of April 13, 2012, the last conversion of Class M shares to Class A shares was completed. There are no Class M shares outstanding and Class M shares are no longer being offered for sale. |
Note 7. Borrowing
The Series, along with other affiliated registered investment companies (the “Funds”), is a party to a syndicated credit agreement (“SCA”) with a group of banks. The purpose of the SCA is to provide an alternative source of temporary funding for capital share redemptions. The SCA provides for a commitment of $900 million for the period December 16, 2011 through November 14, 2012. The SCA has been renewed effective November 15, 2012 at substantially similar terms through November 14, 2013. The Funds pay an annualized commitment fee of 0.08% of the unused portion of the SCA. Prior to December 16, 2011, the Funds had another Syndicated Credit Agreement of a $750 million commitment with an annualized commitment fee of 0.10% of the unused portion. Interest on any borrowings under the SCA is paid at contracted market rates. The commitment fee for the unused amount is accrued daily and paid quarterly.
The Series utilized the SCA during the years ended October 31, 2012. The average daily balance for the 207 days that the Series had loans outstanding during the period was approximately $400,000, borrowed at a weighted average interest rate of 1.49%. At October 31, 2012, the Series has an outstanding loan amount of $984,000.
| | | | |
| Prudential International Equity Fund | | | 45 | |
Notes to Financial Statements
continued
Note 8. Ownership
As of October 31, 2012, approximately 33% of the Series was owned by three institutional shareholders for the beneficial interest of their underlying account holders.
Note 9. Dividends and Distributions to Shareholders
Subsequent to the fiscal year end, the Series declared ordinary income dividends on December 17, 2012 to shareholders of record on December 18, 2012. The ex-dividend date was December 19, 2012. The per share amounts declared were as follows:
| | | | |
| | | Ordinary Income | |
Class A | | $ | 0.13446 | |
Class B | | $ | 0.09608 | |
Class C | | $ | 0.09608 | |
Class F | | $ | 0.11014 | |
Class X | | $ | 0.09608 | |
Class Z | | $ | 0.15186 | |
Note 10. New Accounting Pronouncement
In December 2011, the Financial Accounting Standards Board (“FASB”) issued Accounting Standards Update (“ASU”) No. 2011-11 regarding “Disclosures about Offsetting Assets and Liabilities”. The amendments, which will be effective for annual reporting periods beginning on or after January 1, 2013 and interim periods within those annual periods, require an entity to disclose information about offsetting and related arrangements for assets and liabilities, financial instruments and derivatives that are either currently offset in accordance with current requirements or are subject to enforceable master netting arrangements or similar agreements. At this time, management is evaluating the implications of ASU No. 2011-11 and its impact on the financial statements has not been determined.
| | |
| 46 | | Visit our website at www.prudentialfunds.com |
Financial Highlights
| | | | | | | | | | | | | | | | | | | | |
| Class A Shares | |
| | | Year Ended October 31, | |
| | | 2012 | | | 2011 | | | 2010 | | | 2009 | | | 2008 | |
| Per Share Operating Performance(a): | | | | | | | | | | | | | | | | | | | | |
| Net Asset Value, Beginning Of Year | | | $5.72 | | | | $6.17 | | | | $5.77 | | | | $4.80 | | | | $10.49 | |
| Income (loss) from investment operations: | | | | | | | | | | | | | | | | | | | | |
| Net investment income | | | .12 | | | | .09 | | | | .08 | | | | .08 | | | | .16 | |
| Net realized and unrealized gain (loss) on investment, futures and foreign currency transactions | | | .29 | | | | (.46 | ) | | | .36 | | | | 1.06 | | | | (5.37 | ) |
| Total from investment operations | | | .41 | | | | (.37 | ) | | | .44 | | | | 1.14 | | | | (5.21 | ) |
| Less Dividends and Distributions: | | | | | | | | | | | | | | | | | | | | |
| Dividends from net investment income | | | (.11 | ) | | | (.11 | ) | | | (.10 | ) | | | (.17 | ) | | | (.14 | ) |
| Distributions from net realized gains | | | - | | | | - | | | | - | | | | - | | | | (.34 | ) |
| Total dividends and distributions | | | (.11 | ) | | | (.11 | ) | | | (.10 | ) | | | (.17 | ) | | | (.48 | ) |
| Capital Contributions (Note 6): | | | - | | | | .03 | | | | .06 | | | | - | | | | - | |
| Net asset value, end of year | | | $6.02 | | | | $5.72 | | | | $6.17 | | | | $5.77 | | | | $4.80 | |
| Total Return(b): | | | 7.40% | | | | (5.61)% | | | | 8.78% | | | | 24.65% | | | | (51.87)% | |
| |
| Ratios/Supplemental Data: | |
| Net assets, end of year (000) | | | $209,568 | | | | $214,610 | | | | $260,555 | | | | $275,993 | | | | $246,234 | |
| Average net assets (000) | | | $204,088 | | | | $247,859 | | | | $257,553 | | | | $240,744 | | | | $438,831 | |
| Ratios to average net assets(c): | | | | | | | | | | | | | | | | | | | | |
Expenses, including distribution and
service (12b-1) fees | | | 1.67% | | | | 1.64% | | | | 1.57% | | | | 1.54% | | | | 1.43% | |
| Expenses, excluding distribution and service (12b-1) fees(d) | | | 1.37% | | | | 1.34% | | | | 1.27% | | | | 1.24% | | | | 1.15% | |
| Expenses, excluding distribution and service (12b-1) fees | | | | | | | | | | | | | | | | | | | | |
| Net investment income | | | 2.18% | | | | 1.51% | | | | 1.35% | | | | 1.75% | | | | 1.94% | |
| Portfolio turnover rate | | | 83% | | | | 70% | | | | 96% | | | | 76% | | | | 74% | |
(a) Calculated based on average shares outstanding during the year.
(b) Total return does not consider the effects of sales loads. Total return is calculated assuming a purchase of a share on the first day and a sale on the last day of each year reported, and includes reinvestment of dividends and distributions. Total investment returns may reflect adjustments to conform to generally accepted accounting principles.
(c) Does not include expenses of the underlying portfolios in which the Series invests.
(d) The distributor of the series had contractually agreed to limit its distribution and service (12b-1) fees to .25% of the average daily net assets of the Class A shares through February 28, 2008.
See Notes to Financial Statements.
| | | | |
| Prudential International Equity Fund | | | 47 | |
Financial Highlights
continued
| | | | | | | | | | | | | | | | | | | | |
| Class B Shares | |
| | | Year Ended October 31, | |
| | | 2012 | | | 2011 | | | 2010 | | | 2009 | | | 2008 | |
| Per Share Operating Performance(a): | | | | | | | | | | | | | | | | | | | | |
| Net Asset Value, Beginning Of Year | | | $5.50 | | | | $5.94 | | | | $5.56 | | | | $4.61 | | | | $10.09 | |
| Income (loss) from investment operations: | | | | | | | | | | | | | | | | | | | | |
| Net investment income | | | .08 | | | | .05 | | | | .04 | | | | .05 | | | | .09 | |
| Net realized and unrealized gain (loss) on investment, futures and foreign currency transactions | | | .27 | | | | (.45 | ) | | | .35 | | | | 1.02 | | | | (5.16 | ) |
| Total from investment operations | | | .35 | | | | (.40 | ) | | | .39 | | | | 1.07 | | | | (5.07 | ) |
| Less Dividends and Distributions: | | | | | | | | | | | | | | | | | | | | |
| Dividends from net investment income | | | (.07 | ) | | | (.07 | ) | | | (.07 | ) | | | (.12 | ) | | | (.07 | ) |
| Distributions from net realized gains | | | - | | | | - | | | | - | | | | - | | | | (.34 | ) |
| Total dividends and distributions | | | (.07 | ) | | | (.07 | ) | | | (.07 | ) | | | (.12 | ) | | | (.41 | ) |
| Capital Contributions (Note 6): | | | - | | | | .03 | | | | .06 | | | | - | | | | - | |
| Net asset value, end of year | | | $5.78 | | | | $5.50 | | | | $5.94 | | | | $5.56 | | | | $4.61 | |
| Total Return(b): | | | 6.50% | | | | (6.27)% | | | | 8.11% | | | | 23.82% | | | | (52.22)% | |
| |
| Ratios/Supplemental Data: | |
| Net assets, end of year (000) | | | $5,439 | | | | $6,720 | | | | $9,160 | | | | $9,976 | | | | $11,205 | |
| Average net assets (000) | | | $5,823 | | | | $8,320 | | | | $9,246 | | | | $9,229 | | | | $22,786 | |
| Ratios to average net assets(c): | | | | | | | | | | | | | | | | | | | | |
| Expenses, including distribution and service (12b-1) fees | | | 2.37% | | | | 2.34% | | | | 2.27% | | | | 2.24% | | | | 2.15% | |
| Expenses, excluding distribution and service (12b-1) fees | | | 1.37% | | | | 1.34% | | | | 1.27% | | | | 1.24% | | | | 1.15% | |
| Expenses, excluding distribution and service (12b-1) fees | | | | | | | | | | | | | | | | | | | | |
| Net investment income | | | 1.48% | | | | .83% | | | | .66% | | | | 1.06% | | | | 1.17% | |
| Portfolio turnover rate | | | 83% | | | | 70% | | | | 96% | | | | 76% | | | | 74% | |
(a) Calculated based on average shares outstanding during the year.
(b) Total return does not consider the effects of sales loads. Total return is calculated assuming a purchase of a share on the first day and a sale on the last day of each year reported, and includes reinvestment of dividends and distributions. Total investment returns may reflect adjustments to conform to generally accepted accounting principles.
(c) Does not include expenses of the underlying portfolios in which the Series invests.
See Notes to Financial Statements.
| | |
| 48 | | Visit our website at www.prudentialfunds.com |
| | | | | | | | | | | | | | | | | | | | |
| Class C Shares | |
| | | Year Ended October 31, | |
| | | 2012 | | | 2011 | | | 2010 | | | 2009 | | | 2008 | |
| Per Share Operating Performance(a): | | | | | | | | | | | | | | | | | | | | |
| Net Asset Value, Beginning Of Year | | | $5.50 | | | | $5.94 | | | | $5.56 | | | | $4.61 | | | | $10.09 | |
| Income (loss) from investment operations: | | | | | | | | | | | | | | | | | | | | |
| Net investment income | | | .08 | | | | .05 | | | | .04 | | | | .05 | | | | .09 | |
| Net realized and unrealized gain (loss) on investment, futures and foreign currency transactions | | | .27 | | | | (.45 | ) | | | .35 | | | | 1.02 | | | | (5.16 | ) |
| Total from investment operations | | | .35 | | | | (.40 | ) | | | .39 | | | | 1.07 | | | | (5.07 | ) |
| Less Dividends and Distributions: | | | | | | | | | | | | | | | | | | | | |
| Dividends from net investment income | | | (.07 | ) | | | (.07 | ) | | | (.07 | ) | | | (.12 | ) | | | (.07 | ) |
| Distributions from net realized gains | | | - | | | | - | | | | - | | | | - | | | | (.34 | ) |
| Total dividends and distributions | | | (.07 | ) | | | (.07 | ) | | | (.07 | ) | | | (.12 | ) | | | (.41 | ) |
| Capital Contributions (Note 6): | | | - | | | | .03 | | | | .06 | | | | - | | | | - | |
| Net asset value, end of year | | | $5.78 | | | | $5.50 | | | | $5.94 | | | | $5.56 | | | | $4.61 | |
| Total Return(b): | | | 6.51% | | | | (6.27)% | | | | 8.11% | | | | 23.83% | | | | (52.22)% | |
| |
| Ratios/Supplemental Data: | |
| Net assets, end of year (000) | | | $17,658 | | | | $21,310 | | | | $26,625 | | | | $29,326 | | | | $28,858 | |
| Average net assets (000) | | | $19,019 | | | | $25,128 | | | | $26,974 | | | | $26,677 | | | | $55,111 | |
| Ratios to average net assets(c): | | | | | | | | | | | | | | | | | | | | |
| Expenses, including distribution and service (12b-1) fees | | | 2.37% | | | | 2.34% | | | | 2.27% | | | | 2.24% | | | | 2.15% | |
| Expenses, excluding distribution and service (12b-1) fees | | | 1.37% | | | | 1.34% | | | | 1.27% | | | | 1.24% | | | | 1.15% | |
| Expenses, excluding distribution and service (12b-1) fees | | | | | | | | | | | | | | | | | | | | |
| Net investment income | | | 1.49% | | | | .81% | | | | .66% | | | | 1.06% | | | | 1.19% | |
| Portfolio turnover rate | | | 83% | | | | 70% | | | | 96% | | | | 76% | | | | 74% | |
(a) Calculated based on average shares outstanding during the year.
(b) Total return does not consider the effects of sales loads. Total return is calculated assuming a purchase of a share on the first day and a sale on the last day of each year reported, and includes reinvestment of dividends and distributions. Total investment returns may reflect adjustments to conform to generally accepted accounting principles.
(c) Does not include expenses of the underlying portfolios in which the Series invests.
See Notes to Financial Statements.
| | | | |
| Prudential International Equity Fund | | | 49 | |
Financial Highlights
continued
| | | | | | | | | | | | | | | | | | | | |
| Class F Shares | |
| | | Year Ended October 31, | |
| | | 2012 | | | 2011 | | | 2010 | | | 2009 | | | 2008 | |
| Per Share Operating Performance(a): | | | | | | | | | | | | | | | | | | | | |
| Net Asset Value, Beginning Of Year | | | $5.50 | | | | $5.94 | | | | $5.56 | | | | $4.62 | | | | $10.11 | |
| Income (loss) from investment operations: | | | | | | | | | | | | | | | | | | | | |
| Net investment income | | | .09 | | | | .06 | | | | .05 | | | | .06 | | | | .11 | |
| Net realized and unrealized gain (loss) on investment, futures and foreign currency transactions | | | .29 | | | | (.44 | ) | | | .35 | | | | 1.01 | | | | (5.17 | ) |
| Total from investment operations | | | .38 | | | | (.38 | ) | | | .40 | | | | 1.07 | | | | (5.06 | ) |
| Less Dividends and Distributions: | | | | | | | | | | | | | | | | | | | | |
| Dividends from net investment income | | | (.09 | ) | | | (.09 | ) | | | (.08 | ) | | | (.13 | ) | | | (.09 | ) |
| Distributions from net realized gains | | | - | | | | - | | | | - | | | | - | | | | (.34 | ) |
| Total dividends and distributions | | | (.09 | ) | | | (.09 | ) | | | (.08 | ) | | | (.13 | ) | | | (.43 | ) |
| Capital Contributions (Note 6): | | | - | | | | .03 | | | | .06 | | | | - | | | | - | |
| Net asset value, end of year | | | $5.79 | | | | $5.50 | | | | $5.94 | | | | $5.56 | | | | $4.62 | |
| Total Return(b): | | | 6.98% | | | | (6.05)% | | | | 8.35% | | | | 24.04% | | | | (52.10)% | |
| |
| Ratios/Supplemental Data: | |
| Net assets, end of year (000) | | | $681 | | | | $1,572 | | | | $3,355 | | | | $5,226 | | | | $8,171 | |
| Average net assets (000) | | | $1,044 | | | | $2,442 | | | | $4,064 | | | | $5,769 | | | | $18,310 | |
| Ratios to average net assets(c): | | | | | | | | | | | | | | | | | | | | |
| Expenses, including distribution and service (12b-1) fees | | | 2.12% | | | | 2.09% | | | | 2.02% | | | | 1.99% | | | | 1.90% | |
| Expenses, excluding distribution and service (12b-1) fees | | | 1.37% | | | | 1.34% | | | | 1.27% | | | | 1.24% | | | | 1.15% | |
| Expenses, excluding distribution and service (12b-1) fees | | | | | | | | | | | | | | | | | | | | |
| Net investment income | | | 1.74% | | | | 1.07% | | | | .95% | | | | 1.35% | | | | 1.37% | |
| Portfolio turnover rate | | | 83% | | | | 70% | | | | 96% | | | | 76% | | | | 74% | |
(a) Calculated based on average shares outstanding during the year.
(b) Total return does not consider the effects of sales loads. Total return is calculated assuming a purchase of a share on the first day and a sale on the last day of each year reported, and includes reinvestment of dividends and distributions. Total investment returns may reflect adjustments to conform to generally accepted accounting principles.
(c) Does not include expenses of the underlying portfolios in which the Series invests.
See Notes to Financial Statements.
| | |
| 50 | | Visit our website at www.prudentialfunds.com |
| | | | | | | | | | | | | | | | | | | | | | |
| Class L Shares | |
| | | Period Ended
August 24, | | | | | Year Ended October 31, | |
| | | 2012(g) | | | | | 2011 | | | 2010 | | | 2009 | | | 2008 | |
| Per Share Operating Performance(a): | | | | | | | | | | | | | | | | | | | | | | |
| Net Asset Value, Beginning Of Period | | | $5.73 | | | | | | $6.17 | | | | $5.77 | | | | $4.79 | | | | $10.48 | |
| Income (loss) from investment operations: | | | | | | | | | | | | | | | | | | | | | | |
| Net investment income | | | .10 | | | | | | .08 | | | | .07 | | | | .07 | | | | .14 | |
| Net realized and unrealized gain (loss) on investment, futures and foreign currency transactions | | | .09 | | | | | | (.45 | ) | | | .36 | | | | 1.06 | | | | (5.38 | ) |
| Total from investment operations | | | .19 | | | | | | (.37 | ) | | | .43 | | | | 1.13 | | | | (5.24 | ) |
| Less Dividends and Distributions: | | | | | | | | | | | | | | | | | | | | | | |
| Dividends from net investment income | | | (.10 | ) | | | | | (.10 | ) | | | (.09 | ) | | | (.15 | ) | | | (.11 | ) |
| Distributions from net realized gains | | | - | | | | | | - | | | | - | | | | - | | | | (.34 | ) |
| Total dividends and distributions | | | (.10 | ) | | | | | (.10 | ) | | | (.09 | ) | | | (.15 | ) | | | (.45 | ) |
| Capital Contributions (Note 6): | | | - | | | | | | .03 | | | | .06 | | | | - | | | | - | |
| Net asset value, end of period | | | $5.82 | | | | | | $5.73 | | | | $6.17 | | | | $5.77 | | | | $4.79 | |
| Total Return(b): | | | 3.42% | | | | | | (5.62)% | | | | 8.59% | | | | 24.49% | | | | (52.07)% | |
| |
| Ratios/Supplemental Data: | |
| Net assets, end of period (000) | | | $7,694 | | | | | | $8,644 | | | | $10,919 | | | | $12,342 | | | | $12,621 | |
| Average net assets (000) | | | $8,019 | | | | | | $10,189 | | | | $11,216 | | | | $11,250 | | | | $24,942 | |
| Ratios to average net assets(c): | | | | | | | | | | | | | | | | | | | | | | |
| Expenses, including distribution and service (12b-1) fees | | | 1.90% | (d) | | | | | 1.84% | | | | 1.77% | | | | 1.74% | | | | 1.65% | |
| Expenses, excluding distribution and service (12b-1) fees | | | 1.40% | (d) | | | | | 1.34% | | | | 1.27% | | | | 1.24% | | | | 1.15% | |
| Expenses, excluding distribution and service (12b-1) fees | | | | | | | | | | | | | | | | | | | | | | |
| Net investment income | | | 2.22% | (d) | | | | | 1.31% | | | | 1.16% | | | | 1.56% | | | | 1.68% | |
| Portfolio turnover rate | | | 83% | (e)(f) | | | | | 70% | | | | 96% | | | | 76% | | | | 74% | |
(a) Calculated based on average shares outstanding during the period.
(b) Total return does not consider the effects of sales loads. Total return is calculated assuming a purchase of a share on the first day and a sale on the last day of each period reported, and includes reinvestment of dividends and distributions. Total investment returns may reflect adjustments to conform to generally accepted accounting principles. Total returns for periods less than one full year are not annualized.
(c) Does not include expenses of the underlying portfolios in which the Series invests.
(d) Annualized.
(e) Not annualized.
(f) Calculated as of October 31, 2012.
(g) As of August 24, 2012, the last conversion of Class L shares to Class A shares was completed. There are no Class L shares outstanding and Class L shares are no longer being offered for sale.
See Notes to Financial Statements.
| | | | |
| Prudential International Equity Fund | | | 51 | |
Financial Highlights
continued
| | | | | | | | | | | | | | | | | | | | | | |
| Class M Shares | |
| | | Period Ended April 13, | | | | | Year Ended October 31, | |
| | | 2012(g) | | | | | 2011 | | | 2010 | | | 2009 | | | 2008 | |
| Per Share Operating Performance(a): | | | | | | | | | | | | | | | | | | | | | | |
| Net Asset Value, Beginning Of Period | | | $5.50 | | | | | | $5.94 | | | | $5.56 | | | | $4.61 | | | | $10.09 | |
| Income (loss) from investment operations: | | | | | | | | | | | | | | | | | | | | | | |
| Net investment income | | | .01 | | | | | | .05 | | | | .04 | | | | .05 | | | | .07 | |
| Net realized and unrealized gain (loss) on investment, futures and foreign currency transactions | | | .09 | | | | | | (.45 | ) | | | .35 | | | | 1.02 | | | | (5.14 | ) |
| Total from investment operations | | | .10 | | | | | | (.40 | ) | | | .39 | | | | 1.07 | | | | (5.07 | ) |
| Less Dividends and Distributions: | | | | | | | | | | | | | | | | | | | | | | |
| Dividends from net investment income | | | (.07 | ) | | | | | (.07 | ) | | | (.07 | ) | | | (.12 | ) | | | (.07 | ) |
| Distributions from net realized gains | | | - | | | | | | - | | | | - | | | | - | | | | (.34 | ) |
| Total dividends and distributions | | | (.07 | ) | | | | | (.07 | ) | | | (.07 | ) | | | (.12 | ) | | | (.41 | ) |
| Capital Contributions (Note 6): | | | - | | | | | | .03 | | | | .06 | | | | - | | | | - | |
| Net asset value, end of period | | | $5.53 | | | | | | $5.50 | | | | $5.94 | | | | $5.56 | | | | $4.61 | |
| Total Return(b): | | | 1.90% | | | | | | (6.27)% | | | | 8.11% | | | | 23.82% | | | | (52.22)% | |
| |
| Ratios/Supplemental Data: | |
| Net assets, end of period (000) | | | $29 | | | | | | $743 | | | | $2,985 | | | | $6,622 | | | | $11,467 | |
| Average net assets (000) | | | $342 | | | | | | $1,768 | | | | $4,441 | | | | $7,957 | | | | $34,319 | |
| Ratios to average net assets(c): | | | | | | | | | | | | | | | | | | | | | | |
Expenses, including distribution and
service (12b-1) fees | | | 2.40% | (d) | | | | | 2.34% | | | | 2.27% | | | | 2.24% | | | | 2.15% | |
Expenses, excluding distribution and
service (12b-1) fees | | | 1.40% | (d) | | | | | 1.34% | | | | 1.27% | | | | 1.24% | | | | 1.15% | |
Expenses, excluding distribution and
service (12b-1) fees | | | | | | | | | | | | | | | | | | | | | | |
| Net investment income | | | .26% | (d) | | | | | .76% | | | | .68% | | | | 1.09% | | | | .92% | |
| Portfolio turnover rate | | | 83% | (e)(f) | | | | | 70% | | | | 96% | | | | 76% | | | | 74% | |
(a) Calculated based on average shares outstanding during the period.
(b) Total return does not consider the effects of sales loads. Total return is calculated assuming a purchase of a share on the first day and a sale on the last day of each period reported, and includes reinvestment of dividends and distributions. Total investment returns may reflect adjustments to conform to generally accepted accounting principles. Total returns for periods less than one full year are not annualized.
(c) Does not include expenses of the underlying portfolios in which the Series invests.
(d) Annualized.
(e) Not annualized.
(f) Calculated as of October 31, 2012.
(g) As of April 13, 2012, the last conversion of Class M shares to Class A shares was completed. There are no Class M shares outstanding and Class M shares are no longer being offered for sale.
See Notes to Financial Statements.
| | |
| 52 | | Visit our website at www.prudentialfunds.com |
| | | | | | | | | | | | | | | | | | | | |
| Class X Shares | |
| | | Year Ended October 31, | |
| | | 2012 | | | 2011 | | | 2010 | | | 2009 | | | 2008 | |
| Per Share Operating Performance(a): | | | | | | | | | | | | | | | | | | | | |
| Net Asset Value, Beginning Of Period | | | $5.50 | | | | $5.94 | | | | $5.56 | | | | $4.61 | | | | $10.09 | |
| Income (loss) from investment operations: | | | | | | | | | | | | | | | | | | | | |
| Net investment income | | | .08 | | | | .05 | | | | .04 | | | | .05 | | | | .09 | |
| Net realized and unrealized gain (loss) on investment, futures and foreign currency transactions | | | .28 | | | | (.45 | ) | | | .35 | | | | 1.02 | | | | (5.16 | ) |
| Total from investment operations | | | .36 | | | | (.40 | ) | | | .39 | | | | 1.07 | | | | (5.07 | ) |
| Less Dividends and Distributions: | | | | | | | | | | | | | | | | | | | | |
| Dividends from net investment income | | | (.07 | ) | | | (.07 | ) | | | (.07 | ) | | | (.12 | ) | | | (.07 | ) |
| Distributions from net realized gains | | | - | | | | - | | | | - | | | | - | | | | (.34 | ) |
| Total dividends and distributions | | | (.07 | ) | | | (.07 | ) | | | (.07 | ) | | | (.12 | ) | | | (.41 | ) |
| Capital Contributions (Note 6): | | | - | | | | .03 | | | | .06 | | | | - | | | | - | |
| Net asset value, end of period | | | $5.79 | | | | $5.50 | | | | $5.94 | | | | $5.56 | | | | $4.61 | |
| Total Return(b): | | | 6.69% | | | | (6.27)% | | | | 8.11% | | | | 23.82% | | | | (52.22)% | |
| |
| Ratios/Supplemental Data: | |
| Net assets, end of period (000) | | | $707 | | | | $1,569 | | | | $3,067 | | | | $5,957 | | | | $8,597 | |
| Average net assets (000) | | | $1,077 | | | | $2,351 | | | | $4,020 | | | | $6,611 | | | | $17,864 | |
| Ratios to average net assets(c): | | | | | | | | | | | | | | | | | | | | |
| Expenses, including distribution and service (12b-1) fees | | | 2.37% | | | | 2.34% | | | | 2.27% | | | | 2.24% | | | | 2.15% | |
| Expenses, excluding distribution and service (12b-1) fees | | | 1.37% | | | | 1.34% | | | | 1.27% | | | | 1.24% | | | | 1.15% | |
| Expenses, excluding distribution and service (12b-1) fees | | | | | | | | | | | | | | | | | | | | |
| Net investment income | | | 1.45% | | | | .80% | | | | .66% | | | | 1.10% | | | | 1.18% | |
| Portfolio turnover rate | | | 83% | | | | 70% | | | | 96% | | | | 76% | | | | 74% | |
(a) Calculated based on average shares outstanding during the year.
(b) Total return does not consider the effects of sales loads. Total return is calculated assuming a purchase of a share on the first day and a sale on the last day of each year reported, and includes reinvestment of dividends and distributions. Total investment returns may reflect adjustments to conform to generally accepted accounting principles.
(c) Does not include expenses of the underlying portfolios in which the Series invests.
See Notes to Financial Statements.
| | | | |
| Prudential International Equity Fund | | | 53 | |
Financial Highlights
continued
| | | | | | | | | | | | | | | | | | | | |
| Class Z Shares | |
| | | Year Ended October 31, | |
| | | 2012 | | | 2011 | | | 2010 | | | 2009 | | | 2008 | |
| Per Share Operating Performance(a): | | | | | | | | | | | | | | | | | | | | |
| Net Asset Value, Beginning Of Year | | | $5.77 | | | | $6.22 | | | | $5.82 | | | | $4.85 | | | | $10.60 | |
| Income (loss) from investment operations: | | | | | | | | | | | | | | | | | | | | |
| Net investment income | | | .14 | | | | .11 | | | | .13 | | | | .10 | | | | .18 | |
| Net realized and unrealized gain (loss) on investment, futures and foreign currency transactions | | | .29 | | | | (.46 | ) | | | .33 | | | | 1.06 | | | | (5.43 | ) |
| Total from investment operations | | | .43 | | | | (.35 | ) | | | .46 | | | | 1.16 | | | | (5.25 | ) |
| Less Dividends and Distributions: | | | | | | | | | | | | | | | | | | | | |
| Dividends from net investment income | | | (.13 | ) | | | (.13 | ) | | | (.12 | ) | | | (.19 | ) | | | (.16 | ) |
| Distributions from net realized gains | | | - | | | | - | | | | - | | | | - | | | | (.34 | ) |
| Total dividends and distributions | | | (.13 | ) | | | (.13 | ) | | | (.12 | ) | | | (.19 | ) | | | (.50 | ) |
| Capital Contributions (Note 6): | | | - | | | | .03 | | | | .06 | | | | - | | | | - | |
| Net asset value, end of year | | | $6.07 | | | | $5.77 | | | | $6.22 | | | | $5.82 | | | | $4.85 | |
| Total Return(b): | | | 7.69% | | | | (5.30)% | | | | 8.98% | | | | 24.95% | | | | (51.77)% | |
| |
| Ratios/Supplemental Data: | |
| Net assets, end of year (000) | | | $50,531 | | | | $44,573 | | | | $44,833 | | | | $229,771 | | | | $169,874 | |
| Average net assets (000) | | | $45,946 | | | | $46,529 | | | | $149,685 | | | | $184,038 | | | | $285,097 | |
| Ratios to average net assets(c): | | | | | | | | | | | | | | | | | | | | |
Expenses, including distribution and
service (12b-1) fees | | | 1.37% | | | | 1.34% | | | | 1.27% | | | | 1.24% | | | | 1.15% | |
Expenses, excluding distribution and
service (12b-1) fees | | | 1.37% | | | | 1.34% | | | | 1.27% | | | | 1.24% | | | | 1.15% | |
Expenses, excluding distribution and
service (12b-1) fees | | | | | | | | | | | | | | | | | | | | |
| Net investment income | | | 2.46% | | | | 1.77% | | | | 2.12% | | | | 2.05% | | | | 2.22% | |
| Portfolio turnover rate | | | 83% | | | | 70% | | | | 96% | | | | 76% | | | | 74% | |
(a) Calculated based on average shares outstanding during the year.
(b) Total return does not consider the effects of sales loads. Total return is calculated assuming a purchase of a share on the first day and a sale on the last day of each year reported, and includes reinvestment of dividends and distributions. Total investment returns may reflect adjustments to conform to generally accepted accounting principles.
(c) Does not include expenses of the underlying portfolios in which the Series invests.
See Notes to Financial Statements.
| | |
| 54 | | Visit our website at www.prudentialfunds.com |
Report of Independent Registered Public
Accounting Firm
The Board of Directors and Shareholders
Prudential World Fund, Inc.:
We have audited the accompanying statement of assets and liabilities of Prudential International Equity Fund (one of the series constituting Prudential World Fund, Inc., hereafter referred to as the “Fund”), including the portfolio of investments, as of October 31, 2012, and the related statement of operations for the year then ended, the statement of changes in net assets for each of the years in the two-year period then ended and the financial highlights for each of the years in the five-year period then ended. These financial statements and financial highlights are the responsibility of the Fund’s management. Our responsibility is to express an opinion on these financial statements and financial highlights based on our audits.
We conducted our audits in accordance with the standards of the Public Company Accounting Oversight Board (United States). Those standards require that we plan and perform the audit to obtain reasonable assurance about whether the financial statements and financial highlights are free of material misstatement. An audit includes examining, on a test basis, evidence supporting the amounts and disclosures in the financial statements. Our procedures included confirmation of securities owned as of October 31, 2012, by correspondence with the custodian, transfer agent and brokers or by other appropriate auditing procedures when replies from brokers were not received. An audit also includes assessing the accounting principles used and significant estimates made by management, as well as evaluating the overall financial statement presentation. We believe that our audits provide a reasonable basis for our opinion.
In our opinion, the financial statements and financial highlights referred to above present fairly, in all material respects, the financial position of the Fund as of October 31, 2012, and the results of its operations for the year then ended, the changes in its net assets for each of the years in the two-year period then ended and the financial highlights for each of the years in the five-year period then ended, in conformity with U.S. generally accepted accounting principles.

New York, New York
December 21, 2012
| | | | |
| Prudential International Equity Fund | | | 55 | |
Tax Information
(Unaudited)
For the year ended October 31, 2012, the Series reports, in accordance with Section 854 of the Internal Revenue Code, the following percentages of the ordinary income distributions paid as qualified dividend income (QDI):
| | | | |
| | | QDI | |
Prudential International Equity Fund | | | 100% | |
In January 2013, you will be advised on IRS Form 1099-DIV or substitute 1099-DIV as to the federal tax status of distributions received by you in calendar year 2012.
| | |
| 56 | | Visit our website at www.prudentialfunds.com |
INFORMATION ABOUT BOARD MEMBERS AND OFFICERS
(Unaudited)
Information about Board Members and Officers of the Fund is set forth below. Board Members who are not deemed to be “interested persons” of the Fund, as defined in the 1940 Act, are referred to as “Independent Board Members.” Board Members who are deemed to be “interested persons” of the Fund are referred to as “Interested Board Members.” The Board Members are responsible for the overall supervision of the operations of the Fund and perform the various duties imposed on the directors of investment companies by the 1940 Act. The Board in turn elects the Officers, who are responsible for administering the day-to-day operations of the Fund.
| | | | |
| Independent Board Members(1) |
Name, Address, Age Position(s) Portfolios Overseen | | Principal Occupation(s) During Past Five Years | | Other Directorships Held |
Kevin J. Bannon (60) Board Member Portfolios Overseen: 63 | | Managing Director (since April 2008) and Chief Investment Officer (since October 2008) of Highmount Capital LLC (registered investment adviser); formerly Executive Vice President and Chief Investment Officer (April 1993-August 2007) of Bank of New York Company; President (May 2003-May 2007) of BNY Hamilton Family of Mutual Funds. | | Director of Urstadt Biddle Properties (since September 2008). |
Linda W. Bynoe (60) Board Member Portfolios Overseen: 63 | | President and Chief Executive Officer (since March 1995) and formerly Chief Operating Officer (December 1989-February 1995) of Telemat Ltd. (management consulting); formerly Vice President (January 1985-June 1989) at Morgan Stanley & Co (broker-dealer). | | Director of Simon Property Group, Inc. (retail real estate) (May 2003-May 2012); Director of Anixter International, Inc. (communication products distributor) (since January 2006); Director of Northern Trust Corporation (financial services) (since April 2006); Trustee of Equity Residential (residential real estate) (since December 2009). |
Michael S. Hyland, CFA (67) Board Member Portfolios Overseen: 63 | | Independent Consultant (since February 2005); formerly Senior Managing Director (July 2001-February 2005) of Bear Stearns & Co, Inc.; Global Partner, INVESCO (1999-2001); Managing Director and President of Salomon Brothers Asset Management (1989-1999). | | None. |
Douglas H. McCorkindale (73) Board Member Portfolios Overseen: 63 | | Formerly Chairman (February 2001-June 2006), Chief Executive Officer (June 2000-July 2005), President (September 1997-July 2005) and Vice Chairman (March 1984-May 2000) of Gannett Co. Inc. (publishing and media). | | Director of Lockheed Martin Corp. (aerospace and defense) (since May 2001). |
Visit our website at www.prudentialfunds.com
| | | | |
| Independent Board Members(1) |
Name, Address, Age Position(s) Portfolios Overseen | | Principal Occupation(s) During Past Five Years | | Other Directorships Held |
Stephen P. Munn (70) Board Member Portfolios Overseen: 63 | | Lead Director (since 2007) and formerly Chairman (1993-2007) of Carlisle Companies Incorporated (manufacturer of industrial products). | | Lead Director (since 2007) of Carlisle Companies Incorporated (manufacturer of industrial products). |
Richard A. Redeker (69) Board Member & Independent Chair Portfolios Overseen: 63 | | Retired Mutual Fund Senior Executive (44 years); Management Consultant; Independent Directors Council (organization of 2,800 Independent Mutual Fund Directors)-Executive Committee, Chair of Policy Steering Committee, Governing Council. | | None. |
Robin B. Smith (73) Board Member Portfolios Overseen: 63 | | Chairman of the Board (since January 2003) of Publishers Clearing House (direct marketing); Member of the Board of Directors of ADLPartner (marketing) (since December 2010); formerly Chairman and Chief Executive Officer (August 1996-January 2003) of Publishers Clearing House. | | Formerly Director of BellSouth Corporation (telecommunications) (1992-2006). |
Stephen G. Stoneburn (69) Board Member Portfolios Overseen: 63 | | Chairman, (since July 2011), President and Chief Executive Officer (since June 1996) of Quadrant Media Corp. (publishing company); formerly President (June 1995-June 1996) of Argus Integrated Media, Inc.; Senior Vice President and Managing Director (January 1993-1995) of Cowles Business Media; Senior Vice President of Fairchild Publications, Inc. (1975-1989). | | None. |
| | | | |
| Interested Board Members(1) |
Name, Address, Age Position(s) Portfolios Overseen | | Principal Occupation(s) During Past Five Years | | Other Directorships Held |
Stuart S. Parker (50) Board Member & President Portfolios Overseen: 63 | | President of Prudential Investments LLC (since January 2012); Executive Vice President of Jennison Associates LLC and Head of Retail Distribution of Prudential Investments LLC (June 2005 - December 2011). | | None. |
Prudential International Equity Fund
| | | | |
| Interested Board Members(1) |
Name, Address, Age Position(s) Portfolios Overseen | | Principal Occupation(s) During Past Five Years | | Other Directorships Held |
Scott E. Benjamin (39) Board Member & Vice President Portfolios Overseen: 63 | | Executive Vice President (since June 2009) of Prudential Investments LLC; Executive Vice President (June 2009-June 2012) and Vice President (since June 2012) of Prudential Investment Management Services LLC; Executive Vice President (since September 2009) of AST Investment Services, Inc.; Senior Vice President of Product Development and Marketing, Prudential Investments (since February 2006); Vice President of Product Development and Product Management, Prudential Investments (2003-2006). | | None. |
(1) The year that each Board Member joined the Funds’ Board is as follows:
Kevin J. Bannon, 2008; Linda W. Bynoe, 2005; Michael S. Hyland, 2008; Douglas H. McCorkindale, 2003; Stephen P. Munn, 2008; Richard A. Redeker, 2003; Robin B. Smith, 1996; Stephen G. Stoneburn, 1996; Stuart S. Parker, Board Member and President since 2012; Scott E. Benjamin, Board Member since 2010 and Vice President since 2009.
| | |
| Fund Officers(a)(1) |
Name, Address and Age Position with Fund | | Principal Occupation(s) During Past Five Years |
Judy A. Rice (64) Vice President | | Chairman of Prudential Investments LLC (since January 2012); President, Chief Executive Officer (May 2011-Present) and Executive Vice President (December 2008-May 2011) of Prudential Investment Management Services LLC; formerly President, Chief Executive Officer, Chief Operating Officer and Officer-In-Charge (February 2003-December 2011) of Prudential Investments LLC; formerly President, Chief Executive Officer and Officer-In-Charge (April 2003-December 2011) of Prudential Mutual Fund Services LLC (PMFS); formerly Member of the Board of Directors of Jennison Associates LLC (November 2010-December 2011); formerly Vice President (February 1999-April 2006) of Prudential Investment Management Services LLC; formerly President, COO, CEO and Manager of PIFM Holdco, LLC (April 2006-December 2011); formerly President, Chief Executive Officer, Chief Operating Officer and Officer-In-Charge (May 2003-June 2005) and Director (May 2003-March 2006) and Executive Vice President (June 2005-March 2006) of AST Investment Services, Inc.; Member of Board of Governors of the Investment Company Institute. |
Visit our website at www.prudentialfunds.com
| | |
| Fund Officers(a)(1) |
Name, Address and Age Position with Fund | | Principal Occupation(s) During Past Five Years |
Raymond A. O’Hara (57) Chief Legal Officer | | Vice President and Corporate Counsel (since July 2010) of Prudential Insurance Company of America (Prudential); Vice President (March 2011-Present) of Pruco Life Insurance Company and Pruco Life Insurance Company of New Jersey; Vice President and Corporate Counsel (March 2011-Present) of Prudential Annuities Life Assurance Corporation; Chief Legal Officer of Prudential Investments LLC (since June 2012); Chief Legal Officer of PMFS (since June 2012) and Corporate Counsel of AST Investment Services, Inc. (since June 2012); formerly Assistant Vice President and Corporate Counsel (September 2008-July 2010) of The Hartford Financial Services Group, Inc.; formerly Associate (September 1980-December 1987) and Partner (January 1988–August 2008) of Blazzard & Hasenauer, P.C. (formerly, Blazzard, Grodd & Hasenauer, P.C.). |
Deborah A. Docs (54) Secretary | | Vice President and Corporate Counsel (since January 2001) of Prudential; Vice President (since December 1996) and Assistant Secretary (since March 1999) of Prudential Investments LLC; formerly Vice President and Assistant Secretary (May 2003-June 2005) of AST Investment Services, Inc. |
Jonathan D. Shain (54) Assistant Secretary | | Vice President and Corporate Counsel (since August 1998) of Prudential; Vice President and Assistant Secretary (since May 2001) of Prudential Investments LLC; Vice President and Assistant Secretary (since February 2001) of PMFS; formerly Vice President and Assistant Secretary (May 2003-June 2005) of AST Investment Services, Inc. |
Claudia DiGiacomo (38) Assistant Secretary | | Vice President and Corporate Counsel (since January 2005) of Prudential; Vice President and Assistant Secretary of Prudential Investments LLC (since December 2005); Associate at Sidley Austin Brown & Wood LLP (1999-2004). |
Andrew R. French (50) Assistant Secretary | | Vice President and Corporate Counsel (since February 2010) of Prudential; formerly Director and Corporate Counsel (2006-2010) of Prudential; Vice President and Assistant Secretary (since January 2007) of Prudential Investments LLC; Vice President and Assistant Secretary (since January 2007) of PMFS. |
Amanda S. Ryan (34) Assistant Secretary | | Director and Corporate Counsel (since March 2012) of Prudential; Director and Assistant Secretary (since June 2012) of Prudential Investments LLC; Associate at Ropes & Gray (2008-2012). |
Timothy J. Knierim (53) Chief Compliance Officer | | Chief Compliance Officer of Prudential Investment Management, Inc. (since July 2007); formerly Chief Risk Officer of Prudential Investment Management, Inc. and Prudential Investments LLC (2002-2007) and formerly Chief Ethics Officer of Prudential Investment Management, Inc. and Prudential Investments LLC (2006-2007). |
Valerie M. Simpson (54) Deputy Chief Compliance Officer | | Chief Compliance Officer (since April 2007) of Prudential Investments LLC and AST Investment Services, Inc.; formerly Vice President-Financial Reporting (June 1999-March 2006) for Prudential Life and Annuities Finance. |
Prudential International Equity Fund
| | |
| Fund Officers(a)(1) | | |
Name, Address and Age Position with Fund | | Principal Occupation(s) During Past Five Years |
Theresa C. Thompson (50) Deputy Chief Compliance Officer | | Vice President, Compliance, Prudential Investments LLC (since April 2004); and Director, Compliance, Prudential Investments LLC (2001-2004). |
Richard W. Kinville (44) Anti-Money Laundering Compliance Officer | | Vice President, Corporate Compliance, Anti-Money Laundering Unit (since January 2005) of Prudential; committee member of the American Council of Life Insurers Anti-Money Laundering and Critical Infrastructure Committee (since January 2007); formerly Investigator and Supervisor in the Special Investigations Unit for the New York Central Mutual Fire Insurance Company (August 1994-January 1999); Investigator in AXA Financial’s Internal Audit Department and Manager in AXA’s Anti-Money Laundering Office (January 1999-January 2005); first chair of the American Council of Life Insurers Anti-Money Laundering and Critical Infrastructure Committee (June 2007-December 2009). |
Grace C. Torres (53) Treasurer and Principal Financial and Accounting Officer | | Assistant Treasurer (since March 1999) and Senior Vice President (since September 1999) of Prudential Investments LLC; Assistant Treasurer (since May 2003) and Vice President (since June 2005) of AST Investment Services, Inc.; Senior Vice President and Assistant Treasurer (since May 2003) of Prudential Annuities Advisory Services, Inc.; formerly Senior Vice President (May 2003-June 2005) of AST Investment Services, Inc. |
M. Sadiq Peshimam (48) Assistant Treasurer | | Vice President (since 2005) of Prudential Investments LLC. |
Peter Parrella (54) Assistant Treasurer | | Vice President (since 2007) and Director (2004-2007) within Prudential Mutual Fund Administration; formerly Tax Manager at SSB Citi Fund Management LLC (1997-2004). |
(a) Excludes Mr. Parker and Mr. Benjamin, interested Board Members who also serve as President and Vice President, respectively.
(1) The year that each individual became an officer of the Fund is as follows:
Judy A. Rice, 2012; Raymond A. O’Hara, 2012; Deborah A. Docs, 2005; Jonathan D. Shain, 2005; Claudia DiGiacomo, 2005; Andrew R. French, 2006; Amanda S. Ryan, 2012; Timothy J. Knierim, 2007; Valerie M. Simpson, 2007; Theresa C. Thompson, 2008; Richard W. Kinville, 2011; Grace C. Torres, 1995; Sadiq Peshimam, 2006; Peter Parrella, 2007.
Explanatory Notes to Tables:
| n | Board Members are deemed to be “Interested,” as defined in the 1940 Act, by reason of their affiliation with Prudential Investments LLC and/or an affiliate of Prudential Investments LLC. |
| n | Unless otherwise noted, the address of all Board Members and Officers is c/o Prudential Investments LLC, Gateway Center Three, 100 Mulberry Street, Newark, New Jersey 07102-4077. |
| n | There is no set term of office for Board Members or Officers. The Board Members have adopted a retirement policy, which calls for the retirement of Board Members on December 31 of the year in which they reach the age of 75. |
| n | “Other Directorships Held” includes only directorships of companies required to register or file reports with the SEC under the 1934 Act (that is, “public companies”) or other investment companies registered under the 1940 Act. |
| n | “Portfolios Overseen” includes all investment companies managed by Prudential Investments LLC. The investment companies for which PI serves as manager include the Prudential Investments Mutual Funds, The Prudential Variable Contract Accounts, Target Mutual Funds, Prudential Short Duration High Yield Fund, Inc., The Prudential Series Fund, Prudential’s Gibraltar Fund, Inc. and the Advanced Series Trust. |
Visit our website at www.prudentialfunds.com
Approval of Advisory Agreements
The Fund’s Board of Directors
The Board of Directors (the “Board”) of Prudential International Equity Fund (the “Fund”)1 consists of ten individuals, eight of whom are not “interested persons” of the Fund, as defined in the Investment Company Act of 1940, as amended (the “1940 Act”) (the “Independent Directors”). The Board is responsible for the oversight of the Fund and its operations, and performs the various duties imposed on the directors of investment companies by the 1940 Act. The Independent Directors have retained independent legal counsel to assist them in connection with their duties. The Chair of the Board is an Independent Director. The Board has established three standing committees: the Audit Committee, the Nominating and Governance Committee, and the Investment Committee. Each committee is chaired by, and composed of, Independent Directors.
Annual Approval of the Fund’s Advisory Agreements
As required under the 1940 Act, the Board determines annually whether to renew the Fund’s management agreement with Prudential Investments LLC (“PI”) and the Fund’s subadvisory agreement with Quantitative Management Associates LLC (“QMA”). In considering the renewal of the agreements, the Board, including all of the Independent Directors, met on June 5-7, 2012 and approved the renewal of the agreements through July 31, 2013, after concluding that the renewal of the agreements was in the best interests of the Fund and its shareholders.
In advance of the meetings, the Board requested and received materials relating to the agreements, and had the opportunity to ask questions and request further information in connection with their consideration. Among other things, the Board considered comparative fee information from PI and QMA. Also, the Board considered comparisons with other mutual funds in relevant Peer Universes and Peer Groups, as is further discussed below.
In approving the agreements, the Board, including the Independent Directors advised by independent legal counsel, considered the factors it deemed relevant, including the nature, quality and extent of services provided by PI and the subadviser, the performance of the Fund, the profitability of PI and its affiliates, expenses and fees, and the potential for economies of scale that may be shared with the Fund and its shareholders as the Fund’s assets grow. In their deliberations, the Directors did not identify any single factor which alone was responsible for the Board’s decision to approve the agreements with respect to the Fund. In connection with its deliberations, the Board considered information provided by PI throughout the year at regular Board
| 1 | Prudential International Equity Fund is a series of Prudential World Fund, Inc. |
Prudential International Equity Fund
Approval of Advisory Agreements (continued)
meetings, presentations from portfolio managers and other information, as well as information furnished at or in advance of the meetings on June 5-7, 2012.
The Directors determined that the overall arrangements between the Fund and PI, which serves as the Fund’s investment manager pursuant to a management agreement, and between PI and QMA, which serves as the Fund’s subadviser pursuant to the terms of a subadvisory agreement with PI, are in the best interests of the Fund and its shareholders in light of the services performed, fees charged and such other matters as the Directors considered relevant in the exercise of their business judgment.
The material factors and conclusions that formed the basis for the Directors’ reaching their determinations to approve the continuance of the agreements are separately discussed below.
Nature, Quality and Extent of Services
The Board received and considered information regarding the nature, quality and extent of services provided to the Fund by PI and QMA. The Board considered the services provided by PI, including but not limited to the oversight of the subadviser for the Fund, as well as the provision of fund recordkeeping, compliance, and other services to the Fund. With respect to PI’s oversight of the subadviser, the Board noted that PI’s Strategic Investment Research Group (“SIRG”), which is a business unit of PI, is responsible for monitoring and reporting to PI’s senior management on the performance and operations of the subadviser. The Board also considered that PI pays the salaries of all of the officers and non-independent Directors of the Fund. The Board also considered the investment subadvisory services provided by QMA, as well as adherence to the Fund’s investment restrictions and compliance with applicable Fund policies and procedures. The Board considered PI’s evaluation of the subadviser, as well as PI’s recommendation, based on its review of the subadviser, to renew the subadvisory agreement.
The Board reviewed the qualifications, backgrounds and responsibilities of PI’s senior management responsible for the oversight of the Fund and QMA, and also reviewed the qualifications, backgrounds and responsibilities of QMA’s portfolio managers who are responsible for the day-to-day management of the Fund’s portfolio. The Board was provided with information pertaining to PI’s and QMA’s organizational structure, senior management, investment operations, and other relevant information pertaining to both PI and QMA. The Board also noted that it received favorable compliance reports from the Fund’s Chief Compliance Officer (“CCO”) as to both PI and QMA. The Board noted that QMA is affiliated with PI.
Visit our website at www.prudentialfunds.com
The Board concluded that it was satisfied with the nature, extent and quality of the investment management services provided by PI and the subadvisory services provided to the Fund by QMA, and that there was a reasonable basis on which to conclude that the Fund benefits from the services provided by PI and QMA under the management and subadvisory agreements.
Costs of Services and Profits Realized by PI
The Board was provided with information on the profitability of PI and its affiliates in serving as the Fund’s investment manager. The Board discussed with PI the methodology utilized in assembling the information regarding profitability and considered its reasonableness. The Board recognized that it is difficult to make comparisons of profitability from fund management contracts because comparative information is not generally publicly available and is affected by numerous factors, including the structure of the particular adviser, the types of funds it manages, its business mix, numerous assumptions regarding allocations and the adviser’s capital structure and cost of capital. The Board did not separately consider the profitability of the subadviser, an affiliate of PI, as its profitability was reflected in the profitability report for PI. Taking these factors into account, the Board concluded that the profitability of PI and its affiliates in relation to the services rendered was not unreasonable.
Economies of Scale
The Board noted that the management fee schedule for the Fund includes breakpoints, which have the effect of decreasing the fee rate as assets increase, and that at its current level of assets, the Fund’s effective fee rate reflected some of those rate reductions. The Board received and discussed information concerning whether PI realizes economies of scale as the Fund’s assets grow beyond current levels. The Board took note that the Fund’s fee structure currently results in benefits to Fund shareholders whether or not PI realizes any economies of scale. The Board also recognized the inherent limitations of any analysis of economies of scale, stemming largely from the Board’s understanding that most of PI’s costs are not specific to individual funds, but rather are incurred across a variety of products and services
Other Benefits to PI and QMA
The Board considered potential ancillary benefits that might be received by PI and QMA and their affiliates as a result of their relationship with the Fund. The Board concluded that potential benefits to be derived by PI included fees received by affiliates of PI for serving as the Fund’s securities lending agent, transfer agency fees received by the Fund’s transfer agent (which is affiliated with PI), and benefits to its reputation as well as other intangible benefits resulting from PI’s association with the
Prudential International Equity Fund
Approval of Advisory Agreements (continued)
Fund. The Board concluded that the potential benefits to be derived by QMA included its ability to use soft dollar credits, as well as the potential benefits consistent with those generally resulting from an increase in assets under management, specifically, potential access to additional research resources and benefits to its reputation. The Board concluded that the benefits derived by PI and QMA were consistent with the types of benefits generally derived by investment managers and subadvisers to mutual funds.
Performance of the Fund / Fees and Expenses
The Board considered certain additional specific factors and made related conclusions relating to the historical performance of the Fund for the one-, three-, five- and ten-year periods ended December 31, 2011.
The Board also considered the Fund’s actual management fee, as well as the Fund’s net total expense ratio, for the fiscal year ended October 31, 2011. The Board considered the management fee for the Fund as compared to the management fee charged by PI to other funds and the fee charged by other advisers to comparable mutual funds in a Peer Group. The actual management fee represents the fee rate actually paid by Fund shareholders and includes any fee waivers or reimbursements. The net total expense ratio for the Fund represents the actual expense ratio incurred by Fund shareholders.
The mutual funds included in the Peer Universe (the Lipper International Large-Cap Core Funds Performance Universe) and the Peer Group were objectively determined by Lipper Inc. (“Lipper”), an independent provider of mutual fund data. The comparisons placed the Fund in various quartiles, with the first quartile being the best 25% of the mutual funds (for performance, the best performing mutual funds and, for expenses, the lowest cost mutual funds).
The section below summarizes key factors considered by the Board and the Board’s conclusions regarding the Fund’s performance, fees and overall expenses. The table sets forth gross performance comparisons (which do not reflect the impact on performance of fund expenses, or any subsidies, expense caps or waivers that may be applicable) with the Peer Universe, actual management fees with the Peer Group (which reflect the impact of any subsidies or fee waivers), and net total expenses with the Peer Group, each of which were key factors considered by the Board.
| | | | | | | | |
| Performance | | 1 Year | | 3 Years | | 5 Years | | 10 Years |
| | 2nd Quartile | | 2nd Quartile | | 4th Quartile | | 3rd Quartile |
| Actual Management Fees: 1st Quartile |
| Net Total Expenses: 3rd Quartile |
Visit our website at www.prudentialfunds.com
| | • | | The Board noted that the Fund outperformed its benchmark index over the one-, three- and ten-year periods, though it underperformed over the five-year period. |
| | • | | The Board concluded that, in light of the Fund’s competitive performance over the one- and three-year periods, it would be in the best interests of the Fund and its shareholders to renew the agreements. |
| | • | | The Board concluded that the management fees (including subadvisory fees) and total expenses were reasonable in light of the services provided. |
* * *
After full consideration of these factors, the Board concluded that approval of the agreements was in the best interests of the Fund and its shareholders.
Prudential International Equity Fund
| | | | |
| n MAIL | | n TELEPHONE | | n WEBSITE |
Gateway Center Three 100 Mulberry Street Newark, NJ 07102 | | (800) 225-1852 | | www.prudentialfunds.com |
|
| PROXY VOTING |
| The Board of Directors of the Fund has delegated to the Fund’s investment subadviser the responsibility for voting any proxies and maintaining proxy recordkeeping with respect to the Fund. A description of these proxy voting policies and procedures is available without charge, upon request, by calling (800) 225-1852 or by visiting the Securities and Exchange Commission’s website at www.sec.gov. Information regarding how the Fund voted proxies relating to portfolio securities during the most recent 12-month period ended June 30 is available on the Fund’s website and on the Securities and Exchange Commission’s website. |
|
| DIRECTORS |
| Kevin J. Bannon • Scott E. Benjamin • Linda W. Bynoe • Michael S. Hyland • Douglas H. McCorkindale • Stephen P. Munn • Stuart S. Parker • Richard A. Redeker • Robin B. Smith • Stephen G. Stoneburn |
|
| OFFICERS |
| Stuart S. Parker, President • Judy A. Rice, Vice President • Scott E. Benjamin, Vice President • Grace C. Torres, Treasurer and Principal Financial and Accounting Officer • Raymond A. O’Hara, Chief Legal Officer • Deborah A. Docs, Secretary • Timothy J. Knierim, Chief Compliance Officer • Valerie M. Simpson, Deputy Chief Compliance Officer • Theresa C. Thompson, Deputy Chief Compliance Officer • Richard W. Kinville, Anti-Money Laundering Compliance Officer • Jonathan D. Shain, Assistant Secretary • Claudia DiGiacomo, Assistant Secretary • Amanda S. Ryan, Assistant Secretary • Andrew R. French, Assistant Secretary • M. Sadiq Peshimam, Assistant Treasurer • Peter Parrella, Assistant Treasurer |
| | | | |
| MANAGER | | Prudential Investments LLC | | Gateway Center Three
100 Mulberry Street
Newark, NJ 07102 |
|
| INVESTMENT SUBADVISER | | Quantitative Management
Associates LLC | | Gateway Center Two
100 Mulberry Street
Newark, NJ 07102 |
|
| DISTRIBUTOR | | Prudential Investment
Management Services LLC | | Gateway Center Three
100 Mulberry Street
Newark, NJ 07102 |
|
| CUSTODIAN | | The Bank of New York Mellon | | One Wall Street
New York, NY 10286 |
|
| TRANSFER AGENT | | Prudential Mutual Fund
Services LLC | | PO Box 9658
Providence, RI 02940 |
|
| INDEPENDENT REGISTERED PUBLIC ACCOUNTING FIRM | | KPMG LLP | | 345 Park Avenue
New York, NY 10154 |
|
| FUND COUNSEL | | Willkie Farr & Gallagher LLP | | 787 Seventh Avenue
New York, NY 10019 |
|
| An investor should consider the investment objectives, risks, charges, and expenses of the Fund carefully before investing. The prospectus and summary prospectus contain this and other information about the Fund. An investor may obtain a prospectus and summary prospectus by visiting our website at www.prudentialfunds.com or by calling (800) 225-1852. The prospectus and summary prospectus should be read carefully before investing. |
|
| E-DELIVERY |
| To receive your mutual fund documents online, go to www.prudentialfunds.com/edelivery and enroll. Instead of receiving printed documents by mail, you will receive notification via email when new materials are available. You can cancel your enrollment or change your email address at any time by visiting the website address above. |
|
| SHAREHOLDER COMMUNICATIONS WITH DIRECTORS |
| Shareholders can communicate directly with the Board of Directors by writing to the Chair of the Board, Prudential International Equity Fund, Prudential Investments, Attn: Board of Directors, 100 Mulberry Street, Gateway Center Three, Newark, NJ 07102. Shareholders can communicate directly with an individual Director by writing to the same address. Communications are not screened before being delivered to the addressee. |
|
| AVAILABILITY OF PORTFOLIO SCHEDULE |
| The Fund files its complete schedule of portfolio holdings with the Securities and Exchange Commission for the first and third quarters of each fiscal year on Form N-Q. The Fund’s Forms N-Q are available on the Commission’s website at www.sec.gov. The Fund’s Forms N-Q may also be reviewed and copied at the Commission’s Public Reference Room in Washington, D.C. Information on the operation and location of the Public Reference Room may be obtained by calling (202) 551-8090. The Fund’s schedule of portfolio holdings is also available on the Fund’s website as of the end of each month. |
|
| The Fund’s Statement of Additional Information contains additional information about the Fund’s Directors and is available without charge, upon request, by calling (800) 225-1852. |
Mutual Funds:
| | | | |
ARE NOT INSURED BY THE FDIC OR ANY
FEDERAL GOVERNMENT AGENCY | | MAY LOSE VALUE | | ARE NOT A DEPOSIT OF OR GUARANTEED
BY ANY BANK OR ANY BANK AFFILIATE |

PRUDENTIAL INTERNATIONAL EQUITY FUND
| | | | | | | | | | | | |
| SHARE CLASS | | A | | B | | C | | F | | X | | Z |
| NASDAQ | | PJRAX | | PJRBX | | PJRCX | | N/A | | DEIQX | | PJIZX |
| CUSIP | | 743969859 | | 743969867 | | 743969875 | | 743969842 | | 743969818 | | 743969883 |
MF190E 0236585-00001-00

PRUDENTIAL INVESTMENTS»MUTUAL FUNDS
PRUDENTIAL INTERNATIONAL VALUE FUND
ANNUAL REPORT · OCTOBER 31, 2012
Fund Type
International Stock
Objective
Long-Term growth of capital
This report is not authorized for distribution to prospective investors unless preceded or accompanied by a current prospectus.
The views expressed in this report and information about the Fund’s portfolio holdings are for the period covered by this report and are subject to change thereafter.
Prudential Investments, Prudential, the Prudential logo, the Rock symbol, and Bring Your Challenges are service marks of Prudential Financial, Inc. and its related entities, registered in many jurisdictions worldwide.

December 14, 2012
Dear Shareholder:
We hope you find the annual report for the Prudential International Value Fund informative and useful. The report covers performance for the 12-month period that ended October 31, 2012.
We recognize that ongoing market volatility may make it a difficult time to be an investor. We continue to believe a prudent response to uncertainty is to maintain a diversified portfolio of funds consistent with your tolerance for risk, time horizon, and financial goals.
Your financial advisor can help you create a diversified investment plan that may include funds covering all the basic asset classes and that reflects your personal investor profile and risk tolerance. Keep in mind, however, that diversification and asset allocation strategies do not assure a profit or protect against loss in declining markets.
Prudential Investments® is dedicated to helping you solve your toughest investment challenges—whether it’s capital growth, reliable income, or protection from market volatility and other risks. We offer the expertise of Prudential Financial’s affiliated asset managers* that strive to be leaders in a broad range of funds to help you stay on course to the future you envision. They also manage money for major corporations and pension funds around the world, which means you benefit from the same expertise, innovation, and attention to risk demanded by today’s most sophisticated investors.
Thank you for choosing the Prudential Investments family of funds.
Sincerely,

Stuart S. Parker, President
Prudential International Value Fund
*Most of Prudential Investments’ equity funds are advised by Jennison Associates LLC, Quantitative Management Associates LLC (QMA), or Prudential Real Estate Investors. Prudential Investments’ fixed income and money market funds are advised by Prudential Investment Management, Inc. (PIM) through its Prudential Fixed Income unit. Jennison Associates, QMA, and PIM are registered investment advisers and Prudential Financial companies. Prudential Real Estate Investors is a unit of PIM.
| | | | |
| Prudential International Value Fund | | | 1 | |
Your Fund’s Performance
Performance data quoted represent past performance. Past performance does not guarantee future results. The investment return and principal value of an investment will fluctuate, so that an investor’s shares, when redeemed, may be worth more or less than their original cost. Current performance may be lower or higher than the past performance data quoted. An investor may obtain performance data as of the most recent month-end by visiting our website at www.prudentialfunds.com or by calling (800) 225-1852. The maximum initial sales charge is 5.50% (Class A shares). Gross operating expenses: Class A, 1.84%; Class B, 2.54%; Class C, 2.54%; Class Z, 1.54%. Net operating expenses: Class A, 1.79%; Class B, 2.54%; Class C, 2.54%; Class Z, 1.54%, after contractual reduction for Class A shares through 2/28/2014.
| | | | | | | | | | | | |
Cumulative Total Returns (Without Sales Charges) as of 10/31/12 | |
| | | One Year | | | Five Years | | | Ten Years | |
Class A | | | 4.71 | % | | | –29.48 | % | | | 89.99 | % |
Class B | | | 3.91 | | | | –32.10 | | | | 76.16 | |
Class C | | | 3.90 | | | | –32.09 | | | | 76.14 | |
Class Z | | | 4.92 | | | | –28.58 | | | | 94.71 | |
MSCI EAFE ND Index | | | 4.61 | | | | –25.88 | | | | 110.49 | |
Lipper International Multi-Cap Core Funds Average | | | 5.75 | | | | –25.70 | | | | 104.80 | |
Lipper Customized Blend Funds Average | | | 5.79 | | | | –25.41 | | | | 105.24 | |
| | | | | | | | | | | | |
Average Annual Total Returns (With Sales Charges) as of 9/30/12 | |
| | | One Year | | | Five Years | | | Ten Years | |
Class A | | | 7.35 | % | | | –7.13 | % | | | 6.64 | % |
Class B | | | 7.71 | | | | –6.95 | | | | 6.43 | |
Class C | | | 11.75 | | | | –6.78 | | | | 6.43 | |
Class Z | | | 13.89 | | | | –5.82 | | | | 7.51 | |
MSCI EAFE ND Index | | | 13.75 | | | | –5.24 | | | | 8.20 | |
Lipper International Multi-Cap Core Funds Average | | | 14.60 | | | | –5.24 | | | | 7.59 | |
Lipper Customized Blend Funds Average | | | 14.90 | | | | –5.12 | | | | 7.69 | |
| | | | | | | | | | | | |
Average Annual Total Returns (With Sales Charges) as of 10/31/12 | |
| | | One Year | | | Five Years | | | Ten Years | |
Class A | | | –1.05 | % | | | –7.80 | % | | | 6.03 | % |
Class B | | | –1.09 | | | | –7.61 | | | | 5.83 | |
Class C | | | 2.90 | | | | –7.45 | | | | 5.82 | |
Class Z | | | 4.92 | | | | –6.51 | | | | 6.89 | |
| | |
| 2 | | Visit our website at www.prudentialfunds.com |
| | | | | | | | | | | | |
Average Annual Total Returns (Without Sales Charges) as of 10/31/12 | |
| | | One Year | | | Five Years | | | Ten Years | |
Class A | | | 4.71 | % | | | –6.75 | % | | | 6.63 | % |
Class B | | | 3.91 | | | | –7.45 | | | | 5.83 | |
Class C | | | 3.90 | | | | –7.45 | | | | 5.82 | |
Class Z | | | 4.92 | | | | –6.51 | | | | 6.89 | |
Growth of a $10,000 Investment
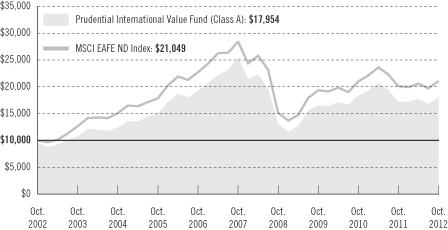
The graph compares a $10,000 investment in the Prudential International Value Fund (Class A shares) with a similar investment in the MSCI EAFE ND Index by portraying the initial account values at the beginning of the 10-year period for Class A shares (October 31, 2002) and the account values at the end of the current fiscal year (October 31, 2012) as measured on a quarterly basis. For purposes of the graph, and unless otherwise indicated, it has been assumed that (a) the maximum applicable front-end sales charge was deducted from the initial $10,000 investment in Class A shares; (b) all recurring fees (including management fees) were deducted; and (c) all dividends and distributions were reinvested. The line graph provides information for Class A shares only. As indicated in the tables provided earlier, performance for Class B, Class C, and Class Z shares will vary due to the differing charges and expenses applicable to each share class (as indicated in the following paragraphs). Without waiver of fees and/or expense reimbursement, if any, the returns would have been lower.
Total returns and the ending account values in the graph include changes in share price and reinvestment of dividends and capital gains distributions in a hypothetical investment for the periods shown. The Fund’s total returns do not reflect the deduction of income taxes on an individual’s investment. Taxes may reduce your actual investment returns on income or gains paid by the Fund or any gains you may realize if you sell your shares.
Source: Prudential Investments LLC and Lipper Inc.
| | | | |
| Prudential International Value Fund | | | 3 | |
Your Fund’s Performance (continued)
The average annual total returns take into account applicable sales charges. Class A shares are subject to a maximum front-end sales charge of 5.50%, and a 12b-1 fee of 0.30% annually. All investors who purchase Class A shares in an amount of $1 million or more and sell these shares within 12 months of purchase are subject to a contingent deferred sales charge (CDSC) of 1%. The Class A CDSC is waived for purchases by certain retirement or benefit plans. Under certain circumstances, an exchange may be made from specified share classes of the Fund to one or more other share classes of the Fund. Class B shares are subject to a declining CDSC of 5%, 4%, 3%, 2%, 1%, and 1%, respectively, for the first six years after purchase and a 12b-1 fee of 1% annually. Approximately seven years after purchase, Class B shares will automatically convert to Class A shares on a quarterly basis. Class C shares purchased are not subject to a front-end sales charge, but are subject to a CDSC of 1% for Class C shares sold within 12 months from the date of purchase, and an annual 12b-1 fee of 1%. Class Z shares are not subject to a sales charge or 12b-1 fees. The returns in the tables and graph reflect the share class expense structure in effect at the close of the fiscal period. The returns in the tables and graph do not reflect the deduction of taxes that a shareholder would pay on Fund distributions or following the redemption of Fund shares.
Benchmark Definitions
Morgan Stanley Capital International Europe, Australasia, and Far East ND Index
The Morgan Stanley Capital International Europe, Australasia, and Far East Index (MSCI EAFE ND Index) is an unmanaged, weighted index of performance that reflects stock price movements of developed-country markets in Europe, Australasia, and the Far East. The Net Dividend (ND) version of the MSCI EAFE Index reflects the impact of the maximum withholding taxes on reinvested dividends.
Lipper International Multi-Cap Core Funds Average
Lipper International Multi-Cap Core Funds invest in a variety of market capitalization ranges without concentrating 75% of their equity assets in any one market capitalization range over an extended period of time. International multi-cap core funds typically have an average price-to-cash flow ratio, price-to-book ratio, and three-year sales-per-share growth value compared to the S&P/Citigroup World ex-U.S. BMI.
Lipper Customized Blend Funds Average
The Lipper Customized Blend Funds Average is a 50/50 blend of the Lipper International Multi-Cap Core Funds and Lipper International Large-Cap Core Funds Averages. The Lipper Customized Blend Funds Average is utilized because PI believes that a blend of the two averages provides a more appropriate basis for Fund performance comparisons, although Lipper classifies the Fund in the Lipper International Multi-Cap Core Funds Universe.
Investors cannot invest directly in an index or average. The returns for the Index would be lower if they included the effects of sales charges, operating expenses, or taxes. Returns for the Lipper Average reflect the deduction of operating expenses of a mutual fund, but not sales charges or taxes.
| | | | |
Five Largest Holdings expressed as a percentage of net assets as of 10/31/12 | | | | |
Royal Dutch Shell PLC (Class B Stock), Oil, Gas & Consumable Fuels | | | 1.7 | % |
KDDI Corp., Telecommunications | | | 1.5 | |
Allianz SE, Insurance | | | 1.5 | |
Novartis AG, Pharmaceuticals | | | 1.5 | |
Vodofone Group PLC, Telecommunications | | | 1.4 | |
Holdings reflect only long-term investments and are subject to change.
| | |
| 4 | | Visit our website at www.prudentialfunds.com |
| | | | |
Five Largest Industries expressed as a percentage of net assets as of 10/31/12 | | | | |
Banks | | | 12.1 | % |
Oil, Gas & Consumable Fuels | | | 9.6 | |
Pharmaceuticals | | | 9.0 | |
Insurance | | | 7.2 | |
Telecommunications | | | 6.4 | |
Industry weightings reflect only long-term investments and are subject to change.
| | | | |
| Prudential International Value Fund | | | 5 | |
Strategy and Performance Overview
How did the Fund perform?
The Prudential International Value Fund’s Class A shares returned 4.71% for the 12-month reporting period ended October 31, 2012, outperforming the Morgan Stanley Capital International Europe, Australasia, and Far East Net Dividend Index (MSCI EAFE ND Index), which gained 4.61%. The Class A shares underperformed the 5.75% gain of the Lipper International Multi-Cap Core Funds Average and the 5.79% return of the Lipper Customized Blend Funds Average. LSV Asset Management (LSV) and Thornburg Investment Management, Inc. (Thornburg) are co-managers of the Fund.
How did international stock markets perform?
Over this reporting period, international equity markets were concerned about economic slowdowns in both Europe and China, as well as by the consequences of several countries’ euro-denominated debt. European markets fluctuated as investors’ views of the prospects of a solution to euro zone imbalances and debt shifted. Between mid-March and the end of May, there was a substantial decline, but the overall return for the period was moderately positive even for the euro zone. Japan, on the other hand, finished the period slightly in the red, as it continued to suffer from the impact of the tsunami as well as from anemic economic growth. Overall, the healthcare and consumer staples sectors performed better than average, while technology and telecommunications services underperformed, and neither growth nor value investing styles performed significantly better than the other.
| | • | | The Fund outperformed the Index due to its exposure to particular countries, including positions in several countries not included in the Index. It also outperformed due to its sector weightings. It underweighted Japanese stocks and selected well among European markets, being overweight compared with the Index in Germany and Denmark and consistently underweight in Greece, Spain, and Portugal. Allocations to emerging markets countries also contributed, despite the mixed performance of the group. Positions in both China and Mexico were particularly beneficial. Favorable sector-allocation decisions included underweights in the materials and utilities sectors and an overweight in healthcare. |
| | • | | Both LSV’s and Thornburg’s portions of the Fund outperformed the Index. LSV outperformed largely due to favorable stock selection in Japan and the United Kingdom. Its quantitative model led to positions in a significant number of outperforming stocks not represented within the Index and away from many of its worst-performing constituents, particularly several poor-performing Japanese technology and consumer discretionary stocks. The Thornburg portion outperformed on the strength of its country and sector allocations, particularly |
| | |
| 6 | | Visit our website at www.prudentialfunds.com |
| | an average underweight in Japan of more than 10% compared with the Index weighting. It also benefited from allocations to China and Mexico and from an overweight in Germany. Its decision to underweight the materials, telecommunications, and utilities sectors proved profitable, while its overweight in the information technology sector was the largest detractor from its relative return. Thornburg’s selection of individual stocks, after accounting for its country and sector weightings, detracted broadly from its performance. |
| | | | |
| Prudential International Value Fund | | | 7 | |
Fees and Expenses (Unaudited)
As a shareholder of the Fund, you incur two types of costs: (1) transaction costs, including sales charges (loads) on purchase payments and redemptions, as applicable, and (2) ongoing costs, including management fees, distribution, and/or service (12b-1) fees, and other Fund expenses, as applicable. This example is intended to help you understand your ongoing costs (in dollars) of investing in the Fund and to compare these costs with the ongoing costs of investing in other mutual funds.
The example is based on an investment of $1,000 invested on May 1, 2012, at the beginning of the period, and held through the six-month period ended October 31, 2012. The example is for illustrative purposes only; you should consult the Prospectus for information on initial and subsequent minimum investment requirements.
The Fund’s transfer agent may charge additional fees to holders of certain accounts that are not included in the expenses shown in the table on the following page. These fees apply to individual retirement accounts (IRAs) and Section 403(b) accounts. As of the close of the six-month period covered by the table, IRA fees included an annual maintenance fee of $15 per account (subject to a maximum annual maintenance fee of $25 for all accounts held by the same shareholder). Section 403(b) accounts are charged an annual $25 fiduciary maintenance fee. Some of the fees may vary in amount, or may be waived, based on your total account balance or the number of Prudential Investments funds, including the Fund, that you own. You should consider the additional fees that were charged to your Fund account over the six-month period when you estimate the total ongoing expenses paid over the period and the impact of these fees on your ending account value, as these additional expenses are not reflected in the information provided in the expense table. Additional fees have the effect of reducing investment returns.
Actual Expenses
The first line for each share class in the table on the following page provides information about actual account values and actual expenses. You may use the information on this line, together with the amount you invested, to estimate the expenses that you paid over the period. Simply divide your account value by $1,000 (for example, an $8,600 account value ÷ $1,000 = 8.6), then multiply the result by the number on the first line under the heading “Expenses Paid During the Six-Month Period” to estimate the expenses you paid on your account during this period.
Hypothetical Example for Comparison Purposes
The second line for each share class in the table on the following page provides information about hypothetical account values and hypothetical expenses based on the Fund’s actual expense ratio and an assumed rate of return of 5% per year before
| | |
| 8 | | Visit our website at www.prudentialfunds.com |
expenses, which is not the Fund’s actual return. The hypothetical account values and expenses may not be used to estimate the actual ending account balance or expenses you paid for the period. You may use this information to compare the ongoing costs of investing in the Fund and other funds. To do so, compare this 5% hypothetical example with the 5% hypothetical examples that appear in the shareholder reports of the other funds.
Please note that the expenses shown in the table are meant to highlight your ongoing costs only and do not reflect any transactional costs such as sales charges (loads). Therefore, the second line for each share class in the table is useful in comparing ongoing costs only and will not help you determine the relative total costs of owning different funds. In addition, if these transactional costs were included, your costs would have been higher.
| | | | | | | | | | | | | | | | | | |
Prudential
International
Value Fund | | Beginning Account
Value
May 1, 2012 | | | Ending Account
Value
October 31, 2012 | | | Annualized
Expense Ratio
Based on the
Six-Month Period | | | Expenses Paid
During the
Six-Month Period* | |
| | | | | | | | | | | | | | | | | | |
| Class A | | Actual | | $ | 1,000.00 | | | $ | 1,014.70 | | | | 1.64 | % | | $ | 8.31 | |
| | | Hypothetical | | $ | 1,000.00 | | | $ | 1,016.89 | | | | 1.64 | % | | $ | 8.31 | |
| | | | | | | | | | | | | | | | | | |
| Class B | | Actual | | $ | 1,000.00 | | | $ | 1,011.00 | | | | 2.39 | % | | $ | 12.08 | |
| | | Hypothetical | | $ | 1,000.00 | | | $ | 1,013.12 | | | | 2.39 | % | | $ | 12.09 | |
| | | | | | | | | | | | | | | | | | |
| Class C | | Actual | | $ | 1,000.00 | | | $ | 1,010.90 | | | | 2.39 | % | | $ | 12.08 | |
| | | Hypothetical | | $ | 1,000.00 | | | $ | 1,013.12 | | | | 2.39 | % | | $ | 12.09 | |
| | | | | | | | | | | | | | | | | | |
| Class Z | | Actual | | $ | 1,000.00 | | | $ | 1,015.60 | | | | 1.39 | % | | $ | 7.04 | |
| | | Hypothetical | | $ | 1,000.00 | | | $ | 1,018.15 | | | | 1.39 | % | | $ | 7.05 | |
*Fund expenses (net of fee waivers or subsidies, if any) for each share class are equal to the annualized expense ratio for each share class (provided in the table), multiplied by the average account value over the period, multiplied by the 184 days in the six-month period ended October 31, 2012, and divided by the 366 days in the Fund’s fiscal year ended October 31, 2012 (to reflect the six-month period). Expenses presented in the table include the expenses of any underlying funds in which the Fund may invest.
| | | | |
| Prudential International Value Fund | | | 9 | |
Portfolio of Investments
as of October 31, 2012
| | | | | | |
| Shares | | Description | | Value (Note 1) | |
LONG-TERM INVESTMENTS 97.2% | | | | |
COMMON STOCKS 95.8% | | | | |
| |
Australia 3.3% | | | | |
| 176,200 | | Arrium Ltd. | | $ | 143,581 | |
| 33,100 | | Bendigo and Adelaide Bank Ltd. | | | 277,626 | |
| 61,388 | | BlueScope Steel Ltd.* | | | 30,269 | |
| 12,700 | | Caltex Australia Ltd. | | | 224,643 | |
| 82,600 | | Challenger Ltd. | | | 276,951 | |
| 71,625 | | Downer EDI Ltd.* | | | 266,919 | |
| 253,200 | | Emeco Holdings Ltd. | | | 182,671 | |
| 171,558 | | Goodman Fielder Ltd.* | | | 104,181 | |
| 37,900 | | Lend Lease Group | | | 341,098 | |
| 77,000 | | Metcash Ltd. | | | 292,545 | |
| 24,000 | | National Australia Bank Ltd. | | | 642,514 | |
| 88,300 | | Pacific Brands Ltd. | | | 56,829 | |
| 6,200 | | Rio Tinto Ltd. | | | 366,462 | |
| | | | | | |
| | | | | 3,206,289 | |
| |
Austria 0.6% | | | | |
| 10,700 | | OMV AG | | | 391,098 | |
| 5,700 | | Voestalpine AG | | | 179,529 | |
| | | | | | |
| | | | | 570,627 | |
| |
Belgium 0.3% | | | | |
| 32,700 | | AGFA-Gevaert NV* | | | 53,404 | |
| 7,300 | | Delhaize Group SA | | | 279,077 | |
| 4,935 | | Dexia SA* | | | 1,151 | |
| | | | | | |
| | | | | 333,632 | |
| |
Brazil 1.4% | | | | |
| 52,410 | | BM&FBOVESPA SA | | | 335,457 | |
| 16,017 | | Embraer SA, ADR | | | 447,034 | |
| 21,000 | | Natura Cosmeticos SA | | | 559,883 | |
| | | | | | |
| | | | | 1,342,374 | |
| |
Canada 2.4% | | | | |
| 9,270 | | Canadian National Railway Co. | | | 800,445 | |
| 13,711 | | Cenovus Energy, Inc. | | | 483,643 | |
| 17,560 | | Potash Corp. of Saskatchewan, Inc. | | | 708,897 | |
| 10,700 | | Teck Resources Ltd. (Class B Stock) | | | 339,615 | |
| | | | | | |
| | | | | 2,332,600 | |
See Notes to Financial Statements.
| | | | |
| Prudential International Value Fund | | | 11 | |
Portfolio of Investments
as of October 31, 2012 continued
| | | | | | |
| Shares | | Description | | Value (Note 1) | |
COMMON STOCKS (Continued) | | | | |
| |
Cayman Islands 1.1% | | | | |
| 5,297 | | Baidu, Inc., ADR* | | $ | 564,766 | |
| 13,870 | | Tencent Holdings Ltd. | | | 490,369 | |
| | | | | | |
| | | | | 1,055,135 | |
| |
China 1.7% | | | | |
| 244,148 | | China Merchants Bank Co. Ltd. (Class H Stock) | | | 456,160 | |
| 1,060,461 | | Industrial & Commercial Bank of China Ltd. (Class H Stock) | | | 701,952 | |
| 144,099 | | Sinopharm Group Co. Ltd. (Class H Stock) | | | 484,356 | |
| | | | | | |
| | | | | 1,642,468 | |
| |
Denmark 1.6% | | | | |
| 7,700 | | Danske Bank A/S* | | | 120,409 | |
| 11,500 | | H. Lundbeck A/S | | | 200,214 | |
| 7,615 | | Novo Nordisk A/S (Class B Stock) | | | 1,227,191 | |
| | | | | | |
| | | | | 1,547,814 | |
| |
Finland 0.3% | | | | |
| 13,700 | | Tieto Oyj | | | 262,806 | |
| |
France 9.0% | | | | |
| 7,448 | | Air Liquide SA | | | 878,484 | |
| 20,000 | | AXA SA | | | 317,944 | |
| 8,100 | | BNP Paribas | | | 407,457 | |
| 11,602 | | Cie Generale des Etablissements Michelin (Class B Stock) | | | 996,408 | |
| 2,700 | | Ciments Francais SA | | | 164,306 | |
| 37,707 | | Credit Agricole SA* | | | 283,858 | |
| 6,885 | | LVMH Moet Hennessy Louis Vuitton SA | | | 1,119,062 | |
| 13,784 | | Publicis Groupe SA | | | 742,602 | |
| 1,900 | | Rallye SA | | | 57,897 | |
| 4,600 | | Renault SA | | | 205,757 | |
| 13,760 | | Sanofi | | | 1,209,564 | |
| 12,000 | | SCOR SE | | | 320,251 | |
| 5,863 | | Societe Generale SA* | | | 186,372 | |
| 5,900 | | Thales SA | | | 207,508 | |
| 16,400 | | Total SA | | | 825,187 | |
| 5,100 | | Valeo SA | | | 224,090 | |
| 27,796 | | Vivendi SA | | | 568,696 | |
| | | | | | |
| | | | | 8,715,443 | |
See Notes to Financial Statements.
| | |
| 12 | | Visit our website at www.prudentialfunds.com |
| | | | | | |
| Shares | | Description | | Value (Note 1) | |
COMMON STOCKS (Continued) | | | | |
| |
Germany 11.1% | | | | |
| 13,590 | | Adidas AG | | $ | 1,157,806 | |
| 11,516 | | Allianz SE | | | 1,427,857 | |
| 3,300 | | Aurubis AG | | | 208,645 | |
| 6,200 | | BASF SE | | | 513,747 | |
| 3,100 | | Bayer AG | | | 269,972 | |
| 7,500 | | Daimler AG | | | 350,202 | |
| 20,720 | | Deutsche Bank AG | | | 939,157 | |
| 12,200 | | E.ON AG | | | 277,201 | |
| 19,300 | | Freenet AG | | | 319,073 | |
| 12,348 | | Fresenius Medical Care AG & Co. KGaA | | | 867,299 | |
| 4,300 | | Hannover Rueckversicherung AG | | | 302,469 | |
| 2,600 | | Lanxess AG | | | 214,768 | |
| 1,500 | | Merck KGaA | | | 191,700 | |
| 2,700 | | Muenchener Rueckversicherungs-Gesellschaft AG | | | 433,949 | |
| 5,100 | | Rheinmetall AG | | | 243,359 | |
| 7,300 | | RWE AG | | | 333,577 | |
| 12,884 | | SAP AG | | | 938,512 | |
| 9,800 | | Siemens AG | | | 984,928 | |
| 3,800 | | Volkswagen AG | | | 740,772 | |
| | | | | | |
| | | | | 10,714,993 | |
| |
Hong Kong 3.4% | | | | |
| 86,022 | | AIA Group Ltd. | | | 340,756 | |
| 17,000 | | Cheung Kong Holdings Ltd. | | | 251,160 | |
| 516,108 | | CNOOC Ltd. | | | 1,072,166 | |
| 388,800 | | First Pacific Co. Ltd. | | | 432,945 | |
| 48,637 | | Hong Kong Exchanges and Clearing Ltd. | | | 802,662 | |
| 58,100 | | Kingboard Chemical Holdings Ltd. | | | 172,799 | |
| 68,200 | | Yue Yuen Industrial Holdings Ltd. | | | 235,398 | |
| | | | | | |
| | | | | 3,307,886 | |
| |
Ireland 1.2% | | | | |
| 8,179 | | Accenture PLC (Class A Stock) | | | 551,346 | |
| 20,600 | | Allied Irish Banks PLC* | | | 1,362 | |
| 11,925 | | Covidien PLC | | | 655,279 | |
| 15,600 | | Permanent TSB Group Holdings PLC* | | | 505 | |
| | | | | | |
| | | | | 1,208,492 | |
See Notes to Financial Statements.
| | | | |
| Prudential International Value Fund | | | 13 | |
Portfolio of Investments
as of October 31, 2012 continued
| | | | | | |
| Shares | | Description | | Value (Note 1) | |
COMMON STOCKS (Continued) | | | | |
| |
Israel 2.3% | | | | |
| 62,300 | | Bank Hapoalim BM* | | $ | 244,795 | |
| 11,063 | | Check Point Software Technologies Ltd.* | | | 492,635 | |
| 6,200 | | Elbit Systems Ltd. | | | 218,393 | |
| 9,100 | | Teva Pharmaceutical Industries Ltd. | | | 369,750 | |
| 22,014 | | Teva Pharmaceutical Industries Ltd., ADR | | | 889,806 | |
| | | | | | |
| | | | | 2,215,379 | |
| |
Italy 1.7% | | | | |
| 14,400 | | Banco Popolare Scarl* | | | 22,957 | |
| 124,700 | | Enel SpA | | | 468,724 | |
| 35,100 | | Eni SpA | | | 805,710 | |
| 15,200 | | Finmeccanica SpA* | | | 75,299 | |
| 251,900 | | Telecom Italia SpA | | | 231,977 | |
| | | | | | |
| | | | | 1,604,667 | |
| |
Japan 15.1% | | | | |
| 8,373 | | Alpine Electronics, Inc. | | | 72,686 | |
| 11,400 | | Aoyama Trading Co. Ltd. | | | 225,201 | |
| 14,400 | | COMSYS Holdings Corp. | | | 191,206 | |
| 191 | | Dai-ichi Life Insurance Co. Ltd. (The) | | | 220,118 | |
| 3,509 | | Fanuc Corp. | | | 558,680 | |
| 73,900 | | Fukuoka Financial Group, Inc. | | | 288,824 | |
| 8,700 | | Fuyo General Lease Co. Ltd. | | | 243,465 | |
| 21,600 | | Heiwa Corp. | | | 339,301 | |
| 12,800 | | Hitachi Capital Corp. | | | 245,642 | |
| 57,894 | | JX Holdings, Inc. | | | 308,217 | |
| 19,107 | | KDDI Corp. | | | 1,483,946 | |
| 9,400 | | Keihin Corp. | | | 113,276 | |
| 34,443 | | Komatsu Ltd. | | | 721,392 | |
| 50,100 | | Kurabo Industries Ltd. | | | 77,193 | |
| 20,400 | | Kyorin Holdings, Inc. | | | 431,357 | |
| 25,600 | | Kyowa Exeo Corp. | | | 268,410 | |
| 76,000 | | Marubeni Corp. | | | 492,196 | |
| 3,900 | | Miraca Holdings, Inc. | | | 164,882 | |
| 5,900 | | Mitsubishi Corp. | | | 105,318 | |
| 193,786 | | Mitsubishi UFJ Financial Group, Inc. | | | 876,321 | |
| 25,800 | | Mitsui & Co. Ltd. | | | 363,585 | |
| 248,700 | | Mizuho Financial Group, Inc. | | | 389,421 | |
| 66,000 | | Morinaga Milk Industry Co. Ltd. | | | 218,264 | |
| 28,800 | | Nichii Gakkan Co. | | | 262,277 | |
See Notes to Financial Statements.
| | |
| 14 | | Visit our website at www.prudentialfunds.com |
| | | | | | |
| Shares | | Description | | Value (Note 1) | |
COMMON STOCKS (Continued) | | | | |
| |
Japan (cont’d.) | | | | |
| 14,700 | | Nippon Electric Glass Co. Ltd. | | $ | 74,761 | |
| 22,800 | | Nippon Shokubai Co. Ltd. | | | 223,630 | |
| 12,300 | | Nippon Telegraph & Telephone Corp. | | | 560,071 | |
| 78,700 | | Nishi-Nippon City Bank Ltd. (The) | | | 179,424 | |
| 8,000 | | Nissan Shatai Co. Ltd. | | | 87,686 | |
| 300 | | NTT DoCoMo, Inc. | | | 440,812 | |
| 12,100 | | Otsuka Holdings Co. Ltd. | | | 372,716 | |
| 3,400 | | Sankyo Co. Ltd. | | | 153,965 | |
| 49,800 | | Sankyu, Inc. | | | 173,423 | |
| 29,400 | | Seino Holdings Co. Ltd. | | | 169,410 | |
| 13,500 | | Shimachu Co. Ltd. | | | 298,309 | |
| 25,400 | | Shizuoka Gas Co. Ltd. | | | 180,724 | |
| 38,600 | | Sumitomo Corp. | | | 526,078 | |
| 17,900 | | Sumitomo Mitsui Financial Group, Inc. | | | 548,009 | |
| 14,006 | | Sumitomo Mitsui Trust Holdings, Inc. | | | 42,458 | |
| 52,600 | | Toagosei Co. Ltd. | | | 214,143 | |
| 16,700 | | Toppan Forms Co. Ltd. | | | 157,314 | |
| 24,171 | | Toyota Motor Corp. | | | 928,023 | |
| 18,300 | | Toyota Tsusho Corp. | | | 399,331 | |
| 36,900 | | Yokohama Rubber Co. Ltd. (The) | | | 258,388 | |
| | | | | | |
| | | | | 14,649,853 | |
| |
Mexico 0.7% | | | | |
| 214,556 | | Wal-Mart de Mexico SAB de CV (Class V Stock) | | | 631,346 | |
| |
Netherlands 3.4% | | | | |
| 18,800 | | Aegon NV | | | 104,975 | |
| 44,700 | | ING Groep NV, CVA* | | | 394,902 | |
| 40,800 | | Koninklijke Ahold NV | | | 519,466 | |
| 8,300 | | Koninklijke DSM NV | | | 426,178 | |
| 21,300 | | Koninklijke KPN NV | | | 134,478 | |
| 8,366 | | Koninklijke Philips Electronics NV | | | 209,172 | |
| 2,000 | | Nutreco NV | | | 149,704 | |
| 15,049 | | Schlumberger Ltd. | | | 1,046,357 | |
| 11,700 | | Yandex NV (Class A Stock)* | | | 272,376 | |
| | | | | | |
| | | | | 3,257,608 | |
| |
New Zealand 0.3% | | | | |
| 279,800 | | Air New Zealand Ltd.(b) | | | 285,334 | |
See Notes to Financial Statements.
| | | | |
| Prudential International Value Fund | | | 15 | |
Portfolio of Investments
as of October 31, 2012 continued
| | | | | | |
| Shares | | Description | | Value (Note 1) | |
COMMON STOCKS (Continued) | | | | |
| |
Norway 0.5% | | | | |
| 20,700 | | DnB ASA | | $ | 258,509 | |
| 9,700 | | Statoil ASA | | | 239,723 | |
| | | | | | |
| | | | | 498,232 | |
| |
Singapore 0.3% | | | | |
| 578,400 | | Golden Agri-Resources Ltd. | | | 296,360 | |
| |
South Korea 1.2% | | | | |
| 2,830 | | Hyundai Motor Co. | | | 582,555 | |
| 483 | | Samsung Electronics Co. Ltd. | | | 580,167 | |
| | | | | | |
| | | | | 1,162,722 | |
| |
Spain 1.5% | | | | |
| 28,659 | | Banco Bilbao Vizcaya Argentaria SA | | | 239,110 | |
| 19,900 | | Banco Espanol de Credito SA | | | 72,505 | |
| 73,500 | | Banco Santander SA | | | 551,498 | |
| 20,300 | | Repsol SA | | | 405,726 | |
| 12,200 | | Telefonica SA | | | 160,659 | |
| | | | | | |
| | | | | 1,429,498 | |
| |
Sweden 1.9% | | | | |
| 31,600 | | Boliden AB | | | 552,163 | |
| 22,116 | | Hennes & Mauritz AB (Class B Stock) | | | 748,547 | |
| 5,500 | | NCC AB (Class B Stock) | | | 102,904 | |
| 6,300 | | Svenska Handelsbanken AB (Class A Stock) | | | 215,797 | |
| 11,000 | | Swedbank AB (Class A Stock) | | | 203,983 | |
| | | | | | |
| | | | | 1,823,394 | |
| |
Switzerland 6.9% | | | | |
| 4,500 | | Baloise Holding AG | | | 375,926 | |
| 12,800 | | Credit Suisse Group AG* | | | 296,738 | |
| 500 | | Georg Fischer AG* | | | 175,293 | |
| 13,496 | | Julius Baer Group Ltd.* | | | 468,078 | |
| 14,100 | | Nestle SA | | | 894,781 | |
| 23,667 | | Novartis AG | | | 1,424,391 | |
| 3,300 | | Roche Holding AG | | | 634,629 | |
| 870 | | Swatch Group AG (The) | | | 360,032 | |
| 2,100 | | Swiss Life Holding AG* | | | 264,276 | |
| 6,400 | | Swiss Re AG* | | | 442,221 | |
| 1,590 | | Syngenta AG | | | 621,112 | |
See Notes to Financial Statements.
| | |
| 16 | | Visit our website at www.prudentialfunds.com |
| | | | | | |
| Shares | | Description | | Value (Note 1) | |
COMMON STOCKS (Continued) | | | | |
| |
Switzerland (cont’d.) | | | | |
| 1,400 | | Verwaltungs-und Privat-Bank AG | | $ | 104,327 | |
| 2,500 | | Zurich Insurance Group AG* | | | 616,074 | |
| | | | | | |
| | | | | 6,677,878 | |
| |
United Kingdom 21.9% | | | | |
| 50,858 | | ARM Holdings PLC | | | 545,784 | |
| 20,700 | | AstraZeneca PLC | | | 961,225 | |
| 60,800 | | Aviva PLC | | | 325,159 | |
| 100,100 | | BAE Systems PLC | | | 504,320 | |
| 85,481 | | Barclays PLC | | | 313,827 | |
| 75,157 | | Beazley PLC | | | 212,371 | |
| 15,600 | | Berendsen PLC | | | 141,734 | |
| 46,244 | | BG Group PLC | | | 856,343 | |
| 116,400 | | BP PLC | | | 832,703 | |
| 17,647 | | British American Tobacco PLC | | | 874,134 | |
| 207,400 | | BT Group PLC | | | 711,225 | |
| 12,363 | | Burberry Group PLC | | | 232,628 | |
| 285,700 | | Cable & Wireless Communications PLC | | | 172,848 | |
| 20,709 | | Carnival PLC | | | 823,454 | |
| 38,100 | | Cookson Group PLC | | | 358,146 | |
| 29,400 | | Dairy Crest Group PLC | | | 169,093 | |
| 11,300 | | Drax Group PLC | | | 102,392 | |
| 8,900 | | GlaxoSmithKline PLC | | | 199,136 | |
| 40,400 | | Home Retail Group PLC | | | 74,389 | |
| 97,700 | | HSBC Holdings PLC | | | 963,127 | |
| 55,000 | | Intermediate Capital Group PLC | | | 270,886 | |
| 115,700 | | J. Sainsbury PLC | | | 662,082 | |
| 164,485 | | Kingfisher PLC | | | 768,448 | |
| 234,900 | | Legal & General Group PLC | | | 507,957 | |
| 24,800 | | Marks & Spencer Group PLC | | | 157,604 | |
| 48,900 | | Marston’s PLC | | | 96,747 | |
| 35,300 | | Mondi PLC | | | 388,507 | |
| 142,800 | | Old Mutual PLC | | | 396,366 | |
| 26,934 | | Pearson PLC | | | 541,140 | |
| 18,773 | | Reckitt Benckiser Group PLC | | | 1,136,068 | |
| 32,190 | | Rolls-Royce Holdings PLC* | | | 443,887 | |
| 53,075 | | Royal Bank of Scotland Group PLC* | | | 236,395 | |
| 46,900 | | Royal Dutch Shell PLC (Class B Stock) | | | 1,657,890 | |
| 100,287 | | RSA Insurance Group PLC | | | 181,746 | |
| 13,732 | | SABMiller PLC | | | 588,242 | |
See Notes to Financial Statements.
| | | | |
| Prudential International Value Fund | | | 17 | |
Portfolio of Investments
as of October 31, 2012
| | | | | | |
| Shares | | Description | | Value (Note 1) | |
COMMON STOCKS (Continued) | | | | |
| |
United Kingdom (cont’d.) | | | | |
| 38,757 | | Standard Chartered PLC | | $ | 915,340 | |
| 128,341 | | Tesco PLC | | | 662,447 | |
| 56,900 | | Thomas Cook Group PLC* | | | 18,824 | |
| 50,700 | | Tullett Prebon PLC | | | 223,526 | |
| 499,270 | | Vodafone Group PLC | | | 1,355,595 | |
| 135,800 | | WM Morrison Supermarkets PLC | | | 587,100 | |
| | | | | | |
| | | | | 21,170,835 | |
| |
United States 0.7% | | | | |
| 10,200 | | Yum! Brands, Inc. | | | 715,122 | |
| | | | | | |
| | TOTAL COMMON STOCKS
(cost $84,638,217) | | | 92,658,787 | |
| | | | | | |
PREFERRED STOCKS 1.4% | | | | |
| |
Brazil 0.5% | | | | |
| 28,900 | | Itau Unibanco Holding SA, ADR 2.79% (PRFC) | | | 421,362 | |
| |
Germany 0.9% | | | | |
| 4,352 | | Volkswagen AG, 1.81% (PRFC) | | | 900,274 | |
| |
United Kingdom | | | | |
| 2,446,440 | | Rolls-Royce Holdings PLC (PRFC C)*(b) | | | 3,948 | |
| | | | | | |
| | TOTAL PREFERRED STOCKS
(cost $962,603) | | | 1,325,584 | |
| | | | | | |
| | TOTAL LONG-TERM INVESTMENTS
(cost $85,600,820) | | | 93,984,371 | |
| | | | | | |
SHORT-TERM INVESTMENT 1.9% | | | | |
|
Affiliated Money Market Mutual Fund | |
| 1,862,563 | | Prudential Investment Portfolios 2 - Prudential Core
Taxable Money Market Fund
(cost $1,862,563)(a) | | | 1,862,563 | |
| | | | | | |
| | TOTAL INVESTMENTS 99.1%
(cost $87,463,383; Note 5) | | | 95,846,934 | |
| | Other assets in excess of liabilities(c) 0.9% | | | 905,836 | |
| | | | | | |
| | NET ASSETS 100% | | $ | 96,752,770 | |
| | | | | | |
The following abbreviations are used in the Portfolio descriptions:
ADR—American Depositary Receipt
CVA—Certificate Van Aandelen (Bearer)
See Notes to Financial Statements.
| | |
| 18 | | Visit our website at www.prudentialfunds.com |
PRFC—Preference Shares
EUR—Euro
| * | Non-income producing security. |
| (a) | Prudential Investments LLC, the manager of the Portfolio, also serves as manager of the Prudential Investment Portfolios 2 - Prudential Core Taxable Money Market Fund. |
| (b) | Indicates a security or securities that have been deemed illiquid. |
| (c) | Includes net unrealized appreciation (depreciation) on the following derivative contracts held at reporting period end: |
Forward foreign currency exchange contracts outstanding at October 31, 2012:
| | | | | | | | | | | | | | | | | | |
Purchase Contracts | | Counterparty | | Notional
Amount
(000) | | | Value at
Settlement
Date
Payable | | | Current
Value | | | Unrealized
Appreciation
(Depreciation) | |
Euro, | | | | | | | | | | | | | | | | | | |
Expiring 11/08/12 | | State Street Bank | | EUR | 950 | | | $ | 1,248,226 | | | $ | 1,231,297 | | | $ | (16,929 | ) |
Expiring 11/08/12 | | State Street Bank | | EUR | 568 | | | | 717,073 | | | | 736,134 | | | | 19,061 | |
| | | | | | | | | | | | | | | | | | |
| | | | | | | | $ | 1,965,299 | | | $ | 1,967,431 | | | $ | 2,132 | |
| | | | | | | | | | | | | | | | | | |
| | | | | |
Sale Contracts | | Counterparty | | Notional
Amount
(000) | | | Value at
Settlement
Date
Receivable | | | Current
Value | | | Unrealized
Appreciation | |
Euro, | | | | | | | | | | | | | | | | | | |
Expiring 11/08/12 | | State Street Bank | | | EUR 2,256 | | | $ | 2,955,290 | | | $ | 2,924,054 | | | $ | 31,236 | |
| | | | | | | | | | | | | | | | | | |
Various inputs are used in determining the value of the Fund’s investments. These inputs are summarized in the three broad levels listed below.
Level 1—quoted prices generally in active markets for identical securities.
Level 2—other significant observable inputs including, but not limited to, quoted prices for similar securities, interest rates and yield curves, prepayment speeds, foreign currency exchange rates, and amortized cost.
Level 3—significant unobservable inputs for securities valued in accordance with Board approved fair valuation procedures.
See Notes to Financial Statements.
| | | | |
| Prudential International Value Fund | | | 19 | |
Portfolio of Investments
as of October 31, 2012
The following is a summary of the inputs used as of October 31, 2012 in valuing such portfolio securities:
| | | | | | | | | | | | |
| | | Level 1 | | | Level 2 | | | Level 3 | |
Investments in Securities | | | | | | | | | | | | |
Common Stocks: | | | | | | | | | | | | |
Australia | | $ | 3,206,289 | | | $ | — | | | $ | — | |
Austria | | | 570,627 | | | | — | | | | — | |
Belgium | | | 333,632 | | | | — | | | | — | |
Brazil | | | 1,342,374 | | | | — | | | | — | |
Canada | | | 2,332,600 | | | | — | | | | — | |
Cayman Islands | | | 1,055,135 | | | | — | | | | — | |
China | | | 1,642,468 | | | | — | | | | — | |
Denmark | | | 1,547,814 | | | | — | | | | — | |
Finland | | | 262,806 | | | | — | | | | — | |
France | | | 8,715,443 | | | | — | | | | — | |
Germany | | | 10,714,993 | | | | — | | | | — | |
Hong Kong | | | 3,307,886 | | | | — | | | | — | |
Ireland | | | 1,208,492 | | | | — | | | | — | |
Israel | | | 2,215,379 | | | | — | | | | — | |
Italy | | | 1,604,667 | | | | — | | | | — | |
Japan | | | 14,649,853 | | | | — | | | | — | |
Mexico | | | 631,346 | | | | — | | | | — | |
Netherlands | | | 3,257,608 | | | | — | | | | — | |
New Zealand | | | 285,334 | | | | — | | | | — | |
Norway | | | 498,232 | | | | — | | | | — | |
Singapore | | | 296,360 | | | | — | | | | — | |
South Korea | | | 1,162,722 | | | | — | | | | — | |
Spain | | | 1,429,498 | | | | — | | | | — | |
Sweden | | | 1,823,394 | | | | — | | | | — | |
Switzerland | | | 6,677,878 | | | | — | | | | — | |
United Kingdom | | | 21,170,835 | | | | — | | | | — | |
United States | | | 715,122 | | | | — | | | | — | |
Preferred Stocks: | | | | | | | | | | | | |
Brazil | | | 421,362 | | | | — | | | | | |
Germany | | | 900,274 | | | | — | | | | — | |
United Kingdom | | | — | | | | 3,948 | | | | — | |
Affiliated Money Market Mutual Fund | | | 1,862,563 | | | | — | | | | — | |
Other Financial Instruments* | | | | | | | | | | | | |
Foreign Forward Currency Exchange Contracts | | | — | | | | 33,368 | | | | — | |
| | | | | | | | | | | | |
Total | | $ | 95,842,986 | | | $ | 37,316 | | | $ | — | |
| | | | | | | | | | | | |
| * | Other financial instruments are derivative instruments not reflected in the Portfolio of Investments, such as futures, forwards and swap contracts, which are recorded at the unrealized appreciation/depreciation on the instrument. |
See Notes to Financial Statements.
| | |
| 20 | | Visit our website at www.prudentialfunds.com |
Fair Value of Level 2 investments at 10/31/11 was $87,692,258, which was a result of valuing investments using third party vendor modeling tools. An amount of $79,422,274 was transferred from Level 2 into Level 1 at 10/31/12 as a result of using quoted prices in active market for such foreign securities.
It is the Portfolio’s policy to recognize transfers in and transfers out at the fair value as of the beginning of period.
The industry classification of investments and other assets in excess of liabilities shown as a percentage of net assets as of October 31, 2012 were as follows:
| | | | |
Banks | | | 12.1 | % |
Oil, Gas & Consumable Fuels | | | 9.6 | |
Pharmaceuticals | | | 9.0 | |
Insurance | | | 7.2 | |
Telecommunications | | | 6.4 | |
Food & Beverage | | | 5.7 | |
Chemicals | | | 4.3 | |
Retail & Merchandising | | | 4.3 | |
Automobile Manufacturers | | | 4.0 | |
Diversified Financial Services | | | 2.6 | |
Aerospace & Defense | | | 2.0 | |
Distribution/Wholesale | | | 1.9 | |
Affiliated Money Market Mutual Fund | | | 1.9 | |
Metals & Mining | | | 1.9 | |
Automotive Parts | | | 1.8 | |
Computer Services & Software | | | 1.8 | |
Apparel | | | 1.7 | |
Machinery & Equipment | | | 1.6 | |
Miscellaneous Manufacturing | | | 1.5 | |
Entertainment & Leisure | | | 1.4 | |
Internet Software & Services | | | 1.4 | |
Holding Companies—Diversified | | | 1.3 | |
Consumer Products & Services | | | 1.3 | |
Agriculture | | | 1.2 | % |
Transportation | | | 1.2 | |
Utilities | | | 1.1 | |
Healthcare Providers & Services | | | 0.9 | |
Electronic Components & Equipment | | | 0.9 | |
Engineering & Construction | | | 0.9 | |
Commercial Services | | | 0.8 | |
Advertising | | | 0.8 | |
Healthcare Products | | | 0.7 | |
Real Estate | | | 0.6 | |
Cosmetics/Personal Care | | | 0.6 | |
Semiconductors | | | 0.6 | |
Media & Entertainment | | | 0.6 | |
IT Services | | | 0.5 | |
Forest & Paper Products | | | 0.4 | |
Airlines | | | 0.3 | |
Building Materials | | | 0.2 | |
Home Furnishings | | | 0.1 | |
| | | | |
| | | 99.1 | |
Other assets in excess of liabilities | | | 0.9 | |
| | | | |
| | | 100.0 | % |
| | | | |
The Series invested in various derivative instruments during the reporting period. The primary types of risk associated with these derivative instruments were equity risk and foreign exchange risk.
The effect of such derivative instruments on the Series’ financial position and financial performance as reflected in the Statement of Assets and Liabilities and Statement of Operations is presented in the summary below.
| | | | |
| Prudential International Value Fund | | | 21 | |
Portfolio of Investments
as of October 31, 2012
Fair values of derivative instruments as of October 31, 2012 as presented in the Statement of Assets and Liabilities:
| | | | | | | | | | | | |
Derivatives not accounted
for as hedging instruments,
carried at fair value | | Asset Derivatives | | | Liability Derivatives | |
| | Balance
Sheet Location | | Fair
Value | | | Balance
Sheet Location | | Fair
Value | |
| Foreign exchange contracts | | Unrealized appreciation on foreign currency forward contracts | | $ | 50,297 | | | Unrealized depreciation on foreign currency forward contracts | | $ | 16,929 | |
| | | | | | | | | | | | |
The effects of derivative instruments on the Statement of Operations for the year ended October 31, 2012 are as follows:
| | | | | | | | | | | | |
Amount of Realized Gain or (Loss) on Derivatives Recognized in Income | |
Derivatives not accounted for as hedging instruments,
carried at fair value | | Rights | | | Forward
Currency
Contracts | | | Total | |
Foreign exchange contracts | | $ | — | | | $ | 311,061 | | | $ | 311,061 | |
Equity contracts | | | (76,087 | ) | | | — | | | | (76,087 | ) |
| | | | | | | | | | | | |
Total | | $ | (76,087 | ) | | $ | 311,061 | | | $ | 234,974 | |
| | | | | | | | | | | | |
| | | | |
Change in Unrealized Appreciation or (Depreciation) on Derivatives Recognized in Income | |
Derivatives not accounted for as hedging
instruments, carried at fair value | | Forward
Currency Contracts | |
Foreign exchange contracts | | $ | (58,728 | ) |
| | | | |
For the year ended October 31, 2012, the Series’ average value at settlement date payable for forward foreign currency exchange purchase contracts was $393,060 and the Series’ average value at settlement date receviable for forward foreign currency exchange sale contracts was $2,844,782.
See Notes to Financial Statements.
| | |
| 22 | | Visit our website at www.prudentialfunds.com |
PRUDENTIAL INVESTMENTS»MUTUAL FUNDS
FINANCIAL STATEMENTS
ANNUAL REPORT · October 31, 2012
Prudential International Value Fund
Statement of Assets and Liabilities
as of October 31, 2012
| | | | |
ASSETS | | | | |
Investments at value: | | | | |
Unaffiliated investments (cost $85,600,820) | | $ | 93,984,371 | |
Affiliated investments (cost $1,862,563) | | | 1,862,563 | |
Foreign currency, at value (cost $406,404) | | | 406,402 | |
Dividends and interest receivable | | | 291,103 | |
Tax reclaim receivable | | | 262,282 | |
Receivable for investments sold | | | 260,238 | |
Receivable for Series shares sold | | | 66,858 | |
Unrealized appreciation on foreign currency forward contracts | | | 50,297 | |
Prepaid expenses | | | 1,449 | |
| | | | |
Total Assets | | | 97,185,563 | |
| | | | |
| |
LIABILITIES | | | | |
Accrued expenses | | | 116,418 | |
Payable for Series shares reacquired | | | 101,307 | |
Advisory fee payable | | | 82,209 | |
Payable for investments purchased | | | 81,886 | |
Affiliated transfer agent fee payable | | | 18,405 | |
Unrealized depreciation on foreign currency forward contracts | | | 16,929 | |
Distribution fee payable | | | 12,522 | |
Payable to custodian | | | 3,117 | |
| | | | |
Total Liabilities | | | 432,793 | |
| | | | |
| |
NET ASSETS | | $ | 96,752,770 | |
| | | | |
| | | | | |
Net assets were comprised of: | | | | |
Common stock, at par value | | $ | 49,943 | |
Paid-in capital in excess of par | | | 112,983,247 | |
| | | | |
| | | 113,033,190 | |
Undistributed net investment income | | | 1,817,939 | |
Accumulated net realized loss on investment and foreign currency transactions | | | (26,513,918 | ) |
Net unrealized appreciation on investments and foreign currencies | | | 8,415,559 | |
| | | | |
Net Assets, October 31, 2012 | | $ | 96,752,770 | |
| | | | |
See Notes to Financial Statements.
| | |
| 24 | | Visit our website at www.prudentialfunds.com |
| | | | |
Class A: | | | | |
Net asset value and redemption price per share
($33,758,651 ÷ 1,743,947 shares of common stock issued and outstanding) | | $ | 19.36 | |
Maximum sales charge (5.5% of offering price) | | | 1.13 | |
| | | | |
Maximum offering price to public | | $ | 20.49 | |
| | | | |
| |
Class B: | | | | |
Net asset value, offering price and redemption price per share
($1,457,005 ÷ 78,946 shares of common stock issued and outstanding) | | $ | 18.46 | |
| | | | |
| |
Class C: | | | | |
Net asset value, offering price and redemption price per share
($4,783,833 ÷ 258,721 shares of common stock issued and outstanding) | | $ | 18.49 | |
| | | | |
| |
Class Z: | | | | |
Net asset value, offering price and redemption price per share
($56,753,281 ÷ 2,912,710 shares of common stock issued and outstanding) | | $ | 19.48 | |
| | | | |
See Notes to Financial Statements.
| | | | |
| Prudential International Value Fund | | | 25 | |
Statement of Operations
Year Ended October 31, 2012
| | | | |
Net Investment Income | | | | |
Investment Income | | | | |
Unaffiliated dividend income (net of foreign withholding taxes of $272,940) | | $ | 3,210,603 | |
Affiliated dividend income | | | 4,558 | |
Unaffiliated interest income | | | 571 | |
| | | | |
Total income | | | 3,215,732 | |
| | | | |
| |
Expenses | | | | |
Advisory fee | | | 949,215 | |
Distribution fee—Class A | | | 86,674 | |
Distribution fee—Class B | | | 16,554 | |
Distribution fee—Class C | | | 51,316 | |
Transfer agent’s fee and expenses (including affiliated expense of $101,400) (Note 3) | | | 161,000 | |
Custodian’s fees and expenses | | | 156,000 | |
Registration fees | | | 53,000 | |
Reports to shareholders | | | 30,000 | |
Audit fee | | | 29,000 | |
Legal fees and expenses | | | 24,000 | |
Directors’ fees | | | 12,000 | |
Insurance fees | | | 2,000 | |
Interest expense (Note 7) | | | 65 | |
Miscellaneous | | | 43,015 | |
| | | | |
Total expenses | | | 1,613,839 | |
| | | | |
Net investment income | | | 1,601,893 | |
| | | | |
| |
Realized And Unrealized Gain (Loss) On Investment And Foreign Currencies | | | | |
Net realized gain (loss) on: | | | | |
Investment transactions | | | (334,705 | ) |
Foreign currency transactions | | | 310,746 | |
| | | | |
| | | (23,959 | ) |
| | | | |
Net change in unrealized appreciation (depreciation) on: | | | | |
Investments | | | 3,004,587 | |
Foreign currencies | | | (86,769 | ) |
| | | | |
| | | 2,917,818 | |
| | | | |
Net gain on investments and foreign currencies | | | 2,893,859 | |
| | | | |
Net Increase In Net Assets Resulting From Operations | | $ | 4,495,752 | |
| | | | |
See Notes to Financial Statements.
| | |
| 26 | | Visit our website at www.prudentialfunds.com |
Statement of Changes in Net Assets
| | | | | | | | |
| | | Year Ended October 31, 2012 | | | Year Ended October 31, 2011 | |
Increase (Decrease) in Net Assets | | | | | | | | |
Operations | | | | | | | | |
Net investment income | | $ | 1,601,893 | | | $ | 1,691,196 | |
Net realized gain (loss) on investment and foreign
currency transactions | | | (23,959 | ) | | | 10,774,092 | |
Net change in unrealized appreciation (depreciation) on investments and foreign currencies | | | 2,917,818 | | | | (12,788,702 | ) |
| | | | | | | | |
Net increase (decrease) in net assets resulting
from operations | | | 4,495,752 | | | | (323,414 | ) |
| | | | | | | | |
| | |
Dividends and Distributions (Note 1) | | | | | | | | |
Dividends from net investment income | | | | | | | | |
Class A | | | (610,527 | ) | | | (376,129 | ) |
Class B | | | (17,304 | ) | | | (5,738 | ) |
Class C | | | (53,269 | ) | | | (12,666 | ) |
Class Z | | | (978,760 | ) | | | (1,693,194 | ) |
| | | | | | | | |
| | | (1,659,860 | ) | | | (2,087,727 | ) |
| | | | | | | | |
| | |
Series share transactions (Net of share conversions) (Note 6) | | | | | | | | |
Net proceeds from shares sold | | | 11,836,699 | | | | 27,552,858 | |
Net asset value of shares issued in reinvestment of dividends and distributions | | | 1,623,732 | | | | 2,073,598 | |
Cost of shares reacquired | | | (18,408,704 | ) | | | (142,888,872 | ) |
| | | | | | | | |
Net decrease in net assets from Series share transactions | | | (4,948,273 | ) | | | (113,262,416 | ) |
| | | | | | | | |
Total decrease | | | (2,112,381 | ) | | | (115,673,557 | ) |
| | |
Net Assets | | | | | | | | |
Beginning of year | | | 98,865,151 | | | | 214,538,708 | |
| | | | | | | | |
End of year(a) | | $ | 96,752,770 | | | $ | 98,865,151 | |
| | | | | | | | |
(a) Includes undistributed net investment income of: | | $ | 1,817,939 | | | $ | 1,565,160 | |
| | | | | | | | |
See Notes to Financial Statements.
| | | | |
| Prudential International Value Fund | | | 27 | |
Notes to Financial Statements
Prudential World Fund, Inc. (the “Fund”), is registered under the Investment Company Act of 1940, as amended, (“1940 Act”) as an open-end diversified management investment company and currently consists of five series: Prudential International Value Fund (the “Series”), Prudential International Equity Fund, Prudential Emerging Markets Debt Local Currency Fund, Prudential Jennison Global Opportunities Fund and Prudential Jennison International Opportunities Fund. These financial statements relate to Prudential International Value Fund. The financial statements of the other series are not presented herein. The investment objective of the Series is to achieve long-term growth of capital.
Note 1. Accounting Policies
The following is a summary of significant accounting policies followed by the Fund and the Series in the preparation of its financial statements.
Securities Valuation: The Fund holds portfolio securities and other assets that are fair valued at the close of each day the New York Stock Exchange (“NYSE”) is open for trading. Fair value is the price that would be received to sell an asset or paid to transfer a liability in an orderly transaction between market participants on the measurement date. The Board of Trustees (the “Board”) has delegated fair valuation responsibilities to Prudential Investments LLC (“PI” or “Manager”) through the adoption of Valuation Procedures for valuation of the Fund’s securities. Under the current Valuation Procedures, a Valuation Committee is established and responsible for supervising the valuation of portfolio securities and other assets. The Valuation Procedures allow the Fund to utilize independent pricing vendor services, quotations from market makers and other valuation methods in events when market quotations are not readily available or not representative of the fair value of the securities. A record of the Valuation Committee’s actions is subject to review, approval and ratification by the Board at its next regularly scheduled quarterly meeting.
Various inputs are used in determining the value of the Fund’s investments, which are summarized in the three broad level hierarchies based on any observable inputs used as described in the table following the Fund’s Portfolio of Investments. The valuation methodologies and significant inputs used in determining the fair value of securities and other assets classified as Level 1, Level 2 and Level 3 of the hierarchy are as follows:
Common stocks, exchange-traded funds and financial derivative instruments (including futures contracts and certain options and swap contracts on securities), that
| | |
| 28 | | Visit our website at www.prudentialfunds.com |
are traded on a national securities exchange are valued at the last sale price as of the close of trading on the applicable exchange. Securities traded via NASDAQ are valued at the NASDAQ official closing price. To the extent these securities are valued at the last sale price or NASDAQ official closing price, they are classified as Level 1 of the fair value hierarchy.
In the event there is no sale or official closing price on such day, these securities are valued at the mean between the last reported bid and asked prices, or at the last bid price in the absence of an asked price. These securities are classified as Level 2 of the fair value hierarchy as these inputs are considered as significant other observable inputs to the valuation.
For common stocks traded on foreign securities exchanges, certain valuation adjustments will be applied when events occur after the close of the security’s foreign market and before the Fund’s normal pricing time. These securities are valued using pricing vendor services that provide model prices derived using adjustment factors based on information such as local closing price, relevant general and sector indices, currency fluctuations, depositary receipts, and futures, as applicable. Securities valued using such model prices are classified as Level 2 of the fair value hierarchy as the adjustment factors are considered as significant other observable inputs to the valuation.
Investments in open-end, non-exchange-traded mutual funds are valued at their net asset values as of the close of the NYSE on the date of valuation. These securities are classified as Level 1 as they have the ability to be purchased or sold at their net asset values on the date of valuation.
Fixed income securities traded in the over-the-counter market, such as corporate bonds, municipal bonds, U.S. Government agencies issues and guaranteed obligations, U.S. Treasury obligations and sovereign issues are usually valued at prices provided by approved independent pricing vendors. The pricing vendors provide these prices usually after evaluating observable inputs including yield curves, credit rating, yield spreads, default rates, cash flows as well as broker/dealer quotations and reported trades. Securities valued using such vendor prices are classified as Level 2 of the fair value hierarchy.
Asset-backed and mortgage-related securities are usually valued by approved independent pricing vendors. The pricing vendors provide the prices using their internal pricing model with input from deal terms, tranche level attributes, yield curves, prepayment speeds, default rates, and broker/dealer quotes. Securities valued using such vendor prices are classified as Level 2 of the fair value hierarchy.
| | | | |
| Prudential International Value Fund | | | 29 | |
Notes to Financial Statements
continued
Short-term debt securities of sufficient credit quality which mature in sixty days or less, are valued using amortized cost methods which approximates fair value. The amortized cost method involves valuing a security at its cost on the date of purchase and thereafter assuming a constant amortization to maturity of the difference between the principal amount due at maturity and cost. These securities are categorized as Level 2 of the fair value hierarchy.
Over-the-counter financial derivative instruments, such as option contracts, foreign currency contracts and swaps agreements, are usually valued using pricing vendor services, which derive the valuation based on underlying asset prices, indices, spreads, interest rates, exchange rates and other inputs. These instruments are categorized as Level 2 of the fair value hierarchy.
Securities and other assets that cannot be priced using the methods described above are valued with pricing methodologies approved by the Valuation Committee. In the event there are unobservable inputs used when determining such valuations, the securities will be classified as Level 3 of the fair value hierarchy.
When determining the fair value of securities, some of the factors influencing the valuation include: the nature of any restrictions on disposition of the securities; assessment of the general liquidity of the securities; the issuer’s financial condition and the markets in which it does business; the cost of the investment; the size of the holding and the capitalization of the issuer; the prices of any recent transactions or bids/offers for such securities or any comparable securities; any available analyst media or other reports or information deemed reliable by the investment adviser regarding the issuer or the markets or industry in which it operates. Using fair value to price securities may result in a value that is different from a security’s most recent closing price and from the price used by other mutual funds to calculate their net asset values.
Securities Lending: The Series may lend its portfolio securities to banks and broker-dealers. The loans are secured by collateral at least equal to the market value of the securities loaned. Collateral pledged by each borrower is invested in a highly liquid short-term mutual fund and is marked to market daily, based on the previous day’s market value, such that the value of the collateral exceeds the value of the loaned securities. Loans are subject to termination at the option of the borrower or the Series. Upon termination of the loan, the borrower will return to the lender securities
| | |
| 30 | | Visit our website at www.prudentialfunds.com |
identical to the loaned securities. Should the borrower of the securities fail financially, the Series has the right to repurchase the securities using the collateral in the open market. The Series recognizes income, net of any rebate and securities lending agent fees, for lending its securities, and interest on the investment of any cash received as collateral. The Series also continues to receive interest and dividends or amounts equivalent thereto, on the securities loaned and recognizes any unrealized gain or loss in the market price of the securities loaned that may occur during the term of the loan.
Foreign Currency Translation: The books and records of the Series are maintained in U.S. dollars. Foreign currency amounts are translated into U.S. dollars on the following basis:
(i) market value of investment securities, other assets and liabilities—at the current rates of exchange.
(ii) Purchases and sales of investment securities, income and expenses—at the rates of exchange prevailing on the respective dates of such transactions.
Although the net assets of the Series are presented at the foreign exchange rates and market values at the close of the fiscal period, the Series does not isolate that portion of the results of operations arising as a result of changes in the foreign exchange rates from the fluctuations arising from changes in the market prices of long-term securities held at the end of the fiscal period. Similarly, the Series does not isolate the effect of changes in foreign exchange rates from the fluctuations arising from changes in the market prices of long-term portfolio securities sold during the fiscal period. Accordingly, realized foreign currency gains or losses are included in the reported net realized gains or losses on investment transactions.
Net realized gains or losses on foreign currency transactions represent net foreign exchange gains or losses from the holding of foreign currencies, currency gains or losses realized between the trade date and settlement date on securities transactions, and the difference between the amounts of dividends, interest and foreign withholding taxes recorded on the Series’ books and the U.S. dollar equivalent amounts actually received or paid. Net unrealized currency gains or losses from valuing foreign currency denominated assets and liabilities (other than investments) at period end exchange rates are reflected as a component of net unrealized appreciation (depreciation) on investments and foreign currencies.
Foreign security and currency transactions may involve certain considerations and risks not typically associated with those of domestic origin as a result of, among other factors, the possibility of political and economic instability or the level of governmental supervision and regulation of foreign securities markets.
| | | | |
| Prudential International Value Fund | | | 31 | |
Notes to Financial Statements
continued
Foreign Currency Contracts: A forward currency contract is a commitment to purchase or sell a foreign currency at a future date at a negotiated forward rate between two parties. The Series enters into forward currency contracts in order to hedge its exposure to changes in foreign currency exchange rates on its foreign portfolio holdings or specific receivables and payables denominated in a foreign currency. The contracts are valued daily at current forward exchange rates and any unrealized gain or loss is included in net unrealized appreciation or depreciation on foreign currencies. Gain or loss is realized on the settlement date of the contract equal to the difference between the settlement value of the original and negotiated forward contracts. This gain or loss, if any, is included in net realized gain (loss) on foreign currency transactions. Risks may arise upon entering into these contracts from the potential inability of the counterparties to meet the terms of their contracts. Forward currency contracts involve elements of both market and credit risk in excess of the amounts reflected on the Statement of Assets and Liabilities. The Series’ maximum risk of loss from counterparty credit risk is the net value of the cash flows to be received from the counterparty at the end of the contract’s life. A master netting agreement between the Series and the counterparty permits the Series to offset amounts payable by the Series to the same counterparty against amounts to be received; and by the receipt of collateral from the counterparty by the Series to cover the Series’ exposure to the counterparty. However, there is no assurance that such mitigating factors are easily enforceable.
Warrants and Rights: The Series may hold warrants and rights acquired either through a direct purchase, included as part of a private placement, or pursuant to corporate actions. Warrants and rights entitle the holder to buy a proportionate amount of common stock at a specific price and time through the expiration dates. Such warrants and rights are held as long positions by the Series until exercised, sold or expired. Warrants and rights are valued at fair value in accordance with the Board of Directors’ approved fair valuation procedures.
Securities Transactions and Net Investment Income: Securities transactions are recorded on the trade date. Realized and unrealized gains or losses from investment and currency transactions are calculated on the identified cost basis. Dividend income is recorded on the ex-dividend date. Interest income, including amortization of premium and accretion of discount on debt securities, as required, is recorded on an accrual basis. Expenses are recorded on the accrual basis, which may require the use of certain estimates by management, that may differ from actual.
| | |
| 32 | | Visit our website at www.prudentialfunds.com |
Net investment income or loss, (other than distribution fees which are charged directly to the respective class) and unrealized and realized gains or losses are allocated daily to each class of shares based upon the relative proportion of adjusted net assets of each class at the beginning of the day.
Dividends and Distributions: The Series expects to pay dividends of net investment income and distributions of net realized capital gains, if any, annually. Dividends and distributions to shareholders, which are determined in accordance with federal income tax regulations and which may differ from generally accepted accounting principles, are recorded on the ex-dividend date. Permanent book/tax differences relating to income and gains are reclassified amongst undistributed net investment income, accumulated net realized gain or loss and paid-in capital in excess of par, as appropriate.
Taxes: For federal income tax purposes, each series in the Fund is treated as a separate taxpaying entity. It is the Series’ policy to continue to meet the requirements of the Internal Revenue Code applicable to regulated investment companies and to distribute all of its taxable net income and capital gains, if any, to shareholders. Therefore, no federal income tax provision is required.
Withholding taxes on foreign dividends are recorded, net of reclaimable amounts, at the time the related income is earned.
Estimates: The preparation of the financial statements requires management to make estimates and assumptions that affect the reported amounts and disclosures in the financial statements. Actual results could differ from those estimates.
Note 2. Agreements
The Fund has a management agreement for the Series with Prudential Investments LLC (“PI”). Pursuant to this agreement, PI has responsibility for all investment advisory services and supervises the subadvisor’s performance of such services. PI has entered into subadvisory agreements with LSV Asset Management (“LSV”) and Thornburg Investment Management, Inc. (“Thornburg”) for the Series.
The subadvisory agreements provide that LSV and Thornburg furnish investment advisory services in connection with the management of the Series. In connection therewith, LSV and Thornburg are obligated to keep certain books and records of the Series. PI pays for the services of the subadvisors, the compensation of officers of the Series, occupancy and certain clerical and bookkeeping costs of the Series. The Series bears all other costs and expenses.
| | | | |
| Prudential International Value Fund | | | 33 | |
Notes to Financial Statements
continued
The management fee paid to PI is computed daily and payable monthly at an annual rate of 1% of the average daily net assets up to $300 million, .95% of the next $700 million of average daily net assets and .90% of average daily net assets in excess of $1 billion of the Series. The effective management fee rate as of October 31, 2012 was 1.00%.
The Fund has a distribution agreement with Prudential Investment Management Services LLC (“PIMS”), which acts as the distributor of the Class A, Class B, Class C and Class Z shares of the Series. The Series compensates PIMS for distributing and servicing the Series’ Class A, Class B and Class C shares pursuant to plans of distribution (the “Class A, B and C Plans”), regardless of expenses actually incurred by PIMS. The distribution fees are accrued daily and payable monthly. No distribution or service fees are paid to PIMS as distributor of the Class Z shares of the Series.
Pursuant to the Class A, B and C Plans, the Series compensates PIMS for distribution related activities at an annual rate of up to .30%, 1% and 1% of the average daily net assets of the Class A, B and C shares, respectively. For the year ended October 31, 2012, PIMS contractually agreed to limit such fee to 0.25% of the average daily net assets of the Class A shares.
PIMS has advised the Series that it received $21,248 in front-end sales charges resulting from sales of Class A shares, during the year ended October 31, 2012. From these fees, PIMS paid such sales charges to broker-dealers, which in turn paid commissions to salespersons and incurred other distribution costs.
PIMS advised the Series that for the year ended October 31, 2012, it received $4, $2,710 and $1,235 in contingent deferred sales charges imposed upon certain redemptions by Class A, Class B and Class C shareholders, respectively.
PI and PIMS are indirect, wholly-owned subsidiaries of Prudential Financial, Inc. (“Prudential”).
Note 3. Other Transactions with Affiliates
Prudential Mutual Fund Services LLC (“PMFS”), an affiliate of PI and an indirect, wholly owned subsidiary of Prudential, serves as the Series’ transfer agent. The transfer agent fees and expenses in the Statement of Operations also include certain out-of-pocket expenses paid to non-affiliates, where applicable.
| | |
| 34 | | Visit our website at www.prudentialfunds.com |
The Series invests in the Prudential Core Taxable Money Market Fund (the “Core Fund”), a portfolio of Prudential Investment Portfolios 2 registered under the 1940 Act, and managed by PI. Earnings from the Core Fund are disclosed on the Statement of Operations as affiliated dividend income.
Note 4. Portfolio Securities
Purchases and sales of investment securities, other than short-term investments, for the year ended October 31, 2012 were $14,599,748 and $18,982,991, respectively.
Note 5. Distributions and Tax Information
Distributions to shareholders, which are determined in accordance with federal income tax regulations, which may differ from generally accepted accounting principles, are recorded on the ex-dividend date. In order to present undistributed net investment income, accumulated net realized loss on investment and foreign currency transactions and paid-in capital in excess of par on the Statement of Assets and Liabilities that more closely represent their tax character, certain adjustments have been made to undistributed net investment income and accumulated net realized loss on investment and foreign currency transactions. For the tax year ended October 31, 2012 the adjustments were to increase undistributed net investment income and increase accumulated net realized loss on investment and foreign currency transactions by $310,746 due to the differences in the treatment for book and tax purposes of certain transactions involving foreign securities. Net investment income, net realized loss and net assets were not affected by this change.
For the years ended October 31, 2012 and October 31, 2011, the tax character of dividends paid as reflected in the Statement of Changes in Net Assets were $1,659,860 and $2,087,727 of ordinary income, respectively.
As of October 31, 2012, the accumulated undistributed earnings on a tax basis was $1,868,189 of ordinary income. This differs from the amount shown on the Statement of Assets and Liabilities primarily due to cumulative timing differences between financial and tax reporting.
The United States federal income tax basis of the Series’ investments and the net unrealized appreciation as of October 31, 2012 were as follows:
| | | | | | | | | | |
Tax Basis | | Appreciation | | Depreciation | | Net
Unrealized
Appreciation | | Other
Cost Basis
Adjustment | | Total Net
Unrealized
Appreciation |
| $87,949,553 | | $18,843,629 | | $(10,946,248) | | $7,897,381 | | $32,008 | | $7,929,389 |
| | | | |
| Prudential International Value Fund | | | 35 | |
Notes to Financial Statements
continued
The difference between book basis and tax basis was primarily attributable to deferred losses on wash sales and investments in passive foreign investment companies.
Under the Regulated Investment Company Modernization Act of 2010 (“the Act”), the Series is permitted to carryforward capital losses incurred in the fiscal year ended October 31, 2012 (“post-enactment losses”) for an unlimited period. Post-enactment losses are required to be utilized before the utilization of losses incurred prior to the effective date of the Act. As a result of this ordering rule, capital loss carryforwards related to taxable years ending before October 31, 2012 (“pre-enactment losses”) may have an increased likelihood to expire unused. Additionally, post-enactment capital losses that are carried forward will retain their character as either short-term or long-term capital losses rather than being considered all short-term as under previous law. No capital gains distributions are expected to be paid to shareholders until net gains have been realized in excess of such losses. As of October 31, 2012, the pre and post-enactment losses were approximately:
| | | | |
Post-Enactment Losses: | | $ | 581,000 | |
| | | | |
Pre-Enactment Losses: | | | | |
Expiring 2017 | | | 24,486,000 | |
Expiring 2018 | | | 978,000 | |
| | | | |
| | $ | 25,464,000 | |
| | | | |
Management has analyzed the Series’ tax positions taken on federal income tax returns for all open tax years and has concluded that no provision for income tax is required in the Series’ financial statements for the current reporting period. The Series’ federal and state income and federal excise tax returns for tax years for which the applicable statutes of limitations have not expired are subject to examination by the Internal Revenue Service and state departments of revenue.
Note 6. Capital
The Series offers Class A, Class B, Class C and Class Z shares. Class A shares are sold with a front-end sales charge of up to 5.50%. All investors who purchase Class A shares in an amount of $1 million or more and sell these shares within 12 months of purchase are subject to a contingent deferred sales charge (“CDSC”) of 1%, including investors who purchase their shares through broker-dealers affiliated with Prudential. Class B shares are sold with a CDSC which declines from 5% to zero depending upon
| | |
| 36 | | Visit our website at www.prudentialfunds.com |
the period of time the shares are held. Class C shares are sold with a CDSC of 1% during the first 12 months from the date of purchase. Class B shares will automatically convert to Class A shares on a quarterly basis approximately seven years after purchase. A special exchange privilege is also available for shareholders who qualify to purchase Class A shares at net asset value. Class Z shares are not subject to any sales or redemption charge and are offered exclusively for sale to a limited group of investors.
Under certain circumstances, an exchange may be made from specified share classes of the Fund to one or more other share classes of the Fund as presented in the table of transactions in shares of beneficial interest.
There are 250 million authorized shares of $.01 par value common stock, divided into four classes, designated Class A, Class B, Class C and Class Z common stock, each of which consists of 75 million, 50 million, 50 million and 75 million authorized shares, respectively.
Transactions in shares of common stock were as follows:
| | | | | | | | |
Class A | | Shares | | | Amount | |
Year ended October 31, 2012: | | | | | | | | |
Shares sold | | | 88,449 | | | $ | 1,631,363 | |
Shares issued in reinvestment of dividends and distributions | | | 32,651 | | | | 585,430 | |
Shares reacquired | | | (457,841 | ) | | | (8,354,606 | ) |
| | | | | | | | |
Net increase (decrease) in shares outstanding before conversion | | | (336,741 | ) | | | (6,137,813 | ) |
Shares issued upon conversion from Class B | | | 20,082 | | | | 366,930 | |
Shares reacquired upon conversion into Class Z | | | (6,033 | ) | | | (107,215 | ) |
| | | | | | | | |
Net increase (decrease) in shares outstanding | | | (322,692 | ) | | $ | (5,878,098 | ) |
| | | | | | | | |
Year ended October 31, 2011: | | | | | | | | |
Shares sold | | | 174,148 | | | $ | 3,564,449 | |
Shares issued in reinvestment of dividends and distributions | | | 18,196 | | | | 363,555 | |
Shares reacquired | | | (405,920 | ) | | | (8,369,754 | ) |
| | | | | | | | |
Net increase (decrease) in shares outstanding before conversion | | | (213,576 | ) | | | (4,441,750 | ) |
Shares issued upon conversion from Class B | | | 33,177 | | | | 671,705 | |
| | | | | | | | |
Net increase (decrease) in shares outstanding | | | (180,399 | ) | | $ | (3,770,045 | ) |
| | | | | | | | |
| | | | |
| Prudential International Value Fund | | | 37 | |
Notes to Financial Statements
continued
| | | | | | | | |
Class B | | Shares | | | Amount | |
Year ended October 31, 2012: | | | | | | | | |
Shares sold | | | 8,208 | | | $ | 144,803 | |
Shares issued in reinvestment of dividends and distributions | | | 929 | | | | 15,993 | |
Shares reacquired | | | (19,508 | ) | | | (346,846 | ) |
| | | | | | | | |
Net increase (decrease) in shares outstanding before conversion | | | (10,371 | ) | | | (186,050 | ) |
Shares reacquired upon conversion into Class A | | | (20,816 | ) | | | (366,930 | ) |
| | | | | | | | |
Net increase (decrease) in shares outstanding | | | (31,187 | ) | | $ | (552,980 | ) |
| | | | | | | | |
Year ended October 31, 2011: | | | | | | | | |
Shares sold | | | 11,306 | | | $ | 223,306 | |
Shares issued in reinvestment of dividends and distributions | | | 281 | | | | 5,390 | |
Shares reacquired | | | (26,475 | ) | | | (519,188 | ) |
| | | | | | | | |
Net increase (decrease) in shares outstanding before conversion | | | (14,888 | ) | | | (290,492 | ) |
Shares reacquired upon conversion into Class A | | | (34,655 | ) | | | (671,705 | ) |
| | | | | | | | |
Net increase (decrease) in shares outstanding | | | (49,543 | ) | | $ | (962,197 | ) |
| | | | | | | | |
Class C | | | | | | |
Year ended October 31, 2012: | | | | | | | | |
Shares sold | | | 20,549 | | | $ | 365,925 | |
Shares issued in reinvestment of dividends and distributions | | | 3,028 | | | | 52,206 | |
Shares reacquired | | | (95,948 | ) | | | (1,677,033 | ) |
| | | | | | | | |
Net increase (decrease) in shares outstanding | | | (72,371 | ) | | $ | (1,258,902 | ) |
| | | | | | | | |
Year ended October 31, 2011: | | | | | | | | |
Shares sold | | | 33,601 | | | $ | 667,489 | |
Shares issued in reinvestment of dividends and distributions | | | 649 | | | | 12,462 | |
Shares reacquired | | | (55,107 | ) | | | (1,085,844 | ) |
| | | | | | | | |
Net increase (decrease) in shares outstanding | | | (20,857 | ) | | $ | (405,893 | ) |
| | | | | | | | |
Class Z | | | | | | |
Year ended October 31, 2012: | | | | | | | | |
Shares sold | | | 529,417 | | | $ | 9,694,608 | |
Shares issued in reinvestment of dividends and distributions | | | 53,865 | | | | 970,103 | |
Shares reacquired | | | (428,040 | ) | | | (8,030,219 | ) |
| | | | | | | | |
| | | 155,242 | | | | 2,634,492 | |
Shares reacquired upon conversion into Class A | | | 6,006 | | | | 107,215 | |
| | | | | | | | |
Net increase (decrease) in shares outstanding | | | 161,248 | | | $ | 2,741,707 | |
| | | | | | | | |
Year ended October 31, 2011: | | | | | | | | |
Shares sold | | | 1,145,232 | | | $ | 23,097,614 | |
Shares issued in reinvestment of dividends and distributions | | | 84,356 | | | | 1,692,191 | |
Shares reacquired | | | (6,266,505 | ) | | | (132,914,086 | ) |
| | | | | | | | |
Net increase (decrease) in shares outstanding | | | (5,036,917 | ) | | $ | (108,124,281 | ) |
| | | | | | | | |
| | |
| 38 | | Visit our website at www.prudentialfunds.com |
Note 7. Borrowings
The Fund, along with other affiliated registered investment companies (the “Funds”), is a party to a Syndicated Credit Agreement (“SCA”) with a group of banks. The purpose of the SCA is to provide an alternative source of temporary funding for capital share redemptions. The SCA provides for a commitment of $900 million for the period December 16, 2011 through November 14, 2012. The SCA has been renewed effective November 15, 2012 at substantially similar terms through November 14, 2013. The Funds pay an annualized commitment fee of .08% of the unused portion of the SCA. Prior to December 16, 2011, the Funds had another Syndicated Credit Agreement of a $750 million commitment with an annualized commitment fee of .10% of the unused portion. Interest on any borrowings under the SCA is paid at contracted market rates. The commitment fee for the unused amount is accrued daily and paid quarterly.
The Series utilized the SCA during the year ended October 31, 2012. The balance for the one day the Series had loans outstanding during the period was approximately $1,571,000, borrowed at an interest rate of 1.49%. At October 31, 2012, the Series did not have an outstanding loan amount.
Note 9. Notice of Dividends to Shareholders
The Series declared ordinary income dividends on December 17, 2012 to shareholders of record on December 18, 2012. The ex-dividend date was December 19, 2012. The per share amounts declared were as follows:
| | | | |
| | | Ordinary Income | |
Class A | | $ | 0.3940 | |
Class B | | $ | 0.2616 | |
Class C | | $ | 0.2616 | |
Class Z | | $ | 0.4408 | |
Note 10. New Accounting Pronouncement
In December 2011, the Financial Accounting Standards Board (“FASB”) issued Accounting Standards Update (“ASU”) No. 2011-11 regarding “Disclosures about Offsetting Assets and Liabilities.” The amendments, which will be effective for annual reporting periods beginning on or after January 1, 2013 and interim periods within those annual periods, require an entity to disclose information about offsetting and related arrangements for assets and liabilities, financial instruments and derivatives
| | | | |
| Prudential International Value Fund | | | 39 | |
Notes to Financial Statements
continued
that are either currently offset in accordance with current requirements or are subject to enforceable master netting arrangements or similar agreements. At this time, management is evaluating the implications of ASU No. 2011-11 and its impact on the financial statements has not yet been determined.
| | |
| 40 | | Visit our website at www.prudentialfunds.com |
Financial Highlights
| | | | | | | | | | | | | | | | | | | | |
| Class A Shares | |
| | | Year Ended October 31, | |
| | | 2012(b) | | | 2011(b) | | | 2010(b) | | | 2009(b) | | | 2008(b) | |
| Per Share Operating Performance: | | | | | | | | | | | | | | | | | | | | |
| Net Asset Value, Beginning of Year | | | $18.80 | | | | $20.29 | | | | $18.45 | | | | $15.28 | | | | $34.10 | |
| Income (loss) from investment operations: | | | | | | | | | | | | | | | | | | | | |
| Net investment income | | | .29 | | | | .32 | | | | .22 | | | | .20 | | | | .44 | |
| Net realized and unrealized gain (loss) on investments | | | .57 | | | | (1.64 | ) | | | 1.71 | | | | 3.59 | | | | (14.93 | ) |
| Total from investment operations | | | .86 | | | | (1.32 | ) | | | 1.93 | | | | 3.79 | | | | (14.49 | ) |
| Less Dividends and Distributions: | | | | | | | | | | | | | | | | | | | | |
| Dividends from net investment income | | | (.30 | ) | | | (.17 | ) | | | (.12 | ) | | | (.62 | ) | | | (.38 | ) |
| Distributions from net realized gains | | | - | | | | - | | | | - | | | | - | | | | (3.95 | ) |
| Total dividends and distributions | | | (.30 | ) | | | (.17 | ) | | | (.12 | ) | | | (.62 | ) | | | (4.33 | ) |
| Capital Contributions(e) | | | - | | | | - | | | | .03 | | | | - | | | | - | |
| Net asset value, end of year | | | $19.36 | | | | $18.80 | | | | $20.29 | | | | $18.45 | | | | $15.28 | |
| Total Return(a): | | | 4.71% | | | | (6.56)% | | | | 10.68% | | | | 26.03% | | | | (48.33)% | |
| |
| Ratios/Supplemental Data: | |
| Net assets, end of year (000) | | | $33,759 | | | | $38,858 | | | | $45,598 | | | | $45,945 | | | | $40,580 | |
| Average net assets (000) | | | $34,669 | | | | $44,169 | | | | $44,626 | | | | $39,582 | | | | $71,618 | |
| Ratios to average net assets(d): | | | | | | | | | | | | | | | | | | | | |
| Expenses, including distribution and service (12b-1) fees(c) | | | 1.79% | | | | 1.78% | | | | 1.66% | | | | 1.65% | | | | 1.56% | |
| Expenses, excluding distribution and service (12b-1) fees | | | 1.54% | | | | 1.53% | | | | 1.41% | | | | 1.40% | | | | 1.31% | |
| Net investment income | | | 1.59% | | | | 1.56% | | | | 1.17% | | | | 1.30% | | | | 1.79% | |
| Portfolio turnover rate | | | 16% | | | | 25% | | | | 40% | | | | 40% | | | | 27% | |
(a) Total return does not consider the effect of sales load. Total return is calculated assuming a purchase of a share on the first day and a sale on the last day of each year reported and includes reinvestment of dividends and distributions. Total returns may reflect adjustments to conform to generally accepted accounting principles.
(b) Calculations are based on the average daily number of shares outstanding.
(c) The distributor of the Fund has contractually agreed to limit its distribution and service (12b-1) fees to .25 of 1% of the average daily assets of the Class A shares.
(d) Does not include expenses of the underlying portfolio in which the Series invests.
(e) The Fund received payments related to a former affiliate’s settlement of regulatory proceedings involving allegations of improper trading in Fund shares during the fiscal year ended October 31, 2010. The Fund was not involved in the proceedings or in the calculations of the amount of settlement.
See Notes to Financial Statements.
| | | | |
| Prudential International Value Fund | | | 41 | |
Financial Highlights
continued
| | | | | | | | | | | | | | | | | | | | |
| Class B Shares | | | | | | | | | | | | | | | |
| | | Year Ended October 31, | |
| | | 2012(b) | | | 2011(b) | | | 2010(b) | | | 2009(b) | | | 2008(b) | |
| Per Share Operating Performance: | | | | | | | | | | | | | | | | | | | | |
| Net Asset Value, Beginning of Year | | | $17.93 | | | | $19.37 | | | | $17.64 | | | | $14.58 | | | | $32.73 | |
| Income (loss) from investment operations: | | | | | | | | | | | | | | | | | | | | |
| Net investment income | | | .15 | | | | .16 | | | | .08 | | | | .08 | | | | .24 | |
Net realized and unrealized gain (loss) on
investments | | | .54 | | | | (1.56 | ) | | | 1.63 | | | | 3.45 | | | | (14.29 | ) |
| Total from investment operations | | | .69 | | | | (1.40 | ) | | | 1.71 | | | | 3.53 | | | | (14.05 | ) |
| Less Dividends and Distributions: | | | | | | | | | | | | | | | | | | | | |
| Dividends from net investment income | | | (.16 | ) | | | (.04 | ) | | | (.01 | ) | | | (.47 | ) | | | (.15 | ) |
| Distributions from net realized gains | | | - | | | | - | | | | - | | | | - | | | | (3.95 | ) |
| Total dividends and distributions | | | (.16 | ) | | | (.04 | ) | | | (.01 | ) | | | (.47 | ) | | | (4.10 | ) |
| Capital Contributions(d) | | | - | | | | - | | | | .03 | | | | - | | | | - | |
| Net asset value, end of year | | | $18.46 | | | | $17.93 | | | | $19.37 | | | | $17.64 | | | | $14.58 | |
| Total Return(a): | | | 3.91% | | | | (7.26)% | | | | 9.86% | | | | 25.11% | | | | (48.74)% | |
| |
| Ratios/Supplemental Data: | | | | | | | | | | | | | | | |
| Net assets, end of year (000) | | | $1,457 | | | | $1,975 | | | | $3,093 | | | | $3,839 | | | | $5,143 | |
| Average net assets (000) | | | $1,655 | | | | $2,651 | | | | $3,314 | | | | $3,985 | | | | $10,730 | |
| Ratios to average net assets(c): | | | | | | | | | | | | | | | | | | | | |
| Expenses, including distribution and service (12b-1) fees | | | 2.54% | | | | 2.52% | | | | 2.41% | | | | 2.40% | | | | 2.31% | |
| Expenses, excluding distribution and service (12b-1) fees | | | 1.54% | | | | 1.52% | | | | 1.41% | | | | 1.40% | | | | 1.31% | |
| Net investment income | | | .83% | | | | .81% | | | | .43% | | | | .58% | | | | 1.01% | |
| Portfolio turnover rate | | | 16% | | | | 25% | | | | 40% | | | | 40% | | | | 27% | |
(a) Total return does not consider the effect of sales load. Total return is calculated assuming a purchase of a share on the first day and a sale on the last day of each year reported and includes reinvestment of dividends and distributions. Total returns may reflect adjustments to conform to generally accepted accounting principles.
(b) Calculations are based on the average daily number of shares outstanding.
(c) Does not include expenses of the underlying portfolio in which the Series invests.
(d) The Fund received payments related to a former affiliate’s settlement of regulatory proceedings involving allegations of improper trading in Fund shares during the fiscal year ended October 31, 2010. The Fund was not involved in the proceedings or in the calculations of the amount of settlement.
See Notes to Financial Statements.
| | |
| 42 | | Visit our website at www.prudentialfunds.com |
| | | | | | | | | | | | | | | | | | | | |
| Class C Shares | | | | | | | | | | | | | | | |
| | | Year Ended October 31, | |
| | | 2012(b) | | | 2011(b) | | | 2010(b) | | | 2009(b) | | | 2008(b) | |
| Per Share Operating Performance: | | | | | | | | | | | | | | | | | | | | |
| Net Asset Value, Beginning of Year | | | $17.96 | | | | $19.40 | | | | $17.66 | | | | $14.60 | | | | $32.77 | |
| Income (loss) from investment operations: | | | | | | | | | | | | | | | | | | | | |
| Net investment income | | | .15 | | | | .16 | | | | .07 | | | | .08 | | | | .24 | |
Net realized and unrealized gain (loss) on
investments | | | .54 | | | | (1.56 | ) | | | 1.65 | | | | 3.45 | | | | (14.31 | ) |
| Total from investment operations | | | .69 | | | | (1.40 | ) | | | 1.72 | | | | 3.53 | | | | (14.07 | ) |
| Less Dividends and Distributions: | | | | | | | | | | | | | | | | | | | | |
| Dividends from net investment income | | | (.16 | ) | | | (.04 | ) | | | (.01 | ) | | | (.47 | ) | | | (.15 | ) |
| Distributions from net realized gains | | | - | | | | - | | | | - | | | | - | | | | (3.95 | ) |
| Total dividends and distributions | | | (.16 | ) | | | (.04 | ) | | | (.01 | ) | | | (.47 | ) | | | (4.10 | ) |
| Capital Contributions(d) | | | - | | | | - | | | | .03 | | | | - | | | | - | |
| Net asset value, end of year | | | $18.49 | | | | $17.96 | | | | $19.40 | | | | $17.66 | | | | $14.60 | |
| Total Return(a): | | | 3.90% | | | | (7.25)% | | | | 9.91% | | | | 25.08% | | | | (48.74)% | |
| |
| Ratios/Supplemental Data: | | | | | | | | | | | | | | | |
| Net assets, end of year (000) | | | $4,784 | | | | $5,947 | | | | $6,828 | | | | $7,507 | | | | $7,355 | |
| Average net assets (000) | | | $5,132 | | | | $6,690 | | | | $6,760 | | | | $6,807 | | | | $13,571 | |
| Ratios to average net assets(c): | | | | | | | | | | | | | | | | | | | | |
| Expenses, including distribution and service (12b-1) fees | | | 2.54% | | | | 2.53% | | | | 2.41% | | | | 2.40% | | | | 2.31% | |
| Expenses, excluding distribution and service (12b-1) fees | | | 1.54% | | | | 1.53% | | | | 1.41% | | | | 1.40% | | | | 1.31% | |
| Net investment income | | | .83% | | | | .81% | | | | .42% | | | | .58% | | | | 1.04% | |
| Portfolio turnover rate | | | 16% | | | | 25% | | | | 40% | | | | 40% | | | | 27% | |
(a) Total return is calculated assuming a purchase of a share on the first day and a sale on the last day of each year reported and includes reinvestment of dividends and distributions. Total returns may reflect adjustments to conform to generally accepted accounting principles.
(b) Calculations are based on the average daily number of shares outstanding.
(c) Does not include expenses of the underlying portfolio in which the Series invests.
(d) The Fund received payments related to a former affiliate’s settlement of regulatory proceedings involving allegations of improper trading in Fund shares during the fiscal year ended October 31, 2010. The Fund was not involved in the proceedings or in the calculations of the amount of settlement.
See Notes to Financial Statements.
| | | | |
| Prudential International Value Fund | | | 43 | |
Financial Highlights
continued
| | | | | | | | | | | | | | | | | | | | |
| Class Z Shares | |
| | | Year Ended October 31, | |
| | | 2012(b) | | | 2011(b) | | | 2010(b) | | | 2009(b) | | | 2008(b) | |
| Per Share Operating Performance: | | | | | | | | | | | | | | | | | | | | |
| Net Asset Value, Beginning of Year | | | $18.93 | | | | $20.42 | | | | $18.55 | | | | $15.37 | | | | $34.30 | |
| Income (loss) from investment operations: | | | | | | | | | | | | | | | | | | | | |
| Net investment income | | | .34 | | | | .24 | | | | .26 | | | | .24 | | | | .50 | |
| Net realized and unrealized gain (loss) on investments | | | .56 | | | | (1.51 | ) | | | 1.74 | | | | 3.62 | | | | (15.02 | ) |
| Total from investment operations | | | .90 | | | | (1.27 | ) | | | 2.00 | | | | 3.86 | | | | (14.52 | ) |
| Less Dividends and Distributions: | | | | | | | | | | | | | | | | | | | | |
| Dividends from net investment income | | | (.35 | ) | | | (.22 | ) | | | (.16 | ) | | | (.68 | ) | | | (.46 | ) |
| Distributions from net realized gains | | | - | | | | - | | | | - | | | | - | | | | (3.95 | ) |
| Total dividends and distributions | | | (.35 | ) | | | (.22 | ) | | | (.16 | ) | | | (.68 | ) | | | (4.41 | ) |
| Capital Contributions(d) | | | - | | | | - | | | | .03 | | | | - | | | | - | |
| Net asset value, end of year | | | $19.48 | | | | $18.93 | | | | $20.42 | | | | $18.55 | | | | $15.37 | |
| Total Return(a): | | | 4.92% | | | | (6.30)% | | | | 11.01% | | | | 26.41% | | | | (48.23)% | |
| |
| Ratios/Supplemental Data: | |
| Net assets, end of year (000) | | | $56,753 | | | | $52,086 | | | | $159,020 | | | | $136,238 | | | | $115,710 | |
| Average net assets (000) | | | $53,465 | | | | $79,550 | | | | $139,023 | | | | $115,310 | | | | $186,380 | |
| Ratios to average net assets(c): | | | | | | | | | | | | | | | | | | | | |
| Expenses, including distribution and service (12b-1) fees | | | 1.54% | | | | 1.47% | | | | 1.41% | | | | 1.40% | | | | 1.31% | |
| Expenses, excluding distribution and service (12b-1) fees | | | 1.54% | | | | 1.47% | | | | 1.41% | | | | 1.40% | | | | 1.31% | |
| Net investment income | | | 1.86% | | | | 1.16% | | | | 1.41% | | | | 1.58% | | | | 2.06% | |
| Portfolio turnover rate | | | 16% | | | | 25% | | | | 40% | | | | 40% | | | | 27% | |
(a) Total return is calculated assuming a purchase of a share on the first day and a sale on the last day of each year reported and includes reinvestment of dividends and distributions. Total returns may reflect adjustments to conform to generally accepted accounting principles.
(b) Calculations are based on the average daily number of shares outstanding.
(c) Does not include expenses of the underlying portfolio in which the Series invests.
(d) The Fund received payments related to a former affiliate’s settlement of regulatory proceedings involving allegations of improper trading in Fund shares during the fiscal year ended October 31, 2010. The Fund was not involved in the proceedings or in the calculations of the amount of settlement.
See Notes to Financial Statements.
| | |
| 44 | | Visit our website at www.prudentialfunds.com |
Report of Independent Registered Public
Accounting Firm
The Board of Directors and Shareholders
Prudential World Fund, Inc.:
We have audited the accompanying statement of assets and liabilities of Prudential International Value Fund (one of the series constituting Prudential World Fund, Inc., hereafter referred to as the “Fund”), including the portfolio of investments, as of October 31, 2012, and the related statement of operations for the year then ended, the statement of changes in net assets for each of the years in the two-year period then ended and the financial highlights for each of the years in the five-year period then ended. These financial statements and financial highlights are the responsibility of the Fund’s management. Our responsibility is to express an opinion on these financial statements and financial highlights based on our audits.
We conducted our audits in accordance with the standards of the Public Company Accounting Oversight Board (United States). Those standards require that we plan and perform the audit to obtain reasonable assurance about whether the financial statements and financial highlights are free of material misstatement. An audit includes examining, on a test basis, evidence supporting the amounts and disclosures in the financial statements. Our procedures included confirmation of securities owned as of October 31, 2012, by correspondence with the custodian, transfer agent and brokers or by other appropriate auditing procedures when replies from brokers were not received. An audit also includes assessing the accounting principles used and significant estimates made by management, as well as evaluating the overall financial statement presentation. We believe that our audits provide a reasonable basis for our opinion.
In our opinion, the financial statements and financial highlights referred to above present fairly, in all material respects, the financial position of the Fund as of October 31, 2012, and the results of its operations for the year then ended, the changes in its net assets for each of the years in the two-year period then ended and the financial highlights for each of the years in the five-year period then ended, in conformity with U.S. generally accepted accounting principles.

New York, New York
December 21, 2012
| | | | |
| Prudential International Value Fund | | | 45 | |
Tax Information
(Unaudited)
For the year ended October 31, 2012, the Series reports 100% of the ordinary income dividends paid during the year as qualified dividend income in accordance with Section 854 of the Internal Revenue Code.
For the fiscal year ended October 31, 2012, the Series made an election to pass through the maximum amount of the portion of the ordinary income dividends paid derived from foreign source income as well as any foreign taxes paid by the Series in accordance with Section 853 of the Internal Revenue Code of the following amounts: $218,325 foreign tax credit from recognized foreign source income of $3,460,494.
In January 2013, you will be advised on IRS Form 1099-DIV or substitute 1099-DIV as to the federal tax status of distributions received by you in calendar year 2012.
| | |
| 46 | | Visit our website at www.prudentialfunds.com |
INFORMATION ABOUT BOARD MEMBERS AND OFFICERS
(Unaudited)
Information about Board Members and Officers of the Fund is set forth below. Board Members who are not deemed to be “interested persons” of the Fund, as defined in the 1940 Act, are referred to as “Independent Board Members.” Board Members who are deemed to be “interested persons” of the Fund are referred to as “Interested Board Members.” The Board Members are responsible for the overall supervision of the operations of the Fund and perform the various duties imposed on the directors of investment companies by the 1940 Act. The Board in turn elects the Officers, who are responsible for administering the day-to-day operations of the Fund.
| | | | |
| Independent Board Members(1) |
Name, Address, Age Position(s) Portfolios Overseen | | Principal Occupation(s) During Past Five Years | | Other Directorships Held |
Kevin J. Bannon (60) Board Member Portfolios Overseen: 63 | | Managing Director (since April 2008) and Chief Investment Officer (since October 2008) of Highmount Capital LLC (registered investment adviser); formerly Executive Vice President and Chief Investment Officer (April 1993-August 2007) of Bank of New York Company; President (May 2003-May 2007) of BNY Hamilton Family of Mutual Funds. | | Director of Urstadt Biddle Properties (since September 2008). |
Linda W. Bynoe (60) Board Member Portfolios Overseen: 63 | | President and Chief Executive Officer (since March 1995) and formerly Chief Operating Officer (December 1989-February 1995) of Telemat Ltd. (management consulting); formerly Vice President (January 1985-June 1989) at Morgan Stanley & Co (broker-dealer). | | Director of Simon Property Group, Inc. (retail real estate) (May 2003-May 2012); Director of Anixter International, Inc. (communication products distributor) (since January 2006); Director of Northern Trust Corporation (financial services) (since April 2006); Trustee of Equity Residential (residential real estate) (since December 2009). |
Michael S. Hyland, CFA (67) Board Member Portfolios Overseen: 63 | | Independent Consultant (since February 2005); formerly Senior Managing Director (July 2001-February 2005) of Bear Stearns & Co, Inc.; Global Partner, INVESCO (1999-2001); Managing Director and President of Salomon Brothers Asset Management (1989-1999). | | None. |
Douglas H. McCorkindale (73) Board Member Portfolios Overseen: 63 | | Formerly Chairman (February 2001-June 2006), Chief Executive Officer (June 2000-July 2005), President (September 1997-July 2005) and Vice Chairman (March 1984-May 2000) of Gannett Co. Inc. (publishing and media). | | Director of Lockheed Martin Corp. (aerospace and defense) (since May 2001). |
Visit our website at www.prudentialfunds.com
| | | | |
| Independent Board Members(1) |
Name, Address, Age Position(s) Portfolios Overseen | | Principal Occupation(s) During Past Five Years | | Other Directorships Held |
Stephen P. Munn (70) Board Member Portfolios Overseen: 63 | | Lead Director (since 2007) and formerly Chairman (1993-2007) of Carlisle Companies Incorporated (manufacturer of industrial products). | | Lead Director (since 2007) of Carlisle Companies Incorporated (manufacturer of industrial products). |
Richard A. Redeker (69) Board Member & Independent Chair Portfolios Overseen: 63 | | Retired Mutual Fund Senior Executive (44 years); Management Consultant; Independent Directors Council (organization of 2,800 Independent Mutual Fund Directors)-Executive Committee, Chair of Policy Steering Committee, Governing Council. | | None. |
Robin B. Smith (73) Board Member Portfolios Overseen: 63 | | Chairman of the Board (since January 2003) of Publishers Clearing House (direct marketing); Member of the Board of Directors of ADLPartner (marketing) (since December 2010); formerly Chairman and Chief Executive Officer (August 1996-January 2003) of Publishers Clearing House. | | Formerly Director of BellSouth Corporation (telecommunications) (1992-2006). |
Stephen G. Stoneburn (69) Board Member Portfolios Overseen: 63 | | Chairman, (since July 2011), President and Chief Executive Officer (since June 1996) of Quadrant Media Corp. (publishing company); formerly President (June 1995-June 1996) of Argus Integrated Media, Inc.; Senior Vice President and Managing Director (January 1993-1995) of Cowles Business Media; Senior Vice President of Fairchild Publications, Inc. (1975-1989). | | None. |
| | | | |
| Interested Board Members(1) |
Name, Address, Age Position(s) Portfolios Overseen | | Principal Occupation(s) During Past Five Years | | Other Directorships Held |
Stuart S. Parker (50) Board Member & President Portfolios Overseen: 63 | | President of Prudential Investments LLC (since January 2012); Executive Vice President of Jennison Associates LLC and Head of Retail Distribution of Prudential Investments LLC (June 2005 - December 2011). | | None. |
Prudential International Value Fund
| | | | |
| Interested Board Members(1) |
Name, Address, Age Position(s) Portfolios Overseen | | Principal Occupation(s) During Past Five Years | | Other Directorships Held |
Scott E. Benjamin (39) Board Member & Vice President Portfolios Overseen: 63 | | Executive Vice President (since June 2009) of Prudential Investments LLC; Executive Vice President (June 2009-June 2012) and Vice President (since June 2012) of Prudential Investment Management Services LLC; Executive Vice President (since September 2009) of AST Investment Services, Inc.; Senior Vice President of Product Development and Marketing, Prudential Investments (since February 2006); Vice President of Product Development and Product Management, Prudential Investments (2003-2006). | | None. |
(1) The year that each Board Member joined the Funds’ Board is as follows:
Kevin J. Bannon, 2008; Linda W. Bynoe, 2005; Michael S. Hyland, 2008; Douglas H. McCorkindale, 2003; Stephen P. Munn, 2008; Richard A. Redeker, 2003; Robin B. Smith, 1996; Stephen G. Stoneburn, 1996; Stuart S. Parker, Board Member and President since 2012; Scott E. Benjamin, Board Member since 2010 and Vice President since 2009.
| | |
| Fund Officers(a)(1) |
Name, Address and Age Position with Fund | | Principal Occupation(s) During Past Five Years |
Judy A. Rice (64) Vice President | | Chairman of Prudential Investments LLC (since January 2012); President, Chief Executive Officer (May 2011-Present) and Executive Vice President (December 2008-May 2011) of Prudential Investment Management Services LLC; formerly President, Chief Executive Officer, Chief Operating Officer and Officer-In-Charge (February 2003-December 2011) of Prudential Investments LLC; formerly President, Chief Executive Officer and Officer-In-Charge (April 2003-December 2011) of Prudential Mutual Fund Services LLC (PMFS); formerly Member of the Board of Directors of Jennison Associates LLC (November 2010-December 2011); formerly Vice President (February 1999-April 2006) of Prudential Investment Management Services LLC; formerly President, COO, CEO and Manager of PIFM Holdco, LLC (April 2006-December 2011); formerly President, Chief Executive Officer, Chief Operating Officer and Officer-In-Charge (May 2003-June 2005) and Director (May 2003-March 2006) and Executive Vice President (June 2005-March 2006) of AST Investment Services, Inc.; Member of Board of Governors of the Investment Company Institute. |
Visit our website at www.prudentialfunds.com
| | |
| Fund Officers(a)(1) |
Name, Address and Age Position with Fund | | Principal Occupation(s) During Past Five Years |
Raymond A. O’Hara (57) Chief Legal Officer | | Vice President and Corporate Counsel (since July 2010) of Prudential Insurance Company of America (Prudential); Vice President (March 2011-Present) of Pruco Life Insurance Company and Pruco Life Insurance Company of New Jersey; Vice President and Corporate Counsel (March 2011-Present) of Prudential Annuities Life Assurance Corporation; Chief Legal Officer of Prudential Investments LLC (since June 2012); Chief Legal Officer of PMFS (since June 2012) and Corporate Counsel of AST Investment Services, Inc. (since June 2012); formerly Assistant Vice President and Corporate Counsel (September 2008-July 2010) of The Hartford Financial Services Group, Inc.; formerly Associate (September 1980-December 1987) and Partner (January 1988–August 2008) of Blazzard & Hasenauer, P.C. (formerly, Blazzard, Grodd & Hasenauer, P.C.). |
Deborah A. Docs (54) Secretary | | Vice President and Corporate Counsel (since January 2001) of Prudential; Vice President (since December 1996) and Assistant Secretary (since March 1999) of Prudential Investments LLC; formerly Vice President and Assistant Secretary (May 2003-June 2005) of AST Investment Services, Inc. |
Jonathan D. Shain (54) Assistant Secretary | | Vice President and Corporate Counsel (since August 1998) of Prudential; Vice President and Assistant Secretary (since May 2001) of Prudential Investments LLC; Vice President and Assistant Secretary (since February 2001) of PMFS; formerly Vice President and Assistant Secretary (May 2003-June 2005) of AST Investment Services, Inc. |
Claudia DiGiacomo (38) Assistant Secretary | | Vice President and Corporate Counsel (since January 2005) of Prudential; Vice President and Assistant Secretary of Prudential Investments LLC (since December 2005); Associate at Sidley Austin Brown & Wood LLP (1999-2004). |
Andrew R. French (50) Assistant Secretary | | Vice President and Corporate Counsel (since February 2010) of Prudential; formerly Director and Corporate Counsel (2006-2010) of Prudential; Vice President and Assistant Secretary (since January 2007) of Prudential Investments LLC; Vice President and Assistant Secretary (since January 2007) of PMFS. |
Amanda S. Ryan (34) Assistant Secretary | | Director and Corporate Counsel (since March 2012) of Prudential; Director and Assistant Secretary (since June 2012) of Prudential Investments LLC; Associate at Ropes & Gray (2008-2012). |
Timothy J. Knierim (53) Chief Compliance Officer | | Chief Compliance Officer of Prudential Investment Management, Inc. (since July 2007); formerly Chief Risk Officer of Prudential Investment Management, Inc. and Prudential Investments LLC (2002-2007) and formerly Chief Ethics Officer of Prudential Investment Management, Inc. and Prudential Investments LLC (2006-2007). |
Valerie M. Simpson (54) Deputy Chief Compliance Officer | | Chief Compliance Officer (since April 2007) of Prudential Investments LLC and AST Investment Services, Inc.; formerly Vice President-Financial Reporting (June 1999-March 2006) for Prudential Life and Annuities Finance. |
Prudential International Value Fund
| | |
| Fund Officers(a)(1) | | |
Name, Address and Age Position with Fund | | Principal Occupation(s) During Past Five Years |
Theresa C. Thompson (50) Deputy Chief Compliance Officer | | Vice President, Compliance, Prudential Investments LLC (since April 2004); and Director, Compliance, Prudential Investments LLC (2001-2004). |
Richard W. Kinville (44) Anti-Money Laundering Compliance Officer | | Vice President, Corporate Compliance, Anti-Money Laundering Unit (since January 2005) of Prudential; committee member of the American Council of Life Insurers Anti-Money Laundering and Critical Infrastructure Committee (since January 2007); formerly Investigator and Supervisor in the Special Investigations Unit for the New York Central Mutual Fire Insurance Company (August 1994-January 1999); Investigator in AXA Financial’s Internal Audit Department and Manager in AXA’s Anti-Money Laundering Office (January 1999-January 2005); first chair of the American Council of Life Insurers Anti-Money Laundering and Critical Infrastructure Committee (June 2007-December 2009). |
Grace C. Torres (53) Treasurer and Principal Financial and Accounting Officer | | Assistant Treasurer (since March 1999) and Senior Vice President (since September 1999) of Prudential Investments LLC; Assistant Treasurer (since May 2003) and Vice President (since June 2005) of AST Investment Services, Inc.; Senior Vice President and Assistant Treasurer (since May 2003) of Prudential Annuities Advisory Services, Inc.; formerly Senior Vice President (May 2003-June 2005) of AST Investment Services, Inc. |
M. Sadiq Peshimam (48) Assistant Treasurer | | Vice President (since 2005) of Prudential Investments LLC. |
Peter Parrella (54) Assistant Treasurer | | Vice President (since 2007) and Director (2004-2007) within Prudential Mutual Fund Administration; formerly Tax Manager at SSB Citi Fund Management LLC (1997-2004). |
(a) Excludes Mr. Parker and Mr. Benjamin, interested Board Members who also serve as President and Vice President, respectively.
(1) The year that each individual became an officer of the Fund is as follows:
Judy A. Rice, 2012; Raymond A. O’Hara, 2012; Deborah A. Docs, 2005; Jonathan D. Shain, 2005; Claudia DiGiacomo, 2005; Andrew R. French, 2006; Amanda S. Ryan, 2012; Timothy J. Knierim, 2007; Valerie M. Simpson, 2007; Theresa C. Thompson, 2008; Richard W. Kinville, 2011; Grace C. Torres, 1995; Sadiq Peshimam, 2006; Peter Parrella, 2007.
Explanatory Notes to Tables:
| | n | Board Members are deemed to be “Interested,” as defined in the 1940 Act, by reason of their affiliation with Prudential Investments LLC and/or an affiliate of Prudential Investments LLC. |
| | n | Unless otherwise noted, the address of all Board Members and Officers is c/o Prudential Investments LLC, Gateway Center Three, 100 Mulberry Street, Newark, New Jersey 07102-4077. |
| | n | There is no set term of office for Board Members or Officers. The Board Members have adopted a retirement policy, which calls for the retirement of Board Members on December 31 of the year in which they reach the age of 75. |
| | n | “Other Directorships Held” includes only directorships of companies required to register or file reports with the SEC under the 1934 Act (that is, “public companies”) or other investment companies registered under the 1940 Act. |
| | n | “Portfolios Overseen” includes all investment companies managed by Prudential Investments LLC. The investment companies for which PI serves as manager include the Prudential Investments Mutual Funds, The Prudential Variable Contract Accounts, Target Mutual Funds, Prudential Short Duration High Yield Fund, Inc., The Prudential Series Fund, Prudential’s Gibraltar Fund, Inc. and the Advanced Series Trust. |
Visit our website at www.prudentialfunds.com
Approval of Advisory Agreements
The Fund’s Board of Directors
The Board of Directors (the “Board”) of Prudential International Value Fund (the “Fund”)1 consists of ten individuals, eight of whom are not “interested persons” of the Fund, as defined in the Investment Company Act of 1940, as amended (the “1940 Act”) (the “Independent Directors”). The Board is responsible for the oversight of the Fund and its operations, and performs the various duties imposed on the directors of investment companies by the 1940 Act. The Independent Directors have retained independent legal counsel to assist them in connection with their duties. The Chair of the Board is an Independent Director. The Board has established three standing committees: the Audit Committee, the Nominating and Governance Committee, and the Investment Committee. Each committee is chaired by, and composed of, Independent Directors.
Annual Approval of the Fund’s Advisory Agreements
As required under the 1940 Act, the Board determines annually whether to renew the Fund’s management agreement with Prudential Investments LLC (“PI”) and the Fund’s subadvisory agreements with each of LSV Asset Management (“LSV”) and Thornburg Investment Management, Inc. (“Thornburg”). In considering the renewal of the agreements, the Board, including all of the Independent Directors, met on June 5-7, 2012 and approved the renewal of the agreements through July 31, 2013, after concluding that the renewal of the agreements was in the best interests of the Fund and its shareholders.
In advance of the meetings, the Board requested and received materials relating to the agreements, and had the opportunity to ask questions and request further information in connection with its consideration. Among other things, the Board considered comparative fee information from PI, LSV and Thornburg. Also, the Board considered comparisons with other mutual funds in relevant Peer Universes and Peer Groups, as is further discussed below.
In approving the agreements, the Board, including the Independent Directors advised by independent legal counsel, considered the factors it deemed relevant, including the nature, quality and extent of services provided by PI and each subadviser, the performance of the Fund, the profitability of PI and its affiliates, expenses and fees, and the potential for economies of scale that may be shared with the Fund and its shareholders as the Fund’s assets grow. In their deliberations, the Directors did not identify any single factor which alone was responsible for the Board’s decision to approve the agreements with respect to the Fund. In connection with its deliberations, the Board considered information provided by PI throughout the year at regular Board
| 1 | Prudential International Value Fund is a series of Prudential World Fund, Inc. |
Prudential International Value Fund
Approval of Advisory Agreements (continued)
meetings, presentations from portfolio managers and other information, as well as information furnished at or in advance of the meetings on June 5-7, 2012.
The Directors determined that the overall arrangements between the Fund and PI, which serves as the Fund’s investment manager pursuant to a management agreement, and between PI and each of LSV and Thornburg, which serve as the Fund’s subadvisers pursuant to the terms of subadvisory agreements with PI, are in the best interests of the Fund and its shareholders in light of the services performed, fees charged and such other matters as the Directors considered relevant in the exercise of their business judgment.
The material factors and conclusions that formed the basis for the Directors’ reaching their determinations to approve the continuance of the agreements are separately discussed below.
Nature, Quality and Extent of Services
The Board received and considered information regarding the nature, quality and extent of services provided to the Fund by PI, LSV and Thornburg. The Board considered the services provided by PI, including but not limited to the oversight of the subadvisers for the Fund, as well as the provision of fund recordkeeping, compliance, and other services to the Fund. With respect to PI’s oversight of the subadvisers, the Board noted that PI’s Strategic Investment Research Group (“SIRG”), which is a business unit of PI, is responsible for screening and recommending new subadvisers when appropriate, as well as monitoring and reporting to the Board on the performance and operations of the subadvisers. The Board also considered that PI pays the salaries of all of the officers and non-independent Directors of the Fund. The Board also considered the investment subadvisory services provided by LSV and Thornburg, as well as adherence to the Fund’s investment restrictions and compliance with applicable Fund policies and procedures. The Board considered PI’s evaluations of the subadvisers, as well as PI’s recommendation, based on its review of each subadviser, to renew the subadvisory agreements.
The Board reviewed the qualifications, backgrounds and responsibilities of PI’s senior management responsible for the oversight of the Fund, LSV and Thornburg, and also reviewed the qualifications, backgrounds and responsibilities of the LSV and Thornburg portfolio managers who are responsible for the day-to-day management of the Fund’s portfolio. The Board was provided with information pertaining to PI’s, LSV’s and Thornburg’s organizational structure, senior management, investment operations, and other relevant information pertaining to PI, LSV and Thornburg. The Board also noted that it received favorable compliance reports from the Fund’s Chief Compliance Officer (“CCO”) as to each of PI, LSV and Thornburg.
Visit our website at www.prudentialfunds.com
The Board concluded that it was satisfied with the nature, extent and quality of the investment management services provided by PI and the subadvisory services provided to the Fund by LSV and Thornburg, and that there was a reasonable basis on which to conclude that the Fund benefits from the services provided by PI, LSV and Thornburg under the management and subadvisory agreements.
Costs of Services and Profits Realized by PI
The Board was provided with information on the profitability of PI and its affiliates in serving as the Fund’s investment manager. The Board discussed with PI the methodology utilized in assembling the information regarding profitability and considered its reasonableness. The Board recognized that it is difficult to make comparisons of profitability from fund management contracts because comparative information is not generally publicly available and is affected by numerous factors, including the structure of the particular adviser, the types of funds it manages, its business mix, numerous assumptions regarding allocations and the adviser’s capital structure and cost of capital. Taking these factors into account, the Board concluded that the profitability of PI and its affiliates in relation to the services rendered was not unreasonable.
The Board considered information about the profitability of LSV or Thornburg, but concluded that the level of a subadviser’s profitability may not be as significant given the arm’s length nature of the process by which the subadvisory fee rates were negotiated by PI, LSV and Thornburg as well as the fact that PI compensates the subadvisers out of its management fee.
Economies of Scale
The Board received and discussed information concerning whether PI realizes economies of scale as the Fund’s assets grow beyond current levels. The Board noted that the management fee schedule for the Fund includes breakpoints, which have the effect of decreasing the fee rate as assets increase, but at the current level of assets the Fund does not realize the effect of those rate reductions. The Board took note that the Fund’s fee structure would result in benefits to Fund shareholders when (and if) assets reach the levels at which the fee rate is reduced. These benefits will accrue whether or not PI is then realizing any economies of scale. The Board also recognized the inherent limitations of any analysis of economies of scale, stemming largely from the Board’s understanding that most of PI’s costs are not specific to individual funds, but rather are incurred across a variety of products and services
Other Benefits to PI, LSV and Thornburg
The Board considered potential ancillary benefits that might be received by PI, LSV and Thornburg and their affiliates as a result of their relationship with the Fund. The
Prudential International Value Fund
Approval of Advisory Agreements (continued)
Board concluded that potential benefits to be derived by PI included fees received by affiliates of PI for serving as the Fund’s securities lending agent, transfer agency fees received by the Fund’s transfer agent (which is affiliated with PI), and benefits to its reputation as well as other intangible benefits resulting from PI’s association with the Fund. The Board concluded that the potential benefits to be derived by LSV and Thornburg included their ability to use soft dollar credits, brokerage commissions received by affiliates of LSV or Thornburg, as well as the potential benefits consistent with those generally resulting from an increase in assets under management, specifically, potential access to additional research resources and benefits to their reputations. The Board concluded that the benefits derived by PI, LSV and Thornburg were consistent with the types of benefits generally derived by investment managers and subadvisers to mutual funds.
Performance of the Fund / Fees and Expenses
The Board considered certain additional specific factors and made related conclusions relating to the historical performance of the Fund for the one-, three-, five- and ten-year periods ended December 31, 2011.
The Board also considered the Fund’s actual management fee, as well as the Fund’s net total expense ratio, for the fiscal year ended October 31, 2011. The Board considered the management fee for the Fund as compared to the management fee charged by PI to other funds and the fee charged by other advisers to comparable mutual funds in a Peer Group. The actual management fee represents the fee rate actually paid by Fund shareholders and includes any fee waivers or reimbursements. The net total expense ratio for the Fund represents the actual expense ratio incurred by Fund shareholders.
The mutual funds included in the Peer Universe (a blend of the Lipper International Large-Cap Core Funds and International Multi-Cap Core Funds Performance Universes)2 and the Peer Group were objectively determined by Lipper Inc. (“Lipper”), an independent provider of mutual fund data. To the extent that PI deemed appropriate, and for reasons addressed in detail with the Board, PI may have provided supplemental data compiled by Lipper for the Board’s consideration. The comparisons placed the Fund in various quartiles, with the first quartile being the best
| 2 | Although Lipper classifies the Fund in its International Large-Cap Core Funds Performance Universe, the International Large-Cap Core Funds and International Multi-Cap Core Funds Performance Universes were utilized because PI believes that the funds included in these Universes provide a more appropriate basis for Fund performance comparisons. |
| Note: | | Lipper has since changed the Fund’s classification and now classifies the Fund in the International Multi-Cap Core Funds Performance Universe. |
Visit our website at www.prudentialfunds.com
25% of the mutual funds (for performance, the best performing mutual funds and, for expenses, the lowest cost mutual funds).
The section below summarizes key factors considered by the Board and the Board’s conclusions regarding the Fund’s performance, fees and overall expenses. The table sets forth gross performance comparisons (which do not reflect the impact on performance of fund expenses, or any subsidies, expense caps or waivers that may be applicable) with the Peer Universe, actual management fees with the Peer Group (which reflect the impact of any subsidies or fee waivers), and net total expenses with the Peer Group, each of which were key factors considered by the Board.
| | | | | | | | |
| Performance | | 1 Year | | 3 Years | | 5 Years | | 10 Years |
| | | 2nd Quartile | | 2nd Quartile | | 2nd Quartile | | 3rd Quartile |
| Actual Management Fees: 2nd Quartile |
| Net Total Expenses: 4th Quartile |
| | • | | The Board noted that the Fund outperformed its benchmark index over all periods. |
| | • | | The Board concluded that, in light of the Fund’s competitive performance, it would be in the best interests of the Fund and its shareholders to renew the agreements. |
| | • | | The Board concluded that the management fees (including subadvisory fees) and total expenses were reasonable in light of the services provided. |
* * *
After full consideration of these factors, the Board concluded that approval of the agreements was in the best interests of the Fund and its shareholders.
Prudential International Value Fund
| | | | |
| n MAIL | | n TELEPHONE | | n WEBSITE |
Gateway Center Three 100 Mulberry Street Newark, NJ 07102 | | (800) 225-1852 | | www.prudentialfunds.com |
|
| PROXY VOTING |
| The Board of Directors of the Fund has delegated to the Fund’s investment subadvisers the responsibility for voting any proxies and maintaining proxy recordkeeping with respect to the Fund. A description of these proxy voting policies and procedures is available without charge, upon request, by calling (800) 225-1852 or by visiting the Securities and Exchange Commission’s website at www.sec.gov. Information regarding how the Fund voted proxies relating to portfolio securities during the most recent 12-month period ended June 30 is available on the Fund’s website and on the Securities and Exchange Commission’s website. |
|
| DIRECTORS |
Kevin J. Bannon • Scott E. Benjamin • Linda W. Bynoe • Michael S. Hyland •
Douglas H. McCorkindale • Stephen P. Munn • Stuart S. Parker • Richard A. Redeker •
Robin B. Smith • Stephen G. Stoneburn |
|
| OFFICERS |
| Stuart S. Parker, President • Judy A. Rice, Vice President • Scott E. Benjamin, Vice President • Grace C. Torres, Treasurer and Principal Financial and Accounting Officer • Raymond A. O’Hara, Chief Legal Officer • Deborah A. Docs, Secretary • Timothy J. Knierim, Chief Compliance Officer • Valerie M. Simpson, Deputy Chief Compliance Officer • Theresa C. Thompson, Deputy Chief Compliance Officer • Richard W. Kinville, Anti-Money Laundering Compliance Officer • Jonathan D. Shain, Assistant Secretary • Claudia DiGiacomo, Assistant Secretary • Amanda S. Ryan, Assistant Secretary • Andrew R. French, Assistant Secretary • M. Sadiq Peshimam, Assistant Treasurer • Peter Parrella, Assistant Treasurer |
| | | | |
| MANAGER | | Prudential Investments LLC | | Gateway Center Three
100 Mulberry Street
Newark, NJ 07102 |
|
| INVESTMENT SUBADVISERS | | LSV Asset Management
| | 155 North Wacker Drive
46th Floor Chicago, IL 60606 |
|
| | Thornburg Investment
Management, Inc. | | 2300 North Ridgetop Road
Santa Fe, NM 87506 |
|
| DISTRIBUTOR | | Prudential Investment
Management Services LLC | | Gateway Center Three
100 Mulberry Street
Newark, NJ 07102 |
|
| CUSTODIAN | | The Bank of New York Mellon | | One Wall Street
New York, NY 10286 |
|
| TRANSFER AGENT | | Prudential Mutual Fund
Services LLC | | PO Box 9658
Providence, RI 02940 |
|
| INDEPENDENT REGISTERED PUBLIC ACCOUNTING FIRM | | KPMG LLP | | 345 Park Avenue
New York, NY 10154 |
|
| FUND COUNSEL | | Willkie Farr & Gallagher LLP | | 787 Seventh Avenue
New York, NY 10019 |
|
| An investor should consider the investment objectives, risks, charges, and expenses of the Fund carefully before investing. The prospectus and summary prospectus contain this and other information about the Fund. An investor may obtain a prospectus and summary prospectus by visiting our website at www.prudentialfunds.com or by calling (800) 225-1852. The prospectus and summary prospectus should be read carefully before investing. |
|
| E-DELIVERY |
| To receive your mutual fund documents online, go to www.prudentialfunds.com/edelivery and enroll. Instead of receiving printed documents by mail, you will receive notification via email when new materials are available. You can cancel your enrollment or change your email address at any time by visiting the website address above. |
|
| SHAREHOLDER COMMUNICATIONS WITH DIRECTORS |
| Shareholders can communicate directly with the Board of Directors by writing to the Chair of the Board, Prudential International Value Fund, Prudential Investments, Attn: Board of Directors, 100 Mulberry Street, Gateway Center Three, Newark, NJ 07102. Shareholders can communicate directly with an individual Director by writing to the same address. Communications are not screened before being delivered to the addressee. |
|
| AVAILABILITY OF PORTFOLIO SCHEDULE |
| The Fund files its complete schedule of portfolio holdings with the Securities and Exchange Commission for the first and third quarters of each fiscal year on Form N-Q. The Fund’s Forms N-Q are available on the Commission’s website at www.sec.gov. The Fund’s Forms N-Q may also be reviewed and copied at the Commission’s Public Reference Room in Washington, D.C. Information on the operation and location of the Public Reference Room may be obtained by calling (202) 551-8090. The Fund’s schedule of portfolio holdings is also available on the Fund’s website as of the end of each month. |
|
| The Fund’s Statement of Additional Information contains additional information about the Fund’s Directors and is available without charge, upon request, by calling (800) 225-1852. |
Mutual Funds:
| | | | |
| ARE NOT INSURED BY THE FDIC OR ANY FEDERAL GOVERNMENT AGENCY | | MAY LOSE VALUE | | ARE NOT A DEPOSIT OF OR GUARANTEED BY ANY BANK OR ANY BANK AFFILIATE |

PRUDENTIAL INTERNATIONAL VALUE FUND
| | | | | | | | |
| SHARE CLASS | | A | | B | | C | | Z |
| NASDAQ | | PISAX | | PISBX | | PCISX | | PISZX |
| CUSIP | | 743969503 | | 743969602 | | 743969701 | | 743969800 |
MF115E 0236586-00001-00

PRUDENTIAL INVESTMENTS»MUTUAL FUNDS
PRUDENTIAL EMERGING MARKETS DEBT LOCAL CURRENCY FUND
ANNUAL REPORT · OCTOBER 31, 2012
Fund Type
Emerging Market Bond
Objective
Total return, through a combination of current income and capital appreciation
This report is not authorized for distribution to prospective investors unless preceded or accompanied by a current prospectus.
The views expressed in this report and information about the Fund’s portfolio holdings are for the period covered by this report and are subject to change thereafter.
Prudential Investments, Prudential, the Prudential logo, the Rock symbol, and Bring Your Challenges are service marks of Prudential Financial, Inc. and its related entities, registered in many jurisdictions worldwide.

December 14, 2012
Dear Shareholder:
We hope you find the annual report for the Prudential Emerging Markets Debt Local Currency Fund informative and useful. The report covers performance for the 12-month period that ended October 31, 2012.
We recognize that ongoing market volatility may make it a difficult time to be an investor. We continue to believe a prudent response to uncertainty is to maintain a diversified portfolio of funds consistent with your tolerance for risk, time horizon, and financial goals.
Your financial advisor can help you create a diversified investment plan that may include funds covering all the basic asset classes and that reflects your personal investor profile and risk tolerance. Keep in mind, however, that diversification and asset allocation strategies do not assure a profit or protect against loss in declining markets.
Prudential Investments® is dedicated to helping you solve your toughest investment challenges—whether it’s capital growth, reliable income, or protection from market volatility and other risks. We offer the expertise of Prudential Financial’s affiliated asset managers* that strive to be leaders in a broad range of funds to help you stay on course to the future you envision. They also manage money for major corporations and pension funds around the world, which means you benefit from the same expertise, innovation, and attention to risk demanded by today’s most sophisticated investors.
Thank you for choosing the Prudential Investments family of funds.
Sincerely,

Stuart S. Parker, President
Prudential Emerging Markets Debt Local Currency Fund
*Most of Prudential Investments’ equity funds are advised by Jennison Associates LLC, Quantitative Management Associates LLC (QMA), or Prudential Real Estate Investors. Prudential Investments’ fixed income and money market funds are advised by Prudential Investment Management, Inc. (PIM) through its Prudential Fixed Income unit. Jennison Associates, QMA, and PIM are registered investment advisers and Prudential Financial companies. Prudential Real Estate Investors is a unit of PIM.
| | | | |
| Prudential Emerging Markets Debt Local Currency Fund | | | 1 | |
Your Fund’s Performance
Performance data quoted represent past performance. Past performance does not guarantee future results. The investment return and principal value of an investment will fluctuate, so that an investor’s shares, when redeemed, may be worth more or less than their original cost. Current performance may be lower or higher than the past performance data quoted. An investor may obtain performance data as of the most recent month-end by visiting our website at www.prudentialfunds.com or by calling (800) 225-1852. Class A shares have a maximum initial sales charge of 4.50%. Gross operating expenses: Class A, 2.09%; Class C, 2.78%; Class Q, 1.71%; Class Z, 1.81%. Net operating expenses: Class A, 1.30%; Class C, 2.05%; Class Q, 1.05%; Class Z, 1.05%, after contractual reduction through 2/28/2014.
| | | | | | | | |
Cumulative Total Returns (Without Sales Charges) as of 10/31/12 |
| | | | | One Year | | | Since Inception |
Class A | | | | | 8.53 | % | | 5.12% (3/30/2011) |
Class C | | | | | 7.55 | | | 4.63 (3/30/2011) |
Class Q | | | | | 9.31 | | | 5.87 (3/30/2011) |
Class Z | | | | | 9.21 | | | 5.78 (3/30/2011) |
JP Morgan Government Bond Index-Emerging Markets Global Diversified Index | | | | | 7.25 | | | 7.64 |
Lipper Emerging Markets Debt Funds Average | | | | | 7.28 | | | 6.97 |
| | | | | | | | |
Average Annual Total Returns (With Sales Charges) as of 9/30/12 |
| | | | | One Year | | | Since Inception |
Class A | | | | | 8.54 | % | | –0.80% (3/30/2011) |
Class C | | | | | 11.36 | | | 1.92 (3/30/2011) |
Class Q | | | | | 14.35 | | | 2.67 (3/30/2011) |
Class Z | | | | | 14.37 | | | 2.69 (3/30/2011) |
JP Morgan Government Bond Index-Emerging Markets Global Diversified Index | | | | | 12.66 | | | 4.67 |
Lipper Emerging Markets Debt Funds Average | | | | | 12.64 | | | 4.19 |
| | | | | | | | |
Average Annual Total Returns (With Sales Charges) as of 10/31/12 |
| | | | | One Year | | | Since Inception |
Class A | | | | | 3.65 | % | | 0.25% (3/30/2011) |
Class C | | | | | 6.55 | | | 2.88 (3/30/2011) |
Class Q | | | | | 9.31 | | | 3.65 (3/30/2011) |
Class Z | | | | | 9.21 | | | 3.59 (3/30/2011) |
| | | | | | | | |
| | |
| 2 | | Visit our website at www.prudentialfunds.com |
| | | | | | | | |
Average Annual Total Returns (Without Sales Charges) as of 10/31/12 |
| | | | | One Year | | | Since Inception |
Class A | | | | | 8.53 | % | | 3.19% (3/30/2011) |
Class C | | | | | 7.55 | | | 2.88 (3/30/2011) |
Class Q | | | | | 9.31 | | | 3.65 (3/30/2011) |
Class Z | | | | | 9.21 | | | 3.59 (3/30/2011) |
Growth of a $10,000 Investment
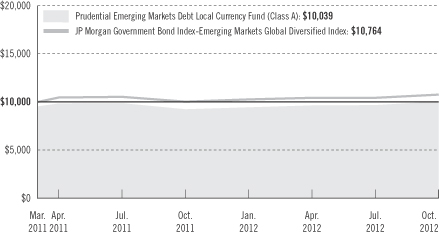
The graph compares a $10,000 investment in the Prudential Emerging Markets Debt Local Currency Fund (Class A shares) with a similar investment in the JP Morgan Government Bond Index-Emerging Markets Global Diversified Index by portraying the initial account values at the commencement of operations for Class A shares (March 30, 2011) and the account values at the end of the current fiscal year (October 31, 2012), as measured on a quarterly basis. For purposes of the graph, and unless otherwise indicated, it has been assumed that (a) the maximum applicable front-end sales charge was deducted from the initial $10,000 investment in Class A shares; (b) all recurring fees (including management fees) were deducted; and (c) all dividends and distributions were reinvested. The line graph provides information for Class A shares only. As indicated in the tables provided earlier, performance for Class C, Class Q, and Class Z shares will vary due to the differing charges and expenses applicable to each share class (as indicated in the following paragraphs). Without waiver of fees and/or expense reimbursement, if any, the returns would have been lower.
Total returns and the ending account values in the graph include changes in share price and reinvestment of dividends and capital gains distributions in a hypothetical investment for the periods shown. The Fund’s total returns do not reflect the deduction of income taxes on an individual’s investment. Taxes may reduce your actual investment returns on income or gains paid by the Fund or any gains you may realize if you sell your shares.
| | | | |
| Prudential Emerging Markets Debt Local Currency Fund | | | 3 | |
Your Fund’s Performance (continued)
Source: Prudential Investments LLC and Lipper Inc.
Inception returns are provided for any share class with less than 10 calendar years of returns.
The average annual total returns take into account applicable sales charges. Class A shares are subject to a maximum front-end sales charge of 4.50% and a 12b-1 fee of up to 0.30% annually. All investors who purchase Class A shares in an amount of $1 million or more and sell these shares within 12 months of purchase are subject to a contingent deferred sales charge (CDSC) of 1%. Under certain circumstances, an exchange may be made from specified share classes of the Fund to one or more other share classes of the Fund. Class C shares are not subject to a front-end sales charge, but charge a CDSC of 1% for shares sold within 12 months from the date of purchase and an annual 12b-1 fee of 1%. Class Q and Class Z shares are not subject to a CDSC or 12b-1 fee. The returns in the tables and graph reflect the share class expense structure in effect at the close of the fiscal period. The returns in the tables and graph do not reflect the deduction of taxes that a shareholder would pay on Fund distributions or following the redemption of Fund shares.
Benchmark Definitions
JP Morgan Government Bond Index-Emerging Markets Global Diversified Index
The JP Morgan Government Bond Index-Emerging Markets Global Diversified Index (GBI-EM Global Diversified), an unmanaged index, is a comprehensive emerging markets debt benchmark that tracks local currency bonds issued by emerging market governments.
Lipper Emerging Markets Debt Funds Average
Funds in the Lipper Emerging Markets Debt Funds Average seek either current income or total return by investing at least 65% of total assets in emerging market debt securities, where “emerging market” is defined by a country’s GNP per capita or other economic measure.
Investors cannot invest directly in an index or average. The returns for the Index would be lower if they included the effects of sales charges, operating expenses of a mutual fund, or taxes. Returns for the Lipper Average reflect the deduction of operating expenses, but not sales charges or taxes.
| | | | | | | | |
Distributions and Yields as of 10/31/12 | |
| | | Total Distributions
Paid for 12 Months | | | 30-Day
SEC Yield | |
Class A | | $ | 0.52 | | | | 3.95 | % |
Class C | | | 0.45 | | | | 3.37 | |
Class Q | | | 0.55 | | | | 4.42 | |
Class Z | | | 0.54 | | | | 4.36 | |
| | | | |
Five Largest Issues expressed as a percentage of net assets as of 10/31/12 | |
Turkey Government Bond, Bonds, Ser. 5YR, 9.000%, 03/08/17 | | | 5.9 | % |
Indonesia Treasury Bond, Sr. Unsec’d. Notes, Ser. FR61, 7.000%, 05/15/22 | | | 3.8 | |
Hungary Government Bond, Bonds, Ser. 17/B, 6.750%, 02/24/17 | | | 3.4 | |
Petroleos de Venezuela SA, Sr. Unsec’d. Notes, Ser. 2014, 4.900%, 10/28/14 | | | 3.1 | |
South Africa Government Bond, Bonds, Ser. R186, 10.500%, 12/21/26 | | | 3.1 | |
Issues reflect only long-term investments and are subject to change.
| | |
| 4 | | Visit our website at www.prudentialfunds.com |
| | | | |
Credit Quality* expressed as a percentage of net assets as of 10/31/12 | |
A | �� | | 8.6 | % |
Baa | | | 59.2 | |
Ba | | | 16.8 | |
B | | | 2.5 | |
Not Rated** | | | 11.1 | |
Total Investments | | | 98.2 | |
Other assets in excess of liabilities | | | 1.8 | |
Net Assets | | | 100.0 | % |
| | | | |
*Source: Moody’s rating, defaulting to S&P when not rated by Moody’s.
**Approximately 6.4% of Not Rated is invested in affiliated money market mutual funds.
Credit Quality is subject to change.
| | | | |
| Prudential Emerging Markets Debt Local Currency Fund | | | 5 | |
Strategy and Performance Overview
How did the Fund perform?
The Prudential Emerging Markets Debt Local Currency Fund’s Class A shares gained 8.53% for the 12-month reporting period that ended October 31, 2012, significantly outperforming the 7.25% return of the JP Morgan GBI-EM Global Diversified Index (GBI-EM Global Diversified) and the 7.28% gain of the Lipper Emerging Markets Local Currency Debt Funds Average.
How did emerging market government bonds denominated in local currencies perform?
The reporting period that began November 1, 2011, saw pronounced changes in investor appetite for global risk assets such as emerging market bonds. However, local currency bonds issued by emerging market governments still delivered a 7.25% gain in U.S. dollar terms for the period without hedging for currency risk, according to the GBI-EM Global Diversified.
| | • | | The market was sometimes dominated by a “risk off” sentiment that favored safe havens such as U.S. Treasury securities and German bunds, particularly when an ongoing European sovereign debt crisis threatened to spiral out of control. |
| | • | | The market was, at other times, dominated by a “risk on” sentiment that favored emerging market bonds and currencies as well as other global risk assets. But, during those periods, local currency emerging market government bonds gained less than emerging market government bonds denominated in the U.S. dollar. This occurred because the performance of the latter is more closely correlated with that of U.S. Treasury securities, which rallied during the period. Also a relatively limited supply of emerging market bonds denominated in the greenback and other hard currencies met with strong demand from investors seeking attractive yields. |
| | • | | Economic growth in emerging market nations as a whole was stronger than in developed nations, but growth slowed in several key emerging economies, including China and Brazil, primarily due to weaker global trade. Softer growth prompted some nations to cut short-term rates to help stimulate economic activity. The trend toward easier monetary policy was supportive of local currency-denominated bonds of emerging market governments. |
| | • | | Emerging market currencies were very volatile. Their performance is highly correlated to risk aversion (such as that caused by the European sovereign debt crisis) and weaker commodity prices. Not surprisingly, currencies of some riskier nations ended the period much weaker versus the U.S. dollar, particularly the Brazilian real, the Indian rupee, the Argentinian peso, and the South African rand. Yet the Mexican peso finished stronger against the |
| | |
| 6 | | Visit our website at www.prudentialfunds.com |
| | greenback, reflecting the Mexican economy’s brisk growth and national election results that boosted expectations the Mexican government will implement needed structural reforms. |
| | • | | Returns of emerging market government local currency bonds in U.S. dollars without hedging for currency risk varied widely, ranging from a 27.8% gain for the Philippines to a 1.0% decline for Brazil, according to the GBI-EM Global Diversified. |
Which strategy made the largest positive contribution to the Fund’s performance?
The Fund outperformed the GBI-EM Global Diversified by a significant amount for the period primarily due to its favorable security selection among emerging market bonds denominated in local currencies. Prudential Fixed Income, a unit of Prudential Investment Management, Inc., manages the Fund, which was well-diversified across a variety of emerging market countries, securities, and currencies. Its portfolio management team closely analyzes each country’s currency, local currency bonds, and hard currency bonds from three viewpoints—fundamental, technical, and relative value.
| | • | | The Fund held positions in longer-term bonds of issuers located in Brazil. Prices of these bonds rallied as the Central Bank of Brazil aggressively cut short-term rates to stimulate economic growth, which had begun to slow in that nation. (Bond prices move inversely to interest rates.) |
| | • | | The Fund also owned other bonds that performed well, such as debt securities of issuers located in Turkey and sovereign and quasi-sovereign bonds of issuers from Russia. |
| | • | | The Fund also benefited from holding select positions in bonds denominated in hard currencies, which are not included in the GBI-EM Global Diversified. Most notably, it owned short-term bonds of issuers located in Venezuela that provided relatively high yields. These bonds performed well, particularly during periods when the market was dominated by “risk on” sentiment and after elections were held in Venezuela late in the period. |
| | • | | The Fund, compared to the GBI-EM Global Diversified, had underweight exposures to lower-yielding bonds of issuers located in higher-quality emerging market nations including Malaysia and Thailand, which also contributed to performance. |
| | | | |
| Prudential Emerging Markets Debt Local Currency Fund | | | 7 | |
Strategy and Performance Overview (continued)
How did the Fund’s foreign exchange strategy affect its performance?
The Fund’s foreign exchange strategy had a mixed impact on its performance for the period.
| | • | | The Fund benefited from having overweight exposures to the Russian ruble and certain other local currencies compared to the GBI-EM Global Diversified. Its trading in the Russian ruble was particularly well timed. Early in the year, the Fund owned rubles when high oil prices and stronger Russian growth prospects helped boost the value of the currency. Later, the Fund was short rubles when softening oil prices and a flare-up in the euro zone crisis caused the Russian currency to weaken. |
| | • | | Another positive for the Fund was its broad exposure to currencies of Asian nations, as that region benefited from lower commodity prices, relatively stronger economic growth, and the generally healthy balance of payment positions of many nations in Asia. |
| | • | | An overweight exposure to the Brazilian real hurt the Fund’s performance, as the previously mentioned aggressive rate cuts by the Central Bank of Brazil caused the real to weaken dramatically versus the U.S. dollar. Also the real softened as the Brazilian government bought U.S. dollars and sold the real to prevent the real from appreciating in value. The Fund underestimated the extent to which the Brazilian government would intervene to weaken its currency in order to keep Brazilian exports competitive. |
| | |
| 8 | | Visit our website at www.prudentialfunds.com |
Fees and Expenses (Unaudited)
As a shareholder of the Fund, you incur two types of costs: (1) transaction costs, including sales charges (loads) on purchase payments and redemptions, as applicable, and (2) ongoing costs, including management fees, distribution, and/or service (12b-1) fees, and other Fund expenses, as applicable. This example is intended to help you understand your ongoing costs (in dollars) of investing in the Fund and to compare these costs with the ongoing costs of investing in other mutual funds.
The example is based on an investment of $1,000 invested on May 1, 2012, at the beginning of the period, and held through the six-month period ended October 31, 2012. The example is for illustrative purposes only; you should consult the Prospectus for information on initial and subsequent minimum investment requirements.
The Fund’s transfer agent may charge additional fees to holders of certain accounts that are not included in the expenses shown in the table on the following page. These fees apply to individual retirement accounts (IRAs) and Section 403(b) accounts. As of the close of the six-month period covered by the table, IRA fees included an annual maintenance fee of $15 per account (subject to a maximum annual maintenance fee of $25 for all accounts held by the same shareholder). Section 403(b) accounts are charged an annual $25 fiduciary maintenance fee. Some of the fees may vary in amount, or may be waived, based on your total account balance or the number of Prudential Investments funds, including the Fund, that you own. You should consider the additional fees that were charged to your Fund account over the six-month period when you estimate the total ongoing expenses paid over the period and the impact of these fees on your ending account value, as these additional expenses are not reflected in the information provided in the expense table. Additional fees have the effect of reducing investment returns.
Actual Expenses
The first line for each share class in the table on the following page provides information about actual account values and actual expenses. You may use the information on this line, together with the amount you invested, to estimate the expenses that you paid over the period. Simply divide your account value by $1,000 (for example, an $8,600 account value ÷ $1,000 = 8.6), then multiply the result by the number on the first line under the heading “Expenses Paid During the Six-Month Period” to estimate the expenses you paid on your account during this period.
Hypothetical Example for Comparison Purposes
The second line for each share class in the table on the following page provides information about hypothetical account values and hypothetical expenses based on the Fund’s actual expense ratio and an assumed rate of return of 5% per year before
| | | | |
| Prudential Emerging Markets Debt Local Currency Fund | | | 9 | |
Fees and Expenses (continued)
expenses, which is not the Fund’s actual return. The hypothetical account values and expenses may not be used to estimate the actual ending account balance or expenses you paid for the period. You may use this information to compare the ongoing costs of investing in the Fund and other funds. To do so, compare this 5% hypothetical example with the 5% hypothetical examples that appear in the shareholder reports of the other funds.
Please note that the expenses shown in the table are meant to highlight your ongoing costs only and do not reflect any transactional costs such as sales charges (loads). Therefore, the second line for each share class in the table is useful in comparing ongoing costs only and will not help you determine the relative total costs of owning different funds. In addition, if these transactional costs were included, your costs would have been higher.
| | | | | | | | | | | | | | | | | | |
Prudential
Emerging Markets Debt
Local Currency Fund | | Beginning Account
Value
May 1, 2012 | | | Ending Account
Value
October 31, 2012 | | | Annualized
Expense Ratio
Based on the
Six-Month Period | | | Expenses Paid
During the
Six-Month Period* | |
| | | | | | | | | | | | | | | | | | |
| Class A | | Actual | | $ | 1,000.00 | | | $ | 1,039.60 | | | | 1.30 | % | | $ | 6.66 | |
| | | Hypothetical | | $ | 1,000.00 | | | $ | 1,018.60 | | | | 1.30 | % | | $ | 6.20 | |
| | | | | | | | | | | | | | | | | | |
| Class C | | Actual | | $ | 1,000.00 | | | $ | 1,037.80 | | | | 2.05 | % | | $ | 10.50 | |
| | | Hypothetical | | $ | 1,000.00 | | | $ | 1,014.83 | | | | 2.05 | % | | $ | 10.38 | |
| | | | | | | | | | | | | | | | | | |
| Class Q | | Actual | | $ | 1,000.00 | | | $ | 1,042.30 | | | | 1.05 | % | | $ | 5.39 | |
| | | Hypothetical | | $ | 1,000.00 | | | $ | 1,019.86 | | | | 1.05 | % | | $ | 5.33 | |
| | | | | | | | | | | | | | | | | | |
| Class Z | | Actual | | $ | 1,000.00 | | | $ | 1,040.70 | | | | 1.05 | % | | $ | 5.39 | |
| | | Hypothetical | | $ | 1,000.00 | | | $ | 1,019.86 | | | | 1.05 | % | | $ | 5.33 | |
*Fund expenses (net of fee waivers or subsidies, if any) for each share class are equal to the annualized expense ratio for each share class (provided in the table), multiplied by the average account value over the period, multiplied by the 184 days in the six-month period ended October 31, 2012, and divided by the 366 days in the Fund’s fiscal year ended October 31, 2012 (to reflect the six-month period). Expenses presented in the table include the expenses of any underlying portfolios in which the Fund may invest.
| | |
| 10 | | Visit our website at www.prudentialfunds.com |
Portfolio of Investments
as of October 31, 2012
| | | | | | | | | | | | | | | | |
| Description | | Moody’s
Ratings†
(Unaudited) | | Interest
Rate | | Maturity
Date | | | Principal
Amount (000)# | | | Value (Note 1) | |
LONG-TERM INVESTMENTS 91.8% | |
FOREIGN BONDS | |
| | | |
Barbados 0.5% | | | | | | | | | | | | |
Columbus International, Inc.,
Sr. Sec’d. Notes, RegS (original cost $188,913; purchased 09/18/12)(a)(b) | | B2 | | 11.500% | | | 11/20/14 | | | $ | 170 | | | $ | 190,400 | |
| | | | | |
Brazil 11.5% | | | | | | | | | | | | | | | | |
Banco Votorantim Ltd.,
Sr. Unsec’d. Notes, MTN, RegS | | Baa2 | | 10.625 | | | 04/10/14 | | | BRL | 415 | | | | 213,134 | |
Brazil Notas Do Tesouro Nacional,
Bonds, Ser. NTN-B - Inflation Linked | | Baa2 | | 6.000 | | | 08/15/14 | | | BRL | 52 | | | | 60,037 | |
Bonds, Ser. NTN-B - Inflation Linked | | Baa2 | | 6.000 | | | 08/15/18 | | | BRL | 510 | | | | 634,823 | |
Notes, Ser. NTN-B -
Inflation Linked | | Baa2 | | 6.000 | | | 05/15/15 | | | BRL | 335 | | | | 394,389 | |
Notes, Ser. NTNF | | Baa2 | | 10.000 | | | 01/01/14 | | | BRL | 740 | | | | 374,077 | |
Notes, Ser. NTNF | | Baa2 | | 10.000 | | | 01/01/15 | | | BRL | 775 | | | | 397,263 | |
Notes, Ser. NTNF | | Baa2 | | 10.000 | | | 01/01/17 | | | BRL | 1,910 | | | | 987,823 | |
Notes, Ser. NTNF | | Baa2 | | 10.000 | | | 01/01/21 | | | BRL | 2,273 | | | | 1,177,620 | |
Brazilian Government International Bond,
Sr. Unsec’d. Notes | | Baa2 | | 8.500 | | | 01/05/24 | | | BRL | 500 | | | | 288,029 | |
Itau Unibanco Holding SA, | | | | | | | | | | | | | | | | |
Sr. Unsec’d. Notes, RegS | | Baa1 | | 10.500 | | | 11/23/15 | | | BRL | 300 | | | | 162,108 | |
| | | | | | | | | | | | | | | | |
| | | | | | | | | | | | | | | 4,689,303 | |
| | | | | |
Colombia 2.8% | | | | | | | | | | | | | | | | |
Colombia Government International Bond, | | | | | | | | | | | | | | | | |
Sr. Unsec’d. Notes | | Baa3 | | 4.375 | | | 03/21/23 | | | COP | 389,000 | | | | 211,302 | |
Sr. Unsec’d. Notes | | Baa3 | | 7.750 | | | 04/14/21 | | | COP | 197,000 | | | | 135,509 | |
Sr. Unsec’d. Notes | | Baa3 | | 9.850 | | | 06/28/27 | | | COP | 180,000 | | | | 153,049 | |
Sr. Unsec’d. Notes | | Baa3 | | 12.000 | | | 10/22/15 | | | COP | 700,000 | | | | 472,331 | |
See Notes to Financial Statements.
| | | | |
| Prudential Emerging Markets Debt Local Currency Fund | | | 11 | |
Portfolio of Investments
as of October 31, 2012 continued
| | | | | | | | | | | | | | | | |
| Description | | Moody’s
Ratings†
(Unaudited) | | Interest
Rate | | Maturity
Date | | | Principal
Amount (000)# | | | Value (Note 1) | |
FOREIGN BONDS (Continued) | | | | | | | | | | | | | | |
| | | | | |
Colombia (cont’d.) | | | | | | | | | | | | | | | | |
Empresas Publicas de Medellin ESP,
Sr. Unsec’d. Notes, RegS | | Baa3 | | 8.375% | | | 02/01/21 | | | COP | 300,000 | | | $ | 184,985 | |
| | | | | | | | | | | | | | | | |
| | | | | | | | | | | | | | | 1,157,176 | |
| | | | | |
Costa Rica 1.3% | | | | | | | | | | | | | | | | |
Costa Rica Government International Bond, | | | | | | | | | | | | | | | | |
Sr. Unsec’d. Notes, RegS | | Baa3 | | 6.548 | | | 03/20/14 | | | $ | 500 | | | | 525,000 | |
| | | | | |
Dominican Republic 0.4% | | | | | | | | | | | | | | | | |
Dominican Republic International Bond,
Sr. Unsec’d. Notes, RegS | | B1 | | 9.040 | | | 01/23/18 | | | | 153 | | | | 175,969 | |
| | | | | |
Hungary 4.5% | | | | | | | | | | | | | | | | |
Hungary Government Bond, Bonds
Ser. 16/C | | Ba1 | | 5.500 | | | 02/12/16 | | | HUF | 33,080 | | | | 147,650 | |
Ser. 17/B | | Ba1 | | 6.750 | | | 02/24/17 | | | HUF | 297,250 | | | | 1,372,637 | |
Ser. 23/A | | Ba1 | | 6.000 | | | 11/24/23 | | | HUF | 74,740 | | | | 313,770 | |
| | | | | | | | | | | | | | | | |
| | | | | | | | | | | | | | | 1,834,057 | |
| | | | | |
Indonesia 10.8% | | | | | | | | | | | | | | | | |
Indonesia Treasury Bond,
Sr. Unsec’d. Notes, Ser. FR36 | | Baa3 | | 11.500 | | | 09/15/19 | | | IDR | 2,200,000 | | | | 305,670 | |
Ser. FR51 | | Baa3 | | 11.250 | | | 05/15/14 | | | IDR | 2,950,000 | | | | 334,623 | |
Ser. FR53 | | Baa3 | | 8.250 | | | 07/15/21 | | | IDR | 4,970,000 | | | | 606,634 | |
Ser. FR54 | | Baa3 | | 9.500 | | | 07/15/31 | | | IDR | 4,000,000 | | | | 551,315 | |
Ser. FR55 | | Baa3 | | 7.375 | | | 09/15/16 | | | IDR | 3,000,000 | | | | 334,001 | |
Ser. FR56 | | Baa3 | | 8.375 | | | 09/15/26 | | | IDR | 1,000,000 | | | | 124,940 | |
Ser. FR58 | | Baa3 | | 8.250 | | | 06/15/32 | | | IDR | 3,000,000 | | | | 372,308 | |
Ser. FR61 | | Baa3 | | 7.000 | | | 05/15/22 | | | IDR | 13,394,000 | | | | 1,526,664 | |
Ser. FR65 | | Baa3 | | 6.625 | | | 05/15/33 | | | IDR | 2,000,000 | | | | 211,822 | |
| | | | | | | | | | | | | | | | |
| | | | | | | | | | | | | | | 4,367,977 | |
See Notes to Financial Statements.
| | |
| 12 | | Visit our website at www.prudentialfunds.com |
| | | | | | | | | | | | | | | | |
| Description | | Moody’s
Ratings†
(Unaudited) | | Interest
Rate | | Maturity
Date | | | Principal
Amount (000)# | | | Value (Note 1) | |
FOREIGN BONDS (Continued) | | | | | | | | | | | | | | |
| | | | | |
Malaysia 4.5% | | | | | | | | | | | | | | | | |
Malaysia Government Bond,
Bonds, Ser. 0111 | | A3 | | 4.160% | | | 07/15/21 | | | MYR | 1,740 | | | $ | 598,381 | |
Bonds, Ser. 0311 | | A3 | | 4.392 | | | 04/15/26 | | | MYR | 440 | | | | 156,115 | |
Unsec’d. Notes, Ser. 0112 | | A3 | | 3.418 | | | 08/15/22 | | | MYR | 580 | | | | 189,577 | |
Unsec’d. Notes, Ser. 0412 | | A3 | | 4.127 | | | 04/15/32 | | | MYR | 2,600 | | | | 880,982 | |
| | | | | | | | | | | | | | | | |
| | | | | | | | | | | | | | | 1,825,055 | |
| | | | | |
Mexico 7.9% | | | | | | | | | | | | | | | | |
Mexican Bonos, Bonds,
Ser. M | | Baa1 | | 6.500 | | | 06/10/21 | | | MXN | 8,000 | | | | 651,464 | |
Ser. M | | Baa1 | | 6.500 | | | 06/09/22 | | | MXN | 4,850 | | | | 396,558 | |
Ser. M20 | | Baa1 | | 7.750 | | | 05/29/31 | | | MXN | 4,400 | | | | 387,280 | |
Ser. M20 | | Baa1 | | 8.500 | | | 05/31/29 | | | MXN | 1,400 | | | | 132,661 | |
Petroleos Mexicanos,
Gtd. Notes, 144A | | Baa1 | | 7.650 | | | 11/24/21 | | | MXN | 4,120 | | | | 343,186 | |
Gtd. Notes(c) | | Baa1 | | 5.260 | | | 05/12/14 | | | MXN | 6,000 | | | | 458,225 | |
Gtd. Notes | | Baa1 | | 9.100 | | | 01/27/20 | | | MXN | 9,650 | | | | 855,478 | |
| | | | | | | | | | | | | | | | |
| | | | | | | | | | | | | | | 3,224,852 | |
| | | | | |
Netherlands 0.5% | | | | | | | | | | | | | | | | |
VimpelCom Holdings BV,
Gtd. Notes, 144A(c) | | Ba3 | | 4.362 | | | 06/29/14 | | | $ | 200 | | | | 201,314 | |
| | | | | |
Nigeria 1.1% | | | | | | | | | | | | | | | | |
Nigeria Treasury Bond,
Bonds | | B+(d) | | 7.000 | | | 10/23/19 | | | NGN | 5,875 | | | | 26,865 | |
Unsec’d. Notes | | B+(d) | | 16.390 | | | 01/27/22 | | | NGN | 54,965 | | | | 410,400 | |
| | | | | | | | | | | | | | | | |
| | | | | | | | | | | | | | | 437,265 | |
| | | | | |
Peru 4.4% | | | | | | | | | | | | | | | | |
Peru Government Bond,
Sr. Unsec’d. Notes | | Baa2 | | 6.950 | | | 08/12/31 | | | PEN | 190 | | | | 89,322 | |
Peruvian Government International Bond,
Sr. Unsec’d. Notes, 144A | | Baa2 | | 7.840 | | | 08/12/20 | | | PEN | 650 | | | | 310,390 | |
Sr. Unsec’d. Notes, RegS | | Baa2 | | 6.950 | | | 08/12/31 | | | PEN | 1,085 | | | | 510,073 | |
Sr. Unsec’d. Notes, RegS | | Baa2 | | 7.840 | | | 08/12/20 | | | PEN | 355 | | | | 169,520 | |
Sr. Unsec’d. Notes, RegS | | Baa2 | | 8.200 | | | 08/12/26 | | | PEN | 880 | | | | 464,059 | |
Sr. Unsec’d. Notes, RegS | | Baa2 | | 9.910 | | | 05/05/15 | | | PEN | 550 | | | | 246,593 | |
| | | | | | | | | | | | | | | | |
| | | | | | | | | | | | | | | 1,789,957 | |
See Notes to Financial Statements.
| | | | |
| Prudential Emerging Markets Debt Local Currency Fund | | | 13 | |
Portfolio of Investments
as of October 31, 2012 continued
| | | | | | | | | | | | | | | | |
| Description | | Moody’s
Ratings†
(Unaudited) | | Interest
Rate | | Maturity
Date | | | Principal
Amount (000)# | | | Value (Note 1) | |
FOREIGN BONDS (Continued) | | | | | | | | | | | | | | |
| | | | | |
Philippines 2.2% | | | | | | | | | | | | | | | | |
Philippine Government International Bond,
Sr. Unsec’d. Notes | | Ba1 | | 4.950% | | | 01/15/21 | | | PHP | 23,000 | | | $ | 614,059 | |
Sr. Unsec’d. Notes | | Ba1 | | 6.250 | | | 01/14/36 | | | PHP | 10,000 | | | | 283,894 | |
| | | | | | | | | | | | | | | | |
| | | | | | | | | | | | | | | 897,953 | |
| | | | | |
Poland 4.1% | | | | | | | | | | | | | | | | |
Poland Government Bond, Bonds,
Ser. 0415 | | A2 | | 5.500 | | | 04/25/15 | | | PLN | 1,705 | | | | 553,905 | |
Ser. 1019 | | A2 | | 5.500 | | | 10/25/19 | | | PLN | 2,475 | | | | 832,197 | |
Ser. 1020 | | A2 | | 5.250 | | | 10/25/20 | | | PLN | 840 | | | | 277,428 | |
| | | | | | | | | | | | | | | | |
| | | | | | | | | | | | | | | 1,663,530 | |
| | | | | |
Russia 7.9% | | | | | | | | | | | | | | | | |
Home Credit & Finance Bank Via Eurasia, Capital SA,
Unsec’d. Notes | | Ba3 | | 7.000 | | | 03/18/14 | | | $ | 250 | | | | 258,437 | |
Russian Agricultural Bank OJSC Via RSHB Capital SA,
Sr. Unsec’d. Notes, 144A | | Baa1 | | 8.625 | | | 02/17/17 | | | RUB | 3,000 | | | | 98,277 | |
Sr. Unsec’d. Notes, RegS | | Baa1 | | 8.625 | | | 02/17/17 | | | RUB | 32,600 | | | | 1,067,941 | |
Sr. Unsec’d. Notes, Ser. E, MTN, RegS | | Baa1 | | 8.700 | | | 03/17/16 | | | RUB | 18,000 | | | | 589,230 | |
Russian Foreign Bond - Eurobond,
Sr. Unsec’d. Notes, 144A, | | Baa1 | | 7.850 | | | 03/10/18 | | | RUB | 10,000 | | | | 341,378 | |
Sr. Unsec’d. Notes, RegS | | Baa1 | | 7.850 | | | 03/10/18 | | | RUB | 15,000 | | | | 512,068 | |
RZD Capital Ltd.,
Sr. Unsec’d. Notes, RegS | | Baa1 | | 8.300 | | | 04/02/19 | | | RUB | 10,100 | | | | 327,645 | |
| | | | | | | | | | | | | | | | |
| | | | | | | | | | | | | | | 3,194,976 | |
| | | | | |
Singapore 0.4% | | | | | | | | | | | | | | | | |
Berau Capital Resources Pte Ltd., Gtd. Notes, RegS | | B1 | | 12.500 | | | 07/08/15 | | | $ | 145 | | | | 152,431 | |
See Notes to Financial Statements.
| | |
| 14 | | Visit our website at www.prudentialfunds.com |
| | | | | | | | | | | | | | | | |
| Description | | Moody’s
Ratings†
(Unaudited) | | Interest
Rate | | Maturity
Date | | | Principal
Amount (000)# | | | Value (Note 1) | |
FOREIGN BONDS (Continued) | | | | | | | | | | | | | | |
| | | | | |
South Africa 9.1% | | | | | | | | | | | | | | | | |
Eskom Holdings Ltd., Notes, MTN | | Baa2 | | 10.000% | | | 01/25/33 | | | ZAR | 7,500 | | | $ | 1,007,218 | |
South Africa Government Bond,
Bonds, Ser. R157 | | Baa1 | | 13.500 | | | 09/15/15 | | | ZAR | 258 | | | | 35,994 | |
Bonds, Ser. R186 | | Baa1 | | 10.500 | | | 12/21/26 | | | ZAR | 8,703 | | | | 1,240,459 | |
Bonds, Ser. R209 | | Baa1 | | 6.250 | | | 03/31/36 | | | ZAR | 11,125 | | | | 990,683 | |
Sr. Unsec’d Notes, Ser. R204 | | Baa1 | | 8.000 | | | 12/21/18 | | | ZAR | 3,165 | | | | 399,085 | |
| | | | | | | | | | | | | | | | |
| | | | | | | | | | | | | | | 3,673,439 | |
| | | | | |
Spain 1.0% | | | | | | | | | | | | | | | | |
Spain Government International Bond,
Sr. Unsec’d. Notes, Ser. E, MTN | | Baa3 | | 3.625 | | | 06/17/13 | | | $ | 400 | | | | 399,880 | |
| | | | | |
Thailand 2.6% | | | | | | | | | | | | | | | | |
Thailand Government Bond,
Bonds | | Baa1 | | 3.580 | | | 12/17/27 | | | THB | 5,000 | | | | 163,219 | |
Sr. Unsec’d. Notes | | Baa1 | | 3.625 | | | 06/16/23 | | | THB | 4,177 | | | | 138,124 | |
Sr. Unsec’d. Notes | | Baa1 | | 3.650 | | | 12/17/21 | | | THB | 12,900 | | | | 432,126 | |
Sr. Unsec’d. Notes | | Baa1 | | 3.850 | | | 12/12/25 | | | THB | 2,000 | | | | 67,041 | |
Sr. Unsec’d. Notes | | Baa1 | | 5.670 | | | 03/13/28 | | | THB | 5,000 | | | | 202,362 | |
Sr. Unsec’d. Notes -
Inflation Linked | | Baa1 | | 1.200 | | | 07/14/21 | | | THB | 1,762 | | | | 58,723 | |
| | | | | | | | | | | | | | | | |
| | | | | | | | | | | | | | | 1,061,595 | |
| | | | | |
Turkey 9.0% | | | | | | | | | | | | | | | | |
Turkey Government Bond,
Bonds | | Ba1 | | 9.000 | | | 01/27/16 | | | TRY | 1,080 | | | | 632,636 | |
Bonds | | Ba1 | | 10.500 | | | 01/15/20 | | | TRY | 775 | | | | 496,779 | |
Bonds - Inflation Linked | | Ba1 | | 3.000 | | | 07/21/21 | | | TRY | 205 | | | | 124,653 | |
Bonds, Ser. 5YR | | Ba1 | | 9.000 | | | 03/08/17 | | | TRY | 4,030 | | | | 2,384,276 | |
| | | | | | | | | | | | | | | | |
| | | | | | | | | | | | | | | 3,638,344 | |
| | | | | |
Ukraine 0.6% | | | | | | | | | | | | | | | | |
NAK Naftogaz Ukraine,
Gtd. Notes | | NR | | 9.500 | | | 09/30/14 | | | $ | 230 | | | | 234,324 | |
See Notes to Financial Statements.
| | | | |
| Prudential Emerging Markets Debt Local Currency Fund | | | 15 | |
Portfolio of Investments
as of October 31, 2012 continued
| | | | | | | | | | | | | | | | |
| Description | | Moody’s
Ratings†
(Unaudited) | | Interest
Rate | | Maturity
Date | | | Principal
Amount (000)# | | | Value (Note 1) | |
FOREIGN BONDS (Continued) | | | | | | | | | | | | | | |
| | | | | |
United Arab Emirates 1.1% | | | | | | | | | | | | | | | | |
Dubai DOF Sukuk Ltd.,
Sr. Unsec’d. Notes, Ser. E, MTN | | NR | | 6.396% | | | 11/03/14 | | | $ | 155 | | | $ | 166,392 | |
Emirate of Dubai Government International Bonds,
Sr. Notes, Ser. E, MTN, RegS | | NR | | 6.700 | | | 10/05/15 | | | | 250 | | | | 276,250 | |
| | | | | | | | | | | | | | | | |
| | | | | | | | | | | | | | | 442,642 | |
| | | | | |
Uruguay 0.4% | | | | | | | | | | | | | | | | |
Uruguay Government International Bond,
Sr. Unsec’d. Notes | | Baa3 | | 5.000 | | | 09/14/18 | | | UYU | 3,143 | | | | 181,980 | |
| | | | | |
Venezuela 3.2% | | | | | | | | | | | | | | | | |
Petroleos de Venezuela SA,
Sr. Unsec’d. Notes | | B1 | | 8.000 | | | 11/17/13 | | | $ | 40 | | | | 40,200 | |
Sr. Unsec’d. Notes,
Ser. 2014 | | NR | | 4.900 | | | 10/28/14 | | | | 1,340 | | | | 1,242,850 | |
| | | | | | | | | | | | | | | | |
| | | | | | | | | | | | | | | 1,283,050 | |
| | | | | | | | | | | | | | | | |
Total long-term investments
(cost $37,016,519) | | | | | | | | | | | | | | | 37,242,469 | |
| | | | | | | | | | | | | | | | |
| | | | | |
| | | | | | | | | | Shares | | | | |
SHORT-TERM INVESTMENT 6.4% | | | | | | | | | | | | | | |
| | | | |
Affiliated Money Market Mutual Fund | | | | | | | | | | | | | | |
Prudential Investment Portfolios 2 - Prudential Core Taxable Money Market Fund
(cost $2,597,500)(e) | | | | | | | | | | | 2,597,500 | | | | 2,597,500 | |
| | | | | | | | | | | | | | | | |
Total Investments 98.2%
(cost $39,614,019; Note 5) | | | | | | | | | | | | | | | 39,839,969 | |
Other assets in excess of liabilities(f) 1.8% | | | | | | | | | | | | | | | 730,884 | |
| | | | | | | | | | | | | | | | |
Net Assets 100.0% | | | | | | | | | | | | | | $ | 40,570,853 | |
| | | | | | | | | | | | | | | | |
See Notes to Financial Statements.
| | |
| 16 | | Visit our website at www.prudentialfunds.com |
The following abbreviations are used in the portfolio descriptions:
144A—Security was purchased pursuant to Rule 144A under the Securities Act of 1933 and may not be resold subject to that rule except to qualified institutional buyers. Unless otherwise noted, 144A securities are deemed to be liquid.
RegS—Regulation S. Security was purchased pursuant to Regulation S and may not be offered, sold or delivered within the United States or to, or for the account or benefit of, U.S. persons, except pursuant to an exemption from, or in a transaction not subject to, the registration requirements of the Securities Act of 1933.
BRL—Brazilian Real
CLP—Chilean Peso
CNY—Chinese Yuan Renminbi
COP—Colombian Peso
EUR—Euro
HUF—Hungarian Forint
IDR—Indonesian Rupiah
INR—Indian Rupee
ILS—Israeli New Shekel
KRW—South Korean Won
MTN—Medium Term Note
MXN—Mexican Peso
MYR—Malaysian Ringgit
NGN—Nigerian Naira
NR—Not Rated by Moody’s or Standard & Poor’s
PEN—Peruvian Nuevo Sol
PHP—Philippine Peso
PLN—Polish Zloty
RON—Romanian Leu
RUB—Russian Ruble
SGD—Singapore Dollar
THB—Thailand Baht
TRY—Turkish Lira
UYU—Uruguayan Peso
ZAR—South African Rand
| † | The ratings reflected are as of October 31, 2012. Ratings of certain bonds may have changed subsequent to that date. The Portfolio’s current Statement of Additional Information contains a description of Moody’s and Standard & Poor’s ratings. |
| # | Principal amount shown in U.S. dollars unless otherwise stated. |
| (a) | Indicates a security that has been deemed illiquid. |
| (b) | Indicates a restricted security, the aggregate original cost of such securities is $188,913. The aggregate value of $190,400 is approximately 0.5% of net assets. |
| (c) | Variable rate instrument. The interest rate shown reflects the rate in effect at October 31, 2012. |
| (d) | Standard & Poor’s Rating. |
| (e) | Prudential Investments LLC, the manager of the Series, also serves as manager of the Prudential Investment Portfolio 2 - Prudential Core Taxable Money Market Fund. |
| (f) | Includes net unrealized appreciation (depreciation) on the following derivative contracts held at reporting period end: |
See Notes to Financial Statements.
| | | | |
| Prudential Emerging Markets Debt Local Currency Fund | | | 17 | |
Portfolio of Investments
as of October 31, 2012 continued
Forward foreign currency exchange contracts outstanding at October 31, 2012:
| | | | | | | | | | | | | | | | | | |
Purchase Contracts | | Counterparty | | Notional
Amount | | | Value at
Settlement
Date
Payable | | | Value at
October 31,
2012 | | | Unrealized
Appreciation/
(Depreciation) | |
Brazilian Real | | | | | | | | | | | | | | | | | | |
Expiring 01/18/13 | | Citibank NA | | BRL | 257,875 | | | $ | 126,100 | | | $ | 125,572 | | | $ | (528 | ) |
Chilean Peso | | | | | | | | | | | | | | | | | | |
Expiring 12/11/12 | | Citibank NA | | CLP | 81,122,502 | | | | 166,473 | | | | 167,596 | | | | 1,123 | |
Expiring 12/11/12 | | Citibank NA | | CLP | 28,492,960 | | | | 59,200 | | | | 58,865 | | | | (335 | ) |
Chinese Yuan Renminbi | | | | | | | | | | | | | | | | | | |
Expiring 01/04/13 | | Citibank NA | | CNY | 1,794,240 | | | | 283,280 | | | | 285,890 | | | | 2,610 | |
Expiring 03/20/13 | | Goldman Sachs Group LP | | CNY | 2,527,000 | | | | 400,000 | | | | 400,276 | | | | 276 | |
Expiring 03/21/13 | | Barclays Capital, Inc. | | CNY | 1,674,005 | | | | 265,000 | | | | 265,144 | | | | 144 | |
Colombian Peso | | | | | | | | | | | | | | | | | | |
Expiring 01/18/13 | | Citibank NA | | COP | 366,682,007 | | | | 199,577 | | | | 198,352 | | | | (1,225 | ) |
Euro | | | | | | | | | | | | | | | | | | |
Expiring 01/25/13 | | Citibank NA | | EUR | 5,895,000 | | | | 7,678,060 | | | | 7,647,693 | | | | (30,367 | ) |
Expiring 01/25/13 | | Citibank NA | | EUR | 5,895,000 | | | | 7,649,729 | | | | 7,647,693 | | | | (2,036 | ) |
Expiring 01/25/13 | | Citibank NA | | EUR | 325,000 | | | | 422,066 | | | | 421,629 | | | | (437 | ) |
Expiring 01/25/13 | | Citibank NA | | EUR | 180,000 | | | | 234,857 | | | | 233,517 | | | | (1,340 | ) |
Expiring 01/25/13 | | Citibank NA | | EUR | 165,000 | | | | 215,851 | | | | 214,058 | | | | (1,793 | ) |
Expiring 01/25/13 | | Citibank NA | | EUR | 95,000 | | | | 124,621 | | | | 123,245 | | | | (1,376 | ) |
Expiring 01/25/13 | | Citibank NA | | EUR | 90,000 | | | | 116,212 | | | | 116,759 | | | | 547 | |
Expiring 01/25/13 | | Citibank NA | | EUR | 90,000 | | | | 117,066 | | | | 116,759 | | | | (307 | ) |
Expiring 01/25/13 | | Citibank NA | | EUR | 90,000 | | | | 118,230 | | | | 116,759 | | | | (1,471 | ) |
Expiring 01/25/13 | | Citibank NA | | EUR | 45,000 | | | | 58,753 | | | | 58,379 | | | | (374 | ) |
Expiring 01/25/13 | | Citibank NA | | EUR | 35,000 | | | | 45,930 | | | | 45,406 | | | | (524 | ) |
Expiring 01/25/13 | | JPMorgan Chase Bank | | EUR | 85,000 | | | | 111,107 | | | | 110,272 | | | | (835 | ) |
Hungarian Forint | | | | | | | | | | | | | | | | | | |
Expiring 01/24/13 | | Citibank NA | | HUF | 179,743,327 | | | | 814,950 | | | | 813,461 | | | | (1,489 | ) |
Expiring 01/24/13 | | Citibank NA | | HUF | 15,482,544 | | | | 70,800 | | | | 70,069 | | | | (731 | ) |
Expiring 01/24/13 | | Credit Suisse International | | HUF | 14,122,550 | | | | 65,000 | | | | 63,914 | | | | (1,086 | ) |
Expiring 01/24/13 | | Morgan Stanley & Co., Inc. | | HUF | 11,757,384 | | | | 53,700 | | | | 53,210 | | | | (490 | ) |
Indian Rupee | | | | | | | | | | | | | | | | | | |
Expiring 01/14/13 | | Citibank NA | | INR | 19,389,547 | | | | 360,736 | | | | 355,367 | | | | (5,369 | ) |
Expiring 01/14/13 | | Citibank NA | | INR | 11,608,475 | | | | 216,285 | | | | 212,757 | | | | (3,528 | ) |
Expiring 01/14/13 | | Credit Suisse International | | INR | 5,092,950 | | | | 95,000 | | | | 93,342 | | | | (1,658 | ) |
See Notes to Financial Statements.
| | |
| 18 | | Visit our website at www.prudentialfunds.com |
| | | | | | | | | | | | | | | | | | |
Purchase Contracts | | Counterparty | | Notional
Amount | | | Value at
Settlement
Date
Payable | | | Value at
October 31,
2012 | | | Unrealized
Appreciation/
(Depreciation) | |
Indonesian Rupiah | | | | | | | | | | | | | | | | | | |
Expiring 02/06/13 | | Citibank NA | | IDR | 2,790,985,600 | | | $ | 291,700 | | | $ | 286,760 | | | $ | (4,940 | ) |
Expiring 02/06/13 | | Citibank NA | | IDR | 1,090,084,800 | | | | 112,000 | | | | 112,001 | | | | 1 | |
Expiring 02/06/13 | | Citibank NA | | IDR | 939,881,250 | | | | 96,250 | | | | 96,568 | | | | 318 | |
Expiring 02/06/13 | | Citibank NA | | IDR | 699,618,000 | | | | 72,200 | | | | 71,882 | | | | (318 | ) |
Expiring 02/06/13 | | Citibank NA | | IDR | 501,105,000 | | | | 51,586 | | | | 51,486 | | | | (100 | ) |
Israeli New Shekel | | | | | | | | | | | | | | | | | | |
Expiring 01/24/13 | | Citibank NA | | ILS | 370,172 | | | | 94,860 | | | | 94,996 | | | | 136 | |
Expiring 01/24/13 | | Goldman Sachs Group LP | | ILS | 375,327 | | | | 96,250 | | | | 96,318 | | | | 68 | |
Expiring 01/24/13 | | Goldman Sachs Group LP | | ILS | 370,766 | | | | 95,000 | | | | 95,148 | | | | 148 | |
Malaysian Ringgit | | | | | | | | | | | | | | | | | | |
Expiring 01/14/13 | | Citibank NA | | MYR | 9,383,985 | | | | 3,048,728 | | | | 3,063,612 | | | | 14,884 | |
Expiring 01/14/13 | | Citibank NA | | MYR | 1,770,002 | | | | 573,931 | | | | 577,857 | | | | 3,926 | |
Expiring 01/14/13 | | Citibank NA | | MYR | 396,477 | | | | 129,500 | | | | 129,439 | | | | (61 | ) |
Expiring 01/14/13 | | Citibank NA | | MYR | 70,121 | | | | 22,800 | | | | 22,893 | | | | 93 | |
Mexican Peso | | | | | | | | | | | | | | | | | | |
Expiring 11/21/12 | | Citibank NA | | MXN | 13,802,746 | | | | 1,032,908 | | | | 1,051,880 | | | | 18,972 | |
Expiring 01/22/13 | | Citibank NA | | MXN | 8,691,225 | | | | 670,028 | | | | 658,064 | | | | (11,964 | ) |
Expiring 01/22/13 | | Citibank NA | | MXN | 1,629,005 | | | | 124,300 | | | | 123,342 | | | | (958 | ) |
Expiring 01/22/13 | | Citibank NA | | MXN | 1,207,567 | | | | 92,504 | | | | 91,432 | | | | (1,072 | ) |
Expiring 01/22/13 | | Citibank NA | | MXN | 778,569 | | | | 59,200 | | | | 58,950 | | | | (250 | ) |
Expiring 01/22/13 | | Citibank NA | | MXN | 15,225 | | | | 1,169 | | | | 1,153 | | | | (16 | ) |
Philippine Peso | | | | | | | | | | | | | | | | | | |
Expiring 11/05/12 | | Citibank NA | | PHP | 24,124,561 | | | | 584,413 | | | | 585,581 | | | | 1,168 | |
Expiring 12/11/12 | | Citibank NA | | PHP | 7,702,970 | | | | 183,369 | | | | 186,904 | | | | 3,535 | |
Expiring 12/11/12 | | Citibank NA | | PHP | 2,438,166 | | | | 58,100 | | | | 59,160 | | | | 1,060 | |
Polish Zloty | | | | | | | | | | | | | | | | | | |
Expiring 01/24/13 | | Barclays Capital, Inc. | | PLN | 426,723 | | | | 131,290 | | | | 132,363 | | | | 1,073 | |
Expiring 01/24/13 | | Citibank NA | | PLN | 7,881,542 | | | | 2,447,456 | | | | 2,444,740 | | | | (2,716 | ) |
Expiring 01/24/13 | | Citibank NA | | PLN | 451,515 | | | | 143,900 | | | | 140,053 | | | | (3,847 | ) |
Expiring 01/24/13 | | Citibank NA | | PLN | 286,912 | | | | 90,000 | | | | 88,996 | | | | (1,004 | ) |
Expiring 01/24/13 | | Citibank NA | | PLN | 193,161 | | | | 59,200 | | | | 59,916 | | | | 716 | |
Romanian Leu | | | | | | | | | | | | | | | | | | |
Expiring 01/24/13 | | Barclays Capital, Inc. | | RON | 352,738 | | | | 100,000 | | | | 99,466 | | | | (534 | ) |
Expiring 01/24/13 | | Barclays Capital, Inc. | | RON | 338,836 | | | | 95,000 | | | | 95,546 | | | | 546 | |
See Notes to Financial Statements.
| | | | |
| Prudential Emerging Markets Debt Local Currency Fund | | | 19 | |
Portfolio of Investments
as of October 31, 2012 continued
| | | | | | | | | | | | | | | | | | |
Purchase Contracts | | Counterparty | | Notional
Amount | | | Value at
Settlement
Date
Payable | | | Value at
October 31,
2012 | | | Unrealized
Appreciation/
(Depreciation) | |
Expiring 01/24/13 | | Goldman Sachs Group LP | | RON | 346,223 | | | $ | 97,500 | | | $ | 97,628 | | | $ | 128 | |
Russian Ruble | | | | | | | | | | | | | | | | | | |
Expiring 01/17/13 | | Citibank NA | | RUB | 48,737,015 | | | | 1,541,920 | | | | 1,533,113 | | | | (8,807 | ) |
Expiring 01/17/13 | | Citibank NA | | RUB | 7,705,038 | | | | 243,584 | | | | 242,376 | | | | (1,208 | ) |
Expiring 01/17/13 | | Citibank NA | | RUB | 5,381,618 | | | | 170,256 | | | | 169,289 | | | | (967 | ) |
Expiring 01/17/13 | | Citibank NA | | RUB | 4,225,663 | | | | 133,200 | | | | 132,926 | | | | (274 | ) |
Expiring 01/17/13 | | Citibank NA | | RUB | 3,358,388 | | | | 106,400 | | | | 105,644 | | | | (756 | ) |
Singapore Dollar | | | | | | | | | | | | | | | | | | |
Expiring 01/23/13 | | Citibank NA | | SGD | 72,270 | | | | 58,976 | | | | 59,247 | | | | 271 | |
South African Rand | | | | | | | | | | | | | | | | | | |
Expiring 01/30/13 | | Barclays Capital, Inc. | | ZAR | 1,231,843 | | | | 147,563 | | | | 140,109 | | | | (7,454 | ) |
Expiring 01/30/13 | | Citibank NA | | ZAR | 1,004,864 | | | | 120,000 | | | | 114,293 | | | | (5,707 | ) |
Expiring 01/30/13 | | Citibank NA | | ZAR | 966,301 | | | | 108,500 | | | | 109,906 | | | | 1,406 | |
Expiring 01/30/13 | | Citibank NA | | ZAR | 491,993 | | | | 59,200 | | | | 55,959 | | | | (3,241 | ) |
Expiring 01/30/13 | | Citibank NA | | ZAR | 374,422 | | | | 45,000 | | | | 42,586 | | | | (2,414 | ) |
Expiring 01/30/13 | | Citibank NA | | ZAR | 347,656 | | | | 40,818 | | | | 39,542 | | | | (1,276 | ) |
Expiring 01/30/13 | | Goldman Sachs Group LP | | ZAR | 626,970 | | | | 75,000 | | | | 71,311 | | | | (3,689 | ) |
Expiring 01/30/13 | | HSBC | | ZAR | 761,940 | | | | 90,000 | | | | 86,663 | | | | (3,337 | ) |
Expiring 01/30/13 | | JPMorgan Chase Bank | | ZAR | 623,700 | | | | 70,000 | | | | 70,939 | | | | 939 | |
South Korean Won | | | | | | | | | | | | | | | | | | |
Expiring 01/14/13 | | Citibank NA | | KRW | 731,173,763 | | | | 653,709 | | | | 667,708 | | | | 13,999 | |
Expiring 01/17/13 | | Citibank NA | | KRW | 38,815,000 | | | | 35,000 | | | | 35,440 | | | | 440 | |
Expiring 01/17/13 | | Citibank NA | | KRW | 22,128,400 | | | | 20,000 | | | | 20,204 | | | | 204 | |
Thai Baht | | | | | | | | | | | | | | | | | | |
Expiring 11/30/12 | | Citibank NA | | THB | 24,821,698 | | | | 775,097 | | | | 808,235 | | | | 33,138 | |
Expiring 11/30/12 | | Citibank NA | | THB | 10,968,281 | | | | 345,400 | | | | 357,145 | | | | 11,745 | |
Expiring 11/30/12 | | Citibank NA | | THB | 7,138,183 | | | | 229,001 | | | | 232,431 | | | | 3,430 | |
Expiring 11/30/12 | | Citibank NA | | THB | 6,008,790 | | | | 191,772 | | | | 195,656 | | | | 3,884 | |
Expiring 11/30/12 | | Citibank NA | | THB | 2,431,534 | | | | 79,100 | | | | 79,175 | | | | 75 | |
Expiring 11/30/12 | | Citibank NA | | THB | 1,530,946 | | | | 48,100 | | | | 49,850 | | | | 1,750 | |
Expiring 11/30/12 | | Citibank NA | | THB | 1,413,017 | | | | 44,600 | | | | 46,010 | | | | 1,410 | |
Expiring 11/30/12 | | Citibank NA | | THB | 1,162,416 | | | | 36,571 | | | | 37,850 | | | | 1,279 | |
Expiring 11/30/12 | | Citibank NA | | THB | 341,039 | | | | 10,714 | | | | 11,105 | | | | 391 | |
Expiring 11/30/12 | | HSBC | | THB | 6,149,600 | | | | 200,000 | | | | 200,241 | | | | 241 | |
Expiring 11/30/12 | | JPMorgan Chase Bank | | THB | 1,000,608 | | | | 32,313 | | | | 32,581 | | | | 268 | |
See Notes to Financial Statements.
| | |
| 20 | | Visit our website at www.prudentialfunds.com |
| | | | | | | | | | | | | | | | | | |
Purchase Contracts | | Counterparty | | Notional
Amount | | | Value at
Settlement
Date
Payable | | | Value at
October 31,
2012 | | | Unrealized
Appreciation/
(Depreciation) | |
Expiring 11/30/12 | | Morgan Stanley & Co., Inc. | | THB | 1,319,524 | | | $ | 42,800 | | | $ | 42,966 | | | $ | 166 | |
Expiring 11/30/12 | | UBS AG | | THB | 158,845 | | | | 5,000 | | | | 5,172 | | | | 172 | |
Turkish Lira | | | | | | | | | | | | | | | | | | |
Expiring 01/30/13 | | Citibank NA | | TRY | 3,050,112 | | | | 1,672,485 | | | | 1,681,121 | | | | 8,636 | |
Expiring 01/30/13 | | Citibank NA | | TRY | 491,001 | | | | 265,772 | | | | 270,623 | | | | 4,851 | |
Expiring 01/30/13 | | Citibank NA | | TRY | 255,756 | | | | 140,000 | | | | 140,964 | | | | 964 | |
Expiring 01/30/13 | | Citibank NA | | TRY | 231,321 | | | | 126,800 | | | | 127,497 | | | | 697 | |
Expiring 01/30/13 | | Citibank NA | | TRY | 183,140 | | | | 100,000 | | | | 100,941 | | | | 941 | |
Expiring 01/30/13 | | Citibank NA | | TRY | 163,618 | | | | 90,000 | | | | 90,181 | | | | 181 | |
Expiring 01/30/13 | | Citibank NA | | TRY | 55,299 | | | | 30,400 | | | | 30,479 | | | | 79 | |
Expiring 01/30/13 | | Citibank NA | | TRY | 20,235 | | | | 11,039 | | | | 11,153 | | | | 114 | |
| | | | | | | | | | | | | | | | | | |
| | | | | | | | $ | 38,919,815 | | | $ | 38,938,749 | | | $ | 18,934 | |
| | | | | | | | | | | | | | | | | | |
| | | | | |
Sales Contracts | | Counterparty | | Notional
Amount | | | Value at
Settlement
Date
Receivable | | | Value at
October 31,
2012 | | | Unrealized
Appreciation/
(Depreciation) | |
Brazilian Real | | | | | | | | | | | | | | | | | | |
Expiring 01/18/13 | | Citibank NA | | BRL | 897,652 | | | $ | 434,383 | | | $ | 437,112 | | | $ | (2,729 | ) |
Chilean Peso | | | | | | | | | | | | | | | | | | |
Expiring 12/11/12 | | Citibank NA | | CLP | 47,977,930 | | | | 100,100 | | | | 99,120 | | | | 980 | |
Expiring 12/11/12 | | Citibank NA | | CLP | 28,122,735 | | | | 59,100 | | | | 58,100 | | | | 1,000 | |
Chinese Yuan Renminbi | | | | | | | | | | | | | | | | | | |
Expiring 01/04/13 | | Morgan Stanley & Co., Inc. | | CNY | 1,794,240 | | | | 280,000 | | | | 285,890 | | | | (5,890 | ) |
Colombian Peso | | | | | | | | | | | | | | | | | | |
Expiring 01/18/13 | | Citibank NA | | COP | 396,831,600 | | | | 217,800 | | | | 214,660 | | | | 3,140 | |
Euro | | | | | | | | | | | | | | | | | | |
Expiring 01/25/13 | | Citibank NA | | EUR | 5,895,000 | | | | 7,711,809 | | | | 7,647,693 | | | | 64,116 | |
Expiring 01/25/13 | | Citibank NA | | EUR | 3,535,000 | | | | 4,606,176 | | | | 4,586,021 | | | | 20,155 | |
Expiring 01/25/13 | | Citibank NA | | EUR | 2,355,000 | | | | 3,062,070 | | | | 3,055,186 | | | | 6,884 | |
Expiring 01/25/13 | | Citibank NA | | EUR | 603,515 | | | | 780,101 | | | | 782,951 | | | | (2,850 | ) |
Expiring 01/25/13 | | Citibank NA | | EUR | 325,000 | | | | 423,625 | | | | 421,629 | | | | 1,996 | |
Expiring 01/25/13 | | Citibank NA | | EUR | 150,000 | | | | 193,724 | | | | 194,598 | | | | (874 | ) |
Expiring 01/25/13 | | Citibank NA | | EUR | 45,000 | | | | 58,117 | | | | 58,379 | | | | (262 | ) |
Expiring 01/25/13 | | Citibank NA | | EUR | 35,000 | | | | 45,318 | | | | 45,406 | | | | (88 | ) |
Hungarian Forint | | | | | | | | | | | | | | | | | | |
Expiring 01/24/13 | | Citibank NA | | HUF | 42,177,895 | | | | 195,851 | | | | 190,884 | | | | 4,967 | |
See Notes to Financial Statements.
| | | | |
| Prudential Emerging Markets Debt Local Currency Fund | | | 21 | |
Portfolio of Investments
as of October 31, 2012 continued
| | | | | | | | | | | | | | | | | | |
Sales Contracts | | Counterparty | | Notional
Amount | | | Value at
Settlement
Date
Receivable | | | Value at
October 31,
2012 | | | Unrealized
Appreciation/
(Depreciation) | |
Expiring 01/24/13 | | Citibank NA | | HUF | 41,777,135 | | | $ | 186,200 | | | $ | 189,070 | | | $ | (2,870 | ) |
Expiring 01/24/13 | | Citibank NA | | HUF | 12,781,513 | | | | 57,441 | | | | 57,845 | | | | (404 | ) |
Indian Rupee | | | | | | | | | | | | | | | | | | |
Expiring 01/14/13 | | Barclays Capital, Inc. | | INR | 5,043,500 | | | | 96,250 | | | | 92,436 | | | | 3,814 | |
Indonesian Rupiah | | | | | | | | | | | | | | | | | | |
Expiring 02/06/13 | | Citibank NA | | IDR | 7,556,372,955 | | | | 774,774 | | | | 776,380 | | | | (1,606 | ) |
Expiring 02/06/13 | | Citibank NA | | IDR | 1,812,570,000 | | | | 186,000 | | | | 186,232 | | | | (232 | ) |
Israeli New Shekel | | | | | | | | | | | | | | | | | | |
Expiring 01/24/13 | | Citibank NA | | ILS | 348,278 | | | | 90,000 | | | | 89,377 | | | | 623 | |
Expiring 01/24/13 | | UBS AG | | ILS | 791,649 | | | | 205,000 | | | | 203,157 | | | | 1,843 | |
Malaysian Ringgit | | | | | | | | | | | | | | | | | | |
Expiring 01/14/13 | | Barclays Capital, Inc. | | MYR | 203,574 | | | | 66,300 | | | | 66,462 | | | | (162 | ) |
Expiring 01/14/13 | | Citibank NA | | MYR | 3,049,107 | | | | 987,725 | | | | 995,449 | | | | (7,724 | ) |
Mexican Peso | | | | | | | | | | | | | | | | | | |
Expiring 01/22/13 | | Citibank NA | | MXN | 4,123,117 | | | | 313,560 | | | | 312,186 | | | | 1,374 | |
Expiring 01/22/13 | | Citibank NA | | MXN | 1,719,346 | | | | 132,400 | | | | 130,182 | | | | 2,218 | |
Expiring 01/22/13 | | Citibank NA | | MXN | 1,233,330 | | | | 95,000 | | | | 93,383 | | | | 1,617 | |
Expiring 01/22/13 | | Citibank NA | | MXN | 1,170,511 | | | | 90,000 | | | | 88,626 | | | | 1,374 | |
Expiring 01/22/13 | | Citibank NA | | MXN | 908,316 | | | | 70,000 | | | | 68,774 | | | | 1,226 | |
Expiring 01/22/13 | | Citibank NA | | MXN | 776,560 | | | | 59,675 | | | | 58,798 | | | | 877 | |
Expiring 01/22/13 | | Citibank NA | | MXN | 591,238 | | | | 45,600 | | | | 44,766 | | | | 834 | |
Expiring 01/22/13 | | Citibank NA | | MXN | 519,572 | | | | 40,000 | | | | 39,340 | | | | 660 | |
Expiring 01/22/13 | | Morgan Stanley & Co., Inc. | | MXN | 1,181,954 | | | | 91,000 | | | | 89,493 | | | | 1,507 | |
Peruvian Nuevo Sol | | | | | | | | | | | | | | | | | | |
Expiring 01/10/13 | | Citibank NA | | PEN | 2,145,199 | | | | 820,407 | | | | 824,355 | | | | (3,948 | ) |
Expiring 01/10/13 | | Citibank NA | | PEN | 374,472 | | | | 144,000 | | | | 143,902 | | | | 98 | |
Philippine Peso | | | | | | | | | | | | | | | | | | |
Expiring 11/05/12 | | UBS AG | | PHP | 24,124,561 | | | | 570,523 | | | | 585,581 | | | | (15,058 | ) |
Expiring 01/22/13 | | Citibank NA | | PHP | 24,124,561 | | | | 584,413 | | | | 585,163 | | | | (750 | ) |
Expiring 01/22/13 | | Citibank NA | | PHP | 15,955,488 | | | | 381,710 | | | | 387,015 | | | | (5,305 | ) |
Expiring 01/22/13 | | HSBC | | PHP | 16,550,000 | | | | 400,000 | | | | 401,435 | | | | (1,435 | ) |
Polish Zloty | | | | | | | | | | | | | | | | | | |
Expiring 01/24/13 | | Citibank NA | | PLN | 454,435 | | | | 141,200 | | | | 140,959 | | | | 241 | |
Expiring 01/24/13 | | Citibank NA | | PLN | 302,553 | | | | 95,000 | | | | 93,847 | | | | 1,153 | |
Expiring 01/24/13 | | Citibank NA | | PLN | 280,825 | | | | 87,400 | | | | 87,108 | | | | 292 | |
Expiring 01/24/13 | | Citibank NA | | PLN | 224,556 | | | | 70,000 | | | | 69,654 | | | | 346 | |
Expiring 01/24/13 | | Citibank NA | | PLN | 193,057 | | | | 60,000 | | | | 59,884 | | | | 116 | |
See Notes to Financial Statements.
| | |
| 22 | | Visit our website at www.prudentialfunds.com |
| | | | | | | | | | | | | | | | | | |
Sales Contracts | | Counterparty | | Notional
Amount | | | Value at
Settlement
Date
Receivable | | | Value at
October 31,
2012 | | | Unrealized
Appreciation/
(Depreciation) | |
Russian Ruble | | | | | | | | | | | | | | | | | | |
Expiring 01/17/13 | | Citibank NA | | RUB | 3,618,532 | | | $ | 115,000 | | | $ | 113,828 | | | $ | 1,172 | |
Expiring 01/17/13 | | Citibank NA | | RUB | 2,848,365 | | | | 90,000 | | | | 89,600 | | | | 400 | |
Expiring 01/17/13 | | Citibank NA | | RUB | 2,363,355 | | | | 75,000 | | | | 74,344 | | | | 656 | |
Expiring 01/17/13 | | Citibank NA | | RUB | 1,901,700 | | | | 60,000 | | | | 59,952 | | | | 48 | |
Expiring 01/17/13 | | Citibank NA | | RUB | 1,889,997 | | | | 59,675 | | | | 59,453 | | | | 222 | |
Expiring 01/17/13 | | Goldman Sachs Group LP | | RUB | 2,994,638 | | | | 95,000 | | | | 94,202 | | | | 798 | |
South African Rand | | | | | | | | | | | | | | | | | | |
Expiring 01/30/13 | | Citibank NA | | ZAR | 3,406,188 | | | | 406,726 | | | | 387,417 | | | | 19,309 | |
Expiring 01/30/13 | | Citibank NA | | ZAR | 659,268 | | | | 75,000 | | | | 74,985 | | | | 15 | |
Expiring 01/30/13 | | Citibank NA | | ZAR | 536,130 | | | | 60,000 | | | | 60,979 | | | | (979 | ) |
Expiring 01/30/13 | | Citibank NA | | ZAR | 507,405 | | | | 59,675 | | | | 57,712 | | | | 1,963 | |
South Korean Won | | | | | | | | | | | | | | | | | | |
Expiring 01/14/13 | | Citibank NA | | KRW | 237,112,750 | | | | 215,000 | | | | 216,531 | | | | (1,531 | ) |
Thai Baht | | | | | | | | | | | | | | | | | | |
Expiring 11/30/12 | | Citibank NA | | THB | 1,990,695 | | | | 62,174 | | | | 64,820 | | | | (2,646 | ) |
Expiring 11/30/12 | | Citibank NA | | THB | 1,908,678 | | | | 60,000 | | | | 62,150 | | | | (2,150 | ) |
Expiring 11/30/12 | | Citibank NA | | THB | 1,597,875 | | | | 50,000 | | | | 52,029 | | | | (2,029 | ) |
Expiring 11/30/12 | | Morgan Stanley & Co., Inc. | | THB | 1,559,376 | | | | 50,400 | | | | 50,776 | | | | (376 | ) |
Expiring 11/30/12 | | UBS AG | | THB | 2,926,114 | | | | 91,250 | | | | 95,279 | | | | (4,029 | ) |
Turkish Lira | | | | | | | | | | | | | | | | | | |
Expiring 01/30/13 | | Barclays Capital, Inc. | | TRY | 39,256 | | | | 21,312 | | | | 21,637 | | | | (325 | ) |
Expiring 01/30/13 | | Citibank NA | | TRY | 1,167,265 | | | | 638,050 | | | | 643,358 | | | | (5,308 | ) |
Expiring 01/30/13 | | Citibank NA | | TRY | 1,136,657 | | | | 624,326 | | | | 626,488 | | | | (2,162 | ) |
Expiring 01/30/13 | | Citibank NA | | TRY | 229,713 | | | | 125,000 | | | | 126,610 | | | | (1,610 | ) |
Expiring 01/30/13 | | Citibank NA | | TRY | 122,926 | | | | 66,776 | | | | 67,753 | | | | (977 | ) |
Expiring 01/30/13 | | Morgan Stanley & Co., Inc. | | TRY | 147,068 | | | | 80,400 | | | | 81,059 | | | | (659 | ) |
| | | | | | | | | | | | | | | | | | |
| | | | | | | | $ | 28,290,516 | | | $ | 28,219,450 | | | | 71,066 | |
| | | | | | | | | | | | | | | | | | |
| | | | | | | | | | | | | | | | $ | 90,000 | |
| | | | | | | | | | | | | | | | | | |
See Notes to Financial Statements.
| | | | |
| Prudential Emerging Markets Debt Local Currency Fund | | | 23 | |
Portfolio of Investments
as of October 31, 2012 continued
Interest rate swap agreements outstanding as of October 31, 2012:
| | | | | | | | | | | | | | | | | | | | | | | | | | |
Notional
Amount
(000)# | | | Termination
Date | | | Fixed
Rate | | | Floating
Rate | | Fair
Value | | | Upfront
Premiums
Paid/
(Received) | | | Unrealized
Appreciation | | | Counterparty |
| MXN | 8,000 | | | | 02/21/22 | | | | 6.620% | | | 28 Day Mexican Interbank Rate(1) | | $ | 35,387 | | | $ | — | | | $ | 35,387 | | | Barclays Bank PLC |
| MXN | 3,000 | | | | 02/28/22 | | | | 6.440% | | | 28 Day Mexican
Interbank Rate(1) | | | 10,696 | | | | — | | | | 10,696 | | | Barclays Bank PLC |
| | | | | | | | | | | | | | | | | | | | | | | | | | |
| | | | | | | | | | | | | | $ | 46,083 | | | $ | — | | | $ | 46,083 | | | |
| | | | | | | | | | | | | | | | | | | | | | | | | | |
| (1) | Fund pays the floating rate and receives the fixed rate. |
| # | Notional amount is shown in U.S. dollars unless otherwise stated. |
Various inputs are used in determining the value of the Series’ investments. These inputs are summarized in the three broad levels listed below.
Level 1—quoted prices generally in active markets for identical securities.
Level 2—other significant observable inputs including, but not limited to, quoted prices for similar securities, interest rates and yield curves, prepayment speeds, foreign currency exchange rates, and amortized cost.
Level 3—significant unobservable inputs for securities valued in accordance with Board approved fair valuation procedures.
The following is a summary of the inputs used as of October 31, 2012 in valuing such portfolio securities:
| | | | | | | | | | | | |
| | | Level 1 | | | Level 2 | | | Level 3 | |
Investments in Securities | | | | | | | | | | | | |
Foreign Bonds: | | | | | | | | | | | | |
Barbados | | $ | — | | | $ | 190,400 | | | $ | — | |
Brazil | | | — | | | | 4,689,303 | | | | — | |
Colombia | | | — | | | | 1,157,176 | | | | — | |
Costa Rica | | | — | | | | 525,000 | | | | — | |
Dominican Republic | | | — | | | | 175,969 | | | | — | |
Hungary | | | — | | | | 1,834,057 | | | | — | |
Indonesia | | | — | | | | 4,367,977 | | | | — | |
Malaysia | | | — | | | | 1,825,055 | | | | — | |
Mexico | | | — | | | | 2,766,627 | | | | 458,225 | |
Netherlands | | | — | | | | 201,314 | | | | — | |
Nigeria | | | — | | | | 437,265 | | | | — | |
See Notes to Financial Statements.
| | |
| 24 | | Visit our website at www.prudentialfunds.com |
| | | | | | | | | | | | |
| | | Level 1 | | | Level 2 | | | Level 3 | |
Foreign Bonds (continued): | | | | | | | | | | | | |
Peru | | $ | — | | | $ | 1,789,957 | | | $ | — | |
Philippines | | | — | | | | 897,953 | | | | — | |
Poland | | | — | | | | 1,663,530 | | | | — | |
Russia | | | — | | | | 3,194,976 | | | | — | |
Singapore | | | — | | | | 152,431 | | | | — | |
South Africa | | | — | | | | 3,673,439 | | | | — | |
Spain | | | — | | | | 399,880 | | | | — | |
Thailand | | | — | | | | 1,061,595 | | | | — | |
Turkey | | | — | | | | 3,638,344 | | | | — | |
Ukraine | | | — | | | | 234,324 | | | | — | |
United Arab Emirates | | | — | | | | 442,642 | | | | — | |
Uruguay | | | — | | | | 181,980 | | | | — | |
Venezuela | | | — | | | | 1,283,050 | | | | — | |
Affiliated Money Market Mutual Fund | | | 2,597,500 | �� | | | — | | | | — | |
Other Financial Instruments* | | | | | | | | | | | | |
Forward Foreign Currency Exchange Contracts | | | — | | | | 90,000 | | | | — | |
Interest Rate Swap Agreements | | | — | | | | 46,083 | | | | — | |
| | | | | | | | | | | | |
Total | | $ | 2,597,500 | | | $ | 36,920,327 | | | $ | 458,225 | |
| | | | | | | | | | | | |
The following is a reconciliation of assets in which significant unobservable inputs (Level 3) were used in determining fair value:
| | | | |
| | | Foreign Bonds | |
Balance as of 10/31/11 | | $ | 1,275,437 | |
Realized gain (loss) | | | — | |
Change in unrealized appreciation (depreciation)** | | | 4,635 | |
Purchases | | | — | |
Sales | | | — | |
Accrued discount/premium | | | — | |
Transfers into Level 3 | | | — | |
Transfers out of Level 3 | | | (821,847 | ) |
| | | | |
Balance as of 10/31/12 | | $ | 458,225 | |
| | | | |
| * | Other financial instruments are derivative instruments not reflected in the Portfolio of Investments, such as futures, forwards and swap contracts, which are recorded at the unrealized appreciation/depreciation on the instrument. |
| ** | Of which, $4,635 was included in Net Assets relating to securities held at the reporting period end. |
See Notes to Financial Statements.
| | | | |
| Prudential Emerging Markets Debt Local Currency Fund | | | 25 | |
Portfolio of Investments
as of October 31, 2012 continued
It is the Series’ policy to recognize transfers in and transfers out at the fair value as of the beginning of period. At the reporting period end, there was one foreign bond that transferred out of Level 3 as a result of being priced by a vendor.
Included in the table above, under Level 3 securities are foreign bonds being fair valued using pricing methodologies approved by the Valuation Committee, which contain unobservable inputs. Such methodologies include, but not limited to, using prices provided by a single broker/dealer, the cost of the investment, and prices of any recent transactions or bids/offers for such securities or any comparable securities using fixed income securities valuation model.
The industry classification of portfolio holdings and other assets in excess of liabilities shown as a percentage of net assets as of October 31, 2012 was as follows:
| | | | |
Foreign Government Obligations | | | 72.6 | % |
Foreign Agencies | | | 15.8 | |
Foreign Corporations | | | 3.4 | |
Affiliated Money Market Mutual Fund | | | 6.4 | |
| | | | |
| | | 98.2 | |
Other assets in excess of liabilities | | | 1.8 | |
| | | | |
Net Assets | | | 100.0 | % |
| | | | |
Prudential Emerging Markets Debt Local Currency Fund (the “Series”) invested in derivative instruments during the reporting period. The primary types of risk associated with these derivative instruments is foreign exchange risk and interest rate risk. The effect of such derivative instruments on the Series’ financial position and financial performance as reflected in the Statement of Assets and Liabilities and Statement of Operations is presented in the summary below.
Fair values of derivative instruments as of October 31, 2012 as presented in the Statement of Assets and Liabilities:
| | | | | | | | | | | | |
Derivatives not designated
as hedging instruments,
carried at fair value | | Asset Derivatives | | | Liability Derivatives | |
| | Balance Sheet Location | | Fair
Value | | | Balance Sheet Location | | Fair
Value | |
| Foreign exchange contracts | | Unrealized appreciation on forward foreign currency contracts | | $ | 291,177 | | | Unrealized depreciation on forward foreign currency contracts | | $ | 201,177 | |
| Interest rate contracts | | Unrealized appreciation on swap agreements | | | 46,083 | | | — | | | — | |
| | | | | | | | | | | | |
| | | | $ | 337,260 | | | | | $ | 201,177 | |
| | | | | | | | | | | | |
See Notes to Financial Statements.
| | |
| 26 | | Visit our website at www.prudentialfunds.com |
The effects of derivative instruments on the Statement of Operations for the year ended October 31, 2012 are as follows:
| | | | | | | | | | | | | | | | | | | | |
Amount of Realized Gain or (Loss) on Derivatives Recognized in Income | |
Derivatives not designated as hedging
instruments, carried at fair value | | Purchased
Options | | | Futures | | | Forward
Contracts | | | Swaps | | | Total | |
Foreign exchange contracts | | $ | (7,780 | ) | | $ | — | | | $ | 168,756 | | | $ | — | | | $ | 160,976 | |
Interest rate contracts | | | — | | | | (19,889 | ) | | | — | | | | 7,204 | | | | (12,685 | ) |
| | | | | | | | | | | | | | | | | | | | |
Total | | $ | (7,780 | ) | | $ | (19,889 | ) | | $ | 168,756 | | | $ | 7,204 | | | $ | 148,291 | |
| | | | | | | | | | | | | | | | | | | | |
| | | | | | | | | | | | |
Change in Unrealized Appreciation or (Depreciation) on Derivatives Recognized in Income | |
Derivatives not designated as hedging
instruments, carried at fair value | | Forward
Contracts | | | Swaps | | | Total | |
Interest rate contracts | | $ | — | | | $ | 46,083 | | | $ | 46,083 | |
Foreign exchange contracts | | | 158,067 | | | | — | | | | 158,067 | |
| | | | | | | | | | | | |
Total | | $ | 158,067 | | | $ | 46,083 | | | $ | 204,150 | |
| | | | | | | | | | | | |
As of October 31, 2012, the Series’ average volume of derivative activities is as follows:
| | | | | | | | | | |
Forward
Currency
Contracts—Purchased
(Value at Settlement Date Payable) | | | Forward
Currency
Contracts—Sold
(Value at Settlement Date Receivable) | | | Interest Rate Swaps
(Notional
amount in
USD (000) | |
| $ | 25,015,607 | | | $ | 16,450,296 | | | $ | 503 | |
In addition, interest rate futures contracts were bought and sold/closed with an aggregate value at trade date of $1,314,398 and $1,294,509, respectively.
See Notes to Financial Statements.
| | | | |
| Prudential Emerging Markets Debt Local Currency Fund | | | 27 | |
Statement of Assets and Liabilities
as of October 31, 2012
| | | | |
Assets | | | | |
Investments at value: | | | | |
Unaffiliated Investments (cost $37,016,519) | | $ | 37,242,469 | |
Affiliated Investments (cost $2,597,500) | | | 2,597,500 | |
Foreign currency, at value (cost $102,774) | | | 103,124 | |
Dividends and interest receivable | | | 684,117 | |
Receivable for investments sold | | | 656,709 | |
Unrealized appreciation on forward foreign currency contracts | | | 291,177 | |
Unrealized appreciation on swap agreements | | | 46,083 | |
Receivable for Series shares sold | | | 17,201 | |
Foreign tax reclaim receivable | | | 11,290 | |
Prepaid expenses | | | 837 | |
| | | | |
Total assets | | | 41,650,507 | |
| | | | |
| |
Liabilities | | | | |
Payable for investments purchased | | | 655,866 | |
Unrealized depreciation on forward foreign currency contracts | | | 201,177 | |
Accrued expenses | | | 165,288 | |
Payable for Series shares reacquired | | | 43,180 | |
Management fee payable | | | 9,081 | |
Dividends payable | | | 2,733 | |
Distribution fee payable | | | 1,895 | |
Affiliated transfer agent fee payable | | | 434 | |
| | | | |
Total liabilities | | | 1,079,654 | |
| | | | |
| |
Net Assets | | $ | 40,570,853 | |
| | | | |
| | | | | |
Net assets were comprised of: | | | | |
Common stock, at par | | $ | 42,019 | |
Paid-in capital in excess of par | | | 40,777,308 | |
| | | | |
| | | 40,819,327 | |
Distributions in excess of net investment income | | | (492,156 | ) |
Accumulated net realized loss on investment and foreign currency transactions | | | (63,128 | ) |
Net unrealized appreciation on investments and foreign currencies (net of capital gains tax) | | | 306,810 | |
| | | | |
Net assets, October 31, 2012 | | $ | 40,570,853 | |
| | | | |
See Notes to Financial Statements.
| | |
| 28 | | Visit our website at www.prudentialfunds.com |
| | | | |
Class A | | | | |
Net asset value and redemption price per share
($5,985,202 ÷ 622,535 shares of common stock issued and outstanding) | | $ | 9.61 | |
Maximum sales charge (4.50% of offering price) | | | 0.45 | |
| | | | |
Maximum offering price to public | | $ | 10.06 | |
| | | | |
| |
Class C | | | | |
Net asset value, offering price and redemption price per share
($1,025,449 ÷ 106,264 shares of common stock issued and outstanding) | | $ | 9.65 | |
| | | | |
| |
Class Q | | | | |
Net asset value, offering price and redemption price per share
($1,058 ÷ 109.5 shares of common stock issued and outstanding) | | $ | 9.66 | |
| | | | |
| |
Class Z | | | | |
Net asset value, offering price and redemption price per share
($33,559,144 ÷ 3,472,994 shares of common stock issued and outstanding) | | $ | 9.66 | |
| | | | |
See Notes to Financial Statements.
| | | | |
| Prudential Emerging Markets Debt Local Currency Fund | | | 29 | |
Statement of Operations
Year Ended October 31, 2012
| | | | |
Net Investment Income | | | | |
Income | | | | |
Unaffiliated interest income (net of foreign withholding taxes of $93,630) | | $ | 2,038,218 | |
Affiliated dividend income | | | 3,707 | |
| | | | |
Total income | | | 2,041,925 | |
| | | | |
| |
Expenses | | | | |
Management fee | | | 271,577 | |
Distribution fee—Class A | | | 6,803 | |
Distribution fee—Class C | | | 7,858 | |
Custodian’s fees and expenses | | | 150,000 | |
Audit fee | | | 60,000 | |
Registration fees | | | 50,000 | |
Reports to shareholders | | | 21,000 | |
Legal fees and expenses | | | 14,000 | |
Transfer agent’s fees and expenses (including affiliated expense of $2,400) (Note 3) | | | 12,000 | |
Directors’ fees | | | 11,000 | |
Insurance | | | 1,000 | |
Miscellaneous | | | 23,729 | |
| | | | |
Total expenses | | | 628,967 | |
Expense reimbursement (Note 2) | | | (257,440 | ) |
| | | | |
Net expenses | | | 371,527 | |
| | | | |
Net investment income | | | 1,670,398 | |
| | | | |
| |
Realized And Unrealized Gain (Loss) On Investment And Foreign Currency Transactions | | | | |
Net realized gain (loss) on: | | | | |
Investment transactions | | | (523,072 | ) |
Foreign currency transactions | | | 306,542 | |
Financial futures transactions | | | (19,889 | ) |
Swap agreement transactions | | | 7,204 | |
| | | | |
| | | (229,215 | ) |
| | | | |
Net change in unrealized appreciation (depreciation) on: | | | | |
Investments (net of capital gains tax) | | | 1,401,933 | |
Foreign currencies | | | 171,120 | |
Swap agreements | | | 46,083 | |
| | | | |
| | | 1,619,136 | |
| | | | |
Net gain on investment and foreign currency transactions | | | 1,389,921 | |
| | | | |
Net Increase In Net Assets Resulting From Operations | | $ | 3,060,319 | |
| | | | |
See Notes to Financial Statements.
| | |
| 30 | | Visit our website at www.prudentialfunds.com |
Statement of Changes in Net Assets
| | | | | | | | |
| | | Year Ended October 31, 2012 | | | March 30, 2011*
through October 31, 2011 | |
Increase (Decrease) In Net Assets | | | | | | | | |
Operations | | | | | | | | |
Net investment income | | $ | 1,670,398 | | | $ | 810,330 | |
Net realized loss on investment and foreign currency transactions | | | (229,215 | ) | | | (537,861 | ) |
Net change in unrealized appreciation (depreciation) on
investments and foreign currencies | | | 1,619,136 | | | | (1,312,326 | ) |
| | | | | | | | |
Net increase (decrease) in net assets resulting from operations | | | 3,060,319 | | | | (1,039,857 | ) |
| | | | | | | | |
| | |
Dividends and Distributions (Note 1) | | | | | | | | |
Dividends from net investment income | | | | | | | | |
Class A | | | (150,328 | ) | | | (19,533 | ) |
Class C | | | (36,880 | ) | | | (2,172 | ) |
Class Q | | | (58 | ) | | | (12 | ) |
Class Z | | | (1,755,165 | ) | | | (314,913 | ) |
| | | | | | | | |
| | | (1,942,431 | ) | | | (336,630 | ) |
| | | | | | | | |
Tax return of capital | | | | | | | | |
Class A | | | — | | | | (33,363 | ) |
Class C | | | — | | | | (3,710 | ) |
Class Q | | | — | | | | (21 | ) |
Class Z | | | — | | | | (537,863 | ) |
| | | | | | | | |
| | | — | | | | (574,957 | ) |
| | | | | | | | |
| | |
Series share transactions (Note 6) | | | | | | | | |
Net proceeds from shares sold | | | 12,318,655 | | | | 32,459,449 | |
Net asset value of shares issued in reinvestment of dividends and tax return of capital | | | 1,894,634 | | | | 894,161 | |
Cost of shares reacquired | | | (4,310,811 | ) | | | (1,851,679 | ) |
| | | | | | | | |
Net increase in net assets from Series share transactions | | | 9,902,478 | | | | 31,501,931 | |
| | | | | | | | |
Total increase | | | 11,020,366 | | | | 29,550,487 | |
| | |
Net Assets: | | | | | | | | |
Beginning of period | | | 29,550,487 | | | | — | |
| | | | | | | | |
End of period | | $ | 40,570,853 | | | $ | 29,550,487 | |
| | | | | | | | |
| * | Commencement of operations. |
See Notes to Financial Statements.
| | | | |
| Prudential Emerging Markets Debt Local Currency Fund | | | 31 | |
Notes to Financial Statements
Prudential World Fund, Inc. (the “Fund”) is an open-end management investment company, registered under the Investment Company Act of 1940, as amended, (“1940 Act”) and currently consists of five series: Prudential International Equity Fund, Prudential International Value Fund, Prudential Jennison Global Opportunities Fund, Prudential Jennison International Opportunities Fund, and Prudential Emerging Markets Debt Local Currency Fund (the “Series”). These financial statements relate to the Prudential Emerging Markets Debt Local Currency Fund. The financial statements of the other series are not presented herein. The Series commenced investment operations on March 30, 2011. The Series is non-diversified.
The investment objective of the Series is to seek total return, through a combination of current income and capital appreciation.
Note 1. Accounting Policies
The following is a summary of significant accounting policies followed by the Series in the preparation of the financial statements.
Securities Valuation: The Series holds portfolio securities and other assets that are fair valued at the close of each day the New York Stock Exchange (“NYSE”) is open for trading. Fair value is the price that would be received to sell an asset or paid to transfer a liability in an orderly transaction between market participants on the measurement date. The Board of Directors (the “Board”) has delegated fair valuation responsibilities to Prudential Investments LLC (“PI” or “Manager”) through the adoption of Valuation Procedures for valuation of the Series’ securities. Under the current Valuation Procedures, a Valuation Committee is established and responsible for supervising the valuation of portfolio securities and other assets. The Valuation Procedures allow the Series to utilize independent pricing vendor services, quotations from market makers and other valuation methods in events when market quotations are not readily available or not representative of the fair values of the securities. A record of the Valuation Committee’s actions is subject to review, approval and ratification by the Board at its next regularly scheduled quarterly meeting.
Various inputs are used in determining the value of the Series’ investments, which are summarized in the three broad level hierarchies based on any observable inputs used as described in the table following the Portfolio of Investments. The valuation
| | |
| 32 | | Visit our website at www.prudentialfunds.com |
methodologies and significant inputs used in determining the fair value of securities and other assets classified as Level 1, Level 2 and Level 3 of the hierarchy are as follows:
Common stocks, exchange-traded funds and financial derivative instruments (including futures contracts and certain options and swap contracts on securities), that are traded on a national securities exchange are valued at the last sale price as of the close of trading on the applicable exchange. Securities traded via NASDAQ are valued at the NASDAQ official closing price. To the extent these securities are valued at the last sale price or NASDAQ official closing price, they are classified as Level 1 of the fair value hierarchy.
In the event there is no sale or official closing price on such day, these securities are valued at the mean between the last reported bid and asked prices, or at the last bid price in absence of an asked price. These securities are classified as Level 2 of the fair value hierarchy as these inputs are considered as significant other observable inputs to the valuation.
For common stocks traded on foreign securities exchanges, certain valuation adjustments will be applied when events occur after the close of the security’s foreign market and before the Series’ normal pricing time. These securities are valued using pricing vendor services that provide model prices derived using adjustment factors based on information such as local closing price, relevant general and sector indices, currency fluctuations, depositary receipts, and futures, as applicable. Securities valued using model prices are classified as Level 2 of the fair value hierarchy as the adjustment factors are considered as significant other observable inputs to the valuation.
Investments in open-end, non-exchange-traded mutual funds are valued at their net asset value as of the close of the NYSE on the date of valuation. These securities are classified as Level 1 as they have the ability to be purchased or sold at their net asset value on the date of valuation.
Fixed income securities traded in the over-the-counter market, such as corporate bonds, municipal bonds, U.S. Government agencies, issued and guaranteed obligations, U.S. Treasury obligations, and sovereign issues are usually valued at prices provided by approved independent pricing vendors. The pricing vendors provide these prices usually after evaluating observable inputs including yield curves, credit rating, yield spreads, default rates, cash flows as well as broker/dealer quotations and reported trades. Securities valued using such vendor prices are classified as Level 2 of the fair value hierarchy.
| | | | |
| Prudential Emerging Markets Debt Local Currency Fund | | | 33 | |
Notes to Financial Statements
continued
Asset-backed and mortgage-related securities are usually valued by approved independent pricing vendors. The pricing vendors provide the prices using their internal pricing models with input from deal term, tranche level attributes, yield curves, prepayment speeds, default rates and broker/dealer quotes. Securities valued using such vendor prices are classified as Level 2 of the fair value hierarchy.
Short-term debt securities of sufficient credit quality which mature in sixty days or less, are valued at amortized cost, which approximates fair value. The amortized cost method involves valuing a security at its cost on the date of purchase and thereafter assuming a constant amortization to maturity of the difference between the principal amount due at maturity and cost. These securities are categorized as Level 2 of the fair value hierarchy.
Over-the-counter financial derivative instruments, such as option contracts, foreign currency contracts and swaps agreements, are usually valued using pricing vendor services, which derive the valuation based on underlying asset prices, indices, spreads, interest rates, exchange rates and other inputs. These instruments are categorized as Level 2 of the fair value hierarchy.
Securities and other assets that cannot be priced using the methods described above are valued with pricing methodologies approved by the Valuation Committee. In the event there are unobservable inputs used when determining such valuations, the securities will be classified as Level 3 of the fair value hierarchy.
When determining the fair value of securities, some of the factors influencing the valuation include: the nature of any restrictions on disposition of the securities; assessment of the general liquidity of the securities; the issuer’s financial condition and the markets in which it does business; the cost of the investment; the size of the holding and the capitalization of the issuer; the prices of any recent transactions or bids/offers for such securities or any comparable securities; any available analyst media or other reports or information deemed reliable by the investment adviser regarding the issuer or the markets or industry in which it operates. Using fair value to price securities may result in a value that is different from a security’s most recent closing price and from the price used by other mutual funds to calculate their net asset values.
Foreign Currency Translation: The books and records of the Series are maintained in U.S. dollars. Foreign currency amounts are translated into U.S. dollars on the following basis:
(i) market value of investment securities, other assets and liabilities at the current rates of exchange;
| | |
| 34 | | Visit our website at www.prudentialfunds.com |
(ii) purchases and sales of investment securities, income and expenses at the rates of exchange prevailing on the respective dates of such transactions.
Although the net assets of the Series are presented at the foreign exchange rates and market values at the close of the period, the Series does not isolate that portion of the results of operations arising as a result of changes in the foreign exchange rates from the fluctuations arising from changes in the market prices of long-term portfolio securities held at the end of the period. Similarly, the Series does not isolate the effect of changes in foreign exchange rates from the fluctuations arising from changes in the market prices of long-term portfolio securities sold during the period. Accordingly, these realized foreign currency gains or losses are included in the reported net realized gains or losses on investment transactions.
Net realized gains or losses on foreign currency transactions represent net foreign exchange gains or losses from holdings of foreign currencies, currency gains or losses realized between the trade and settlement dates on security transactions, and the difference between the amounts of dividends, interest and foreign withholding taxes recorded on the Series’ books and the U.S. dollar equivalent amounts actually received or paid. Net unrealized currency gains or losses from valuing foreign currency denominated assets and liabilities (other than investments) at period end exchange rates are reflected as a component of net unrealized appreciation (depreciation) on foreign currencies. Foreign security and currency transactions may involve certain considerations and risks not typically associated with those of domestic origin as a result of, among other factors, the possibility of political and economic instability, or the level of governmental supervision and regulation of foreign securities markets.
Forward Currency Contracts: A forward currency contract is a commitment to purchase or sell a foreign currency at a future date at a negotiated forward rate between two parties. The Series entered into forward currency contracts in order to hedge its exposure to changes in foreign currency exchange rates on its foreign portfolio holdings or specific receivables and payables denominated in a foreign currency. The contracts are valued daily at current exchange rates and any unrealized gain or loss is included in net unrealized appreciation or depreciation on foreign currencies. Gain or loss is realized on the settlement date of the contract equal to the difference between the settlement value of the original and negotiated forward contracts. This gain or loss, if any, is included in net realized gain (loss) on foreign currency transactions. Risks may arise upon entering into these contracts from the potential inability of the counterparties to meet the terms of their contracts. Forward currency contracts involve risks from currency exchange rate and credit risk in excess of the amounts reflected on the Statement of Assets and Liabilities. The Series’
| | | | |
| Prudential Emerging Markets Debt Local Currency Fund | | | 35 | |
Notes to Financial Statements
continued
maximum risk of loss from counterparty credit risk is the net value of the cash flows to be received from the counterparty at the end of the contract’s life. Such credit risk may be mitigated by entering into a master netting arrangement between the Series and the counterparty which may permit the Series to offset amounts payable by the Series to the same counterparty against amounts to be received; and by the receipt of collateral from the counterparty by the Series to cover the Series’ exposure to the counterparty. However, there are no assurances that such mitigating factors are easily enforceable.
Financial Futures Contracts: A financial futures contract is an agreement to purchase (long) or sell (short) an agreed amount of securities at a set price for delivery on a future date. Upon entering into a financial futures contract, the Series is required to pledge to the broker an amount of cash and/or other assets equal to a certain percentage of the contract amount. This amount is known as the “initial margin.” Subsequent payments, known as “variation margin,” are made or received by the Series each day, depending on the daily fluctuations in the value of the underlying security. Such variation margin is recorded for financial statement purposes on a daily basis as unrealized gain (loss). When the contract expires or is closed, the gain (loss) is realized and is presented in the Statement of Operations as net realized gain (loss) on financial futures transactions. Financial futures contracts involve elements of risk in excess of the amounts reflected on the Statement of Assets and Liabilities.
The Series invests in financial futures contracts in order to hedge its existing portfolio securities, or securities the Series intends to purchase, against fluctuations in value caused by changes in prevailing interest rates, value of equities or foreign currency exchange rates. Should interest rates move unexpectedly, the Series may not achieve the anticipated benefits of the financial futures contracts and may realize a loss. The use of futures transactions involves the risk of imperfect correlation in movements in the price of futures contracts, interest rates and the underlying hedged assets.
Options: The Series purchased options and may write options in order to hedge against adverse market movements or fluctuations in value caused by changes in prevailing interest rates with respect to securities which the Series currently owns or intends to purchase. The Series’ principal reason for writing options would be to realize, through receipt of premiums, a greater current return than would be realized on the underlying security alone. When the Series purchases an option, it pays a premium and an amount equal to that premium is recorded as an asset. When the Series writes an option, it receives a premium and an amount equal to that premium
| | |
| 36 | | Visit our website at www.prudentialfunds.com |
is recorded as a liability. The asset or liability is adjusted daily to reflect the current market value of the option. If an option expires unexercised, the Series realizes a gain or loss to the extent of the premium received or paid. If an option is exercised, the premium received or paid is recorded as an adjustment to the proceeds from the sale or the cost of the purchase in determining whether the Series has realized a gain or loss. The difference between the premium and the amount received or paid on effecting a closing purchase or sale transaction is also treated as a realized gain or loss. Gain or loss on purchased options is included in net realized gain or loss on investment transactions. Gain or loss on written options is presented separately as net realized gain or loss on options written. The Series, as writer of an option, may have no control over whether the underlying securities may be sold (called) or purchased (put). As a result, the Series bears the market risk of an unfavorable change in the price of the security underlying the written option. Over-the-counter options involve the risk of the potential inability of the counterparties to meet the terms of their contracts.
With exchange-traded futures and options contracts, there is minimal counterparty credit risk to the Fund since the exchanges’ clearinghouse acts as counterparty to all exchange traded futures and options and guarantees the futures and options contracts against default.
Swap Agreements: The Series entered into interest rate swap agreements. A swap agreement is an agreement to exchange the return generated by one instrument for the return generated by another instrument. Swap agreements are negotiated in the over-the-counter market and may be executed either directly with counterparty (“OTC Traded”) or through a central clearing facility, such as a registered commodities exchange (“Exchange Traded”). The swap agreements are valued daily at current market value and any change in value is included in the net unrealized appreciation or depreciation on investments. Payments received or paid by the Series are recorded as realized gains or losses upon termination or maturity of the swap. Risk of loss may exceed amounts recognized on the statements of assets and liabilities. Swap agreements outstanding at period end, if any, are listed on the Portfolio of Investments.
Interest Rate Swaps: Interest rate swaps represent an agreement between counterparties to exchange cash flows based on the difference between two interest rates, applied to a notional principal amount for a specified period. The Series is subject to interest rate risk exposure in the normal course of pursuing its investment objectives. The Series used interest rate swaps to maintain its ability to generate steady cash flow by receiving a stream of fixed rate payments and to increase exposure to prevailing market rates by receiving floating rate payments using interest
| | | | |
| Prudential Emerging Markets Debt Local Currency Fund | | | 37 | |
Notes to Financial Statements
continued
rate swap contracts. The Series’ maximum risk of loss from counterparty credit risk is the discounted net value of the cash flows to be received from the counterparty over the contract’s remaining life. Such credit risk may be mitigated by entering into a master netting arrangement between the Series and the counterparty which may permit the Series to offset amounts payable by the Series to the same counterparty against amounts to be received; and by the receipt of collateral from the counterparty by the Series to cover the Series’ exposure to the counterparty. However, there are no assurances that such mitigating factors are easily enforceable.
In addition to each instrument’s primary underlying risk exposure (e.g. interest rate), swap agreements involve, to varying degrees, elements of credit, market risk and documentation risk. Such risks involve the possibility that there will be no liquid market for these agreements, that the counterparty to the agreement may default on its obligation to perform or disagree as to the meaning of the contractual terms in the agreement, that there will be unfavorable changes in net interest rates. In connection with these agreements, securities in the portfolio may be identified as collateral or received as collateral from the counterparty in accordance with the terms of the respective swap agreements to provide or receive assets of value and serve as recourse in the event of default or bankruptcy/insolvency of either party.
Such over-the-counter derivative agreements include conditions which when materialized, give the counterparty the right to cause an early termination of the transactions under those agreements. Any election by the counterparty for early termination of the contract(s) may impact the amounts reported on financial statements.
As of October 31, 2012, the Series has not met conditions under such agreements that give the counterparty the right to call for an early termination.
Concentration of Risk: The ability of issuers of debt securities (other than those issued or guaranteed by the U.S. Government), held by the Series, to meet their obligations may be affected by the economic or political developments in a specific industry, region or country. Foreign security and currency transactions may involve certain considerations and risks not typically associated with those of domestic origin as a result of, among other factors, the possibility of political or economic instability, or the level of governmental supervision and regulation of foreign securities markets.
| | |
| 38 | | Visit our website at www.prudentialfunds.com |
Securities Transactions and Net Investment Income: Securities transactions are recorded on the trade date. Realized gains or losses from investment and currency transactions are calculated on the identified cost basis. Dividend income is recorded on the ex-dividend date. Interest income, including amortization of premium and accretion of discount on debt securities, as required, is recorded on an accrual basis. Expenses are recorded on the accrual basis, which may require the use of certain estimates by management, that may differ from actual.
Net investment income or loss (other than distribution fees which are charged directly to the respective class) and unrealized and realized gains or losses are allocated daily to each class of shares based upon the relative proportion of adjusted net assets of each class at the beginning of the day.
Dividends and Distributions: The Series declares dividends of net investment income daily and payment is made monthly. Distributions of net realized capital and currency gains, if any, are made annually. Dividends and distributions are recorded on the ex-dividend date. Dividends and distributions are determined in accordance with federal income tax regulations which may differ from generally accepted accounting principles. Permanent book/tax differences relating to income and gains are reclassified amongst distribution in excess of net investment income, accumulated net realized gain or loss and paid-in-capital in excess of par, as appropriate.
Taxes: For federal income tax purposes, each series in the Fund is treated as a separate taxpaying entity. It is each series’ policy to continue to meet the requirements of the Internal Revenue Code applicable to regulated investment companies and to distribute all of its taxable net investment income and capital gains, if any, to its shareholders. Therefore, no federal income tax provision is required.
Withholding taxes on foreign interest are recorded, net of reclaimable amounts, at the time the related income is earned.
Estimates: The preparation of the financial statements requires management to make estimates and assumptions that affect the reported amounts and disclosures in the financial statements. Actual results could differ from those amounts.
Note 2. Agreements
The Series has a management agreement with PI. Pursuant to this agreement, PI has responsibility for all investment advisory services and supervises the subadvisor’s performance of such services. PI has entered into a subadvisory agreement with
| | | | |
| Prudential Emerging Markets Debt Local Currency Fund | | | 39 | |
Notes to Financial Statements
continued
Prudential Investment Management, Inc. (“PIM”). The subadvisory agreement provides that PIM will furnish investment advisory services in connection with the management of the Series. In connection therewith, PIM is obligated to keep certain books and records of the Series. PI pays for the services of PIM, the cost of compensation of officers of the Series, occupancy and certain clerical and bookkeeping costs of the Series. The Series bears all other costs and expenses.
The management fee paid to PI is computed daily and payable monthly at an annual rate of .80% of the average daily net assets of the Series.
PI has contractually agreed through February 28, 2014 to limit net annual Series operating expenses (excluding distribution and service (12b-1) fees, extraordinary and certain other expenses such as taxes, interest and brokerage commissions) to each class of shares to 1.05% of the Series’ average daily net assets.
The Series has a distribution agreement with Prudential Investment Management Services LLC (“PIMS”) who acts as the distributor of the Class A, Class C, Class Q and Class Z shares. The Series compensates PIMS for distributing and servicing the Series’ Class A and Class C, pursuant to plans of distribution (the “Class A and C Plans”), regardless of expenses actually incurred by PIMS. The distribution fees are accrued daily and payable monthly. No distribution or service fees are paid to PIMS as distributor of the Class Q and Z shares of the Series.
Pursuant to the Class A and C Plans, the Series compensates PIMS for distribution related activities at an annual rate of up to .30% and 1% of the average daily net assets of the Class A and C shares, respectively. PIMS has contractually agreed through February 28, 2014, to limit such expenses to .25% of the average daily net assets of the Class A shares.
PIMS has advised the Series that it received $24,141 in front-end sales charges resulting from sales of Class A shares during the year ended October 31, 2012. From these fees, PIMS paid such sales charges to affiliated broker-dealers, which in turn paid commissions to salespersons and incurred other distribution costs.
PIMS has advised the Series that it has received $685 in contingent deferred sales charges imposed upon certain redemptions by Class C Shareholders for the year ended October 31, 2012.
| | |
| 40 | | Visit our website at www.prudentialfunds.com |
PI, PIM and PIMS are indirect, wholly-owned subsidiaries of Prudential Financial, Inc. (“Prudential”).
Note 3. Other Transactions with Affiliates
Prudential Mutual Fund Services LLC (“PMFS”), an affiliate of PI and an indirect, wholly-owned subsidiary of Prudential, serves as the Series’ transfer agent. Transfer agent fees and expenses in the Statement of Operations include certain out-of-pocket expenses paid to non-affiliates, where applicable.
The Series invests in the Prudential Core Taxable Money Market Fund (the “Core Fund”), a Series of the Prudential Investment Portfolios 2 registered under the 1940 Act, and managed by PI. Earnings from the Core Fund are disclosed on the Statement of Operations as affiliated dividend income.
Note 4. Portfolio Securities
Purchases and sales of portfolio securities, other than short-term investments, for the year ended October 31, 2012, were $32,179,208 and $22,265,590, respectively.
Note 5. Distributions and Tax Information
Distributions to shareholders, which are determined in accordance with federal income tax regulations and which may differ from generally accepted accounting principles, are recorded on the ex-dividend date. In order to present distributions in excess of net investment income, accumulated net realized loss on investment and foreign currency transactions and paid-in capital in excess of par on the Statement of Assets and Liabilities that more closely represent their tax character, certain adjustments have been made to distributions in excess of net investment income and accumulated net realized loss on investment and foreign currency transactions. For the year ended October 31, 2012, the adjustments were to increase distributions in excess of net investment income and decrease accumulated net realized loss on investment and foreign currency transactions by $183,845 due to the differences in the treatment for book and tax purposes of certain transactions involving foreign currencies, swaps, paydown gains/losses and other book to tax adjustments. Net investment income, net realized loss on investment and foreign currency transactions and net assets were not affected by this change.
For the years ended October 31, 2012, the tax character of dividends paid as reflected in the Statement of Changes in Net Assets was $1,942,431 of ordinary
| | | | |
| Prudential Emerging Markets Debt Local Currency Fund | | | 41 | |
Notes to Financial Statements
continued
income. For the period ended October 31, 2011, the tax character of dividends paid as reflected in the Statement of Changes in Net Assets were $336,630 of ordinary income and $574,957 of tax return of capital.
As of October 31, 2012, the Fund had accumulated undistributed earnings on a tax basis of $330,673 of ordinary income and $91,800 of long-term capital gains. This differs from the amount shown on the Statement of Assets and Liabilities primarily due to cumulative timing differences between financial and tax reporting.
The United States federal income tax basis of the Series’ investments and the net unrealized depreciation as of October 31, 2012 were as follows:
| | | | | | | | | | |
Tax Basis | | Appreciation | | Depreciation | | Net
Unrealized
Depreciation | | Other Cost
Basis
Adjustments | | Total Net
Unrealized
Depreciation |
| $40,520,247 | | $489,437 | | $(1,169,715) | | $(680,278) | | $70,143 | | $(610,135) |
The difference between book basis and tax basis is primarily attributable to the difference in the treatment of amortization of premiums, wash sales and straddle loss deferrals. The other cost basis adjustments are primarily attributable to appreciation (depreciation) of foreign currencies, swaps and mark-to-market of receivables and payables.
Management has analyzed the Series’ tax positions taken on federal income tax returns for all open tax years and has concluded that no provision for income tax is required in the Series’ financial statements for the current reporting period. The Series’ federal and state income and federal excise tax returns for tax years for which the applicable statutes of limitations have not expired are subject to examination by the Internal Revenue Service and state departments of revenue.
Note 6. Capital
The Series offers Class A, Class C, Class Q and Class Z shares. Class A shares are sold with a front-end sales charge of up to 4.50%. All Investors who purchase Class A shares in an amount of $1 million or more and sell these shares within 12 months of purchase are subject to a contingent deferred sales charge (CDSC) of 1%. The Class A CDSC is waived for purchases by certain retirement and/or benefit plans. Class C shares are sold with a contingent deferred sales charge of 1% on shares redeemed
| | |
| 42 | | Visit our website at www.prudentialfunds.com |
within the first 12 months after purchase. A special exchange privilege is also available for shareholders who qualified to purchase Class A shares at net asset value. Class Q and Z shares are not subject to any sales or redemption charge and are offered exclusively for sale to a limited group of investors.
Under certain circumstances, an exchange may be made from specified share classes of the Series to one or more other share classes of the Series as presented in the table of transactions in shares of common stock. For the fiscal year ended October 31, 2012, no such exchanges were made.
As of October 31, 2012, Prudential Financial, Inc. through its affiliates owned 109 Class A shares, 108 Class C shares, 109 Class Q shares and 110 Class Z shares of the Series.
There are 275 million shares of common stock at $0.01 par value per share, designated Class A, Class C, Class Q and Class Z common stock, each of which consists of 75 million, 75 million, 50 million and 75 million authorized shares, respectively.
Transactions in shares of common stock were as follows:
| | | | | | | | |
Class A | | Shares | | | Amount | |
Year ended October 31, 2012: | | | | | | | | |
Shares sold | | | 507,223 | | | $ | 4,807,892 | |
Shares issued in reinvestment of dividends | | | 13,747 | | | | 128,087 | |
Shares reacquired | | | (178,210 | ) | | | (1,655,069 | ) |
| | | | | | | | |
Net increase (decrease) in shares outstanding | | | 342,760 | | | $ | 3,280,910 | |
| | | | | | | | |
Period ended October 31, 2011:* | | | | | | | | |
Shares sold | | | 415,348 | | | $ | 4,173,929 | |
Shares issued in reinvestment of dividends and tax return of capital | | | 4,853 | | | | 46,027 | |
Shares reacquired | | | (140,426 | ) | | | (1,355,681 | ) |
| | | | | | | | |
Net increase (decrease) in shares outstanding | | | 279,775 | | | $ | 2,864,275 | |
| | | | | | | | |
| | | | |
| Prudential Emerging Markets Debt Local Currency Fund | | | 43 | |
Notes to Financial Statements
continued
| | | | | | | | |
Class C | | Shares | | | Amount | |
Year ended October 31, 2012: | | | | | | | | |
Shares sold | | | 76,112 | | | $ | 714,307 | |
Shares issued in reinvestment of dividends | | | 3,789 | | | | 35,467 | |
Shares reacquired | | | (15,867 | ) | | | (147,837 | ) |
| | | | | | | | |
Net increase (decrease) in shares outstanding | | | 64,034 | | | $ | 601,937 | |
| | | | | | | | |
Period ended October 31, 2011:* | | | | | | | | |
Shares sold | | | 50,542 | | | $ | 505,520 | |
Shares issued in reinvestment of dividends and tax return of capital | | | 571 | | | | 5,479 | |
Shares reacquired | | | (8,883 | ) | | | (82,126 | ) |
| | | | | | | | |
Net increase (decrease) in shares outstanding | | | 42,230 | | | $ | 428,873 | |
| | | | | | | | |
Class Q | | | | | | |
Year ended October 31, 2012: | | | | | | | | |
Shares issued in reinvestment of dividends | | | 6.1 | | | $ | 58 | |
| | | | | | | | |
Net increase (decrease) in shares outstanding | | | 6.1 | | | $ | 58 | |
| | | | | | | | |
Period ended October 31, 2011:* | | | | | | | | |
Shares sold | | | 100.0 | | | $ | 1,000 | |
Shares issued in reinvestment of dividends and tax return of capital | | | 3.4 | | | | 33 | |
| | | | | | | | |
Net increase (decrease) in shares outstanding | | | 103.4 | | | $ | 1,033 | |
| | | | | | | | |
Class Z | | | | | | |
Year ended October 31, 2012: | | | | | | | | |
Shares sold | | | 721,461 | | | $ | 6,796,456 | |
Shares issued in reinvestment of dividends | | | 185,266 | | | | 1,731,022 | |
Shares reacquired | | | (264,332 | ) | | | (2,507,905 | ) |
| | | | | | | | |
Net increase (decrease) in shares outstanding | | | 642,395 | | | $ | 6,019,573 | |
| | | | | | | | |
Period ended October 31, 2011:* | | | | | | | | |
Shares sold | | | 2,790,861 | | | $ | 27,779,000 | |
Shares issued in reinvestment of dividends and tax return of capital | | | 85,813 | | | | 842,622 | |
Shares reacquired | | | (46,075 | ) | | | (413,872 | ) |
| | | | | | | | |
Net increase (decrease) in shares outstanding | | | 2,830,599 | | | $ | 28,207,750 | |
| | | | | | | | |
| * | Commencement of operations on March 30, 2011. |
Note 7. Borrowing
The Series, along with other affiliated registered investment companies (the “Funds”), is a party to a Syndicated Credit Agreement (“SCA”) with a group of banks. The purpose of the SCA is to provide an alternative source of temporary funding for capital share
| | |
| 44 | | Visit our website at www.prudentialfunds.com |
redemptions. The SCA provides for a commitment of $900 million for the period December 16, 2011 through November 14, 2012. The SCA has been renewed effective November 15, 2012 at substantially similar terms through November 14, 2013. The Funds pay an annualized commitment fee of 0.08% of the unused portion of the SCA. Prior to December 16, 2011, the Funds had another SCA of a $750 million commitment with an annualized commitment fee of 0.10% of the unused portion. Interest on any borrowings under the SCA is paid at contracted market rates. The commitment fee for the unused amount is accrued daily and paid quarterly.
The Series did not utilize the SCA during the year ended October 31, 2012.
Note 8. Dividends and Distributions to Shareholders
Subsequent to the fiscal year end, in addition to the monthly dividend paid by the Series, the Series declared an ordinary income dividend on December 19, 2012 to shareholders of record on December 20, 2012. The ex-dividend date was December 21, 2012. The per share amounts declared were as follows:
| | | | |
| | | Ordinary Income | |
Class A | | $ | 0.04746 | |
Class C | | $ | 0.04746 | |
Class Q | | $ | 0.04746 | |
Class Z | | $ | 0.04746 | |
The Series declared capital gain distributions on December 19, 2012 to shareholders of record on December 24, 2012. The ex-dividend date was December 26, 2012. The per share amounts declared were as follows:
| | | | | | | | |
| | | Short-Term
Capital Gains | | | Long-Term
Capital Gains | |
Class A | | $ | 0.02784 | | | $ | 0.02090 | |
Class C | | $ | 0.02784 | | | $ | 0.02090 | |
Class Q | | $ | 0.02784 | | | $ | 0.02090 | |
Class Z | | $ | 0.02784 | | | $ | 0.02090 | |
Note 9. New Accounting Pronouncement
In December 2011, the Financial Accounting Standards Board (“FASB”) issued Accounting Standards Update (“ASU”) No. 2011-11 regarding “Disclosures about Offsetting Assets and Liabilities”. The amendments, which will be effective for annual reporting periods beginning on or after January 1, 2013 and interim periods within
| | | | |
| Prudential Emerging Markets Debt Local Currency Fund | | | 45 | |
Notes to Financial Statements
continued
those annual periods, require an entity to disclose information about offsetting and related arrangements for assets and liabilities, financial instruments and derivatives that are either currently offset in accordance with current requirements or are subject to enforceable master netting arrangements or similar agreements. At this time, management is evaluating the implications of ASU No. 2011-11 and its impact on the financial statements has not yet been determined.
| | |
| 46 | | Visit our website at www.prudentialfunds.com |
Financial Highlights
| | | | | | | | | | |
| Class A Shares | |
| | | Year Ended
October 31,
2012(b) | | | | | March 30,
2011(a)
through
October 31,
2011 | |
| Per Share Operating Performance: | | | | | | | | | | |
| Net Asset Value, Beginning Of Period | | | $9.36 | | | | | | $10.00 | |
| Income (loss) from investment operations: | | | | | | | | | | |
| Net investment income | | | .42 | | | | | | .32 | |
Net realized and unrealized gain (loss) on
investment and foreign currency transactions | | | .35 | | | | | | (.62 | ) |
| Total from investment operations | | | .77 | | | | | | (.30 | ) |
| Less Dividends and Distributions: | | | | | | | | | | |
| Dividends from net investment income | | | (.52 | ) | | | | | (.13 | ) |
| Tax return of capital | | | - | | | | | | (.21 | ) |
| Total dividends and distributions | | | (.52 | ) | | | | | (.34 | ) |
| Net asset value, end of period | | | $9.61 | | | | | | $9.36 | |
| Total Return(c): | | | 8.53% | | | | | | (3.14)% | |
| |
| Ratios/Supplemental Data: | | | | | | | | |
| Net assets, end of period (000) | | | $5,985 | | | | | | $2,620 | |
| Average net assets (000) | | | $2,721 | | | | | | $1,634 | |
| Ratios to average net assets(d)(e): | | | | | | | | | | |
| Expenses, including distribution and service (12b-1) fees(f) | | | 1.30% | | | | | | 1.30% | (g) |
| Expenses, excluding distribution and service (12b-1) fees | | | 1.05% | | | | | | 1.05% | (g) |
| Net investment income | | | 4.73% | | | | | | 4.85% | (g) |
| Portfolio turnover rate | | | 70% | | | | | | 60% | (h) |
(a) Commencement of operations.
(b) Calculated based on average shares outstanding during the period.
(c) Total return does not consider the effects of sales loads. Total return is calculated assuming a purchase of a share on the first day and a sale on the last day of the reporting period, and includes reinvestment of dividends and distributions. Total return may reflect adjustments to conform to generally accepted accounting principles. Total return for a period less than a full year is not annualized.
(d) Does not include expenses of the underlying fund in which the Series invests.
(e) Net of expense waiver/reimbursement. If the investment manager had not waived/reimbursed expenses, the expense ratios including and excluding distribution and services (12b-1) fees and net investment income ratio would be 2.04%, 1.79% and 3.99%, respectively, for the year ended October 31, 2012 and 2.76%, 2.51% and 3.39%, respectively, for the period ended October 31, 2011.
(f) The distributor of the Series has contractually agreed to limit its distribution and service (12b-1) fees to .25% of the average daily net assets of the Class A shares.
(g) Annualized.
(h) Not annualized.
See Notes to Financial Statements.
| | | | |
| Prudential Emerging Markets Debt Local Currency Fund | | | 47 | |
Financial Highlights
continued
| | | | | | | | | | |
| Class C Shares | |
| | | Year Ended
October 31,
2012(b) | | | | | March 30,
2011(a)
through
October 31,
2011 | |
| Per Share Operating Performance: | | | | | | | | | | |
| Net Asset Value, Beginning Of Period | | | $9.41 | | | | | | $10.00 | |
| Income (loss) from investment operations: | | | | | | | | | | |
| Net investment income | | | .37 | | | | | | .31 | |
Net realized and unrealized gain (loss) on
investment and foreign currency transactions | | | .32 | | | | | | (.57 | ) |
| Total from investment operations | | | .69 | | | | | | (.26 | ) |
| Less Dividends and Distributions: | | | | | | | | | | |
| Dividends from net investment income | | | (.45 | ) | | | | | (.12 | ) |
| Tax return of capital | | | - | | | | | | (.21 | ) |
| Total dividends and distributions | | | (.45 | ) | | | | | (.33 | ) |
| Net asset value, end of period | | | $9.65 | | | | | | $9.41 | |
| Total Return(c): | | | 7.55% | | | | | | (2.72)% | |
| |
| Ratios/Supplemental Data: | | | | | | | | |
| Net assets, end of period (000) | | | $1,025 | | | | | | $398 | |
| Average net assets (000) | | | $786 | | | | | | $211 | |
| Ratios to average net assets(d)(e): | | | | | | | | | | |
| Expenses, including distribution and service (12b-1) fees | | | 2.05% | | | | | | 2.05% | (f) |
| Expenses, excluding distribution and service (12b-1) fees | | | 1.05% | | | | | | 1.05% | (f) |
| Net investment income | | | 3.89% | | | | | | 4.09% | (f) |
| Portfolio turnover rate | | | 70% | | | | | | 60% | (g) |
(a) Commencement of operations.
(b) Calculated based on average shares outstanding during the period.
(c) Total return does not consider the effects of sales loads. Total return is calculated assuming a purchase of a share on the first day and a sale on the last day of the reporting period, and includes reinvestment of dividends and distributions. Total return may reflect adjustments to conform to generally accepted accounting principles. Total return for a period less than a full year is not annualized.
(d) Does not include expenses of the underlying fund in which the Series invests.
(e) Net of expense waiver/reimbursement. If the investment manager had not waived/reimbursed expenses, the expense ratios including and excluding distribution and services (12b-1) fees and net investment income ratio would be 2.78%, 1.78% and 3.16%, respectively, for the year ended October 31, 2012 and 3.52%, 2.52% and 2.62%, respectively, for the period ended October 31, 2011.
(f) Annualized.
(g) Not annualized.
See Notes to Financial Statements.
| | |
| 48 | | Visit our website at www.prudentialfunds.com |
| | | | | | | | | | |
| Class Q Shares | | | | | | | | |
| | | Year Ended
October 31,
2012(b) | | | | | March 30,
2011(a)
through
October 31,
2011 | |
| Per Share Operating Performance: | | | | | | | | | | |
| Net Asset Value, Beginning Of Period | | | $9.37 | | | | | | $10.00 | |
| Income (loss) from investment operations: | | | | | | | | | | |
| Net investment income | | | .47 | | | | | | .29 | |
Net realized and unrealized gain (loss) on
investment and foreign currency transactions | | | .37 | | | | | | (.59 | ) |
| Total from investment operations | | | .84 | | | | | | (.30 | ) |
| Less Dividends and Distributions: | | | | | | | | | | |
| Dividends from net investment income | | | (.55 | ) | | | | | (.12 | ) |
| Tax return of capital | | | - | | | | | | (.21 | ) |
| Total dividends and distributions | | | (.55 | ) | | | | | (.33 | ) |
| Net asset value, end of period | | | $9.66 | | | | | | $9.37 | |
| Total Return(c): | | | 9.31% | | | | | | (3.14)% | |
| |
| Ratios/Supplemental Data: | | | | | | | | |
| Net assets, end of period (000) | | | $1 | | | | | | $1 | |
| Average net assets (000) | | | $1 | | | | | | $1 | |
| Ratios to average net assets(d)(e): | | | | | | | | | | |
| Expenses, including distribution and service (12b-1) fees | | | 1.05% | | | | | | 1.05% | (f) |
| Expenses, excluding distribution and service (12b-1) fees | | | 1.05% | | | | | | 1.05% | (f) |
| Net investment income | | | 5.06% | | | | | | 4.98% | (f) |
| Portfolio turnover rate | | | 70% | | | | | | 60% | (g) |
(a) Commencement of operations.
(b) Calculated based on average shares outstanding during the period.
(c) Total return is calculated assuming a purchase of a share on the first day and a sale on the last day of the reporting period, and includes reinvestment of dividends and distributions. Total return may reflect adjustments to conform to generally accepted accounting principles. Total return for a period less than a full year is not annualized.
(d) Does not include expenses of the underlying fund in which the Series invests.
(e) Net of expense waiver/reimbursement. If the investment manager had not waived/reimbursed expenses, the expense ratios including and excluding distribution and services (12b-1) fees and net investment income ratio would be 1.71%, 1.71% and 4.40%, respectively, for the year ended October 31, 2012 and 2.67%, 2.67% and 3.36%, respectively, for the period ended October 31, 2011.
(f) Annualized.
(g) Not annualized.
See Notes to Financial Statements.
| | | | |
| Prudential Emerging Markets Debt Local Currency Fund | | | 49 | |
Financial Highlights
continued
| | | | | | | | | | |
| Class Z Shares | | | | | | | | |
| | | Year Ended
October 31,
2012(b) | | | | | March 30,
2011(a)
through
October 31,
2011 | |
| Per Share Operating Performance: | | | | | | | | | | |
| Net Asset Value, Beginning Of Period | | | $9.37 | | | | | | $10.00 | |
| Income (loss) from investment operations: | | | | | | | | | | |
| Net investment income | | | .47 | | | | | | .29 | |
Net realized and unrealized gain (loss) on
investment and foreign currency transactions | | | .36 | | | | | | (.59 | ) |
| Total from investment operations | | | .83 | | | | | | (.30 | ) |
| Less Dividends and Distributions: | | | | | | | | | | |
| Dividends from net investment income | | | (.54 | ) | | | | | (.12 | ) |
| Tax return of capital | | | - | | | | | | (.21 | ) |
| Total dividends and distributions | | | (.54 | ) | | | | | (.33 | ) |
| Net asset value, end of period | | | $9.66 | | | | | | $9.37 | |
| Total Return(c): | | | 9.21% | | | | | | (3.14)% | |
| |
| Ratios/Supplemental Data: | | | | | | | | |
| Net assets, end of period (000) | | | $33,559 | | | | | | $26,532 | |
| Average net assets (000) | | | $30,441 | | | | | | $25,697 | |
| Ratios to average net assets(d)(e): | | | | | | | | | | |
Expenses, including distribution and
service (12b-1) fees | | | 1.05% | | | | | | 1.05% | (f) |
Expenses, excluding distribution and
service (12b-1) fees | | | 1.05% | | | | | | 1.05% | (f) |
| Net investment income | | | 4.96% | | | | | | 4.99% | (f) |
| Portfolio turnover rate | | | 70% | | | | | | 60% | (g) |
(a) Commencement of operations.
(b) Calculated based on average shares outstanding during the period.
(c) Total return is calculated assuming a purchase of a share on the first day and a sale on the last day of the reporting period, and includes reinvestment of dividends and distributions. Total return may reflect adjustments to conform to generally accepted accounting principles. Total return for a period less than a full year is not annualized.
| (d) | Does not include expenses of the underlying portfolios in which the Series invests. |
(e) Net of expense waiver/reimbursement. If the investment manager had not waived/reimbursed expenses, the expense ratios including and excluding distribution and services (12b-1) fees and net investment income ratio would be 1.81%, 1.81% and 4.20%,respectively, for the year ended October 31, 2012 and 2.72%, 2.72% and 3.32%, respectively, for the period ended October 31, 2011.
(f) Annualized.
(g) Not annualized.
See Notes to Financial Statements.
| | |
| 50 | | Visit our website at www.prudentialfunds.com |
Report of Independent Registered Public
Accounting Firm
The Board of Trustees and Shareholders
Prudential World Fund, Inc.:
We have audited the accompanying statement of assets and liabilities of Prudential Emerging Markets Debt Local Currency Fund (one of the series constituting Prudential World Fund, Inc., hereafter referred to as the “Fund”), including the portfolio of investments, as of October 31, 2012, and the related statements of operations for the year then ended, the statement of changes in net assets and financial highlights for the year then ended and for the period March 30, 2011 (commencement of operations) to October 31, 2011. These financial statements and financial highlights are the responsibility of the Fund’s management. Our responsibility is to express an opinion on these financial statements and financial highlights based on our audits.
We conducted our audits in accordance with the standards of the Public Company Accounting Oversight Board (United States). Those standards require that we plan and perform the audit to obtain reasonable assurance about whether the financial statements and financial highlights are free of material misstatement. An audit includes examining, on a test basis, evidence supporting the amounts and disclosures in the financial statements. Our procedures included confirmation of securities owned as of October 31, 2012, by correspondence with the custodian, transfer agent and brokers or by other appropriate auditing procedures when replies from brokers were not received. An audit also includes assessing the accounting principles used and significant estimates made by management, as well as evaluating the overall financial statement presentation. We believe that our audits provide a reasonable basis for our opinion.
In our opinion, the financial statements and financial highlights referred to above present fairly, in all material respects, the financial position of the Fund as of October 31, 2012, and the results of its operations for the year then ended, the changes in its net assets and the financial highlights for the year then ended and for the period March 30, 2011 to October 31, 2011, in conformity with U.S. generally accepted accounting principles.

New York, New York
December 21, 2012
| | | | |
| Prudential Emerging Markets Debt Local Currency Fund | | | 51 | |
Tax Information
(Unaudited)
For the year ended October 31, 2012, the Fund reports the maximum amount allowable but not less than 4.84% as interest related dividends in accordance with Section 871(k)(1) and 881(e)(1) of the Internal Revenue Code.
Interest-related dividends do not include any distributions paid by a fund with respect to Fund tax years beginning after October 31, 2012. Consequently, this provision expires with respect to such distributions paid after the Fund’s fiscal year end.
In January 2013, you will be advised on IRS Form 1099-DIV or substitute 1099-DIV, as to the federal tax status of distributions received by you in calendar year 2012.
| | |
| 52 | | Visit our website at www.prudentialfunds.com |
INFORMATION ABOUT BOARD MEMBERS AND OFFICERS
(Unaudited)
Information about Board Members and Officers of the Fund is set forth below. Board Members who are not deemed to be “interested persons” of the Fund, as defined in the 1940 Act, are referred to as “Independent Board Members.” Board Members who are deemed to be “interested persons” of the Fund are referred to as “Interested Board Members.” The Board Members are responsible for the overall supervision of the operations of the Fund and perform the various duties imposed on the directors of investment companies by the 1940 Act. The Board in turn elects the Officers, who are responsible for administering the day-to-day operations of the Fund.
| | | | |
| Independent Board Members(1) |
Name, Address, Age Position(s) Portfolios Overseen | | Principal Occupation(s) During Past Five Years | | Other Directorships Held |
Kevin J. Bannon (60) Board Member Portfolios Overseen: 63 | | Managing Director (since April 2008) and Chief Investment Officer (since October 2008) of Highmount Capital LLC (registered investment adviser); formerly Executive Vice President and Chief Investment Officer (April 1993-August 2007) of Bank of New York Company; President (May 2003-May 2007) of BNY Hamilton Family of Mutual Funds. | | Director of Urstadt Biddle Properties (since September 2008). |
Linda W. Bynoe (60) Board Member Portfolios Overseen: 63 | | President and Chief Executive Officer (since March 1995) and formerly Chief Operating Officer (December 1989-February 1995) of Telemat Ltd. (management consulting); formerly Vice President (January 1985-June 1989) at Morgan Stanley & Co (broker-dealer). | | Director of Simon Property Group, Inc. (retail real estate) (May 2003-May 2012); Director of Anixter International, Inc. (communication products distributor) (since January 2006); Director of Northern Trust Corporation (financial services) (since April 2006); Trustee of Equity Residential (residential real estate) (since December 2009). |
Michael S. Hyland, CFA (67) Board Member Portfolios Overseen: 63 | | Independent Consultant (since February 2005); formerly Senior Managing Director (July 2001-February 2005) of Bear Stearns & Co, Inc.; Global Partner, INVESCO (1999-2001); Managing Director and President of Salomon Brothers Asset Management (1989-1999). | | None. |
Douglas H. McCorkindale (73) Board Member Portfolios Overseen: 63 | | Formerly Chairman (February 2001-June 2006), Chief Executive Officer (June 2000-July 2005), President (September 1997-July 2005) and Vice Chairman (March 1984-May 2000) of Gannett Co. Inc. (publishing and media). | | Director of Lockheed Martin Corp. (aerospace and defense) (since May 2001). |
Visit our website at www.prudentialfunds.com
| | | | |
| Independent Board Members(1) |
Name, Address, Age Position(s) Portfolios Overseen | | Principal Occupation(s) During Past Five Years | | Other Directorships Held |
Stephen P. Munn (70) Board Member Portfolios Overseen: 63 | | Lead Director (since 2007) and formerly Chairman (1993-2007) of Carlisle Companies Incorporated (manufacturer of industrial products). | | Lead Director (since 2007) of Carlisle Companies Incorporated (manufacturer of industrial products). |
Richard A. Redeker (69) Board Member & Independent Chair Portfolios Overseen: 63 | | Retired Mutual Fund Senior Executive (44 years); Management Consultant; Independent Directors Council (organization of 2,800 Independent Mutual Fund Directors)-Executive Committee, Chair of Policy Steering Committee, Governing Council. | | None. |
Robin B. Smith (73) Board Member Portfolios Overseen: 63 | | Chairman of the Board (since January 2003) of Publishers Clearing House (direct marketing); Member of the Board of Directors of ADLPartner (marketing) (since December 2010); formerly Chairman and Chief Executive Officer (August 1996-January 2003) of Publishers Clearing House. | | Formerly Director of BellSouth Corporation (telecommunications) (1992-2006). |
Stephen G. Stoneburn (69) Board Member Portfolios Overseen: 63 | | Chairman, (since July 2011), President and Chief Executive Officer (since June 1996) of Quadrant Media Corp. (publishing company); formerly President (June 1995-June 1996) of Argus Integrated Media, Inc.; Senior Vice President and Managing Director (January 1993-1995) of Cowles Business Media; Senior Vice President of Fairchild Publications, Inc. (1975-1989). | | None. |
| | | | |
| Interested Board Members(1) |
Name, Address, Age Position(s) Portfolios Overseen | | Principal Occupation(s) During Past Five Years | | Other Directorships Held |
Stuart S. Parker (50) Board Member & President Portfolios Overseen: 63 | | President of Prudential Investments LLC (since January 2012); Executive Vice President of Jennison Associates LLC and Head of Retail Distribution of Prudential Investments LLC (June 2005 - December 2011). | | None. |
Prudential Emerging Markets Debt Local Currency Fund
| | | | |
| Interested Board Members(1) |
Name, Address, Age Position(s) Portfolios Overseen | | Principal Occupation(s) During Past Five Years | | Other Directorships Held |
Scott E. Benjamin (39) Board Member & Vice President Portfolios Overseen: 63 | | Executive Vice President (since June 2009) of Prudential Investments LLC; Executive Vice President (June 2009-June 2012) and Vice President (since June 2012) of Prudential Investment Management Services LLC; Executive Vice President (since September 2009) of AST Investment Services, Inc.; Senior Vice President of Product Development and Marketing, Prudential Investments (since February 2006); Vice President of Product Development and Product Management, Prudential Investments (2003-2006). | | None. |
| (1) | The year that each Board Member joined the Funds’ Board is as follows: |
Kevin J. Bannon, 2008; Linda W. Bynoe, 2005; Michael S. Hyland, 2008; Douglas H. McCorkindale, 2003; Stephen P. Munn, 2008; Richard A. Redeker, 2003; Robin B. Smith, 1996; Stephen G. Stoneburn, 1996; Stuart S. Parker, Board Member and President since 2012; Scott E. Benjamin, Board Member since 2010 and Vice President since 2009.
| | |
| Fund Officers(a)(1) |
Name, Address and Age Position with Fund | | Principal Occupation(s) During Past Five Years |
Judy A. Rice (64) Vice President | | Chairman of Prudential Investments LLC (since January 2012); President, Chief Executive Officer (May 2011-Present) and Executive Vice President (December 2008-May 2011) of Prudential Investment Management Services LLC; formerly President, Chief Executive Officer, Chief Operating Officer and Officer-In-Charge (February 2003-December 2011) of Prudential Investments LLC; formerly President, Chief Executive Officer and Officer-In-Charge (April 2003-December 2011) of Prudential Mutual Fund Services LLC (PMFS); formerly Member of the Board of Directors of Jennison Associates LLC (November 2010-December 2011); formerly Vice President (February 1999-April 2006) of Prudential Investment Management Services LLC; formerly President, COO, CEO and Manager of PIFM Holdco, LLC (April 2006-December 2011); formerly President, Chief Executive Officer, Chief Operating Officer and Officer-In-Charge (May 2003-June 2005) and Director (May 2003-March 2006) and Executive Vice President (June 2005-March 2006) of AST Investment Services, Inc.; Member of Board of Governors of the Investment Company Institute. |
Visit our website at www.prudentialfunds.com
| | |
| Fund Officers(a)(1) |
Name, Address and Age Position with Fund | | Principal Occupation(s) During Past Five Years |
Raymond A. O’Hara (57) Chief Legal Officer | | Vice President and Corporate Counsel (since July 2010) of Prudential Insurance Company of America (Prudential); Vice President (March 2011-Present) of Pruco Life Insurance Company and Pruco Life Insurance Company of New Jersey; Vice President and Corporate Counsel (March 2011-Present) of Prudential Annuities Life Assurance Corporation; Chief Legal Officer of Prudential Investments LLC (since June 2012); Chief Legal Officer of PMFS (since June 2012) and Corporate Counsel of AST Investment Services, Inc. (since June 2012); formerly Assistant Vice President and Corporate Counsel (September 2008-July 2010) of The Hartford Financial Services Group, Inc.; formerly Associate (September 1980-December 1987) and Partner (January 1988– August 2008) of Blazzard & Hasenauer, P.C. (formerly, Blazzard, Grodd & Hasenauer, P.C.). |
Deborah A. Docs (54) Secretary | | Vice President and Corporate Counsel (since January 2001) of Prudential; Vice President (since December 1996) and Assistant Secretary (since March 1999) of Prudential Investments LLC; formerly Vice President and Assistant Secretary (May 2003-June 2005) of AST Investment Services, Inc. |
Jonathan D. Shain (54) Assistant Secretary | | Vice President and Corporate Counsel (since August 1998) of Prudential; Vice President and Assistant Secretary (since May 2001) of Prudential Investments LLC; Vice President and Assistant Secretary (since February 2001) of PMFS; formerly Vice President and Assistant Secretary (May 2003-June 2005) of AST Investment Services, Inc. |
Claudia DiGiacomo (38) Assistant Secretary | | Vice President and Corporate Counsel (since January 2005) of Prudential; Vice President and Assistant Secretary of Prudential Investments LLC (since December 2005); Associate at Sidley Austin Brown & Wood LLP (1999-2004). |
Andrew R. French (50) Assistant Secretary | | Vice President and Corporate Counsel (since February 2010) of Prudential; formerly Director and Corporate Counsel (2006-2010) of Prudential; Vice President and Assistant Secretary (since January 2007) of Prudential Investments LLC; Vice President and Assistant Secretary (since January 2007) of PMFS. |
Amanda S. Ryan (34) Assistant Secretary | | Director and Corporate Counsel (since March 2012) of Prudential; Director and Assistant Secretary (since June 2012) of Prudential Investments LLC; Associate at Ropes & Gray (2008-2012). |
Timothy J. Knierim (53) Chief Compliance Officer | | Chief Compliance Officer of Prudential Investment Management, Inc. (since July 2007); formerly Chief Risk Officer of Prudential Investment Management, Inc. and Prudential Investments LLC (2002-2007) and formerly Chief Ethics Officer of Prudential Investment Management, Inc. and Prudential Investments LLC (2006-2007). |
Valerie M. Simpson (54) Deputy Chief Compliance Officer | | Chief Compliance Officer (since April 2007) of Prudential Investments LLC and AST Investment Services, Inc.; formerly Vice President-Financial Reporting (June 1999-March 2006) for Prudential Life and Annuities Finance. |
Prudential Emerging Markets Debt Local Currency Fund
| | |
| Fund Officers(a)(1) |
Name, Address and Age Position with Fund | | Principal Occupation(s) During Past Five Years |
Theresa C. Thompson (50) Deputy Chief Compliance Officer | | Vice President, Compliance, Prudential Investments LLC (since April 2004); and Director, Compliance, Prudential Investments LLC (2001-2004). |
Richard W. Kinville (44) Anti-Money Laundering Compliance Officer | | Vice President, Corporate Compliance, Anti-Money Laundering Unit (since January 2005) of Prudential; committee member of the American Council of Life Insurers Anti-Money Laundering and Critical Infrastructure Committee (since January 2007); formerly Investigator and Supervisor in the Special Investigations Unit for the New York Central Mutual Fire Insurance Company (August 1994-January 1999); Investigator in AXA Financial’s Internal Audit Department and Manager in AXA’s Anti-Money Laundering Office (January 1999-January 2005); first chair of the American Council of Life Insurers Anti-Money Laundering and Critical Infrastructure Committee (June 2007-December 2009). |
Grace C. Torres (53) Treasurer and Principal Financial and Accounting Officer | | Assistant Treasurer (since March 1999) and Senior Vice President (since September 1999) of Prudential Investments LLC; Assistant Treasurer (since May 2003) and Vice President (since June 2005) of AST Investment Services, Inc.; Senior Vice President and Assistant Treasurer (since May 2003) of Prudential Annuities Advisory Services, Inc.; formerly Senior Vice President (May 2003-June 2005) of AST Investment Services, Inc. |
M. Sadiq Peshimam (48) Assistant Treasurer | | Vice President (since 2005) of Prudential Investments LLC. |
Peter Parrella (54) Assistant Treasurer | | Vice President (since 2007) and Director (2004-2007) within Prudential Mutual Fund Administration; formerly Tax Manager at SSB Citi Fund Management LLC (1997-2004). |
(a) Excludes Mr. Parker and Mr. Benjamin, interested Board Members who also serve as President and Vice President, respectively.
(1) The year that each individual became an officer of the Fund is as follows:
Judy A. Rice, 2012; Raymond A. O’Hara, 2012; Deborah A. Docs, 2005; Jonathan D. Shain, 2005; Claudia DiGiacomo, 2005; Andrew R. French, 2006; Amanda S. Ryan, 2012; Timothy J. Knierim, 2007; Valerie M. Simpson, 2007; Theresa C. Thompson, 2008; Richard W. Kinville, 2011; Grace C. Torres, 1995; Sadiq Peshimam, 2006; Peter Parrella, 2007.
Explanatory Notes to Tables:
| n | Board Members are deemed to be “Interested,” as defined in the 1940 Act, by reason of their affiliation with Prudential Investments LLC and/or an affiliate of Prudential Investments LLC. |
| n | Unless otherwise noted, the address of all Board Members and Officers is c/o Prudential Investments LLC, Gateway Center Three, 100 Mulberry Street, Newark, New Jersey 07102-4077. |
| n | There is no set term of office for Board Members or Officers. The Board Members have adopted a retirement policy, which calls for the retirement of Board Members on December 31 of the year in which they reach the age of 75. |
| n | “Other Directorships Held” includes only directorships of companies required to register or file reports with the SEC under the 1934 Act (that is, “public companies”) or other investment companies registered under the 1940 Act. |
| n | “Portfolios Overseen” includes all investment companies managed by Prudential Investments LLC. The investment companies for which PI serves as manager include the Prudential Investments Mutual Funds, The Prudential Variable Contract Accounts, Target Mutual Funds, Prudential Short Duration High Yield Fund, Inc., The Prudential Series Fund, Prudential’s Gibraltar Fund, Inc. and the Advanced Series Trust. |
Visit our website at www.prudentialfunds.com
Approval of Advisory Agreements
The Fund’s Board of Directors
The Board of Directors (the “Board”) of Prudential Emerging Markets Debt Local Currency Fund (the “Fund”)1 consists of ten individuals, eight of whom are not “interested persons” of the Fund, as defined in the Investment Company Act of 1940, as amended (the “1940 Act”) (the “Independent Trustees”). The Board is responsible for the oversight of the Fund and its operations, and performs the various duties imposed on the Trustees of investment companies by the 1940 Act. The Independent Trustees have retained independent legal counsel to assist them in connection with their duties. The Chair of the Board is an Independent Director. The Board has established three standing committees: the Audit Committee, the Nominating and Governance Committee, and the Investment Committee. Each committee is chaired by, and composed of, Independent Trustees.
Annual Approval of the Fund’s Advisory Agreements
As required under the 1940 Act, the Board determines annually whether to renew the Fund’s management agreement with Prudential Investments LLC (“PI”) and the Fund’s subadvisory agreement with Prudential Investment Management, Inc. (“PIM”). In considering the renewal of the agreements, the Board, including all of the Independent Trustees, met on June 5-7, 2012 and approved the renewal of the agreements through July 31, 2013, after concluding that the renewal of the agreements was in the best interests of the Fund and its shareholders.
In advance of the meetings, the Board requested and received materials relating to the agreements, and had the opportunity to ask questions and request further information in connection with its consideration. Among other things, the Board considered comparative fee information from PI and PIM. Also, the Board considered comparisons with other mutual funds in relevant Peer Universes and Peer Groups, as is further discussed below.
In approving the agreements, the Board, including the Independent Trustees advised by independent legal counsel, considered the factors it deemed relevant, including the nature, quality and extent of services provided by PI and the subadviser, the performance of the Fund, the profitability of PI and its affiliates, expenses and fees, and the potential for economies of scale that may be shared with the Fund and its shareholders as the Fund’s assets grow. In their deliberations, the Trustees did not identify any single factor which alone was responsible for the Board’s decision to approve the agreements with respect to the Fund. In connection with its deliberations, the Board considered information provided by PI throughout the year at regular Board
| 1 | Prudential Emerging Markets Debt Local Currency Fund is a series of Prudential World Fund, Inc. |
Prudential Emerging Markets Debt Local Currency Fund
Approval of Advisory Agreements (continued)
meetings, presentations from portfolio managers and other information, as well as information furnished at or in advance of the meetings on June 5-7, 2012.
The Trustees determined that the overall arrangements between the Fund and PI, which serves as the Fund’s investment manager pursuant to a management agreement, and between PI and PIM, which serves as the Fund’s subadviser pursuant to the terms of a subadvisory agreement with PI, are in the best interests of the Fund and its shareholders in light of the services performed, fees charged and such other matters as the Trustees considered relevant in the exercise of their business judgment.
The material factors and conclusions that formed the basis for the Trustees’ reaching their determinations to approve the continuance of the agreements are separately discussed below.
Nature, Quality and Extent of Services
The Board received and considered information regarding the nature, quality and extent of services provided to the Fund by PI and PIM. The Board considered the services provided by PI, including but not limited to the oversight of the subadviser for the Fund, as well as the provision of fund recordkeeping, compliance, and other services to the Fund. With respect to PI’s oversight of the subadviser, the Board noted that PI’s Strategic Investment Research Group (“SIRG”), which is a business unit of PI, is responsible for monitoring and reporting to PI’s senior management on the performance and operations of the subadviser. The Board also considered that PI pays the salaries of all of the officers and non-independent Trustees of the Fund. The Board also considered the investment subadvisory services provided by PIM, including investment research and security selection, as well as adherence to the Fund’s investment restrictions and compliance with applicable Fund policies and procedures. The Board considered PI’s evaluation of the subadviser, as well as PI’s recommendation, based on its review of the subadviser, to renew the subadvisory agreement.
The Board reviewed the qualifications, backgrounds and responsibilities of PI’s senior management responsible for the oversight of the Fund and PIM, and also reviewed the qualifications, backgrounds and responsibilities of PIM’s portfolio managers who are responsible for the day-to-day management of the Fund’s portfolio. The Board was provided with information pertaining to PI’s and PIM’s organizational structure, senior management, investment operations, and other relevant information pertaining to both PI and PIM. The Board also noted that it received favorable compliance reports from the Fund’s Chief Compliance Officer (“CCO”) as to both PI and PIM. The Board noted that PIM is affiliated with PI.
Visit our website at www.prudentialfunds.com
The Board concluded that it was satisfied with the nature, extent and quality of the investment management services provided by PI and the subadvisory services provided to the Fund by PIM, and that there was a reasonable basis on which to conclude that the Fund benefits from the services provided by PI and PIM under the management and subadvisory agreements.
Costs of Services and Profits Realized by PI
The Board was provided with information on the profitability of PI and its affiliates in serving as the Fund’s investment manager. The Board discussed with PI the methodology utilized in assembling the information regarding profitability and considered its reasonableness. The Board recognized that it is difficult to make comparisons of profitability from fund management contracts because comparative information is not generally publicly available and is affected by numerous factors, including the structure of the particular adviser, the types of funds it manages, its business mix, numerous assumptions regarding allocations and the adviser’s capital structure and cost of capital. However, the Board considered that the cost of services provided by PI for the year ended December 31, 2011 exceeded the management fees received by PI, resulting in an operating loss to PI. The Board did not separately consider the profitability of the subadviser, an affiliate of PI, as its profitability was reflected in the profitability report for PI. Taking these factors into account, the Board concluded that the profitability of PI and its affiliates in relation to the services rendered was not unreasonable.
Economies of Scale
The Board noted that the management fee schedule for the Fund does not contain breakpoints that would reduce the fee rate on assets above specified levels. The Board received and discussed information concerning whether PI realizes economies of scale as the Fund’s assets grow beyond current levels. The Board recognized the inherent limitations of any analysis of economies of scale, stemming largely from the Board’s understanding that most of PI’s costs are not specific to any individual funds, but rather are incurred across a variety of products and services. In light of the Fund’s current size, performance and expense structure, the Board concluded that the absence of breakpoints in the Fund’s fee schedule is acceptable at this time.
Other Benefits to PI and PIM
The Board considered potential ancillary benefits that might be received by PI and PIM and their affiliates as a result of their relationship with the Fund. The Board concluded that potential benefits to be derived by PI included fees received by affiliates of PI for serving as the Fund’s securities lending agent, transfer agency fees received by the Fund’s transfer agent (which is affiliated with PI), as well as benefits to its reputation or other intangible benefits resulting from PI’s association with the Fund. The Board
Prudential Emerging Markets Debt Local Currency Fund
Approval of Advisory Agreements (continued)
concluded that the potential benefits to be derived by PIM included the ability to use soft dollar credits, as well as the potential benefits consistent with those generally resulting from an increase in assets under management, specifically, potential access to additional research resources and benefits to its reputation. The Board concluded that the benefits derived by PI and PIM were consistent with the types of benefits generally derived by investment managers and subadvisers to mutual funds.
Performance of the Fund / Fees and Expenses
The Board considered certain additional specific factors and made related conclusions relating to the historical performance of the Fund for the fourth calendar quarter ended December 31, 2011. The Board considered that the Fund commenced operations on March 30, 2011, and that longer-term performance was not yet available.
The Board also considered the Fund’s actual management fee, as well as the Fund’s net total expense ratio, for the fiscal year ended October 31, 2011. The Board considered the management fee for the Fund as compared to the management fee charged by PI to other funds and the fee charged by other advisers to comparable mutual funds in a Peer Group. The actual management fee represents the fee rate actually paid by Fund shareholders and includes any fee waivers or reimbursements. The net total expense ratio for the Fund represents the actual expense ratio incurred by Fund shareholders.
The mutual funds included in the Peer Universe (the Lipper Emerging Markets Debt Funds Performance Universe) and the Peer Group were objectively determined by Lipper Inc. (“Lipper”), an independent provider of mutual fund data. The comparisons placed the Fund in various quartiles, with the first quartile being the best 25% of the mutual funds (for performance, the best performing mutual funds and, for expenses, the lowest cost mutual funds).
The section below summarizes key factors considered by the Board and the Board’s conclusions regarding the Fund’s performance, fees and overall expenses. The table sets forth gross performance comparisons (which do not reflect the impact on performance of fund expenses, or any subsidies, expense caps or waivers that may be applicable) with the Peer Universe, actual management fees with the Peer Group (which reflect the impact of any subsidies or fee waivers), and net total expenses with the Peer Group, each of which were key factors considered by the Board.
| | | | | | | | | | |
| Performance | | Q4 2011 | | 1 Year | | 3 Years | | 5 Years | | 10 Years |
| | 4th Quartile | | N/A | | N/A | | N/A | | N/A |
| Actual Management Fees: 1st Quartile |
| Net Total Expenses: 4th Quartile |
Visit our website at www.prudentialfunds.com
| | • | | The Board noted that the Fund outperformed its benchmark index for the fourth quarter of 2011. |
| | • | | The Board accepted PI’s recommendation to continue the existing expense cap of 1.05% (exclusive of 12b-1 fees and certain other fees) through February 28, 2014. |
| | • | | The Board concluded that, in light of the Fund’s recent inception date and strong short-term performance against its benchmark index at the end of 2011, it would be in the best interests of the Fund and its shareholders to renew the agreements. |
| | • | | The Board concluded that the management fees (including subadvisory fees) and total expenses were reasonable in light of the services provided. |
* * *
After full consideration of these factors, the Board concluded that the approval of the agreements was in the best interests of the Fund and its shareholders.
Prudential Emerging Markets Debt Local Currency Fund
| | | | |
| n MAIL | | n TELEPHONE | | n WEBSITE |
Gateway Center Three 100 Mulberry Street Newark, NJ 07102 | | (800) 225-1852 | | www.prudentialfunds.com |
|
| PROXY VOTING |
| The Board of Directors of the Fund has delegated to the Fund’s investment subadviser the responsibility for voting any proxies and maintaining proxy recordkeeping with respect to the Fund. A description of these proxy voting policies and procedures is available without charge, upon request, by calling (800) 225-1852 or by visiting the Securities and Exchange Commission’s website at www.sec.gov. Information regarding how the Fund voted proxies relating to portfolio securities during the most recent 12-month period ended June 30 is available on the Fund’s website and on the Securities and Exchange Commission’s website. |
|
| DIRECTORS |
Kevin J. Bannon • Scott E. Benjamin • Linda W. Bynoe • Michael S. Hyland • Douglas H. McCorkindale • Stephen P. Munn • Stuart S. Parker • Richard A. Redeker •
Robin B. Smith • Stephen G. Stoneburn |
|
| OFFICERS |
| Stuart S. Parker, President • Judy A. Rice, Vice President • Scott E. Benjamin, Vice President • Grace C. Torres, Treasurer and Principal Financial and Accounting Officer • Raymond A. O’Hara, Chief Legal Officer • Deborah A. Docs, Secretary • Timothy J. Knierim, Chief Compliance Officer • Valerie M. Simpson, Deputy Chief Compliance Officer • Theresa C. Thompson, Deputy Chief Compliance Officer • Richard W. Kinville, Anti-Money Laundering Compliance Officer • Jonathan D. Shain, Assistant Secretary • Claudia DiGiacomo, Assistant Secretary • Amanda S. Ryan, Assistant Secretary • Andrew R. French, Assistant Secretary • M. Sadiq Peshimam, Assistant Treasurer • Peter Parrella, Assistant Treasurer |
| | | | |
| MANAGER | | Prudential Investments LLC | | Gateway Center Three
100 Mulberry Street
Newark, NJ 07102 |
|
| INVESTMENT SUBADVISER | | Prudential Investment
Management, Inc. | | Gateway Center Two
100 Mulberry Street
Newark, NJ 07102 |
|
| DISTRIBUTOR | | Prudential Investment
Management Services LLC | | Gateway Center Three
100 Mulberry Street
Newark, NJ 07102 |
|
| CUSTODIAN | | The Bank of New York Mellon | | One Wall Street
New York, NY 10286 |
|
| TRANSFER AGENT | | Prudential Mutual Fund
Services LLC | | PO Box 9658
Providence, RI 02940 |
|
| INDEPENDENT REGISTERED PUBLIC ACCOUNTING FIRM | | KPMG LLP | | 345 Park Avenue
New York, NY 10154 |
|
| FUND COUNSEL | | Willkie Farr & Gallagher LLP | | 787 Seventh Avenue
New York, NY 10019 |
|
| An investor should consider the investment objectives, risks, charges, and expenses of the Fund carefully before investing. The prospectus and summary prospectus contain this and other information about the Fund. An investor may obtain a prospectus and summary prospectus by visiting our website at www.prudentialfunds.com or by calling (800) 225-1852. The prospectus and summary prospectus should be read carefully before investing. |
|
| E-DELIVERY |
| To receive your mutual fund documents online, go to www.prudentialfunds.com/edelivery and enroll. Instead of receiving printed documents by mail, you will receive notification via email when new materials are available. You can cancel your enrollment or change your email address at any time by visiting the website address above. |
|
| SHAREHOLDER COMMUNICATIONS WITH DIRECTORS |
| Shareholders can communicate directly with the Board of Directors by writing to the Chair of the Board, Prudential Emerging Markets Debt Local Currency Fund, Prudential Investments, Attn: Board of Directors, 100 Mulberry Street, Gateway Center Three, Newark, NJ 07102. Shareholders can communicate directly with an individual Director by writing to the same address. Communications are not screened before being delivered to the addressee. |
|
| AVAILABILITY OF PORTFOLIO SCHEDULE |
| The Fund files its complete schedule of portfolio holdings with the Securities and Exchange Commission for the first and third quarters of each fiscal year on Form N-Q. The Fund’s Forms N-Q are available on the Commission’s website at www.sec.gov. The Fund’s Forms N-Q may also be reviewed and copied at the Commission’s Public Reference Room in Washington, D.C. Information on the operation and location of the Public Reference Room may be obtained by calling (202) 551-8090. The Fund’s schedule of portfolio holdings is also available on the Fund’s website as of the end of each month. |
|
| The Fund’s Statement of Additional Information contains additional information about the Fund’s Directors and is available without charge, upon request, by calling (800) 225-1852. |
Mutual Funds:
| | | | |
| ARE NOT INSURED BY THE FDIC OR ANY FEDERAL GOVERNMENT AGENCY | | MAY LOSE VALUE | | ARE NOT A DEPOSIT OF OR GUARANTEED BY ANY BANK OR ANY BANK AFFILIATE |

PRUDENTIAL EMERGING MARKETS DEBT LOCAL CURRENCY FUND
| | | | | | | | |
| SHARE CLASS | | A | | C | | Q | | Z |
| NASDAQ | | EMDAX | | EMDCX | | EMDQX | | EMDZX |
| CUSIP | | 743969750 | | 743969743 | | 743969735 | | 743969727 |
MF212E 0236589-00001-00

PRUDENTIAL INVESTMENTS»MUTUAL FUNDS
PRUDENTIAL JENNISON GLOBAL OPPORTUNITIES FUND
ANNUAL REPORT · OCTOBER 31, 2012
Fund Type
Global Stock
Objective
To seek long-term growth of capital
This report is not authorized for distribution to prospective investors unless preceded or accompanied by a current prospectus.
The views expressed in this report and information about the Fund’s portfolio holdings are for the period covered by this report and are subject to change thereafter.
Prudential Investments, Prudential, Jennison, the Prudential logo, the Rock symbol, and Bring Your Challenges are service marks of Prudential Financial, Inc. and its related entities, registered in many jurisdictions worldwide.

December 14, 2012
Dear Shareholder:
We hope you find the annual report for the Prudential Jennison Global Opportunities Fund informative and useful. The report covers performance for the seven-month period that ended October 31, 2012.
We recognize that ongoing market volatility may make it a difficult time to be an investor. We continue to believe a prudent response to uncertainty is to maintain a diversified portfolio of funds consistent with your tolerance for risk, time horizon, and financial goals.
Your financial advisor can help you create a diversified investment plan that may include funds covering all the basic asset classes and that reflects your personal investor profile and risk tolerance. Keep in mind, however, that diversification and asset allocation strategies do not assure a profit or protect against loss in declining markets.
Prudential Investments® is dedicated to helping you solve your toughest investment challenges—whether it’s capital growth, reliable income, or protection from market volatility and other risks. We offer the expertise of Prudential Financial’s affiliated asset managers* that strive to be leaders in a broad range of funds to help you stay on course to the future you envision. They also manage money for major corporations and pension funds around the world, which means you benefit from the same expertise, innovation, and attention to risk demanded by today’s most sophisticated investors.
Thank you for choosing the Prudential Investments family of funds.
Sincerely,

Stuart S. Parker, President
Prudential Jennison Global Opportunities Fund
*Most of Prudential Investments’ equity funds are advised by Jennison Associates LLC, Quantitative Management Associates LLC (QMA), or Prudential Real Estate Investors. Prudential Investments’ fixed income and money market funds are advised by Prudential Investment Management, Inc. (PIM) through its Prudential Fixed Income unit. Jennison Associates LLC, QMA, and PIM are registered investment advisers and Prudential Financial companies. Prudential Real Estate Investors is a unit of PIM.
| | | | |
| Prudential Jennison Global Opportunities Fund | | | 1 | |
Your Fund’s Performance
Performance data quoted represent past performance. Past performance does not guarantee future results. The investment return and principal value of an investment will fluctuate, so that an investor’s shares, when redeemed, may be worth more or less than their original cost. Current performance may be lower or higher than the past performance data quoted. An investor may obtain performance data as of the most recent month-end by visiting our website at www.prudentialfunds.com or by calling (800) 225-1852. Class A shares have a maximum initial sales charge of 5.50%. Gross operating expenses: Class A, 3.10%; Class C, 3.85%; Class Z, 2.72%. Net operating expenses: Class A, 1.60%; Class C, 2.35%; Class Z, 1.35%, after contractual reduction through 2/28/2014.
| | | | | | | | |
Cumulative Total Returns (Without Sales Charges) as of 10/31/12 |
| | | | | | | | | Since Inception |
Class A | | | | | | | | -1.40% (3/14/2012) |
Class C | | | | | | | | -1.90 (3/14/2012) |
Class Z | | | | | | | | -1.30 (3/14/2012) |
MSCI AC World ND Index | | | | | | | | 0.89 |
Lipper Global Multi-Cap Core Funds Average | | | | | | | | 0.21 |
Lipper Global Multi-Cap Growth Funds Average | | | | | | | | -0.96 |
| | | | | | | | |
Average Annual Total Returns (With Sales Charges) as of 9/30/12 |
| | | | | | | | | Since Inception |
Class A | | | | | | | | N/A (3/14/2012) |
Class C | | | | | | | | N/A (3/14/2012) |
Class Z | | | | | | | | N/A (3/14/2012) |
MSCI AC World ND Index | | | | | | | | N/A |
Lipper Global Multi-Cap Core Funds Average | | | | | | | | N/A |
Lipper Global Multi-Cap Growth Funds Average | | | | | | | | N/A |
| | | | | | | | |
Average Annual Total Returns (With Sales Charges) as of 10/31/12 |
| | | | | | | | | Since Inception |
Class A | | | | | | | | N/A (3/14/2012) |
Class C | | | | | | | | N/A (3/14/2012) |
Class Z | | | | | | | | N/A (3/14/2012) |
| | | | | | | | |
Average Annual Total Returns (Without Sales Charges) as of 10/31/12 |
| | | | | | | | | Since Inception |
Class A | | | | | | | | N/A (3/14/2012) |
Class C | | | | | | | | N/A (3/14/2012) |
Class Z | | | | | | | | N/A (3/14/2012) |
| | |
| 2 | | Visit our website at www.prudentialfunds.com |
Growth of a $10,000 Investment
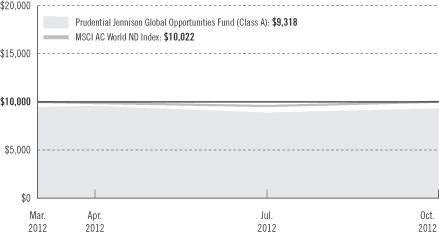
The graph compares a $10,000 investment in the Prudential Jennison Global Opportunities Fund (Class A shares) with a similar investment in the MSCI AC World ND Index by portraying the initial account values at the commencement of operations for Class A shares (March 14, 2012) and the account values at the end of the current fiscal year (October 31, 2012), as measured on a quarterly basis. For purposes of the graph, and unless otherwise indicated, it has been assumed that (a) the maximum applicable front-end sales charge was deducted from the initial $10,000 investment in Class A shares; (b) all recurring fees (including management fees) were deducted; and (c) all dividends and distributions were reinvested. The line graph provides information for Class A shares only. As indicated in the tables provided earlier, performance for Class C and Class Z shares will vary due to the differing charges and expenses applicable to each share class (as indicated in the following paragraphs). Without waiver of fees and/or expense reimbursement, if any, the returns would have been lower.
Total returns and the ending account values in the graph include changes in share price and reinvestment of dividends and capital gains distributions in a hypothetical investment for the periods shown. The Fund’s total returns do not reflect the deduction of income taxes on an individual’s investment. Taxes may reduce your actual investment returns on income or gains paid by the Fund or any gains you may realize if you sell your shares.
Source: Prudential Investments LLC and Lipper Inc.
Inception returns are provided for any share class with less than 10 calendar years of returns.
The average annual total returns take into account applicable sales charges. Class A shares are subject to a maximum front-end sales charge of 5.50% and a 12b-1 fee of 0.30% annually. All investors who purchase Class A shares in an amount of $1 million or more and sell these shares within 12 months of purchase are subject to a contingent deferred sales charge (CDSC) of 1%. Under certain circumstances, an exchange may be made from specified share classes of the Fund to one or more other share classes of the Fund. Class C shares are not subject to a front-end sales charge, but charge a CDSC of 1% for shares sold within 12 months from the date of purchase and an annual 12b-1 fee of 1%. Class Z shares are not subject to a CDSC or 12b-1 fee. The
| | | | |
| Prudential Jennison Global Opportunities Fund | | | 3 | |
Your Fund’s Performance (continued)
returns in the tables and graph reflect the share class expense structure in effect at the close of the fiscal period. The returns in the tables and graph do not reflect the deduction of taxes that a shareholder would pay on Fund distributions or following the redemption of Fund shares.
Benchmark Definitions
MSCI AC World ND Index
The MSCI All Country World Index (MSCI ACWI) is an unmanaged free-float-adjusted, market-capitalization-weighted index designed to measure the equity market performance of developed and emerging markets. The MSCI ACWI comprises 24 developed market country indexes and 21 emerging market country indexes. The developed market country indexes include Australia, Austria, Belgium, Canada, Denmark, Finland, France, Germany, Greece, Hong Kong, Ireland, Israel, Italy, Japan, Netherlands, New Zealand, Norway, Portugal, Singapore, Spain, Sweden, Switzerland, the United Kingdom, and the United States. The emerging market country indexes include Brazil, Chile, China, Colombia, Czech Republic, Egypt, Hungary, India, Indonesia, Korea, Malaysia, Mexico, Morocco, Peru, Philippines, Poland, Russia, South Africa, Taiwan, Thailand, and Turkey.
Lipper Global Multi-Cap Core Funds Average
Funds in the Lipper Global Multi-Cap Core Funds Average are funds that, by portfolio practice, invest in a variety of market capitalization ranges without concentrating 75% of their equity assets in any one market capitalization range over an extended period of time. Global multi-cap core funds typically have average characteristics compared to the MSCI World Index.
Lipper Global Multi-Cap Growth Funds Average
Funds in the Lipper Global Multi-Cap Growth Funds Average are funds that, by portfolio practice, invest in a variety of market capitalization ranges without concentrating 75% of their equity assets in any one market capitalization range over an extended period of time. Global multi-cap growth funds typically have above-average characteristics compared to the MSCI World Index.
Note: Although the Fund is classified by Lipper in its Multi-Cap Core Funds Performance Universe, the Multi-Cap Growth Funds Performance Universe was utilized for performance comparisons, because the Fund’s investment manager believes that the Multi-Cap Growth Funds Performance Universe provides a more appropriate basis for Fund performance comparisons.
Investors cannot invest directly in an index or average. The returns for the Index would be lower if they included the effects of sales charges, operating expenses of a mutual fund, or taxes. Returns for the Lipper Averages reflect the deduction of operating expenses, but not sales charges or taxes.
| | | | |
Five Largest Holdings expressed as a percentage of net assets as of 10/31/12 | | | | |
Apple, Inc., United States | | | 8.4 | % |
Michael Kors Holdings Ltd., United States | | | 3.8 | |
Inditex SA, Spain | | | 3.6 | |
MasterCard, Inc. (Class A Stock), United States | | | 3.5 | |
Home Depot, Inc. (The), United States | | | 3.5 | |
| | |
| 4 | | Visit our website at www.prudentialfunds.com |
| | | | |
Five Largest Industries expressed as a percentage of net assets as of 10/31/12 | | | | |
Specialty Retail | | | 10.1 | % |
Textiles, Apparel & Luxury Goods | | | 9.9 | |
Internet Software & Services | | | 9.7 | |
Computers & Peripherals | | | 8.4 | |
Internet & Catalog Retail | | | 6.4 | |
| | | | |
| Prudential Jennison Global Opportunities Fund | | | 5 | |
Strategy and Performance Overview
How did the Fund perform?
From its inception on March 14, 2012, through October 31, 2012, the Prudential Jennison Global Opportunities Fund’s Class A shares declined by 1.40%. Over the same period, the MSCI All Country World Net Dividend Index rose 0.89% and the Lipper Global Multi-Cap Growth Average declined –0.96%.
What was the market environment?
Global equity markets were highly volatile in the period, reflecting swings in sentiment around European sovereign debt issues and uncertainty about global growth. Stock prices rose and fell as sentiment veered between optimism and pessimism, often based on short-term data. U.S. economic growth proceeded at a subpar pace, and unemployment remained high as the job market expanded at a meager pace. Personal income and spending increased at generally lackluster rates, and business and housing indicators were inconsistent.
With the implementation of austerity measures, many European economies contracted. Emerging markets offered mixed opportunities: some domestically focused companies in certain countries showed solid growth, while companies with large export exposure to developed markets felt the impact of slower growth. Growth in China, a key engine of global economic expansion, slowed. Volatile raw materials, commodities, food, and energy prices reflected shifts in economic expectations.
Which holdings made the largest positive contributions to the Fund’s return?
Consumer staples stocks contributed significantly to Fund performance.
| | • | | Raia Drogasil is Brazil’s largest drugstore chain. Jennison believes the company’s strong balance sheet, operational structure, and experienced management team position Raia for market share gains as Brazil’s highly fragmented retail drugstore market consolidates. |
| | • | | Orion is Korea’s second-largest confectionery company. It sells in 75 different countries, with main operations in China, Russia, Vietnam, and Japan. Jennison expects Orion’s operations in China to expand at a compound annual rate of 30% over the next few years as it diversifies its product offerings, expands its production capacity, and broadens its high-margin distribution channels. |
In consumer discretionary, Inditex, Home Depot, Prada, Michael Kors, and Mr Price Group were key contributors.
| | • | | Jennison believes Italian luxury retailer Prada’s strong brand, cutting-edge design, and growing scale present an opportunity to generate above-average sales and earnings growth. Jennison expects the company to benefit from the demand for upscale consumer goods in Asia, where millions of newly affluent consumers purchase branded bags, clothes, and jewelry. |
| | |
| 6 | | Visit our website at www.prudentialfunds.com |
| | • | | Based in Durban, Mr Price Group operates and franchises almost 1,000 apparel and home products stores, primarily in South Africa. Jennison likes the company’s exposure to Southern Africa’s growing middle class, its solid balance sheet, and strong earnings growth potential. |
| | • | | Please see the “Comments on Largest Holdings” section for a discussion of Inditex, Home Depot, and Michael Kors. |
Tencent Holdings was a notable performer in information technology.
| | • | | Tencent is China’s largest and most visited Internet service portal. Its messaging app has the potential to extend Tencent’s dominance from desktop computers to mobile devices, in Jennison’s view. It could also drive interest in revenue-generating mobile games, apps, and fee-based services. |
Which holdings detracted most from the Fund’s return?
Energy positions detracted most from Fund return.
| | • | | FMC Technologies, which provides subsea oil and gas production systems, fell on lower-than-expected revenue and earnings. The subsea sector offers compelling growth prospects over the long term, in Jennison’s view, given increasing ultra-deepwater drilling activity and the rapid expansion of deepwater rig fleets. |
Some consumer names also hurt performance.
| | • | | London-based apparel and accessories retailer Burberry Group fell on indications of decelerating sales and store traffic. |
| | • | | Watch retailer Fossil declined after reporting lighter-than-projected revenue, partly due to weakness in Europe. |
In information technology, VMware and Cognizant Technology Solutions lost ground.
| | • | | Cloud computing pioneer VMware was hurt by concerns about information technology spending. |
| | • | | Technology outsourcing company Cognizant Technology reduced its revenue guidance, as business from the company’s North American banking clients was not as strong as expected. |
Jennison eliminated the Fund’s positions in Burberry, Fossil, VMware, and Cognizant Technology.
| | | | |
| Prudential Jennison Global Opportunities Fund | | | 7 | |
Strategy and Performance Overview (continued)
Were there significant changes to the portfolio?
Over the period, the Fund’s sector weights were largely stable. Relative to the MSCI All Country World NDR Index, the Fund was heavily invested in technology and consumer discretionary stocks, while financials, industrials, and materials exposures were small.
Comments on Largest Holdings
8.4% Apple, Inc., Computers & Peripherals: Apple designs, manufactures, and markets personal computers, mobile communication devices (iPhone, iPad), and portable digital music and video players (iPod). Jennison believes Apple’s creativity and innovation in product design and marketing will continue to drive share gains.
3.8% Michael Kors Holdings Ltd., Textiles, Apparel, and Luxury Goods: Michael Kors designs, markets, distributes, and sells branded apparel and accessories. Jennison considers Kors a rapidly growing luxury lifestyle brand with strong revenue, margin, and earnings upside potential. The company’s opportunities to open more stores, increase square footage, and expand into new international markets could result in higher operating margins.
3.6% Inditex S.A., Specialty Retail: Industria de Diseño Textil, or Inditex, is one of the world’s largest fashion retailers. Best known globally for its brand, Zara, the Spain-based company is engaged in a range of activities in the textile and fashion design, manufacturing, and distribution businesses. Jennison believes Inditex’s vertical integration is a competitive advantage as it allows the company to shorten turnaround times and achieve greater flexibility, reducing merchandise stock and fashion risk.
3.5% MasterCard, Inc. (Class A Stock), Information Technology Services: MasterCard is the No. 2 payment system in the U.S. Jennison’s long-term decision on MasterCard is based on projected growth in the total value of its cardholders’ transactions, as consumers continue their ongoing shift from paper money to electronic credit/debit transactions (retailers and banks pay MasterCard each time consumers use MasterCard-branded payment cards).
3.5% Home Depot, Inc. (The), Specialty Retail: Home Depot, the world’s largest home improvement chain, is benefiting from an improving U.S. housing market and strong execution. Jennison likes the company’s margin improvement opportunities and aggressive return of cash to shareholders through share buybacks and dividend payouts.
| | |
| 8 | | Visit our website at www.prudentialfunds.com |
Fees and Expenses (Unaudited)
As a shareholder of the Fund, you incur two types of costs: (1) transaction costs, including sales charges (loads) on purchase payments and redemptions, as applicable, and (2) ongoing costs, including management fees, distribution, and/or service (12b-1) fees, and other Fund expenses, as applicable. This example is intended to help you understand your ongoing costs (in dollars) of investing in the Fund and to compare these costs with the ongoing costs of investing in other mutual funds.
The example is based on an investment of $1,000 invested on May 1, 2012, at the beginning of the period, and held through the six-month period ended October 31, 2012. The example is for illustrative purposes only; you should consult the Prospectus for information on initial and subsequent minimum investment requirements.
The Fund’s transfer agent may charge additional fees to holders of certain accounts that are not included in the expenses shown in the table on the following page. These fees apply to individual retirement accounts (IRAs) and Section 403(b) accounts. As of the close of the six-month period covered by the table, IRA fees included an annual maintenance fee of $15 per account (subject to a maximum annual maintenance fee of $25 for all accounts held by the same shareholder). Section 403(b) accounts are charged an annual $25 fiduciary maintenance fee. Some of the fees may vary in amount, or may be waived, based on your total account balance or the number of Prudential Investments funds, including the Fund, that you own. You should consider the additional fees that were charged to your Fund account over the six-month period when you estimate the total ongoing expenses paid over the period and the impact of these fees on your ending account value, as these additional expenses are not reflected in the information provided in the expense table. Additional fees have the effect of reducing investment returns.
Actual Expenses
The first line for each share class in the table on the following page provides information about actual account values and actual expenses. You may use the information on this line, together with the amount you invested, to estimate the expenses that you paid over the period. Simply divide your account value by $1,000 (for example, an $8,600 account value ÷ $1,000 = 8.6), then multiply the result by the number on the first line under the heading “Expenses Paid During the Six-Month Period” to estimate the expenses you paid on your account during this period.
Hypothetical Example for Comparison Purposes
The second line for each share class in the table on the following page provides information about hypothetical account values and hypothetical expenses based on the Fund’s actual expense ratio and an assumed rate of return of 5% per year before
| | | | |
| Prudential Jennison Global Opportunities Fund | | | 9 | |
expenses, which is not the Fund’s actual return. The hypothetical account values and expenses may not be used to estimate the actual ending account balance or expenses you paid for the period. You may use this information to compare the ongoing costs of investing in the Fund and other funds. To do so, compare this 5% hypothetical example with the 5% hypothetical examples that appear in the shareholder reports of the other funds.
Please note that the expenses shown in the table are meant to highlight your ongoing costs only and do not reflect any transactional costs such as sales charges (loads). Therefore, the second line for each share class in the table is useful in comparing ongoing costs only and will not help you determine the relative total costs of owning different funds. In addition, if these transactional costs were included, your costs would have been higher.
| | | | | | | | | | | | | | | | | | |
Prudential
Jennison Global
Opportunities Fund | | Beginning Account
Value
May 1, 2012 | | | Ending Account
Value
October 31, 2012 | | | Annualized
Expense Ratio
Based on the
Six-Month Period | | | Expenses Paid
During the
Six-Month Period* | |
| | | | | | | | | | | | | | | | | | |
| Class A | | Actual | | $ | 1,000.00 | | | $ | 974.30 | | | | 1.60 | % | | $ | 7.94 | |
| | | Hypothetical | | $ | 1,000.00 | | | $ | 1,017.09 | | | | 1.60 | % | | $ | 8.11 | |
| | | | | | | | | | | | | | | | | | |
| Class C | | Actual | | $ | 1,000.00 | | | $ | 971.30 | | | | 2.35 | % | | $ | 11.64 | |
| | | Hypothetical | | $ | 1,000.00 | | | $ | 1,013.32 | | | | 2.35 | % | | $ | 11.89 | |
| | | | | | | | | | | | | | | | | | |
| Class Z | | Actual | | $ | 1,000.00 | | | $ | 975.30 | | | | 1.35 | % | | $ | 6.70 | |
| | | Hypothetical | | $ | 1,000.00 | | | $ | 1,018.35 | | | | 1.35 | % | | $ | 6.85 | |
*Fund expenses (net of fee waivers or subsidies, if any) for each share class are equal to the annualized expense ratio for each share class (provided in the table), multiplied by the average account value over the period, multiplied by the 184 days in the six-month period ended October 31, 2012, and divided by the 366 days in the Fund's fiscal year ended October 31, 2012 (to reflect the six-month period). Expenses presented in the table include the expenses of any underlying funds in which the Fund may invest.
| | |
| 10 | | Visit our website at www.prudentialfunds.com |
Portfolio of Investments
as of October 31, 2012
| | | | | | |
| Shares | | Description | | Value (Note 1) | |
LONG-TERM INVESTMENTS 99.1% | |
COMMON STOCKS 97.7% | |
|
Brazil 7.0% | |
| 18,621 | | Arezzo Industria e Comercio SA | | $ | 332,346 | |
| 19,233 | | BR Properties SA | | | 251,888 | |
| 7,800 | | BTG Pactual Participations Ltd., 144A | | | 122,892 | |
| 18,121 | | BTG Pactual Participations Ltd. | | | 285,504 | |
| 33,478 | | Raia Drogasil SA | | | 368,397 | |
| | | | | | |
| | | | | 1,361,027 | |
|
China 3.7% | |
| 1,275 | | Baidu, Inc., ADR* | | | 135,941 | |
| 16,345 | | Tencent Holdings Ltd. | | | 577,871 | |
| | | | | | |
| | | | | 713,812 | |
|
Denmark 3.1% | |
| 3,790 | | Novo Nordisk A/S (Class B Stock) | | | 610,775 | |
|
France 3.1% | |
| 2,650 | | Remy Cointreau SA | | | 274,851 | |
| 2,882 | | Technip SA | | | 324,614 | |
| | | | | | |
| | | | | 599,465 | |
|
Germany 2.0% | |
| 5,323 | | SAP AG | | | 387,744 | |
|
Hong Kong 2.4% | |
| 181,945 | | China Overseas Land & Investment Ltd. | | | 476,576 | |
|
Italy 4.4% | |
| 9,591 | | Luxottica Group SpA | | | 364,859 | |
| 61,206 | | Prada SpA | | | 499,122 | |
| | | | | | |
| | | | | 863,981 | |
|
Macau 1.3% | |
| 68,967 | | Sands China Ltd. | | | 259,403 | |
|
Mexico 1.3% | |
| 24,821 | | Mexichem SAB de CV, 144A | | | 123,024 | |
| 27,617 | | Mexichem SAB de CV | | | 136,883 | |
| | | | | | |
| | | | | 259,907 | |
See Notes to Financial Statements.
| | | | |
| Prudential Jennison Global Opportunities Fund | | | 11 | |
Portfolio of Investments
as of October 31, 2012 continued
| | | | | | |
| Shares | | Description | | Value (Note 1) | |
COMMON STOCKS (Continued) | |
|
South Africa 1.2% | |
| 15,373 | | Mr Price Group Ltd. | | $ | 237,492 | |
|
South Korea 3.8% | |
| 390 | | Orion Corp. | | | 366,184 | |
| 311 | | Samsung Electronics Co. Ltd. | | | 373,565 | |
| | | | | | |
| | | | | 739,749 | |
|
Spain 3.6% | |
| 5,452 | | Inditex SA | | | 695,633 | |
|
Thailand 1.9% | |
| 283,304 | | CP ALL PCL | | | 367,417 | |
|
United Kingdom 7.3% | |
| 6,629 | | Aggreko PLC | | | 229,999 | |
| 41,606 | | ARM Holdings PLC | | | 446,495 | |
| 5,351 | | ASOS PLC* | | | 194,725 | |
| 9,440 | | Diageo PLC | | | 269,793 | |
| 19,681 | | Rolls-Royce Holdings PLC | | | 271,393 | |
| | | | | | |
| | | | | 1,412,405 | |
|
United States 51.6% | |
| 5,379 | | Alexion Pharmaceuticals, Inc.* | | | 486,154 | |
| 2,166 | | Amazon.com, Inc.* | | | 504,288 | |
| 2,749 | | Apple, Inc. | | | 1,635,930 | |
| 2,009 | | Biogen Idec, Inc.* | | | 277,684 | |
| 10,376 | | eBay, Inc.* | | | 501,057 | |
| 5,582 | | Estee Lauder Cos., Inc. (The) (Class A Stock) | | | 343,963 | |
| 4,347 | | Facebook, Inc. (Class A Stock)* | | | 91,787 | |
| 4,898 | | FMC Technologies, Inc.* | | | 200,328 | |
| 3,831 | | Gilead Sciences, Inc.* | | | 257,290 | |
| 4,102 | | Goldman Sachs Group, Inc. (The) | | | 502,044 | |
| 11,096 | | Home Depot, Inc. (The) | | | 681,073 | |
| 3,793 | | LinkedIn Corp. (Class A Stock)* | | | 405,585 | |
| 1,481 | | MasterCard, Inc. (Class A Stock) | | | 682,637 | |
| 2,190 | | MercadoLibre, Inc. | | | 183,894 | |
| 13,453 | | Michael Kors Holdings Ltd.* | | | 735,744 | |
| 3,645 | | Monsanto Co. | | | 313,725 | |
| 4,499 | | National Oilwell Varco, Inc. | | | 331,576 | |
| 945 | | priceline.com, Inc.* | | | 542,213 | |
See Notes to Financial Statements.
| | |
| 12 | | Visit our website at www.prudentialfunds.com |
| | | | | | |
| Shares | | Description | | Value (Note 1) | |
COMMON STOCKS (Continued) | |
|
United States (cont’d.) | |
| 2,697 | | Salesforce.com, Inc.* | | $ | 393,708 | |
| 3,011 | | Teradata Corp.* | | | 205,682 | |
| 3,590 | | Tesla Motors, Inc.* | | | 100,987 | |
| 8,702 | | TJX Cos., Inc. | | | 362,264 | |
| 2,105 | | TransDigm Group, Inc. | | | 280,407 | |
| 688 | | Workday, Inc. (Class A Stock)* | | | 33,368 | |
| | | | | | |
| | | | | 10,053,388 | |
| | | | | | |
| | Total common stocks
(cost $18,002,352) | | | 19,038,774 | |
| | | | | | |
PREFERRED STOCKS 1.4% | | | | |
| |
Germany 1.4% | | | | |
| 1,313 | | Volkswagen AG | | | 271,613 | |
| |
United Kingdom | | | | |
| 1,495,756 | | Rolls-Royce Holdings PLC (Class C Stock)* | | | 2,414 | |
| | | | | | |
| | Total preferred stocks
(cost $265,470) | | | 274,027 | |
| | | | | | |
| | Total long-term investments
(cost $18,267,822) | | | 19,312,801 | |
| | | | | | |
SHORT-TERM INVESTMENT 1.1% | |
| |
Affiliated Money Market Mutual Fund | | | | |
| 209,465 | | Prudential Investment Portfolios 2 - Prudential Core Taxable Money Market Fund
(cost $209,465; Note 3)(a) | | | 209,465 | |
| | | | | | |
| | Total Investments 100.2%
(cost $18,477,287; Note 5) | | | 19,522,266 | |
| | Liabilities in excess of other assets (0.2%) | | | (29,229 | ) |
| | | | | | |
| | Net Assets 100.0% | | $ | 19,493,037 | |
| | | | | | |
The following abbreviations are used in the Portfolio descriptions:
144A—Security was purchased pursuant to Rule 144A under the Securities Act of 1933 and may not be resold subject to that rule except to qualified institutional buyers. Unless otherwise noted, 144A securities are deemed to be liquid.
ADR—American Depositary Receipt
| * | Non-income producing security. |
| (a) | Prudential Investments LLC, the manager of the Series, also serves as manager of the Prudential Investment Portfolios 2 - Prudential Core Taxable Money Market Fund. |
See Notes to Financial Statements.
| | | | |
| Prudential Jennison Global Opportunities Fund | | | 13 | |
Portfolio of Investments
as of October 31, 2012 continued
Various inputs are used in determining the value of the Series’ investments. These inputs are summarized in the three broad levels listed below.
Level 1—quoted prices generally in active markets for identical securities.
Level 2—other significant observable inputs including, but not limited to, quoted prices for similar securities, interest rates and yield curves, prepayment speeds, foreign currency exchange rates, and amortized cost.
Level 3—significant unobservable inputs for securities valued in accordance with Board approved fair valuation procedures.
The following is a summary of the inputs used as of October 31, 2012 in valuing such portfolio securities:
| | | | | | | | | | | | |
| | | Level 1 | | | Level 2 | | | Level 3 | |
Investments in Securities | | | | | | | | | | | | |
Common Stocks: | | | | | | | | | | | | |
Brazil | | $ | 1,361,027 | | | $ | — | | | $ | — | |
China | | | 713,812 | | | | — | | | | — | |
Denmark | | | 610,775 | | | | — | | | | — | |
France | | | 599,465 | | | | — | | | | — | |
Germany | | | 387,744 | | | | — | | | | — | |
Hong Kong | | | 476,576 | | | | — | | | | — | |
Italy | | | 863,981 | | | | — | | | | — | |
Macau | | | 259,403 | | | | — | | | | — | |
Mexico | | | 259,907 | | | | — | | | | — | |
South Africa | | | 237,492 | | | | — | | | | — | |
South Korea | | | 739,749 | | | | — | | | | — | |
Spain | | | 695,633 | | | | — | | | | — | |
Thailand | | | — | | | | 367,417 | | | | — | |
United Kingdom | | | 1,412,405 | | | | — | | | | — | |
United States | | | 10,053,388 | | | | — | | | | — | |
Preferred Stocks: | | | | | | | | | | | | |
Germany | | | 271,613 | | | | — | | | | — | |
United Kingdom | | | — | | | | 2,414 | | | | — | |
Affiliated Money Market Mutual Fund | | | 209,465 | | | | — | | | | — | |
| | | | | | | | | | | | |
Total | | $ | 19,152,435 | | | $ | 369,831 | | | $ | — | |
| | | | | | | | | | | | |
See Notes to Financial Statements.
| | |
| 14 | | Visit our website at www.prudentialfunds.com |
The industry classification of portfolio holdings and liabilities in excess of other assets shown as a percentage of net assets as of October 31, 2012 were as follows:
| | | | |
Specialty Retail | | | 10.1 | % |
Textiles, Apparel & Luxury Goods | | | 9.9 | |
Internet Software & Services | | | 9.7 | |
Computers & Peripherals | | | 8.4 | |
Internet & Catalog Retail | | | 6.4 | |
Biotechnology | | | 5.3 | |
IT Services | | | 4.6 | |
Energy Equipment & Services | | | 4.4 | |
Semiconductors & Semiconductor Equipment | | | 4.2 | |
Software | | | 4.2 | |
Food & Staples Retailing | | | 3.8 | |
Real Estate Management & Development | | | 3.7 | |
Pharmaceuticals | | | 3.1 | |
Chemicals | | | 2.9 | |
Aerospace & Defense | | | 2.8 | % |
Beverages | | | 2.8 | |
Capital Markets | | | 2.6 | |
Diversified Financial Services | | | 2.1 | |
Automobiles | | | 1.9 | |
Food Products | | | 1.9 | |
Personal Products | | | 1.8 | |
Hotels, Restaurants & Leisure | | | 1.3 | |
Commercial Services & Supplies | | | 1.2 | |
Affiliated Money Market Mutual Fund | | | 1.1 | |
| | | | |
| | | 100.2 | |
Liabilities in excess of other assets | | | (0.2 | ) |
| | | | |
| | | 100.0 | % |
| | | | |
See Notes to Financial Statements.
| | | | |
| Prudential Jennison Global Opportunities Fund | | | 15 | |
Statement of Assets and Liabilities
as of October 31, 2012
| | | | |
Assets | | | | |
Investments at value: | | | | |
Unaffiliated Investments (cost $18,267,822) | | $ | 19,312,801 | |
Affiliated Investments (cost $209,465) | | | 209,465 | |
Receivable for investments sold | | | 193,100 | |
Dividends receivable | | | 29,159 | |
Due from Manager | | | 13,206 | |
Receivable for Series shares sold | | | 3,309 | |
Foreign tax reclaim receivable | | | 2,596 | |
Prepaid expenses | | | 607 | |
| | | | |
Total assets | | | 19,764,243 | |
| | | | |
| |
Liabilities | | | | |
Payable for investments purchased | | | 201,995 | |
Accrued expenses | | | 67,746 | |
Distribution fee payable | | | 1,346 | |
Affiliated transfer agent fee payable | | | 119 | |
| | | | |
Total liabilities | | | 271,206 | |
| | | | |
| |
Net Assets | | $ | 19,493,037 | |
| | | | |
| | | | | |
Net assets were comprised of: | | | | |
Common stock, at par | | $ | 19,749 | |
Paid-in capital in excess of par | | | 19,613,186 | |
| | | | |
| | | 19,632,935 | |
Net investment loss | | | (12,187 | ) |
Accumulated net realized loss on investment and foreign currency transactions | | | (1,172,568 | ) |
Net unrealized appreciation on investments and foreign currencies | | | 1,044,857 | |
| | | | |
Net assets, October 31, 2012 | | $ | 19,493,037 | |
| | | | |
See Notes to Financial Statements.
| | |
| 16 | | Visit our website at www.prudentialfunds.com |
| | | | |
Class A | | | | |
Net asset value and redemption price per share
($3,897,573 ÷ 395,198 shares of common stock issued and outstanding) | | $ | 9.86 | |
Maximum sales charge (5.50% of offering price) | | | .57 | |
| | | | |
Maximum offering price to public | | $ | 10.43 | |
| | | | |
| |
Class C | | | | |
Net asset value, offering price and redemption price per share
($593,362 ÷ 60,499 shares of common stock issued and outstanding) | | $ | 9.81 | |
| | | | |
| |
Class Z | | | | |
Net asset value, offering price and redemption price per share
($15,002,102 ÷ 1,519,236 shares of common stock issued and outstanding) | | $ | 9.87 | |
| | | | |
See Notes to Financial Statements.
| | | | |
| Prudential Jennison Global Opportunities Fund | | | 17 | |
Statement of Operations
For the Period March 14, 2012* through October 31, 2012
| | | | |
Net Investment Loss | | | | |
Income | | | | |
Unaffiliated dividend income (net of foreign withholding taxes of $7,820) | | $ | 146,307 | |
Unaffiliated interest income | | | 2,018 | |
Affiliated dividend income | | | 1,015 | |
| | | | |
Total income | | | 149,340 | |
| | | | |
| |
Expenses | | | | |
Management fee | | | 101,872 | |
Distribution fee—Class A | | | 4,702 | |
Distribution fee—Class C | | | 1,903 | |
Registration fees | | | 54,000 | |
Custodian’s fees and expenses | | | 51,000 | |
Legal fees and expenses | | | 31,000 | |
Audit fee | | | 30,000 | |
Reports to shareholders | | | 24,000 | |
Directors’ fees | | | 6,000 | |
Transfer agent’s fees and expenses (including affiliated expense of $300) (Note 3) | | | 1,000 | |
Miscellaneous | | | 11,656 | |
| | | | |
Total expenses | | | 317,133 | |
Expense reimbursement (Note 2) | | | (157,139 | ) |
| | | | |
Net expenses | | | 159,994 | |
| | | | |
Net investment loss | | | (10,654 | ) |
| | | | |
| |
Realized And Unrealized Gain (Loss) On Investment And Foreign Currency Transactions | | | | |
Net realized loss on: | | | | |
Investment transactions | | | (1,172,568 | ) |
Foreign currency transactions | | | (23,080 | ) |
| | | | |
| | | (1,195,648 | ) |
| | | | |
Net change in unrealized appreciation (depreciation) on: | | | | |
Investments | | | 1,044,979 | |
Foreign currencies | | | (122 | ) |
| | | | |
| | | 1,044,857 | |
| | | | |
Net loss on investment and foreign currency transactions | | | (150,791 | ) |
| | | | |
Net Decrease In Net Assets Resulting From Operations | | $ | (161,445 | ) |
| | | | |
See Notes to Financial Statements.
| | |
| 18 | | Visit our website at www.prudentialfunds.com |
Statement of Changes in Net Assets
| | | | |
| | | March 14, 2012*
through
October 31, 2012 | |
Increase (Decrease) In Net Assets | | | | |
Operations | | | | |
Net investment loss | | $ | (10,654 | ) |
Net realized loss on investment and foreign currency transactions | | | (1,195,648 | ) |
Net change in unrealized appreciation on investments and foreign currencies | | | 1,044,857 | |
| | | | |
Net decrease in net assets resulting from operations | | | (161,445 | ) |
| | | | |
| |
Series share transactions (Note 6) | | | | |
Net proceeds from shares sold | | | 19,692,646 | |
Cost of shares reacquired | | | (38,164 | ) |
| | | | |
Net increase in net assets from Series share transactions | | | 19,654,482 | |
| | | | |
Total increase | | | 19,493,037 | |
| |
Net Assets: | | | | |
Beginning of period | | | — | |
| | | | |
End of period | | $ | 19,493,037 | |
| | | | |
See Notes to Financial Statements.
| | | | |
| Prudential Jennison Global Opportunities Fund | | | 19 | |
Notes to Financial Statements
Prudential World Fund, Inc. (the “Fund”) is an open-end management investment company, registered under the Investment Company Act of 1940, as amended, (“1940 Act”) and currently consists of five series: Prudential Jennison Global Opportunities Fund (the “Series”), Prudential International Equity Fund, Prudential International Value Fund, Prudential Jennison International Opportunities Fund and Prudential Emerging Markets Debt Local Currency Fund. These financial statements relate to the Prudential Jennison Global Opportunities Fund. The financial statements of the other series are not presented herein. The Series commenced investment operations on March 14, 2012. The investment objective of the Series is to achieve long-term growth of capital.
Note 1. Accounting Policies
The following is a summary of significant accounting policies followed by the Fund and the Series in the preparation of its financial statements.
Securities Valuation: The Series holds portfolio securities and other assets that are fair valued at the close of each day the New York Stock Exchange (“NYSE”) is open for trading. Fair value is the price that would be received to sell an asset or paid to transfer a liability in an orderly transaction between market participants on the measurement date. The Board of Directors (the “Board”) has delegated fair valuation responsibilities to Prudential Investments LLC (“PI” or “Manager”) through the adoption of Valuation Procedures for valuation of the Series’ securities. Under the current Valuation Procedures, a Valuation Committee is established and responsible for supervising the valuation of portfolio securities and other assets. The Valuation Procedures allow the Series to utilize independent pricing vendor services, quotations from market makers and other valuation methods in events when market quotations are not readily available or not representative of the fair values of the securities. A record of the Valuation Committee’s actions is subject to review, approval and ratification by the Board at its next regularly scheduled quarterly meeting.
Various inputs are used in determining the value of the Series’ investments, which are summarized in the three broad level hierarchies based on any observable inputs used as described in the table following the Portfolio of Investments. The valuation methodologies and significant inputs used in determining the fair value of securities and other assets classified as Level 1, Level 2 and Level 3 of the hierarchy are as follows:
Common stocks, exchange-traded funds and financial derivative instruments (including futures contracts and certain options and swap contracts on securities), that
| | |
| 20 | | Visit our website at www.prudentialfunds.com |
are traded on a national securities exchange are valued at the last sale price as of the close of trading on the applicable exchange. Securities traded via NASDAQ are valued at the NASDAQ official closing price. To the extent these securities are valued at the last sale price or NASDAQ official closing price, they are classified as Level 1 of the fair value hierarchy.
In the event there is no sale or official closing price on such day, these securities are valued at the mean between the last reported bid and asked prices, or at the last bid price in the absence of an asked price. These securities are classified as Level 2 of the fair value hierarchy as these inputs are considered as significant other observable inputs to the valuation.
For common stocks traded on foreign securities exchanges, certain valuation adjustments will be applied when events occur after the close of the security’s foreign market and before the Fund’s normal pricing time. These securities are valued using pricing vendor services that provide model prices derived using adjustment factors based on information such as local closing price, relevant general and sector indices, currency fluctuations, depositary receipts, and futures, as applicable. Securities valued using such model prices are classified as Level 2 of the fair value hierarchy as the adjustment factors are considered as significant other observable inputs to the valuation.
Investments in open-end, non-exchange-traded mutual funds are valued at their net asset values as of the close of the NYSE on the date of valuation. These securities are classified as Level 1 as they have the ability to be purchased or sold at their net asset values on the date of valuation.
Fixed income securities traded in the over-the-counter market, such as corporate bonds, municipal bonds, U.S. Government agencies, issued and guaranteed obligations, U.S. Treasury obligations and sovereign issues are usually valued at prices provided by approved independent pricing vendors. The pricing vendors provide these prices usually after evaluating observable inputs including yield curves, credit rating, yield spreads, default rates, cash flows as well as broker/dealer quotations and reported trades. Securities valued using such vendor prices are classified as Level 2 of the fair value hierarchy.
Asset-backed and mortgage-related securities are usually valued by approved independent pricing vendors. The pricing vendors provide the prices using their internal pricing models with input from deal terms, tranche level attributes, yield curves, prepayment speeds, default rates and broker/dealer quotes. Securities valued using such vendor prices are classified as Level 2 of the fair value hierarchy.
| | | | |
| Prudential Jennison Global Opportunities Fund | | | 21 | |
Notes to Financial Statements
continued
Short-term debt securities of sufficient credit quality, which mature in sixty days or less, are valued using amortized cost method, which approximates fair value. The amortized cost method involves valuing a security at its cost on the date of purchase and thereafter assuming a constant amortization to maturity of the difference between the principal amount due at maturity and cost. These securities are categorized as Level 2 of the fair value hierarchy.
Over-the-counter financial derivative instruments, such as option contracts, foreign currency contracts and swaps agreements, are usually valued using pricing vendor services, which derive the valuation based on underlying asset prices, indices, spreads, interest rates, exchange rates and other inputs. These instruments are categorized as Level 2 of the fair value hierarchy.
Securities and other assets that cannot be priced using the methods described above are valued with pricing methodologies approved by the Valuation Committee. In the event there are unobservable inputs used when determining such valuations, the securities will be classified as Level 3 of the fair value hierarchy.
When determining the fair value of securities, some of the factors influencing the valuation include: the nature of any restrictions on disposition of the securities; assessment of the general liquidity of the securities; the issuer’s financial condition and the markets in which it does business; the cost of the investment; the size of the holding and the capitalization of the issuer; the prices of any recent transactions or bids/offers for such securities or any comparable securities; any available analyst media or other reports or information deemed reliable by the investment adviser regarding the issuer or the markets or industry in which it operates. Using fair value to price securities may result in a value that is different from a security’s most recent closing price and from the price used by other mutual funds to calculate their net asset values.
Foreign Currency Translation: The books and records of the Series are maintained in U.S. dollars. Foreign currency amounts are translated into U.S. dollars on the following basis:
(i) market value of investment securities, other assets and liabilities-at the current rates of exchange;
(ii) purchases and sales of investment securities, income and expenses-at the rates of exchange prevailing on the respective dates of such transactions.
| | |
| 22 | | Visit our website at www.prudentialfunds.com |
Although the net assets of the Series are presented at the foreign exchange rates and market values at the close of the fiscal period, the Series does not isolate that portion of the results of operations arising as a result of changes in the foreign exchange rates from the fluctuations arising from changes in the market prices of long-term portfolio securities held at the end of the period. Similarly, the Series does not isolate the effect of changes in foreign exchange rates from the fluctuations arising from changes in the market prices of long-term portfolio securities sold during the period. Accordingly, realized foreign currency gains or losses are included in the reported net realized gains or losses on investment transactions.
Net realized gains or losses on foreign currency transactions represent net foreign exchange gains or losses from the holding of foreign currencies, currency gains or losses realized between the trade date and settlement dates on security transactions, and the difference between the amounts of dividends, interest and foreign withholding taxes recorded on the Series’ books and the U.S. dollar equivalent amounts actually received or paid. Net unrealized currency gains or losses from valuing foreign currency denominated assets and liabilities (other than investments) at period end exchange rates are reflected as a component of net unrealized appreciation (depreciation) on foreign currencies.
Foreign security and currency transactions may involve certain considerations and risks not typically associated with those of domestic origin as a result of, among other factors, the possibility of political and economic instability and the level of governmental supervision and regulation of foreign securities markets.
Forward Currency Contracts: A forward currency contract is a commitment to purchase or sell a foreign currency at a future date at a negotiated forward rate between two parties. The Series enters into forward currency contracts in order to hedge its exposure to changes in foreign currency exchange rates on its foreign portfolio holdings or specific receivables and payables denominated in a foreign currency. The contracts are valued daily at current exchange rates and any unrealized gain or loss is included in net unrealized appreciation or depreciation on foreign currencies. Gain or loss is realized on the settlement date of the contract equal to the difference between the settlement value of the original and negotiated forward contracts. This gain or loss, if any, is included in net realized gain (loss) on foreign currency transactions. Risks may arise upon entering into these contracts from the potential inability of the counterparties to meet the terms of their contracts. Forward currency contracts involve risks from currency exchange rate and credit risk in excess of the amounts reflected on the Statement of Assets and Liabilities. The Series’ maximum risk of loss from counterparty credit risk is the net value of the cash flows to be received from the counterparty at the end of the contract’s life. A master netting
| | | | |
| Prudential Jennison Global Opportunities Fund | | | 23 | |
Notes to Financial Statements
continued
arrangement between the Series and the counterparty permits the Series to offset amounts payable by the Series to the same counterparty against amounts to be received; and by the receipt of collateral from the counterparty by the Series to cover the Series’ exposure to the counterparty. However, there is no assurance that such mitigating factors are easily enforceable.
Securities Transactions and Net Investment Income: Securities transactions are recorded on the trade date. Realized gains or losses from investment and currency transactions are calculated on the identified cost basis. Dividend income is recorded on the ex-dividend date. Interest income, including amortization of premium and accretion of discount on debt securities, as required, is recorded on an accrual basis. Expenses are recorded on the accrual basis, which may require the use of certain estimates by management, that may differ from actual.
Net investment income or loss (other than distribution fees which are charged directly to the respective class) and unrealized and realized gains or losses are allocated daily to each class of shares based upon the relative proportion of adjusted net assets of each class at the beginning of the day.
Dividends and Distributions: The Series expects to pay dividends of net investment income and distributions of net realized capital and currency gains, if any, annually. Dividends and distributions to shareholders, which are determined in accordance with federal income tax regulations and which may differ from generally accepted accounting principles, are recorded on the ex-dividend date.
Taxes: For federal income tax purposes, each Series in the Fund is treated as a separate taxpaying entity. It is each Series’ policy to continue to meet the requirements of the Internal Revenue Code applicable to regulated investment companies and to distribute all of its taxable net investment income and capital gains, if any, to shareholders. Therefore, no federal income tax provision is required.
Withholding taxes on foreign dividends are recorded net of reclaimable amounts, at the time the related income is earned.
Estimates: The preparation of the financial statements requires management to make estimates and assumptions that affect the reported amounts and disclosures in the financial statements. Actual results could differ from those estimates.
| | |
| 24 | | Visit our website at www.prudentialfunds.com |
Note 2. Agreements
The Fund has a management agreement for the Series with PI. Pursuant to this agreement, PI has responsibility for all investment advisory services and supervises the subadvisor’s performance of such services. PI has entered into a subadvisory agreement with Jennison Associates LLC (“Jennison”). The subadvisory agreement provides that Jennison furnishes investment advisory services in connection with the management of the Series. In connection therewith, Jennison is obligated to keep certain books and records of the Series. PI pays for the services of Jennison, the compensation of officers of the Series, occupancy and certain clerical and bookkeeping costs of the Series. The Series bears all other costs and expenses.
The management fee paid to PI is computed daily and payable monthly at an annual rate of .90% of the Series’ average daily net assets.
PI has contractually agreed through February 28, 2014 to limit net annual Series operating expenses (excluding distribution and service (12b-1) fees, extraordinary and certain other expenses such as taxes, interest and brokerage commissions) to each class of shares to 1.35% of the Series’ average daily net assets.
The Series has a distribution agreement with Prudential Investment Management Services LLC (“PIMS”), which acts as the distributor of the Class A, Class C and Class Z shares of the Series. The Series compensates PIMS for distributing and servicing the Series’ Class A and Class C shares, pursuant to plans of distribution (the “Class A and C Plans”), regardless of expenses actually incurred by PIMS. The distribution fees are accrued daily and payable monthly. No distribution or service fees are paid to PIMS as distributor of the Class Z shares of the Series.
Pursuant to the Class A and C Plans, the Series compensates PIMS for distribution related activities at an annual rate of up to .30% and 1% of the average daily net assets of the Class A and C shares, respectively. PIMS has contractually agreed to limit such fees to .25% of the average daily net assets of the Class A shares through February 28, 2014.
PIMS has advised the Series that they received $2,959 in front-end sales charges resulting from sales of Class A shares during the period ended October 31, 2012. From these fees, PIMS paid such sales charges to broker-dealers, which in turn paid commissions to salespersons and incurred other distribution costs.
PIMS has advised the Series that for the period ended October 31, 2012, there were no contingent deferred sales charges imposed.
PI, PIMS and Jennison are indirect, wholly-owned subsidiaries of Prudential Financial, Inc. (“Prudential”).
| | | | |
| Prudential Jennison Global Opportunities Fund | | | 25 | |
Notes to Financial Statements
continued
Note 3. Other Transactions with Affiliates
Prudential Mutual Fund Services LLC (“PMFS”), an affiliate of PI and an indirect, wholly-owned subsidiary of Prudential, serves as the Series’ transfer agent. Transfer agent’s fees and expenses on the Statement of Operations include certain out-of-pocket expenses paid to non-affiliates, where applicable.
The Series invests in the Prudential Core Taxable Money Market Fund (the “Core Fund”), a portfolio of the Prudential Investment Portfolios 2, registered under the 1940 Act and managed by PI. Earnings from the Core Fund are disclosed on the Statement of Operations as affiliated dividend income.
Note 4. Portfolio Securities
Purchases and sales of portfolio securities, other than short-term investments, for the period ended October 31, 2012 were $28,082,959 and $8,637,531, respectively.
Note 5. Tax Information
Distributions to shareholders, which are determined in accordance with federal income tax regulations and which may differ from generally accepted accounting principles, are recorded on the ex-dividend date. In order to present net investment loss, accumulated net realized loss on investment and foreign currency transactions and paid-in capital in excess of par on the Statement of Assets and Liabilities that more closely represent their tax character, certain adjustments have been made to net investment loss, accumulated net realized loss on investment and foreign currency transactions and paid-in capital in excess of par. For the period ended October 31, 2012, the adjustments were to increase net investment loss by $1,533, decrease accumulated net realized loss on investment and foreign currency transactions by $23,080 and decrease paid-in capital in excess of par by $21,547 due to the reclassification of a net operating loss, certain transactions involving foreign currencies and nondeductible expenses. Net investment loss, net realized loss on investment and foreign currency transactions and net assets were not affected by this change.
For the period ended October 31, 2012 there were no distributions paid by the Fund.
As of October 31, 2012, the Fund did not have any distributable earnings on a
tax basis.
| | |
| 26 | | Visit our website at www.prudentialfunds.com |
The United States federal income tax basis of the Series’ investments and the net unrealized appreciation as of October 31, 2012 were as follows:
| | | | | | | | | | |
Tax Basis | | Appreciation | | Depreciation | | Net
Unrealized
Appreciation | | Other Cost
Basis
Adjustments | | Total Net
Unrealized
Appreciation |
| $18,520,109 | | $1,364,216 | | $(362,059) | | $1,002,157 | | $(20) | | $1,002,137 |
The difference between book basis and tax basis is primarily attributable to deferred losses on wash sales and investments in passive foreign investment companies. The other cost basis adjustments are primarily attributable to appreciation (depreciation) of foreign currencies and mark-to-market of receivables and payables.
For federal income tax purposes, the Series had a capital loss carryforward as of October 31, 2012 of approximately $1,133,000 which can be carried forward for an unlimited period. No capital gains distributions are expected to be paid to shareholders until net gains have been realized in excess of such losses.
Management has analyzed the Series’ tax positions and has concluded that no provision for income tax is required in the Series’ financial statements for the current reporting period.
Note 6. Capital
The Series offers Class A, Class C and Class Z shares. Class A shares are subject to a maximum front-end sales charge of 5.50%. Investors who purchase Class A shares in an amount of $1 million or more and sell these shares within 12 months of purchase are not subject to an initial sales charge but are subject to a contingent deferred sales charge (CDSC) of 1%. The Class A CDSC is waived for purchases by certain retirement or benefits plans. The CDSC for Class C shares is 1% for shares redeemed within 12 months of purchase. Class Z shares are not subject to any sales or redemption charge and are offered exclusively for sale to a limited group of investors. A special exchange privilege is also available for shareholders who qualified to purchase Class A shares at net asset value.
Under certain circumstances, an exchange may be made from specified share classes of the Series to one or more other share classes of the Series as presented in the table of transactions in shares of capital stock.
At October 31, 2012, Prudential Financial, Inc. through its affiliates owned 1,000 Class A shares, 1,000 Class C shares and 1,501,000 Class Z shares of the Series.
There are 900 million shares of common stock, $.01 par value per share, divided into three classes, designated Class A, Class C and Class Z common stock, each of which consists of 300,000,000 authorized shares.
| | | | |
| Prudential Jennison Global Opportunities Fund | | | 27 | |
Notes to Financial Statements
continued
Transactions in shares of common stock were as follows:
| | | | | | | | |
Class A | | Shares | | | Amount | |
Period ended October 31, 2012:* | | | | | | | | |
Shares sold | | | 399,078 | | | $ | 3,930,985 | |
Shares reacquired | | | (3,880 | ) | | | (38,164 | ) |
| | | | | | | | |
Net increase in shares outstanding | | | 395,198 | | | $ | 3,892,821 | |
| | | | | | | | |
Class C | | | | | | |
Period ended October 31, 2012:* | | | | | | | | |
Shares sold | | | 60,499 | | | $ | 579,898 | |
| | | | | | | | |
Net increase in shares outstanding | | | 60,499 | | | $ | 579,898 | |
| | | | | | | | |
Class Z | | | | | | |
Period ended October 31, 2012:* | | | | | | | | |
Shares sold | | | 1,519,236 | | | $ | 15,181,763 | |
| | | | | | | | |
Net increase in shares outstanding | | | 1,519,236 | | | $ | 15,181,763 | |
| | | | | | | | |
| * | Commenced operations on March 14, 2012. |
Note 7. Borrowings
The Series, along with other affiliated registered investment companies (the “Funds”), is a party to a Syndicated Credit Agreement (“SCA”) with a group of banks. The purpose of the SCA is to provide an alternative source of temporary funding for capital share redemptions. The SCA provides for a commitment of $900 million for the period December 16, 2011 through November 14, 2012. The SCA has been renewed effective November 15, 2012 at substantially similar terms through November 14, 2013. The Funds pay an annualized commitment fee of 0.08% on the unused portion of the SCA. Prior to December 16, 2011, the Funds had another Syndicated Credit Agreement of a $750 million commitment with an annualized commitment fee of 0.10% of the unused portion. Interest on any borrowings under the SCA is paid at contracted market rates. The commitment fee for the unused amount is accrued daily and paid quarterly.
The Series did not utilize the SCA during the period ended October 31, 2012.
| | |
| 28 | | Visit our website at www.prudentialfunds.com |
Note 8. New Accounting Pronouncement
In December 2011, the Financial Accounting Standards Board (“FASB”) issued Accounting Standards Update (“ASU”) No. 2011-11 regarding “Disclosures about Offsetting Assets and Liabilities”. The amendments, which will be effective for annual reporting periods beginning on or after January 1, 2013 and interim periods within those annual periods, require an entity to disclose information about offsetting and related arrangements for assets and liabilities, financial instruments and derivatives that are either currently offset in accordance with current requirements or are subject to enforceable master netting arrangements or similar agreements. At this time, management is evaluating the implications of ASU No. 2011-11 and its impact on the financial statements has not yet been determined.
| | | | |
| Prudential Jennison Global Opportunities Fund | | | 29 | |
Financial Highlights
| | | | |
| Class A Shares | |
| | | March 14,
2012(a)
through
October 31,
2012 | |
| Per Share Operating Performance: | | | | |
| Net Asset Value, Beginning Of Period | | | $10.00 | |
| Income (loss) from investment operations: | | | | |
| Net investment loss | | | (.02 | ) |
| Net realized and unrealized loss on investment and foreign currency transactions | | | (.12 | ) |
| Total from investment operations | | | (.14 | ) |
| Net asset value, end of period | | | $9.86 | |
| Total Return(b): | | | (1.40)% | |
| |
| Ratios/Supplemental Data: | | | |
| Net assets, end of period (000) | | | $3,898 | |
| Average net assets (000) | | | $2,967 | |
| Ratios to average net assets(c)(d): | | | | |
| Expenses, including distribution and service (12b-1) fees | | | 1.60% | (e)(f) |
| Expenses, excluding distribution and service (12b-1) fees | | | 1.35% | (e)(f) |
| Net investment loss | | | (.30)% | (e)(f) |
| Portfolio turnover rate | | | 48% | (g) |
(a) Commencement of Series.
(b) Total return does not consider the effects of sales loads. Total return is calculated assuming a purchase of a share on the first day and a sale on the last day of each period reported, and includes reinvestment of dividends and distributions. Total returns may reflect adjustments to conform to generally accepted accounting principles. Total returns for periods less than a full year are not annualized.
(c) Does not include expenses of the underlying fund in which the Series invests.
(d) The distributor of the Fund has contractually agreed to limit its distribution and service (12b-1) fees to .25% of the average daily net assets of the Class A shares.
(e) Net of expense waiver/reimbursement. If the investment manager had not waived/reimbursed expenses, the expense ratios including and excluding distribution and services (12b-1) fees and net investment loss ratio would have been 3.05%, 2.80% and (1.75)%, respectively, for the period ended October 31, 2012.
(f) Annualized.
(g) Not annualized.
See Notes to Financial Statements.
| | |
| 30 | | Visit our website at www.prudentialfunds.com |
| | | | |
| Class C Shares | | | |
| | | March 14,
2012(a)
through
October 31,
2012 | |
| Per Share Operating Performance: | | | | |
| Net Asset Value, Beginning Of Period | | | $10.00 | |
| Income (loss) from investment operations: | | | | |
| Net investment loss | | | (.06 | ) |
| Net realized and unrealized loss on investment and foreign currency transactions | | | (.13 | ) |
| Total from investment operations | | | (.19 | ) |
| Net asset value, end of period | | | $9.81 | |
| Total Return(b): | | | (1.90)% | |
| |
| Ratios/Supplemental Data: | | | |
| Net assets, end of period (000) | | | $593 | |
| Average net assets (000) | | | $300 | |
| Ratios to average net assets(c): | | | | |
| Expenses, including distribution and service (12b-1) fees | | | 2.35% | (d)(e) |
| Expenses, excluding distribution and service (12b-1) fees | | | 1.35% | (d)(e) |
| Net investment loss | | | (.97)% | (d)(e) |
| Portfolio turnover rate | | | 48% | (f) |
(a) Commencement of Series.
(b) Total return does not consider the effects of sales loads. Total return is calculated assuming a purchase of a share on the first day and a sale on the last day of each period reported, and includes reinvestment of dividends and distributions. Total returns may reflect adjustments to conform to generally accepted accounting principles. Total returns for periods less than a full year are not annualized.
(c) Does not include expenses of the underlying fund in which the Series invests.
(d) Net of expense waiver/reimbursement. If the investment manager had not waived/reimbursed expenses, the expense ratios including and excluding distribution and services (12b-1) fees and net investment loss ratio would have been 3.85%, 2.85% and (2.47)%, respectively, for the period ended October 31, 2012.
(e) Annualized.
(f) Not annualized.
See Notes to Financial Statements.
| | | | |
| Prudential Jennison Global Opportunities Fund | | | 31 | |
Financial Highlights
continued
| | | | |
| Class Z Shares | | | |
| | | March 14,
2012(a)
through October 31,
2012 | |
| Per Share Operating Performance: | | | | |
| Net Asset Value, Beginning Of Period | | | $10.00 | |
| Income (loss) from investment operations: | | | | |
| Net investment loss | | | - | (d) |
| Net realized and unrealized loss on investment and foreign currency transactions | | | (.13 | ) |
| Total from investment operations | | | (.13 | ) |
| Net asset value, end of period | | | $9.87 | |
| Total Return(b): | | | (1.30)% | |
| |
| Ratios/Supplemental Data: | | | |
| Net assets, end of period (000) | | | $15,002 | |
| Average net assets (000) | | | $14,655 | |
| Ratios to average net assets(c): | | | | |
| Expenses, including distribution and service (12b-1) fees | | | 1.35% | (e)(f) |
| Expenses, excluding distribution and service (12b-1) fees | | | 1.35% | (e)(f) |
| Net investment loss | | | (.03)% | (e)(f) |
| Portfolio turnover rate | | | 48% | (g) |
(a) Commencement of Series.
(b) Total return is calculated assuming a purchase of a share on the first day and a sale on the last day of each period reported, and includes reinvestment of dividends and distributions. Total returns may reflect adjustments to conform to generally accepted accounting principles. Total returns for periods less than a full year are not annualized.
(c) Does not include expenses of the underlying fund in which the Series invests.
(d) Less than $.005 per share.
(e) Net of expense waiver/reimbursement. If the investment manager had not waived/reimbursed expenses, the expense ratios including and excluding distribution and services (12b-1) fees and net investment loss ratio would have been 2.72%, 2.72% and (1.40)%, respectively, for the period ended October 31, 2012.
(f) Annualized.
(g) Not annualized.
See Notes to Financial Statements.
| | |
| 32 | | Visit our website at www.prudentialfunds.com |
Report of Independent Registered Public
Accounting Firm
The Board of Directors and Shareholders
Prudential World Fund, Inc.:
We have audited the accompanying statement of assets and liabilities of Prudential Jennison Global Opportunities Fund (one of the series constituting Prudential World Fund, Inc., hereafter referred to as the “Fund”), including the portfolio of investments, as of October 31, 2012, and the related statements of operations, changes in net assets and the financial highlights for the period March 14, 2012 (commencement of operations) to October 31, 2012. These financial statements and financial highlights are the responsibility of the Fund’s management. Our responsibility is to express an opinion on these financial statements and financial highlights based on our audits.
We conducted our audits in accordance with the standards of the Public Company Accounting Oversight Board (United States). Those standards require that we plan and perform the audit to obtain reasonable assurance about whether the financial statements and financial highlights are free of material misstatement. An audit includes examining, on a test basis, evidence supporting the amounts and disclosures in the financial statements. Our procedures included confirmation of securities owned as of October 31, 2012, by correspondence with the custodian, transfer agent and brokers or by other appropriate auditing procedures when replies from brokers were not received. An audit also includes assessing the accounting principles used and significant estimates made by management, as well as evaluating the overall financial statement presentation. We believe that our audits provide a reasonable basis for our opinion.
In our opinion, the financial statements and financial highlights referred to above present fairly, in all material respects, the financial position of the Fund as of October 31, 2012, and the results of its operations, the changes in its net assets and the financial highlights for the period March 14, 2012 to October 31, 2012, in conformity with U.S. generally accepted accounting principles.

New York, New York
December 21, 2012
| | | | |
| Prudential Jennison Global Opportunities Fund | | | 33 | |
INFORMATION ABOUT BOARD MEMBERS AND OFFICERS
(Unaudited)
Information about Board Members and Officers of the Fund is set forth below. Board Members who are not deemed to be “interested persons” of the Fund, as defined in the 1940 Act, are referred to as “Independent Board Members.” Board Members who are deemed to be “interested persons” of the Fund are referred to as “Interested Board Members.” The Board Members are responsible for the overall supervision of the operations of the Fund and perform the various duties imposed on the directors of investment companies by the 1940 Act. The Board in turn elects the Officers, who are responsible for administering the day-to-day operations of the Fund.
| | | | |
| Independent Board Members(1) |
Name, Address, Age Position(s) Portfolios Overseen | | Principal Occupation(s) During Past Five Years | | Other Directorships Held |
Kevin J. Bannon (60) Board Member Portfolios Overseen: 63 | | Managing Director (since April 2008) and Chief Investment Officer (since October 2008) of Highmount Capital LLC (registered investment adviser); formerly Executive Vice President and Chief Investment Officer (April 1993-August 2007) of Bank of New York Company; President (May 2003-May 2007) of BNY Hamilton Family of Mutual Funds. | | Director of Urstadt Biddle Properties (since September 2008). |
Linda W. Bynoe (60) Board Member Portfolios Overseen: 63 | | President and Chief Executive Officer (since March 1995) and formerly Chief Operating Officer (December 1989-February 1995) of Telemat Ltd. (management consulting); formerly Vice President (January 1985-June 1989) at Morgan Stanley & Co (broker-dealer). | | Director of Simon Property Group, Inc. (retail real estate) (May 2003-May 2012); Director of Anixter International, Inc. (communication products distributor) (since January 2006); Director of Northern Trust Corporation (financial services) (since April 2006); Trustee of Equity Residential (residential real estate) (since December 2009). |
Michael S. Hyland, CFA (67) Board Member Portfolios Overseen: 63 | | Independent Consultant (since February 2005); formerly Senior Managing Director (July 2001-February 2005) of Bear Stearns & Co, Inc.; Global Partner, INVESCO (1999-2001); Managing Director and President of Salomon Brothers Asset Management (1989-1999). | | None. |
Douglas H. McCorkindale (73) Board Member Portfolios Overseen: 63 | | Formerly Chairman (February 2001-June 2006), Chief Executive Officer (June 2000-July 2005), President (September 1997-July 2005) and Vice Chairman (March 1984-May 2000) of Gannett Co. Inc. (publishing and media). | | Director of Lockheed Martin Corp. (aerospace and defense) (since May 2001). |
Prudential Jennison Global Opportunities Fund
| | | | |
| Independent Board Members(1) |
Name, Address, Age Position(s) Portfolios Overseen | | Principal Occupation(s) During Past Five Years | | Other Directorships Held |
Stephen P. Munn (70) Board Member Portfolios Overseen: 63 | | Lead Director (since 2007) and formerly Chairman (1993-2007) of Carlisle Companies Incorporated (manufacturer of industrial products). | | Lead Director (since 2007) of Carlisle Companies Incorporated (manufacturer of industrial products). |
Richard A. Redeker (69) Board Member & Independent Chair Portfolios Overseen: 63 | | Retired Mutual Fund Senior Executive (44 years); Management Consultant; Independent Directors Council (organization of 2,800 Independent Mutual Fund Directors)-Executive Committee, Chair of Policy Steering Committee, Governing Council. | | None. |
Robin B. Smith (73) Board Member Portfolios Overseen: 63 | | Chairman of the Board (since January 2003) of Publishers Clearing House (direct marketing); Member of the Board of Directors of ADLPartner (marketing) (since December 2010); formerly Chairman and Chief Executive Officer (August 1996-January 2003) of Publishers Clearing House. | | Formerly Director of BellSouth Corporation (telecommunications) (1992-2006). |
Stephen G. Stoneburn (69) Board Member Portfolios Overseen: 63 | | Chairman, (since July 2011), President and Chief Executive Officer (since June 1996) of Quadrant Media Corp. (publishing company); formerly President (June 1995-June 1996) of Argus Integrated Media, Inc.; Senior Vice President and Managing Director (January 1993-1995) of Cowles Business Media; Senior Vice President of Fairchild Publications, Inc. (1975-1989). | | None. |
| | | | |
| Interested Board Members(1) |
Name, Address, Age Position(s) Portfolios Overseen | | Principal Occupation(s) During Past Five Years | | Other Directorships Held |
Stuart S. Parker (50) Board Member & President Portfolios Overseen: 63 | | President of Prudential Investments LLC (since January 2012); Executive Vice President of Jennison Associates LLC and Head of Retail Distribution of Prudential Investments LLC (June 2005 - December 2011). | | None. |
Visit our website at www.prudentialfunds.com
| | | | |
| Interested Board Members(1) |
Name, Address, Age Position(s) Portfolios Overseen | | Principal Occupation(s) During Past Five Years | | Other Directorships Held |
Scott E. Benjamin (39) Board Member & Vice President Portfolios Overseen: 63 | | Executive Vice President (since June 2009) of Prudential Investments LLC; Executive Vice President (June 2009-June 2012) and Vice President (since June 2012) of Prudential Investment Management Services LLC; Executive Vice President (since September 2009) of AST Investment Services, Inc.; Senior Vice President of Product Development and Marketing, Prudential Investments (since February 2006); Vice President of Product Development and Product Management, Prudential Investments (2003-2006). | | None. |
(1) The year that each Board Member joined the Funds’ Board is as follows:
Kevin J. Bannon, 2008; Linda W. Bynoe, 2005; Michael S. Hyland, 2008; Douglas H. McCorkindale, 2003; Stephen P. Munn, 2008; Richard A. Redeker, 2003; Robin B. Smith, 1996; Stephen G. Stoneburn, 1996; Stuart S. Parker, Board Member and President since 2012; Scott E. Benjamin, Board Member since 2010 and Vice President since 2009.
| | |
| Fund Officers(a)(1) |
Name, Address and Age Position with Fund | | Principal Occupation(s) During Past Five Years |
Judy A. Rice (64) Vice President | | Chairman of Prudential Investments LLC (since January 2012); President, Chief Executive Officer (May 2011-Present) and Executive Vice President (December 2008-May 2011) of Prudential Investment Management Services LLC; formerly President, Chief Executive Officer, Chief Operating Officer and Officer-In-Charge (February 2003-December 2011) of Prudential Investments LLC; formerly President, Chief Executive Officer and Officer-In-Charge (April 2003-December 2011) of Prudential Mutual Fund Services LLC (PMFS); formerly Member of the Board of Directors of Jennison Associates LLC (November 2010-December 2011); formerly Vice President (February 1999-April 2006) of Prudential Investment Management Services LLC; formerly President, COO, CEO and Manager of PIFM Holdco, LLC (April 2006-December 2011); formerly President, Chief Executive Officer, Chief Operating Officer and Officer-In-Charge (May 2003-June 2005) and Director (May 2003-March 2006) and Executive Vice President (June 2005-March 2006) of AST Investment Services, Inc.; Member of Board of Governors of the Investment Company Institute. |
Prudential Jennison Global Opportunities Fund
| | |
| Fund Officers(a)(1) |
Name, Address and Age Position with Fund | | Principal Occupation(s) During Past Five Years |
Raymond A. O’Hara (57) Chief Legal Officer | | Vice President and Corporate Counsel (since July 2010) of Prudential Insurance Company of America (Prudential); Vice President (March 2011-Present) of Pruco Life Insurance Company and Pruco Life Insurance Company of New Jersey; Vice President and Corporate Counsel (March 2011-Present) of Prudential Annuities Life Assurance Corporation; Chief Legal Officer of Prudential Investments LLC (since June 2012); Chief Legal Officer of PMFS (since June 2012) and Corporate Counsel of AST Investment Services, Inc. (since June 2012); formerly Assistant Vice President and Corporate Counsel (September 2008-July 2010) of The Hartford Financial Services Group, Inc.; formerly Associate (September 1980-December 1987) and Partner (January 1988–August 2008) of Blazzard & Hasenauer, P.C. (formerly, Blazzard, Grodd & Hasenauer, P.C.). |
Deborah A. Docs (54) Secretary | | Vice President and Corporate Counsel (since January 2001) of Prudential; Vice President (since December 1996) and Assistant Secretary (since March 1999) of Prudential Investments LLC; formerly Vice President and Assistant Secretary (May 2003-June 2005) of AST Investment Services, Inc. |
Jonathan D. Shain (54) Assistant Secretary | | Vice President and Corporate Counsel (since August 1998) of Prudential; Vice President and Assistant Secretary (since May 2001) of Prudential Investments LLC; Vice President and Assistant Secretary (since February 2001) of PMFS; formerly Vice President and Assistant Secretary (May 2003-June 2005) of AST Investment Services, Inc. |
Claudia DiGiacomo (38) Assistant Secretary | | Vice President and Corporate Counsel (since January 2005) of Prudential; Vice President and Assistant Secretary of Prudential Investments LLC (since December 2005); Associate at Sidley Austin Brown & Wood LLP (1999-2004). |
Andrew R. French (50) Assistant Secretary | | Vice President and Corporate Counsel (since February 2010) of Prudential; formerly Director and Corporate Counsel (2006-2010) of Prudential; Vice President and Assistant Secretary (since January 2007) of Prudential Investments LLC; Vice President and Assistant Secretary (since January 2007) of PMFS. |
Amanda S. Ryan (34) Assistant Secretary | | Director and Corporate Counsel (since March 2012) of Prudential; Director and Assistant Secretary (since June 2012) of Prudential Investments LLC; Associate at Ropes & Gray (2008-2012). |
Timothy J. Knierim (53) Chief Compliance Officer | | Chief Compliance Officer of Prudential Investment Management, Inc. (since July 2007); formerly Chief Risk Officer of Prudential Investment Management, Inc. and Prudential Investments LLC (2002-2007) and formerly Chief Ethics Officer of Prudential Investment Management, Inc. and Prudential Investments LLC (2006-2007). |
Valerie M. Simpson (54) Deputy Chief Compliance Officer | | Chief Compliance Officer (since April 2007) of Prudential Investments LLC and AST Investment Services, Inc.; formerly Vice President-Financial Reporting (June 1999-March 2006) for Prudential Life and Annuities Finance. |
Visit our website at www.prudentialfunds.com
| | |
| Fund Officers(a)(1) |
Name, Address and Age Position with Fund | | Principal Occupation(s) During Past Five Years |
Theresa C. Thompson (50) Deputy Chief Compliance Officer | | Vice President, Compliance, Prudential Investments LLC (since April 2004); and Director, Compliance, Prudential Investments LLC (2001-2004). |
Richard W. Kinville (44) Anti-Money Laundering Compliance Officer | | Vice President, Corporate Compliance, Anti-Money Laundering Unit (since January 2005) of Prudential; committee member of the American Council of Life Insurers Anti-Money Laundering and Critical Infrastructure Committee (since January 2007); formerly Investigator and Supervisor in the Special Investigations Unit for the New York Central Mutual Fire Insurance Company (August 1994-January 1999); Investigator in AXA Financial’s Internal Audit Department and Manager in AXA’s Anti-Money Laundering Office (January 1999-January 2005); first chair of the American Council of Life Insurers Anti-Money Laundering and Critical Infrastructure Committee (June 2007-December 2009). |
Grace C. Torres (53) Treasurer and Principal Financial and Accounting Officer | | Assistant Treasurer (since March 1999) and Senior Vice President (since September 1999) of Prudential Investments LLC; Assistant Treasurer (since May 2003) and Vice President (since June 2005) of AST Investment Services, Inc.; Senior Vice President and Assistant Treasurer (since May 2003) of Prudential Annuities Advisory Services, Inc.; formerly Senior Vice President (May 2003-June 2005) of AST Investment Services, Inc. |
M. Sadiq Peshimam (48) Assistant Treasurer | | Vice President (since 2005) of Prudential Investments LLC. |
Peter Parrella (54) Assistant Treasurer | | Vice President (since 2007) and Director (2004-2007) within Prudential Mutual Fund Administration; formerly Tax Manager at SSB Citi Fund Management LLC (1997-2004). |
(a) Excludes Mr. Parker and Mr. Benjamin, interested Board Members who also serve as President and Vice President, respectively.
(1) The year that each individual became an officer of the Fund is as follows:
Judy A. Rice, 2012; Raymond A. O’Hara, 2012; Deborah A. Docs, 2005; Jonathan D. Shain, 2005; Claudia DiGiacomo, 2005; Andrew R. French, 2006; Amanda S. Ryan, 2012; Timothy J. Knierim, 2007; Valerie M. Simpson, 2007; Theresa C. Thompson, 2008; Richard W. Kinville, 2011; Grace C. Torres, 1995; Sadiq Peshimam, 2006; Peter Parrella, 2007.
Explanatory Notes to Tables:
| | n | Board Members are deemed to be “Interested,” as defined in the 1940 Act, by reason of their affiliation with Prudential Investments LLC and/or an affiliate of Prudential Investments LLC. |
| | n | Unless otherwise noted, the address of all Board Members and Officers is c/o Prudential Investments LLC, Gateway Center Three, 100 Mulberry Street, Newark, New Jersey 07102-4077. |
| | n | There is no set term of office for Board Members or Officers. The Board Members have adopted a retirement policy, which calls for the retirement of Board Members on December 31 of the year in which they reach the age of 75. |
| | n | “Other Directorships Held” includes only directorships of companies required to register or file reports with the SEC under the 1934 Act (that is, “public companies”) or other investment companies registered under the 1940 Act. |
| | n | “Portfolios Overseen” includes all investment companies managed by Prudential Investments LLC. The investment companies for which PI serves as manager include the Prudential Investments Mutual Funds, The Prudential Variable Contract Accounts, Target Mutual Funds, Prudential Short Duration High Yield Fund, Inc., The Prudential Series Fund, Prudential’s Gibraltar Fund, Inc. and the Advanced Series Trust. |
Prudential Jennison Global Opportunities Fund
| | | | |
| n MAIL | | n TELEPHONE | | n WEBSITE |
Gateway Center Three 100 Mulberry Street Newark, NJ 07102 | | (800) 225-1852 | | www.prudentialfunds.com |
|
| PROXY VOTING |
| The Board of Directors of the Fund has delegated to the Fund’s investment subadviser the responsibility for voting any proxies and maintaining proxy recordkeeping with respect to the Fund. A description of these proxy voting policies and procedures is available without charge, upon request, by calling (800) 225-1852 or by visiting the Securities and Exchange Commission’s website at www.sec.gov. Information regarding how the Fund voted proxies relating to portfolio securities during the most recent 12-month period ended June 30 is available on the Fund’s website and on the Securities and Exchange Commission’s website. |
|
| DIRECTORS |
Kevin J. Bannon • Scott E. Benjamin • Linda W. Bynoe • Michael S. Hyland • Douglas H. McCorkindale • Stephen P. Munn • Stuart S. Parker • Richard A. Redeker •
Robin B. Smith • Stephen G. Stoneburn |
|
| OFFICERS |
| Stuart S. Parker, President • Judy A. Rice, Vice President • Scott E. Benjamin, Vice President • Grace C. Torres, Treasurer and Principal Financial and Accounting Officer • Raymond A. O’Hara, Chief Legal Officer • Deborah A. Docs, Secretary • Timothy J. Knierim, Chief Compliance Officer • Valerie M. Simpson, Deputy Chief Compliance Officer • Theresa C. Thompson, Deputy Chief Compliance Officer • Richard W. Kinville, Anti-Money Laundering Compliance Officer • Jonathan D. Shain, Assistant Secretary • Claudia DiGiacomo, Assistant Secretary • Amanda S. Ryan, Assistant Secretary • Andrew R. French, Assistant Secretary • M. Sadiq Peshimam, Assistant Treasurer • Peter Parrella, Assistant Treasurer |
| | | | |
| MANAGER | | Prudential Investments LLC | | Gateway Center Three
100 Mulberry Street
Newark, NJ 07102 |
|
| INVESTMENT SUBADVISER | | Jennison Associates LLC | | 466 Lexington Avenue
New York, NY 10017 |
|
| DISTRIBUTOR | | Prudential Investment
Management Services LLC | | Gateway Center Three
100 Mulberry Street
Newark, NJ 07102 |
|
| CUSTODIAN | | The Bank of New York Mellon | | One Wall Street
New York, NY 10286 |
|
| TRANSFER AGENT | | Prudential Mutual Fund
Services LLC | | PO Box 9658
Providence, RI 02940 |
|
| INDEPENDENT REGISTERED PUBLIC ACCOUNTING FIRM | | KPMG LLP | | 345 Park Avenue
New York, NY 10154 |
|
| FUND COUNSEL | | Willkie Farr & Gallagher LLP | | 787 Seventh Avenue
New York, NY 10019 |
|
| An investor should consider the investment objectives, risks, charges, and expenses of the Fund carefully before investing. The prospectus and summary prospectus contain this and other information about the Fund. An investor may obtain a prospectus and summary prospectus by visiting our website at www.prudentialfunds.com or by calling (800) 225-1852. The prospectus and summary prospectus should be read carefully before investing. |
|
| E-DELIVERY |
| To receive your mutual fund documents online, go to www.prudentialfunds.com/edelivery and enroll. Instead of receiving printed documents by mail, you will receive notification via email when new materials are available. You can cancel your enrollment or change your email address at any time by visiting the website address above. |
|
| SHAREHOLDER COMMUNICATIONS WITH DIRECTORS |
| Shareholders can communicate directly with the Board of Directors by writing to the Chair of the Board, Prudential Jennison Global Opportunities Fund, Prudential Investments, Attn: Board of Directors, 100 Mulberry Street, Gateway Center Three, Newark, NJ 07102. Shareholders can communicate directly with an individual Director by writing to the same address. Communications are not screened before being delivered to the addressee. |
|
| AVAILABILITY OF PORTFOLIO SCHEDULE |
| The Fund files its complete schedule of portfolio holdings with the Securities and Exchange Commission for the first and third quarters of each fiscal year on Form N-Q. The Fund’s Forms N-Q are available on the Commission’s website at www.sec.gov. The Fund’s Forms N-Q may also be reviewed and copied at the Commission’s Public Reference Room in Washington, D.C. Information on the operation and location of the Public Reference Room may be obtained by calling (202) 551-8090. The Fund’s schedule of portfolio holdings is also available on the Fund’s website as of the end of each month. |
|
| The Fund’s Statement of Additional Information contains additional information about the Fund’s Directors and is available without charge, upon request, by calling (800) 225-1852. |
Mutual Funds:
| | | | |
| ARE NOT INSURED BY THE FDIC OR ANY FEDERAL GOVERNMENT AGENCY | | MAY LOSE VALUE | | ARE NOT A DEPOSIT OF OR GUARANTEED BY ANY BANK OR ANY BANK AFFILIATE |

PRUDENTIAL JENNISON GLOBAL OPPORTUNITIES FUND
| | | | | | |
| SHARE CLASS | | A | | C | | Z |
| NASDAQ | | PRJAX | | PRJCX | | PRJZX |
| CUSIP | | 743969719 | | 743969693 | | 743969685 |
MF214E 0236591-00001-00

PRUDENTIAL INVESTMENTS»MUTUAL FUNDS
PRUDENTIAL JENNISON INTERNATIONAL OPPORTUNITIES FUND
ANNUAL REPORT · OCTOBER 31, 2012
Fund Type
International Stock
Objective
To seek long-term growth of capital
This report is not authorized for distribution to prospective investors unless preceded or accompanied by a current prospectus.
The views expressed in this report and information about the Fund’s portfolio holdings are for the period covered by this report and are subject to change thereafter.
Prudential Investments, Prudential, Jennison, the Prudential logo, the Rock symbol, and Bring Your Challenges are service marks of Prudential Financial, Inc. and its related entities, registered in many jurisdictions worldwide.

December 14, 2012
Dear Shareholder:
We hope you find the annual report for the Prudential Jennison International Opportunities Fund informative and useful. The report covers performance for the four-month period that ended October 31, 2012.
We recognize that ongoing market volatility may make it a difficult time to be an investor. We continue to believe a prudent response to uncertainty is to maintain a diversified portfolio of funds consistent with your tolerance for risk, time horizon, and financial goals.
Your financial advisor can help you create a diversified investment plan that may include funds covering all the basic asset classes and that reflects your personal investor profile and risk tolerance. Keep in mind, however, that diversification and asset allocation strategies do not assure a profit or protect against loss in declining markets.
Prudential Investments® is dedicated to helping you solve your toughest investment challenges—whether it’s capital growth, reliable income, or protection from market volatility and other risks. We offer the expertise of Prudential Financial’s affiliated asset managers* that strive to be leaders in a broad range of funds to help you stay on course to the future you envision. They also manage money for major corporations and pension funds around the world, which means you benefit from the same expertise, innovation, and attention to risk demanded by today’s most sophisticated investors.
Thank you for choosing the Prudential Investments family of funds.
Sincerely,

Stuart S. Parker, President
Prudential Jennison International Opportunities Fund
*Most of Prudential Investments’ equity funds are advised by Jennison Associates LLC, Quantitative Management Associates LLC (QMA), or Prudential Real Estate Investors. Prudential Investments’ fixed income and money market funds are advised by Prudential Investment Management, Inc. (PIM) through its Prudential Fixed Income unit. Jennison Associates LLC, QMA, and PIM are registered investment advisers and Prudential Financial companies. Prudential Real Estate Investors is a unit of PIM.
| | | | |
| Prudential Jennison International Opportunities Fund | | | 1 | |
Your Fund’s Performance
Performance data quoted represent past performance. Past performance does not guarantee future results. The investment return and principal value of an investment will fluctuate, so that an investor’s shares, when redeemed, may be worth more or less than their original cost. Current performance may be lower or higher than the past performance data quoted. An investor may obtain performance data as of the most recent month-end by visiting our website at www.prudentialfunds.com or by calling (800) 225-1852. Class A shares have a maximum initial sales charge of 5.50%. Gross operating expenses: Class A, 4.42%; Class C, 5.29%; Class Z, 4.28%. Net operating expenses: Class A, 1.60%; Class C, 2.35%; Class Z, 1.35%, after contractual reduction through 2/28/2014.
| | |
Cumulative Total Returns (Without Sales Charges) as of 10/31/12 |
| | | Since Inception |
Class A | | 13.10%(6/5/2012) |
Class C | | 12.80 (6/5/2012) |
Class Z | | 13.20 (6/5/2012) |
MSCI AC World Index ex-US | | 14.18 |
Lipper International Multi-Cap Core Funds Average | | 13.69 |
Lipper International Multi-Cap Growth Funds Average | | 12.29 |
| | |
Average Annual Total Returns (With Sales Charges) as of 9/30/12 |
| | | Since Inception |
Class A | | N/A (6/5/2012) |
Class C | | N/A (6/5/2012) |
Class Z | | N/A (6/5/2012) |
MSCI AC World Index ex-US | | N/A |
Lipper International Multi-Cap Core Funds Average | | N/A |
Lipper International Multi-Cap Growth Funds Average | | N/A |
| | |
Average Annual Total Returns (With Sales Charges) as of 10/31/12 |
| | | Since Inception |
Class A | | N/A (6/5/2012) |
Class C | | N/A (6/5/2012) |
Class Z | | N/A (6/5/2012) |
| | |
Average Annual Total Returns (Without Sales Charges) as of 10/31/12 |
| | | Since Inception |
Class A | | N/A (6/5/2012) |
Class C | | N/A (6/5/2012) |
Class Z | | N/A (6/5/2012) |
| | |
| 2 | | Visit our website at www.prudentialfunds.com |
Growth of a $10,000 Investment
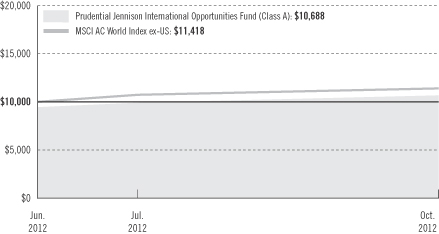
The graph compares a $10,000 investment in the Prudential Jennison International Opportunities Fund (Class A shares) with a similar investment in the MSCI AC World Index ex-US by portraying the initial account values at the commencement of operations for Class A shares (June 5, 2012) and the account values at the end of the current fiscal year (October 31, 2012), as measured on a quarterly basis. For purposes of the graph, and unless otherwise indicated, it has been assumed that (a) the maximum applicable front-end sales charge was deducted from the initial $10,000 investment in Class A shares; (b) all recurring fees (including management fees) were deducted; and (c) all dividends and distributions were reinvested. The line graph provides information for Class A shares only. As indicated in the tables provided earlier, performance for Class C and Class Z shares will vary due to the differing charges and expenses applicable to each share class (as indicated in the following paragraphs). Without waiver of fees and/or expense reimbursement, if any, the returns would have been lower.
Total returns and the ending account values in the graph include changes in share price and reinvestment of dividends and capital gains distributions in a hypothetical investment for the periods shown. The Fund’s total returns do not reflect the deduction of income taxes on an individual’s investment. Taxes may reduce your actual investment returns on income or gains paid by the Fund or any gains you may realize if you sell your shares.
Source: Prudential Investments LLC and Lipper Inc.
Inception returns are provided for any share class with less than 10 calendar years of returns.
The average annual total returns take into account applicable sales charges. Class A shares are subject to a maximum front-end sales charge of 5.50% and a 12b-1 fee of 0.30% annually. All investors who purchase Class A shares in an amount of $1 million or more and sell these shares within 12 months of purchase are subject to a contingent deferred sales charge (CDSC) of 1%. Under certain circumstances, an exchange may be
| | | | |
| Prudential Jennison International Opportunities Fund | | | 3 | |
Your Fund’s Performance (continued)
made from specified share classes of the Fund to one or more other share classes of the Fund. Class C shares are not subject to a front-end sales charge, but charge a CDSC of 1% for shares sold within 12 months from the date of purchase and an annual 12b-1 fee of 1%. Class Z shares are not subject to a CDSC or 12b-1 fee. The returns in the tables and graph reflect the share class expense structure in effect at the close of the fiscal period. The returns in the tables and graph do not reflect the deduction of taxes that a shareholder would pay on Fund distributions or following the redemption of Fund shares.
Benchmark Definitions
MSCI AC World Index ex-US
The MSCI All Country World Index ex-US is an unmanaged free-float-adjusted, market capitalization-weighted index designed to measure the equity market performance of developed and emerging markets, excluding the U.S. The MSCI AC World Index ex-US comprises 23 developed market country indexes and 21 emerging market country indexes. The developed market country indexes include Australia, Austria, Belgium, Canada, Denmark, Finland, France, Germany, Greece, Hong Kong, Ireland, Israel, Italy, Japan, Netherlands, New Zealand, Norway, Portugal, Singapore, Spain, Sweden, Switzerland, and the United Kingdom. The emerging market country indexes include Brazil, Chile, China, Colombia, Czech Republic, Egypt, Hungary, India, Indonesia, Korea, Malaysia, Mexico, Morocco, Peru, Philippines, Poland, Russia, South Africa, Taiwan, Thailand, and Turkey.
Lipper International Multi-Cap Core Funds Average
Funds in the Lipper International Multi-Cap Core Funds Average are Funds that, by portfolio practice, invest in a variety of market capitalization ranges without concentrating 75% of their equity assets in any one market capitalization range over an extended period of time. International multi-cap core funds typically have an average price-to-cash flow ratio, price-to-book ratio, and three-year sales-per-share growth value compared to the S&P/Citigroup World ex-U.S. BMI.
Lipper International Multi-Cap Growth Funds Average
Funds in the Lipper International Multi-Cap Growth Funds Average are Funds that by portfolio practice, invest in a variety of market capitalization ranges without concentrating 75% of their equity assets in any one market capitalization range over an extended period of time. International multi-cap growth funds typically have an above-average price-to-cash flow ratio, price-to-book ratio, and three-year sales-per-share growth value compared to the S&P/Citigroup World ex-U.S. BMI.
Although Lipper classifies the Fund in its International Multi-Cap Core Funds category, the Fund utilizes the Lipper International Multi-Cap Growth Funds category because the Fund’s investment manager believes that the Lipper International Multi-Cap Growth Funds category provides a more appropriate basis for Fund performance comparisons.
Investors cannot invest directly in an index or average. The returns for the Index would be lower if they included the effects of sales charges, operating expenses of a mutual fund, or taxes. Returns for the Lipper Average reflect the deduction of operating expenses, but not sales charges or taxes.
| | |
| 4 | | Visit our website at www.prudentialfunds.com |
| | | | |
Five Largest Holdings expressed as a percentage of net assets as of 10/31/12 | | | | |
Novo Nordisk A/S (Class B Stock), Denmark | | | 3.6 | % |
SAP AG, Germany | | | 3.6 | |
Inditex SA, Spain | | | 3.4 | |
Eni SpA, Italy | | | 3.0 | |
Michael Kors Holdings Ltd., United States | | | 2.8 | |
| | | | |
Five Largest Industries expressed as a percentage of net assets as of 10/31/12 | | | | |
Textiles, Apparel & Luxury Goods | | | 10.6 | % |
Semiconductors & Semiconductor Equipment | | | 6.9 | |
Specialty Retail | | | 6.8 | |
Beverages | | | 6.5 | |
Software | | | 5.6 | |
| | | | |
| Prudential Jennison International Opportunities Fund | | | 5 | |
Fees and Expenses (Unaudited)
As a shareholder of the Fund, you incur two types of costs: (1) transaction costs, including sales charges (loads) on purchase payments and redemptions, as applicable, and (2) ongoing costs, including management fees, distribution, and/or service (12b-1) fees, and other Fund expenses, as applicable. This example is intended to help you understand your ongoing costs (in dollars) of investing in the Fund and to compare these costs with the ongoing costs of investing in other mutual funds.
The example is based on an investment of $1,000 invested on May 1, 2012, at the beginning of the period, and held through the six-month period ended October 31, 2012. The example is for illustrative purposes only; you should consult the Prospectus for information on initial and subsequent minimum investment requirements.
The Fund’s transfer agent may charge additional fees to holders of certain accounts that are not included in the expenses shown in the table on the following page. These fees apply to individual retirement accounts (IRAs) and Section 403(b) accounts. As of the close of the six-month period covered by the table, IRA fees included an annual maintenance fee of $15 per account (subject to a maximum annual maintenance fee of $25 for all accounts held by the same shareholder). Section 403(b) accounts are charged an annual $25 fiduciary maintenance fee. Some of the fees may vary in amount, or may be waived, based on your total account balance or the number of Prudential Investments funds, including the Fund, that you own. You should consider the additional fees that were charged to your Fund account over the six-month period when you estimate the total ongoing expenses paid over the period and the impact of these fees on your ending account value, as these additional expenses are not reflected in the information provided in the expense table. Additional fees have the effect of reducing investment returns.
Actual Expenses
The first line for each share class in the table on the following page provides information about actual account values and actual expenses. You may use the information on this line, together with the amount you invested, to estimate the expenses that you paid over the period. Simply divide your account value by $1,000 (for example, an $8,600 account value ÷ $1,000 = 8.6), then multiply the result by the number on the first line under the heading “Expenses Paid During the Six-Month Period” to estimate the expenses you paid on your account during this period.
Hypothetical Example for Comparison Purposes
The second line for each share class in the table on the following page provides information about hypothetical account values and hypothetical expenses based on the Fund’s actual expense ratio and an assumed rate of return of 5% per year before
| | |
| 6 | | Visit our website at www.prudentialfunds.com |
expenses, which is not the Fund’s actual return. The hypothetical account values and expenses may not be used to estimate the actual ending account balance or expenses you paid for the period. You may use this information to compare the ongoing costs of investing in the Fund and other funds. To do so, compare this 5% hypothetical example with the 5% hypothetical examples that appear in the shareholder reports of the other funds.
Please note that the expenses shown in the table are meant to highlight your ongoing costs only and do not reflect any transactional costs such as sales charges (loads). Therefore, the second line for each share class in the table is useful in comparing ongoing costs only and will not help you determine the relative total costs of owning different funds. In addition, if these transactional costs were included, your costs would have been higher.
| | | | | | | | | | | | | | | | | | |
Prudential
Jennison International
Opportunities Fund | | Beginning Account
Value
May 1, 2012 | | | Ending Account
Value
October 31, 2012 | | | Annualized
Expense Ratio
Based on the
Six-Month Period | | | Expenses Paid
During the
Six-Month Period* | |
| | | | | | | | | | | | | | | | | | |
| Class A | | Actual** | | $ | 1,000.00 | | | $ | 1,131.00 | | | | 1.60 | % | | $ | 6.94 | |
| | | Hypothetical | | $ | 1,000.00 | | | $ | 1,017.09 | | | | 1.60 | % | | $ | 8.11 | |
| | | | | | | | | | | | | | | | | | |
| Class C | | Actual** | | $ | 1,000.00 | | | $ | 1,128.00 | | | | 2.35 | % | | $ | 10.18 | |
| | | Hypothetical | | $ | 1,000.00 | | | $ | 1,013.32 | | | | 2.35 | % | | $ | 11.89 | |
| | | | | | | | | | | | | | | | | | |
| Class Z | | Actual** | | $ | 1,000.00 | | | $ | 1,132.00 | | | | 1.35 | % | | $ | 5.86 | |
| | | Hypothetical | | $ | 1,000.00 | | | $ | 1,018.35 | | | | 1.35 | % | | $ | 6.85 | |
*Fund expenses (net of fee waivers or subsidies, if any) for each share class are equal to the annualized expense ratio for each share class (provided in the table), multiplied by the average account value over the period, multiplied by the 184 days in the six-month period ended October 31, 2012, and divided by the 366 days in the Fund’s fiscal year ended October 31, 2012 (to reflect the six-month period) with the exception of the “Actual” information which reflects the 149-day period ended October 31, 2012, due to its inception date of June 5, 2012. Expenses presented in the table include the expenses of any underlying Funds in which the Fund may invest.
**Commenced operations on June 5, 2012.
| | | | |
| Prudential Jennison International Opportunities Fund | | | 7 | |
Portfolio of Investments
as of October 31, 2012
| | | | | | |
| Shares | | Description | | Value (Note 1) | |
LONG-TERM INVESTMENTS 99.1% | |
COMMON STOCKS 96.5% | | | | |
| |
Belgium 0.7% | | | | |
| 1,074 | | Anheuser-Busch InBev NV | | $ | 89,802 | |
| |
Brazil 8.6% | | | | |
| 7,479 | | Arezzo Industria e Comercio SA | | | 133,484 | |
| 8,938 | | BR Properties SA | | | 117,058 | |
| 6,940 | | Cia de Bebidas das Americas | | | 233,378 | |
| 15,151 | | Grupo BTG Pactual | | | 238,710 | |
| 8,588 | | Mills Estruturas e Servicos de Engenharia SA | | | 131,671 | |
| 16,580 | | Raia Drogasil SA | | | 182,449 | |
| | | | | | |
| | | | | 1,036,750 | |
| |
Chile 1.2% | | | | |
| 2,415 | | Sociedad Quimica y Minera de Chile SA, ADR | | | 139,708 | |
| |
China 3.5% | | | | |
| 946 | | Baidu, Inc., ADR* | | | 100,862 | |
| 9,082 | | Tencent Holdings Ltd. | | | 321,091 | |
| | | | | | |
| | | | | 421,953 | |
| |
Colombia 0.5% | | | | |
| 999 | | Ecopetrol SA, ADR | | | 59,151 | |
| |
Denmark 3.6% | | | | |
| 2,728 | | Novo Nordisk A/S (Class B Stock) | | | 439,629 | |
| |
France 5.8% | | | | |
| 2,313 | | Dassault Systemes SA | | | 243,705 | |
| 1,596 | | Remy Cointreau SA | | | 165,533 | |
| 2,602 | | Technip SA | | | 293,076 | |
| | | | | | |
| | | | | 702,314 | |
| |
Germany 6.6% | | | | |
| 1,246 | | Adidas AG | | | 106,153 | |
| 764 | | Deutsche Bank AG | | | 34,629 | |
| 1,970 | | Fresenius SE & Co. KGaA | | | 224,699 | |
| 5,940 | | SAP AG | | | 432,689 | |
| | | | | | |
| | | | | 798,170 | |
|
Hong Kong 2.4% | |
| 111,414 | | China Overseas Land & Investment Ltd. | | | 291,831 | |
See Notes to Financial Statements.
| | | | |
| Prudential Jennison International Opportunities Fund | | | 9 | |
Portfolio of Investments
as of October 31, 2012 continued
| | | | | | |
| Shares | | Description | | Value (Note 1) | |
COMMON STOCKS (Continued) | | | | |
|
Ireland 2.4% | |
| 16,475 | | Experian PLC | | $ | 284,478 | |
|
Italy 9.0% | |
| 3,062 | | Brunello Cucinelli SpA* | | | 54,174 | |
| 15,872 | | Eni SpA | | | 364,337 | |
| 4,775 | | Luxottica Group SpA | | | 181,650 | |
| 38,988 | | Prada SpA | | | 317,939 | |
| 1,233 | | Tod’s SpA | | | 144,232 | |
| 1,733 | | Yoox SpA* | | | 26,213 | |
| | | | | | |
| | | | | 1,088,545 | |
|
Japan 3.1% | |
| 791 | | FANUC Corp. | | | 125,938 | |
| 4,534 | | Unicharm Corp. | | | 245,357 | |
| | | | | | |
| | | | | 371,295 | |
|
Macau 1.5% | |
| 48,003 | | Sands China Ltd. | | | 180,552 | |
|
Mexico 2.1% | |
| 60,800 | | Corp. Inmobiliaria Vesta SAB de CV, 144A* | | | 91,520 | |
| 28,070 | | Mexichem SAB de CV | | | 139,128 | |
| 4,176 | | Mexichem SAB de CV, 144A | | | 20,698 | |
| | | | | | |
| | | | | 251,346 | |
|
Netherlands 1.2% | |
| 1,662 | | Gemalto NV | | | 149,975 | |
|
South Africa 4.7% | |
| 13,785 | | Mr Price Group Ltd. | | | 212,960 | |
| 3,181 | | Naspers Ltd. (Class N Stock) | | | 206,515 | |
| 19,999 | | Woolworths Holdings Ltd. | | | 150,846 | |
| | | | | | |
| | | | | 570,321 | |
|
South Korea 4.4% | |
| 226 | | Orion Corp. | | | 212,199 | |
| 265 | | Samsung Electronics Co. Ltd. | | | 318,311 | |
| | | | | | |
| | | | | 530,510 | |
See Notes to Financial Statements.
| | |
| 10 | | Visit our website at www.prudentialfunds.com |
| | | | | | |
| Shares | | Description | | Value (Note 1) | |
COMMON STOCKS (Continued) | | | | |
|
Spain 3.5% | |
| 3,260 | | Inditex SA | | $ | 415,951 | |
|
Switzerland 3.5% | |
| 1,556 | | Dufry AG* | | | 197,486 | |
| 578 | | Syngenta AG | | | 225,788 | |
| | | | | | |
| | | | | 423,274 | |
|
Taiwan 1.5% | |
| 11,271 | | Taiwan Semiconductor Manufacturing Co. Ltd., ADR | | | 179,209 | |
|
Thailand 1.4% | |
| 133,251 | | CP ALL PCL | | | 172,814 | |
|
Turkey 1.3% | |
| 3,369 | | BIM Birlesik Magazalar AS | | | 156,468 | |
|
United Kingdom 16.0% | |
| 6,094 | | Aggreko PLC | | | 211,437 | |
| 31,278 | | ARM Holdings PLC | | | 335,660 | |
| 3,309 | | ASOS PLC* | | | 120,416 | |
| 48,410 | | Barclays PLC | | | 177,728 | |
| 7,555 | | BG Group PLC | | | 139,903 | |
| 20,743 | | Compass Group PLC | | | 227,625 | |
| 10,411 | | Diageo PLC | | | 297,543 | |
| 8,015 | | Hikma Pharmaceuticals PLC | | | 95,649 | |
| 23,771 | | Rolls-Royce Holdings PLC | | | 327,793 | |
| | | | | | |
| | | | | 1,933,754 | |
|
United States 8.0% | |
| 4,726 | | Accenture PLC (Class A Stock) | | | 318,580 | |
| 1,714 | | Core Laboratories NV | | | 177,673 | |
| 979 | | Credicorp Ltd. | | | 126,624 | |
| 6,165 | | Michael Kors Holdings Ltd.* | | | 337,164 | |
| | | | | | |
| | | | | 960,041 | |
| | | | | | |
| | Total common stocks
(cost $10,245,876) | | | 11,647,841 | |
| | | | | | |
PREFERRED STOCKS 2.6% | |
|
Germany 2.6% | |
| 1,493 | | Volkswagen AG | | | 308,848 | |
See Notes to Financial Statements.
| | | | |
| Prudential Jennison International Opportunities Fund | | | 11 | |
Portfolio of Investments
as of October 31, 2012 continued
| | | | | | |
| Shares | | Description | | Value (Note 1) | |
PREFERRED STOCKS (Continued) | | | | |
|
United Kingdom | |
| 1,806,596 | | Rolls-Royce Holdings PLC (Class C Stock)* | | $ | 2,916 | |
| | | | | | |
| | Total preferred stocks
(cost $278,201) | | | 311,764 | |
| | | | | | |
| | Total long-term investments
(cost $10,524,077) | | | 11,959,605 | |
| | | | | | |
SHORT-TERM INVESTMENT 1.2% | |
|
Affiliated Money Market Mutual Fund | |
| 138,359 | | Prudential Investment Portfolios 2 - Prudential Core Taxable Money Market Fund
(cost $138,359) (Note 3)(a) | | | 138,359 | |
| | | | | | |
| | Total Investments 100.3%
(cost $10,662,436; Note 5) | | | 12,097,964 | |
| | Liabilities in excess of other assets (0.3%) | | | (30,492 | ) |
| | | | | | |
| | Net Assets 100.0% | | $ | 12,067,472 | |
| | | | | | |
The following abbreviations are used in the portfolio descriptions:
144A—Security was purchased pursuant to Rule 144A under the Securities Act of1933 and may not be resold subject to that rule except to qualified institutional buyers. Unless otherwise noted, 144A securities are deemed to be liquid.
ADR—American Depositary Receipt
| * | Non-income producing security. |
| (a) | Prudential Investments LLC, the manager of the Fund, also serves as manager of the Prudential Investment Portfolios 2 - Prudential Core Taxable Money Market Fund. |
Various inputs are used in determining the value of the Series’ investments. These inputs are summarized in the three broad levels listed below.
Level 1—quoted prices generally in active markets for identical securities.
Level 2—other significant observable inputs including, but not limited to, quoted prices for similar securities, interest rates and yield curves, prepayment speeds, foreign currency exchange rates, and amortized cost.
Level 3—significant unobservable inputs for securities valued in accordance with Board approved fair valuation procedures.
See Notes to Financial Statements.
| | |
| 12 | | Visit our website at www.prudentialfunds.com |
The following is a summary of the inputs used as of October 31, 2012 in valuing such portfolio securities:
| | | | | | | | | | | | |
| | | Level 1 | | | Level 2 | | | Level 3 | |
Investments in Securities | | | | | | | | | | | | |
Common Stocks | | | | | | | | | | | | |
Belgium | | $ | 89,802 | | | $ | — | | | $ | — | |
Brazil | | | 1,036,750 | | | | — | | | | — | |
Chile | | | 139,708 | | | | — | | | | — | |
China | | | 421,953 | | | | — | | | | — | |
Colombia | | | 59,151 | | | | — | | | | — | |
Denmark | | | 439,629 | | | | — | | | | — | |
France | | | 702,314 | | | | — | | | | — | |
Germany | | | 798,170 | | | | — | | | | — | |
Hong Kong | | | 291,831 | | | | — | | | | — | |
Ireland | | | 284,478 | | | | — | | | | — | |
Italy | | | 1,088,545 | | | | — | | | | — | |
Japan | | | 371,295 | | | | — | | | | — | |
Macau | | | 180,552 | | | | — | | | | — | |
Mexico | | | 251,346 | | | | — | | | | — | |
Netherlands | | | 149,975 | | | | — | | | | — | |
South Africa | | | 570,321 | | | | — | | | | — | |
South Korea | | | 530,510 | | | | — | | | | — | |
Spain | | | 415,951 | | | | — | | | | ��� | |
Switzerland | | | 423,274 | | | | — | | | | — | |
Taiwan | | | 179,209 | | | | — | | | | — | |
Thailand | | | — | | | | 172,814 | | | | — | |
Turkey | | | 156,468 | | | | — | | | | — | |
United Kingdom | | | 1,933,754 | | | | — | | | | — | |
United States | | | 960,041 | | | | — | | | | — | |
Preferred Stocks | | | | | | | | | | | | |
Germany | | | 308,848 | | | | — | | | | — | |
United Kingdom | | | — | | | | 2,916 | | | | — | |
Affiliated Money Market Mutual Fund | | | 138,359 | | | | — | | | | — | |
| | | | | | | | | | | | |
Total | | $ | 11,922,234 | | | $ | 175,730 | | | $ | — | |
| | | | | | | | | | | | |
See Notes to Financial Statements.
| | | | |
| Prudential Jennison International Opportunities Fund | | | 13 | |
Portfolio of Investments
as of October 31, 2012 continued
The industry classification of portfolio holdings and liabilities in excess of other assets shown as a percentage of net assets as of October 31, 2012 were as follows:
| | | | |
Textiles, Apparel & Luxury Goods | | | 10.6 | % |
Semiconductors & Semiconductor Equipment | | | 6.9 | |
Specialty Retail | | | 6.8 | |
Beverages | | | 6.5 | |
Software | | | 5.6 | |
Oil, Gas & Consumable Fuels | | | 4.7 | |
Chemicals | | | 4.4 | |
Pharmaceuticals | | | 4.4 | |
Food & Staples Retailing | | | 4.2 | |
Real Estate Management & Development | | | 4.1 | |
Energy Equipment & Services | | | 3.9 | |
Internet Software & Services | | | 3.5 | |
Hotels Restaurants & Leisure | | | 3.4 | |
Aerospace & Defense | | | 2.7 | |
Automobiles | | | 2.6 | |
IT Services | | | 2.6 | |
Commercial Banks | | | 2.5 | |
Professional Services | | | 2.4 | |
Diversified Financial Services | | | 2.0 | % |
Household Products | | | 2.0 | |
Healthcare Providers & Services | | | 1.9 | |
Commercial Services & Supplies | | | 1.8 | |
Food Products | | | 1.8 | |
Media | | | 1.7 | |
Multiline Retail | | | 1.3 | |
Computers & Peripherals | | | 1.2 | |
Internet & Catalog Retail | | | 1.2 | |
Affiliated Money Market Mutual Fund | | | 1.2 | |
Trading Companies & Distributors | | | 1.1 | |
Machinery | | | 1.0 | |
Capital Markets | | | 0.3 | |
| | | | |
| | | 100.3 | |
Liabilities in excess of other assets | | | (0.3 | ) |
| | | | |
| | | 100.0 | % |
| | | | |
See Notes to Financial Statements.
| | |
| 14 | | Visit our website at www.prudentialfunds.com |
PRUDENTIAL INVESTMENTS»MUTUAL FUNDS
FINANCIAL STATEMENTS
ANNUAL REPORT · OCTOBER 31, 2012
Prudential Jennison International Opportunities Fund
Statement of Assets and Liabilities
as of October 31, 2012
| | | | |
Assets | | | | |
Investments at value: | | | | |
Unaffiliated investments (cost $10,524,077) | | $ | 11,959,605 | |
Affiliated investments (cost $138,359) | | | 138,359 | |
Cash | | | 38,768 | |
Foreign currency, at value (cost $25,229) | | | 25,269 | |
Receivable for investments sold | | | 181,303 | |
Due from Manager | | | 15,221 | |
Dividends receivable | | | 6,746 | |
Prepaid expenses | | | 594 | |
| | | | |
Total assets | | | 12,365,865 | |
| | | | |
| |
Liabilities | | | | |
Payable for investments purchased | | | 235,358 | |
Accrued expenses | | | 62,955 | |
Affiliated transfer agent fee payable | | | 54 | |
Distribution fee payable | | | 26 | |
| | | | |
Total liabilities | | | 298,393 | |
| | | | |
| |
Net Assets | | $ | 12,067,472 | |
| | | | |
| | | | | |
Net assets were comprised of: | | | | |
Common stock, at par | | $ | 10,662 | |
Paid-in capital in excess of par | | | 10,688,364 | |
| | | | |
| | | 10,699,026 | |
Undistributed net investment income | | | 10,385 | |
Net realized loss on investment and foreign currency transactions | | | (77,433 | ) |
Net unrealized appreciation on investments and foreign currencies | | | 1,435,494 | |
| | | | |
Net assets, October 31, 2012 | | $ | 12,067,472 | |
| | | | |
See Notes to Financial Statements.
| | |
| 16 | | Visit our website at www.prudentialfunds.com |
| | | | |
Class A | | | | |
Net asset value and redemption price per share
($94,071 ÷ 8,321.2 shares of common stock issued and outstanding) | | $ | 11.30 | |
Maximum sales charge (5.50% of offering price) | | | 0.66 | |
| | | | |
Maximum offering price to public | | $ | 11.96 | |
| | | | |
| |
Class C | | | | |
Net asset value, offering price and redemption price per share
($11,423 ÷ 1,013.4 shares of common stock issued and outstanding) | | $ | 11.27 | |
| | | | |
| |
Class Z | | | | |
Net asset value, offering price and redemption price per share
($11,961,978 ÷ 1,056,892 shares of common stock issued and outstanding) | | $ | 11.32 | |
| | | | |
See Notes to Financial Statements.
| | | | |
| Prudential Jennison International Opportunities Fund | | | 17 | |
Statement of Operations
For the Period June 5, 2012* through October 31, 2012
| | | | |
Net Investment Loss | | | | |
Income | | | | |
Unaffiliated dividend income (net of foreign withholding taxes of $5,573) | | $ | 52,870 | |
Affiliated dividend income | | | 525 | |
| | | | |
Total income | | | 53,395 | |
| | | | |
| |
Expenses | | | | |
Management fee | | | 40,679 | |
Distribution fee—Class A | | | 32 | |
Distribution fee—Class C | | | 43 | |
Registration fees | | | 55,000 | |
Custodian’s fees and expenses | | | 32,000 | |
Audit fee | | | 26,000 | |
Legal fees and expenses | | | 18,000 | |
Reports to shareholders | | | 9,000 | |
Directors’ fees | | | 4,000 | |
Transfer agent’s fees and expenses (including affiliated expense of $100) (Note 3) | | | 1,000 | |
Miscellaneous | | | 7,626 | |
| | | | |
Total expenses | | | 193,380 | |
Expense reimbursement (Note 2) | | | (132,281 | ) |
| | | | |
Net expenses | | | 61,099 | |
| | | | |
Net investment loss | | | (7,704 | ) |
| | | | |
|
Realized And Unrealized Gain (Loss) On Investment And Foreign Currency Transactions | |
Net realized gain (loss) on: | | | | |
Investment transactions | | | (77,433 | ) |
Foreign currency transactions | | | 5,704 | |
| | | | |
| | | (71,729 | ) |
| | | | |
Net change in unrealized appreciation (depreciation) on: | | | | |
Investments | | | 1,435,528 | |
Foreign currencies | | | (34 | ) |
| | | | |
| | | 1,435,494 | |
| | | | |
Net gain on investment and foreign currency transactions | | | 1,363,765 | |
| | | | |
Net Increase In Net Assets Resulting From Operations | | $ | 1,356,061 | |
| | | | |
See Notes to Financial Statements.
| | |
| 18 | | Visit our website at www.prudentialfunds.com |
Statement of Changes in Net Assets
| | | | |
| | | June 5, 2012*
through
October 31, 2012 | |
Increase (Decrease) In Net Assets | | | | |
Operations | | | | |
Net investment loss | | $ | (7,704 | ) |
Net realized loss on investment and foreign currency transactions | | | (71,729 | ) |
Net change in unrealized appreciation on investments and foreign currencies | | | 1,435,494 | |
| | | | |
Net increase in net assets resulting from operations | | | 1,356,061 | |
| | | | |
| |
Series share transactions (Note 6) | | | | |
Net proceeds from shares sold | | | 10,711,411 | |
| | | | |
Net increase in net assets from Series share transactions | | | 10,711,411 | |
| | | | |
Total increase | | | 12,067,472 | |
| |
Net Assets: | | | | |
Beginning of period | | | — | |
| | | | |
End of period(a) | | $ | 12,067,472 | |
| | | | |
(a) Includes undistributed net investment income of | | | $10,385 | |
| | | | |
See Notes to Financial Statements.
| | | | |
| Prudential Jennison International Opportunities Fund | | | 19 | |
Notes to Financial Statements
Prudential World Fund, Inc. (the “Fund”) is an open-end management investment company, registered under the Investment Company Act of 1940, as amended, (“1940 Act”) and currently consists of five series: Prudential Jennison International Opportunities Fund (the “Series”), Prudential International Equity Fund, Prudential International Value Fund, Prudential Jennison Global Opportunities Fund and Prudential Emerging Markets Debt Local Currency Fund. These financial statements relate to the Prudential Jennison International Opportunities Fund. The financial statements of the other series are not presented herein. The Series commenced investment operations on June 5, 2012.
The investment objective of the Series is to achieve long-term growth of capital.
Note 1. Accounting Policies
The following is a summary of significant accounting policies followed by the Fund and the Series in the preparation of its financial statements.
Securities Valuation: The Series holds portfolio securities and other assets that are fair valued at the close of each day the New York Stock Exchange (“NYSE”) is open for trading. Fair value is the price that would be received to sell an asset or paid to transfer a liability in an orderly transaction between market participants on the measurement date. The Board of Directors (the “Board”) has delegated fair valuation responsibilities to Prudential Investments LLC (“PI” or “Manager”) through the adoption of Valuation Procedures for valuation of the Series’ securities. Under the current Valuation Procedures, a Valuation Committee is established and responsible for supervising the valuation of portfolio securities and other assets. The Valuation Procedures allow the Series to utilize independent pricing vendor services, quotations from market makers and other valuation methods in events when market quotations are not readily available or not representative of the fair values of the securities. A record of the Valuation Committee’s actions is subject to review, approval and ratification by the Board at its next regularly scheduled quarterly meeting.
Various inputs are used in determining the value of the Series’ investments, which are summarized in the three broad level hierarchies based on any observable inputs used as described in the table following the Portfolio of Investments. The valuation
| | |
| 20 | | Visit our website at www.prudentialfunds.com |
methodologies and significant inputs used in determining the fair value of securities and other assets classified as Level 1, Level 2 and Level 3 of the hierarchy are as follows:
Common stocks, exchange-traded funds and financial derivative instruments (including futures contracts and certain options and swap contracts on securities), that are traded on a national securities exchange are valued at the last sale price as of the close of trading on the applicable exchange. Securities traded via NASDAQ are valued at the NASDAQ official closing price. To the extent these securities are valued at the last sale price or NASDAQ official closing price, they are classified as Level 1 of the fair value hierarchy.
In the event there is no sale or official closing price on such day, these securities are valued at the mean between the last reported bid and asked prices, or at the last bid price in absence of an asked price. These securities are classified as Level 2 of the fair value hierarchy as these inputs are considered as significant other observable inputs to the valuation.
For common stocks traded on foreign securities exchanges, certain valuation adjustments will be applied when events occur after the close of the security’s foreign market and before the Series’ normal pricing time. These securities are valued using pricing vendor services that provide model prices derived using adjustment factors based on information such as local closing price, relevant general and sector indices, currency fluctuations, depositary receipts, and futures, as applicable. Securities valued using such model prices are classified as Level 2 of the fair value hierarchy as the adjustment factors are considered as significant other observable inputs to the valuation.
Investments in open-end, non-exchange-traded mutual funds are valued at their net asset values as of the close of the NYSE on the date of valuation. These securities are classified as Level 1 as they have the ability to be purchased or sold at their net asset values on the date of valuation.
Fixed income securities traded in the over-the-counter market, such as corporate bonds, municipal bonds, U.S. Government agencies, issued and guaranteed obligations, U.S. Treasury obligations and sovereign issues are usually valued at prices provided by approved independent pricing vendors. The pricing vendors provide these prices usually after evaluating observable inputs including yield curves, credit rating, yield spreads, default rates, cash flows as well as broker/dealer quotations and reported trades. Securities valued using such vendor prices are classified as Level 2 of the fair value hierarchy.
Asset-backed and mortgage-related securities are usually valued by approved independent pricing vendors. The pricing vendors provide the prices using their
| | | | |
| Prudential Jennison International Opportunities Fund | | | 21 | |
Notes to Financial Statements
continued
internal pricing models with input from deal terms, tranche level attributes, yield curves, prepayment speeds, default rates and broker/dealer quotes. Securities valued using such vendor prices are classified as Level 2 of the fair value hierarchy.
Short-term debt securities of sufficient credit quality, which mature in sixty days or less, are valued at amortized cost, which approximates fair market value. The amortized cost method involves valuing a security at its cost on the date of purchase and thereafter assuming a constant amortization to maturity of the difference between the principal amount due at maturity and cost. These securities are categorized as Level 2 of the fair value hierarchy.
Over-the-counter financial derivative instruments, such as option contracts, foreign currency contracts and swaps agreements, are usually valued using pricing vendor services, which derive the valuation based on underlying asset prices, indices, spreads, interest rates, exchange rates and other inputs. These instruments are categorized as Level 2 of the fair value hierarchy.
Securities and other assets that cannot be priced using the methods described above are valued with pricing methodologies approved by the Valuation Committee. In the event there are unobservable inputs used when determining such valuations, the securities will be classified as Level 3 of the fair value hierarchy.
When determining the fair value of securities, some of the factors influencing the valuation include: the nature of any restrictions on disposition of the securities; assessment of the general liquidity of the securities; the issuer’s financial condition and the markets in which it does business; the cost of the investment; the size of the holding and the capitalization of the issuer; the prices of any recent transactions or bids/offers for such securities or any comparable securities; any available analyst media or other reports or information deemed reliable by the investment adviser regarding the issuer or the markets or industry in which it operates. Using fair value to price securities may result in a value that is different from a security’s most recent closing price and from the price used by other mutual funds to calculate their net asset values.
Foreign Currency Translation: The books and records of the Series are maintained in U.S. dollars. Foreign currency amounts are translated into U.S. dollars on the following basis:
(i) market value of investment securities, other assets and liabilities-at the current rates of exchange;
| | |
| 22 | | Visit our website at www.prudentialfunds.com |
(ii) purchases and sales of investment securities, income and expenses-at the rates of exchange prevailing on the respective dates of such transactions.
Although the net assets of the Series are presented at the foreign exchange rates and market values at the close of the fiscal period, the Series does not isolate that portion of the results of operations arising as a result of changes in the foreign exchange rates from the fluctuations arising from changes in the market prices of long-term portfolio securities held at the end of the period. Similarly, the Series does not isolate the effect of changes in foreign exchange rates from the fluctuations arising from changes in the market prices of long-term portfolio securities sold during the period. Accordingly, realized foreign currency gains or losses are included in the reported net realized gains or losses on investment transactions.
Net realized gains or losses on foreign currency transactions represent net foreign exchange gains or losses from the holding of foreign currencies, currency gains or losses realized between the trade date and settlement dates on security transactions, and the difference between the amounts of dividends, interest and foreign withholding taxes recorded on the Series’ books and the U.S. dollar equivalent amounts actually received or paid. Net unrealized currency gains or losses from valuing foreign currency denominated assets and liabilities (other than investments) at period end exchange rates are reflected as a component of net unrealized appreciation (depreciation) on foreign currencies.
Foreign security and currency transactions may involve certain considerations and risks not typically associated with those of domestic origin as a result of, among other factors, the possibility of political and economic instability and the level of governmental supervision and regulation of foreign securities markets.
Forward Currency Contracts: A forward currency contract is a commitment to purchase or sell a foreign currency at a future date at a negotiated forward rate between two parties. The Series enters into forward currency contracts in order to hedge its exposure to changes in foreign currency exchange rates on its foreign portfolio holdings or specific receivables and payables denominated in a foreign currency. The contracts are valued daily at current exchange rates and any unrealized gain or loss is included in net unrealized appreciation or depreciation on foreign currencies. Gain or loss is realized on the settlement date of the contract equal to the difference between the settlement value of the original and negotiated forward contracts. This gain or loss, if any, is included in net realized gain (loss) on foreign currency transactions. Risks may arise upon entering into these contracts from the potential inability of the counterparties to meet the terms of their contracts. Forward currency contracts involve risks from currency exchange rate and credit risk in excess
| | | | |
| Prudential Jennison International Opportunities Fund | | | 23 | |
Notes to Financial Statements
continued
of the amounts reflected on the Statement of Assets and Liabilities. The Series’ maximum risk of loss from counterparty credit risk is the net value of the cash flows to be received from the counterparty at the end of the contract’s life. A master netting arrangement between the Series and the counterparty permits the Series to offset amounts payable by the Series to the same counterparty against amounts to be received; and by the receipt of collateral from the counterparty by the Series to cover the Series’ exposure to the counterparty. However, there is no assurance that such mitigating factors are easily enforceable.
Securities Transactions and Net Investment Income: Securities transactions are recorded on the trade date. Realized gains or losses from investment and currency transactions are calculated on the identified cost basis. Dividend income is recorded on the ex-dividend date. Interest income, including amortization of premium and accretion of discount on debt securities, as required, is recorded on an accrual basis. Expenses are recorded on the accrual basis, which may require the use of certain estimates by management, that may differ from actual.
Net investment income or loss (other than distribution fees which are charged directly to the respective class) and unrealized and realized gains or losses are allocated daily to each class of shares based upon the relative proportion of adjusted net assets of each class at the beginning of the day.
Dividends and Distributions: The Series expects to pay dividends of net investment income and distributions of net realized capital and currency gains, if any, annually. Dividends and distributions to shareholders, which are determined in accordance with federal income tax regulations and which may differ from generally accepted accounting principles, are recorded on the ex-dividend date.
Taxes: For federal income tax purposes, each Series in the Fund is treated as a separate taxpaying entity. It is each Series’ policy to continue to meet the requirements of the Internal Revenue Code applicable to regulated investment companies and to distribute all of its taxable net investment income and capital gains, if any, to shareholders. Therefore, no federal income tax provision is required.
Withholding taxes on foreign dividends are recorded net of reclaimable amounts, at the time the related income is earned.
Estimates: The preparation of the financial statements requires management to make estimates and assumptions that affect the reported amounts and disclosures in the financial statements. Actual results could differ from those estimates.
| | |
| 24 | | Visit our website at www.prudentialfunds.com |
Note 2. Agreements
The Fund has a management agreement for the Series with PI. Pursuant to this agreement, PI has responsibility for all investment advisory services and supervises the subadvisor’s performance of such services. PI has entered into a subadvisory agreement with Jennison Associates LLC (“Jennison”). The subadvisory agreement provides that Jennison furnishes investment advisory services in connection with the management of the Series. In connection therewith, Jennison is obligated to keep certain books and records of the Series. PI pays for the services of Jennison, the compensation of officers of the Series, occupancy and certain clerical and bookkeeping costs of the Series. The Series bears all other costs and expenses.
The management fee paid to PI is computed daily and payable monthly at an annual rate of .90% of the Series’ average daily net assets.
PI has contractually agreed through February 28, 2014 to limit net annual Series operating expenses (excluding distribution and service (12b-1) fees, extraordinary and certain other expenses such as taxes, interest and brokerage commissions) to each class of shares to 1.35% of the Series’ average daily net assets.
The Series has a distribution agreement with Prudential Investment Management Services LLC (“PIMS”), which acts as the distributor of the Class A, Class C and Class Z shares of the Series. The Series compensates PIMS for distributing and servicing the Series’ Class A and Class C shares, pursuant to plans of distribution (the “Class A and C Plans”), regardless of expenses actually incurred by PIMS. The distribution fees are accrued daily and payable monthly. No distribution or service fees are paid to PIMS as distributor of the Class Z shares of the Series.
Pursuant to the Class A and C Plans, the Series compensates PIMS for distribution related activities at an annual rate of up to .30% and 1% of the average daily net assets of the Class A and C shares, respectively. PIMS has contractually agreed to limit such fees to .25% of the average daily net assets of the Class A shares through February 28, 2014.
PIMS has advised the Series that they received $1,361 in front-end sales charges resulting from sales of Class A shares during the period ended October 31, 2012. From these fees, PIMS paid such sales charges to broker-dealers, which in turn paid commissions to salespersons and incurred other distribution costs.
PIMS has advised the Series that for the period ended October 31, 2012, there were no contingent deferred sales charges imposed.
| | | | |
| Prudential Jennison International Opportunities Fund | | | 25 | |
Notes to Financial Statements
continued
PI, PIMS and Jennison are indirect, wholly-owned subsidiaries of Prudential Financial, Inc. (“Prudential”).
Note 3. Other Transactions with Affiliates
Prudential Mutual Fund Services LLC (“PMFS”), an affiliate of PI and an indirect, wholly-owned subsidiary of Prudential, serves as the Series’ transfer agent. Transfer agent’s fees and expenses on the Statement of Operations include certain out-of-pocket expenses paid to non-affiliates, where applicable.
The Series invests in the Prudential Core Taxable Money Market Fund (the “Core Fund”), a portfolio of the Prudential Investment Portfolios 2, registered under the 1940 Act and managed by PI. Earnings from the Core Fund are disclosed on the Statement of Operations as affiliated dividend income.
Note 4. Portfolio Securities
Purchases and sales of portfolio securities, other than short-term investments, for the period ended October 31, 2012 were $13,717,803 and $3,113,990, respectively.
Note 5. Tax Information
Distributions to shareholders, which are determined in accordance with federal income tax regulations and which may differ from generally accepted accounting principles, are recorded on the ex-dividend date. In order to present undistributed net investment income, accumulated net realized loss on investment and foreign currency transactions and paid-in capital in excess of par on the Statement of Assets and Liabilities that more closely represent their tax character, certain adjustments have been made to undistributed net investment income, accumulated net realized loss on investment and foreign currency transactions and paid-in capital in excess of par. For the period ended October 31, 2012, the adjustments were to increase undistributed net investment income by $18,089, increase accumulated net realized loss on investment and foreign currency transactions by $5,704 and decrease paid-in capital in excess of par by $12,385, primarily due to the difference between certain transactions involving foreign currencies and nondeductible expenses. Net investment loss, net realized loss on investment and foreign currency transactions and net assets were not affected by this change.
| | |
| 26 | | Visit our website at www.prudentialfunds.com |
For the period ended October 31, 2012, there were no distributions paid by the Series.
As of October 31, 2012, the accumulated undistributed earnings on a tax basis was $53,875 of ordinary income.
The United States federal income tax basis of the Series’ investments and the net unrealized appreciation as of October 31, 2012 were as follows:
| | | | | | | | | | |
Tax Basis | | Appreciation | | Depreciation | | Net
Unrealized
Appreciation | | Other Cost
Basis
Adjustments | | Total Net
Unrealized
Appreciation |
| $10,706,382 | | $1,483,954 | | $(92,372) | | $1,391,582 | | $(32) | | $1,391,550 |
The difference between book basis and tax basis is primarily attributable to deferred losses on wash sales and investments in passive foreign investment companies. The other cost basis adjustments are primarily attributable to appreciation (depreciation) of foreign currencies and mark-to-market of receivables and payables.
For federal income tax purposes, the Series had a capital loss carryforward as of October 31, 2012 of approximately $77,000 which can be carried forward for an unlimited period. No capital gains distributions are expected to be paid to shareholders until net gains have been realized in excess of such losses.
Management has analyzed the Series’ tax positions and has concluded that no provision for income tax is required in the Series’ financial statements for the current reporting period.
Note 6. Capital
The Series offers Class A, Class C and Class Z shares. Class A shares are subject to a maximum front-end sales charge of 5.50%. Investors who purchase Class A shares in an amount of $1 million or more and sell these shares within 12 months of purchase are not subject to an initial sales charge but are subject to a contingent deferred sales charge (CDSC) of 1%. The Class A CDSC is waived for purchases by certain retirement or benefits plans. The CDSC for Class C shares is 1% for shares redeemed within 12 months of purchase. Class Z shares are not subject to any sales or redemption charge and are offered exclusively for sale to a limited group of investors. A special exchange privilege is also available for shareholders who qualified to purchase Class A shares at net asset value.
Under certain circumstances, an exchange may be made from specified share classes of the Series to one or more other share classes of the Series as presented in the table of transactions in shares of capital stock.
| | | | |
| Prudential Jennison International Opportunities Fund | | | 27 | |
Notes to Financial Statements
continued
At October 31, 2012, Prudential Financial, Inc. through its affiliates owned 1,000 Class A shares, 1,000 Class C shares and 1,001,000 Class Z shares of the Series.
There are 900 million shares of common stock, $.01 par value per share, divided into three classes, designated Class A, Class C and Class Z common stock, each of which consists of 300,000,000 authorized shares.
Transactions in shares of common stock were as follows:
| | | | | | | | |
Class A | | Shares | | | Amount | |
Period ended October 31, 2012*: | | | | | | | | |
Shares sold | | | 8,321.2 | | | $ | 91,261 | |
| | | | | | | | |
Net increase in shares outstanding | | | 8,321.2 | | | $ | 91,261 | |
| | | | | | | | |
Class C | | | | | | |
Period ended October 31, 2012*: | | | | | | | | |
Shares sold | | | 1,013.4 | | | $ | 10,150 | |
| | | | | | | | |
Net increase in shares outstanding | | | 1,013.4 | | | $ | 10,150 | |
| | | | | | | | |
Class Z | | | | | | |
Period ended October 31, 2012*: | | | | | | | | |
Shares sold | | | 1,056,892 | | | $ | 10,610,000 | |
| | | | | | | | |
Net increase in shares outstanding | | | 1,056,892 | | | $ | 10,610,000 | |
| | | | | | | | |
| * | Commenced operations on June 5, 2012. |
Note 7. Borrowings
The Series, along with other affiliated registered investment companies (the “Funds”), is a party to a Syndicated Credit Agreement (“SCA”) with a group of banks. The purpose of the SCA is to provide an alternative source of temporary funding for capital share redemptions. The SCA provides for a commitment of $900 million for the period December 16, 2011 through November 14, 2012. The SCA has been renewed effective November 15, 2012 at substantially similar terms through November 14, 2013. The Funds pay an annualized commitment fee of 0.08% of the unused portion of the SCA. Prior to December 16, 2011, the Funds had another SCA of a $750 million commitment with an annualized commitment fee of 0.10% of the unused portion. Interest on any borrowings under the SCA is paid at contracted market rates. The commitment fee for the unused amount is accrued daily and paid quarterly.
The Series did not utilize the SCA during the period ended October 31, 2012.
| | |
| 28 | | Visit our website at www.prudentialfunds.com |
Note 8. Dividends and Distributions to Shareholders
Subsequent to the fiscal year end, the Series declared ordinary income dividends on December 19, 2012 to shareholders of record on December 20, 2012. The ex-dividend date was December 21, 2012. The per share amounts declared were as follows:
| | | | |
| |
| Ordinary
Income |
|
Class A | | $ | 0.0474 | |
Class C | | $ | 0.0474 | |
Class Z | | $ | 0.0530 | |
Note 9. New Accounting Pronouncement
In December 2011, the Financial Accounting Standards Board (“FASB”) issued Accounting Standards Update (“ASU”) No. 2011-11 regarding “Disclosures about Offsetting Assets and Liabilities”. The amendments, which will be effective for annual reporting periods beginning on or after January 1, 2013 and interim periods within those annual periods, require an entity to disclose information about offsetting and related arrangements for assets and liabilities, financial instruments and derivatives that are either currently offset in accordance with current requirements or are subject to enforceable master netting arrangements or similar agreements. At this time, management is evaluating the implications of ASU No. 2011-11 and its impact on the financial statements has not yet been determined.
| | | | |
| Prudential Jennison International Opportunities Fund | | | 29 | |
Financial Highlights
| | | | |
| Class A Shares | |
| | | June 5,
2012(a)
through
October 31,
2012 | |
| Per Share Operating Performance: | | | | |
| Net Asset Value, Beginning Of Period | | | $10.00 | |
| Income (loss) from investment operations: | | | | |
| Net investment loss | | | (.01 | ) |
| Net realized and unrealized gain on investment and foreign currency transactions | | | 1.31 | |
| Total from investment operations | | | 1.30 | |
| Net asset value, end of period | | | $11.30 | |
| Total Return(b): | | | 13.00% | |
| |
| Ratios/Supplemental Data: | | | |
| Net assets, end of period (000) | | | $94 | |
| Average net assets (000) | | | $32 | |
| Ratios to average net assets(c): | | | | |
| Expenses, including distribution and service (12b-1) fees(d) | | | 1.60% | (e)(f) |
| Expenses, excluding distribution and service (12b-1) fees | | | 1.35% | (e)(f) |
| Net investment loss | | | (.61)% | (e)(f) |
| Portfolio turnover rate | | | 28% | (g) |
(a) Commencement of Series.
(b) Total return does not consider the effects of sales loads. Total return is calculated assuming a purchase of a share on the first day and a sale on the last day of each period reported, and includes reinvestment of dividends and distributions. Total returns may reflect adjustments to conform to generally accepted accounting principles. Total returns for periods less than a full year are not annualized.
(c) Does not include expenses of the underlying fund in which the Series invests.
(d) The distributor of the Series has contractually agreed to limit its distribution and service (12b-1) fees to .25% of the average daily net assets of the Class A shares.
(e) Net of expense waiver/reimbursement. If the investment manager had not waived/reimbursed expenses, the expense ratios including and excluding distribution and services (12b-1) fees and net investment loss ratio would be 4.37%, 4.12% and (3.38)%, respectively, for the period ended October 31, 2012.
(f) Annualized
(g) Not annualized.
See Notes to Financial Statements.
| | |
| 30 | | Visit our website at www.prudentialfunds.com |
| | | | |
| Class C Shares | |
| | | June 5,
2012(a)
through
October 31,
2012 | |
| Per Share Operating Performance: | | | | |
| Net Asset Value, Beginning Of Period | | | $10.00 | |
| Income (loss) from investment operations: | | | | |
| Net investment loss | | | (.05 | ) |
| Net realized and unrealized gain on investment and foreign currency transactions | | | 1.32 | |
| Total from investment operations | | | 1.27 | |
| Net asset value, end of period | | | $11.27 | |
| Total Return(b): | | | 12.70% | |
| |
| Ratios/Supplemental Data: | |
| Net assets, end of period (000) | | | $11 | |
| Average net assets (000) | | | $11 | |
| Ratios to average net assets(c): | | | | |
| Expenses, including distribution and service (12b-1) fees | | | 2.35% | (d)(e) |
| Expenses, excluding distribution and service (12b-1) fees | | | 1.35% | (d)(e) |
| Net investment loss | | | (1.16)% | (d)(e) |
| Portfolio turnover rate | | | 28% | (f) |
(a) Commencement of Series.
(b) Total return does not consider the effects of sales loads. Total return is calculated assuming a purchase of a share on the first day and a sale on the last day of each period reported, and includes reinvestment of dividends and distributions. Total returns may reflect adjustments to conform to generally accepted accounting principles. Total returns for periods less than a full year are not annualized.
(c) Does not include expenses of the underlying fund in which the Series invests.
(d) Net of expense waiver/reimbursement. If the investment manager had not waived/reimbursed expenses, the expense ratios including and excluding distribution and services (12b-1) fees and net investment loss ratio would be 5.29%, 4.29% and (4.10)%, respectively, for the period ended October 31, 2012.
(e) Annualized.
(f) Not annualized.
See Notes to Financial Statements.
| | | | |
| Prudential Jennison International Opportunities Fund | | | 31 | |
Financial Highlights
continued
| | | | |
| Class Z Shares | |
| | | June 5,
2012(a)
through
October 31,
2012 | |
| Per Share Operating Performance: | | | | |
| Net Asset Value, Beginning Of Period | | | $10.00 | |
| Income (loss) from investment operations: | | | | |
| Net investment loss | | | (.01) | |
| Net realized and unrealized gain on investment and foreign currency transactions | | | 1.33 | |
| Total from investment operations | | | 1.32 | |
| Net asset value, end of period | | | $11.32 | |
| Total Return(b): | | | 13.20% | |
| |
| Ratios/Supplemental Data: | |
| Net assets, end of period (000) | | | $11,962 | |
| Average net assets (000) | | | $11,061 | |
| Ratios to average net assets(c): | | | | |
| Expenses, including distribution and service (12b-1) fees | | | 1.35% | (d)(e) |
| Expenses, excluding distribution and service (12b-1) fees | | | 1.35% | (d)(e) |
| Net investment loss | | | (.17)% | (d)(e) |
| Portfolio turnover rate | | | 28% | (f) |
(a) Commencement of Series.
(b) Total return is calculated assuming a purchase of a share on the first day and a sale on the last day of each period reported, and includes reinvestment of dividends and distributions. Total returns may reflect adjustments to conform to generally accepted accounting principles. Total returns for periods less than a full year are not annualized.
(c) Does not include expenses of the underlying fund in which the Series invests.
(d) Net of expense waiver/reimbursement. If the investment manager had not waived/reimbursed expenses, the expense ratios including and excluding distribution and services (12b-1) fees and net investment loss ratio would be 4.28%, 4.28% and (3.10)%, respectively, for the period ended October 31, 2012.
(e) Annualized.
(f) Not annualized.
See Notes to Financial Statements.
| | |
| 32 | | Visit our website at www.prudentialfunds.com |
Report of Independent Registered Public
Accounting Firm
The Board of Directors and Shareholders
Prudential World Fund, Inc.:
We have audited the accompanying statement of assets and liabilities of Prudential Jennison International Opportunities Fund (one of the series constituting Prudential World Fund, Inc., hereafter referred to as the “Fund”), including the portfolio of investments, as of October 31, 2012, and the related statement of operations, changes in net assets and the financial highlights for the period June 5, 2012 (commencement of operations) to October 31, 2012. These financial statements and financial highlights are the responsibility of the Fund’s management. Our responsibility is to express an opinion on these financial statements and financial highlights based on our audits.
We conducted our audit in accordance with the standards of the Public Company Accounting Oversight Board (United States). Those standards require that we plan and perform the audit to obtain reasonable assurance about whether the financial statements and financial highlights are free of material misstatement. An audit includes examining, on a test basis, evidence supporting the amounts and disclosures in the financial statements. Our procedures included confirmation of securities owned as of October 31, 2012, by correspondence with the custodian, transfer agent and brokers or by other appropriate auditing procedures when replies from brokers were not received. An audit also includes assessing the accounting principles used and significant estimates made by management, as well as evaluating the overall financial statement presentation. We believe that our audits provide a reasonable basis for our opinion.
In our opinion, the financial statements and financial highlights referred to above present fairly, in all material respects, the financial position of the Fund as of October 31, 2012, and the results of its operations, the changes in its net assets and the financial highlights for the period June 5, 2012 to October 31, 2012, in conformity with U.S. generally accepted accounting principles.

New York, New York
December 21, 2012
| | | | |
| Prudential Jennison International Opportunities Fund | | | 33 | |
INFORMATION ABOUT BOARD MEMBERS AND OFFICERS
(Unaudited)
Information about Board Members and Officers of the Fund is set forth below. Board Members who are not deemed to be “interested persons” of the Fund, as defined in the 1940 Act, are referred to as “Independent Board Members.” Board Members who are deemed to be “interested persons” of the Fund are referred to as “Interested Board Members.” The Board Members are responsible for the overall supervision of the operations of the Fund and perform the various duties imposed on the directors of investment companies by the 1940 Act. The Board in turn elects the Officers, who are responsible for administering the day-to-day operations of the Fund.
| | | | |
| Independent Board Members(1) |
Name, Address, Age Position(s) Portfolios Overseen | | Principal Occupation(s) During Past Five Years | | Other Directorships Held |
Kevin J. Bannon (60) Board Member Portfolios Overseen: 63 | | Managing Director (since April 2008) and Chief Investment Officer (since October 2008) of Highmount Capital LLC (registered investment adviser); formerly Executive Vice President and Chief Investment Officer (April 1993-August 2007) of Bank of New York Company; President (May 2003-May 2007) of BNY Hamilton Family of Mutual Funds. | | Director of Urstadt Biddle Properties (since September 2008). |
Linda W. Bynoe (60) Board Member Portfolios Overseen: 63 | | President and Chief Executive Officer (since March 1995) and formerly Chief Operating Officer (December 1989-February 1995) of Telemat Ltd. (management consulting); formerly Vice President (January 1985-June 1989) at Morgan Stanley & Co (broker-dealer). | | Director of Simon Property Group, Inc. (retail real estate) (May 2003-May 2012); Director of Anixter International, Inc. (communication products distributor) (since January 2006); Director of Northern Trust Corporation (financial services) (since April 2006); Trustee of Equity Residential (residential real estate) (since December 2009). |
Michael S. Hyland, CFA (67) Board Member Portfolios Overseen: 63 | | Independent Consultant (since February 2005); formerly Senior Managing Director (July 2001-February 2005) of Bear Stearns & Co, Inc.; Global Partner, INVESCO (1999-2001); Managing Director and President of Salomon Brothers Asset Management (1989-1999). | | None. |
Douglas H. McCorkindale (73) Board Member Portfolios Overseen: 63 | | Formerly Chairman (February 2001-June 2006), Chief Executive Officer (June 2000-July 2005), President (September 1997-July 2005) and Vice Chairman (March 1984-May 2000) of Gannett Co. Inc. (publishing and media). | | Director of Lockheed Martin Corp. (aerospace and defense) (since May 2001). |
Prudential Jennison International Opportunities Fund
| | | | |
| Independent Board Members(1) |
Name, Address, Age Position(s) Portfolios Overseen | | Principal Occupation(s) During Past Five Years | | Other Directorships Held |
Stephen P. Munn (70) Board Member Portfolios Overseen: 63 | | Lead Director (since 2007) and formerly Chairman (1993-2007) of Carlisle Companies Incorporated (manufacturer of industrial products). | | Lead Director (since 2007) of Carlisle Companies Incorporated (manufacturer of industrial products). |
Richard A. Redeker (69) Board Member & Independent Chair Portfolios Overseen: 63 | | Retired Mutual Fund Senior Executive (44 years); Management Consultant; Independent Directors Council (organization of 2,800 Independent Mutual Fund Directors)-Executive Committee, Chair of Policy Steering Committee, Governing Council. | | None. |
Robin B. Smith (73) Board Member Portfolios Overseen: 63 | | Chairman of the Board (since January 2003) of Publishers Clearing House (direct marketing); Member of the Board of Directors of ADLPartner (marketing) (since December 2010); formerly Chairman and Chief Executive Officer (August 1996-January 2003) of Publishers Clearing House. | | Formerly Director of BellSouth Corporation (telecommunications) (1992-2006). |
Stephen G. Stoneburn (69) Board Member Portfolios Overseen: 63 | | Chairman, (since July 2011), President and Chief Executive Officer (since June 1996) of Quadrant Media Corp. (publishing company); formerly President (June 1995-June 1996) of Argus Integrated Media, Inc.; Senior Vice President and Managing Director (January 1993-1995) of Cowles Business Media; Senior Vice President of Fairchild Publications, Inc. (1975-1989). | | None. |
| | | | |
| Interested Board Members(1) |
Name, Address, Age Position(s) Portfolios Overseen | | Principal Occupation(s) During Past Five Years | | Other Directorships Held |
Stuart S. Parker (50) Board Member & President Portfolios Overseen: 63 | | President of Prudential Investments LLC (since January 2012); Executive Vice President of Jennison Associates LLC and Head of Retail Distribution of Prudential Investments LLC (June 2005 - December 2011). | | None. |
Visit our website at www.prudentialfunds.com
| | | | |
| Interested Board Members(1) |
Name, Address, Age Position(s) Portfolios Overseen | | Principal Occupation(s) During Past Five Years | | Other Directorships Held |
Scott E. Benjamin (39) Board Member & Vice President Portfolios Overseen: 63 | | Executive Vice President (since June 2009) of Prudential Investments LLC; Executive Vice President (June 2009-June 2012) and Vice President (since June 2012) of Prudential Investment Management Services LLC; Executive Vice President (since September 2009) of AST Investment Services, Inc.; Senior Vice President of Product Development and Marketing, Prudential Investments (since February 2006); Vice President of Product Development and Product Management, Prudential Investments (2003-2006). | | None. |
(1) The year that each Board Member joined the Funds’ Board is as follows:
Kevin J. Bannon, 2008; Linda W. Bynoe, 2005; Michael S. Hyland, 2008; Douglas H. McCorkindale, 2003; Stephen P. Munn, 2008; Richard A. Redeker, 2003; Robin B. Smith, 1996; Stephen G. Stoneburn, 1996; Stuart S. Parker, Board Member and President since 2012; Scott E. Benjamin, Board Member since 2010 and Vice President since 2009.
| | |
| Fund Officers(a)(1) |
Name, Address and Age Position with Fund | | Principal Occupation(s) During Past Five Years |
Judy A. Rice (64) Vice President | | Chairman of Prudential Investments LLC (since January 2012); President, Chief Executive Officer (May 2011-Present) and Executive Vice President (December 2008-May 2011) of Prudential Investment Management Services LLC; formerly President, Chief Executive Officer, Chief Operating Officer and Officer-In-Charge (February 2003-December 2011) of Prudential Investments LLC; formerly President, Chief Executive Officer and Officer-In-Charge (April 2003-December 2011) of Prudential Mutual Fund Services LLC (PMFS); formerly Member of the Board of Directors of Jennison Associates LLC (November 2010-December 2011); formerly Vice President (February 1999-April 2006) of Prudential Investment Management Services LLC; formerly President, COO, CEO and Manager of PIFM Holdco, LLC (April 2006-December 2011); formerly President, Chief Executive Officer, Chief Operating Officer and Officer-In-Charge (May 2003-June 2005) and Director (May 2003-March 2006) and Executive Vice President (June 2005-March 2006) of AST Investment Services, Inc.; Member of Board of Governors of the Investment Company Institute. |
Prudential Jennison International Opportunities Fund
| | |
| Fund Officers(a)(1) |
Name, Address and Age Position with Fund | | Principal Occupation(s) During Past Five Years |
Raymond A. O’Hara (57) Chief Legal Officer | | Vice President and Corporate Counsel (since July 2010) of Prudential Insurance Company of America (Prudential); Vice President (March 2011-Present) of Pruco Life Insurance Company and Pruco Life Insurance Company of New Jersey; Vice President and Corporate Counsel (March 2011-Present) of Prudential Annuities Life Assurance Corporation; Chief Legal Officer of Prudential Investments LLC (since June 2012); Chief Legal Officer of PMFS (since June 2012) and Corporate Counsel of AST Investment Services, Inc. (since June 2012); formerly Assistant Vice President and Corporate Counsel (September 2008-July 2010) of The Hartford Financial Services Group, Inc.; formerly Associate (September 1980-December 1987) and Partner (January 1988–August 2008) of Blazzard & Hasenauer, P.C. (formerly, Blazzard, Grodd & Hasenauer, P.C.). |
Deborah A. Docs (54) Secretary | | Vice President and Corporate Counsel (since January 2001) of Prudential; Vice President (since December 1996) and Assistant Secretary (since March 1999) of Prudential Investments LLC; formerly Vice President and Assistant Secretary (May 2003-June 2005) of AST Investment Services, Inc. |
Jonathan D. Shain (54) Assistant Secretary | | Vice President and Corporate Counsel (since August 1998) of Prudential; Vice President and Assistant Secretary (since May 2001) of Prudential Investments LLC; Vice President and Assistant Secretary (since February 2001) of PMFS; formerly Vice President and Assistant Secretary (May 2003-June 2005) of AST Investment Services, Inc. |
Claudia DiGiacomo (38) Assistant Secretary | | Vice President and Corporate Counsel (since January 2005) of Prudential; Vice President and Assistant Secretary of Prudential Investments LLC (since December 2005); Associate at Sidley Austin Brown & Wood LLP (1999-2004). |
Andrew R. French (50) Assistant Secretary | | Vice President and Corporate Counsel (since February 2010) of Prudential; formerly Director and Corporate Counsel (2006-2010) of Prudential; Vice President and Assistant Secretary (since January 2007) of Prudential Investments LLC; Vice President and Assistant Secretary (since January 2007) of PMFS. |
Amanda S. Ryan (34) Assistant Secretary | | Director and Corporate Counsel (since March 2012) of Prudential; Director and Assistant Secretary (since June 2012) of Prudential Investments LLC; Associate at Ropes & Gray (2008-2012). |
Timothy J. Knierim (53) Chief Compliance Officer | | Chief Compliance Officer of Prudential Investment Management, Inc. (since July 2007); formerly Chief Risk Officer of Prudential Investment Management, Inc. and Prudential Investments LLC (2002-2007) and formerly Chief Ethics Officer of Prudential Investment Management, Inc. and Prudential Investments LLC (2006-2007). |
Valerie M. Simpson (54) Deputy Chief Compliance Officer | | Chief Compliance Officer (since April 2007) of Prudential Investments LLC and AST Investment Services, Inc.; formerly Vice President-Financial Reporting (June 1999-March 2006) for Prudential Life and Annuities Finance. |
Visit our website at www.prudentialfunds.com
| | |
| Fund Officers(a)(1) | | |
Name, Address and Age Position with Fund | | Principal Occupation(s) During Past Five Years |
Theresa C. Thompson (50) Deputy Chief Compliance Officer | | Vice President, Compliance, Prudential Investments LLC (since April 2004); and Director, Compliance, Prudential Investments LLC (2001-2004). |
Richard W. Kinville (44) Anti-Money Laundering Compliance Officer | | Vice President, Corporate Compliance, Anti-Money Laundering Unit (since January 2005) of Prudential; committee member of the American Council of Life Insurers Anti-Money Laundering and Critical Infrastructure Committee (since January 2007); formerly Investigator and Supervisor in the Special Investigations Unit for the New York Central Mutual Fire Insurance Company (August 1994-January 1999); Investigator in AXA Financial’s Internal Audit Department and Manager in AXA’s Anti-Money Laundering Office (January 1999-January 2005); first chair of the American Council of Life Insurers Anti-Money Laundering and Critical Infrastructure Committee (June 2007-December 2009). |
Grace C. Torres (53) Treasurer and Principal Financial and Accounting Officer | | Assistant Treasurer (since March 1999) and Senior Vice President (since September 1999) of Prudential Investments LLC; Assistant Treasurer (since May 2003) and Vice President (since June 2005) of AST Investment Services, Inc.; Senior Vice President and Assistant Treasurer (since May 2003) of Prudential Annuities Advisory Services, Inc.; formerly Senior Vice President (May 2003-June 2005) of AST Investment Services, Inc. |
M. Sadiq Peshimam (48) Assistant Treasurer | | Vice President (since 2005) of Prudential Investments LLC. |
Peter Parrella (54) Assistant Treasurer | | Vice President (since 2007) and Director (2004-2007) within Prudential Mutual Fund Administration; formerly Tax Manager at SSB Citi Fund Management LLC (1997-2004). |
(a) Excludes Mr. Parker and Mr. Benjamin, interested Board Members who also serve as President and Vice President, respectively.
(1) The year that each individual became an officer of the Fund is as follows:
Judy A. Rice, 2012; Raymond A. O’Hara, 2012; Deborah A. Docs, 2005; Jonathan D. Shain, 2005; Claudia DiGiacomo, 2005; Andrew R. French, 2006; Amanda S. Ryan, 2012; Timothy J. Knierim, 2007; Valerie M. Simpson, 2007; Theresa C. Thompson, 2008; Richard W. Kinville, 2011; Grace C. Torres, 1995; Sadiq Peshimam, 2006; Peter Parrella, 2007.
Explanatory Notes to Tables:
| n | Board Members are deemed to be “Interested,” as defined in the 1940 Act, by reason of their affiliation with Prudential Investments LLC and/or an affiliate of Prudential Investments LLC. |
| n | Unless otherwise noted, the address of all Board Members and Officers is c/o Prudential Investments LLC, Gateway Center Three, 100 Mulberry Street, Newark, New Jersey 07102-4077. |
| n | There is no set term of office for Board Members or Officers. The Board Members have adopted a retirement policy, which calls for the retirement of Board Members on December 31 of the year in which they reach the age of 75. |
| n | “Other Directorships Held” includes only directorships of companies required to register or file reports with the SEC under the 1934 Act (that is, “public companies”) or other investment companies registered under the 1940 Act. |
| n | “Portfolios Overseen” includes all investment companies managed by Prudential Investments LLC. The investment companies for which PI serves as manager include the Prudential Investments Mutual Funds, The Prudential Variable Contract Accounts, Target Mutual Funds, Prudential Short Duration High Yield Fund, Inc., The Prudential Series Fund, Prudential’s Gibraltar Fund, Inc. and the Advanced Series Trust. |
Prudential Jennison International Opportunities Fund
Approval of Advisory Agreements
Initial Approval of the Fund’s Advisory Agreements
As required by the Investment Company Act of 1940, as amended (“1940 Act”), the Board of Directors (the “Board”) of Prudential World Fund, Inc. considered the proposed management agreement with Prudential Investments LLC (the “Manager”) and the proposed subadvisory agreement with Jennison Associates LLC (the “Subadviser”), with respect to the Prudential Jennison International Opportunities Fund (the “Fund”) prior to the Fund’s commencement of operations. The Board, including all of the Directors who are not “interested persons” of the Fund, as defined in the 1940 Act (the “Independent Directors”), met on March 6-8, 2012 and approved the agreements for an initial two year period, after concluding that approval of the agreements was in the best interests of the Fund.
In advance of the meetings, the Board requested and received materials relating to the agreements, and had the opportunity to ask questions and request further information in connection with its consideration.
In approving the agreements, the Board, including the Independent Directors advised by independent legal counsel, considered the factors it deemed relevant, including the nature, quality and extent of services to be provided to the Fund by the Manager and the Subadviser; any relevant comparable performance and the Subadviser’s qualifications and track record in serving other affiliated mutual funds; the fees proposed to be paid by the Fund to the Manager and by the Manager to the Subadviser under the agreements; and the potential for economies of scale that may be shared with the Fund and its shareholders. In connection with its deliberations, the Board considered information provided by the Manager and the Subadviser at or in advance of the meetings on March 6-8, 2012. The Board also considered information provided by the Manager with respect to other funds managed by the Manager and the Subadviser, which information had been provided throughout the year at regular Board meetings. In their deliberations, the Directors did not identify any single factor which alone was responsible for the Board’s decision to approve the agreements with respect to the Fund.
The Directors determined that the overall arrangements between the Fund and the Manager, which serve as the Fund’s investment manager pursuant to a management agreement, and between the Manager and the Subadviser, which serve as the Fund’s Subadviser pursuant to the terms of a subadvisory agreement, are appropriate in light of the services to be performed and the fees to be charged under the agreements and such other matters as the Directors considered relevant in the exercise of their business judgment.
The material factors and conclusions that formed the basis for the Directors’ reaching their determinations to approve the agreements are separately discussed below.
Prudential Jennison International Opportunities Fund
Approval of Advisory Agreements (continued)
Nature, Quality and Extent of Services
With respect to the Manager, the Board noted that it had received and considered information about the Manager at the June 6-8, 2011 meetings in connection with the renewal of the management agreements between the Manager and the other retail mutual funds in the Prudential fund complex (the “Prudential Retail Funds”), as well as at other regular meetings throughout the year, regarding the nature, quality and extent of services provided by the Manager. The Board considered the services to be provided by the Manager, including but not limited to the oversight of the Subadviser, as well as the provision of fund recordkeeping, compliance and other services to the Fund. With respect to the Manager’s oversight of the Subadviser, the Board noted that the Manager’s Strategic Investment Research Group, which is a business unit of the Manager, is responsible for monitoring and reporting to the Manager’s senior management on the performance and operations of the Subadviser. The Board also noted that the Manager pays the salaries of all the officers and non-independent Directors of the Fund. The Board reviewed the qualifications, backgrounds and responsibilities of the Manager’s senior management responsible for the oversight of the Fund and the Subadviser, and was also provided with information pertaining to the Manager’s organizational structure, senior management, investment operations and other relevant information. The Board further noted that it received favorable compliance reports from the Fund’s Chief Compliance Officer as to the Manager. The Board noted that it had concluded that it was satisfied with the nature, quality and extent of the services provided by the Manager to the other Prudential Retail Funds and determined that it was reasonable to conclude that the nature, quality and extent of services to be provided by the Manager under the management agreement for the Fund would be similar in nature to those provided under the other management agreements.
With respect to the Subadviser, the Board noted that it had received and considered information about the Subadviser at the June 6-8, 2011 meetings in connection with the renewal of the subadvisory agreements between the Manager and the Subadviser with respect to other Prudential Retail Funds, as well as at other regular meetings throughout the year, regarding the nature, quality and extent of services provided by the Subadviser. The Board considered, among other things, the qualifications, background and experience of the Subadviser’s portfolio managers who will be responsible for the day-to-day management of the Fund’s portfolio, as well as information on the Subadviser’s organizational structure, senior management, investment operations and other relevant information. The Board further noted that it received favorable compliance reports from the Fund’s Chief Compliance Officer as to the Subadviser. The Board noted that it was satisfied with the nature, quality and extent of services provided by the Subadviser with respect to the other Prudential Retail Funds served by the Subadviser and determined that it was reasonable to
Visit our website at www.prudentialfunds.com
conclude that the nature, quality and extent of services to be provided by the Subadviser under the subadvisory agreement for the Fund would be similar in nature to those provided under the other subadvisory agreements. The Board noted that the Subadviser is affiliated with the Manager.
Performance
Because the Fund had not yet commenced operations and the actual asset base of the Fund has not yet been determined, no investment performance for the Fund existed for Board review. Nevertheless, as noted above, the Board did consider the background and professional experience of the proposed portfolio management team for the Fund. The Manager will provide information relating to performance to the Board in connection with future annual reviews of the management agreement and subadvisory agreement.
Fee Rates
The Board considered the proposed management fees of 0.90% of the Fund’s average daily net assets to be paid by the Fund to the Manager and the proposed subadvisory fees at the annual rate of 0.45% of the Fund’s average daily net assets to be paid by the Manager to the Subadviser.
The Board considered information provided by the Manager comparing the Fund’s proposed management fee rate and total expenses for Class A shares to the Lipper 15(c) Peer Group. The Board noted that the Fund’s contractual management fee ranks in the second quartile of the Lipper Peer Group (first quartile being the lowest fee). The Board further noted that the anticipated net total expenses for Class A shares, after waivers and reimbursements, were in the third quartile of the Lipper Peer Group (first quartile being the lowest expenses), 9 basis points from the Peer Group median.
The Board noted that the Fund’s actual management fee is expected to be 0.00%, due to waivers and reimbursements required to support the net total expense limitation, given that the Fund’s initial assets will be low. The Board concluded that the proposed management fee and total expenses were reasonable in light of the services to be provided.
Profitability
Because the Fund had not yet commenced operations and the actual asset base of the Funds has not yet been determined, the Board noted that there was no historical profitability information with respect to the Fund to be reviewed. The Board noted that it would review profitability information in connection with the annual renewal of the advisory and subadvisory agreements.
Prudential Jennison International Opportunities Fund
Approval of Advisory Agreements (continued)
Economies of Scale
Because the Fund had not yet commenced operations and the actual asset base of the Funds has not yet been determined, the Board noted that there was no historical information regarding economies of scale with respect to the Fund to be reviewed. The Board noted that it would review such information in connection with the annual renewal of the advisory and subadvisory agreements.
Other Benefits to the Manager and the Subadviser
The Board considered potential “fall-out” or ancillary benefits anticipated to be received by the Manager and the Subadviser. The Board concluded that any potential benefits to be derived by the Manager were similar to benefits derived by the Manager in connection with its management of the other Prudential Retail Funds, which are reviewed on an annual basis. The Board also concluded that any potential benefits to be derived by the Subadviser were consistent with those generally derived by subadvisers to the Prudential Retail Funds, and that those benefits are reviewed on an annual basis. The Board concluded that any potential benefits derived by the Manager and the Subadviser were consistent with the types of benefits generally derived by investment managers and subadvisers to mutual funds.
* * *
After full consideration of these factors, the Board concluded that the approval of the agreements was in the interests of the Fund.
Visit our website at www.prudentialfunds.com
| | | | |
| n MAIL | | n TELEPHONE | | n WEBSITE |
Gateway Center Three 100 Mulberry Street Newark, NJ 07102 | | (800) 225-1852 | | www.prudentialfunds.com |
|
| PROXY VOTING |
| The Board of Directors of the Fund has delegated to the Fund’s investment subadviser the responsibility for voting any proxies and maintaining proxy recordkeeping with respect to the Fund. A description of these proxy voting policies and procedures is available without charge, upon request, by calling (800) 225-1852 or by visiting the Securities and Exchange Commission’s website at www.sec.gov. Information regarding how the Fund voted proxies relating to portfolio securities during the most recent 12-month period ended June 30 is available on the Fund’s website and on the Securities and Exchange Commission’s website. |
|
| DIRECTORS |
Kevin J. Bannon • Scott E. Benjamin • Linda W. Bynoe • Michael S. Hyland • Douglas H. McCorkindale • Stephen P. Munn • Stuart S. Parker • Richard A. Redeker •
Robin B. Smith • Stephen G. Stoneburn |
|
| OFFICERS |
| Stuart S. Parker, President • Judy A. Rice, Vice President • Scott E. Benjamin, Vice President • Grace C. Torres, Treasurer and Principal Financial and Accounting Officer • Raymond A. O’Hara, Chief Legal Officer • Deborah A. Docs, Secretary • Timothy J. Knierim, Chief Compliance Officer • Valerie M. Simpson, Deputy Chief Compliance Officer • Theresa C. Thompson, Deputy Chief Compliance Officer • Richard W. Kinville, Anti-Money Laundering Compliance Officer • Jonathan D. Shain, Assistant Secretary • Claudia DiGiacomo, Assistant Secretary • Amanda S. Ryan, Assistant Secretary • Andrew R. French, Assistant Secretary • M. Sadiq Peshimam, Assistant Treasurer • Peter Parrella, Assistant Treasurer |
| | | | |
| MANAGER | | Prudential Investments LLC | | Gateway Center Three
100 Mulberry Street
Newark, NJ 07102 |
|
| INVESTMENT SUBADVISER | | Jennison Associates LLC | | 466 Lexington Avenue
New York, NY 10017 |
|
| DISTRIBUTOR | | Prudential Investment
Management Services LLC | | Gateway Center Three
100 Mulberry Street
Newark, NJ 07102 |
|
| CUSTODIAN | | The Bank of New York Mellon | | One Wall Street
New York, NY 10286 |
|
| TRANSFER AGENT | | Prudential Mutual Fund
Services LLC | | PO Box 9658
Providence, RI 02940 |
|
| INDEPENDENT REGISTERED PUBLIC ACCOUNTING FIRM | | KPMG LLP | | 345 Park Avenue
New York, NY 10154 |
|
| FUND COUNSEL | | Willkie Farr & Gallagher LLP | | 787 Seventh Avenue
New York, NY 10019 |
|
| An investor should consider the investment objectives, risks, charges, and expenses of the Fund carefully before investing. The prospectus and summary prospectus contain this and other information about the Fund. An investor may obtain a prospectus and summary prospectus by visiting our website at www.prudentialfunds.com or by calling (800) 225-1852. The prospectus and summary prospectus should be read carefully before investing. |
|
| E-DELIVERY |
| To receive your mutual fund documents online, go to www.prudentialfunds.com/edelivery and enroll. Instead of receiving printed documents by mail, you will receive notification via email when new materials are available. You can cancel your enrollment or change your email address at any time by visiting the website address above. |
|
| SHAREHOLDER COMMUNICATIONS WITH DIRECTORS |
| Shareholders can communicate directly with the Board of Directors by writing to the Chair of the Board, Prudential Jennison International Opportunities Fund, Prudential Investments, Attn: Board of Directors, 100 Mulberry Street, Gateway Center Three, Newark, NJ 07102. Shareholders can communicate directly with an individual Director by writing to the same address. Communications are not screened before being delivered to the addressee. |
|
| AVAILABILITY OF PORTFOLIO SCHEDULE |
| The Fund files its complete schedule of portfolio holdings with the Securities and Exchange Commission for the first and third quarters of each fiscal year on Form N-Q. The Fund’s Forms N-Q are available on the Commission’s website at www.sec.gov. The Fund’s Forms N-Q may also be reviewed and copied at the Commission’s Public Reference Room in Washington, D.C. Information on the operation and location of the Public Reference Room may be obtained by calling (202) 551-8090. The Fund’s schedule of portfolio holdings is also available on the Fund’s website as of the end of each month. |
|
| The Fund’s Statement of Additional Information contains additional information about the Fund’s Directors and is available without charge, upon request, by calling (800) 225-1852. |
Mutual Funds:
| | | | |
| ARE NOT INSURED BY THE FDIC OR ANY FEDERAL GOVERNMENT AGENCY | | MAY LOSE VALUE | | ARE NOT A DEPOSIT OF OR GUARANTEED BY ANY BANK OR ANY BANK AFFILIATE |

PRUDENTIAL JENNISON INTERNATIONAL OPPORTUNITIES FUND
| | | | | | |
| SHARE CLASS | | A | | C | | Z |
| NASDAQ | | PWJAX | | PWJCX | | PWJZX |
| CUSIP | | 743969677 | | 743969669 | | 743969651 |
MF215E 0236609-00001-00
Item 2 – Code of Ethics — See Exhibit (a)
As of the end of the period covered by this report, the registrant has adopted a code of ethics (the “Section 406 Standards for Investment Companies – Ethical Standards for Principal Executive and Financial Officers”) that applies to the registrant’s Principal Executive Officer and Principal Financial Officer; the registrant’s Principal Financial Officer also serves as the Principal Accounting Officer.
The registrant hereby undertakes to provide any person, without charge, upon request, a copy of the code of ethics. To request a copy of the code of ethics, contact the registrant 800-225-1852, and ask for a copy of the Section 406 Standards for Investment Companies - Ethical Standards for Principal Executive and Financial Officers.
Item 3 – Audit Committee Financial Expert –
The registrant’s Board has determined that Mr. Stephen P. Munn, member of the Board’s Audit Committee is an “audit committee financial expert,” and that he is “independent,” for purposes of this Item.
Item 4 – Principal Accountant Fees and Services –
(a) Audit Fees
For the fiscal years ended October 31, 2012 and October 31, 2011, KPMG LLP (“KPMG”), the Registrant’s principal accountant, billed the Registrant $183,500 and $118,000, respectively, for professional services rendered for the audit of the Registrant’s annual financial statements or services that are normally provided in connection with statutory and regulatory filings.
(b) Audit-Related Fees
None.
(c) Tax Fees
During the fiscal year ended October 31, 2012, KPMG billed the Registrant $13,024 for professional services rendered in connection with agreed upon procedures performed related to the receipt of payments pursuant to certain fair fund settlement orders, an in-kind distribution of equity securities and an analysis in connection with federal and state tax issues related to the fiscal year end of the portfolio. Not applicable for the fiscal year ended October 31, 2011.
(d) All Other Fees
None.
(e) (1) Audit Committee Pre-Approval Policies and Procedures
THE PRUDENTIAL MUTUAL FUNDS
AUDIT COMMITTEE POLICY
on
Pre-Approval of Services Provided by the Independent Accountants
The Audit Committee of each Prudential Mutual Fund is charged with the responsibility to monitor the independence of the Fund’s independent accountants. As part of this responsibility, the Audit Committee must pre-approve any independent accounting firm’s engagement to render audit and/or permissible non-audit services, as required by law. In evaluating a proposed engagement of the independent accountants, the Audit Committee will assess the effect that the engagement might reasonably be expected to have on the accountant’s independence. The Committee’s evaluation will be based on:
| | • | | a review of the nature of the professional services expected to be provided, |
| | • | | a review of the safeguards put into place by the accounting firm to safeguard independence, and |
| | • | | periodic meetings with the accounting firm. |
Policy for Audit and Non-Audit Services Provided to the Funds
On an annual basis, the scope of audits for each Fund, audit fees and expenses, and audit-related and non-audit services (and fees proposed in respect thereof) proposed to be performed by the Fund’s independent accountants will be presented by the Treasurer and the independent accountants to the Audit Committee for review and, as appropriate, approval prior to the initiation of such services. Such presentation shall be accompanied by confirmation by both the Treasurer and the independent accountants that the proposed services will not adversely affect the independence of the independent accountants. Proposed services shall be described in sufficient detail to enable the Audit Committee to assess the appropriateness of such services and fees, and the compatibility of the provision of such services with the auditor’s independence. The Committee shall receive periodic reports on the progress of the audit and other services which are approved by the Committee or by the Committee Chair pursuant to authority delegated in this Policy.
The categories of services enumerated under “Audit Services”, “Audit-related Services”, and “Tax Services” are intended to provide guidance to the Treasurer and the independent accountants as to those categories of services which the Committee believes are generally consistent with the independence of the independent accountants and which the Committee (or the Committee Chair) would expect upon the presentation of specific proposals to pre-approve. The enumerated categories are not intended as an exclusive list of audit, audit-related or tax services, which the Committee (or the Committee Chair) would consider for pre-approval.
Audit Services
The following categories of audit services are considered to be consistent with the role of the Fund’s independent accountants:
| | • | | Annual Fund financial statement audits |
| | • | | Seed audits (related to new product filings, as required) |
| | • | | SEC and regulatory filings and consents |
Audit-related Services
The following categories of audit-related services are considered to be consistent with the role of the Fund’s independent accountants:
| | • | | Accounting consultations |
| | • | | Fund merger support services |
| | • | | Agreed Upon Procedure Reports |
| | • | | Other Internal Control Reports |
Individual audit-related services that fall within one of these categories and are not presented to the Audit Committee as part of the annual pre-approval process will be subject to pre-approval by the Committee Chair (or any other Committee member on whom this responsibility has been delegated) so long as the estimated fee for those services does not exceed $50,000.
Tax Services
The following categories of tax services are considered to be consistent with the role of the Fund’s independent accountants:
| | • | | Tax compliance services related to the filing or amendment of the following: |
| | • | | Federal, state and local income tax compliance; and, |
| | • | | Sales and use tax compliance |
| | • | | Timely RIC qualification reviews |
| | • | | Tax distribution analysis and planning |
| | • | | Tax authority examination services |
| | • | | Tax appeals support services |
| | • | | Accounting methods studies |
| | • | | Fund merger support services |
| | • | | Tax consulting services and related projects |
Individual tax services that fall within one of these categories and are not presented to the Audit Committee as part of the annual pre-approval process will be subject to pre-approval by the Committee Chair (or any other Committee member on whom this responsibility has been delegated) so long as the estimated fee for those services does not exceed $50,000.
Other Non-audit Services
Certain non-audit services that the independent accountants are legally permitted to render will be subject to pre-approval by the Committee or by one or more Committee members to whom the Committee has delegated this authority and who will report to the full Committee any pre-approval decisions made pursuant to this Policy. Non-audit services presented for pre-approval pursuant to this paragraph will be accompanied by a confirmation from both the Treasurer and the independent accountants that the proposed services will not adversely affect the independence of the independent accountants.
Proscribed Services
The Fund’s independent accountants will not render services in the following categories of non-audit services:
| | • | | Bookkeeping or other services related to the accounting records or financial statements of the Fund |
| | • | | Financial information systems design and implementation |
| | • | | Appraisal or valuation services, fairness opinions, or contribution-in-kind reports |
| | • | | Internal audit outsourcing services |
| | • | | Management functions or human resources |
| | • | | Broker or dealer, investment adviser, or investment banking services |
| | • | | Legal services and expert services unrelated to the audit |
| | • | | Any other service that the Public Company Accounting Oversight Board determines, by regulation, is impermissible. |
Pre-approval of Non-Audit Services Provided to Other Entities Within the Prudential Fund Complex
Certain non-audit services provided to Prudential Investments LLC or any of its affiliates that also provide ongoing services to the Prudential Mutual Funds will be subject to pre-approval by the Audit Committee. The only non-audit services provided to these entities that will require pre-approval are those related directly to the operations and financial reporting of the Funds. Individual projects that are not presented to the Audit Committee as part of the annual pre-approval process will be subject to pre-approval by the Committee Chair (or any other Committee member on whom this responsibility has been delegated) so long as the estimated fee for those services does not exceed $50,000. Services presented for pre-approval pursuant to this paragraph will be accompanied by a confirmation from both the Treasurer and the independent accountants that the proposed services will not adversely affect the independence of the independent accountants.
Although the Audit Committee will not pre-approve all services provided to Prudential Investments LLC and its affiliates, the Committee will receive an annual report from the Fund’s independent accounting firm showing the aggregate fees for all services provided to Prudential Investments and its affiliates.
(e) (2) Percentage of services referred to in 4(b) – 4(d) that were approved by the audit committee –
One hundred percent of the services described in Item 4(c) was approved by the audit committee.
(f) Percentage of hours expended attributable to work performed by other than full time employees of principal accountant if greater than 50%.
The percentage of hours expended on the principal accountant’s engagement to audit the registrant’s financial statements for the most recent fiscal year that were attributed to work performed by persons other than the principal accountant’s full-time, permanent employees was 0%.
(g) Non-Audit Fees
Not applicable to Registrant for the fiscal years 2012 and 2011. The aggregate non-audit fees billed by KPMG for services rendered to the registrant’s investment adviser and any entity controlling, controlled by, or under common control with the investment adviser that provides ongoing services to the registrant for the fiscal years 2012 and 2011 was $0 and $0, respectively.
(h) Principal Accountant’s Independence
Not applicable as KPMG has not provided non-audit services to the registrant’s investment adviser and any entity controlling, controlled by, or under common control with the investment adviser that provides ongoing services to the registrant that were not pre-approved pursuant to Rule 2-01(c)(7)(ii) of Regulation S-X.
Item 5 – Audit Committee of Listed Registrants – Not applicable.
Item 6 – Schedule of Investments – The schedule is included as part of the report to shareholders filed under Item 1 of this Form.
Item 7 – Disclosure of Proxy Voting Policies and Procedures for Closed-End Management Investment Companies – Not applicable.
Item 8 – Portfolio Managers of Closed-End Management Investment Companies – Not applicable.
Item 9 – Purchases of Equity Securities by Closed-End Management Investment Company and Affiliated Purchasers – Not applicable.
Item 10 – Submission of Matters to a Vote of Security Holders – Not applicable.
Item 11 – Controls and Procedures
| | (a) | It is the conclusion of the registrant’s principal executive officer and principal financial officer that the effectiveness of the registrant’s current disclosure controls and procedures (such disclosure controls and procedures having been evaluated within 90 days of the date of this filing) provide reasonable assurance that the information required to be disclosed by the registrant has been recorded, processed, summarized and reported within the time period specified in the Commission’s rules and forms and that the information required to be disclosed by the registrant has been accumulated and communicated to the registrant’s principal executive officer and principal financial officer in order to allow timely decisions regarding required disclosure. |
| | (b) | There has been no significant change in the registrant’s internal control over financial reporting that occurred during the registrant’s most recent fiscal quarter of the period covered by this report that has materially affected, or is likely to materially affect, the registrant’s internal control over financial reporting. |
Item 12 – Exhibits
| | (a) | (1) Code of Ethics – Attached hereto as Exhibit EX-99.CODE-ETH |
| | (2) | Certifications pursuant to Section 302 of the Sarbanes-Oxley Act – Attached hereto as Exhibit EX-99.CERT. |
| | (3) | Any written solicitation to purchase securities under Rule 23c-1. – Not applicable. |
| | (b) | Certifications pursuant to Section 906 of the Sarbanes-Oxley Act – Attached hereto as Exhibit EX-99.906CERT. |
SIGNATURES
Pursuant to the requirements of the Securities Exchange Act of 1934 and the Investment Company Act of 1940, the registrant has duly caused this report to be signed on its behalf by the undersigned, thereunto duly authorized.
| | |
| Registrant: | | Prudential World Fund, Inc. |
| |
| By: | | /s/ Deborah A. Docs |
| | Deborah A. Docs |
| | Secretary |
| |
| Date: | | December 20, 2012 |
Pursuant to the requirements of the Securities Exchange Act of 1934 and the Investment Company Act of 1940, this report has been signed below by the following persons on behalf of the registrant and in the capacities and on the dates indicated.
| | |
| By: | | /s/ Stuart S. Parker |
| | Stuart S. Parker |
| | President and Principal Executive Officer |
| |
| Date: | | December 20, 2012 |
| |
| By: | | /s/ Grace C. Torres |
| | Grace C. Torres |
| | Treasurer and Principal Financial Officer |
| |
| Date: | | December 20, 2012 |