UNITED STATES
SECURITIES AND EXCHANGE COMMISSION
Washington, D.C. 20549
FORM N-CSR
CERTIFIED SHAREHOLDER REPORT OF REGISTERED MANAGEMENT
INVESTMENT COMPANIES
| Investment Company Act file number: | 811-03981 | |
| Exact name of registrant as specified in charter: | Prudential World Fund, Inc. | |
| Address of principal executive offices: | Gateway Center 3, | |
| 100 Mulberry Street, | ||
| Newark, New Jersey 07102 | ||
| Name and address of agent for service: | Deborah A. Docs | |
| Gateway Center 3, | ||
| 100 Mulberry Street, | ||
| Newark, New Jersey 07102 | ||
| Registrant’s telephone number, including area code: | 973-367-7521 | |
| Date of fiscal year end: | 10/31/2006 | |
| Date of reporting period: | 10/31/2006 | |
Item 1 – Reports to Stockholders

Jennison Global Growth Fund
| October 31, 2006 | ANNUAL REPORT |

FUND TYPE
Global stock
OBJECTIVE
Long-term growth of capital
This report is not authorized for distribution to prospective investors unless preceded or accompanied by a current prospectus.
The views expressed in this report and information about the Fund’s portfolio holdings are for the period covered by this report and are subject to change thereafter.
JennisonDryden is a registered trademark of The Prudential Insurance Company of America.

December 26, 2006
Dear Shareholder:
We hope you find the annual report for the Jennison Global Growth Fund informative and useful.
You recently received materials asking you to vote on a proposal to merge the Fund into Dryden International Equity Fund. The proposal was the result of our conclusion, reached after a thorough review, that the Fund does not offer the current or potential scale to remain an effective long-term investment solution for shareholders. The proposal was approved at a shareholders meeting held earlier this month, and you now own shares of Dryden International Equity Fund, which, like Jennison Global Growth Fund, is part of the JennisonDryden family of mutual funds.
JennisonDryden combines strong teams of research analysts, a culture that leverages their findings, and security selection disciplines that focus on risk controls as well as returns. These traits characterize the JennisonDryden approach, whether a fund’s primary investment discipline is based on fundamental research, quantitative research, or credit and economic research. We have created a family of funds that you, together with the advice of a financial professional, can comfortably rely upon in investment programs suited to your personal goals and tolerance for risk.
Thank you for choosing JennisonDryden Mutual Funds.
Sincerely,

Judy A. Rice, President
Prudential World Fund, Inc.
| Jennison Global Growth Fund | 1 |
Your Fund’s Performance
Fund objective
The investment objective of the Jennison Global Growth Fund is long-term growth of capital. There can be no assurance that the Fund will achieve its investment objective.
Performance data quoted represent past performance. Past performance does not guarantee future results. The investment return and principal value of an investment will fluctuate, so that an investor’s shares, when redeemed, may be worth more or less than their original cost. Current performance may be lower or higher than the past performance data quoted. An investor may obtain performance data as of the most recent month-end by visiting our website at www.jennisondryden.com or by calling (800) 225-1852. The maximum initial sales charge is 5.50% (Class A shares).
| Cumulative Total Returns as of 10/31/06 | ||||||||
| One Year | Five Years | Ten Years | ||||||
Class A | 17.87 | % | 53.97 | % | 90.04% | |||
Class B | 17.28 | 49.87 | 78.89 | |||||
Class C | 17.01 | 48.13 | 76.72 | |||||
Class Z | 18.12 | 55.48 | 94.64 | |||||
MSCI World Index1 | 21.32 | 63.93 | 107.52 | |||||
Lipper Global Large-Cap Growth Funds Avg.2 | 18.44 | 47.60 | 86.07 |
| Average Annual Total Returns3 as of 9/30/06 | ||||||||
| One Year | Five Years | Ten Years | ||||||
Class A | 6.91 | % | 8.40 | % | 5.77% | |||
Class B | 7.55 | 8.89 | 5.72 | |||||
Class C | 11.23 | 8.83 | 5.60 | |||||
Class Z | 13.38 | 9.87 | 6.63 | |||||
MSCI World Index1 | 14.18 | 10.01 | 7.26 | |||||
Lipper Global Large-Cap Growth Funds Avg.2 | 11.89 | 7.96 | 5.87 |
The cumulative total returns do not reflect the deduction of applicable sales charges. If reflected, the applicable sales charges would reduce the cumulative total returns performance quoted. Class A shares are subject to a maximum front-end sales charge of 5.50%. Under certain circumstances, Class A shares may be subject to a contingent deferred sales charge (CDSC) of 1%. Class B and Class C shares are subject to a maximum CDSC of 5% and 1%, respectively. Class Z shares are not subject to a sales charge.
| 2 | Visit our website at www.jennisondryden.com |
Source: Prudential Investments LLC and Lipper Inc. Performance figures may reflect fee waivers and/or expense reimbursements. In the absence of such fee waivers and/or expense reimbursements, total returns would be lower.
1The Morgan Stanley Capital International (MSCI) World Index is an unmanaged, weighted index of performance that reflects the stock price movement in securities listed on the stock exchanges of Australia, Canada, Europe, the Far East, and the United States.
2The Lipper Global Large-Cap Growth Funds Average (Lipper Average) represents returns based on an average return of all funds in the Lipper Global Large-Cap Growth Funds category. Funds in the Lipper Average invest at least 75% of their equity assets in companies both inside and outside the United States with market capitalizations (on a three-year weighted basis) greater than the 500th largest company in the S&P/Citigroup World Broad Market Index (BMI). Large-cap growth funds typically have an above-average price-to-cash flow ratio, price-to-book ratio, and three-year sales-per-share growth value compared with the S&P/Citigroup World BMI.
3The average annual total returns take into account applicable sales charges. Class A, Class B, and Class C shares are subject to an annual distribution and service (12b-1) fee of up to 0.30%, 1.00%, and 1.00%, respectively. Approximately seven years after purchase, Class B shares will automatically convert to Class A shares on a quarterly basis. Class Z shares are not subject to a 12b-1 fee. The returns in the tables do not reflect the deduction of taxes that a shareholder would pay on Fund distributions or following the redemption of Fund shares.
Investors cannot invest directly in an index. The returns for the MSCI World Index and the Lipper Average would be lower if they included the effects of sales charges, operating expenses of a mutual fund, or taxes. Returns for the Lipper Average reflect the deduction of operating expenses of a mutual fund, but not sales charges or taxes.
| Five Largest Holdings expressed as a percentage of net assets as of 10/31/06 | |||
Roche Holding AG ADR, Pharmaceuticals | 2.7 | % | |
UBS AG, Capital Markets | 2.6 | ||
Total SA, Oil, Gas & Consumable Fuels | 2.5 | ||
American International Group, Inc., Insurance | 2.3 | ||
Royal Bank of Scotland Group PLC (The), Commercial Banks | 2.3 |
Holdings are subject to change.
| Five Largest Industries expressed as a percentage of net assets as of 10/31/06 | |||
Commercial Banks | 11.3 | % | |
Oil, Gas & Consumable Fuels | 6.8 | ||
Pharmaceuticals | 6.4 | ||
Food & Staples Retailing | 5.9 | ||
Capital Markets | 5.2 |
Industry weightings are subject to change.
| Jennison Global Growth Fund | 3 |
Investment Subadviser’s Report
Jennison Associates LLC
Performance overview
The Fund’s Class A shares had a strong return for the 12 months ended October 31, 2006, but nonetheless trailed the MSCI World Index (the Index) largely due to the substantially lower returns on growth stocks than on value stocks in 2006. The Fund trailed comparable funds by less than one percentage point, as measured by the Lipper Large-Cap Growth Funds Average.
Holdings in the materials, utilities, financials, and consumer discretionary sectors made the largest contributions to the Fund’s return while its technology holdings declined. Its holdings in Asia beat the Index there, but it underperformed the Index in North America and Europe. Stock selection was strongest in Japan, Austria, and Canada, and weakest in Switzerland, Bermuda, and the Netherlands.
Market environment
Among the Index’s major sectors, financials, consumer discretionary, and industrials made the largest gains, but the smaller materials, utilities, and telecommunication services sectors also made substantial advances.
In the United States, higher oil and natural gas prices in the fourth quarter of 2005 reflected the lingering economic fallout from train bombings in London and hurricanes Katrina and Rita. Although the U.S. economy rebounded strongly in the first quarter of 2006, perceptions about the prospects for growth, inflation, and interest rates continued to fluctuate between May and the end of the Fund’s reporting period in October. The economy continued to expand, but at a slower pace. After raising its target for the federal funds rate (the overnight lending rate for banks) by 0.25 percentage points each time it met for more than two years, the Federal Open Market Committee took no action at its recent meetings. The significance of this pause was the subject of debate between those pointing to signs of economic strength and inflation and those already seeing deceleration. A marked decline in oil and natural gas prices and moderation in the prices of other commodities lifted consumer confidence as the period drew to a close; allaying worries that consumer spending would wane. On the negative side, the housing and automotive sectors posted their weakest showings in many years, and U.S. economic growth in the third quarter slowed further.
In Europe, consumer confidence and other economic indicators improved despite labor and student unrest in France early in 2006. Some investors feared that high oil prices, moderate wage increases, and soft job creation would dampen spending power. Some began to worry that interest rates might need to rise further than had been anticipated in order to contain inflation. However, capital spending was fairly strong, and job creation accelerated.
| 4 | Visit our website at www.jennisondryden.com |
In Japan, consumer spending and corporate investment lifted economic growth to 3% over the 12 months ended March 2006, Japan’s fourth consecutive fiscal year of growth. In July the Bank of Japan hiked interest rates for the first time in six years, a sign of confidence in the sustainability of economic expansion. However, economic indicators since mid-August have generally fallen short of forecasts in a broad range of production and demand categories.
Performance review
The Fund’s energy stocks—including Suncor Energy, Nexen, Schlumberger, and Total (see Comments on Largest Holdings)—benefited from the rising price of crude oil through most of the reporting period, reflecting persistent global imbalances of supply and demand. Canadian exploration and production company Suncor Energy became increasingly profitable, enabling it to spend more to increase production and replenish its reserves. Nexen, also based in Canada, increased its proven and probable reserves as well as its production from existing bases. Schlumberger’s earnings consistently beat the estimates of Wall Street analysts, spurred by its largest operating margin expansion in more than 20 years.
In the financials sector, Sumitomo Realty & Development, UBS (see Comments on Largest Holdings), Banco Bilbao Vizcaya Argentaria, and Raiffeisen International Bank Holdings performed well. As Japanese economic growth resumed, real estate developer Sumitomo benefited from rising property prices. UBS, based in Switzerland, advanced on the strength of its investment banking and wealth management businesses. We believe its brand enhancements and investments in distribution networks increased its wealth managers’ assets under management. Spain’s Banco Bilbao benefited from its leading position in the fast-growing Mexican market, speculation that it would be taken over, and news that it is among the foreign institutions that may be allowed to buy a stake in one of China’s largest commercial lenders. Austria-based bank Raiffeisen reaped the rewards of its exposure to dynamic Eastern European markets.
The Fund benefited from emphasizing the strong materials sector and from good stock selection within the sector. Tight copper supply and strong demand from China and India led to pricing power for mining firm Phelps Dodge. It sharpened its focus on its core mining business by acquiring licenses for copper and gold exploration in Kosovo and selling its Colombian chemicals unit. Monsanto advanced on strong earnings and sales across its agricultural chemical and seed businesses. Nissan Chemical rose on economic growth in Japan and the rest of Asia.
Comcast and Federated Department Stores were noteworthy consumer discretionary holdings. Shares of Comcast, the largest U.S. cable television provider, had been sluggish for three years, but the firm has begun to generate significant free cash flow because it is reducing capital expenditures while earnings from its digital video and phone services are rising. Federated, the second-largest department store company in the United States, saw share prices rise because of good earnings and same-store sales
| Jennison Global Growth Fund | 5 |
Investment Subadviser’s Report (continued)
growth. We expect its profits to rise as its merger with May Stores may lead to improved merchandising, a better product mix, and lower costs.
We had disappointing performance from our technology stocks, particularly losses on Broadcom, eBay, and Qualcomm. A number of technology stocks were affected by issues concerning backdated options they had granted to employees in the past. Broadcom designs and markets semiconductor chips for telecommunications. It was hit by concerns about economic growth as well as by issues relating to its issuance of stock options. eBay suffered from signs that search engines and other vehicles are beginning to marginalize its core on-line auction business. We sold both positions. Qualcomm, the world’s No. 2 maker of mobile-phone chips, also was hurt by charges it backdated options as well as by uncertainty over royalty talks with Nokia, the world’s largest handset maker. We expect the parties will come to a mutually satisfactory agreement. Qualcomm’s intellectual property gives it what we believe to be a unique position in the mobile phone industry.
The Fund’s healthcare and industrial holdings detracted from its performance. St. Jude Medical was hurt by a disrupted market for implantable defibrillators when Guidant recalled its defibrillators in 2005 and by an intensified competitive environment. UnitedHealth was one of the first companies to be tainted by backdated options. Among industrials, Japan-based Union Tool, which makes tools used to attach devices to printed circuit boards, declined on an unexpected deceleration in orders and increased competition from lower-cost Taiwanese rivals. We sold these three positions. Shares of Mitsui, one of Japan’s largest general trading companies, declined after Russia canceled a major oil and gas project in which state-run Gazprom is seeking a stake. We think the snag is likely to be temporary, and expect Mitsui to benefit from increased crude oil and gas production and higher iron ore prices.
Looking ahead
We continue to focus on companies with strong management and unique products that we believe will lead to above-average earnings growth. We reduced our energy exposure as we believe share prices in the sector already reflect most of the short-term positive news. We believe the United States will feel the impact of energy prices more acutely than elsewhere, which may slow consumer spending. Consequently, we reduced our exposure to consumer discretionary stocks in the United States in favor of those of European firms with more compelling valuations and growth prospects. We added exposure to U.S. utilities. We continue to hold export-oriented industrial companies in Europe and companies not closely tied to the general business cycle. In Asia, we remain exposed to China through Hong Kong, but are waiting for more clarity on the course of interest rates before increasing our weightings.
The Portfolio of Investments following this report shows the size of the Fund’s positions at period-end.
| 6 | Visit our website at www.jennisondryden.com |
Comments on Largest Holdings
Holdings expressed as a percentage of the Fund’s net assets as of 10/31/06.
| 2.7% | Roche Holding AG ADR/Pharmaceuticals |
Roche Holding, the world’s largest producer of cancer drugs, has beaten earnings and income expectations, thanks to strong growth in cancer drugs and soaring margins. The company has been able to bolster sales of its cancer treatments by expanding their use to other conditions.
| 2.6% | UBS AG/Capital Markets |
UBS AG is a Switzerland-based global banking services firm that provides a broad range of financial services, including advisory services, underwriting, financing, market making, asset management, brokerage, and retail banking. Its investment banking business appears capable of delivering stable results in a variety of market conditions. UBS is also strategically adding global scale in wealth management, especially in the United States, which we believe should help raise profit margins.
| 2.5% | Total SA/Oil, Gas & Consumable Fuels |
Total, France’s largest oil company, explores for, produces, refines, and markets crude oil and finished products in more than 100 countries. The company also operates a chain of service stations, primarily in Europe and Africa. Total has benefited from strength in crude oil prices.
| 2.3% | American International Group, Inc./Insurance |
American International Group (AIG) offers insurance and related products and financial services. We find its U.S. and foreign property/casualty insurance results impressive, with good premium growth and strong profitability. We believe AIG is attractively valued and poised to continue its revenue and earnings growth, especially from its international insurance business (particularly in Asia).
| 2.3% | Royal Bank of Scotland Group PLC (The)/Commercial Banks |
Royal Bank of Scotland is one of the ten largest banks in the world. It has Citizens Financial and Charter One retail franchises in the United States and NatWest and Royal Bank of Scotland retail outlets in the United Kingdom, as well as a U.S. capital markets franchise, Greenwich Capital. We believe that its shares are attractively valued, and the company’s solid growth from ongoing businesses should allow it to improve its capital strength.
Holdings are subject to change.
| Jennison Global Growth Fund | 7 |
Fees and Expenses (Unaudited)
As a shareholder of the Fund, you incur two types of costs: (1) transaction costs, including sales charges (loads) on purchase payments and redemptions, as applicable, and (2) ongoing costs, including management fees, distribution and/or service (12b-1) fees, and other Fund expenses, as applicable. This example is intended to help you understand your ongoing costs (in dollars) of investing in the Fund and to compare these costs with the ongoing costs of investing in other mutual funds.
The example is based on an investment of $1,000 invested on May 1, 2006, at the beginning of the period, and held through the six-month period ended October 31, 2006.
The Fund’s transfer agent may charge additional fees to holders of certain accounts that are not included in the expenses shown in the table on the following page. These fees apply to Individual Retirement Accounts (IRAs) and Section 403(b) accounts. As of the close of the six-month period covered by the table, IRA fees included an annual maintenance fee of $15 per account (subject to a maximum annual maintenance fee of $25 for all accounts held by the same shareholder). Section 403(b) accounts are charged an annual $25 fiduciary maintenance fee. Some of the fees may vary in amount, or may be waived, based on your total account balance or the number of JennisonDryden or Strategic Partners Funds, including the Fund, that you own. You should consider the additional fees that were charged to your Fund account over the six-month period when you estimate the total ongoing expenses paid over the period and the impact of these fees on your ending account value, as these additional expenses are not reflected in the information provided in the expense table. Additional fees have the effect of reducing investment returns.
Actual Expenses
The first line for each share class in the table on the following page provides information about actual account values and actual expenses. You may use the information on this line, together with the amount you invested, to estimate the expenses that you paid over the period. Simply divide your account value by $1,000 (for example, an $8,600 account value ÷ $1,000 = 8.6), then multiply the result by the number on the first line under the heading “Expenses Paid During the Six-Month Period” to estimate the expenses you paid on your account during this period.
Hypothetical Example for Comparison Purposes
The second line for each share class in the table on the following page provides information about hypothetical account values and hypothetical expenses based on the Fund’s actual expense ratio and an assumed rate of return of 5% per year before expenses, which is not the Fund’s actual return. The hypothetical account values and expenses may not be used to estimate the actual ending account balance or expenses
| 8 | Visit our website at www.jennisondryden.com |
you paid for the period. You may use this information to compare the ongoing costs of investing in the Fund and other funds. To do so, compare this 5% hypothetical example with the 5% hypothetical examples that appear in the shareholder reports of the other funds.
Please note that the expenses shown in the table are meant to highlight your ongoing costs only, and do not reflect any transactional costs such as sales charges (loads). Therefore the second line for each share class in the table is useful in comparing ongoing costs only, and will not help you determine the relative total costs of owning different funds. In addition, if these transactional costs were included, your costs would have been higher.
| Jennison Global Growth Fund | Beginning Account May 1, 2006 | Ending Account October 31, 2006 | Annualized Expense Ratio Based on the Six-Month Period | Expenses Paid During the Six- Month Period* | ||||||||||
| Class A | Actual | $ | 1,000.00 | $ | 1,012.40 | 1.21 | % | $ | 6.14 | |||||
| Hypothetical | $ | 1,000.00 | $ | 1,019.11 | 1.21 | % | $ | 6.16 | ||||||
| Class B | Actual | $ | 1,000.00 | $ | 1,010.20 | 1.71 | % | $ | 8.66 | |||||
| Hypothetical | $ | 1,000.00 | $ | 1,016.59 | 1.71 | % | $ | 8.69 | ||||||
| Class C | Actual | $ | 1,000.00 | $ | 1,008.50 | 1.96 | % | $ | 9.92 | |||||
| Hypothetical | $ | 1,000.00 | $ | 1,015.32 | 1.96 | % | $ | 9.96 | ||||||
| Class Z | Actual | $ | 1,000.00 | $ | 1,013.30 | 0.96 | % | $ | 4.87 | |||||
| Hypothetical | $ | 1,000.00 | $ | 1,020.37 | 0.96 | % | $ | 4.89 | ||||||
* Fund expenses (net of fee waivers or subsidies, if any) for each share class are equal to the annualized expense ratio for each share class (provided in the table), multiplied by the average account value over the period, multiplied by the 184 days in the six-month period ended October 31, 2006, and divided by the 365 days in the Fund’s fiscal year ended October 31, 2006 (to reflect the six-month period).
| Jennison Global Growth Fund | 9 |
Portfolio of Investments
as of October 31, 2006
| Shares | Description | Value (Note 1) | |||
LONG-TERM INVESTMENTS 98.5% | |||||
COMMON STOCKS | |||||
Austria 3.1% | |||||
| 89,384 | Erste Bank der Oesterreichischen Sparkassen AG | $ | 6,086,248 | ||
| 25,700 | Raiffeisen International Bank-Holding AG | 2,986,388 | |||
| 27,900 | Raiffeisen International Bank-Holding AG 144A | 3,146,578 | |||
| 12,219,214 | |||||
Bermuda 0.9% | |||||
| 104,600 | Axis Capital Holdings Ltd. | 3,436,110 | |||
Canada 2.8% | |||||
| 106,000 | Nexen, Inc. | 5,651,920 | |||
| 74,300 | Suncor Energy, Inc. | 5,695,095 | |||
| 11,347,015 | |||||
France 6.0% | |||||
| 54,500 | Sanofi-Aventis | 4,632,615 | |||
| 59,700 | Schneider Electric SA | 6,202,320 | |||
| 149,652 | Total SA | 10,132,657 | |||
| 46,000 | Veolia Environnement | 2,816,327 | |||
| 23,783,919 | |||||
Germany 4.1% | |||||
| 82,900 | Metro AG | 4,926,324 | |||
| 75,200 | RWE AG | 7,411,448 | |||
| 45,954 | Siemens AG | 4,117,919 | |||
| 16,455,691 | |||||
Hong Kong 0.6% | |||||
| 225,900 | Cheung Kong Holdings Ltd. | 2,457,329 | |||
Japan 14.9% | |||||
| 94,700 | Credit Saison Co. Ltd. | 3,425,087 | |||
| 69,950 | Honeys Co. Ltd. | 3,265,589 | |||
| 311 | Mitsubishi UFJ Financial Group, Inc. | 3,908,939 | |||
| 469,000 | Mitsui & Co. Ltd. | 6,404,113 | |||
| 534,000 | Mitsui Trust Holdings, Inc. | 6,287,187 | |||
| 270,300 | Nishimatsuya Chain Co. Ltd. | 5,280,967 | |||
| 516,000 | Nissan Motor Co. Ltd. | 6,181,147 | |||
| 76,600 | Sumco Corp. | 5,449,207 | |||
| 168,000 | Sumitomo Realty & Development Co. Ltd. | 5,573,426 | |||
See Notes to Financial Statements.
| Jennison Global Growth Fund | 11 |
Portfolio of Investments
as of October 31, 2006 Cont’d.
| Shares | Description | Value (Note 1) | |||
| 439,000 | Suruga Bank Ltd. (The) | $ | 5,457,706 | ||
| 667,000 | Tokyo Tatemono Co. Ltd. | 7,961,455 | |||
| 59,194,823 | |||||
Spain 2.0% | |||||
| 330,784 | Banco Bilbao Vizcaya Argentaria SA | 7,987,688 | |||
Switzerland 10.8% | |||||
| 50,100 | Alcon, Inc. | 5,314,608 | |||
| 68,500 | Holcim Ltd. | 5,897,150 | |||
| 6,354 | Holcim Ltd. 144A | 547,015 | |||
| 89,695 | Novartis AG | 5,443,489 | |||
| 75,100 | Novartis AG ADR | 4,560,823 | |||
| 124,000 | Roche Holding AG ADR | 10,851,315 | |||
| 175,424 | UBS AG | 10,477,073 | |||
| 43,091,473 | |||||
United Kingdom 10.6% | |||||
| 243,600 | BHP Billiton PLC | 4,697,930 | |||
| 645,300 | Cadbury Schweppes PLC | 6,493,252 | |||
| 1,193,500 | Kingfisher PLC | 5,993,340 | |||
| 190,940 | Royal Bank of Scotland Group PLC (The) | 6,804,022 | |||
| 67,000 | Royal Bank of Scotland Group PLC (The) 144A | 2,387,210 | |||
| 996,000 | Tesco PLC | 7,476,222 | |||
| 655,100 | WPP Group PLC | 8,391,348 | |||
| 42,243,324 | |||||
United States 42.7% | |||||
| 171,200 | Adobe Systems, Inc.(a) | 6,548,400 | |||
| 104,700 | ALLTEL Corp. | 5,581,557 | |||
| 137,100 | American International Group, Inc. | 9,209,007 | |||
| 113,300 | American Standard Cos., Inc. | 5,018,057 | |||
| 90,600 | Apple Computer, Inc.(a)(b) | 7,345,848 | |||
| 158,300 | Bank of New York Co., Inc. (The) | 5,440,771 | |||
| 268,000 | ConAgra Foods, Inc. | 7,008,200 | |||
| 111,800 | E.I. du Pont de Nemours & Co. | 5,120,440 | |||
| 76,900 | Electronic Arts, Inc.(a) | 4,067,241 | |||
| 151,500 | Federated Department Stores, Inc. | 6,652,365 | |||
| 98,900 | Gilead Sciences, Inc.(a)(b) | 6,814,210 | |||
| 17,100 | Google, Inc., (Class A)(a) | 8,146,269 | |||
| 61,200 | Honeywell International, Inc. | 2,577,744 | |||
| 54,800 | IntercontinentalExchange, Inc.(a) | 4,626,216 | |||
See Notes to Financial Statements.
| 12 | Visit our website at www.jennisondryden.com |
| Shares | Description | Value (Note 1) | ||||
| 27,600 | Keryx Biopharmaceuticals, Inc.(a)(b) | $ | 387,504 | |||
| 245,600 | Kroger Co. (The) | 5,523,544 | ||||
| 63,300 | Lehman Brothers Holdings, Inc.(b) | 4,927,272 | ||||
| 219,100 | Motorola, Inc. | 5,052,446 | ||||
| 109,000 | NRG Energy, Inc.(a) | 5,248,350 | ||||
| 78,100 | NYSE Group, Inc.(a)(b) | 5,778,619 | ||||
| 83,600 | PepsiCo, Inc. | 5,303,584 | ||||
| 59,000 | Phelps Dodge Corp. | 5,922,420 | ||||
| 152,200 | QUALCOMM, Inc. | 5,538,558 | ||||
| 34,700 | Research In Motion Ltd.(a) | 4,076,556 | ||||
| 252,700 | Sprint Nextel Corp. | 4,722,963 | ||||
| 80,500 | United Technologies Corp. | 5,290,460 | ||||
| 110,300 | Valero Energy Corp. | 5,771,999 | ||||
| 110,200 | Wal-Mart Stores, Inc. | 5,430,656 | ||||
| 211,000 | Walt Disney Co. | 6,638,060 | ||||
| 151,500 | Waste Management, Inc. | 5,678,220 | ||||
| 65,100 | WellPoint, Inc.(a) | 4,968,432 | ||||
| 170,415,968 | ||||||
Total long-term investments | 392,632,554 | |||||
SHORT-TERM INVESTMENT 6.5% | ||||||
Affiliated Money Market Mutual Fund | ||||||
Dryden Core Investment Fund—Taxable Money Market Series | ||||||
| 26,096,465 | (cost $26,096,465; includes $21,402,090 of cash collateral received for securities on loan) (Note 3)(c)(d) | 26,096,465 | ||||
Total Investments 105.0% | 418,729,019 | |||||
Liabilities in excess of other assets (5.0%) | (20,121,031 | ) | ||||
Net Assets 100.0% | $ | 398,607,988 | ||||
ADR—American Depositary Receipt.
144A—Security was purchased pursuant to Rule 144A under the Securities Act of 1933 and may not be resold subject to that rule except to qualified institutional buyers. Unless otherwise noted, 144A securities are deemed to be liquid.
| (a) | Non-income producing security. |
| (b) | All or a portion of security is on loan. The aggregate market value of such securities is $20,831,393; cash collateral of $21,402,090 (included in liabilities) was received with which the Fund purchased highly liquid short-term investments. |
| (c) | Represents security, or a portion thereof, purchased with cash collateral received for securities on loan. |
| (d) | Prudential Investments LLC, the manager of the Fund, also serves as manager of the Dryden Core Investment Fund — Taxable Money Market Series. |
See Notes to Financial Statements.
| Jennison Global Growth Fund | 13 |
Portfolio of Investments
as of October 31, 2006 Cont’d.
The industry classification of portfolio holdings and liabilities in excess of other assets shown as a percentage of net assets as of October 31, 2006 was as follows:
Commercial Banks | 11.3 | % | |
Oil, Gas & Consumable Fuels | 6.8 | ||
Affiliated Money Market Mutual Fund (including 5.4% of collateral received for securities on loan) | 6.5 | ||
Pharmaceuticals | 6.4 | ||
Food & Staples Retailing | 5.9 | ||
Capital Markets | 5.2 | ||
Real Estate | 4.0 | ||
Media | 3.8 | ||
Communications Equipment | 3.7 | ||
Specialty Retail | 3.5 | ||
Food Products | 3.4 | ||
Insurance | 3.2 | ||
Metals & Mining | 2.7 | ||
Software | 2.7 | ||
Diversified Financial Services | 2.6 | ||
Multi-Utilities | 2.6 | ||
Wireless Telecommunication Services | 2.6 | ||
Aerospace & Defense | 2.0 | ||
Internet Software & Services | 2.0 | ||
Biotechnology | 1.8 | ||
Computers & Peripherals | 1.8 | ||
Multiline Retail | 1.7 | ||
Automobiles | 1.6 | ||
Construction Materials | 1.6 | ||
Electrical Equipment | 1.6 | ||
Trading Companies & Distributors | 1.6 | ||
Commercial Services & Supplies | 1.4 | ||
Semiconductors & Semiconductor Equipment | 1.4 | ||
Beverages | 1.3 | ||
Building Products | 1.3 | ||
Chemicals | 1.3 | ||
Healthcare Equipment & Supplies | 1.3 | ||
Independent Power Producers & Energy Traders | 1.3 | ||
Healthcare Providers & Services | 1.2 | ||
Industrial Conglomerates | 1.0 | ||
Consumer Finance | 0.9 | ||
| 105.0 | |||
Liabilities in excess of other assets | (5.0 | ) | |
Total | 100.0 | % | |
See Notes to Financial Statements.
| 14 | Visit our website at www.jennisondryden.com |
Financial Statements
| OCTOBER 31, 2006 | ANNUAL REPORT |
Jennison Global Growth Fund
Statement of Assets and Liabilities
as of October 31, 2006
Assets | ||||
Investments at value, including securities on loan of $20,831,393: | ||||
Unaffiliated investments (cost $299,960,131) | $ | 392,632,554 | ||
Affiliated investments (cost $26,096,465) | 26,096,465 | |||
Foreign currency, at value (cost $3,672,229) | 3,697,619 | |||
Cash | 144,527 | |||
Receivable for investments sold | 4,900,206 | |||
Dividends and interest receivable | 514,711 | |||
Receivable for Series shares sold | 217,818 | |||
Reclaims receivable | 175,982 | |||
Prepaid expenses | 9,605 | |||
Total assets | 428,389,487 | |||
Liabilities | ||||
Payable to broker for collateral for securities on loan (Note 4) | 21,402,090 | |||
Payable for investments purchased | 6,622,154 | |||
Payable for Series shares reacquired | 868,249 | |||
Accrued expenses | 304,739 | |||
Management fee payable | 253,201 | |||
Transfer agent fee payable | 198,257 | |||
Distribution fee payable | 107,808 | |||
Foreign withholding tax payable | 14,095 | |||
Deferred directors’ fees | 10,906 | |||
Total liabilities | 29,781,499 | |||
Net Assets | $ | 398,607,988 | ||
Net assets were comprised of: | ||||
Common stock, at par | $ | 215,787 | ||
Paid-in capital in excess of par | 360,967,415 | |||
| 361,183,202 | ||||
Undistributed net investment income | 443,074 | |||
Accumulated net realized loss on investments and foreign currency transactions | (55,725,438 | ) | ||
Net unrealized appreciation on investments and foreign currencies | 92,707,150 | |||
Net assets, October 31, 2006 | $ | 398,607,988 | ||
See Notes to Financial Statements.
| 16 | Visit our website at www.jennisondryden.com |
Class A | |||
Net asset value and redemption price per share | $ | 18.75 | |
Maximum sales charge (5.50% of offering price) | 1.09 | ||
Maximum offering price to public | $ | 19.84 | |
Class B | |||
Net asset value, offering price and redemption price per share | $ | 16.83 | |
Class C | |||
Net asset value, offering price and redemption price per share | $ | 16.65 | |
Class Z | |||
Net asset value, offering price and redemption price per share | $ | 19.04 | |
See Notes to Financial Statements.
| Jennison Global Growth Fund | 17 |
Statement of Operations
Year Ended October 31, 2006
Net Investment Income | |||
Income | |||
Unaffiliated dividends (net of foreign withholding taxes of $441,943) | $ | 5,842,249 | |
Affiliated dividend income | 132,433 | ||
Affiliated income from securities loaned, net | 110,990 | ||
Total income | 6,085,672 | ||
Expenses | |||
Management fee | 3,074,493 | ||
Distribution fee—Class A | 840,048 | ||
Distribution fee—Class B | 353,124 | ||
Distribution fee—Class C | 126,614 | ||
Transfer agent’s fees and expenses (including affiliated expenses of $848,000) (Note 3) | 997,000 | ||
Custodian’s fees and expenses | 96,000 | ||
Reports to shareholders | 64,000 | ||
Legal fees and expenses | 35,000 | ||
Audit fee | 25,000 | ||
Registration fees | 20,000 | ||
Directors’ fees | 18,000 | ||
Insurance | 11,000 | ||
Interest Expenses | 10,000 | ||
Miscellaneous | 38,423 | ||
Total expenses | 5,708,702 | ||
Net investment income | 376,970 | ||
Realized And Unrealized Gain On Investment And Foreign Currency Transactions | |||
Net realized gain on: | |||
Investment transactions | 55,491,257 | ||
Foreign currency transactions | 71,805 | ||
| 55,563,062 | |||
Net change in unrealized appreciation on: | |||
Investments | 10,043,960 | ||
Foreign currencies | 53,134 | ||
| 10,097,094 | |||
Net gain on investment and foreign currency transactions | 65,660,156 | ||
Net Increase In Net Assets Resulting From Operations | $ | 66,037,126 | |
See Notes to Financial Statements.
| 18 | Visit our website at www.jennisondryden.com |
Statement of Changes in Net Assets
| Year Ended October 31, | ||||||||
| 2006 | 2005 | |||||||
Increase (Decrease) In Net Assets | ||||||||
Operations | ||||||||
Net investment income | $ | 376,970 | $ | 407,398 | ||||
Net realized gain on investment and foreign currency transactions | 55,563,062 | 34,147,546 | ||||||
Net change in unrealized appreciation on investments and foreign currencies | 10,097,094 | 34,195,951 | ||||||
Net increase in net assets resulting from operations | 66,037,126 | 68,750,895 | ||||||
Dividends from net investment income (Note 1) | ||||||||
Class A | (255,524 | ) | — | |||||
Class B | — | — | ||||||
Class C | — | — | ||||||
Class Z | (46,762 | ) | — | |||||
| (302,286 | ) | — | ||||||
Series share transactions (net of share conversions) (Note 6) | ||||||||
Net proceeds from shares sold | 31,094,149 | 22,165,347 | ||||||
Net asset value of shares issued in reinvestment of dividends | 287,757 | — | ||||||
Cost of shares reacquired | (93,069,107 | ) | (113,151,200 | ) | ||||
Net decrease in net assets from Series share transactions | (61,687,201 | ) | (90,985,853 | ) | ||||
Total increase (decrease) | 4,047,639 | (22,234,958 | ) | |||||
Net Assets | ||||||||
Beginning of year | 394,560,349 | 416,795,307 | ||||||
End of year(a) | $ | 398,607,988 | $ | 394,560,349 | ||||
(a) Includes undistributed net investment income of: | $ | 443,074 | $ | 297,749 | ||||
See Notes to Financial Statements.
| Jennison Global Growth Fund | 19 |
Notes to Financial Statements
Prudential World Fund, Inc. (the “Fund”) is registered under the Investment Company Act of 1940, as an open-end, diversified management investment company and currently consists of three series: Jennison Global Growth Fund (the “Series”), Strategic Partners International Value Fund and Dryden International Equity Fund. These financial statements relate to the Jennison Global Growth Fund. The financial statements of the other series are not presented herein. The Series commenced investment operations in May 15, 1984.
The investment objective of the Series is to seek long-term capital growth, with income as a secondary objective, by investing in a diversified portfolio of securities consisting of marketable securities of U.S. and non-U.S. issuers.
Note 1. Accounting Policies
The following is a summary of significant accounting policies followed by the Fund, and the Series, in the preparation of its financial statements.
Securities Valuation: Securities listed on a securities exchange (other than options on securities and indices) are valued at the last sale price on such exchange on the day of valuation or, if there was no sale on such day, at the mean between the last reported bid and asked prices, or at the last bid price on such day in the absence of an asked price. Securities traded via Nasdaq are valued at the official closing price as provided by Nasdaq. Securities that are actively traded in the over-the-counter market, including listed securities for which the primary market is believed by Prudential Investments LLC (“PI or Manager”), in consultation with the subadviser(s); to be over-the-counter, are valued at market value using prices provided by an independent pricing agent or principal market maker. Futures contracts and options thereon traded on commodities exchange or board of trade are valued at their last sales price as of the close of trading on such exchange or board of trade on such day, or if there was no sale then at the mean between the most recently quoted bid and asked prices on such exchange or board of trade or at the last bid price in the absence of an asked price. Securities for which market quotations are not readily available, or whose values have been affected by events occurring after the close of the security’s foreign market and before the fund’s normal pricing time, are valued at fair value in accordance with the Board of Directors’ approved fair valuation procedures. When determining the fair valuation of securities some of the factors influencing the valuation include, the nature of any restrictions on disposition of the securities; assessment of the general liquidity of the securities; the issuer’s financial condition and the markets in which it does business; the cost of the investment; the size of the holding and the capitalization of
| 20 | Visit our website at www.jennisondryden.com |
issuer; the prices of any recent transactions or bids/offers for such securities or any comparable securities; any available analyst media or other reports or information deemed reliable by the investment adviser regarding the issuer or the markets or industry in which it operates. Using fair value to price securities may result in a value that is different from a security’s most recent closing price and from the price used by other mutual funds to calculate their net asset values.
Investments in mutual funds are valued at the net asset value as of the close of the New York Stock Exchange on the date of valuation.
Short-term securities, which mature in sixty days or less, are valued at amortized cost, which approximates market value. The amortized cost method involves valuing a security at its cost on the date of purchase and thereafter assuming a constant amortization to maturity of the difference between the principal amount due at maturity and cost. Short-term securities which mature in more than sixty days are valued at current market quotations.
Foreign Currency Translation: The books and records of the Series are maintained in U.S. dollars. Foreign currency amounts are translated into U.S. dollars on the following basis:
(i) market value of investment securities, other assets and liabilities-at the current rates of exchange;
(ii) purchases and sales of investment securities, income and expenses-at the rate of exchange prevailing on the respective dates of such transactions.
Although the net assets of the Series are presented at the foreign exchange rates and market values at the close of the fiscal period, the Series does not isolate that portion of the results of operations arising as a result of changes in the foreign exchange rates from the fluctuations arising from changes in the market prices of long-term securities held at the end of the fiscal period. Similarly, the Series does not isolate the effect of changes in foreign exchange rates from the fluctuations arising from changes in the market prices of long-term portfolio securities sold during the fiscal period. Accordingly, realized foreign currency gains or losses are included in the reported net realized gains or losses on investment transactions.
Net realized gains or losses on foreign currency transactions represent net foreign exchange gains or losses from holdings of foreign currencies, currency gains or losses realized between the trade and settlement dates on security transactions, and the difference between the amounts of dividends, interest and foreign taxes recorded on the Series’ books and the U.S. dollar equivalent amounts actually received or paid.
| Jennison Global Growth Fund | 21 |
Notes to Financial Statements
Cont’d
Net unrealized currency gains and losses from valuing foreign currency denominated assets and liabilities (other than investments) at period end exchange rates are reflected as a component of net unrealized appreciation or depreciation on investments and foreign currencies.
Foreign security and currency transactions may involve certain considerations and risks not typically associated with those of domestic origin as a result of, among other factors, the possibility of political and economic instability and the level of governmental supervision and regulation of foreign securities markets.
Forward Currency Contracts: A forward currency contract is a commitment to purchase or sell a foreign currency at a future date at a negotiated forward rate. The Series enters into forward currency contracts in order to hedge its exposure to changes in foreign currency exchange rates on its foreign portfolio holdings or on specific receivables and payables denominated in a foreign currency. The contracts are valued daily at current exchange rates and any unrealized gain or loss is included in net unrealized appreciation or depreciation on foreign currencies. Gain or loss is realized on the settlement date of the contract equal to the difference between the settlement value of the original and renegotiated forward contracts. This gain or loss, if any, is included in net realized gain or loss on foreign currency transactions. Risks may arise upon entering into these contracts from the potential inability of the counterparties to meet the terms of their contracts.
Forward currency contracts involve elements of both market and credit risk in excess of the amounts reflected on the Statement of Assets and Liabilities.
Securities Lending: The Series may lend its portfolio securities to qualified institutions. The loans are secured by collateral at least equal at all times, to the market value of the securities loaned. The Series may bear the risk of delay in recovery of, or even loss of rights in, the securities loaned should the borrower of the securities fail financially. The Series receives compensation, net of any rebate, for lending its securities in the form of interest or dividends on the collateral received for the securities loaned, and any gain or loss in the market price of the securities loaned that may occur during the term of the loan.
Securities Transactions and Net Investment Income: Securities transactions are recorded on the trade date. Realized gains or losses from investment and currency
| 22 | Visit our website at www.jennisondryden.com |
transactions are calculated on the identified cost basis. Dividend income is recorded on the ex-dividend date, and interest income is recorded on an accrual basis. Expenses are recorded on the accrual basis.
Net investment income or loss, (other than distribution fees, which are charged directly to the respective class) unrealized and realized gains or losses are allocated daily to each class of shares based upon the relative proportion of net assets of each class at the beginning of the day.
Dividends and Distributions: The Series expects to pay dividends of net investment income and distributions of net realized capital and currency gains, if any, annually. Dividends and distributions, which are determined in accordance with federal income tax regulations and which may differ from generally accepted accounting principles, are recorded on the ex-dividend date. Permanent book/tax differences relating to income and gains are reclassified to undistributed net investment income, accumulated net realized gain or loss and to paid-in capital in excess of par, as appropriate.
Taxes: For federal income tax purposes, each series in the Fund is treated as a separate taxpaying entity. It is the Series’ policy to continue to meet the requirements of the Internal Revenue Code applicable to regulated investment companies and to distribute all of its taxable net income and capital gains, if any, to its shareholders. Therefore, no federal income tax provision is required.
Withholding taxes on foreign dividends are recorded net of reclaimable amounts, at the time the related income is earned.
Estimates: The preparation of these financial statements requires management to make estimates and assumptions that affect the reported amounts and disclosures in the financial statements. Actual results could differ from those estimates.
Note 2. Agreements
The Fund has a management agreement for the Series with PI. Pursuant to this agreement, PI has responsibility for all investment advisory services and supervises the subadvisor’s performance of such services. PI has entered into a subadvisory agreement with Jennison Associates LLC (“Jennison”). The subadvisory agreement provides that Jennison furnishes investment advisory services in connection with the management of the Series. In connection therewith, Jennison is obligated to keep certain books and records of the Series. PI pays for the services of Jennison, the cost of compensation of officers of the Series, occupancy and certain clerical and bookkeeping costs of the Series. The Series bears all other costs and expenses. The
| Jennison Global Growth Fund | 23 |
Notes to Financial Statements
Cont’d
management fee paid to PI is computed daily and payable monthly, at an annual rate of .75 of 1% of the Series’ average daily net assets up to and including $1 billion and .70 of 1% of the average daily net assets of the Series in excess of $1 billion. The effective management fee rate was .75 of 1% for the year ended October 31, 2006.
The Fund has a distribution agreement with Prudential Investment Management Services LLC (“PIMS”), which acts as the distributor of the Class A, B, C and Z shares of the Series. The Series compensates PIMS for distributing and servicing the Series’ Class A, Class B and Class C shares, pursuant to plans of distribution, (the “Class A, B and C Plans”), regardless of expenses actually incurred by PIMS. The distribution fees are accrued daily and payable monthly. No distribution or service fees are paid to PIMS as distributor for the Class Z shares of the Series.
Pursuant to the Class A Plan, the Series compensates PIMS, for distribution-related activities at an annual rate of up to .30 of 1% of the average daily net assets of the Class A shares. PIMS has contractually agreed to limit such fees to .25% on the average daily net assets of the Class A shares. Pursuant to the Class B and C Plans, the Series compensates PIMS for distribution-related activities at the annual rate of .75 of 1% of the average daily net assets of Class B shares up to the level of average daily net assets as of February 26,1986, plus 1% of the average daily net assets in excess of such level of the Class B shares, and 1% of average daily net assets of Class C shares.
PIMS has advised the Series that it received approximately $177,900 in front-end sales charges resulting from sales of Class A shares, during the year ended October 31, 2006. From these fees, PIMS paid such sales charges to affiliated broker-dealers, which in turn paid commissions to salespersons and incurred other distribution costs.
PIMS has advised the Series that it received approximately $58,600 and $600 in contingent deferred sales charges imposed upon certain redemptions by Class B and C shareholders, respectively, during the year ended October 31, 2006.
PI, PIMS, and Jennison are indirect, wholly-owned subsidiaries of Prudential Financial, Inc. (“Prudential”).
The Fund, along with other affiliated registered investment companies (the “Funds”), is a party to a Syndicated Credit Agreement (“SCA”) with two banks. The SCA
| 24 | Visit our website at www.jennisondryden.com |
provides for a commitment of $500 million. Interest on any borrowings under the SCA is incurred at contracted market rates and a commitment fee for the unused amount is accrued daily and paid quarterly. Effective October 27, 2006, the Funds renewed SCA with the banks. The commitment under the renewed SCA continues to be $500 million. The Funds pay a commitment fee of .07 of 1% of the unused portion of the renewed SCA. The expiration date of the renewed SCA will be October 26, 2007. For the period from October 29, 2005 through October 26, 2006, the Funds paid a commitment fee of .0725 of 1% of the unused portion of the agreement. The purpose of the SCA is to provide an alternative source of temporary funding for capital share redemptions.
Note 3. Other Transactions With Affiliates
Prudential Mutual Fund Services LLC (“PMFS”), an affiliate of PI and an indirect, wholly-owned subsidiary of Prudential, serves as the Fund’s transfer agent. Transfer agent fees and expenses in the Statement of Operations include certain out-of-pocket expenses paid to non-affiliates, where applicable.
The Series pays networking fees to affiliated and unaffiliated broker/dealers. These networking fees are payments made to broker/dealers that clear mutual fund transactions through a national clearing system. For the year ended October 31, 2006, the Series incurred approximately $174,800 in total networking fees. These amounts are included in transfer agent’s fees and expenses in the Statement of Operations.
The Series invests in the Taxable Money Market Series (the “Portfolio”), a portfolio of Dryden Core Investment Fund, pursuant to an exemptive order received from the Securities and Exchange Commission. The Portfolio is a money market mutual fund registered under the Investment Company Act of 1940, as amended, and managed by PI.
Note 4. Portfolio Securities
Purchases and sales of investment securities, other than short-term investments, for
the year ended October 31, 2006 aggregated $242,721,178 and $307,141,728, respectively.
As of October 31, 2006, the Series had securities on loan with an aggregate market value of $20,831,393. The Series received $21,402,090 in cash as collateral for securities on loan which was used to purchase highly liquid short-term investments in accordance with Fund’s securities lending procedures.
| Jennison Global Growth Fund | 25 |
Notes to Financial Statements
Cont’d
Note 5. Distributions and Tax Information
Distributions to shareholders, which are determined in accordance with federal income tax regulations, which may differ from U.S. generally accepted accounting principles, are recorded on the ex-dividend date. In order to present undistributed net investment income, accumulated net realized losses on investments and foreign currency transactions and paid-in capital in excess of par on the Statement of Assets and Liabilities that more closely represent their tax character, certain adjustments have been made to paid-in-capital in excess of par, undistributed net investment income and accumulated net realized loss on investments and foreign currency transactions. For the year ended October 31, 2006, the adjustments were to increase undistributed net investment income by $70,641, to decrease accumulated net realized loss on investments and foreign currency transactions by $1,643,326 and to decrease paid-in capital in excess of par by $1,713,967. These differences are due to the treatment for book and tax purposes of certain transactions involving foreign currencies, reclassification for redemption utilized as distributions for federal income tax purposes and write-off of capital loss carryforward pursuant to Internal Revenue Code Section 382. Net investment income, net realized gains and net assets were not affected by this change.
For the fiscal year ended October 31, 2006, the tax character of dividends paid of $302,286 was ordinary income. There were no dividends paid for the fiscal year ended October 31, 2005.
As of October 31, 2006, the Series had accumulated undistributed ordinary income of $452,643.
The United States federal income tax basis of the Series’ investments and the net unrealized appreciation as of October 31, 2006 were as follows:
Tax Basis | Appreciation | Depreciation | Net Unrealized Appreciation | Other Cost | Total Net | |||||
$326,258,085 | $96,137,187 | $3,666,253 | $92,470,934 | $34,727 | $92,505,661 |
The difference between book basis and tax basis is primarily attributable to deferred losses on wash sales. The adjusted net unrealized appreciation includes adjustments primarily attributable to appreciation of foreign currency to the mark-to-market of receivables and payables.
| 26 | Visit our website at www.jennisondryden.com |
For federal income tax purposes, the Series had a capital loss carryforward as of October 31, 2006, of approximately $55,524,000 of which $3,430,300 expires in 2008, $2,610,000 expires in 2009, $40,703,200 expires in 2010 and $8,780,500 expires in 2011. Approximately $57,180,000 of capital loss carryforward was used as of October 31, 2006, of which approximately $55,464,900 was used to offset net taxable realized capital gains and approximately $1,715,100 was written-off pursuant to Internal Revenue Code Section 382.
Note 6. Capital
The Fund offers Class A, Class B, Class C and Class Z shares. Class A shares are sold with a front-end sales charge of up to 5.50%. All investors who purchase Class A shares in an amount of $1 million or more and sell these shares within 12 months of purchase are subject to a contingent deferred sales charge (CDSC) of 1%, including investors who purchase their shares through broker-dealers affiliated with Prudential Financial, Inc. Class B shares are sold with a contingent deferred sales charge which declines from 5% to zero depending on the period of time the shares are held. Class C shares purchased are not subject to a front-end sales charge and a contingent deferred sales charge (CDSC) of 1% for Class C shares will be effective during the 12 months from the date of purchase. Class B shares automatically convert to Class A shares on a quarterly basis approximately seven years after purchase. A special exchange privilege is also available for shareholders who qualified to purchase Class A shares at net asset value. Class Z shares are not subject to any sales or redemption charge and are offered exclusively for sale to a limited group of investors.
There are 500 million authorized shares of $.01 par value common stock, divided equally into four classes, designated Class A, Class B, Class C and Class Z common stock.
Transactions in shares of common stock were as follows:
Class A | Shares | Amount | |||||
Year ended October 31, 2006: | |||||||
Shares sold | 1,233,815 | $ | 21,852,981 | ||||
Shares issued in reinvestment of dividends | 14,330 | 241,033 | |||||
Shares reacquired | (3,838,195 | ) | (67,502,486 | ) | |||
Net increase (decrease) in shares outstanding before conversion | (2,590,050 | ) | (45,408,472 | ) | |||
Shares issued upon conversion from Class B | 730,490 | 12,634,186 | |||||
Net increase (decrease) in shares outstanding | (1,859,560 | ) | $ | (32,774,286 | ) | ||
Year ended October 31, 2005: | |||||||
Shares sold | 971,166 | $ | 14,347,084 | ||||
Shares reacquired | (5,506,808 | ) | (81,005,787 | ) | |||
Net increase (decrease) in shares outstanding before conversion | (4,535,642 | ) | (66,658,703 | ) | |||
Shares issued upon conversion from Class B | 1,003,902 | 14,925,795 | |||||
Net increase (decrease) in shares outstanding | (3,531,740 | ) | $ | (51,732,908 | ) | ||
| Jennison Global Growth Fund | 27 |
Notes to Financial Statements
Cont’d
Class B | Shares | Amount | |||||
Year ended October 31, 2006: | |||||||
Shares sold | 259,010 | $ | 4,112,020 | ||||
Shares reacquired | (591,777 | ) | (9,361,683 | ) | |||
Net increase (decrease) in shares outstanding before conversion | (332,767 | ) | (5,249,663 | ) | |||
Shares reacquired upon conversion into Class A | (812,045 | ) | (12,634,186 | ) | |||
Net increase (decrease) in shares outstanding | (1,144,812 | ) | $ | (17,883,849 | ) | ||
Year ended October 31, 2005: | |||||||
Shares sold | 281,884 | $ | 3,725,224 | ||||
Shares reacquired | (1,007,913 | ) | (13,378,818 | ) | |||
Net increase (decrease) in shares outstanding before conversion | (726,029 | ) | (9,653,594 | ) | |||
Shares reacquired upon conversion into Class A | (1,110,978 | ) | (14,925,795 | ) | |||
Net increase (decrease) in shares outstanding | (1,837,007 | ) | $ | (24,579,389 | ) | ||
Class C | |||||||
Year ended October 31, 2006: | |||||||
Shares sold | 174,419 | $ | 2,753,327 | ||||
Shares reacquired | (302,324 | ) | (4,745,500 | ) | |||
Net increase (decrease) in shares outstanding | (127,905 | ) | $ | (1,992,173 | ) | ||
Year ended October 31, 2005: | |||||||
Shares sold | 134,169 | $ | 1,757,997 | ||||
Shares reacquired | (618,785 | ) | (8,169,114 | ) | |||
Net increase (decrease) in shares outstanding | (484,616 | ) | $ | (6,411,117 | ) | ||
Class Z | |||||||
Year ended October 31, 2006: | |||||||
Shares sold | 133,589 | $ | 2,375,821 | ||||
Shares issued in reinvestment of dividends | 2,742 | 46,724 | |||||
Shares reacquired | (633,193 | ) | (11,459,438 | ) | |||
Net increase (decrease) in shares outstanding | (496,862 | ) | $ | (9,036,893 | ) | ||
Year ended October 31, 2005: | |||||||
Shares sold | 157,315 | $ | 2,335,042 | ||||
Shares reacquired | (717,990 | ) | (10,597,481 | ) | |||
Net increase (decrease) in shares outstanding | (560,675 | ) | $ | (8,262,439 | ) | ||
| 28 | Visit our website at www.jennisondryden.com |
Note 7. New Accounting Pronouncements
On July 13, 2006, the Financial Accounting Standards Board (FASB) released FASB Interpretation No. 48 “Accounting for Uncertainty in Income Taxes” (FIN 48). FIN 48 provides guidance for how uncertain tax positions should be recognized, measured, presented and disclosed in the financial statements. FIN 48 requires the evaluation of tax positions taken or expected to be taken in the course of preparing the Fund’s tax returns to determine whether the tax positions are “more-likely-than-not” of being sustained by the applicable tax authority. Tax benefits or expenses resulting from tax positions not deemed to meet the more-likely-than-not threshold would be recorded in the year in which they arise. Adoption of FIN 48 is required for fiscal years beginning after December 15, 2006 and interim periods within those fiscal years and is to be applied to all open tax years as of the effective date. At this time, management is evaluating the implications of FIN 48 and its impact, if any, in the financial statements has not yet been determined.
On September 20, 2006, the FASB released Statement of Financial Accounting Standards No. 157 “Fair Value Measurements” (FAS 157). FAS 157 establishes an authoritative definition of fair value, sets out a framework for measuring fair value, and requires additional disclosures about fair-value measurements. The application of FAS 157 is required for fiscal years beginning after November 15, 2007 and interim periods within those fiscal years. At this time, management is evaluating the implications of FAS 157 and its impact, if any, in the financial statements has not yet been determined.
Note 8. Reorganization
At the meeting held on June 8, 2006, the Board of Directors of the Series approved an Agreement and Plan of Reorganization (the “Plan”) which provided for the transfer of all assets of each class of shares of Jennison Global Growth Fund into the like shares of Dryden International Equity Fund, another series of Prudential World Fund, Inc., and the assumption of the liabilities of the Series.
Shareholders approved the Plan on December 11, 2006 and the reorganization was completed on December 15, 2006.
| Jennison Global Growth Fund | 29 |
Financial Highlights
Cont’d
| Class A | ||||
| Year Ended October 31, 2006 | ||||
Per Share Operating Performance(a): | ||||
Net Asset Value, Beginning Of Year | $ | 15.92 | ||
Income (loss) from investment operations: | ||||
Net investment income (loss) | .03 | |||
Net realized and unrealized gain (loss) on investment and foreign currency transactions | 2.81 | |||
Total from investment operations | 2.84 | |||
Less Dividends and Distributions: | ||||
Dividends from net investment income | (.01 | ) | ||
Distributions from net realized gains | — | |||
Total dividends and distributions | (.01 | ) | ||
Net asset value, end of year | $ | 18.75 | ||
Total Return(b): | 17.87 | % | ||
Ratios/Supplemental Data: | ||||
Net assets, end of year (000) | $ | 338,546 | ||
Average net assets (000) | $ | 336,019 | ||
Ratios to average net assets: | ||||
Expenses, including distribution and service (12b-1) fees(c) | 1.32 | % | ||
Expenses, excluding distribution and service (12b-1) fees | 1.07 | % | ||
Net investment income (loss) | .16 | % | ||
For Class A, B, C and Z shares: | ||||
Portfolio turnover rate | 60 | % | ||
| (a) | Calculated based upon average shares outstanding during the year. |
| (b) | Total return does not consider the effects of sales loads. Total return is calculated assuming a purchase of shares on the first day and a sale on the last day of each year reported, and includes reinvestment of dividends and distributions. |
| (c) | The distributor of the Series has contractually agreed to limit its distribution and service (12b-1) fees to .25 of 1% of the average daily net assets of the Class A shares. |
See Notes to Financial Statements.
| 30 | Visit our website at www.jennisondryden.com |
| Class A | ||||||||||||||
| Year Ended October 31, | ||||||||||||||
| 2005 | 2004 | 2003 | 2002 | |||||||||||
| $ | 13.45 | $ | 12.72 | $ | 10.21 | $ | 12.23 | |||||||
| .03 | (.01 | ) | .02 | (.01 | ) | |||||||||
| 2.44 | .78 | 2.49 | (2.01 | ) | ||||||||||
| �� | ||||||||||||||
| 2.47 | .77 | 2.51 | (2.02 | ) | ||||||||||
| — | (.04 | ) | — | — | ||||||||||
| — | — | — | — | |||||||||||
| — | (.04 | ) | — | — | ||||||||||
| $ | 15.92 | $ | 13.45 | $ | 12.72 | $ | 10.21 | |||||||
| 18.36 | % | 6.11 | % | 24.58 | % | (16.52 | )% | |||||||
| $ | 317,065 | $ | 315,214 | $ | 256,106 | $ | 223,191 | |||||||
| $ | 316,224 | $ | 327,615 | $ | 230,103 | $ | 284,046 | |||||||
| 1.47 | % | 1.39 | % | 1.59 | % | 1.46 | % | |||||||
| 1.22 | % | 1.14 | % | 1.34 | % | 1.21 | % | |||||||
| .18 | % | (.06 | )% | .15 | % | (.18 | )% | |||||||
| 57 | % | 125 | % | 79 | % | 67 | % | |||||||
See Notes to Financial Statements.
| Jennison Global Growth Fund | 31 |
Financial Highlights
Cont’d
| Class B | ||||
| Year Ended October 31, 2006 | ||||
Per Share Operating Performance(a): | ||||
Net Asset Value, Beginning Of Year | $ | 14.35 | ||
Income (loss) from investment operations: | ||||
Net investment loss | (.05 | ) | ||
Net realized and unrealized gain (loss) on investment and foreign currency transactions | 2.53 | |||
Total from investment operations | 2.48 | |||
Less Dividends and Distributions: | ||||
Dividends from net investment income | — | |||
Distributions from net realized gains | — | |||
Total dividends and distributions | — | |||
Net asset value, end of year | $ | 16.83 | ||
Total Return(b): | 17.28 | % | ||
Ratios/Supplemental Data: | ||||
Net assets, end of year (000) | $ | 40,473 | ||
Average net assets (000) | $ | 47,083 | ||
Ratios to average net assets: | ||||
Expenses, including distribution and service (12b-1) fees | 1.82 | % | ||
Expenses, excluding distribution and service (12b-1) fees | 1.07 | % | ||
Net investment loss | (.33 | )% | ||
| (a) | Calculated based upon average shares outstanding during the year. |
| (b) | Total return does not consider the effects of sales loads. Total return is calculated assuming a purchase of shares on the first day and a sale on the last day of each year reported, and includes reinvestment of dividends and distributions. |
See Notes to Financial Statements.
| 32 | Visit our website at www.jennisondryden.com |
| Class B | ||||||||||||||
| Year Ended October 31, | ||||||||||||||
| 2005 | 2004 | 2003 | 2002 | |||||||||||
| $ | 12.18 | $ | 11.54 | $ | 9.31 | $ | 11.23 | |||||||
| (.04 | ) | (.07 | ) | (.04 | ) | (.08 | ) | |||||||
| 2.21 | .71 | 2.27 | (1.84 | ) | ||||||||||
| 2.17 | .64 | 2.23 | (1.92 | ) | ||||||||||
| — | — | — | — | |||||||||||
| — | — | — | — | |||||||||||
| — | — | — | — | |||||||||||
| $ | 14.35 | $ | 12.18 | $ | 11.54 | $ | 9.31 | |||||||
| 17.82 | % | 5.55 | % | 23.95 | % | (17.10 | )% | |||||||
| $ | 50,937 | $ | 65,603 | $ | 53,834 | $ | 70,804 | |||||||
| $ | 59,418 | $ | 75,607 | $ | 58,843 | $ | 109,004 | |||||||
| 1.97 | % | 1.89 | % | 2.09 | % | 2.00 | % | |||||||
| 1.22 | % | 1.14 | % | 1.34 | % | 1.21 | % | |||||||
| (.28 | )% | (.55 | )% | (.37 | )% | (.73 | )% | |||||||
See Notes to Financial Statements.
| Jennison Global Growth Fund | 33 |
Financial Highlights
(Unaudited) Cont’d
| Class C | ||||
| Year Ended October 31, 2006 | ||||
Per Share Operating Performance(a): | ||||
Net Asset Value, Beginning Of Year | $ | 14.23 | ||
Income (loss) from investment operations: | ||||
Net investment loss | (.09 | ) | ||
Net realized and unrealized gain (loss) on investment and foreign currency transactions | 2.51 | |||
Total from investment operations | 2.42 | |||
Less Dividends and Distributions: | ||||
Dividends from net investment income | — | |||
Distributions from net realized gains | — | |||
Total dividends and distributions | — | |||
Net asset value, end of year | $ | 16.65 | ||
Total Return(b): | 17.01 | % | ||
Ratios/Supplemental Data: | ||||
Net assets, end of year (000) | $ | 12,273 | ||
Average net assets (000) | $ | 12,661 | ||
Ratios to average net assets: | ||||
Expenses, including distribution and service (12b-1) fees | 2.07 | % | ||
Expenses, excluding distribution and service (12b-1) fees | 1.07 | % | ||
Net investment loss | (.58 | )% | ||
| (a) | Calculated based upon average shares outstanding during the year. |
| (b) | Total return does not consider the effects of sales loads. Total return is calculated assuming a purchase of shares on the first day and a sale on the last day of each year reported, and includes reinvestment of dividends and distributions. |
See Notes to Financial Statements.
| 34 | Visit our website at www.jennisondryden.com |
| Class C | ||||||||||||||
| Year Ended October 31, | ||||||||||||||
| 2005 | 2004 | 2003 | 2002 | |||||||||||
| $ | 12.11 | $ | 11.50 | $ | 9.30 | $ | 11.24 | |||||||
| (.07 | ) | (.10 | ) | (.06 | ) | (.10 | ) | |||||||
| 2.19 | .71 | 2.26 | (1.84 | ) | ||||||||||
| 2.12 | .61 | 2.20 | (1.94 | ) | ||||||||||
| — | — | — | — | |||||||||||
| — | — | — | — | |||||||||||
| — | — | — | — | |||||||||||
| $ | 14.23 | $ | 12.11 | $ | 11.50 | $ | 9.30 | |||||||
| 17.51 | % | 5.30 | % | 23.66 | % | (17.26 | )% | |||||||
| $ | 12,313 | $ | 16,343 | $ | 13,053 | $ | 12,490 | |||||||
| $ | 14,130 | $ | 17,682 | $ | 12,091 | $ | 14,897 | |||||||
| 2.22 | % | 2.14 | % | 2.34 | % | 2.21 | % | |||||||
| 1.22 | % | 1.14 | % | 1.34 | % | 1.21 | % | |||||||
| (.54 | )% | (.81 | )% | (.60 | )% | (.92 | )% | |||||||
See Notes to Financial Statements.
| Jennison Global Growth Fund | 35 |
Financial Highlights
(Unaudited) Cont’d
| Class Z | ||||
| Year Ended October 31, 2006 | ||||
Per Share Operating Performance(a): | ||||
Net Asset Value, Beginning Of Year | $ | 16.17 | ||
Income (loss) from investment operations: | ||||
Net investment income | .07 | |||
Net realized and unrealized gain (loss) on investment and foreign currency transactions | 2.85 | |||
Total from investment operations | 2.92 | |||
Less Dividends and Distributions: | ||||
Dividends from net investment income | (.05 | ) | ||
Distributions from net realized gains | — | |||
Total dividends and distributions | (.05 | ) | ||
Net asset value, end of year | $ | 19.04 | ||
Total Return(b): | 18.12 | % | ||
Ratios/Supplemental Data: | ||||
Net assets, end of year (000) | $ | 7,315 | ||
Average net assets (000) | $ | 14,169 | ||
Ratios to average net assets: | ||||
Expenses, including distribution and service (12b-1) fees | 1.07 | % | ||
Expenses, excluding distribution and service (12b-1) fees | 1.07 | % | ||
Net investment income | .38 | % | ||
| (a) | Calculated based upon average shares outstanding during the year. |
| (b) | Total return does not consider the effects of sales loads. Total return is calculated assuming a purchase of shares on the first day and a sale on the last day of each year reported, and includes reinvestment of dividends and distributions. |
See Notes to Financial Statements.
| 36 | Visit our website at www.jennisondryden.com |
| Class Z | ||||||||||||||
| Year Ended October 31, | ||||||||||||||
| 2005 | 2004 | 2003 | 2002 | |||||||||||
| $ | 13.62 | $ | 12.90 | $ | 10.32 | $ | 12.35 | |||||||
| .07 | �� | .01 | .05 | .01 | ||||||||||
| 2.48 | .79 | 2.53 | (2.04 | ) | ||||||||||
| 2.55 | .80 | 2.58 | (2.03 | ) | ||||||||||
| — | (.08 | ) | — | — | ||||||||||
| — | — | — | — | |||||||||||
| — | (.08 | ) | — | — | ||||||||||
| $ | 16.17 | $ | 13.62 | $ | 12.90 | $ | 10.32 | |||||||
| 18.72 | % | 6.32 | % | 24.90 | % | (16.50 | )% | |||||||
| $ | 14,245 | $ | 19,635 | $ | 36,372 | $ | 33,228 | |||||||
| $ | 16,923 | $ | 24,872 | $ | 33,443 | $ | 40,960 | |||||||
| 1.22 | % | 1.14 | % | 1.34 | % | 1.21 | % | |||||||
| 1.22 | % | 1.14 | % | 1.34 | % | 1.21 | % | |||||||
| .47 | % | .10 | % | .40 | % | .08 | % | |||||||
See Notes to Financial Statements.
| Jennison Global Growth Fund | 37 |
Supplemental Proxy Information
A Special Meeting of Shareholders of Jennison Global Growth Fund was held on December 11, 2006. At the meeting, the shareholders of the Fund approved the following proposal.
| 1. | To approve a Plan of Reorganization whereby all of the assets and liabilities of Jennison Global Growth Fund, will be transferred to, and assumed by, Dryden International Equity Fund, in exchange for shares of Dryuden International Equity Fund, and the cancellation of all of the shares of Jennison Global Growth Fund. |
| Votes For | Votes Against | Abstain | ||
| 9,464,640.08 | 474,366.30 | 683,864.72 |
| 38 | Visit our website at www.jennisondryden.com |
Report of Independent Registered Public Accounting Firm
The Board of Directors and Shareholders of
Prudential World Fund, Inc.—Jennison Global Growth Fund:
We have audited the accompanying statement of assets and liabilities of Prudential World Fund, Inc.—Jennison Global Growth Fund (hereafter referred to as the “Fund”), including the portfolio of investments, as of October 31, 2006, and the related statement of operations for the year then ended, the statement of changes in net assets for each of the years in the two-year period then ended, and the financial highlights for each of the years in the three-year period then ended. These financial statements and financial highlights are the responsibility of the Fund’s management. Our responsibility is to express an opinion on these financial statements and financial highlights based on our audits. The financial highlights for the years presented prior to the year ended October 31, 2004, were audited by another independent registered public accounting firm whose report dated December 22, 2003, expressed an unqualified opinion thereon.
We conducted our audits in accordance with the standards of the Public Company Accounting Oversight Board (United States). Those standards require that we plan and perform the audit to obtain reasonable assurance about whether the financial statements and financial highlights are free of material misstatement. An audit includes examining, on a test basis, evidence supporting the amounts and disclosures in the financial statements. Our procedures included confirmation of securities owned as of October 31, 2006, by correspondence with the custodian and brokers or by other appropriate auditing procedures where replies from brokers were not received. An audit also includes assessing the accounting principles used and significant estimates made by management, as well as evaluating the overall financial statement presentation. We believe that our audits provide a reasonable basis for our opinion.
In our opinion, the financial statements and financial highlights referred to above present fairly, in all material respects, the financial position of the Fund as of October 31, 2006, and the results of its operations for the year then ended, the changes in its net assets for each of the years in the two-year period then ended, and the financial highlights for each of the years in the three-year period then ended, in conformity with U.S. generally accepted accounting principles.

New York, New York
December 22, 2006
| Jennison Global Growth Fund | 39 |
Tax Information
(Unaudited)
We are required by the Internal Revenue Code to advise you within 60 days of the Fund’s fiscal year end (October 31, 2006) as to the federal income tax status of dividends paid by the Fund during such fiscal period. Accordingly, we are advising you that during its fiscal year ended October 31, 2006, the Fund paid an ordinary distribution for Class A and Class Z shares of $0.013 per share and $0.053 per share, respectively, which represents net investment income.
Further, we wish to advise you that 100% of the ordinary income dividends paid in the fiscal period ended October 31, 2006 qualified for the corporate dividend received deduction available to corporate taxpayers.
The Fund intends to designate 100% of ordinary income dividends, as qualified for the reduced tax rate under The Jobs and Growth Tax Relief Reconciliation Act of 2003.
The Fund has elected to give benefit of tax credits to its shareholders. Accordingly, shareholders who must report their gross income dividends and distributions in a federal tax return will be entitled to a foreign tax credit, or an itemized deduction, in computing their U.S. income tax liability. It is generally more advantageous to claim a credit rather than to take a deduction. For the fiscal year ended October 31, 2006, the Fund intends on passing through $443,280 of ordinary income dividends as a foreign tax credit based on foreign source income of $4,309,477.
In January 2007, you will be advised on IRS Form 1099-DIV or substitute 1099-DIV as to the federal tax status of the distributions received by you in calendar year 2006.
For more detailed information regarding your state and local taxes, you should contact your tax advisor or the state/local taxing authorities.
| 40 | Visit our website at www.jennisondryden.com |
Management of the Fund
(Unaudited)
Information pertaining to the Directors of the Fund is set forth below. Directors who are not deemed to be “interested persons” of the Fund, as defined in the Investment Company Act of 1940 (the 1940 Act), are referred to as “Independent Directors.” Directors who are deemed to be “interested persons” of the Fund are referred to as “Interested Directors.” “Fund Complex”† consists of the Fund and any other investment companies managed by PI.
Independent Directors(2)
Linda W. Bynoe (54), Director since 2005(3) Oversees 73 portfolios in Fund complex
Principal occupations (last 5 years): President and Chief Executive Officer (since March 1995) of Telemat, Ltd. (management consulting); formerly Vice President at Morgan Stanley & Co.
Other Directorships held: Director of Simon Property Group, Inc. (real estate investment trust) (since May 2003); Anixter International (communication products distributor) (since January 2006); Director of Northern Trust Corporation (since April 2006).
David E.A. Carson (72), Director since 2003(3) Oversees 77 portfolios in Fund complex
Principal occupations (last 5 years): Formerly Director (January 2000-May 2000), Chairman (January 1999-December 1999), Chairman and Chief Executive Officer (January 1998-December 1998) and President, Chairman and Chief Executive Officer of People’s Bank (1983-1997).
Robert E. La Blanc (72), Director since 2003(3) Oversees 75 portfolios in Fund complex
Principal occupations (last 5 years): President (since 1981) of Robert E. La Blanc Associates, Inc. (telecommunications).
Other Directorships held:(4) Director of Chartered Semiconductor Manufacturing, Ltd. (since 1998); Computer Associates International, Inc. (since 2002) (software company); FiberNet Telecom Group, Inc. (since 2003) (telecom company).
Douglas H. McCorkindale (67), Director since 1996(3) Oversees 73 portfolios in Fund complex
Principal occupations (last 5 years): Formerly Chairman (February 2001- June 2006), Chief Executive Officer (June 2000-July 2005), President (September 1997-July 2005) and Vice Chairman (March 1984-May 2000) of Gannett Co. Inc. (publishing and media).
Other Directorships held:(4) Director of Continental Airlines, Inc. (since May 1993); Director of Lockheed Martin Corp. (aerospace and defense) (since May 2001).
Richard A. Redeker (63), Director since 1995(3) Oversees 74 portfolios in Fund complex
Principal occupations (last 5 years): Management Consultant; Director (since 2001) and Chairman of the Board (since 2006) of Invesmart, Inc.; Director of Penn Tank Lines, Inc. (since 1999).
Robin B. Smith (67), Director since 1996(3) Oversees 75 portfolios in Fund complex
Principal occupations (last 5 years): Chairman of the Board (since January 2003) of Publishers Clearing House (direct marketing); formerly Chairman and Chief Executive Officer (August 1996-January 2003) of Publishers Clearing House.
Other Directorships held:(4) Director of BellSouth Corporation (since 1992).
| Jennison Global Growth Fund | 41 |
Stephen G. Stoneburn (63), Director since 2003(3) Oversees 75 portfolios in Fund complex
Principal occupations (last 5 years): President and Chief Executive Officer (since June 1996) of Quadrant Media Corp. (publishing company); formerly President (June 1995-June 1996) of Argus Integrated Media, Inc.; Senior Vice President and Managing Director (January 1993-1995) of Cowles Business Media; Senior Vice President of Fairchild Publications, Inc. (1975-1989).
Clay T. Whitehead (68), Director since 1996(3) Oversees 75 portfolios in Fund complex
Principal occupations (last 5 years): President (since 1983) of YCO (new business development firm).
Interested Directors(1)
Judy A. Rice (58), President since 2003 and Director since 2000(3) Oversees 73 portfolios in Fund complex
Principal occupations (last 5 years): President, Chief Executive Officer, Chief Operating Officer and Officer-In-Charge (since February 2003) of Prudential Investments LLC; Vice President (since February 1999) of Prudential Investment Management Services LLC; President, Chief Executive Officer and Officer-In-Charge (since April 2003) of Prudential Mutual Fund Services LLC; formerly Director (May 2003-March 2006) and Executive Vice President (June 2005-March 2006) of American Skandia Investment Services, Inc.; formerly Executive Vice President (September 1999-February 2003) of Prudential Investments LLC; Member of Board of Governors of the Investment Company Institute.
Robert F. Gunia (59), Vice President and Director since 1996(3) Oversees 153 portfolios in Fund complex
Principal occupations (last 5 years): Chief Administrative Officer (since September 1999) and Executive Vice President (since December 1996) of Prudential Investments LLC; President (since April 1999) of Prudential Investment Management Services LLC; Executive Vice President (since March 1999) and Treasurer (since May 2000) of Prudential Mutual Fund Services LLC; Chief Administrative Officer, Executive Vice President and Director (since May 2003) of American Skandia Investment Services, Inc.
Other Directorships held:(4) Vice President and Director (since May 1989) and Treasurer (since 1999) of The Asia Pacific Fund, Inc.
Information pertaining to the Officers of the Fund who are not also Directors is set forth below.
Officers(2)
Kathryn L. Quirk (54), Chief Legal Officer since 2005(3)
Principal occupations (last 5 years): Vice President and Corporate Counsel (since September 2004) of Prudential; Executive Vice President, Chief Legal Officer and Secretary (since July 2005) of Prudential Investments LLC and Prudential Mutual Fund Services LLC; formerly Managing Director, General Counsel, Chief Compliance Officer, Chief Risk Officer and Corporate Secretary (1997-2002) of Zurich Scudder Investments, Inc.
Deborah A. Docs (48), Secretary since 2005(3)
Principal occupations (last 5 years): Vice President and Corporate Counsel (since January 2001) of Prudential; Vice President (since December 1996) and Assistant Secretary (since March 1999) of PI; formerly Vice President and Assistant Secretary (May 2003-June 2005) of American Skandia Investment Services, Inc.
Jonathan D. Shain (48), Assistant Secretary since 2005(3)
Principal occupations (last 5 years): Vice President and Corporate Counsel (since August 1998) of Prudential; Vice President and Assistant Secretary (since May 2001) of PI; Vice President and Assistant Secretary (since February 2001) of PMFS; formerly Vice President and Assistant Secretary (May 2003-June 2005) of American Skandia Investment Services, Inc.
| 42 | Visit our website at www.jennisondryden.com |
Claudia DiGiacomo (32), Assistant Secretary since 2005(3)
Principal occupations (last 5 years): Vice President and Corporate Counsel (since January 2005) of Prudential; Vice President and Assistant Secretary of PI (since December 2005); Associate at Sidley Austin Brown & Wood LLP (1999-2004).
Lee D. Augsburger (47), Chief Compliance Officer since 2004(3)
Principal occupations (last 5 years): Senior Vice President and Chief Compliance Officer (since April 2003) of PI; Vice President (since November 2000) and Chief Compliance Officer (since October 2000) of Prudential Investment Management, Inc.; Chief Compliance Officer and Senior Vice President (since May 2003) of American Skandia Investment Services, Inc.
Grace C. Torres (47), Treasurer and Principal Financial and Accounting Officer since 1998(3)
Principal occupations (last 5 years): Assistant Treasurer (since March 1999) and Senior Vice President (since September 1999) of PI; Assistant Treasurer (since May 2003) and Vice President (since June 2005) of American Skandia Investment Services, Inc.; Senior Vice President and Assistant Treasurer (since May 2003) of American Skandia Advisory Services, Inc.; formerly Senior Vice President (May 2003-June 2005) of American Skandia Investment Services, Inc.
John P. Schwartz (35), Assistant Secretary since 2006(3)
Principal occupations (last 5 years): Vice President and Corporate Counsel (since April 2005) of Prudential; Vice President and Assistant Secretary of PI (since December 2005); Associate at Sidley, Austin Brown & Wood LLP (1997-2005).
M. Sadiq Peshimam (42), Assistant Treasurer since 2006(3)
Principal occupations (last 5 years): Vice President (since 2005) and Director (2000-2005) within Prudential Mutual Fund Administration.
Jack Benintende (42), Assistant Treasurer since 2006(3)
Principal occupations (last 5 years): Vice President (since June 2000) within Prudential Mutual Fund Administration; formerly Senior Manager within the investment management practice of PricewaterhouseCoopers LLP (May 1994 through June 2000).
Andrew R. French (44), Assistant Secretary since October 2006(3)
Principal occupations (last 5 years): Director and Corporate Counsel (since May 2006) of Prudential; formerly Senior Legal Analyst of Prudential Mutual Fund Law Department (1997-2006).
Noreen M. Fierro (42), Anti-Money Laundering Compliance Officer since October 2006(3)
Principal occupations (last 5 years): Vice President, Corporate Compliance (since May 2006) of Prudential; formerly Corporate Vice President, Associate General Counsel (April 2002-May 2005) of UBS Financial Services, Inc., in their Money Laundering Prevention Group; Senior Manager (May 2005-May 2006) of Deloitte Financial Advisory Services, LLP, in their Forensic and Dispute Services, Anti-Money Laundering Group.
| Jennison Global Growth Fund | 43 |
| † | The Fund Complex consists of all investment companies managed by PI. The Funds for which PI serves as manager include Jennison Dryden Mutual Funds, Strategic Partners Funds, The Prudential Variable Contract Accounts 2, 10, 11. The Target Portfolio Trust, The Prudential Series Fund, The High Yield Income Fund, Inc., The High Yield Plus Fund, Inc., Nicholas-Applegate Fund, Inc., American Skandia Trust, and Prudential’s Gibraltar Fund, Inc. |
| (1) | “Interested” Directors, as defined in the 1940 Act, by reason of employment with the Manager, a Subadvisor or the Distributor. |
| (2) | Unless otherwise noted, the address of the Directors and Officers is c/o: Prudential Investments LLC, Gateway Center Three, 100 Mulberry Street, Newark, NJ 07102. |
| (3) | There is no set term of office for Directors and Officers. The Independent Directors have adopted a retirement policy, which calls for the retirement of Directors on December 31 of the year in which they reach the age of 75. The table shows the individual’s length of service as Directors and/or Officer. |
| (4) | This includes only directorships of companies required to register, or file reports with the SEC under the Securities and Exchange Act of 1934 (that is, “public companies”) or other investment companies registered under the 1940 Act. |
Additional Information about the Directors is included in the Statement of Additional Information which is available without charge, upon request, by calling (800) 521-7466 or (732) 482-7555 (Calling from outside the U.S.)
| 44 | Visit our website at www.jennisondryden.com |
Approval of Advisory Agreements
The Board of Directors (the “Board”) of Prudential World Fund, Inc. oversees the management of the Jennison Global Growth Fund (the “Fund”) and, as required by law, determines annually whether to renew the Fund’s management agreement with Prudential Investments LLC (“PI”) and the Fund’s subadvisory agreement with Jennison Associates LLC (“Jennison”). In considering the renewal of the agreements, the Board, including all of the Independent Directors, met on June 7-8, 2006 and approved the renewal of the agreements through July 31, 2007, after concluding that renewal of the agreements was in the best interests of the Fund and its shareholders.
In advance of the meetings, the Board received materials relating to the agreements, and had the opportunity to ask questions and request further information in connection with their consideration. Among other things, the Board considered comparisons with other mutual funds in relevant Peer Universes and Peer Groups. The mutual funds included in each Peer Universe or Peer Group were objectively determined solely by Lipper Inc., an independent provider of mutual fund data. The comparisons placed the Fund in various quartiles over one-year, three-year and five-year time periods ending December 31, with the first quartile being the best 25% of the mutual funds (for performance, the best performing mutual funds and, for expenses, the lowest cost mutual funds).
In approving the agreements, the Board, including the Independent Directors advised by independent legal counsel, considered the factors they deemed relevant, including the nature, quality and extent of services provided, the performance of the Fund, the profitability of PI and its affiliates, expenses and fees, and the potential for economies of scale that may be shared with the Fund and its shareholders. In their deliberations, the Directors did not identify any single factor that was dispositive and each Director attributed different weights to the various factors. In connection with their deliberations, the Board considered information provided by PI throughout the year at regular Board meetings, presentations from portfolio managers and other information, as well as information furnished at or in advance of the meetings on June 7-8, 2006.
The Board further noted that at the June 7-8 meetings, PI had provided the Directors with a preliminary overview of potential fund reorganizations among various PI-managed mutual funds, which included the Fund. PI advised the Board at the meetings that it expected to formally submit the proposed reorganizations to the Directors for consideration at a subsequent special meeting of the Board.
The Directors determined that the overall arrangements between the Fund and PI, which serves as the Fund’s investment manager pursuant to a management agreement, and between PI and Jennison, which serves as the Fund’s subadviser
| Jennison Global Growth Fund |
Approval of Advisory Agreements (continued)
pursuant to the terms of a subadvisory agreement with PI, are fair and reasonable in light of the services performed, fees charged and such other matters as the Directors considered relevant in the exercise of their business judgment.
Several of the material factors and conclusions that formed the basis for the Directors reaching their determinations to approve the continuance of the agreements are separately discussed below.
Nature, Quality and Extent of Services
The Board received and considered information regarding the nature and extent of services provided to the Fund by PI and Jennison. The Board considered the services provided by PI, including but not limited to the oversight of the subadviser for the Fund, as well as the provision of fund recordkeeping, compliance, and other services to the Fund. With respect to PI’s oversight of the subadviser, the Board noted that PI’s Strategic Investment Research Group (“SIRG”), which is a business unit of PI, is responsible for monitoring and reporting to PI’s senior management on the performance and operations of the subadviser. The Board also considered that PI pays the salaries of all of the officers and non-independent Directors of the Fund. The Board also considered the investment subadvisory services provided by Jennison, as well as adherence to the Fund’s investment restrictions and compliance with applicable Fund policies and procedures.
The Board reviewed the qualifications, backgrounds and responsibilities of PI’s senior management responsible for the oversight of the Fund and Jennison, and also reviewed the qualifications, backgrounds and responsibilities of Jennison’s portfolio managers who are responsible for the day-to-day management of the Fund’s portfolio. The Board was provided with information pertaining to PI’s and Jennison’s organizational structure, senior management, investment operations, and other relevant information pertaining to both PI and Jennison. The Board also noted that it received favorable compliance reports from the Fund’s Chief Compliance Officer (“CCO”) as to both PI and Jennison. The Board noted that Jennison is affiliated with PI.
The Board concluded that it was satisfied with the nature, extent and quality of the investment management services provided by PI and the subadvisory services provided to the Fund by Jennison, and that there was a reasonable basis on which to conclude that the Fund benefits from the services provided by PI and Jennison under the management and subadvisory agreements.
| Visit our website at www.jennisondryden.com |
Performance of Jennison Global Growth Fund
The Board received and considered information about the Fund’s historical performance, noting that the Fund had achieved performance that was in the first quartile over a one-year period, and performance that was in the second quartile over three-year, five-year, and 10-year periods ending December 31 in relation to the group of comparable funds in a Peer Universe. The Board further noted that the Fund had outperformed against its benchmark index over the same one-year, three-year and five-year time periods.
The Board concluded that the Fund’s performance was satisfactory.
Fees and Expenses
The Board considered the management fee for the Fund as compared to the management fee charged by PI to other funds and accounts and the fee charged by other advisers to comparable mutual funds.
The Fund’s management fee ranked in the first quartile in its Peer Group. The Board concluded that the management and subadvisory fees were reasonable.
The Board further noted that during 2005 and continuing through 2006, several initiatives had commenced which, when fully implemented, were expected to result in cost savings and expense reductions for the Fund.
Costs of Services and Profits Realized by PI
The Board was provided with information on the profitability of PI and its affiliates in serving as the Fund’s investment manager. The Board discussed with PI the methodology utilized in assembling the information regarding profitability and considered its reasonableness. The Board recognized that it is difficult to make comparisons of profitability from fund management contracts because comparative information is not generally publicly available and is affected by numerous factors, including the structure of the particular adviser, the types of funds it manages, its business mix, numerous assumptions regarding allocations and the adviser’s capital structure and cost of capital. Taking these factors into account, the Board concluded that the profitability of PI and its affiliates in relation to the services rendered was not unreasonable. The Board did not separately consider the profitability of the subadviser, an affiliate of PI, as its profitability was reflected in the profitability report for PI. Taking these factors into account, the Board concluded that the profitability of PI and its affiliates in relation to the services rendered was not unreasonable.
| Jennison Global Growth Fund |
Approval of Advisory Agreements (continued)
Economies of Scale
The Board noted that the management fee schedule for the Fund includes breakpoints, which have the effect of decreasing the fee rate as assets increase, but at the current level of assets the Fund does not realize the effect of those rate reductions. The Board received and discussed information concerning whether PI realizes economies of scale as the Fund’s assets grow beyond current levels. The Board took note that the Fund’s fee structure would result in benefits to Fund shareholders when (and if) assets reach the levels at which the fee rate is reduced. These benefits will accrue whether or not PI is then realizing any economies of scale.
Other Benefits to PI and Jennison
The Board considered potential ancillary benefits that might be received by PI and Jennison and their affiliates as a result of their relationship with the Fund. The Board concluded that potential benefits to be derived by PI included brokerage commissions received by affiliates of PI, transfer agency fees received by the Fund’s transfer agent (which is affiliated with PI), as well as reputational or other intangible benefits resulting from PI’s association with the Fund. The Board concluded that the potential benefits to be derived by Jennison included its ability to use soft dollar credits, brokerage commissions received by affiliates of Jennison, as well as the potential benefits consistent with those generally resulting from an increase in assets under management, specifically, potential access to additional research resources and reputational benefits. The Board concluded that the benefits derived by PI and Jennison were consistent with the types of benefits generally derived by investment managers and subadvisers to mutual funds.
| Visit our website at www.jennisondryden.com |
Growth of a $10,000 Investment
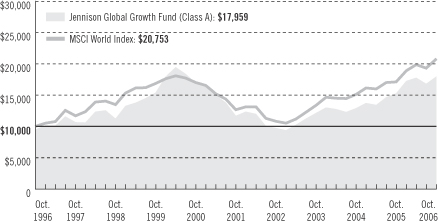
| Average Annual Total Returns (With Sales Charges) as of 10/31/06 | |||||||||
| One Year | Five Years | Ten Years | |||||||
Class A | 11.38 | % | 7.79 | % | 6.03 | % | |||
Class B | 12.28 | 8.28 | 5.99 | ||||||
Class C | 16.01 | 8.18 | 5.86 | ||||||
Class Z | 18.12 | 9.23 | 6.89 | ||||||
| Average Annual Total Returns (Without Sales Charges) as of 10/31/06 | |||||||||
| One Year | Five Years | Ten Years | |||||||
Class A | 17.87 | % | 9.02 | % | 6.63 | % | |||
Class B | 17.28 | 8.43 | 5.99 | ||||||
Class C | 17.01 | 8.18 | 5.86 | ||||||
Class Z | 18.12 | 9.23 | 6.89 | ||||||
Performance data quoted represent past performance. Past performance does not guarantee future results. The investment return and principal value of an investment will fluctuate, so that an investor’s shares, when redeemed, may be worth more or less than their original cost. Current performance may be lower or higher than the past performance data quoted. An investor may obtain performance data as of the most recent month-end by visiting our website at www.jennisondryden.com or by calling (800) 225-1852. The maximum initial sales charge is 5.50%.
The returns in the graph and the tables do not reflect the deduction of taxes that a shareholder would pay on Fund distributions or following the redemption of Fund shares.
| Visit our website at www.jennisondryden.com |
Source: Prudential Investments LLC and Lipper Inc.
The graph compares a $10,000 investment in the Jennison Global Growth Fund (Class A shares) with a similar investment in the MSCI World Index by portraying the initial account values at the beginning of the 10-year period for Class A shares (October 31, 1996) and the account values at the end of the current fiscal year (October 31, 2006) as measured on a quarterly basis. For purposes of the graph, and unless otherwise indicated, it has been assumed that (a) the maximum applicable front-end sales charge was deducted from the initial $10,000 investment in Class A shares; (b) all recurring fees (including management fees) were deducted; and (c) all dividends and distributions were reinvested. The line graph provides information for Class A shares only. As indicated in the tables provided earlier, performance for Class B, Class C, and Class Z shares will vary due to the differing charges and expenses applicable to each share class (as indicated in the following paragraphs). Without a distribution and service (12b-1) fee waiver of 0.05% annually for Class A shares through October 31, 2006, the returns shown in the graph and for Class A shares in the tables would have been lower.
The MSCI World Index is an unmanaged, weighted index of performance that reflects the stock price movement in securities listed on stock exchanges of Australia, Canada, Europe, the Far East, and the United States. The MSCI World Index’s total returns include the reinvestment of all dividends, but do not include the effects of sales charges, operating expenses of a mutual fund, or taxes. These returns would be lower if they included the effects of sales charges, operating expenses, or taxes. The securities that comprise the MSCI World Index may differ substantially from the securities in the Fund. The MSCI World Index is not the only index that may be used to characterize performance of global stock funds. Other indexes may portray different comparative performance. Investors cannot invest directly in an index.
Class A shares are subject to a maximum front-end sales charge of 5.50%, a 12b-1 fee of up to 0.30% annually, and all investors who purchase Class A shares in an amount of $1 million or more and sell these shares within 12 months of purchase are subject to a contingent deferred sales charge (CDSC) of 1% in certain circumstances. Class B shares are subject to a declining CDSC of 5%, 4%, 3%, 2%, 1%, and 1%, respectively, for the first six years after purchase and a 12b-1 fee of 1% annually. Approximately seven years after purchase, Class B shares will automatically convert to Class A shares on a quarterly basis. Class C shares purchased are not subject to a front-end sales charge, but charge a CDSC of 1% for Class C shares sold within 12 months from the date of purchase and an annual 12b-1 fee of 1%. Class Z shares are not subject to a sales charge or 12b-1 fees. The returns in the graph and tables reflect the share class expense structure in effect at the close of the fiscal period.
| Jennison Global Growth Fund |
| n MAIL | n TELEPHONE | n WEBSITE | ||
Gateway Center Three 100 Mulberry Street Newark, NJ 07102 | (800) 225-1852 | www.jennisondryden.com |
| PROXY VOTING |
| The Board of Directors of the Fund has delegated to the Fund’s investment subadviser the responsibility for voting any proxies and maintaining proxy recordkeeping with respect to the Fund. A description of these proxy voting policies and procedures is available without charge, upon request, by calling (800) 225-1852 or by visiting the Securities and Exchange Commission’s website at www.sec.gov. Information regarding how the Fund voted proxies relating to portfolio securities during the most recent 12-month period ended June 30 is available on the Fund’s website and on the Commission’s website. |
| DIRECTORS |
| Linda W. Bynoe • David E.A. Carson • Robert F. Gunia • Robert E. La Blanc • Douglas H. McCorkindale • Richard A. Redeker • Judy A. Rice • Robin B. Smith • Stephen G. Stoneburn • Clay T. Whitehead |
| OFFICERS |
| Judy A. Rice, President • Robert F. Gunia, Vice President • Grace C. Torres, Treasurer and Principal Financial and Accounting Officer • Kathryn L. Quirk, Chief Legal Officer • Deborah A. Docs, Secretary • Lee D. Augsburger, Chief Compliance Officer • Noreen M. Fierro, Acting Anti-Money Laundering Compliance Officer • Jonathan D. Shain, Assistant Secretary • Claudia DiGiacomo, Assistant Secretary • John P. Schwartz, Assistant Secretary • Andrew R. French, Assistant Secretary • Jack Benintende, Assistant Treasurer • M. Sadiq Peshimam, Assistant Treasurer |
| MANAGER | Prudential Investments LLC | Gateway Center Three 100 Mulberry Street Newark, NJ 07102 | ||
| INVESTMENT SUBADVISER | Jennison Associates, LLC | 466 Lexington Avenue New York, NY 10017 | ||
| DISTRIBUTOR | Prudential Investment Management Services LLC | Gateway Center Three 100 Mulberry Street Newark, NJ 07102 | ||
| CUSTODIAN | The Bank of New York | One Wall Street New York, NY 10286 | ||
| TRANSFER AGENT | Prudential Mutual Fund Services LLC | PO Box 8098 Philadelphia, PA 19176 | ||
| INDEPENDENT REGISTERED PUBLIC ACCOUNTING FIRM | KPMG LLP | 345 Park Avenue New York, NY 10154 | ||
| FUND COUNSEL | Sullivan & Cromwell LLP | 125 Broad Street New York, NY 10004 | ||
| An investor should consider the investment objectives, risks, charges, and expenses of the Fund carefully before investing. The prospectus for the Fund contains this and other information about the Fund. An investor may obtain a prospectus by visiting our website at www.jennisondryden.com or by calling (800) 225-1852. The prospectus should be read carefully before investing. |
| E-DELIVERY |
To receive your mutual fund documents on-line, go to www.icsdelivery.com/prudential/funds website address. |
| SHAREHOLDER COMMUNICATIONS WITH DIRECTORS |
| Shareholders can communicate directly with the Board of Directors by writing to the Chair of the Board, Jennison Global Growth Fund, PO Box 13964, Philadelphia, PA 19176. Shareholders can communicate directly with an individual Director by writing to the same address. Communications are not screened before being delivered to the addressee. |
| AVAILABILITY OF PORTFOLIO SCHEDULE |
| The Fund files its complete schedule of portfolio holdings with the Securities and Exchange Commission for the first and third quarters of each fiscal year on Form N-Q. The Fund’s Forms N-Q are available on the Commission’s website at www.sec.gov. The Fund’s Forms N-Q may also be reviewed and copied at the Commission’s Public Reference Room in Washington, D.C. Information on the operation and location of the Public Reference Room may be obtained by calling (800) SEC-0330 (732-0330). The Fund’s schedule of portfolio holdings is also available on the Fund’s website as of the end of each fiscal quarter. |
| The Fund’s Statement of Additional Information contains additional information about the Fund’s Directors and is available without charge, upon request, by calling (800) 225-1852. |
Mutual Funds:
| ARE NOT INSURED BY THE FDIC OR ANY FEDERAL GOVERNMENT AGENCY | MAY LOSE VALUE | ARE NOT A DEPOSIT OF OR GUARANTEED BY ANY BANK OR ANY BANK AFFILIATE |

| Jennison Global Growth Fund | ||||||||||||
| Share Class | A | B | C | Z | ||||||||
NASDAQ | PRGAX | PRGLX | PRGCX | PWGZX | ||||||||
CUSIP | 743969107 | 743969206 | 743969305 | 743969404 | ||||||||
MF115E IFS-A127702 Ed. 12/2006

Dryden International Equity Fund
OCTOBER 31, 2006 | ANNUAL REPORT |

FUND TYPE
Global/International stock
OBJECTIVE
Long-term growth of capital
This report is not authorized for distribution to prospective investors unless preceded or accompanied by a current prospectus.
The views expressed in this report and information about the Fund’s portfolio holdings are for the period covered by this report and are subject to change thereafter.
JennisonDryden is a registered trademark of The Prudential Insurance Company of America.

December 15, 2006
Dear Shareholder:
We hope you find the annual report for the Dryden International Equity Fund, a series of Prudential World Fund, Inc., informative and useful. As a JennisonDryden mutual fund shareholder, you may be thinking about where you can find additional growth opportunities. You could invest in last year’s top-performing asset class and hope that history repeats itself or you could stay in cash while waiting for the “right moment” to invest.
Instead, we believe it is better to take advantage of developing domestic and global investment opportunities through a diversified portfolio of stock and bond mutual funds. A diversified asset allocation offers two potential advantages. It helps you manage downside risk by not being overly exposed to any particular asset class, plus it gives you a better opportunity to have at least some of your assets in the right place at the right time. Your financial professional can help you create a diversified investment plan that may include mutual funds covering all the basic asset classes and that reflects your personal investor profile and tolerance for risk.
JennisonDryden Mutual Funds gives you a wide range of choices that can help you make progress toward your financial goals. Our funds offer the experience, resources, and professional discipline of three leading asset managers. They are recognized and respected in the institutional market and by discerning investors for excellence in their respective strategies. JennisonDryden equity funds are advised by Jennison Associates LLC or Quantitative Management Associates LLC (QMA). Prudential Investment Management, Inc. (PIM) advises the JennisonDryden fixed income and money market funds. Jennison Associates, QMA, and PIM are registered investment advisers and Prudential Financial companies.
Thank you for choosing JennisonDryden Mutual Funds.
Sincerely,

Judy A. Rice, President
Prudential World Fund, Inc.
| Dryden International Equity Fund | 1 |
Your Fund’s Performance
Fund objective
The investment objective of the Dryden International Equity Fund is long-term growth of capital. There can be no assurance that the Fund will achieve its investment objective.
Performance data quoted represent past performance. Past performance does not guarantee future results. The investment return and principal value of an investment will fluctuate, so that an investor’s shares, when redeemed, may be worth more or less than their original cost. Current performance may be lower or higher than the past performance data quoted. An investor may obtain performance data as of the most recent month-end by visiting our website at www.jennisondryden.com or by calling (800) 225-1852. The maximum initial sales charge is 5.50% (Class A shares).
| Cumulative Total Returns as of 10/31/06 | |||||||||
| One Year | Five Years | Since Inception1 | |||||||
Class A | 25.55 | % | 98.44 | % | –13.28 | % | |||
Class B | 24.73 | 90.82 | –17.56 | ||||||
Class C | 24.73 | 90.82 | –17.56 | ||||||
Class Z | 25.86 | 100.21 | –12.11 | ||||||
MSCI EAFE® Index2 | 27.52 | 97.31 | 32.63 | ||||||
Lipper International Multi-Cap Growth Funds Avg.3 | 26.17 | 86.47 | –1.61 | ||||||
| Average Annual Total Returns4 as of 9/30/06 | |||||||||
| One Year | Five Years | Since Inception1 | |||||||
Class A | 11.54 | % | 13.49 | % | –3.50 | % | |||
Class B | 12.11 | 13.80 | –3.40 | ||||||
Class C | 16.11 | 13.92 | –3.40 | ||||||
Class Z | 18.39 | 15.04 | –2.47 | ||||||
MSCI EAFE® Index2 | 19.16 | 14.26 | 3.78 | ||||||
Lipper International Multi-Cap Growth Funds Avg.3 | 17.90 | 13.46 | –0.65 |
The cumulative total returns do not reflect the deduction of applicable sales charges. If reflected, the applicable sales charges would reduce the cumulative total returns performance quoted. Class A shares are subject to a maximum front-end sales charge of 5.50%. Under certain circumstances, Class A shares may be subject to a contingent deferred sales charge (CDSC) of 1%. Class B and Class C shares are subject to a maximum CDSC of 5% and 1%, respectively. Class Z shares are not subject to a sales charge.
| 2 | Visit our website at www.jennisondryden.com |
Source: Prudential Investments LLC and Lipper Inc. Performance figures may reflect fee waivers and/or expense reimbursements. In the absence of such fee waivers and/or expense reimbursements, total returns would be lower.
1Inception date: 3/1/2000. The Since Inception returns for the MSCI EAFE® Index and the Lipper International Multi-Cap Growth Funds Average (Lipper Average) are measured from the closest month-end to inception date, and not from the Fund’s actual inception date.
2The Morgan Stanley Capital International Europe, Australasia, and Far East (MSCI EAFE®) Index is an unmanaged, weighted index of performance that reflects stock price movements of developed-country markets in Europe, Australasia, and the Far East.
3The Lipper Average represents returns based on an average return of all funds in the Lipper International Multi-Cap Growth Funds category. Funds in the Lipper Average invest in a variety of market-capitalization ranges without concentrating 75% of their equity assets in any one market-capitalization range over an extended period of time. Multi-cap funds typically have 25% to 75% of their assets invested in companies strictly outside of the United States with market capitalizations (on a three-year weighted basis) greater than the 250th largest company in the S&P/Citigroup World ex-U.S. Broad Market Index (BMI). Multi-cap growth funds typically have an above-average price-to-cash flow ratio, price-to-book ratio, and three-year sales-per-share growth value compared with the S&P/Citigroup World ex-U.S. BMI.
4The average annual total returns take into account applicable sales charges. Class A, Class B, and Class C shares are subject to an annual distribution and service (12b-1) fee of up to 0.30%, 1.00%, and 1.00%, respectively. Approximately seven years after purchase, Class B shares will automatically convert to Class A shares on a quarterly basis. Class Z shares are not subject to a 12b-1 fee. The returns in the tables do not reflect the deduction of taxes that a shareholder would pay on Fund distributions or following the redemption of Fund shares.
Investors cannot invest directly in an index. The returns for the MSCI EAFE® Index and the Lipper Average would be lower if they included the effects of sales charges, operating expenses of a mutual fund, or taxes. Returns for the Lipper Average reflect the deduction of operating expenses, but not sales charges or taxes.
| Five Largest Holdings in Long-Term Portfolio expressed as a percentage of net assets as of 10/31/06 | |||
HSBC Holdings PLC, Banks | 2.2 | % | |
Toyota Motor Corp., Automobiles | 1.7 | ||
GlaxoSmithKline PLC, Pharmaceuticals | 1.5 | ||
Banco Santander Central Hispano SA, Commercial Banks | 1.3 | ||
AstraZeneca PLC, Pharmaceuticals | 1.3 |
Holdings are subject to change.
| Five Largest Industries in Long-Term Portfolio expressed as a percentage of net assets as of 10/31/06 | |||
Commercial Banks | 16.9 | % | |
Oil, Gas & Consumable Fuels | 7.7 | ||
Pharmaceuticals | 5.6 | ||
Insurance | 5.5 | ||
Metals & Mining | 4.7 |
Industry weightings are subject to change.
| Dryden International Equity Fund | 3 |
Investment Subadviser’s Report
Quantitative Management Associates LLC
Market review
The 12 months ended October 31, 2006, were a period of strong global economic growth. Europe, in particular, had stronger growth than many observers had expected. Japan’s economy did not accelerate quite as much as had been expected, but still experienced strong business orders and profits and an improving consumer sector. The MSCI EAFE Index (the Index), the Fund’s benchmark, had a very strong reporting period, substantially outperforming even the strong U.S. domestic markets. The return of the Japan component of the Index was in line with that of U.S. stocks, but Europe moved substantially ahead. The gains were very broad-based, with all European components of the benchmark rising 25% to 45%. The market’s laggards were Pacific countries. New Zealand returned less than 3% and Hong Kong about 20%, a very respectable performance nonetheless. The very largest returns, over 40%, were in countries whose economies were still benefiting from the impetus of European Union membership: Ireland, Portugal, and Spain. The first two are very small markets; neither Ireland nor Portugal makes up as much as 1 percent of the benchmark, although Ireland has become one of the wealthiest countries in Europe on a per capita basis.
Stock returns were consistently strong across economic sectors and industries as well. The materials sector, particularly steel, led the market. Chinese demand for steel has driven growth. Real estate continued to boom, leading a generally strong finance sector. The capital equipment sector was led by energy equipment & services and data processing & reproduction. Its weakest component was the single-digit share price rise of the aerospace & military technology group. The consumer goods sector had strong gains across the board in absolute terms, but the average was below this reporting period’s high standard. It was led by textiles & apparel and pulled down by the (nonetheless good) advances of the appliances & household durables, health & personal care, and food & household products groups.
The weakest sectors in this market were energy and services. Energy was pulled down by the single-digit price rise of the large energy sources sector. The price of oil fell sharply over the reporting period as inventories built and what was expected to be a difficult hurricane season in the North Atlantic proved uneventful. The large integrated oil firms dominate the sector, and shares of both BP and Total declined, while those of Royal Dutch Shell rose less than 2%. Single-digit gains for the tiny shipping and very large telecommunications groups pulled down the average return of the services sector. However, returns in the sector were generally more modest than in other sectors.
| 4 | Visit our website at www.jennisondryden.com |
Performance review
The Fund’s Class A shares (+25.55%) trailed the Index (+27.52%) and the Lipper International Multi-Cap Growth Funds Average (+26.17%), a measure of comparable funds’ performance.
The Fund is actively managed with the goal of outperforming the MSCI EAFE Index. To meet this objective, we invest in both rapidly and slowly growing companies. Doing this limits our exposure to any particular style of investing and can reduce the Fund’s volatility relative to the Index. When selecting the stocks of more rapidly growing companies, we place a heavier emphasis on signals about their future growth prospects. We call these signals “news.” For example, upward revisions in the earnings forecasts of Wall Street analysts characterize many good news situations. We emphasize attractive valuation for slowly growing stocks, and invest more heavily in stocks that are cheaply priced relative to the firms’ earnings prospects and book value.
As designed, the Fund’s return was not far from the exceptionally strong return of its benchmark. Its underperformance of the Index was primarily the result of weak selection among stocks of faster growing companies, particularly those in Japan. For example, it was overweighted compared with the Index in Sega Sammy Holdings (–29%), Teijin (–5%), and The Bank of Fukuoka (+4%), all of which substantially trailed the Index return. However, the two individual positions that had the largest negative impact on relative performance were among the Fund’s positions in slower growing companies. They were European Aeronautic Defense & Space (–20%) and Vodafone (+3%). Both were overweighted compared with the Index because they had appeared to be underpriced on one or more measures.
The average return of the Fund’s holdings of stocks of slower growing companies, however, was higher than that of the similar components of the Index. This partially offset the impact of negative choices. For example, the Fund benefited from overweights in Endesa (+92%), Rautaruuki (+67%), and Air France (+115%).
The Portfolio of Investments following this report shows the size of the Fund’s positions at period-end.
| Dryden International Equity Fund | 5 |
Fees and Expenses (Unaudited)
As a shareholder of the Fund, you incur two types of costs: (1) transaction costs, including sales charges (loads) on purchase payments and redemptions, as applicable, and (2) ongoing costs, including management fees, distribution and/or service (12b-1) fees, and other Fund expenses, as applicable. This example is intended to help you understand your ongoing costs (in dollars) of investing in the Fund and to compare these costs with the ongoing costs of investing in other mutual funds.
The example is based on an investment of $1,000 invested on May 1, 2006, at the beginning of the period, and held through the six-month period ended October 31, 2006.
The Fund’s transfer agent may charge additional fees to holders of certain accounts that are not included in the expenses shown in the table on the following page. These fees apply to Individual Retirement Accounts (IRAs) and Section 403(b) accounts. As of the close of the six-month period covered by the table, IRA fees included an annual maintenance fee of $15 per account (subject to a maximum annual maintenance fee of $25 for all accounts held by the same shareholder). Section 403(b) accounts are charged an annual $25 fiduciary maintenance fee. Some of the fees may vary in amount, or may be waived, based on your total account balance or the number of JennisonDryden or Strategic Partners Funds, including the Fund, that you own. You should consider the additional fees that were charged to your Fund account over the six-month period when you estimate the total ongoing expenses paid over the period and the impact of these fees on your ending account value, as these additional expenses are not reflected in the information provided in the expense table. Additional fees have the effect of reducing investment returns.
Actual Expenses
The first line for each share class in the table on the following page provides information about actual account values and actual expenses. You may use the information on this line, together with the amount you invested, to estimate the expenses that you paid over the period. Simply divide your account value by $1,000 (for example, an $8,600 account value ÷ $1,000 = 8.6), then multiply the result by the number on the first line under the heading “Expenses Paid During the Six-Month Period” to estimate the expenses you paid on your account during this period.
Hypothetical Example for Comparison Purposes
The second line for each share class in the table on the following page provides information about hypothetical account values and hypothetical expenses based on the Fund’s actual expense ratio and an assumed rate of return of 5% per year before expenses, which is not the Fund’s actual return. The hypothetical account values and expenses may not be used to estimate the actual ending account balance or expenses
| 6 | Visit our website at www.jennisondryden.com |
you paid for the period. You may use this information to compare the ongoing costs of investing in the Fund and other funds. To do so, compare this 5% hypothetical example with the 5% hypothetical examples that appear in the shareholder reports of the other funds.
Please note that the expenses shown in the table are meant to highlight your ongoing costs only, and do not reflect any transactional costs such as sales charges (loads). Therefore the second line for each share class in the table is useful in comparing ongoing costs only, and will not help you determine the relative total costs of owning different funds. In addition, if these transactional costs were included, your costs would have been higher.
| Dryden International Equity Fund | Beginning Account Value May 1, 2006 | Ending Account October 31, 2006 | Annualized Expense Ratio Based on the Six-Month Period | Expenses Paid During the Six- Month Period* | ||||||||||
| Class A | Actual | $ | 1,000.00 | $ | 1,027.70 | 1.37 | % | $ | 7.00 | |||||
| Hypothetical | $ | 1,000.00 | $ | 1,018.30 | 1.37 | % | $ | 6.97 | ||||||
| Class B | Actual | $ | 1,000.00 | $ | 1,023.70 | 2.12 | % | $ | 10.81 | |||||
| Hypothetical | $ | 1,000.00 | $ | 1,014.52 | 2.12 | % | $ | 10.76 | ||||||
| Class C | Actual | $ | 1,000.00 | $ | 1,023.70 | 2.12 | % | $ | 10.81 | |||||
| Hypothetical | $ | 1,000.00 | $ | 1,014.52 | 2.12 | % | $ | 10.76 | ||||||
| Class Z | Actual | $ | 1,000.00 | $ | 1,028.60 | 1.12 | % | $ | 5.73 | |||||
| Hypothetical | $ | 1,000.00 | $ | 1,019.56 | 1.12 | % | $ | 5.70 | ||||||
* Fund expenses (net of fee waivers or subsidies, if any) for each share class are equal to the annualized expense ratio for each share class (provided in the table), multiplied by the average account value over the period, multiplied by the 184 days in the six-month period ended October 31, 2006, and divided by the 365 days in the Fund’s fiscal year ended October 31, 2006 (to reflect the six-month period).
| Dryden International Equity Fund | 7 |
Portfolio of Investments
as of October 31, 2006
| Shares | Description | Value (Note1) | |||
LONG-TERM INVESTMENTS 96.9% | |||||
COMMON STOCKS 96.7% | |||||
Australia 4.5% | |||||
| 139,626 | APN News & Media, Ltd. | $ | 661,688 | ||
| 61,703 | BHP Billiton, Ltd. | 1,303,426 | |||
| 14,570 | BlueScope Steel, Ltd. | 81,683 | |||
| 29,719 | Caltex Australia, Ltd. | 509,734 | |||
| 174,564 | Challenger Financial Services Group | 463,644 | |||
| 13,949 | Cochlear, Ltd. | 601,312 | |||
| 254,766 | CSR, Ltd. | 639,179 | |||
| 229,070 | Foster’s Group, Ltd. | 1,144,099 | |||
| 11,413 | Lend Lease Corp., Ltd. | 148,826 | |||
| 20,412 | Lion Nathan, Ltd. | 131,032 | |||
| 783,036 | Macquarie Airports | 1,946,359 | |||
| 7,635 | Macquarie Bank, Ltd. | 440,750 | |||
| 129,167 | Macquarie Infrastructure Group | 338,068 | |||
| 160,165 | Mayne Pharma, Ltd. | 541,982 | |||
| 215,116 | Mirvac Group | 816,215 | |||
| 71,157 | OneSteel, Ltd. | 231,972 | |||
| 58,901 | Pacific Brands, Ltd. | 120,866 | |||
| 6,995 | Publishing & Broadcasting, Ltd. | 104,973 | |||
| 11,838 | QBE Insurance Group, Ltd. | 226,418 | |||
| 114,909 | Quantas Airways, Ltd. | 377,273 | |||
| 31,179 | Rio Tinto, Ltd. | 1,892,841 | |||
| 176,863 | Santos, Ltd. | 1,450,337 | |||
| 12,557 | Suncorp-Metway, Ltd. | 202,248 | |||
| 51,576 | Toll Holdings, Ltd. | 619,035 | |||
| 104,833 | Woolworths, Ltd. | 1,679,556 | |||
| 16,673,516 | |||||
Austria 0.3% | |||||
| 16,384 | Boehler-Uddeholm AG | 1,015,858 | |||
Belgium 1.7% | |||||
| 31,264 | Belgacom SA | 1,279,274 | |||
| 3,847 | Delhaize Group | 311,046 | |||
| 84,279 | Dexia | 2,276,096 | |||
| 30,229 | Fortis | 1,268,946 | |||
| 2,575 | Inbev NV | 145,066 | |||
| 9,669 | Mobistar SA | 801,523 | |||
| 3,140 | Solvay SA (Class A) | 406,371 | |||
| 6,488,322 | |||||
See Notes to Financial Statements.
| Dryden International Equity Fund | 9 |
Portfolio of Investments
as of October 31, 2006 Cont’d.
| Shares | Description | Value (Note 1) | |||
Cayman Islands 0.4% | |||||
| 438,000 | Foxconn International Holdings, Ltd.(a) | $ | 1,455,832 | ||
Denmark 1.1% | |||||
| 55,532 | Danske Bank A/S | 2,329,662 | |||
| 4,400 | Det Ostasiatiske Kompagni A/S (The East Asiatic Company, Ltd.) | 221,505 | |||
| 8,871 | Novo Nordisk SA | 669,876 | |||
| 4,150 | Topdanmark A/S(a) | 589,096 | |||
| 1,250 | William Demant Holding(a) | 103,595 | |||
| 3,913,734 | |||||
Finland 1.2% | |||||
| 3,800 | Metso Oyj | 165,141 | |||
| 42,394 | Nokia Oyj | 841,376 | |||
| 29,600 | OKO Bank | 499,812 | |||
| 39,800 | Outokumpu Oyj (Class A) | 1,228,274 | |||
| 25,314 | Rautaruukki Oyj | 836,143 | |||
| 45,928 | Sampo Oyj (Class A) | 995,338 | |||
| 4,566,084 | |||||
France 8.8% | |||||
| 50,434 | Air France-KLM | 1,796,548 | |||
| 54,263 | AXA SA | 2,067,300 | |||
| 41,238 | BNP Paribas SA | 4,534,281 | |||
| 1,999 | Bouygues SA | 116,545 | |||
| 8,026 | Casino Guichard-Perrachon SA | 680,690 | |||
| 33,069 | Compagnie de Saint-Gobain | 2,437,410 | |||
| 60,275 | Credit Agricole SA | 2,562,520 | |||
| 21,496 | Gaz De France | 864,219 | |||
| 1,172 | Groupe Danone | 171,722 | |||
| 10,628 | Lafarge SA | 1,428,352 | |||
| 625 | Pinault-Printemps-Redoute SA | 93,250 | |||
| 11,815 | Renault SA | 1,382,043 | |||
| 33,686 | Sanofi-Aventis | 2,863,381 | |||
| 6,836 | Schneider Electric SA | 710,202 | |||
| 60,268 | Scor | 151,533 | |||
| 20,794 | Societe Generale | 3,455,449 | |||
| 4,382 | Suez SA | 196,083 | |||
| 42,967 | Total SA | 2,909,215 | |||
| 3,561 | Vallourec | 886,262 | |||
| 84,430 | Vivendi Universal SA | 3,197,200 | |||
| 32,504,205 | |||||
See Notes to Financial Statements.
| 10 | Visit our website at www.jennisondryden.com |
| Shares | Description | Value (Note 1) | |||
Germany 7.4% | |||||
| 16,801 | Allianz AG | $ | 3,107,985 | ||
| 2,205 | Altana AG | 122,983 | |||
| 36,492 | BASF AG | 3,204,362 | |||
| 18,844 | Continental AG | 2,106,605 | |||
| 22,355 | DaimlerChrysler AG | 1,269,383 | |||
| 29,891 | Deutsche Bank AG | 3,753,972 | |||
| 5,195 | Deutsche Boerse AG | 835,101 | |||
| 33,602 | E.ON AG | 4,017,177 | |||
| 2,037 | Fresenius Medical Care AG | 271,163 | |||
| 8,197 | MAN AG | 726,579 | |||
| 17,071 | Muenchener Rueckversicherungs-Gesellschaft AG | 2,762,264 | |||
| 2,975 | Puma AG Rudolf Dassler Sport | 1,056,634 | |||
| 4,334 | Siemens AG | 388,368 | |||
| 68,718 | Suedzucker AG | 1,695,344 | |||
| 61,429 | ThyssenKrupp AG | 2,276,803 | |||
| 27,594,723 | |||||
Greece 0.5% | |||||
| 14,080 | Alpha Credit Bank | 409,725 | |||
| 12,430 | Coca-Cola Hellenic Bottling Company SA | 406,131 | |||
| 18,458 | National Bank of Greece SA | 837,727 | |||
| 6,175 | Titan Cement Co. | 324,075 | |||
| 1,977,658 | |||||
Hong Kong 1.0% | |||||
| 131,000 | Cheung Kong Holdings, Ltd. | 1,425,012 | |||
| 28,000 | CLP Holdings, Ltd. | 177,853 | |||
| 196,652 | Hong Kong Exchanges and Clearing, Ltd. | 1,557,600 | |||
| 78,000 | Hopewell Holdings, Ltd. | 231,677 | |||
| 98,000 | Li & Fung, Ltd. | 256,429 | |||
| 12,000 | Swire Pacific, Ltd. (Class A) | 126,755 | |||
| 3,775,326 | |||||
Ireland 1.0% | |||||
| 47,743 | Allied Irish Banks PLC | 1,300,957 | |||
| 87,090 | Bank of Ireland | 1,755,117 | |||
| 11,853 | CRH PLC | 418,896 | |||
| 3,409 | Irish Life & Permanent PLC | 83,755 | |||
| 3,558,725 | |||||
See Notes to Financial Statements.
| Dryden International Equity Fund | 11 |
Portfolio of Investments
as of October 31, 2006 Cont’d.
| Shares | Description | Value (Note 1) | |||
Italy 3.4% | |||||
| 32,025 | Banca Intesa SpA | $ | 218,879 | ||
| 70,535 | Banche Popolari Unite Scrl | 1,935,524 | |||
| 48,525 | Banco Popolare di Verona E Novara Scrl | 1,306,164 | |||
| 29,920 | Capitalia SpA | 264,446 | |||
| 43,009 | Enel SpA | 412,793 | |||
| 134,240 | ENI SpA | 4,048,566 | |||
| 24,415 | Fiat SpA | 430,957 | |||
| 2,406 | FONDIARIA-SAI SpA | 107,109 | |||
| 12,198 | Italcementi SpA | 323,044 | |||
| 325,680 | Telecom Italia Mobile SpA | 823,023 | |||
| 314,757 | UniCredito Italiano SpA | 2,609,216 | |||
| 12,479,721 | |||||
Japan 22.3% | |||||
| 48,700 | Aeon Co., Ltd. | 1,147,181 | |||
| 77,000 | Amada Co., Ltd. | 764,371 | |||
| 12,600 | Aoyama Trading Co., Ltd. | 386,764 | |||
| 67,394 | Canon, Inc. | 3,613,017 | |||
| 24,000 | Central Glass Co., Ltd. | 133,179 | |||
| 16,000 | Comsys Holdings Corp. | 169,364 | |||
| 81,286 | Denki Kagaku Kogyo K K | 309,284 | |||
| 20,100 | Elpida Memory, Inc.(a) | 938,361 | |||
| 13,254 | FamilyMart Co., Ltd. | 359,242 | |||
| 16,300 | FUJIFILM Holdings Corp. | 604,865 | |||
| 202 | Fuji Television Network, Inc. | 421,427 | |||
| 93,000 | Fujikura, Ltd. | 994,767 | |||
| 16,000 | Fujitsu, Ltd. | 130,512 | |||
| 84,000 | Gunze, Ltd. | 441,708 | |||
| 7,000 | Hitachi Construction Machinery Co., Ltd. | 166,389 | |||
| 55,853 | Hokkaido Electric Power Co., Inc. | 1,332,392 | |||
| 98,874 | Honda Motor Co., Ltd. | 3,499,965 | |||
| 12,300 | Ibiden Co., Ltd. | 644,684 | |||
| 55 | Inpex Holdings Inc.(a) | 449,575 | |||
| 140,000 | Itochu Corp. | 1,115,643 | |||
| 10,900 | JS Group Corp. | 223,676 | |||
| 76,000 | Kajima Corp. | 363,251 | |||
| 40,400 | Kansai Electric Power Co., Inc. (The) | 953,392 | |||
| 124,000 | Komatsu, Ltd. | 2,237,100 | |||
| 74,000 | Kubota Corp. | 647,275 | |||
| 6,800 | Kyocera Corp. | 609,910 | |||
| 40,100 | Kyushu Electric Power Co., Inc. | 937,741 | |||
| 29,700 | Leopalace21 Corp. | 1,117,353 | |||
See Notes to Financial Statements.
| 12 | Visit our website at www.jennisondryden.com |
| Shares | Description | Value (Note 1) | |||
| 63,200 | Makita Corp. | $ | 1,880,518 | ||
| 258,222 | Marubeni Corp. | 1,322,517 | |||
| 48,000 | Matsushita Electric Industrial Co., Ltd. | 1,003,463 | |||
| 310,843 | Mitsubishi Chemical, Inc. | 1,988,034 | |||
| 62,100 | Mitsubishi Corp. | 1,200,000 | |||
| 12,000 | Mitsubishi Electric Corp. | 104,656 | |||
| 106,000 | Mitsubishi Gas Chemical Co., Inc. | 1,009,653 | |||
| 34,000 | Mitsubishi Materials Corp. | 134,017 | |||
| 120 | Mitsubishi UFJ Financial Group, Inc. | 1,508,272 | |||
| 97,000 | Mitsui & Co., Ltd. | 1,324,518 | |||
| 65,000 | Mitsui O.S.K. Lines, Ltd. | 541,875 | |||
| 471 | Mizuho Financial Group, Inc. | 3,668,770 | |||
| 40,000 | NGK SPARK PLUG Co., Ltd. | 843,059 | |||
| 30,000 | NHK Spring Co., Ltd. | 331,666 | |||
| 82,000 | Nikon Corp. | 1,686,204 | |||
| 64,000 | Nippon Express Company, Ltd. | 346,390 | |||
| 38,000 | Nippon Mining Holdings, Inc. | 283,972 | |||
| 113,000 | Nippon Oil Corp. | 840,580 | |||
| 111,000 | Nippon Sheet Glass Co., Ltd. | 498,269 | |||
| 12,000 | Nippon Shokubai Co., Ltd. | 128,562 | |||
| 217,000 | Nippon Steel Corp. | 883,177 | |||
| 534 | Nippon Telegraph and Telephone Corp. | 2,689,291 | |||
| 36,200 | Nisshin Seifun Group, Inc. | 380,091 | |||
| 133,753 | NSK, Ltd. | 1,120,755 | |||
| 381 | NTT Data Corp. | 1,899,218 | |||
| 286,000 | Obayashi Corp. | 1,875,610 | |||
| 5,320 | ORIX Corp. | 1,498,816 | |||
| 59,000 | Ricoh Co., Ltd. | 1,165,320 | |||
| 20,900 | Sankyo Co., Ltd. | 1,066,846 | |||
| 31,000 | Sanwa Shutter Corp. | 177,590 | |||
| 8 | Sapporo Hokuyo Holdings, Inc. | 80,031 | |||
| 82,000 | Shimizu Corp. | 486,580 | |||
| 3,300 | Shin-Etsu Chemical Co., Ltd. | 216,417 | |||
| 18,300 | Stanley Electric Co., Ltd. | 363,011 | |||
| 24,900 | Sumco Corp. | 1,771,348 | |||
| 301,000 | Sumitomo Chemical Co., Ltd. | 2,146,415 | |||
| 102,000 | Sumitomo Corp. | 1,341,336 | |||
| 39,000 | Sumitomo Heavy Industries, Ltd. | 334,129 | |||
| 246,000 | Sumitomo Metal Industries, Ltd. | 925,484 | |||
| 64,000 | Sumitomo Metal Mining Co., Ltd. | 841,076 | |||
| 73 | Sumitomo Mitsui Financial Group, Inc. | 798,940 | |||
| 29,000 | Sumitono Realty & Development Co., Ltd. | 962,079 | |||
| 16,400 | Suzuken Co., Ltd. | 574,922 | |||
See Notes to Financial Statements.
| Dryden International Equity Fund | 13 |
Portfolio of Investments
as of October 31, 2006 Cont’d.
| Shares | Description | Value (Note 1) | |||
| 68,641 | Tanabe Seiyaku Co., Ltd. | $ | 845,137 | ||
| 27,300 | Tokyo Electric Power Co., Inc.(The) | 793,639 | |||
| 31,200 | Tokyo Electron, Ltd. | 2,331,563 | |||
| 19,000 | Tokyo Tatemono Co., Ltd. | 226,788 | |||
| 101,000 | Toshiba Corp. | 639,049 | |||
| 30,000 | Toyo Suisan Kaisha, Ltd. | 438,374 | |||
| 106,834 | Toyota Motor Corp. | 6,330,296 | |||
| 11,980 | UNY Co., Ltd. | 150,473 | |||
| 5,310 | USS Co., Ltd. | 336,883 | |||
| 31,200 | Yamaha Corp. | 666,923 | |||
| 12,000 | Yamazaki Baking Co., Ltd. | 124,458 | |||
| 68,000 | Yaskawa Electric Corp. | 725,612 | |||
| 82,565,060 | |||||
Netherlands 3.8% | |||||
| 135,653 | Aegon NV | 2,494,875 | |||
| 8,571 | Fugro NV-CVA | 370,402 | |||
| 3,115 | Heineken NV | 141,177 | |||
| 87,431 | ING Groep NV | 3,873,251 | |||
| 131,776 | Koninklijke Ahold NV(a) | 1,387,541 | |||
| 27,204 | Koninklijke DSM NV | 1,239,875 | |||
| 12,628 | Mittal Steel Co. NV | 542,344 | |||
| 8,010 | Oce NV | 122,372 | |||
| 5,753 | Randstad Holdings NV | 362,357 | |||
| 130,432 | Royal KPN NV | 1,742,955 | |||
| 81,799 | Unilever NV - CVA | 2,017,022 | |||
| 14,294,171 | |||||
New Zealand 0.7% | |||||
| 56,741 | Fisher & Paykel Appliances Holdings, Ltd. | 144,430 | |||
| 32,249 | Fletcher Building, Ltd. | 205,219 | |||
| 681,657 | Telecom Corporation of New Zealand, Ltd. | 2,132,362 | |||
| 2,482,011 | |||||
Norway 1.6% | |||||
| 112,909 | DBN NOR ASA | 1,478,542 | |||
| 49,075 | Norsk Hydro ASA | 1,127,993 | |||
| 41,051 | Orkla ASA | 2,103,779 | |||
| 2,700 | Prosafe ASA | 172,652 | |||
| 21,180 | TGS Nopec Geophysical Co. ASA(a) | 377,471 | |||
| 28,500 | Yara International ASA | 499,208 | |||
| 5,759,645 | |||||
See Notes to Financial Statements.
| 14 | Visit our website at www.jennisondryden.com |
| Shares | Description | Value (Note 1) | |||
Portugal 0.5% | |||||
| 241,055 | Banco Comercial Portugues SA | $ | 784,534 | ||
| 248,614 | Energias de Portugal SA | 1,116,924 | |||
| 1,901,458 | |||||
Singapore 0.7% | |||||
| 150,000 | Cosco Corp. Singapore, Ltd. | 184,995 | |||
| 1,000 | Haw Par Corp., Ltd. | 4,336 | |||
| 35,000 | Jardine Cycle & Carriage, Ltd. | 278,777 | |||
| 82,000 | SembCorp Marine, Ltd. | 180,139 | |||
| 64,000 | Singapore Airlines, Ltd. | 624,871 | |||
| 259,300 | Singapore Petroleum Co., Ltd. | 756,180 | |||
| 200,000 | Singapore Post, Ltd. | 128,469 | |||
| 272,652 | Singapore Telecommunications, Ltd. | 464,111 | |||
| 35,000 | United Overseas Land, Ltd. | 89,928 | |||
| 2,711,806 | |||||
Spain 4.8% | |||||
| 3,732 | Acciona S.A | 657,319 | |||
| 24,524 | Acerinox SA | 575,923 | |||
| 114,612 | Banco Bilbao Vizcaya Argentaria SA | 2,767,621 | |||
| 29,672 | Banco Popular Espanol SA | 514,283 | |||
| 283,103 | Banco Santander Central Hispano SA | 4,899,590 | |||
| 22,700 | Ebro Puleva SA | 504,116 | |||
| 79,629 | Endesa SA | 3,530,665 | |||
| 4,051 | Fomento de Construcciones y Contratas SA | 353,133 | |||
| 6,012 | Gas Natural SDG SA | 238,789 | |||
| 3,596 | Grupo Ferrovial SA | 332,287 | |||
| 12,943 | Iberdrola SA | 593,867 | |||
| 52,403 | Repsol YPF SA | 1,738,941 | |||
| 31,215 | Telefonica SA | 601,583 | |||
| 7,397 | Union Fenosa SA | 375,746 | |||
| 17,683,863 | |||||
Sweden 1.7% | |||||
| 11,700 | D Carnegie AB | 223,555 | |||
| 7,093 | Nobia AB | 251,413 | |||
| 37,987 | Skandinaviska Enskilda Banken AB (Class A) | 1,062,441 | |||
| 5,000 | Svenska Cellulosa AB (Class B) | 229,494 | |||
| 81,500 | Swedish Match AB | 1,303,341 | |||
| 76,175 | TeliaSonera AB | 553,720 | |||
| 40,320 | Volvo AB (Class B) | 2,520,559 | |||
| 6,144,523 | |||||
See Notes to Financial Statements.
| Dryden International Equity Fund | 15 |
Portfolio of Investments
as of October 31, 2006 Cont’d.
| Shares | Description | Value (Note 1) | |||
Switzerland 6.7% | |||||
| 38,009 | ABB, Ltd. | $ | 565,224 | ||
| 62,996 | Credit Suisse Group | 3,797,838 | |||
| 395 | Geberit AG | 514,686 | |||
| 3,548 | Holcim, Ltd. | 305,447 | |||
| 6,746 | Nestle SA | 2,304,610 | |||
| 37,728 | Novartis AG | 2,289,670 | |||
| 18,198 | Phonak Holding AG | 1,161,466 | |||
| 2,032 | Rieter Holding AG | 962,874 | |||
| 18,506 | Roche Holdings AG | 3,238,420 | |||
| 219 | SGS SA | 232,546 | |||
| 313 | Sulzer AG | 275,499 | |||
| 3,440 | Swatch Group AG | 137,429 | |||
| 24,933 | Swiss Re | 2,044,263 | |||
| 2,816 | Swisscom AG | 983,523 | |||
| 72,930 | UBS AG | 4,355,692 | |||
| 7,420 | Zurich Financial Services AG | 1,834,050 | |||
| 25,003,237 | |||||
United Kingdom 22.6% | |||||
| 33,808 | Anglo American PLC | 1,524,562 | |||
| 79,611 | AstraZeneca PLC | 4,704,707 | |||
| 141,716 | Aviva PLC | 2,095,071 | |||
| 263,907 | Barclays PLC | 3,561,685 | |||
| 49,927 | Barratt Developments PLC | 1,031,435 | |||
| 7,592 | Bellway PLC | 195,075 | |||
| 11,054 | Berkeley Group Holdings PLC | 303,641 | |||
| 85,401 | BHP Billiton PLC | 1,646,995 | |||
| 27,192 | Bovis Homes Group PLC | 490,694 | |||
| 366,049 | BP PLC | 4,070,858 | |||
| 37,984 | BP PLC ADR | 2,548,726 | |||
| 111,088 | British Airways PLC(a) | 973,713 | |||
| 29,925 | British American Tobacco PLC | 815,726 | |||
| 6,592 | British Land Co. PLC | 187,991 | |||
| 545,916 | BT Group PLC | 2,897,605 | |||
| 37,253 | Carnival PLC | 1,818,485 | |||
| 68,596 | DSG International PLC | 284,601 | |||
| 13,186 | Enterprise Inns PLC | 271,150 | |||
| 11,988 | Experian Group, Ltd. | 131,947 | |||
| 51,390 | FirstGroup PLC | 526,663 | |||
| 80,479 | George Wimpey PLC | 807,507 | |||
| 210,892 | GlaxoSmithKline PLC | 5,632,047 | |||
| 120,832 | HBOS PLC | �� | 2,505,472 | ||
See Notes to Financial Statements.
| 16 | Visit our website at www.jennisondryden.com |
| Shares | Description | Value (Note 1) | |||
| 1 | Henderson Group PLC | $ | 2 | ||
| 431,418 | HSBC Holdings PLC | 8,180,178 | |||
| 90,689 | Imperial Chemical Industries PLC | 703,656 | |||
| 43,079 | Imperial Tobacco Group PLC | 1,526,004 | |||
| 30,960 | Inchcape PLC | 305,773 | |||
| 39,762 | Kelda Group PLC | 656,847 | |||
| 323,587 | Legal & General Group PLC | 891,943 | |||
| 200,175 | Lloyds TSB Group PLC | 2,136,427 | |||
| 32,977 | Marks & Spencer Group PLC | 412,975 | |||
| 39,422 | Michael Page International PLC | 303,807 | |||
| 162,637 | National Grid PLC | 2,078,607 | |||
| 49,423 | National Power PLC | 315,593 | |||
| 3,486 | Next PLC | 125,015 | |||
| 36,418 | Persimmon PLC | 927,418 | |||
| 16,817 | Reckitt Benckiser PLC | 731,732 | |||
| 20,095 | Reed International PLC | 228,845 | |||
| 49,150 | Resolution PLC | 583,166 | |||
| 27,161 | Rio Tinto PLC | 1,498,381 | |||
| 165,824 | Royal & Sun Alliance Insurance Group PLC | 466,571 | |||
| 76,201 | Royal Bank of Scotland Group PLC (The) | 2,715,287 | |||
| 92,736 | Royal Dutch Shell PLC | 3,216,032 | |||
| 130,915 | Royal Dutch Shell PLC (Class B) | 4,689,895 | |||
| 106,560 | SABMiller PLC | 2,061,153 | |||
| 22,331 | Scottish & Newcastle PLC | 240,251 | |||
| 84,633 | Stagecoach Group PLC | 225,212 | |||
| 46,213 | Tate & Lyle PLC | 694,654 | |||
| 86,432 | Taylor Woodrow PLC | 599,730 | |||
| 216,896 | Tesco PLC | 1,628,075 | |||
| 28,998 | Tomkins PLC | 134,416 | |||
| 4,775 | Trinity Mirror PLC | 44,678 | |||
| 29,120 | Unilever PLC | 722,681 | |||
| 46,452 | United Utilities PLC | 632,232 | |||
| 1,630,544 | Vodafone Group PLC | 4,198,986 | |||
| 32,699 | Vodafone Group PLC ADR | 845,269 | |||
| 10,518 | William Hill PLC | 130,615 | |||
| 9,005 | WPP Group PLC | 115,347 | |||
| 83,993,809 | |||||
Total common stocks | 358,543,287 | ||||
See Notes to Financial Statements.
| Dryden International Equity Fund | 17 |
Portfolio of Investments
as of October 31, 2006 Cont’d.
| Shares | Description | Value (Note 1) | |||
PREFERRED STOCK 0.2% | |||||
Germany | |||||
| 532 | Porsche AG | $ | 620,181 | ||
Total Long-Term Investments | 359,163,468 | ||||
Principal | |||||
SHORT-TERM INVESTMENTS 0.5% | |||||
U.S. GOVERNMENT SECURITIES 0.2% | |||||
United States | |||||
United States Treasury Bill 4.76%, 12/14/06(b)(c) | |||||
| $ 850 | (cost $845,167) | 845,040 | |||
Shares | |||||
Affiliated Money Market Mutual Fund 0.3% | |||||
Dryden Core Investment Fund - Taxable Money Market Series | |||||
| 1,098,621 | (cost $1,098,621)(Note 3)(d) | 1,098,621 | |||
Total Short-Term Investments | 1,943,661 | ||||
Total Investments 97.4% | 361,107,129 | ||||
Other assets in excess of liabilities(e) 2.6% | 9,742,415 | ||||
Net Assets 100.0% | $ | 370,849,544 | |||
ADR—American Depositary Receipt
| (a) | Non-income producing security. |
| (b) | Rate quoted represents yield-to-maturity as of purchase date. |
| (c) | All or portion of security segregated as collateral for financial futures contracts. |
| (d) | Prudential Investments LLC, the manager of the Fund also serves a manager of the Dryden Core Investment Fund-Taxable Money Market Series. |
| (e) | Other assets in excess of liabilities included net unrealized appreciation on financial futures as follows: |
See Notes to Financial Statements.
| 18 | Visit our website at www.jennisondryden.com |
Open future contracts outstanding at October 31, 2006:
| Number of Contracts | Type | Expiration | Value at October 31, 2006 | Value at Trade Date | Unrealized Appreciation | ||||||||
| Long Positions: | |||||||||||||
| 4 | Hang Seng Stock Index | Nov 06 | $ | 471,635 | $ | 467,267 | $ | 4,368 | |||||
| 18 | Share Price Index 200 | Dec 06 | 1,868,074 | 1,776,251 | 91,823 | ||||||||
| 62 | DJ Euro Stoxx 50 Index | Dec 06 | 3,174,739 | 3,055,004 | 119,735 | ||||||||
| 51 | Nikkei 225 Index | Dec 06 | 4,173,075 | 4,111,875 | 61,200 | ||||||||
| 25 | FTSE 100 Index | Dec 06 | 2,928,343 | 2,846,874 | 81,469 | ||||||||
| $ | 358,595 | ||||||||||||
The industry classification of portfolio holdings and other assets in excess of liabilities shown as a percentage of net assets as of October 31, 2006 was as follows:
Commercial Banks | 16.9 | % | |
Oil, Gas & Consumable Fuels | 7.7 | ||
Pharmaceuticals | 5.6 | ||
Insurance | 5.5 | ||
Metals & Mining | 4.7 | ||
Diversified Telecommunication Services | 3.8 | ||
Electric Utilities | 3.8 | ||
Automobiles | 3.6 | ||
Capital Markets | 3.4 | ||
Chemicals | 3.2 | ||
Machinery | 2.7 | ||
Food Products | 2.5 | ||
Diversified Financial Services | 2.4 | ||
Household Products | 2.2 | ||
Food & Staples Retailing | 2.0 | ||
Trading Companies & Distributors | 1.7 | ||
Wireless Telecommunication Services Total | 1.6 | ||
Semiconductors & Semiconductor Equipment | 1.4 | ||
Media | 1.3 | ||
Office Electronics | 1.3 | ||
Auto Components | 1.2 | ||
Beverages | 1.2 | ||
Construction & Engineering | 1.2 | ||
Real Estate Management & Development | 1.2 | ||
Building Products | 1.1 | ||
Leisure Equipment & Products | 1.1 | ||
Airlines | 1.0 | ||
Tobacco | 1.0 | ||
Industrial Conglomerates | 0.9 | ||
Construction Materials | 0.8 |
See Notes to Financial Statements.
| Dryden International Equity Fund | 19 |
Portfolio of Investments
as of October 31, 2006 Cont’d.
Multi-Utilities | 0.8 | ||
Health Care Providers & Services | 0.7 | ||
Transportation Infrastructure | 0.7 | ||
Communications Equipment | 0.6 | ||
Electrical Equipment | 0.6 | ||
Hotels Restaurants & Leisure | 0.6 | ||
Electronic Equipment & Instruments | 0.5 | ||
IT Services | 0.5 | ||
Road & Rail | 0.5 | ||
Consumer Finance | 0.4 | ||
Textiles, Apparel & Luxury Goods | 0.4 | ||
Affiliated Money Market Mutual Fund | 0.3 | ||
Distributors | 0.3 | ||
Energy Equipment & Services | 0.3 | ||
Gas Utilities | 0.3 | ||
Specialty Retail | 0.3 | ||
Commercial Services & Supplies | 0.2 | ||
Computers & Peripherals | 0.2 | ||
Marine | 0.2 | ||
Multiline Retail | 0.2 | ||
Real Estate Investment Trusts | 0.2 | ||
U.S. Government Security | 0.2 | ||
Water Utilities | 0.2 | ||
Independent Power Producers & Energy Traders | 0.1 | ||
Paper & Forest Products | 0.1 | ||
| 97.4 | |||
Other assets in excess of liabilities | 2.6 | ||
| 100.0 | % | ||
See Notes to Financial Statements.
| 20 | Visit our website at www.jennisondryden.com |
Financial Statements
| OCTOBER 31, 2006 | ANNUAL REPORT |
Dryden International Equity Fund
Statement of Assets and Liabilities
as of October 31, 2006
Assets | ||||
Investments, at value: | ||||
Unaffiliated investments (cost $286,622,035) | $ | 360,008,508 | ||
Affiliated investments (cost $1,098,621) | 1,098,621 | |||
Foreign currency, at value (cost $10,357,169) | 10,605,047 | |||
Cash | 15,691 | |||
Receivable for investments sold | 5,542,778 | |||
Receivable for Series shares sold | 632,672 | |||
Dividends receivable | 437,055 | |||
Foreign tax reclaim receivable | 231,135 | |||
Prepaid expenses | 7,540 | |||
Total assets | 378,579,047 | |||
Liabilities | ||||
Payable for investments purchased | 6,677,166 | |||
Payable for Series shares reacquired | 477,126 | |||
Management fee payable | 255,474 | |||
Accrued expenses | 120,758 | |||
Transfer agent fee payable | 106,363 | |||
Distribution fee payable | 64,078 | |||
Due to broker-variation margin | 23,195 | |||
Loan interest payable | 3,942 | |||
Deferred directors’ fees | 1,401 | |||
Total liabilities | 7,729,503 | |||
Net Assets | $ | 370,849,544 | ||
Net assets were comprised of: | ||||
Common stock, at par | $ | 434,342 | ||
Paid-in capital in excess of par | 442,769,723 | |||
| 443,204,065 | ||||
Undistributed net investment income | 4,159,706 | |||
Accumulated net realized loss on investments and foreign currency transactions | (150,507,608 | ) | ||
Net unrealized appreciation on investments and foreign currencies | 73,993,381 | |||
Net assets, October 31, 2006 | $ | 370,849,544 | ||
See Notes to Financial Statements.
| 22 | Visit our website at www.jennisondryden.com |
Class A | |||
Net asset value and redemption price per share | $ | 8.54 | |
Maximum sales charge (5.50% of offering price) | .50 | ||
Maximum offering price to public | $ | 9.04 | |
Class B | |||
Net asset value, offering price and redemption price per share | $ | 8.22 | |
Class C | |||
Net asset value, offering price and redemption price per share | $ | 8.22 | |
Class Z | |||
Net asset value, offering price and redemption price per share | $ | 8.62 | |
See Notes to Financial Statements.
| Dryden International Equity Fund | 23 |
Statement of Operations
Year Ended October 31, 2006
Net Investment Income | |||
Income | |||
Unaffiliated dividends (net of foreign withholding taxes of $913,682) | $ | 8,513,950 | |
Interest | 29,624 | ||
Affiliated dividend income | 15,113 | ||
Total income | 8,558,687 | ||
Expenses | |||
Management fee | 2,742,464 | ||
Distribution fee—Class A | 130,435 | ||
Distribution fee—Class B | 450,411 | ||
Distribution fee—Class C | 134,778 | ||
Transfer agent’s fees and expenses (including affiliated expense of $451,900) | 520,000 | ||
Custodian’s fees and expenses | 230,000 | ||
Reports to shareholders | 50,000 | ||
Legal fees and expenses | 41,000 | ||
Loan interest expense (Note 7) | 36,504 | ||
Registration fees | 30,000 | ||
Audit fee | 24,000 | ||
Directors’ fees | 13,000 | ||
Insurance | 4,000 | ||
Miscellaneous | 56,656 | ||
Total expenses | 4,463,248 | ||
Net investment income | 4,095,439 | ||
Realized And Unrealized Gain On Investments, Futures And Foreign Currency Transactions | |||
Net realized gain on: | |||
Investment transactions | 17,266,193 | ||
Foreign currency transactions | 349,458 | ||
Financial futures transactions | 1,388,426 | ||
| 19,004,077 | |||
Net change in unrealized appreciation on: | |||
Investments | 48,451,130 | ||
Foreign currencies | 276,224 | ||
Financial futures contracts | 203,926 | ||
| 48,931,280 | |||
Net gain on investments and foreign currency transactions | 67,935,357 | ||
Net Increase In Net Assets Resulting From Operations | $ | 72,030,796 | |
See Notes to Financial Statements.
| 24 | Visit our website at www.jennisondryden.com |
Statement of Changes in Net Assets
| Year Ended October 31, | ||||||||
| 2006 | 2005 | |||||||
Increase (Decrease) In Net Assets | ||||||||
Operations | ||||||||
Net investment income | $ | 4,095,439 | $ | 1,020,852 | ||||
Net realized gain on investments and foreign currency transactions | 19,004,077 | 7,870,480 | ||||||
Net change in unrealized appreciation on investments and foreign currencies | 48,931,280 | 12,079,554 | ||||||
Net increase in net assets resulting from operations | 72,030,796 | 20,970,886 | ||||||
Dividends from net investment income (Note 1) | ||||||||
Class A | (223,315 | ) | (236,028 | ) | ||||
Class B | — | (127,690 | ) | |||||
Class C | — | (41,462 | ) | |||||
Class Z | (1,403,752 | ) | (170,252 | ) | ||||
| (1,627,067 | ) | (575,432 | ) | |||||
Series share transactions (net of share conversions) (Note 6) | ||||||||
Net proceeds from shares sold | 103,089,748 | 200,114,155 | ||||||
Net asset value of shares issued in reinvestment of dividends | 1,617,011 | 549,984 | ||||||
Cost of shares reacquired | (78,038,521 | ) | (38,187,242 | ) | ||||
Net increase in net assets from Series share transactions | 26,668,238 | 162,476,897 | ||||||
Total increase | 97,071,967 | 182,872,351 | ||||||
Net Assets | ||||||||
Beginning of year | 273,777,577 | 90,905,226 | ||||||
End of year(a) | $ | 370,849,544 | $ | 273,777,577 | ||||
(a) Includes undistributed net investment income of: | $ | 4,159,706 | $ | 473,484 | ||||
See Notes to Financial Statements.
| Dryden International Equity Fund | 25 |
Notes to Financial Statements
Prudential World Fund, Inc. (the “Fund”) is registered under the Investment Company Act of 1940, as an open-end, diversified management investment company and currently consists of three series: Dryden International Equity Fund (the “Series”), Strategic Partners International Value Fund and Jennison Global Growth Fund. These financial statements relate to the Dryden International Equity Fund. The financial statements of the other series are not presented herein. The Series commenced investment operations in March 2000. The investment objective of the Series is to achieve long-term growth of capital. The Series seeks to achieve its objective primarily through investment in equity-related securities of foreign issuers.
Note 1. Accounting Policies
The following is a summary of significant accounting policies followed by the Fund and the Series in the preparation of its financial statements.
Securities Valuation: Securities listed on a securities exchange (other than options on securities and indices) are valued at the last sale price on such exchange on the day of valuation or, if there was no sale on such day, at the mean between the last reported bid and ask prices, or at the last bid price on such day in the absence of an asked price. Securities traded via Nasdaq are valued at the Nasdaq official closing price (NOCP) on the day of valuation, or if there was no NOCP, at the last sale price. Securities that are actively traded in the over-the-counter market, including listed securities for which the primary market is believed by Prudential Investments LLC (“PI” or “Manager”), in consultation with the subadvisers, to be over-the-counter, are valued at market value using prices provided by an independent pricing agent or principal market maker. Options on securities and indices traded on an exchange are valued at the last sale price as of the close of trading on the applicable exchange or, if there was no sale, at the mean between the most recently quoted bid and asked prices on such exchange. Futures contracts and options thereon traded on a commodities exchange or board of trade are valued at the last sale price at the close of trading on such exchange or board of trade or, if there was no sale on the applicable commodities exchange or board of trade on such day, at the mean between the most recently quoted bid and asked prices on such exchange or board of trade or at the last bid price in the absence of an asked price. Prices may be obtained from independent pricing services which use information provided by market makers or estimates of market values obtained from yield data relating to investments or securities with similar characteristics. Securities for which reliable market quotations are not readily available, or whose values have been affected by events occurring after the close of the security’s foreign market and before the Funds’ normal pricing
| 26 | Visit our website at www.jennisondryden.com |
time, are valued at fair value in accordance with the Board of Directors approved fair valuation procedures. When determining the fair valuation of securities some of the factors influencing the valuation include, the nature of any restrictions on disposition of the securities; assessment of the general liquidity of the securities; the issuer’s financial condition and the markets in which it does business; the cost of the investment; the size of the holding and the capitalization of issuer; the prices of any recent transactions or bids/offers for such securities or any comparable securities; any available analyst media or other reports or information deemed reliable by the investment adviser regarding the issuer or the markets or industry in which it operates. Using fair value to price securities may result in a value that is different from a security’s most recent closing price and from the price used by other mutual funds to calculate their net asset values. As of October 31, 2006, there were no securities valued in accordance with such procedures.
Investments in mutual funds are valued at their net asset value as of the close of the New York Stock Exchange on the date of valuation.
Short-term securities which mature in 60 days or less are valued at amortized cost, which approximates market value. The amortized cost method includes valuing a security at its cost on the date of purchase and thereafter assuming a constant amortization to maturity of the difference between the principal amount due at maturity and cost. Short-term securities that mature in more than 60 days are valued at current market quotations.
Foreign Currency Translation: The books and records of the Series are maintained in U.S. dollars. Foreign currency amounts are translated into U.S. dollars on the following basis:
(i) market value of investment securities, other assets and liabilities-at the current rates of exchange.
(ii) purchases and sales of investment securities, income and expenses-at the rate of exchange prevailing on the respective dates of such transactions.
Although the net assets of the Series are presented at the foreign exchange rates and market values at the close of the fiscal period, the Series does not isolate that portion of the results of operations arising as a result of changes in the foreign exchange rates from the fluctuations arising from changes in the market prices of long-term portfolio securities held at the end of the fiscal period. Similarly, the Series does not isolate the effect of changes in foreign exchange rates from the fluctuations arising from changes in the market prices of long-term portfolio securities sold during the fiscal period. Accordingly, realized foreign currency gains or losses are included in the reported net realized gains or losses on investment transactions.
| Dryden International Equity Fund | 27 |
Notes to Financial Statements
Cont’d
Net realized gains or losses on foreign currency transactions represent net foreign exchange gains or losses from holdings of foreign currencies, currency gains or losses realized between the trade and settlement dates on security transactions, and the difference between the amounts of dividends, interest and foreign withholding taxes recorded on the Series’ books and the U.S. dollar equivalent amounts actually received or paid. Net unrealized currency gains or losses from valuing foreign currency denominated assets and liabilities (other than investments) at period end exchange rates are reflected as a component of net unrealized appreciation (depreciation) on foreign currencies.
Foreign security and currency transactions may involve certain considerations and risks not typically associated with those of domestic origin as a result of, among other factors, the possibility of political or economic instability, or the level of governmental supervision and regulation of foreign securities markets.
Securities Transactions and Net Investment Income: Securities transactions are recorded on the trade date. Realized and unrealized gains or losses from security and currency transactions are calculated on the identified cost basis. Dividend income is recorded on the ex-dividend date and interest income is recorded on an accrual basis. Expenses are recorded on the accrual basis.
Net investment income or loss (other than distribution fees which are charged directly to the respective class) and unrealized and realized gains or losses are allocated daily to each class of shares based upon the relative proportion of net assets of each class at the beginning of the day.
Financial Futures Contracts: A financial futures contract is an agreement to purchase (long) or sell (short) an agreed amount of securities at a set price for delivery on a future date. Upon entering into a financial futures contract, the Fund is required to pledge to the broker an amount of cash and/or other assets equal to a certain percentage of the contract amount. This amount is known as the “initial margin.” Subsequent payments, known as “variation margin,” are made or received by the Fund each day, depending on the daily fluctuations in the value of the underlying security. Such variation margin is recorded for financial statement purposes on a daily basis as unrealized gain or loss. When the contract expires or is closed, the gain or loss is realized and is presented in the Statement of Operations as net realized gain or loss on financial futures transactions.
| 28 | Visit our website at www.jennisondryden.com |
The Fund invests in financial futures contracts in order to hedge its existing portfolio securities, or securities the Fund intends to purchase, against fluctuations in value caused by changes in prevailing interest rates or market conditions. Should interest rates move unexpectedly, the Fund may not achieve the anticipated benefits of the financial futures contracts and may realize a loss. The use of futures transactions involves the risk of imperfect correlation in movements in the price of futures contracts, interest rates and the underlying hedged assets.
Financial futures contracts involve elements of both market and credit risk in excess of the amounts reflected on the Statement of Assets and Liabilities.
Dividends and Distributions: The Series expects to pay dividends of net investment income and distributions of net realized capital and currency gains, if any, annually. Dividends and distributions to shareholders, which are determined in accordance with federal income tax regulations which may differ from generally accepted accounting principles, are recorded on the ex-dividend date.
Taxes: For federal income tax purposes, each series in the Fund is treated as a separate taxpaying entity. It is each Series’ policy to continue to meet the requirements of the Internal Revenue Code applicable to regulated investment companies and to distribute all of its taxable net investment income and capital gains, if any, to its shareholders. Therefore, no federal income tax provision is required.
Withholding taxes on foreign dividends are recorded net of reclaimable amounts, at the time the related income is earned.
Estimates: The preparation of the financial statements requires management to make estimates and assumptions that affect the reported amounts and disclosures in the financial statements. Actual results could differ from those estimates.
Note 2. Agreements
The Fund has a management agreement for the Series with PI. Pursuant to this agreement, PI has responsibility for all investment advisory services and supervises the subadviser’s performance of such services. PI entered into a subadvisory agreement with Quantitative Management Associates LLC (QMA). The subadvisory agreement provides that QMA furnishes investment advisory services in connection with the management of the Series. In connection therewith, QMA is obligated to keep certain books and records of the Series. PI pays for the services of QMA, the cost of compensation of officers of the Series, occupancy and certain clerical and bookkeeping costs of the Series. The Series bears all other costs and expenses.
| Dryden International Equity Fund | 29 |
Notes to Financial Statements
Cont’d
The management fee paid to PI is computed daily and payable monthly, at an annual rate of .85 of 1% of the average daily net assets of the Series up to and including $300 million, .75 of 1% of the average daily net assets in excess of $300 million up to and including $1.5 billion and .70 of 1% of the Series’ average daily net assets over $1.5 billion. PI contractually agreed to subsidize and or cap the annual operating expenses so that annual operation expenses (exclusive of distribution and service (12b-1) fees) do not exceed 1.25% of the Series net assets. The effective management fee was .84% for the year ended October 31, 2006.
The Series has a distribution agreement with Prudential Investment Management Services LLC (“PIMS”) which acts as the distributor of Class A, Class B, Class C and Class Z shares of the Series. The Series compensates PIMS for distributing and servicing the Series’ Class A, Class B and Class C shares, pursuant to a plan of distribution, (the “Class A, B and C Plans”), regardless of expenses actually incurred by PIMS. The distribution fees are accrued daily and payable monthly. No distribution or service fees are paid to PIMS as distributor for Class Z shares of the Series.
Pursuant to the Class A, B and C Plans, the Series compensates PIMS for distribution related activities at an annual rate of up to .30 of 1%, 1% and 1% of the average daily net assets of the Class A, B, and C shares, respectively. For the year ended October 31, 2006, PIMS contractually agreed to limit such fees to .25 of 1% of the average daily net assets of the Class A shares.
PIMS has advised the Series that they received approximately $166,500 in front-end sales charges resulting from sales of Class A shares during the year ended October 31, 2006. From these fees, PIMS paid such sales charges to broker-dealers, which in turn paid commissions to salespersons and incurred other distribution costs.
PIMS has advised the Series that for the year ended October 31, 2006 it received approximately $49,500 and $700 in contingent deferred sales charges imposed upon redemptions by certain Class B and Class C shareholders, respectively.
PI, QMA and PIMS are indirect, wholly-owned subsidiaries of Prudential Financial, Inc. (“Prudential”).
| 30 | Visit our website at www.jennisondryden.com |
Note 3. Other Transactions with Affiliates
Prudential Mutual Fund Services LLC (“PMFS”), an affiliate of PI and an indirect, wholly-owned subsidiary of Prudential, serves as the Fund’s transfer agent. Transfer agent’s fees and expenses in the Statement of Operations include certain out-of-pocket expenses paid to non-affiliates, where applicable.
The Series pays networking fees to affiliated and unaffiliated broker/dealers. These networking fees are payments made to broker/dealers that clear mutual fund transactions through a national clearing system. For the year ended October 31, 2006, the Series incurred approximately $88,800 in total networking fees. These amounts are included in transfer agent’s fees and expenses in the Statement of Operations.
The Series invests in the Taxable Money Market Series (the “Portfolio”), a portfolio of Dryden Core Investment Fund, pursuant to an exemptive order received from the Securities and Exchange Commission. The Portfolio is a money market mutual fund registered under the Investment Company Act of 1940, as amended, and managed by PI.
Note 4. Portfolio Securities
Purchases and sales of investment securities, other than short-term investments, for the year ended October 31, 2006 aggregated $218,290,306 and $188,756,319, respectively.
Note 5. Tax Information
Distributions to shareholders, which are determined in accordance with federal income tax regulations and which may differ from generally accepted accounting principles, are recorded on the ex-dividends date. In order to present undistributed net investment income (loss) and accumulated net realized gains (losses) on the Statement of Assets and Liabilities that more closely represent their tax character, certain adjustments have been made to undistributed net investment income and accumulated net realized loss on investment and foreign currency transactions. For the year ended October 31, 2006, the adjustments were to increase accumulated net realized loss on investments and foreign currency transactions and increase undistributed net investment income by $1,217,850 due to the difference in the treatment for book and tax purposes of certain transactions involving foreign currencies, passive foreign investment companies and other tax adjustments. Net investment income, net realized gains and net assets were not affected by this change.
| Dryden International Equity Fund | 31 |
Notes to Financial Statements
Cont’d
As of October 31, 2006, the Series had undistributed ordinary income on a tax basis of $4,757,216.
For the years ended October 31, 2006 and October 31, 2005, the tax character of dividends paid as reflected in the Statement of Changes in Net Assets were $1,627,067 and $575,432, respectively, from ordinary income.
For federal income tax purposes, the Series had a capital loss carryforward as of October 31, 2006, of approximately $150,193,000 of which $89,590,000 expires in 2009, $49,177,000 expires in 2010 and $11,426,000 expires in 2011. Accordingly, no capital gains distribution is expected to be paid to shareholders until net gains have been realized in excess of such carryforward. It is uncertain whether the Series will be able to realize the full benefit prior to the expiration date. In addition, the Fund utilized approximately $17,798,000 of its capital loss carryforward to offset net taxable gains realized in the fiscal year ended October 31, 2006.
The United States federal income tax basis of the Series’ investments and the net unrealized appreciation as of October 31, 2006 was as follows:
Tax Basis | Appreciation | Depreciation | Total Unrealized | |||
| $288,570,371 | $73,676,162 | $1,139,404 | $72,536,758 |
The difference between book and tax basis is primarily attributable to deferred losses on wash sales and market to market of open passive foreign investment companies.
Note 6. Capital
The Series offers Class A, Class B, Class C and Class Z shares. Class A shares are sold with a front-end sales charge of up to 5.50%. All investors who purchase Class A shares in an amount of $1 million or more and sell these shares within 12 months of purchase are subject to a contingent deferred sales charge (CDSC) of 1%, including investors who purchase their shares through broker-dealers affiliated with Prudential. Class B shares are sold with a contingent deferred sales charge which declines from 5% to zero depending on the period of time the shares are held. Class C shares are sold with a contingent deferred sales charge of 1% during the first 12 months. Class B shares will automatically convert to Class A shares on a quarterly basis approximately seven years after purchase. A special exchange privilege is also available for
| 32 | Visit our website at www.jennisondryden.com |
shareholders who qualify to purchase Class A shares at net asset value. Class Z shares are not subject to any sales or redemption charge and are offered exclusively for sale to a limited group of investors.
There are 500 million authorized shares of $.01 par value common stock, divided equally into four classes, designated Class A, Class B, Class C and Class Z common stock.
Class A | Shares | Amount | |||||
Year ended October 31, 2006: | |||||||
Shares sold | 3,802,085 | $ | 29,816,540 | ||||
Shares issued in reinvestment of dividends | 30,143 | 213,410 | |||||
Shares reacquired | (1,759,296 | ) | (13,709,402 | ) | |||
Net increase (decrease) in shares outstanding before conversion | 2,072,932 | 16,320,548 | |||||
Shares issued upon conversion from Class B | 181,369 | 1,385,391 | |||||
Net increase (decrease) in shares outstanding | 2,254,301 | $ | 17,705,939 | ||||
Year ended October 31, 2005: | |||||||
Shares sold | 3,075,587 | $ | 19,889,669 | ||||
Shares issued in reinvestment of dividends | 36,937 | 225,314 | |||||
Shares reacquired | (1,572,361 | ) | (10,149,806 | ) | |||
Net increase (decrease) in shares outstanding before conversion | 1,540,163 | 9,965,177 | |||||
Shares issued upon conversion from Class B | 221,923 | 1,443,849 | |||||
Net increase (decrease) in shares outstanding | 1,762,086 | $ | 11,409,026 | ||||
Class B | |||||||
Year ended October 31, 2006: | |||||||
Shares sold | 770,278 | $ | 5,842,750 | ||||
Shares issued in reinvestment of dividends | — | — | |||||
Shares reacquired | (1,449,171 | ) | (10,830,803 | ) | |||
Net increase (decrease) in shares outstanding before conversion | (678,893 | ) | (4,988,053 | ) | |||
Shares reacquired upon conversion into Class A | (187,762 | ) | (1,385,391 | ) | |||
Net increase (decrease) in shares outstanding | (866,655 | ) | $ | (6,373,444 | ) | ||
Year ended October 31, 2005: | |||||||
Shares sold | 967,336 | $ | 5,983,249 | ||||
Shares issued in reinvestment of dividends | 19,844 | 117,479 | |||||
Shares reacquired | (1,868,303 | ) | (11,619,512 | ) | |||
Net increase (decrease) in shares outstanding before conversion | (881,123 | ) | (5,518,784 | ) | |||
Shares reacquired upon conversion into Class A | (229,320 | ) | (1,443,849 | ) | |||
Net increase (decrease) in shares outstanding | (1,110,443 | ) | $ | (6,962,633 | ) | ||
| Dryden International Equity Fund | 33 |
Notes to Financial Statements
Cont’d
Class C | Shares | Amount | |||||
Year ended October 31, 2006: | |||||||
Shares sold | 441,017 | $ | 3,332,860 | ||||
Shares issued in reinvestment of dividends | — | — | |||||
Shares reacquired | (696,970 | ) | (5,231,728 | ) | |||
Net increase (decrease) in shares outstanding | (255,953 | ) | $ | (1,898,868 | ) | ||
Year ended October 31, 2005: | |||||||
Shares sold | 506,522 | $ | 3,138,890 | ||||
Shares issued in reinvestment of dividends | 6,489 | 38,417 | |||||
Shares reacquired | (1,037,995 | ) | (6,454,396 | ) | |||
Net increase (decrease) in shares outstanding | (524,984 | ) | $ | (3,277,089 | ) | ||
Class Z | |||||||
Year ended October 31, 2006: | |||||||
Shares sold | 8,110,954 | $ | 64,097,598 | ||||
Shares issued in reinvestment of dividends | 196,583 | 1,403,601 | |||||
Shares reacquired | (6,119,945 | ) | (48,266,588 | ) | |||
Net increase (decrease) in shares outstanding | 2,187,592 | $ | 17,234,611 | ||||
Year ended October 31, 2005: | |||||||
Shares sold* | 25,273,059 | $ | 171,102,347 | ||||
Shares issued in reinvestment of dividends | 27,443 | 168,774 | |||||
Shares reacquired | (1,454,474 | ) | (9,963,528 | ) | |||
Net increase (decrease) in shares outstanding | 23,846,028 | $ | 161,307,593 | ||||
| * | Includes 22,671,236 shares allotted pursuant to a subscription in kind transaction for $153,711,660. |
Note 7. Borrowing
The Series, along with other affiliated registered investment companies (the “Funds”), is a party to a Syndicated Credit Agreement (“SCA”) with two banks. The SCA provides for a commitment of $500 million. Interest on any borrowings under the SCA is incurred at contracted market rates and a commitment fee for the unused amount is accrued daily and paid quarterly. Effective October 27, 2006, the Funds renewed SCA with the banks. The commitment under the renewed SCA continues to be $500 million. The Funds pay a commitment fee of .07 of 1% of the unused portion of the renewed SCA. The expiration date of the renewed SCA will be October 26, 2007. For the period from October 29, 2005 through October 26, 2006, the Funds paid a commitment fee of .0725 of 1% of the unused portion of the agreement. The purpose of the SCA is to provide an alternative source of temporary funding for capital share redemptions.
| 34 | Visit our website at www.jennisondryden.com |
The Series utilized the line of credit during the year ended October 31, 2006. The average balance is for the number of days the Fund had an outstanding balance.
| Average Balance Outstanding | Number of Days Outstanding | Weighted Average Interest Rate | ||||
| $ | 1,631,396 | 136 | 5.70 | % | ||
The Series did not have any loans outstanding at year ended October 31, 2006.
Note 8. Subsequent Events
On December 8, 2006, the Board of Directors of the Fund declared the following dividends per share. Dividends are payable on December 13, 2006 to shareholders on record December 12, 2006.
| Class A | Class B | Class C | Class Z | |||||||||
Ordinary Income | $ | 0.132 | $ | 0.068 | $ | 0.068 | $ | 0.150 | ||||
Pursuant to a Plan of Reorganization approved by the shareholders of the Jennison Global Growth Fund, Inc., a series of the Prudential World Fund, the Series acquired the net assets of $409,484,903, of the Jennison Global Growth Fund, at the close of business on December 15, 2006. According to the terms of the merger, the shareholders of the Jennison Global Growth Fund were issued shares in the Series.
Note 9. New Accounting Pronouncements
On July 13, 2006, the Financial Accounting Standards Board (FASB) released FASB Interpretation No. 48 “Accounting for Uncertainty in Income Taxes” (FIN 48). FIN 48 provides guidance for how uncertain tax positions should be recognized, measured, presented and disclosed in the financial statements. FIN 48 requires the evaluation of tax positions taken or expected to be taken in the course of preparing the Fund’s tax returns to determine whether the tax positions are “more-likely-than-not” of being sustained by the applicable tax authority. The impact of the tax positions not deemed to meet the likely-than-not threshold would be recorded in the year in which they arise. Adoption of FIN 48 is required for fiscal years beginning after December 15, 2006 and interim periods within those fiscal years and is to be applied to all open tax years as of the effective date. At this time, management is evaluating the implications of FIN 48 and its impact, if any, in the financial statements has not yet been determined.
On September 20, 2006, the FASB released Statement of Financial Accounting Standards No. 157 “Fair Value Measurements” (FAS 157). FAS 157 establishes an authoritative definition of fair value, sets out a framework for measuring fair value, and requires additional disclosures about fair-value measurements. The application of FAS 157 is required for fiscal years beginning after November 15, 2007 and interim periods within those fiscal years. At this time, management is evaluating the implications of FAS 157 and its impact, if any, in the financial statements has not yet been determined.
| Dryden International Equity Fund | 35 |
Financial Highlights
| Class A | ||||
| Year Ended October 31, 2006 | ||||
Per Share Operating Performance: | ||||
Net Asset Value, Beginning Of Year | $ | 6.84 | ||
Income (loss) from investment operations: | ||||
Net investment income (loss) | .08 | |||
Net realized and unrealized gain (loss) on investment and foreign currency transactions | 1.66 | |||
Total from investment operations | 1.74 | |||
Less Dividends: | ||||
Dividends from net investment income | (.04 | ) | ||
Net asset value, end of year | $ | 8.54 | ||
Total Return(a): | 25.55 | % | ||
Ratios/Supplemental Data: | ||||
Net assets, end of year (000) | $ | 67,123 | ||
Average net assets (000) | $ | 52,174 | ||
Ratios to average net assets: | ||||
Expenses, including distribution and service (12b-1) fees(b) | 1.40 | % | ||
Expenses, excluding distribution and service (12b-1) fees | 1.15 | % | ||
Net investment income (loss) | 1.23 | % | ||
For Class A, B, C and Z shares: | ||||
Portfolio turnover rate | 60 | % | ||
| (a) | Total return does not consider the effects of sales loads. Total return is calculated assuming a purchase of shares on the first day and a sale on the last day of each year reported, and includes reinvestment of dividends and distributions. |
| (b) | The distributor of the Series has contractually agreed to limit its distribution and service (12b-1) fees to .25 of 1% of the average daily net assets of the Class A shares. |
| (c) | Net of expense subsidy. If the investment manager had not subsidized expenses, the expense ratios (both including and excluding distribution and service (12b-1) fees) and the net investment income ratios would have been 1.68%, 1.43% and 1.02%, respectively for the year ended October 31, 2005. |
See Notes to Financial Statements.
| 36 | Visit our website at www.jennisondryden.com |
| Class A | ||||||||||||||
| Year Ended October 31, | ||||||||||||||
| 2005 | 2004 | 2003 | 2002 | |||||||||||
| $ | 5.75 | $ | 4.84 | $ | 3.74 | $ | 4.37 | |||||||
| .06 | .03 | (.02 | ) | (.02 | ) | |||||||||
| 1.09 | .88 | 1.12 | (.61 | ) | ||||||||||
| 1.15 | .91 | 1.10 | (.63 | ) | ||||||||||
| (.06 | ) | — | — | — | ||||||||||
| $ | 6.84 | $ | 5.75 | $ | 4.84 | $ | 3.74 | |||||||
| 20.13 | % | 18.80 | % | 29.41 | % | (14.42 | )% | |||||||
| $ | 38,323 | $ | 22,103 | $ | 20,050 | $ | 19,414 | |||||||
| $ | 30,177 | $ | 20,760 | $ | 18,650 | $ | 25,360 | |||||||
| 1.57 | %(c) | 2.02 | % | 2.13 | % | 1.88 | % | |||||||
| 1.32 | %(c) | 1.77 | % | 1.88 | % | 1.63 | % | |||||||
| 1.13 | %(c) | .64 | % | (.36 | )% | (.56 | )% | |||||||
| 41 | % | 100 | % | 157 | % | 108 | % | |||||||
See Notes to Financial Statements.
| Dryden International Equity Fund | 37 |
Financial Highlights
Cont’d
| Class B | ||||
| Year Ended October 31, 2006 | ||||
Per Share Operating Performance: | ||||
Net Asset Value, Beginning Of Year | $ | 6.59 | ||
Income (loss) from investment operations: | ||||
Net investment income (loss) | .04 | |||
Net realized and unrealized gain (loss) on investment and foreign currency transactions | 1.59 | |||
Total from investment operations | 1.63 | |||
Less Dividends: | ||||
Dividends from net investment income | — | |||
Net asset value, end of year | $ | 8.22 | ||
Total Return(a): | 24.73 | % | ||
Ratios/Supplemental Data: | ||||
Net assets, end of year (000) | $ | 46,330 | ||
Average net assets (000) | $ | 45,041 | ||
Ratios to average net assets: | ||||
Expenses, including distribution and service (12b-1) fees | 2.15 | % | ||
Expenses, excluding distribution and service (12b-1) fees | 1.15 | % | ||
Net investment income (loss) | .46 | % | ||
| (a) | Total return does not consider the effects of sales loads. Total return is calculated assuming a purchase of shares on the first day and a sale on the last day of each year reported, and includes reinvestment of dividends and distributions. |
| (b) | Net of expense subsidy. If the investment manager had not subsidized expenses, the expense ratios (both including and excluding distribution and service (12b-1) fees) and the net investment income ratios would have been 2.43%, 1.43% and .28%, respectively for the year ended October 31, 2005. |
See Notes to Financial Statements.
| 38 | Visit our website at www.jennisondryden.com |
| Class B | ||||||||||||||
| Year Ended October 31, | ||||||||||||||
| 2005 | 2004 | 2003 | 2002 | |||||||||||
| $ | 5.55 | $ | 4.71 | $ | 3.66 | $ | 4.32 | |||||||
| .02 | (.01 | ) | (.05 | ) | (.07 | ) | ||||||||
| 1.04 | .85 | 1.10 | (.59 | ) | ||||||||||
| 1.06 | .84 | 1.05 | (.66 | ) | ||||||||||
| (.02 | ) | — | — | — | ||||||||||
| $ | 6.59 | $ | 5.55 | $ | 4.71 | $ | 3.66 | |||||||
| 19.08 | % | 17.83 | % | 28.34 | % | (15.05 | )% | |||||||
| $ | 42,878 | $ | 42,252 | $ | 40,587 | $ | 37,059 | |||||||
| $ | 44,159 | $ | 42,334 | $ | 35,399 | $ | 49,086 | |||||||
| 2.32 | %(b) | 2.77 | % | 2.88 | % | 2.63 | % | |||||||
| 1.32 | %(b) | 1.77 | % | 1.88 | % | 1.63 | % | |||||||
| .37 | %(b) | (.11 | )% | (1.14 | )% | (1.30 | )% | |||||||
See Notes to Financial Statements.
| Dryden International Equity Fund | 39 |
Financial Highlights
Cont’d
| Class C | ||||
| Year Ended October 31, 2006 | ||||
Per Share Operating Performance: | ||||
Net Asset Value, Beginning Of Year | $ | 6.59 | ||
Income (loss) from investment operations: | ||||
Net investment income (loss) | .04 | |||
Net realized and unrealized gain (loss) on investment and foreign currency transactions | 1.59 | |||
Total from investment operations | 1.63 | |||
Less Dividends: | ||||
Dividends from net investment income | — | |||
Net asset value, end of year | $ | 8.22 | ||
Total Return(a): | 24.73 | % | ||
Ratios/Supplemental Data: | ||||
Net assets, end of year (000) | $ | 13,825 | ||
Average net assets (000) | $ | 13,478 | ||
Ratios to average net assets: | ||||
Expenses, including distribution and service (12b-1) fees | 2.15 | % | ||
Expenses, excluding distribution and service (12b-1) fees | 1.15 | % | ||
Net investment income (loss) | .47 | % | ||
| (a) | Total return does not consider the effects of sales loads. Total return is calculated assuming a purchase of shares on the first day and a sale on the last day of each year reported, and includes reinvestment of dividends and distributions. |
| (b) | Net of expense subsidy. If the investment manager had not subsidized expenses, the expense ratios (both including and excluding distribution and service (12b-1) fees) and the net investment income ratios would have been 2.43%, 1.43% and .28%, respectively for the year ended October 31, 2005. |
See Notes to Financial Statements.
| 40 | Visit our website at www.jennisondryden.com |
| Class C | ||||||||||||||
| Year Ended October 31, | ||||||||||||||
| 2005 | 2004 | 2003 | 2002 | |||||||||||
| $ | 5.55 | $ | 4.71 | $ | 3.66 | $ | 4.32 | |||||||
| �� | ||||||||||||||
| .02 | (.01 | ) | (.05 | ) | (.08 | ) | ||||||||
| 1.04 | .85 | 1.10 | (.58 | ) | ||||||||||
| 1.06 | .84 | 1.05 | (.66 | ) | ||||||||||
| (.02 | ) | — | — | — | ||||||||||
| $ | 6.59 | $ | 5.55 | $ | 4.71 | $ | 3.66 | |||||||
| 19.08 | % | 17.83 | % | 28.34 | % | (15.05 | )% | |||||||
| $ | 12,779 | $ | 13,669 | $ | 14,006 | $ | 13,906 | |||||||
| $ | 13,700 | $ | 13,956 | $ | 12,640 | $ | 19,770 | |||||||
| 2.32 | %(b) | 2.77 | % | 2.88 | % | 2.63 | % | |||||||
| 1.32 | %(b) | 1.77 | % | 1.88 | % | 1.63 | % | |||||||
| .37 | %(b) | (.12 | )% | (1.14 | )% | (1.33 | )% | |||||||
See Notes to Financial Statements.
| Dryden International Equity Fund | 41 |
Financial Highlights
Cont’d
| Class Z | ||||
| Year Ended October 31, 2006 | ||||
Per Share Operating Performance: | ||||
Net Asset Value, Beginning Of Year | $ | 6.90 | ||
Income (loss) from investment operations: | ||||
Net investment income (loss) | .12 | |||
Net realized and unrealized gain (loss) on investment and foreign currency transactions | 1.65 | |||
Total from investment operations | 1.77 | |||
Less Dividends: | ||||
Dividends from net investment income | (.05 | ) | ||
Net asset value, end of year | $ | 8.62 | ||
Total Return(a): | 25.86 | % | ||
Ratios/Supplemental Data: | ||||
Net assets, end of year (000) | $ | 243,572 | ||
Average net assets (000) | $ | 214,969 | ||
Ratios to average net assets: | ||||
Expenses, including distribution and service (12b-1) fees | 1.15 | % | ||
Expenses, excluding distribution and service (12b-1) fees | 1.15 | % | ||
Net investment income (loss) | 1.48 | % | ||
| (a) | Total return is calculated assuming a purchase of shares on the first day and a sale on the last day of each year reported, and includes reinvestment of dividends and distributions. |
| (b) | Net of expense subsidy. If the investment manager had not subsidized expenses, the expense ratios (both including and excluding distribution and service (12b-1) fees) and the net investment income ratios would have been 1.43%, 1.43% and .73%, respectively for the year ended October 31, 2005. |
See Notes to Financial Statements.
| 42 | Visit our website at www.jennisondryden.com |
| Class Z | ||||||||||||||
| Year Ended October 31, | ||||||||||||||
| 2005 | 2004 | 2003 | 2002 | |||||||||||
| $ | 5.80 | $ | 4.88 | $ | 3.76 | $ | 4.39 | |||||||
| .05 | .03 | (.01 | ) | (.02 | ) | |||||||||
| 1.12 | .89 | 1.13 | (.61 | ) | ||||||||||
| 1.17 | .92 | 1.12 | (.63 | ) | ||||||||||
| (.07 | ) | — | — | — | ||||||||||
| $ | 6.90 | $ | 5.80 | $ | 4.88 | $ | 3.76 | |||||||
| 20.40 | % | 18.85 | % | 29.79 | % | (14.35 | )% | |||||||
| $ | 179,798 | $ | 12,881 | $ | 3,699 | $ | 6,049 | |||||||
| $ | 53,026 | $ | 7,103 | $ | 3,533 | $ | 7,665 | |||||||
| 1.32 | %(b) | 1.77 | % | 1.88 | % | 1.63 | % | |||||||
| 1.32 | %(b) | 1.77 | % | 1.88 | % | 1.63 | % | |||||||
| .88 | %(b) | .81 | % | (.31 | )% | (.22 | )% | |||||||
See Notes to Financial Statements.
| Dryden International Equity Fund | 43 |
Report of Independent Registered Public Accounting Firm
The Board of Directors and Shareholders of Prudential World Fund, Inc.—Dryden International Equity Fund:
We have audited the accompanying statement of assets and liabilities of the Prudential World Fund, Inc.—Dryden International Equity Fund (one of the portfolios constituting the Prudential World Fund, Inc., hereafter referred to as the “Fund”), including the portfolio of investments, as of October 31, 2006, and the related statement of operations for the year then ended, the statement of changes in net assets for each of the years in the two-year period then ended, and the financial highlights for each of years in the three-year period then ended. These financial statements and financial highlights are the responsibility of the Fund’s management. Our responsibility is to express an opinion on these financial statements and financial highlights based on our audits. The Financial highlights for the years presented prior to the year ended October 31, 2004, were audited by another independent registered public accounting firm, whose report dated December 22, 2003, expressed an unqualified opinion thereon.
We conducted our audits in accordance with the standards of the Public Company Accounting Oversight Board (United States). Those standards require that we plan and perform the audit to obtain reasonable assurance about whether the financial statements and financial highlights are free of material misstatement. An audit includes examining, on a test basis, evidence supporting the amounts and disclosures in the financial statements. Our procedures included confirmation of securities owned as of October 31, 2006, by correspondence with the custodian and brokers or by other appropriate auditing procedures where replies from brokers were not received. An audit also includes assessing the accounting principles used and significant estimates made by management, as well as evaluating the overall financial statement presentation. We believe that our audits provide a reasonable basis for our opinion.
In our opinion, the financial statements and financial highlights referred to above present fairly, in all material respects, the financial position of the Fund as of October 31, 2006, and the results of its operations for the year then ended, the changes in its net assets for each of the years in the two-year period then ended, and the financial highlights for each of the years in the three-year period then ended, in conformity with U.S. generally accepted accounting principles.
KPMG LLP
New York, New York
December 22, 2006
| 44 | Visit our website at www.jennisondryden.com |
Federal Income Tax Information
(Unaudited)
As required by the Internal Revenue Code, we wish to advise you as to the federal status of dividends paid by the Series during its fiscal year ended October 31, 2006.
During the fiscal year ended October 31, 2006, the Series paid dividends taxable as ordinary income of $0.03927 for Class A shares and $0.05347 for Class Z shares.
Further, we wish to advise you that 4.14% of ordinary income dividends paid during the fiscal year ended October 31, 2006 qualified for the corporate dividends received deduction available to corporate taxpayers.
For the fiscal year ended October 31, 2006, the Series designated 100.0% as qualified dividend income for the reduced tax rate under the Jobs and Growth Tax Reconciliation Act of 2003.
The Series has elected to give the benefit of foreign tax credits to its shareholders. Accordingly, shareholders who must report their gross income dividends and distributions in a federal tax return will be entitled to a foreign tax credit, or an itemized deduction, in computing their U.S. income tax liability. It is generally more advantageous to claim a credit rather than to take a deduction. For the fiscal year ended October 31, 2006, the Fund intends on passing through $887,698 of ordinary income distributions as a foreign tax credit based on foreign source income of $8,496,370.
For purposes of preparing your federal income tax return, however, you should report the amounts as reflected on the appropriate Form 1099-DIV or substitute Form 1099-DIV which you should receive in January 2007.
| Dryden International Equity Fund | 45 |
Management of the Fund
(Unaudited)
Information pertaining to the Directors of the Prudential World Fund, Inc./the Dryden International Equity Fund (the “Fund”) is set forth below. Directors who are not deemed to be “interested persons” of the Fund, as defined in the Investment Company Act of 1940 as amended, (the 1940 Act) are referred to as “Independent Directors.” Directors who are deemed to be “interested persons” of the Fund are referred to as “Interested Directors.” “Fund Complex”† consists of the Fund and any other investment companies managed by PI.
Independent Directors(2)
Linda W. Bynoe (54), Director since 2005(3) Oversees 82 portfolios in Fund complex
Principal occupations (last 5 years): President and Chief Executive Officer (since March 1995) of Telemat, Ltd. (management consulting); formerly Vice President at Morgan Stanley & Co.
Other Directorships held: Director of Simon Property Group, Inc. (real estate investment trust) (since May 2003); Anixter International (communication products distributor) (since January 2006); Director of Northern Trust Corporation (since April 2006).
David E.A. Carson (72), Director since 2003(3) Oversees 86 portfolios in Fund complex
Principal occupations (last 5 years): Formerly Director (January 2000-May 2000), Chairman (January 1999-December 1999), Chairman and Chief Executive Officer (January 1998-December 1998) and President, Chairman and Chief Executive Officer of People’s Bank (1983-1997).
Robert E. La Blanc (72), Director since 1984(3) Oversees 85 portfolios in Fund complex
Principal occupations (last 5 years): President (since 1981) of Robert E. La Blanc Associates, Inc. (telecommunications).
Other Directorships held:(4) Director of Chartered Semiconductor Manufacturing, Ltd. (since 1998); Computer Associates International, Inc. (since 2002) (software company); FiberNet Telecom Group, Inc. (since 2003) (telecom company).
Douglas H. McCorkindale (67), Director since 2003(3) Oversees 85 portfolios in Fund complex
Principal occupations (last 5 years): Formerly Chairman (February 2001- June 2006), Chief Executive Officer (June 2000-July 2005), President (September 1997-July 2005) and Vice Chairman (March 1984-May 2000) of Gannett Co. Inc. (publishing and media).
Other Directorships held:(4) Director of Continental Airlines, Inc. (since May 1993); Director of Lockheed Martin Corp. (aerospace and defense) (since May 2001).
Richard A. Redeker (63), Director since 2003(3) Oversees 85 portfolios in Fund complex
Principal occupations (last 5 years): Management Consultant; Director (since 2001) and Chairman of the Board (since 2006) of Invesmart, Inc.; Director of Penn Tank Lines, Inc. (since 1999).
Robin B. Smith (67), Director since 1996(3) Oversees 85 portfolios in Fund complex
Principal occupations (last 5 years): Chairman of the Board (since January 2003) of Publishers Clearing House (direct marketing); formerly Chairman and Chief Executive Officer (August 1996-January 2003) of Publishers Clearing House.
Other Directorships held:(4) Director of BellSouth Corporation (since 1992).
| 46 | Visit our website at www.jennisondryden.com |
Stephen G. Stoneburn (63), Director since 1996(3) Oversees 85 portfolios in Fund complex
Principal occupations (last 5 years): President and Chief Executive Officer (since June 1996) of Quadrant Media Corp. (publishing company); formerly President (June 1995-June 1996) of Argus Integrated Media, Inc.; Senior Vice President and Managing Director (January 1993-1995) of Cowles Business Media; Senior Vice President of Fairchild Publications, Inc. (1975-1989).
Clay T. Whitehead (68), Director since 1984(3) Oversees 85 portfolios in Fund complex
Principal occupations (last 5 years): President (since 1983) of YCO (new business development firm).
Interested Directors(1)
Judy A. Rice (58), President since 2003 and Director since 2000(3) Oversees 81 portfolios in Fund complex
Principal occupations (last 5 years): President, Chief Executive Officer, Chief Operating Officer and Officer-In-Charge (since February 2003) of Prudential Investments LLC; Vice President (since February 1999) of Prudential Investment Management Services LLC; President, Chief Executive Officer and Officer-In-Charge (since April 2003) of Prudential Mutual Fund Services LLC; formerly Director (May 2003-March 2006) and Executive Vice President (June 2005-March 2006) of American Skandia Investment Services, Inc.; formerly Executive Vice President (September 1999-February 2003) of Prudential Investments LLC; Member of Board of Governors of the Investment Company Institute.
Robert F. Gunia (60), Vice President and Director since 1996(3) Oversees 158 portfolios in Fund complex
Principal occupations (last 5 years): Chief Administrative Officer (since September 1999) and Executive Vice President (since December 1996) of Prudential Investments LLC; President (since April 1999) of Prudential Investment Management Services LLC; Executive Vice President (since March 1999) and Treasurer (since May 2000) of Prudential Mutual Fund Services LLC; Chief Administrative Officer, Executive Vice President and Director (since May 2003) of American Skandia Investment Services, Inc.
Other Directorships held:(4) Vice President and Director (since May 1989) and Treasurer (since 1999) of The Asia Pacific Fund, Inc.
Information pertaining to the Officers of the Fund who are not also Directors is set forth below.
Officers(2)
Kathryn L. Quirk (54), Chief Legal Officer since 2005(3)
Principal occupations (last 5 years): Vice President and Corporate Counsel (since September 2004) of Prudential; Executive Vice President, Chief Legal Officer and Secretary (since July 2005) of Prudential Investments LLC and Prudential Mutual Fund Services LLC; formerly Managing Director, General Counsel, Chief Compliance Officer, Chief Risk Officer and Corporate Secretary (1997-2002) of Zurich Scudder Investments, Inc.
Deborah A. Docs (48), Secretary since 2005(3)
Principal occupations (last 5 years): Vice President and Corporate Counsel (since January 2001) of Prudential; Vice President (since December 1996) and Assistant Secretary (since March 1999) of PI; formerly Vice President and Assistant Secretary (May 2003-June 2005) of American Skandia Investment Services, Inc.
Jonathan D. Shain (48), Assistant Secretary since 2005(3)
Principal occupations (last 5 years): Vice President and Corporate Counsel (since August 1998) of Prudential; Vice President and Assistant Secretary (since May 2001) of PI; Vice President and Assistant Secretary (since February 2001) of PMFS; formerly Vice President and Assistant Secretary (May 2003-June 2005) of American Skandia Investment Services, Inc.
| Dryden International Equity Fund | 47 |
Claudia DiGiacomo (32), Assistant Secretary since 2005(3)
Principal occupations (last 5 years): Vice President and Corporate Counsel (since January 2005) of Prudential; Vice President and Assistant Secretary of PI (since December 2005); Associate at Sidley Austin Brown & Wood LLP (1999-2004).
Lee D. Augsburger (47), Chief Compliance Officer since 2004(3)
Principal occupations (last 5 years): Senior Vice President and Chief Compliance Officer (since April 2003) of PI; Vice President (since November 2000) and Chief Compliance Officer (since October 2000) of Prudential Investment Management, Inc.; Chief Compliance Officer and Senior Vice President (since May 2003) of American Skandia Investment Services, Inc.
Grace C. Torres (47), Treasurer and Principal Financial and Accounting Officer since 1995(3)
Principal occupations (last 5 years): Assistant Treasurer (since March 1999) and Senior Vice President (since September 1999) of PI; Assistant Treasurer (since May 2003) and Vice President (since June 2005) of American Skandia Investment Services, Inc.; Senior Vice President and Assistant Treasurer (since May 2003) of American Skandia Advisory Services, Inc.; formerly Senior Vice President (May 2003-June 2005) of American Skandia Investment Services, Inc.
John P. Schwartz (35), Assistant Secretary since 2006(3)
Principal occupations (last 5 years): Vice President and Corporate Counsel (since April 2005) of Prudential; Vice President and Assistant Secretary of PI (since December 2005); Associate at Sidley, Austin Brown & Wood LLP (1997-2005).
M. Sadiq Peshimam (42), Assistant Treasurer since 2006(3)
Principal occupations (last 5 years): Vice President (since 2005) and Director (2000-2005) within Prudential Mutual Fund Administration.
Jack Benintende (42), Assistant Treasurer since 2006(3)
Principal occupations (last 5 years): Vice President (since June 2000) within Prudential Mutual Fund Administration; formerly Senior Manager within the investment management practice of PricewaterhouseCoopers LLP (May 1994 through June 2000).
Andrew R. French (43), Assistant Secretary (since October 2006)(3)
Principal occupations (last 5 years): Director and Corporate Counsel (since May 2006) of Prudential; formerly Senior Legal Analyst of Prudential Mutual Fund Law Department (1997-2006).
Noreen M. Fierro (42), Anti-Money Laundering Compliance Officer (since October 2006)(3)
Principal occupations (last 5 years): Vice President, Corporate Compliance (since May 2006) of Prudential; formerly Corporate Vice President, Associate General Counsel (April 2002-May 2005) of UBS Financial Services, Inc., in their Money Laundering Prevention Group; Senior Manager (May 2005-May 2006) of Deloitte Financial Advisory Services, LLP, in their Forensic and Dispute Services, Anti-Money Laundering Group.
| 48 | Visit our website at www.jennisondryden.com |
| † | The Fund Complex consists of all investment companies managed by PI. The Funds for which PI serves as manager include Jennison Dryden Mutual Funds, Strategic Partners Funds, The Prudential Variable Contract Accounts 2, 10, 11. The Target Portfolio Trust, The Prudential Series Fund, The High Yield Income Fund, Inc., The High Yield Plus Fund, Inc., Nicholas-Applegate Fund, Inc., American Skandia Trust, and Prudential’s Gibraltar Fund, Inc. |
| (1) | “Interested” Directors, as defined in the 1940 Act, by reason of employment with the Manager, a Subadvisor or the Distributor. |
| (2) | Unless otherwise noted, the address of the Directors and Officers is c/o: Prudential Investments LLC, Gateway Center Three, 100 Mulberry Street, Newark, NJ 07102. |
| (3) | There is no set term of office for Directors and Officers. The Independent Directors have adopted a retirement policy, which calls for the retirement of Directors on December 31 of the year in which they reach the age of 75. The table shows the individual’s length of service as Directors and/or Officer. |
| (4) | This includes only directorships of companies required to register, or file reports with the SEC under the Securities and Exchange Act of 1934 (that is, “public companies”) or other investment companies registered under the 1940 Act. |
Additional Information about the Directors is included in the Statement of Additional Information which is available without charge, upon request, by calling (800) 521-7466 or (732) 482-7555 (Calling from outside the U.S.)
| Dryden International Equity Fund | 49 |
Approval of Advisory Agreements
The Board of Directors (the “Board”) of Prudential World Fund, Inc. oversees the management of the Dryden International Equity Fund (the “Fund”) and, as required by law, determines annually whether to renew the Fund’s management agreement with Prudential Investments LLC (“PI”) and the Fund’s subadvisory agreement with Quantitative Management Associates LLC (“QMA”). In considering the renewal of the agreements, the Board, including all of the Independent Directors, met on June 7-8, 2006 and approved the renewal of the agreements through July 31, 2007, after concluding that renewal of the agreements was in the best interests of the Fund and its shareholders.
In advance of the meetings, the Board received materials relating to the agreements, and had the opportunity to ask questions and request further information in connection with their consideration. Among other things, the Board considered comparisons with other mutual funds in relevant Peer Universes and Peer Groups. The mutual funds included in each Peer Universe or Peer Group were objectively determined solely by Lipper Inc., an independent provider of mutual fund data. The comparisons placed the Fund in various quartiles over one-year, three-year and five-year time periods ending December 31, with the first quartile being the best 25% of the mutual funds (for performance, the best performing mutual funds and, for expenses, the lowest cost mutual funds).
In approving the agreements, the Board, including the Independent Directors advised by independent legal counsel, considered the factors they deemed relevant, including the nature, quality and extent of services provided, the performance of the Fund, the profitability of PI and its affiliates, expenses and fees, and the potential for economies of scale that may be shared with the Fund and its shareholders. In their deliberations, the Directors did not identify any single factor that was dispositive and each Director attributed different weights to the various factors. In connection with their deliberations, the Board considered information provided by PI throughout the year at regular Board meetings, presentations from portfolio managers and other information, as well as information furnished at or in advance of the meetings on June 7-8, 2006.
The Directors determined that the overall arrangements between the Fund and PI, which serves as the Fund’s investment manager pursuant to a management agreement, and between PI and QMA, which serves as the Fund’s subadviser pursuant to the terms of a subadvisory agreement with PI, are fair and reasonable in light of the services performed, fees charged and such other matters as the Directors considered relevant in the exercise of their business judgment.
Several of the material factors and conclusions that formed the basis for the Directors reaching their determinations to approve the continuance of the agreements are separately discussed below.
| Dryden International Equity Fund |
Approval of Advisory Agreements (continued)
Nature, Quality and Extent of Services
The Board received and considered information regarding the nature and extent of services provided to the Fund by PI and QMA. The Board considered the services provided by PI, including but not limited to the oversight of the subadviser for the Fund, as well as the provision of fund recordkeeping, compliance, and other services to the Fund. With respect to PI’s oversight of the subadviser, the Board noted that PI’s Strategic Investment Research Group (“SIRG”), which is a business unit of PI, is responsible for monitoring and reporting to PI’s senior management on the performance and operations of the subadviser. The Board also considered that PI pays the salaries of all of the officers and non-independent Directors of the Fund. The Board also considered the investment subadvisory services provided by QMA, as well as adherence to the Fund’s investment restrictions and compliance with applicable Fund policies and procedures.
The Board reviewed the qualifications, backgrounds and responsibilities of PI’s senior management responsible for the oversight of the Fund and QMA, and also reviewed the qualifications, backgrounds and responsibilities of QMA’s portfolio managers who are responsible for the day-to-day management of the Fund’s portfolio. The Board was provided with information pertaining to PI’s and QMA’s organizational structure, senior management, investment operations, and other relevant information pertaining to both PI and QMA. The Board also noted that it received favorable compliance reports from the Fund’s Chief Compliance Officer (“CCO”) as to both PI and QMA. The Board noted that QMA is affiliated with PI.
The Board concluded that it was satisfied with the nature, extent and quality of the investment management services provided by PI and the subadvisory services provided to the Fund by QMA, and that there was a reasonable basis on which to conclude that the Fund benefits from the services provided by PI and QMA under the management and subadvisory agreements.
Performance of Dryden International Equity Fund
The Board received and considered information about the Fund’s historical performance, noting that the Fund had achieved performance that was in the third quartile over a one-year period, the first quartile over a three-year period, and performance that was in the fourth quartile over a five-year period ending December 31 in relation to the group of comparable funds in a Peer Universe.
The Board expressed disappointment in the Fund’s inconsistent performance, but noted that the Fund’s current subadviser had assumed responsibility for managing the Fund in December 2003, and that the Fund had outperformed against its benchmark
| Visit our website at www.jennisondryden.com |
index since then. The Board determined that it was reasonable to approve the continuance of the management and subadvisory agreements and to continue to evaluate the Fund’s ongoing performance.
Fees and Expenses
The Board considered the management fee for the Fund as compared to the management fee charged by PI to other funds and accounts and the fee charged by other advisers to comparable mutual funds.
The Fund’s management fee ranked in the first quartile in its Peer Group, and was the lowest management fee charged among all of the mutual funds included in the Fund’s Peer Group. The Board concluded that the management and subadvisory fees were reasonable.
The Board further noted that during 2005 and continuing through 2006, several initiatives had commenced which, when fully implemented, were expected to result in cost savings and expense reductions for the Fund.
Costs of Services and Profits Realized by PI
The Board was provided with information on the profitability of PI and its affiliates in serving as the Fund’s investment manager. The Board discussed with PI the methodology utilized in assembling the information regarding profitability and considered its reasonableness. The Board recognized that it is difficult to make comparisons of profitability from fund management contracts because comparative information is not generally publicly available and is affected by numerous factors, including the structure of the particular adviser, the types of funds it manages, its business mix, numerous assumptions regarding allocations and the adviser’s capital structure and cost of capital. Taking these factors into account, the Board concluded that the profitability of PI and its affiliates in relation to the services rendered was not unreasonable. The Board did not separately consider the profitability of the subadviser, an affiliate of PI, as its profitability was reflected in the profitability report for PI. Taking these factors into account, the Board concluded that the profitability of PI and its affiliates in relation to the services rendered was not unreasonable.
Economies of Scale
The Board noted that the management fee schedule for the Fund includes breakpoints, which have the effect of decreasing the fee rate as assets increase, but at the current level of assets the Fund does not realize the effect of those rate reductions. The Board received and discussed information concerning whether PI realizes
| Dryden International Equity Fund |
Approval of Advisory Agreements (continued)
economies of scale as the Fund’s assets grow beyond current levels. The Board took note that the Fund’s fee structure would result in benefits to Fund shareholders when (and if) assets reach the levels at which the fee rate is reduced. These benefits will accrue whether or not PI is then realizing any economies of scale.
Other Benefits to PI and QMA
The Board considered potential ancillary benefits that might be received by PI and QMA and their affiliates as a result of their relationship with the Fund. The Board concluded that potential benefits to be derived by PI included brokerage commissions received by affiliates of PI, transfer agency fees received by the Fund’s transfer agent (which is affiliated with PI), as well as reputational or other intangible benefits resulting from PI’s association with the Fund. The Board concluded that the potential benefits to be derived by QMA included its ability to use soft dollar credits, brokerage commissions received by affiliates of QMA, as well as the potential benefits consistent with those generally resulting from an increase in assets under management, specifically, potential access to additional research resources and reputational benefits. The Board concluded that the benefits derived by PI and QMA were consistent with the types of benefits generally derived by investment managers and subadvisers to mutual funds.
| Visit our website at www.jennisondryden.com |
Growth of a $10,000 Investment
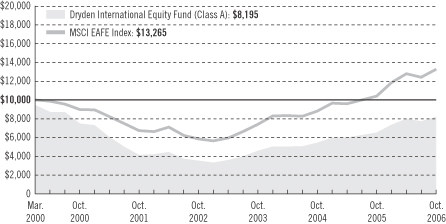
| Average Annual Total Returns (With Sales Charges) as of 10/31/06 | |||||||||
| One Year | Five Years | Since Inception | |||||||
Class A | 18.64 | % | 13.40 | % | –2.94 | % | |||
Class B | 19.73 | 13.68 | –2.85 | ||||||
Class C | 23.73 | 13.80 | –2.85 | ||||||
Class Z | 25.86 | 14.89 | –1.92 | ||||||
| Average Annual Total Returns (Without Sales Charges) as of 10/31/06 | |||||||||
| One Year | Five Years | Since Inception | |||||||
Class A | 25.55 | % | 14.69 | % | –2.11 | % | |||
Class B | 24.73 | 13.80 | –2.85 | ||||||
Class C | 24.73 | 13.80 | –2.85 | ||||||
Class Z | 25.86 | 14.89 | –1.92 | ||||||
Performance data quoted represent past performance. Past performance does not guarantee future results. The investment return and principal value of an investment will fluctuate, so that an investor’s shares, when redeemed, may be worth more or less than their original cost. Current performance may be lower or higher than the past performance data quoted. An investor may obtain performance data as of the most recent month-end by visiting our website at www.jennisondryden.com or by calling (800) 225-1852. The maximum initial sales charge is 5.50%.
The returns in the graph and the tables do not reflect the deduction of taxes that a shareholder would pay on Fund distributions or following the redemption of Fund shares.
| Visit our website at www.jennisondryden.com |
Source: Prudential Investments LLC and Lipper Inc.
Inception date: 3/1/2000.
The graph compares a $10,000 investment in the Dryden International Equity Fund (Class A shares) with a similar investment in the MSCI EAFE® Index by portraying the initial account values at the commencement of operations of Class A shares (March 1, 2000) and the account values at the end of the current fiscal year (October 31, 2006) as measured on a quarterly basis. For purposes of the graph, and unless otherwise indicated, it has been assumed that (a) the maximum applicable front-end sales charge was deducted from the initial $10,000 investment in Class A shares; (b) all recurring fees (including management fees) were deducted; and (c) all dividends and distributions were reinvested. The line graph provides information for Class A shares only. As indicated in the tables provided earlier, performance for Class B, Class C, and Class Z shares will vary due to the differing charges and expenses applicable to each share class (as indicated in the following paragraphs). Without a distribution and service (12b-1) fee waiver of 0.05% for Class A shares through October 31, 2006, the returns shown in the graph and for Class A shares in the tables would have been lower.
The MSCI EAFE® Index is an unmanaged, weighted index of performance that reflects stock price movements of developed-country markets in Europe, Australasia, and the Far East. The MSCI EAFE® Index’s total returns include the reinvestment of all dividends, but do not include the effects of sales charges, operating expenses of a mutual fund, or taxes. These returns would be lower if they included the effects of sales charges, operating expenses, or taxes. The securities that comprise the MSCI EAFE® Index may differ substantially from the securities in the Fund. The MSCI EAFE® Index is not the only index that may be used to characterize performance of global/international stock funds. Other indexes may portray different comparative performance. Investors cannot invest directly in an index.
Class A shares are subject to a maximum front-end sales charge of 5.50%, a 12b-1 fee of up to 0.30% annually, and investors who purchase Class A shares in an amount of $1 million or more and sell these shares within 12 months of purchase are subject to a contingent deferred sales charge (CDSC) of 1% in certain circumstances. Class B shares are subject to a declining CDSC of 5%, 4%, 3%, 2%, 1%, and 1%, respectively, for the first six years after purchase and a 12b-1 fee of 1% annually. Approximately seven years after purchase, Class B shares will automatically convert to Class A shares on a quarterly basis. Class C shares purchased are not subject to a front-end sales charge, but charge a CDSC of 1% for Class C shares sold within 12 months from the date of purchase and an annual 12b-1 fee of 1%. Class Z shares are not subject to a sales charge or 12b-1 fees. The returns in the graph and tables reflect the share class expense structure in effect at the close of the fiscal period.
| Dryden International Equity Fund |
| n MAIL | n TELEPHONE | n WEBSITE | ||
Gateway Center Three 100 Mulberry Street Newark, NJ 07102 | (800) 225-1852 | www.jennisondryden.com |
| PROXY VOTING |
| The Board of Directors of the Fund has delegated to the Fund’s investment subadviser the responsibility for voting any proxies and maintaining proxy recordkeeping with respect to the Fund. A description of these proxy voting policies and procedures is available without charge, upon request, by calling (800) 225-1852 or by visiting the Securities and Exchange Commission’s website at www.sec.gov. Information regarding how the Fund voted proxies relating to portfolio securities during the most recent 12-month period ended June 30 is available on the Fund’s website and on the Commission’s website. |
| DIRECTORS |
| Linda W. Bynoe • David E.A. Carson • Robert F. Gunia • Robert E. La Blanc • Douglas H. McCorkindale • Richard A. Redeker • Judy A. Rice • Robin B. Smith • Stephen G. Stoneburn • Clay T. Whitehead |
| OFFICERS |
| Judy A. Rice, President • Robert F. Gunia, Vice President • Grace C. Torres, Treasurer and Principal Financial and Accounting Officer • Kathryn L. Quirk, Chief Legal Officer • Deborah A. Docs, Secretary • Lee D. Augsburger, Chief Compliance Officer • Noreen M. Fierro, Acting Anti-Money Laundering Compliance Officer • Jonathan D. Shain, Assistant Secretary • Claudia DiGiacomo, Assistant Secretary • John P. Schwartz, Assistant Secretary • Andrew R. French, Assistant Secretary • Jack Benintende, Assistant Treasurer • M. Sadiq Peshimam, Assistant Treasurer |
| MANAGER | Prudential Investments LLC | Gateway Center Three 100 Mulberry Street Newark, NJ 07102 | ||
| INVESTMENT SUBADVISER | Quantitative Management Associates LLC | Gateway Center Two 100 Mulberry Street Newark, NJ 07102 | ||
| DISTRIBUTOR | Prudential Investment Management Services LLC | Gateway Center Three 100 Mulberry Street Newark, NJ 07102 | ||
| CUSTODIAN | The Bank of New York | One Wall Street New York, NY 10286 | ||
| TRANSFER AGENT | Prudential Mutual Fund Services LLC | PO Box 8098 Philadelphia, PA 19176 | ||
| INDEPENDENT REGISTERED PUBLIC ACCOUNTING FIRM | KPMG LLP | 345 Park Avenue New York, NY 10154 | ||
| FUND COUNSEL | Sullivan & Cromwell LLP | 125 Broad Street New York, NY 10004 | ||
| An investor should consider the investment objectives, risks, charges, and expenses of the Fund carefully before investing. The prospectus for the Fund contains this and other information about the Fund. An investor may obtain a prospectus by visiting our website at www.jennisondryden.com or by calling (800) 225-1852. The prospectus should be read carefully before investing. |
| E-DELIVERY |
To receive your mutual fund documents on-line, go to www.icsdelivery.com/prudential/funds and enroll. Instead of receiving printed documents by mail, you will receive notification via e-mail when new materials are available. You can cancel your enrollment or change your e-mail address at any time by clicking on the change/cancel enrollment option at the icsdelivery website address. |
| SHAREHOLDER COMMUNICATIONS WITH DIRECTORS |
| Shareholders can communicate directly with the Board of Directors by writing to the Chair of the Board, Dryden International Equity Fund, PO Box 13964, Philadelphia, PA 19176. Shareholders can communicate directly with an individual Director by writing to the same address. Communications are not screened before being delivered to the addressee. |
| AVAILABILITY OF PORTFOLIO SCHEDULE |
| The Fund files its complete schedule of portfolio holdings with the Securities and Exchange Commission for the first and third quarters of each fiscal year on Form N-Q. The Fund’s Forms N-Q are available on the Commission’s website at www.sec.gov. The Fund’s Forms N-Q may also be reviewed and copied at the Commission’s Public Reference Room in Washington, D.C. Information on the operation and location of the Public Reference Room may be obtained by calling (800) SEC-0330 (732-0330). The Fund’s schedule of portfolio holdings is also available on the Fund’s website as of the end of each fiscal quarter. |
| The Fund’s Statement of Additional Information contains additional information about the Fund’s Directors and is available without charge, upon request, by calling (800) 225-1852. |
Mutual Funds:
| ARE NOT INSURED BY THE FDIC OR ANY FEDERAL GOVERNMENT AGENCY | MAY LOSE VALUE | ARE NOT A DEPOSIT OF OR GUARANTEED BY ANY BANK OR ANY BANK AFFILIATE |

| Dryden International Equity Fund | ||||||||||||
| Share Class | A | B | C | Z | ||||||||
NASDAQ | PJRAX | PJRBX | PJRCX | PJIZX | ||||||||
CUSIP | 743969859 | 743969867 | 743969875 | 743969883 | ||||||||
MF190E IFS-A127700 Ed. 12/2006
ANNUAL REPORT
OCTOBER 31, 2006
STRATEGIC PARTNERS
INTERNATIONAL VALUE FUND
FUND TYPE
International stock
OBJECTIVE
Long-term growth of capital

This report is not authorized for distribution to prospective investors unless preceded or accompanied by a current prospectus.
The views expressed in this report and information about the Fund’s portfolio holdings are for the period covered by this report and are subject to change thereafter.

December 15, 2006
Dear Shareholder:
We hope you find the annual report for the Strategic Partners International Value Fund informative and useful.
You recently received materials asking you to vote on a proposal to merge the Fund into Dryden International Equity Fund. The proposal is the result of our conclusion, reached after a thorough review, that the Strategic Partners fund family does not offer the current or potential scale to remain an effective long-term investment solution for shareholders. If the proposal is approved, you will own shares of Dryden International Equity Fund, part of the JennisonDryden family of mutual funds, managed by Prudential-affiliated asset managers.
JennisonDryden combines strong teams of research analysts, a culture that leverages their findings, and security selection disciplines that focus on risk controls as well as returns. These traits characterize the JennisonDryden approach, whether a fund’s primary investment discipline is based on fundamental research, quantitative research, or credit and economic research. We have created a family of funds that you, together with the advice of a financial professional, can comfortably rely upon in investment programs suited to your personal goals and tolerance for risk.
The shareholder meeting scheduled to consider the proposal was adjourned because the number of Fund shares voted was below the minimum that is required under the Fund’s governing documents in order to convene a shareholder meeting. As of the date of this letter, shareholders were still voting on the proposal, so we do not know the results. At Prudential, we appreciate your confidence in our Strategic Partners funds and look forward to continuing to serve you with our much larger JennisonDryden family of mutual funds.
Sincerely,

Judy A. Rice, President
Prudential World Fund, Inc.
| Strategic Partners International Value Fund | 1 |
Your Fund’s Performance
Fund objective
The investment objective of the Strategic Partners International Value Fund is long-term growth of capital through investment in equity securities of foreign issuers. There can be no assurance that the Fund will achieve its investment objective.
Performance data quoted represent past performance. Past performance does not guarantee future results. The investment return and principal value of an investment will fluctuate, so that an investor’s shares, when redeemed, may be worth more or less than their original cost. Current performance may be lower or higher than the past performance data quoted. An investor may obtain performance data as of the most recent month-end by visiting our website at www.strategicpartners.com or by calling (800) 225-1852. The maximum initial sales charge is 5.50% (Class A shares).
| Cumulative Total Returns as of 10/31/06 | |||||||||
| One Year | Five Years | Ten Years | |||||||
Class A | 28.59 | % | 73.17 | % | 112.60 | % | |||
Class B | 27.51 | 66.61 | 96.94 | ||||||
Class C | 27.53 | 66.69 | 97.14 | ||||||
Class Z | 28.78 | 75.07 | 117.60 | ||||||
MSCI EAFE® Index1 | 27.52 | 97.31 | 103.01 | ||||||
Lipper International Large-Cap Core Funds Avg.2 | 25.62 | 77.46 | 102.23 | ||||||
| Average Annual Total Returns3 as of 9/30/06 | |||||||||
| One Year | Five Years | Ten Years | |||||||
Class A | 14.24 | % | 10.03 | % | 6.91 | % | |||
Class B | 14.86 | 10.29 | 6.70 | ||||||
Class C | 18.84 | 10.43 | 6.71 | ||||||
Class Z | 21.06 | 11.54 | 7.77 | ||||||
MSCI EAFE® Index1 | 19.16 | 14.26 | 6.82 | ||||||
Lipper International Large-Cap Core Funds Avg.2 | 17.43 | 11.70 | 6.58 |
The cumulative total returns do not reflect the deduction of applicable sales charges. If reflected, the applicable sales charges would reduce the cumulative total returns performance quoted. Class A shares are subject to a maximum front-end sales charge of 5.50%. Under certain circumstances, Class A shares may be subject to a contingent deferred sales charge (CDSC) of 1%. Class B and Class C shares are subject to a maximum CDSC of 5% and 1%, respectively. Class Z shares are not subject to a sales charge.
| 2 | Visit our website at www.strategicpartners.com |
Source: Prudential Investments LLC and Lipper Inc. Performance figures may reflect fee waivers and/or expense reimbursements. In the absence of such fee waivers and/or expense reimbursements, total returns would be lower.
1The Morgan Stanley Capital International Europe, Australasia, and Far East Index (MSCI EAFE® Index) is an unmanaged, weighted index of performance that reflects stock price movements of developed-country markets in Europe, Australasia, and the Far East.
2The Lipper International Large-Cap Core Funds Average (Lipper Average) represents returns based on an average return of all funds in the Lipper International Large-Cap Core Funds category. Funds in the Lipper Average invest at least 75% of their equity assets in companies strictly outside of the United States with market capitalizations (on a three-year weighted basis) greater than the 250th largest company in the S&P/Citigroup World ex-U.S. Broad Market Index (BMI). Large-cap core funds typically have an average price-to-cash flow ratio, price-to-book ratio, and three-year sales-per-share growth value compared with the S&P/Citigroup World ex-U.S. BMI.
3The average annual total returns take into account applicable sales charges. Class A, Class B, and Class C shares are subject to an annual distribution and service (12b-1) fee of up to 0.30%, 1.00%, and 1.00%, respectively. Approximately seven years after purchase, Class B shares will automatically convert to Class A shares on a quarterly basis. Class Z shares are not subject to a 12b-1 fee. The returns in the tables do not reflect the deduction of taxes that a shareholder would pay on Fund distributions or following the redemption of Fund shares.
Investors cannot invest directly in an index. The returns for the MSCI EAFE Index and the Lipper Average would be lower if they included the effects of sales charges, operating expenses, or taxes. Returns for the Lipper Average reflect the deduction of operating expenses of a mutual fund, but not sales charges or taxes.
| Five Largest Holdings expressed as a percentage of net assets as of 10/31/06 | |||
Barclays PLC, Financial Services | 2.1 | % | |
Toyota Motor Corp., Automobile Manufacturers | 1.9 | ||
UBS AG, Financial Services | 1.7 | ||
Lloyds TSB Group PLC, Financial—Bank & Trust | 1.6 | ||
Roche Holding AG, Pharmaceuticals | 1.6 |
Holdings reflect only long-term investments and are subject to change.
| Five Largest Industries expressed as a percentage of net assets as of 10/31/06 | |||
Financial—Bank & Trust | 12.2 | % | |
Oil, Gas & Consumable Fuels | 10.2 | ||
Telecommunications | 8.4 | ||
Financial Services | 7.4 | ||
Pharmaceuticals | 6.7 |
Industry weightings reflect only long-term investments and are subject to change.
| Strategic Partners International Value Fund | 3 |
Investment Adviser’s Report
Performance Overview
The 12 months ended October 31, 2006 were a period of strong global economic growth. Europe, in particular, had stronger growth than many observers had expected. Japan’s economy did not accelerate quite as much as had been expected, but still experienced strong business orders and profits and an improving consumer sector. The MSCI EAFE Index (the Index) had an excellent return, substantially higher even than the strong U.S. domestic markets. The Fund captured this market gain and a little more. It outperformed the Lipper International Large-Cap Core Funds Average by a larger margin.
Another strong year for international stocks
The Index’s gains were very broad-based, with all its European components rising 25% to 45%. The market’s laggards were Pacific countries. New Zealand returned less than 3% and Hong Kong about 20%, a very respectable performance, nonetheless. The very largest returns were in countries whose economies were still benefiting from the impetus of European Union membership: Ireland, Portugal, and Spain. The first two are very small markets; neither Ireland nor Portugal makes up as much as one percent of the benchmark, although Ireland has become one of the wealthiest countries in Europe on a per capita basis.
Stock returns were consistently strong across economic sectors and industries, as well. The materials sector, particularly steel, led the market. Chinese demand for steel has driven growth. Real estate continued to boom, leading a generally strong finance sector. The capital equipment sector was led by energy equipment & services and data processing & reproduction. Its weakest component was the single digit share price rise of the aerospace & military technology group. The consumer goods sector had strong gains across the board in absolute terms, but the average return was below this reporting period’s high standard. The sector was led by the textiles & apparel group and pulled down by the (nonetheless good) advances of the appliances & household durables, health & personal care, and food & household products groups.
The weakest sectors in this market were energy and services. Energy was pulled down by the single-digit price rise of the large energy sources sector. The price of oil fell sharply over the reporting period as inventories increased and what was expected to be a difficult hurricane season in the North Atlantic proved uneventful. The sector is dominated by the large integrated oil firms, and shares of both BP and Total declined, while those of Royal Dutch Shell rose less than 2%. Single-digit gains for the tiny shipping and very large telecommunications groups pulled down the average return of the services sector. However, returns in the sector were generally more modest than in other sectors.
| 4 | Visit our website at www.strategicpartners.com |
Stock selection was the largest contributor to performance
The Fund was managed by a pairing of LSV Asset Management and Thornburg Investment Management. LSV and Thornburg were selected in part because their styles complemented each other. LSV uses a quantitative deep value investment strategy and maintains a relatively large number of stocks in its portfolio. Thornburg uses traditional analysis of business fundamentals and a relative value strategy to select a portfolio with fewer and larger individual stock positions. Whereas LSV has no emerging market exposure, Thornburg may invest as much as 30% of its investable assets in emerging market countries. Emerging markets are not included in the benchmark MSCI EAFE Index.
Selection of individual stocks was good, especially in Hong Kong, Mexico, the Netherlands, and Switzerland, and within the energy, financials, and telecommunication services sectors.
Other factors were mixed
Thornburg drove the impact of country weightings, which overall hurt the Fund’s performance. The Fund was overweighted in Japan and the United States whereas European stocks were strongest over this reporting period. The Fund’s benchmark Index has no U.S. exposure. In contrast, the Fund gained from its substantial off-benchmark holdings in Mexico, part of Thornburg’s emerging markets exposure. Good selection among Mexican stocks augmented the benefit. However, the impact of the Mexican holdings would have been greater had Thornburg not hedged its peso exposure. The hedge would have offered some protection had the peso declined, but instead offset the Fund’s gains when the peso rose.
The Fund’s value orientation helped its performance against the style-neutral Index since value stocks in the Index substantially outperformed its growth components. The Fund also benefited from its small-cap emphasis compared to the Index. This is typical of LSV’s deep value style because larger firms tend to be more fairly priced; it is more common to find bargains among the less-analyzed small companies. Thornburg also characteristically emphasizes smaller firms because of its substantial holdings in emerging market countries. Companies in emerging markets tend to be younger and smaller than those in developed markets.
Although stock selection within the energy and financials sectors was good, the Fund’s emphasis on those sectors detracted somewhat from its performance relative to the Index. That is, there were more opportunities in other sectors.
| Strategic Partners International Value Fund | 5 |
Investment Adviser’s Report (continued)
A significant detractor
One position particularly detracted from the Fund’s return, Teva Pharmaceutical Industries. Teva, which is headquartered in Israel but has global operations and a primary subsidiary in Pennsylvania, is one of the dominant global manufacturers of generic drugs. Two factors drove its share price down. One was its exposure to uncertainty in the Middle East. The second was the rapidly changing competitive landscape for generic drug companies as new firms start up in many emerging market countries. Thornburg continues to like Teva’s prospects, given its commanding competitive position in generics and the large number of blockbuster drugs coming off patent soon.
| 6 | Visit our website at www.strategicpartners.com |
Fees and Expenses (Unaudited)
As a shareholder of the Fund, you incur two types of costs: (1) transaction costs, including sales charges (loads) on purchase payments and redemptions, as applicable, and (2) ongoing costs, including management fees, distribution and/or service (12b-1) fees, and other Fund expenses, as applicable. This example is intended to help you understand your ongoing costs (in dollars) of investing in the Fund and to compare these costs with the ongoing costs of investing in other mutual funds.
The example is based on an investment of $1,000 invested on May 1, 2006, at the beginning of the period, and held through the six-month period ended October 31, 2006.
The Fund’s transfer agent may charge additional fees to holders of certain accounts that are not included in the expenses shown in the table on the following page. These fees apply to Individual Retirement Accounts (IRAs) and Section 403(b) accounts. As of the close of the six-month period covered by the table, IRA fees included an annual maintenance fee of $15 per account (subject to a maximum annual maintenance fee of $25 for all accounts held by the same shareholder). Section 403(b) accounts are charged an annual $25 fiduciary maintenance fee. Some of the fees may vary in amount, or may be waived, based on your total account balance or the number of JennisonDryden or Strategic Partners Funds, including the Fund, that you own. You should consider the additional fees that were charged to your Fund account over the six-month period when you estimate the total ongoing expenses paid over the period and the impact of these fees on your ending account value, as these additional expenses are not reflected in the information provided in the expense table. Additional fees have the effect of reducing investment returns.
Actual Expenses
The first line for each share class in the table on the following page provides information about actual account values and actual expenses. You may use the information on this line, together with the amount you invested, to estimate the expenses that you paid over the period. Simply divide your account value by $1,000 (for example, an $8,600 account value ÷ $1,000 = 8.6), then multiply the result by the number on the first line under the heading “Expenses Paid During the Six-Month Period” to estimate the expenses you paid on your account during this period.
Hypothetical Example for Comparison Purposes
The second line for each share class in the table on the following page provides information about hypothetical account values and hypothetical expenses based on the Fund’s actual expense ratio and an assumed rate of return of 5% per year before expenses, which is not the Fund’s actual return. The hypothetical account values and
| Strategic Partners International Value Fund | 7 |
Fees and Expenses (continued)
expenses may not be used to estimate the actual ending account balance or expenses you paid for the period. You may use this information to compare the ongoing costs of investing in the Fund and other funds. To do so, compare this 5% hypothetical example with the 5% hypothetical examples that appear in the shareholder reports of the other funds.
Please note that the expenses shown in the table are meant to highlight your ongoing costs only, and do not reflect any transactional costs such as sales charges (loads). Therefore the second line for each share class in the table is useful in comparing ongoing costs only, and will not help you determine the relative total costs of owning different funds. In addition, if these transactional costs were included, your costs would have been higher.
| Strategic Partners International Value Fund | Beginning Account Value May 1, 2006 | Ending Account Value October 31, 2006 | Annualized Expense Ratio Based on the Six-Month Period | Expenses Paid During the Six-Month Period* | ||||||||||
| Class A | Actual | $ | 1,000.00 | $ | 1,032.00 | 1.64 | % | $ | 8.40 | |||||
| Hypothetical | $ | 1,000.00 | $ | 1,016.94 | 1.64 | % | $ | 8.34 | ||||||
| Class B | Actual | $ | 1,000.00 | $ | 1,027.80 | 2.39 | % | $ | 12.22 | |||||
| Hypothetical | $ | 1,000.00 | $ | 1,013.16 | 2.39 | % | $ | 12.13 | ||||||
| Class C | Actual | $ | 1,000.00 | $ | 1,027.40 | 2.39 | % | $ | 12.21 | |||||
| Hypothetical | $ | 1,000.00 | $ | 1,013.16 | 2.39 | % | $ | 12.13 | ||||||
| Class Z | Actual | $ | 1,000.00 | $ | 1,032.20 | 1.39 | % | $ | 7.12 | |||||
| Hypothetical | $ | 1,000.00 | $ | 1,018.20 | 1.39 | % | $ | 7.07 | ||||||
* Fund expenses (net of fee waivers or subsidies, if any) for each share class are equal to the annualized expense ratio for each share class (provided in the table), multiplied by the average account value over the period, multiplied by the 184 days in the six-month period ended October 31, 2006, and divided by the 365 days in the Fund’s fiscal year ended October 31, 2006 (to reflect the six-month period).
| 8 | Visit our website at www.strategicpartners.com |
Portfolio of Investments
as of October 31, 2006
| Shares | Description | Value (Note 1) | |||
LONG-TERM INVESTMENTS 98.0% | |||||
COMMON STOCKS | |||||
Australia 2.2% | |||||
| 155,688 | Bluescope Steel Ltd. | $ | 872,830 | ||
| 59,100 | Commonwealth Bank of Australia | 2,182,939 | |||
| 97,400 | CSR Ltd. | 244,365 | |||
| 400,200 | Qantas Airways Ltd. | 1,313,950 | |||
| 59,235 | Santos Ltd. | 485,747 | |||
| 344,703 | Telestra Corp. Ltd. | 1,057,003 | |||
| 6,156,834 | |||||
Austria 0.5% | |||||
| 12,300 | Boehler-Uddeholm AG | 762,637 | |||
| 14,700 | Voestalpine AG | 693,246 | |||
| 1,455,883 | |||||
Belgium 0.8% | |||||
| 9,428 | Dexia | 254,619 | |||
| 45,800 | Fortis | 1,922,582 | |||
| 2,177,201 | |||||
Brazil 0.7% | |||||
| 47,177 | Empresa Brasileira de Aeronautica SA, ADR | 1,963,979 | |||
Canada 3.1% | |||||
| 57,100 | Canadian Natural Resources Ltd. | 2,972,078 | |||
| 73,772 | Rogers Communications, Inc. (Class B Stock) | 4,414,035 | |||
| 47,166 | Shaw Communications, Inc. (Class B Stock) | 1,546,929 | |||
| 8,933,042 | |||||
China 2.9% | |||||
| 949,300 | China Merchants Bank Co. Ltd. (Class H Stock)* | 1,481,832 | |||
| 834,512 | China Merchants Holdings International Co. Ltd. | 2,441,129 | |||
| 2,213,400 | China Overseas Land & Investment Ltd. | 2,017,822 | |||
| 3,363,920 | China Petroleum and Chemical Corp. (Class H Stock) | 2,335,695 | |||
| 8,276,478 | |||||
Denmark 1.3% | |||||
| 24,445 | Danske Bank A/S | 1,025,509 | |||
| 33,941 | Novo Nordisk A/S | 2,562,989 | |||
| 3,588,498 | |||||
See Notes to Financial Statements.
| Strategic Partners International Value Fund | 9 |
Portfolio of Investments
as of October 31, 2006 Cont’d.
| Shares | Description | Value (Note 1) | |||
Finland 0.7% | |||||
| 37,300 | Rautaruukki Oyj | $ | 1,232,051 | ||
| 51,500 | Stora Enso Oyj | 833,454 | |||
| 2,065,505 | |||||
France 9.5% | |||||
| 12,425 | Air Liquide | 2,645,135 | |||
| 510 | Arkema* | 24,898 | |||
| 27,223 | BNP Paribas | 2,993,276 | |||
| 40,645 | Carrefour SA | 2,476,538 | |||
| 5,103 | Ciments Francais | 868,183 | |||
| 6,996 | CNP Assurances | 736,200 | |||
| 21,500 | Compagnie Generale des Establissements Michelin (Class B Stock) | 1,753,456 | |||
| 23,100 | Credit Agricole SA | 982,069 | |||
| 135,900 | France Telecom SA | 3,529,712 | |||
| 62,600 | JC Decaux SA | 1,597,937 | |||
| 27,033 | LVMH Moet Hennessy Louis Vuitton | 2,817,124 | |||
| 2,000 | Natexis Banques Populaires | 552,897 | |||
| 17,718 | PSA Peugeot Citroen SA | 1,017,839 | |||
| 8,005 | Renault SA | 936,374 | |||
| 6,400 | Schneider Electric SA | 664,905 | |||
| 7,366 | Societe Generale | 1,224,047 | |||
| 20,400 | Total SA | 1,381,246 | |||
| 23,600 | Vivendi | 893,686 | |||
| 27,095,522 | |||||
Germany 7.0% | |||||
| 58,622 | Adidas-Salomon AG | 2,937,422 | |||
| 12,300 | Altana AG | 686,499 | |||
| 26,977 | BASF AG | 2,377,802 | |||
| 8,700 | Bayer AG | 438,048 | |||
| 19,500 | Deutsche Bank AG | 2,454,206 | |||
| 18,287 | Deutsche Boerse AG | 2,948,756 | |||
| 40,200 | Deutsche Telekom AG | 695,731 | |||
| 21,605 | Fraport AG | 1,484,894 | |||
| 19,342 | MAN AG | 1,719,404 | |||
| 9,500 | SAP AG | 1,890,033 | |||
| 47,719 | ThyssenKrup AG | 1,771,092 | |||
| 20,619 | TUI AG | 451,060 | |||
| 19,854,947 | |||||
Greece 0.8% | |||||
| 62,200 | OPAP SA | 2,221,230 | |||
See Notes to Financial Statements.
| 10 | Visit our website at www.strategicpartners.com |
| Shares | Description | Value (Note 1) | |||
Guernsey 0.9% | |||||
| 69,594 | Amdocs Ltd.* | $ | 2,697,463 | ||
Hong Kong 1.8% | |||||
| 989,458 | Chaoda Modern Agriculture Holdings Ltd. | 599,232 | |||
| 331,100 | Citic Pacific Ltd. | 1,017,499 | |||
| 345,748 | Hong Kong Exchanges and Clearing Ltd. | 2,738,528 | |||
| 192,347 | Orient Overseas International Ltd. | 838,420 | |||
| 5,193,679 | |||||
Ireland 0.3% | |||||
| 32,900 | Irish Life & Permanent PLC | 808,318 | |||
Israel 1.0% | |||||
| 83,900 | Teva Pharmaceutical Industries Ltd., ADR | 2,766,183 | |||
Italy 2.6% | |||||
| 38,600 | Banco Popolare di Verona, Scrl. | 1,039,009 | |||
| 47,100 | Benetton Group SpA | 892,093 | |||
| 146,001 | Eni SpA | 4,403,267 | |||
| 56,500 | San Paolo - IMI SpA | 1,206,424 | |||
| 7,540,793 | |||||
Japan 19.0% | |||||
| 33,973 | Alpine Electronics, Inc. | 490,619 | |||
| 54,025 | Alps Electric Co., Inc. | 540,920 | |||
| 38,953 | Asahi Breweries Ltd. | 555,211 | |||
| 97,300 | Asahi Kasei Corp. | 621,462 | |||
| 357,920 | Bank of Yokohama Ltd. (The) | 2,766,531 | |||
| 175,214 | Cosmo Oil Co. Ltd. | 731,088 | |||
| 50,000 | Daiwa Securities Group, Inc. | 567,312 | |||
| 175,214 | Denki Kagaku Kogyo KK | 666,669 | |||
| 16,600 | Fanuc Ltd. | 1,440,640 | |||
| 104,000 | Fuji Heavy Industries Ltd. | 600,231 | |||
| 208,756 | Hitachi Ltd. | 1,204,825 | |||
| 42,347 | Hokkaido Electric Power Co., Inc. | 1,010,202 | |||
| 71,553 | Hokuetsu Paper Mills Ltd. | 406,847 | |||
| 68,726 | Honda Motor Co. Ltd. | 2,432,779 | |||
| 42,555 | Hosiden Corp. | 471,196 | |||
| 6,130 | JS Group Corp. | 125,792 | |||
| 109,677 | Kaken Pharmaceutical Co. Ltd. | 748,341 | |||
| 59,100 | Kansai Electric Power Co., Inc. (The) | 1,394,690 | |||
| 114,800 | Komatsu Ltd. | 2,071,121 | |||
See Notes to Financial Statements.
| Strategic Partners International Value Fund | 11 |
Portfolio of Investments
as of October 31, 2006 Cont’d.
| Shares | Description | Value (Note 1) | |||
| 203,600 | Kurabo Industries Ltd. | $ | 513,548 | ||
| 173,200 | Marubeni Corp. | 887,066 | |||
| 38,500 | Millea Holdings, Inc. | 1,455,004 | |||
| 152,478 | Mitsubishi Chemical Holdings Corp. | 975,192 | |||
| 166,300 | Nippon Oil Corp. | 1,237,066 | |||
| 300 | Nippon Telegraph and Telephone Corp. | 1,510,837 | |||
| 200 | Nippon Unipac Group, Inc. | 716,515 | |||
| 29,116 | Nipro Corp. | 521,551 | |||
| 120,830 | Nissan Motor Co. Ltd. | 1,447,418 | |||
| 69,700 | Nomura Holdings, Inc. | 1,230,649 | |||
| 108,647 | NSK Ltd. | 910,385 | |||
| 1,000 | NTT Docomo, Inc. | 1,530,503 | |||
| 105,200 | Oji Paper Co. Ltd | 557,685 | |||
| 30,644 | Okasan Holdings, Inc. | 238,172 | |||
| 8,600 | Ono Pharmaceutical Co. Ltd. | 419,871 | |||
| 285,407 | Osaka Gas Co. Ltd. | 1,029,813 | |||
| 2,500 | Promise Co. Ltd. | 90,419 | |||
| 99,079 | Rengo Co. Ltd. | 632,825 | |||
| 34,500 | Ricoh Co. Ltd. | 681,416 | |||
| 41,900 | Secom Co. Ltd. | 2,095,806 | |||
| 162,200 | Sharp Corp. | 2,891,599 | |||
| 126,100 | Shiseido Co. Ltd. | 2,458,279 | |||
| 78,000 | SMK Corp. | 533,539 | |||
| 251 | Sumitomo Osaka Cement Co. Ltd. | 738 | |||
| 31 | Sumitomo Trust & Banking Co. Ltd. (The) | 333 | |||
| 14,319 | Takefuji Corp. | 519,110 | |||
| 91,259 | Tanabe Seiyaku Co. Ltd. | 1,123,620 | |||
| 25,700 | Tohoku Electric Power Co., Inc. | 569,133 | |||
| 271,700 | Tokyo Gas Co. Ltd. | 1,386,900 | |||
| 50,000 | Toppan Printing Co. Ltd. | 548,074 | |||
| 93,666 | Toyota Motor Corp. | 5,550,044 | |||
| 20 | UNY Co. Ltd. | 251 | |||
| 12,344 | Yamada Denki Co. Ltd. | 1,228,542 | |||
| 54,338,379 | |||||
Liechtenstein 0.4% | |||||
| 4,341 | Verwaltungs und Privat Bank AG | 1,094,802 | |||
Mexico 2.2% | |||||
| 87,313 | America Movil SA de CV Series L, ADR | 3,743,108 | |||
| 739,198 | Wal-Mart de Mexico SA de CV Series V | 2,570,550 | |||
| 6,313,658 | |||||
See Notes to Financial Statements.
| 12 | Visit our website at www.strategicpartners.com |
| Shares | Description | Value (Note 1) | |||
Netherlands 3.0% | |||||
| 29,152 | ABN AMRO Holding NV | $ | 850,178 | ||
| 39,600 | Aegon NV | 728,307 | |||
| 57,300 | ING Groep NV ADR | 2,538,427 | |||
| 77,700 | Koninklijke (Royal) KPN NV | 1,038,301 | |||
| 45,200 | Royal Dutch Shell (Class A Stock) | 1,566,260 | |||
| 29,930 | Schlumberger Ltd. | 1,887,984 | |||
| 8,609,457 | |||||
Norway 0.4% | |||||
| 51,000 | Norsk Hydro ASA | 1,172,239 | |||
Portugal 0.3% | |||||
| 200,200 | Energias de Portugal SA | 899,419 | |||
Russia 0.6% | |||||
| 21,900 | LUKOIL, ADR | 1,771,710 | |||
Singapore 0.7% | |||||
| 419,960 | Mobileone Ltd. | 534,122 | |||
| 307,141 | Neptune Orient Lines Ltd. | 400,498 | |||
| 97,000 | Singapore Airlines Ltd. | 947,071 | |||
| 1,881,691 | |||||
South Africa 1.0% | |||||
| 142,918 | SABMiller PLC | 2,764,414 | |||
South Korea 2.4% | |||||
| 31,420 | Hyundai Motor Co. | 2,554,282 | |||
| 3,165 | Samsung Electronics Co. Ltd. | 2,052,337 | |||
| 51,762 | Shinhan Financial Group Co. Ltd. | 2,386,903 | |||
| 6,993,522 | |||||
Spain 1.4% | |||||
| 89,100 | Banco Santander Central Hispano SA | 1,542,030 | |||
| 13,305 | Endesa SA | 589,930 | |||
| 56,547 | Repsol YPF SA | 1,876,456 | |||
| 4,008,416 | |||||
Sweden 1.2% | |||||
| 36,700 | Electrolux AB, Series B | 672,017 | |||
| 36,700 | Husqvarna AB (Class B Stock)* | 449,705 | |||
| 167,086 | Nordea Bank AB | 2,301,874 | |||
| 3,423,596 | |||||
See Notes to Financial Statements.
| Strategic Partners International Value Fund | 13 |
Portfolio of Investments
as of October 31, 2006 Cont’d.
| Shares | Description | Value (Note 1) | |||
Switzerland 9.2% | |||||
| 14,000 | Baloise Holding | $ | 1,339,174 | ||
| 2,017 | Ciba Specialty Chemicals AG | 123,463 | |||
| 10,800 | Credit Suisse Group | 651,099 | |||
| 1,709 | Georg Fischer AG* | 875,072 | |||
| 2,379 | Givaudan SA | 1,969,672 | |||
| 71,143 | Novartis AG | 4,317,589 | |||
| 2,263 | Rieter Holdings AG | 1,072,335 | |||
| 25,325 | Roche Holding AG | 4,431,697 | |||
| 35,000 | Swiss Re | 2,869,660 | |||
| 5,000 | Swisscom AG | 1,746,312 | |||
| 5,400 | Syngenta AG* | 872,039 | |||
| 79,840 | UBS AG | 4,768,387 | |||
| 4,600 | Zurich Financial Services AG | 1,137,012 | |||
| 26,173,511 | |||||
United Kingdom 20.1% | |||||
| 58,000 | Alliance & Leicester PLC | 1,235,832 | |||
| 18,700 | AstraZeneca PLC | 1,105,099 | |||
| 124,100 | Aviva PLC | 1,834,643 | |||
| 443,121 | Barclays PLC | 5,980,354 | |||
| 31,866 | Boots Group PLC | 492,375 | |||
| 296,400 | BP PLC | 3,296,286 | |||
| 166,655 | Bradford & Bingley PLC | 1,468,718 | |||
| 482,864 | BT Group PLC | 2,562,938 | |||
| 133,872 | Cadbury Schweppes PLC | 1,347,071 | |||
| 29,200 | Carnival PLC | 1,425,382 | |||
| 62,100 | Dairy Crest Group PLC | 723,787 | |||
| 276,764 | DSG International PLC | 1,148,278 | |||
| 119,200 | GKN PLC | 694,649 | |||
| 30,494 | GlaxoSmithKline PLC | 814,368 | |||
| 51,100 | Hanson PLC | 708,165 | |||
| 110,293 | HBOS PLC | 2,286,944 | |||
| 334,313 | Kingfisher | 1,678,803 | |||
| 272,238 | Legal & General Group PLC | 750,403 | |||
| 432,389 | Lloyds TSB Group PLC | 4,614,800 | |||
| 87,600 | Next PLC | 3,141,522 | |||
| 200,998 | Northern Foods PLC | 340,281 | |||
| 204,969 | Northumbrian Water Group PLC | 1,133,873 | |||
| 283,100 | Old Mutual PLC | 915,351 | |||
| 63,800 | Reckitt Benckiser PLC | 2,776,030 | |||
| 53,500 | Rio Tinto PLC | 2,951,414 | |||
| 354,400 | Royal & Sun Alliance Insurance Group PLC | 997,158 | |||
See Notes to Financial Statements.
| 14 | Visit our website at www.strategicpartners.com |
| Shares | Description | Value (Note 1) | ||||
| 18,200 | Royal Bank of Scotland Group PLC | $ | 648,525 | |||
| 78,400 | Royal Dutch Shell PLC (Class B Stock) | 2,808,599 | ||||
| 47,000 | Tate & Lyle PLC | 706,484 | ||||
| 272,985 | Tesco PLC | 2,049,093 | ||||
| 128,588 | TT Electronics PLC | 545,769 | ||||
| 29,580 | Viridian Group PLC | 747,639 | ||||
| 103,525 | VODAFONE GROUP PLC, ADR | 2,676,121 | ||||
| 326,200 | VODAFONE GROUP PLC* | 840,032 | ||||
| 57,446,786 | ||||||
Total long-term investments | 279,687,155 | |||||
SHORT-TERM INVESTMENTS 3.5% | ||||||
Affiliated Money Market Mutual Fund | ||||||
Dryden Core Investment Fund - Taxable Money Market Series | ||||||
| 10,040,428 | (cost $10,040,428) (Note 3)(a) | 10,040,428 | ||||
Total Investments 101.5% | 289,727,583 | |||||
Liabilities in excess of other assets(b) (1.5%) | (4,327,803 | ) | ||||
Net Assets 100% | $ | 285,399,780 | ||||
The following abbreviations are used in portfolio descriptions:
ADR—American Depositary Receipt
| * | Non-income producing security. |
| (a) | Prudential Investments LLC, the manager of the Portfolio also serves as manager of the Dryden Core Investment Fund - Taxable Money Market Series. |
| (b) | Liabilities in excess of other assets includes net unrealized depreciation on forward foreign currency contracts as follows: |
Forward foreign currency exchange contracts outstanding at October 31, 2006:
Foreign Currency Contracts | Value at Settlement | Current Value | Unrealized Depreciation | |||||||
Sold: | ||||||||||
Euro Currency 8,480,000 expiring 04/04/07 | $ | 10,853,298 | $ | 10,901,263 | $ | (47,965 | ) | |||
Korean Won 2,146,600,000 expiring 01/12/07 | 2,234,878 | 2,282,482 | (47,604 | ) | ||||||
Mexican Peso 59,880,000 expiring 12/06/06 | 5,282,287 | 5,557,701 | (275,414 | ) | ||||||
Pound Sterling 2,520,000 expiring 12/05/06 | 4,704,840 | 4,808,486 | (103,646 | ) | ||||||
| $ | 23,075,303 | $ | 23,549,932 | $ | (474,629 | ) | ||||
See Notes to Financial Statements.
| Strategic Partners International Value Fund | 15 |
Portfolio of Investments
as of October 31, 2006 Cont’d.
The industry classification of portfolio holdings, and liabilities in excess of other assets shown as a percentage of net assets as of October 31, 2006 was as follows:
Industry | |||
Financial—Bank & Trust | 12.2 | % | |
Oil, Gas & Consumable Fuels | 10.2 | ||
Telecommunications | 8.4 | ||
Financial Services | 7.4 | ||
Pharmaceuticals | 6.7 | ||
Automobile Manufacturers | 4.2 | ||
Insurance | 3.6 | ||
Affiliated Money Market Mutual Fund | 3.5 | ||
Retail & Merchandising | 3.0 | ||
Chemicals | 2.8 | ||
Foods | 2.2 | ||
Automotive Parts | 2.1 | ||
Utilities | 1.9 | ||
Metals & Mining | 1.9 | ||
Electronic Components & Equipment | 1.7 | ||
Clothing & Apparel | 1.5 | ||
Electronic Components | 1.5 | ||
Diversified Operations | 1.5 | ||
Building Materials | 1.3 | ||
Telecom—Integrated/Services | 1.2 | ||
Conglomerates | 1.2 | ||
Real Estate | 1.2 | ||
Consumer Products & Services | 1.2 | ||
Beverages | 1.2 | ||
Commercial Banks | 1.1 | ||
Metals | 1.0 | ||
Machinery | 1.0 | ||
Industrial | 0.9 | ||
Semiconductors | 0.9 | ||
Cosmetics & Toiletries | 0.9 | ||
Business Services | 0.8 | ||
Airlines | 0.8 | ||
Gaming | 0.8 | ||
Machinery—Construction & Mining | 0.7 | ||
Diversified Financial Services | 0.7 | ||
Paper & Forest Products | 0.7 | ||
Aerospace | 0.7 | ||
Computer Services & Software | 0.7 | ||
Entertainment & Leisure | 0.7 | ||
Advertising | 0.6 | ||
Cable Television | 0.5 | ||
Telecommunications—Cellular | 0.5 | ||
Electric—Integrated | 0.5 | ||
Gas Distribution | 0.5 | ||
See Notes to Financial Statements.
| 16 | Visit our website at www.strategicpartners.com |
Industry | |||
Banks | 0.4 | % | |
Diversified Telecommunication Services | 0.4 | ||
Multimedia | 0.3 | ||
Paper & Related Products | 0.3 | ||
Steel Producers/Products | 0.2 | ||
Office Equipment | 0.2 | ||
Utilities—Distribution | 0.2 | ||
Printing | 0.2 | ||
Medical Supplies & Equipment | 0.2 | ||
Household Products / Wares | 0.2 | ||
Lumber & Wood Products | 0.1 | ||
Transportation | 0.1 | ||
Financial—Brokerage | 0.1 | ||
| 101.5 | |||
Liabilities in excess of other assets | (1.5 | ) | |
Total | 100.0 | % | |
See Notes to Financial Statements.
| Strategic Partners International Value Fund | 17 |
Statement of Assets and Liabilities
as of October 31, 2006
Assets | |||
Investments at value: | |||
Unaffiliated investments (cost $216,106,526) | $ | 279,687,155 | |
Affiliated investments (cost $10,040,428) | 10,040,428 | ||
Foreign currency, at value (cost $2,958,384) | 2,981,738 | ||
Cash | 4,900,310 | ||
Receivable for investments sold | 1,102,541 | ||
Dividends receivable | 470,540 | ||
Receivable for Series shares sold | 330,731 | ||
Foreign tax reclaim receivable | 234,527 | ||
Prepaid expenses | 10,895 | ||
Total assets | 299,758,865 | ||
Liabilities | |||
Payable for Series shares reacquired | 10,267,808 | ||
Payable for investments purchased | 2,700,561 | ||
Accrued expenses | 494,831 | ||
Unrealized depreciation on forward currency contracts | 474,629 | ||
Management fee payable | 277,716 | ||
Payable to transfer agent | 92,588 | ||
Distribution fee payable | 44,751 | ||
Deferred directors’ fee payable | 4,605 | ||
Withholding tax payable | 1,596 | ||
Total liabilities | 14,359,085 | ||
Net Assets | $ | 285,399,780 | |
Net assets were comprised of: | |||
Common stock, at par | $ | 105,321 | |
Paid-in capital in excess of par | 211,397,533 | ||
| 211,502,854 | |||
Net investment income | 76,399 | ||
Accumulated net realized gain on investments and foreign currency transactions | 10,678,279 | ||
Net unrealized appreciation on investments and foreign currencies | 63,142,248 | ||
Net assets, October 31, 2006 | $ | 285,399,780 | |
See Notes to Financial Statements.
| 18 | Visit our website at www.strategicpartners.com |
Class A: | |||
Net asset value and redemption price per share | |||
($73,288,782 ÷ 2,702,463 shares of common stock issued and outstanding) | $ | 27.12 | |
Maximum sales charge (5.50% of offering price) | 1.58 | ||
Offering price per share | $ | 28.70 | |
Class B: | |||
Net asset value, offering and redemption price per share | |||
($19,140,971 ÷ 729,363 shares of common stock issued and outstanding) | $ | 26.24 | |
Class C: | |||
Net asset value, offering and redemption price per share | |||
($15,961,846 ÷ 607,638 shares of common stock issued and outstanding) | $ | 26.27 | |
Class Z: | |||
Net asset value, offering and redemption price per share | |||
($177,008,181 ÷ 6,492,633 shares of common stock issued and outstanding) | $ | 27.26 | |
See Notes to Financial Statements.
| Strategic Partners International Value Fund | 19 |
Statement of Operations
Year Ended October 31, 2006
Net Investment Income | ||||
Income | ||||
Unaffiliated dividend income (net of withholding taxes of $566,717) | $ | 7,625,947 | ||
Affiliated dividend income | 156,179 | |||
Affiliated income from securities lending | 1,378 | |||
Total income | 7,783,504 | |||
Expenses | ||||
Management fee | 2,719,114 | |||
Distribution fee—Class A | 168,976 | |||
Distribution fee—Class B | 193,456 | |||
Distribution fee—Class C | 149,086 | |||
Transfer agent’s fees and expenses (including affiliated expenses of $395,100) | 460,000 | |||
Custodian’s fees and expenses | 224,000 | |||
Reports to shareholders | 76,000 | |||
Reorganization expenses (Note 10) | 68,400 | |||
Registration fees | 67,000 | |||
Legal fees | 36,000 | |||
Loan interest expense (Note 7) | 30,164 | |||
Audit fees | 22,000 | |||
Directors’ fees | 19,000 | |||
Insurance fees | 10,000 | |||
Miscellaneous expenses | 82,318 | |||
Net expenses | 4,325,514 | |||
Net investment income | 3,457,990 | |||
Realized And Unrealized Gain (Loss) On Investments And Foreign Currency Transactions | ||||
Net realized gain (loss) on: | ||||
Investment transactions | 32,756,553 | |||
Foreign currency transactions | (785,941 | ) | ||
| 31,970,612 | ||||
Net change in unrealized appreciation (depreciation) on: | ||||
Investments | 32,452,585 | |||
Foreign currencies | (435,647 | ) | ||
| 32,016,938 | ||||
Net gain on investments and foreign currencies | 63,987,550 | |||
Net Increase In Net Assets Resulting From Operations | $ | 67,445,540 | ||
See Notes to Financial Statements.
| 20 | Visit our website at www.strategicpartners.com |
Statement of Changes in Net Assets
| Year Ended October 31, | ||||||||
| 2006 | 2005 | |||||||
Increase (Decrease) In Net Assets | ||||||||
Operations | ||||||||
Net investment income | $ | 3,457,990 | $ | 4,599,487 | ||||
Net realized gain on investments and foreign currency transactions | 31,970,612 | 85,305,923 | ||||||
Net change in unrealized appreciation (depreciation) on investments and foreign currencies | 32,016,938 | (21,790,261 | ) | |||||
Net increase in net assets resulting from operations | 67,445,540 | 68,115,149 | ||||||
Dividends and distributions (Note 1) | ||||||||
Dividends from net investment income | ||||||||
Class A | (1,338,851 | ) | (526,469 | ) | ||||
Class B | (279,268 | ) | (57,515 | ) | ||||
Class C | (186,171 | ) | (28,274 | ) | ||||
Class Z | (3,990,294 | ) | (3,534,518 | ) | ||||
| (5,794,584 | ) | (4,146,776 | ) | |||||
Distributions from net realized gains | ||||||||
Class A | (866,912 | ) | — | |||||
Class B | (289,255 | ) | — | |||||
Class C | (192,828 | ) | — | |||||
Class Z | (2,323,971 | ) | — | |||||
| (3,672,966 | ) | — | ||||||
Series share transactions (net of share conversions) (Note 6) | ||||||||
Net proceeds from shares sold | 92,737,158 | 113,014,644 | ||||||
Net asset value of shares issued in reinvestment of dividends and distributions | 9,238,126 | 4,105,182 | ||||||
Cost of shares reacquired | (124,275,889 | ) | (321,270,560 | ) | ||||
Net decrease in net assets from Series share transactions | (22,300,605 | ) | (204,150,734 | ) | ||||
Net increase (decrease) | 35,677,385 | (140,182,361 | ) | |||||
Net Assets | ||||||||
Beginning of year | 249,722,395 | 389,904,756 | ||||||
End of year(a) | $ | 285,399,780 | $ | 249,722,395 | ||||
(a) Includes undistributed net investment income of: | $ | 76,399 | $ | 5,717,574 | ||||
See Notes to Financial Statements.
| Strategic Partners International Value Fund | 21 |
Notes to Financial Statements
Prudential World Fund, Inc. (the “Fund”), is registered under the Investment Company Act of 1940 as an open-end diversified management investment company and currently consists of three series: Strategic Partners International Value Fund (the “Series”), Jennison Global Growth Fund, and the Dryden International Equity Fund. These financial statements relate to Strategic Partners International Value Fund. The financial statements of the other series are not presented herein. The investment objective of the Series is to achieve long-term growth of capital. Income is a secondary objective. The Series seeks to achieve its objective primarily through investment in common stock and preferred stock of foreign companies of all sizes.
Note 1. Accounting Policies
The following is a summary of significant accounting policies followed by the Fund and the Series in the preparation of its financial statements.
Securities Valuation: Securities listed on a securities exchange (other than options on securities and indices) are valued at the last sale price on such exchange on the day of valuation or, if there was no sale on such day, at the mean between the last reported bid and ask prices, or at the last bid price on such day in the absence of an asked price. Securities traded via Nasdaq are valued at the Nasdaq official closing price (“NOCP”) on the day of valuation, or if there was no NOCP, at the last sale price. Securities that are actively traded in the over-the-counter market, including listed securities for which the primary market is believed by Prudential Investments LLC (“PI” or “Manager”), in consultation with the subadvisor(s), to be over-the-counter, are valued at market value using prices provided by an independent pricing agent or principal market maker. Options on securities and indices traded on an exchange are valued at the last sale price as of the close of trading on the applicable exchange or, if there was no sale, at the mean between the most recently quoted bid and asked prices on such exchange. Futures contracts and options thereon traded on a commodities exchange or board of trade are valued at the last sale price at the close of trading on such exchange or board of trade or, if there was no sale on the applicable commodities exchange or board of trade on such day, at the mean between the most recently quoted bid and asked prices on such exchange or board of trade or at the last bid price in the absence of an asked price. Securities for which reliable market quotations are not readily available, or whose values have been affected by events occurring after the close of the security’s foreign market and before the Series’ normal pricing time, are valued at fair value in accordance with the Board of Directors’ approved fair valuation procedures. When determining the fair valuation of securities some of the factors influencing the valuation include, the nature of any
| 22 | Visit our website at www.strategicpartners.com |
restrictions on disposition of the securities; assessment of the general liquidity of the securities; the issuer’s financial condition and the markets in which it does business; the cost of the investment; the size of the holding and the capitalization of issuer; the prices of any recent transactions or bids/offers for such securities or any comparable securities; any available analyst media or other reports or information deemed reliable by the investment advisor regarding the issuer or the markets or industry in which it operates. Using fair value to price securities may result in a value that is different from a security’s most recent closing price and from the price used by other mutual funds to calculate their net asset values. As of October 31, 2006, there were no securities valued in accordance with such procedures.
Short-term securities which mature in 60 days or less are valued at amortized cost, which approximates market value. The amortized cost method involves valuing a security at its cost on the date of purchase and thereafter assuming a constant amortization to maturity of the difference between the principal amount due at maturity and cost. Short-term securities which mature in more than 60 days are valued at current market quotations.
Foreign Currency Translation: The books and records of the Series are maintained in U.S. dollars. Foreign currency amounts are translated into U.S. dollars on the following basis:
(i) market value of investment securities, other assets and liabilities-at the current rates of exchange.
(ii) Purchases and sales of investment securities, income and expenses-at the rates of exchange prevailing on the respective dates of such transactions.
Although the net assets of the Series are presented at the foreign exchange rates and market values at the close of the fiscal period, the Series does not isolate that portion of the results of operations arising as a result of changes in the foreign exchange rates from the fluctuations arising from changes in the market prices of long-term securities held at the end of the fiscal period. Similarly, the Series does not isolate the effect of changes in foreign exchange rates from the fluctuations arising from changes in the market prices of long-term portfolio securities sold during the fiscal period. Accordingly, realized foreign currency gains or losses are included in the reported net realized gains or losses on investment transactions.
Net realized gains or losses on foreign currency transactions represent net foreign exchange gains or losses from the holding of foreign currencies, currency gains or losses realized between the trade date and settlement date on securities transactions, and the difference between the amounts of dividends, interest and foreign
| Strategic Partners International Value Fund | 23 |
Notes to Financial Statements
Cont’d
withholding taxes recorded on the Series’ books and the U.S. dollar equivalent amounts actually received or paid. Net unrealized currency gains or losses from valuing foreign currency denominated assets and liabilities (other than investments) at period end exchange rates are reflected as a component of net unrealized appreciation (depreciation) on investments and foreign currencies.
Foreign security and currency transactions may involve certain considerations and risks not typically associated with those of domestic origin as a result of, among other factors, the possibility of political and economic instability or the level of governmental supervision and regulation of foreign securities markets.
Forward Currency Contracts: A forward currency contract is a commitment to purchase or sell a foreign currency at a future date at a negotiated forward rate. The Series enters into forward currency contracts in order to hedge its exposure to changes in foreign currency exchange rates on its foreign portfolio holdings or specific receivables and payables denominated in a foreign currency. The contracts are valued daily at current exchange rates and any unrealized gain or loss is included in net unrealized appreciation or depreciation on foreign currencies. Gain or loss is realized on the settlement date of the contract equal to the difference between the settlement value of the original and renegotiated forward contracts. This gain or loss, if any, is included in net realized gain (loss) on foreign currency transactions. Risks may arise upon entering into these contracts from the potential inability of the counterparties to meet the terms of their contracts. Forward currency contracts involve elements of both market and credit risk in excess of the amounts reflected on the Statement of Assets and Liabilities.
Securities Transactions and Net Investment Income: Securities transactions are recorded on the trade date. Realized and unrealized gains or losses on sales of securities are calculated on the identified cost basis. Dividend income is recorded on the ex-dividend date and interest income, including amortization of premium and accretion of discount on debt securities, as required, is recorded on an accrual basis. Expenses are recorded on the accrual basis. Net investment income or loss, (other than distribution fees which are charged directly to the respective class) and unrealized and realized gains or losses are allocated daily to each class of shares based upon the relative proportion of net assets of each class at the beginning of the day.
Dividends and Distributions: The Series expects to pay dividends of net investment income and distributions of net realized capital gains, if any, annually. Dividends
| 24 | Visit our website at www.strategicpartners.com |
and distributions to shareholders, which are determined in accordance with federal income tax regulations and which may differ from generally accepted accounting principles, are recorded on the ex-dividend date. Permanent book/tax differences relating to income and gains are reclassified amongst undistributed net investment income, accumulated net realized gain or loss and paid-in capital in excess of par, as appropriate.
Taxes: For federal income tax purposes, each series in the Fund is treated as a separate taxpaying entity. It is the Series’ policy to continue to meet the requirements of the Internal Revenue Code applicable to regulated investment companies and to distribute all of its taxable net income and capital gains, if any, to shareholders. Therefore, no federal income tax provision is required.
Withholding taxes on foreign dividends are recorded, net of reclaimable amounts, at the time the related income is earned.
Estimates: The preparation of the financial statements requires management to make estimates and assumptions that affect the reported amounts and disclosures in the financial statements. Actual results could differ from those estimates.
Note 2. Agreements
The Fund has a management agreement for the Series with Prudential Investments LLC (“PI”). Pursuant to this agreement, PI has responsibility for all investment advisory services and supervises the subadvisor’s performance of such services. PI has entered into subadvisory agreements with LSV Asset Management (“LSV”) and Thornburg Investment Management (“Thornburg”) for the Series.
The subadvisory agreements provide that LSV and Thornburg furnish investment advisory services in connection with the management of the Series. In connection therewith, LSV and Thornburg are obligated to keep certain books and records of the Series. PI pays for the services of the subadvisors, the cost of compensation of officers of the Series, occupancy and certain clerical and bookkeeping costs of the Series. The Series bears all other costs and expenses.
The management fee paid to PI is computed daily and payable monthly at an annual rate of 1% of the average daily net assets up to $300 million, .95 of 1% of the next $700 million of average daily net assets and .90 of 1% of average daily net assets in excess of $1 billion of the Series. The effective management fee rate as of October 31, 2006 was 1.00%.
| Strategic Partners International Value Fund | 25 |
Notes to Financial Statements
Cont’d
Effective August 1, 2005, PI has voluntarily agreed to reimburse the Series through February 28, 2007 in order to limit operating expenses (excluding interest, taxes and extraordinary expenses) to 1.61%, 2.36%, 2.36% and 1.36% of the average daily net assets of the Class A, B, C and Z shares, respectively.
The Series has a distribution agreement with Prudential Investment Management Services LLC (“PIMS”), which acts as the distributor of the Class A, Class B, Class C and Class Z shares of the Series. The Series compensates PIMS for distributing and servicing the Series’ Class A, Class B and Class C shares pursuant to plans of distribution (the “Class A, B and C Plans”), regardless of expenses actually incurred by PIMS. The distribution fees are accrued daily and payable monthly. No distribution or service fees are paid to PIMS as distributor of the Class Z shares of the Series.
Pursuant to the Class A, B and C Plans, the Series compensates PIMS for distribution-related activities at an annual rate of up to .30 of 1%, 1% and 1% of the average daily net assets of the Class A, B and C shares, respectively. For the year ended October 31, 2006, PIMS contractually agreed to limit such fee to .25 of 1% of the average daily net assets of the Class A shares.
PIMS has advised the Series that it received approximately $74,000 in front-end sales charges resulting from sales of Class A shares, during the year ended October 31, 2006. From these fees, PIMS paid such sales charges to broker-dealers, which in turn paid commissions to salespersons and incurred other distribution costs.
PIMS advised the Series that for the year ended October 31, 2006, it received approximately $18,000 and $1,800 in contingent deferred sales charges imposed upon certain redemptions by Class B and Class C shareholders, respectively.
PI and PIMS are indirect, wholly-owned subsidiaries of Prudential Financial, Inc. (“Prudential”).
Note 3. Other Transactions with Affiliates
Prudential Mutual Fund Services LLC (“PMFS”), an affiliate of PI and an indirect, wholly owned subsidiary of Prudential, serves as the Fund’s transfer agent. The transfer agent fees and expenses in the Statement of Operations also include certain out-of-pocket expenses paid to non-affiliates, where applicable.
| 26 | Visit our website at www.strategicpartners.com |
The Fund pays networking fees to affiliated and unaffiliated broker/dealers. These networking fees are payments made to broker/dealers that clear mutual fund transactions through a national clearing system. For the year ended October 31, 2006, the Series incurred approximately $59,000 in total networking fees. These amounts are included in transfer agent’s fees and expenses in the Statement of Operations.
Prudential Investment Management, Inc. (“PIM”), an indirect, wholly-owned subsidiary of Prudential, is the Series’ security lending agent. For the year ended October 31, 2006, PIM has been compensated approximately $600 for these services.
The Series invests in the Taxable Money Market Series, a portfolio of Dryden Core Investment Fund, formerly Prudential Core Investment Fund, pursuant to an exemptive order received from the Securities and Exchange Commission. The Taxable Money Market Series is a money market mutual fund registered under the Investment Company Act of 1940, as amended, and managed by PI.
Note 4. Portfolio Securities
Purchases and sales of investment securities, other than short-term investments, for the year ended October 31, 2006 were $127,956,269 and $129,692,960, respectively.
Note 5. Distributions and Tax Information
Distributions to shareholders, which are determined in accordance with federal income tax regulations, which may differ from generally accepted accounting principles, are recorded on the ex-dividend date. In order to present net investment income and accumulated net realized gain on investments and foreign currency transactions on the Statement of Assets and Liabilities that more closely represent their tax character, certain adjustments have been made to paid-in capital, net investment income and accumulated net realized gain on investments and foreign currency transactions. For the year ended October 31, 2006, the adjustments were to decrease net investment income by $3,304,580, decrease accumulated net realized gain on investments and foreign currency transactions by $1,393,759 and increase paid-in capital by $4,698,339. These differences are due to the treatment for book and tax purposes of certain transactions involving foreign currency transactions, tax adjustments pertaining to the treatment of passive foreign investment companies and in-kind shareholder redemption transactions and other book to tax differences. Net investment income, net realized gains and net assets were not affected by this change.
| Strategic Partners International Value Fund | 27 |
Notes to Financial Statements
Cont’d
For the years ended October 31, 2006 and 2005, the tax character of total dividends paid by the Series was $9,467,550 and $4,146,776, respectively, from ordinary income.
As of October 31, 2006, the accumulated undistributed earnings on a tax basis were $14,209,179 of long-term capital gains.
The Series had a capital loss carryforward as of October 31, 2006 of approximately $3,119,000, of which $2,785,000 expires in 2010 and $334,000 expires in 2011. The Fund utilized $12,299,345 of its capital loss carryforward to offset taxable gains realized during the year ended October 31, 2006.
The federal income tax basis of the Series’s investments and the net unrealized appreciation as of October 31, 2006 was as follows:
Tax Basis of Investments | Appreciation | Depreciation | Net Unrealized | |||
| $226,950,735 | $66,213,133 | $3,436,285 | $62,776,848 |
The difference between book basis and tax basis was primarily attributable to deferred losses on wash sales and investments in passive foreign investment companies.
Note 6. Capital
The Series offers Class A, Class B, Class C and Class Z shares. Class A shares are sold with a front-end sales charge of up to 5.50%. All investors who purchase Class A shares in an amount of $1 million or more and sell these shares within 12 months of purchase are subject to a contingent deferred sales charge (“CDSC”) of 1%, including investors who purchase their shares through broker-dealers affiliated with Prudential. Class B shares are sold with a CDSC which declines from 5% to zero depending upon the period of time the shares are held. Class C shares are sold with a CDSC of 1% during the first 12 months from the date of purchase. Class B shares will automatically convert to Class A shares on a quarterly basis approximately seven years after purchase. A special exchange privilege is also available for shareholders who qualify to purchase Class A shares at net asset value. Class Z shares are not subject to any sales or redemption charge and are offered exclusively for sale to a limited group of investors.
| 28 | Visit our website at www.strategicpartners.com |
There are 500 million authorized shares of $.01 par value common stock, divided equally into four classes, designated Class A, Class B, Class C and Class Z common stock.
Transactions in shares of common stock were as follows:
Class A | Shares | Amount | |||||
Year ended October 31, 2006: | |||||||
Shares sold | 634,776 | $ | 15,680,256 | ||||
Shares issued in reinvestment of dividends and distributions | 92,600 | 2,039,054 | |||||
Shares reacquired | (970,058 | ) | (23,458,112 | ) | |||
Net increase (decrease) in shares outstanding before conversion | (242,682 | ) | (5,738,802 | ) | |||
Shares issued upon conversion from Class B | 141,546 | 3,378,301 | |||||
Net increase (decrease) in shares outstanding | (101,136 | ) | $ | (2,360,501 | ) | ||
Year ended October 31, 2005: | |||||||
Shares sold | 591,328 | $ | 12,172,121 | ||||
Shares issued in reinvestment of dividends and distributions | 25,412 | 492,479 | |||||
Shares reacquired | (1,243,275 | ) | (25,297,301 | ) | |||
Net increase (decrease) in shares outstanding before conversion | (626,535 | ) | (12,632,701 | ) | |||
Shares issued upon conversion from Class B | 394,832 | 8,068,864 | |||||
Net increase (decrease) in shares outstanding | (231,703 | ) | $ | (4,563,837 | ) | ||
Class B | |||||||
Year ended October 31, 2006: | |||||||
Shares sold | 156,140 | $ | 3,771,471 | ||||
Shares issued in reinvestment of dividends and distributions | 25,034 | 537,475 | |||||
Shares reacquired | (201,729 | ) | (4,810,645 | ) | |||
Net increase (decrease) in shares outstanding before conversion | (20,555 | ) | (501,699 | ) | |||
Shares reacquired upon conversion into Class A | (145,644 | ) | (3,378,301 | ) | |||
Net increase (decrease) in shares outstanding | (166,199 | ) | $ | (3,880,000 | ) | ||
Year ended October 31, 2005: | |||||||
Shares sold | 211,140 | $ | 4,180,370 | ||||
Shares issued in reinvestment of dividends and distributions | 2,873 | 54,295 | |||||
Shares reacquired | (374,361 | ) | (7,417,792 | ) | |||
Net increase (decrease) in shares outstanding before conversion | (160,348 | ) | (3,183,127 | ) | |||
Shares reacquired upon conversion into Class A | (406,074 | ) | (8,068,864 | ) | |||
Net increase (decrease) in shares outstanding | (566,422 | ) | $ | (11,251,991 | ) | ||
| Strategic Partners International Value Fund | 29 |
Notes to Financial Statements
Cont’d
Class C | Shares | Amount | |||||
Year ended October 31, 2006: | |||||||
Shares sold | 176,616 | $ | 4,305,549 | ||||
Shares issued in reinvestment of dividends and distributions | 16,596 | 356,650 | |||||
Shares reacquired | (185,223 | ) | (4,441,582 | ) | |||
Net increase (decrease) in shares outstanding | 7,989 | $ | 220,617 | ||||
Year ended October 31, 2005: | |||||||
Shares sold | 146,397 | $ | 2,923,171 | ||||
Shares issued in reinvestment of dividends and distributions | 1,399 | 26,461 | |||||
Shares reacquired | (283,010 | ) | (5,650,636 | ) | |||
Net increase (decrease) in shares outstanding | (135,214 | ) | $ | (2,701,004 | ) | ||
Class Z | |||||||
Year ended October 31, 2006: | |||||||
Shares sold | 2,762,586 | $ | 68,979,882 | ||||
Shares issued in reinvestment of dividends and distributions | 285,034 | 6,304,947 | |||||
Shares reacquired | (3,671,082 | ) | (91,565,550 | ) | |||
Net increase (decrease) in shares outstanding | (623,462 | ) | $ | (16,280,721 | ) | ||
Year ended October 31, 2005: | |||||||
Shares sold | 4,589,691 | $ | 93,738,982 | ||||
Shares issued in reinvestment of dividends and distributions | 181,498 | 3,531,947 | |||||
Shares reacquired | (13,701,289 | ) | (282,904,831 | ) | |||
Net increase (decrease) in shares outstanding | (8,930,100 | ) | $ | (185,633,902 | ) | ||
Note 7. Borrowings
The Series, along with other affiliated registered investment companies (the “Funds”), is a party to a Syndicated Credit Agreement (“SCA”) with two banks. The SCA provides for a commitment of $500 million. Interest on any borrowings under the SCA is incurred at contracted market rates and a commitment fee for the unused amount is accrued daily and paid quarterly. Effective October 27, 2006, the Funds renewed SCA with the banks. The commitment under the renewed SCA continues to be $500 million. The Funds pay a commitment fee of .07 of 1% of the unused portion of the renewed SCA. The expiration date of the renewed SCA will be October 26, 2007. For the period from October 29, 2005 through October 26, 2006, the Funds paid a commitment fee of .0725 of 1% of the unused portion of the agreement. The purpose of the SCA is to provide an alternative source of temporary funding for capital share redemptions.
| 30 | Visit our website at www.strategicpartners.com |
The Series utilized the line of credit during for the year ended October 31, 2006. The average daily balance for the 88 days the Series had debt outstanding during the year was $2,546,114 at a weighted average interest rate of approximately 4.83%.
Note 8. In-Kind Redemption
During the year ended October 31, 2006, shareholders redeemed Series shares in exchange for Series’ portfolio securities valued at $25,598,448. The Series realized a gain of $5,492,586 related to the in-kind redemption transactions. This gain is not taxable for federal income tax purposes.
Note 9. New Accounting Pronouncements
On July 13, 2006, the Financial Accounting Standards Board (“FASB”) released FASB Interpretation No. 48 “Accounting for Uncertainty in Income Taxes” (“FIN 48”). FIN 48 provides guidance for how uncertain tax positions should be recognized, measured, presented and disclosed in the financial statements. FIN 48 requires the evaluation of tax positions taken or expected to be taken in the course of preparing the Series’ tax returns to determine whether the tax positions are “more-likely-than-not” of being sustained by the applicable tax authority. Tax benefits or expenses resulting from tax positions not deemed to meet the more-likely-than-not threshold would be recorded in the year in which they arise. Adoption of FIN 48 is required for fiscal years beginning after December 15, 2006 and interim periods within those fiscal years and is to be applied to all open tax years as of the effective date. At this time, management is evaluating the implications of FIN 48 and its impact, if any, in the financial statements has not yet been determined.
On September 20, 2006, the FASB released Statement of Financial Accounting Standards No. 157 “Fair Value Measurements” (“FAS 157”). FAS 157 establishes an authoritative definition of fair value, sets out a framework for measuring fair value, and requires additional disclosures about fair-value measurements. The application of FAS 157 is required for fiscal years beginning after November 15, 2007 and interim periods within those fiscal years. At this time, management is evaluating the implications of FAS 157 and its impact, if any, in the financial statements has not yet been determined.
Note 10. Plan of Reorganization
On July 19, 2006, the Board of Directors of the Fund has approved an Agreement and Plan of Reorganization (the “Plan”) which provides for the transfer of all the assets of the
| Strategic Partners International Value Fund | 31 |
Notes to Financial Statements
Cont’d
Class A, B, C and Z shares of the Series for like shares of Dryden International Equity Fund, a series of Prudential World Fund, Inc., and the assumption of the liabilities of the Series. The Plan is subject to approval by the shareholders of the Series.
The expenses resulting from the Plan, including proxy solicitation costs, will be paid by PI and/or an affiliate and the respective funds. The reorganization costs attributable to the Series are currently reflected in the Statement of Operations.
| 32 | Visit our website at www.strategicpartners.com |
Financial Highlights
| OCTOBER 31, 2006 | ANNUAL REPORT |
Strategic Partners International Value Fund
Financial Highlights
| Class A | ||||
| Year Ended October 31, 2006(b) | ||||
Per Share Operating Performance: | ||||
Net Asset Value, Beginning Of Year | $ | 21.88 | ||
Income (loss) from investment operations: | ||||
Net investment income | .45 | |||
Net realized and unrealized gain (loss) on investments and foreign currency transactions | 5.61 | |||
Total from investment operations | 6.06 | |||
Less Dividends and Distributions: | ||||
Dividends from net investment income | (.50 | ) | ||
Distributions from net realized gains | (.32 | ) | ||
Total dividends and distributions | (.82 | ) | ||
Net asset value, end of year | $ | 27.12 | ||
Total Investment Return(a): | 28.59 | % | ||
Ratios/Supplemental Data: | ||||
Net assets, end of year (000) | $ | 73,289 | ||
Average net assets (000) | $ | 67,590 | ||
Ratios to average net assets: | ||||
Expenses, including distribution and service (12b-1) fees(c) | 1.65 | % | ||
Expenses, excluding distribution and service (12b-1) fees | 1.40 | % | ||
Net investment income | 1.83 | % | ||
For Class A, B, C and Z shares: | ||||
Portfolio turnover rate | 48 | % | ||
| (a) | These total returns do not consider the effect of sales load. Total return is calculated assuming a purchase of shares on the first day and a sale on the last day of each year reported and includes reinvestment of dividends and distributions. |
| (b) | Calculations are based on the average daily number of shares outstanding. |
| (c) | The distributor of the Series has contractually agreed to limit its distribution and service (12b-1) fees to .25 of 1% of the average daily assets of the Class A shares. |
| (d) | Effective August 1, 2005 through February 28, 2007, the Manager of the Series has voluntarily agreed to reimburse the Series in order to limit operating expenses (excluding interest, taxed and brokerage commissions) to 1.61% of the average daily net assets of the Class A shares. If the Manager had not reimbursed the Series, the annual expenses (both including and excluding distribution and service (12b-1) fees) and net investment income ratios would be 1.62%, 1.37% and 1.15%, respectively, for the year ended October 31, 2005. |
See Notes to Financial Statements.
| 34 | Visit our website at www.strategicpartners.com |
| Class A | ||||||||||||||
| Year Ended October 31, | ||||||||||||||
| 2005(b) | 2004(b) | 2003(b) | 2002(b) | |||||||||||
| $ | 18.29 | $ | 16.07 | $ | 14.08 | $ | 17.29 | |||||||
| .24 | .16 | .14 | .07 | |||||||||||
| 3.53 | 2.20 | 1.89 | (2.53 | ) | ||||||||||
| 3.77 | 2.36 | 2.03 | (2.46 | ) | ||||||||||
| (.18 | ) | (.14 | ) | (.04 | ) | — | ||||||||
| — | — | — | (.75 | ) | ||||||||||
| (.18 | ) | (.14 | ) | (.04 | ) | (.75 | ) | |||||||
| $ | 21.88 | $ | 18.29 | $ | 16.07 | $ | 14.08 | |||||||
| 20.71 | % | 14.77 | % | 14.44 | % | (15.07 | )% | |||||||
| $ | 61,347 | $ | 55,530 | $ | 41,889 | $ | 41,011 | |||||||
| $ | 59,739 | $ | 49,953 | $ | 40,463 | $ | 49,279 | |||||||
| 1.62 | %(d) | 1.61 | % | 1.72 | % | 1.64 | % | |||||||
| 1.37 | %(d) | 1.36 | % | 1.47 | % | 1.39 | % | |||||||
| 1.15 | %(d) | .90 | % | .97 | % | .42 | % | |||||||
| 121 | % | 24 | % | 23 | % | 35 | % | |||||||
See Notes to Financial Statements.
| Strategic Partners International Value Fund | 35 |
Financial Highlights
Cont’d
| Class B | ||||
| Year Ended October 31, 2006(b) | ||||
Per Share Operating Performance: | ||||
Net Asset Value, Beginning Of Year | $ | 21.19 | ||
Income (loss) from investment operations: | ||||
Net investment income (loss) | .19 | |||
Net realized and unrealized gain (loss) on investments and foreign currency transactions | 5.49 | |||
Total from investment operations | 5.68 | |||
Less Dividends and Distributions: | ||||
Dividends from net investment income | (.31 | ) | ||
Distributions from net realized gains | (.32 | ) | ||
Total dividends and distributions | (.63 | ) | ||
Net asset value, end of year | $ | 26.24 | ||
Total Investment Return(a): | 27.51 | % | ||
Ratios/Supplemental Data: | ||||
Net assets, end of year (000) | $ | 19,141 | ||
Average net assets (000) | $ | 19,346 | ||
Ratios to average net assets: | ||||
Expenses, including distribution and service (12b-1) fees | 2.40 | % | ||
Expenses, excluding distribution and service (12b-1) fees | 1.40 | % | ||
Net investment income (loss) | .78 | % | ||
| (a) | These total returns do not consider the effect of sales load. Total return is calculated assuming a purchase of shares on the first day and a sale on the last day of each year reported and includes reinvestment of dividends and distributions. |
| (b) | Calculations are based on the average daily number of shares outstanding. |
| (c) | Effective August 1, 2005 through February 28, 2007, the Manager of the Series has voluntarily agreed to reimburse the Series in order to limit operating expenses (excluding interest, taxes and brokerage commissions) to 2.36% of the average daily net assets of the Class B shares. If the Manager had not reimbursed the Series, the annual expenses (both including and excluding distribution and service (12b-1) fees) and net investment income ratios would be 2.37%, 1.37% and 0.38%, respectively, for the year ended October 31, 2005. |
See Notes to Financial Statements.
| 36 | Visit our website at www.strategicpartners.com |
| Class B | ||||||||||||||
| Year Ended October 31, | ||||||||||||||
| 2005(b) | 2004(b) | 2003(b) | 2002(b) | |||||||||||
| $ | 17.73 | $ | 15.58 | $ | 13.71 | $ | 16.99 | |||||||
| .08 | .03 | .03 | (.05 | ) | ||||||||||
| 3.42 | 2.15 | 1.84 | (2.48 | ) | ||||||||||
| 3.50 | 2.18 | 1.87 | (2.53 | ) | ||||||||||
| (.04 | ) | (.03 | ) | — | — | |||||||||
| — | — | — | (.75 | ) | ||||||||||
| (.04 | ) | (.03 | ) | — | (.75 | ) | ||||||||
| $ | 21.19 | $ | 17.73 | $ | 15.58 | $ | 13.71 | |||||||
| 19.77 | % | 13.98 | % | 13.64 | % | (15.77 | )% | |||||||
| $ | 18,978 | $ | 25,917 | $ | 33,651 | $ | 37,636 | |||||||
| $ | 23,092 | $ | 33,863 | $ | 33,581 | $ | 49,420 | |||||||
| 2.37 | %(c) | 2.36 | % | 2.47 | % | 2.39 | % | |||||||
| 1.37 | %(c) | 1.36 | % | 1.47 | % | 1.39 | % | |||||||
| .38 | %(c) | .15 | % | .20 | % | (.33 | )% | |||||||
See Notes to Financial Statements.
| Strategic Partners International Value Fund | 37 |
Financial Highlights
Cont’d
| Class C | ||||
| Year Ended October 31, 2006(b) | ||||
Per Share Operating Performance: | ||||
Net Asset Value, Beginning Of Year | $ | 21.21 | ||
Income (loss) from investment operations: | ||||
Net investment income (loss) | .23 | |||
Net realized and unrealized gain (loss) on investments and foreign currency transactions | 5.46 | |||
Total from investment operations | 5.69 | |||
Less Dividends and Distributions: | ||||
Dividends from net investment income | (.31 | ) | ||
Distributions from net realized gains | (.32 | ) | ||
Total dividends and distributions | (.63 | ) | ||
Net asset value, end of year | $ | 26.27 | ||
Total Investment Return(a): | 27.53 | % | ||
Ratios/Supplemental Data: | ||||
Net assets, end of year (000) | $ | 15,962 | ||
Average net assets (000) | $ | 14,909 | ||
Ratios to average net assets: | ||||
Expenses, including distribution and service (12b-1) fees | 2.40 | % | ||
Expenses, excluding distribution and service (12b-1) fees | 1.40 | % | ||
Net investment income (loss) | .98 | % | ||
| (a) | These total returns do not consider the effect of sales load. Total return is calculated assuming a purchase of shares on the first day and a sale on the last day of each year reported and includes reinvestment of dividends and distributions. |
| (b) | Calculations are based on the average daily number of shares outstanding. |
| (c) | Effective August 1, 2005 through February 28, 2007, the Manager of the Series has voluntarily agreed to reimburse the Series in order to limit operating expenses (excluding interest, taxes and brokerage commissions) to 2.36% of the average daily net assets of the Class C shares. If the Manager had not reimbursed the Series, the annual expenses (both including and excluding distribution and service (12b-1) fees) and net investment income ratios would be 2.37%, 1.37% and 0.40%, respectively, for the year ended October 31, 2005. |
See Notes to Financial Statements.
| 38 | Visit our website at www.strategicpartners.com |
| Class C | ||||||||||||||
| Year Ended October 31, | ||||||||||||||
| 2005(b) | 2004(b) | 2003(b) | 2002(b) | |||||||||||
| $ | 17.74 | $ | 15.60 | $ | 13.73 | $ | 17.00 | |||||||
| .08 | .06 | .03 | (.05 | ) | ||||||||||
| 3.43 | 2.11 | 1.84 | (2.47 | ) | ||||||||||
| 3.51 | 2.17 | 1.87 | (2.52 | ) | ||||||||||
| (.04 | ) | (.03 | ) | — | — | |||||||||
| — | — | — | (.75 | ) | ||||||||||
| (.04 | ) | (.03 | ) | — | (.75 | ) | ||||||||
| $ | 21.21 | $ | 17.74 | $ | 15.60 | $ | 13.73 | |||||||
| 19.81 | % | 13.90 | % | 13.62 | % | (15.70 | )% | |||||||
| $ | 12,720 | $ | 13,040 | $ | 7,438 | $ | 7,850 | |||||||
| $ | 13,293 | $ | 11,763 | $ | 6,988 | $ | 9,978 | |||||||
| 2.37 | %(c) | 2.36 | % | 2.47 | % | 2.39 | % | |||||||
| 1.37 | %(c) | 1.36 | % | 1.47 | % | 1.39 | % | |||||||
| .40 | %(c) | .33 | % | .18 | % | (.34 | )% | |||||||
See Notes to Financial Statements.
| Strategic Partners International Value Fund | 39 |
Financial Highlights
Cont’d
| Class Z | ||||
| Year Ended October 31, 2006(b) | ||||
Per Share Operating Performance: | ||||
Net Asset Value, Beginning Of Year | $ | 22.02 | ||
Income (loss) from investment operations: | ||||
Net investment income | .28 | |||
Net realized and unrealized gain (loss) on investments and foreign currency transactions | 5.84 | |||
Total from investment operations | 6.12 | |||
Less Dividends and Distributions: | ||||
Dividends from net investment income | (.56 | ) | ||
Distributions from net realized gains | (.32 | ) | ||
Total dividends and distributions | (.88 | ) | ||
Net asset value, end of year | $ | 27.26 | ||
Total Investment Return(a): | 28.78 | % | ||
Ratios/Supplemental Data: | ||||
Net assets, end of year (000) | $ | 177,008 | ||
Average net assets (000) | $ | 170,067 | ||
Ratios to average net assets: | ||||
Expenses, including distribution and service (12b-1) fees | 1.40 | % | ||
Expenses, excluding distribution and service (12b-1) fees | 1.40 | % | ||
Net investment income | 1.13 | % | ||
| (a) | These total returns do not consider the effect of sales load. Total return is calculated assuming a purchase of shares on the first day and a sale on the last day of each year reported and includes reinvestment of dividends and distributions. |
| (b) | Calculations are based on the average daily number of shares outstanding. |
| (c) | Effective August 1, 2005 through February 28, 2007, the Manager of the Series has voluntarily agreed to reimburse the Series in order to limit operating expenses (excluding interest, taxes and brokerage commissions) to 1.36% of the average daily net assets of the Class Z shares. If the Manager had not reimbursed the Series, the annual expenses (both including and excluding distribution and service (12b-1) fees) and net investment income ratios would be 1.37%, 1.37% and 1.43%, respectively, for the year ended October 31, 2005. |
See Notes to Financial Statements.
| 40 | Visit our website at www.strategicpartners.com |
| Class Z | ||||||||||||||
| Year Ended October 31, | ||||||||||||||
| 2005(b) | 2004(b) | 2003(b) | 2002(b) | |||||||||||
| $ | 18.41 | $ | 16.17 | $ | 14.17 | $ | 17.39 | |||||||
| .29 | .20 | .18 | .11 | |||||||||||
| 3.54 | 2.22 | 1.90 | (2.55 | ) | ||||||||||
| 3.83 | 2.42 | 2.08 | (2.44 | ) | ||||||||||
| (.22 | ) | (.18 | ) | (.08 | ) | (.03 | ) | |||||||
| — | — | — | (.75 | ) | ||||||||||
| (.22 | ) | (.18 | ) | (.08 | ) | (.78 | ) | |||||||
| $ | 22.02 | $ | 18.41 | $ | 16.17 | $ | 14.17 | |||||||
| 20.97 | % | 15.09 | % | 14.76 | % | (14.91 | )% | |||||||
| $ | 156,678 | $ | 295,418 | $ | 310,521 | $ | 269,625 | |||||||
| $ | 264,624 | $ | 334,003 | $ | 276,808 | $ | 308,825 | |||||||
| 1.37 | %(c) | 1.36 | % | 1.47 | % | 1.39 | % | |||||||
| 1.37 | %(c) | 1.36 | % | 1.47 | % | 1.39 | % | |||||||
| 1.43 | %(c) | 1.10 | % | 1.22 | % | .68 | % | |||||||
See Notes to Financial Statements.
| Strategic Partners International Value Fund | 41 |
Report of Independent Registered Public
Accounting Firm
The Board of Directors and Shareholders of Prudential World Fund, Inc.—Strategic Partners International Value Fund:
We have audited the accompanying statement of assets and liabilities of the Prudential World Fund, Inc.—Strategic Partners International Value Fund (one of the portfolios constituting the Prudential World Fund, Inc., hereafter referred to as the “Fund”) including the portfolio of investments, as of October 31, 2006, and the related statement of operations for the year then ended, the statement of changes in net assets for each of the years in the two-year period then ended and the financial highlights for each of the years presented in the three-year period then ended. These financial statements and financial highlights are the responsibility of the Funds’ management. Our responsibility is to express an opinion on these financial statements and financial highlights based on our audits. The financial highlights for the years presented prior to the year ended October 31, 2004, were audited by another independent registered public accounting firm whose report dated, December 22, 2003, expressed an unqualified opinion thereon.
We conducted our audit in accordance with the standards of the Public Company Accounting Oversight Board (United States). Those standards require that we plan and perform the audit to obtain reasonable assurance about whether the financial statements and financial highlights are free of material misstatement. An audit includes examining, on a test basis, evidence supporting the amounts and disclosures in the financial statements. Our procedures included confirmation of securities owned as of October 31, 2006, by correspondence with the custodian and brokers or by other appropriate auditing procedures where replies from brokers were not received. An audit also includes assessing the accounting principles used and significant estimates made by management, as well as evaluating the overall financial statement presentation. We believe that our audit provide a reasonable basis for our opinion.
In our opinion, the financial statements and financial highlights referred to above present fairly, in all material respects, the financial position of the Fund as of October 31, 2006, and the results of its operations for the year then ended, and the changes in its net assets for each of the years in the two-year period then ended and the financial highlights for each of the years in the three-year period then ended, in conformity with U.S. generally accepted accounting principles.
KPMG LLP
New York, New York
December 22, 2006
| 42 | Visit our website at www.strategicpartners.com |
Federal Income Tax Information
(Unaudited)
We are required by the Internal Revenue Code to advise you within 60 days of the Series fiscal year end (October 31, 2006) as to the federal income tax status of dividends paid by the Series during such fiscal year. The Series paid dividends as follows:
| Class | ||||||||||||
| A | B | C | Z | |||||||||
Ordinary Income | $ | .82 | $ | .63 | $ | .63 | $ | .88 | ||||
For the fiscal year ended October 31, 2006, the series designated 100.0% as qualified dividend income for the reduced tax rate under the Jobs and Growth Tax Relief Reconciliation Act of 2003.
The Series has elected to give the benefit of foreign tax credits to its shareholders. Accordingly, shareholders who must report their gross income dividends and distributions in a federal income tax return will be entitled to a foreign tax credit, or an itemized deduction in computing their U.S. income tax liability. It is generally more advantageous to claim a credit rather than take a deduction. For the fiscal year ended October 31, 2006 the Series intends on passing through $592,647 of ordinary income distributions as a foreign tax credit from recognized foreign source income of $8,052,992.
In January 2007, you will be advised on IRS Form 1099 DIV or substitute 1099 DIV as to the federal tax status of the dividends and distributions received by you in calendar year 2006.
| Strategic Partners International Value Fund | 43 |
Management of the Fund
(Unaudited)
Information pertaining to the Directors of Prudential World Fund, Inc. (the “Fund”) is set forth below. Directors who are not deemed to be “interested persons” of the Fund, as defined in the Investment Company Act of 1940 (the 1940 Act), are referred to as “Independent Directors.” Directors who are deemed to be “interested persons” of the Fund are referred to as “Interested Directors.” “Fund Complex”† consists of the Fund and any other investment companies managed by PI.
Independent Directors(2)
Linda W. Bynoe (54), Director since 2005(3) Oversees 73 portfolios in Fund complex
Principal occupations (last 5 years): President and Chief Executive Officer (since March 1995) of Telemat, Ltd. (management consulting); formerly Vice President at Morgan Stanley & Co.
Other Directorships held: Director of Simon Property Group, Inc. (real estate investment trust) (since May 2003); Anixter International (communication products distributor) (since January 2006); Director of Northern Trust Corporation (since April 2006).
David E.A. Carson (72), Director since 2003(3) Oversees 77 portfolios in Fund complex
Principal occupations (last 5 years): Formerly Director (January 2000-May 2000), Chairman (January 1999-December 1999), Chairman and Chief Executive Officer (January 1998-December 1998) and President, Chairman and Chief Executive Officer of People’s Bank (1983-1997).
Robert E. La Blanc (72), Director since 1984(3) Oversees 75 portfolios in Fund complex
Principal occupations (last 5 years): President (since 1981) of Robert E. La Blanc Associates, Inc. (telecommunications).
Other Directorships held:(4) Director of Chartered Semiconductor Manufacturing, Ltd. (since 1998); Computer Associates International, Inc. (since 2002) (software company); FiberNet Telecom Group, Inc. (since 2003) (telecom company).
Douglas H. McCorkindale (67), Director since 2003(3) Oversees 73 portfolios in Fund complex
Principal occupations (last 5 years): Formerly Chairman (February 2001- June 2006), Chief Executive Officer (June 2000-July 2005), President (September 1997-July 2005) and Vice Chairman (March 1984-May 2000) of Gannett Co. Inc. (publishing and media).
Other Directorships held:(4) Director of Continental Airlines, Inc. (since May 1993); Director of Lockheed Martin Corp. (aerospace and defense) (since May 2001).
Richard A. Redeker (63), Director since 2003(3) Oversees 74 portfolios in Fund complex
Principal occupations (last 5 years): Management Consultant; Director (since 2001) and Chairman of the Board (since 2006) of Invesmart, Inc.; Director of Penn Tank Lines, Inc. (since 1999).
Robin B. Smith (67), Director since 1996(3) Oversees 75 portfolios in Fund complex
Principal occupations (last 5 years): Chairman of the Board (since January 2003) of Publishers Clearing House (direct marketing); formerly Chairman and Chief Executive Officer (August 1996-January 2003) of Publishers Clearing House.
Other Directorships held:(4) Director of BellSouth Corporation (since 1992).
| 44 | Visit our website at www.strategicpartners.com |
Stephen G. Stoneburn (63), Director since 1996(3) Oversees 75 portfolios in Fund complex
Principal occupations (last 5 years): President and Chief Executive Officer (since June 1996) of Quadrant Media Corp. (publishing company); formerly President (June 1995-June 1996) of Argus Integrated Media, Inc.; Senior Vice President and Managing Director (January 1993-1995) of Cowles Business Media; Senior Vice President of Fairchild Publications, Inc. (1975-1989).
Clay T. Whitehead (68), Director since 1984(3) Oversees 75 portfolios in Fund complex
Principal occupations (last 5 years): President (since 1983) of YCO (new business development firm).
Interested Directors(1)
Judy A. Rice (58), President since 2003 and Director since 2000(3) Oversees 73 portfolios in Fund complex
Principal occupations (last 5 years): President, Chief Executive Officer, Chief Operating Officer and Officer-In-Charge (since February 2003) of Prudential Investments LLC; Vice President (since February 1999) of Prudential Investment Management Services LLC; President, Chief Executive Officer and Officer-In-Charge (since April 2003) of Prudential Mutual Fund Services LLC; formerly Director (May 2003-March 2006) and Executive Vice President (June 2005-March 2006) of American Skandia Investment Services, Inc.; formerly Executive Vice President (September 1999-February 2003) of Prudential Investments LLC; Member of Board of Governors of the Investment Company Institute.
Robert F. Gunia (60), Vice President and Director since 1996(3) Oversees 153 portfolios in Fund complex
Principal occupations (last 5 years): Chief Administrative Officer (since September 1999) and Executive Vice President (since December 1996) of Prudential Investments LLC; President (since April 1999) of Prudential Investment Management Services LLC; Executive Vice President (since March 1999) and Treasurer (since May 2000) of Prudential Mutual Fund Services LLC; Chief Administrative Officer, Executive Vice President and Director (since May 2003) of American Skandia Investment Services, Inc.
Other Directorships held:(4) Vice President and Director (since May 1989) and Treasurer (since 1999) of The Asia Pacific Fund, Inc.
Information pertaining to the Officers of the Fund who are not also Directors is set forth below.
Officers(2)
Kathryn L. Quirk (54), Chief Legal Officer since 2005(3)
Principal occupations (last 5 years): Vice President and Corporate Counsel (since September 2004) of Prudential; Executive Vice President, Chief Legal Officer and Secretary (since July 2005) of Prudential Investments LLC and Prudential Mutual Fund Services LLC; formerly Managing Director, General Counsel, Chief Compliance Officer, Chief Risk Officer and Corporate Secretary (1997-2002) of Zurich Scudder Investments, Inc.
Deborah A. Docs (48), Secretary since 2005(3)
Principal occupations (last 5 years): Vice President and Corporate Counsel (since January 2001) of Prudential; Vice President (since December 1996) and Assistant Secretary (since March 1999) of PI; formerly Vice President and Assistant Secretary (May 2003-June 2005) of American Skandia Investment Services, Inc.
Jonathan D. Shain (48), Assistant Secretary since 2005(3)
Principal occupations (last 5 years): Vice President and Corporate Counsel (since August 1998) of Prudential; Vice President and Assistant Secretary (since May 2001) of PI; Vice President and Assistant Secretary (since February 2001) of PMFS; formerly Vice President and Assistant Secretary (May 2003-June 2005) of American Skandia Investment Services, Inc.
| Strategic Partners International Value Fund | 45 |
Claudia DiGiacomo (32), Assistant Secretary since 2005(3)
Principal occupations (last 5 years): Vice President and Corporate Counsel (since January 2005) of Prudential; Vice President and Assistant Secretary of PI (since December 2005); Associate at Sidley Austin Brown & Wood LLP (1999-2004).
Lee D. Augsburger (47), Chief Compliance Officer since 2004(3)
Principal occupations (last 5 years): Senior Vice President and Chief Compliance Officer (since April 2003) of PI; Vice President (since November 2000) and Chief Compliance Officer (since October 2000) of Prudential Investment Management, Inc.; Chief Compliance Officer and Senior Vice President (since May 2003) of American Skandia Investment Services, Inc.
Grace C. Torres (47), Treasurer and Principal Financial and Accounting Officer since 1995(3)
Principal occupations (last 5 years): Assistant Treasurer (since March 1999) and Senior Vice President (since September 1999) of PI; Assistant Treasurer (since May 2003) and Vice President (since June 2005) of American Skandia Investment Services, Inc.; Senior Vice President and Assistant Treasurer (since May 2003) of American Skandia Advisory Services, Inc.; formerly Senior Vice President (May 2003-June 2005) of American Skandia Investment Services, Inc.
John P. Schwartz (35), Assistant Secretary since 2006(3)
Principal occupations (last 5 years): Vice President and Corporate Counsel (since April 2005) of Prudential; Vice President and Assistant Secretary of PI (since December 2005); Associate at Sidley, Austin Brown & Wood LLP (1997-2005).
M. Sadiq Peshimam (42), Assistant Treasurer since 2006(3)
Principal occupations (last 5 years): Vice President (since 2005) and Director (2000-2005) within Prudential Mutual Fund Administration.
Jack Benintende (42), Assistant Treasurer since 2006(3)
Principal occupations (last 5 years): Vice President (since June 2000) within Prudential Mutual Fund Administration; formerly Senior Manager within the investment management practice of PricewaterhouseCoopers LLP (May 1994 through June 2000).
Andrew R. French (44), Assistant Secretary since October 2006(3)
Principal occupations (last 5 years): Director and Corporate Counsel (since May 2006) of Prudential; formerly Senior Legal Analyst of Prudential Mutual Fund Law Department (1997-2006).
Noreen M. Fierro (42), Anti-Money Laundering Compliance Officer since October 2006(3)
Principal occupations (last 5 years): Vice President, Corporate Compliance (since May 2006) of Prudential; formerly Corporate Vice President, Associate General Counsel (April 2002-May 2005) of UBS Financial Services, Inc., in their Money Laundering Prevention Group; Senior Manager (May 2005-May 2006) of Deloitte Financial Advisory Services, LLP, in their Forensic and Dispute Services, Anti-Money Laundering Group.
| 46 | Visit our website at www.strategicpartners.com |
| † | The Fund Complex consists of all investment companies managed by PI. The Funds for which PI serves as manager include Jennison Dryden Mutual Funds, Strategic Partners Funds, The Prudential Variable Contract Accounts 2, 10, 11. The Target Portfolio Trust, The Prudential Series Fund, The High Yield Income Fund, Inc., The High Yield Plus Fund, Inc., Nicholas-Applegate Fund, Inc., American Skandia Trust, and Prudential’s Gibraltar Fund, Inc. |
| (1) | “Interested” Directors, as defined in the 1940 Act, by reason of employment with the Manager, a Subadvisor or the Distributor. |
| (2) | Unless otherwise noted, the address of the Directors and Officers is c/o: Prudential Investments LLC, Gateway Center Three, 100 Mulberry Street, Newark, NJ 07102. |
| (3) | There is no set term of office for Directors and Officers. The Independent Directors have adopted a retirement policy, which calls for the retirement of Directors on December 31 of the year in which they reach the age of 75. The table shows the individual’s length of service as Directors and/or Officer. |
| (4) | This includes only directorships of companies required to register, or file reports with the SEC under the Securities and Exchange Act of 1934 (that is, “public companies”) or other investment companies registered under the 1940 Act. |
Additional Information about the Directors is included in the Statement of Additional Information which is available without charge, upon request, by calling (800) 521-7466 or (732) 482-7555 (Calling from outside the U.S.)
| Strategic Partners International Value Fund | 47 |
Approval of Advisory Agreements
The Board of Directors (the “Board”) of Prudential World Fund, Inc. oversees the management of Strategic Partners International Value Fund (the “Fund”) and, as required by law, determines annually whether to renew the Fund’s management agreement with Prudential Investments LLC (“PI”) and the Fund’s subadvisory agreements with LSV Asset Management (“LSV”) and Thornburg Investment Management, Inc. (“Thornburg”). In considering the renewal of the agreements, the Board, including all of the Independent Directors, met on June 7-8, 2006 and approved the renewal of the agreements through July 31, 2007, after concluding that renewal of the agreements was in the best interests of the Fund and its shareholders.
In advance of the meetings, the Board received materials relating to the agreements, and had the opportunity to ask questions and request further information in connection with their consideration. Among other things, the Board considered comparisons with other mutual funds in relevant Peer Universes and Peer Groups. The mutual funds included in each Peer Universe or Peer Group were objectively determined solely by Lipper Inc., an independent provider of mutual fund data. The comparisons placed the Fund in various quartiles over one-year, three-year and five-year time periods ending December 31, with the first quartile being the best 25% of the mutual funds (for performance, the best performing mutual funds and, for expenses, the lowest cost mutual funds).
In approving the agreements, the Board, including the Independent Directors advised by independent legal counsel, considered the factors they deemed relevant, including the nature, quality and extent of services provided, the performance of the Fund, the profitability of PI and its affiliates, expenses and fees, and the potential for economies of scale that may be shared with the Fund and its shareholders. In their deliberations, the Directors did not identify any single factor that was dispositive and each Director attributed different weights to the various factors. In connection with their deliberations, the Board considered information provided by PI throughout the year at regular Board meetings, presentations from portfolio managers and other information, as well as information furnished at or in advance of the meetings on June 7-8, 2006.
The Board further noted that at the June 7-8 meetings, PI had provided the Directors with a preliminary overview of potential fund reorganizations among various PI-managed mutual funds, which included the Fund. PI advised the Board at the meetings that it expected to formally submit the proposed reorganizations to the Directors for consideration at a subsequent special meeting of the Board.
The Directors determined that the overall arrangements between the Fund and PI, which serves as the Fund’s investment manager pursuant to a management
| Strategic Partners International Value Fund |
Approval of Advisory Agreements (continued)
agreement, and between PI and each of LSV and Thornburg, which serve as the Fund’s subadvisers pursuant to the terms of subadvisory agreements with PI, are fair and reasonable in light of the services performed, fees charged and such other matters as the Directors considered relevant in the exercise of their business judgment.
Several of the material factors and conclusions that formed the basis for the Directors reaching their determinations to approve the continuance of the agreements are separately discussed below.
Nature, Quality and Extent of Services
The Board received and considered information regarding the nature and extent of services provided to the Fund by PI and LSV and Thornburg. The Board considered the services provided by PI, including but not limited to the oversight of the subadvisers for the Fund, as well as the provision of fund recordkeeping, compliance, and other services to the Fund. With respect to PI’s oversight of the subadvisers, the Board noted that PI’s Strategic Investment Research Group (“SIRG”), which is a business unit of PI, is responsible for screening and recommending new subadvisers when appropriate, as well as monitoring and reporting to the Board on the performance and operations of the subadvisers. The Board also considered that PI pays the salaries of all of the officers and non-independent Directors of the Fund. The Board also considered the investment subadvisory services provided by LSV and Thornburg, as well as adherence to the Fund’s investment restrictions and compliance with applicable Fund policies and procedures.
The Board reviewed the qualifications, backgrounds and responsibilities of PI’s senior management responsible for the oversight of the Fund and LSV and Thornburg, and also reviewed the qualifications, backgrounds and responsibilities of the LSV and Thornburg portfolio managers who are responsible for the day-to-day management of the Fund’s portfolio. The Board was provided with information pertaining to PI’s and LSV’s and Thornburg’s organizational structure, senior management, investment operations, and other relevant information pertaining to PI and LSV and Thornburg. The Board also noted that it received favorable compliance reports from the Fund’s Chief Compliance Officer (“CCO”) as to each of PI and LSV and Thornburg.
The Board concluded that it was satisfied with the nature, extent and quality of the investment management services provided by PI and the subadvisory services provided to the Fund by LSV and Thornburg, and that there was a reasonable basis on which to conclude that the Fund benefits from the services provided by PI and LSV and Thornburg under the management and subadvisory agreements.
| Visit our website at www.strategicpartners.com |
Performance of Strategic Partners International Value Fund
The Board received and considered information about the Fund’s historical performance, noting that the Fund had achieved performance that was in the second quartile over a one-year period, and performance that was in the fourth quartile over three-year and five-year time periods ending December 31 in relation to the group of comparable funds in a Peer Universe. The Board also considered the separate performance of the “sleeves” of the Fund managed by LSV and Thornburg.
The Board noted that the Fund’s recent performance had improved, but expressed disappointment in the Fund’s long-term performance over the three-year and five-year time periods. The Board further noted, however, that since the current subadvisers assumed responsibility for the Fund in late 2004, the Fund had outperformed against its benchmark index as well as the median of the Peer Universe.
In light of the fact that a proposal to reorganize the Fund was expected to be submitted to the Board by PI in the near future, the Board concluded that it was reasonable to approve the continuance of the management and subadvisory agreements on an interim basis pending Board and shareholder consideration of the possible reorganization of the Fund.
Fees and Expenses
The Board considered the management fee for the Fund as compared to the management fee charged by PI to other funds and accounts and the fee charged by other advisers to comparable mutual funds.
The Fund’s management fee ranked in the first quartile in its Peer Group. The Board concluded that the management and subadvisory fees were reasonable. The Board accepted PI’s recommendation to continue the existing voluntary cap on Fund expenses (exclusive of 12b-1 and certain other fees) at 1.36% of average net assets.
The Board further noted that during 2005 and continuing through 2006, several initiatives had commenced which, when fully implemented, were expected to result in cost savings and expense reductions for the Fund.
Costs of Services and Profits Realized by PI
The Board was provided with information on the profitability of PI and its affiliates in serving as the Fund’s investment manager. The Board discussed with PI the methodology utilized in assembling the information regarding profitability and considered its reasonableness. The Board recognized that it is difficult to make
| Strategic Partners International Value Fund |
Approval of Advisory Agreements (continued)
comparisons of profitability from fund management contracts because comparative information is not generally publicly available and is affected by numerous factors, including the structure of the particular adviser, the types of funds it manages, its business mix, numerous assumptions regarding allocations and the adviser’s capital structure and cost of capital. Taking these factors into account, the Board concluded that the profitability of PI and its affiliates in relation to the services rendered was not unreasonable.
The Board considered information about the profitability of LSV or Thornburg, but concluded that the level of a subadviser’s profitability may not be as significant given the arm’s length nature of the process by which the subadvisory fee rates were negotiated by PI, LSV and Thornburg as well as the fact that PI compensates the subadvisers out of its management fee.
Economies of Scale
The Board noted that the management fee schedule for the Fund includes breakpoints, which have the effect of decreasing the fee rate as assets increase, but at the current level of assets the Fund does not realize the effect of those rate reductions. The Board received and discussed information concerning whether PI realizes economies of scale as the Fund’s assets grow beyond current levels. The Board took note that the Fund’s fee structure would result in benefits to Fund shareholders when (and if) assets reach the levels at which the fee rate is reduced. These benefits will accrue whether or not PI is then realizing any economies of scale.
Other Benefits to PI, LSV and Thornburg
The Board considered potential ancillary benefits that might be received by PI, LSV and Thornburg and their affiliates as a result of their relationship with the Fund. The Board concluded that potential benefits to be derived by PI included brokerage commissions received by affiliates of PI, transfer agency fees received by the Fund’s transfer agent (which is affiliated with PI), as well as reputational or other intangible benefits resulting from PI’s association with the Fund. The Board concluded that the potential benefits to be derived by LSV and Thornburg included their ability to use soft dollar credits, brokerage commissions received by affiliates of LSV or Thornburg, as well as the potential benefits consistent with those generally resulting from an increase in assets under management, specifically, potential access to additional research resources and reputational benefits. The Board concluded that the benefits derived by PI and LSV and Thornburg were consistent with the types of benefits generally derived by investment managers and subadvisers to mutual funds.
| Visit our website at www.strategicpartners.com |
Growth of a $10,000 Investment
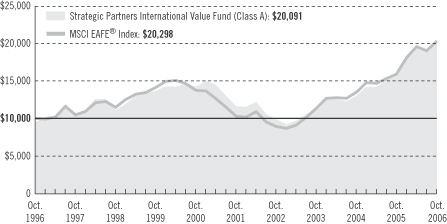
| Average Annual Total Returns (With Sales Charges) as of 10/31/06 | |||||||||
| One Year | Five Years | Ten Years | |||||||
Class A | 21.52 | % | 10.35 | % | 7.23 | % | |||
Class B | 22.51 | 10.62 | 7.01 | ||||||
Class C | 26.53 | 10.76 | 7.02 | ||||||
Class Z | 28.78 | 11.85 | 8.09 | ||||||
| Average Annual Total Returns (Without Sales Charges) as of 10/31/06 | |||||||||
| One Year | Five Years | Ten Years | |||||||
Class A | 28.59 | % | 11.61 | % | 7.83 | % | |||
Class B | 27.51 | 10.75 | 7.01 | ||||||
Class C | 27.53 | 10.76 | 7.02 | ||||||
Class Z | 28.78 | 11.85 | 8.09 | ||||||
Performance data quoted represent past performance. Past performance does not guarantee future results. The investment return and principal value of an investment will fluctuate, so that an investor’s shares, when redeemed, may be worth more or less than their original cost. Current performance may be lower or higher than the past performance data quoted. An investor may obtain performance data as of the most recent month-end by visiting our website at www.strategicpartners.com or by calling (800) 225-1852. The maximum initial sales charge is 5.50%.
The returns in the graph and the tables do not reflect the deduction of taxes that a shareholder would pay on Fund distributions or following the redemption of Fund shares.
| Visit our website at www.strategicpartners.com |
Source: Prudential Investments LLC and Lipper Inc.
The graph compares a $10,000 investment in the Strategic Partners International Value Fund (Class A shares) with a similar investment in the MSCI EAFE® Index by portraying the initial account values at the commencement of operations of Class A shares (September 23, 1996) and the account values at the end of the current fiscal year (October 31, 2006) as measured on a quarterly basis. For purposes of the graph, and unless otherwise indicated, it has been assumed that (a) the maximum applicable front-end sales charge was deducted from the initial $10,000 investment in Class A shares; (b) all recurring fees (including management fees) were deducted; and (c) all dividends and distributions were reinvested. The line graph provides information for Class A shares only. As indicated in the tables provided earlier, performance for Class B, Class C, and Class Z shares will vary due to the differing charges and expenses applicable to each share class (as indicated in the following paragraphs). Without a contractual distribution and service (12b-1) fee waiver of 0.05% for Class A shares through October 31, 2006, the returns shown in the graph and for Class A shares in the tables would have been lower.
The MSCI EAFE® Index is an unmanaged, weighted index of performance that reflects stock price movements of developed-country markets in Europe, Australasia, and the Far East. The MSCI EAFE® Index’s total returns include the reinvestment of all dividends, but do not include the effects of sales charges, operating expenses of a mutual fund, or taxes. These returns would be lower if they included the effects of sales charges, operating expenses, or taxes. The securities that comprise the MSCI EAFE® Index may differ substantially from the securities in the Fund. The MSCI EAFE® Index is not the only index that may be used to characterize performance of international stock funds. Other indexes may portray different comparative performance. Investors cannot invest directly in an index.
Class A shares are subject to a maximum front-end sales charge of 5.50%, a 12b-1 fee of up to 0.30% annually, and all investors who purchase Class A shares in an amount of $1 million or more and sell these shares within 12 months of purchase are subject to a contingent deferred sales charge (CDSC) of 1%, in certain circumstances. Class B shares are subject to a declining CDSC of 5%, 4%, 3%, 2%, 1%, and 1%, respectively, for the first six years after purchase and a 12b-1 fee of 1% annually. Approximately seven years after purchase, Class B shares will automatically convert to Class A shares on a quarterly basis. Class C shares purchased are not subject to a front-end sales charge, but charge a CDSC of 1% for Class C shares sold within 12 months from the date of purchase, and an annual 12b-1 fee of 1%. Class Z shares are not subject to a sales charge or 12b-1 fees. The returns in the graph and tables reflect the share class expense structure in effect at the close of the fiscal period.
| Strategic Partners International Value Fund |
| n MAIL | n TELEPHONE | n WEBSITE | ||
Gateway Center Three 100 Mulberry Street Newark, NJ 07102 | (800) 225-1852 | www.strategicpartners.com |
| PROXY VOTING |
| The Board of Directors of the Fund has delegated to the Fund’s investment subadvisers the responsibility for voting any proxies and maintaining proxy recordkeeping with respect to the Fund. A description of these proxy voting policies and procedures is available without charge, upon request, by calling (800) 225-1852 or by visiting the Securities and Exchange Commission’s website at www.sec.gov. Information regarding how the Fund voted proxies relating to portfolio securities during the most recent 12-month period ended June 30 is available on the Fund’s website and on the Commission’s website. |
| DIRECTORS |
| Linda W. Bynoe • David E.A. Carson • Robert F. Gunia • Robert E. La Blanc • Douglas H. McCorkindale • Richard A. Redeker • Judy A. Rice • Robin B. Smith • Stephen G. Stoneburn • Clay T. Whitehead |
| OFFICERS |
| Judy A. Rice, President • Robert F. Gunia, Vice President • Grace C. Torres, Treasurer and Principal Financial and Accounting Officer • Kathryn L. Quirk, Chief Legal Officer • Deborah A. Docs, Secretary • Lee D. Augsburger, Chief Compliance Officer • Noreen M. Fierro, Anti-Money Laundering Compliance Officer • Jonathan D. Shain, Assistant Secretary • Claudia DiGiacomo, Assistant Secretary • John P. Schwartz, Assistant Secretary • Andrew R. French, Assistant Secretary • Jack Benintende, Assistant Treasurer • M. Sadiq Peshimam, Assistant Treasurer |
| MANAGER | Prudential Investments LLC | Gateway Center Three 100 Mulberry Street Newark, NJ 07102 | ||
| INVESTMENT SUBADVISERS | LSV Asset Management Thornburg Investment Management, Inc. | One North Wacker Drive Suite 4000 Chicago, IL 60606 119 East Marcy Street Santa Fe, NM 87501 | ||
| DISTRIBUTOR | Prudential Investment Management Services LLC | Gateway Center Three 100 Mulberry Street Newark, NJ 07102 | ||
| CUSTODIAN | PFPC Trust Company | 400 Bellevue Parkway Wilmington, DE 19809 | ||
| TRANSFER AGENT | Prudential Mutual Fund Services LLC | PO Box 8098 Philadelphia, PA 19176 | ||
| INDEPENDENT REGISTERED PUBLIC ACCOUNTING FIRM | KPMG LLP | 345 Park Avenue New York, NY 10154 | ||
| FUND COUNSEL | Sullivan & Cromwell LLP | 125 Broad Street New York, NY 10004 | ||
An investor should consider the investment objectives, risks, charges, and expenses of the Fund carefully before investing. The prospectus for the Fund contains this and other information about the Fund. An investor may obtain a prospectus by visiting our website at www.strategicpartners.com or by calling (800) 225-1852. The prospectus should be read carefully before investing.
E-DELIVERY
To receive your mutual fund documents on-line, go to www.icsdelivery.com/prudential/funds and enroll. Instead of receiving printed documents by mail, you will receive notification via e-mail when new materials are available. You can cancel your enrollment or change your e-mail address at any time by clicking on the change/cancel enrollment option at the icsdelivery website address.
SHAREHOLDER COMMUNICATIONS WITH DIRECTORS
Shareholders can communicate directly with the Board of Directors by writing to the Chair of the Board, Strategic Partners International Value Fund, PO Box 13964, Philadelphia, PA 19176. Shareholders can communicate directly with an individual Director by writing to the same address. Communications are not screened before being delivered to the addressee.
AVAILABILITY OF PORTFOLIO SCHEDULE
The Fund files its complete schedule of portfolio holdings with the Securities and Exchange Commission for the first and third quarters of each fiscal year on Form N-Q. The Fund’s Forms N-Q are available on the Commission’s website at www.sec.gov. The Fund’s Forms N-Q may also be reviewed and copied at the Commission’s Public Reference Room in Washington, D.C. Information on the operation and location of the Public Reference Room may be obtained by calling (800) SEC-0330 (732-0330). The Fund’s schedule of portfolio holdings is also available on the Fund’s website as of the end of each fiscal quarter.
The Fund’s Statement of Additional Information contains additional information about the Fund’s Directors and is available without charge, upon request, by calling (800) 225-1852.
Mutual Funds:
| ARE NOT INSURED BY THE FDIC OR ANY FEDERAL GOVERNMENT AGENCY | MAY LOSE VALUE | ARE NOT A DEPOSIT OF OR GUARANTEED BY ANY BANK OR ANY BANK AFFILIATE |

| Strategic Partners International Value Fund | ||||||||||||
| Share Class | A | B | C | Z | ||||||||
NASDAQ | PISAX | PISBX | PCISX | PISZX | ||||||||
CUSIP | 743969503 | 743969602 | 743969701 | 743969800 | ||||||||
MFSP115E IFS-A127718 Ed. 12/2006
Item 2 – Code of Ethics — See Exhibit (a)
As of the end of the period covered by this report, the registrant has adopted a code of ethics (the “Section 406 Standards for Investment Companies – Ethical Standards for Principal Executive and Financial Officers”) that applies to the registrant’s Principal Executive Officer and Principal Financial Officer; the registrant’s Principal Financial Officer also serves as the Principal Accounting Officer.
The registrant hereby undertakes to provide any person, without charge, upon request, a copy of the code of ethics. To request a copy of the code of ethics, contact the registrant 973-367-7521, and ask for a copy of the Section 406 Standards for Investment Companies - Ethical Standards for Principal Executive and Financial Officers.
Item 3 – Audit Committee Financial Expert –
The registrant’s Board has determined that Mr. David E. A. Carson, member of the Board’s Audit Committee is an “audit committee financial expert,” and that he is “independent,” for purposes of this Item.
Item 4 – Principal Accountant Fees and Services –
(a) Audit Fees
For the fiscal years ended October 31, 2006 and October 31, 2005, KPMG LLP (“KPMG”), the Registrant’s principal accountant, billed the Registrant $107,200 (includes fees for consents issued in connection with SEC filings) and $66,200, respectively, for professional services rendered for the audit of the Registrant’s annual financial statements or services that are normally provided in connection with statutory and regulatory filings.
(b) Audit-Related Fees
None.
(c) Tax Fees
None.
(d) All Other Fees
None.
(e) (1) Audit Committee Pre-Approval Policies and Procedures
THE PRUDENTIAL MUTUAL FUNDS
AUDIT COMMITTEE POLICY
on
Pre-Approval of Services Provided by the Independent Accountants
The Audit Committee of each Prudential Mutual Fund is charged with the responsibility to monitor the independence of the Fund’s independent accountants. As part of this responsibility, the Audit Committee must pre-approve any independent accounting firm’s engagement to render audit and/or permissible non-audit services, as required by law. In evaluating a proposed engagement of the independent accountants, the Audit Committee will assess the effect that the engagement might reasonably be expected to have on the accountant’s independence. The Committee’s evaluation will be based on:
| • | a review of the nature of the professional services expected to be provided, |
| • | a review of the safeguards put into place by the accounting firm to safeguard independence, and |
| • | periodic meetings with the accounting firm. |
Policy for Audit and Non-Audit Services Provided to the Funds
On an annual basis, the scope of audits for each Fund, audit fees and expenses, and audit-related and non-audit services (and fees proposed in respect thereof) proposed to be performed by the Fund’s independent accountants will be presented by the Treasurer and the independent accountants to the Audit Committee for review and, as appropriate, approval prior to the initiation of such services. Such presentation shall be accompanied by confirmation by both the Treasurer and the independent accountants that the proposed services will not adversely affect the independence of the independent accountants. Proposed services shall be described in sufficient detail to enable the Audit Committee to assess the appropriateness of such services and fees, and the compatibility of the provision of such services with the auditor’s independence. The Committee shall receive periodic reports on the progress of the audit and other services which are approved by the Committee or by the Committee Chair pursuant to authority delegated in this Policy.
The categories of services enumerated under “Audit Services”, “Audit-related Services”, and “Tax Services” are intended to provide guidance to the Treasurer and the independent accountants as to those categories of services which the Committee believes are generally consistent with the independence of the independent accountants and which the Committee (or the Committee Chair) would expect upon the presentation of specific proposals to pre-approve. The enumerated categories are not intended as an exclusive list of audit, audit-related or tax services, which the Committee (or the Committee Chair) would consider for pre-approval.
Audit Services
The following categories of audit services are considered to be consistent with the role of the Fund’s independent accountants:
| • | Annual Fund financial statement audits |
| • | Seed audits (related to new product filings, as required) |
| • | SEC and regulatory filings and consents |
Audit-related Services
The following categories of audit-related services are considered to be consistent with the role of the Fund’s independent accountants:
| • | Accounting consultations |
| • | Fund merger support services |
| • | Agreed Upon Procedure Reports |
| • | Attestation Reports |
| • | Other Internal Control Reports |
Individual audit-related services that fall within one of these categories and are not presented to the Audit Committee as part of the annual pre-approval process will be subject to pre-approval by the Committee Chair (or any other Committee member on whom this responsibility has been delegated) so long as the estimated fee for those services does not exceed $50,000.
Tax Services
The following categories of tax services are considered to be consistent with the role of the Fund’s independent accountants:
| • | Tax compliance services related to the filing or amendment of the following: |
| • | Federal, state and local income tax compliance; and, |
| • | Sales and use tax compliance |
| • | Timely RIC qualification reviews |
| • | Tax distribution analysis and planning |
| • | Tax authority examination services |
| • | Tax appeals support services |
| • | Accounting methods studies |
| • | Fund merger support services |
| • | Tax consulting services and related projects |
Individual tax services that fall within one of these categories and are not presented to the Audit Committee as part of the annual pre-approval process will be subject to pre-approval by the Committee Chair (or any other Committee member on whom this responsibility has been delegated) so long as the estimated fee for those services does not exceed $50,000.
Other Non-audit Services
Certain non-audit services that the independent accountants are legally permitted to render will be subject to pre-approval by the Committee or by one or more Committee members to whom the Committee has delegated this authority and who will report to the full Committee any pre-approval decisions made pursuant to this Policy. Non-audit services presented for pre-approval pursuant to this paragraph will be accompanied by a confirmation from both the Treasurer and the independent accountants that the proposed services will not adversely affect the independence of the independent accountants.
Proscribed Services
The Fund’s independent accountants will not render services in the following categories of non-audit services:
| • | Bookkeeping or other services related to the accounting records or financial statements of the Fund |
| • | Financial information systems design and implementation |
| • | Appraisal or valuation services, fairness opinions, or contribution-in-kind reports |
| • | Actuarial services |
| • | Internal audit outsourcing services |
| • | Management functions or human resources |
| • | Broker or dealer, investment adviser, or investment banking services |
| • | Legal services and expert services unrelated to the audit |
| • | Any other service that the Public Company Accounting Oversight Board determines, by regulation, is impermissible. |
Pre-approval of Non-Audit Services Provided to Other Entities Within the Prudential Fund Complex
Certain non-audit services provided to Prudential Investments LLC or any of its affiliates that also provide ongoing services to the Prudential Mutual Funds will be subject to pre-approval by the Audit Committee. The only non-audit services provided to these entities that will require pre-approval are those related directly to the operations and financial reporting of the Funds. Individual projects that are not presented to the Audit Committee as part of the annual pre-approval process will be subject to pre-approval by the Committee Chair (or any other Committee member on whom this responsibility has been delegated) so long as the estimated fee for those services does not exceed $50,000. Services presented for pre-approval pursuant to this paragraph will be accompanied by a confirmation from both the Treasurer and the independent accountants that the proposed services will not adversely affect the independence of the independent accountants.
Although the Audit Committee will not pre-approve all services provided to Prudential Investments LLC and its affiliates, the Committee will receive an annual report from the Fund’s independent accounting firm showing the aggregate fees for all services provided to Prudential Investments and its affiliates.
(e) (2) Percentage of services referred to in 4(b)- (4)(d) that were approved by the audit committee –
Not applicable.
(f) Percentage of hours expended attributable to work performed by other than full time employees of principal accountant if greater than 50%.
Not applicable.
(g) Non-Audit Fees
Not applicable to Registrant for the fiscal years 2006 and 2005. The aggregate non-audit fees billed by KPMG for services rendered to the registrant’s investment adviser and any entity controlling, controlled by, or under common control with the investment adviser that provides ongoing services to the registrant for the fiscal years 2006 and 2005 was $317,300 and $51,000, respectively.
(h) Principal Accountant’s Independence
Not applicable as KPMG has not provided non-audit services to the registrant’s investment adviser and any entity controlling, controlled by, or under common control with the investment adviser that provides ongoing services to the registrant that were not pre-approved pursuant to Rule 2-01(c)(7)(ii) of Regulation S-X.
Item 5 – Audit Committee of Listed Registrants – Not applicable.
Item 6 – Schedule of Investments – The schedule is included as part of the report to shareholders filed under Item 1 of this Form.
Item 7 – Disclosure of Proxy Voting Policies and Procedures for Closed-End Management Investment Companies – Not applicable.
Item 8 – Portfolio Managers of Closed-End Management Investment Companies – Not applicable.
Item 9 – Purchases of Equity Securities by Closed-End Management Investment Company and Affiliated Purchasers – Not applicable.
Item 10 – Submission of Matters to a Vote of Security Holders – Not applicable.
Item 11 – Controls and Procedures
| (a) | It is the conclusion of the registrant’s principal executive officer and principal financial officer that the effectiveness of the registrant’s current disclosure controls and procedures (such disclosure controls and procedures having been evaluated within 90 days of the date of this filing) provide reasonable assurance that the information required to be disclosed by the registrant has been recorded, processed, summarized and reported within the time period specified in the Commission’s rules and forms and that the information required to be disclosed by the registrant has been accumulated and communicated to the registrant’s principal executive officer and principal financial officer in order to allow timely decisions regarding required disclosure. |
| (b) | There has been no significant change in the registrant’s internal control over financial reporting that occurred during the registrant’s most recent fiscal quarter of the period covered by this report that has materially affected, or is likely to materially affect, the registrant’s internal control over financial reporting. |
Item 12 – Exhibits
| (a) | (1) Code of Ethics – Attached hereto as Exhibit EX-99.CODE-ETH | |
(2) Certifications pursuant to Section 302 of the Sarbanes-Oxley Act – Attached hereto as Exhibit EX-99.CERT. | ||
(3) Any written solicitation to purchase securities under Rule 23c-1. – Not applicable. | ||
(b) | Certifications pursuant to Section 906 of the Sarbanes-Oxley Act – Attached hereto as Exhibit EX-99.906CERT. | |
SIGNATURES
Pursuant to the requirements of the Securities Exchange Act of 1934 and the Investment Company Act of 1940, the registrant has duly caused this report to be signed on its behalf by the undersigned, thereunto duly authorized.
| (Registrant) Prudential World Fund, Inc. | ||
| By (Signature and Title)* | /s/ Deborah A. Docs | |
| Deborah A. Docs | ||
| Secretary | ||
| Date December 22, 2006 | ||
Pursuant to the requirements of the Securities Exchange Act of 1934 and the Investment Company Act of 1940, this report has been signed below by the following persons on behalf of the registrant and in the capacities and on the dates indicated.
| By (Signature and Title)* | /s/ Judy A. Rice | |
| Judy A. Rice | ||
| President and Principal Executive Officer | ||
| Date December 22, 2006 | ||
| By (Signature and Title)* | /s/ Grace C. Torres | |
| Grace C. Torres | ||
| Treasurer and Principal Financial Officer | ||
| Date December 22, 2006 | ||
| * | Print the name and title of each signing officer under his or her signature. |