UNITED STATES
SECURITIES AND EXCHANGE COMMISSION
Washington, D.C. 20549
FORM N-CSR
CERTIFIED SHAREHOLDER REPORT OF REGISTERED MANAGEMENT
INVESTMENT COMPANIES
| | |
Investment Company Act file number: | | 811-03981 |
| |
Exact name of registrant as specified in charter: | | Prudential World Fund, Inc. |
| |
Address of principal executive offices: | | Gateway Center 3,
100 Mulberry Street,
Newark, New Jersey 07102 |
| |
Name and address of agent for service: | | Jonathan D. Shain
Gateway Center 3,
100 Mulberry Street,
Newark, New Jersey 07102 |
| |
Registrant’s telephone number, including area code: | | 973-802-6469 |
| |
Date of fiscal year end: | | 10/31/2004 |
| |
Date of reporting period: | | 10/31/2004 |
Item 1 – Reports to Stockholders – [ INSERT REPORT ]

Jennison Global Growth Fund
| | |
| OCTOBER 31, 2004 | | ANNUAL REPORT |

FUND TYPE
Global stock
OBJECTIVE
Long-term growth of capital
This report is not authorized for distribution to prospective investors unless preceded or accompanied by a current prospectus.
The views expressed in this report and information about the Fund’s portfolio holdings are for the period covered by this report and are subject to change thereafter.
JennisonDryden is a registered trademark of The Prudential Insurance Company of America.

Dear Shareholder,
December 15, 2004
We hope that you find the annual report for the Jennison Global Growth Fund informative and useful. As a JennisonDryden mutual fund shareholder, you may be thinking where you can find additional growth opportunities. You could invest in last year’s top-performing asset class and hope that history repeats itself or you could stay in cash while waiting for the “right moment” to invest.
We believe it is wise to take advantage of developing domestic and global investment opportunities through a diversified portfolio of stock and bond mutual funds. A diversified asset allocation offers two advantages. It helps you manage downside risk by not being overly exposed to any particular asset class, plus it gives you a better opportunity of having at least some of your assets in the right place at the right time. Your financial professional can help you create a diversified investment plan that may include mutual funds that cover all the basic asset classes and is reflective of your personal investor profile and tolerance for risk.
JennisonDryden mutual funds give you a wide range of choices that can help you make progress toward your financial goals. Our funds offer the experience, resources, and professional discipline of three leading asset managers. They are recognized and respected in the institutional market and by discerning investors for excellence in their respective strategies. JennisonDryden equity funds are advised by Jennison Associates LLC and/or Quantitative Management Associates LLC (QMA). Prudential Investment Management, Inc. (PIM) advises the JennisonDryden fixed income and money market funds. Jennison Associates, QMA, and PIM are registered investment advisers and Prudential Financial companies.
Thank you for choosing JennisonDryden mutual funds.
Sincerely,

Judy A. Rice, President
Jennison Global Growth Fund
| | |
| Jennison Global Growth Fund | | 1 |
Your Fund’s Performance
Fund objective
The investment objective of the Jennison Global Growth Fund (the Fund) is long-term growth of capital. There can be no assurance that the Fund will achieve its investment objective.
Performance data quoted represent past performance. Past performance does not guarantee future results. The investment return and principal value of an investment will fluctuate so that an investor’s shares, when redeemed, may be worth more or less than their original cost. Current performance may be lower or higher than the past performance data quoted. An investor may obtain performance data current to the most recent month-end by visiting our website at www.jennisondryden.com or by calling (800) 225-1852. The maximum initial sales charge is 5.50% (Class A shares).
| | | | | | | | | | | |
| Cumulative Total Returns1 as of 10/31/04 |
| | | One Year | | | Five Years | | | Ten Years | | | Since Inception2 |
Class A | | 6.11 | % | | –16.23 | % | | 61.80 | % | | 137.25% |
Class B | | 5.55 | | | –18.79 | | | 51.64 | | | 485.97 (476.34) |
Class C | | 5.30 | | | –19.25 | | | 50.55 | | | 55.91 |
Class Z | | 6.32 | | | –15.34 | | | N/A | | | 49.99 |
MSCI World Index3 | | 13.25 | | | –10.17 | | | 92.29 | | | *** |
Lipper Global Multi-Cap Growth Funds Avg.4 | | 11.75 | | | 17.83 | | | 109.84 | | | **** |
| | | | | | | | | | | | |
| Average Annual Total Returns1 as of 9/30/04 |
| | | One Year | | | Five Years | | | Ten Years | | | Since Inception2 |
Class A | | 4.54 | % | | –4.09 | % | | 4.40 | % | | 5.48% |
Class B | | 4.98 | | | –3.74 | | | 4.31 | | | 8.94 (8.85) |
Class C | | 8.73 | | | –3.70 | | | 4.25 | | | 4.23 |
Class Z | | 10.78 | | | –2.78 | | | N/A | | | 4.54 |
MSCI World Index3 | | 17.10 | | | –1.60 | | | 6.80 | | | *** |
Lipper Global Multi-Cap Growth Funds Avg.4 | | 15.75 | | | 2.45 | | | 7.34 | | | **** |
The cumulative total returns do not reflect the deduction of applicable sales charges. If reflected, the applicable sales charges would reduce the cumulative total returns performance quoted. Class A shares are subject to a maximum front-end sales charge of 5.50%. Under certain circumstances, Class A shares may be subject to a contingent deferred sales charge (CDSC) of 1%. Class B and Class C shares are subject to a maximum CDSC of 5% and 1% respectively. Class Z shares are not subject to a sales charge.
1Source: Prudential Investments LLC and Lipper Inc. The average annual total returns take into account applicable sales charges. During certain periods shown, fee waivers and/or expense reimbursements were in
| | |
| 2 | | Visit our website at www.jennisondryden.com |
effect. Without such fee waivers and expense reimbursements, the returns for the classes would have been lower, as indicated in parentheses. Class A, Class B, and Class C shares are subject to an annual distribution and service (12b-1) fee of up to 0.30%, 1.00%, and 1.00% respectively. Approximately seven years after purchase, Class B shares will automatically convert to Class A shares on a quarterly basis. Class Z shares are not subject to a 12b-1 fee. The returns in the tables do not reflect the deduction of taxes that a shareholder would pay on fund distributions or following the redemption of fund shares.
2Inception dates: Class A, 1/22/90; Class B, 5/15/84; Class C, 8/1/94; and Class Z, 3/1/96.
3The Morgan Stanley Capital International (MSCI) World Index is an unmanaged, weighted index of performance that reflects the stock price movement in securities listed on the stock exchanges of Australia, Canada, Europe, the Far East, and the United States.
4The Lipper Global Multi-Cap Growth Funds Average (Lipper Average) represents returns based on an average return of all funds in the Lipper Global Multi-Cap Growth Funds category. Funds in the Lipper Average invest in a variety of market-capitalization ranges without concentrating 75% of their equity assets in any one market-capitalization range over an extended period of time. Multi-cap funds typically have 25% to 75% of their assets invested in companies both inside and outside of the United States with market capitalizations (on a three-year weighted basis) greater than the 500th largest company in the S&P/Citigroup World Broad Market Index. Multi-cap growth funds typically have an above-average price-to-cash flow ratio, price-to-book ratio, and three-year sales-per-share growth value compared with the S&P/Citigroup BMI.
Investors cannot invest directly in an index. The returns for the MSCI World Index and the Lipper Average would be lower if they included the effects of sales charges, operating expenses of a mutual fund, or taxes. Returns for the Lipper Average reflect the deduction of operating expenses of a mutual fund, but not sales charges or taxes.
***MSCI World Index Closest Month-End to Inception cumulative total returns as of 10/31/04 are 150.24% for Class A, 769.92% for Class B, 98.23% for Class C, and 61.14% for Class Z. MSCI World Index Closest Month-End to Inception average annual total returns as of 9/30/04 are 6.28% for Class A, 11.09% for Class B, 6.71% for Class C, and 5.42% for Class Z.
****Lipper Average Closest Month-End to Inception cumulative total returns as of 10/31/04 are 205.41% for Class A, 947.97% for Class B, 125.13% for Class C, and 93.95% for Class Z. Lipper Average Closest Month-End to Inception average annual total returns as of 9/30/04 are 7.39% for Class A, 11.57% for Class B, 7.80% for Class C, and 7.48% for Class Z.
| | | |
| Five Largest Holdings expressed as a percentage of net assets as of 10/31/04 | | | |
Total S.A., Oil & Gas | | 2.7 | % |
JPMorgan Chase & Co., Diversified Financial Services | | 1.8 | |
Monsanto Co., Chemicals | | 1.8 | |
UBS AG, Capital Markets | | 1.8 | |
Tesco PLC, Food & Staples Retailing | | 1.7 | |
Holdings are subject to change.
| | | |
| Five Largest Industries expressed as a percentage of net assets as of 10/31/04 | | | |
Pharmaceuticals | | 7.0 | % |
Commercial Banks | | 6.6 | |
Software | | 5.8 | |
Oil & Gas | | 5.7 | |
Industrial Conglomerates | | 5.1 | |
Industry weightings are subject to change.
| | |
| Jennison Global Growth Fund | | 3 |
Investment Adviser’s Report
Jennison Associates LLC
A difficult market for growth investors
The Fund’s return trailed that of the MSCI World Index. Investors were generally worried that future interest-rate increases, high oil prices, and a possible slowing of the Chinese economy would ultimately dampen the global economic recovery and earnings growth. This created a challenging environment for growth stocks generally throughout a substantial portion of the reporting period.
In 2003 the U.S. Federal Reserve (the Fed) reduced interest rates to historically low levels to revive a faltering domestic economy. The stimulus provided by these low rates was effective in spurring economic growth. Consequently, in January of this year, the Fed indicated its intention to raise interest rates to more normal levels. Because it telegraphed its intentions far in advance, many investors expected that the Fed would implement a 25-basis-point increase in June rather than late 2004 or early 2005. We further believed that share prices reflected this expectation prior to the actual announcement. Indeed, the market reaction was muted when the long-expected 25-basis-point increase was announced at the end of June. However, concerns regarding the size of future interest-rate increases continued to weigh on stocks.
As economic statistics for the second quarter of the calendar year were released, concerns regarding future interest-rate increases were replaced by fears that economic growth was already slowing. The preliminary estimate of second-quarter U.S. GDP growth of 3.0% was below expectations and below the 4.5% rate reported for the first quarter. Second-quarter earnings reports corroborated this economic data. While generally strong, earnings growth was lower than in the first quarter. These indications led to generally flat-to-weak markets. Growth stocks were particularly sensitive to these developments.
Concerns of sustained strength in oil prices also pressured markets during the reporting period, perhaps more than events warranted. Although the rise in the price of energy trimmed the rate of real growth this year, the bite on the consumer has been significantly less than anticipated. Over the past four calendar quarters, consumers’ wage gains have dwarfed their additional outlays on energy.
The state of the Chinese economy also was a dominant theme in global stock markets. Concerned that a bad loan crisis was brewing, the Chinese government ordered banks to halt indiscriminate lending to the construction sector. Investors were very skeptical about the government’s ability to slow growth in this sector without dire consequences for China’s—and possibly the world’s—overall economy. The Chinese political leadership has since indicated that its actions have been successful and that, for now, no additional measures are required. Consequently, it appears that an economic “hard landing” in China is unlikely. Investor skepticism about
| | |
| 4 | | Visit our website at www.jennisondryden.com |
government policies has finally diminished as well. While it is still possible that the government will have to take further actions to rein in the economy, we are more confident in its ability to do so successfully.
Economic and geographic sector exposure detracted from return
The Fund’s overall sector exposure detracted somewhat from its return. We had substantial holdings in the healthcare and technology sectors, which were the weakest sectors worldwide over the fiscal year. Our underweight in utilities also hurt. On the other hand, the Fund’s holdings in the energy sector made a significant positive contribution to its return.
Our Japanese holdings showed weakness in the spring of 2004. We believed that Japanese domestic demand would remain stronger that it ultimately did. As a result, we held bank and construction stocks for too long, missing a significant Tokyo stock market movement away from these shares and into export-oriented manufacturing stocks.
Some individual positions moved significantly
The Fund’s substantial position in InterActiveCorp, which had been a profitable holding for a long time, detracted significantly from its return during this fiscal year. InterActiveCorp, under the leadership of Barry Diller, has transformed itself from a traditional media company into an Internet conglomerate. We thought that it had a very good chance of becoming a dominant force in the Internet travel business in the way that Yahoo! and Ebay have done in their respective areas. We expected continuing strong profit growth and expansion of its price-earnings multiple (the premium investors are willing to pay for future growth potential). Instead, slower-than-expected growth, operational miscues, and very poor communication with Wall Street produced a sharp decline in the share price. We reduced our exposure to InterActiveCorp, but we maintain a smaller position because we believe the market reaction was overdone.
We also had some significant successes. We made substantial profits on Apple Computer, where the success of the iPod has also sparked consumer demand for the company’s personal computer line. Marvell Technology, a semiconductor firm that designs chips for storage and communications devices, was also a strong performer.
We reoriented the portfolio mid-period
During the second half of the fiscal year, we determined that it was necessary to reorient the portfolio toward areas of greater economic and market strength. This refocus took three forms. We trimmed or eliminated our exposure to underperforming stocks. We also rebalanced our holdings in Japan to more closely reflect the new
| | |
| Jennison Global Growth Fund | | 5 |
Investment Advisor’s Report (continued)
opportunities in that market. Finally, to lessen portfolio volatility, we reduced the size of our largest positions and shifted our exposure somewhat away from companies with smaller market capitalizations. These changes improved our performance relative to the Fund’s benchmark over the last few months of the fiscal year.
Looking Ahead
Our primary focus remains identifying companies with factors such as strong management and unique products that we believe will lead to above-average earnings growth. We believe that much of the negative news that has concerned investors in recent months—slower global economic growth, high oil prices, and the possibility of a sharp slowdown in China’s economy—is already reflected in share prices, but lingering uncertainties remain. As a result, shares may trade within a narrow range for a while yet.
Perhaps the most important of these concerns is the dependence of much of the world’s economic vigor on consumption in the United States. Our increasing appetite for imported goods, combined with slower growth in the rest of the developed world, has resulted in the build-up of a very large, and ultimately unsustainable, U.S. trade deficit. Trade and federal budget deficits are key reasons for the dollar’s fall over the past 12 months. This is an issue that bears close monitoring.
Overall, we believe that the global economic environment will remain favorable for growth stocks. The global economy may be emerging from the shadow of recession. Historically, when the driving force for profit growth shifts from cyclical economic recovery to long-term growth trends, investors have made a corresponding shift from value stocks to growth stocks to seek out the beneficiaries of this move.
The Portfolio of Investments following this report shows the size of the Fund’s positions at period-end.
| | |
| 6 | | Visit our website at www.jennisondryden.com |
Comments on Largest Holdings
Holdings expressed as a percentage of the Fund’s net assets as of 10/31/04.
Total is France’s largest oil company. It is an integrated oil company that explores for, produces, refines, and markets crude oil and finished products in more than 100 countries. The company also operates a chain of service stations primarily in Europe and Africa. Total has benefited from continued strength in crude oil prices.
| 1.8% | JPMorgan Chase & Co./Diversified Financial Services |
JPMorgan Chase is a global financial services firm that operates in more than 50 countries, providing investment banking, investment management, private banking, and traditional consumer and small business banking services. In July 2004, the company merged with Bank One, which we believe will create synergies across all of its divisions. We also anticipate that capital market activities will return to normal levels after a period of seasonal weakness, and we therefore feel that the fundamental outlook for JPMorgan Chase is positive.
| 1.8% | Monsanto Co./Chemicals |
Monsanto is the leading agricultural genomics company. It produces genetically modified seed traits that control characteristics such as resistance to herbicides, insects, and/or drought. Monsanto also produces the herbicide Roundup. The company is enjoying strong global sales for its genetic trait seeds, and we believe it should see an improved pricing environment for its herbicide business.
| 1.8% | UBS AG/Capital Markets |
UBS is a Switzerland-based global banking services firm, providing private wealth management, consumer banking, investment banking, and asset management services. After a period of seasonal weakness, we anticipate that capital market activities will return to normal levels, and we feel that the fundamental outlook for UBS is therefore positive.
| 1.7% | Tesco PLC/Food & Staples Retailing |
Tesco is a United Kingdom-based food retailer, operating stores globally. The company continues to report strong sales in the UK and internationally.
Holdings are subject to change.
| | |
| Jennison Global Growth Fund | | 7 |
Fees and Expenses (Unaudited)
As a shareholder of the Fund, you incur two types of costs: (1) transaction costs, including sales charges (loads) on purchase payments and redemptions, as applicable, and (2) ongoing costs, including management fees, distribution and/or service (12b-1) fees, and other Fund expenses, as applicable. This example is intended to help you understand your ongoing costs (in dollars) of investing in the Fund and to compare these costs with the ongoing costs of investing in other mutual funds.
The example is based on an investment of $1,000 invested on May 1, 2004, at the beginning of the period and held through the six-month period ended October 31, 2004.
Actual Expenses
The first line for each share class in the following table provides information about actual account values and actual expenses. You may use the information in this line, together with the amount you invested, to estimate the expenses that you paid over the period. Simply divide your account value by $1,000 (for example, an $8,600 account value ÷ $1,000 = 8.6), then multiply the result by the number in the first line under the heading “Expenses Paid During the Six-Month Period” to estimate the expenses you paid on your account during this period. The Fund may charge additional fees to holders of certain accounts that are not included in the expenses shown in the table. These fees apply to Individual Retirement Accounts (IRAs), 403(b) accounts, and Section 529 plan accounts. As of the close of the six months covered by the table, IRA fees included a setup fee of $5, a maintenance fee of up to $36 annually ($18 for the six-month period), and a termination fee of $10. 403(b) accounts and Section 529 plan accounts are each charged an annual $25 fiduciary maintenance fee ($12.50 for the six-month period). Some of the fees vary in amount, or are waived, based on your total account balance or the number of JennisonDryden or Strategic Partners funds, including the Fund, that you own. You should consider the additional fees that were charged to your Fund account over the six-month period when you estimate the total ongoing expenses paid over the period and the impact of these fees on your ending account value, as these additional expenses are not reflected in the information provided in the expense table. Additional fees have the effect of reducing investment returns.
Hypothetical Example for Comparison Purposes
The second line for each share class in the following table provides information about hypothetical account values and hypothetical expenses based on the Fund’s actual expense ratio and an assumed rate of return of 5% per year before expenses, which is not the Fund’s actual return. The hypothetical account values and expenses may not be used to estimate the actual ending account balance or expenses you paid for the period. You may use this information to compare the ongoing costs of investing in the Fund and other funds. To do so, compare this 5% hypothetical example with the 5%
| | |
| 8 | | Visit our website at www.jennisondryden.com |
hypothetical examples that appear in the shareholder reports of the other funds. The Fund may charge additional fees to holders of certain accounts that are not included in the expenses shown in the table. These fees apply to Individual Retirement Accounts (IRAs), 403(b) accounts, and Section 529 plan accounts. As of the close of the six months covered by the table, IRA fees included a setup fee of $5, a maintenance fee of up to $36 annually ($18 for the six-month period), and a termination fee of $10. 403(b) accounts and Section 529 plan accounts are each charged an annual $25 fiduciary maintenance fee ($12.50 for the six-month period). Some of the fees vary in amount, or are waived, based on your total account balance or the number of JennisonDryden or Strategic Partners funds, including the Fund, that you own. You should consider the additional fees that were charged to your Fund account over the six-month period when you estimate the total ongoing expenses paid over the period and the impact of these fees on your ending account value, as such additional expenses are not reflected in the information provided in the expense table. Additional fees have the effect of reducing investment returns.
Please note that the expenses shown in the table are meant to highlight your ongoing costs only, and do not reflect any transactional costs such as sales charges (loads). Therefore the second line for each share class in the table is useful in comparing ongoing costs only, and will not help you determine the relative total costs of owning different funds. In addition, if these transactional costs were included, your costs would have been higher.
| | | | | | | | | | | | | | |
Jennison Global
Growth Fund | | Beginning Account
Value May 1, 2004 | | Ending Account
Value October 31, 2004 | | Annualized
Expense Ratio
Based on the
Six-Month Period | | | Expenses Paid
During the Six-
Month Period* |
| | | | | | | | | | | | | | | |
| Class A | | Actual | | $ | 1,000 | | $ | 1,009 | | 1.41 | % | | $ | 7.12 |
| | | Hypothetical | | $ | 1,000 | | $ | 1,018 | | 1.41 | % | | $ | 7.15 |
| | | | | | | | | | | | | | | |
| Class B | | Actual | | $ | 1,000 | | $ | 1,006 | | 1.91 | % | | $ | 9.63 |
| | | Hypothetical | | $ | 1,000 | | $ | 1,016 | | 1.91 | % | | $ | 9.68 |
| | | | | | | | | | | | | | | |
| Class C | | Actual | | $ | 1,000 | | $ | 1,005 | | 2.16 | % | | $ | 10.89 |
| | | Hypothetical | | $ | 1,000 | | $ | 1,014 | | 2.16 | % | | $ | 10.94 |
| | | | | | | | | | | | | | | |
| Class Z | | Actual | | $ | 1,000 | | $ | 1,010 | | 1.16 | % | | $ | 5.86 |
| | | Hypothetical | | $ | 1,000 | | $ | 1,019 | | 1.16 | % | | $ | 5.89 |
| | | | | | | | | | | | | | | |
* Fund expenses for each share class are equal to the annualized expense ratio for each share class (provided in the table), multiplied by the average account value over the period, multiplied by the 184 days in the six-month period ended October 31, 2004, and divided by the 366 days in the year ended October 31, 2004, (to reflect the six-month period).
| | |
| Jennison Global Growth Fund | | 9 |
This Page Intentionally Left Blank
Portfolio of Investments
as of October 31, 2004
| | | | | |
| Shares | | Description | | Value (Note 1) |
| | | | | | |
LONG-TERM INVESTMENTS 99.0% | | | |
COMMON STOCKS | | | |
| |
Australia 0.4% | | | |
| 71,000 | | BHP Billiton Ltd | | $ | 734,513 |
| 34,000 | | News Corp. Ltd. (The) | | | 273,518 |
| 23,500 | | Rio Tinto Ltd. | | | 642,452 |
| | | | |
|
|
| | | | | | 1,650,483 |
| |
Bermuda 2.0% | | | |
| 177,400 | | Marvell Technology Group Ltd.(a) | | | 5,068,318 |
| 105,300 | | Tyco International Ltd. | | | 3,280,095 |
| | | | |
|
|
| | | | | | 8,348,413 |
| |
Canada 1.6% | | | |
| 27,700 | | Research in Motion Ltd.(a)(b) | | | 2,443,140 |
| 121,100 | | Suncor Energy, Inc. | | | 4,129,510 |
| | | | |
|
|
| | | | | | 6,572,650 |
| |
France 4.2% | | | |
| 49,907 | | France Telecom S.A. | | | 1,424,585 |
| 70,100 | | Schneider Electric S.A. | | | 4,627,957 |
| 54,663 | | Total S.A. | | | 11,334,048 |
| | | | |
|
|
| | | | | | 17,386,590 |
| |
Germany 5.5% | | | |
| 23,908 | | Deutsche Bank AG | | | 1,812,260 |
| 279,600 | | Deutsche Telekom AG(a) | | | 5,342,089 |
| 119,700 | | Metro AG | | | 5,699,253 |
| 6,820 | | SAP AG | | | 1,158,423 |
| 79,200 | | SAP AG (ADR) | | | 3,377,880 |
| 76,454 | | Siemens AG | | | 5,674,728 |
| | | | |
|
|
| | | | | | 23,064,633 |
| |
Hong Kong 0.8% | | | |
| 1,806,000 | | Cosco Pacific Ltd. | | | 3,120,834 |
| 21,337 | | HSBC Holdings PLC | | | 345,410 |
| | | | |
|
|
| | | | | | 3,466,244 |
| |
India 0.1% | | | |
| 16,500 | | Reliance Industries Ltd. (GDR) | | | 405,900 |
| |
Ireland 1.0% | | | |
| 230,875 | | Anglo-Irish Bank Corp. PLC | | | 4,375,898 |
See Notes to Financial Statements.
| | |
| Prudential World Funds, Inc./Jennison Global Growth Fund | | 11 |
Portfolio of Investments
as of October 31, 2004 Cont’d.
| | | | | |
| Shares | | Description | | Value (Note 1) |
| | | | | | |
Italy 3.2% | | | |
| 526,700 | | Enel SpA | | $ | 4,750,218 |
| 140,667 | | Eni SpA | | | 3,185,049 |
| 259,676 | | Riunione Adriatica di Sicurta SpA | | | 5,470,111 |
| | | | |
|
|
| | | | | | 13,405,378 |
| |
Japan 11.4% | | | |
| 500,000 | | Asahi Glass Co. Ltd. | | | 4,586,119 |
| 96,300 | | Canon, Inc. | | | 4,742,904 |
| 7,100 | | FANUC Ltd. | | | 427,912 |
| 18,200 | | Honda Motor Corp. Ltd. | | | 877,521 |
| 5,600 | | Hoya Corp. | | | 573,764 |
| 257,100 | | JFE Holdings, Inc. | | | 6,888,120 |
| 1,400 | | Keyence Corp. | | | 314,832 |
| 39,000 | | Mitsubishi Corp. | | | 430,069 |
| 567,000 | | Mitsubishi Estate Co. Ltd. | | | 5,974,885 |
| 88 | | Mitsubishi Tokyo Financial Group, Inc. | | | 745,833 |
| 646,000 | | Mitsui & Co. Ltd. | | | 5,420,341 |
| 50,400 | | Nidec Corp. | | | 5,448,649 |
| 374,900 | | Nissan Motor Co. Ltd. | | | 4,218,905 |
| 11,300 | | Nitto Denko Corp. | | | 535,258 |
| 72 | | NTT DoCoMo, Inc. | | | 126,792 |
| 11,000 | | Olympus Optical Co. Ltd. | | | 212,873 |
| 3,700 | | ORIX Corp. | | | 433,101 |
| 48,000 | | Sharp Corp. | | | 661,757 |
| 384,000 | | Sumitomo Realty & Development Co. Ltd. | | | 4,212,826 |
| 13,200 | | Takeda Pharmaceutical Co. Ltd. | | | 636,444 |
| | | | |
|
|
| | | | | | 47,468,905 |
| |
Netherlands 0.2% | | | |
| 36,885 | | ING Groep NV | | | 973,580 |
| |
South Korea 0.4% | | | |
| 8,700 | | Hyundai Mobis Co. | | | 446,074 |
| 2,580 | | Samsung Electronics Co. Ltd. | | | 1,012,872 |
| | | | |
|
|
| | | | | | 1,458,946 |
| |
Spain 2.4% | | | |
| 327,284 | | Banco Bilbao Vizcaya Argentaria S.A. | | | 5,120,753 |
| 285,702 | | Telefonica S.A. | | | 4,702,746 |
| | | | |
|
|
| | | | | | 9,823,499 |
See Notes to Financial Statements.
| | |
| 12 | | Visit our website at www.jennisondryden.com |
| | | | | |
| Shares | | Description | | Value (Note 1) |
| | | | | | |
Switzerland 6.4% | | | |
| 70,200 | | Alcon, Inc.(b) | | $ | 4,998,240 |
| 77,300 | | Novartis AG (ADR) | | | 3,711,173 |
| 88,695 | | Novartis AG | | | 4,215,310 |
| 12,813 | | Roche Holding AG | | | 1,305,349 |
| 50,800 | | Roche Holding AG (ADR) | | | 5,175,347 |
| 102,762 | | UBS AG | | | 7,381,381 |
| | | | |
|
|
| | | | | | 26,786,800 |
| |
Taiwan 0.1% | | | |
| 193,947 | | Taiwan Semiconductor Manufacturing Co. Ltd. | | | 254,300 |
| 239,870 | | Wan Hai Lines Ltd. | | | 230,499 |
| | | | |
|
|
| | | | | | 484,799 |
| |
United Kingdom 9.5% | | | |
| 25,129 | | Anglo American PLC | | | 549,764 |
| 26,946 | | AstraZeneca PLC | | | 1,102,009 |
| 68,900 | | AstraZeneca PLC (ADR) | | | 2,838,680 |
| 188,700 | | BHP Billition PLC | | | 1,913,755 |
| 477,232 | | BP PLC | | | 4,612,631 |
| 63,520 | | British Sky Broadcasting Group PLC | | | 591,832 |
| 150,738 | | Centrica PLC | | | 664,946 |
| 324,699 | | Exel PLC | | | 4,209,244 |
| 191,722 | | HSBC Holdings PLC | | | 3,089,616 |
| 24,920 | | Reckitt Benckiser PLC | | | 682,174 |
| 242,340 | | Royal Bank Scotland Group PLC (The) | | | 7,126,837 |
| 1,361,800 | | Tesco PLC | | | 7,161,301 |
| 2,036,966 | | Vodafone Group PLC | | | 5,206,606 |
| | | | |
|
|
| | | | | | 39,749,395 |
| |
United States 49.8% | | | |
| 158,200 | | Activision, Inc.(a)(b) | | | 2,290,736 |
| 133,200 | | Agilent Technologies, Inc.(a) | | | 3,337,992 |
| 82,600 | | American Express Co.(b) | | | 4,383,582 |
| 57,800 | | American International Group, Inc. | | | 3,509,038 |
| 84,200 | | Amgen, Inc.(a) | | | 4,782,560 |
| 130,200 | | Apple Computer, Inc.(a)(b) | | | 6,839,406 |
| 149,600 | | Bank of America Corp.(b) | | | 6,700,584 |
| 125,200 | | Bank of New York Co., Inc. (The) | | | 4,063,992 |
| 148,400 | | Bed, Bath & Beyond, Inc.(a)(b) | | | 6,053,236 |
| 77,800 | | BJ Services Co. | | | 3,967,800 |
| 132,700 | | Cendant Corp.(b) | | | 2,732,293 |
| 99,200 | | Chico’s FAS, Inc.(a)(b) | | | 3,970,976 |
See Notes to Financial Statements.
| | |
| Prudential World Funds, Inc./Jennison Global Growth Fund | | 13 |
Portfolio of Investments
as of October 31, 2004 Cont’d.
| | | | | |
| Shares | | Description | | Value (Note 1) |
| | | | | | |
| 192,800 | | Cisco Systems, Inc.(a) | | $ | 3,703,688 |
| 20,300 | | Citigroup, Inc. | | | 900,711 |
| 78,800 | | Costco Wholesale Corp.(b) | | | 3,777,672 |
| 116,100 | | Dell, Inc.(a)(b) | | | 4,070,466 |
| 215,400 | | DIRECTV Group, Inc.(a) | | | 3,612,258 |
| 12,700 | | eBay, Inc.(a) | | | 1,239,647 |
| 89,600 | | Electronic Arts, Inc.(a)(b) | | | 4,024,832 |
| 64,100 | | Eli Lilly and Co. (The) | | | 3,519,731 |
| 142,900 | | ENSCO International, Inc. | | | 4,365,595 |
| 209,800 | | General Electric Co. | | | 7,158,376 |
| 180,200 | | Gilead Sciences, Inc.(a) | | | 6,240,326 |
| 78,700 | | Guidant Corp. | | | 5,242,994 |
| 182,550 | | IAC/InterActiveCorp(a)(b) | | | 3,946,731 |
| 159,000 | | IVAX Corp.(a)(b) | | | 2,877,900 |
| 198,600 | | JPMorgan Chase & Co. | | | 7,665,960 |
| 211,200 | | Kroger Co. (The)(a) | | | 3,191,232 |
| 37,200 | | Lehman Brothers Holdings, Inc. | | | 3,055,980 |
| 111,800 | | Lowe’s Companies, Inc.(b) | | | 6,292,104 |
| 96,200 | | Mercury Interactive Corp.(a)(b) | | | 4,177,966 |
| 220,600 | | Microsoft Corp. | | | 6,174,594 |
| 176,500 | | Monsanto Co.(b) | | | 7,545,375 |
| 75,700 | | P.F. Chang’s China Bistro, Inc.(a)(b) | | | 3,848,588 |
| 70,200 | | PETsMART, Inc. | | | 2,244,996 |
| 128,160 | | Pfizer, Inc. | | | 3,710,232 |
| 59,100 | | Phelps Dodge Corp. | | | 5,173,614 |
| 109,500 | | Praxair, Inc. | | | 4,620,900 |
| 96,100 | | Procter & Gamble Co. (The) | | | 4,918,398 |
| 108,100 | | QUALCOMM, Inc.(b) | | | 4,519,661 |
| 109,600 | | Schlumberger Ltd. | | | 6,898,224 |
| 67,000 | | Smith International, Inc.(a)(b) | | | 3,891,360 |
| 68,500 | | State Street Corp.(b) | | | 3,085,925 |
| 52,400 | | Symantec Corp.(a)(b) | | | 2,983,656 |
| 91,000 | | Target Corp. | | | 4,551,820 |
| 189,200 | | Univision Communications, Inc., Class A(a)(b) | | | 5,857,632 |
| 55,400 | | Williams-Sonoma, Inc. (The)(a)(b) | | | 2,114,618 |
| 100,200 | | Yahoo! Inc.(a)(b) | | | 3,626,238 |
| | | | |
|
|
| | | | | | 207,462,195 |
| | | | |
|
|
| | | Total long-term investments
(cost $364,565,414) | | | 412,884,308 |
| | | | |
|
|
See Notes to Financial Statements.
| | |
| 14 | | Visit our website at www.jennisondryden.com |
| | | | | | |
| Shares | | Description | | Value (Note 1) | |
| | | | | | | |
SHORT-TERM INVESTMENTS 20.5% | | | | |
| |
Mutual Fund | | | | |
| 85,295,882 | | Dryden Core Investment Fund - Taxable Money Market Series(c)
(cost $85,295,882) (Note 3) | | $ | 85,295,882 | |
| | | | |
|
|
|
| | | Total Investments 119.5%
(cost $449,861,296; Note 5) | | | 498,180,190 | |
| | | Liabilities in excess of other assets (19.5%) | | | (81,384,883 | ) |
| | | | |
|
|
|
| | | Net Assets 100% | | $ | 416,795,307 | |
| | | | |
|
|
|
| (a) | Non-income producing security. |
| (b) | Portion of securities on loan with an aggregate market value of $76,941,436; cash collateral of $78,061,666 was received with which the portfolio purchased with highly liquid securities. |
| (c) | Represents security, or portion thereof, purchased with cash collateral received for securities on loan. |
The following abbreviations are used in portfolio descriptions:
ADR—American Depositary Receipt.
GDR—Guaranteed Depositary Receipt.
See Notes to Financial Statements.
| | |
| Prudential World Funds, Inc./Jennison Global Growth Fund | | 15 |
The industry classification of portfolio holdings and liabilities in excess of other assets shown as a percentage of net assets as of October 31, 2004 is as follows:
| | | |
Mutual Fund | | 20.5 | % |
Pharmaceuticals | | 7.0 | |
Commercial Banks | | 6.6 | |
Software | | 5.8 | |
Oil & Gas | | 5.7 | |
Industrial Conglomerates | | 5.1 | |
Specialty Retail | | 5.0 | |
Food & Staples Retailing | | 4.8 | |
Capital Markets | | 4.7 | |
Energy Equipment & Services | | 4.6 | |
Chemicals | | 3.0 | |
Diversified Telecommunication Services | | 2.7 | |
Biotechnology | | 2.6 | |
Communications Equipment | | 2.6 | |
Computers & Peripherals | | 2.6 | |
Metals & Mining | | 2.6 | |
Health Care Equipment & Supplies | | 2.5 | |
Media | | 2.5 | |
Real Estate | | 2.4 | |
Diversified Financials | | 2.3 | |
Electronic Equipment & Instruments | | 2.3 | |
Insurance | | 2.1 | |
Semiconductor Equipment & Products | | 1.5 | |
Trading Companies & Distributors | | 1.4 | |
Household Products | | 1.3 | |
Wireless Telecommunication Services | | 1.3 | |
Automobiles | | 1.2 | |
Consumer Finance | | 1.2 | |
Internet & Catalog Retail | | 1.2 | |
Building Products | | 1.1 | |
Electric Utilities | | 1.1 | |
Electrical Equipment | | 1.1 | |
Multiline Retail | | 1.1 | |
Office Electronics | | 1.1 | |
Air Freight & Logistics | | 1.0 | |
Hotels Restaurants & Leisure | | 0.9 | |
Internet Software & Services | | 0.9 | |
Commercial Services & Supplies | | 0.7 | |
Transportation Infrastructure | | 0.7 | |
Gas Utilities | | 0.2 | |
Household Durables | | 0.2 | |
Auto Components | | 0.1 | |
Machinery | | 0.1 | |
Marine | | 0.1 | |
| | |
|
|
| | | 119.5 | |
Liabilities in excess of other assets | | (19.5 | ) |
| | |
|
|
| | | 100.0 | % |
| | |
|
|
See Notes to Financial Statements.
| | |
| 16 | | Visit our website at www.jennisondryden.com |
Financial Statements
| | |
| OCTOBER 31, 2004 | | ANNUAL REPORT |
Jennison Global Growth Fund
Statement of Assets and Liabilities
as of October 31, 2004
| | | | |
Assets | | | | |
Investments, at value including securities on loan of $76,941,436 (cost $449,861,296) | | $ | 498,180,190 | |
Foreign currency, at value (cost $914,652) | | | 948,452 | |
Receivable for investments sold | | | 727,316 | |
Dividends and interest receivable | | | 454,513 | |
Foreign tax reclaim receivable | | | 327,121 | |
Receivable for Series shares sold | | | 93,513 | |
Prepaid expenses | | | 25,843 | |
| | |
|
|
|
Total assets | | | 500,756,948 | |
| | |
|
|
|
| |
Liabilities | | | | |
Payable to broker for collateral for securities on loan (Note 4) | | | 78,061,666 | |
Payable for investments purchased | | | 3,266,704 | |
Payable for Series shares reacquired | | | 1,731,277 | |
Accrued expenses | | | 431,198 | |
Management fee payable | | | 264,142 | |
Distribution fee payable | | | 121,916 | |
Payable to custodian | | | 45,703 | |
Foreign taxes payable | | | 26,619 | |
Deferred directors’ fees payable | | | 12,416 | |
| | |
|
|
|
Total liabilities | | | 83,961,641 | |
| | |
|
|
|
| |
Net Assets | | $ | 416,795,307 | |
| | |
|
|
|
| | | | | |
Net assets were comprised of: | | | | |
Common stock, at par | | $ | 316,219 | |
Paid-in capital in excess of par | | | 515,254,004 | |
| | |
|
|
|
| | | | 515,570,223 | |
Accumulated net investment loss | | | (149,951 | ) |
Accumulated net realized loss on investments and foreign currency transactions | | | (147,039,070 | ) |
Net unrealized appreciation on investments and foreign currencies | | | 48,414,105 | |
| | |
|
|
|
Net assets, October 31, 2004 | | $ | 416,795,307 | |
| | |
|
|
|
See Notes to Financial Statements.
| | |
| 18 | | Visit our website at www.jennisondryden.com |
| | | |
Class A | | | |
Net asset value and redemption price per share
($315,213,591 ÷ 23,443,403 shares of common stock issued and outstanding) | | $ | 13.45 |
Maximum sales charge (5.50% of offering price) | | | 0.78 |
| | |
|
|
Maximum offering price to public | | $ | 14.23 |
| | |
|
|
| |
Class B | | | |
Net asset value, offering price and redemption price per share
($65,603,025 ÷ 5,386,927 shares of common stock issued and outstanding) | | $ | 12.18 |
| | |
|
|
| |
Class C | | | |
Net asset value, offering price and redemption price per share
($16,343,319 ÷ 1,349,775 shares of common stock issued and outstanding) | | $ | 12.11 |
| | |
|
|
| |
Class Z | | | |
Net asset value, offering price and redemption price per share
($19,635,372 ÷ 1,441,769 shares of common stock issued and outstanding) | | $ | 13.62 |
| | |
|
|
See Notes to Financial Statements.
| | |
| Prudential World Funds, Inc./Jennison Global Growth Fund | | 19 |
Statement of Operations
Year Ended October 31, 2004
| | | | |
Net Investment Loss | | | | |
Income | | | | |
Dividends (net of foreign withholding taxes of $515,000) | | $ | 5,834,130 | |
Interest | | | 15 | |
Income from securities lending, net | | | 91,343 | |
| | |
|
|
|
Total income | | | 5,925,488 | |
| | |
|
|
|
| |
Expenses | | | | |
Management fee | | | 3,343,319 | |
Distribution fee—Class A | | | 819,038 | |
Distribution fee—Class B | | | 567,050 | |
Distribution fee—Class C | | | 176,825 | |
Transfer agent’s fees and expenses | | | 1,060,000 | |
Custodian’s fees and expenses | | | 368,000 | |
Reports to shareholders | | | 122,000 | |
Legal fees and expenses | | | 80,000 | |
Registration fees | | | 32,000 | |
Directors’ fees | | | 27,000 | |
Audit fees | | | 21,000 | |
Miscellaneous | | | 30,357 | |
| | |
|
|
|
Total expenses | | | 6,646,589 | |
| | |
|
|
|
Net investment loss | | | (721,101 | ) |
| | |
|
|
|
| |
Realized And Unrealized Gain (Loss) On Investments And Foreign Currency Transactions | | | | |
Net realized gain (loss) on: | | | | |
Investment transactions (net of Thailand capital gains taxes of $26,880) | | �� | 71,598,710 | |
Foreign currency transactions | | | (239,308 | ) |
| | |
|
|
|
| | | | 71,359,402 | |
| | |
|
|
|
Net change in unrealized appreciation (depreciation) on: | | | | |
Investments | | | (38,976,221 | ) |
Foreign currencies | | | 66,165 | |
| | |
|
|
|
| | | | (38,910,056 | ) |
| | |
|
|
|
Net gain on investments and foreign currencies | | | 32,449,346 | |
| | |
|
|
|
Net Increase In Net Assets Resulting From Operations | | $ | 31,728,245 | |
| | |
|
|
|
See Notes to Financial Statements.
| | |
| 20 | | Visit our website at www.jennisondryden.com |
Statement of Changes in Net Assets
| | | | | | | | |
| | | Year Ended October 31,
| |
| | | 2004 | | | 2003 | |
Increase In Net Assets | | | | | | | | |
Operations | | | | | | | | |
Net investment income (loss) | | $ | (721,101 | ) | | $ | 200,902 | |
Net realized gain on investments and foreign currency transactions | | | 71,359,402 | | | | 201,864 | |
Net change in unrealized appreciation (depreciation) on investments and foreign currencies | | | (38,910,056 | ) | | | 73,903,794 | |
| | |
|
|
| |
|
|
|
Net increase in net assets resulting from operations | | | 31,728,245 | | | | 74,306,560 | |
| | |
|
|
| |
|
|
|
Dividends and distributions (Note 1) | | | | | | | | |
Dividends from net investment income | | | | | | | | |
Class A | | | (862,951 | ) | | | — | |
Class Z | | | (219,096 | ) | | | — | |
| | |
|
|
| |
|
|
|
| | | | (1,082,047 | ) | | | — | |
| | |
|
|
| |
|
|
|
| | |
Series share transactions (net of share conversions) (Note 6 and 7) | | | | | | | | |
Net proceeds from shares sold(b) | | | 165,492,705 | | | | 65,971,140 | |
Net asset value of shares issued in reinvestment of dividends and distributions | | | 1,041,505 | | | | — | |
Cost of shares reacquired | | | (139,750,168 | ) | | | (120,626,072 | ) |
| | |
|
|
| |
|
|
|
Net increase (decrease) in net assets from Series share transactions | | | 26,784,042 | | | | (54,654,932 | ) |
| | |
|
|
| |
|
|
|
Total increase | | | 57,430,240 | | | | 19,651,628 | |
| | |
Net Assets | | | | | | | | |
Beginning of year | | | 359,365,067 | | | | 339,713,439 | |
| | |
|
|
| |
|
|
|
End of year | | $ | 416,795,307 | | | $ | 359,365,067 | |
| | |
|
|
| |
|
|
|
(a) Includes undistributed net investment income of: | | $ | — | | | $ | 1,082,198 | |
| | |
|
|
| |
|
|
|
| (b) | For the year ended October 31, 2004, includes $127,577,448 for shares issued in connection with the acquisition of Prudential Pacific Growth, Inc. and Prudential Europe Growth, Inc. |
See Notes to Financial Statements.
| | |
| Prudential World Funds, Inc./Jennison Global Growth Fund | | 21 |
Notes to Financial Statements
Prudential World Fund, Inc. (the “Fund”) is registered under the Investment Company Act of 1940, as an open-end, diversified management investment company and currently consists of three series: Jennison Global Growth Fund (the “Series”), Strategic Partners International Value Fund and Jennison International Growth Fund, formerly known as Prudential Global Growth Fund, Prudential International Value Fund and Prudential International Growth Fund, respectively. The financial statements of the other series are not presented herein. The Series commenced investment operations in May, 1984.
The investment objective of the Series is to seek long-term capital growth, with income as a secondary objective, by investing in a diversified portfolio of securities consisting of marketable securities of U.S. and non-U.S. issuers.
Note 1. Accounting Policies
The following is a summary of significant accounting policies followed by the Fund, and the Series, in the preparation of its financial statements.
Securities Valuation: Securities listed on a securities exchange (other than options on securities and indices) are valued at the last sale price on such exchange on the day of valuation or, if there was no sale on such day, at the mean between the last reported bid and asked prices, or at the last bid price on such day in the absence of an asked price. Securities traded via Nasdaq are valued at the official closing price as provided by Nasdaq. Securities that are actively traded in the over-the-counter market, including listed securities for which the primary market is believed by Prudential Investments LLC (“PI or Manager”), in consultation with the subadviser(s); to be over-the-counter, are valued at market value using prices provided by an independent pricing agent or principal market maker. Futures contracts and options thereon traded on commodities exchange or board of trade are valued on their last sales price as of the close of trading on such exchange or board of trade on such day, at the mean between the most recently quoted bid and asked prices on such exchange or board of trade or at the last bid price in the abscense of an asked price. Securities for which market quotations are not readily available, or whose values have been effected by events occurring after the close of the security’s foreign market and before the fund’s normal pricing time, are valued at fair value in accordance with the Board of Directors’ approved fair valuation procedures. Using fair value to price securities may result in a value that is different from a security’s most recent closing price and from the price used by other mutual funds to calculate their net asset values. As of October 31, 2004, there were no securities valued in accordance with such procedures.
| | |
| 22 | | Visit our website at www.jennisondryden.com |
Investments in mutual funds are valued at the net asset value as of the close of the New York Stock Exchange on the date of valuation.
Short-term securities, which mature in sixty days or less, are valued at amortized cost, which approximates market value. The amortized cost method involves valuing a security at its cost on the date of purchase and thereafter assuming a constant amortization to maturity of the difference between the principal amount due at maturity and cost. Short-term securities which mature in more than sixty days are valued at current market quotations.
Foreign Currency Translation: The books and records of the Series are maintained in U.S. dollars. Foreign currency amounts are translated into U.S. dollars on the following basis:
(i) market value of investment securities, other assets and liabilities-at the current rates of exchange;
(ii) purchases and sales of investment securities, income and expenses-at the rate of exchange prevailing on the respective dates of such transactions.
Although the net assets of the Series are presented at the foreign exchange rates and market values at the close of the fiscal period, the Series does not isolate that portion of the results of operations arising as a result of changes in the foreign exchange rates from the fluctuations arising from changes in the market prices of long-term securities held at the end of the fiscal period. Similarly, the Series does not isolate the effect of changes in foreign exchange rates from the fluctuations arising from changes in the market prices of long-term portfolio securities sold during the fiscal period. Accordingly, realized foreign currency gains or losses are included in the reported net realized gains or losses on investment transactions.
Net realized gains or losses on foreign currency transactions represent net foreign exchange gains or losses from holdings of foreign currencies, currency gains or losses realized between the trade and settlement dates on security transactions, and the difference between the amounts of dividends, interest and foreign taxes recorded on the Series’ books and the U.S. dollar equivalent amounts actually received or paid. Net unrealized currency gains and losses from valuing foreign currency denominated assets and liabilities (other than investments) at period end exchange rates are reflected as a component of net unrealized appreciation or depreciation on investments and foreign currencies.
Foreign security and currency transactions may involve certain considerations and risks not typically associated with those of domestic origin as a result of, among other factors, the possibility of political and economic instability and the level of governmental supervision and regulation of foreign securities markets.
| | |
| Prudential World Funds, Inc./Jennison Global Growth Fund | | 23 |
Notes to Financial Statements
Cont’d
Forward Currency Contracts: A forward currency contract is a commitment to purchase or sell a foreign currency at a future date at a negotiated forward rate. The Series enters into forward currency contracts in order to hedge its exposure to changes in foreign currency exchange rates on its foreign portfolio holdings or on specific receivables and payables denominated in a foreign currency. The contracts are valued daily at current exchange rates and any unrealized gain or loss is included in net unrealized appreciation or depreciation on foreign currencies. Gain or loss is realized on the settlement date of the contract equal to the difference between the settlement value of the original and renegotiated forward contracts. This gain or loss, if any, is included in net realized gain or loss on foreign currency transactions. Risks may arise upon entering into these contracts from the potential inability of the counterparties to meet the terms of their contracts.
Forward currency contracts involve elements of both market and credit risk in excess of the amounts reflected on the Statement of Assets and Liabilities.
Securities Lending: The Series may lend its portfolio securities to qualified institutions. The loans are secured by collateral at least equal at all times, to the market value of the securities loaned. The Series may bear the risk of delay in recovery of, or even loss of rights in, the securities loaned should the borrower of the securities fail financially. The Series receives compensation, net of any rebate, for lending its securities in the form of interest or dividends on the collateral received for the securities loaned, and any gain or loss in the market price of the securities loaned that may occur during the term of the loan.
Securities Transactions and Net Investment Income: Securities transactions are recorded on the trade date. Realized gains or losses from investment and currency transactions are calculated on the identified cost basis. Dividend income is recorded on the ex-dividend date, and interest income is recorded on an accrual basis. Expenses are recorded on the accrual basis.
Net investment income or loss, (other than distribution fees, which are charged directly to the respective class) unrealized and realized gains or losses are allocated daily to each class of shares based upon the relative proportion of net assets of each class at the beginning of the day.
Dividends and Distributions: The Series expects to pay dividends of net investment income and distributions of net realized capital and currency gains, if any, annually.
| | |
| 24 | | Visit our website at www.jennisondryden.com |
Dividends and distributions, which are determined in accordance with federal income tax regulations and which may differ from generally accepted accounting principles, are recorded on the ex-dividend date. Permanent book/tax differences relating to income and gains are reclassified amongst undistributed net investment income, accumulated net realized gain or loss and to paid-in capital in excess of par, as appropriate.
Taxes: For federal income tax purposes, each series in the Fund is treated as a separate taxpaying entity. It is the Series’ policy to continue to meet the requirements of the Internal Revenue Code applicable to regulated investment companies and to distribute all of its taxable net income and capital gains, if any, to its shareholders. Therefore, no federal income tax provision is required.
Withholding taxes on foreign dividends are recorded net of reclaimable amounts, at the time the related income is earned.
Estimates: The preparation of these financial statements requires management to make estimates and assumptions that affect the reported amounts and disclosures in the financial statements. Actual results could differ from those estimates.
Note 2. Agreements
The Fund has a management agreement for the Series with PI. Pursuant to this agreement, PI has responsibility for all investment advisory services and supervises the subadvisor’s performance of such services. PI has entered into a subadvisory agreement with Jennison Associates LLC (“Jennison”). The subadvisory agreement provides that Jennison furnishes investment advisory services in connection with the management of the Series. In connection therewith, Jennison is obligated to keep certain books and records of the Series. PI pays for the services of Jennison, the cost of compensation of officers of the Series, occupancy and certain clerical and bookkeeping costs of the Series. The Series bears all other costs and expenses.
The management fee paid to PI is computed daily and payable monthly, at an annual rate of .75% of the Series’ average daily net assets.
The Fund has a distribution agreement with Prudential Investment Management Services LLC (“PIMS”), which acts as the distributor of the Class A, B, C and Z shares of the Series. The Series compensates PIMS for distributing and servicing the Series’ Class A, Class B and Class C shares, pursuant to plans of distribution, (the “Class A, B and C Plans”), regardless of expenses actually incurred by PIMS. The distribution fees are accrued daily and payable monthly. No distribution or service fees are paid to PIMS as distributor for the Class Z shares of the Series.
| | |
| Prudential World Funds, Inc./Jennison Global Growth Fund | | 25 |
Notes to Financial Statements
Cont’d
Pursuant to the Class A Plan, the Series compensates PIMS, for distribution-related activities at an annual rate of up to .30 of 1% of the average daily net assets of the Class A shares. PIMS has contractually agreed to limit such fees to .25% on the average daily net assets of the Class A shares. Pursuant to the Class B and C Plans, the Series compensates PIMS for distribution-related activities at the annual rate of .75 of 1% of the average daily net assets of Class B shares up to the level of average daily net assets as of February 26,1986, plus 1% of the average daily net assets in excess of such level of the Class B shares, and 1% of average daily net assets of Class C shares.
PIMS has advised the Series that it received approximately $64,100 and $900 in front-end sales charges resulting from sales of Class A and Class C shares, respectively, during the year ended October 31, 2004. From these fees, PIMS paid such sales charges to affiliated broker-dealers, which in turn paid commissions to salespersons and incurred other distribution costs.
PI has advised the Series that it received approximately $111,500 and $1,300 in contingent deferred sales charges imposed upon certain redemptions by Class B and C shareholders, respectively, during the year ended October 31, 2004.
PI, PIMS, and Jennison are indirect, wholly-owned subsidiaries of Prudential Financial, Inc. (“Prudential”).
The Series, along with other affiliated registered investment companies (the “Funds”), is a party to a syndicated credit agreement (“SCA”) with a group of banks. For the period from October 1, 2003 through April 30, 2004, the SCA provided for a commitment of $800 million and allowed the Funds to increase the commitment to $1 billion, if necessary. Effective May 3, 2004, the SCA provided for a commitment of $500 million. Interest on any borrowings under the SCA would be incurred at market rates. The Funds pay a commitment fee of .08 of 1% of the unused portion of the SCA. The commitment fee is accrued daily and paid quarterly and is allocated to the Funds pro rata, based on net assets. The purpose of the SCA is to serve as an alternative source of funding for capital share redemptions. The expiration date of the SCA is October 29, 2004. Effective October 29, 2004, the Funds entered into a revised credit agreement with two banks. The commitment under the revised credit agreement is $500 million. The Funds pay a commitment fee of .075 of 1% of the unused portion of the revised credit agreement. The expiration date of the revised credit agreement will be October 28, 2005. The Series did not borrow any amounts pursuant to the SCA during the year ended October 31, 2004.
| | |
| 26 | | Visit our website at www.jennisondryden.com |
Note 3. Other Transactions With Affiliates
Prudential Mutual Fund Services LLC (“PMFS”), an affiliate of PI and an indirect, wholly-owned subsidiary of Prudential, serves as the Fund’s transfer agent. During the year ended October 31, 2004, the Series incurred fees of approximately $858,400 for the services of PMFS. As of October 31, 2004, approximately $79,700 of such fees were due to PMFS. Transfer agent fees and expenses in the Statement of Operations include certain out-of-pocket expenses paid to non-affiliates, where applicable.
The Series pays networking fees to affiliated and unaffiliated broker/dealers. These networking fees are payments made to broker/dealers that clear mutual fund transactions through a national clearing system. The Fund incurred approximately $121,000 in total networking fees, of which the amount relating to the services of Wachovia Securities, LLC (“Wachovia”) an affiliate of PI was approximately $89,800 for the year ended October 31, 2004. As of October 31, 2004, approximately $23,100 of such fees were due to Wachovia. These amounts are included in transfer agent’s fees and expenses in the Statement of Operations.
The Series invests in the Taxable Money Market Series (the “Portfolio”), a portfolio of Dryden Core Investment Fund, pursuant to an exemptive order received from the Securities and Exchange Commission. The Series is a money market mutual fund registered under the Investment Company Act of 1940, as amended, and managed by PI. During the year ended October 31, 2004, the Series earned income from the Portfolio of $25,319 and $91,343 by investing collateral received from securities lending and excess cash.
For the year ended October 31, 2004, Wachovia earned approximately $300 in brokerage commissions from portfolio transactions executed on behalf of the Series.
Prudential Investment Management, Inc., (“PIM”), an indirect, wholly-owned subsidiary of Prudential, is the Series’ security lending agent. For the year ended October 31, 2004, PIM has been compensated approximately $30,400 for this service.
Note 4. Portfolio Securities
Purchases and sales of investment securities, other than short-term investments, for the year ended October 31, 2004 aggregated $552,314,027 and $653,852,385, respectively.
As of October 31, 2004, the Series had securities on loan with an aggregate market value of $76,941,436. The Series received $78,061,666 in cash as collateral for securities on loan which was used to purchase highly liquid short-term investments in accordance with Fund’s securities lending procedures.
| | |
| Prudential World Funds, Inc./Jennison Global Growth Fund | | 27 |
Notes to Financial Statements
Cont’d
Note 5. Distributions and Tax Information
Distributions to shareholders, which are determined in accordance with federal income tax regulations, which may differ from generally accepted accounting principles, are recorded on the ex-dividend date. In order to present accumulated net investment loss and accumulated net realized losses on investments and foreign currency transactions on the Statement of Assets and Liabilities that more closely represent their tax character, certain adjustments have been made to paid-in-capital in excess of par, accumulated net investment loss and accumulated net realized loss on investments and foreign currency transactions. For the year ended October 31, 2004, the adjustments were to decrease accumulated net investment loss by $570,999, to increase accumulated net realized loss on investments and foreign currency transactions by $47,271,676 and increase paid-in capital in excess of par by $46,700,677. These differences are due to net operating loss, due to the treatment for book and tax purposes of certain transactions involving foreign currency transactions, tax adjustments pertaining to the treatment of passive foreign investment companies and other tax adjustments due to the merger. Net investment income, net realized gains and net assets were not affected by this change.
For the fiscal year ended October 31, 2004, the tax character of dividends paid of $1,082,047 was ordinary income. There was no dividends paid for the fiscal year ended October 31, 2003.
As of October 31, 2004, the Series did not have accumulated undistributed earnings on a tax basis.
The United States federal income tax basis of the Series’ investments and the net unrealized appreciation as of October 31, 2004 were as follows:
| | | | | | | | |
Tax Basis
| | Appreciation
| | Depreciation
| | Other Cost Basis
Adjustment
| | Total Net
Unrealized
Appreciation
|
| $452,225,368 | | $54,614,265 | | $(8,659,443) | | $95,211 | | $46,050,033 |
The difference between book basis and tax basis is primarily attributable to deferred losses on wash sales and passive foreign investment companies for book and tax purposes.
| | |
| 28 | | Visit our website at www.jennisondryden.com |
For federal income tax purposes, the Series had a capital loss carryforward as of October 31, 2004, of approximately $144,812,500 of which $1,715,100 expires in 2005, $6,860,500 expires in 2008, $32,419,400 expires in 2009, $95,037,000 expires in 2010 and $8,780,500 expires in 2011. Approximately $66,968,700 of capital loss carryforward was used to offset net taxable gains realized in the fiscal year ended October 31, 2004. Accordingly, no capital gains distribution in expected to be paid to shareholders until net gains have been realized in excess of such carryforward.
Note 6. Capital
The Fund offers Class A, Class B, Class C and Class Z shares. Class A shares are sold with a front-end sales charge of up to 5.50%. Prior to March 15, 2004, Class A shares were sold with a front-end sales charge of 5.00%. Effective March 15, 2004, all investors who purchase Class A shares in an amount of 1 million or more and sell these shares within 12 months of purchase are subject to a contingent deferred sales charge (CDSC) of 1%, including investors who purchase their shares through broker-dealers affiliated with Prudential Financial, Inc. Class B shares are sold with a contingent deferred sales charge which declines from 5% to zero depending on the period of time the shares are held. Prior to February 2, 2004, Class C shares were sold with a front-end sales charge of 1% and a contingent deferred sales charge of 1% during the first 18 months. Class C shares purchased on or after February 2, 2004 are not subject to a front-end sales charge and the contingent deferred sales charge (CDSC) for Class C shares will be effective during the 12 months from the date of purchase. Class B shares automatically convert to Class A shares on a quarterly basis approximately seven years after purchase. A special exchange privilege is also available for shareholders who qualified to purchase Class A shares at net asset value. Class Z shares are not subject to any sales or redemption charge and are offered exclusively for sale to a limited group of investors.
There are 500 million authorized shares of $.01 par value common stock, divided equally into four classes, designated Class A, Class B, Class C and Class Z common stock.
| | |
| Prudential World Funds, Inc./Jennison Global Growth Fund | | 29 |
Notes to Financial Statements
Cont’d
Transactions in shares of common stock were as follows:
| | | | | | | |
Class A
| | Shares
| | | Amount
| |
Year ended October 31, 2004: | | | | | | | |
Shares sold | | 1,538,249 | | | $ | 20,512,794 | |
Shares issued in connection with reorganization (Note 7) | | 6,721,815 | | | | 82,815,672 | |
Shares issued in reinvestment of dividends and distributions | | 67,011 | | | | 822,896 | |
Shares reacquired | | (6,359,527 | ) | | | (84,267,038 | ) |
| | |
|
| |
|
|
|
Net increase (decrease) in shares outstanding before conversion | | 1,967,548 | | | | 19,884,324 | |
Shares issued upon conversion from Class B | | 1,347,440 | | | | 17,751,465 | |
| | |
|
| |
|
|
|
Net increase (decrease) in shares outstanding | | 3,314,988 | | | $ | 37,635,789 | |
| | |
|
| |
|
|
|
Year ended October 31, 2003: | | | | | | | |
Shares sold | | 3,904,829 | | | $ | 42,792,755 | |
Shares reacquired | | (7,306,255 | ) | | | (80,277,136 | ) |
| | |
|
| |
|
|
|
Net increase (decrease) in shares outstanding before conversion | | (3,401,426 | ) | | | (37,484,381 | ) |
Shares issued upon conversion from Class B | | 1,662,325 | | | | 18,348,560 | |
| | |
|
| |
|
|
|
Net increase (decrease) in shares outstanding | | (1,739,101 | ) | | $ | (19,135,821 | ) |
| | |
|
| |
|
|
|
Class B
| | | | | | |
Year ended October 31, 2004: | | | | | | | |
Shares sold | | 389,763 | | | $ | 4,673,326 | |
Shares issued in connection with reorganization (Note 7) | | 3,009,169 | | | | 33,720,649 | |
Shares reacquired | | (1,191,791 | ) | | | (14,299,947 | ) |
| | |
|
| |
|
|
|
Net increase (decrease) in shares outstanding before conversion | | 2,207,141 | | | | 24,094,028 | |
Shares reacquired upon conversion into Class A | | (1,483,817 | ) | | | (17,751,465 | ) |
| | |
|
| |
|
|
|
Net increase (decrease) in shares outstanding | | 723,324 | | | $ | 6,342,563 | |
| | |
|
| |
|
|
|
Year ended October 31, 2003: | | | | | | | |
Shares sold | | 547,053 | | | $ | 5,520,526 | |
Shares reacquired | | (1,663,518 | ) | | | (16,230,978 | ) |
| | |
|
| |
|
|
|
Net increase (decrease) in shares outstanding before conversion | | (1,116,465 | ) | | | (10,710,452 | ) |
Shares reacquired upon conversion into Class A | | (1,827,256 | ) | | | (18,348,560 | ) |
| | |
|
| |
|
|
|
Net increase (decrease) in shares outstanding | | (2,943,721 | ) | | $ | (29,059,012 | ) |
| | |
|
| |
|
|
|
Class C
| | | | | | |
Year ended October 31, 2004: | | | | | | | |
Shares sold | | 193,525 | | | $ | 2,327,258 | |
Shares issued in connection with reorganization (Note 7) | | 544,826 | | | | 6,083,476 | |
Shares reacquired | | (523,219 | ) | | | (6,278,087 | ) |
| | |
|
| |
|
|
|
Net increase (decrease) in shares outstanding | | 215,132 | | | $ | 2,132,647 | |
| | |
|
| |
|
|
|
| | |
| 30 | | Visit our website at www.jennisondryden.com |
| | | | | | | |
Class C
| | Shares
| | | Amount
| |
Year ended October 31, 2003: | | | | | | | |
Shares sold | | 328,437 | | | $ | 3,315,995 | |
Shares reacquired | | (537,080 | ) | | | (5,369,261 | ) |
| | |
|
| |
|
|
|
Net increase (decrease) in shares outstanding | | (208,643 | ) | | $ | (2,053,266 | ) |
| | |
|
| |
|
|
|
Class Z
| | | | | | |
Year ended October 31, 2004: | | | | | | | |
Shares sold | | 787,823 | | | $ | 10,401,879 | |
Shares issued in connection with reorganization (Note 7) | | 398,158 | | | | 4,957,651 | |
Shares issued in reinvestment of dividends and distributions | | 17,616 | | | | 218,609 | |
Shares reacquired | | (2,582,400 | ) | | | (34,905,096 | ) |
| | |
|
| |
|
|
|
Net increase (decrease) in shares outstanding | | (1,378,803 | ) | | $ | (19,326,957 | ) |
| | |
|
| |
|
|
|
Year ended October 31, 2003: | | | | | | | |
Shares sold | | 1,308,315 | | | $ | 14,341,864 | |
Shares reacquired | | (1,707,766 | ) | | | (18,748,697 | ) |
| | |
|
| |
|
|
|
Net increase (decrease) in shares outstanding | | (399,451 | ) | | $ | (4,406,833 | ) |
| | |
|
| |
|
|
|
Note 7. Plan of Reorganization
On November 21, 2003, Jennison Global Growth Fund acquired all of the net assets of Prudential Pacific Growth Fund, Inc. and the Prudential Europe Growth Fund, Inc. pursuant to a plan of reorganization approved by the Jennison Global Growth Fund shareholders on November 20, 2003. The acquisition was accomplished by a tax-free exchange of Class A, Class B, Class C and Class Z shares.
| | | | | | | | | | | | | |
Prudential Pacific
Growth Fund, Inc.
| | Prudential Europe
Growth Fund, Inc.
| | Jennison Global Growth Fund
| | Value
|
| Class A | | 3,474,325 | | Class A | | 4,455,047 | | Class A | | 6,721,815 | | $ | 82,815,672 |
| B | | 981,473 | | B | | 2,260,273 | | B | | 3,009,169 | | | 33,720,649 |
| C | | 192,708 | | C | | 396,713 | | C | | 544,826 | | | 6,083,476 |
| Z | | 52,978 | | Z | | 360,412 | | Z | | 398,158 | | | 4,957,651 |
The aggregate net assets including unrealized appreciation (depreciation) of the Prudential Pacific Growth Fund, Inc., the Prudential Europe Growth Fund, Inc. and the Jennison Global Growth Fund immediately before the acquisition were $36,184,191, $91,393,257 and $345,758,607, respectively.
The future utilization of the acquired capital loss carryforwards from Prudential Pacific Growth Fund, Inc. and Prudential Europe Growth Fund, Inc. in the amounts of $41,646,269 and $29,257,940, respectively, will be limited under certain conditions defined in the Internal Revenue Code of 1986, as amended.
| | |
| Prudential World Funds, Inc./Jennison Global Growth Fund | | 31 |
Financial Highlights
| | | | |
| | | Class A
| |
| | | Year Ended October 31, 2004 | |
Per Share Operating Performance(a): | | | | |
Net Asset Value, Beginning Of Year | | $ | 12.72 | |
| | |
|
|
|
Income (Loss) From Investment Operations: | | | | |
Net investment income (loss) | | | (.01 | ) |
Net realized and unrealized gain (loss) on investment and foreign currency transactions | | | .78 | |
| | |
|
|
|
Total from investment operations | | | .77 | |
| | |
|
|
|
Less Dividends and Distributions: | | | | |
Dividends from net investment income | | | (.04 | ) |
Distributions in excess of net investment income | | | — | |
Distributions from net realized capital gains | | | — | |
| | |
|
|
|
Total dividends and distributions | | | (.04 | ) |
| | |
|
|
|
Net asset value, end of year | | $ | 13.45 | |
| | |
|
|
|
Total Return(b): | | | 6.11 | % |
Ratios/Supplemental Data: | | | | |
Net assets, end of year (000) | | $ | 315,214 | |
Average net assets (000) | | $ | 327,615 | |
Ratios to average net assets: | | | | |
Operating expenses, including distribution and service (12b-1 fees)(c) | | | 1.39 | % |
Operating expenses, excluding distribution and service (12b-1 fees) | | | 1.14 | % |
Net investment income (loss) | | | (.06 | )% |
For Class A, B, C and Z shares: | | | | |
Portfolio turnover rate | | | 125 | % |
| (a) | Based on average shares outstanding. |
| (b) | Total return does not consider the effects of sales loads. Total return is calculated assuming a purchase of shares on the first day and a sale on the last day of each year reported and includes reinvestment of dividends and distributions. |
| (c) | The distributor of the Series has contractually agreed to reduce its distribution and service (12b-1) for Class A shares to .25 of 1% of the average net assets. |
See Notes to Financial Statements.
| | |
| 32 | | Visit our website at www.jennisondryden.com |
| | | | | | | | | | | | | | |
| Class A | |
| Year Ended October 31, | |
| 2003 | | | 2002 | | | 2001 | | | 2000 | |
| | | | | | | | | | | | | | | |
| $ | 10.21 | | | $ | 12.23 | | | $ | 21.35 | | | $ | 21.19 | |
|
|
| |
|
|
| |
|
|
| |
|
|
|
| | | | | | | | | | | | | | | |
| | .02 | | | | (.01 | ) | | | .01 | | | | (.09 | ) |
| | 2.49 | | | | (2.01 | ) | | | (5.83 | ) | | | 2.25 | |
|
|
| |
|
|
| |
|
|
| |
|
|
|
| | 2.51 | | | | (2.02 | ) | | | (5.82 | ) | | | 2.16 | |
|
|
| |
|
|
| |
|
|
| |
|
|
|
| | — | | | | — | | | | — | | | | — | |
| | — | | | | — | | | | — | | | | (.19 | ) |
| | — | | | | — | | | | (3.30 | ) | | | (1.81 | ) |
|
|
| |
|
|
| |
|
|
| |
|
|
|
| | — | | | | — | | | | (3.30 | ) | | | (2.00 | ) |
|
|
| |
|
|
| |
|
|
| |
|
|
|
| $ | 12.72 | | | $ | 10.21 | | | $ | 12.23 | | | $ | 21.35 | |
|
|
| |
|
|
| |
|
|
| |
|
|
|
| | 24.58 | % | | | (16.52 | )% | | | (30.87 | )% | | | 9.80 | % |
| | | | | | | | | | | | | | | |
| $ | 256,106 | | | $ | 223,191 | | | $ | 304,777 | | | $ | 396,870 | |
| $ | 230,103 | | | $ | 284,046 | | | $ | 353,879 | | | $ | 415,035 | |
| | | | | | | | | | | | | | | |
| | 1.59 | % | | | 1.46 | % | | | 1.37 | % | | | 1.27 | % |
| | 1.34 | % | | | 1.21 | % | | | 1.12 | % | | | 1.02 | % |
| | .15 | % | | | (.18 | )% | | | .06 | % | | | (.38 | )% |
| | | | | | | | | | | | | | | |
| | 79 | % | | | 67 | % | | | 72 | % | | | 82 | % |
See Notes to Financial Statements.
| | |
| Prudential World Funds, Inc./Jennison Global Growth Fund | | 33 |
Financial Highlights
Cont’d
| | | | |
| | | Class B
| |
| | | Year Ended October 31, 2004 | |
Per Share Operating Performance(a): | | | | |
Net Asset Value, Beginning Of Year | | $ | 11.54 | |
| | |
|
|
|
Income (Loss) From Investment Operations: | | | | |
Net investment loss | | | (.07 | ) |
Net realized and unrealized gain (loss) on investment and foreign currency transactions | | | .71 | |
| | |
|
|
|
Total from investment operations | | | .64 | |
| | |
|
|
|
Less Dividends and Distributions: | | | | |
Distributions in excess of net investment income | | | — | |
Distributions from net realized capital gains | | | — | |
| | |
|
|
|
Total dividends and distributions | | | — | |
| | |
|
|
|
Net asset value, end of year | | $ | 12.18 | |
| | |
|
|
|
Total Return(b): | | | 5.55 | % |
Ratios/Supplemental Data: | | | | |
Net assets, end of year (000) | | $ | 65,603 | |
Average net assets (000) | | $ | 75,607 | |
Ratios to average net assets: | | | | |
Operating expenses, including distribution and service (12b-1 fees) | | | 1.89 | % |
Operating expenses, excluding distribution and service (12b-1 fees) | | | 1.14 | % |
Net investment loss | | | (.55 | )% |
| (a) | Based on average shares outstanding. |
| (b) | Total return does not consider the effects of sales loads. Total return is calculated assuming a purchase of shares on the first day and a sale on the last day of each year reported and includes reinvestment of dividends and distributions. |
See Notes to Financial Statements.
| | |
| 34 | | Visit our website at www.jennisondryden.com |
| | | | | | | | | | | | | | |
| Class B | |
| Year Ended October 31, | |
| 2003 | | | 2002 | | | 2001 | | | 2000 | |
| | | | | | | | | | | | | | | |
| $ | 9.31 | | | $ | 11.23 | | | $ | 20.00 | | | $ | 19.98 | |
|
|
| |
|
|
| |
|
|
| |
|
|
|
| | | | | | | | | | | | | | | |
| | (.04 | ) | | | (.08 | ) | | | (.08 | ) | | | (.24 | ) |
| | 2.27 | | | | (1.84 | ) | | | (5.39 | ) | | | 2.12 | |
|
|
| |
|
|
| |
|
|
| |
|
|
|
| | 2.23 | | | | (1.92 | ) | | | (5.47 | ) | | | 1.88 | |
|
|
| |
|
|
| |
|
|
| |
|
|
|
| | | | | | | | | | | | | | | |
| | — | | | | — | | | | — | | | | (.05 | ) |
| | — | | | | — | | | | (3.30 | ) | | | (1.81 | ) |
|
|
| |
|
|
| |
|
|
| |
|
|
|
| | — | | | | — | | | | (3.30 | ) | | | (1.86 | ) |
|
|
| |
|
|
| |
|
|
| |
|
|
|
| $ | 11.54 | | | $ | 9.31 | | | $ | 11.23 | | | $ | 20.00 | |
|
|
| |
|
|
| |
|
|
| |
|
|
|
| | 23.95 | % | | | (17.10 | )% | | | (31.27 | )% | | | 8.94 | % |
| | | | | | | | | | | | | | | |
| $ | 53,834 | | | $ | 70,804 | | | $ | 130,201 | | | $ | 288,418 | |
| $ | 58,843 | | | $ | 109,004 | | | $ | 195,461 | | | $ | 355,100 | |
| | | | | | | | | | | | | | | |
| | 2.09 | % | | | 2.00 | % | | | 2.00 | % | | | 1.96 | % |
| | 1.34 | % | | | 1.21 | % | | | 1.12 | % | | | 1.02 | % |
| | (.37 | )% | | | (.73 | )% | | | (.58 | )% | | | (1.07 | )% |
See Notes to Financial Statements.
| | |
| Prudential World Funds, Inc./Jennison Global Growth Fund | | 35 |
Financial Highlights
Cont’d
| | | | |
| | | Class C
| |
| | | Year Ended
October 31, 2004 | |
Per Share Operating Performance(a): | | | | |
Net Asset Value, Beginning Of Year | | $ | 11.50 | |
| | |
|
|
|
Income (Loss) From Investment Operations: | | | | |
Net investment income loss | | | (.10 | ) |
Net realized and unrealized gain (loss) on investment and foreign currency transactions | | | .71 | |
| | |
|
|
|
Total from investment operations | | | .61 | |
| | |
|
|
|
Less Dividends and Distributions: | | | | |
Distributions in excess of net investment income | | | — | |
Distributions from net realized capital gains | | | — | |
| | |
|
|
|
Total dividends and distributions | | | — | |
| | |
|
|
|
Net asset value, end of year | | $ | 12.11 | |
| | |
|
|
|
Total Return(b): | | | 5.30 | % |
Ratios/Supplemental Data: | | | | |
Net assets, end of year (000) | | $ | 16,343 | |
Average net assets (000) | | $ | 17,682 | |
Ratios to average net assets: | | | | |
Operating expenses, including distribution and service (12b-1 fees) | | | 2.14 | % |
Operating expenses, excluding distribution and service (12b-1 fees) | | | 1.14 | % |
Net investment loss | | | (.81 | )% |
| (a) | Based on average shares outstanding. |
| (b) | Total return does not consider the effects of sales loads. Total return is calculated assuming a purchase of shares on the first day and a sale on the last day of each year reported and includes reinvestment of dividends and distributions. |
See Notes to Financial Statements.
| | |
| 36 | | Visit our website at www.jennisondryden.com |
| | | | | | | | | | | | | | |
| Class C | |
| Year Ended October 31, | |
| 2003 | | | 2002 | | | 2001 | | | 2000 | |
| | | | | | | | | | | | | | | |
| $ | 9.30 | | | $ | 11.24 | | | $ | 19.99 | | | $ | 19.97 | |
|
|
| |
|
|
| |
|
|
| |
|
|
|
| | | | | | | | | | | | | | | |
| | (.06 | ) | | | (.10 | ) | | | (.09 | ) | | | (.24 | ) |
| | 2.26 | | | | (1.84 | ) | | | (5.36 | ) | | | 2.11 | |
|
|
| |
|
|
| |
|
|
| |
|
|
|
| | 2.20 | | | | (1.94 | ) | | | (5.45 | ) | | | 1.87 | |
|
|
| |
|
|
| |
|
|
| |
|
|
|
| | | | | | | | | | | | | | | |
| | — | | | | — | | | | — | | | | (.04 | ) |
| | — | | | | — | | | | (3.30 | ) | | | (1.81 | ) |
|
|
| |
|
|
| |
|
|
| |
|
|
|
| | — | | | | — | | | | (3.30 | ) | | | (1.85 | ) |
|
|
| |
|
|
| |
|
|
| |
|
|
|
| $ | 11.50 | | | $ | 9.30 | | | $ | 11.24 | | | $ | 19.99 | |
|
|
| |
|
|
| |
|
|
| |
|
|
|
| | 23.66 | % | | | (17.26 | )% | | | (31.17 | )% | | | 8.89 | % |
| | | | | | | | | | | | | | | |
| $ | 13,053 | | | $ | 12,490 | | | $ | 16,006 | | | $ | 21,377 | |
| $ | 12,091 | | | $ | 14,897 | | | $ | 18,330 | | | $ | 18,886 | |
| | | | | | | | | | | | | | | |
| | 2.34 | % | | | 2.21 | % | | | 2.12 | % | | | 2.02 | % |
| | 1.34 | % | | | 1.21 | % | | | 1.12 | % | | | 1.02 | % |
| | (.60 | )% | | | (.92 | )% | | | (.68 | )% | | | (1.11 | )% |
See Notes to Financial Statements.
| | |
| Prudential World Funds, Inc./Jennison Global Growth Fund | | 37 |
Financial Highlights
Cont’d
| | | | |
| | | Class Z
| |
| | | Year Ended October 31, 2004 | |
Per Share Operating Performance(a): | | | | |
Net Asset Value, Beginning Of Year | | $ | 12.90 | |
| | |
|
|
|
Income (Loss) From Investment Operations: | | | | |
Net investment income (loss) | | | .01 | |
Net realized and unrealized gain (loss) on investment and foreign currency transactions | | | .79 | |
| | |
|
|
|
Total from investment operations | | | .80 | |
| | |
|
|
|
Less Dividends and Distributions: | | | | |
Dividends from net investment income | | | (.08 | ) |
Distributions in excess of net investment income | | | — | |
Distributions from net realized capital gains | | | — | |
| | |
|
|
|
Total dividends and distributions | | | (.08 | ) |
| | |
|
|
|
Net asset value, end of year | | $ | 13.62 | |
| | |
|
|
|
Total Return(b): | | | 6.32 | % |
Ratios/Supplemental Data: | | | | |
Net assets, end of year (000) | | $ | 19,635 | |
Average net assets (000) | | $ | 24,872 | |
Ratios to average net assets: | | | | |
Operating expenses, including distribution and service (12b-1 fees) | | | 1.14 | % |
Operating expenses, excluding distribution and service (12b-1 fees) | | | 1.14 | % |
Net investment income (loss) | | | .10 | % |
| (a) | Based on average shares outstanding. |
| (b) | Total return is calculated assuming a purchase of shares on the first day and a sale on the last day of each year reported and includes reinvestment of dividends and distributions. |
See Notes to Financial Statements.
| | |
| 38 | | Visit our website at www.jennisondryden.com |
| | | | | | | | | | | | | | |
| Class Z | |
| Year Ended October 31, | |
| 2003 | | | 2002 | | | 2001 | | | 2000 | |
| | | | | | | | | | | | | | | |
| $ | 10.32 | | | $ | 12.35 | | | $ | 21.46 | | | $ | 21.29 | |
|
|
| |
|
|
| |
|
|
| |
|
|
|
| | | | | | | | | | | | | | | |
| | .05 | | | | .01 | | | | .05 | | | | (.02 | ) |
| | 2.53 | | | | (2.04 | ) | | | (5.86 | ) | | | 2.23 | |
|
|
| |
|
|
| |
|
|
| |
|
|
|
| | 2.58 | | | | (2.03 | ) | | | (5.81 | ) | | | 2.21 | |
|
|
| |
|
|
| |
|
|
| |
|
|
|
| | — | | | | — | | | | — | | | | — | |
| | — | | | | — | | | | — | | | | (.23 | ) |
| | — | | | | — | | | | (3.30 | ) | | | (1.81 | ) |
|
|
| |
|
|
| |
|
|
| |
|
|
|
| | — | | | | — | | | | (3.30 | ) | | | (2.04 | ) |
|
|
| |
|
|
| |
|
|
| |
|
|
|
| $ | 12.90 | | | $ | 10.32 | | | $ | 12.35 | | | $ | 21.46 | |
|
|
| |
|
|
| |
|
|
| |
|
|
|
| | 24.90 | % | | | (16.50 | )% | | | (30.57 | )% | | | 9.97 | % |
| | | | | | | | | | | | | | | |
| $ | 36,372 | | | $ | 33,228 | | | $ | 42,562 | | | $ | 70,956 | |
| $ | 33,443 | | | $ | 40,960 | | | $ | 54,387 | | | $ | 77,989 | |
| | | | | | | | | | | | | | | |
| | 1.34 | % | | | 1.21 | % | | | 1.12 | % | | | 1.02 | % |
| | 1.34 | % | | | 1.21 | % | | | 1.12 | % | | | 1.02 | % |
| | .40 | % | | | .08 | % | | | .32 | % | | | (.08 | )% |
See Notes to Financial Statements.
| | |
| Prudential World Funds, Inc./Jennison Global Growth Fund | | 39 |
Report of Independent Registered Public Accounting Firm
The Board of Directors and Shareholders of
The Prudential World Fund, Inc.—Jennison Global Growth Fund
We have audited the accompanying statement of assets and liabilities of The Prudential World Fund, Inc.—Jennison Global Growth Fund (one of the portfolios constituting The Prudential World Fund, Inc., hereafter referred to as the “Fund”), including the portfolio of investments, as of October 31, 2004, and the related statement of operations, the statement of changes in net assets, and the financial highlights for the year then ended. These financial statements and financial highlights are the responsibility of the Fund’s management. Our responsibility is to express an opinion on these financial statements and financial highlights based on our audit. The statement of changes in net assets for the year ended October 31, 2003 and the financial highlights for the periods presented prior to October 31, 2004, were audited by another independent registered public accounting firm, whose report dated December 22, 2003 expressed an unqualified opinion thereon.
We conducted our audit in accordance with the standards of the Public Company Accounting Oversight Board (United States). Those standards require that we plan and perform the audit to obtain reasonable assurance about whether the financial statements and financial highlights are free of material misstatement. An audit includes examining, on a test basis, evidence supporting the amounts and disclosures in the financial statements. Our procedures included confirmation of securities owned as of October 31, 2004, by correspondence with the custodian. As to securities purchased or sold but not yet received or delivered, we performed other appropriate auditing procedures. An audit also includes assessing the accounting principles used and significant estimates made by management, as well as evaluating the overall financial statement presentation. We believe that our audit provides a reasonable basis for our opinion.
In our opinion, the financial statements and financial highlights referred to above present fairly, in all material respects, the financial position of the Fund as of October 31, 2004, and the results of its operations, the changes in its net assets, and the financial highlights for the year then ended, in conformity with U.S. generally accepted accounting principles.

New York, New York
December 22, 2004
| | |
| 40 | | Visit our website at www.jennisondryden.com |
Federal Income Tax Information
(Unaudited)
We are required by the Internal Revenue Code to advise you within 60 days of the Series fiscal year end, October 31, 2004, as to the federal income tax status of the dividends paid by the Series. The Series paid ordinary income distribution in the amount of $0.04 and $0.08 per share for Class A and Class Z, respectively.
Further, we wish to advise you that 100% of the ordinary income dividends paid in the fiscal year ended October 31, 2004 qualified for the corporate dividends received deduction available to corporate taxpayers.
The Series intends to designate 100% of ordinary income dividends as qualified for the reduced tax rate under the Jobs and Growth Tax Relief Reconciliation Act of 2003.
In January 2005, you will be advised on IRS Form 1099 DIV or substitute 1099 DIV as to the federal tax status of the dividends and distributions received by you in calendar year 2004.
| | |
| Prudential World Funds, Inc./Jennison Global Growth Fund | | 41 |
Additional Information
(Unaudited)
The Fund files a complete portfolio of holdings on the Fund’s first and third quarter-end on Form N-Q with the Securities and Exchange Commission (the “Commission”). Form N-Q will be available on the Commission’s website at http://www.sec.gov or by visiting the Commission’s Public Reference Room. For information on the Commission’s Public Reference Room visit the Commission’s website.
| | |
| 42 | | Visit our website at www.jennisondryden.com |
Management of the Fund
(Unaudited)
Information pertaining to the Board of Directors is set forth below. Directors who are not deemed to be “interested persons” of the Fund, as defined in the 1940 Act are referred to as “Independent Directors.” Directors who are deemed to be “interested persons” of the Fund are referred to as “Interested Directors.” “Fund Complex”† consists of the Fund and any other investment companies managed by Prudential Investments LLC (“PI” or the Manager).
Independent Directors(2)
David E.A. Carson (70), Director since 2003(3) Oversees 97 portfolios in Fund complex
Principal occupations (last 5 years): Director (January 2000 to May 2000), Chairman (January 1999 to December 1999), Chairman and Chief Executive Officer (January 1998 to December 1998) and President, Chairman and Chief Executive Officer of People’s Bank (1983-1997).
Other Directorships held:(4) Director of United Illuminating and UIL Holdings (utility company), since 1993.
Robert E. La Blanc (70), Director since 1984(3) Oversees 100 portfolios in Fund complex
Principal occupations (last 5 years): President (since 1981) of Robert E. La Blanc Associates, Inc. (telecommunications); formerly General Partner at Salomon Brothers and Vice-Chairman of Continental Telecom; Trustee of Manhattan College.
Other Directorships held:(4) Director of Chartered Semiconductor Manufacturing, Ltd. (since 1998); Titan Corporation (electronics) (since 1995), Computer Associates International, Inc. (software company); (since 2002) FiberNet Telecom Group, Inc. (telecom company) (since 2003); Director (since April 1999) of the High Yield Plus Fund, Inc.
Douglas H. McCorkindale (65), Director since 2003(3) Oversees 93 portfolios in Fund complex
Principal occupations (last 5 years): Chairman (since February 2001), Chief Executive Officer (since June 2000) and President (since September 1997) of Gannett Co. Inc. (publishing and media); formerly Vice Chairman (March 1984-May 2000) of Gannett Co., Inc.
Other Directorships held:(4) Director of Gannett Co. Inc., Director of Continental Airlines, Inc. (since May 1993); Director of Lockheed Martin Corp. (aerospace and defense) (since May 2001); Director of The High Yield Plus Fund, Inc. (since 1996).
Richard A. Redeker (61), Director since 2003(3) Oversees 94 portfolios in Fund complex
Principal occupations (last 5 years): Management Consultant; Director of Invesmart, Inc. (since 2001) and Director of Penn Tank Lines, Inc. (since 1999).
Other Directorships held:(4) None.
Robin B. Smith (65), Director since 1996(3) Oversees 99 portfolios in Fund complex
Principal occupations (last 5 years): Chairman of the Board (since January 2003) of Publishers Clearing House (direct marketing), formerly Chairman and Chief Executive Officer (August 1996-January 2003) of Publishers Clearing House.
Other Directorships held:(4) Director of BellSouth Corporation (since 1992).
| | |
| Prudential World Funds, Inc./Jennison Global Growth Fund | | 43 |
Stephen Stoneburn (61), Director since 1996(3) Oversees 97 portfolios in Fund complex
Principal occupations (last 5 years): President and Chief Executive Officer (since June 1996) of Quadrant Media Corp. (a publishing company); formerly President (June 1995-June 1996) of Argus Integrated Media, Inc.; Senior Vice President and Managing Director (January 1993-1995) of Cowles Business Media and Senior Vice President of Fairchild Publications, Inc. (1975-1989).
Other Directorships held:(4) None
Clay T. Whitehead (66), Director since 1984(3) Oversees 98 portfolios in Fund complex
Principal occupations (last 5 years): President (since 1983) of National Exchange Inc. (new business development firm).
Other Directorships held:(4) Director (since 2000) of the High Yield Plus Fund, Inc.
Interested Directors(1)
Judy A. Rice (56), President since 2003 and Director since 2000(3) Oversees 101 portfolios in Fund complex
Principal occupations (last 5 years): President, Chief Executive Officer, Chief Operating Officer and Officer-in-Charge (since 2003) of PI; Director, Officer-in-Charge, President, Chief Executive Officer and Chief Operating Officer (since May 2003) of American Skandia Advisory Services, Inc. and American Skandia Investment Services, Inc.; Director, Officer-in-Charge, President, Chief Executive Officer (since May 2003) of American Skandia Fund Services, Inc.; Vice President (since February 1999) of Prudential Investment Management Services LLC; President, Chief Executive Officer and Officer-in-Charge (since April 2003) of Prudential Mutual Fund Services LLC; formerly various positions to Senior Vice President (1992-1999) of Prudential Securities Incorporated (Prudential Securities); and various positions to Managing Director (1975-1992) of Salomon Smith Barney; Member of Board of Governors of the Money Management Institute.
Other Directorships held:(4) None
Robert F. Gunia (58), Vice President and Director since 1996(3) Oversees 175 portfolios in Fund complex
Principal occupations (last 5 years): Chief Administrative Officer (since June 1999) of PI; Executive Vice President and Treasurer (since January 1996) of PI; President (since April 1999) of Prudential Investment Management Services LLC (PIMS); Corporate Vice President (since September 1997) of The Prudential Insurance Company of America (Prudential); Director, Executive Vice President and Chief Administrative Officer (since May 2003) of American Skandia Investment Services, Inc., American Skandia Advisory Services, Inc. and American Skandia Fund Services, Inc.; Executive Vice President (since March 1999) and Treasurer (since May 2000) of Prudential Mutual Fund Services LLC; formerly Senior Vice President (March 1987-May 1999) of Prudential Securities.
Other Directorships held:(4) Vice President and Director (since May 1989) and Treasurer (since 1999) of The Asia Pacific Fund, Inc.
Information pertaining to the Officers of the Fund is set forth below.
Officers(2)
Jonathan D. Shain (46), Secretary since 2001(3)
Principal occupations (last 5 years): Vice President and Corporate Counsel (since August 1998) of Prudential; Vice President and Assistant Secretary (since May 2003) of American Skandia Investment Services, Inc. and American Skandia Fund Services, Inc.
| | |
| 44 | | Visit our website at www.jennisondryden.com |
Grace C. Torres (45), Treasurer and Principal Financial and Accounting Officer since 1995(3)
Principal occupations (last 5 years): Senior Vice President (since January 2000) of PI, Senior Vice President and Assistant Treasurer (since May 2003) of American Skandia Investment Services, Inc. and American Skandia Advisory Services, Inc.; formerly First Vice President (December 1996-January 2000) of PI and First Vice President (March 1993-1999) of Prudential Securities.
Lee D. Augsburger (45), Chief Compliance Officer since 2004
Vice President and Chief Compliance Officer (since May 2003) of PI; Vice President and Chief Compliance Officer (since October 2000) of Prudential Investment Management Inc.; formerly Vice President and Chief Legal Officer-Annuities (August 1999-October 2000) of Prudential Insurance Company of America; Vice President and Corporate Counsel (November 1997-August 1999) of Prudential Insurance Company of America.
William V. Healey (51), Chief Legal Officer since 2004
Vice President and Associate General Counsel (since 1998) of Prudential; Executive Vice President and Chief Legal Officer (since February 1999) of Prudential Investments LLC; Senior Vice President, Chief Legal Officer and Secretary (since December 1998) of Prudential Investment Management Services LLC; Executive Vice President and Chief Legal Officer (since February 1999) of Prudential Mutual Fund Services LLC; Vice President and Secretary (since October 1998) of Prudential Investment Management, Inc.; Executive Vice President and Chief Legal Officer (since May 2003) of American Skandia Investment Services, Inc.; American Skandia Fund Services, Inc. and American Skandia Advisory Services, Inc.; Director (June 1999-June 2002 and June 2003-present) of ICI Mutual Insurance Company; prior to August 1998, Associate General Counsel of the Dreyfus Corporation (Dreyfus), a subsidiary of Mellon Bank, N.A. (Mellon Bank), and an officer and/or director of various affiliates of Mellon Bank and Dreyfus.
Maryanne Ryan (40), Anti-Money Laundering Compliance Officer since 2002(3)
Principal occupations (last 5 years): Vice President, Prudential (since November 1998), First Vice President, Prudential Securities (March 1997-May 1998); Anti-Money Laundering Compliance Officer (since 2003) of American Skandia Investment Services, Inc., American Skandia Advisory Services, Inc. and American Skandia Marketing, Inc.
| † | The Fund Complex consists of all investment companies managed by PI. The Funds for which PI serves as manager include JennisonDryden Mutual Funds, Strategic Partners Funds, The Prudential Variable Contract Accounts 2, 10, 11, The Target Portfolio Trust, The Prudential Series Fund, Inc., American Skandia Trust, and Prudential’s Gibraltar Fund. |
| (1) | “Interested” Director, as defined in the Investment Company Act of 1940 (the 1940 Act), by reason of employment with the Manager, (Prudential Investments LLC or PI), the Subadvisers (Prudential Investment Management, Inc. or PIM), (Bank of Ireland Asset Management (U.S.) Limited or BIAM) or (Jennison Associations LLC or Jennison) or the Distributor (Prudential Investment Management Services LLC or PIMS). |
| (2) | Unless otherwise noted, the address of the Directors and Officers is c/o: Prudential Investments LLC, Gateway Center Three, 100 Mulberry Street, Newark, NJ 07102. |
| (3) | There is no set term of office for Trustees and Officers. The Independent Directors have adopted a retirement policy, which calls for the retirement of Directors on December 31 of the year in which they reach the age of 75. The table shows the individuals length of service as Trustee and/or Officer. |
| (4) | This column includes only directorships of companies requested to register, or file reports with the SEC under the Securities and Exchange Act of 1934 (that is, “public companies”) or other investment companies registered under the 1940 Act. |
Additional information about the Fund’s Trustees is included in the Fund’s Statement of Additional Information which is available without charge, upon request, by calling (800) 521-7466 or (732) 482-7555 (Calling from outside the U.S.)
| | |
| Prudential World Funds, Inc./Jennison Global Growth Fund | | 45 |
Growth of a $10,000 Investment
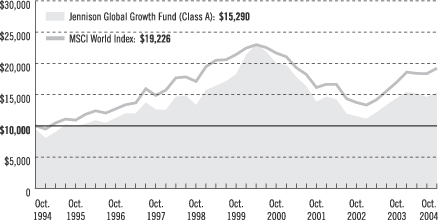
| | | | | | | | | | | | |
| Average Annual Total Returns (With Sales Charges) as of 10/31/04 | | | | |
| | | One Year | | | Five Years | | | Ten Years | | | Since Inception | |
Class A | | 0.27 | % | | –4.57 | % | | 4.34 | % | | 5.62 | % |
Class B | | 0.55 | | | –4.22 | | | 4.25 | | | 9.02 | |
Class C | | 4.30 | | | –4.19 | | | 4.18 | | | 4.43 | |
Class Z | | 6.32 | | | –3.27 | | | N/A | | | 4.79 | |
| | | | | | | | | | | | | |
| Average Annual Total Returns (Without Sales Charges) as of 10/31/04 | |
| | | One Year | | | Five Years | | | Ten Years | | | Since Inception | |
Class A | | 6.11 | % | | –3.48 | % | | 4.93 | % | | 6.02 | % |
Class B | | 5.55 | | | –4.08 | | | 4.25 | | | 9.02 | |
Class C | | 5.30 | | | –4.19 | | | 4.18 | | | 4.43 | |
Class Z | | 6.32 | | | –3.27 | | | N/A | | | 4.79 | |
Performance data quoted represent past performance. Past performance does not guarantee future results. The investment return and principal value of an investment will fluctuate so that an investor’s shares, when redeemed, may be worth more or less than their original cost. Current performance may be lower or higher than the past performance data quoted. The returns in the graph and the tables do not reflect the deduction of taxes that a shareholder would pay on Fund distributions or following the redemption of Fund shares. An investor may obtain performance data current to the most recent month-end by visiting our website at www.jennisondryden.com or by calling (800) 225-1852. The maximum initial sales charge is 5.50%.
Source: Prudential Investments LLC and Lipper Inc. Inception dates: Class A, 1/22/90; Class B, 5/15/84; Class C, 8/1/94; and Class Z, 3/1/96.
| | |
| | | Visit our website at www.jennisondryden.com |
The graph compares a $10,000 investment in the Jennison Global Growth Fund (Class A shares) with a similar investment in the MSCI World Index by portraying the initial account values at the beginning of the 10-year period for Class A shares (October 31, 1994) and the account values at the end of the current fiscal year (October 31, 2004) as measured on a quarterly basis. For purposes of the graph, and unless otherwise indicated, it has been assumed that (a) the maximum applicable front-end sales charge was deducted from the initial $10,000 investment in Class A shares; (b) all recurring fees (including management fees) were deducted; and (c) all dividends and distributions were reinvested. The line graph provides information for Class A shares only. As indicated in the tables provided earlier, performance for Class B, Class C, and Class Z shares will vary due to the differing charges and expenses applicable to each share class (as indicated in the following paragraphs). Without a distribution and service (12b-1) fee waiver of 0.05% annually for Class A shares through October 31, 2004, the returns shown in the graph and for Class A shares in the tables would have been lower.
The MSCI World Index is an unmanaged, weighted index of performance that reflects the stock price movement in securities listed on stock exchanges of Australia, Canada, Europe, the Far East, and the United States. The MSCI World Index’s total returns include the reinvestment of all dividends, but do not include the effects of sales charges, operating expenses of a mutual fund, or taxes. These returns would be lower if they included the effects of sales charges, operating expenses, or taxes. The securities that comprise the MSCI World Index may differ substantially from the securities in the Fund. The MSCI World Index is not the only index that may be used to characterize performance of global stock funds. Other indexes may portray different comparative performance. Investors cannot invest directly in an index.
Through March 14, 2004, the Fund charged a maximum front-end sales charge of 5.00% for Class A shares and a 12b-1 fee of up to 0.30% annually. Effective March 15, 2004, Class A shares are subject to a maximum front-end sales charge of 5.50%, a 12b-1 fee of up to 0.30% annually, and all investors who purchase Class A shares in an amount of $1 million or more and sell these shares within 12 months of purchase are subject to a contingent deferred sales charge (CDSC) of 1%. Class B shares are subject to a declining CDSC of 5%, 4%, 3%, 2%, 1%, and 1% respectively for the first six years after purchase and a 12b-1 fee of 1% annually. Approximately seven years after purchase, Class B shares will automatically convert to Class A shares on a quarterly basis. Until February 2, 2004, Class C shares were subject to a front-end sales charge of 1%, a CDSC of 1% for shares redeemed within 18 months of purchase, and a 12b-1 fee of 1% annually. Class C shares purchased on or after February 2, 2004, are not subject to a front-end sales charge, but charge a CDSC of 1% for Class C shares sold within 12 months from the date of purchase, and an annual 12b-1 fee of 1%. Class Z shares are not subject to a sales charge or 12b-1 fees. The returns in the graph and tables reflect the share class expense structure in effect at the close of the fiscal period.
| | |
| Jennison Global Growth Fund | | |
| | | | |
| n MAIL | | n TELEPHONE | | n WEBSITE |
Gateway Center Three 100 Mulberry Street Newark, NJ 07102 | | (800) 225-1852 | | www.jennisondryden.com |
|
| PROXY VOTING |
The Board of Directors of the Fund has delegated to the Fund’s investment adviser the responsibility for voting any proxies and maintaining proxy recordkeeping with respect to the Fund. A description of these proxy voting policies and procedures is available without charge, upon request, by calling (800) 225-1852 or by visiting the Securities and Exchange
Commission’s (the Commission) website at http://www.sec.gov. Information regarding how the Fund voted proxies relating to portfolio securities during the most recent 12-month period ended June 30, 2004, is available on the Fund’s website at http://www.prudential.com and on the Commission’s website at http://www.sec.gov. |
|
| DIRECTORS |
David E.A. Carson • Robert F. Gunia • Robert E. La Blanc • Douglas H. McCorkindale • Richard A. Redeker • Judy A. Rice • Robin B. Smith • Stephen D. Stoneburn •
Clay T. Whitehead |
|
| OFFICERS |
Judy A. Rice, President • Robert F. Gunia, Vice President • Grace C. Torres, Treasurer and Principal Financial and Accounting Officer • William V. Healey, Chief Legal Officer •
Jonathan D. Shain, Secretary • Maryanne Ryan, Anti-Money Laundering Compliance Officer • Lee D. Augsburger, Chief Compliance Officer |
| | | | |
| MANAGER | | Prudential Investments LLC | | Gateway Center Three
100 Mulberry Street
Newark, NJ 07102 |
|
| INVESTMENT ADVISER | | Jennison Associates, LLC | | 466 Lexington Avenue
New York, NY 10017 |
|
| DISTRIBUTOR | | Prudential Investment
Management Services LLC | | Gateway Center Three
100 Mulberry Street
Newark, NJ 07102 |
|
| CUSTODIAN | | State Street Bank
and Trust Company | | One Heritage Drive
North Quincy, MA 02171 |
|
| TRANSFER AGENT | | Prudential Mutual Fund
Services LLC | | PO Box 8098
Philadelphia, PA 19176 |
|
| INDEPENDENT REGISTERED PUBLIC ACCOUNTING FIRM | | KPMG LLP | | 757 Third Avenue
New York, NY 10017 |
|
| FUND COUNSEL | | Sullivan & Cromwell LLP | | 125 Broad Street
New York, NY 10004 |
| | | | | | | | | | | | |
| Jennison Global Growth Fund | | | | |
| Share Class | | | | A | | B | | C | | Z | | |
NASDAQ | | | | PRGAX | | PRGLX | | PRGCX | | PWGZX | | |
CUSIP | | | | 743969107 | | 743969206 | | 743969305 | | 743969404 | | |
| | | | | | | | | | | | | |
|
| An investor should consider the investment objectives, risks, and charges and expenses of the Fund carefully before investing. The prospectus for the Fund contains this and other information about the Fund. An investor may obtain a prospectus by visiting our website at www.jennisondryden.com or by calling (800) 225-1852. The prospectus should be read carefully before investing. |
|
| Prudential Fixed Income is a business unit of Prudential Investment Management, Inc. (PIM). Quantitative Management Associates LLC, Jennison Associates LLC, and PIM are registered investment advisers and Prudential Financial companies. |
|
| E-DELIVERY |
To receive your mutual fund documents on-line, go to www.icsdelivery.com/prudential/funds
and enroll. Instead of receiving printed documents by mail, you will receive notification via e-mail when new materials are available. You can cancel your enrollment or change your e-mail
address at any time by clicking on the change/cancel enrollment option at the icsdelivery website address. |
|
| SHAREHOLDER COMMUNICATIONS WITH DIRECTORS |
| Shareholders of the Fund can communicate directly with the Board of Directors by writing to the Chair of the Board, Jennison Global Growth Fund, PO Box 13964, Philadelphia, PA 19176. Shareholders can communicate directly with an individual Director by writing to that Director at Jennison Global Growth Fund, PO Box 13964, Philadelphia, PA 19176. Such communications to the Board or individual Directors are not screened before being delivered to the addressee. |
|
| AVAILABILITY OF QUARTERLY PORTFOLIO SCHEDULE |
| The Fund files its complete schedule of portfolio holdings with the Securities and Exchange Commission (the “Commission”) for the first and third quarters of each fiscal year on Form N-Q. The Fund’s Forms N-Q are available on the Commission’s website at http://www.sec.gov. The Fund’s Forms N-Q may also be reviewed and copied at the Commission’s Public Reference Room in Washington, D.C. Information on the operation of the Public Reference Room may be obtained by calling 1-800-SEC-0330. The Fund will provide a full list of its portfolio holdings as of the end of each fiscal quarter on its website at www.jennisondryden.com within 60 days after the end of the fiscal quarter. |
Mutual Funds:
| | | | |
| ARE NOT INSURED BY THE FDIC OR ANY FEDERAL GOVERNMENT AGENCY | | MAY LOSE VALUE | | ARE NOT A DEPOSIT OF OR GUARANTEED BY ANY BANK OR ANY BANK AFFILIATE |
| | | | | | | | | | | | |
| Jennison Global Growth Fund | | | | |
| | | Share Class | | A | | B | | C | | Z | | |
| | | NASDAQ | | PRGAX | | PRGLX | | PRGCX | | PWGZX | | |
| | | CUSIP | | 743969107 | | 743969206 | | 743969305 | | 743969404 | | |
| | | | | | | | | | | | | |
MF115E IFS-AO98922 Ed. 12/2004

Dryden International Equity Fund
| | |
OCTOBER 31, 2004 | | ANNUAL REPORT |

FUND TYPE
Global/International stock
OBJECTIVE
Long-term growth of capital
This report is not authorized for distribution to prospective investors unless preceded or accompanied by a current prospectus.
The views expressed in this report and information about the Fund’s portfolio holdings are for the period covered by this report and are subject to change thereafter.
JennisonDryden is a registered trademark of The Prudential Insurance Company of America.

Dear Shareholder,
December 15, 2004
We hope that you find the annual report for the Dryden International Equity Fund informative and useful. As a JennisonDryden mutual fund shareholder, you may be thinking where you can find additional growth opportunities. You could invest in last year’s top-performing asset class and hope that history repeats itself or you could stay in cash while waiting for the “right moment” to invest.
We believe it is wise to take advantage of developing domestic and global investment opportunities through a diversified portfolio of stock and bond mutual funds. A diversified asset allocation offers two advantages. It helps you manage downside risk by not being overly exposed to any particular asset class, plus it gives you a better opportunity of having at least some of your assets in the right place at the right time. Your financial professional can help you create a diversified investment plan that may include mutual funds that cover all the basic asset classes and is reflective of your personal investor profile and tolerance for risk.
JennisonDryden mutual funds give you a wide range of choices that can help you make progress toward your financial goals. Our funds offer the experience, resources, and professional discipline of three leading asset managers. They are recognized and respected in the institutional market and by discerning investors for excellence in their respective strategies. JennisonDryden equity funds are advised by Jennison Associates LLC and/or Quantitative Management Associates LLC (QMA). Prudential Investment Management, Inc. (PIM) advises the JennisonDryden fixed income and money market funds. Jennison Associates, QMA, and PIM are registered investment advisers and Prudential Financial companies.
Thank you for choosing JennisonDryden mutual funds.
Sincerely,

Judy A. Rice, President
Dryden International Equity Fund
| | |
| Dryden International Equity Fund | | 1 |
Your Fund’s Performance
Fund objective
The investment objective of the Dryden International Equity Fund (the Fund) is long-term growth of capital. There can be no assurance that the Fund will achieve its investment objective.
Performance data quoted represent past performance. Past performance does not guarantee future results. The investment return and principal value of an investment will fluctuate so that an investor’s shares, when redeemed, may be worth more or less than their original cost. Current performance may be lower or higher than the past performance data quoted. An investor may obtain performance data current to the most recent month-end by visiting our website at www.jennisondryden.com or by calling (800) 225-1852. The maximum initial sales charge is 5.50% (Class A shares).
| | | | | | | | | |
| Cumulative Total Returns1 as of 10/31/04 | |
| | | One Year | | | Three Years | | | Since Inception2 | |
Class A | | 18.80 | % | | 31.58 | % | | –42.50 | % |
Class B | | 17.83 | | | 28.47 | | | –44.50 | |
Class C | | 17.83 | | | 28.47 | | | –44.50 | |
Class Z | | 18.85 | | | 32.12 | | | –42.00 | |
MSCI EAFE® Index3 | | 18.84 | | | 31.02 | | | –11.93 | 5 |
Lipper International Multi-Cap Growth Funds Avg.4 | | 13.15 | | | 25.91 | | | –30.65 | 5 |
| | | | | | | | | | |
| Average Annual Total Returns1 as of 9/30/04 | |
| | | One Year | | | Three Years | | | Since Inception2 | |
Class A | | 16.36 | % | | 7.94 | % | | –12.99 | % |
Class B | | 17.45 | | | 8.33 | | | –12.76 | |
Class C | | 21.45 | | | 9.17 | | | –12.57 | |
Class Z | | 23.41 | | | 10.24 | | | –11.74 | |
MSCI EAFE® Index3 | | 22.08 | | | 9.12 | | | –3.44 | 5 |
Lipper International Multi-Cap Growth Funds Avg.4 | | 17.18 | | | 8.08 | | | –8.92 | 5 |
The cumulative total returns do not reflect the deduction of applicable sales charges. If reflected, the applicable sales charges would reduce the cumulative total returns performance quoted. Class A shares are subject to a maximum front-end sales charge of 5.50%. Under certain circumstances, Class A shares may be subject to a contingent deferred sales charge (CDSC) of 1%. Class B and Class C shares are subject to a maximum CDSC of 5% and 1% respectively. Class Z shares are not subject to a sales charge.
1Source: Prudential Investments LLC and Lipper Inc. The average annual total returns take into account applicable sales charges. During certain periods shown, fee waivers and/or expense reimbursements were in
| | |
| 2 | | Visit our website at www.jennisondryden.com |
effect. Without such fee waivers and expense reimbursements, the returns for the classes would have been lower. Class A, Class B, and Class C shares are subject to an annual distribution and service (12b-1) fee of up to 0.30%, 1.00%, and 1.00% respectively. Approximately seven years after purchase, Class B shares will automatically convert to Class A shares on a quarterly basis. Class Z shares are not subject to a 12b-1 fee. The returns in the tables do not reflect the deduction of taxes that a shareholder would pay on Fund distributions or following the redemption of Fund shares.
2Inception date: 3/1/2000.
3The Morgan Stanley Capital International Europe, Australasia, and Far East Index (MSCI EAFE® Index) is an unmanaged, weighted index of performance that reflects stock price movements of developed-country markets in Europe, Australasia, and the Far East.
4The Lipper International Multi-Cap Growth Funds Average (Lipper Average) represents returns based on an average return of all funds in the Lipper International Multi-Cap Growth Funds category. Funds in the Lipper Average invest in a variety of market-capitalization ranges without concentrating 75% of their equity assets in any one market-capitalization range over an extended period of time. Multi-cap funds typically have 25% to 75% of their assets invested in companies strictly outside of the United States with market capitalizations (on a three-year weighted basis) greater than the 250th largest company in the S&P/Citigroup World ex-U.S. Broad Market Index. Multi-cap growth funds typically have an above-average price-to-cash flow ratio, price-to-book ratio, and three-year sales-per-share growth value compared with the S&P/Citigroup World ex-U.S. BMI.
5The Since Inception returns for the MSCI EAFE® Index and the Lipper Average are measured from the closest month-end to inception date, and not from the Fund’s actual inception date.
Investors cannot invest directly in an index. The returns for the MSCI EAFE® Index and the Lipper Average would be lower if they included the effects of sales charges, operating expenses of a mutual fund, or taxes. Returns for the Lipper Average reflect the deduction of operating expenses, but not sales charges or taxes.
| | | |
| Five Largest Holdings in Long-Term Portfolio expressed as a percentage of net assets as of 10/31/04 | | | |
BP PLC, Oil & Gas | | 2.0 | % |
Total SA, Oil & Gas | | 1.9 | |
Toyota Motor Corp., Automobiles | | 1.7 | |
GlaxoSmithKline PLC, Pharmaceuticals | | 1.7 | |
HSBC Holdings PLC, Commercial Banks | | 1.6 | |
Holdings are subject to change.
| | | |
| Five Largest Industries in Long-Term Portfolio expressed as a percentage of net assets as of 10/31/04 | | | |
Commercial Banks | | 19.4 | % |
Oil & Gas | | 9.7 | |
Pharmaceuticals | | 6.6 | |
Insurance | | 5.0 | |
Diversified Telecommunication Services | | 4.5 | |
Industry weightings are subject to change.
| | |
| Dryden International Equity Fund | | 3 |
Investment Adviser’s Report
Prudential Investment Management, Inc.
Our quantitative investment discipline
We use quantitative methods to select individual securities. This means that we rate the attractiveness of a stock with a formula that includes such characteristics as price, the company’s earnings, anticipated future earnings growth, and a number of other variables. We rely on objective data rather than judgments about companies’ business prospects. Usually, stocks of both fast- and slow-growing companies (the former are often called growth stocks, the latter value stocks) are represented in our portfolio. We have found that no single group of selection criteria identifies winners and losers equally well within each style. Therefore we apply different selection criteria to growth and value stocks.
We create a ranking of stocks using proprietary quantitative methods, and put together a portfolio that satisfies our risk control objectives while giving preference to highly ranked stocks. We incorporate risk controls to limit the portfolio’s deviations from the MSCI EAFE universe on many factors—such as industry profile or market capitalization (the value of the overall equity in the firm)—that can affect stock returns.
Analysis of the reporting period’s return
Over the Fund’s reporting period, the MSCI EAFE® Index rose 18.84% in U.S. dollars, while the Fund’s Class A shares returned 18.80%.
During the period, the Fund’s holdings in every country had double-digit gains. Its Australian stocks gained about 38%. Stocks in the United Kingdom and Japan gained 24% and 14% respectively. The appreciation of many foreign currencies against the U.S. dollar was responsible for part of the strong performance of international equities when measured in dollar terms. For example, the euro gained 10% during this period and the Japanese yen gained about 4%.
Throughout this period our stock selection process yielded a portfolio that essentially matched the country weights of our target index. However, a slight underweight in Europe and the United Kingdom in favor of Japan subtracted some relative performance. Strong selection of securities within Continental Europe and Japan substantially offset the impact of regional weightings. For example, we held overweights in the Norwegian shipping company Frontline (+287%) and Finnish energy producer/marketer Fortum (+74%). (Frontline is considered & Norwegian company although it is registered in Bermuda. We sold the position, taking profits, after the end of the reporting period.) In Japan we held overweights in Mitsubishi Tokyo Financial Group (+19%) and Toyota Motor (+38%). These all had significant gains.
The Portfolio of Investments following this report shows the size of the Fund’s positions at period-end.
| | |
| 4 | | Visit our website at www.jennisondryden.com |
Fees and Expenses (Unaudited)
As a shareholder of the Fund, you incur two types of costs: (1) transaction costs, including sales charges (loads) on purchase payments and redemptions, as applicable, and (2) ongoing costs, including management fees, distribution and/or service (12b-1) fees, and other Fund expenses, as applicable. This example is intended to help you understand your ongoing costs (in dollars) of investing in the Fund and to compare these costs with the ongoing costs of investing in other mutual funds.
The example is based on an investment of $1,000 invested on May 1, 2004, at the beginning of the period, and held through the six-month period ended October 31, 2004.
Actual Expenses
The first line for each share class in the following table provides information about actual account values and actual expenses. You may use the information in this line, together with the amount you invested, to estimate the expenses that you paid over the period. Simply divide your account value by $1,000 (for example, an $8,600 account value ÷ $1,000 = 8.6), then multiply the result by the number in the first line under the heading “Expenses Paid During the Six-Month Period” to estimate the expenses you paid on your account during this period. The Fund may charge additional fees to holders of certain accounts that are not included in the expenses shown in the table. These fees apply to Individual Retirement Accounts (IRAs), 403(b) accounts, and Section 529 plan accounts. As of the close of the six months covered by the table, IRA fees included a setup fee of $5, a maintenance fee of up to $36 annually ($18 for the six-month period), and a termination fee of $10. 403(b) accounts and Section 529 plan accounts are each charged an annual $25 fiduciary maintenance fee ($12.50 for the six-month period). Some of the fees vary in amount, or are waived, based on your total account balance or the number of JennisonDryden or Strategic Partners funds, including the Fund, that you own. You should consider the additional fees that were charged to your Fund account over the six-month period when you estimate the total ongoing expenses paid over the period and the impact of these fees on your ending account value, as these additional expenses are not reflected in the information provided in the expense table. Additional fees have the effect of reducing investment returns.
Hypothetical Example for Comparison Purposes
The second line for each share class in the following table provides information about hypothetical account values and hypothetical expenses based on the Fund’s actual expense ratio and an assumed rate of return of 5% per year before expenses, which is not the Fund’s actual return. The hypothetical account values and expenses may not be used to estimate the actual ending account balance or expenses you paid for the period. You may use this information to compare the ongoing costs of investing in the Fund and other funds. To do so, compare this 5% hypothetical example with the 5% hypothetical examples that appear in the shareholder reports of the other funds. The
| | |
| Dryden International Equity Fund | | 5 |
Fund may charge additional fees to holders of certain accounts that are not included in the expenses shown in the table. These fees apply to Individual Retirement Accounts (IRAs), 403(b) accounts, and Section 529 plan accounts. As of the close of the six months covered by the table, IRA fees included a setup fee of $5, a maintenance fee of up to $36 annually ($18 for the six-month period), and a termination fee of $10. 403(b) accounts and Section 529 plan accounts are each charged an annual $25 fiduciary maintenance fee ($12.50 for the six-month period). Some of the fees vary in amount, or are waived, based on your total account balance or the number of JennisonDryden or Strategic Partners funds, including the Fund, that you own. You should consider the additional fees that were charged to your Fund account over the six-month period when you estimate the total ongoing expenses paid over the period and the impact of these fees on your ending account value, as such additional expenses are not reflected in the information provided in the expense table. Additional fees have the effect of reducing investment returns.
Please note that the expenses shown in the table are meant to highlight your ongoing costs only, and do not reflect any transactional costs such as sales charges (loads). Therefore the second line for each share class in the table is useful in comparing ongoing costs only, and will not help you determine the relative total costs of owning different funds. In addition, if these transactional costs were included, your costs would have been higher.
| | | | | | | | | | | | | | |
Dryden International
Equity Fund | | Beginning Account
Value
May 1, 2004 | | Ending Account
Value October 31, 2004 | | Annualized
Expense Ratio
Based on the
Six-Month Period | | | Expenses Paid
During the Six-
Month Period* |
| | | | | | | | | | | | | | | |
| Class A | | Actual | | $ | 1,000 | | $ | 1,079 | | 2.12 | % | | $ | 11.08 |
| | | Hypothetical | | $ | 1,000 | | $ | 1,014 | | 2.12 | % | | $ | 10.73 |
| | | | | | | | | | | | | | | |
| Class B | | Actual | | $ | 1,000 | | $ | 1,073 | | 2.87 | % | | $ | 14.96 |
| | | Hypothetical | | $ | 1,000 | | $ | 1,011 | | 2.87 | % | | $ | 14.51 |
| | | | | | | | | | | | | | | |
| Class C | | Actual | | $ | 1,000 | | $ | 1,073 | | 2.87 | % | | $ | 14.96 |
| | | Hypothetical | | $ | 1,000 | | $ | 1,011 | | 2.87 | % | | $ | 14.51 |
| | | | | | | | | | | | | | | |
| Class Z | | Actual | | $ | 1,000 | | $ | 1,078 | | 1.87 | % | | $ | 9.77 |
| | | Hypothetical | | $ | 1,000 | | $ | 1,016 | | 1.87 | % | | $ | 9.48 |
| | | | | | | | | | | | | | | |
* Fund expenses for each share class are equal to the annualized expense ratio for each share class (provided in the table), multiplied by the average account value over the period, multiplied by the 184 days in the six-month period ended October 31, 2004, and divided by the 366 days in the year ended October 31, 2004 (to reflect the six-month period).
| | |
| 6 | | Visit our website at www.jennisondryden.com |
Portfolio of Investments
as of October 31, 2004
| | | | | |
| Shares | | Description | | Value (Note 1) |
| | | | | | |
LONG-TERM INVESTMENTS 97.9% | | | |
COMMON STOCKS 97.7% | | | |
| |
Australia 4.9% | | | |
| 17,735 | | AMP, Ltd. | | $ | 84,384 |
| 18,579 | | Australia and New Zealand Banking Group, Ltd. | | | 283,103 |
| 300 | | Australian Gas Light Co., Ltd. | | | 2,936 |
| 4,549 | | BHP Billiton, Ltd. | | | 47,061 |
| 103,439 | | BlueScope Steel, Ltd. | | | 597,249 |
| 63,463 | | Boral, Ltd. | | | 314,760 |
| 21,845 | | Centro Properties Group | | | 78,975 |
| 9,417 | | Commonwealth Bank of Australia | | | 225,792 |
| 4,680 | | CSL, Ltd. | | | 100,671 |
| 21,152 | | General Property Trust | | | 58,774 |
| 32,112 | | John Fairfax Holdings, Ltd. | | | 102,900 |
| 39,488 | | Macquarie Infrastructure Group | | | 109,428 |
| 42,934 | | Mirvac Group | | | 145,275 |
| 24,796 | | Orica, Ltd. | | | 314,493 |
| 30,795 | | QBE Insurance Group, Ltd. | | | 315,822 |
| 3,254 | | Rinker Group, Ltd. | | | 21,097 |
| 9,714 | | Suncorp-Metway, Ltd. | | | 124,220 |
| 48,727 | | Telstra Corp., Ltd. | | | 169,972 |
| 2,800 | | Westfield Group(a) | | | 31,372 |
| 54,562 | | Westpac Banking Corp. | | | 769,456 |
| 29,986 | | WMC Resources, Ltd. | | | 151,187 |
| 38,455 | | Woolworths, Ltd. | | | 384,327 |
| | | | |
|
|
| | | | | | 4,433,254 |
| |
Austria 0.9% | | | |
| 100 | | Bank Austria Creditanstalt | | | 7,379 |
| 9,719 | | Erste Bank der oesterreichischen Sparkassen AG | | | 431,347 |
| 322 | | OMV AG | | | 77,103 |
| 5,204 | | voestalpine AG | | | 302,125 |
| | | | |
|
|
| | | | | | 817,954 |
| |
Belgium 1.8% | | | |
| 422 | | Compagnie Maritime Belge SA | | | 88,788 |
| 920 | | Delhaize Group | | | 59,099 |
| 31,734 | | Dexia | | | 633,765 |
| 7,263 | | Fortis | | | 183,946 |
| 5,042 | | KBC Bankverzekeringsholding | | | 368,466 |
| 2,338 | | Mobistar SA(a) | | | 174,874 |
See Notes to Financial Statements.
| | |
| Prudential World Funds, Inc./Dryden International Equity Fund | | 7 |
Portfolio of Investments
as of October 31, 2004 Cont’d.
| | | | | |
| Shares | | Description | | Value (Note 1) |
| | | | | | |
| 161 | | SA D’Ieteren NV | | $ | 29,082 |
| 1,052 | | Umicore | | | 81,028 |
| | | | |
|
|
| | | | | | 1,619,048 |
| |
Bermuda 0.2% | | | |
| 4,332 | | Frontline, Ltd. | | | 212,810 |
| 240 | | Ship Finance International, Ltd. | | | 4,824 |
| | | | |
|
|
| | | | | | 217,634 |
| |
Cayman Islands 0.2% | | | |
| 40,000 | | ASM Pacific Technology, Ltd. | | | 129,249 |
| 10,000 | | Kingboard Chemical Holdings, Ltd. | | | 20,942 |
| | | | |
|
|
| | | | | | 150,191 |
| |
Denmark 0.3% | | | |
| 14 | | A P Moller—Maersk A/S | | | 103,060 |
| 2,400 | | Danisco A/S | | | 132,710 |
| 1,700 | | TDC A/S | | | 62,717 |
| | | | |
|
|
| | | | | | 298,487 |
| |
Finland 1.7% | | | |
| 42,800 | | Fortum Oyj | | | 653,325 |
| 3,100 | | Kesko Oyj (Class “B” Shares) | | | 69,206 |
| 24,161 | | Nokia Oyj | | | 371,574 |
| 700 | | Nokian Renkaat Oyj | | | 75,633 |
| 1,600 | | Orion Oyj (Class “B” Shares) | | | 22,836 |
| 4,400 | | Outokumpu Oyj (Class “A” Shares) | | | 75,616 |
| 2,532 | | Pohjola Group PLC (Class “D” Shares) | | | 26,475 |
| 6,824 | | Rautaruukki Oyj | | | 70,572 |
| 17,736 | | Sampo Oyj (Class “A” Shares) | | | 210,720 |
| | | | |
|
|
| | | | | | 1,575,957 |
| |
France 9.4% | | | |
| 2,887 | | Air France | | | 50,128 |
| 22,968 | | Axa | | | 492,881 |
| 13,232 | | BNP Paribas SA | | | 897,974 |
| 13,644 | | Bouygues SA | | | 535,948 |
| 2,335 | | CNP Assurances | | | 158,462 |
| 11,206 | | Compagnie de Saint-Gobain | | | 613,660 |
| 560 | | Compagnie Generale des Etablissements Michelin (Class “B” Shares) | | | 30,382 |
| 8,737 | | Credit Agricole SA | | | 255,286 |
| 10,143 | | France Telecom SA(a) | | | 289,530 |
See Notes to Financial Statements.
| | |
| 8 | | Visit our website at www.jennisondryden.com |
| | | | | |
| Shares | | Description | | Value (Note 1) |
| | | | | | |
| 1,586 | | Lafarge SA | | $ | 144,350 |
| 729 | | Lagardere S.C.A. | | | 46,830 |
| 2,077 | | Pernod Ricard SA | | | 286,662 |
| 8,254 | | Renault SA | | | 688,767 |
| 16,170 | | Sanofi-Synthelabo SA | | | 1,178,606 |
| 6,235 | | Societe Generale | | | 576,600 |
| 3,250 | | Suez SA | | | 75,738 |
| 8,146 | | Total SA | | | 1,689,025 |
| 3,669 | | Vinci SA | | | 435,678 |
| 4,305 | | Vivendi Universal SA(a) | | | 117,245 |
| | | | |
|
|
| | | | | | 8,563,752 |
| |
Germany 5.5% | | | |
| 941 | | Allianz AG | | | 99,806 |
| 3,078 | | Commerzbank AG(a) | | | 56,107 |
| 3,076 | | Continental AG | | | 167,469 |
| 2,802 | | DaimlerChrysler AG | | | 115,411 |
| 7,013 | | Deutsche Bank AG | | | 531,595 |
| 21,424 | | Deutsche Post AG | | | 417,507 |
| 16,072 | | Deutsche Telekom AG(a) | | | 307,075 |
| 11,590 | | E.ON AG | | | 940,312 |
| 2,401 | | HeidelbergCement AG | | | 117,831 |
| 2,485 | | Metro AG | | | 118,318 |
| 5,447 | | Muenchener Rueckversicherungs-Gesellschaft AG | | | 531,304 |
| 789 | | Puma AG Rudolf Dassler Sport | | | 197,016 |
| 3,272 | | RWE AG | | | 172,812 |
| 903 | | SAP AG | | | 153,381 |
| 10,959 | | Siemens AG | | | 813,422 |
| 7,462 | | Suedzucker AG | | | 141,336 |
| 5,500 | | ThyssenKrupp AG | | | 102,845 |
| | | | |
|
|
| | | | | | 4,983,547 |
| |
Greece 1.1% | | | |
| 3,846 | | Alpha Bank AE | | | 109,098 |
| 1,300 | | Coca-Cola Hellenic Bottling Co. SA | | | 28,807 |
| 10,547 | | EFG Eurobank Ergasias | | | 285,767 |
| 1,251 | | Folli-Follie SA | | | 38,192 |
| 5,300 | | Hellenic Petroleum SA | | | 50,834 |
| 7,540 | | National Bank of Greece SA | | | 209,089 |
| 11,300 | | OPAP SA | | | 229,412 |
| | | | |
|
|
| | | | | | 951,199 |
See Notes to Financial Statements.
| | |
| Prudential World Funds, Inc./Dryden International Equity Fund | | 9 |
Portfolio of Investments
as of October 31, 2004 Cont’d.
| | | | | |
| Shares | | Description | | Value (Note 1) |
| | | | | | |
Hong Kong 1.2% | | | |
| 40,000 | | Cheung Kong Holdings, Ltd. | | $ | 331,475 |
| 9,500 | | CLP Holdings, Ltd. | | | 54,558 |
| 45,506 | | Esprit Holdings, Ltd. | | | 243,216 |
| 21,000 | | Hopewell Holdings, Ltd. | | | 45,192 |
| 17,000 | | Swire Pacific, Ltd. (Class “A” Shares) | | | 120,674 |
| 144,882 | | Techtronic Industries Co., Ltd. | | | 288,521 |
| | | | |
|
|
| | | | | | 1,083,636 |
| |
Ireland 1.1% | | | |
| 8,556 | | Allied Irish Banks PLC | | | 148,562 |
| 26,997 | | Bank of Ireland | | | 369,171 |
| 11,853 | | CRH PLC | | | 281,951 |
| 8,347 | | Depfa Bank PLC | | | 127,414 |
| 28,407 | | Independent News & Media PLC | | | 82,388 |
| | | | |
|
|
| | | | | | 1,009,486 |
| |
Italy 2.9% | | | |
| 130,771 | | Banca Intesa SpA | | | 533,974 |
| 16,837 | | Banca Popolare di Verona E Novara Scrl | | | 297,703 |
| 500 | | Benetton Group SpA | | | 5,756 |
| 400 | | Bulgari SpA | | | 4,127 |
| 49,488 | | Eni SpA | | | 1,120,531 |
| 27,076 | | Grupo Editoriale L’Espresso SpA | | | 144,656 |
| 1,790 | | Italcementi SpA | | | 27,415 |
| 10,912 | | Snam Rete Gas SpA | | | 55,245 |
| 26,057 | | Telecom Italia Mobile SpA | | | 153,134 |
| 78,939 | | Telecom Italia SpA | | | 262,081 |
| | | | |
|
|
| | | | | | 2,604,622 |
| |
Japan 22.6% | | | |
| 410 | | ACOM Co., Ltd. | | | 25,676 |
| 2,700 | | Advantest Corp. | | | 188,408 |
| 100 | | Aiful Corp. | | | 9,963 |
| 7,000 | | Ajinomoto Co., Inc. | | | 77,390 |
| 19,800 | | Aoyama Trading Co., Ltd. | | | 430,718 |
| 13,000 | | Asahi Breweries, Ltd. | | | 133,685 |
| 29,000 | | Asahi Glass Co., Ltd. | | | 265,995 |
| 25,000 | | Asahi Kasei Corp. | | | 106,413 |
| 700 | | Asatsu—DK, Inc. | | | 19,842 |
| 9,000 | | Bank of Yokohama, Ltd. | | | 53,734 |
| 7,000 | | Bridgestone Corp. | | | 126,566 |
See Notes to Financial Statements.
| | |
| 10 | | Visit our website at www.jennisondryden.com |
| | | | | |
| Shares | | Description | | Value (Note 1) |
| | | | | | |
| 16,000 | | Canon, Inc. | | $ | 788,021 |
| 3,000 | | Central Glass Co., Ltd. | | | 20,171 |
| 20,900 | | Chubu Electric Power Co., Inc. | | | 453,663 |
| 4,000 | | Citizen Watch Co., Ltd. | | | 37,518 |
| 2,300 | | Coca-Cola West Japan Co., Ltd. | | | 55,664 |
| 21,000 | | Dai Nippon Printing Co., Ltd. | | | 286,948 |
| 3,000 | | Daimaru, Inc. (The) | | | 22,262 |
| 2,100 | | Daito Trust Construction Co., Ltd. | | | 88,596 |
| 17,000 | | Denki Kagaku Kogyo Kabushiki Kaisha | | | 51,549 |
| 16,800 | | Denso Corp. | | | 401,846 |
| 37 | | East Japan Railway Co. | | | 194,077 |
| 4,000 | | Eisai Co., Ltd. | | | 114,888 |
| 1,500 | | Fast Retailing Co., Ltd. | | | 95,207 |
| 3,000 | | Fujisawa Pharmaceutical Co., Ltd. | | | 78,256 |
| 59,000 | | Hitachi, Ltd. | | | 370,590 |
| 10,800 | | Honda Motor Co., Ltd. | | | 520,727 |
| 3,200 | | Hoya Corp. | | | 327,865 |
| 7,000 | | Itochu Corp.(a) | | | 30,059 |
| 34 | | Japan Tobacco, Inc. | | | 298,088 |
| 11,800 | | JFE Holdings, Inc. | | | 316,141 |
| 7,000 | | Kaneka Corp. | | | 72,841 |
| 7,600 | | Kansai Electric Power Co., Inc. | | | 142,281 |
| 18,000 | | Kao Corp. | | | 414,446 |
| 2,900 | | Katokichi Co., Ltd. | | | 54,428 |
| 35,000 | | Kawasaki Kisen Kaisha, Ltd. | | | 233,026 |
| 1,700 | | Keyence Corp. | | | 382,296 |
| 9,000 | | Kikkoman Corp. | | | 78,990 |
| 21,000 | | Komatsu, Ltd. | | | 140,211 |
| 59,000 | | Kubota Corp. | | | 268,359 |
| 700 | | Kyocera Corp. | | | 50,692 |
| 6,000 | | Kyowa Hakko Kogyo Co., Ltd. | | | 41,925 |
| 15,000 | | Kyushu Electric Power Co., Inc. | | | 296,638 |
| 8,000 | | Makita Corp. | | | 109,991 |
| 17,000 | | Meiji Dairies Corp. | | | 96,695 |
| 58,000 | | Mitsubishi Corp. | | | 639,589 |
| 49,000 | | Mitsubishi Gas Chemical Co., Inc. | | | 209,492 |
| 46 | | Mitsubishi Tokyo Financial Group, Inc. | | | 389,867 |
| 11,000 | | Mitsui & Co., Ltd. | | | 92,297 |
| 80,000 | | Mitsui Mining & Smelting Co., Ltd. | | | 315,661 |
| 73,000 | | Mitsui O.S.K. Lines, Ltd. | | | 431,717 |
| 3,000 | | Mitsui Sumitomo Insurance Co., Ltd. | | | 24,579 |
| 4,000 | | Nippon Meat Packers, Inc. | | | 49,798 |
| 42,000 | | Nippon Oil Corp. | | | 266,183 |
See Notes to Financial Statements.
| | |
| Prudential World Funds, Inc./Dryden International Equity Fund | | 11 |
Portfolio of Investments
as of October 31, 2004 Cont’d.
| | | | | |
| Shares | | Description | | Value (Note 1) |
| | | | | | |
| 17,000 | | Nippon Shokubai Co., Ltd. | | $ | 122,949 |
| 106 | | Nippon Telegraph and Telephone Corp. | | | 449,195 |
| 23,000 | | Nippon Yusen Kabushiki Kaisha | | | 115,444 |
| 69,600 | | Nissan Motor Co., Ltd. | | | 783,238 |
| 17,000 | | Nisshin Seifun Group, Inc. | | | 169,536 |
| 8,100 | | Nitto Denko Corp. | | | 383,680 |
| 2,000 | | Nomura Holdings, Inc. | | | 24,484 |
| 7,000 | | NTN Corp. | | | 36,717 |
| 10,000 | | Obayashi Corp. | | | 53,677 |
| 25,000 | | Oji Paper Co., Ltd. | | | 142,433 |
| 900 | | ORIX Corp. | | | 105,349 |
| 1,850 | | Promise Co., Ltd. | | | 117,422 |
| 15 | | Rakuten, Inc. | | | 112,299 |
| 23,000 | | Ricoh Co., Ltd. | | | 428,854 |
| 1,900 | | Sankyo Co., Ltd. | | | 75,864 |
| 4,600 | | Sankyo Company, Ltd. | | | 95,301 |
| 5,000 | | Sanwa Shutter Corp. | | | 25,520 |
| 10,000 | | Sapporo Holdings, Ltd. | | | 39,834 |
| 1,500 | | Sega Sammy Holdings, Inc.(a) | | | 69,498 |
| 9,000 | | Seino Transportation Co., Ltd. | | | 81,364 |
| 7,000 | | Sekisui Chemical Co., Ltd. | | | 44,430 |
| 6,000 | | Shionogi & Co., Ltd. | | | 92,947 |
| 3,600 | | Sony Corp. | | | 125,097 |
| 46,000 | | Sumitomo Corp. | | | 341,784 |
| 13,000 | | Sumitomo Electric Industries, Ltd. | | | 123,034 |
| 28,000 | | Sumitomo Heavy Industries, Ltd.(a) | | | 81,213 |
| 8,000 | | Sumitomo Realty & Development Co., Ltd. | | | 87,767 |
| 9,000 | | Taisho Pharmaceutical Co., Ltd. | | | 162,219 |
| 19,500 | | Takeda Chemical Industries, Ltd. | | | 940,201 |
| 2,620 | | Takefuji Corp. | | | 165,307 |
| 3,000 | | TDK Corp. | | | 207,929 |
| 2,000 | | THK Co., Ltd. | | | 34,693 |
| 9,600 | | Tohoku Electric Power Co., Inc. | | | 163,541 |
| 6,500 | | Tokyo Broadcasting System, Inc. | | | 103,936 |
| 1,700 | | Tokyo Electric Power Co., Inc. | | | 38,422 |
| 10,000 | | Tokyo Electron, Ltd. | | | 541,482 |
| 134,000 | | Tokyo Gas Co., Ltd. | | | 498,446 |
| 22,000 | | Tokyu Corp. | | | 99,444 |
| 25,000 | | Toray Industries, Inc. | | | 116,536 |
| 18,000 | | Tosoh Corp. | | | 76,109 |
| 6,000 | | Toyo Suisan Kaisha, Ltd. | | | 70,120 |
| 40,500 | | Toyota Motor Corp. | | | 1,575,148 |
| 3,500 | | Trend Micro, Inc. | | | 167,436 |
See Notes to Financial Statements.
| | |
| 12 | | Visit our website at www.jennisondryden.com |
| | | | | |
| Shares | | Description | | Value (Note 1) |
| | | | | | |
| 31 | | West Japan Railway Co. | | $ | 123,486 |
| 2,600 | | Yamada Denki Co., Ltd. | | | 92,061 |
| 16,500 | | Yamaha Corp. | | | 251,563 |
| | | | |
|
|
| | | | | | 20,549,537 |
| |
Luxembourg 0.3% | | | |
| 16,848 | | Arcelor | | | 313,757 |
| |
Netherlands 5.1% | | | |
| 37,199 | | ABN AMRO Holding NV | | | 887,231 |
| 34,851 | | Aegon NV | | | 380,370 |
| 9,558 | | ASML Holding NV(a) | | | 135,808 |
| 2,528 | | Corio NV | | | 125,960 |
| 9,614 | | European Aeronautic Defence and Space Co. | | | 273,329 |
| 36,607 | | ING Groep NV | | | 966,243 |
| 10,495 | | James Hardie Industries NV | | | 49,387 |
| 66,886 | | Koninklijke (Royal) KPN NV | | | 533,466 |
| 8,129 | | Koninklijke (Royal) Philips Electronics NV | | | 191,816 |
| 15,493 | | Royal Dutch Petroleum Co. | | | 839,358 |
| 8,270 | | TPG NV | | | 199,246 |
| 857 | | Wereldhave NV | | | 76,310 |
| | | | |
|
|
| | | | | | 4,658,524 |
| |
New Zealand 0.3% | | | |
| 21,199 | | Fletcher Building, Ltd. | | | 79,037 |
| 9,075 | | Sky Network Telelevison, Ltd.(a) | | | 34,580 |
| 46,024 | | Telecom Corporation of New Zealand, Ltd. | | | 181,668 |
| | | | |
|
|
| | | | | | 295,285 |
| |
Norway 1.2% | | | |
| 19,400 | | DNB NOR ASA | | | 163,896 |
| 4,180 | | Norsk Hydro ASA | | | 306,706 |
| 29,400 | | Statoil ASA | | | 424,314 |
| 22,200 | | Telenor ASA | | | 176,264 |
| | | | |
|
|
| | | | | | 1,071,180 |
| |
Portugal 0.5% | | | |
| 5,109 | | Banco BPI SA | | | 19,822 |
| 18,149 | | Banco Comercial Portugues SA | | | 42,710 |
| 500 | | Banco Espirito Santo SA | | | 8,529 |
| 7,880 | | Jeronimo Martins, SGPS SA(a) | | | 92,519 |
| 22,140 | | Portugal Telecom, SGPS SA | | | 248,681 |
| | | | |
|
|
| | | | | | 412,261 |
See Notes to Financial Statements.
| | |
| Prudential World Funds, Inc./Dryden International Equity Fund | | 13 |
Portfolio of Investments
as of October 31, 2004 Cont’d.
| | | | | |
| Shares | | Description | | Value (Note 1) |
| | | | | | |
Singapore 1.2% | | | |
| 5,000 | | ComfortDelGro Corp., Ltd. | | $ | 4,294 |
| 34,000 | | DBS Group Holdings, Ltd. | | | 318,511 |
| 7,000 | | Fraser and Neave, Ltd. | | | 57,589 |
| 35,000 | | Jardine Cycle & Carriage, Ltd. | | | 168,143 |
| 100,000 | | Neptune Orient Lines, Ltd. | | | 178,351 |
| 15,000 | | Oversea-Chinese Banking Corp., Ltd. | | | 124,306 |
| 26,000 | | Singapore Airlines, Ltd. | | | 167,062 |
| 50,000 | | Singapore Post, Ltd. | | | 24,170 |
| 5,000 | | Singapore Press Holdings, Ltd. | | | 14,112 |
| 5,000 | | United Overseas Bank, Ltd. | | | 40,534 |
| | | | |
|
|
| | | | | | 1,097,072 |
| |
Spain 3.0% | | | |
| 1,000 | | Acerinox SA | | | 13,853 |
| 9,039 | | ACS SA | | | 174,655 |
| 8,151 | | Banco Bilbao Vizcaya Argentaria SA | | | 127,532 |
| 47,269 | | Banco Santander Central Hispano SA | | | 526,124 |
| 19,316 | | Endesa SA | | | 390,923 |
| 10,023 | | Iberdrola SA | | | 218,786 |
| 1,963 | | Metrovacesa SA | | | 85,249 |
| 1,862 | | Promotora de Informaciones SA | | | 35,078 |
| 32,153 | | Repsol YPF SA | | | 694,895 |
| 6,826 | | Telefonica Publicidad e Informacion SA | | | 50,101 |
| 24,184 | | Telefonica SA | | | 398,076 |
| | | | |
|
|
| | | | | | 2,715,272 |
| |
Sweden 2.5% | | | |
| 1,000 | | Billerud | | | 15,253 |
| 500 | | Capio AB(a) | | | 5,026 |
| 63,522 | | Nordea Bank AB | | | 546,976 |
| 22,787 | | Skandinaviska Enskilda Banken AB (Class “A” Shares) | | | 378,013 |
| 3,304 | | SSAB Svenskt Stal AB (Class “A” Shares) | | | 65,261 |
| 10,000 | | Svenska Handelsbanken AB (Class “A” Shares) | | | 215,798 |
| 191,812 | | Telefonaktiebolaget LM Ericsson (Class “B” Shares)(a) | | | 555,496 |
| 11,500 | | TeliaSonera AB | | | 61,436 |
| 11,400 | | Volvo AB (Class “B” Shares) | | | 430,316 |
| | | | |
|
|
| | | | | | 2,273,575 |
| |
Switzerland 5.9% | | | |
| 4,757 | | ABB Ltd.(a) | | | 27,399 |
| 26,453 | | Credit Suisse Group(a) | | | 901,619 |
See Notes to Financial Statements.
| | |
| 14 | | Visit our website at www.jennisondryden.com |
| | | | | |
| Shares | | Description | | Value (Note 1) |
| | | | | | |
| 4,341 | | Kudelski SA(a) | | $ | 131,157 |
| 1,090 | | Logitech International SA(a) | | | 56,385 |
| 2,820 | | Nestle SA | | | 664,834 |
| 17,148 | | Novartis AG | | | 814,974 |
| 4,686 | | Roche Holdings AG | | | 477,395 |
| 105 | | SGS SA | | | 66,682 |
| 957 | | Straumann AG | | | 197,541 |
| 163 | | Sulzer AG | | | 54,811 |
| 4,770 | | Swiss Re | | | 291,810 |
| 18,226 | | UBS AG | | | 1,309,171 |
| 2,893 | | Zurich Financial Services AG(a) | | | 410,551 |
| | | | |
|
|
| | | | | | 5,404,329 |
| |
United Kingdom 23.9% | | | |
| 10,605 | | Alliance Unichem PLC | | | 129,511 |
| 9,257 | | AstraZeneca PLC | | | 378,583 |
| 46,256 | | Aviva PLC | | | 461,914 |
| 5,772 | | BAA PLC | | | 60,654 |
| 111,219 | | Barclays PLC | | | 1,084,145 |
| 35,674 | | Barratt Developments PLC | | | 330,749 |
| 8,276 | | Bellway PLC | | | 102,661 |
| 17,461 | | Berkeley Group Holdings PLC | | | 380,726 |
| 60,962 | | BHP Billiton PLC | | | 618,263 |
| 185,499 | | BP PLC | | | 1,792,919 |
| 1,000 | | BPB PLC | | | 7,700 |
| 11,579 | | British Airways PLC(a) | | | 45,668 |
| 214,380 | | BT Group PLC | | | 729,642 |
| 100 | | Carnival PLC | | | 5,281 |
| 12,910 | | Centrica PLC | | | 56,948 |
| 43,519 | | COLT Telecom Group PLC(a) | | | 35,085 |
| 10,034 | | Diageo PLC | | | 133,937 |
| 31,760 | | Dixons Group PLC | | | 99,948 |
| 11,754 | | Enterprise Inns PLC | | | 133,313 |
| 114,915 | | Friends Provident PLC | | | 286,360 |
| 49,388 | | George Wimpey PLC | | | 316,728 |
| 73,284 | | GlaxoSmithKline PLC | | | 1,540,172 |
| 4,749 | | Hanson PLC | | | 34,980 |
| 45,125 | | HBOS PLC | | | 603,169 |
| 54,065 | | HHG PLC CDI(a) | | | 46,441 |
| 90,389 | | HSBC Holdings PLC | | | 1,456,626 |
| 69,728 | | Imperial Chemical Industries PLC | | | 267,663 |
| 20,414 | | Imperial Tobacco Group PLC | | | 475,786 |
| 4,866 | | Inchcape PLC | | | 131,778 |
See Notes to Financial Statements.
| | |
| Prudential World Funds, Inc./Dryden International Equity Fund | | 15 |
Portfolio of Investments
as of October 31, 2004 Cont’d.
| | | | | |
| Shares | | Description | | Value (Note 1) |
| | | | | | |
| 34,132 | | Kelda Group PLC | | $ | 349,912 |
| 29,818 | | Kesa Electricals PLC | | | 148,609 |
| 136,625 | | Legal & General Group PLC | | | 247,835 |
| 28,711 | | Lloyds TSB Group PLC | | | 226,737 |
| 18,055 | | Marks & Spencer Group PLC | | | 118,765 |
| 10,461 | | Mitchells & Butlers PLC | | | 54,580 |
| 8,546 | | National Grid Transco PLC | | | 74,145 |
| 19,331 | | Next PLC | | | 591,517 |
| 36,913 | | Persimmon PLC | | | 417,989 |
| 46,489 | | Prudential PLC | | | 341,153 |
| 12,247 | | Reckitt Benckiser PLC | | | 335,256 |
| 48,582 | | Reuters Group PLC | | | 330,030 |
| 5,694 | | RMC Group PLC | | | 88,734 |
| 67,461 | | Royal & Sun Alliance Insurance Group PLC | | | 92,397 |
| 35,221 | | Royal Bank of Scotland Group PLC | | | 1,035,794 |
| 17,894 | | Scottish and Southern Energy PLC | | | 273,609 |
| 1,826 | | Severn Trent PLC | | | 30,631 |
| 116,914 | | Shell Transport & Trading Co. PLC | | | 918,475 |
| 54,023 | | Tate & Lyle PLC | | | 419,950 |
| 41,059 | | Taylor Woodrow PLC | | | 174,163 |
| 131,357 | | Tesco PLC | | | 690,767 |
| 4,713 | | Tomkins PLC | | | 21,503 |
| 4,775 | | Trinity Mirror PLC | | | 56,433 |
| 14,896 | | Unilever PLC | | | 125,279 |
| 33,210 | | United Utilities PLC | | | 349,283 |
| 566,943 | | Vodafone Group PLC | | | 1,449,140 |
| 20,033 | | Whitbread PLC | | | 298,057 |
| 3,812 | | William Hill PLC | | | 34,155 |
| 15,014 | | Wolseley PLC | | | 258,871 |
| 39,273 | | WPP Group PLC | | | 393,261 |
| | | | |
|
|
| | | | | | 21,694,380 |
| | | | |
|
|
| | | Total common stocks
(cost $75,890,815) | | | 88,793,939 |
| | | | |
|
|
PREFERRED STOCKS 0.2% | | | |
| |
Australia 0.1% | | | |
| 6,529 | | News Corporation, Ltd. | | | 51,206 |
| |
Germany 0.1% | | | |
| 85 | | Porsche AG | | | 53,950 |
| 4,860 | | ProSiebenSat.1 Media AG | | | 86,798 |
| | | | |
|
|
| | | | | | 140,748 |
| | | | |
|
|
| | | Total preferred stocks
(cost $182,467) | | | 191,954 |
| | | | |
|
|
See Notes to Financial Statements.
| | |
| 16 | | Visit our website at www.jennisondryden.com |
| | | | | |
| Shares | | Description | | Value (Note 1) |
| | | | | | |
RIGHT | | | |
| |
United Kingdom | | | |
| 7,748 | | Prudential PLC(a) (cost $0) | | $ | 13,061 |
| | | | |
|
|
| | | Total long-term investments
(cost $76,073,282) | | | 88,998,954 |
| | | | |
|
|
| | |
Principal
Amount (000)
| | | | |
SHORT-TERM INVESTMENTS 0.4% | | | |
U.S. GOVERNMENT SECURITIES 0.4% | | | |
| |
United States 0.4% | | | |
| $380 | | United States Treasury Bills(b)(c)
1.63%, 12/16/04
(cost $379,232) | | | 379,202 |
| | | | |
|
|
| | | Total Investments 98.3%
(cost $76,452,514) | | | 89,378,156 |
| | | Other assets in excess of liabilities 1.7% | | | 1,527,070 |
| | | | |
|
|
| | | Net Assets 100% | | $ | 90,905,226 |
| | | | |
|
|
| (a) | Non-income producing security. |
| (b) | Rate quoted represents yield-to-maturity as of purchase date. |
| (c) | All or portion of security segregated as collateral for financial futures contracts. |
See Notes to Financial Statements.
| | |
| Prudential World Funds, Inc./Dryden International Equity Fund | | 17 |
The industry classification of portfolio holdings shown as a percentage of net assets as of October 31, 2004 was as follows:
| | | |
Commercial Banks | | 19.4 | % |
Oil & Gas | | 9.7 | |
Pharmaceuticals | | 6.6 | |
Insurance | | 5.0 | |
Diversified Telecommunication Services | | 4.5 | |
Automobiles | | 4.1 | |
Metals & Mining | | 3.4 | |
Electric Utilities | | 3.4 | |
Wireless Telecommunication Services | | 2.4 | |
Food Products | | 2.3 | |
Household Durables | | 2.1 | |
Diversified Financials | | 1.9 | |
Media | | 1.8 | |
Electronic Equipment & Instruments | | 1.7 | |
Marine | | 1.5 | |
Trading Companies & Distributors | | 1.5 | |
Electrical Equipment | | 1.5 | |
Chemicals | | 1.5 | |
Machinery | | 1.5 | |
Real Estate | | 1.4 | |
Food & Drug Retailing | | 1.4 | |
Office Electronics | | 1.3 | |
Construction Materials | | 1.3 | |
Specialty Retail | | 1.2 | |
Semiconductor Equipment & Products | | 1.1 | |
Multiline Retail | | 1.0 | |
Communications Equipment | | 1.0 | |
Building Products | | 1.0 | |
Auto Components | | 0.9 | |
Tobacco | | 0.9 | |
Hotels Restaurants & Leisure | | 0.8 | |
Household Products | | 0.8 | |
Beverages | | 0.8 | |
Construction & Engineering | | 0.7 | |
Air Freight & Couriers | | 0.7 | |
Gas Utilities | | 0.7 | |
Multi-Utilities | | 0.7 | |
Road & Rail | | 0.5 | |
Leisure Equipment & Products | | 0.4 | |
Water Utilities | | 0.4 | |
Commercial Services & Supplies | | 0.4 | |
Distributors | | 0.4 | |
Software | | 0.4 | |
Aerospace & Defense | | 0.3 | |
Airlines | | 0.3 | |
Textiles & Apparel | | 0.3 | |
See Notes to Financial Statements.
| | |
| 18 | | Visit our website at www.jennisondryden.com |
| | | |
Health Care Equipment & Supplies | | 0.2 | % |
Transportation Infrastructure | | 0.2 | |
Paper & Forest Products | | 0.2 | |
Health Care Providers & Services | | 0.1 | |
Internet & Catalog Retail | | 0.1 | |
Industrial Conglomerates | | 0.1 | |
Computers & Peripherals | | 0.1 | |
Cash & Equivalents | | 0.4 | |
| | |
|
|
| | | 98.3 | |
Other assets in excess of liabilities | | 1.7 | |
| | |
|
|
| | | 100.0 | % |
| | |
|
|
See Notes to Financial Statements.
| | |
| Prudential World Funds, Inc./Dryden International Equity Fund | | 19 |
Statement of Assets and Liabilities
as of October 31, 2004
| | | | |
Assets | | | | |
Investments, at value (cost $76,452,514) | | $ | 89,378,156 | |
Foreign currency, at value (cost $1,463,417) | | | 1,502,529 | |
Cash | | | 43,291 | |
Receivable for Series shares sold | | | 343,798 | |
Dividends receivable | | | 166,446 | |
Tax reclaims receivable | | | 64,499 | |
Prepaid expenses and other assets | | | 1,892 | |
| | |
|
|
|
Total assets | | | 91,500,611 | |
| | |
|
|
|
| |
Liabilities | | | | |
Accrued expenses | | | 282,687 | |
Payable for Series shares reacquired | | | 173,772 | |
Management fee payable | | | 64,527 | |
Distribution fee payable | | | 51,675 | |
Withholding tax payable | | | 13,302 | |
Due to broker-variation margin | | | 8,422 | |
Deferred directors’ fees | | | 1,000 | |
| | |
|
|
|
Total liabilities | | | 595,385 | |
| | |
|
|
|
| |
Net Assets | | $ | 90,905,226 | |
| | |
|
|
|
| | | | | |
Net assets were comprised of: | | | | |
Common stock, at par | | $ | 161,422 | |
Paid-in capital in excess of par | | | 253,897,508 | |
| | |
|
|
|
| | | | 254,058,930 | |
Undistributed net investment income | | | 245,055 | |
Accumulated net realized loss on investments, futures and foreign currency transactions | | | (176,381,306 | ) |
Net unrealized appreciation on investments, futures and foreign currencies | | | 12,982,547 | |
| | |
|
|
|
Net assets October 31, 2004 | | $ | 90,905,226 | |
| | |
|
|
|
See Notes to Financial Statements.
| | |
| 20 | | Visit our website at www.jennisondryden.com |
| | | |
Class A | | | |
Net asset value and redemption price per share
($22,102,836 ÷ 3,844,153 shares of common stock issued and outstanding) | | $ | 5.75 |
Maximum sales charge (5.50% of offering price) | | | 0.33 |
| | |
|
|
Maximum offering price to public | | $ | 6.08 |
| | |
|
|
| |
Class B | | | |
Net asset value, offering price and redemption price per share
($42,252,041 ÷ 7,614,916 shares of common stock issued and outstanding) | | $ | 5.55 |
| | |
|
|
| |
Class C | | | |
Net asset value, offering price and redemption price per share
($13,669,464 ÷ 2,463,646 shares of common stock issued and outstanding) | | $ | 5.55 |
| | |
|
|
| |
Class Z | | | |
Net asset value, offering price and redemption price per share
($12,880,885 ÷ 2,219,519 shares of common stock issued and outstanding) | | $ | 5.80 |
| | |
|
|
See Notes to Financial Statements.
| | |
| Prudential World Funds, Inc./Dryden International Equity Fund | | 21 |
Statement of Operations
Year Ended October 31, 2004
| | | | |
Net Investment Income | | | | |
Income | | | | |
Dividends (net of foreign withholding taxes of $259,240) | | $ | 2,219,480 | |
Interest | | | 5,649 | |
Income from securities loaned, net | | | 5,451 | |
| | |
|
|
|
Total income | | | 2,230,580 | |
| | |
|
|
|
| |
Expenses | | | | |
Management fee | | | 715,305 | |
Distribution fee—Class A | | | 51,900 | |
Distribution fee—Class B | | | 423,339 | |
Distribution fee—Class C | | | 139,562 | |
Transfer agent’s fees and expenses | | | 287,000 | |
Custodian’s fees and expenses | | | 267,000 | |
Reports to shareholders | | | 51,000 | |
Legal fees and expenses | | | 46,000 | |
Registration fees | | | 40,000 | |
Audit fee | | | 23,000 | |
Directors’ fees | | | 12,000 | |
Miscellaneous | | | 47,575 | |
| | |
|
|
|
Total expenses | | | 2,103,681 | |
| | |
|
|
|
Net investment income | | | 126,899 | |
| | |
|
|
|
| |
Realized And Unrealized Gain (Loss) On Investments, Futures And Foreign Currency Transactions | | | | |
Net realized gain on: | | | | |
Investment transactions | | | 17,665,161 | |
Financial futures transactions | | | 98,508 | |
Foreign currency transactions | | | 98,245 | |
| | |
|
|
|
| | | | 17,861,914 | |
| | |
|
|
|
Net change in unrealized appreciation (depreciation) on: | | | | |
Investments | | | (4,251,747 | ) |
Financial futures contracts | | | 6,570 | |
Foreign currencies | | | 65,377 | |
| | |
|
|
|
| | | | (4,179,800 | ) |
| | |
|
|
|
Net gain on investments, futures and foreign currencies | | | 13,682,114 | |
| | |
|
|
|
Net Increase In Net Assets Resulting From Operations | | $ | 13,809,013 | |
| | |
|
|
|
See Notes to Financial Statements.
| | |
| 22 | | Visit our website at www.jennisondryden.com |
Statement of Changes in Net Assets
| | | | | | | | |
| | | Year Ended October 31,
| |
| | | 2004 | | | 2003 | |
Increase (Decrease) In Net Assets | | | | | | | | |
Operations | | | | | | | | |
Net investment income (loss) | | $ | 126,899 | | | $ | (624,367 | ) |
Net realized gain (loss) on investment transactions | | | 17,861,914 | | | | (6,775,564 | ) |
Net change in unrealized appreciation/depreciation on investments
and foreign currencies | | | (4,179,800 | ) | | | 25,510,650 | |
| | |
|
|
| |
|
|
|
Net increase in net assets resulting from operations | | | 13,809,013 | | | | 18,110,719 | |
| | |
|
|
| |
|
|
|
| | |
Series share transactions (net of share conversions) (Note 6) | | | | | | | | |
Net proceeds from shares sold | | | 29,624,483 | | | | 47,247,827 | |
Cost of shares reacquired | | | (30,870,673 | ) | | | (63,443,659 | ) |
| | |
|
|
| |
|
|
|
Net decrease in net assets from Series share transactions | | | (1,246,190 | ) | | | (16,195,832 | ) |
| | |
|
|
| |
|
|
|
Total increase | | | 12,562,823 | | | | 1,914,887 | |
| | |
Net Assets | | | | | | | | |
Beginning of year | | | 78,342,403 | | | | 76,427,516 | |
| | |
|
|
| |
|
|
|
End of year | | $ | 90,905,226 | | | $ | 78,342,403 | |
| | |
|
|
| |
|
|
|
(a) Includes undistributed net investment income of: | | $ | 245,055 | | | $ | — | |
| | |
|
|
| |
|
|
|
See Notes to Financial Statements.
| | |
| Prudential World Funds, Inc./Dryden International Equity Fund | | 23 |
Notes to Financial Statements
Prudential World Fund, Inc. (the “Fund”) is registered under the Investment Company Act of 1940, as an open-end, diversified management investment company and currently consists of three series: Dryden International Equity Fund (the “Series”), Strategic Partners International Value Fund and Jennison Global Growth Fund. These financial statements relate to the Dryden International Equity Fund. The financial statements of the other series are not presented herein. The Series commenced investment operations in March 2000. The investment objective of the Series is to achieve long-term growth of capital. The Series seeks to achieve its objective primarily through investment in equity-related securities of foreign issuers.
Note 1. Accounting Policies
The following is a summary of significant accounting policies followed by the Fund and the Series in the preparation of its financial statements.
Securities Valuation: Securities listed on a securities exchange are valued at the last sale price on such exchange on the day of valuation or, if there was no sale on such day, at the mean between the last reported bid and asked prices, or at the last bid price on such day in the absence of an asked price. Securities that are actively traded via Nasdaq are valued at the official closing price as provided by Nasdaq. Securities that are actively traded in the over-the-counter market, including listed securities for which the primary market is believed by Prudential Investments LLC (“PI” or “Manager”), in consultation with the subadvisor, to be over-the-counter, are valued at market value using prices provided by an independent pricing agent or principal market maker. Options on securities and indices traded on an exchange are valued at the mean between the most recently quoted bid and asked prices on such exchange. Futures contracts and options thereon traded on a commodities exchange or board of trade are valued at the last sale price at the close of trading on such exchange or board of trade or, if there was no sale on the applicable commodities exchange or board of trade on such day, at the mean between the most recently quoted bid and asked prices on such exchange or board of trade or at the last bid price in the absence of an asked price. Prices may be obtained from independent pricing services which use information provided by market makers or estimates of market values obtained from yield data relating to investments or securities with similar characteristics. Securities for which reliable market quotations are not readily available, or whose values have been affected by events occurring after the close of the security’s foreign market and before the Series’ normal pricing time, are valued at fair value in accordance with Board of Directors’ approved fair valuation procedures. Using fair value to price securities may result in a value that is different from a security’s most
| | |
| 24 | | Visit our website at www.jennisondryden.com |
recent closing price and from the price used by other mutual funds to calculate their net asset values. As of October 31, 2004, there were no securities valued in accordance with such procedures.
Investments in mutual funds are valued at their net asset value as of the close of the New York Stock Exchange on the date of valuation.
Short-term securities which mature in 60 days or less are valued at amortized cost, which approximates market value. The amortized cost method includes valuing a security at its cost on the date of purchase and thereafter assuming a constant amortization to maturity of the difference between the principal amount due at maturity and cost. Short-term securities with mature in more than 60 days are valued at current market quotations.
Repurchase Agreements: In connection with transactions in repurchase agreements with United States financial institutions, it is the Fund’s policy that its custodian or designated subcustodians, under triparty repurchase agreements, as the case may be, take possession of the underlying collateral securities, the value of which exceeds the principal amount of the repurchase transaction including accrued interest. To the extent that any repurchase transaction exceeds one business day, the value of the collateral is marked to market on a daily basis to maintain the adequacy of the collateral. If the seller defaults and the value of the collateral declines, or if bankruptcy proceedings are commenced with respect to the seller of the security, realization of the collateral by the Series may be delayed or limited.
Foreign Currency Translation: The books and records of the Series are maintained in U.S. dollars. Foreign currency amounts are translated into U.S. dollars on the following basis:
(i) market value of investment securities, other assets and liabilities-at the current rates of exchange.
(ii) purchases and sales of investment securities, income and expenses-at the rate of exchange prevailing on the respective dates of such transactions.
Although the net assets of the Series are presented at the foreign exchange rates and market values at the close of the fiscal period, the Series does not isolate that portion of the results of operations arising as a result of changes in the foreign exchange rates from the fluctuations arising from changes in the market prices of long-term portfolio securities held at the end of the fiscal period. Similarly, the Series does not isolate the effect of changes in foreign exchange rates from the fluctuations arising from changes in the market prices of long-term portfolio securities sold at the end of the fiscal
| | |
| Prudential World Funds, Inc./Dryden International Equity Fund | | 25 |
Notes to Financial Statements
Cont’d
period. Accordingly, realized foreign currency gains or losses are included in the reported net realized gains or losses on investment transactions.
Net realized gains or losses on foreign currency transactions represent net foreign exchange gains or losses from holdings of foreign currencies, currency gains or losses realized between the trade and settlement dates on security transactions, and the difference between the amounts of dividends, interest and foreign withholding taxes recorded on the Series’ books and the U.S. dollar equivalent amounts actually received or paid. Net unrealized currency gains or losses from valuing foreign currency denominated assets and liabilities (other than investments) at period end exchange rates are reflected as a component of net unrealized appreciation (depreciation) on foreign currencies.
Foreign security and currency transactions may involve certain considerations and risks not typically associated with those of domestic origin as a result of, among other factors, the possibility of political or economic instability, or the level of governmental supervision and regulation of foreign securities markets.
Securities Transactions and Net Investment Income: Securities transactions are recorded on the trade date. Realized and unrealized gains or losses from security and currency transactions are calculated on the identified cost basis. Dividend income is recorded on the ex-dividend date. Interest income, including amortization of premium and accretion of discount on debt securities, as required, is recorded on an accrual basis. Expenses are recorded on the accrual basis.
Net investment income or loss (other than distribution fees which are charged directly to the respective class) and unrealized and realized gains or losses are allocated daily to each class of shares based upon the relative proportion of net assets of each class at the beginning of the day.
Securities Lending: The Series may lend its portfolio securities to broker-dealers. The loans are secured by collateral at least equal at all times to the market value of the securities loaned. Loans are subject to termination at the option of the borrower or the Series. Upon termination of the loan, the borrower will return to the lender securities identical to the loaned securities. Should the borrower of the securities fail financially, the Series has the right to repurchase the securities using the collateral in the open market. The Series recognizes income, net of any rebate and securities lending agent fees, for lending its securities in the form of fees or interest on the investment of any
| | |
| 26 | | Visit our website at www.jennisondryden.com |
cash received as collateral. The Series also continues to receive interest and dividends or amounts equivalent thereto on the securities loaned and recognizes any unrealized gain or loss in the market price of the securities loaned that may occur during the term of the loan.
Financial Futures Contracts: A financial futures contract is an agreement to purchase (long) or sell (short) an agreed amount of securities at a set price for delivery on a future date. Upon entering into a financial futures contract, the Fund is required to pledge to the broker an amount of cash and/or other assets equal to a certain percentage of the contract amount. This amount is known as the “initial margin.” Subsequent payments, known as “variation margin,” are made or received by the Fund each day, depending on the daily fluctuations in the value of the underlying security. Such variation margin is recorded for financial statement purposes on a daily basis as unrealized gain or loss. When the contract expires or is closed, the gain or loss is realized and is presented in the Statement of Operations as net realized gain or loss on financial futures transactions.
The Fund invests in financial futures contracts in order to hedge its existing portfolio securities, or securities the Fund intends to purchase, against fluctuations in value caused by changes in prevailing interest rates or market conditions. Should interest rates move unexpectedly, the Fund may not achieve the anticipated benefits of the financial futures contracts and may realize a loss. The use of futures transactions involves the risk of imperfect correlation in movements in the price of futures contracts, interest rates and the underlying hedged assets.
Financial futures contracts involve elements of both market and credit risk in excess of the amounts reflected on the Statement of Assets and Liabilities.
Dividends and Distributions: The Series expects to pay dividends of net investment income and distributions of net realized capital and currency gains, if any, annually. Dividends and distributions to shareholders, which are determined in accordance with federal income tax regulations which may differ from generally accepted accounting principles, are recorded on the ex-dividend date.
Taxes: For federal income tax purposes, each series in the Fund is treated as a separate taxpaying entity. It is each Series’ policy to continue to meet the requirements of the Internal Revenue Code applicable to regulated investment companies and to distribute all of its taxable net investment income and capital gains, if any, to its shareholders. Therefore, no federal income tax provision is required.
Withholding taxes on foreign dividends are recorded net of reclaimable amounts, at the time the related income is earned.
| | |
| Prudential World Funds, Inc./Dryden International Equity Fund | | 27 |
Notes to Financial Statements
Cont’d
Estimates: The preparation of the financial statements requires management to make estimates and assumptions that affect the reported amounts and disclosures in the financial statements. Actual results could differ from those estimates.
Note 2. Agreements
The Fund has a management agreement for the Series with PI. Pursuant to this agreement, PI has responsibility for all investment advisory services and supervises the subadviser’s performance of such services. Jennison Associates LLC (“Jennison”) was the Series’ subadviser. Effective December 8, 2003, PI entered into a subadvisory agreement Prudential Investment Management, Inc. (“PIM”). The subadvisory agreement provides that PIM furnishes investment advisory services in connection with the management of the Series. In connection therewith, PIM is obligated to keep certain books and records of the Series. PI pays for the services of PIM, the cost of compensation of officers of the Series, occupancy and certain clerical and bookkeeping costs of the Series. The Series bears all other costs and expenses.
The management fee paid to PI is computed daily and payable monthly, at an annual rate of .85 of 1% of the average daily net assets of the Series up to and including $300 million, .75 of 1% of the average daily net assets in excess of $300 million up to and including $1.5 billion and .70 of 1% of the Series’ average daily net assets over $1.5 billion.
The Series has a distribution agreement with Prudential Investment Management Services LLC (“PIMS”) which acts as the distributor of Class A, Class B, Class C and Class Z shares of the Series. The Series compensates PIMS for distributing and servicing the Series’ Class A, Class B and Class C shares, pursuant to a plan of distribution, (the “Class A, B and C Plans”), regardless of expenses actually incurred by PIMS. The distribution fees are accrued daily and payable monthly. No distribution or service fees are paid to PIMS as distributor for Class Z shares of the Series.
Pursuant to the Class A, B and C Plans, the Series compensates PIMS for distribution-related activities at an annual rate of up to .30 of 1%, 1% and 1% of the average daily net assets of the Class A, B, and C shares, respectively. For the year ended October 31, 2004, PIMS contractually agreed to limit such fees to .25 of 1% of the average daily net assets of the Class A shares.
PIMS has advised the Series that they received approximately $34,200 and $1,700 in front-end sales charges resulting from sales of Class A and Class C shares, respectively, during the year ended October 31, 2004. From these fees, PIMS paid
| | |
| 28 | | Visit our website at www.jennisondryden.com |
such sales charges to broker-dealers, which in turn paid commissions to salespersons and incurred other distribution costs.
PIMS has advised the Series that for the year ended October 31, 2004 it received approximately $105,700 and $1,800 in contingent deferred sales charges imposed upon certain redemptions by Class B and Class C shareholders, respectively.
PI, PIM and PIMS are indirect, wholly-owned subsidiaries of Prudential Financial, Inc. (“Prudential”).
The Fund, along with other affiliated registered investment companies (the “Funds”), is a party to a syndicated credit agreement (“SCA”) with a group of banks. For the period from October 1, 2003 through April 30, 2004, the SCA provided for a commitment of $800 million and allowed the Funds to increase the commitment to $1 billion, if necessary. Effective May 3, 2004, the SCA provided for a commitment of $500 million. Interest on any borrowings under the SCA would be incurred at market rates. The Funds pay a commitment fee of .08 of 1% of the unused portion of the SCA. The commitment fee is accrued daily and paid quarterly and is allocated to the Funds pro rata, based on net assets. The purpose of the SCA is to serve as an alternative source of funding for capital share redemptions. The expiration date of the SCA is October 29, 2004.
Effective October 29, 2004, the Funds entered into a revised credit agreement with two banks. The commitment under the revised credit agreement is $500 million. The Funds pay a commitment fee of .075 of 1% of the unused portion of the revised credit agreement. The expiration date of the revised credit agreement will be October 28, 2005. The Fund did not borrow any amounts pursuant to the SCA during the year ended October 31, 2004.
Note 3. Other Transactions with Affiliates
Prudential Mutual Fund Services LLC (“PMFS”), an affiliate of PI and an indirect, wholly-owned subsidiary of Prudential, serves as the Fund’s transfer agent. During the year ended October 31, 2004, the Series incurred fees of approximately $220,400 for the services of PMFS. As of October 31, 2004 approximately $17,100 of such fees were due to PMFS. Transfer agent fees and expenses in the Statement of Operations include certain out-of-pocket expenses paid to non-affiliates, where applicable.
The Series pays networking fees to affiliated and unaffiliated broker/dealers. These networking fees are payments made to broker/dealers that clear mutual fund transactions through a national clearing system. The Series incurred approximately $34,100 in total networking fees, of which the amount relating to the services of Wachovia Securities LLC (“Wachovia”), an affiliate of PI, was approximately $31,900
| | |
| Prudential World Funds, Inc./Dryden International Equity Fund | | 29 |
Notes to Financial Statements
Cont’d
for the year ended October 31, 2004. As of October 31, 2004, approximately $5,600 of such fees were due to Wachovia. These amounts are included in transfer agent’s fees and expenses in the Statement of Operations.
PIM is the securities lending agent for the Series. For the year ended October 31, 2004, PIM has been compensated approximately $1,800 for these services.
The Series invests in the Taxable Money Market Series (the “Portfolio”), a portfolio of the Dryden Core Investment Fund, pursuant to an exemptive order received from the Securities and Exchange Commission. The Portfolio is a money market mutual fund registered under the Investment Company Act of 1940, as amended, and managed by PI. During the year ended October 31, 2004, the Series earned income of approximately $5,000 and $5,500, from the Portfolio, by investing its excess cash and collateral received from securities lending, respectively.
Note 4. Portfolio Securities
Purchases and sales of investment securities, other than short-term investments, for the year ended October 31, 2004 aggregated $84,526,004 and $81,420,937, respectively.
During the year ended October 31, 2004, the Series entered into financial futures contracts. Details of open contracts at October 31, 2004 were as follows:
| | | | | | | | | | | | | | |
Number of
Contracts
| | Type
| | Expiration
Date
| | Value at
Trade
Date
| | Value at
October 31,
2004
| | Unrealized
Appreciation
(Depreciation)
| |
| | | Long Positions: | | | | | | | | | | | | |
| 2 | | Hang Seng Stock Index | | Nov. 04 | | $ | 164,106 | | $ | 167,536 | | $ | 3,430 | |
| 10 | | Nikkei 225 Index | | Dec. 04 | | | 550,900 | | | 536,750 | | | (14,150 | ) |
| 5 | | Share Price Index 200 | | Dec. 04 | | | 339,768 | | | 353,027 | | | 13,259 | |
| 12 | | FTSE 100 Index | | Dec. 04 | | | 1,019,400 | | | 1,019,895 | | | 495 | |
| 13 | | DJ Euro Stoxx 50 Index | | Dec. 04 | | | 462,632 | | | 466,168 | | | 3,536 | |
| | | | | | | | | | | | |
|
|
|
| | | | | | | | | | | | | $ | 6,570 | |
| | | | | | | | | | | | |
|
|
|
Note 5. Tax Information
Distributions to shareholders, which are determined in accordance with federal income tax regulations and which may differ from generally accepted accounting principles, are recorded on the ex-dividends date. In order to present undistributed net investment income (loss) and accumulated net realized gains (losses) on the
| | |
| 30 | | Visit our website at www.jennisondryden.com |
Statement of Assets and Liabilities that more closely represent their tax character, certain adjustments have been made to paid-in capital in excess of par, undistributed net investment income (loss) and accumulated net realized gain (loss) on investment. For the year ended October 31, 2004, the adjustments were to increase accumulated net realized loss on investments and increase undistributed net investment income by $118,156 due to the difference in the treatment for book and tax purposes of certain transactions involving, foreign currencies and other tax adjustments.
As of October 31, 2004, the Series had undistributed ordinary income on a tax basis of $462,989.
For federal income tax purposes, the Series had a capital loss carryforward as of October 31, 2004, of approximately $176,305,000 of which $115,702,000 expires in 2009, $49,177,000 expires in 2010 and $11,426,000 expires in 2011. Accordingly, no capital gains distribution is expected to be paid to shareholders until net gains have been realized in excess of such carryforward. It is uncertain whether the Series will be able to realize the full benefit prior to the expiration date. In addition, the Fund utilized approximately $17,601,000 of its capital loss carry forward to offset net taxable gains realized in the fiscal year ended October 31, 2004.
The United States federal income tax basis of the Series’ investments and the net unrealized appreciation as of October 31, 2004 was as follows:
| | | | | | | | |
Tax Basis
| | Appreciation
| | Depreciation
| | Other Cost
Basis Adjustment
| | Total Net Unrealized
Appreciation
|
| $76,746,937 | | $13,459,494 | | ($828,275) | | $71,055 | | $12,702,274 |
The difference between book and tax basis is primarily attributable to deferred losses on wash sales, and market to market of open passive foreign investment companies.
Note 6. Capital
The Series offers Class A, Class B, Class C and Class Z shares. Class A shares were sold with a front-end sales charge of up to 5%. Class A shares purchased on or after March 15, 2004 are subject to a maximum front-end sales charge of 5.50%. Effective on March 15, 2004, all investors who purchase Class A shares in an amount of $1 million or more and sell these shares within 12 months of purchase are subject to a contingent deferred sales charge (CDS) of 1%, including investors who purchase their shares through broker-dealers affiliated with Prudential. Class B shares are sold with a contingent deferred sales charge which declines from 5% to zero depending on the period of time the shares are held. Class C shares were sold with a front-end sales charge of 1% and a contingent deferred sales charge of 1% during the first 18 months.
| | |
| Prudential World Funds, Inc./Dryden International Equity Fund | | 31 |
Notes to Financial Statements
Cont’d
Class C shares purchased on or after February 2, 2004 are not subject to a front-end sales charge and the contingent deferred sales charge (CDSC) for Class C shares is 12 months from the date or purchase. Class B shares will automatically convert to Class A shares on a quarterly basis approximately seven years after purchase. A special exchange privilege is also available for shareholders who qualify to purchase Class A shares at net asset value. Class Z shares are not subject to any sales or redemption charge and are offered exclusively for sale to a limited group of investors.
There are 500 million authorized shares of $.01 par value common stock, divided equally into four classes, designated Class A, Class B, Class C and Class Z common stock.
Transactions in shares of common stock were as follows:
| | | | | | | |
Class A
| | Shares
| | | Amount
| |
Year ended October 31, 2004: | | | | | | | |
Shares sold | | 1,347,315 | | | $ | 7,229,559 | |
Shares reacquired | | (1,738,594 | ) | | | (9,162,357 | ) |
| | |
|
| |
|
|
|
Net increase (decrease) in shares outstanding before conversion | | (391,279 | ) | | | (1,932,798 | ) |
Shares issued upon conversion from Class B | | 94,663 | | | | 507,267 | |
| | |
|
| |
|
|
|
Net increase (decrease) in shares outstanding | | (296,616 | ) | | $ | (1,425,531 | ) |
| | |
|
| |
|
|
|
Year ended October 31, 2003: | | | | | | | |
Shares sold | | 6,452,827 | | | $ | 25,523,495 | |
Shares reacquired | | (7,622,631 | ) | | | (30,448,210 | ) |
| | |
|
| |
|
|
|
Net increase (decrease) in shares outstanding before conversion | | (1,169,804 | ) | | | (4,924,715 | ) |
Shares issued upon conversion from Class B | | 119,808 | | | | 476,632 | |
| | |
|
| |
|
|
|
Net increase (decrease) in shares outstanding | | (1,049,996 | ) | | $ | (4,448,083 | ) |
| | |
|
| |
|
|
|
Class B
| | | | | | |
Year ended October 31, 2004: | | | | | | | |
Shares sold | | 969,690 | | | $ | 5,012,244 | |
Shares reacquired | | (1,877,866 | ) | | | (9,705,381 | ) |
| | |
|
| |
|
|
|
Net increase (decrease) in shares outstanding before conversion | | (908,176 | ) | | | (4,693,137 | ) |
Shares reacquired upon conversion into Class A | | (97,721 | ) | | | (507,267 | ) |
| | |
|
| |
|
|
|
Net increase (decrease) in shares outstanding | | (1,005,897 | ) | | $ | (5,200,404 | ) |
| | |
|
| |
|
|
|
Year ended October 31, 2003: | | | | | | | |
Shares sold | | 1,419,278 | | | $ | 5,558,876 | |
Shares reacquired | | (2,787,406 | ) | | | (10,623,686 | ) |
| | |
|
| |
|
|
|
Net increase (decrease) in shares outstanding before conversion | | (1,368,128 | ) | | | (5,064,810 | ) |
Shares reacquired upon conversion into Class A | | (122,878 | ) | | | (476,632 | ) |
| | |
|
| |
|
|
|
Net increase (decrease) in shares outstanding | | (1,491,006 | ) | | $ | (5,541,442 | ) |
| | |
|
| |
|
|
|
| | |
| 32 | | Visit our website at www.jennisondryden.com |
| | | | | | | |
Class C
| | Shares
| | | Amount
| |
Year ended October 31, 2004: | | | | | | | |
Shares sold | | 1,059,382 | | | $ | 5,515,749 | |
Shares reaquired | | (1,570,840 | ) | | | (8,158,518 | ) |
| | |
|
| |
|
|
|
Net increase (decrease) in shares outstanding | | (511,458 | ) | | $ | (2,642,769 | ) |
| | |
|
| |
|
|
|
Year ended October 31, 2003: | | | | | | | |
Shares sold | | 2,460,812 | | | $ | 9,351,879 | |
Shares reacquired | | (3,280,089 | ) | | | (12,500,330 | ) |
| | |
|
| |
|
|
|
Net increase (decrease) in shares outstanding | | (819,277 | ) | | $ | (3,148,451 | ) |
| | |
|
| |
|
|
|
Class Z
| | | | | | |
Year ended October 31, 2004: | | | | | | | |
Shares sold | | 2,175,647 | | | $ | 11,866,931 | |
Shares reacquired | | (714,723 | ) | | | (3,844,417 | ) |
| | |
|
| |
|
|
|
Net increase (decrease) in shares outstanding | | 1,460,924 | | | $ | 8,022,514 | |
| | |
|
| |
|
|
|
Year ended October 31, 2003: | | | | | | | |
Shares sold | | 1,685,724 | | | $ | 6,813,577 | |
Shares reacquired | | (2,534,581 | ) | | | (9,871,433 | ) |
| | |
|
| |
|
|
|
Net increase (decrease) in shares outstanding | | (848,857 | ) | | $ | (3,057,856 | ) |
| | |
|
| |
|
|
|
Note 7. Subsequent Events
On December 6, 2004 the Board of Directors of the Fund declared the following dividends per share, payable on December 9, 2004 to shareholders of record on December 8, 2004.
| | | | | | | | | |
| | | Class A
| | Class B
and C
| | Class Z
|
Ordinary Income | | $ | 0.060 | | $ | 0.017 | | $ | 0.074 |
| | |
| Prudential World Funds, Inc./Dryden International Equity Fund | | 33 |
Financial Highlights
| | | | |
| |
| | | Class A
| |
| | | Year Ended
October 31, 2004 | |
Per Share Operating Performance: | | | | |
Net Asset Value, Beginning of Period | | $ | 4.84 | |
| | |
|
|
|
Income (Loss) from investment operations | | | | |
Net investment income (loss) | | | .03 | |
Net realized and unrealized gain (loss) on investment transactions | | | .88 | |
| | |
|
|
|
Total from investment operations | | | .91 | |
| | |
|
|
|
Net asset value, end of period | | $ | 5.75 | |
| | |
|
|
|
Total Return(b): | | | 18.80 | % |
Ratios/Supplemental Data: | | | | |
Net assets, end of period (000) | | $ | 22,103 | |
Average net assets (000) | | $ | 20,760 | |
Ratios to average net assets: | | | | |
Expenses, including distribution and service (12b-1) fees(e) | | | 2.02 | % |
Expenses, excluding distribution and service (12b-1) fees | | | 1.77 | % |
Net investment income (loss) | | | .64 | % |
For Class A, B, C and Z shares: | | | | |
Portfolio turnover rate | | | 100 | % |
| (a) | Commencement of investment operations. |
| (b) | Total return does not consider the effects of sales loads. Total return is calculated assuming a purchase of shares on the first day and a sale on the last day of each period reported, and includes reinvestment of dividends and distributions. Total returns for periods less than a full year are not annualized. |
| (d) | Less than $.005 per share. |
| (e) | The distributor of the Series contractually agreed to limit its distribution and service (12b-1) fees to .25 of 1% of the average net assets of the Class A shares. |
See Notes to Financial Statements.
| | |
| 34 | | Visit our website at www.jennisondryden.com |
| | | | | | | | | | | | | | |
| Class A | |
| Year Ended October 31, | | | March 1, 2000(a)
Through
October 31, 2000 | |
| 2003 | | | 2002 | | | 2001 | | |
| | | | | | | | | | | | | | | |
| $ | 3.74 | | | $ | 4.37 | | | $ | 7.91 | | | $ | 10.00 | |
|
|
| |
|
|
| |
|
|
| |
|
|
|
| | | | | | | | | | | | | | | |
| | (.02 | ) | | | (.02 | ) | | | (.06 | ) | | | (— | )(d) |
| | 1.12 | | | | (.61 | ) | | | (3.48 | ) | | | (2.09 | ) |
|
|
| |
|
|
| |
|
|
| |
|
|
|
| | 1.10 | | | | (.63 | ) | | | (3.54 | ) | | | (2.09 | ) |
|
|
| |
|
|
| |
|
|
| |
|
|
|
| $ | 4.84 | | | $ | 3.74 | | | $ | 4.37 | | | $ | 7.91 | |
|
|
| |
|
|
| |
|
|
| |
|
|
|
| | 29.41 | % | | | (14.42 | )% | | | (44.68 | )% | | | (21.00 | )% |
| | | | | | | | | | | | | | | |
| $ | 20,050 | | | $ | 19,414 | | | $ | 28,860 | | | $ | 75,354 | |
| $ | 18,650 | | | $ | 25,360 | | | $ | 47,713 | | | $ | 85,757 | |
| | | | | | | | | | | | | | | |
| | 2.13 | % | | | 1.88 | % | | | 1.73 | % | | | 1.56 | %(c) |
| | 1.88 | % | | | 1.63 | % | | | 1.48 | % | | | 1.31 | %(c) |
| | (.36 | )% | | | (.56 | )% | | | (.86 | )% | | | (— | )(c) |
| | | | | | | | | | | | | | | |
| | 157 | % | | | 108 | % | | | 63 | % | | | 61 | %(f) |
See Notes to Financial Statements.
| | |
| Prudential World Funds, Inc./Dryden International Equity Fund | | 35 |
Financial Highlights
Cont’d
| | | | |
| |
| | | Class B
| |
| | | Year Ended
October 31, 2004 | |
Per Share Operating Performance: | | | | |
Net Asset Value, Beginning of Period | | $ | 4.71 | |
| | |
|
|
|
Income (Loss) from investment operations | | | | |
Net investment loss | | | (.01 | ) |
Net realized and unrealized gain (loss) on investment transactions | | | .85 | |
| | |
|
|
|
Total from investment operations | | | .84 | |
| | |
|
|
|
Net asset value, end of period | | $ | 5.55 | |
| | |
|
|
|
Total Return(b): | | | 17.83 | % |
Ratios/Supplemental Data: | | | | |
Net assets, end of period (000) | | $ | 42,252 | |
Average net assets (000) | | $ | 42,334 | |
Ratios to average net assets: | | | | |
Expenses, including distribution and service (12b-1) fees | | | 2.77 | % |
Expenses, excluding distribution and service (12b-1) fees | | | 1.77 | % |
Net investment loss | | | (.11 | )% |
| (a) | Commencement of operations. |
| (b) | Total return does not consider the effects of sales loads. Total return is calculated assuming a purchase of shares on the first day and a sale on the last day of each period reported, and includes reinvestment of dividends and distributions. Total returns for periods less than a full year are not annualized. |
See Notes to Financial Statements.
| | |
| 36 | | Visit our website at www.jennisondryden.com |
| | | | | | | | | | | | | | |
| Class B | |
| Year Ended October 31, | | | March 1, 2000(a)
Through
October 31, 2000 | |
| 2003 | | | 2002 | | | 2001 | | |
| | | | | | | | | | | | | | | |
| $ | 3.66 | | | $ | 4.32 | | | $ | 7.87 | | | $ | 10.00 | |
|
|
| |
|
|
| |
|
|
| |
|
|
|
| | | | | | | | | | | | | | | |
| | (.05 | ) | | | (.07 | ) | | | (.11 | ) | | | (.05 | ) |
| | 1.10 | | | | (.59 | ) | | | (3.44 | ) | | | (2.08 | ) |
|
|
| |
|
|
| |
|
|
| |
|
|
|
| | 1.05 | | | | (.66 | ) | | | (3.55 | ) | | | (2.13 | ) |
|
|
| |
|
|
| |
|
|
| |
|
|
|
| $ | 4.71 | | | $ | 3.66 | | | $ | 4.32 | | | $ | 7.87 | |
|
|
| |
|
|
| |
|
|
| |
|
|
|
| | 28.34 | % | | | (15.05 | )% | | | (45.04 | )% | | | (21.40 | )% |
| | | | | | | | | | | | | | | |
| $ | 40,587 | | | $ | 37,059 | | | $ | 54,810 | | | $ | 131,919 | |
| $ | 35,399 | | | $ | 49,086 | | | $ | 87,731 | | | $ | 147,626 | |
| | | | | | | | | | | | | | | |
| | 2.88 | % | | | 2.63 | % | | | 2.48 | % | | | 2.31 | %(c) |
| | 1.88 | % | | | 1.63 | % | | | 1.48 | % | | | 1.31 | %(c) |
| | (1.14 | )% | | | (1.30 | )% | | | (1.60 | )% | | | (.78 | )%(c) |
See Notes to Financial Statements.
| | |
| Prudential World Funds, Inc./Dryden International Equity Fund | | 37 |
Financial Highlights
Cont’d
| | | | |
| |
| | | Class C
| |
| | | Year Ended
October 31, 2004 | |
Per Share Operating Performance: | | | | |
Net Asset Value, Beginning of Period | | $ | 4.71 | |
| | |
|
|
|
Income (Loss) from investment operations | | | | |
Net investment loss | | | (.01 | ) |
Net realized and unrealized gain (loss) on investment transactions | | | .85 | |
| | |
|
|
|
Total from investment operations | | | .84 | |
| | |
|
|
|
Net asset value, end of period | | $ | 5.55 | |
| | |
|
|
|
Total Return(b): | | | 17.83 | % |
Ratios/Supplemental Data: | | | | |
Net assets, end of period (000) | | $ | 13,669 | |
Average net assets (000) | | $ | 13,956 | |
Ratios to average net assets: | | | | |
Expenses, including distribution and service (12b-1) fees | | | 2.77 | % |
Expenses, excluding distribution and service (12b-1) fees | | | 1.77 | % |
Net investment loss | | | (.12 | )% |
| (a) | Commencement of operations. |
| (b) | Total return does not consider the effects of sales loads. Total return is calculated assuming a purchase of shares on the first day and a sale on the last day of each period reported, and includes reinvestment of dividends and distributions. Total returns for periods less than a full year are not annualized. |
See Notes to Financial Statements.
| | |
| 38 | | Visit our website at www.jennisondryden.com |
| | | | | | | | | | | | | | |
| Class C | |
| Year Ended October 31, | | | March 1, 2000(a)
Through
October 31, 2000 | |
| 2003 | | | 2002 | | | 2001 | | |
| | | | | | | | | | | | | | | |
| $ | 3.66 | | | $ | 4.32 | | | $ | 7.87 | | | $ | 10.00 | |
|
|
| |
|
|
| |
|
|
| |
|
|
|
| | | | | | | | | | | | | | | |
| | (.05 | ) | | | (.08 | ) | | | (.12 | ) | | | (.05 | ) |
| | 1.10 | | | | (.58 | ) | | | (3.43 | ) | | | (2.08 | ) |
|
|
| |
|
|
| |
|
|
| |
|
|
|
| | 1.05 | | | | (.66 | ) | | | (3.55 | ) | | | (2.13 | ) |
|
|
| |
|
|
| |
|
|
| |
|
|
|
| $ | 4.71 | | | $ | 3.66 | | | $ | 4.32 | | | $ | 7.87 | |
|
|
| |
|
|
| |
|
|
| |
|
|
|
| | 28.34 | % | | | (15.05 | )% | | | (45.04 | )% | | | (21.40 | )% |
| | | | | | | | | | | | | | | |
| $ | 14,006 | | | $ | 13,906 | | | $ | 24,004 | | | $ | 64,362 | |
| $ | 12,640 | | | $ | 19,770 | | | $ | 41,057 | | | $ | 79,138 | |
| | | | | | | | | | | | | | | |
| | 2.88 | % | | | 2.63 | % | | | 2.48 | % | | | 2.31 | %(c) |
| | 1.88 | % | | | 1.63 | % | | | 1.48 | % | | | 1.31 | %(c) |
| | (1.14 | )% | | | (1.33 | )% | | | (1.61 | )% | | | (.74 | )%(c) |
See Notes to Financial Statements.
| | |
| Prudential World Funds, Inc./Dryden International Equity Fund | | 39 |
Financial Highlights
Cont’d
| | | | |
| |
| | | Class Z
| |
| | | Year Ended
October 31, 2004 | |
Per Share Operating Performance: | | | | |
Net Asset Value, Beginning of Period | | $ | 4.88 | |
| | |
|
|
|
Income (Loss) from investment operations | | | | |
Net investment income (loss) | | | .03 | |
Net realized and unrealized gain (loss) on investment transactions | | | .89 | |
| | |
|
|
|
Total from investment operations | | | .92 | |
| | |
|
|
|
Net asset value, end of period | | $ | 5.80 | |
| | |
|
|
|
Total Return(b): | | | 18.85 | % |
Ratios/Supplemental Data: | | | | |
Net assets, end of period (000) | | $ | 12,881 | |
Average net assets (000) | | $ | 7,103 | |
Ratios to average net assets: | | | | |
Expenses, including distribution and service (12b-1) fees | | | 1.77 | % |
Expenses, excluding distribution and service (12b-1) fees | | | 1.77 | % |
Net investment income | | | .81 | % |
| (a) | Commencement of operations. |
| (b) | Total return does not consider the effects of sales loads. Total return is calculated assuming a purchase of shares on the first day and a sale on the last day of each period reported, and includes reinvestment of dividends and distributions. Total returns for periods less than a full year are not annualized. |
See Notes to Financial Statements.
| | |
| 40 | | Visit our website at www.jennisondryden.com |
| | | | | | | | | | | | | | |
| Class Z | |
| Year Ended October 31, | | | March 1, 2000(a)
Through
October 31, 2000 | |
| 2003 | | | 2002 | | | 2001 | | |
| | | | | | | | | | | | | | | |
| $ | 3.76 | | | $ | 4.39 | | | $ | 7.92 | | | $ | 10.00 | |
|
|
| |
|
|
| |
|
|
| |
|
|
|
| | | | | | | | | | | | | | | |
| | (.01 | ) | | | (.02 | ) | | | (.06 | ) | | | .01 | |
| | 1.13 | | | | (.61 | ) | | | (3.47 | ) | | | (2.09 | ) |
|
|
| |
|
|
| |
|
|
| |
|
|
|
| | 1.12 | | | | (.63 | ) | | | (3.53 | ) | | | (2.08 | ) |
|
|
| |
|
|
| |
|
|
| |
|
|
|
| $ | 4.88 | | | $ | 3.76 | | | $ | 4.39 | | | $ | 7.92 | |
|
|
| |
|
|
| |
|
|
| |
|
|
|
| | 29.79 | % | | | (14.35 | )% | | | (44.50 | )% | | | (20.90 | )% |
| | | | | | | | | | | | | | | |
| $ | 3,699 | | | $ | 6,049 | | | $ | 6,065 | | | $ | 19,703 | |
| $ | 3,533 | | | $ | 7,665 | | | $ | 13,805 | | | $ | 22,320 | |
| | | | | | | | | | | | | | | |
| | 1.88 | % | | | 1.63 | % | | | 1.48 | % | | | 1.31 | %(c) |
| | 1.88 | % | | | 1.63 | % | | | 1.48 | % | | | 1.31 | %(c) |
| | (.31 | )% | | | (.22 | )% | | | (.59 | )% | | | .23 | %(c) |
See Notes to Financial Statements.
| | |
| Prudential World Funds, Inc./Dryden International Equity Fund | | 41 |
Report of Independent Registered Public Accounting Firm
The Board of Directors and Shareholders of
Prudential World Fund—Dryden International Equity Fund
We have audited the accompanying statement of assets and liabilities of The Prudential World Fund—Dryden International Equity Fund hereafter referred to as the “Fund”, including the portfolio of investments, as of October 31, 2004, and the related statement of operations, the statement of changes in net assets, and the financial highlights for the year then ended. These financial statements and financial highlights are the responsibility of the Fund’s management. Our responsibility is to express an opinion on these financial statements and financial highlights based on our audit. The statement of changes in net assets for the year ended October 31, 2003 and the financial highlights for the periods presented prior to October 31, 2004, were audited by another independent registered public accounting firm, whose report dated, December 22, 2003, expressed an unqualified opinion thereon.
We conducted our audit in accordance with the standards of the Public Company Accounting Oversight Board (United States). Those standards require that we plan and perform the audit to obtain reasonable assurance about whether the financial statements and financial highlights are free of material misstatement. An audit includes examining, on a test basis, evidence supporting the amounts and disclosures in the financial statements. Our procedures included confirmation of securities owned as of October 31, 2004, by correspondence with the custodian. An audit also includes assessing the accounting principles used and significant estimates made by management, as well as evaluating the overall financial statement presentation. We believe that our audit provides a reasonable basis for our opinion.
In our opinion, the financial statements and financial highlights referred to above present fairly, in all material respects, the financial position of the Fund as of October 31, 2004, and the results of its operations, the changes in its net assets, and the financial highlights for the year then ended, in conformity with U.S. generally accepted accounting principles.

New York, New York
December 22, 2004
| | |
| 42 | | Visit our website at www.jennisondryden.com |
U.S. Federal Tax Information
Dividends and Distributions
As required by the U.S. Internal Revenue Code, we wish to advise you as to the federal tax status of dividends and distributions paid by the Fund during its fiscal year ended October 31, 2004.
The Fund has elected to give the benefit of foreign tax credits to its shareholders. Accordingly, shareholders who must report their gross income dividends and distributions in a federal tax return will be entitled to a foreign tax credit, or an itemized deduction, in computing their U.S. income tax liability. It is generally more advantageous to claim a credit rather than to take a deduction. For the fiscal year ended October 31, 2004, the Fund intends on passing through $0.02 per share of ordinary income distributions as a foreign tax credit based on foreign source income of $0.14 per share.
During the fiscal year, the Fund paid no dividends from ordinary income.
For purposes of preparing your federal income tax return, however, you should report the amounts as reflected on the appropriate Form 1099-DIV or substitute Form 1099-DIV which you should receive in January 2005.
| | |
| Prudential World Funds, Inc./Dryden International Equity Fund | | 43 |
Management of the Fund
(Unaudited)
Information pertaining to the Board of Directors is set forth below. Directors who are not deemed to be “interested persons” of the Fund, as defined in the 1940 Act are referred to as “Independent Directors.” Directors who are deemed to be “interested persons” of the Fund are referred to as “Interested Directors.” “Fund Complex”† consists of the Fund and any other investment companies managed by Prudential Investments LLC (“PI” or the Manager).
Independent Directors(2)
David E.A. Carson (70), Director since 2003(3) Oversees 97 portfolios in Fund complex
Principal occupations (last 5 years): Director (January 2000 to May 2000), Chairman (January 1999 to December 1999), Chairman and Chief Executive Officer (January 1998 to December 1998) and President, Chairman and Chief Executive Officer of People’s Bank (1983-1997).
Other Directorships held:(4) Director of United Illuminating and UIL Holdings (utility company), since 1993.
Robert E. La Blanc (70), Director since 1984(3) Oversees 100 portfolios in Fund complex
Principal occupations (last 5 years): President (since 1981) of Robert E. La Blanc Associates, Inc. (telecommunications); formerly General Partner at Salomon Brothers and Vice-Chairman of Continental Telecom; Trustee of Manhattan College.
Other Directorships held:(4) Director of Chartered Semiconductor Manufacturing, Ltd. (since 1998); Titan Corporation (electronics) (since 1995), Computer Associates International, Inc. (software company); (since 2002) FiberNet Telecom Group, Inc. (telecom company) (since 2003); Director (since April 1999) of the High Yield Plus Fund, Inc.
Douglas H. McCorkindale (65), Director since 2003(3) Oversees 93 portfolios in Fund complex
Principal occupations (last 5 years): Chairman (since February 2001), Chief Executive Officer (since June 2000) and President (since September 1997) of Gannett Co. Inc. (publishing and media); formerly Vice Chairman (March 1984-May 2000) of Gannett Co., Inc.
Other Directorships held:(4) Director of Gannett Co. Inc., Director of Continental Airlines, Inc. (since May 1993); Director of Lockheed Martin Corp. (aerospace and defense) (since May 2001); Director of The High Yield Plus Fund, Inc. (since 1996).
Richard A. Redeker (61), Director since 2003(3) Oversees 94 portfolios in Fund complex
Principal occupations (last 5 years): Management Consultant; Director of Invesmart, Inc. (since 2001) and Director of Penn Tank Lines, Inc. (since 1999).
Other Directorships held:(4) None.
Robin B. Smith (65), Director since 1996(3) Oversees 99 portfolios in Fund complex
Principal occupations (last 5 years): Chairman of the Board (since January 2003) of Publishers Clearing House (direct marketing), formerly Chairman and Chief Executive Officer (August 1996-January 2003) of Publishers Clearing House.
Other Directorships held:(4) Director of BellSouth Corporation (since 1992).
| | |
| 44 | | Visit our website at www.jennisondryden.com |
Stephen Stoneburn (61), Director since 1996(3) Oversees 97 portfolios in Fund complex
Principal occupations (last 5 years): President and Chief Executive Officer (since June 1996) of Quadrant Media Corp. (a publishing company); formerly President (June 1995-June 1996) of Argus Integrated Media, Inc.; Senior Vice President and Managing Director (January 1993-1995) of Cowles Business Media and Senior Vice President of Fairchild Publications, Inc. (1975-1989).
Other Directorships held:(4) None
Clay T. Whitehead (66), Director since 1984(3) Oversees 98 portfolios in Fund complex
Principal occupations (last 5 years): President (since 1983) of National Exchange Inc. (new business development firm).
Other Directorships held:(4) Director (since 2000) of the High Yield Plus Fund, Inc.
Interested Directors(1)
Judy A. Rice (56), President since 2003 and Director since 2000(3) Oversees 101 portfolios in Fund complex
Principal occupations (last 5 years): President, Chief Executive Officer, Chief Operating Officer and Officer-in-Charge (since 2003) of PI; Director, Officer-in-Charge, President, Chief Executive Officer and Chief Operating Officer (since May 2003) of American Skandia Advisory Services, Inc. and American Skandia Investment Services, Inc.; Director, Officer-in-Charge, President, Chief Executive Officer (since May 2003) of American Skandia Fund Services, Inc.; Vice President (since February 1999) of Prudential Investment Management Services LLC; President, Chief Executive Officer and Officer-in-Charge (since April 2003) of Prudential Mutual Fund Services LLC; formerly various positions to Senior Vice President (1992-1999) of Prudential Securities Incorporated (Prudential Securities); and various positions to Managing Director (1975-1992) of Salomon Smith Barney; Member of Board of Governors of the Money Management Institute.
Other Directorships held:(4) None
Robert F. Gunia (58), Vice President and Director since 1996(3) Oversees 175 portfolios in Fund complex
Principal occupations (last 5 years): Chief Administrative Officer (since June 1999) of PI; Executive Vice President and Treasurer (since January 1996) of PI; President (since April 1999) of Prudential Investment Management Services LLC (PIMS); Corporate Vice President (since September 1997) of The Prudential Insurance Company of America (Prudential); Director, Executive Vice President and Chief Administrative Officer (since May 2003) of American Skandia Investment Services, Inc., American Skandia Advisory Services, Inc. and American Skandia Fund Services, Inc.; Executive Vice President (since March 1999) and Treasurer (since May 2000) of Prudential Mutual Fund Services LLC; formerly Senior Vice President (March 1987-May 1999) of Prudential Securities.
Other Directorships held:(4) Vice President and Director (since May 1989) and Treasurer (since 1999) of The Asia Pacific Fund, Inc.
Information pertaining to the Officers of the Fund is set forth below.
Officers(2)
Jonathan D. Shain (46), Secretary since 2001(3)
Principal occupations (last 5 years): Vice President and Corporate Counsel (since August 1998) of Prudential; Vice President and Assistant Secretary (since May 2003) of American Skandia Investment Services, Inc. and American Skandia Fund Services, Inc.
| | |
| Prudential World Funds, Inc./Dryden International Equity Fund | | 45 |
Grace C. Torres (45), Treasurer and Principal Financial and Accounting Officer since 1995(3)
Principal occupations (last 5 years): Senior Vice President (since January 2000) of PI, Senior Vice President and Assistant Treasurer (since May 2003) of American Skandia Investment Services, Inc. and American Skandia Advisory Services, Inc.; formerly First Vice President (December 1996-January 2000) of PI and First Vice President (March 1993-1999) of Prudential Securities.
Lee D. Augsburger (45), Chief Compliance Officer since 2004
Vice President and Chief Compliance Officer (since May 2003) of PI; Vice President and Chief Compliance Officer (since October 2000) of Prudential Investment Management Inc.; formerly Vice President and Chief Legal Officer-Annuities (August 1999-October 2000) of Prudential Insurance Company of America; Vice President and Corporate Counsel (November 1997-August 1999) of Prudential Insurance Company of America.
William V. Healey (51), Chief Legal Officer since 2004
Vice President and Associate General Counsel (since 1998) of Prudential; Executive Vice President and Chief Legal Officer (since February 1999) of Prudential Investments LLC; Senior Vice President, Chief Legal Officer and Secretary (since December 1998) of Prudential Investment Management Services LLC; Executive Vice President and Chief Legal Officer (since February 1999) of Prudential Mutual Fund Services LLC; Vice President and Secretary (since October 1998) of Prudential Investment Management, Inc.; Executive Vice President and Chief Legal Officer (since May 2003) of American Skandia Investment Services, Inc.; American Skandia Fund Services, Inc. and American Skandia Advisory Services, Inc.; Director (June 1999-June 2002 and June 2003-present) of ICI Mutual Insurance Company; prior to August 1998, Associate General Counsel of the Dreyfus Corporation (Dreyfus), a subsidiary of Mellon Bank, N.A. (Mellon Bank), and an officer and/or director of various affiliates of Mellon Bank and Dreyfus.
Maryanne Ryan (40), Anti-Money Laundering Compliance Officer since 2002(3)
Principal occupations (last 5 years): Vice President, Prudential (since November 1998), First Vice President, Prudential Securities (March 1997-May 1998); Anti-Money Laundering Compliance Officer (since 2003) of American Skandia Investment Services, Inc., American Skandia Advisory Services, Inc. and American Skandia Marketing, Inc.
| † | The Fund Complex consists of all investment companies managed by PI. The Funds for which PI serves as manager include JennisonDryden Mutual Funds, Strategic Partners Funds, The Prudential Variable Contract Accounts 2, 10, 11, The Target Portfolio Trust, The Prudential Series Fund, Inc., American Skandia Trust, and Prudential’s Gibraltar Fund. |
| (1) | “Interested” Director, as defined in the Investment Company Act of 1940 (the 1940 Act), by reason of employment with the Manager, (Prudential Investments LLC or PI), the Subadvisers (Prudential Investment Management, Inc. or PIM), (Bank of Ireland Asset Management (U.S.) Limited or BIAM) or (Jennison Associations LLC or Jennison) or the Distributor (Prudential Investment Management Services LLC or PIMS). |
| (2) | Unless otherwise noted, the address of the Directors and Officers is c/o: Prudential Investments LLC, Gateway Center Three, 100 Mulberry Street, Newark, NJ 07102. |
| (3) | There is no set term of office for Trustees and Officers. The Independent Directors have adopted a retirement policy, which calls for the retirement of Directors on December 31 of the year in which they reach the age of 75. The table shows the individuals length of service as Trustee and/or Officer. |
| (4) | This column includes only directorships of companies requested to register, or file reports with the SEC under the Securities and Exchange Act of 1934 (that is, “public companies”) or other investment companies registered under the 1940 Act. |
Additional information about the Fund’s Trustees is included in the Fund’s Statement of Additional Information which is available without charge, upon request, by calling (800) 521-7466 or (732) 482-7555 (Calling from outside the U.S.)
| | |
| 46 | | Visit our website at www.jennisondryden.com |
Additional Information
(Unaudited)
The Fund files a complete portfolio of holdings on the Fund’s first and third quarter-end on Form N-Q with the Securities and Exchange Commission (the “Commission”). Form N-Q will be available on the Commission’s website at http://www.sec.gov or by visiting the Commission’s Public Reference Room. For information on the Commission’s Public Reference Room visit the Commission’s website.
| | |
| Prudential World Funds, Inc./Dryden International Equity Fund | | 47 |
Growth of a $10,000 Investment

| | | | | | | | | |
| Average Annual Total Returns (With Sales Charges) as of 10/31/04 | |
| | | One Year | | | Three Years | | | Since Inception | |
Class A | | 12.27 | % | | 7.53 | % | | –12.24 | % |
Class B | | 12.83 | | | 7.86 | | | –12.03 | |
Class C | | 16.83 | | | 8.71 | | | –11.84 | |
Class Z | | 18.85 | | | 9.73 | | | –11.01 | |
| | | | | | | | | | |
| Average Annual Total Returns (Without Sales Charges) as of 10/31/04 | |
| | | One Year | | | Three Years | | | Since Inception | |
Class A | | 18.80 | % | | 9.58 | % | | –11.17 | % |
Class B | | 17.83 | | | 8.71 | | | –11.84 | |
Class C | | 17.83 | | | 8.71 | | | –11.84 | |
Class Z | | 18.85 | | | 9.73 | | | –11.01 | |
Performance data quoted represent past performance. Past performance does not guarantee future results. The investment return and principal value of an investment will fluctuate so that an investor’s shares, when redeemed, may be worth more or less than their original cost. Current performance may be lower or higher than the past performance data quoted. The returns in the graph and the tables do not reflect the deduction of taxes that a shareholder would pay on Fund distributions or following the redemption of Fund shares. An investor may obtain performance data current to the most recent month-end by visiting our website at www.jennisondryden.com or by calling (800) 225-1852. The maximum initial sales charge is 5.50%.
Source: Prudential Investments LLC and Lipper Inc. Inception date: 3/1/2000.
| | |
| | | Visit our website at www.jennisondryden.com |
The graph compares a $10,000 investment in the Dryden International Equity Fund (Class A shares) with a similar investment in the MSCI EAFE® Index by portraying the initial account values at the commencement of operations of Class A shares (March 1, 2000) and the account values at the end of the current fiscal year (October 31, 2004) as measured on a quarterly basis. For purposes of the graph, and unless otherwise indicated, it has been assumed that (a) the maximum applicable front-end sales charge was deducted from the initial $10,000 investment in Class A shares; (b) all recurring fees (including management fees) were deducted; and (c) all dividends and distributions were reinvested. The line graph provides information for Class A shares only. As indicated in the tables provided earlier, performance for Class B, Class C, and Class Z shares will vary due to the differing charges and expenses applicable to each share class (as indicated in the following paragraphs). Without a distribution and service (12b-1) fee waiver of 0.05% for Class A shares through October 31, 2004, the returns shown in the graph and for Class A shares in the tables would have been lower.
The MSCI EAFE® Index is an unmanaged, weighted index of performance that reflects stock price movements of developed-country markets in Europe, Australasia, and the Far East. MSCI EAFE® Index’s total returns include the reinvestment of all dividends, but do not include the effects of sales charges, operating expenses of a mutual fund, or taxes. These returns would be lower if they included the effects of sales charges, operating expenses, or taxes. The securities that comprise the MSCI EAFE® Index may differ substantially from the securities in the Fund. The MSCI EAFE® Index is not the only index that may be used to characterize performance of global/international stock funds. Other indexes may portray different comparative performance. Investors cannot invest directly in an index.
Through March 14, 2004, the Fund charged a maximum front-end sales charge of 5.00% for Class A shares and a 12b-1 fee of up to 0.30% annually. Effective March 15, 2004, Class A shares are subject to a maximum front-end sales charge of 5.50%, a 12b-1 fee of up to 0.30% annually, and all investors who purchase Class A shares in an amount of $1 million or more and sell these shares within 12 months of purchase are subject to a contingent deferred sales charge (CDSC) of 1%. Class B shares are subject to a declining CDSC of 5%, 4%, 3%, 2%, 1%, and 1% respectively for the first six years after purchase and a 12b-1 fee of 1% annually. Approximately seven years after purchase, Class B shares will automatically convert to Class A shares on a quarterly basis. Until February 2, 2004, Class C shares were subject to a front-end sales charge of 1%, a CDSC of 1% for shares redeemed within 18 months of purchase, and a 12b-1 fee of 1% annually. Class C shares purchased on or after February 2, 2004, are not subject to a front-end sales charge, but charge a CDSC of 1% for Class C shares sold within 12 months from the date of purchase, and an annual 12b-1 fee of 1%. Class Z shares are not subject to a sales charge or 12b-1 fees. The returns in the graph and tables reflect the share class expense structure in effect at the close of the fiscal period.
| | |
| Dryden International Equity Fund | | |
| | | | |
| n MAIL | | n TELEPHONE | | n WEBSITE |
Gateway Center Three 100 Mulberry Street Newark, NJ 07102 | | (800) 225-1852 | | www.jennisondryden.com |
|
| PROXY VOTING |
| The Board of Directors of the Fund has delegated to the Fund’s investment adviser the responsibility for voting any proxies and maintaining proxy recordkeeping with respect to the Fund. A description of these proxy voting policies and procedures is available without charge, upon request, by calling (800) 225-1852 or by visiting the Securities and Exchange Commission’s (the Commission) website at http://www.sec.gov. Information regarding how the Fund voted proxies relating to portfolio securities during the most recent 12-month period ended June 30, 2004, is available on the Fund’s website at http://www.prudential.com and on the Commission’s website at http://www.sec.gov. |
|
| DIRECTORS |
David E.A. Carson • Robert F. Gunia • Robert E. La Blanc • Douglas H. McCorkindale • Richard A. Redeker • Judy A. Rice • Robin B. Smith • Stephen D. Stoneburn • Clay T. Whitehead |
|
| OFFICERS |
Judy A. Rice, President • Robert F. Gunia, Vice President • Grace C. Torres, Treasurer and Principal Financial and Accounting Officer • William V. Healey, Chief Legal Officer •
Jonathan D. Shain, Secretary • Maryanne Ryan, Anti-Money Laundering Compliance Officer • Lee D. Augsburger, Chief Compliance Officer |
| | | | |
| MANAGER | | Prudential Investments LLC | | Gateway Center Three
100 Mulberry Street
Newark, NJ 07102 |
|
| INVESTMENT ADVISER | | Prudential Investment
Management, Inc. | | Gateway Center Two
100 Mulberry Street
Newark, NJ 07102 |
|
| DISTRIBUTOR | | Prudential Investment
Management Services LLC | | Gateway Center Three
100 Mulberry Street
Newark, NJ 07102 |
|
| CUSTODIAN | | State Street Bank
and Trust Company | | One Heritage Drive
North Quincy, MA 02171 |
|
| TRANSFER AGENT | | Prudential Mutual Fund
Services LLC | | PO Box 8098
Philadelphia, PA 19176 |
|
| INDEPENDENT REGISTERED PUBLIC ACCOUNTING FIRM | | KPMG LLP | | 757 Third Avenue
New York, NY 10017 |
|
| FUND COUNSEL | | Sullivan & Cromwell LLP | | 125 Broad Street
New York, NY 10004 |
| | | | | | | | | | | | |
| Dryden International Equity Fund | | | | |
| Share Class | | | | A | | B | | C | | Z | | |
NASDAQ | | | | PJRAX | | PJRBX | | PJRCX | | PJIZX | | |
CUSIP | | | | 743969859 | | 743969867 | | 743969875 | | 743969883 | | |
| | | | | | | | | | | | | |
|
An investor should consider the investment objectives, risks, and charges and expenses of the
Fund carefully before investing. The prospectus for the Fund contains this and other information about the Fund. An investor may obtain a prospectus by visiting our website at www.jennisondryden.com or
by calling (800) 225-1852. The prospectus should be read carefully before investing. |
|
| Prudential Fixed Income is a business unit of Prudential Investment Management, Inc. (PIM). Quantitative Management Associates LLC, Jennison Associates LLC, and PIM are registered investment advisers and Prudential Financial companies. |
|
| E-DELIVERY |
To receive your mutual fund documents on-line, go to www.icsdelivery.com/prudential/funds
and enroll. Instead of receiving printed documents by mail, you will receive notification via
e-mail when new materials are available. You can cancel your enrollment or change your
e-mail address at any time by clicking on the change/cancel enrollment option at the icsdelivery website address. |
|
| SHAREHOLDER COMMUNICATIONS WITH DIRECTORS |
| Shareholders of the Fund can communicate directly with the Board of Directors by writing to the Chair of the Board, Dryden International Equity Fund, PO Box 13964, Philadelphia, PA 19176. Shareholders can communicate directly with an individual Director by writing to that Director at Dryden International Equity Fund, PO Box 13964, Philadelphia, PA 19176. Such communications to the Board or individual Directors are not screened before being delivered to the addressee. |
|
| AVAILABILITY OF QUARTERLY PORTFOLIO SCHEDULE |
| The Fund files its complete schedule of portfolio holdings with the Securities and Exchange Commission (the “Commission”) for the first and third quarters of each fiscal year on Form N-Q. The Fund’s Forms N-Q are available on the Commission’s website at http://www.sec.gov. The Fund’s Forms N-Q may also be reviewed and copied at the Commission’s Public Reference Room in Washington, D.C. Information on the operation of the Public Reference Room may be obtained by calling 1-800-SEC-0330. The Fund will provide a full list of its portfolio holdings as of the end of each fiscal quarter on its website at www.jennisondryden.com within 60 days after the end of the fiscal quarter. |
Mutual Funds:
| | | | |
| ARE NOT INSURED BY THE FDIC OR ANY FEDERAL GOVERNMENT AGENCY | | MAY LOSE VALUE | | ARE NOT A DEPOSIT OF OR GUARANTEED BY ANY BANK OR ANY BANK AFFILIATE |
| | | | | | | | | | | | |
| Dryden International Equity Fund | | | | | | |
| | | Share Class | | A | | B | | C | | Z | | |
| | | NASDAQ | | PJRAX | | PJRBX | | PJRCX | | PJIZX | | |
| | | CUSIP | | 743969859 | | 743969867 | | 743969875 | | 743969883 | | |
| | | | | | | | | | | | | |
MF190E IFS-AO98921 Ed. 12/2004
ANNUAL REPORT
OCTOBER 31, 2004

STRATEGIC PARTNERS
INTERNATIONAL VALUE FUND
FUND TYPE
International stock
OBJECTIVE
Long-term growth of capital

This report is not authorized for distribution to prospective investors unless preceded or accompanied by a current prospectus.
The views expressed in this report and information about the Fund’s portfolio holdings are for the period covered by this report and are subject to change thereafter.
Dear Shareholder,
December 15, 2004
We hope that you find the annual report for the Strategic Partners International Value Fund informative and useful. As a Strategic Partners mutual fund shareholder, you may be thinking where you can find additional growth opportunities. You could invest in last year’s top-performing asset class and hope that history repeats itself or you could stay in cash while waiting for the “right moment” to invest.
We believe it is wise to take advantage of developing domestic and global investment opportunities through a diversified portfolio of stock and bond mutual funds. A diversified asset allocation offers two advantages. It helps you manage downside risk by not being overly exposed to any particular asset class, plus it gives you a better opportunity to have at least some of your assets in the right place at the right time. Your financial professional can help you create a diversified investment plan that may include mutual funds that cover all the basic asset classes and reflects your personal investment profile and tolerance for risk.
Strategic Partners mutual funds give you a wide range of choices that can help you make progress toward your financial goals. Our funds feature leading asset managers not just from a single company but from the entire investment industry.
Thank you for choosing Strategic Partners mutual funds.
Sincerely,

Judy A. Rice, President
Strategic Partners International Value Fund
| | |
| Prudential World Funds, Inc./Strategic Partners International Value Fund | | 1 |
Your Fund’s Performance
Fund objective
The investment objective of the Strategic Partners International Value Fund (the Fund) is long-term growth of capital. There can be no assurance that the Fund will achieve its investment objective.
Performance data quoted represent past performance. Past performance does not guarantee future results. The investment return and principal value of an investment will fluctuate so that an investor’s shares, when redeemed, may be worth more or less than their original cost. Current performance may be lower or higher than the past performance data quoted. An investor may obtain performance data current to the most recent month-end by visiting our website at www.strategicpartners.com or by calling (800) 225-1852. The maximum initial sales charge is 5.50% (Class A shares).
| | | | | | | | | | | |
| Cumulative Total Returns1 as of 10/31/04 | |
| | | One Year | | | Five Years | | | Ten Years | | Since Inception2 | |
Class A | | 14.77 | % | | –5.22 | % | | N/A | | 37.37 | % |
Class B | | 13.98 | | | –8.71 | | | N/A | | 29.19 | |
Class C | | 13.90 | | | –8.67 | | | N/A | | 29.25 | |
Class Z | | 15.09 | | | –4.04 | | | 58.46% | | 145.56 | |
MSCI EAFE® Index3 | | 18.84 | | | –4.49 | | | 48.37 | | *** | |
Lipper International Large-Cap Core Funds Avg.4 | | 14.63 | | | –10.93 | | | 52.27 | | **** | |
| | | | | | | | | | | | |
| Average Annual Total Returns1 as of 9/30/04 | | | | | | | | | |
| | | One Year | | | Five Years | | | Ten Years | | Since Inception2 | |
Class A | | 9.96 | % | | –2.56 | % | | N/A | | 2.89 | % |
Class B | | 10.57 | | | –2.36 | | | N/A | | 2.83 | |
Class C | | 14.48 | | | –2.18 | | | N/A | | 2.84 | |
Class Z | | 16.68 | | | –1.21 | | | 4.66% | | 7.54 | |
MSCI EAFE® Index3 | | 22.08 | | | –0.85 | | | 4.02 | | *** | |
Lipper International Large-Cap Core Funds Avg.4 | | 17.26 | | | –2.28 | | | 4.26 | | **** | |
The cumulative total returns do not reflect the deduction of applicable sales charges. If reflected, the applicable sales charges would reduce the cumulative total returns performance quoted. Class A shares are subject to a maximum front-end sales charge of 5.50%. Under certain circumstances, Class A shares may be subject to a contingent deferred sales charge (CDSC) of 1%. Class B and Class C shares are subject to a maximum CDSC of 5% and 1% respectively. Class Z shares are not subject to a sales charge.
1Source: Prudential Investments LLC and Lipper Inc. The average annual total returns take into account applicable sales charges. During certain periods shown, fee waivers and/or expense reimbursements were in effect. Without such fee waivers and expense reimbursements, the returns for the classes would have been lower.
| | |
| 2 | | Visit our website at www.strategicpartners.com |
Class A, Class B, and Class C shares are subject to an annual distribution and service (12b-1) fee of up to 0.30%, 1.00%, and 1.00% respectively. Approximately seven years after purchase, Class B shares will automatically convert to Class A shares on a quarterly basis. Class Z shares are not subject to a 12b-1 fee. The returns in the tables do not reflect the deduction of taxes that a shareholder would pay on Fund distributions or following the redemption of Fund shares.
2Inception dates: Class A, Class B, and Class C, 9/23/96; Class Z, 11/5/92.
3The Morgan Stanley Capital International Europe, Australasia, and Far East Index (MSCI EAFE® Index) is an unmanaged, weighted index of performance that reflects stock price movements of developed-country markets in Europe, Australasia, and the Far East.
4The Lipper International Large-Cap Core Funds Average (Lipper Average) represents returns based on an average return of all funds in the Lipper International Large-Cap Core Funds category. Funds in the Lipper Average invest at least 75% of their equity assets in companies strictly outside of the United States with market capitalizations (on a three-year weighted basis) greater than the 250th largest company in the S&P/Citigroup World ex-U.S. Broad Market Index. Large-cap core funds typically have an average price-to-cash flow ratio, price-to-book ratio, and three-year sales-per-share growth value compared with the S&P/Citigroup World ex-U.S. BMI.
Investors cannot invest directly in an index. The returns for the MSCI EAFE® Index and the Lipper Average would be lower if they included the effects of sales charges, operating expenses, or taxes. Returns for the Lipper Average reflect the deduction of operating expenses of a mutual fund, but not sales charges or taxes.
***MSCI EAFE® Index Closest Month-End to Inception cumulative total returns as of 10/31/04 are 33.42% for Class A, Class B, and Class C, and 124.53% for Class Z. MSCI EAFE® Index Closest Month-End to Inception average annual total returns as of 9/30/04 are 3.24% for Class A, Class B, and Class C, and 6.72% for Class Z.
****Lipper Average Closest Month-End to Inception cumulative total returns as of 10/31/04 are 34.06% for Class A, Class B, and Class C, and 139.65% for Class Z. Lipper Average Closest Month-End to Inception average annual total returns as of 9/30/04 are 3.33% for Class A, Class B, and Class C, and 7.02% for Class Z.
| | | |
| Five Largest Holdings expressed as a percentage of net assets as of 10/31/04 | | | |
Total SA, Oil & Gas | | 3.6 | % |
UBS AG, Commercial Banks | | 2.9 | |
Nestlé SA, Food Products | | 2.8 | |
Canon, Inc., Electronics Equipment | | 2.8 | |
ING Groep, Commercial Banks | | 2.7 | |
Holdings are subject to change.
| | | |
| Five Largest Industries expressed as a percentage of net assets as of 10/31/04 | | | |
Commercial Banks | | 19.0 | % |
Pharmaceuticals | | 10.4 | |
Insurance | | 7.8 | |
Diversified Telecommunication Services | | 7.5 | |
Food Products | | 7.3 | |
| Industry | weightings are subject to change. |
| | |
| Prudential World Funds, Inc./Strategic Partners International Value Fund | | 3 |
Investment Adviser’s Report
Bank of Ireland Asset Management (U.S.) Limited
It was generally a good year
Despite some notable headwinds, foreign equity markets generally produced positive returns for the Fund’s fiscal year, and the broad thrust of economic data was upbeat in most major economies. The Fund’s return was in line with that of its peers, as measured by the Lipper International Large-Cap Core Funds Average, but it trailed the unmanaged MSCI EAFE® Index.
High oil prices helped the Fund
The dominant influence on market sentiment in the second half of calendar year 2004 was the sharp rise in the price of oil to levels above $50 a barrel. Equity markets became volatile because investors were concerned about the potential of higher energy costs to curb economic growth. The volatility was exacerbated by supply concerns as a consequence of Middle East conflict and instability in countries such as Nigeria and Venezuela. Stormy weather conditions in the Gulf of Mexico during September also contributed to the increase in the price of oil late in the reporting period. This had a positive impact on the Fund’s oil stocks, including Total (see Comments on Largest Holdings) and Eni. These companies have successfully cut costs as well as grown their businesses for the past few years.
Economic growth helped financials, but higher oil prices threatened Japan
For most of the year the global economy gathered momentum. The strength of demand in the United States and China helped fuel export-oriented recoveries in other economies. European corporate earnings picked up significantly as the global economic revival increased overall demand. This enhanced the attractiveness of equities despite the relatively slow economic growth in some European countries. The Fund’s positions in European financial stocks performed well, particularly ING and UBS (see Comments on Largest Holdings for both).
During the Fund’s reporting period, the Japanese economy improved from a dependence on export-led growth to greater strength sustained by both overseas and domestic demand. Japanese financial stocks initially surged as previously downtrodden bank stocks benefited from renewed economic optimism. However, gains in the sector were transformed into losses later in the reporting period as investors became concerned about the potential impact of higher oil prices on the broader Japanese economy. Exporters came under some pressure, particularly as China professed its intention to slow the pace of economic growth to contain inflationary pressures.
We did well on pharmaceuticals
The Fund’s pharmaceutical holdings performed relatively well, particularly a position in Sanofi-Synthelabo. The stock rose as Sanofi’s $63 billion purchase of Aventis was
| | |
| 4 | | Visit our website at www.strategicpartners.com |
completed in 2004. Before the merger, Sanofi reported a more than 20% gain in first-half profit, driven by demand for its blood-thinning drug Plavix and its cancer treatment Eloxatin. The world’s third largest drugmaker expects new products to propel earnings as it reduces its dependence on older products.
Our telecommunications holdings were mixed
The telecommunications sector had mixed results with wireless stocks performing poorly while the service providers fared better. Shares of Nokia—the world’s largest mobile handset company—declined as the Finnish company yielded mobile-handset market share to its competitors. An industry research group said the company’s market share had fallen to its lowest level in five years because consumers preferred new “clamshell” telephones that were more widely available from rivals. Our position in the world’s largest wireless service provider Vodafone, on the other hand, got a boost from results at Verizon Wireless, of which it owns 45%. Verizon Wireless reported 1.7 million net additional users versus expectations of only 1.5 million. Its revenues rose 23% and average revenues per user (a widely watched performance measure) rose 3.1%. Verizon Wireless’s earnings were 5% to 10% ahead of expectations, which could lead to upgrades in estimates of Vodafone earnings.
Looking ahead
We believe that the price of benchmark West Texas Intermediate crude oil is likely to settle somewhere in the mid $30s to low $40s over the next 6 to 12 months. That is broadly consistent with the view that underlies current one- to two-year earnings estimates for oil companies. As we write, the price of oil is about 10% below its peak, illustrating how quickly it can move as demand and supply shift.
Forecasts for the timing and scale of interest-rate increases have been revised somewhat as more modest growth is forecast for 2005. With the repo rate at 4.75%, the Bank of England is unlikely to tighten monetary policy much further. We anticipate that the Federal Reserve and the European Central Bank are likely to move only cautiously.
We remain upbeat on the outlook for Japan despite the recent slowdown in the growth of its gross domestic product. The current recovery differs significantly from the ones that were seen during the 1990s. Those “recoveries” were based on exports and government fiscal expansion. This time around, the recovery is more broad-based, with stronger domestic demand a notable factor. Fiscal policy is also considerably tighter than in the past.
The Portfolio of Investments following this report shows the size of the Fund’s positions at period-end.
| | |
| Prudential World Funds, Inc./Strategic Partners International Value Fund | | 5 |
Comments on Largest Holdings
Holdings expressed as a percentage of the Fund’s net assets as of 10/31/04.
| 3.6% | Total SA (France)/Oil & Gas |
Total is a leading global oil company. The strength in oil prices this year benefited oil stocks. In addition, Total continues to build on its long-term track record of above-industry-average production growth and return to shareholders. It has continued excellent capital discipline and an emphasis on improving shareholder value with share buybacks and higher dividends. The stock has continued to perform well.
| 2.9% | UBS AG (Switzerland)/Commercial Banks |
UBS is one of the largest global asset managers and one of the leading providers of private banking services. It has had good growth in assets even through the difficult years of the bear market in stocks. It has also continued to pay back the lion’s share of its earnings to shareholders, and thus continues to reward our faith in its management and strategy.
| 2.8% | Nestlé SA (Switzerland)/Food Products |
Nestlé is the world’s largest food company, with leading brand franchises in beverages, milk products, prepared dishes, water, chocolate, pet food, and pharmaceuticals. Its earnings this year reflected several difficulties, including poor ice cream and water sales this summer and higher costs for food and oil. This has meant that margins have come under pressure. Nonetheless, it has had a record of growth consistently above its industry average and has made continued progress in developing markets. We believe its shares are inexpensively priced.
| 2.8% | Canon, Inc. (Japan)/Electronics Equipment |
Canon makes copiers and laser printers as well as fax machines, cameras, and other optical equipment. It suffered somewhat from the Japanese yen’s appreciation against the U.S. dollar because of its emphasis on exports. However, it continues to innovate both in terms of products and manufacturing processes (witness recent announcements of restructuring in their consumables division). It is a world leader in a number of areas such as digital still cameras and color copiers. Canon’s very strong record of shareholder focus is reflected in its stock’s long-term returns.
| 2.7% | ING Groep (Netherlands)/Commercial Banks |
ING is one of the world’s largest financial services companies. It continues to benefit from the global economic and stock market recovery. In addition, ING’s stock has rallied this year as investors rewarded its strategy of selling businesses in Asia, Australia, and Europe to focus on opportunities in insurance, phone, and Internet banking. Results were ahead of consensus, with most divisions exhibiting strong growth, and the company gave strong guidance for the remainder of the year. Given the relatively low valuation of its stock compared to its peer group, ING remains one of our favored European financials.
Holdings are subject to change.
| | |
| 6 | | Visit our website at www.strategicpartners.com |
Fees and Expenses (Unaudited)
As a shareholder of the Fund, you incur two types of costs: (1) transaction costs, including sales charges (loads) on purchase payments and redemptions, as applicable, and (2) ongoing costs, including management fees, distribution and/or service (12b-1) fees, and other Fund expenses, as applicable. This example is intended to help you understand your ongoing costs (in dollars) of investing in the Fund and to compare these costs with the ongoing costs of investing in other mutual funds.
The example is based on an investment of $1,000 invested on May 1, 2004, at the beginning of the period, and held through the six-month period ended October 31, 2004.
Actual Expenses
The first line for each share class in the following table provides information about actual account values and actual expenses. You may use the information in this line, together with the amount you invested, to estimate the expenses that you paid over the period. Simply divide your account value by $1,000 (for example, an $8,600 account value ÷ $1,000 = 8.6), then multiply the result by the number in the first line under the heading “Expenses Paid During the Six-Month Period” to estimate the expenses you paid on your account during this period. The Fund may charge additional fees to holders of certain accounts that are not included in the expenses shown in the table. These fees apply to Individual Retirement Accounts (IRAs), 403(b) accounts, and Section 529 plan accounts. As of the close of the six months covered by the table, IRA fees included a setup fee of $5, a maintenance fee of up to $36 annually ($18 for the six-month period), and a termination fee of $10. 403(b) accounts and Section 529 plan accounts are each charged an annual $25 fiduciary maintenance fee ($12.50 for the six-month period). Some of the fees vary in amount, or are waived, based on your total account balance or the number of JennisonDryden or Strategic Partners funds, including the Fund, that you own. You should consider the additional fees that were charged to your Fund account over the six-month period when you estimate the total ongoing expenses paid over the period and the impact of these fees on your ending account value, as these additional expenses are not reflected in the information provided in the expense table. Additional fees have the effect of reducing investment returns.
Hypothetical Example for Comparison Purposes
The second line for each share class in the following table provides information about hypothetical account values and hypothetical expenses based on the Fund’s actual expense ratio and an assumed rate of return of 5% per year before expenses, which is not the Fund’s actual return. The hypothetical account values and expenses may not be used to estimate the actual ending account balance or expenses you paid for the period. You may use this information to compare the ongoing costs of investing in the Fund and other funds. To do so, compare this 5% hypothetical example with the 5%
| | |
| Prudential World Funds, Inc./Strategic Partners International Value Fund | | 7 |
hypothetical examples that appear in the shareholder reports of the other funds. The Fund may charge additional fees to holders of certain accounts that are not included in the expenses shown in the table. These fees apply to Individual Retirement Accounts (IRAs), 403(b) accounts, and Section 529 plan accounts. As of the close of the six months covered by the table, IRA fees included a setup fee of $5, a maintenance fee of up to $36 annually ($18 for the six-month period), and a termination fee of $10. 403(b) accounts and Section 529 plan accounts are each charged an annual $25 fiduciary maintenance fee ($12.50 for the six-month period). Some of the fees vary in amount, or are waived, based on your total account balance or the number of JennisonDryden or Strategic Partners funds, including the Fund, that you own. You should consider the additional fees that were charged to your Fund account over the six-month period when you estimate the total ongoing expenses paid over the period and the impact of these fees on your ending account value, as such additional expenses are not reflected in the information provided in the expense table. Additional fees have the effect of reducing investment returns.
Please note that the expenses shown in the table are meant to highlight your ongoing costs only, and do not reflect any transactional costs such as sales charges (loads). Therefore the second line for each share class in the table is useful in comparing ongoing costs only, and will not help you determine the relative total costs of owning different funds. In addition, if these transactional costs were included, your costs would have been higher.
| | | | | | | | | | | | | | |
Strategic Partners
International
Value Fund | | Beginning Account Value May 1, 2004 | | Ending Account
Value October 31, 2004 | | Annualized Expense Ratio
Based on the
Six-Month Period | | | Expenses Paid
During the Six-
Month Period* |
| | | | | | | | | | | | | | | |
| Class A | | Actual | | $ | 1,000 | | $ | 1,032 | | 1.63 | % | | $ | 8.33 |
| | | Hypothetical | | $ | 1,000 | | $ | 1,017 | | 1.63 | % | | $ | 8.26 |
| | | | | | | | | | | | | | | |
| Class B | | Actual | | $ | 1,000 | | $ | 1,028 | | 2.38 | % | | $ | 12.13 |
| | | Hypothetical | | $ | 1,000 | | $ | 1,013 | | 2.38 | % | | $ | 12.04 |
| | | | | | | | | | | | | | | |
| Class C | | Actual | | $ | 1,000 | | $ | 1,028 | | 2.38 | % | | $ | 12.13 |
| | | Hypothetical | | $ | 1,000 | | $ | 1,013 | | 2.38 | % | | $ | 12.04 |
| | | | | | | | | | | | | | | |
| Class Z | | Actual | | $ | 1,000 | | $ | 1,033 | | 1.38 | % | | $ | 7.05 |
| | | Hypothetical | | $ | 1,000 | | $ | 1,018 | | 1.38 | % | | $ | 7.00 |
* Fund expenses for each share class are equal to the annualized expense ratio for each share class (provided in the table), multiplied by the average account value over the period, multiplied by the 184 days in the six-month period ended October 31, 2004, and divided by the 366 days in the year ended October 31, 2004 (to reflect the six-month period)
| | |
| 8 | | Visit our website at www.strategicpartners.com |
Portfolio of Investments
as of October 31, 2004
| | | | | |
| Shares | | Description | | Value (Note 1) |
| | | | | | |
LONG-TERM INVESTMENTS 99.1% | | | |
COMMON STOCKS | | | |
| |
Australia 0.3% | | | |
| 129,362 | | News Corp., Ltd. | | $ | 1,040,672 |
| |
Canada 0.6% | | | |
| 36,783 | | Royal Bank of Canada(a) | | | 1,911,902 |
| 18,369 | | Shoppers Drug Mart Corp.(a) | | | 557,960 |
| | | | |
|
|
| | | | | | 2,469,862 |
| |
Finland 0.5% | | | |
| 136,743 | | Nokia AB Oyj | | | 2,102,981 |
| |
France 10.6% | | | |
| 221,793 | | AXA(a) | | | 4,759,561 |
| 125,517 | | BNP Paribas SA | | | 8,518,065 |
| 158,928 | | France Telecom SA | | | 4,536,566 |
| 48,871 | | Lafarge SA | | | 4,448,001 |
| 65,201 | | Sanofi-Synthelabo SA | | | 4,752,399 |
| 68,096 | | Total SA Series B | | | 14,119,300 |
| | | | |
|
|
| | | | | | 41,133,892 |
| |
Germany 5.4% | | | |
| 78,763 | | Bayer AG | | | 2,225,229 |
| 149,015 | | Bayerische Motoren Werke (BMW) AG(a) | | | 6,283,730 |
| 51,069 | | Deutsche Bank AG | | | 3,871,103 |
| 107,546 | | E.ON AG(a) | | | 8,725,348 |
| | | | |
|
|
| | | | | | 21,105,410 |
| |
Hong Kong 3.6% | | | |
| 266,000 | | Cheung Kong Holdings, Ltd. | | | 2,204,307 |
| 243,500 | | Esprit Holdings, Ltd. | | | 1,301,436 |
| 206,100 | | Hang Seng Bank, Ltd. | | | 2,753,861 |
| 1,032,000 | | Johnson Electric Holdings, Ltd. | | | 1,027,572 |
| 934,000 | | Li & Fung, Ltd. | | | 1,385,988 |
| 314,000 | | Sun Hung Kai Properties, Ltd. | | | 2,904,643 |
| 334,500 | | Swire Pacific, Ltd. (Class A) | | | 2,374,428 |
| | | | |
|
|
| | | | | | 13,952,235 |
| |
Ireland 1.2% | | | |
| 190,269 | | CRH PLC | | | 4,525,990 |
See Notes to Financial Statements.
| | |
| Prudential World Funds, Inc./Strategic Partners International Value Fund | | 9 |
Portfolio of Investments
as of October 31, 2004 Cont’d.
| | | | | |
| Shares | | Description | | Value (Note 1) |
| | | | | | |
| | |
Italy 3.8% | | | | | |
| 383,496 | | Eni SpA(a) | | $ | 8,683,300 |
| 1,863,269 | | Telecom Italia SpA | | | 6,186,144 |
| | | | |
|
|
| | | | | | 14,869,444 |
| |
Japan 18.6% | | | |
| 223,400 | | Canon, Inc. | | | 11,002,750 |
| 52,100 | | Fanuc, Ltd. | | | 3,140,032 |
| 155,500 | | Honda Motor Co., Ltd. | | | 7,497,504 |
| 41,500 | | Hoya Corp. | | | 4,252,001 |
| 566 | | Japan Tobacco, Inc. | | | 4,962,294 |
| 231 | | Millea Holdings, Inc. | | | 3,045,485 |
| 541 | | Mitsubishi Tokyo Financial Group, Inc. | | | 4,585,177 |
| 263,000 | | Mitsui Sumitomo Insurance Co., Ltd. | | | 2,154,723 |
| 1,814 | | Nippon Telegraph and Telephone Corp. | | | 7,687,165 |
| 1,393 | | NTT DoCoMo, Inc. | | | 2,453,065 |
| 144,000 | | Ricoh Co., Ltd. | | | 2,684,999 |
| 22,300 | | Rohm Co., Ltd. | | | 2,284,810 |
| 99,000 | | Shin-Etsu Chemical Co., Ltd. | | | 3,757,133 |
| 110,000 | | Shionogi & Co., Ltd. | | | 1,704,021 |
| 757 | | Sumitomo Mitsui Financial Group, Inc. | | | 4,911,696 |
| 132,700 | | Takeda Chemical Industries, Ltd. | | | 6,398,192 |
| | | | |
|
|
| | | | | | 72,521,047 |
| |
Netherlands 8.6% | | | |
| 349,734 | | ABN AMRO Holding N.V. | | | 8,341,480 |
| 23,085 | | Heineken N.V. | | | 723,560 |
| 404,680 | | ING Groep N.V. | | | 10,681,539 |
| 276,834 | | Koninklijke (Royal) Philips Electronics N.V. | | | 6,532,318 |
| 275,123 | | Reed Elsevier PLC | | | 3,604,691 |
| 78,698 | | TPG N.V. | | | 1,896,041 |
| 65,501 | | VNU N.V. | | | 1,783,892 |
| | | | |
|
|
| | | | | | 33,563,521 |
| |
Singapore 0.8% | | | |
| 381,296 | | United Overseas Bank, Ltd. | | | 3,091,125 |
| |
South Korea 4.8% | | | |
| 49,030 | | Hyundai Motor Co. | | | 2,378,141 |
| 129,050 | | Korea Electric Power Corp. | | | 2,668,609 |
| 49,750 | | KT Corp. | | | 1,617,597 |
| 26,555 | | POSCO (ADR) | | | 3,973,169 |
| 20,469 | | Samsung Electronics Co., Ltd. (GDR) | | | 8,035,842 |
| | | | |
|
|
| | | | | | 18,673,358 |
See Notes to Financial Statements.
| | |
| 10 | | www.strategicpartners.com |
| | | | | |
| Shares | | Description | | Value (Note 1) |
| | | | | | |
| | |
Spain 3.8% | | | | | |
| 660,876 | | Banco Santander Central Hispano SA(a) | | $ | 7,355,835 |
| 446,338 | | Telefonica SA | | | 7,346,866 |
| | | | |
|
|
| | | | | | 14,702,701 |
| |
Switzerland 12.1% | | | |
| 47,131 | | Nestle SA | | | 11,111,454 |
| 209,658 | | Novartis AG | | | 9,964,186 |
| 81,090 | | Roche Holdings AG(a) | | | 8,261,198 |
| 101,300 | | Swiss Reinsurance(a) | | | 6,197,137 |
| 159,696 | | UBS AG | | | 11,470,943 |
| | | | |
|
|
| | | | | | 47,004,918 |
| |
Taiwan 0.6% | | | |
| 324,890 | | Taiwan Semiconductor Manufacturing Co., Ltd. (ADR) | | | 2,459,417 |
| |
United Kingdom 23.8% | | | |
| 899,719 | | Barclays PLC | | | 8,770,316 |
| 252,624 | | British America Tobacco PLC | | | 3,795,641 |
| 520,363 | | BT Group PLC | | | 1,771,055 |
| 404,644 | | Cadbury Schweppes PLC | | | 3,354,968 |
| 810,800 | | Centrica PLC | | | 3,576,650 |
| 346,346 | | Diageo PLC | | | 4,623,134 |
| 97,676 | | Enterprise Inns PLC | | | 1,107,835 |
| 269,700 | | GlaxoSmithKline PLC | | | 5,668,147 |
| 144,955 | | GUS PLC | | | 2,366,506 |
| 728,911 | | Kingfisher PLC | | | 4,036,803 |
| 456,158 | | Prudential PLC | | | 3,347,453 |
| 184,925 | | Reed International PLC | | | 1,648,448 |
| 285,811 | | Royal Bank Scotland Group PLC | | | 8,405,251 |
| 457,211 | | Smith & Nephew PLC (ADR) | | | 3,874,584 |
| 106,774 | | Smiths Group PLC | | | 1,458,511 |
| 1,473,448 | | Tesco PLC | | | 7,748,425 |
| 351,864 | | Tomkins PLC | | | 1,605,354 |
| 40,346 | | Travis Perkins PLC | | | 1,019,439 |
| 722,533 | | Unilever PLC | | | 6,076,690 |
| 3,916,998 | | Vodafone Group PLC | | | 10,012,079 |
| 87,847 | | Whitbread PLC | | | 1,307,012 |
| 262,578 | | Wolseley PLC | | | 4,527,356 |
| 282,609 | | WPP Group PLC | | | 2,829,912 |
| | | | |
|
|
| | | | | | 92,931,569 |
| | | | |
|
|
| | | Total common stocks
(cost $333,405,033) | | | 386,148,142 |
| | | | |
|
|
See Notes to Financial Statements.
| | |
| Prudential World Funds, Inc./Strategic Partners International Value Fund | | 11 |
Portfolio of Investments
as of October 31, 2004 Cont’d.
| | | | | |
| Shares | | Description | | Value (Note 1) |
| | | | | | |
| |
Right | | | |
| |
United Kingdom | | | |
| 76,026 | | Prudential PLC
(cost $0) | | $ | 128,158 |
| | | | |
|
|
| | | Total long-term investments
(cost $333,405,033) | | | 386,276,300 |
| | | | |
|
|
| |
SHORT-TERM INVESTMENT 0.2% | | | |
| |
Mutual Fund | | | |
| 800,572 | | Dryden Core Investment Fund - Taxable Money Market Series,
(cost $800,572; Note 3) | | | 800,572 |
| | | | |
|
|
| | | Total Investments 99.3%
(cost $334,205,605; Note 5) | | | 387,076,872 |
| | | Other assets in excess of liabilities 0.7% | | | 2,827,884 |
| | | | |
|
|
| | | Net Assets 100% | | $ | 389,904,756 |
| | | | |
|
|
| (a) | Non-income producing security. |
ADR—American Depositary Receipt.
GDR—Global Depositary Receipt.
See Notes to Financial Statements.
| | |
| 12 | | www.strategicpartners.com |
The industry classification of portfolio holdings and other assets in excess of liabilities shown as a percentage of net assets as of October 31, 2004 was as follows:
| | | |
Commercial Banks | | 19.0 | % |
Pharmaceuticals | | 10.4 | |
Insurance | | 7.8 | |
Diversified Telecommunications | | 7.5 | |
Food Products | | 7.3 | |
Oil & Gas | | 6.8 | |
Electronic Equipment | | 6.5 | |
Automobiles | | 4.1 | |
Wireless Telecommunication Services | | 3.7 | |
Office Electronics | | 3.5 | |
Electric Utilities | | 2.9 | |
Construction Materials | | 2.6 | |
Retail | | 2.4 | |
Tobacco | | 2.2 | |
Distribution/Wholesale | | 1.9 | |
Publishing | | 1.8 | |
Chemicals | | 1.5 | |
Beverages | | 1.4 | |
Diversified Manufacturing | | 1.4 | |
Real Estate | | 1.3 | |
Steel & Metals | | 1.0 | |
Advertising | | 0.7 | |
Semiconductors | | 0.6 | |
Transportation | | 0.5 | |
Media | | 0.3 | |
Cash Equivalent | | 0.2 | |
| | |
|
|
| | | 99.3 | |
Other assets in excess of liabilities | | 0.7 | |
| | |
|
|
| | | 100.0 | % |
| | |
|
|
See Notes to Financial Statements.
| | |
| Prudential World Funds, Inc./Strategic Partners International Value Fund | | 13 |
Statement of Assets and Liabilities
as of October 31, 2004
| | | | |
Assets | | | | |
Investments, at value (cost $334,205,605) | | $ | 387,076,872 | |
Foreign currency, at value (cost $800,464) | | | 797,404 | |
Cash | | | 96 | |
Receivable for investments sold | | | 1,666,436 | |
Dividends and interest receivable | | | 1,029,032 | |
Receivable for Series shares sold | | | 828,068 | |
Foreign tax reclaim receivable | | | 373,844 | |
Other assets | | | 11,829 | |
| | |
|
|
|
Total assets | | | 391,783,581 | |
| | |
|
|
|
| |
Liabilities | | | | |
Payable for Series shares reacquired | | | 718,051 | |
Payable for investments purchased | | | 372,282 | |
Accrued expenses | | | 324,586 | |
Management fee payable | | | 322,071 | |
Withholding tax payable | | | 93,175 | |
Distribution fee payable | | | 44,668 | |
Deferred directors’ fees payable | | | 3,992 | |
| | |
|
|
|
Total liabilities | | | 1,878,825 | |
| | |
|
|
|
| |
Net Assets | | $ | 389,904,756 | |
| | |
|
|
|
| | | | | |
Net assets were comprised of: | | | | |
Common stock, at par | | $ | 212,783 | |
Paid-in capital in excess of par | | | 417,614,422 | |
| | |
|
|
|
| | | | 417,827,205 | |
Undistributed net investment income | | | 3,989,502 | |
Accumulated net realized loss on investments and foreign currency transactions | | | (84,827,522 | ) |
Net unrealized appreciation on investments and foreign currencies | | | 52,915,571 | |
| | |
|
|
|
Net assets October 31, 2004 | | $ | 389,904,756 | |
| | |
|
|
|
See Notes to Financial Statements.
| | |
| 14 | | www.strategicpartners.com |
| | | |
Class A | | | |
Net asset value and redemption price per share
($55,529,532 ÷ 3,035,302 shares of common stock issued and outstanding) | | $ | 18.29 |
Maximum sales charge (5.50% of offering price) | | | 1.06 |
| | |
|
|
Maximum offering price to public | | $ | 19.35 |
| | |
|
|
| |
Class B | | | |
Net asset value, offering price and redemption price per share
($25,916,837 ÷ 1,461,984 shares of common stock issued and outstanding) | | $ | 17.73 |
| | |
|
|
| |
Class C | | | |
Net asset value, offering price and redemption price per share
($13,040,044 ÷ 734,863 shares of common stock issued and outstanding) | | $ | 17.74 |
| | |
|
|
| |
Class Z | | | |
Net asset value, offering price and redemption price per share
($295,418,343 ÷ 16,046,195 shares of common stock issued and outstanding) | | $ | 18.41 |
| | |
|
|
See Notes to Financial Statements.
| | |
| Prudential World Funds, Inc./Strategic Partners International Value Fund | | 15 |
Statement of Operations
Year Ended October 31, 2004
| | | | |
Net Investment Income | | | | |
Income | | | | |
Dividends (net of foreign withholding taxes of $1,438,629) | | $ | 10,627,221 | |
Interest | | | 19,593 | |
| | |
|
|
|
Total income | | | 10,646,814 | |
| | |
|
|
|
| |
Expenses | | | | |
Management fee | | | 4,231,019 | |
Distribution fee—Class A | | | 124,881 | |
Distribution fee—Class B | | | 334,385 | |
Distribution fee—Class C | | | 112,102 | |
Transfer agent’s fees and expenses | | | 791,000 | |
Custodian’s fees and expenses | | | 524,000 | |
Legal fees | | | 127,000 | |
Registration fees | | | 69,000 | |
Report to shareholders | | | 30,000 | |
Audit fee | | | 26,000 | |
Directors’ fees | | | 13,000 | |
Miscellaneous | | | 31,898 | |
| | |
|
|
|
Total operating expenses | | | 6,414,285 | |
Loan interest expense (Note 7) | | | 18,495 | |
| | |
|
|
|
Total expenses | | | 6,432,780 | |
| | |
|
|
|
Net investment Income | | | 4,214,034 | |
| | |
|
|
|
| |
Realized And Unrealized Gain (Loss) On Investments and Foreign Currency Transactions | | | | |
Net realized gain (loss) on: | | | | |
Investment transactions | | | 104,467 | |
Foreign currency transactions | | | (181,379 | ) |
| | |
|
|
|
| | | | (76,912 | ) |
| | |
|
|
|
Net change in unrealized appreciation (depreciation) on: | | | | |
Investments | | | 52,017,598 | |
Foreign currencies | | | (4,835 | ) |
| | |
|
|
|
| | | | 52,012,763 | |
| | |
|
|
|
Net gain on investments and foreign currencies | | | 51,935,851 | |
| | |
|
|
|
Net Increase In Net Assets Resulting From Operations | | $ | 56,149,885 | |
| | |
|
|
|
See Notes to Financial Statements.
| | |
| 16 | | www.strategicpartners.com |
Statement of Changes in Net Assets
| | | | | | | | |
| | | Year Ended October 31,
| |
| | | 2004 | | | 2003 | |
Increase (Decrease) In Net Assets | | | | | | | | |
Operations | | | | | | | | |
Net investment income | | $ | 4,214,034 | | | $ | 3,852,885 | |
Net realized loss on investment and foreign currency transactions | | | (76,912 | ) | | | (34,173,357 | ) |
Net change in unrealized appreciation (depreciation) on investments and foreign currencies | | | 52,012,763 | | | | 82,983,642 | |
| | |
|
|
| |
|
|
|
Net increase in net assets resulting from operations | | | 56,149,885 | | | | 52,663,170 | |
| | |
|
|
| |
|
|
|
| | |
Dividends (Note 1) | | | | | | | | |
Dividends from net investment income | | | | | | | | |
Class A | | | (355,438 | ) | | | (107,003 | ) |
Class B | | | (53,585 | ) | | | — | |
Class C | | | (11,814 | ) | | | — | |
Class Z | | | (3,395,621 | ) | | | (1,514,375 | ) |
| | |
|
|
| |
|
|
|
| | | | (3,816,458 | ) | | | (1,621,378 | ) |
| | |
|
|
| |
|
|
|
| | |
Series share transactions (net of share conversions) (Note 6) | | | | | | | | |
Net proceeds from shares sold(b) | | | 147,161,713 | | | | 210,784,175 | |
Net asset value of shares issued in reinvestment of dividends | | | 3,788,558 | | | | 1,610,139 | |
Cost of shares reacquired | | | (206,877,748 | ) | | | (226,060,115 | ) |
| | |
|
|
| |
|
|
|
Net decrease in net assets from Series share transactions | | | (55,927,477 | ) | | | (13,665,801 | ) |
| | |
|
|
| |
|
|
|
Total increase (decrease) | | | (3,594,050 | ) | | | 37,375,991 | |
| | |
Net Assets | | | | | | | | |
Beginning of year | | | 393,498,806 | | | | 356,122,815 | |
| | |
|
|
| |
|
|
|
End of year(a) | | $ | 389,904,756 | | | $ | 393,498,806 | |
| | |
|
|
| |
|
|
|
(a) Includes undistributed net investment income of: | | $ | 3,989,502 | | | $ | 3,698,787 | |
| | |
|
|
| |
|
|
|
(b) For the year ended October 31, 2004, includes $18,252,977 for shares issued in connection with the acquisition of the Strategic Partners Style Specific Funds—Strategic Partners International Equity Fund. | |
See Notes to Financial Statements.
| | |
| Prudential World Funds, Inc./Strategic Partners International Value Fund | | 17 |
Notes to Financial Statements
Prudential World Fund, Inc. (the “Fund”), is registered under the Investment Company Act of 1940 as an open-end diversified management investment company and currently consists of three series: Strategic Partners International Value Fund (the “Series”), Jennison Global Growth Fund, and the Dryden International Equity Fund. These financial statements relate to Strategic Partners International Value Fund. The financial statements of the other Series are not presented herein. The investment objective of the Series is to achieve long-term growth of capital. Income is a secondary objective. The Series seeks to achieve its objective primarily through investment in common stock and preferred stock of foreign companies of all sizes.
Note 1. Accounting Policies
The following is a summary of significant accounting policies followed by the Fund and the Series in the preparation of its financial statements.
Securities Valuation: Securities listed on a securities exchange (other than options on securities and indices) are valued at the last sale price on such exchange on the day of valuation or, if there was no sale on such day, at the mean between the last reported bid and ask prices, or at the last bid price on such day in the absence of an asked price. Securities traded via Nasdaq are valued at the Nasdaq official closing price (NOCP) on the day of valuation, or if there was no NOCP, at the last sale price. Securities that are actively traded in the over-the-counter market, including listed securities for which the primary market is believed by Prudential Investments LLC (“PI” or “Manager”), in consultation with the subadviser(s), to be over-the-counter, are valued at market value using prices provided by an independent pricing agent or principal market maker. Options on securities and indices traded on an exchange are valued at the last sale price as of the close of trading on the applicable exchange or, if there was no sale, at the mean between the most recently quoted bid and asked prices on such exchange. Futures contracts and options thereon traded on a commodities exchange or board of trade are valued at the last sale price at the close of trading on such exchange or board of trade or, if there was no sale on the applicable commodities exchange or board of trade on such day, at the mean between the most recently quoted bid and asked prices on such exchange or board of trade or at the last bid price in the absence of an asked price. Securities for which reliable market quotations are not readily available, or whose values have been affected by events occurring after the close of the security’s foreign market and before the Funds’ normal pricing time, are valued at fair value in accordance with the Board of Trustees’ approved fair valuation procedures. Using fair value to price securities may result in a value that is different from a security’s most recent closing price and
| | |
| 18 | | www.strategicpartners.com |
from the price used by other mutual funds to calculate their net asset values. As of October 31, 2004 there were no securities valued in accordance with such procedures. Investments in mutual funds are valued at their net asset value as of the close of the New York Stock Exchange on the date of valuation.
Short-term securities which mature in 60 days or less are valued at amortized cost, which approximates market value. The amortized cost method involves valuing a security at its cost on the date of purchase and thereafter assuming a constant amortization to maturity of the difference between the principal amount due at maturity and cost. Short-term securities which mature in more than 60 days are valued at current market quotations.
Repurchase Agreements: In connection with transactions in repurchase agreements with United States financial institutions, it is the Fund’s policy that its custodian or designated subcustodians under triparty repurchase agreements, as the case may be, take possession of the underlying securities, the value of which exceeds the principal amount of the repurchase transaction including accrued interest. To the extent that any repurchase transaction exceeds one business day, the value of the collateral is marked to market on a daily basis to maintain the accuracy of the collateral. If the seller defaults and the value of the collateral declines or if bankruptcy proceedings are commenced with respect to the seller of the security, realization of the collateral by the Series may be delayed or limited.
Foreign Currency Translation: The books and records of the Series are maintained in U.S. dollars. Foreign currency amounts are translated into U.S. dollars on the following basis:
(i) market value of investment securities, other assets and liabilities—at the current rates of exchange.
(ii) Purchases and sales of investment securities, income and expenses—at the rates of exchange prevailing on the respective dates of such transactions.
Although the net assets of the Series are presented at the foreign exchange rates and market values at the close of the fiscal period, the Series does not isolate that portion of the results of operations arising as a result of changes in the foreign exchange rates from the fluctuations arising from changes in the market prices of long-term securities held at the end of the fiscal period. Similarly, the Series does not isolate the effect of changes in foreign exchange rates from the fluctuations arising from changes in the market prices of long-term portfolio securities sold during the fiscal period. Accordingly, realized foreign currency gains or losses are included in the reported net realized gains or losses on investment transactions.
| | |
| Prudential World Funds, Inc./Strategic Partners International Value Fund | | 19 |
Notes to Financial Statements
Cont’d
Net realized gains or losses on foreign currency transactions represent net foreign exchange gains or losses from the holding of foreign currencies, currency gains or losses realized between the trade date and settlement date on securities transactions, and the difference between the amounts of dividends, interest and foreign withholding taxes recorded on the Series’ books and the U.S. dollar equivalent amounts actually received or paid. Net unrealized currency gains or losses from valuing foreign currency denominated assets and liabilities (other than investments) at period end exchange rates are reflected as a component of net unrealized appreciation (depreciation) on investments and foreign currencies.
Foreign security and currency transactions may involve certain considerations and risks not typically associated with those of domestic origin as a result of, among other factors, the possibility of political and economic instability or the level of governmental supervision and regulation of foreign securities markets.
Forward Currency Contracts: A forward currency contract is a commitment to purchase or sell a foreign currency at a future date at a negotiated forward rate. The Series enters into forward currency contracts in order to hedge its exposure to changes in foreign currency exchange rates on its foreign portfolio holdings or specific receivables and payables denominated in a foreign currency. The contracts are valued daily at current exchange rates and any unrealized gain or loss is included in net unrealized appreciation or depreciation on foreign currencies. Gain or loss is realized on the settlement date of the contract equal to the difference between the settlement value of the original and renegotiated forward contracts. This gain or loss, if any, is included in net realized gain (loss) on foreign currency transactions. Risks may arise upon entering into these contracts from the potential inability of the counterparties to meet the terms of their contracts.
Forward currency contracts involve elements of both market and credit risk in excess of the amounts reflected on the Statement of Assets and Liabilities.
Securities Transactions and Net Investment Income: Securities transactions are recorded on the trade date. Realized and unrealized gains or losses on sales of securities are calculated on the identified cost basis. Dividend income is recorded on the ex-dividend date and interest income, including amortization of premium and accretion of discount on debt securities, as required, is recorded on an accrual basis. Expenses are recorded on the accrual basis.
| | |
| 20 | | www.strategicpartners.com |
Net investment income or loss, (other than distribution fees which are charged directly to the respective class) and unrealized and realized gains or losses are allocated daily to each class of shares based upon the relative proportion of net assets of each class at the beginning of the day.
Dividends and Distributions: The Series expects to pay dividends of net investment income and distributions of net realized capital gains, if any, annually. Dividends and distributions to shareholders, which are determined in accordance with federal income tax regulations and which may differ from generally accepted accounting principles, are recorded on the ex-dividend date. Permanent book/tax differences relating to income and gains are reclassified amongst undistributed net investment income, accumulated net realized gain or loss and paid-in capital in excess of par, as appropriate.
Taxes: For federal income tax purposes, each series in the Fund is treated as a separate taxpaying entity. It is the Series’ policy to continue to meet the requirements of the Internal Revenue Code applicable to regulated investment companies and to distribute all of its taxable net income and capital gains, if any, to shareholders. Therefore, no federal income tax provision is required.
Withholding taxes on foreign dividends are recorded, net of reclaimable amounts, at the time the related income is earned.
Estimates: The preparation of the financial statements requires management to make estimates and assumptions that affect the reported amounts and disclosures in the financial statements. Actual results could differ from those estimates.
Note 2. Agreements
The Fund has a management agreement for the Series with Prudential Investments LLC (“PI”). Pursuant to this agreement, PI has responsibility for all investment advisory services and supervises the subadvisor’s performance of such services. PI has entered into a subadvisory agreement with Bank of Ireland Asset Management (“BOI”).
The subadvisory agreement provides that BOI furnishes investment advisory services in connection with the management of the Series. In connection therewith, BOI is obligated to keep certain books and records of the Series. PI pays for the services of BOI, the cost of compensation of officers of the Series, occupancy and certain clerical and bookkeeping costs of the Series. The Fund bears all other costs and expenses.
The management fee paid PI is computed daily and payable monthly at an annual rate of 1% of the average daily net assets up to $300 million and .95 of 1% of average daily net assets in excess of $300 million of the Series.
| | |
| Prudential World Funds, Inc./Strategic Partners International Value Fund | | 21 |
Notes to Financial Statements
Cont’d
Effective December 14, 2004, LSV Asset Management (“LSV”) & Thornburg Investment Management (“Thornburg”) replaced Bank of Ireland as the Sub-advisers on the Series.
The Series has a distribution agreement with Prudential Investment Management Services LLC (“PIMS”), which acts as the distributor of the Class A, Class B, Class C and Class Z shares of the Series. The Series compensates PIMS for distributing and servicing the Series’ Class A, Class B and Class C shares pursuant to plans of distribution (the “Class A, B and C Plans”), regardless of expenses actually incurred by PIMS. The distribution fees are accrued daily and payable monthly. No distribution or service fees are paid to PIMS as distributor of the Class Z shares of the Series.
Pursuant to the Class A, B and C Plans, the Series compensates PIMS for distribution-related activities at an annual rate of up to .30 of 1%, 1% and 1% of the average daily net assets of the Class A, B and C shares, respectively. For the year ended October 31, 2004, PIMS contractually agreed to limit such fee to .25 of 1% of the average daily net assets of the Class A shares.
PIMS has advised the Series that it received approximately $30,400 and $2,600 in front-end sales charges resulting from sales of Class A shares and Class C shares, respectively, during the year ended October 31, 2004. From these fees, PIMS paid such sales charges to broker-dealers, which in turn paid commissions to salespersons and incurred other distribution costs.
PIMS advised the Series that for the year ended October 31, 2004, it received approximately $39,800 and $2,000 in contingent deferred sales charges imposed upon certain redemptions by Class B and Class C shareholders, respectively.
PI and PIMS are indirect, wholly-owned subsidiaries of Prudential Financial, Inc. (“Prudential”).
Note 3. Other Transactions with Affiliates
Prudential Mutual Fund Services LLC (“PMFS”), an affiliate of PI and an indirect, wholly-owned subsidiary of Prudential, serves as the Fund’s transfer agent. During the year ended October 31, 2004, the Series incurred fees of approximately $739,200 for the services of PMFS. As of October 31, 2004, approximately $52,500 of such
| | |
| 22 | | www.strategicpartners.com |
services were due to PMFS. The transfer agent fees and expenses in the Statement of Operations include certain out-of-pocket expenses paid to nonaffiliates, where applicable.
The Series pays networking fees to affiliated and unaffiliated broker/dealers. These networking fees are payments made to broker/dealers that clear mutual fund transactions through a national clearing system. The Series incurred approximately $46,600 in total networking fees, of which the amount relating to the services of Wachovia Securities, LLC (“Wachovia”), an affiliate of PI, was approximately $29,200 for the year ended October 31, 2004. As of October 31, 2004 approximately $2,600 of such fees were due to Wachovia. These amounts are included in transfer agent’s fees and expenses in the Statement of Operations.
The Series invests in the Taxable Money Market Series, a portfolio of Dryden Core Investment Fund, formerly Prudential Core Investment Fund, pursuant to an exemptive order received from the Securities and Exchange Commission. The Taxable Money Market Series is a money market mutual fund registered under the Investment Company Act of 1940, as amended, and managed by PI. During the year ended October 31, 2004, the Series earned gross income of $24,866 from the Taxable Money Market Series by investing its excess cash.
Note 4. Portfolio Securities
Purchases and sales of investment securities, other than short-term investments, for the year ended October 31, 2004 were $100,619,328 and $173,143,326, respectively.
Note 5. Distributions and Tax Information
In order to present undistributed net investment income (loss) and accumulated net realized gains (losses) on the Statement of Assets and Liabilities that more closely represent their tax character, certain adjustments have been made to undistributed net investment income (loss) and accumulated net realized gains (loss) on investments. For the year ended October 31, 2004, the adjustments were to increase accumulated net realized loss by $7,306,075, decrease undistributed net investment income by $106,861 and increase paid in capital by $7,412,936 for differences in the treatment for book and tax purposes of certain transactions involving foreign securities, currencies and other tax adjustments due to the merger.
For the years ended October 31, 2004 and October 31, 2003, the tax character of dividends paid, as reflected in the Statement of Changes in Net Assets of $3,816,458 and $1,621,378 respectively, was ordinary income.
| | |
| Prudential World Funds, Inc./Strategic Partners International Value Fund | | 23 |
Notes to Financial Statements
Cont’d
As of October 31, 2004, the accumulated undistributed earnings on a tax basis was $4,086,669 of ordinary income.
For federal income tax purposes, the Series had a capital loss carryforward as of October 31, 2004 of approximately $77,597,000 of which $17,000 expires in 2008, $3,104,000 expires in 2009, $38,565,000 expires in 2010, $33,416,000 expires in 2011 and $2,495,000 expires in 2012. Accordingly, no capital gains distributions are expected to be paid to shareholders until net gains have been realized in excess of such carryforward.
The United States federal income tax basis of the Series’ investments and the net unrealized appreciation as of October 31, 2004 were as follows:
| | | | | | | | |
Tax Basis
| | Appreciation
| | Depreciation
| | Other Cost
Adjustments
| | Total Net
Unrealized Appreciation
|
| $341,436,402 | | $63,770,010 | | $18,129,540 | | $44,304 | | $45,684,774 |
The difference between book basis and tax basis was attributable to deferred losses on wash sale and other tax adjustments. The other cost basis adjustments are primarily attributable to depreciation of foreign currency and mark to market of receivables and payables.
Note 6. Capital
The Fund offers Class A, Class B, Class C and Class Z shares. Class A shares were sold with a front-end sales charge of up to 5%. Class A shares purchased on or after March 15, 2004 are subject to a maximum front-end sales charge of 5.50%. Effective March 15, 2004, all investors who purchased Class A shares in an amount of $1 million or more and sell these shares within 12 months of purchase are subject to a contingent deferred sales charge (CDSC) of 1%, including investors who purchase their shares through broker-dealers affiliated with Prudential. Class B shares are sold with a contingent deferred sales charge which declines from 5% to zero depending upon the period of time the shares are held. Class C shares were sold with a front-end sales charge of 1% and a contingent deferred sales charge of 1% during the first 18 months. Class C shares purchased on or after February 2, 2004 are not subject to a front-end sales charge and the contingent deferred sales charge (CDSC) for Class C shares is 12 months from the date of purchase. Class B shares will automatically convert to Class A shares on a quarterly basis approximately seven years after purchase. A special exchange privilege is also available for shareholders who qualify
| | |
| 24 | | www.strategicpartners.com |
to purchase Class A shares at net asset value. Class Z shares are not subject to any sales or redemption charge and are offered exclusively for sale to a limited group of investors.
There are 500 million authorized shares of $.01 par value common stock, divided equally into four classes, designated Class A, Class B, Class C and Class Z common stock.
Transactions in shares of common stock were as follows:
| | | | | | | |
Class A
| | Shares
| | | Amount
| |
Year ended October 31, 2004: | | | | | | | |
Shares sold | | 812,342 | | | $ | 14,261,765 | |
Shares issued in connection with reorganization (Note 8) | | 262,056 | | | | 4,858,696 | |
Shares issued in reinvestment of dividends and distributions | | 20,706 | | | | 336,257 | |
Shares reacquired | | (1,395,105 | ) | | | (24,626,866 | ) |
| | |
|
| |
|
|
|
Net increase (decrease) in shares outstanding before conversion | | (300,001 | ) | | | (5,170,148 | ) |
Shares issued upon conversion from Class B | | 728,786 | | | | 12,969,203 | |
| | |
|
| |
|
|
|
Net increase (decrease) in shares outstanding | | 428,785 | | | $ | 7,799,055 | |
| | |
|
| |
|
|
|
Year ended October 31, 2003: | | | | | | | |
Shares sold | | 4,601,050 | | | $ | 66,268,156 | |
Shares issued in reinvestment of dividends and distributions | | 7,341 | | | | 103,529 | |
Shares reacquired | | (5,020,691 | ) | | | (73,325,967 | ) |
| | |
|
| |
|
|
|
Net increase (decrease) in shares outstanding before conversion | | (412,300 | ) | | | (6,954,282 | ) |
Shares issued upon conversion from Class B | | 105,103 | | | | 1,468,997 | |
| | |
|
| |
|
|
|
Net increase (decrease) in shares outstanding | | (307,197 | ) | | $ | (5,485,285 | ) |
| | |
|
| |
|
|
|
Class B
| | | | | | |
Year ended October 31, 2004: | | | | | | | |
Shares sold | | 250,642 | | | $ | 4,304,989 | |
Shares issued in connection with reorganization (Note 8) | | 333,631 | | | | 6,026,255 | |
Shares issued in reinvestment of dividends and distributions | | 3,207 | | | | 50,805 | |
Shares reacquired | | (534,931 | ) | | | (9,164,707 | ) |
| | |
|
| |
|
|
|
Net increase (decrease) in shares outstanding before conversion | | 52,549 | | | | 1,217,342 | |
Shares reacquired upon conversion into Class A | | (750,116 | ) | | | (12,969,203 | ) |
| | |
|
| |
|
|
|
Net increase (decrease) in shares outstanding | | (697,567 | ) | | $ | (11,751,861 | ) |
| | |
|
| |
|
|
|
Year ended October 31, 2003: | | | | | | | |
Shares sold | | 294,371 | | | $ | 4,032,232 | |
Shares reacquired | | (771,800 | ) | | | (10,610,204 | ) |
| | |
|
| |
|
|
|
Net increase (decrease) in shares outstanding before conversion | | (447,429 | ) | | | (6,577,972 | ) |
Shares reacquired upon conversion into Class A | | (107,969 | ) | | | (1,468,997 | |
| | |
|
| |
|
|
|
Net increase (decrease) in shares outstanding | | (585,398 | ) | | $ | (8,046,969 | ) |
| | |
|
| |
|
|
|
| | |
| Prudential World Funds, Inc./Strategic Partners International Value Fund | | 25 |
Notes to Financial Statements
Cont’d
| | | | | | | |
Class C
| | Shares
| | | Amount
| |
Year ended October 31, 2004: | | | | | | | |
Shares sold | | 109,865 | | | $ | 1,903,861 | |
Shares issued in connection with reorganization (Note 8) | | 407,663 | | | | 7,368,026 | |
Shares issued in reinvestment of dividends and distributions | | 691 | | | | 10,968 | |
Shares reacquired | | (260,224 | ) | | | (4,485,944 | ) |
| | |
|
| |
|
|
|
Net increase (decrease) in shares outstanding | | 257,995 | | | $ | 4,796,911 | |
| | |
|
| |
|
|
|
Year ended October 31, 2003: | | | | | | | |
Shares sold | | 513,851 | | | $ | 7,040,899 | |
Shares reacquired | | (608,873 | ) | | | (8,338,190 | ) |
| | |
|
| |
|
|
|
Net increase (decrease) in shares outstanding | | (95,022 | ) | | $ | (1,297,291 | ) |
| | |
|
| |
|
|
|
Class Z
| | | | | | |
Year ended October 31, 2004: | | | | | | | |
Shares sold | | 6,116,252 | | | $ | 108,438,121 | |
Shares issued in reinvestment of dividends and distributions | | 208,008 | | | | 3,390,528 | |
Shares reacquired | | (9,479,052 | ) | | | (168,600,231 | ) |
| | |
|
| |
|
|
|
Net increase (decrease) in shares outstanding | | (3,154,792 | ) | | $ | (56,771,582 | ) |
| | |
|
| |
|
|
|
Year ended October 31, 2003: | | | | | | | |
Shares sold | | 9,362,691 | | | $ | 133,442,888 | |
Shares issued in reinvestment of dividends and distributions | | 106,400 | | | | 1,506,610 | |
Shares reacquired | | (9,297,500 | ) | | | (133,785,754 | ) |
| | |
|
| |
|
|
|
Net increase (decrease) in shares outstanding | | 171,591 | | | $ | 1,163,744 | |
| | |
|
| |
|
|
|
Note 7. Borrowings
The Series, along with other affiliated registered investment companies (the “Funds”), is a party to a syndicated credit agreement (“SCA”) with a group of banks. For the period from November 1, 2003 through April 30, 2004, the SCA provided for a commitment of $800 million and allowed the Funds to increase the commitment to $1 billion, if necessary. Effective May 1, 2004, the SCA provided for a commitment of $500 million. Interest on any borrowings under the SCA would be incurred at market rates. The Funds pay a commitment fee of .08 of 1% of the unused portion of the SCA. The commitment fee is accrued daily and paid quarterly and is allocated to the Funds pro rata, based on net assets. The purpose of the SCA is to serve as an alternative source of funding for capital share redemptions. The expiration date of the SCA was October 29, 2004. Effective October 29, 2004, the Funds entered into a revised credit agreement with two banks. The commitment under the revised credit
| | |
| 26 | | www.strategicpartners.com |
agreement is $500 million. The Funds pay a commitment fee of .075 of 1% of the unused portion of the revised credit agreement. The expiration date of the revised credit agreement will be October 28, 2005.
The Series utilized the line of credit during the year ended October 31, 2004. The average daily balance for the 7 days the Series had debt outstanding during the year was approximately $40,340,000 at a weighted average interest rate of approximately 2.350%.
Note 8. Plan of Reorganization
On March 5, 2004, the Strategic Partners International Value Fund acquired all of the net assets of the Strategic Partners Style Specific Funds—Strategic Partners International Equity Fund pursuant to a plan of reorganization approved by the Strategic Partners International Value Fund shareholders on December 19, 2003. The acquisition was accomplished by a tax-free exchange of Class A, Class B and Class C shares.
| | | | | | | | |
Strategic Partners Style
Specific Funds—Strategic
Partners International Fund
| | Strategic Partners
International Value Fund
| | Value
|
| Class A | | 571,226 | | Class A | | 262,056 | | $4,858,696 |
B | | 725,076 | | B | | 333,631 | | 6,026,255 |
C | | 886,950 | | C | | 407,663 | | 7,368,026 |
The aggregate net assets of the Strategic Partners Style Specific Funds—Strategic Partners International Equity Fund and the Strategic Partners International Value Fund immediately before the acquisition were $18,252,977 and $450,914,546, respectively.
The future utilization of the acquired capital loss carryforward from the Strategic Partners Style Specific Funds—Strategic Partners International Equity Fund in the amount of $7,233,033 will be limited under certain conditions defined in the Internal Revenue Code of 1986, as amended.
| | |
| Prudential World Funds, Inc./Strategic Partners International Value Fund | | 27 |
Financial Highlights
| | | | |
| | | Class A
| |
| | | Year Ended
October 31, 2004(b) | |
Per Share Operating Performance: | | | | |
Net Asset Value, Beginning Of Year | | $ | 16.07 | |
| | |
|
|
|
Income (Loss) from investment operations | | | | |
Net investment income | | | .16 | |
Net realized and unrealized gain (loss) on investment and foreign currency transactions | | | 2.20 | |
| | |
|
|
|
Total from investment operations | | | 2.36 | |
| | |
|
|
|
Less Dividends and Distributions | | | | |
Dividends from net investment income | | | (.14 | ) |
Distributions from net realized gains | | | — | |
| | |
|
|
|
Total dividends and distributions | | | (.14 | ) |
| | |
|
|
|
Net asset value, end of year | | $ | 18.29 | |
| | |
|
|
|
Total Return(a): | | | 14.77 | % |
Ratios/Supplemental Data: | | | | |
Net assets, end of year (000) | | $ | 55,530 | |
Average net assets (000) | | $ | 49,953 | |
Ratios to average net assets: | | | | |
Expenses, including distribution and service (12b-1) fees(c) | | | 1.61 | % |
Expenses, excluding distribution and service (12b-1) fees | | | 1.36 | % |
Net investment income | | | .90 | % |
For Class A, B, C and Z shares: | | | | |
Portfolio turnover rate | | | 24 | % |
| (a) | Total return does not consider the effects of sales loads. Total return is calculated assuming a purchase of shares on the first day and a sale on the last day of each year reported, and includes reinvestment of dividends and distributions. |
| (b) | Calculated based upon average shares outstanding during the year. |
| (c) | The distributor of the Series contractually agreed to limit its distribution and service (12b-1) fees to .25 of 1% on the average daily net assets of Class A shares. |
See Notes to Financial Statements.
| | |
| 28 | | www.strategicpartners.com |
| | | | | | | | | | | | | | |
| Class A | |
| Year Ended October 31, | |
| 2003(b) | | | 2002(b) | | | 2001 | | | 2000(b) | |
| | | | | | | | | | | | | | | |
| $ | 14.08 | | | $ | 17.29 | | | $ | 22.08 | | | $ | 22.42 | |
|
|
| |
|
|
| |
|
|
| |
|
|
|
| | | | | | | | | | | | | | | |
| | .14 | | | | .07 | | | | .13 | | | | .19 | |
| | 1.89 | | | | (2.53 | ) | | | (4.01 | ) | | | .71 | |
|
|
| |
|
|
| |
|
|
| |
|
|
|
| | 2.03 | | | | (2.46 | ) | | | (3.88 | ) | | | .90 | |
|
|
| |
|
|
| |
|
|
| |
|
|
|
| | | | | | | | | | | | | | | |
| | (.04 | ) | | | — | | | | — | | | | (.17 | ) |
| | — | | | | (.75 | ) | | | (.91 | ) | | | (1.07 | ) |
|
|
| |
|
|
| |
|
|
| |
|
|
|
| | (.04 | ) | | | (.75 | ) | | | (.91 | ) | | | (1.24 | ) |
|
|
| |
|
|
| |
|
|
| |
|
|
|
| $ | 16.07 | | | $ | 14.08 | | | $ | 17.29 | | | $ | 22.08 | |
|
|
| |
|
|
| |
|
|
| |
|
|
|
| | 14.44 | % | | | (15.07 | )% | | | (18.25 | )% | | | 3.92 | % |
| | | | | | | | | | | | | | | |
| $ | 41,889 | | | $ | 41,011 | | | $ | 53,269 | | | $ | 72,185 | |
| $ | 40,463 | | | $ | 49,279 | | | $ | 63,061 | | | $ | 67,362 | |
| | | | | | | | | | | | | | | |
| | 1.72 | % | | | 1.64 | % | | | 1.60 | % | | | 1.52 | % |
| | 1.47 | % | | | 1.39 | % | | | 1.35 | % | | | 1.27 | % |
| | .97 | % | | | .42 | % | | | .62 | % | | | .84 | % |
| | | | | | | | | | | | | | | |
| | 23 | % | | | 35 | % | | | 115 | % | | | 33 | % |
See Notes to Financial Statements.
| | |
| Prudential World Funds, Inc./Strategic Partners International Value Fund | | 29 |
Financial Highlights
Cont’d
| | | | |
| | | Class B
| |
| | | Year Ended
October 31, 2004(b) | |
Per Share Operating Performance: | | | | |
Net Asset Value, Beginning Of Year | | $ | 15.58 | |
| | |
|
|
|
Income (Loss) from investment operations | | | | |
Net investment income (loss) | | | .03 | |
Net realized and unrealized gain (loss) on investment and foreign currency transactions | | | 2.15 | |
| | |
|
|
|
Total from investment operations | | | 2.18 | |
| | |
|
|
|
Less Dividends and Distributions | | | | |
Dividends from net investment income | | | (.03 | ) |
Distributions from net realized gains | | | — | |
| | |
|
|
|
Total dividends and distributions | | | (.03 | ) |
| | |
|
|
|
Net asset value, end of year | | $ | 17.73 | |
| | |
|
|
|
Total Return(a): | | | 13.98 | % |
Ratios/Supplemental Data: | | | | |
Net assets, end of year (000) | | $ | 25,917 | |
Average net assets (000) | | $ | 33,863 | |
Ratios to average net assets: | | | | |
Expenses, including distribution and service (12b-1) fees | | | 2.36 | % |
Expenses, excluding distribution and service (12b-1) fees | | | 1.36 | % |
Net investment income (loss) | | | .15 | % |
| (a) | Total return does not consider the effects of sales loads. Total return is calculated assuming a purchase of shares on the first day and a sale on the last day of each year reported, and includes reinvestment of dividends and distributions. |
| (b) | Calculated based upon average shares outstanding during the year. |
See Notes to Financial Statements.
| | |
| 30 | | www.strategicpartners.com |
| | | | | | | | | | | | | | |
| Class B | |
| Year Ended October 31, | |
| 2003(b) | | | 2002(b) | | | 2001 | | | 2000(b) | |
| | | | | | | | | | | | | | | |
| $ | 13.71 | | | $ | 16.99 | | | $ | 21.88 | | | $ | 22.23 | |
|
|
| |
|
|
| |
|
|
| |
|
|
|
| | | | | | | | | | | | | | | |
| | .03 | | | | (.05 | ) | | | (.03 | ) | | | .02 | |
| | 1.84 | | | | (2.48 | ) | | | (3.95 | ) | | | .71 | |
|
|
| |
|
|
| |
|
|
| |
|
|
|
| | 1.87 | | | | (2.53 | ) | | | (3.98 | ) | | | .73 | |
|
|
| |
|
|
| |
|
|
| |
|
|
|
| | | | | | | | | | | | | | | |
| | — | | | | — | | | | — | | | | (.01 | ) |
| | — | | | | (.75 | ) | | | (.91 | ) | | | (1.07 | ) |
|
|
| |
|
|
| |
|
|
| |
|
|
|
| | — | | | | (.75 | ) | | | (.91 | ) | | | (1.08 | ) |
|
|
| |
|
|
| |
|
|
| |
|
|
|
| $ | 15.58 | | | $ | 13.71 | | | $ | 16.99 | | | $ | 21.88 | |
|
|
| |
|
|
| |
|
|
| |
|
|
|
| | 13.64 | % | | | (15.77 | )% | | | (18.93 | )% | | | 3.22 | % |
| | | | | | | | | | | | | | | |
| $ | 33,651 | | | $ | 37,636 | | | $ | 55,620 | | | $ | 86,451 | |
| $ | 33,581 | | | $ | 49,420 | | | $ | 74,063 | | | $ | 99,106 | |
| | | | | | | | | | | | | | | |
| | 2.47 | % | | | 2.39 | % | | | 2.35 | % | | | 2.27 | % |
| | 1.47 | % | | | 1.39 | % | | | 1.35 | % | | | 1.27 | % |
| | .20 | % | | | (.33 | )% | | | (.13 | )% | | | .07 | % |
See Notes to Financial Statements.
| | |
| Prudential World Funds, Inc./Strategic Partners International Value Fund | | 31 |
Financial Highlights
Cont’d
| | | | |
| | | Class C
| |
| | | Year Ended
October 31, 2004(b) | |
Per Share Operating Performance: | | | | |
Net Asset Value, Beginning Of Year | | $ | 15.60 | |
| | |
|
|
|
Income (Loss) from investment operations | | | | |
Net investment income (loss) | | | .06 | |
Net realized and unrealized gain (loss) on investment and foreign currency transactions | | | 2.11 | |
| | |
|
|
|
Total from investment operations | | | 2.17 | |
| | |
|
|
|
Less Dividends and Distributions | | | | |
Dividends from net investment income | | | (.03 | ) |
Distributions from net realized gains | | | — | |
| | |
|
|
|
Total dividends and distributions | | | (.03 | ) |
| | |
|
|
|
Net asset value, end of year | | $ | 17.74 | |
| | |
|
|
|
Total Return(a): | | | 13.90 | % |
Ratios/Supplemental Data: | | | | |
Net assets, end of year (000) | | $ | 13,040 | |
Average net assets (000) | | $ | 11,763 | |
Ratios to average net assets: | | | | |
Expenses, including distribution and service (12b-1) fees | | | 2.36 | % |
Expenses, excluding distribution and service (12b-1) fees | | | 1.36 | % |
Net investment income (loss) | | | .33 | % |
| (a) | Total return does not consider the effects of sales loads. Total return is calculated assuming a purchase of shares on the first day and a sale on the last day of each year reported, and includes reinvestment of dividends and distributions. |
| (b) | Calculated based upon average shares outstanding during the year. |
See Notes to Financial Statements.
| | |
| 32 | | www.strategicpartners.com |
| | | | | | | | | | | | | | |
| Class C | |
| Year Ended October 31, | |
| 2003(b) | | | 2002(b) | | | 2001 | | | 2000(b) | |
| | | | | | | | | | | | | | | |
| $ | 13.73 | | | $ | 17.00 | | | $ | 21.88 | | | $ | 22.23 | |
|
|
| |
|
|
| |
|
|
| |
|
|
|
| | | | | | | | | | | | | | | |
| | .03 | | | | (.05 | ) | | | (.03 | ) | | | .02 | |
| | 1.84 | | | | (2.47 | ) | | | (3.94 | ) | | | .71 | |
|
|
| |
|
|
| |
|
|
| |
|
|
|
| | 1.87 | | | | (2.52 | ) | | | (3.97 | ) | | | .73 | |
|
|
| |
|
|
| |
|
|
| |
|
|
|
| | | | | | | | | | | | | | | |
| | — | | | | — | | | | — | | | | (.01 | ) |
| | — | | | | (.75 | ) | | | (.91 | ) | | | (1.07 | ) |
|
|
| |
|
|
| |
|
|
| |
|
|
|
| | — | | | | (.75 | ) | | | (.91 | ) | | | (1.08 | ) |
|
|
| |
|
|
| |
|
|
| |
|
|
|
| $ | 15.60 | | | $ | 13.73 | | | $ | 17.00 | | | $ | 21.88 | |
|
|
| |
|
|
| |
|
|
| |
|
|
|
| | 13.62 | % | | | (15.70 | )% | | | (18.89 | )% | | | 3.22 | % |
| | | | | | | | | | | | | | | |
| $ | 7,438 | | | $ | 7,850 | | | $ | 11,306 | | | $ | 17,755 | |
| $ | 6,988 | | | $ | 9,978 | | | $ | 14,599 | | | $ | 18,082 | |
| | | | | | | | | | | | | | | |
| | 2.47 | % | | | 2.39 | % | | | 2.35 | % | | | 2.27 | % |
| | 1.47 | % | | | 1.39 | % | | | 1.35 | % | | | 1.27 | % |
| | .18 | % | | | (.34 | )% | | | (.15 | )% | | | .07 | % |
See Notes to Financial Statements.
| | |
| Prudential World Funds, Inc./Strategic Partners International Value Fund | | 33 |
Financial Highlights
Cont’d
| | | | |
| | | Class Z
| |
| | | Year Ended
October 31, 2004(b) | |
Per Share Operating Performance: | | | | |
Net Asset Value, Beginning Of Year | | $ | 16.17 | |
| | |
|
|
|
Income (Loss) from investment operations | | | | |
Net investment income | | | .20 | |
Net realized and unrealized gain (loss) on investment and foreign currency transactions | | | 2.22 | |
| | |
|
|
|
Total from investment operations | | | 2.42 | |
| | |
|
|
|
Less Dividends and Distributions | | | | |
Dividends from net investment income | | | (.18 | ) |
Distributions from net realized gains | | | — | |
| | |
|
|
|
Total dividends and distributions | | | (.18 | ) |
| | |
|
|
|
Net asset value, end of year | | $ | 18.41 | |
| | |
|
|
|
Total Return(a): | | | 15.09 | % |
Ratios/Supplemental Data: | | | | |
Net assets, end of year (000) | | $ | 295,418 | |
Average net assets (000) | | $ | 334,003 | |
Ratios to average net assets: | | | | |
Expenses, including distribution and service (12b-1) fees | | | 1.36 | % |
Expenses, excluding distribution and service (12b-1) fees | | | 1.36 | % |
Net investment income | | | 1.10 | % |
| (a) | Total return is calculated assuming a purchase of shares on the first day and sale on the last day of each year reported, and includes reinvestment of dividends and distributions. |
| (b) | Calculated based upon average shares outstanding during the year. |
See Notes to Financial Statements.
| | |
| 34 | | www.strategicpartners.com |
| | | | | | | | | | | | | | |
| Class Z | |
| Year Ended October 31, | |
| 2003(b) | | | 2002(b) | | | 2001 | | | 2000(b) | |
| | | | | | | | | | | | | | | |
| $ | 14.17 | | | $ | 17.39 | | | $ | 22.15 | | | $ | 22.48 | |
|
|
| |
|
|
| |
|
|
| |
|
|
|
| | | | | | | | | | | | | | | |
| | .18 | | | | .11 | | | | .20 | | | | .25 | |
| | 1.90 | | | | (2.55 | ) | | | (4.05 | ) | | | .71 | |
|
|
| |
|
|
| |
|
|
| |
|
|
|
| | 2.08 | | | | (2.44 | ) | | | (3.85 | ) | | | .96 | |
|
|
| |
|
|
| |
|
|
| |
|
|
|
| | | | | | | | | | | | | | | |
| | (.08 | ) | | | (.03 | ) | | | — | | | | (.22 | ) |
| | — | | | | (.75 | ) | | | (.91 | ) | | | (1.07 | ) |
|
|
| |
|
|
| |
|
|
| |
|
|
|
| | (.08 | ) | | | (.78 | ) | | | (.91 | ) | | | (1.29 | ) |
|
|
| |
|
|
| |
|
|
| |
|
|
|
| $ | 16.17 | | | $ | 14.17 | | | $ | 17.39 | | | $ | 22.15 | |
|
|
| |
|
|
| |
|
|
| |
|
|
|
| | 14.76 | % | | | (14.91 | )% | | | (18.08 | )% | | | 4.24 | % |
| | | | | | | | | | | | | | | |
| $ | 310,521 | | | $ | 269,625 | | | $ | 306,278 | | | $ | 405,340 | |
| $ | 276,808 | | | $ | 308,825 | | | $ | 375,390 | | | $ | 391,289 | |
| | | | | | | | | | | | | | | |
| | 1.47 | % | | | 1.39 | % | | | 1.35 | % | | | 1.27 | % |
| | 1.47 | % | | | 1.39 | % | | | 1.35 | % | | | 1.27 | % |
| | 1.22 | % | | | .68 | % | | | .89 | % | | | 1.09 | % |
See Notes to Financial Statements.
| | |
| Prudential World Funds, Inc./Strategic Partners International Value Fund | | 35 |
Report of Independent Registered Public Accounting Firm
The Board of Directors and Shareholders of
Prudential World Fund, Inc.—Strategic Partners International Value Fund
We have audited the accompanying statement of assets and liabilities of Prudential World Fund, Inc.—Strategic Partners International Value Fund (one of the portfolios constituting Prudential World Fund, Inc., hereafter referred to as the “Fund”), including the portfolio of investments, as of October 31, 2004, and the related statement of operations, the statement of changes in net assets, and the financial highlights for the year then ended. These financial statements and financial highlights are the responsibility of the Fund’s management. Our responsibility is to express an opinion on these financial statements and financial highlights based on our audit. The statement of changes in net assets for the year ended October 31, 2003 and the financial highlights for the periods presented prior to October 31, 2004, were audited by another independent registered public accounting firm, whose report dated, December 22, 2003, expressed an unqualified opinion thereon.
We conducted our audit in accordance with the standards of the Public Company Accounting Oversight Board (United States). Those standards require that we plan and perform the audit to obtain reasonable assurance about whether the financial statements and financial highlights are free of material misstatement. An audit includes examining, on a test basis, evidence supporting the amounts and disclosures in the financial statements. Our procedures included confirmation of securities owned as of October 31, 2004, by correspondence with the custodian. As to securities purchased or sold but not yet received or delivered, we performed other appropriate auditing procedures. An audit also includes assessing the accounting principles used and significant estimates made by management, as well as evaluating the overall financial statement presentation. We believe that our audit provides a reasonable basis for our opinion.
In our opinion, the financial statements and financial highlights referred to above present fairly, in all material respects, the financial position of the Fund as of October 31, 2004, and the results of its operations, the changes in its net assets, and the financial highlights for the year then ended, in conformity with U.S. generally accepted accounting principles.

New York, New York
December 22, 2004
| | |
| 36 | | www.strategicpartners.com |
Federal Income Tax Information
(Unaudited)
We are required by the Internal Revenue Code to advise you within 60 days of the Series fiscal year end, October 31, 2004, as to the federal income tax status of the dividends paid by the Series. The Series paid ordinary income distribution in the amount of $0.14, $0.03, $0.03 and $0.18 per share for Class A, Class B, Class C and Class Z respectively.
Further, we wish to advise you that 9.37% of the ordinary income dividends paid in the fiscal year ended October 31, 2004 qualified for the corporate dividends received deduction available to corporate taxpayers.
The Series has elected to give the benefit of foreign tax credit to its shareholders. Accordingly, shareholders who must report their gross income dividends and distributions in a federal income tax return will be entitled to a foreign tax credit, or an itemized deduction in computing their U.S. income tax liability. It is generally more advantageous to claim a credit rather than take a deduction. For the fiscal year ended October 31, 2004, the Series intends on passing through $1,406,303 of ordinary income distributions as a foreign tax credit from recognized foreign source income of $11,627,352.
The Fund intends to designate 100% of ordinary income dividends, as qualified for the reduced tax rate under The Jobs and Growth Tax Relief Reconciliation Act of 2003.
In January 2005, you will be advised on IRS Form 1099 DIV or substitute 1099 DIV as to the federal tax status of the dividends and distributions received by you in calendar year 2004.
| | |
| Prudential World Funds, Inc./Strategic Partners International Value Fund | | 37 |
Management of the Fund
(Unaudited)
Information pertaining to the Board of Directors is set forth below. Directors who are not deemed to be “interested persons” of the Fund, as defined in the 1940 Act are referred to as “Independent Directors.” Directors who are deemed to be “interested persons” of the Fund are referred to as “Interested Directors.” “Fund Complex”† consists of the Fund and any other investment companies managed by Prudential Investments LLC (“PI” or the Manager).
Independent Directors2
David E.A. Carson (70), Director since 20033 Oversees 97 portfolios in Fund complex
Principal occupations (last 5 years): Director (January 2000 to May 2000), Chairman (January 1999 to December 1999), Chairman and Chief Executive Officer (January 1998 to December 1998) and President, Chairman and Chief Executive Officer of People’s Bank (1983-1997).
Other Directorships held:4 Director of United Illuminating and UIL Holdings (utility company), since 1993.
Robert E. La Blanc (70), Director since 19843 Oversees 100 portfolios in Fund complex
Principal occupations (last 5 years): President (since 1981) of Robert E. La Blanc Associates, Inc. (telecommunications); formerly General Partner at Salomon Brothers and Vice-Chairman of Continental Telecom; Trustee of Manhattan College.
Other Directorships held:4 Director of Chartered Semiconductor Manufacturing, Ltd. (since 1998); Titan Corporation (electronics) (since 1995), Computer Associates International, Inc. (software company); (since 2002) FiberNet Telecom Group, Inc. (telecom company) (since 2003); Director (since April 1999) of the High Yield Plus Fund, Inc.
Douglas H. McCorkindale (65), Director since 20033 Oversees 93 portfolios in Fund complex
Principal occupations (last 5 years): Chairman (since February 2001), Chief Executive Officer (since June 2000) and President (since September 1997) of Gannett Co. Inc. (publishing and media); formerly Vice Chairman (March 1984-May 2000) of Gannett Co., Inc.
Other Directorships held:4 Director of Gannett Co. Inc., Director of Continental Airlines, Inc. (since May 1993); Director of Lockheed Martin Corp. (aerospace and defense) (since May 2001); Director of The High Yield Plus Fund, Inc. (since 1996).
| | |
| 38 | | www.strategicpartners.com |
Richard A. Redeker (61), Director since 20033 Oversees 94 portfolios in Fund complex
Principal occupations (last 5 years): Management Consultant; Director of Invesmart, Inc. (since 2001) and Director of Penn Tank Lines, Inc. (since 1999).
Other Directorships held:4 None.
Robin B. Smith (65), Director since 19963 Oversees 99 portfolios in Fund complex
Principal occupations (last 5 years): Chairman of the Board (since January 2003) of Publishers Clearing House (direct marketing), formerly Chairman and Chief Executive Officer (August 1996-January 2003) of Publishers Clearing House.
Other Directorships held:4 Director of BellSouth Corporation (since 1992).
Stephen Stoneburn (61), Director since 19963 Oversees 97 portfolios in Fund complex
Principal occupations (last 5 years): President and Chief Executive Officer (since June 1996) of Quadrant Media Corp. (a publishing company); formerly President (June 1995-June 1996) of Argus Integrated Media, Inc.; Senior Vice President and Managing Director (January 1993-1995) of Cowles Business Media and Senior Vice President of Fairchild Publications, Inc. (1975-1989).
Other Directorships held:4 None
Clay T. Whitehead (66), Director since 19843 Oversees 98 portfolios in Fund complex
Principal occupations (last 5 years): President (since 1983) of National Exchange Inc. (new business development firm).
Other Directorships held:4 Director (since 2000) of the High Yield Plus Fund, Inc.
Interested Directors1
Judy A. Rice (56), President since 2003 and Director since 20003 Oversees 101 portfolios in Fund complex
Principal occupations (last 5 years): President, Chief Executive Officer, Chief Operating Officer and Officer-in-Charge (since 2003) of PI; Director, Officer-in-Charge, President, Chief Executive Officer and Chief Operating Officer (since May 2003) of American Skandia Advisory Services, Inc. and American Skandia Investment Services, Inc.; Director, Officer-in-Charge, President, Chief Executive Officer (since May 2003) of American Skandia Fund Services, Inc.; Vice President (since February 1999) of Prudential Investment Management Services LLC; President, Chief Executive Officer and Officer-in-Charge (since April 2003) of Prudential Mutual Fund Services LLC; formerly various positions to Senior Vice President (1992-1999) of Prudential Securities Incorporated (Prudential Securities); and various positions to Managing Director (1975-1992) of Salomon Smith Barney; Member of Board of Governors of the Money Management Institute.
Other Directorships held:4 None
Robert F. Gunia (58), Vice President and Director since 19963 Oversees 175 portfolios in Fund complex
Principal occupations (last 5 years): Chief Administrative Officer (since June 1999) of PI; Executive Vice President and Treasurer (since January 1996) of PI; President (since April 1999) of Prudential Investment Management Services LLC (PIMS); Corporate Vice President (since September 1997) of The Prudential Insurance Company of America (Prudential); Director, Executive Vice President and Chief Administrative Officer (since May 2003) of American Skandia Investment Services, Inc., American Skandia Advisory Services, Inc. and American Skandia Fund Services, Inc.; Executive Vice President (since March 1999) and Treasurer (since May 2000) of Prudential Mutual Fund Services LLC; formerly Senior Vice President (March 1987-May 1999) of Prudential Securities.
| | |
| Prudential World Funds, Inc./Strategic Partners International Value Fund | | 39 |
Other Directorships held:4 Vice President and Director (since May 1989) and Treasurer (since 1999) of The Asia Pacific Fund, Inc.
Information pertaining to the Officers of the Fund is set forth below.
Officers2
Jonathan D. Shain (46), Secretary since 20013
Principal occupations (last 5 years): Vice President and Corporate Counsel (since August 1998) of Prudential; Vice President and Assistant Secretary (since May 2003) of American Skandia Investment Services, Inc. and American Skandia Fund Services, Inc.
Grace C. Torres (45), Treasurer and Principal Financial and Accounting Officer since 19953
Principal occupations (last 5 years): Senior Vice President (since January 2000) of PI, Senior Vice President and Assistant Treasurer (since May 2003) of American Skandia Investment Services, Inc. and American Skandia Advisory Services, Inc.; formerly First Vice President (December 1996-January 2000) of PI and First Vice President (March 1993-1999) of Prudential Securities.
Lee D. Augsburger (45), Chief Compliance Officer since 2004
Vice President and Chief Compliance Officer (since May 2003) of PI; Vice President and Chief Compliance Officer (since October 2000) of Prudential Investment Management Inc.; formerly Vice President and Chief Legal Officer-Annuities (August 1999-October 2000) of Prudential Insurance Company of America; Vice President and Corporate Counsel (November 1997-August 1999) of Prudential Insurance Company of America.
William V. Healey (51), Chief Legal Officer since 2004
Vice President and Associate General Counsel (since 1998) of Prudential; Executive Vice President and Chief Legal Officer (since February 1999) of Prudential Investments LLC; Senior Vice President, Chief Legal Officer and Secretary (since December 1998) of Prudential Investment Management Services LLC; Executive Vice President and Chief Legal Officer (since February 1999) of Prudential Mutual Fund Services LLC; Vice President and Secretary (since October 1998) of Prudential Investment Management, Inc.; Executive Vice President and Chief Legal Officer (since May 2003) of American Skandia Investment Services, Inc.; American Skandia Fund Services, Inc. and American Skandia Advisory Services, Inc.; Director (June 1999-June 2002 and June 2003-present) of ICI Mutual Insurance Company; prior to August 1998, Associate General Counsel of the Dreyfus Corporation (Dreyfus), a subsidiary of Mellon Bank, N.A. (Mellon Bank), and an officer and/or director of various affiliates of Mellon Bank and Dreyfus.
Maryanne Ryan (40), Anti-Money Laundering Compliance Officer since 20023
Principal occupations (last 5 years): Vice President, Prudential (since November 1998), First Vice President, Prudential Securities (March 1997-May 1998); Anti-Money Laundering Compliance Officer (since 2003) of American Skandia Investment Services, Inc., American Skandia Advisory Services, Inc. and American Skandia Marketing, Inc.
| † | The Fund Complex consists of all investment companies managed by PI. The Funds for which PI serves as manager include JennisonDryden Mutual Funds, Strategic Partners Funds, The Prudential Variable Contract Accounts 2, 10, 11, The Target Portfolio Trust, The Prudential Series Fund, Inc., American Skandia Trust, and Prudential’s Gibraltar Fund. |
| 1 | “Interested” Director, as defined in the Investment Company Act of 1940 (the 1940 Act), by reason of employment with the Manager, (Prudential Investments LLC or PI), the Subadvisers (Prudential Investment Management, Inc. or PIM), (Bank of Ireland Asset Management (U.S.) Limited or BIAM) or (Jennison Associations LLC or Jennison) or the Distributor (Prudential Investment Management Services LLC or PIMS). |
| | |
| 40 | | www.strategicpartners.com |
| 2 | Unless otherwise noted, the address of the Directors and Officers is c/o: Prudential Investments LLC, Gateway Center Three, 100 Mulberry Street, Newark, NJ 07102. |
| 3 | There is no set term of office for Trustees and Officers. The Independent Directors have adopted a retirement policy, which calls for the retirement of Directors on December 31 of the year in which they reach the age of 75. The table shows the individuals length of service as Trustee and/or Officer. |
| 4 | This column includes only directorships of companies requested to register, or file reports with the SEC under the Securities and Exchange Act of 1934 (that is, “public companies”) or other investment companies registered under the 1940 Act. |
Additional information about the Fund’s Trustees is included in the Fund’s Statement of Additional Information which is available without charge, upon request, by calling (800) 521-7466 or (732) 482-7555 (Calling from outside the U.S.)
| | |
| Prudential World Funds, Inc./Strategic Partners International Value Fund | | 41 |
Growth of a $10,000 Investment
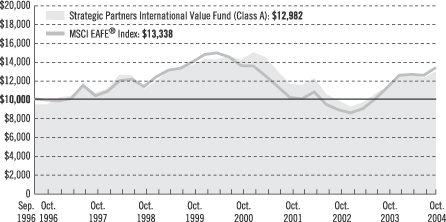
| | | | | | | | | | | | |
| Average Annual Total Returns (With Sales Charges) as of 10/31/04 | |
| | | One Year | | | Five Years | | | Ten Years | | | Since Inception | |
Class A | | 8.46 | % | | –2.18 | % | | N/A | | | 3.27 | % |
Class B | | 8.98 | | | –1.98 | | | N/A | | | 3.21 | |
Class C | | 12.90 | | | –1.80 | | | N/A | | | 3.22 | |
Class Z | | 15.09 | | | –0.82 | | | 4.71 | % | | 7.78 | |
| | | | | | | | | | | | | |
| Average Annual Total Returns (Without Sales Charges) as of 10/31/04 | |
| | | One Year | | | Five Years | | | Ten Years | | | Since Inception | |
Class A | | 14.77 | % | | –1.07 | % | | N/A | | | 3.99 | % |
Class B | | 13.98 | | | –1.81 | | | N/A | | | 3.21 | |
Class C | | 13.90 | | | –1.80 | | | N/A | | | 3.22 | |
Class Z | | 15.09 | | | –0.82 | | | 4.71 | % | | 7.78 | |
Performance data quoted represent past performance. Past performance does not guarantee future results. The investment return and principal value of an investment will fluctuate so that an investor’s shares, when redeemed, may be worth more or less than their original cost. Current performance may be lower or higher than the past performance data quoted. The returns in the graph and the tables do not reflect the deduction of taxes that a shareholder would pay on Fund distributions or following the redemption of Fund shares. An investor may obtain performance data current to the most recent month-end by visiting our website at www.strategicpartners.com or by calling (800) 225-1852. The maximum initial sales charge is 5.50%.
| | |
| Prudential World Funds, Inc./Strategic Partners International Value Fund | | |
Source: Prudential Investments LLC and Lipper Inc. Inception dates: Class A, Class B, and Class C, 9/23/96; and Class Z, 11/5/92.
The graph compares a $10,000 investment in the Strategic Partners International Value Fund (Class A shares) with a similar investment in the MSCI EAFE® Index by portraying the initial account values at the commencement of operations of Class A shares (September 23, 1996) and the account values at the end of the current fiscal year (October 31, 2004) as measured on a quarterly basis. For purposes of the graph, and unless otherwise indicated, it has been assumed that (a) the maximum applicable front-end sales charge was deducted from the initial $10,000 investment in Class A shares; (b) all recurring fees (including management fees) were deducted; and (c) all dividends and distributions were reinvested. The line graph provides information for Class A shares only. As indicated in the tables provided earlier, performance for Class B, Class C, and Class Z shares will vary due to the differing charges and expenses applicable to each share class (as indicated in the following paragraphs). Without a contractual distribution and service (12b-1) fee waiver of 0.05% for Class A shares through October 31, 2004, the returns shown in the graph and for Class A shares in the tables would have been lower.
The MSCI EAFE® is an unmanaged, weighted index of performance that reflects stock price movements of developed-country markets in Europe, Australasia, and the Far East. The MSCI EAFE® Index’s total returns include the reinvestment of all dividends, but do not include the effects of sales charges, operating expenses of a mutual fund, or taxes. These returns would be lower if they included the effects of sales charges, operating expenses, or taxes. The securities that comprise the MSCI EAFE® Index may differ substantially from the securities in the Fund. The MSCI EAFE® Index is not the only index that may be used to characterize performance of international stock funds. Other indexes may portray different comparative performance. Investors cannot invest directly in an index.
Through March 14, 2004, the Fund charged a maximum front-end sales charge of 5.00% for Class A shares and a 12b-1 fee of up to 0.30% annually. Effective March 15, 2004, Class A shares are subject to a maximum front-end sales charge of 5.50%, a 12b-1 fee of up to 0.30% annually, and all investors who purchase Class A shares in an amount of $1 million or more and sell these shares within 12 months of purchase are subject to a contingent deferred sales charge (CDSC) of 1%. Class B shares are subject to a declining CDSC of 5%, 4%, 3%, 2%, 1%, and 1% respectively for the first six years after purchase and a 12b-1 fee of 1% annually. Approximately seven years after purchase, Class B shares will automatically convert to Class A shares on a quarterly basis. Until February 2, 2004, Class C shares were subject to a front-end sales charge of 1%, a CDSC of 1% for shares redeemed within 18 months of purchase, and a 12b-1 fee of 1% annually. Class C shares purchased on or after February 2, 2004, are not subject to a front-end sales charge, but charge a CDSC of 1% for Class C shares sold within 12 months from the date of purchase, and an annual 12b-1 fee of 1%. Class Z shares are not subject to a sales charge or 12b-1 fees. The returns in the graph and tables reflect the share class expense structure in effect at the close of the fiscal period.
| | |
| | | Visit our website at www.strategicpartners.com |
| | | | |
| nMAIL | | nTELEPHONE | | nWEBSITE |
Gateway Center Three 100 Mulberry Street Newark, NJ 07102 | | (800) 225-1852 | | www.strategicpartners.com |
|
| PROXY VOTING |
| The Board of Directors of the Fund has delegated to the Fund’s investment advisers the responsibility for voting any proxies and maintaining proxy recordkeeping with respect to the Fund. A description of these proxy voting policies and procedures is available without charge, upon request, by calling (800) 225-1852 or by visiting the Securities and Exchange Commission’s (the Commission) website at http://www.sec.gov. Information regarding how the Fund voted proxies relating to portfolio securities during the most recent 12-month period ended June 30, 2004, is available on the Fund’s website at http://www.prudential.com and on the Commission’s website at http://www.sec.gov. |
|
| DIRECTORS |
David E.A. Carson • Robert F. Gunia • Robert E. La Blanc • Douglas H. McCorkindale • Richard A. Redeker • Judy A. Rice • Robin B. Smith • Stephen D. Stoneburn • Clay T. Whitehead |
|
| OFFICERS |
Judy A. Rice, President • Robert F. Gunia, Vice President • Grace C. Torres, Treasurer and Principal Financial and Accounting Officer • William V. Healey, Chief Legal Officer •
Jonathan D. Shain, Secretary • Maryanne Ryan, Anti-Money Laundering Compliance Officer • Lee D. Augsburger, Chief Compliance Officer |
| | | | |
| MANAGER | | Prudential Investments LLC | | Gateway Center Three
100 Mulberry Street
Newark, NJ 07102 |
|
| INVESTMENT ADVISER | | Bank of Ireland
Asset Management
(U.S.) Limited | | 75 Holly Hill Lane
Greenwich, CT 06830
|
|
| DISTRIBUTOR | | Prudential Investment
Management Services LLC | | Gateway Center Three
100 Mulberry Street
Newark, NJ 07102 |
|
| CUSTODIAN | | State Street Bank
and Trust Company | | One Heritage Drive
North Quincy, MA 02171 |
|
| TRANSFER AGENT | | Prudential Mutual Fund
Services LLC | | PO Box 8098
Philadelphia, PA 19176 |
|
| INDEPENDENT REGISTERED PUBLIC ACCOUNTING FIRM | | KPMG LLP | | 757 Third Avenue
New York, NY 10017 |
|
| FUND COUNSEL | | Sullivan & Cromwell LLP | | 125 Broad Street
New York, NY 10004 |
| | | | | | | | | | | | |
| Strategic Partners International Value Fund | | | | |
| | | Share Class | | A | | B | | C | | Z | | |
| | | NASDAQ | | PISAX | | PISBX | | PCISX | | PISZX | | |
| | | CUSIP | | 743969503 | | 743969602 | | 743969701 | | 743969800 | | |
| | | | | | | | | | | | | |
|
| An investor should consider the investment objectives, risks, and charges and expenses of the Fund carefully before investing. The prospectus for the Fund contains this and other information about the Fund. An investor may obtain a prospectus by visiting our website at www.strategicpartners.com or by calling (800) 225-1852. The prospectus should be read carefully before investing. |
|
| E-DELIVERY |
To receive your mutual fund documents on-line, go to www.icsdelivery.com/prudential/funds
and enroll. Instead of receiving printed documents by mail, you will receive notification via e-mail when new materials are available. You can cancel your enrollment or change your e-mail
address at any time by clicking on the change/cancel enrollment option at the icsdelivery website address. |
|
| SHAREHOLDER COMMUNICATIONS WITH DIRECTORS |
| Shareholders of the Fund can communicate directly with the Board of Directors by writing to the Chair of the Board, Strategic Partners International Value Fund, PO Box 13964, Philadelphia, PA 19176. Shareholders can communicate directly with an individual Director by writing to that Director at Strategic Partners International Value Fund, PO Box 13964, Philadelphia, PA 19176. Such communications to the Board or individual Directors are not screened before being delivered to the addressee. |
|
| AVAILABILITY OF QUARTERLY PORTFOLIO SCHEDULE |
| The Fund files its complete schedule of portfolio holdings with the Securities and Exchange Commission (the “Commission”) for the first and third quarters of each fiscal year on Form N-Q. The Fund’s Forms N-Q are available on the Commission’s website at http://www.sec.gov. The Fund’s Forms N-Q may also be reviewed and copied at the Commission’s Public Reference Room in Washington, D.C. Information on the operation of the Public Reference Room may be obtained by calling 1-800-SEC-0330. The Fund will provide a full list of its portfolio holdings as of the end of each fiscal quarter on its website at www.strategicpartners.com within 60 days after the end of the fiscal quarter. |
Mutual Funds:
| | | | |
| ARE NOT INSURED BY THE FDIC OR ANY FEDERAL GOVERNMENT AGENCY | | MAY LOSE VALUE | | ARE NOT A DEPOSIT OF OR GUARANTEED BY ANY BANK OR ANY BANK AFFILIATE |

| | | | | | | | | | | | |
| Strategic Partners International Value Fund | | | | | | |
| | | Share Class | | A | | B | | C | | Z | | |
| | | NASDAQ | | PISAX | | PISBX | | PCISX | | PISZX | | |
| | | CUSIP | | 743969503 | | 743969602 | | 743969701 | | 743969800 | | |
| | | | | | | | | | | | | |
MFSP115E IFS-A098923 Ed. 12/2004
Item 2 – Code of Ethics — See Exhibit (a)
As of the end of the period covered by this report, the registrant has adopted a code of ethics (the “Section 406 Standards for Investment Companies – Ethical Standards for Principal Executive and Financial Officers”) that applies to the registrant’s Principal Executive Officer and Principal Financial Officer; the registrant’s Principal Financial Officer also serves as the Principal Accounting Officer.
The registrant hereby undertakes to provide any person, without charge, upon request, a copy of the code of ethics. To request a copy of the code of ethics, contact the registrant 973-802-6469, and ask for a copy of the Section 406 Standards for Investment Companies - Ethical Standards for Principal Executive and Financial Officers.
Item 3 – Audit Committee Financial Expert –
The registrant’s Board has determined that Mr. David Carson, member of the Board’s Audit Committee is an “audit committee financial expert,” and that he is “independent,” for purposes of this Item.
Item 4 – Principal Accountant Fees and Services –
(a) Audit Fees
For the fiscal year ended October 31, 2004, KPMG LLP, the Registrant’s principal accountant, billed the Registrant $66,200 for professional services rendered for the audit of the Registrant’s annual financial statements or services that are normally provided in connection with statutory and regulatory filings. KPMG did not serve as the Registrant’s principal accountant during fiscal year ended October 31, 2003, so no information for that fiscal year is provided.
(b) Audit-Related Fees
None.
(c) Tax Fees
None.
(d) All Other Fees
None.
(e) (1) Audit Committee Pre-Approval Policies and Procedures
THE PRUDENTIAL MUTUAL FUNDS
AUDIT COMMITTEE POLICY
on
Pre-Approval of Services Provided by the Independent Accountants
The Audit Committee of each Prudential Mutual Fund is charged with the responsibility to monitor the independence of the Fund’s independent accountants. As part of this responsibility, the Audit Committee must pre-approve any independent accounting firm’s engagement to render audit and/or permissible non-audit services, as required by law. In evaluating a proposed engagement of the independent accountants, the Audit Committee will assess the effect that the engagement might reasonably be expected to have on the accountant’s independence. The Committee’s evaluation will be based on:
| | • | a review of the nature of the professional services expected to be provided, |
| | • | a review of the safeguards put into place by the accounting firm to safeguard independence, and |
| | • | periodic meetings with the accounting firm. |
Policy for Audit and Non-Audit Services Provided to the Funds
On an annual basis, the scope of audits for each Fund, audit fees and expenses, and audit-related and non-audit services (and fees proposed in respect thereof) proposed to be performed by the Fund’s independent accountants will be presented by the Treasurer and the independent accountants to the Audit Committee for review and, as appropriate, approval prior to the initiation of such services. Such presentation shall be accompanied by confirmation by both the Treasurer and the independent accountants that the proposed services will not adversely affect the independence of the independent accountants. Proposed services shall be described in sufficient detail to enable the Audit Committee to assess the appropriateness of such services and fees, and the compatibility of the provision of such services with the auditor’s independence. The Committee shall receive periodic reports on the progress of the audit and other services which are approved by the Committee or by the Committee Chair pursuant to authority delegated in this Policy.
The categories of services enumerated under “Audit Services”, “Audit-related Services”, and “Tax Services” are intended to provide guidance to the Treasurer and the independent accountants as to those categories of services which the Committee believes are generally consistent with the independence of the independent accountants and which the Committee (or the Committee Chair) would expect upon the presentation of specific proposals to pre-approve. The enumerated categories are not intended as an exclusive list of audit, audit-related or tax services which the Committee (or the Committee Chair) would consider for pre-approval.
Audit Services
The following categories of audit services are considered to be consistent with the role of the Fund’s independent accountants:
| | • | Annual Fund financial statement audits |
| | • | Seed audits (related to new product filings, as required) |
| | • | SEC and regulatory filings and consents |
Audit-related Services
The following categories of audit-related services are considered to be consistent with the role of the Fund’s independent accountants:
| | • | Accounting consultations |
| | • | Fund merger support services |
| | • | Agreed Upon Procedure Reports |
| | • | Other Internal Control Reports |
Individual audit-related services that fall within one of these categories and are not presented to the Audit Committee as part of the annual pre-approval process will be subject to pre-approval by the Committee Chair (or any other Committee member on whom this responsibility has been delegated) so long as the estimated fee for those services does not exceed $50,000.
Tax Services
The following categories of tax services are considered to be consistent with the role of the Fund’s independent accountants:
| | • | Tax compliance services related to the filing or amendment of the following: |
| | • | Federal, state and local income tax compliance; and, |
| | • | Sales and use tax compliance |
| | • | Timely RIC qualification reviews |
| | • | Tax distribution analysis and planning |
| | • | Tax authority examination services |
| | • | Tax appeals support services |
| | • | Accounting methods studies |
| | • | Fund merger support services |
| | • | Tax consulting services and related projects |
Individual tax services that fall within one of these categories and are not presented to the Audit Committee as part of the annual pre-approval process will be subject to pre-approval by the Committee Chair (or any other Committee member on whom this responsibility has been delegated) so long as the estimated fee for those services does not exceed $50,000.
Other Non-audit Services
Certain non-audit services that the independent accountants are legally permitted to render will be subject to pre-approval by the Committee or by one or more Committee members to whom the Committee has delegated this authority and who will report to the full Committee any pre-approval decisions made pursuant to this Policy. Non-audit services presented for pre-approval pursuant to this paragraph will be accompanied by a confirmation from both the Treasurer and the independent accountants that the proposed services will not adversely affect the independence of the independent accountants.
Proscribed Services
The Fund’s independent accountants will not render services in the following categories of non-audit services:
| | • | Bookkeeping or other services related to the accounting records or financial statements of the Fund |
| | • | Financial information systems design and implementation |
| | • | Appraisal or valuation services, fairness opinions, or contribution-in-kind reports |
| | • | Internal audit outsourcing services |
| | • | Management functions or human resources |
| | • | Broker or dealer, investment adviser, or investment banking services |
| | • | Legal services and expert services unrelated to the audit |
| | • | Any other service that the Public Company Accounting Oversight Board determines, by regulation, is impermissible. |
Pre-approval of Non-Audit Services Provided to Other Entities Within the Prudential Fund Complex
Certain non-audit services provided to Prudential Investments LLC or any of its affiliates that also provide ongoing services to the Prudential Mutual Funds will be subject to pre-approval by the Audit Committee. The only non-audit services provided to these entities that will require pre-approval are those related directly to the operations and financial reporting of the Funds. Individual projects that are not presented to the Audit Committee as part of the annual pre-approval process, will be subject to pre-approval by the Committee Chair (or any other Committee member on whom this responsibility has been delegated) so long as the estimated fee for those services does not exceed $50,000. Services presented for pre-approval pursuant to this paragraph will be accompanied by a confirmation from both the Treasurer and the independent accountants that the proposed services will not adversely affect the independence of the independent accountants.
Although the Audit Committee will not pre-approve all services provided to Prudential Investments LLC and its affiliates, the Committee will receive an annual report from the Fund’s independent accounting firm showing the aggregate fees for all services provided to Prudential Investments and its affiliates.
(e) (2) Percentage of services referred to in 4(b)- (4)(d) that were approved by the audit committee –
Not applicable.
(f) Percentage of hours expended attributable to work performed by other than full time employees of principal accountant if greater than 50%.
Not applicable.
(g) Non-Audit Fees
Not applicable to Registrant. The aggregate non-audit fees billed by KPMG for services rendered to the registrant’s investment adviser and any entity controlling, controlled by, or under common control with the investment adviser that provides ongoing services to the registrant for the last fiscal year 2004 was $33,500. KPMG did not serve as the Registrant’s principal accountant during fiscal year 2003, so no information for that fiscal year is provided.
(h) Principal Accountants Independence
Not applicable as KPMG has not provided non-audit services to the registrant’s investment adviser and any entity controlling, controlled by, or under common control with the investment adviser that provides ongoing services to the registrant that were not pre-approved pursuant to Rule 2-01(c)(7)(ii) of Regulation S-X.
Item 5 – Audit Committee of Listed Registrants – Not applicable.
Item 6 – Schedule of Investments – The schedule is included as part of the report to shareholders filed under Item 1 of this Form.
Item 7 – Disclosure of Proxy Voting Policies and Procedures for Closed-End Management Investment Companies – Not applicable.
Item 8 – Purchases of Equity Securities by Closed-End Management Investment Company and Affiliated Purchasers – Not applicable.
Item 9 – Submission of Matters to a Vote of Security Holders:
On September 1, 2004, the Board of Directors adopted the following nominations and communications policy:
Nominating and Governance Committee. The Nominating and Governance Committee of the Board of Directors is responsible for nominating directors and making recommendations to the Board concerning Board composition, committee structure and governance, director education, and governance practices. The Board has determined that each member of the Nominating and Governance Committee is not an “interested person” as defined in the 1940 Act.
The Nominating and Governance Committee Charter is available on the Funds’ website at www.jennisondryden.com.
Selection of Director Nominees. The Nominating and Governance Committee is responsible for considering nominees for directors at such times as it considers electing new members to the Board. The Nominating and Governance Committee may consider recommendations by business and personal contacts of current Board members, and by executive search firms which the Committee may engage from time to time and will also consider shareholder recommendations. The Nominating and Governance Committee has not established specific, minimum qualifications that it believes must be met by a nominee. In evaluating nominees, the Nominating and
Governance Committee considers, among other things, an individual’s background, skills, and experience; whether the individual is an “interested person” as defined in the 1940 Act; and whether the individual would be deemed an “audit committee financial expert” within the meaning of applicable SEC rules. The Nominating and Governance Committee also considers whether the individual’s background, skills, and experience will complement the background, skills, and experience of other nominees and will contribute to the diversity of the Board. There are no differences in the manner in which the Nominating and Governance Committee evaluates nominees for the Board based on whether the nominee is recommended by a shareholder.
A shareholder who wishes to recommend a director nominee should submit his or her recommendation in writing to the Chair of the Board (Robin Smith) or the Chair of the Nominating and Governance Committee (Richard Redeker), in either case at Prudential World Fund, Inc., P.O. Box 13964, Philadelphia, PA 19176. At a minimum, the recommendation should include:
| | • | the name, address, and business, educational, and/or other pertinent background of the person being recommended; |
| | • | a statement concerning whether the person is an “interested person” as defined in the Investment Company Act of 1940; |
| | • | any other information that the Funds would be required to include in a proxy statement concerning the person if he or she was nominated; and |
| | • | the name and address of the person submitting the recommendation, together with the number of Fund shares held by such person and the period for which the shares have been held. |
The recommendation also can include any additional information which the person submitting it believes would assist the Nominating and Governance Committee in evaluating the recommendation.
Shareholders should note that a person who owns securities issued by Prudential Financial, Inc. (the parent company of the Funds’ investment adviser) would be deemed an “interested person” under the 1940 Act. In addition, certain other relationships with Prudential Financial, Inc. or its subsidiaries, with registered broker-dealers, or with the Funds’ outside legal counsel may cause a person to be deemed an “interested person.”
Before the Nominating and Governance Committee decides to nominate an individual to the Board, Committee members and other Board members customarily interview the individual in person. In addition, the individual customarily is asked to complete a detailed questionnaire which is designed to elicit information which must be
disclosed under SEC and stock exchange rules and to determine whether the individual is subject to any statutory disqualification from serving on the board of a registered investment company.
Shareholder Communications with Directors
Shareholders of the Funds can communicate directly with the Board of Directors by writing to the Chair of the Board, Prudential World Fund, Inc., P.O. Box 13964, Philadelphia, PA 19176. Shareholders can communicate directly with an individual Director by writing to that director at Prudential World Fund, Inc., P.O. Box 13964, Philadelphia, PA 19176. Such communications to the Board or individual directors are not screened before being delivered to the addressee.
Item 10 – Controls and Procedures
| | (a) | It is the conclusion of the registrant’s principal executive officer and principal financial officer that the effectiveness of the registrant’s current disclosure controls and procedures (such disclosure controls and procedures having been evaluated within 90 days of the date of this filing) provide reasonable assurance that the information required to be disclosed by the registrant has been recorded, processed, summarized and reported within the time period specified in the Commission’s rules and forms and that the information required to be disclosed by the registrant has been accumulated and communicated to the registrant’s principal executive officer and principal financial officer in order to allow timely decisions regarding required disclosure. |
| | (b) | There have been no significant changes in the registrant’s internal controls or in other factors that could significantly affect these controls subsequent to the date of their evaluation, including any corrective actions with regard to significant deficiencies and material weaknesses. |
Item 11 – Exhibits
| | (a) | Code of Ethics – Attached hereto |
| | (b) | Certifications pursuant to Section 302 and 906 of the Sarbanes-Oxley Act – Attached hereto |
SIGNATURES
Pursuant to the requirements of the Securities Exchange Act of 1934 and the Investment Company Act of 1940, the registrant has duly caused this report to be signed on its behalf by the undersigned, thereunto duly authorized.
| | |
| (Registrant) Prudential World Fund, Inc. |
| |
| By (Signature and Title)* | | /s/ JONATHAN D. SHAIN |
| | | Jonathan D. Shain |
| | | Secretary |
Date December 21, 2004
Pursuant to the requirements of the Securities Exchange Act of 1934 and the Investment Company Act of 1940, this report has been signed below by the following persons on behalf of the registrant and in the capacities and on the dates indicated.
| | |
| |
| By (Signature and Title)* | | /s/ JUDY A. RICE |
| | | Judy A. Rice |
| | | President and Principal Executive Officer |
Date December 21, 2004
| | |
| |
| By (Signature and Title)* | | /s/ GRACE C. TORRES |
| | | Grace C. Torres |
| | | Treasurer and Principal Financial Officer |
Date December 21, 2004
| * | Print the name and title of each signing officer under his or her signature. |