| | OMB APPROVAL |
| | OMB Number: | 3235-0570 |
| | Expires: | November 30, 2005 |
| UNITED STATES | Estimated average burden hours per response. . . . . . . . . . . . . . . . .5.0 |
| SECURITIES AND EXCHANGE COMMISSION | |
| Washington, D.C. 20549 | |
| | | | |
FORM N-CSR
CERTIFIED SHAREHOLDER REPORT OF REGISTERED
MANAGEMENT INVESTMENT COMPANIES
Investment Company Act file number | 811-03980 |
|
Morgan Stanley Institutional Fund Trust |
(Exact name of registrant as specified in charter) |
|
522 FIFTH AVENUE NEW YORK, NY | | 10036 |
(Address of principal executive offices) | | (Zip code) |
|
RONALD E. ROBISON 522 FIFTH AVENUE NEW YORK, NY 10036 |
(Name and address of agent for service) |
|
Registrant’s telephone number, including area code: | 1-800-221-6726 | |
|
Date of fiscal year end: | 9/30 | |
|
Date of reporting period: | 9/30/07 | |
| | | | | | | | |
Form N-CSR is to be used by management investment companies to file reports with the Commission not later than 10 days after the transmission to stockholders of any report that is required to be transmitted to stockholders under Rule 30e-1 under the Investment Company Act of 1940 (17 CFR 270.30e-1). The Commission may use the information provided on Form N-CSR in its regulatory, disclosure review, inspection, and policymaking roles.
A registrant is required to disclose the information specified by Form N-CSR, and the Commission will make this information public. A registrant is not required to respond to the collection of information contained in Form N-CSR unless the Form displays a currently valid Office of Management and Budget (“OMB”) control number. Please direct comments concerning the accuracy of the information collection burden estimate and any suggestions for reducing the burden to Secretary, Securities and Exchange Commission, 450 Fifth Street, NW, Washington, DC 20549-0609. The OMB has reviewed this collection of information under the clearance requirements of 44 U.S.C. Section 3507.
ITEM 1. REPORTS TO STOCKHOLDERS.
The Fund’s annual report transmitted to shareholders pursuant to Rule 30e-1 under the Investment Company Act of 1940 is as follows:
Morgan Stanley Investment Management

Morgan Stanley
Institutional Fund Trust
Advisory Portfolios
Advisory
Advisory Global Fixed Income
Advisory Global Fixed Income II
September 30, 2007
Annual Report
| 2007 Annual Report |
| |
| September 30, 2007 |
Table of Contents
Shareholders’ Letter | | 2 |
Investment Advisory Agreement Approval | | 3 |
Investment Overviews & Portfolios of Investments | | |
Advisory Portfolios: | | |
Advisory | | 6 |
Advisory Global Fixed Income | | 15 |
Advisory Global Fixed Income II | | 18 |
| | |
Statements of Assets and Liabilities | | 21 |
Statements of Operations | | 22 |
Statements of Changes in Net Assets | | 23 |
Statement of Cash Flows | | 24 |
Financial Highlights | | 25 |
Notes to Financial Statements | | 28 |
Report of Independent Registered Public Accounting Firm | | 35 |
Federal Income Tax Information | | 36 |
U.S. Privacy Policy | | 37 |
Trustee and Officer Information | | 39 |
This report is authorized for distribution only when preceded or accompanied by prospectuses of the Morgan Stanley Institutional Fund Trust. To receive a prospectus and/or SAI, which contains more complete information such as investment objectives, charges, expenses, policies for voting proxies, risk considerations, and describes in detail each of the Portfolio’s investment policies to the prospective investor, please call 1 (800) 548-7786. Please read the prospectus carefully before you invest or send money. Market forecasts provided in this report may not necessarily come to pass. There is no guarantee that any sectors mentioned will continue to perform as discussed herein or that securities in such sectors will be held by the Fund in the future. There is no assurance that the Fund will achieve its investment objective. The Fund is subject to market risk, which is the possibility that market values of securities owned by the Fund will decline and, therefore, the value of the Fund’s shares may be less than what you paid for them. Accordingly, you can lose money investing in this Fund. Please see the prospectus for more complete information on investment risks.
1
2007 Annual Report
September 30, 2007
Shareholders’ Letter
Dear Shareholders:
We are pleased to present to you the Morgan Stanley Institutional Fund Trust’s (the “Fund”) Annual Report for the year ended September 30, 2007. Our Fund currently consists of 18 portfolios. The Fund’s portfolios, together with the portfolios of the Morgan Stanley Institutional Fund, Inc., provide investors with a means to help them meet specific investment needs and to allocate their investments among equities (e.g., value and growth; small, medium, and large capitalization), and fixed income (e.g., short, medium, and long duration; investment grade and high yield).
Sincerely,

Ronald E. Robison
President and Principal Executive Officer
October 2007
2
| 2007 Annual Report |
| |
| September 30, 2007 |
Investment Advisory Agreement Approval (unaudited)
ADVISORY PORTFOLIOS
The Board considered the following with respect to each Portfolio:
Nature, Extent and Quality of Services
The Board reviewed and considered the nature and extent of the investment advisory services provided by the Investment Adviser under the Advisory Agreement, including portfolio management, investment research and fixed income securities trading. The Board also reviewed and considered the nature and extent of the non-advisory, administrative services provided by the Portfolios’ Administrator under the Administration Agreement, including accounting, clerical, bookkeeping, compliance, business management and planning, and the provision of supplies, office space and utilities at the Investment Adviser’s expense. (The Investment Adviser and Administrator together are referred to as the “Adviser” and the Advisory and Administration Agreements together are referred to as the “Management Agreement.”) The Board also compared the nature of the services provided by the Adviser with similar services provided by non-affiliated advisers as reported to the Board by Lipper Inc. (“Lipper”).
The Board reviewed and considered the qualifications of the portfolio managers, the senior administrative managers and other key personnel of the Adviser who provide the advisory and administrative services to the Portfolios. The Board determined that the Adviser’s portfolio managers and key personnel are well qualified by education and/or training and experience to perform the services in an efficient and professional manner. The Board concluded that the nature and extent of the advisory and administrative services provided were necessary and appropriate for the conduct of the business and investment activities of each Portfolio. The Board also concluded that the overall quality of the advisory and administrative services provided was satisfactory.
Performance Relative to Comparable Funds Managed by Other Advisers
On a regular basis, the Board reviews the performance of all funds in the Morgan Stanley Fund Complex, including the Portfolios, compared to their peers, paying specific attention to the underperforming funds. In addition, the Board specifically reviewed each Portfolio’s performance for the one-, three- and five-year periods ended November 30, 2006, as shown in reports provided by Lipper (the “Lipper Reports”), compared to the performance of comparable funds selected by Lipper (the “performance peer group”) for each Portfolio. The Board also discussed with the Adviser the performance goals and the actual results achieved in managing each Portfolio. When a fund underperforms its performance peer group, the Board discusses with the Adviser the causes of the underperformance and, where necessary, specific changes to the fund’s investment strategy and/or investment personnel.
With respect to the Advisory Portfolio, the Board reviewed a separate account attribution analysis provided by the Adviser in addition to the Portfolio’s Lipper Report. The Board concluded that the performance of the Portfolio was acceptable based upon its review of the separate account attribution analysis and considering market conditions during the period.
With respect to the Advisory Global Fixed Income Portfolio, the Board reviewed a separate account attribution analysis provided by the Adviser in addition to the Portfolio’s Lipper Report. The Board concluded that the Portfolio’s performance was acceptable based upon its review of the separate account attribution analysis.
With respect to the Advisory Global Fixed Income II Portfolio, the Board concluded that the Portfolio’s performance was acceptable.
Fees Relative to Other Proprietary Funds Managed by the Adviser with Comparable Investment Strategies
The Board reviewed the advisory and administrative fee (together, the “management fee”) rate paid by each Portfolio under the Management Agreement. The Board noted that the Adviser did not manage any other proprietary funds with investment strategies comparable to those of the Portfolios.
3
2007 Annual Report
September 30, 2007
Investment Advisory Agreement Approval (cont’d)
Fees and Expenses Relative to Comparable Funds Managed by Other Advisers
The Board reviewed the management fee rate and total expense ratio of each Portfolio as compared to the expense peer group. The Board concluded that each Portfolio’s management fee rate and total expense ratio were competitive with those of its expense peer group.
Breakpoints and Economies of Scale
The Board reviewed the structure of each Portfolio’s management fee schedule under the Management Agreement. With respect to the Advisory Global Fixed Income and Advisory Global Fixed Income II Portfolios, the Board noted that the Portfolios’ management fee schedules do not include any breakpoints. The Board considered that the Portfolios’ assets under management were relatively small. The Board concluded that economies of scale for the Portfolios were not a factor that needed to be considered at the present time.
With respect to the Advisory Portfolio, the Board noted that the Portfolios management fee schedules do not include any breakpoints. The Board also reviewed the level of the Portfolio’s management fee and concluded that the fee, compared to the Portfolio’s expense peer group, was sufficiently low, so that, in effect, economies of scale were built into each management fee structure.
Profitability of the Adviser and Affiliates
The Board considered information concerning the costs incurred and profits realized by the Adviser and affiliates during the last year from their relationship with each Portfolio and during the last two years from their relationship with the Morgan Stanley Fund Complex and reviewed with the Adviser the cost allocation methodology used to determine the profitability of the Adviser and affiliates. Based on its review of the information it received, the Board concluded that the profits earned by the Adviser and affiliates were not excessive in light of the advisory, administrative and other services provided to the Portfolios.
Fall-Out Benefits
The Board considered so-called “fall-out benefits” derived by the Adviser and affiliates from their relationship with each Portfolio and the Morgan Stanley Fund Complex. The Board considered the “float” benefits derived from handling of checks for purchases and sales of Portfolio shares, through a broker-dealer affiliate of the Adviser. The Board also considered that a brokerdealer affiliate of the Adviser receives from each Portfolio 12b-1 fees for distribution and shareholder services. The Board concluded that the float benefits were relatively small and the 12b-1 fees were competitive with those of other broker-dealers.
Soft Dollar Benefits
The Board considered whether the Adviser realizes any benefits as a result of brokerage transactions executed through “soft dollar” arrangements. Under such arrangements, brokerage commissions paid by the Portfolios and/or other funds managed by the Adviser would be used to pay for research that a securities broker obtains from third parties, or to pay for both research and execution services from securities brokers who effect transactions for the Portfolios. The Board noted that the Portfolios invest only in fixed income securities, which do not generate soft dollars.
Adviser Financially Sound and Financially Capable of Meeting the Portfolios’ Needs
The Board considered whether the Adviser is financially sound and has the resources necessary to perform its obligations under the Management Agreement. The Board concluded that the Adviser has the financial resources necessary to fulfill its obligations under the Management Agreement.
4
| 2007 Annual Report |
| |
| September 30, 2007 |
Investment Advisory Agreement Approval (cont’d)
Historical Relationship Between the Portfolios and the Adviser
The Board also reviewed and considered the historical relationship between each Portfolio and the Adviser, including the organizational structure of the Adviser, the policies and procedures formulated and adopted by the Adviser for managing the Portfolios’ operations and the Board’s confidence in the competence and integrity of the senior managers and key personnel of the Adviser. The Board concluded that it is beneficial for each Portfolio to continue its relationship with the Adviser.
Other Factors and Current Trends
The Board considered the controls and procedures adopted and implemented by the Adviser and monitored by the Fund’s Chief Compliance Officer and concluded that the conduct of business by the Adviser indicates a good faith effort on its part to adhere to high ethical standards in the conduct of each Portfolio’s business.
General Conclusion
On April 25, 2007, after considering and weighing all of the above factors, the Board concluded that it would be in the best interest of each Portfolio and its shareholders to approve renewal of the Management Agreement for another year until April 30, 2008. On June 20, 2007, the Board again considered and weighed all of the above factors and concluded that it would be in the best interest of each Portfolio and its shareholders to approve renewal of the Management Agreement to continue until June 30, 2008.
5
2007 Annual Report
September 30, 2007
Investment Overview (unaudited)
Advisory Portfolio
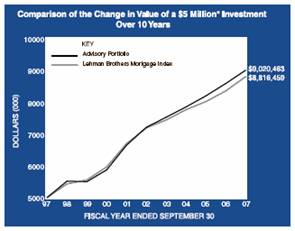
The Advisory Portfolio seeks returns consistent with returns generated by the market for mortgage securities. The Portfolio invests primarily in investment grade mortgage securities of the U.S. government and private issuers, and in mortgage derivatives. The Portfolio also invests in other U.S. government securities and investment grade fixed income securities. The Portfolio will ordinarily seek to maintain an average weighted maturity in excess of seven years, although there is no minimum or maximum maturity for any individual security. The Portfolio may invest in asset-backed securities and may use futures, options, forwards, collateralized mortgage obligations (“CMOs”), swaps, options on swaps and other derivatives. The Portfolio may also invest in to-be-announced pass-through mortgage securities, which settle on a delayed delivery basis (“TBAs”). Federal Home Loan Mortgage Corp., Federal National Mortgage Association, and Federal Home Loan Banks, although chartered and sponsored by Congress, are not funded by congressional appropriations and securities issued by them are neither guaranteed nor insured by the U.S. government.
Performance
For the fiscal year ended September 30, 2007, the Portfolio had a total return based on net asset value and reinvestment of distributions per share of 4.88%, net of fees. The Portfolio underperformed against its benchmark the Lehman Brothers Mortgage Index (the “Index”) which returned 5.39%.
Factors Affecting Performance
• | | Fears stemming from a residential housing downturn persisted throughout the 12-month period. Confronted with increasing delinquency rates on subprime loans, high-profile hedge fund collapses, and a series of subprime mortgage related credit downgrades, markets responded severely in the latter months of the reporting period. The impact was exacerbated by an influx of forced sellers looking to liquidate assets to help meet margin calls and capital withdrawals, which fueled concerns about the potential impact on the broader financial markets and economy and led to a flight to quality. |
| | |
• | | In August, the Federal Open Market Committee (the “Fed”) lowered the discount rate by half a percentage point, from 6.25% to 5.75%, and began encouraging member banks to make greater use of the discount window. In September, the Fed cut the discount rate another 50 basis points and elected to cut the target federal funds rate by 50 basis points as well, to 4.75%. At that time, the Fed noted that while economic growth remained moderate, inflation risks remained and “the tightening of credit conditions has the potential to intensify the housing correction and to restrain economic growth”. |
| | |
• | | U.S. Treasury yields fluctuated throughout the 12-month period, with the yield curve beginning the period relatively flat and ending the period steep. As the yield curve steepened, shorter U.S. Treasury yields experienced the greatest decline, while longer yields rose slightly. |
| | |
• | | The mortgage market was hit by the turmoil affecting residential housing, and especially by its spillover effects on secondary market activity, most notably in the non-agency mortgage area. This cast a pall across the entire sector with little regard for whether the securities or loans in question were subprime or prime. The result was a further reduction in mortgage market liquidity, as well as a sharp reduction in the availability of non-conforming mortgage loans to the general public. |
| | |
• | | Although the Portfolio maintained an underweight to agency mortgage-backed securities, holdings here detracted from returns as the recent turmoil in the mortgage market and drying up of liquidity hurt the performance of the sector. |
| | |
• | | A relative overweight to U.S. Treasuries was additive to performance as the sector outperformed all other areas of the fixed income market in the latter months of there porting period. |
Management Strategies
• | | Agency spreads remained unattractive in our view, leading us to maintain a below-index exposure to the sector. Within the sector, we favored high-coupon, slow-prepaying issues. We also favored non-agency mortgages issued to high-quality borrowers. |
| | |
• | | Throughout the course of the period, we maintained a relative overweight to U.S. Treasury securities, due to the relative underweight to mortgage backed securities. Mortgage spreads remain tight to Treasuries, meaning that in most cases, investors are not adequately compensated for the added risks inherent in mortgage backed securities. Additionally, implied interest-rate volatility remains quite low, suggesting that this is not a good time to “write” or “sell” options (a mortgage investor is implicitly short a call option to the homeowner). With yield spreads and implied volatility at such unattractive levels, we believe it is prudent to maintain below-benchmark sensitivity to the sector. |
6
| 2007 Annual Report |
| |
| September 30, 2007 |
Investment Overview (cont’d)
Advisory Portfolio
* Minimum Investment
In accordance with SEC regulations, Portfolio performance shown assumes that all recurring fees (including management fees) were deducted and all dividends and distributions were reinvested.
Performance Compared to the Lehman Brothers Mortgage Index(1)
| | Total Returns(2) | |
| | | | Average Annual | |
| | One
Year | | Five
Years | | Ten
Years | | Since
Inception(4) | |
| | | | | | | | | |
Portfolio(3) | | 4.88 | % | 4.56 | % | 6.08 | % | 6.77 | % |
Lehman Brothers Mortgage Index | | 5.39 | | 4.14 | | 5.84 | | 6.47 | |
Performance data quoted represents past performance, which is no guarantee of future results, and current performance may be lower or higher than the figures shown. Performance assumes that all dividends and distributions, if any, were reinvested. For the most recent month-end performance figures, please call 1(800) 548-7786. Investment return and principal value will fluctuate so that Portfolio shares, when redeemed, may be worth more or less than their original cost. Total returns do not reflect the deduction of taxes that a shareholder would pay on Portfolio distributions or the redemption of Portfolio shares.
(1) | | The Lehman Brothers Mortgage Index includes GNMA, FNMA and FHLMC pass-through securities with original maturities of 15, 20, and 30 years, as well as balloon mortgages. The Index is formed by grouping the universe of over 600,000 individual fixed rate MBS pools into approximately 3,500 generic aggregates. These aggregates are defined according to agency, program, pass-through coupon and origination year. Index maturity and liquidity criteria are then applied to these aggregates to determine which qualify for inclusion in the Index. The Index excludes buy down, graduated equity mortgages, project loans, ARMS, non-agency mortgages and CMOs. The Index is unmanaged and its returns do not include any sales charges or fees. Such costs would lower performance. It is not possible to invest directly in an index. |
(2) | | Total returns for the Portfolio reflect expenses waived and/or reimbursed, if applicable, by the Adviser. Without such waivers and/or reimbursements, total returns would have been lower. Fee waivers and/or reimbursements are voluntary and the Adviser reserves the right to commence or terminate any waiver and/or reimbursement at any time. |
(3) | | Commenced operations on April 12, 1995. |
(4) | | For comparative purposes, average annual since inception returns listed for the Index refer to the inception date or initial offering of the Portfolio, not the inception of the Index. |
Expense Example
As a shareholder of the Portfolio, you incur ongoing costs, including management fees and other Portfolio expenses. This example is intended to help you understand your ongoing costs (in dollars) of investing in the Portfolio and to compare these costs with the ongoing costs of investing in other mutual funds.
The example is based on an investment of $1,000 invested at the beginning of the six-month period ended September 30, 2007 and held for the entire six-month period.
Actual Expenses
The first line of the table below provides information about actual account values and actual expenses. You may use the information in this line, together with the amount you invested, to estimate the expenses that you paid over the period. Simply divide your account value by $1,000 (for example, an $8,600 account value divided by $1,000 = 8.6), then multiply the result by the number in the first line under the heading entitled “Expenses Paid During Period” to estimate the expenses you paid on your account during this period.
Please note that “Expenses Paid During Period” are grossed up to reflect Portfolio expenses prior to the effect of Expense Offset (See Note E in the Notes to Financial Statements). Therefore, the annualized net expense ratios may differ from the ratio of expenses to average net assets shown in the Financial Highlights.
Hypothetical Example for Comparison Purposes
The second line of the table below provides information about hypothetical account values and hypothetical expenses based on the Portfolio’s actual expense ratio and an assumed rate of return of 5% per year before expenses, which is not the Portfolio’s actual return. The hypothetical account values and expenses may not be used to estimate the actual ending account balance or expenses you paid for the period. You may use this information to compare the ongoing costs of investing
7
2007 Annual Report
September 30, 2007
Investment Overview (cont’d)
Advisory Portfolio
in the Portfolio and other funds. To do so, compare this 5% hypothetical example with the 5% hypothetical examples that appear in the shareholder reports of the other funds.
| | | | | | Expenses Paid | |
| | | | Ending Account | | During Period* | |
| | Beginning | | Value | | April 1, 2007 — | |
| | Account Value | | September 30, | | September 30, | |
| | April 1, 2007 | | 2007 | | 2007 | |
| | | | | | | |
Actual | | $ | 1,000.00 | | $ | 1,018.50 | | $ | 0.35 | |
Hypothetical (5% average annual return before expenses) | | 1,000.00 | | 1,024.72 | | 0.36 | |
| | | | | | | | | | |
* | | Expenses are equal to the Portfolio’s annualized net expense ratio of 0.07%, multiplied by the average account value over the period, multiplied by 183/365 (to reflect the one-half year period). |
Graphic Presentation of Portfolio Holdings
The following graph depicts the Portfolio’s holdings by investment type, as a percentage of total investments.
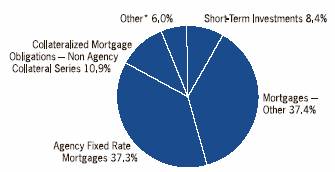
* | | Investment types which do not appear in the above graph, as well as those which represent less than 5% of total investments, if applicable, are included in the category labeled “Other”. |
8
| 2007 Annual Report |
| |
| September 30, 2007 |
Portfolio of Investments
Advisory Portfolio
| | Face | | | |
| | Amount | | Value | |
| | (000) | | (000) | |
Fixed Income Securities (119.0%) | | | | | |
Agency Adjustable Rate Mortgages (5.6%) | | | | | |
Federal Home Loan Mortgage Corp., | | | | | |
3.53%, 5/1/34 | | $ | 1,999 | | $ | 1,989 | |
5.59%, 11/1/36 | | 10,631 | | 10,685 | |
5.63%, 4/1/37 | | 30,350 | | 30,589 | |
5.78%, 1/1/37 | | 17,839 | | 17,967 | |
5.97%, 1/1/37 | | 12,424 | | 12,589 | |
Federal National Mortgage Association, | | | | | |
4.88%, 5/1/35 | | 3,844 | | 3,815 | |
4.98%, 3/1/37 | | 4,900 | | 4,877 | |
5.60%, 6/1/34 | | 21 | | 21 | |
5.81%, 5/1/37 | | 14,917 | | 15,079 | |
5.99%, 4/1/37 | | 27,366 | | 27,742 | |
7.39%, 4/1/36 | | 25,603 | | 26,191 | |
Government National Mortgage Association, | | | | | |
5.75%, 7/20/25 - 9/20/27 | | 3,527 | | 3,562 | |
6.13%, 10/20/25 - 12/20/27 | | 4,864 | | 4,916 | |
6.38%, 5/20/24 - 2/20/28 | | 21,396 | | 21,638 | |
| | | | 181,660 | |
Agency Fixed Rate Mortgages (48.7%) | | | | | |
Federal Home Loan Mortgage Corp., | | | | | |
Conventional Pools: | | | | | |
8.00%, 4/1/08 - 7/1/08 | | 1 | | 1 | |
8.75%, 4/1/08 | | @— | | @— | |
9.00%, 10/1/16 | | 19 | | 20 | |
9.50%, 10/1/16 - 3/1/20 | | 839 | | 914 | |
10.00%, 1/1/09 - 12/1/20 | | 1,980 | | 2,194 | |
10.25%, 1/1/09 - 12/1/11 | | 11 | | 12 | |
10.50%, 11/1/08 - 12/1/20 | | 905 | | 991 | |
11.00%, 2/1/11 - 9/1/20 | | 589 | | 653 | |
11.25%, 6/1/10 - 12/1/15 | | 9 | | 9 | |
11.50%, 12/1/09 - 9/1/19 | | 368 | | 401 | |
11.75%, 8/1/14 - 4/1/15 | | 33 | | 37 | |
12.00%, 10/1/09 - 7/1/20 | | 415 | | 465 | |
12.50%, 10/1/09 - 6/1/15 | | 31 | | 35 | |
13.00%, 9/1/10 - 11/1/13 | | 1 | | 2 | |
13.50%, 2/1/10 | | 1 | | 1 | |
Gold Pools: | | | | | |
6.00%, 10/1/28 - 12/1/28 | | 479 | | 482 | |
6.50%, 5/1/21 - 11/1/33 | | 5,257 | | 5,383 | |
7.00%, 12/1/26 - 11/1/32 | | 15,010 | | 15,574 | |
7.50%, 2/1/23 - 1/1/34 | | 31,184 | | 32,613 | |
8.00%, 5/1/20 - 12/1/31 | | 14,250 | | 15,106 | |
8.50%, 10/1/10 - 7/1/31 | | 33,861 | | 36,309 | |
9.00%, 10/1/17 - 1/1/31 | | 2,930 | | 3,168 | |
9.50%, 11/1/16 - 12/1/22 | | 1,185 | | 1,291 | |
10.00%, 6/1/17 - 4/1/25 | | 764 | | 844 | |
10.50%, 7/1/19 - 3/1/21 | | 310 | | 350 | |
11.00%, 7/1/17 - 9/1/20 | | 188 | | 202 | |
11.50%, 1/1/16 - 6/1/20 | | 105 | | 116 | |
12.00%, 6/1/20 | | 254 | | 270 | |
12.50%, 7/1/19 | | 7 | | 8 | |
November TBA | | | | | |
6.50%, 11/15/31 | | $ | (i)56,900 | | $ | 57,869 | |
Federal National Mortgage Association, | | | | | |
Conventional Pools: | | | | | |
4.50%, 8/1/18 | | 337 | | 326 | |
5.50%, 3/1/17 | | 351 | | 351 | |
6.00%, 4/1/13 - 1/1/29 | | 455 | | 461 | |
6.50%, 6/1/15 - 3/1/34 | | 56,543 | | 57,952 | |
7.00%, 12/1/12 - 4/1/36 | | 93,918 | | 97,748 | |
7.50%, 10/1/12 - 7/1/36 | | 78,461 | | 81,924 | |
8.00%, 10/1/07 - 4/1/33 | | 50,295 | | 53,039 | |
8.50%, 12/1/08 - 5/1/32 | | 45,595 | | 49,015 | |
9.00%, 6/1/18 - 4/1/26 | | 1,151 | | 1,243 | |
9.50%, 7/1/16 - 4/1/30 | | 5,995 | | 6,544 | |
10.00%, 9/1/10 - 11/1/25 | | 5,462 | | 6,115 | |
10.50%, 10/1/11 - 6/1/27 | | 1,586 | | 1,775 | |
10.75%, 10/1/11 | | 5 | | 5 | |
11.00%, 10/1/13 - 7/1/25 | | 351 | | 392 | |
11.50%, 9/1/11 - 8/1/25 | | 773 | | 851 | |
12.00%, 1/1/13 - 5/1/20 | | 286 | | 314 | |
12.50%, 2/1/11 - 9/1/15 | | 405 | | 457 | |
October TBA | | | | | |
5.50%, 10/25/37 | | (i)139,000 | | 136,155 | |
6.50%, 10/25/37 | | (i)47,300 | | 48,165 | |
7.00%, 10/25/37 | | (i)31,700 | | 32,720 | |
November TBA | | | | | |
5.00%, 11/25/37 | | (i)297,000 | | 283,217 | |
5.50%, 11/25/37 | | (i)437,750 | | 428,516 | |
7.00%, 11/25/37 | | (i)17,325 | | 17,866 | |
Government National Mortgage Association, | | | | | |
Various Pools: | | | | | |
5.50%, 12/15/32 | | 29 | | 29 | |
6.50%, 10/15/10 | | 21 | | 21 | |
7.00%, 7/15/31 | | 145 | | 152 | |
8.50%, 7/15/08 - 3/15/20 | | 1,602 | | 1,719 | |
9.00%, 11/15/16 - 11/15/24 | | 9,105 | | 9,794 | |
9.50%, 7/15/09 - 10/15/24 | | 21,450 | | 23,311 | |
10.00%, 11/15/09 - 2/15/26 | | 32,626 | | 36,941 | |
10.50%, 4/15/13 - 4/15/25 | | 7,182 | | 8,188 | |
11.00%, 12/15/09 - 4/15/21 | | 8,802 | | 9,839 | |
11.50%, 3/15/10 - 11/15/19 | | 589 | | 663 | |
12.00%, 11/15/12 - 5/15/16 | | 1,208 | | 1,378 | |
12.50%, 5/15/10 - 4/15/19 | | 90 | | 102 | |
13.00%, 1/15/11 - 10/15/13 | | 36 | | 41 | |
13.50%, 5/15/10 - 5/15/13 | | 36 | | 41 | |
| | | | 1,572,690 | |
Asset Backed Corporate (0.0%) | | | | | |
Bear Stearns Asset Backed Securities, Inc., | | | | | |
5.33%, 9/25/34 | | (h)75 | | 75 | |
Collateralized Mortgage Obligations — Agency Collateral Series (1.5%) | | | | | |
Federal Home Loan Mortgage Corp., | | | | | |
Inv Fl IO | | | | | |
0.25%, 3/15/24 | | 37,502 | | 1,429 | |
2.20%, 3/15/32 | | 168 | | 15 | |
2.25%, 6/15/28 - 3/15/32 | | 3,739 | | 131 | |
The accompanying notes are an integral part of the financial statements. |
9
2007 Annual Report
September 30, 2007
Portfolio of Investments (cont’d)
Advisory Portfolio
| | Face | | | |
| | Amount | | Value | |
| | (000) | | (000) | |
Collateralized Mortgage Obligations — Agency Collateral Series (cont’d) | | | | | |
2.75%, 9/15/30 | | $ | 2,097 | | $ | 181 | |
3.27%, 12/15/23 | | 3,121 | | 399 | |
18.50%, 11/15/07 | | 1 | | @— | |
Inv Fl IO PAC | | | | | |
3.85%, 3/15/08 | | 21 | | @— | |
4.97%, 2/15/08 | | 45 | | @— | |
Inv Fl IO REMIC | | | | | |
1.75%, 8/15/30 | | 78 | | 5 | |
IO | | | | | |
1.25%, 6/17/27 | | 170 | | 11 | |
5.00%, 6/15/17 | | 319 | | 35 | |
5.50%, 1/15/29 - 8/15/30 | | 10,425 | | 761 | |
6.00%, 5/1/31 | | 1,274 | | 289 | |
6.50%, 4/1/28 - 5/15/33 | | 2,090 | | 480 | |
7.00%, 9/1/30 - 3/1/32 | | 4,701 | | 1,255 | |
7.50%, 4/1/28 - 9/1/30 | | 2,505 | | 778 | |
8.00%, 10/15/12 - 6/1/31 | | 7,789 | | 1,932 | |
IO PAC | | | | | |
1.00%, 2/15/27 | | 4,602 | | 76 | |
6.00%, 4/15/32 | | 347 | | 42 | |
7.00%, 9/15/27 | | 56 | | 15 | |
IO REMIC | | | | | |
10.00%, 5/1/20 - 6/1/20 | | 68 | | 13 | |
PAC | | | | | |
8.55%, 1/15/21 | | 33 | | 34 | |
9.50%, 4/15/20 | | 125 | | 132 | |
9.60%, 4/15/20 | | 121 | | 134 | |
9.90%, 10/15/19 | | 578 | | 615 | |
10.00%, 5/15/20 - 6/15/20 | | 546 | | 582 | |
Federal National Mortgage Association, | | | | | |
Inv Fl IO | | | | | |
1.27%, 7/25/34 | | 27,381 | | 1,309 | |
1.80%, 2/17/31 | | 516 | | 28 | |
2.38%, 7/18/27 | | 844 | | 51 | |
2.89%, 11/18/30 | | 1,332 | | 109 | |
2.94%, 10/18/30 | | 352 | | 24 | |
3.07%, 10/25/28 | | 2,721 | | 120 | |
3.37%, 7/25/30 - 8/25/30 | | 2,363 | | 168 | |
3.47%, 10/25/29 | | 479 | | 15 | |
3.97%, 10/25/07 | | 8 | | @— | |
5.56%, 12/25/08 | | 17 | | 17 | |
Inv Fl IO REMIC | | | | | |
31.94%, 9/25/20 | | 157 | | 262 | |
36.84%, 9/25/22 | | 237 | | 279 | |
IO | | | | | |
5.00%, 2/25/15 | | 305 | | 6 | |
5.50%, 3/25/17 | | 338 | | 25 | |
6.00%, 8/25/32 - 7/25/33 | | 19,450 | | 4,306 | |
6.50%, 7/25/09 - 6/25/33 | | 21,994 | | 5,261 | |
7.00%, 4/1/32 - 5/25/33 | | 24,217 | | 11,590 | |
7.50%, 4/1/27 - 1/1/32 | | 5,868 | | 1,763 | |
8.00%, 2/1/23 - 12/1/31 | | 24,145 | | 5,864 | |
8.50%, 10/1/24 - 10/1/25 | | 4,495 | | 1,290 | |
9.00%, 11/1/26 | | 2,348 | | 599 | |
9.50%, 9/1/18 | | $ | 1 | | $ | @— | |
460.80%, 12/25/21 | | @— | | 1 | |
810.00%, 6/25/21 | | @— | | 1 | |
IO PAC | | | | | |
8.00%, 8/18/27 - 9/18/27 | | 7,387 | | 1,807 | |
1,008.00%, 9/25/20 | | @— | | 6 | |
1,159.20%, 7/25/21 | | @— | | 4 | |
IO REMIC PAC | | | | | |
8.00%, 8/18/27 | | 1,128 | | 289 | |
PAC | | | | | |
8.50%, 9/25/20 | | 55 | | 59 | |
8.75%, 11/25/19 | | 7 | | 8 | |
Government National Mortgage Association, | | | | | |
Inv Fl IO | | | | | |
2.25%, 9/16/27 - 4/16/29 | | 11,342 | | 697 | |
2.65%, 5/20/31 | | 2,699 | | 285 | |
2.80%, 12/16/29 | | 794 | | 87 | |
2.85%, 8/16/29 | | 13,702 | | 1,486 | |
| | | | 47,160 | |
Collateralized Mortgage Obligation — Non Agency Collateral Series (14.2%) | | | | | |
Banc of America Commercial Mortgage, Inc., | | | | | |
5.84% | | (h)(o)22,450 | | 22,608 | |
5.87% | | (h)(o)1,175 | | 1,188 | |
Bank of America Funding Corp., | | | | | |
IO | | | | | |
1.90%, 9/20/35 | | 76,737 | | 1,798 | |
Citigroup Commercial Mortgage Trust, | | | | | |
5.89% | | (h)(o)23,175 | | 23,475 | |
Commercial Mortgage Pass Through Certificates, | | | | | |
6.01% | | (h)(o)29,000 | | 29,612 | |
Countrywide Alternative Loan Trust, | | | | | |
IO | | | | | |
1.10%, 3/20/46 | | 29,043 | | 1,046 | |
1.19%, 3/20/46 | | 121,923 | | 5,063 | |
2.07%, 12/20/46 | | 284,043 | | 12,694 | |
2.09%, 2/25/37 | | 155,653 | | 7,490 | |
2.14%, 12/20/35 | | (e)(h)175,393 | | 6,960 | |
2.18%, 10/25/46 | | 140,101 | | 6,288 | |
2,215.54%, 11/20/35 | | (h)262,740 | | 6,651 | |
Countrywide Home Loan Mortgage Pass Through Trust, | | | | | |
IO | | | | | |
0.53%, 2/25/35 | | 80,865 | | 1,516 | |
Credit Suisse Mortgage Capital Certificates, | | | | | |
5.91%, 6/15/39 | | (c)(h)13,500 | | 13,676 | |
Greenpoint Mortgage Funding Trust, | | | | | |
5.30%, 4/25/47 | | (h)27,769 | | 27,160 | |
5.31%, 1/25/37 | | (h)34,308 | | 33,193 | |
5.33%, 3/25/47 | | (h)38,277 | | 37,479 | |
IO | | | | | |
1.36%, 6/25/45 | | (h)66,938 | | 1,631 | |
Greenwich Capital Commercial Funding Corp., | | | | | |
5.44%, 3/10/39 | | 18,400 | | 18,218 | |
The accompanying notes are an integral part of the financial statements. |
10
| 2007 Annual Report |
| |
| September 30, 2007 |
Portfolio of Investments (cont’d)
Advisory Portfolio
| | Face | | | |
| | Amount | | Value | |
| | (000) | | (000) | |
Collateralized Mortgage Obligation — Non Agency Collateral Series (cont’d) | | | | | |
GS Mortgage Securities Corp., | | | | | |
IO | | | | | |
2.60%, 8/25/35 | | $ | (e)(h)65,018 | | $ | 2,265 | |
GS Mortgage Securities Corp. II, | | | | | |
5.99%, 8/10/45 | | (h)31,000 | | 31,589 | |
Harborview Mortgage Loan Trust, | | | | | |
IO | | | | | |
1.53%, 5/19/35 | | (h)137,436 | | 2,963 | |
1.76%, 10/20/45 | | (h)86,110 | | 3,727 | |
1.85%, 1/19/36 | | (h)54,706 | | 1,402 | |
1.89%, 3/19/37 | | (h)105,756 | | 4,495 | |
PO | | | | | |
1/19/36 - 10/20/45 | | 2,202 | | 472 | |
Indymac Index Mortgage Loan Trust, | | | | | |
IO | | | | | |
1.43%, 7/25/35 | | (h)96,684 | | 3,384 | |
PO | | | | | |
7/25/35 | | @— | | @— | |
JPMorgan Chase Commercial Mortgage Securities Corp., | | | | | |
5.44%, 6/12/47 | | 16,550 | | 16,354 | |
5.94% | | (c)(h)(o)14,825 | | 15,021 | |
6.01% | | (h)(o)34,100 | | 34,766 | |
Kidder Peabody Mortgage Assets Trust, | | | | | |
IO | | | | | |
9.50%, 4/22/18 | | 12 | | 3 | |
Lehman Brothers Commercial Conduit Mortgage Trust, | | | | | |
6.13%, 7/15/44 | | (h)21,550 | | 22,209 | |
Lehman Brothers-UBS Commercial Mortgage Trust, | | | | | |
5.43%, 2/15/40 | | 5,700 | | 5,635 | |
5.86%, 7/17/40 | | (h)24,025 | | 24,025 | |
Lehman Structured Securities Corp., | | | | | |
IO | | | | | |
7.00%, 10/26/29 | | (e)25,493 | | 1,835 | |
Wachovia Bank Commercial Mortgage Trust, | | | | | |
5.34%, 12/15/43 | | 17,500 | | 17,169 | |
6.10%, 2/15/51 | | (h)14,250 | | 14,638 | |
| | | | 459,698 | |
Mortgages — Other (49.0%) | | | | | |
Alliance Bancorp Trust, | | | | | |
5.37%, 7/25/37 | | (h)17,520 | | 17,224 | |
American Express Co., | | | | | |
9.63%, 12/1/12 | | (d)(k)73 | | 73 | |
American Home Mortgage Assets, | | | | | |
5.26%, 3/25/47 | | (h)31,930 | | 31,120 | |
5.32%, 10/25/46 | | (h)21,268 | | 20,772 | |
5.36%, 5/25/46 - 9/25/46 | | (h)50,358 | | 49,513 | |
5.37%, 6/25/47 | | (h)25,686 | | 24,403 | |
5.43%, 6/25/47 | | (h)24,702 | | 22,138 | |
5.54%, 10/25/46 | | (h)6,084 | | 4,840 | |
American Home Mortgage Investment Trust, | | | | | |
5.32%, 5/25/47 | | (h)32,674 | | 32,087 | |
5.43%, 9/25/45 | | (h)3,282 | | 3,222 | |
5.85%, 11/25/45 | | $ | (h)4,425 | | $ | 3,595 | |
American Housing Trust, | | | | | |
9.55%, 9/25/20 | | 738 | | 736 | |
Bear Stearns Mortgage Funding Trust, | | | | | |
5.29%, 12/25/46 | | (h)44,833 | | 44,003 | |
5.33%, 9/25/36 | | (h)26,626 | | 26,046 | |
5.38%, 7/25/36 | | (h)29,528 | | 27,888 | |
California Federal Savings & Loan Association, | | | | | |
8.80%, 1/25/14 | | (d)(k)1 | | 1 | |
Countrywide Alternative Loan Trust, | | | | | |
5.27%, 4/25/47 | | (h)32,667 | | 31,879 | |
5.30%, 5/25/47 | | (h)21,020 | | 20,527 | |
5.31%, 6/25/47 | | (h)42,359 | | 41,380 | |
5.42%, 10/25/35 | | (h)5,219 | | 5,205 | |
5.65%, 7/25/46 | | (h)8,312 | | 5,486 | |
5.71%, 3/20/46 | | (h)16,028 | | 15,587 | |
5.76%, 11/20/35 - 3/25/47 | | (h)11,594 | | 10,623 | |
5.78%, 9/20/46 | | (h)12,262 | | 11,345 | |
5.79%, 11/20/35 | | (h)7,902 | | 7,871 | |
5.89%, 12/20/35 | | (h)12,871 | | 12,539 | |
5.93%, 6/25/46 | | (h)10,236 | | 7,165 | |
6.38%, 6/25/47 | | (h)3,000 | | 2,490 | |
6.68%, 2/25/36 | | (h)21,763 | | 21,461 | |
7.00%, 11/25/35 | | (h)17,375 | | 17,456 | |
Countrywide Home Loan Mortgage Pass Through Trust, | | | | | |
5.43%, 4/25/46 | | (h)20,936 | | 20,571 | |
Deutsche ALT-A Securities, Inc., Alternate Loan Trust, | | | | | |
5.28%, 2/25/47 | | (h)39,131 | | 38,269 | |
5.53%, 2/25/47 | | (h)14,289 | | 13,503 | |
Deutsche ALT-A Securities, Inc., NIM Trust, | | | | | |
6.75%, 2/25/47 | | (e)5,291 | | 5,088 | |
Downey Savings & Loan Association Mortgage Loan Trust, | | | | | |
5.68%, 3/19/38 | | (h)2,753 | | 2,671 | |
5.70%, 11/19/37 | | (h)29,647 | | 29,036 | |
5.92%, 4/19/47 | | (h)25,240 | | 24,971 | |
Gemsco Mortgage Pass Through Certificate, | | | | | |
8.70%, 11/25/10 | | (d)(k)8 | | 8 | |
GSR Mortgage Loan Trust, | | | | | |
5.32%, 8/25/46 | | (h)30,768 | | 30,106 | |
Harborview Mortgage Loan Trust, | | | | | |
5.26%, 4/19/38 | | (h)37,305 | | 36,376 | |
5.40%, 8/21/36 | | (h)27,331 | | 26,766 | |
5.65%, 3/19/38 | | (h)30,689 | | 29,945 | |
5.68%, 11/19/36 | | (h)37,654 | | 36,859 | |
5.69%, 1/19/38 | | (h)33,223 | | 32,456 | |
5.71%, 11/19/36 | | (h)35,465 | | 34,777 | |
5.73%, 7/19/46 | | (h)21,288 | | 20,726 | |
5.74%, 3/19/37 | | (h)19,215 | | 18,894 | |
5.79%, 7/19/45 | | (h)3,764 | | 3,709 | |
5.88%, 11/19/35 | | (h)13,797 | | 13,445 | |
Harborview NIM Corp., | | | | | |
6.41%, 3/19/37 - 3/19/38 | | (e)8,862 | | 8,809 | |
Indymac Index Mortgage Loan Trust, | | | | | |
5.36%, 9/25/46 | | (h)18,406 | | 17,921 | |
5.41%, 7/25/35 | | (h)4,244 | | 4,125 | |
| | | | | | | | | |
The accompanying notes are an integral part of the financial statements. |
11
2007 Annual Report
September 30, 2007
Portfolio of Investments (cont’d)
Advisory Portfolio
| | Face | | | |
| | Amount | | Value | |
| | (000) | | (000) | |
Mortgages — Other (cont’d) | | | | | |
Lehman XS Trust, | | | | | |
5.40%, 12/25/35 | | $ | (h)24,347 | | $ | 23,836 | |
6.13%, 3/25/47 | | (h)12,991 | | 10,555 | |
Luminent Mortgage Trust, | | | | | |
5.36%, 5/25/46 | | (h)15,953 | | 15,607 | |
Mastr Adjustable Rate Mortgages Trust, | | | | | |
5.38%, 4/25/46 | | (h)13,857 | | 13,659 | |
5.78%, 4/25/46 | | (h)7,294 | | 5,325 | |
5.88%, 4/25/46 | | (h)3,765 | | 2,447 | |
6.33%, 5/25/47 | | (h)6,928 | | 4,988 | |
Residential Accredit Loans, Inc., | | | | | |
5.27%, 2/25/37 | | (h)28,973 | | 28,275 | |
5.28%, 2/25/37 | | (h)12,106 | | 11,815 | |
5.29%, 2/25/37 - 3/25/47 | | (h)47,355 | | 46,257 | |
5.33%, 6/25/37 - 3/25/47 | | (h)54,826 | | 53,437 | |
5.36%, 6/25/46 | | (h)30,750 | | 29,964 | |
5.39%, 2/25/46 - 5/25/47 | | (h)35,982 | | 35,117 | |
5.40%, 2/25/46 | | (h)7,728 | | 7,632 | |
5.43%, 6/25/47 | | (h)15,156 | | 14,541 | |
Ryland Acceptance Corp. IV, | | | | | |
6.65%, 7/1/11 | | 267 | | 267 | |
Structured Asset Mortgage Investments, Inc., | | | | | |
5.32%, 2/25/36 | | (h)14,264 | | 13,994 | |
5.33%, 10/25/36 | | (h)18,569 | | 18,226 | |
5.36%, 7/25/36 - 8/25/36 | | (h)62,394 | | 60,904 | |
5.40%, 4/25/36 | | (h)30,508 | | 30,156 | |
5.43%, 5/25/46 | | (h)8,638 | | 8,411 | |
5.44%, 2/25/36 | | (h)35,452 | | 34,638 | |
Washington Mutual, Inc., | | | | | |
5.36%, 7/25/47 | | (h)1,374 | | 1,337 | |
5.38%, 12/25/45 | | (h)5,938 | | 5,908 | |
5.39%, 10/25/45 | | (h)4,392 | | 4,381 | |
5.40%, 4/25/45 | | (h)12,089 | | 11,907 | |
5.42%, 8/25/45 | | (h)2,031 | | 2,027 | |
5.49%, 7/25/45 | | (h)10,302 | | 10,138 | |
5.92%, 4/25/46 - 5/25/46 | | (h)62,463 | | 60,816 | |
5.94%, 8/25/46 | | (h)28,744 | | 28,054 | |
Zuni Mortgage Loan Trust, | | | | | |
5.26%, 8/25/36 | | (h)17,818 | | 17,685 | |
| | | | 1,580,010 | |
Total Fixed Income Securities (Cost $3,956,179) | | | | 3,841,293 | |
| | | | | |
| | Shares | | | |
Preferred Stock (0.7%) | | | | | |
Mortgages — Other | | | | | |
Home Ownership Funding Corp., | | | | | |
13.33% (Cost $21,855) | | (e)153,475 | | 22,971 | |
| | | | | |
| | No. of | | | |
| | Contracts | | | |
Put Options Purchased (0.0%) | | | | | |
90 Day EuroDollar | | | | | |
12/07 @ $94.75 | | (a)6,855 | | 728 | |
3/08 @ $94.50 | | (a)207 | | 9 | |
Total Put Options Purchased (Cost $1,275) | | | | 737 | |
| | | | | |
| | Face | | | |
| | Amount | | | |
| | (000) | | | |
Short-Term Investments (11.0%) | | | | | |
Short-Term Debt Securities held as Collateral on Loaned Securities (0.2%) | | | | | |
AIG Match Funding Corp., | | | | | |
5.73%, 10/17/07 | | $ | (h)315 | | $ | 315 | |
Alliance & Leicester plc, | | | | | |
5.83%, 10/9/07 | | (h)225 | | 225 | |
Bancaja, | | | | | |
5.36%, 10/19/07 | | 112 | | 112 | |
Bank of New York Co., Inc., | | | | | |
5.82%, 10/10/07 | | (h)112 | | 112 | |
BASF AG, | | | | | |
5.36%, 10/22/07 | | (h)112 | | 112 | |
BNP Paribas plc, | | | | | |
5.50%, 11/19/07 | | (h)225 | | 225 | |
CAM US Finance S.A. Unipersonal, | | | | | |
5.37%, 10/3/07 | | 450 | | 450 | |
Canadian Imperial Bank of Commerce, New York, | | | | | |
4.92%, 10/1/07 | | (h)225 | | 225 | |
CC USA, Inc., | | | | | |
4.68%, 10/1/07 | | (h)112 | | 112 | |
CIT Group Holdings, | | | | | |
5.38%, 10/18/07 | | (h)405 | | 405 | |
Citigroup Global Markets Holdings, Inc., | | | | | |
5.26%, 10/1/07 | | 892 | | 892 | |
Credit Suisse First Boston, New York, | | | | | |
4.82%, 10/1/07 | | (h)225 | | 225 | |
First Tennessee Bank, | | | | | |
5.76%, 10/17/07 | | (h)112 | | 112 | |
5.77%, 10/17/07 | | (h)450 | | 450 | |
Goldman Sachs Group, Inc., | | | | | |
5.37%, 10/1/07 | | 212 | | 212 | |
5.82%, 10/15/07 | | (h)113 | | 113 | |
HSBC Finance Corp., | | | | | |
5.81%, 10/9/07 | | (h)113 | | 113 | |
IBM Corp., | | | | | |
5.79%, 10/9/07 | | 450 | | 450 | |
Macquarie Bank Ltd., | | | | | |
5.17%, 10/22/07 | | (h)225 | | 225 | |
Marshall & Ilsley Bank, | | | | | |
5.37%, 12/17/07 | | 226 | | 226 | |
Metropolitan Life Global Funding, | | | | | |
5.13%, 10/22/07 | | (h)338 | | 338 | |
National Bank of Canada, | | | | | |
5.66%, 10/2/07 | | (h)450 | | 450 | |
National Rural Utilities Cooperative Finance Corp., | | | | | |
5.73%, 10/1/07 | | (h)450 | | 450 | |
Nationwide Building Society, | | | | | |
5.28%, 12/28/07 | | 261 | | 261 | |
Societe Generale, New York, | | | | | |
5.11%, 10/31/07 | | (h)540 | | 540 | |
Unicredito Delaware, Inc., | | | | | |
5.77%, 10/15/07 | | (h)248 | | 248 | |
Unicredito Italiano Bank (Ireland) plc, | | | | | |
5.84%, 10/9/07 | | (h)158 | | 158 | |
| | | | 7,756 | |
The accompanying notes are an integral part of the financial statements. |
12
| 2007 Annual Report |
| |
| September 30, 2007 |
Portfolio of Investments (cont’d)
Advisory Portfolio
| | | | Value | |
| | Shares | | (000) | |
Investment Company (10.3%) | | | | | |
Morgan Stanley Institutional Liquidity Money Market Portfolio — Institutional Class | | (p)331,395,419 | | $ | 331,395 | |
| | | | | | |
| | Face | | | |
| | Amount | | | |
| | (000) | | | |
U.S. Treasury Security (0.5%) | | | | | |
U.S. Treasury Bill | | | | | |
3.82%, 1/10/08 | | $ | (j)(r)16,715 | | 16,539 | |
Total Short-Term Investments (Cost $355,654) | | | | 355,690 | |
Total Investments (130.7%) (Cost $4,334,963) — Including $7,669 of Securities Loaned | | | | 4,220,691 | |
Liabilities in Excess of Other Assets (-30.7%) | | | | (992,612 | ) |
Net Assets (100%) | | | | $ | 3,228,079 | |
| | | | | | | |
(a) | | Non-income producing security. |
(c) | | All or a portion of security on loan at September 30, 2007. |
(d) | | Security was valued at fair value — At September 30, 2007, the Portfolio held $82,000 of fair valued securities, representing less than 0.05% of net assets. |
(e) | | 144A security — Certain conditions for public sale may exist. Unless otherwise noted, these securities are deemed to be liquid. |
(h) | | Variable/Floating Rate Security — Interest rate changes on these instruments are based on changes in a designated base rate. The rates shown are those in effect on September 30, 2007. |
(i) | | Security is subject to delayed delivery. |
(j) | | All or a portion of the security was pledged to cover margin requirements for futures contracts. |
(k) | | Security has been deemed illiquid at September 30, 2007. |
(o) | | Perpetual — Security does not have a predetermined maturity date. Rate for this security is fixed for a period of time then reverts to a floating rate. The interest rate shown is the rate in effect at September 30, 2007. |
(p) | | See Note F within the Notes to Financial Statements regarding investment in Morgan Stanley Institutional Liquidity Government Portfolio — Institutional Class, Morgan Stanley Institutional Liquidity Money Market Portfolio — Institutional Class and/or Morgan Stanley Institutional Liquidity Tax-Exempt Portfolio — Institutional Class. |
(r) | | The rate shown is the yield to maturity at September 30, 2007. |
@ | | Face Amount/Value is less than $500. |
Inv Fl | | Inverse Floating Rate — Interest rate fluctuates with an inverse relationship to an associated interest rate. Indicated rate is the effective rate at September 30, 2007. |
IO | | Interest Only |
PAC | | Planned Amortization Class |
PO | | Principal Only |
REMIC | | Real Estate Mortgage Investment Conduit |
TBA | | To Be Announced |
Futures Contracts:
The Portfolio had the following futures contract(s) open at period end:
| | | | | | | | Net | |
| | | | | | | | Unrealized | |
| | Number | | | | | | Appreciation | |
| | of | | Value | | Expiration | | (Depreciation) | |
| | Contracts | | (000) | | Date | | (000) | |
Long: | | | | | | | | | |
EuroDollar | | | | | | | | | |
CME | | 1,285 | | $ | 305,685 | | Dec-07 | | $ | 1,565 | |
EuroDollar | | | | | | | | | |
CME | | 1,285 | | 306,730 | | Mar-08 | | 2,432 | |
EuroDollar | | | | | | | | | |
CME | | 1,285 | | 307,195 | | Jun-08 | | 2,753 | |
EuroDollar | | | | | | | | | |
CME | | 1,285 | | 307,404 | | Sep-08 | | 2,929 | |
EuroDollar | | | | | | | | | |
CME | | 1,285 | | 307,388 | | Dec-08 | | 2,986 | |
EuroDollar | | | | | | | | | |
CME | | 1,285 | | 307,163 | | Mar-09 | | 2,921 | |
EuroDollar | | | | | | | | | |
CME | | 1,285 | | 306,794 | | Jun-09 | | (299 | ) |
Short: | | | | | | | | | |
U.S. Treasury
2 yr. Note | | 103 | | 21,326 | | Dec-07 | | (28 | ) |
U.S. Treasury
5 yr. Note | | 3,316 | | 354,916 | | Dec-07 | | (295 | ) |
U.S. Treasury
10 yr. Note | | 5,476 | | 598,424 | | Dec-07 | | 1,412 | |
U.S. Treasury
Long Bond | | 7,419 | | 826,059 | | Dec-07 | | 921 | |
| | | | | | | | $ | 17,297 | |
| | | | | | | | | | | |
CME | | Chicago Mercantile Exchange |
The accompanying notes are an integral part of the financial statements.
13
2007 Annual Report
September 30, 2007
Portfolio of Investments (cont’d)
Advisory Portfolio
Interest Rate Swap Contracts
The Portfolio had the following interest rate swap agreement(s) open at period end:
| | | | | | | | | | | | Unrealized | |
| | | | | | | | | | Notional | | Appreciation | |
| | Floating Rate | | Pay/Receive | | Fixed | | Termination | | Amount | | (Depreciation) | |
Swap Counterparty | | Index | | Floating Rate | | Rate | | Date | | (000) | | (000) | |
Citigroup | | 3 Month LIBOR | | Pay | | 5.33 | % | 5/22/17 | | $ | 22,250 | | $ | 532 | |
| | 3 Month LIBOR | | Pay | | 5.37 | % | 5/23/17 | | 127,400 | | 3,382 | |
| | 3 Month LIBOR | | Pay | | 5.02 | % | 9/11/17 | | 85,000 | | (1,325 | ) |
| | 3 Month LIBOR | | Receive | | 5.29 | % | 9/28/17 | | 105,250 | | (697 | ) |
Deutsche Bank | | 3 Month LIBOR | | Pay | | 5.35 | % | 5/24/17 | | 147,000 | | 3,672 | |
| | 3 Month LIBOR | | Pay | | 5.39 | % | 5/25/17 | | 187,875 | | 5,281 | |
| | 3 Month LIBOR | | Pay | | 5.43 | % | 5/29/17 | | 326,350 | | 10,206 | |
JPMorgan Chase | | 3 Month LIBOR | | Pay | | 5.37 | % | 5/23/17 | | 63,400 | | 1,705 | |
| | 3 Month LIBOR | | Pay | | 5.34 | % | 5/24/17 | | 128,200 | | 3,111 | |
| | 3 Month LIBOR | | Pay | | 5.45 | % | 5/29/17 | | 50,000 | | 1,639 | |
| | 3 Month LIBOR | | Pay | | 5.09 | % | 9/11/17 | | 190,000 | | (1,947 | ) |
| | 3 Month LIBOR | | Pay | | 5.16 | % | 9/20/17 | | 82,150 | | (331 | ) |
| | 3 Month LIBOR | | Receive | | 5.23 | % | 9/27/17 | | 99,600 | | (232 | ) |
| | 3 Month LIBOR | | Receive | | 5.30 | % | 9/28/17 | | 100,000 | | (750 | ) |
Lehman Brothers | | 3 Month LIBOR | | Pay | | 5.34 | % | 5/24/17 | | 50,000 | | 1,197 | |
| | 3 Month LIBOR | | Pay | | 5.40 | % | 5/25/17 | | 127,050 | | 3,716 | |
| | | | | | | | | | | | $ | 29,159 | |
| | | | | | | | | | | | | | | |
LIBOR — London Inter Bank Offer Rate |
The accompanying notes are an integral part of the financial statements.
14
| 2007 Annual Report |
| |
| September 30, 2007 |
Investment Overview (unaudited)
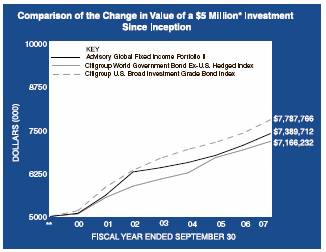
Advisory Global Fixed Income Portfolio
The Advisory Global Fixed Income Portfolio seeks above average total return over a market cycle of three to five years. The Portfolio invests primarily in fixed income securities of government and corporate issuers including both U.S. and non-U.S. issuers, including issuers located in emerging markets, and both investment grade and high yield securities rated B or BB (commonly referred to as “junk bonds”). A portion of these securities may asset-backed and, to a lesser extent, mortgage securities. In addition, the Portfolio may invest a portion of its assets in structured investments, structured notes and other types of similarly structured products consistent with the Portfolio’s investment objectives and policies. Generally, structured investments are interests in entities organized and operated for the purpose of restructuring the investment characteristics of underlying investment interests or securities. A portion of the securities held by the Portfolio will be denominated in foreign currencies, including the Euro. There is no minimum or maximum maturity for any individual security. The Portfolio may use futures, options, forwards, collateralized mortgage obligations (“CMOs”), swaps, options on swaps and other derivatives. Foreign investments are subject to certain risks such as currency fluctuations, economic instability, and political developments.
Performance
For the fiscal year ended September 30, 2007, the Portfolio had a total return based on net asset value and reinvestment of distributions per share of 1.77%, net of fees. The Portfolio underperformed against its benchmarks the Citigroup World Government Bond Index, excluding the United States, hedged to U.S. dollars (the “Index”) and for the Citigroup U.S. Broad Investment Grade Bond Index, which returned 3.58% and 5.23%, respectively.
Factors Affecting Performance
• | | The Portfolio’s defensive interest-rate positioning was additive to performance as global interest rates generally rose during the 12-month period. |
| | |
• | | Emerging market debt had a favorable effect on performance. Overall, the strategy favored local-currency denominated securities in Argentina, Brazil, Mexico, Turkey, and a few other small countries. |
| | |
• | | An overweight to the Yen versus the Euro detracted from performance as the Yen continued to depreciate relative to the Euro during the reporting period. |
Management Strategies
• | | In keeping with its mandate, the Portfolio emphasizes exposure to non-U.S. fixed income markets, and is intended to add value to separate account U.S. fixed income portfolios allowing non-U.S. exposure. |
| | |
• | | The Portfolio holds diversified exposure to local currency emerging markets debt expected to outperform U.S. bonds, as well as short-duration European government bonds, hedged to the U.S. dollar, for diversification purposes. |
| | |
• | | We maintained a defensive interest-rate posture across the major bond markets during the reporting period due to the generally low level of real interest rates and insufficient allowance for likely monetary policy tightening. |
| | |
• | | We favored the Yen over the Euro based on the extreme undervaluation of the Yen and signs of solid economic growth in Japan, which led to expectations that the currency would appreciate. |

* Minimum Investment
In accordance with SEC regulations, Portfolio performance shown assumes that all recurring fees (including management fees) were deducted and all dividends and distributions were reinvested.
Performance Compared to the Citigroup World Government Bond Ex-U.S. Hedged Index(1) and the Citigroup U.S. Broad Investment Grade Bond Index(2)
| | Total Returns(3) | |
| | Average Annual | |
| | One | | Five | | Ten | | Since | |
| | Year | | Years | | Years | | Inception(5) | |
Portfolio(4) | | 1.77 | % | 3.00 | % | 5.43 | % | 7.40 | % |
Citigroup World Government Bond Ex-U.S. Hedged Index | | 3.58 | | 4.06 | | 5.80 | | 7.49 | |
Citigroup U.S. Broad Investment Grade Bond Index | | 5.23 | | 4.23 | | 6.00 | | 6.84 | |
15
2007 Annual Report
September 30, 2007
Investment Overview (cont’d)
Advisory Global Fixed Income Portfolio
Performance data quoted represents past performance, which is no guarantee of future results, and current performance may be lower or higher than the figures shown. Performance assumes that all dividends and distributions, if any, were reinvested. For the most recent month-end performance figures, please call 1(800) 548-7786. Investment return and principal value will fluctuate so that Portfolio shares, when redeemed, may be worth more or less than their original cost. Total returns do not reflect the deduction of taxes that a shareholder would pay on Portfolio distributions or the redemption of Portfolio shares.
(1) | | The Citigroup World Government Bond Ex-U.S Hedged Index is a marketcapitalization weighted benchmark that tracks the performance of the 20 government bond markets of Australia, Austria, Belgium, Canada, Denmark, Finland, France, Germany, Greece, Ireland, Italy, Japan, the Netherlands, Norway, Poland, Portugal, Spain, Sweden, Switzerland, and the United Kingdom. Issuers must carry an investment grade (BBB-/Baa3) or higher credit rating to remain eligible for inclusion. The Index is hedged to the U.S. dollar by using a rolling onemonth forward exchange contract as a hedging instrument. The Index is unmanaged and its returns do not include any sales charges or fees. Such costs would lower performance. It is not possible to invest directly in an index. |
(2) | | The Citigroup U.S. Broad Investment Grade Bond Index is a fixed income, market value-weighted Index that includes publicly-traded U.S. Treasury, U.S. agency, mortgage pass-through, asset-backed, supranational, corporate, Yankee and global debt issues, including securities issued under Rule 144A with registration rights, carrying investment grade (BBB-/Baa3) or higher credit ratings with remaining maturities of at least one year. The Index is unmanaged and its returns do not include any sales charges or fees. Such costs would lower performance. It is not possible to invest directly in an index. |
(3) | | Total returns for the Portfolio reflect expenses waived and/or reimbursed, if applicable, by the Adviser. Without such waivers and/or reimbursements, total returns would have been lower. Fee waivers and/or reimbursements are voluntary and the Adviser reserves the right to commence or terminate any waiver and/or reimbursement at any time. |
(4) | | Commenced operations on October 7, 1994. |
(5) | | For comparative purposes, average annual since inception returns listed for the Indexes refer to the inception date or initial offering of the Portfolio, not the inception of the Indexes. |
Expense Example
As a shareholder of the Portfolio, you incur ongoing costs, including management fees and other Portfolio expenses. This example is intended to help you understand your ongoing costs (in dollars) of investing in the Portfolio and to compare these costs with the ongoing costs of investing in other mutual funds.
The example is based on an investment of $1,000 invested at the beginning of the six-month period ended September 30, 2007 and held for the entire six-month period.
Actual Expenses
The first line of the table below provides information about actual account values and actual expenses. You may use the information in this line, together with the amount you invested, to estimate the expenses that you paid over the period. Simply divide your account value by $1,000 (for example, an $8,600 account value divided by $1,000 = 8.6), then multiply the result by the number in the first line under the heading entitled “Expenses Paid During Period” to estimate the expenses you paid on your account during this period.
Please note that “Expenses Paid During Period” are grossed up to reflect Portfolio expenses prior to the effect of Expense Offset (See Note E in the Notes to Financial Statements). Therefore, the annualized net expense ratios may differ from the ratio of expenses to average net assets shown in the Financial Highlights.
Hypothetical Example for Comparison Purposes
The second line of the table below provides information about hypothetical account values and hypothetical expenses based on the Portfolio’s actual expense ratio and an assumed rate of return of 5% per year before expenses, which is not the Portfolio’s actual return. The hypothetical account values and expenses may not be used to estimate the actual ending account balance or expenses you paid for the period. You may use this information to compare the ongoing costs of investing in the Portfolio and other funds. To do so, compare this 5% hypothetical example with the 5% hypothetical examples that appear in the shareholder reports of the other funds.
| | | | | | Expenses Paid | |
| | | | Ending Account | | During Period* | |
| | Beginning | | Value | | April 1, 2007 — | |
| | Account Value | | September 30, | | September 30, | |
| | April 1, 2007 | | 2007 | | 2007 | |
Actual | | $ | 1,000.00 | | $ | 977.10 | | $ | 0.55 | |
Hypothetical (5% average annual return before expenses) | | 1,000.00 | | 1,024.52 | | 0.56 | |
| | | | | | | | | | |
* | | Expenses are equal to the Portfolio’s annualized net expense ratio of 0.11%, multiplied by the average account value over the period, multiplied by 183/365 (to reflect the one-half year period). |
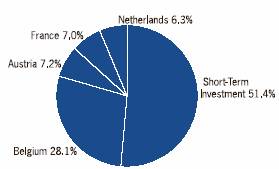
Graphic Presentation of Portfolio Holdings
The following graph depicts the Portfolio’s holdings by country and/or investment type, as a percentage of total investments.

* | | Countries and/or investment types which do not appear in the above graph, as well as those which represent less than 5% of total investments, if applicable, are included in the category labeled “Other”. |
16
| 2007 Annual Report |
| |
| September 30, 2007 |
Portfolio of Investments
Advisory Global Fixed Income Portfolio
| | Face | | | |
| | Amount | | Value | |
| | (000) | | (000) | |
Fixed Income Securities (34.7%) | | | | | |
Argentina (5.8%) | | | | | |
Government of Argentina, | | | | | |
8.28%, 12/31/33 | | $ | 10,935 | | $ | 9,851 | |
Austria (1.7%) | | | | | |
Republic of Austria, | | | | | |
5.00%, 1/15/08 | | EUR | 2,000 | | 2,859 | |
Belgium (4.3%) | | | | | |
Kingdom of Belgium, | | | | | |
5.75%, 3/28/08 | | 5,100 | | 7,327 | |
France (4.5%) | | | | | |
Government of France B.T.A.N., | | | | | |
3.00%, 7/12/08 | | 5,500 | | 7,777 | |
Mexico (8.7%) | | | | | |
Mexican Bonos, | | | | | |
9.50%, 12/18/14 | | MXN | 148,305 | | 14,799 | |
Netherlands (5.0%) | | | | | |
Netherlands Government, | | | | | |
2.50%, 1/15/08 | | EUR | 6,000 | | 8,518 | |
United Kingdom (4.7%) | | | | | |
United Kingdom Treasury GILT, | | | | | |
5.75%, 12/7/09 | | GBP | 3,850 | | 7,996 | |
Total Fixed Income Securities (Cost $54,867) | | | | 59,127 | |
| | | | | |
| | No. of | | | |
| | Contracts | | | |
Put Options Purchased (0.9%) | | | | | |
Switzerland (0.9%) | | | | | |
Swiss Franc Put @ $1.186 expiring 3/6/08 (Cost $5,557) | | (a)206,500 | | 1,605 | |
| | | | | |
| | Shares | | | |
Short-Term Investment (62.1%) | | | | | |
Investment Company (62.1%) | | | | | |
Morgan Stanley Institutional Liquidity Money Market Portfolio — Institutional Class
(Cost $105,856) | | (p)105,855,659 | | 105,856 | |
Total Investments (97.7%) (Cost $166,280) | | | | 166,588 | |
Other Assets in Excess of Liabilities (2.3%) | | | | 3,993 | |
Net Assets (100%) | | | | $ | 170,581 | |
| | | | | | | | | |
(a) | | Non-income producing security. |
(p) | | See Note F within the Notes to Financial Statements regarding investment in Morgan Stanley Institutional Liquidity Government Portfolio — Institutional Class, Morgan Stanley Institutional Liquidity Money Market Portfolio — Institutional Class and/or Morgan Stanley Institutional Liquidity Tax-Exempt Portfolio — Institutional Class. |
EUR | | Euro |
MXN | | Mexican Peso |
GBP | | British Pound |
Foreign Currency Exchange Contract Information:
The Portfolio had the following foreign currency exchange contract(s) open at period end:
Currency
to
Deliver
(000) | | Value
(000) | | Settlement
Date | | In
Exchange
For
(000) | | Value
(000) | | Net
Unrealized
Appreciation
(Depreciation)
(000) | |
EUR | 18,350 | | $ | 26,186 | | 10/31/07 | | USD | 25,116 | | $ | 25,116 | | $ | (1,070 | ) |
EUR | 42,024 | | 59,983 | | 11/14/07 | | USD | 57,639 | | 57,639 | | (2,344 | ) |
GBP | 3,935 | | 8,047 | | 10/24/07 | | USD | 7,799 | | 7,799 | | (248 | ) |
USD | 55,522 | | 55,522 | | 11/14/07 | | JPY | 6,450,000 | | 56,454 | | 932 | |
| | $ | 149,738 | | | | | | $ | 147,008 | | $ | (2,730 | ) |
JPY | | — Japanese Yen |
USD | | — United States Dollar |
Futures Contracts:
The Portfolio had the following futures contract(s) open at period end:
| | | | | | | | Net | |
| | | | | | | | Unrealized | |
| | Number | | | | | | Appreciation | |
| | of | | Value | | Expiration | | (Depreciation) | |
| | Contracts | | (000) | | Date | | (000) | |
Long: | | | | | | | | | |
Euro—Schatz 2 yr.
(Germany) | | 617 | | $ | 90,937 | | Dec-07 | | $ | (123 | ) |
| | | | | | | | | | | |
The accompanying notes are an integral part of the financial statements.
17
2007 Annual Report
September 30, 2007
Investment Overview (unaudited)
Advisory Global Fixed Income Portfolio II
The Advisory Global Fixed Income Portfolio II seeks above average total return over a market cycle of three to five years. The Portfolio invests primarily in investment grade fixed income securities of government and corporate issuers including both U.S. and non-U.S. issuers, including issuers located in emerging markets. A portion of these securities may be asset-backed and, to a lesser extent, mortgage securities. In addition, the Portfolio may invest a portion of its assets in structured investments, structured notes and other types of similarly structured products consistent with the Portfolio’s investment objectives and policies. Generally, structured investments are interests in entities organized and operated for the purpose of restructuring the investment characteristics of underlying investment interests or securities. A portion of securities held by the Portfolio will be denominated in foreign currencies, including the Euro. There is no minimum or maximum maturity for any individual security. The Portfolio may use futures, options, forwards, collateralized mortgage obligations (“CMOs”), swaps, options on swaps and other types derivatives. Foreign investments are subject to certain risks such as currency fluctuations, economic instability, and political developments.
Performance
For the fiscal year ended September 30, 2007, the Portfolio had a total return based on net asset value and reinvestment of distributions per share of 4.82%, net of fees. The Portfolio outperformed against its benchmark the Citigroup World Government Bond Index, excluding the United States, hedged to U.S. dollars, (the “Index”) and underperformed against the Citigroup U.S. Broad Investment Grade Bond Index which returned 3.58% and 5.23%, respectively.
Factors Affecting Performance
• | | The Portfolio’s defensive interest-rate positioning was additive to performance as global interest rates generally rose during the 12-month period. |
| | |
• | | Emerging market debt had a favorable effect on performance. Overall, the strategy favored localcurrency denominated securities in Argentina, Brazil, Mexico, Turkey, and a few other small countries. |
| | |
• | | An overweight to the Yen versus the Euro detracted from performance as the Yen continued to depreciate relative to the Euro during the reporting period. |
Management Strategies
• | | In keeping with its mandate, the Portfolio emphasizes exposure to non-U.S. fixed income markets, and is intended to add value to separate account U.S. fixed income portfolios allowing non-U.S. exposure. |
| | |
• | | We maintained a defensive interest-rate posture across the major bond markets during the reporting period due to the generally low level of real interest rates and insufficient allowance for likely monetary policy tightening. |
| | |
• | | We favored the Yen over the Euro based on the extreme undervaluation of the Yen and signs of solid economic growth in Japan, which led to expectations that the currency would appreciate. |
* | | Minimum Investment |
** | | Commenced operations on June 20, 2000. |
In accordance with SEC regulations, Portfolio performance shown assumes that all recurring fees (including management fees) were deducted and all dividends and distributions were reinvested.
Performance Compared to the Citigroup World Government Bond Ex-U.S. Hedged Index(1) and the Citigroup U.S. Broad Investment Grade Bond Index(2)
| | Total Returns(3) | |
| | | | Average Annual | |
| | One | | Five | | Since | |
| | Year | | Years | | Inception(5) | |
Portfolio(4) | | 4.82 | % | 3.30 | % | 5.51 | % |
Citigroup World Government Bond Ex-U.S. Hedged Index | | 3.58 | | 4.06 | | 5.07 | |
Citigroup U.S. Broad Investment Grade Bond Index | | 5.23 | | 4.23 | | 6.28 | |
Performance data quoted represents past performance, which is no guarantee of future results, and current performance may be lower or higher than the figures shown. Performance assumes that all dividends and distributions, if any, were reinvested. For the most recent month-end performance figures, please call 1(800) 548-7786. Investment return and principal value will fluctuate so that Portfolio shares, when redeemed, may be worth more or less than their original cost. Total returns do not reflect the
18
| 2007 Annual Report |
| |
| September 30, 2007 |
Investment Overview (cont’d)
Advisory Global Fixed Income Portfolio II
deduction of taxes that a shareholder would pay on Portfolio distributions or the redemption of Portfolio shares.
(1) | | The Citigroup World Government Bond Ex-U.S Hedged Index is a marketcapitalization weighted benchmark that tracks the performance of the 20 Government bonds markets of Australia, Austria, Belgium, Canada, Denmark, Finland, France, Germany, Greece, Ireland, Italy, Japan, the Netherlands, Norway, Poland, Portugal, Spain, Sweden, Switzerland, and the United Kingdom. Issuers must carry an investment grade (BBB-/Baa3) or higher credit rating to remain eligible for inclusion. The index is hedged to the U.S. dollar by using a rolling onemonth forward exchange contract as a hedging instrument. The Index is unmanaged and its returns do not include any sales charges or fees. Such costs would lower performance. It is not possible to invest directly in an index. |
(2) | | The Citigroup U.S. Broad Investment Grade Bond Index is a fixed income, market value-weighted Index that includes publicly-traded U.S. Treasury, U.S. agency, mortgage pass-through, asset-backed, supranational, corporate, Yankee and global debt issues, including securities issued under Rule 144A with registration rights, carrying investment grade (BBB-/Baa3) or higher credit ratings with remaining maturities of at least one year. The Index is unmanaged and its returns do not include any sales charges or fees. Such costs would lower performance. It is not possible to invest directly in an index. |
(3) | | Total returns for the Portfolio reflect expenses waived and/or reimbursed, if applicable, by the Adviser. Without such waivers and/or reimbursements, total returns would have been lower. Fee waivers and/or reimbursements are voluntary and the Adviser reserves the right to commence or terminate any waiver and/or reimbursement at any time. |
(4) | | Commenced operations on June 20, 2000. |
(5) | | For comparative purposes, average annual since inception returns listed for the Indexes refer to the inception date or initial offering of the Portfolio, not the inception of the Indexes. |
Expense Example
As a shareholder of the Portfolio, you incur ongoing costs, including management fees and other Portfolio expenses. This example is intended to help you understand your ongoing costs (in dollars) of investing in the Portfolio and to compare these costs with the ongoing costs of investing in other mutual funds.
The example is based on an investment of $1,000 invested at the beginning of the six-month period ended September 30, 2007 and held for the entire six-month period.
Actual Expenses
The first line of the table below provides information about actual account values and actual expenses. You may use the information in this line, together with the amount you invested, to estimate the expenses that you paid over the period. Simply divide your account value by $1,000 (for example, an $8,600 account value divided by $1,000 = 8.6), then multiply the result by the number in the first line under the heading entitled “Expenses Paid During Period” to estimate the expenses you paid on your account during this period.
Please note that “Expenses Paid During Period” are grossed up to reflect Portfolio expenses prior to the effect of Expense Offset (See Note E in the Notes to Financial Statements). Therefore, the annualized net expense ratios may differ from the ratio of expenses to average net assets shown in the Financial Highlights.
Hypothetical Example for Comparison Purposes
The second line of the table below provides information about hypothetical account values and hypothetical expenses based on the Portfolio’s actual expense ratio and an assumed rate of return of 5% per year before expenses, which is not the Portfolio’s actual return. The hypothetical account values and expenses may not be used to estimate the actual ending account balance or expenses you paid for the period. You may use this information to compare the ongoing costs of investing in the Portfolio and other funds. To do so, compare this 5% hypothetical example with the 5% hypothetical examples that appear in the shareholder reports of the other funds.
| | | | | | Expenses Paid | |
| | | | Ending Account | | During Period* | |
| | Beginning | | Value | | April 1, 2007 — | |
| | Account Value | | September 30, | | September 30, | |
| | April 1, 2007 | | 2007 | | 2007 | |
| | | | | | | |
Actual | | $ | 1,000.00 | | $ | 1,027.20 | | $ | 0.56 | |
Hypothetical (5% average annual return before expenses) | | 1,000.00 | | 1,024.52 | | 0.56 | |
| | | | | | | | | | |
* | | Expenses are equal to the Portfolio’s annualized net expense ratio of 0.11%, multiplied by the average account value over the period, multiplied by 183/365 (to reflect the one-half year period). |
Graphic Presentation of Portfolio Holdings
The following graph depicts the Portfolio’s holdings by country and/or investment type, as a percentage of total investments.
19
2007 Annual Report
September 30, 2007
Portfolio of Investments
Advisory Global Fixed Income Portfolio II
| | Face | | | |
| | Amount | | Value | |
| | (000) | | (000) | |
Fixed Income Securities (42.1%) | | | | | |
Austria (6.2%) | | | | | |
Republic of Austria, | | | | | |
4.00%, 7/15/09 | | EUR | 40 | | $ | 57 | |
Belgium (24.3%) | | | | | |
Kingdom of Belgium, | | | | | |
5.75%, 3/28/08 | | 155 | | 223 | |
France (6.1%) | | | | | |
Government of France B.T.A.N, | | | | | |
3.50%, 1/12/09 | | 40 | | 56 | |
Netherlands (5.5%) | | | | | |
Netherlands Government, | | | | | |
5.25%, 7/15/08 | | 35 | | 50 | |
Total Fixed Income Securities (Cost $344) | | | | 386 | |
| | | | | |
| | Shares | | | |
Short-Term Investment (44.6%) | | | | | |
Investment Company (44.6%) | | | | | |
Morgan Stanley Institutional Liquidity Money Market Portfolio — Institutional Class (Cost $408) | | (p)407,614 | | 408 | |
Total Investments (86.7%) (Cost $752) | | | | 794 | |
Other Assets in Excess of Liabilities (13.3%) | | | | 122 | |
Net Assets (100%) | | | | $ | 916 | |
| | | | | | | |
(p) | | See Note F within the Notes to Financial Statements regarding investment in Morgan Stanley Institutional Liquidity Government Portfolio — Institutional Class, Morgan Stanley Institutional Liquidity Money Market Portfolio — Institutional Class and/or Morgan Stanley Institutional Liquidity Tax-Exempt Portfolio — Institutional Class. |
EUR | | Euro |
Foreign Currency Exchange Contract Information:
The Portfolio had the following foreign currency exchange contract(s) open at period end:
Currency
to
Deliver
(000) | | Value
(000) | | Settlement
Date | | In
Exchange
For
(000) | | Value
(000) | | Net
Unrealized
Appreciation
(Depreciation)
(000) | |
EUR | 307 | | $ | 438 | | 10/31/07 | | USD | 420 | | $ | 420 | | $ | (18 | ) |
| | | | | | | | | | | | | | | | |
USD — United States Dollar
Futures Contracts:
The Portfolio had the following futures contract(s) open at period end:
| | Number
of
Contracts | | Value
(000) | | Expiration
Date | | Net
Unrealized
Appreciation
(Depreciation)
(000) | |
Long: | | | | | | | | | |
Euro—Schatz 2 yr.
(Germany) | | 4 | | $ | 590 | | Dec-07 | | $ | (1 | ) |
| | | | | | | | | | | |
The accompanying notes are an integral part of the financial statements.
20
| 2007 Annual Report |
| |
| September 30, 2007 |
Statements of Assets and Liabilities
| | | | Advisory Global | | Advisory Global | |
| | Advisory | | Fixed Income | | Fixed Income | |
| | Portfolio | | Portfolio | | Portfolio II | |
| | (000) | | (000) | | (000) | |
Assets: | | | | | | | |
Investments in Securities of Unaffiliated Issuers, at Cost: | | $ | 4,003,568 | | $ | 60,424 | | $ | 344 | |
Investment in Security of Affiliated Issuer, at Cost: | | 331,395 | | 105,856 | | 408 | |
Total Investments in Securities, at Cost: | | 4,334,963 | | 166,280 | | 752 | |
Foreign Currency, at Cost: | | — | | @— | | @— | |
Investments in Securities of Unaffiliated Issuers, at Value:(1) | | 3,889,296 | | 60,732 | | 386 | |
Investment in Security of Affiliated Issuer, at Value: | | 331,395 | | 105,856 | | 408 | |
Total Investments in Securities, at Value: | | 4,220,691 | | 166,588 | | 794 | |
Cash | | 4,207 | | @— | | @— | |
Foreign Currency, at Value: | | — | | @— | | @— | |
Receivable for Investments Sold | | 1,430 | | — | | 52 | |
Receivable for Portfolio Shares Sold | | — | | 3,482 | | — | |
Unrealized Appreciation on Foreign Currency Exchange Contracts | | — | | 932 | | — | |
Unrealized Appreciation on Swap Agreements | | 34,441 | | — | | — | |
Interest Receivable | | 13,831 | | 1,692 | | 11 | |
Dividends Receivable | | 384 | | — | | — | |
Receivable for Delayed Delivery Commitments | | 506,735 | | — | | — | |
Due from Broker | | — | | 1,805 | | 98 | |
Receivable from Affiliate | | 93 | | 29 | | @— | |
Due from Adviser | | 128 | | — | | 17 | |
Other Assets | | 30 | | 1 | | @— | |
Total Assets | | 4,781,970 | | 174,529 | | 972 | |
Liabilities: | | | | | | | |
Collateral on Securities Loaned, at Value | | 7,756 | | — | | — | |
Payable for Delayed Delivery Commitments | | 1,508,962 | | — | | — | |
Due to Broker | | 24,803 | | — | | — | |
Unrealized Depreciation on Foreign Currency Exchange Contracts | | — | | 3,662 | | 18 | |
Unrealized Depreciation on Swap Agreements | | 5,282 | | — | | — | |
Payable for Portfolio Shares Redeemed | | 6,500 | | 211 | | — | |
Payable for Administration Fees | | 212 | | 11 | | @— | |
Payable for Custodian Fees | | 27 | | 24 | | 4 | |
Payable for Trustees’ Fees and Expenses | | 153 | | 3 | | 1 | |
Other Liabilities | | 196 | | 37 | | 33 | |
Total Liabilities | | 1,553,891 | | 3,948 | | 56 | |
Net Assets | | $ | 3,228,079 | | $ | 170,581 | | $ | 916 | |
Net Assets Consist Of: | | | | | | | |
Paid-in Capital | | $ | 3,678,244 | | $ | 174,347 | | $ | 903 | |
Undistributed (Distributions in Excess of) Net Investment Income | | (130 | ) | (3,683 | ) | (10 | ) |
Accumulated Net Realized Gain (Loss) | | (382,219 | ) | 2,447 | | @— | |
Unrealized Appreciation (Depreciation) on: | | | | | | | |
Investments | | (114,272 | ) | 308 | | 42 | |
Foreign Currency Exchange Contracts and Translations | | — | | (2,715 | ) | (18 | ) |
Futures Contracts | | 17,297 | | (123 | ) | (1 | ) |
Swap Agreements | | 29,159 | | — | | — | |
Net Assets | | $ | 3,228,079 | | $ | 170,581 | | $ | 916 | |
INSTITUTIONAL CLASS: | | | | | | | |
Shares Outstanding (unlimited number of shares authorized, no par value) (not in 000) | | 347,435,373 | | 50,200,283 | | 73,558 | |
Net Asset Value, Offering and Redemption Price Per Share | | $ | 9.29 | | $ | 3.40 | | $ | 12.46 | |
(1) Including: | | | | | | | |
Securities on Loan, at Value: | | $ | 7,669 | | $ | — | | $ | — | |
| | | | | | | | | | |
@ Amount is less than $500.
The accompanying notes are an integral part of the financial statements.
21
2007 Annual Report
September 30, 2007
Statements of Operations
For the Year Ended September 30, 2007
| | | | Advisory | | Advisory | |
| | | | Global | | Global | |
| | Advisory | | Fixed Income | | Fixed Income | |
| | Portfolio | | Portfolio | | Portfolio II | |
| | (000) | | (000) | | (000) | |
Investment Income: | | | | | | | |
Dividends from Securities of Unaffiliated Issuers | | $ | 1,618 | | $ | — | | $ | — | |
Interest from Securities of Unaffiliated Issuers | | 159,561 | | 5,739 | | 36 | |
Interest from Security of Affiliated Issuer | | 10,522 | | 2,536 | | 13 | |
Total Investment Income | | 171,701 | | 8,275 | | 49 | |
Expenses: | | | | | | | |
Investment Advisory Fees (Note B) | | 11,727 | | 626 | | 4 | |
Administration Fees (Note C) | | 2,502 | | 134 | | 1 | |
Custodian Fees (Note E) | | 86 | | 36 | | 8 | |
Professional Fees | | 162 | | 28 | | 22 | |
Trustees’ Fees and Expenses | | 77 | | 3 | | 1 | |
Transfer Agency Fees | | 7 | | 4 | | 3 | |
Shareholder Reporting Fees | | 73 | | 11 | | 6 | |
Registration Fees | | 18 | | 16 | | 16 | |
Other Expenses | | 170 | | 9 | | 4 | |
Total Expenses | | 14,822 | | 867 | | 65 | |
Waiver of Investment Advisory Fees (Note B) | | (11,727 | ) | (626 | ) | (4 | ) |
Expenses Reimbursed by Adviser (Note B) | | (555 | ) | — | | (59 | ) |
Rebate from Morgan Stanley Affiliated Cash Sweep (Note F) | | (210 | ) | (51 | ) | @— | |
Expense Offset (Note E) | | (38 | ) | (8 | ) | @— | |
Net Expenses | | 2,292 | | 182 | | 2 | |
Net Investment Income | | 169,409 | | 8,093 | | 47 | |
Realized Gain (Loss): | | | | | | | |
Investments Sold | | 57,829 | | 2,451 | | — | |
Foreign Currency Transactions | | — | | (5,018 | ) | (11 | ) |
Futures Contracts | | (37,209 | ) | (400 | ) | (3 | ) |
Options Written | | — | | 459 | | — | |
Swap Agreements | | 6,455 | | — | | — | |
Net Realized Gain (Loss) | | 27,075 | | (2,508 | ) | (14 | ) |
Change in Unrealized Appreciation (Depreciation): | | | | | | | |
Investments | | (85,083 | ) | 111 | | 36 | |
Foreign Currency Exchange Contracts and Translations | | — | | (2,833 | ) | (20 | ) |
Futures Contracts | | 10,989 | | (202 | ) | (1 | ) |
Swap Agreements | | 29,074 | | — | | — | |
Net Change in Unrealized Appreciation (Depreciation) | | (45,020 | ) | (2,924 | ) | 15 | |
Total Net Realized Gain (Loss) and Change in Unrealized Appreciation (Depreciation) | | (17,945 | ) | (5,432 | ) | 1 | |
Net Increase (Decrease) in Net Assets Resulting from Operations | | $ | 151,464 | | $ | 2,661 | | $ | 48 | |
@ Amount is less than $500.
The accompanying notes are an integral part of the financial statements.
22
| 2007 Annual Report |
| |
| September 30, 2007 |
Statements of Changes in Net Assets
| | | | Advisory Global | | Advisory Global | |
| | Advisory | | Fixed Income | | Fixed Income | |
| | Portfolio | | Portfolio | | Portfolio II | |
| | Year Ended | | Year Ended | | Year Ended | | Year Ended | | Year Ended | | Year Ended | |
| | September | | September | | September | | September | | September | | September | |
| | 30, 2007 | | 30, 2006 | | 30, 2007 | | 30, 2006 | | 30, 2007 | | 30, 2006 | |
| | (000) | | (000) | | (000) | | (000) | | (000) | | (000) | |
Increase (Decrease) in Net Assets | | | | | | | | | | | | | |
Operations: | | | | | | | | | | | | | |
Net Investment Income (Loss) | | $ | 169,409 | | $ | 108,684 | | $ | 8,093 | | $ | 1,785 | | $ | 47 | | $ | 48 | |
Net Realized Gain (Loss) | | 27,075 | | 90,759 | | (2,508 | ) | (216 | ) | (14 | ) | (29 | ) |
Net Change in Unrealized Appreciation (Depreciation) | | (45,020 | ) | (52,856 | ) | (2,924 | ) | 469 | | 15 | | 32 | |
Net Increase (Decrease) in Net Assets Resulting from Operations | | 151,464 | | 146,587 | | 2,661 | | 2,038 | | 48 | | 51 | |
Distributions from and/or in Excess of: | | | | | | | | | | | | | |
Institutional Class: | | | | | | | | | | | | | |
Net Investment Income | | (205,869 | ) | (205,755 | ) | (7,273 | ) | (652 | ) | (36 | ) | (21 | ) |
Net Realized Gain | | — | | — | | (415 | ) | — | | — | | — | |
Return of Capital | | (12,396 | ) | (54,511 | ) | — | | — | | — | | — | |
Total Distributions | | (218,265 | ) | (260,266 | ) | (7,688 | ) | (652 | ) | (36 | ) | (21 | ) |
Capital Share Transactions:(1) | | | | | | | | | | | | | |
Institutional Class: | | | | | | | | | | | | | |
Subscribed | | 578,396 | | 364,390 | | 16,569 | | 159,280 | | — | | — | |
Distributions Reinvested | | 190,371 | | 223,721 | | 6,901 | | 574 | | 34 | | 19 | |
Redeemed | | (650,927 | ) | (596,069 | ) | (12,372 | ) | (1,918 | ) | (198 | ) | (266 | ) |
Net Increase (Decrease) in Net Assets Resulting from Capital Share Transactions | | 117,840 | | (7,958 | ) | 11,098 | | 157,936 | | (164 | ) | (247 | ) |
Total Increase (Decrease) in Net Assets | | 51,039 | | (121,637 | ) | 6,071 | | 159,322 | | (152 | ) | (217 | ) |
Net Assets: | | | | | | | | | | | | | |
Beginning of Period | | 3,177,040 | | 3,298,677 | | 164,510 | | 5,188 | | 1,068 | | 1,285 | |
End of Period | | $ | 3,228,079 | | $ | 3,177,040 | | $ | 170,581 | | $ | 164,510 | | $ | 916 | | $ | 1,068 | |
Undistributed (Distributions in Excess of) Net Investment Income Included in End of Period Net Assets | | $ | (130 | ) | $ | (24,521 | ) | $ | (3,683 | ) | $ | 899 | | $ | (10 | ) | $ | (8 | ) |
| | | | | | | | | | | | | | | | | | | |
| |
(1) Capital Share Transactions: | | | | | | | | | | | | | |
Institutional Class: | | | | | | | | | | | | | |
Shares Subscribed | | 62,148 | | 37,939 | | 4,753 | | 45,849 | | — | | — | |
Shares Issued on Distributions Reinvested | | 20,429 | | 23,333 | | 1,976 | | 169 | | 3 | | 2 | |
Shares Redeemed | | (69,823 | ) | (61,822 | ) | (3,508 | ) | (560 | ) | (16 | ) | (22 | ) |
Net Increase (Decrease) in Institutional Class Shares Outstanding | | 12,754 | | (550 | ) | 3,221 | | 45,458 | | (13 | ) | (20 | ) |
The accompanying notes are an integral part of the financial statements.
23
2007 Annual Report
September 30, 2007
Statement of Cash Flows
For the Year Ended September 30, 2007
| | Advisory | |
| | Portfolio | |
| | (000) | |
Cash Flows From Operating Activities: | | | |
Proceeds from Sales and Maturities of Investments | | $ | 4,882,210 | |
Purchases of Investments | | (5,105,315 | ) |
Proceeds from Sales of Delayed Delivery Commitments | | 1,839,160 | |
Purchases of Delayed Delivery Commitments | | (1,380,816 | ) |
Net (Increase) Decrease in Short-Term Investments | | (280,543 | ) |
Net Realized Gain (Loss) on Futures Contracts | | (37,209 | ) |
Net Realized Gain (Loss) on Swap Agreements | | 6,455 | |
Net Investment Income | | 169,409 | |
Adjustments to Reconcile Net Investment Income to Net Cash Provided by Operating Activities: | | | |
Net (Increase) Decrease in Receivables Related to Operations | | (1,806 | ) |
Net Increase (Decrease) in Payables Related to Operations | | 48 | |
Accretion/Amortization of Discounts and Premiums | | 3,947 | |
Net Cash Provided by Operating Activities | | 95,540 | |
Cash Flows from Financing Activities: | | | |
Proceeds from Portfolio Shares Sold | | 578,396 | |
Payment on Portfolio Shares Redeemed | | (646,318 | ) |
Cash Dividends and Distributions Paid | | (27,894 | ) |
Net Cash Used in Financing Activities | | (95,816 | ) |
Net Increase (Decrease) in Cash | | (276 | ) |
Cash at Beginning of Period | | 4,483 | |
Cash at End of Period | | $ | 4,207 | |
The accompanying notes are an integral part of the financial statements.
24
| 2007 Annual Report |
| |
| September 30, 2007 |
Financial Highlights
Advisory Portfolio
| | Institutional Class | |
| | Year Ended September 30, | |
Selected Per Share Data and Ratios | | 2007 | | 2006 | | 2005 | | 2004 | | 2003 | |
Net Asset Value, Beginning of Period | | $ | 9.49 | | $ | 9.84 | | $ | 10.03 | | $ | 10.11 | | $ | 10.74 | |
Income from Investment Operations: | | | | | | | | | | | |
Net Investment Income† | | 0.51 | | 0.33 | | 0.36 | | 0.21 | | 0.23 | |
Net Realized and Unrealized Gain (Loss) on Investments | | (0.06 | ) | 0.11 | | 0.07 | | 0.21 | | 0.22 | |
Total from Investment Operations | | 0.45 | | 0.44 | | 0.43 | | 0.42 | | 0.45 | |
Distributions from and/or in Excess of: | | | | | | | | | | | |
Net Investment Income | | (0.61 | ) | (0.63 | ) | (0.62 | ) | (0.50 | ) | (0.51 | ) |
Net Realized Gain | | — | | — | | — | | — | | (0.57 | ) |
Return of Capital | | (0.04 | ) | (0.16 | ) | — | | — | | — | |
Total Distributions | | (0.65 | ) | (0.79 | ) | (0.62 | ) | (0.50 | ) | (1.08 | ) |
Net Asset Value, End of Period | | $ | 9.29 | | $ | 9.49 | | $ | 9.84 | | $ | 10.03 | | $ | 10.11 | |
Total Return+ | | 4.88 | % | 4.76 | % | 4.44 | % | 4.30 | % | 4.42 | % |
Ratios and Supplemental Data: | | | | | | | | | | | |
Net Assets, End of Period (Thousands) | | $ | 3,228,079 | | $ | 3,177,040 | | $ | 3,298,677 | | $ | 3,760,527 | | $ | 5,716,522 | |
Ratio of Expenses to Average Net Assets (1) | | 0.07 | %‡ | 0.08 | % | 0.08 | % | 0.08 | % | 0.08 | % |
Ratio of Net Investment Income to Average Net Assets (1) | | 5.42 | %‡ | 3.41 | % | 3.66 | % | 2.09 | % | 2.24 | % |
Portfolio Turnover Rate^ | | 218 | % | 230 | % | 240 | % | 512 | % | 120 | % |
| | | | | | | | | | | |
|
(1) Supplemental Information on the Ratios to Average Net Assets: | | | | | | | | | | | |
Ratios Before Expense Limitation: | | | | | | | | | | | |
Expenses to Average Net Assets | | 0.47 | %‡ | 0.48 | % | 0.47 | % | 0.49 | % | 0.49 | % |
Net Investment Income to Average Net Assets | | 5.02 | %‡ | 3.01 | % | 3.27 | % | 1.68 | % | 1.83 | % |
† | | Per share amount is based on average shares outstanding. |
+ | | Calculated based on the net asset value as of the last business day of the period. |
‡ | | Reflects rebate of certain Portfolio’s expenses in connection with the investments in Morgan Stanley Institutional Liquidity Money Market Portfolio — Institutional Class during the period. The impact of the rebate was 0.01% on the ratios. |
^ | | The Portfolio’s turnover rate is calculated by dividing the lesser of purchases and sales of securities for a fiscal year by the average monthly value of the portfolio securities during such fiscal year. The turnover rate may vary greatly from year to year as well as within a year. The Portfolio’s turnover rate reflects mortgage pool forward commitments as purchases and sales, which was not the case prior to the year ended September 30, 2004. The inclusion of such securities caused the reported turnover rate to be higher during the period than in previous fiscal years. |
The accompanying notes are an integral part of the financial statements.
25
2007 Annual Report
September 30, 2007
Financial Highlights
Advisory Global Fixed Income Portfolio
| | Institutional Class | |
| | Year Ended September 30, | |
Selected Per Share Data and Ratios | | 2007 | | 2006 | | 2005 | | 2004 | | 2003 | |
Net Asset Value, Beginning of Period | | $3.50 | | $3.41 | | $3.34 | | $3.29 | | $4.17 | |
Income (Loss) from Investment Operations: | | | | | | | | | | | �� |
Net Investment Income† | | 0.17 | | 0.18 | | 0.08 | | 0.06 | | 0.06 | |
Net Realized and Unrealized Gain (Loss) on Investments | | (0.11 | ) | (0.01 | )†† | 0.06 | | 0.01 | | 0.01 | |
Total from Investment Operations | | 0.06 | | 0.17 | | 0.14 | | 0.07 | | 0.07 | |
Distributions from and/or in Excess of: | | | | | | | | | | | |
Net Investment Income | | (0.15 | ) | (0.08 | ) | (0.07 | ) | (0.02 | ) | (0.34 | ) |
Net Realized Gain | | (0.01 | ) | — | | (0.00 | )# | (0.00 | )# | (0.61 | ) |
Total Distributions | | (0.16 | ) | (0.08 | ) | (0.07 | ) | (0.02 | ) | (0.95 | ) |
Net Asset Value, End of Period | | $3.40 | | $3.50 | | $3.41 | | $3.34 | | $3.29 | |
Total Return+ | | 1.77 | % | 4.93 | % | 4.30 | % | 2.15 | % | 1.88 | % |
Ratios and Supplemental Data: | | | | | | | | | | | |
Net Assets, End of Period (Thousands) | | $170,581 | | $164,510 | | $5,188 | | $101,210 | | $157,665 | |
Ratio of Expenses to Average Net Assets (1) | | 0.11 | %‡ | 0.15 | % | 0.15 | % | 0.15 | % | 0.22 | % |
Ratio of Net Investment Income to Average Net Assets (1) | | 4.85 | %‡ | 5.18 | % | 2.45 | % | 1.91 | % | 1.86 | % |
Portfolio Turnover Rate | | 69 | % | 11 | % | 7 | % | 10 | % | 13 | % |
| | | | | | | | | | | |
|
(1) Supplemental Information on the Ratios to Average Net Assets: | | | | | | | | | | | |
Ratios Before Expense Limitation: | | | | | | | | | | | |
Expenses to Average Net Assets | | 0.49 | %‡ | 0.63 | % | 0.57 | % | 0.53 | % | 0.54 | % |
Net Investment Income to Average Net Assets | | 4.47 | %‡ | 4.70 | % | 2.03 | % | 1.53 | % | 1.47 | % |
† | | Per share amount is based on average shares outstanding. |
†† | | The amount shown for a share outstanding does not correspond with the aggregate net gain (loss) on investments for the period due to timing of sales and repurchases of shares in relation to fluctuating market values of the investments of the Portfolio. |
# | | Amount is less than $0.005 per share. |
+ | | Calculated based on the net asset value as of the last business day of the period. |
‡ | | Reflects rebate of certain Portfolio’s expenses in connection with the investments in Morgan Stanley Institutional Liquidity Money Market Portfolio — Institutional Class during the period. The impact of the rebate was 0.03% on the ratios. |
The accompanying notes are an integral part of the financial statements.
26
| 2007 Annual Report |
| |
| September 30, 2007 |
Financial Highlights
Advisory Global Fixed Income Portfolio II
| | Institutional Class | |
| | Year Ended September 30, | |
Selected Per Share Data and Ratios | | 2007 | | 2006 | | 2005 | | 2004 | | 2003 | |
Net Asset Value, Beginning of Period | | $ | 12.30 | | $ | 12.00 | | $ | 11.84 | | $ | 11.63 | | $ | 11.60 | |
Income (Loss) from Investment Operations: | | | | | | | | | | | |
Net Investment Income† | | 0.55 | | 0.49 | | 0.29 | | 0.22 | | 0.24 | |
Net Realized and Unrealized Gain (Loss) on Investments | | 0.03 | | 0.02 | | 0.07 | | 0.05 | | (0.01 | ) |
Total from Investment Operations | | 0.58 | | 0.51 | | 0.36 | | 0.27 | | 0.23 | |
Distributions from and/or in Excess of: | | | | | | | | | | | |
Net Investment Income | | (0.42 | ) | (0.21 | ) | (0.20 | ) | (0.06 | ) | (0.20 | ) |
Net Realized Gain | | — | | — | | — | | (0.00 | )# | — | |
Total Distributions | | (0.42 | ) | (0.21 | ) | (0.20 | ) | (0.06 | ) | (0.20 | ) |
Net Asset Value, End of Period | | $ | 12.46 | | $ | 12.30 | | $ | 12.00 | | $ | 11.84 | | $ | 11.63 | |
Total Return+ | | 4.82 | % | 4.30 | % | 3.11 | % | 2.35 | % | 1.96 | % |
Ratios and Supplemental Data: | | | | | | | | | | | |
Net Assets, End of Period (Thousands) | | $ | 916 | | $ | 1,068 | | $ | 1,285 | | $ | 25,671 | | $ | 26,874 | |
Ratio of Expenses to Average Net Assets (1) | | 0.13 | %‡ | 0.15 | % | 0.15 | % | 0.15 | % | 0.22 | % |
Ratio of Net Investment Income to Average Net Assets (1) | | 4.46 | %‡ | 4.04 | % | 2.41 | % | 1.92 | % | 2.08 | % |
Portfolio Turnover Rate | | 12 | % | 91 | % | 15 | % | 11 | % | 50 | % |
| | | | | | | | | | | |
|
(1) Supplemental Information on the Ratios to Average Net Assets: | | | | | | | | | | | |
Ratios Before Expense Limitation: | | | | | | | | | | | |
Expenses to Average Net Assets | | 6.16 | %‡ | 5.36 | % | 0.81 | % | 0.62 | % | 1.23 | % |
Net Investment Income (Loss) to Average Net Assets | | (1.57 | )%‡ | (1.17 | )% | 1.75 | % | 1.45 | % | 1.00 | % |
† | | Per share amount is based on average shares outstanding. |
# | | Amount is less than $0.005 per share. |
+ | | Calculated based on the net asset value as of the last business day of the period. |
‡ | | Reflects rebate of certain Portfolio’s expenses in connection with the investments in Morgan Stanley Institutional Liquidity Money Market Portfolio — Institutional Class during the period. The impact of the rebate was 0.02% on the ratios. |
The accompanying notes are an integral part of the financial statements.
27
2007 Annual Report
September 30, 2007
Notes to Financial Statements
Morgan Stanley Institutional Fund Trust (“MSIFT”) or the “Fund”) is registered under the Investment Company Act of 1940, as amended (the “1940 Act”), as an open-end investment company. The Fund is comprised of eighteen active portfolios. The accompanying financial statements and financial highlights are those of the Advisory Portfolio, Advisory Global Fixed Income and Advisory Global Fixed Income Portfolio II (each referred to as a “Portfolio” or together as “Portfolios”) only. For the purposes of the 1940 Act, the Advisory Global Fixed Income Portfolio and Advisory Global Fixed Income Portfolio II are considered non-diversified funds; the Advisory Portfolio is considered a diversified fund. The financial statements of the remaining portfolios are presented separately.
A. Significant Accounting Policies. The following significant accounting policies are in conformity with U.S. generally accepted accounting principles. Such policies are consistently followed by the Fund in the preparation of its financial statements. U.S. generally accepted accounting principles may require management to make estimates and assumptions that affect the reported amounts and disclosures in the financial statements. Actual results may differ from those estimates.
1. Security Valuation: Bonds and other fixed income securities may be valued according to the broadest and most representative market. In addition, bonds and other fixed income securities may be valued on the basis of prices provided by a pricing service. The prices provided by a pricing service take into account broker dealer market price quotations for institutional size trading in similar groups of securities, security quality, maturity, coupon and other security characteristics as well as any developments related to the specific security. Debt securities purchased with remaining maturities of 60 days or less are valued at amortized cost, if it approximates market value. Equity securities listed on a U.S. exchange are valued at the latest quoted sales price on the valuation date. Equity securities listed or traded on NASDAQ, for which market quotations are available, are valued at the NASDAQ Official Closing Price. Securities listed on a foreign exchange are valued at their closing price, except as noted below. Unlisted and listed equity securities not traded on the valuation date, for which market quotations are readily available, are valued at the mean between the current bid and asked prices obtained from reputable brokers.
All other securities and investments for which market values are not readily available, including restricted securities, and those securities for which it is inappropriate to determine prices in accordance with the aforementioned procedures, are valued at fair value as determined in good faith under procedures adopted by the Board of Trustees (the “Trustees”), although the actual calculations may be done by others. Factors considered in making this determination may include, but are not limited to, information obtained by contacting the issuer, analysts, or the appropriate stock exchange (for exchange-traded securities), analysis of the issuer’s financial statements or other available documents and, if necessary, available information concerning other securities in similar circumstances.
Most foreign markets close before the New York Stock Exchange (NYSE). Occasionally, developments that could affect the closing prices of securities and other assets may occur between the times at which valuations of such securities are determined (that is, close of the foreign market on which the securities trade) and the close of business on the NYSE. If these developments are expected to materially affect the value of the securities, the valuations may be adjusted to reflect the estimated fair value as of the close of the NYSE, as determined in good faith under procedures established by the Trustees.
2. Repurchase Agreements: Each Portfolio may enter into repurchase agreements under which a Portfolio lends excess cash and takes possession of securities with an agreement that the counterparty will repurchase such securities. In connection with transactions in repurchase agreements, a bank as custodian for the Fund takes possession of the underlying securities which are held as collateral, with a market value at least equal to the amount of the repurchase transaction, including principal and accrued interest. To the extent that any repurchase transaction exceeds one business day, the value of the collateral is marked-to-market on a daily basis to determine the adequacy of the collateral. In the event of default on the obligation to repurchase, the Fund has the right to liquidate the collateral and apply the proceeds in satisfaction of the obligation. In the event of default or bankruptcy by the counterparty to the agreement, realization and/or retention of the collateral or proceeds may be subject to legal proceedings.
Pursuant to an exemptive order issued by the Securities and Exchange Commission, the Portfolios may transfer their uninvested cash balances into a joint trading account with other Portfolios of the Fund which invests in one or more repurchase agreements. Any such joint repurchase agreement is covered by the same collateral requirements discussed above.
At September 30, 2007, the Portfolios did not have any outstanding repurchase agreements.
3. Futures: Financial futures contracts (secured by cash and securities deposited with brokers as “initial margin”) are valued based upon their quoted daily settlement prices; changes in initial settlement value (represented by cash paid
28
| 2007 Annual Report |
| |
| September 30, 2007 |
Notes to Financial Statements (cont’d)
to or received from brokers as “variation margin”) are accounted for as unrealized appreciation (depreciation). When futures contracts are closed, the difference between the opening value at the date of purchase and the value at closing is recorded as realized gain or loss in the Statements of Operations. “Due from (to) Broker” includes initial margin and variation margin, as stated in the Statements of Assets and Liabilities.
Futures contracts may be used by each Portfolio in order to hedge against unfavorable changes in the value of securities or to attempt to realize profits from the value of the related securities.
Futures contracts involve market risk that may exceed the amounts recognized in the Statements of Assets and Liabilities. Risks arise from the possible movements in the prices of securities relating to these instruments. The change in value of futures contracts primarily corresponds with the value of their related securities, but may not precisely correlate with the change in value of such securities. In addition, there is the risk that a Portfolio may not be able to enter into a closing transaction because of an illiquid secondary market.
4. Securities Sold Short: Each Portfolio may sell securities short. A short sale is a transaction in which the Portfolio sells securities it may or may not own, but has borrowed, in anticipation of a decline in the market price of the securities. The Portfolio is obligated to replace the borrowed securities at their market price at the time of replacement. The Portfolio may have to pay a premium to borrow the securities as well as pay any dividends or interest payable on the securities until they are replaced. The Portfolio’s obligation to replace the securities borrowed in connection with a short sale will generally be secured by collateral deposited with the broker that consists of cash, U.S. government securities or other liquid high grade debt obligations. In addition, the Portfolio will either place in a segregated account with its custodian or denote on its custody records an amount of cash, U.S. government securities or other liquid high grade debt obligations equal to the difference, if any, between (1) the market value of the securities sold at the time they were sold short and (2) any cash, U.S. government securities or other liquid high grade debt obligations deposited as collateral with the broker in connection with the short sale (not including the proceeds of the short sale). Short sales by the Portfolios involve certain risks and special considerations. Possible losses from short sales differ from losses that could be incurred from a purchase of a security because losses from short sales may be unlimited, whereas losses from purchases cannot exceed the total amount invested.
5. Swap Agreements: Each Portfolio may enter into swap agreements to exchange the interest rate on, or return generated by, one nominal instrument for the return generated by another nominal instrument. Cash collateral for swap agreements, if applicable, is deposited with the broker serving as counterparty to the agreement, and is included in “Due from (to) Broker” on the Statements of Assets and Liabilities. The following summarizes swaps entered into by the Portfolios:
Credit Default Swaps: Credit default swaps involve commitments to pay a fixed rate in exchange for payment if a credit event affecting a third party (the referenced company) occurs. Credit events may include a failure to pay interest, bankruptcy, or restructuring. The Portfolio accrues for interim payments on swap contracts on a daily basis, with the net amount recorded within unrealized appreciation (depreciation) of swap contracts on the Statements of Assets and Liabilities. Once interim payments are settled in cash, the net amount is recorded within realized gain (loss) on swaps on the Statements of Operations. Credit default swaps are marked-to-market daily based upon quotations from market makers and the change, if any, is recorded as unrealized appreciation or depreciation in the Statements of Operations.
Interest Rate Swaps: Interest rate swaps involve the exchange of commitments to pay and receive interest based on a notional principal amount. The Portfolio accrues for interim payments on swap contracts on a daily basis, with the net amount recorded within unrealized appreciation (depreciation) of swap contracts on the Statements of Assets and Liabilities. Once interim payments are settled in cash, the net amount is recorded within realized gain (loss) on swaps on the Statements of Operations. In a zero-coupon interest rate swap, payments only occur at maturity, at which time one counterparty pays the total compounded fixed rate over the life of the swap and the other pays the total compounded floating rate that would have been earned had a series of LIBOR investments been rolled over through the life of the swap. The Portfolio amortizes its interest payment obligation over the life of the swap. The amortized portion of this payment is recorded within realized gain (loss) on the Statements of Operations. The unamortized portion of this payment is included in “Due from (to) Broker” on the Statements of Assets and Liabilities. Interest rate swaps are marked-to-market daily based upon quotations from market makers and the change, if any, is recorded as unrealized appreciation or depreciation in the Statements of Operations.
29
2007 Annual Report
September 30, 2007
Notes to Financial Statements (cont’d)
Total Return Swaps: Total return swaps involve commitments to pay interest in exchange for a market-linked return based on a notional amount. To the extent the total return of the security or index underlying the transaction exceeds or falls short of the offsetting interest rate obligation, the Portfolio will receive a payment from or make a payment to the counterparty, respectively. Total return swaps are marked-to-market daily based upon quotations from market makers and the change, if any, is recorded as unrealized appreciation or depreciation in the Statements of Operations. Periodic payments received or made at the end of each measurement period, but prior to termination, are recorded as realized gains or losses in the Statements of Operations.
Realized gains or losses on maturity or termination of swaps are presented in the Statements of Operations. Because there is no organized market for these swap agreements, the unrealized gain (loss) reported in the Statements of Assets and Liabilities may differ from that which would be realized in the event the Portfolio terminated its position in the agreement. Risks may arise upon entering into these agreements from the potential inability of the counterparties to meet the terms of the agreements and are generally limited to the amount of net interest payments to be received, if any, at the date of default. Risks also arise from potential losses from adverse market movements and such losses could exceed the related amounts shown in the Statements of Assets and Liabilities.
6. Structured Investments: Each Portfolio may invest in structured investments whose values are linked either directly or inversely to changes in foreign currencies, interest rates, commodities, indices, or other underlying instruments. A Portfolio uses these securities to increase or decrease its exposure to different underlying instruments and to gain exposure to markets that might be difficult to invest in through conventional securities. Structured investments may be more volatile than their underlying instruments, but any loss is limited to the amount of the original investment.
7. Delayed Delivery Commitments: Each Portfolio may purchase or sell securities on a when-issued or forward commitment basis. Payment and delivery may take place a month or more after the date of the transaction. The price of the underlying securities and the date when the securities will be delivered and paid for are fixed at the time the transaction is negotiated. Liquid securities or cash is designated in an amount at least equal to these commitments. Securities held for this purpose cannot be sold while this strategy is outstanding, unless replaced with other assets. As a result, there is a possibility that as designated assets reach certain levels, a Portfolio may lose some flexibility in managing its investments, responding to shareholder redemption requests, or meeting other current obligations. Such transactions may give rise to a form of leverage. This can cause a Portfolio to be more volatile than if it had not been leveraged, as leverage tends to exaggerate the effect of any increase or decrease in the value of the Portfolio’s securities.
8. Foreign Currency Translation and Foreign Currency Exchange Contracts: The books and records of the Fund are maintained in U.S. dollars. Foreign currency amounts are translated into U.S. dollars at the bid prices of such currencies against U.S. dollars quoted by a bank. Net realized gains (losses) on foreign currency transactions represent net foreign exchange gains (losses) from foreign currency exchange contracts, disposition of foreign currencies, currency gains or losses realized between the trade and settlement dates on securities transactions, and the difference between the amount of investment income and foreign withholding taxes recorded on a Portfolio’s books and the U.S. dollar equivalent of amounts actually received or paid.
A foreign currency exchange contract is an agreement between two parties to buy or sell currency at a set price on a future date. Each Portfolio may enter into foreign currency exchange contracts to protect securities and related receivables and payables against future changes in foreign exchange rates and, in certain situations, to gain exposure to foreign currencies. Certain Portfolios may also enter into cross currency hedges which involve the sale of one currency against the positive exposure to a different currency. Cross currency hedges may be used for hedging purposes or to establish an active exposure to the exchange rate between any two currencies. Fluctuations in the value of such contracts are recorded as unrealized appreciation or depreciation; realized gains or losses, which are disclosed in the Statements of Operations, include net gains or losses on contracts which have been terminated by settlements. Risks may arise upon entering into these contracts from the potential inability of counterparties to meet the terms of their contracts and are generally limited to the amount of unrealized gain on the contract, if any, at the date of default. Risks may also arise from unanticipated movements in the value of the foreign currency relative to the U.S. dollar.
The Advisory Global Fixed Income Portfolio and Advisory Global Fixed Income Portfolio II’s net assets include foreign denominated securities and currency. The net assets of these Portfolios are presented at the foreign exchange rates and market values at the close of the period. The Portfolios do not isolate that portion of the results of operations arising as a result of changes in the foreign exchange rates from the fluctuations arising from changes in the market prices of
30
| 2007 Annual Report |
| |
| September 30, 2007 |
Notes to Financial Statements (cont’d)
the securities held at period end. Similarly, the Portfolios do not isolate the effect of changes in foreign exchange rates from the fluctuations arising from changes in the market prices of securities sold during the period. Accordingly, the component of realized and unrealized foreign currency gains (losses) representing foreign exchange changes on investments is included in the reported net realized and unrealized gains (losses) on investment transactions and balances. Changes in currency exchange rates will affect the value of and investment income from such securities and currency.
Foreign security and currency transactions may involve certain considerations and risks not typically associated with those of U.S. dollar denominated transactions as a result of, among other factors, the possibly lower level of governmental supervision, relative currency valuation fluctuation, regulation of foreign securities markets and the possibility of political or economic instability.
9. Purchased and Written Options: Certain Portfolios may write covered call and put options on portfolio securities and other financial instruments. Premiums are received and are recorded as liabilities. The liabilities are subsequently adjusted to reflect the current value of the options written. Premiums received from writing options which expire are treated as realized gains. Premiums received from writing options which are exercised or are closed are added to or offset against the proceeds or amount paid on the transaction to determine the net realized gain or loss. By writing a covered call option, a Portfolio, in exchange for the premium, foregoes the opportunity for capital appreciation above the exercise price should the market price of the underlying security increase. By writing a put option, a Portfolio, in exchange for the premium, accepts the risk of having to purchase a security at an exercise price that is above the current market price.
Certain Portfolios may purchase call and put options on their portfolio securities or other financial instruments. Each Portfolio may purchase call options to protect against an increase in the price of the security or financial instrument it anticipates purchasing. Each Portfolio may purchase put options on securities which it holds or other financial instruments to protect against a decline in the value of the security or financial instrument or to close out covered written put positions. Risks may arise from an imperfect correlation between the change in market value of the securities held by the Portfolio and the prices of options relating to the securities purchased or sold by the Portfolio and from the possible lack of a liquid secondary market for an option. The maximum exposure to loss for any purchased option is limited to the premium initially paid for the option.
Options written for the year ended September 30, 2007 were as follows:
| | Total | | Total | |
| | Number of | | Premiums | |
| | Contracts | | Received | |
Advisory Global Fixed Income Portfolio | | (000) | | (000) | |
Options Outstanding — October 1, 2006 | | — | | $ | — | |
Options Written | | 27,670 | | 849 | |
Options Terminated in Closing Purchase Transactions | | (27,670 | ) | (849 | ) |
Options Expired | | — | | — | |
Options Exercised | | — | | — | |
Options Outstanding — September 30, 2007 | | — | | $ | — | |
10. New Accounting Pronouncements: In July 2006, the Financial Accounting Standards Board (“FASB”) issued Interpretation 48, “Accounting for Uncertainty in Income Taxes — an Interpretation of FASB Statement No. 109” (“FIN 48”). FIN 48 clarifies the accounting for income taxes by prescribing the minimum recognition threshold a tax position must meet before being recognized in the financial statements. FIN 48 is effective for fiscal years beginning after December 15, 2006 and is to be applied to all open tax years as of the effective date. Recent SEC guidance allows implementing FIN 48 in the Portfolio NAV calculations as late as the Portfolios’ last NAV calculation in the first required financial statement period. As a result, the Fund will incorporate FIN 48 in its next semi annual report. The impact to the Portfolios’ financial statements, if any, is currently being assessed.
In September 2006, Statement of Financial Accounting Standards No. 157, Fair Value Measurements (“SFAS 157”), was issued and is effective for fiscal years beginning after November 15, 2007. SFAS 157 defines fair value, establishes a framework for measuring fair value and expands disclosures about fair value measurements. Management is currently evaluating the impact the adoption of SFAS 157 will have on the Portfolios’ financial statement disclosures.
In February 2007, the FASB issued Statement of Financial Accounting Standards No. 159, “The Fair Value Option for Financial Assets and Financial Liabilities — including an amendment of FASB Statement No. 115” (“SFAS 159”), which is effective for fiscal years beginning after November 15, 2007. SFAS 159 permits entities to elect to measure certain financial assets and liabilities at fair value. The fair value option may be applied instrument by instrument, is irrevocable and is applied only to entire instruments and not to portions of instruments. SFAS 159 also establishes presentation and disclosure requirements
31
2007 Annual Report
September 30, 2007
Notes to Financial Statements (cont’d)
designed to facilitate comparisons between entities that choose different measurement attributes for similar types of assets and liabilities. Management is currently evaluating the impact the adoption of SFAS 159 will have on the Portfolios’ financial statement disclosures.
11. Other: Security transactions are accounted for on the date the securities are purchased or sold. Costs used in determining realized gains and losses on the sale of investment securities are those of specific securities sold.
Discounts and premiums on securities purchased are accreted/amortized over their respective lives. Most expenses of the Fund can be directly attributed to a particular Portfolio. Expenses which cannot be directly attributed are apportioned among the Portfolios on the basis of their relative net assets.
B. Investment Advisory Fees. Morgan Stanley Investment Management Inc. (the “Adviser” or “MS Investment Management”), a wholly-owned subsidiary of Morgan Stanley, performs investment advisory services at a fee calculated by applying a quarterly rate based on an annual percentage rate of 0.375% of each Portfolio’s average daily net assets for the quarter.
The Adviser has voluntarily agreed to reduce the fees payable to it and, if necessary, reimburse the Portfolios for certain expenses, after giving effect to custody fee offsets, if annual operating expenses exceed 0.08%, 0.15% and 0.15% of average daily net assets of the Advisory Portfolio, Advisory Global Fixed Income Portfolio, and Advisory Global Fixed Income Portfolio II, respectively.
Fee waivers and/or expense reimbursements are voluntary and may be commenced or terminated at any time. For the year ended September 30, 2007, the Portfolios had advisory fees waived and/or certain expenses reimbursed as follows:
| | Advisory Fees Waived | |
| | and/or Reimbursed | |
Portfolio | | (000) | |
| | | | |
Advisory | | $ | 12,282 | |
Advisory Global Fixed Income | | 626 | |
Advisory Global Fixed Income II | | 63 | |
Morgan Stanley Investment Management Limited (“MSIM Limited”) serves as Sub-Adviser to the Advisory Global Fixed Income Portfolio and the Advisory Global Fixed Income Portfolio II. MSIM Limited is a wholly-owned subsidiary of Morgan Stanley. Under an Investment Sub-Advisory Agreement with the Adviser, MSIM Limited, subject to the control and supervision of the Fund, its Officers, Trustees and the Adviser, and in accordance with the investment objectives, policies and restrictions of these Portfolios, makes certain day-to-day investment decisions for these Portfolios and places certain of the Portfolios’ purchase and sales orders. The Adviser pays MSIM Limited on a monthly basis a portion of the net advisory fees the Adviser receives from these Portfolios.
C. Administration Fees. MS Investment Management (the “Administrator”) also provides the Fund with administration services pursuant to an administration agreement for an annual fee, accrued daily and paid monthly, of 0.08% of each Portfolio’s average daily net assets.
Under an agreement between the Administrator and JPMorgan Investor Services Co. (“JPMIS”), a corporate affiliate of JPMorgan Chase Bank, N.A., JPMIS provides certain administrative services to the Fund. For such services, the Administrator pays JPMIS a portion of the fee the Administrator receives from the Fund. An employee of JPMIS is an officer of the Fund.
D. Distributor. Morgan Stanley Distribution, Inc. (“MSDI” or the “Distributor”), a wholly-owned subsidiary of the Adviser, serves as the distributor for the Fund.
E. Custodian Fees. JPMorgan Chase Bank, N.A. (the “Custodian”) serves as Custodian for the Fund in accordance with a custodian agreement. The Custodian holds cash, securities, and other assets of the Fund as required by the 1940 Act.
The Fund has entered into an arrangement with its Custodian whereby credits realized on uninvested cash balances were used to offset a portion of each applicable Portfolio’s expenses. These custodian credits are shown as “Expense Offset” on the Statements of Operations.
F. Portfolio Investment Activity.
1. Security Transactions: For the year ended September 30, 2007, purchases and sales of investment securities other than temporary cash investments and long-term U.S. government securities were:
| | Purchases | | Sales | |
Portfolio | | (000) | | (000) | |
| | | | | |
Advisory | | $ | 6,033,416 | | $ | 4,613,270 | |
Advisory Global Fixed Income | | 42,232 | | 49,511 | |
Advisory Global Fixed Income II | | 51 | | 156 | |
| | | | | | | |
For the year ended September 30, 2007, purchases and sales of long-term U.S. government securities were:
| | Purchases | | Sales | |
Portfolio | | (000) | | (000) | |
| | | | | |
Advisory | | $ | 1,350,527 | | $ | 2,439,259 | |
| | | | | | | |
32
| 2007 Annual Report |
| |
| September 30, 2007 |
Notes to Financial Statements (cont’d)
2. Transactions with Affiliates: The Portfolios invest in the Institutional Class of portfolios within the Morgan Stanley Institutional Liquidity Funds (the ‘‘Liquidity Funds’’), an open-end management investment companies managed by the Adviser.
A summary of the Portfolios’ transactions in the shares of affiliated issuers during the year ended September 30, 2007 is set forth below:
| | Market Value | | Purchases | | Sales | | Interest | | Market Value | |
| | September 30, 2006 | | at Cost | | Proceeds | | Income | | September 30, 2007 | |
Portfolios | | (000) | | (000) | | (000) | | (000) | | (000) | |
| | | | | | | | | | | |
Advisory | | $ | — | | $ | 1,404,176 | | $ | 1,072,781 | | $ | 10,522 | | $ | 331,395 | |
Advisory Global Fixed Income | | — | | 119,045 | | 13,189 | | 2,536 | | 105,856 | |
Advisory Global Fixed Income II | | — | | 654 | | 246 | | 13 | | 408 | |
| | | | | | | | | | | | | | | | |
Investment Advisory fees paid by the Portfolios are reduced by an amount equal to their pro-rata share of the advisory and administration fees paid by the Liquidity Funds (‘‘Rebate’’). For the year ended September 30, 2007, advisory fees paid were reduced as follows:
| | Rebate | |
Portfolio | | (000) | |
| | | |
Advisory | | $ | 210 | |
Advisory Global Fixed Income | | 51 | |
Advisory Global Fixed Income II | | @— | |
| | | | |
@ Amount is less than $500.
G. Securities Lending. Certain Portfolios may lend securities to qualified financial institutions, such as broker-dealers, to earn additional income. Any increase or decrease in the fair value of the securities loaned that might occur and any interest earned or dividends declared on those securities during the term of the loan would remain in the Portfolio. Portfolios that lend securities receive cash or securities as collateral in an amount equal to or exceeding 100% of the current fair value of the loaned securities. The collateral is marked to market daily, by the securities lending agent, to ensure that a minimum of 100% collateral coverage is maintained.
Based on pre-established guidelines, the securities lending agent invests any cash collateral that is received in high-quality short-term investments. Securities lending income is generated from the earnings on the invested collateral and borrowing fees, less any rebates owed to the borrowers and compensation to the lending agent, and is included in the Portfolios’ Statements of Operations in interest income. Risks in securities lending transactions are that a borrower may not provide additional collateral when required or return the securities when-due, and that the value of the short-term investments will be less than the amount of cash collateral plus any rebate that is required to be returned to the borrower. The value of loaned securities and related collateral outstanding at September 30, 2007 are as follows:
| | Value of | | | |
| | Loaned | | Value of | |
| | Securities | | Collateral | |
Portfolio | | (000) | | (000) | |
| | | | | |
Advisory | | $ | 7,669 | | $ | 7,756 | |
| | | | | | | |
The following Portfolios had income from securities lending (after rebates to borrowers and allocation to the securities lending agent):
| | Net Interest | |
| | Earned by | |
| | Portfolio | |
Portfolio | | (000) | |
| | | |
Advisory | | $ | 89 | |
| | | | |
H. Federal Income Taxes. It is each Portfolio’s intention to continue to qualify as a regulated investment company and distribute all of its taxable income. Accordingly, no provision for Federal income taxes is required in the financial statements. Dividend income and distributions to shareholders are recorded on the ex-dividend date. Interest income is recognized on the accrual basis. Dividends from net investment income, if any, are declared and paid quarterly for the Advisory Global Fixed Income Portfolio and Advisory Global Fixed Income Portfolio II and monthly for the Advisory Portfolio. Net realized capital gains, if any, are distributed at least annually.
The tax character of distributions paid may differ from the character of distributions shown on the Statements of Changes in Net Assets due to short-term capital gains being treated as ordinary income for tax purposes. The tax character
33
2007 Annual Report
September 30, 2007
Notes to Financial Statements (cont’d)
of distributions paid during fiscal 2007 and 2006 were as follows:
| | 2007 Distributions | | 2006 Distributions | |
| | Paid From: | | Paid From: | |
| | | | | | Long- | | | | | | Long- | |
| | | | | | Term | | | | | | Term | |
| | Ordinary | | Return of | | Capital | | Ordinary | | Return of | | Capital | |
| | Income | | Capital | | Gain | | Income | | Capital | | Gain | |
Portfolio | | (000) | | (000) | | (000) | | (000) | | (000) | | (000) | |
| | | | | | | | | | | | | |
Advisory | | $ | 205,869 | | $ | 12,396 | | $ | — | | $ | 205,755 | | $ | 54,511 | | $ | — | |
Advisory Global Fixed Income | | 7,688 | | — | | — | | 652 | | — | | — | |
Advisory Global Fixed Income II | | 36 | | — | | — | | 21 | | — | | — | |
| | | | | | | | | | | | | | | | | | | |
The amount and character of income and gains to be distributed are determined in accordance with income tax regulations which may differ from U.S. generally accepted accounting principles. The book/tax differences are either considered temporary or permanent in nature.
Temporary differences are generally due to differing book and tax treatments in the timing of the recognition of gains or losses on securities, forwards and futures, including Post- October Losses.
Permanent differences are generally due to swap transactions, paydown adjustments, foreign futures transactions, foreign currency transactions and investment in certain foreign fixed income securities. These resulted in the following reclassifications among the Portfolios’ components of net assets at September 30, 2007:
| | Undistributed | | | | | |
| | (Distributions | | | | | |
| | in Excess of) | | | | | |
| | Net | | Accumulated Net | | | |
| | Investment | | Realized | | Paid-in | |
| | Income (Loss) | | Gain (Loss) | | Capital | |
Portfolio | | (000) | | (000) | | (000) | |
| | | | | | | |
Advisory | | $ | 59,661 | | $ | (40,023 | ) | $ | (19,638 | ) |
Advisory Global Fixed Income | | (5,402 | ) | 5,402 | | — | |
Advisory Global Fixed Income II | | (13 | ) | 13 | | — | |
| | | | | | | | | | |
At September 30, 2007, the components of distributable earnings on a tax basis were as follows:
| | Undistributed | |
| | Ordinary Income | |
Portfolio | | (000) | |
| | | |
Advisory Global Fixed Income | | $ | 2,447 | |
Advisory Global Fixed Income II | | 14 | |
| | | | |
At September 30, 2007, cost, unrealized appreciation, unrealized depreciation and net unrealized appreciation (depreciation) of securities for Federal income tax purposes were:
| | | | | | | | Net | |
| | | | | | | | Appreciation | |
| | Cost | | Appreciation | | Depreciation | | (Depreciation) | |
Portfolio | | (000) | | (000) | | (000) | | (000) | |
| | | | | | | | | |
Advisory | | $ | 4,336,745 | | $ | 21,202 | | $ | (137,256 | ) | $ | (116,054 | ) |
Advisory Global Fixed Income | | 166,280 | | 4,482 | | (4,174 | ) | 308 | |
Advisory Global Fixed Income II | | 752 | | 42 | | — | | 42 | |
| | | | | | | | | | | | | |
At September 30, 2007, the following Portfolios had available for Federal income tax purposes unused capital losses, which will expire on the indicated dates:
| | Expiration Date September 30, | |
| | (000) | |
Portfolio | | 2012 | | 2013 | | 2014 | | 2015 | | Total | |
| | | | | | | | | | | |
Advisory | | $ | 152,714 | | $ | 62,736 | | $ | 19,857 | | $ | 61,283 | | $ | 296,590 | |
Advisory Global Fixed Income II | | — | | — | | — | | @— | | @— | |
| | | | | | | | | | | | | | | | |
@ Amount is less than $500.
To the extent that capital loss carryforwards are used to offset any future capital gains realized during the carryforwards period as provided by U.S. Federal income tax regulations, no capital gains tax liability will be incurred by a portfolio for gains realized and not distributed. To the extent that capital gains are offset, such gains will not be distributed to the shareholders.
During the year ended September 30, 2007, the Advisory Global Fixed Income Portfolio utilized capital loss carryforwards for U.S. Federal income tax purposes of approximately $32,000.
Under current tax law, certain capital and net foreign exchange losses realized after October 31 may be deferred and treated as occurring on the first day of the following fiscal year. For the year ended September 30, 2007, the Advisory Portfolio elected to defer capital losses and Advisory Global Fixed Income Portfolio elected to defer currency losses occurring between November 1, 2006 and September 30, 2007 up to approximately $51,061,000 and $3,080,000, respectively.
I. Contractual Obligations. The Fund enters into contracts that contain a variety of indemnifications. The Fund’s maximum exposure under these arrangements is unknown. However, the Fund has not had prior claims or losses pursuant to these contracts and expects the risk of loss to be remote.
J. Other. At September 30, 2007, the Advisory Portfolio, Advisory Global Fixed Income Portfolio and Advisory Global Fixed Income Portfolio II each had otherwise unaffiliated record owners of 10% or greater. Investment activities of these shareholders could have a material impact on the Portfolios. The aggregate percentage of such owners was 15.3%, 30.4% and 94.8%, respectively.
34
| 2007 Annual Report |
| |
| September 30, 2007 |
Report of Independent Registered Public Accounting Firm
To the Board of Trustees and Shareholders of Morgan Stanley Institutional Fund Trust:
We have audited the accompanying statements of assets and liabilities of Advisory Portfolio, Advisory Global Fixed Income Portfolio (formerly, Advisory Foreign Fixed Income Portfolio) and Advisory Global Fixed Income Portfolio II (formerly, Advisory Foreign Fixed Income II Portfolio) (the “Portfolios”) (three of the Portfolios constituting Morgan Stanley Institutional Fund Trust), including the portfolios of investments, as of September 30, 2007, and the related statements of operations for the year then ended, the statement of cash flows for Advisory Portfolio for the year then ended, the statements of changes in net assets for each of the two years in the period then ended, and the financial highlights for each of the five years in the period then ended. These financial statements and financial highlights are the responsibility of the Portfolios’ management. Our responsibility is to express an opinion on these financial statements and financial highlights based on our audits.
We conducted our audits in accordance with the standards of the Public Company Accounting Oversight Board (United States). Those standards require that we plan and perform the audit to obtain reasonable assurance about whether the financial statements and financial highlights are free of material misstatement. We were not engaged to perform an audit of the Portfolios’ internal control over financial reporting. Our audits included consideration of internal control over financial reporting as a basis for designing audit procedures that are appropriate in the circumstances, but not for the purpose of expressing an opinion on the effectiveness of the Portfolios’ internal control over financial reporting. Accordingly, we express no such opinion. An audit also includes examining, on a test basis, evidence supporting the amounts and disclosures in the financial statements and financial highlights, assessing the accounting principles used and significant estimates made by management, and evaluating the overall financial statement presentation. Our procedures included confirmation of securities owned as of September 30, 2007, by correspondence with the custodian and brokers or by other appropriate auditing procedures where replies from brokers were not received. We believe that our audits provide a reasonable basis for our opinion.
In our opinion, the financial statements and financial highlights referred to above present fairly, in all material respects, the financial position of the aforementioned three Portfolios of Morgan Stanley Institutional Fund Trust at September 30, 2007, the results of their operations for the year then ended, the cash flows for Advisory Portfolio for the year then ended, the changes in their net assets for each of the two years in the period then ended, and the financial highlights for each of the five years in the period then ended, in conformity with U.S. generally accepted accounting principles.

Boston, Massachusetts
November 19, 2007
35
2007 Annual Report
September 30, 2007
Federal Income Tax Information: (unaudited)
For Federal income tax purposes, the following information is furnished with respect to the distributions paid by each applicable Portfolio during the taxable year ended September 30, 2007.
17.5% of the Advisory Portfolio was attributable to qualifying U.S. Government obligations. (Please consult your tax advisor to determine if any portion of the dividends you received is exempt from state income tax.).
In January, each applicable Portfolio provides tax information to shareholders for the preceding calendar year.
36
| 2007 Annual Report |
| |
| September 30, 2007 |
An Important Notice Concerning Our U.S. Privacy Policy (unaudited)
POLICY CONCERNING CUSTOMER INFORMATION
Morgan Stanley Institutional Fund Trust (the “Fund”) is required by federal law to provide you with a copy of their Privacy Policy (the “Policy”) annually. The following Policy applies to current and former individual clients of the Fund. This Policy is not applicable to partnerships, corporations, trusts or other non-individual clients or account holders. Please note that this Policy may be amended at any time, and that you will be informed of any changes to this Policy as required by law.
THE FUND RESPECTS YOUR PRIVACY
The Fund appreciates that you have provided your personal financial information and strive to maintain the privacy of such information. This Policy describes, and is designed to help you understand, what non-public personal information the Fund may collect about you, why the Fund collects it, and when the Fund may share it with others. Throughout this Policy, the non-public information that personally identifies you or your accounts is referred to as “personal information.”
1. WHAT PERSONAL INFORMATION DOES THE FUND COLLECT ABOUT YOU?
To serve you better and manage your investment, it is important that the Fund collects and maintains accurate information about you. The Fund obtains this information from applications and other forms you submit, from your dealings with the Fund, and from third parties and other sources.
For example:
• The Fund collects information such as your name, address, e-mail address, and telephone/fax numbers through applications and other forms you may submit.
• The Fund may obtain information about account balances, your use of account(s) and the types of products and services you prefer to receive through your dealings and transactions with the Fund and other sources.
• The Fund may collect background information from and through third-party vendors to verify representations you have made and to comply with various regulatory requirements.
2. WHEN DOES THE FUND DISCLOSE PERSONAL INFORMATION COLLECTED ABOUT YOU?
To provide you with the products and services you request, to serve you better and to manage your investment, the Fund may disclose personal information collected about you to affiliated companies and to non-affiliated third parties as required or permitted by law.
a. Information the Fund discloses to affiliated companies:
The Fund does not disclose personal information collected about you to affiliated companies except to enable them to provide services on their behalf or as otherwise required or permitted by law.
b. Information the Fund discloses to third parties:
The Fund does not disclose personal information collected about you to non-affiliated third parties except to enable them to provide services on the Fund’s behalf, to perform joint marketing agreements with other financial institutions, or as otherwise required or permitted by law. For example, some instances where the Fund may disclose information about you to non-affiliated third parties include: for servicing and processing transactions, to protect against fraud, for institutional risk control or to respond to judicial process. When the Fund shares personal information with these third parties, they are required to limit their use of personal information to the particular purpose for which it was shared and they are not allowed to share personal information with others except to fulfill that limited purpose.
37
2007 Annual Report
September 30, 2007
An Important Notice Concerning Our U.S. Privacy Policy (cont’d)
3. HOW DOES THE FUND PROTECT THE SECURITY AND CONFIDENTIALITY OF PERSONAL INFORMATION COLLECTED ABOUT YOU?
The Fund and/or its service providers maintain physical, electronic and procedural security measures to help safeguard the personal information collected about you. The Fund and its service providers have internal policies governing the proper handling of client information. Third parties that provide support or marketing services on the Fund’s behalf may also receive personal information, and they are required to adhere to confidentiality standards with respect to such information.
If you have any questions regarding this Policy, please contact a Fund representative at (800) 548-7786.
© 2007 Morgan Stanley Institutional Fund Trust
38
| 2007 Annual Report |
| |
| September 30, 2007 |
Trustee and Officer Information (unaudited)
Independent Trustees:
Name, Age and Address of
Independent Trustee | | Position(s) Held
with Registrant | | Length of
Time Served* | | Principal Occupation(s) During Past 5 Years | | Number of
Portfolios in
Fund Complex
Overseen by
Independent
Trustee** | | Other Directorships Held by
Independent Trustees |
Frank L. Bowman (62)
c/o Kramer Levin Naftalis & Frankel LLP Counsel to the Independent Trustees 1177 Avenue of the Americas
New York, NY 10036 | | Trustee | | Since August 2006 | | President and Chief Executive Officer, Nuclear Energy Institute (policy organization) (since February 2005); Director or Trustee of various Retail Funds and Institutional Funds (since August 2006); Chairperson of the Insurance Sub-Committee of the Valuation, Insurance and Compliance Committee (since February 2007); formerly, variously, Admiral in the U.S. Navy, Director of Naval Nuclear Propulsion Program and Deputy Administrator — Naval Reactors in the National Nuclear Security Administration at the U.S. Department of Energy (1996-2004). Honorary Knight Commander of the Most Excellent Order of the British Empire. | | 171 | | Director of the National Energy Foundation, the U.S. Energy Association, the American Council for Capital Formation and the Armed Services YMCA of the USA. |
| | | | | | | | | | |
Michael Bozic (66)
c/o Kramer Levin
Naftalis & Frankel LLP
Counsel to the Independent Trustees
1177 Avenue of the Americas
New York, NY 10036 | | Trustee | | Since April 1994 | | Private investor; Chairperson of the Valuation, Insurance and Compliance Committee (since October 2006); Director or Trustee of the Retail Funds (since April 1994) and the Institutional Funds (since July 2003); formerly, Chairperson of the Insurance Committee (July 2006-September 2006); Vice Chairman of Kmart Corporation (December 1998-October 2000), Chairman and Chief Executive Officer of Levitz Furniture Corporation (November 1995-November 1998) and President and Chief Executive Officer of Hills Department Stores (May 1991-July 1995); variously Chairman, Chief Executive Officer, President and Chief Operating Officer (1987-1991) of the Sears Merchandise Group of Sears, Roebuck & Co. | | 173 | | Director of various business organizations. |
| | | | | | | | | | |
Kathleen A. Dennis (54)
c/o Kramer Levin Naftalis & Frankel LLP
Counsel to the Independent Trustees
1177 Avenue of the Americas
New York, NY 10036 | | Trustee | | Since August 2006 | | President, Cedarwood Associates (mutual fund consulting) (since July 2006); Chairperson of the Money Market and Alternatives Sub-Committee of the Investment Committee (since October 2006) and Director or Trustee of various Retail Funds and Institutional Funds (since August 2006); formerly, Senior Managing Director of Victory Capital Management (1993-2006). | | 171 | | None. |
| | | | | | | | | | |
Dr. Manuel H. Johnson (58)
c/o Johnson Smick Group, Inc.
888 16th Street, NW
Suite 740
Washington, D.C. 20006 | | Trustee | | Since July 1991 | | Senior Partner, Johnson Smick International, Inc. (consulting firm); Chairperson of the Investment Committee (since October 2006) and Director or Trustee of the Retail Funds (since July 1991) and the Institutional Funds (since July 2003); Co-Chairman and a founder of the Group of Seven Council (G7C) (international economic commission); formerly, Chairperson of the Audit Committee (July 1991-September 2006); Vice Chairman of the Board of Governors of the Federal Reserve System and Assistant Secretary of the U.S. Treasury. | | 173 | | Director of NVR, Inc. (home construction); Director of Evergreen Energy. |
| | | | | | | | | | |
Joseph J. Kearns (65)
c/o Kearns & Associates LLC
PMB754 23852
Pacific Coast Highway
Malibu, CA 90265 | | Trustee | | Since August 1994 | | President, Kearns & Associates LLC (investment consulting); Chairperson of the Audit Committee (since October 2006) and Director or Trustee of the Retail Funds (since July 2003) and the Institutional Funds (since August 1994); formerly, Deputy Chairperson of the Audit Committee (July 2003-September 2006) and Chairperson of the Audit Committee of the Institutional Funds (October 2001- July 2003); CFO of the J. Paul Getty Trust. | | 174 | | Director of Electro Rent Corporation (equipment leasing), The Ford Family Foundation and the UCLA Foundation. |
39
2007 Annual Report
September 30, 2007
Trustee and Officer Information (cont’d)
Independent Trustees:
Name, Age and Address of
Independent Trustee | | Position(s) Held
with Registrant | | Length of
Time Served* | | Principal Occupation(s) During Past 5 Years | | Number of
Portfolios in
Fund Complex
Overseen by
Independent
Trustee** | | Other Directorships Held by
Independent Trustees |
Michael F. Klein (48)
c/o Kramer Levin Naftalis & Frankel LLP
Counsel to the Independent Trustees
1177 Avenue of the Americas
New York, NY 10036 | | Trustee | | Since August 2006 | | Managing Director, Aetos Capital, LLC (since March 2000) and Co-President, Aetos Alternatives Management, LLC (since January 2004); Chairperson of the Fixed- Income Sub-Committee of the Investment Committee (since October 2006) and Director or Trustee of various Retail Funds and Institutional Funds (since August 2006); formerly, Managing Director, Morgan Stanley & Co., Inc. and Morgan Stanley Dean Witter Investment Management, President, Morgan Stanley Institutional Funds (June 1998-March 2000) and Principal, Morgan Stanley & Co., Inc. and Morgan Stanley Dean Witter Investment Management (August 1997-December 1999). | | 171 | | Director of certain investment funds managed or sponsored by Aetos Capital, LLC; Director of Sanitized AG and Sanitized Marketing AG (specialty chemicals). |
| | | | | | | | | | |
Michael E. Nugent (71)
c/o Triumph Capital, L.P.
445 Park Avenue
New York, NY 10022 | | Chairperson of the Board and Trustee | | Chairperson of the Boards since July 2006 and Trustee since July 1991 | | General Partner, Triumph Capital, L.P. (private investment partnership); Chairperson of the Boards of the Retail Funds and Institutional Funds (since July 2006); Director or Trustee of the Retail Funds (since July 1991) and the Institutional Funds (since July 2001); formerly, Chairperson of the Insurance Committee (until July 2006); Vice President, Bankers Trust Company and BT Capital Corporation (1984-1988). | | 173 | | None. |
| | | | | | | | | | |
W. Allen Reed (60)
c/o Kramer Levin Naftalis & Frankel LLP
Counsel to the Independent Trustees
1177 Avenue of the Americas
New York, NY 10036 | | Trustee | | Since August 2006 | | Chairperson of the Equity Sub-Committee of the Investment Committee (since October 2006) and Director or Trustee of various Retail Funds and Institutional Funds (since August 2006); formerly, President and CEO of General Motors Asset Management; Chairman and Chief Executive Officer of the GM Trust Bank and Corporate Vice President of General Motors Corporation (July 1994-December 2005). | | 171 | | Director of GMAC (financial services) and Temple-Inland Industries (packaging, banking and forest products); Director of Legg Mason, Inc. and Director of the Auburn University Foundation. |
| | | | | | | | | | |
Fergus Reid (75)
c/o Lumelite Plastics Corporation
85 Charles Coleman Blvd.
Pawling, NY 12564 | | Trustee | | Since June 1992 | | Chairman of Lumelite Plastics Corporation; Chairperson of the Governance Committee and Director or Trustee of the Retail Funds (since July 2003) and the Institutional Funds (since June 1992). | | 174 | | Trustee and Director of certain investment companies in the JPMorgan Funds complex managed by JP Morgan Investment Management Inc. |
40
| 2007 Annual Report |
| |
| September 30, 2007 |
Trustee and Officer Information (cont’d)
Interested Trustees:
| | | | | | | | Number of | | | |
| | | | | | | | Portfolios in | | | |
| | | | | | | | Fund Complex | | | |
| | Position(s) | | Term of Office | | | | Overseen by | | | |
Name, Age and Address of | | Held with | | and Length of | | | | Interested | | Other Directorships Held by Interested | |
Interested Trustee | | Registrant | | Time Served* | | Principal Occupation(s) During Past 5 Years | | Trustee** | | Trustee | |
James F. Higgins (59)
c/o Morgan Stanley Trust
Harborside Financial Center
Plaza Two
Jersey City, NJ 07311 | | Trustee | | Since June
2000 | | Director or Trustee of the Retail Funds (since June 2000) and the Institutional Funds (since July 2003); Senior Advisor of Morgan Stanley (since August 2000). | | 173 | | Director of AXA Financial, Inc. and The Equitable Life Assurance Society of the United States (financial services). | |
* | This is the earliest date the Trustee began serving the Retail Funds or Institutional Funds. Each Trustee serves an indefinite term, until his or her successor is elected. |
** | The Fund Complex includes all funds advised by Morgan Stanley Investments LP (“MSI”) that have an investment advisor that is an affiliated entity of MSI (including but not limited to, Morgan Stanley Investment Management Inc. (“MSIM”), Morgan Stanley Investment Advisors Inc. (“MSIA”) and Morgan Stanley AIP GP LP). The Retail Funds are those funds advised by MSIA. The Institutional Funds are certain U.S. registered funds advised by MSI, MSIM and Morgan Stanley AIP GP LP. |
Additional information about the Fund’s Trustees can be found in the Fund’s Statement of Additional Information (SAI). The SAI may be obtained without charge upon request, by calling the Fund at 1-800-548-7786. You may also retrieve this information on-line at the Securities and Exchange Commission’s website at “http://www.sec.gov”. To aid you in obtaining this information on-line, the Fund’s Central Index Key (CIK) number is 0000741375 and the SAI is found within form type 485BPOS.
41
2007 Annual Report
September 30, 2007
Trustee and Officer Information (cont’d)
Executive Officers:
| | Position(s) | | Term of Office | | | |
| | Held with | | and Length of | | | |
Name, Age and Address of Executive Officer | | Registrant | | Time Served* | | Principal Occupation(s) During Past 5 Years | |
| | | | | | | |
Ronald E. Robison (68)
Morgan Stanley Investment Management Inc.
522 Fifth Avenue
New York, NY 10036 | | President and Principal Executive Officer | | President since September 2005 and Principal Executive Officer since May 2003 | | President (since September 2005) and Principal Executive Officer (since May 2003) of funds in the Fund Complex; President (since September 2005) and Principal Executive Officer (since May 2003) of the Van Kampen Funds; Managing Director, Director and/or Officer of the Adviser and various entities affiliated with the Adviser; Director of Morgan Stanley SICAV (since May 2004). Formerly, Executive Vice President (July 2003 to September 2005) of funds in the Fund Complex and the Van Kampen Funds; President and Director of the Institutional Funds (March 2001 to July 2003); Chief Administrative Officer of Morgan Stanley Investment Advisors Inc.; Chief Administrative Officer of Morgan Stanley Services Company Inc. | |
| | | | | | | |
J. David Germany (53)
Morgan Stanley Investment Management Ltd.
20 Bank Street
Canary Wharf
London, England
E144AD | | Vice President | | Since February 2006 | | Managing Director and (since December 2005) Chief Investment Officer—Global Fixed Income of Morgan Stanley Investment Management; Managing Director and Director of Morgan Stanley Investment Management Limited; Vice President of the Retail Funds and Institutional Funds (since February 2006). | |
| | | | | | | |
Dennis F. Shea (54)
Morgan Stanley Investment Management Inc.
522 Fifth Avenue
New York, NY 10036 | | Vice President | | Since February 2006 | | Managing Director and (since February 2006) Chief Investment Officer—Global Equity of Morgan Stanley Investment Management; Vice President of the Retail Funds and Institutional Funds (since February 2006). Formerly, Managing Director and Director of Global Equity Research at Morgan Stanley. | |
| | | | | | | |
Amy R. Doberman (45)
Morgan Stanley Investment Management Inc.
522 Fifth Avenue
New York, NY 10036 | | Vice President | | Since July 2004 | | Managing Director and General Counsel, U.S. Investment Management of Morgan Stanley Investment Management (since July 2004); Vice President of the Retail Funds and Institutional Funds (since July 2004); Vice President of the Van Kampen Funds (since August 2004); Secretary (since February 2006) and Managing Director (since July 2004) of the Adviser and various entities affiliated with the Adviser. Formerly, Managing Director and General Counsel — Americas, UBS Global Asset Management (July 2000-July 2004). | |
| | | | | | | |
Carsten Otto (43)
Morgan Stanley Investment Management Inc.
522 Fifth Avenue
New York, NY 10036 | | Chief Compliance Officer | | Since October 2004 | | Managing Director and Global Head of Compliance for Morgan Stanley Investment Management (since April 2007) and Chief Compliance Officer of Morgan Stanley Retail Funds and Institutional Funds (since October 2004). Formerly, U.S. Director of Compliance (October 2004 - April 2007) and Assistant Secretary and Assistant General Counsel of the Retail Funds. | |
| | | | | | | |
Stefanie V. Chang Yu (40)
Morgan Stanley Investment Management Inc.
522 Fifth Avenue
New York, NY 10036 | | Vice President | | Since December 1997 | | Executive Director of the Adviser and various entities affiliated with the Adviser; Vice President of the Retail Funds (since July 2002) and the Institutional Funds (since December 1997). Formerly, Secretary of various entities affiliated with the Adviser. | |
| | | | | | | |
Mary E. Mullin (40)
Morgan Stanley Investment Management Inc.
522 Fifth Avenue
New York, NY 10036 | | Secretary | | Since June 1999 | | Executive Director of the Adviser and various entities affiliated with the Adviser; Secretary of the Retail Funds (since July 2003) and the Institutional Funds (since June 1999). | |
| | | | | | | |
James W. Garrett (38)
Morgan Stanley Investment Management Inc.
522 Fifth Avenue
New York, NY 10036 | | Treasurer and Chief Financial Officer | | Treasurer since February 2002 and Chief Financial Officer since July 2003 | | Head of Global Fund Administration; Managing Director of the Adviser and various entities affiliated with the Adviser; Treasurer and Chief Financial Officer of the Institutional Funds. | |
* | | This is the earliest date the Officer began serving the Retail Funds or Institutional Funds. Each Officer serves an indefinite term, until his or her successor is elected. |
42
| 2007 Annual Report |
| |
| September 30, 2007 |
Investment Adviser and Administrator
Morgan Stanley Investment Management Inc.
522 Fifth Avenue
New York, NY 10036
Distributor
Morgan Stanley Distribution, Inc.
One Tower Bridge
100 Front Street, Suite 1100
West Conshohocken, PA 19428-2899
Custodian
JPMorgan Chase Bank, N.A.
270 Park Avenue
New York, NY 10017
Legal Counsel
Clifford Chance US LLP
31 West 52nd Street
New York, NY 10019-6131
Independent Registered Public Accounting Firm
Ernst & Young LLP
200 Clarendon Street
Boston, MA 02116-5072
Reporting to Shareholders
Each Morgan Stanley Fund provides a complete schedule of portfolio holdings in its semi-annual and annual reports within 60 days of the end of the Fund’s second and fourth fiscal quarters. The semi-annual reports and the annual reports are filed electronically with the Securities and Exchange Commission (SEC) on Form N-CSRS and Form N-CSR, respectively. Morgan Stanley also delivers the semi-annual and annual reports to Fund shareholders and makes these reports available on its public website, www.morganstanley.com. Each Morgan Stanley Fund also files a complete schedule of portfolio holdings with the SEC for the Fund’s first and third fiscal quarters on Form N-Q. Morgan Stanley does not deliver the reports for the first and third fiscal quarters to shareholders, nor are the reports posted to the Morgan Stanley public website. You may, however, obtain the Form N-Q filings (as well as the Form N-CSR and NCSRS filings) by accessing the SEC’s website, http:/www.sec.gov. You may also review and copy them at the SEC’s public reference room in Washington, DC. Information on the operation of the SEC’s Public Reference Room may be obtained by calling the SEC at 1(800) SEC-0330. You can also request copies of these materials, upon payment of a duplicating fee, by electronic request at the SEC’s email address (publicinfo@sec.gov) or by writing the Public Reference section of the SEC, Washington, DC 20549-0102.
Proxy Voting Policies and Procedures and Proxy Voting Record
You may obtain a copy of the Fund’s Proxy Voting Policy and Procedures and information regarding how the Fund voted proxies relating to portfolio securities during the most recent twelve-month period ended June 30, without charge, upon request, by calling toll-free 1(800) 548-7786 or by visiting our website at www.morganstanley.com/im. This information is also available on the SEC’s website at http://www.sec.gov.
This report is authorized for distribution only when preceded or accompanied by the prospectus of the Morgan Stanley Institutional Fund Trust which describes in detail each Investment Portfolio’s investment policies, risks, fees and expenses. Please read the prospectus carefully before you invest or send money. For additional information, including information regarding the investments comprising the Portfolio, please visit our website at www.morganstanley.com/im or call 1(800) 548-7786.
43
Printed in U.S.A.
This Report has been prepared for shareholders and may be distributed to others only if preceded or accompanied by a current prospectus.
Morgan Stanley Investment Management Inc.
522 Fifth Avenue
New York, NY 10036
Investment Adviser: (610) 940-5000 • MSIF Trust (800) 548-7786
© 2007 Morgan Stanley
| IFTAPAR 9/07 |
| IS06-00953P-Y09/07 |

| |
Morgan Stanley Investment Management

| Morgan Stanley |
| Institutional Fund Trust |
| |
| Balanced Portfolio |
| Balanced |
| |
| Equity Portfolios | |
| Equities Plus | U.S. Small Cap Value |
| Mid Cap Growth | Value |
| U.S. Mid Cap Value | |
| | |
| Fixed Income Portfolios | |
| Core Fixed Income | Investment Grade Fixed Income |
| Core Plus Fixed Income | Limited Duration |
| High Yield | Long Duration Fixed Income |
| Intermediate Duration | Municipal |
| International Fixed Income | |
| |
| September 30, 2007 |
| |
| |
| Annual Report |
| 2007 Annual Report |
| |
| September 30, 2007 |
Table of Contents
Shareholders’ Letter | | 2 |
Investment Advisory Agreement Approval | | 3 |
Investment Overviews & Portfolios of Investments | | |
Balanced Portfolio: | | |
Balanced | | 7 |
Equity Portfolios: | | |
Equities Plus | | 24 |
Mid Cap Growth | | 30 |
U.S. Mid Cap Value | | 34 |
U.S. Small Cap Value | | 38 |
Value | | 43 |
Fixed Income Portfolios: | | |
Core Fixed Income | | 48 |
Core Plus Fixed Income | | 60 |
High Yield | | 72 |
Intermediate Duration | | 81 |
International Fixed Income | | 92 |
Investment Grade Fixed Income | | 99 |
Limited Duration | | 110 |
Long Duration Fixed Income | | 120 |
Municipal | | 127 |
Statements of Assets & Liabilities | | 139 |
Statements of Operations | | 147 |
Statements of Changes in Net Assets | | 150 |
Statements of Cash Flows | | 160 |
Financial Highlights | | 162 |
Notes to Financial Statements | | 183 |
Report of Independent Registered Public Accounting Firm | | 194 |
Federal Income Tax Information | | 195 |
U.S. Privacy Policy | | 196 |
Trustee and Officer Information | | 198 |
This report is authorized for distribution only when preceded or accompanied by prospectuses of the Morgan Stanley Institutional Fund Trust. To receive a prospectus and/or SAI, which contains more complete information such as investment objectives, charges, expenses, policies for voting proxies, risk considerations, and describes in detail each of the Portfolio’s investment policies to the prospective investor, please call 1 (800) 548-7786. Please read the prospectus carefully before you invest or send money. Market forecasts provided in this report may not necessarily come to pass. There is no guarantee that any sectors mentioned will continue to perform as discussed herein or that securities in such sectors will be held by the Fund in the future. There is no assurance that the Fund will achieve its investment objective. The Fund is subject to market risk, which is the possibility that market values of securities owned by the Fund will decline and, therefore, the value of the Fund’s shares may be less than what you paid for them. Accordingly, you can lose money investing in this Fund. Please see the prospectus for more complete information on investment risks.
1
2007 Annual Report
September 30, 2007
Shareholders’ Letter
Dear Shareholders:
We are pleased to present to you the Morgan Stanley Institutional Fund Trust’s (the “Fund”) Annual Report for the year ended September 30, 2007. Our Fund currently consists of 18 portfolios. The Fund’s portfolios, together with the portfolios of the Morgan Stanley Institutional Fund, Inc., provide investors with a means to help them meet specific investment needs and to allocate their investments among equities (e.g., value and growth; small, medium, and large capitalization), and fixed income (e.g., short, medium, and long duration; investment grade and high yield).
Sincerely, |
|

|
|
Ronald E. Robison |
President and Principal Executive Officer |
|
October 2007 |
2
| 2007 Annual Report |
| |
| September 30, 2007 |
Investment Advisory Agreement Approval (unaudited)
BALANCED, EQUITY AND FIXED INCOME PORTFOLIOS
The Board considered the following with respect to each Portfolio:
Nature, Extent and Quality of Services
The Board reviewed and considered the nature and extent of the investment advisory services provided by the Investment Adviser under the Advisory Agreement, including portfolio management, investment research and fixed income securities trading. The Board reviewed similar information and factors regarding the Sub-Adviser to the extent applicable. The Board also reviewed and considered the nature and extent of the non-advisory, administrative services provided by the Portfolios’ Administrator under the Administration Agreement, including accounting, clerical, bookkeeping, compliance, business management and planning, and the provision of supplies, office space and utilities at the Investment Adviser’s expense. (The Investment Adviser, Sub-Adviser and Administrator together are referred to as the “Adviser” and the Advisory and Administration Agreements together are referred to as the “Management Agreement.”) The Board also compared the nature of the services provided by the Adviser with similar services provided by non-affiliated advisers as reported to the Board by Lipper Inc. (“Lipper”).
The Board reviewed and considered the qualifications of the portfolio managers, the senior administrative managers and other key personnel of the Adviser who provide the advisory and administrative services to the Portfolios. The Board determined that the Adviser’s portfolio managers and key personnel are well qualified by education and/or training and experience to perform the services in an efficient and professional manner. The Board concluded that the nature and extent of the advisory and administrative services provided were necessary and appropriate for the conduct of the business and investment activities of each Portfolio. The Board also concluded that the overall quality of the advisory and administrative services provided was satisfactory.
Performance Relative to Comparable Funds Managed by Other Advisers
On a regular basis, the Board reviews the performance of all funds in the Morgan Stanley Fund Complex, including the Portfolios, compared to their peers, paying specific attention to the underperforming funds. In addition, the Board specifically reviewed each Portfolio’s performance for the one-, three- and five-year periods ended November 30, 2006 (except with respect to the Equities Plus and Long Duration Fixed Income Portfolios whereby the Board reviewed the Equities Plus Portfolio for the period April 30, 2006 to November 30, 2006 and the Long Duration Fixed Income Portfolio for the period July 31, 2006 to November 30, 2006), as shown in reports provided by Lipper (the “Lipper Reports”), compared to the performance of comparable funds selected by Lipper (the “performance peer group”) for each Portfolio. The Board also discussed with the Adviser the performance goals and the actual results achieved in managing each Portfolio. When a fund underperforms its performance peer group, the Board discusses with the Adviser the causes of the underperformance and, where necessary, specific changes to the fund’s investment strategy and/or investment personnel.
With respect to the U.S. Mid Cap Value, Balanced, Value, U.S. Small Cap Value, Mid Cap Growth, Core Fixed Income, Core Plus Fixed Income, Intermediate Duration, Investment Grade Fixed Income, Limited Duration, Long Duration Fixed Income and Municipal Portfolios, the Board concluded that each Portfolio’s performance was competitive with that of its performance peer group.
With respect to the High Yield Portfolio, the Board concluded that the Portfolio can reasonably be expected to be competitive with that of its performance peer group based on recent action taken or proposed to be taken by the Adviser with respect to the Portfolio’s investment strategy and/or investment personnel.
With respect to the Equities Plus Portfolio, the Board concluded that the Portfolio’s performance was acceptable.
With respect to the International Fixed Income Portfolio, the Board noted that the Portfolio was not hedged against foreign currency exposure, whereas most of its peers in the performance peer group are partially or fully hedged against foreign currency exposure. The Board also noted the Adviser’s view that the Portfolio’s benchmark, which is unhedged, is a more accurate barometer of performance. The Board concluded that the Portfolio’s performance was competitive with that of its benchmark.
3
2007 Annual Report
September 30, 2007
Investment Advisory Agreement Approval (cont’d)
Fees Relative to Other Proprietary Funds Managed by the Adviser with Comparable Investment Strategies
The Board reviewed the advisory and administrative fee (together, the “management fee”) rate paid by each Portfolio under the Management Agreement.
With respect to the Core Fixed Income and Investment Grade Fixed Income Portfolios, the Board noted that the management fee rates were comparable to the management fee rates charged by the Adviser to other proprietary funds it manages with investment strategies comparable to those of the Portfolios.
With respect to the U.S. Mid Cap Value, U.S. Small Cap Value, High Yield, Core Plus Fixed Income and Limited Duration Portfolios, the Board noted that the management fee rates were comparable to the management fee rates charged by the Adviser to other proprietary funds it manages with investment strategies comparable to those of the Portfolios taking into account the scope of the services provided.
With respect to the Balanced, Equities Plus, Intermediate Duration, Long Duration Fixed Income, Municipal, and International Fixed Income Portfolios, the Board noted that the Adviser did not manage any other proprietary funds with investment strategies comparable to those of the Portfolios.
With respect to the Value and Mid Cap Growth Portfolios, the Board noted that the management fee rates were higher than the management fee rates charged by the Adviser to other proprietary funds that it manages with investment strategies comparable to those of the Portfolios. The Board also noted that each Portfolio’s management fee rate and total expense ratio were lower than the average management fee rate and total expense ratio for funds, selected by Lipper for each Portfolio (the “expense peer group”), managed by other advisers with investment strategies comparable to those of the Portfolios, as shown in the Portfolios’ Lipper Reports.
Fees and Expenses Relative to Comparable Funds Managed by Other Advisers
The Board reviewed the management fee rate and total expense ratio of each Portfolio as compared to the expense peer group. The Board concluded that each Portfolio’s management fee rate and total expense ratio were competitive with those of its expense peer group.
Breakpoints and Economies of Scale
The Board reviewed the structure of each Portfolio’s management fee schedule under the Management Agreement.
With respect to the U.S. Mid Cap Value, Value, U.S. Small Cap Value, High Yield, Core Plus Fixed Income and High Yield Portfolios, the Board noted that each Portfolio’s management fee schedule includes one or more breakpoints. The Board also reviewed the level of each Portfolio’s management fee and noted that each fee, as a percentage of the Portfolio’s net assets, would decrease as net assets increase because each management fee includes one or more breakpoints. The Board concluded that each Portfolio’s management fee would reflect economies of scale as assets increase.
With respect to the Balanced, Core Fixed Income, Equities Plus, Intermediate Duration, Long Duration Fixed Income and International Fixed Income Portfolios, the Board noted that the Portfolios’ management fee schedules do not include any breakpoints. The Board considered that the Portfolios’ assets under management were relatively small. The Board concluded that economies of scale for the Portfolios were not a factor that needed to be considered at the present time.
With respect to the Mid Cap Growth, Investment Grade Fixed Income and Municipal Portfolios, the Board noted that the Portfolios’ management fee schedules do not include any breakpoints. The Board also reviewed the level of each Portfolio’s management fee and concluded that the fee, compared to the Portfolio’s expense peer group, was sufficiently low, so that, in effect, economies of scale were built into each management fee structure.
With respect to the Limited Duration Portfolio, the Board noted that the Portfolio’s management fee schedule does not include any breakpoints. The Board noted that the Portfolio’s management fee schedule and total expense ratio were competitive with those of its expense peer group and concluded that economies of scale for the Portfolio were not a factor that needed to be considered at the present time.
4
| 2007 Annual Report |
| |
| September 30, 2007 |
Investment Advisory Agreement Approval (cont’d)
Profitability of the Adviser and Affiliates
The Board considered information concerning the costs incurred and profits realized by the Adviser and affiliates during the last year from their relationship with each Portfolio and during the last two years from their relationship with the Morgan Stanley Fund Complex and reviewed with the Adviser the cost allocation methodology used to determine the profitability of the Adviser and affiliates. Based on its review of the information it received, the Board concluded that the profits earned by the Adviser and affiliates were not excessive in light of the advisory, administrative and other services provided to the Portfolios.
Fall-Out Benefits
The Board considered so-called “fall-out benefits” derived by the Adviser and affiliates from their relationship with each Portfolio and the Morgan Stanley Fund Complex. The Board considered the “float” benefits derived from handling of checks for purchases and sales of Portfolio shares, through a broker-dealer affiliate of the Adviser. The Board also considered that a broker-dealer affiliate of the Adviser receives from each Portfolio 12b-1 fees for distribution and shareholder services. The Board concluded that the float benefits were relatively small and the 12b-1 fees were competitive with those of other broker-dealers.
With respect to the U.S. Mid Cap Value, Balanced, Value, U.S. Small Cap Value, Mid Cap Growth and Equities Plus Portfolios, the Board considered “soft dollar” benefits (discussed in the next section).
Soft Dollar Benefits
The Board considered whether the Adviser realizes any benefits as a result of brokerage transactions executed through “soft dollar” arrangements. Under such arrangements, brokerage commissions paid by the Portfolios and/or other funds managed by the Adviser would be used to pay for research that a securities broker obtains from third parties, or to pay for both research and execution services from securities brokers who effect transactions for the Portfolios.
With respect to the U.S. Mid Cap Value, Balanced, Value, U.S. Small Cap Value, Mid Cap Growth and Equities Plus Portfolios, the Board recognized that the receipt of such research from brokers may reduce the Adviser’s costs but concluded that the receipt of such research strengthens the investment management resources of the Adviser, which may ultimately benefit the Portfolios and other funds in the Morgan Stanley Fund Complex.
With respect to the Intermediate Duration, Investment Grade Fixed Income, Limited Duration, Long Duration Fixed Income, Municipal and International Fixed Income Portfolios, the Board noted that the Portfolios invest only in fixed income securities, which do not generate soft dollars.
Adviser Financially Sound and Financially Capable of Meeting the Portfolios’ Needs
The Board considered whether the Adviser is financially sound and has the resources necessary to perform its obligations under the Management Agreement. The Board concluded that the Adviser has the financial resources necessary to fulfill its obligations under the Management Agreement.
Historical Relationship Between the Portfolios and the Adviser
The Board also reviewed and considered the historical relationship between each Portfolio and the Adviser, including the organizational structure of the Adviser, the policies and procedures formulated and adopted by the Adviser for managing the Portfolios’ operations and the Board’s confidence in the competence and integrity of the senior managers and key personnel of the Adviser. The Board concluded that it is beneficial for each Portfolio to continue its relationship with the Adviser.
5
2007 Annual Report
September 30, 2007
Investment Advisory Agreement Approval (cont’d)
Other Factors and Current Trends
The Board considered the controls and procedures adopted and implemented by the Adviser and monitored by the Fund’s Chief Compliance Officer and concluded that the conduct of business by the Adviser indicates a good faith effort on its part to adhere to high ethical standards in the conduct of each Portfolio’s business.
General Conclusion
On April 25, 2007, after considering and weighing all of the above factors, the Board concluded that it would be in the best interest of each Portfolio and its shareholders to approve renewal of the Management Agreement for another year until April 30, 2008. On June 20, 2007, the Board again considered and weighed all of the above factors and concluded that it would be in the best interest of each Portfolio and its shareholders to approve renewal of the Management Agreement to continue until June 30, 2008.
6
| 2007 Annual Report |
| |
| September 30, 2007 |
Investment Overview (unaudited)
Balanced Portfolio
The Balanced Portfolio seeks above-average total return over a market cycle of three to five years. The Portfolio invests in a mix of equity and fixed income securities. The Portfolio normally invests 45-75% of its assets in equity securities and 25-55% of its assets in fixed income securities. The Portfolio may invest up to 25% of its assets in foreign equity and foreign fixed income securities, including emerging market securities. The Portfolio’s equity securities generally will be common stocks of large corporations with market capitalizations generally greater than $1 billion. The Portfolio’s fixed income investments generally will include mortgage securities and high yield securities (commonly referred to as “junk bonds”). The Portfolio will ordinarily seek to maintain an average weighted maturity in excess of five years, although there is no minimum or maximum maturity for any individual security. The Portfolio may invest up to 10% of its assets in real estate investment trusts (“REITs”). The Portfolio may invest in asset-backed securities and may use futures, options, forwards, collateralized mortgage obligations (“CMOs”), structured investments, swaps, options on swaps and other derivatives. Foreign investments are subject to certain risks such as currency fluctuations, economic instability, and political developments. High yield fixed income securities represent a much greater risk of default and tend to be more volatile than higher rated bonds. Freddie Mac, Fannie Mae, and Federal Home Loan Bank, although chartered and sponsored by Congress, are not funded by congressional appropriations and securities issued by them are neither guaranteed nor insured by the U.S. government.
Performance
For the fiscal year ended September 30, 2007, the Portfolio’s Institutional Class had a total return based on net asset value and reinvestment of distributions per share of 18.57%, net of fees. The Portfolio’s Institutional Class outperformed against its benchmarks, the S&P 500® Index, the Lehman Brothers U.S. Aggregate Index and the 60/40 Blended Index, a blend of 60% S&P 500® Index and 40% Lehman Brothers U.S. Aggregate Index which returned 16.44%, 5.14% and 11.87%, respectively.
Factors Affecting Performance
• The Portfolio benefited from a number of positive contributors. The Portfolio’s asset mix, consisting of an overweight to equities and underweight in bonds, was favorable. A string of positive global economic data, low Treasury bond yields, and a wave of merger and acquisition (“M&A”) activity supported stock returns. Despite market turmoil in the third quarter of 2007 prompted by U.S. subprime mortgage woes, equities outperformed.
• Within equities, the Portfolio’s exposure to international markets including Europe, Hong Kong and Singapore supported results. Europe chalked up higher gains given the region’s steady economic expansion, attractive relative valuations to the U.S. and continued M&A activity. One key reason for the optimism was Germany’s overall improved economic conditions. Hong Kong and Singapore added to results as these countries were buoyed by solid growth and China’s economic momentum. In addition, the Portfolio’s exposure to non-dollar currencies, particularly the Canadian dollar, United Kingdom (“U.K.”) pound and Chinese renminbi was favorable. The U.S. dollar traded lower amid tepid employment and business activity data, and heightened speculation for further interest rate cuts.
• The strategy’s exposure to emerging market equities was the largest contributor to returns. Solid economic growth and contained inflationary pressures provided a favorable macro backdrop for emerging market equities to thrive, with China leading the pack. These regions benefited from current account surpluses and high savings rates, as well as attractive valuations.
• An allocation to gold was favorable. Gold rose given the U.S. dollar’s weakness, and geopolitical and inflation worries.
• Within U.S. equities, sector and stock selection was favorable. The Portfolio’s underweight in retailing and banks, and overweight in the capital goods and energy sectors contributed to results. Financial stocks were roiled by continued turmoil in the sub prime mortgage market, and a possible credit crunch weighed on the sector. Energy benefited from a higher price of oil. Positive momentum drove stocks higher in the capital goods sector.
• Turning to detractors within equities, the Portfolio’s exposure to Japan detracted from results. Japanese equities trailed the broad market given the slow pace of the economic recovery and the Bank of Japan’s hawkish tone.
• Within fixed income, an overweight in the U.K. and Australia detracted from relative return. Bonds sold off during the second half given a shift in interest rate expectations and further turbulence in the subprime mortgage sector.
Management Strategies
• In the third quarter, we reduced the Portfolio’s overweight in equities and increased cash holdings. The overall reduction in equity exposure was effected by
7
2007 Annual Report
September 30, 2007
Investment Overview (cont’d)
Balanced Portfolio
reducing U.S. equity exposure. We believe the U.S. is most exposed to the fall-out in the subprime mortgage sector including a potential housing-led recession and tepid consumer spending. Overall, the Portfolio remains overweight stocks and cash, and underweight bonds relative to the financial benchmark.
• Within equities, we favor non-U.S. markets including Europe, Hong Kong, Singapore and the emerging markets. Despite recent mixed economic news, the Portfolio maintains an overweight in Europe, specifically the U.K. U.K. inflation fell to its lowest level in more than a year, as the consumer price index dipped below 1.8%. Asia continues to benefit from strong demand from China and solid domestic economic news. The emerging markets staged a spectacular comeback from the summer’s financial turmoil, reflecting the region’s solid domestic consumption, improved fiscal management, large foreign exchange reserves and productivity.
• Within U.S. equities, the Portfolio is overweight defensive growth sectors such as health care and consumer staples, while avoiding interest rate sensitive sectors such as banks, retailing and media.
• Within fixed income, we remain underweight U.S. Treasuries. U.S. bonds continue to be expensive on a real short-term and long-term yield historical basis. The Portfolio is overweight non-U.S. regions such as the U.K. and Australia, which we believe offer better value.


* Minimum Investment
In accordance with SEC regulations, the Portfolio’s performance shown assumes that all recurring fees (including management fees) were deducted and all dividends and distributions were reinvested. The performance of Investment Class and Adviser Class shares will vary from the Institutional Class shares based upon their different inception dates and will be negatively impacted by additional fees assessed to those classes.
8
| 2007 Annual Report |
| |
| September 30, 2007 |
Investment Overview (cont’d)
Balanced Portfolio
Performance Compared to the S&P 500® Index(1), Lehman Brothers U.S. Aggregate Index(2), 60/40 Blended Index(3) and the Lipper Mixed-Asset Target Allocation Growth Funds Index(4)
| | Total Returns(5) | |
| | | | Average Annual | |
| | One | | Five | | Ten | | Since | |
| | Year | | Years | | Years | | Inception(9) | |
| | | | | | | | | |
Portfolio — Institutional Class(6) | | 18.57 | % | 13.52 | % | 6.76 | % | 9.20 | % |
S&P 500® Index | | 16.44 | | 15.45 | | 6.57 | | 10.94 | |
Lehman Brothers U.S. Aggregate Index | | 5.14 | | 4.13 | | 5.97 | | 6.37 | |
60/40 Blended Index | | 11.87 | | 10.93 | | 6.77 | | 9.43 | |
Lipper Mixed-Asset Target Allocation Growth Funds Index | | 14.34 | | 12.76 | | 6.91 | | 9.50 | |
Portfolio — Investment Class(7) | | 18.43 | | 13.37 | | 6.55 | | 7.96 | |
S&P 500® Index | | 16.44 | | 15.45 | | 6.57 | | 8.73 | |
Lehman Brothers U.S. Aggregate Index | | 5.14 | | 4.13 | | 5.97 | | 6.34 | |
60/40 Blended Index | | 11.87 | | 10.93 | | 6.77 | | 8.22 | |
Lipper Mixed-Asset Target Allocation Growth Funds Index | | 14.34 | | 12.76 | | 6.91 | | 8.40 | |
Portfolio — Adviser Class(8) | | 18.23 | | 13.23 | | 6.48 | | 8.02 | |
S&P 500® Index | | 16.44 | | 15.45 | | 6.57 | | 9.11 | |
Lehman Brothers U.S. Aggregate Index | | 5.14 | | 4.13 | | 5.97 | | 6.15 | |
60/40 Blended Index | | 11.87 | | 10.93 | | 6.77 | | 8.35 | |
Lipper Mixed-Asset Target Allocation Growth Funds Index | | 14.34 | | 12.76 | | 6.91 | | 8.51 | |
Performance data quoted represents past performance, which is no guarantee of future results, and current performance may be lower or higher than the figures shown. Performance assumes that all dividends and distributions, if any, were reinvested. For the most recent month-end performance figures, please visit www.morganstanley.com/im. Investment return and principal value will fluctuate so that Portfolio shares, when redeemed, may be worth more or less than their original cost. Total returns do not reflect the deduction of taxes that a shareholder would pay on Portfolio distributions or the redemption of Portfolio shares.
(1) | The S&P 500® Index is a capitalization-weighted index of 500 stocks. The index is designed to measure performance of the broad domestic economy through changes in the aggregate market value of 500 stocks representing all major industries. The Index is unmanaged and its returns do not include any sales charges or fees. Such costs would lower performance. It is not possible to invest directly in an index. |
(2) | The Lehman Brothers U.S. Aggregate Index tracks the performance of all U.S. government agency and Treasury securities, investment-grade corporate debt securities, agency mortgage-backed securities, asset-backed securities and commercial mortgage-backed securities. The Index is unmanaged and its returns do not include any sales charges or fees. Such costs would lower performance. It is not possible to invest directly in an index. |
(3) | The 60/40 Blended Index is comprised of 60% S&P 500® Index and 40% Lehman Brothers U.S. Aggregate Index. |
(4) | The Lipper Mixed-Asset Target Allocation Growth Funds Index is an equally-weighted performance index of the largest qualifying funds (based on net assets) in the Lipper Mixed-Asset Target Allocation Growth Funds classification. The Index, which is adjusted for capital gains distributions and income dividends, is unmanaged and should not be considered an investment. There are currently 30 funds represented in this Index. As of the date of this report, the Portfolio is in the Lipper Mixed-Asset Target Allocation Growth Funds classification. |
(5) | Total returns for the Portfolio reflect expenses waived and/or reimbursed, if applicable, by the Adviser. Without such waivers and/or reimbursements, total returns would have been lower. Fee waivers and/or reimbursements are voluntary and the Adviser reserves the right to commence or terminate any waiver and/or reimbursement at any time. |
(6) | Commenced operations on December 31, 1992. |
(7) | Commenced operations on April 3, 1997. |
(8) | Commenced operations on November 1, 1996. |
(9) | For comparative purposes, average annual since inception returns listed for the Indexes refer to the inception date or initial offering of the respective share class of the Portfolio, not the inception of the Indexes. |
Expense Examples
As a shareholder of the Portfolio, you incur two types of costs: (1) transactional costs, including redemption fees; (2) ongoing costs, including management fees, shareholder servicing fees (in the case of Investment Class and Adviser Class); and other Portfolio expenses. These examples are intended to help you understand your ongoing costs (in dollars) of investing in the Portfolio and to compare these costs with the ongoing costs of investing in other mutual funds.
The examples are based on an investment of $1,000 invested at the beginning of the six-month period ended September 30, 2007 and held for the entire six-month period.
Actual Expenses
The first line of the tables below provides information about actual account values and actual expenses. You may use the information in this line, together with the amount you invested, to estimate the expenses that you paid over the period. Simply divide your account value by $1,000 (for example, an $8,600 account value divided by $1,000 = 8.6), then multiply the result by the number in the first line under the heading entitled ‘‘Expenses Paid During Period’’ to estimate the expenses you paid on your account during this period.
Please note that “Expenses Paid During Period” are grossed up to reflect Portfolio expenses prior to the effect of Expense Offset (See Note E in the Notes to Financial Statements). Therefore, the annualized net expense ratios may differ from the ratio of expenses to average net assets shown in the Financial Highlights.
Hypothetical Example for Comparison Purposes
The second line of the tables below provides information about hypothetical account values and hypothetical expenses based on the Portfolio’s actual expense ratio and an assumed rate of return of 5% per year before expenses, which is not the Portfolio’s actual return. The hypothetical account values and expenses may not be used to estimate the actual ending account balance or expenses you paid for the period. You may use this information to compare the ongoing costs of investing in the Portfolio and other funds. To do so, compare this 5% hypothetical example with the 5% hypothetical examples that appear in the shareholder reports of the other funds.
9
2007 Annual Report
September 30, 2007
Investment Overview (cont’d)
Balanced Portfolio
Please note that the expenses shown in the table are meant to highlight your ongoing costs only and do not reflect any transactional costs, such as redemption fees. Therefore, the second line of the table is useful in comparing ongoing costs only, and will not help you determine the relative total costs of owning different funds. In addition, if these transactional costs were included, your costs would have been higher.
| | | | | | Expenses Paid | |
| | | | Ending Account | | During Period* | |
| | Beginning | | Value | | April 1, 2007 — | |
| | Account Value | | September 30, | | September 30, | |
| | April 1, 2007 | | 2007 | | 2007 | |
Institutional Class | | | | | | | |
Actual | | $ | 1,000.00 | | $ | 1,104.20 | | $ | 3.22 | |
Hypothetical (5% average annual return before expenses) | | 1,000.00 | | 1,022.01 | | 3.09 | |
| | | | | | | |
Investment Class | | | | | | | |
Actual | | 1,000.00 | | 1,103.60 | | 4.01 | |
Hypothetical (5% average annual return before expenses) | | 1,000.00 | | 1,021.26 | | 3.85 | |
| | | | | | | |
Adviser Class | | | | | | | |
Actual | | 1,000.00 | | 1,103.10 | | 4.53 | |
Hypothetical (5% average annual return before expenses) | | 1,000.00 | | 1,020.76 | | 4.36 | |
| | | | | | | | | | |
* Expenses are equal to Institutional Class’, Investment Class’ and Adviser Class’ annualized net expense ratios of 0.61%, 0.76% and 0.86%, respectively, multiplied by the average account value over the period, multiplied by 183/365 (to reflect the one-half year period).
Graphic Presentation of Portfolio Holdings
The following graph depicts the Portfolio’s holdings by investment type, as a percentage of total investments.
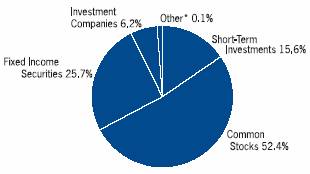
* Investment types which do not appear in the above graph, as well as those which represent less than 5% of total investments, if applicable, are included in the category labeled “Other”.
10
| 2007 Annual Report |
| |
| September 30, 2007 |
Portfolio of Investments
Balanced Portfolio
| | Face | | | |
| | Amount | | Value | |
| | (000) | | (000) | |
Fixed Income Securities (27.1%) | | | | | |
Agency Adjustable Rate Mortgages (1.0%) | | | | | |
Federal Home Loan Mortgage Corp.,
Conventional Pools: | | | | | |
5.61%, 1/1/37 | | $ | 306 | | $ | 308 | |
5.73%, 1/1/37 | | 486 | | 490 | |
5.84%, 4/1/37 | | 325 | | 329 | |
5.85%, 10/1/36 | | 379 | | 383 | |
Federal National Mortgage Association,
Conventional Pools: | | | | | |
5.11%, 11/1/35 | | 320 | | 317 | |
7.41%, 5/1/36 | | 518 | | 528 | |
7.48%, 7/1/36 | | 401 | | 409 | |
7.49%, 8/1/36 | | 287 | | 294 | |
Government National Mortgage Association, | | | | | |
6.13%, 11/20/25 - 12/20/27 | | 112 | | 114 | |
6.38%, 2/20/25 - 1/20/28 | | 449 | | 454 | |
| | | | 3,626 | |
Agency Fixed Rate Mortgages (5.4%) | | | | | |
Federal Home Loan Mortgage Corp.,
Conventional Pools: | | | | | |
10.00%, 9/1/17 | | 20 | | 21 | |
10.50%, 8/1/19 - 12/1/19 | | 73 | | 83 | |
11.00%, 5/1/20 - 9/1/20 | | 33 | | 35 | |
12.00%, 3/1/15 | | 25 | | 29 | |
Gold Pools: | | | | | |
7.50%, 8/1/20 - 11/1/32 | | 402 | | 420 | |
8.00%, 2/1/21 - 8/1/31 | | 363 | | 385 | |
9.50%, 12/1/22 | | 30 | | 33 | |
10.00%, 12/1/19 | | 31 | | 34 | |
November TBA | | | | | |
6.50%, 11/15/31 | | (i)600 | | 610 | |
Federal National Mortgage Association,
Conventional Pools: | | | | | |
6.50%, 4/1/32 - 7/1/32 | | 292 | | 299 | |
7.00%, 3/1/18 - 10/1/34 | | 1,141 | | 1,187 | |
7.50%, 11/1/29 - 9/1/35 | | 858 | | 898 | |
8.00%, 2/1/30 - 5/1/32 | | 398 | | 420 | |
8.50%, 6/1/30 - 12/1/30 | | 247 | | 266 | |
9.50%, 11/1/20 - 4/1/30 | | 252 | | 275 | |
10.00%, 1/1/10 - 1/1/20 | | 29 | | 32 | |
10.50%, 12/1/16 - 4/1/22 | | 154 | | 170 | |
11.50%, 11/1/19 | | 2 | | 2 | |
12.50%, 9/1/15 | | 13 | | 15 | |
October TBA | | | | | |
5.50%, 10/25/37 | | (i)1,950 | | 1,910 | |
6.50%, 10/25/37 | | (i)1,100 | | 1,120 | |
November TBA | | | | | |
5.00%, 11/25/37 | | (i)4,000 | | 3,814 | |
5.50%, 11/25/37 | | (i)5,750 | | 5,629 | |
7.00%, 11/25/37 | | (i)475 | | 490 | |
Government National Mortgage Association,
Various Pools: | | | | | |
9.50%, 10/15/18 - 11/15/21 | | 88 | | 96 | |
10.00%, 11/15/09 - 12/15/21 | | 264 | | 299 | |
10.50%, 2/15/20 - 12/15/20 | | $ | 49 | | $ | 55 | |
11.00%, 1/15/19 | | 53 | | 60 | |
| | | | 18,687 | |
Asset Backed Corporates (3.2%) | | | | | |
ACE Securities Corp., | | | | | |
5.45%, 5/25/34 | | (h)53 | | 51 | |
American Express Credit Account Master Trust, | | | | | |
5.75%, 10/15/12 | | (h)325 | | 323 | |
Argent Securities, Inc., | | | | | |
5.18%, 10/25/36 | | (h)311 | | 309 | |
Bear Stearns Asset Backed Securities, Inc., | | | | | |
5.23%, 1/25/37 | | (h)212 | | 211 | |
5.33%, 9/25/34 | | (h)30 | | 30 | |
5.35%, 3/25/35 | | (h)56 | | 56 | |
Capital Auto Receivables Asset Trust, | | | | | |
5.38%, 7/20/10 | | (h)525 | | 521 | |
5.76%, 11/15/11 | | (h)400 | | 397 | |
5.81%, 5/15/11 | | (h)575 | | 571 | |
Carrington Mortgage Loan Trust, | | | | | |
5.44%, 3/25/47 | | (h)314 | | 312 | |
Citibank Credit Card Issuance Trust, | | | | | |
5.20%, 3/22/12 | | (h)400 | | 398 | |
5.65%, 9/20/19 | | (c)350 | | 349 | |
Countrywide Asset Backed Certificates, | | | | | |
5.28%, 7/25/25 | | (h)138 | | 138 | |
First Franklin Mortgage Loan Asset Backed Certificates, | | | | | |
5.18%, 7/25/36 - 3/25/37 | | (h)544 | | 541 | |
5.20%, 2/25/36 | | (h)170 | | 169 | |
5.25%, 10/25/35 | | (h)102 | | 101 | |
Ford Credit Auto Owner Trust, | | | | | |
5.76%, 4/15/10 | | (h)750 | | 747 | |
Fremont Home Loan Owner Trust, | | | | | |
5.18%, 10/25/36 | | (h)320 | | 318 | |
GSAMP Trust, | | | | | |
5.20%, 1/25/37 | | (h)259 | | 257 | |
5.25%, 3/25/47 | | (h)373 | | 371 | |
MBNA Master Credit Card Trust, | | | | | |
7.80%, 10/15/12 | | 900 | | 967 | |
RAAC Series, | | | | | |
5.23%, 9/25/45 | | (h)96 | | 95 | |
Residential Asset Mortgage Products, Inc., | | | | | |
5.20%, 6/25/29 | | (h)294 | | 292 | |
Residential Asset Securities Corp., | | | | | |
5.24%, 2/25/30 | | (h)313 | | 311 | |
Securitized Asset Backed Receivables, LLC Trust, | | | | | |
5.20%, 12/25/35 | | (h)73 | | 72 | |
5.24%, 2/25/37 | | (h)346 | | 344 | |
5.26%, 5/25/37 | | (h)346 | | 343 | |
SLM Student Loan Trust, | | | | | |
5.35%, 10/25/14 | | (h)545 | | 546 | |
Soundview Home Equity Loan Trust, | | | | | |
5.21%, 1/25/37 - 6/25/37 | | (h)519 | | 515 | |
5.24%, 2/25/37 | | (h)336 | | 333 | |
The accompanying notes are an integral part of the financial statements.
11
2007 Annual Report
September 30, 2007
Portfolio of Investments (cont’d)
Balanced Portfolio
| | Face | | | |
| | Amount | | Value | |
| | (000) | | (000) | |
Asset Backed Corporates (cont’d) | | | | | |
Structured Asset Securities Corp., | | | | | |
5.22%, 2/25/37 - 6/25/37 | | $ | (h)608 | | $ | 602 | |
5.25%, 1/25/37 | | (e)(h)287 | | 280 | |
TXU Electric Delivery Transition Bond Co., | | | | | |
4.81%, 11/17/14 | | 100 | | 100 | |
| | | | 10,970 | |
Collateralized Mortgage Obligations — Agency Collateral Series (0.1%) | | | | | |
Federal Home Loan Mortgage Corp., | | | | | |
Inv Fl IO | | | | | |
2.80%, 10/15/29 | | (h)43 | | 1 | |
18.50%, 11/15/07 | | (h)@— | | @— | |
Inv Fl IO PAC | | | | | |
3.85%, 3/15/08 | | (h)4 | | @— | |
4.97%, 2/15/08 | | (h)9 | | @— | |
IO | | | | | |
5.00%, 6/15/17 | | 242 | | 27 | |
6.50%, 3/15/33 | | 149 | | 33 | |
7.50%, 12/1/29 | | 100 | | 34 | |
8.00%, 1/1/28 - 6/1/31 | | 30 | | 8 | |
Federal National Mortgage Association, | | | | | |
Inv Fl IO | | | | | |
1.80%, 2/17/31 | | (h)381 | | 20 | |
2.99%, 3/18/30 | | (h)14 | | @— | |
3.97%, 10/25/07 | | (h)2 | | @— | |
IO | | | | | |
1.38%, 3/25/36 | | 1,723 | | 35 | |
5.00%, 2/25/15 | | 128 | | 3 | |
6.00%, 8/25/32 - 7/25/33 | | 138 | | 28 | |
6.50%, 6/1/31 - 6/25/33 | | 292 | | 69 | |
7.00%, 4/25/33 | | 96 | | 22 | |
8.00%, 4/1/24 - 12/1/31 | | 361 | | 86 | |
9.00%, 11/1/26 | | 39 | | 10 | |
IO PAC | | | | | |
8.00%, 8/18/27 | | 82 | | 19 | |
Government National Mortgage Association, | | | | | |
Inv Fl IO | | | | | |
2.25%, 4/16/29 | | (h)206 | | 13 | |
2.85%, 8/16/29 | | (h)119 | | 9 | |
| | | | 417 | |
Collateralized Mortgage Obligations — Non Agency Collateral Series (1.0%) | | | | | |
Bear Stearns Structured Products, Inc., | | | | | |
IO | | | | | |
1.41%, 1/27/37 | | (e)5,330 | | 154 | |
1.45%, 6/26/36 | | (e)6,058 | | 189 | |
1.46%, 1/27/37 | | (e)7,649 | | 230 | |
1.57%, 1/27/37 | | (e)4,171 | | 140 | |
2.02%, 5/25/37 | | (e)6,531 | | 219 | |
Countrywide Alternative Loan Trust, | | | | | |
IO | | | | | |
1.19%, 3/20/46 | | 1,659 | | 69 | |
2.37%, 2/25/47 | | (e)4,100 | | 143 | |
1.51%, 3/20/47 | | $ | 3,039 | | $ | 156 | |
1.66%, 12/20/35 | | (e)(h)1,824 | | 49 | |
1.90%, 5/25/47 | | (e)1,989 | | 79 | |
2.07%, 12/20/46 | | 3,471 | | 155 | |
2.09%, 2/25/37 | | 1,860 | | 89 | |
2.14%, 12/20/35 | | (e)(h)2,356 | | 93 | |
Countrywide Home Loan Mortgage Pass Through Trust, | | | | | |
IO | | | | | |
0.53%, 2/25/35 | | 1,620 | | 30 | |
Credit Suisse Mortgage Capital Certificates, | | | | | |
5.91%, 6/15/39 | | (h)300 | | 304 | |
Greenpoint Mortgage Funding Trust, | | | | | |
IO | | | | | |
0.81%, 8/25/45 - 10/25/45 | | 2,182 | | 62 | |
Greenwich Capital Commercial Funding Corp., | | | | | |
5.44%, 3/10/39 | | 300 | | 297 | |
GS Mortgage Securities Corp. II, | | | | | |
5.99%, 8/10/45 | | (h)425 | | 433 | |
Harborview Mortgage Loan Trust, | | | | | |
5.88%, 11/19/35 | | 177 | | 173 | |
IO | | | | | |
1.24%, 6/19/35 | | (h)1,283 | | 27 | |
1.53%, 5/19/35 | | (h)1,808 | | 39 | |
1.89%, 3/19/37 | | (h)1,596 | | 68 | |
PO | | | | | |
3/19/37 | | 1 | | 1 | |
Harborview NIM Corp., | | | | | |
IO | | | | | |
Zero Coupon, 12/15/36 | | (e)263 | | 143 | |
Indymac Index Mortgage Loan Trust, | | | | | |
IO | | | | | |
1.43%, 7/25/35 | | (h)1,134 | | 40 | |
Residential Accredit Loans, Inc., | | | | | |
2.80%, 3/25/47 | | (e)2,217 | | 89 | |
| | | | 3,471 | |
Finance (1.3%) | | | | | |
AIG SunAmerica Global Financing VI, | | | | | |
6.30%, 5/10/11 | | (e)265 | | 274 | |
American General Finance Corp., | | | | | |
4.63%, 5/15/09 - 9/1/10 | | 80 | | 79 | |
AXA Financial, Inc., | | | | | |
6.50%, 4/1/08 | | 60 | | 60 | |
Capmark Financial Group, Inc., | | | | | |
5.88%, 5/10/12 | | (e)100 | | 91 | |
6.30%, 5/10/17 | | (e)45 | | 39 | |
Catlin Insurance Co., Ltd., | | | | | |
7.25% | | (e)(h)(o)100 | | 94 | |
CIT Group, Inc., | | | | | |
3.65%, 11/23/07 | | 80 | | 80 | |
Countrywide Home Loans, Inc., | | | | | |
3.25%, 5/21/08 | | 95 | | 92 | |
Farmers Insurance Exchange, | | | | | |
8.63%, 5/1/24 | | (e)290 | | 333 | |
The accompanying notes are an integral part of the financial statements.
12
| 2007 Annual Report |
| |
| September 30, 2007 |
Portfolio of Investments (cont’d)
Balanced Portfolio
| | Face | | | |
| | Amount | | Value | |
| | (000) | | (000) | |
Finance (cont’d) | | | | | |
General Electric Capital Corp., | | | | | |
4.25%, 12/1/10 | | $ | (c)80 | | $ | 78 | |
Goldman Sachs Capital II, | | | | | |
5.79% | | (h)(o)135 | | 128 | |
HSBC Finance Corp., | | | | | |
5.88%, 2/1/09 | | 345 | | 348 | |
JPMorgan Chase & Co., | | | | | |
7.00%, 11/15/09 | | 255 | | 265 | |
Marshall & Ilsley Bank, | | | | | |
3.80%, 2/8/08 | | 190 | | 189 | |
Mantis Reef Ltd., | | | | | |
4.69%, 11/14/08 | | (e)200 | | 199 | |
MBNA Corp., | | | | | |
5.79%, 5/5/08 | | (h)140 | | 140 | |
Nationwide Building Society, | | | | | |
4.25%, 2/1/10 | | (e)155 | | 152 | |
Platinum Underwriters Finance, Inc., | | | | | |
7.50%, 6/1/17 | | 100 | | 106 | |
Platinum Underwriters Holdings Ltd., | | | | | |
6.37%, 11/16/07 | | 90 | | 90 | |
SLM Corp., | | | | | |
4.00%, 1/15/10 | | 120 | | 113 | |
Two-Rock Pass Through Trust, | | | | | |
6.44% | | (e)(h)(o)100 | | 85 | |
Unicredit Luxembourg Finance S.A., | | | | | |
5.41%, 10/24/08 | | (e)(h)230 | | 230 | |
USB Capital IX, | | | | | |
6.19% | | (o)135 | | 135 | |
Wachovia Capital Trust III, | | | | | |
5.80% | | (h)(o)360 | | 358 | |
Washington Mutual, Inc., | | | | | |
8.25%, 4/1/10 | | 175 | | 185 | |
Washington Mutual Preferred Funding II, | | | | | |
6.67% | | (e)(h)(o)100 | | 86 | |
World Financial Properties, | | | | | |
6.91%, 9/1/13 | | (e)237 | | 245 | |
Xlliac Global Funding, | | | | | |
4.80%, 8/10/10 | | (e)155 | | 154 | |
| | | | 4,428 | |
Industrials (1.3%) | | | | | |
ArvinMeritor, Inc., | | | | | |
8.75%, 3/1/12 | | (c)100 | | 103 | |
AT&T Corp., | | | | | |
8.00%, 11/15/31 | | 160 | | 195 | |
Brookfield Asset Management, Inc., | | | | | |
5.80%, 4/25/17 | | 50 | | 50 | |
7.13%, 6/15/12 | | 125 | | 134 | |
Caterpillar Financial Services Corp., | | | | | |
3.63%, 11/15/07 | | 30 | | 30 | |
Clorox Co., | | | | | |
5.83%, 12/14/07 | | (h)140 | | 140 | |
Comcast Cable Communications, LLC, | | | | | |
6.75%, 1/30/11 | | 40 | | 42 | |
ConAgra Foods, Inc., | | | | | |
7.00%, 10/1/28 | | $ | 45 | | $ | 47 | |
8.25%, 9/15/30 | | 55 | | 65 | |
Consumers Energy Co., | | | | | |
4.00%, 5/15/10 | | 30 | | 29 | |
4.80%, 2/17/09 | | 80 | | 80 | |
Cooper Industries, Inc., | | | | | |
5.25%, 11/15/12 | | 105 | | 105 | |
CVS/Caremark Corp., | | | | | |
5.75%, 8/15/11 - 6/1/17 | | 100 | | 99 | |
6.04%, 12/10/28 | | (e)133 | | 129 | |
DaimlerChrysler N.A. Holding Corp., | | | | | |
8.50%, 1/18/31 | | (c)65 | | 81 | |
Delhaize America, Inc., | | | | | |
9.00%, 4/15/31 | | 139 | | 166 | |
Echostar DBS Corp., | | | | | |
6.38%, 10/1/11 | | 145 | | 146 | |
FBG Finance Ltd., | | | | | |
5.13%, 6/15/15 | | (e)115 | | 109 | |
Ford Motor Credit Co., | | | | | |
7.25%, 10/25/11 | | 110 | | 103 | |
France Telecom S.A., | | | | | |
8.50%, 3/1/31 | | 120 | | 155 | |
General Motors Acceptance Corp., | | | | | |
6.88%, 9/15/11 | | 210 | | 200 | |
Home Depot, Inc., (The) | | | | | |
5.82%, 12/16/09 | | (h)170 | | 168 | |
Hospira, Inc., | | | | | |
5.68%, 3/30/10 | | (h)150 | | 149 | |
ICI Wilmington, Inc., | | | | | |
4.38%, 12/1/08 | | 65 | | 65 | |
Interpublic Group of Companies, Inc., | | | | | |
6.25%, 11/15/14 | | 70 | | 63 | |
Kroger Co. (The), | | | | | |
6.40%, 8/15/17 | | (c)35 | | 36 | |
Lenfest Communications, Inc., | | | | | |
7.63%, 2/15/08 | | 180 | | 181 | |
LG Electronics, Inc., | | | | | |
5.00%, 6/17/10 | | (e)80 | | 79 | |
Miller Brewing Co., | | | | | |
4.25%, 8/15/08 | | (e)110 | | 109 | |
Pilgrim’s Pride Corp., | | | | | |
7.63%, 5/1/15 | | 60 | | 61 | |
AT&T, Inc., | | | | | |
6.15%, 9/15/34 | | 70 | | 69 | |
Sprint Capital Corp., | | | | | |
8.75%, 3/15/32 | | 15 | | 17 | |
Systems 2001 Asset Trust, LLC, | | | | | |
6.66%, 9/15/13 | | (e)151 | | 159 | |
Telecom Italia Capital S.A., | | | | | |
4.00%, 1/15/10 | | 155 | | 151 | |
Telefonica Europe B.V., | | | | | |
8.25%, 9/15/30 | | 125 | | 150 | |
The accompanying notes are an integral part of the financial statements.
13
2007 Annual Report
September 30, 2007
Portfolio of Investments (cont’d)
Balanced Portfolio
| | Face | | | |
| | Amount | | Value | |
| | (000) | | (000) | |
Industrials (cont’d) | | | | | |
Time Warner, Inc., | | | | | |
5.73%, 11/13/09 | | $ | (h)210 | | $ | 208 | |
Union Pacific Corp., | | | | | |
5.45%, 1/31/13 | | 165 | | 164 | |
6.63%, 2/1/08 | | 45 | | 45 | |
6.79%, 11/9/07 | | 35 | | 35 | |
Viacom, Inc., | | | | | |
6.88%, 4/30/36 | | 110 | | 110 | |
WellPoint, Inc., | | | | | |
3.75%, 12/14/07 | | 30 | | 30 | |
Yum! Brands, Inc., | | | | | |
8.88%, 4/15/11 | | 90 | | 100 | |
| | | | 4,357 | |
Mortgages — Other (7.3%) | | | | | |
Alliance Bancorp., | | | | | |
5.37%, 7/25/37 | | (h)396 | | 389 | |
American Home Mortgage Assets, | | | | | |
5.26%, 3/25/47 | | (h)440 | | 428 | |
5.32%, 10/25/46 - 6/25/47 | | (h)1,122 | | 1,089 | |
5.36%, 9/25/46 | | (h)386 | | 381 | |
5.43%, 6/25/47 | | (h)221 | | 198 | |
American Home Mortgage Investment Trust, | | | | | |
5.32%, 5/25/47 | | (h)573 | | 562 | |
Banc of America Commercial Mortgage, Inc., | | | | | |
5.84% | | (h)(o)300 | | 302 | |
5.87% | | (h)(o)200 | | 202 | |
Banc of America Funding Corp., | | | | | |
5.85%, 9/20/35 | | (h)134 | | 132 | |
Bear Stearns Commercial Mortgage Securities, | | | | | |
5.90%, 6/11/40 | | (h)250 | | 254 | |
Bear Stearns Mortgage Funding Trust, | | | | | |
5.29%, 12/25/36 | | (h)511 | | 502 | |
5.38%, 7/25/36 | | (h)371 | | 351 | |
Citigroup Commercial Mortgage Trust, | | | | | |
5.89% | | (h)(o)300 | | 304 | |
Commercial Mortgage Pass-Through Certificates, | | | | | |
6.01% | | (h)(o)275 | | 281 | |
Countrywide Alternative Loan Trust, | | | | | |
5.25%, 7/25/46 | | (e)33 | | 33 | |
5.29%, 2/25/47 | | (h)293 | | 286 | |
5.32%, 10/25/46 - 11/25/46 | | (h)583 | | 570 | |
5.36%, 6/25/47 | | (h)559 | | 543 | |
5.40%, 7/25/46 | | (h)242 | | 239 | |
5.76%, 11/20/35 | | (h)111 | | 110 | |
5.81%, 3/20/46 | | (h)240 | | 234 | |
6.50%, 10/25/46 | | (e)53 | | 53 | |
Countrywide Home Loan Mortgage Pass Through Trust | | | | | |
5.43%, 3/25/35 | | (h)46 | | 45 | |
Deutsche ALT-A Securities, Inc., Alternate Loan Trust, | | | | | |
5.28%, 2/25/47 | | 516 | | 505 | |
Deutsche ALT-A Securities, Inc., NIM Trust, | | | | | |
5.81%, 2/25/47 | | (h)191 | | 180 | |
6.75%, 2/25/47 | | (e)(h)113 | | 108 | |
Downey Savings & Loan Association Mortgage Loan Trust, | | | | | |
5.70%, 11/19/37 | | $ | (h)407 | | $ | 399 | |
5.92%, 4/19/46 | | (h)363 | | 361 | |
Federal National Mortgage Association, | | | | | |
5.19%, 12/25/36 | | (h)249 | | 247 | |
PAC | | | | | |
8.50%, 9/25/20 | | 15 | | 16 | |
Greenpoint Mortgage Funding Trust, | | | | | |
5.31%, 1/25/37 | | (h)353 | | 342 | |
5.33%, 3/25/47 | | (h)544 | | 532 | |
5.42%, 2/25/36 | | (h)289 | | 283 | |
5.45%, 3/25/36 | | (h)317 | | 311 | |
Harborview Mortgage Loan Trust, | | | | | |
5.40%, 7/21/36 | | (h)378 | | 370 | |
5.59%, 1/19/38 | | (h)118 | | 117 | |
5.65%, 3/19/38 | | (h)349 | | 340 | |
5.68%, 11/19/36 | | (h)429 | | 420 | |
5.69%, 1/19/38 | | (h)488 | | 477 | |
5.70%, 9/19/36 - 3/19/38 | | (h)415 | | 406 | |
5.71%, 11/19/36 | | (h)440 | | 432 | |
5.73%, 7/19/46 | | (h)291 | | 283 | |
5.75%, 10/19/37 | | (h)309 | | 303 | |
5.79%, 7/19/45 | | (h)91 | | 90 | |
Harborview NIM Corp., | | | | | |
6.41%, 3/19/37 - 3/19/38 | | (e)154 | | 153 | |
Indymac Index Mortgage Loan Trust, | | | | | |
5.23%, 2/25/37 | | (h)353 | | 350 | |
5.25%, 7/25/46 | | (h)506 | | 503 | |
5.38%, 6/25/46 | | (h)396 | | 384 | |
JPMorgan Chase Commercial Mortgage Securities Corp., | | | | | |
5.44%, 6/12/47 | | 325 | | 321 | |
5.94% | | (h)(o)300 | | 304 | |
6.01% | | (h)(o)450 | | 459 | |
Lehman Brothers Commercial Conduit Mortgage Trust, | | | | | |
6.13%, 7/15/44 | | (h)300 | | 309 | |
Lehman Brothers-UBS Commercial Mortgage Trust, | | | | | |
5.43%, 2/15/40 | | 200 | | 198 | |
5.86%, 7/17/40 | | (h)300 | | 300 | |
Luminent Mortgage Capital, Inc., | | | | | |
5.37%, 4/25/36 | | (h)225 | | 221 | |
5.38%, 5/25/36 | | (h)212 | | 208 | |
Mastr Adjustable Rate Mortgages Trust, | | | | | |
5.24%, 5/25/47 | | (h)201 | | 200 | |
Merrill Lynch Mortgage Investors, Inc., | | | | | |
5.25%, 8/25/35 | | (h)22 | | 22 | |
Residential Accredit Loans, Inc., | | | | | |
2.76%, 5/25/47 | | (e)4,468 | | 190 | |
5.29%, 2/25/37 - 3/25/47 | | (h)1,121 | | 1,096 | |
5.32%, 12/25/36 | | (h)400 | | 393 | |
5.33%, 6/25/37 | | (h)779 | | 763 | |
5.36%, 5/25/46 | | (h)189 | | 184 | |
5.39%, 2/25/46 | | (h)111 | | 109 | |
5.40%, 2/25/46 | | (h)114 | | 113 | |
The accompanying notes are an integral part of the financial statements.
14
| 2007 Annual Report |
| |
| September 30, 2007 |
Portfolio of Investments (cont’d)
Balanced Portfolio
| | Face | | | |
| | Amount | | Value | |
| | (000) | | (000) | |
Mortgages — Other (cont’d) | | | | | |
Ryland Acceptance Corp. IV, | | | | | |
6.65%, 7/1/11 | | $ | 3 | | $ | 3 | |
Structured Asset Mortgage Investments, Inc., | | | | | |
5.31%, 9/25/47 | | (h)595 | | 577 | |
5.32%, 2/25/36 | | (h)101 | | 99 | |
5.33%, 10/25/36 | | (h)309 | | 303 | |
5.36%, 7/25/36 - 8/25/36 | | (h)808 | | 788 | |
5.40%, 4/25/36 | | (h)372 | | 368 | |
5.41%, 7/25/36 | | (h)194 | | 189 | |
Wachovia Bank Commercial Mortgage Trust, | | | | | |
5.34%, 12/15/43 | | 200 | | 196 | |
6.10%, 2/15/51 | | (h)300 | | 308 | |
Washington Mutual Alternative Mortgage Pass Through
Certificates, | | | | | |
5.32%, 7/25/46 | | (h)145 | | 143 | |
5.41%, 6/25/46 | | (h)196 | | 185 | |
5.92%, 4/25/46 | | (h)300 | | 293 | |
Washington Mutual Mortgage Pass Through Certificates, | | | | | |
5.38%, 1/25/47 | | (h)221 | | 215 | |
Washington Mutual, Inc., | | | | | |
5.38%, 11/25/45 - 12/25/45 | | (h)187 | | 186 | |
5.39%, 10/25/45 | | (h)54 | | 54 | |
5.40%, 4/25/45 | | (h)151 | | 149 | |
5.42%, 8/25/45 | | (h)26 | | 26 | |
5.92%, 4/25/46 | | (h)353 | | 347 | |
Zuni Mortgage Loan Trust, | | | | | |
5.26%, 8/25/36 | | (h)210 | | 208 | |
| | | | 25,427 | |
Sovereign (0.3%) | | | | | |
Government of Argentina, | | | | | |
8.28%, 12/31/33 | | 117 | | 106 | |
Government of Japan, | | | | | |
0.30%, 3/20/08 | | JPY | 85,000 | | 739 | |
United Mexican States, | | | | | |
9.50%, 12/18/14 | | MXN | 2,090 | | 208 | |
| | | | 1,053 | |
U.S. Treasury Securities (5.8%) | | | | | |
U.S. Treasury Bonds, | | | | | |
4.50%, 2/15/36 | | $ | 275 | | 261 | |
5.38%, 2/15/31 | | (c)2,600 | | 2,784 | |
6.13%, 8/15/29 | | (c)1,525 | | 1,779 | |
6.25%, 5/15/30 | | (c)6,420 | | 7,634 | |
7.25%, 8/15/22 | | (c)2,880 | | 3,601 | |
U.S. Treasury Notes, | | | | | |
2.63%, 5/15/08 | | (c)3,000 | | 2,973 | |
3.88%, 2/15/13 | | (c)1,170 | | 1,151 | |
| | | | 20,183 | |
Utilities (0.4%) | | | | | |
Appalachian Power Co., | | | | | |
5.65%, 8/15/12 | | 35 | | 35 | |
Arizona Public Service Co., | | | | | |
5.80%, 6/30/14 | | 110 | | 109 | |
CenterPoint Energy Resources Corp., | | | | | |
6.25%, 2/1/37 | | $ | 35 | | $ | 35 | |
7.88%, 4/1/13 | | (c)20 | | 22 | |
Consolidated Natural Gas Co., | | | | | |
6.25%, 11/1/11 | | 45 | | 46 | |
Detroit Edison Co., | | | | | |
6.13%, 10/1/10 | | 75 | | 78 | |
Entergy Gulf States, Inc., | | | | | |
3.60%, 6/1/08 | | 45 | | 44 | |
5.98%, 12/1/09 | | (h)75 | | 74 | |
6.47%, 12/8/08 | | (e)(h)105 | | 105 | |
Kinder Morgan Finance Co., | | | | | |
5.70%, 1/5/16 | | 125 | | 114 | |
NiSource Finance Corp., | | | | | |
6.06%, 11/23/09 | | (h)85 | | 84 | |
7.88%, 11/15/10 | | 95 | | 102 | |
Ohio Power Co., | | | | | |
6.00%, 6/1/16 | | 110 | | 111 | |
Plains All American Pipeline, LP, | | | | | |
6.70%, 5/15/36 | | 110 | | 111 | |
PSEG Energy Holdings, LLC, | | | | | |
8.63%, 2/15/08 | | (c)65 | | 66 | |
Texas Eastern Transmission, LP, | | | | | |
7.00%, 7/15/32 | | 70 | | 74 | |
TXU Energy Co., LLC, | | | | | |
7.00%, 3/15/13 | | 70 | | 77 | |
Union Electric Co., | | | | | |
6.40%, 6/15/17 | | 100 | | 103 | |
Wisconsin Electric Power Co., | | | | | |
3.50%, 12/1/07 | | 30 | | 30 | |
| | | | 1,420 | |
Total Fixed Income Securities (Cost $96,255) | | | | 94,039 | |
| | | | | |
| | Shares | | | |
Common Stocks (55.2%) | | | | | |
Aerospace & Defense (1.4%) | | | | | |
Boeing Co. | | 9,450 | | 992 | |
General Dynamics Corp. | | 3,800 | | 321 | |
Honeywell International, Inc. | | 10,200 | | 606 | |
Lockheed Martin Corp. | | 4,450 | | 483 | |
Northrop Grumman Corp. | | 4,000 | | 312 | |
Raytheon Co. | | 16,600 | | 1,059 | |
Rockwell Collins, Inc. | | 1,200 | | 88 | |
United Technologies Corp. | | 11,800 | | 950 | |
| | | | 4,811 | |
Air Freight & Logistics (0.7%) | | | | | |
C.H. Robinson Worldwide, Inc. | | 17,546 | | 952 | |
Expeditors International Washington, Inc. | | 15,283 | | 723 | |
FedEx Corp. | | 1,850 | | 194 | |
United Parcel Service, Inc., Class B | | 7,000 | | 526 | |
| | | | 2,395 | |
Airlines (0.0%) | | | | | |
Southwest Airlines Co. | | 6,150 | | 91 | |
| | | | | | | | |
The accompanying notes are an integral part of the financial statements.
15
2007 Annual Report
September 30, 2007
Portfolio of Investments (cont’d)
Balanced Portfolio
| | | | Value | |
| | Shares | | (000) | |
Auto Components (0.0%) | | | | | |
WABCO Holdings, Inc. | | 1,116 | | $ | 52 | |
Automobiles (0.1%) | | | | | |
Honda Motor Co., Ltd. ADR | | 10,090 | | 337 | |
Beverages (0.9%) | | | | | |
Anheuser-Busch Cos., Inc. | | 5,538 | | 277 | |
Brown-Forman Corp., Class B | | 600 | | 45 | |
Coca-Cola Co. (The) | | 33,270 | | 1,912 | |
Coca-Cola Enterprises, Inc. | | 2,803 | | 68 | |
Pepsi Bottling Group, Inc. | | 1,440 | | 53 | |
PepsiCo., Inc. | | 11,625 | | 852 | |
| | | | 3,207 | |
Biotechnology (0.6%) | | | | | |
Amgen, Inc. | | (a)11,960 | | 677 | |
Applera Corp. - Applied Biosystems Group | | 8,210 | | 284 | |
Biogen Idec, Inc. | | (a)3,336 | | 221 | |
Genentech, Inc. | | (a)5,464 | | 426 | |
Genzyme Corp. | | (a)1,600 | | 99 | |
Gilead Sciences, Inc. | | (a)5,200 | | 213 | |
| | | | 1,920 | |
Building Products (0.1%) | | | | | |
American Standard Cos., Inc. | | 3,350 | | 119 | |
Masco Corp. | | 8,150 | | 189 | |
| | | | 308 | |
Capital Markets (0.9%) | | | | | |
Bank of New York Mellon Corp. (The) | | 4,060 | | 179 | |
Bear Stearns Cos., Inc. (The) | | 1,200 | | 147 | |
Charles Schwab Corp. (The) | | 28,186 | | 609 | |
Franklin Resources, Inc. | | 4,080 | | 520 | |
Goldman Sachs Group, Inc. | | 3,470 | | 752 | |
Lehman Brothers Holdings, Inc. | | 4,974 | | 307 | |
Merrill Lynch & Co., Inc. | | 5,970 | | 426 | |
Northern Trust Corp. | | 470 | | 31 | |
State Street Corp. | | 2,080 | | 142 | |
| | | | 3,113 | |
Chemicals (1.5%) | | | | | |
Bayer A.G. ADR | | 20,310 | | 1,609 | |
E.I. du Pont de Nemours & Co. | | 5,490 | | 272 | |
Monsanto Co. | | 38,411 | | 3,293 | |
Tronox, Inc., Class B | | 207 | | 2 | |
| | | | 5,176 | |
Commercial Banks (1.7%) | | | | | |
Akbank T.A.S. | | (a)93,198 | | 710 | |
Ameriprise Financial, Inc. | | 1,460 | | 92 | |
Axis Bank Ltd. GDR | | (a)693 | | 13 | |
Bank Pekao S.A. | | (a)5,906 | | 549 | |
BB&T Corp. | | 750 | | 30 | |
Comerica, Inc. | | 440 | | 23 | |
Fifth Third Bancorp. | | 10,542 | | 357 | |
HDFC Bank Ltd. ADR | | 1,200 | | 129 | |
ICICI Bank Ltd. ADR | | 800 | | 42 | |
KeyCorp. | | 340 | | 11 | |
Komercni Banka A.S. | | (a)2,718 | | 633 | |
Marshall & Ilsley Corp. | | 670 | | 29 | |
National City Corp. | | 1,220 | | $ | 31 | |
PNC Financial Services Group, Inc. | | 7,010 | | 477 | |
Powszechna Kasa | | (a)30,873 | | 645 | |
Regions Financial Corp. | | 1,754 | | 52 | |
State Bank of India Ltd. | | (a)577 | | 65 | |
SunTrust Banks, Inc. | | 410 | | 31 | |
Synovus Financial Corp. | | 1,120 | | 31 | |
Turkiye Garanti Bankasi A.S. | | (a)123,563 | | 947 | |
Turkiye Is Bankasi | | (a)102,060 | | 617 | |
U.S. Bancorp | | 3,090 | | 100 | |
Wachovia Corp. | | 3,146 | | 158 | |
Wells Fargo & Co. | | 5,440 | | 194 | |
| | | | 5,966 | |
Commercial Services & Supplies (0.5%) | | | | | |
ACCO Brands Corp. | | (a)376 | | 9 | |
Corporate Executive Board Co. | | 12,195 | | 905 | |
Monster Worldwide, Inc. | | (a)14,626 | | 498 | |
Stericycle, Inc. | | (a)7,403 | | 423 | |
| | | | 1,835 | |
Communications Equipment (2.3%) | | | | | |
Alcatel-Lucent ADR | | 67,190 | | 684 | |
Avaya, Inc. | | (a)3,956 | | 67 | |
Cisco Systems, Inc. | | (a)111,256 | | 3,684 | |
Comverse Technology, Inc. | | (a)2,000 | | 40 | |
Corning, Inc. | | 14,325 | | 353 | |
JDS Uniphase Corp. | | (a)1,795 | | 27 | |
Motorola, Inc. | | 25,512 | | 473 | |
QLogic Corp. | | (a)2,114 | | 28 | |
QUALCOMM, Inc. | | 17,424 | | 736 | |
Research In Motion Ltd. | | (a)(c)17,640 | | 1,738 | |
Tellabs, Inc. | | (a)4,500 | | 43 | |
| | | | 7,873 | |
Computers & Peripherals (2.4%) | | | | | |
Apple, Inc. | | (a)16,923 | | 2,598 | |
Dell, Inc. | | (a)27,269 | | 753 | |
EMC Corp. | | (a)26,050 | | 542 | |
Hewlett-Packard Co. | | 37,052 | | 1,845 | |
International Business Machines Corp. | | 17,915 | | 2,110 | |
Lexmark International, Inc., Class A | | (a)1,215 | | 51 | |
Network Appliance, Inc. | | (a)3,429 | | 92 | |
Sun Microsystems, Inc. | | (a)43,534 | | 244 | |
| | | | 8,235 | |
Construction & Engineering (0.0%) | | | | | |
Larsen & Toubro Ltd. | | (a)1,684 | | 119 | |
Construction Materials (0.2%) | | | | | |
Cemex S.A.B. de C.V. ADR | | (a)20,804 | | 622 | |
Ambuja Cements Ltd. GDR | | (a)10,474 | | 38 | |
| | | | 660 | |
Consumer Finance (0.7%) | | | | | |
American Express Co. | | 37,745 | | 2,241 | |
Capital One Financial Corp. | | 1,473 | | 98 | |
SLM Corp. | | 300 | | 15 | |
| | | | 2,354 | |
The accompanying notes are an integral part of the financial statements.
16
| 2007 Annual Report |
| |
| September 30, 2007 |
Portfolio of Investments (cont’d)
Balanced Portfolio
| | | | Value | |
| | Shares | | (000) | |
Distributors (0.2%) | | | | | |
Li & Fung Ltd. | | (a)188,000 | | $ | 798 | |
Diversified Financial Services (3.1%) | | | | | |
Bank of America Corp. | | 31,330 | | 1,575 | |
Brookfield Asset Management, Inc., Class A | | 65,087 | | 2,506 | |
Chicago Mercantile Exchange Holdings, Inc. | | 1,543 | | 906 | |
Citigroup, Inc. | | 51,249 | | 2,392 | |
JPMorgan Chase & Co. | | 47,523 | | 2,178 | |
Moody’s Corp. | | 21,832 | | 1,100 | |
| | | | 10,657 | |
Diversified Telecommunication Services (0.8%) | | | | | |
AT&T, Inc. | | 420 | | 18 | |
Embarq Corp. | | 4,925 | | 274 | |
France Telecom S.A. ADR | | 14,090 | | 471 | |
Qwest Communications International, Inc. | | (a)100 | | 1 | |
Sprint Nextel Corp. | | 36,307 | | 690 | |
Verizon Communications, Inc. | | 30,734 | | 1,361 | |
Videsh Sanchar Nigam Ltd. ADR | | 1,600 | | 35 | |
| | | | 2,850 | |
Electric Utilities (1.2%) | | | | | |
American Electric Power Co., Inc. | | 21,040 | | 969 | |
CEZ 2 | | (a)10,955 | | 672 | |
Consolidated Edison, Inc. | | 800 | | 37 | |
Edison International | | 1,100 | | 61 | |
Entergy Corp. | | 10,145 | | 1,099 | |
Exelon Corp. | | 2,600 | | 196 | |
FirstEnergy Corp. | | 8,330 | | 528 | |
FPL Group, Inc. | | 1,900 | | 116 | |
PPL Corp. | | 1,600 | | 74 | |
Progress Energy, Inc. | | 800 | | 37 | |
Southern Co. (The) | | 3,000 | | 109 | |
TXU Corp. | | 2,200 | | 151 | |
| | | | 4,049 | |
Electrical Equipment (0.2%) | | | | | |
Cooper Industries Ltd., Class A | | 1,100 | | 56 | |
Emerson Electric Co. | | 9,100 | | 484 | |
Rockwell Automation, Inc. | | 1,000 | | 70 | |
| | | | 610 | |
Electronic Equipment & Instruments (0.2%) | | | | | |
Agilent Technologies, Inc. | | (a)5,618 | | 207 | |
Jabil Circuit, Inc. | | 3,052 | | 70 | |
Molex, Inc. | | 1,550 | | 42 | |
Sanmina-SCI Corp. | | (a)5,348 | | 11 | |
Solectron Corp. | | (a)12,249 | | 48 | |
Tyco Electronics Ltd. | | 5,025 | | 178 | |
| | | | 556 | |
Energy Equipment & Services (0.9%) | | | | | |
Baker Hughes, Inc. | | 3,460 | | 313 | |
BJ Services Co. | | 2,880 | | 77 | |
Halliburton Co. | | 8,968 | | 344 | |
Nabors Industries Ltd. | | (a)2,700 | | 83 | |
Schlumberger Ltd. | | 17,930 | | 1,883 | |
Transocean, Inc. | | (a)2,790 | | 315 | |
| | | | 3,015 | |
Food & Staples Retailing (1.4%) | | | | | |
Costco Wholesale Corp. | | 23,229 | | $ | 1,426 | |
CVS/Caremark Corp. | | 2,940 | | 116 | |
Kroger Co. (The) | | 9,858 | | 281 | |
Rite Aid Corp. | | (a)26,590 | | 123 | |
Safeway, Inc. | | 1,502 | | 50 | |
SUPERVALU, Inc. | | 419 | | 16 | |
Sysco Corp. | | 2,390 | | 85 | |
Tesco plc ADR | | 25,460 | | 684 | |
Wal-Mart, Inc. | | 44,384 | | 1,937 | |
Walgreen Co. | | 3,689 | | 174 | |
| | | | 4,892 | |
Food Products (1.1%) | | | | | |
Archer-Daniels-Midland Co. | | 4,402 | | 146 | |
Cadbury Schweppes plc ADR | | 13,740 | | 639 | |
Campbell Soup Co. | | 2,520 | | 93 | |
ConAgra Foods, Inc. | | 13,661 | | 357 | |
General Mills, Inc. | | 2,467 | | 143 | |
Heinz (H.J.) Co. | | 2,559 | | 118 | |
Hershey Co. (The) | | 1,828 | | 85 | |
Kellogg Co. | | 2,593 | | 145 | |
Kraft Foods, Inc., Class A | | 27,280 | | 941 | |
Sara Lee Corp. | | 5,478 | | 91 | |
Unilever N.V. | | 27,900 | | 861 | |
W.M. Wrigley Jr. Co. | | 1,471 | | 95 | |
| | | | 3,714 | |
Gas Utilities (0.0%) | | | | | |
Sempra Energy | | 800 | | 46 | |
Health Care Equipment & Supplies (1.4%) | | | | | |
Bard (C.R.), Inc. | | 2,100 | | 185 | |
Bausch & Lomb, Inc. | | 700 | | 45 | |
Baxter International, Inc. | | 9,250 | | 521 | |
Becton Dickinson & Co. | | 3,970 | | 326 | |
Boston Scientific Corp. | | (a)41,085 | | 573 | |
Covidien Ltd. | | (a)12,780 | | 530 | |
Gen-Probe, Inc. | | (a)5,320 | | 354 | |
Hospira, Inc. | | (a)1,177 | | 49 | |
Medtronic, Inc. | | 19,020 | | 1,073 | |
Millipore Corp. | | (a)400 | | 30 | |
St. Jude Medical, Inc. | | (a)6,520 | | 287 | |
Stryker Corp. | | 6,520 | | 448 | |
Waters Corp. | | (a)640 | | 43 | |
Zimmer Holdings, Inc. | | (a)3,880 | | 314 | |
| | | | 4,778 | |
Health Care Providers & Services (1.5%) | | | | | |
Aetna, Inc. | | 9,840 | | 534 | |
AmerisourceBergen Corp. | | 3,980 | | 180 | |
Cardinal Health, Inc. | | 6,660 | | 416 | |
CIGNA Corp. | | 13,980 | | 745 | |
Express Scripts, Inc. | | (a)5,000 | | 279 | |
Health Management Associates, Inc., Class A | | 4,200 | | 29 | |
Humana, Inc. | | (a)2,500 | | 175 | |
IMS Health, Inc. | | 4,400 | | 135 | |
The accompanying notes are an integral part of the financial statements.
17
2007 Annual Report
September 30, 2007
Portfolio of Investments (cont’d)
Balanced Portfolio
| | | | Value | |
| | Shares | | (000) | |
Health Care Providers & Services (cont’d) | | | | | |
Manor Care, Inc. | | 1,000 | | $ | 64 | |
McKesson Corp. | | 4,510 | | 265 | |
Medco Health Solutions, Inc. | | (a)3,917 | | 354 | |
PharMerica Corp. | | (a)331 | | 5 | |
Quest Diagnostics, Inc. | | 3,200 | | 185 | |
Tenet Healthcare Corp. | | (a)7,000 | | 24 | |
UnitedHealth Group, Inc. | | 19,380 | | 939 | |
WellPoint, Inc. | | (a)8,800 | | 695 | |
| | | | 5,024 | |
Hotels Restaurants & Leisure (1.3%) | | | | | |
Accor S.A. | | (a)7,195 | | 639 | |
Carnival Corp. | | 200 | | 10 | |
Harrah’s Entertainment, Inc. | | 50 | | 4 | |
Marriott International, Inc., Class A | | 200 | | 9 | |
McDonald’s Corp. | | 4,990 | | 272 | |
Starbucks Corp. | | (a)52,071 | | 1,364 | |
Starwood Hotels & Resorts Worldwide, Inc. | | 100 | | 6 | |
Wynn Resorts Ltd. | | 14,118 | | 2,224 | |
Yum! Brands, Inc. | | 400 | | 14 | |
| | | | 4,542 | |
Household Durables (0.1%) | | | | | |
Fortune Brands, Inc. | | 1,418 | | 116 | |
Newell Rubbermaid, Inc. | | 4,700 | | 135 | |
| | | | 251 | |
Household Products (1.3%) | | | | | |
Clorox Co. | | 2,517 | | 154 | |
Colgate Palmolive Co. | | 6,092 | | 434 | |
Kimberly-Clark Corp. | | 9,280 | | 652 | |
Procter & Gamble Co. | | 48,850 | | 3,436 | |
| | | | 4,676 | |
Independent Power Producers & Energy Traders (0.0%) | | | | | |
AES Corp. (The) | | (a)2,600 | | 52 | |
Constellation Energy Group, Inc. | | 800 | | 69 | |
| | | | 121 | |
Industrial Conglomerates (2.4%) | | | | | |
3M Co. | | 7,800 | | 730 | |
General Electric Co. | | 143,030 | | 5,921 | |
Siemens A.G. ADR | | 7,510 | | 1,031 | |
Textron, Inc. | | 2,500 | | 155 | |
Tyco International Ltd. | | 14,650 | | 650 | |
| | | | 8,487 | |
Information Technology Services (0.1%) | | | | | |
Automatic Data Processing, Inc. | | 2,100 | | 97 | |
Broadridge Financial Solutions | | 525 | | 10 | |
Electronic Data Systems Corp. | | 2,100 | | 46 | |
Infosys Technology Ltd. ADR | | 2,400 | | 116 | |
Paychex, Inc. | | 1,300 | | 53 | |
Western Union Co. (The) | | 2,100 | | 44 | |
| | | | 366 | |
Insurance (2.6%) | | | | | |
ACE Ltd. | | 1,430 | | 87 | |
Aegon N.V. | | 12,130 | | 231 | |
Aflac, Inc. | | 3,060 | | $ | 175 | |
Allstate Corp. (The) | | 4,240 | | 242 | |
AMBAC Financial Group, Inc. | | 450 | | 28 | |
American International Group, Inc. | | 13,830 | | 936 | |
AON Corp. | | 1,300 | | 58 | |
Berkshire Hathaway, Inc., Class B | | (a)293 | | 1,158 | |
Chubb Corp. | | 15,290 | | 820 | |
Cincinnati Financial Corp. | | 425 | | 18 | |
Hartford Financial Services Group, Inc. (The) | | 7,960 | | 737 | |
Lincoln National Corp. | | 1,859 | | 123 | |
Loews Corp. | | 20,163 | | 975 | |
Marsh & McLennan Cos., Inc. | | 43,048 | | 1,098 | |
MBIA, Inc. | | 1,260 | | 77 | |
Metlife, Inc. | | 4,490 | | 313 | |
Principal Financial Group | | 2,270 | | 143 | |
Progressive Corp. (The) | | 5,540 | | 107 | |
Prudential Financial, Inc. | | 2,900 | | 283 | |
Travelers Cos., Inc. (The) | | 18,836 | | 948 | |
XL Capital Ltd., Class A | | 6,840 | | 542 | |
| | | | 9,099 | |
Internet & Catalog Retail (0.8%) | | | | | |
Amazon.com, Inc. | | (a)29,879 | | 2,783 | |
Internet Software & Services (2.1%) | | | | | |
eBay, Inc. | | (a)66,080 | | 2,579 | |
Google, Inc., Class A | | (a)5,928 | | 3,363 | |
Yahoo!, Inc. | | (a)52,693 | | 1,414 | |
| | | | 7,356 | |
Machinery (0.8%) | | | | | |
Caterpillar, Inc. | | 8,100 | | 635 | |
Danaher Corp. | | 3,200 | | 265 | |
Deere & Co. | | 2,250 | | 334 | |
Dover Corp. | | 3,250 | | 165 | |
Eaton Corp. | | 1,900 | | 188 | |
Illinois Tool Works, Inc. | | 7,400 | | 441 | |
Ingersoll-Rand Co., Ltd., Class A | | 4,000 | | 218 | |
ITT Corp. | | 2,100 | | 143 | |
Paccar, Inc. | | 3,237 | | 276 | |
Parker Hannifin Corp. | | 1,500 | | 168 | |
Tata Motors Ltd. ADR | | 2,100 | | 40 | |
| | | | 2,873 | |
Media (1.5%) | | | | | |
CBS Corp., Class B | | 75 | | 2 | |
Central European Media Enterprises Ltd., | | | | | |
Class A | | (a)6,600 | | 605 | |
Citadel Broadcasting Corp. | | 11 | | @— | |
Comcast Corp., Class A | | (a)28,259 | | 683 | |
Grupo Televisa S.A. ADR | | 43,243 | | 1,045 | |
Idearc, Inc. | | 135 | | 4 | |
Interpublic Group of Cos., Inc. | | (a)50 | | 1 | |
Live Nation, Inc. | | (a)263 | | 6 | |
McClatchy Co., Class A | | 25 | | 1 | |
McGraw-Hill Cos., Inc. (The) | | 6,784 | | 345 | |
New York Times Co., Class A | | 50 | | 1 | |
Omnicom Group, Inc. | | 100 | | 5 | |
The accompanying notes are an integral part of the financial statements.
18
| 2007 Annual Report |
| |
| September 30, 2007 |
Portfolio of Investments (cont’d)
Balanced Portfolio
| | | | Value | |
| | Shares | | (000) | |
Media (cont’d) | | | | | |
Time Warner, Inc. | | 66,508 | | $ | 1,221 | |
TVN S.A. | | (a)54,982 | | 454 | |
Viacom, Inc., Class B | | (a)24,573 | | 958 | |
Walt Disney Co. | | 150 | | 5 | |
| | | | 5,336 | |
Metals & Mining (0.5%) | | | | | |
Newmont Mining Corp. | | 12,993 | | 581 | |
Nucor Corp. | | 16,366 | | 973 | |
Sterlite Industries India Ltd. ADR | | (a)3,600 | | 67 | |
| | | | 1,621 | |
Multi-Utilities (0.4%) | | | | | |
Ameren Corp. | | 800 | | 42 | |
Dominion Resources, Inc. | | 1,100 | | 93 | |
DTE Energy Co. | | 900 | | 44 | |
Duke Energy Corp. | | 4,628 | | 86 | |
PG&E Corp. | | 1,900 | | 91 | |
Public Service Enterprise Group, Inc. | | 800 | | 70 | |
Veolia Environnement ADR | | 5,634 | | 485 | |
Williams Cos., Inc. | | 13,420 | | 457 | |
| | | | 1,368 | |
Multiline Retail (0.4%) | | | | | |
Sears Holdings Corp. | | (a)11,929 | | 1,517 | |
Office Electronics (0.0%) | | | | | |
Xerox Corp. | | (a)7,954 | | 138 | |
Oil, Gas & Consumable Fuels (5.4%) | | | | | |
Anadarko Petroleum Corp. | | 4,940 | | 266 | |
Apache Corp. | | 3,286 | | 296 | |
Chevron Corp. | | 21,657 | | 2,027 | |
ConocoPhillips | | 24,239 | | 2,127 | |
Devon Energy Corp. | | 6,670 | | 555 | |
EOG Resources, Inc. | | 2,100 | | 152 | |
ExxonMobil Corp. | | 64,341 | | 5,955 | |
Hess Corp. | | 2,510 | | 167 | |
Hugoton Royalty Trust | | 131 | | 3 | |
LUKOIL ADR | | 9,314 | | 774 | |
Marathon Oil Corp. | | 6,640 | | 379 | |
OAO Gazprom (Registered) ADR | | (a)19,276 | | 850 | |
Occidental Petroleum Corp. | | 17,188 | | 1,101 | |
Royal Dutch Shell plc ADR | | 11,540 | | 948 | |
Spectra Energy Corp. | | 3,914 | | 96 | |
Tupras-Turkiye Petrol Rafine | | (a)25,204 | | 668 | |
Ultra Petroleum Corp. | | (a)(c)29,220 | | 1,813 | |
Valero Energy Corp. | | 4,800 | | 323 | |
XTO Energy, Inc. | | 2,100 | | 130 | |
| | | | 18,630 | |
Personal Products (0.1%) | | | | | |
Avon Products, Inc. | | 5,490 | | 206 | |
Estee Lauder Cos., Inc. (The) | | 5,990 | | 254 | |
| | | | 460 | |
Pharmaceuticals (3.9%) | | | | | |
Abbott Laboratories | | 35,356 | | 1,896 | |
Allergan, Inc. | | 2,120 | | $ | 137 | |
Bristol-Myers Squibb Co. | | 52,871 | | 1,524 | |
Dr Reddys Laboratories Ltd. ADR | | 1,700 | | 28 | |
Eli Lilly & Co. | | 26,750 | | 1,523 | |
Forest Laboratories, Inc. | | (a)2,510 | | 93 | |
Johnson & Johnson | | 23,160 | | 1,522 | |
King Pharmaceuticals, Inc. | | (a)1,030 | | 12 | |
Merck & Co., Inc. | | 15,700 | | 811 | |
Novartis A.G. ADR | | 2,940 | | 162 | |
Pfizer, Inc. | | 69,341 | | 1,694 | |
Roche Holding A.G. ADR | | 6,600 | | 596 | |
Sanofi-Aventis ADR | | 4,330 | | 184 | |
Schering-Plough Corp. | | 63,690 | | 2,014 | |
Thermo Fisher Scientific, Inc. | | (a)1,762 | | 102 | |
Wyeth | | 28,237 | | 1,258 | |
| | | | 13,556 | |
Road & Rail (0.2%) | | | | | |
Burlington Northern and Santa Fe Railway Co. | | 2,100 | | 171 | |
CSX Corp. | | 3,800 | | 162 | |
Norfolk Southern Corp. | | 2,350 | | 122 | |
Union Pacific Corp. | | 1,550 | | 175 | |
| | | | 630 | |
Semiconductors & Semiconductor Equipment (1.3%) | | | | | |
Advanced Micro Devices, Inc. | | (a)4,022 | | 53 | |
Altera Corp. | | 4,329 | | 104 | |
Analog Devices, Inc. | | 3,392 | | 123 | |
Applied Materials, Inc. | | 15,963 | | 331 | |
Broadcom Corp., Class A | | (a)4,730 | | 172 | |
Intel Corp. | | 75,226 | | 1,945 | |
KLA-Tencor Corp. | | 2,010 | | 112 | |
Linear Technology Corp. | | 2,658 | | 93 | |
LSI Logic Corp. | | (a)460 | | 3 | |
Maxim Integrated Products, Inc. | | 3,114 | | 91 | |
Micron Technology, Inc. | | (a)32,756 | | 364 | |
National Semiconductor Corp. | | 4,106 | | 111 | |
Novellus Systems, Inc. | | (a)1,828 | | 50 | |
NVIDIA Corp. | | (a)5,700 | | 207 | |
Teradyne, Inc. | | (a)1,455 | | 20 | |
Texas Instruments, Inc. | | 15,978 | | 585 | |
Xilinx, Inc. | | 3,160 | | 83 | |
| | | | 4,447 | |
Software (0.7%) | | | | | |
Accelr8 Technology Corp. | | (a)233 | | 1 | |
Adobe Systems, Inc. | | (a)1,400 | | 61 | |
Electronic Arts, Inc. | | (a)900 | | 51 | |
Microsoft Corp. | | 19,800 | | 583 | |
NCR Corp. | | (a)1,008 | | 50 | |
Oracle Corp. | | (a)9,800 | | 212 | |
Symantec Corp. | | (a)30,530 | | 592 | |
VMware, Inc., Class A | | (a)8,369 | | 711 | |
| | | | 2,261 | |
Specialty Retail (0.5%) | | | | | |
Abercrombie & Fitch Co., Class A | | 11,375 | | 918 | |
Home Depot, Inc. (The) | | 13,000 | | 422 | |
The accompanying notes are an integral part of the financial statements.
19
2007 Annual Report
September 30, 2007
Portfolio of Investments (cont’d)
Balanced Portfolio
| | | | Value | |
| | Shares | | (000) | |
Specialty Retail (cont’d) | | | | | |
Office Depot, Inc. | | (a)12,872 | | $ | 265 | |
| | | | 1,605 | |
Thrifts & Mortgage Finance (0.4%) | | | | | |
Countrywide Financial Corp. | | 1,230 | | 24 | |
Fannie Mae | | 1,400 | | 85 | |
Freddie Mac | | 19,015 | | 1,122 | |
MGIC Investment Corp. | | 225 | | 7 | |
Washington Mutual, Inc. | | 1,810 | | 64 | |
| | | | 1,302 | |
Tobacco (0.5%) | | | | | |
Altria Group, Inc. | | 23,320 | | 1,622 | |
ITC Ltd. GDR | | (a)13,531 | | 64 | |
Reynolds American, Inc. | | 1,500 | | 95 | |
UST, Inc. | | 1,012 | | 50 | |
| | | | 1,831 | |
Trading Companies & Distributors (0.0%) | | | | | |
W.W. Grainger, Inc. | | 550 | | 50 | |
Wireless Telecommunication Services (1.9%) | | | | | |
America Movil S.A.B. de C.V., Series L ADR | | 23,978 | | 1,534 | |
China Mobile Ltd. ADR | | 9,260 | | 760 | |
Mobile Telesystems OJSC ADR | | 24,400 | | 1,691 | |
Turkcell Iletisim Hizmet A.S. | | (a)77,125 | | 652 | |
Vimpel-Communications ADR | | 79,000 | | 2,135 | |
| | | | 6,772 | |
Total Common Stocks (Cost $142,159) | | | | 191,519 | |
Investment Companies (6.5%) | | | | | |
iShares MSCI Emerging Markets Index Fund | | 60,794 | | 9,086 | |
iShares MSCI EMU Index Fund | | 100 | | 12 | |
iShares MSCI Hong Kong Index Fund | | 93,300 | | 1,962 | |
iShares MSCI Japan Index Fund | | 26,330 | | 378 | |
iShares MSCI Mexico Index Fund | | 69,033 | | 4,058 | |
iShares MSCI United Kingdom Index Fund | | 99,100 | | 2,550 | |
StreetTRACKS Gold Trust | | 62,700 | | 4,609 | |
Total Investment Companies (Cost $15,563) | | | | 22,655 | |
| | | | | |
| | No. of | | | |
| | Contracts | | | |
Put Options Purchased (0.0%) | | | | | |
90 Day EuroDollar | | | | | |
12/07 @ $94.75 | | (a)184 | | 20 | |
3/08 @ $94.75 | | (a)66 | | 6 | |
Total Put Options Purchased (Cost $52) | | | | 26 | |
| | | | | |
| | Shares | | | |
Preferred Stock (0.0%) | | | | | |
Mortgages — Other | | | | | |
Home Ownership Funding Corp., | | | | | |
13.33% (Cost $92) | | (e)500 | | 75 | |
| | | | | |
| | Face | | | |
| | Amount | | Value | |
| | (000) | | (000) | |
Short-Term Investments (16.4%) | | | | | |
Short-Term Debt Securities held as Collateral on Loaned Securities (2.4%) | | | | | |
AIG Match Funding Corp., | | | | | |
5.73%, 10/17/07 | | $ | (h)340 | | $ | 340 | |
Alliance & Leicester plc, | | | | | |
5.83%, 10/9/07 | | (h)243 | | 243 | |
Bancaja, | | | | | |
5.36%, 10/19/07 | | 121 | | 121 | |
Bank of New York Co., Inc., | | | | | |
5.82%, 10/10/07 | | (h)121 | | 121 | |
BASF AG, | | | | | |
5.36%, 10/22/07 | | (h)121 | | 121 | |
BNP Paribas plc, | | | | | |
5.50%, 11/19/07 | | (h)243 | | 243 | |
CAM US Finance S.A. Unipersonal, | | | | | |
5.37%, 10/3/07 | | 486 | | 486 | |
Canadian Imperial Bank of Commerce, New
York, | | | | | |
4.92%, 10/1/07 | | (h)243 | | 243 | |
CC USA, Inc., | | | | | |
4.68%, 10/1/07 | | (h)121 | | 121 | |
CIT Group Holdings, | | | | | |
5.38%, 10/18/07 | | (h)437 | | 437 | |
Citigroup Global Markets Holdings, Inc., | | | | | |
5.26%, 10/1/07 | | 962 | | 962 | |
Credit Suisse First Boston, New York, | | | | | |
4.82%, 10/1/07 | | (h)243 | | 243 | |
First Tennessee Bank, | | | | | |
5.76%, 10/17/07 | | (h)121 | | 121 | |
5.77%, 10/17/07 | | (h)485 | | 485 | |
Goldman Sachs Group, Inc., | | | | | |
5.37%, 10/1/07 | | 121 | | 121 | |
5.82%, 10/15/07 | | (h)228 | | 228 | |
HSBC Finance Corp., | | | | | |
5.81%, 10/9/07 | | (h)121 | | 121 | |
IBM Corp., | | | | | |
5.79%, 10/9/07 | | 486 | | 486 | |
Macquarie Bank Ltd., | | | | | |
5.17%, 10/22/07 | | (h)243 | | 243 | |
Marshall & Ilsley Bank, | | | | | |
5.37%, 12/17/07 | | 243 | | 243 | |
Metropolitan Life Global Funding, | | | | | |
5.13%, 10/22/07 | | (h)364 | | 364 | |
National Bank of Canada, | | | | | |
5.66%, 10/2/07 | | (h)485 | | 485 | |
National Rural Utilities Cooperative Finance Corp., | | | | | |
5.73%, 10/1/07 | | (h)485 | | 485 | |
Nationwide Building Society, | | | | | |
5.28%, 12/28/07 | | 282 | | 282 | |
Societe Generale, New York, | | | | | |
5.11%, 10/31/07 | | (h)583 | | 583 | |
Unicredito Delaware, Inc., | | | | | |
5.77%, 10/15/07 | | (h)267 | | 267 | |
Unicredito Italiano Bank (Ireland) plc, | | | | | |
5.84%, 10/9/07 | | (h)170 | | 170 | |
| | | | 8,365 | |
| | | | | | | |
The accompanying notes are an integral part of the financial statements.
20
| 2007 Annual Report |
| |
| September 30, 2007 |
Portfolio of Investments (cont’d)
Balanced Portfolio
| | | | Value | |
| | Shares | | (000) | |
Investment Company (14.0%) | | | | | |
Morgan Stanley Institutional Liquidity Money Market Portfolio — Institutional Class | | (p)48,557,036 | | $ | 48,557 | |
| | | | | |
| | Face | | | |
| | Amount | | | |
| | (000) | | | |
U.S. Treasury Security (0.0%) | | | | | |
U.S. Treasury Bill | | | | | |
5.49%, 1/10/08 | | $ | (j)(r)150 | | 148 | |
Total Short-Term Investments (Cost $57,070) | | | | 57,070 | |
Total Investments (105.2%) (Cost $311,191) — Including $23,249 of Securities Loaned | | | | 365,384 | |
Liabilities in Excess of Other Assets (-5.2%) | | | | (18,212 | ) |
Net Assets(100%) | | | | $ | 347,172 | |
| | | | | | | |
(a) | Non-income producing security. |
(c) | All or a portion of security on loan at September 30, 2007. |
(e) | 144A security — Certain conditions for public sale may exist. Unless otherwise noted, these securities are deemed to be liquid. |
(h) | Variable/Floating Rate Security — Interest rate changes on these instruments are based on changes in a designated base rate. The rates shown are those in effect on September 30, 2007. |
(i) | Security is subject to delayed delivery. |
(j) | All or a portion of the security was pledged to cover margin requirements for futures contracts. |
(o) | Perpetual — Security does not have a predetermined maturity date. Rate for this security is fixed for a period of time then reverts to a floating rate. The interest rate shown is the rate in effect at September 30, 2007. |
(p) | See Note F within the Notes to Financial Statements regarding investment in Morgan Stanley Institutional Liquidity Government Portfolio — Institutional Class, Morgan Stanley Institutional Liquidity Money Market Portfolio -— Institutional Class and/or Morgan Stanley Institutional Liquidity Tax-Exempt Portfolio — Institutional Class. |
(r) | Rate shown is the Yield to Maturity at September 30, 2007. |
@ | Face Amount/Value is less than $500. |
ADR | American Depositary Receipt |
GDR | Global Depositary Receipt |
Inv Fl | Inverse Floating Rate — Interest rate fluctuates with an inverse relationship to an associated interest rate. Indicated rate is the effective rate at September 30, 2007. |
IO | Interest Only |
JPY | Japanese Yen |
MXN | Mexican Peso |
PAC | Planned Amortization Class |
PO | Principal Only |
TBA | To Be Announced |
Foreign Currency Exchange Contract Information:
The Portfolio had the following foreign currency exchange contract(s) open at period end:
| | | | | | | | | | Net | |
Currency | | | | | | In | | | | Unrealized | |
to | | | | | | Exchange | | | | Appreciation | |
Deliver | | Value | | Settlement | | For | | Value | | (Depreciation) | |
(000) | | (000) | | Date | | (000) | | (000) | | (000) | |
CNY | 275,255 | | $ | 36,770 | | 10/17/07 USD | | 36,833 | | $ | 36,833 | | $ | 63 | |
EUR | 551 | | 787 | | 11/14/07 USD | | 756 | | 756 | | (31 | ) |
USD | 52,493 | | 52,493 | | 10/17/07 CNY | | 393,222 | | 52,530 | | 37 | |
| | $ | 90,050 | | | | | | $ | 90,119 | | $ | 69 | |
CNY — Chinese Renminbi
EUR — Euro
USD — United States Dollar
The accompanying notes are an integral part of the financial statements.
21
2007 Annual Report
September 30, 2007
Portfolio of Investments (cont’d)
Balanced Portfolio
Futures contracts:
The Portfolio had the following futures contract(s) open at period end:
| | | | | | | | Net | |
| | | | | | | | Unrealized | |
| | Number | | | | | | Appreciation | |
| | of | | Value | | Expiration | | (Depreciation) | |
| | Contracts | | (000) | | Date | | (000) | |
Long: | | | | | | | | | |
Australian Dollar | | | | | | | | | |
10 yr. Bond | | 39 | | $ | 25,004 | | Dec-07 | | $ | (66 | ) |
British Pound | | | | | | | | | |
Long Gilt | | 21 | | 4,595 | | Dec-07 | | (7 | ) |
EuroDollar | | | | | | | | | |
CME | | 17 | | 4,044 | | Dec-07 | | 21 | |
EuroDollar | | | | | | | | | |
CME | | 17 | | 4,058 | | Mar-08 | | 32 | |
EuroDollar | | | | | | | | | |
CME | | 17 | | 4,064 | | Jun-08 | | 36 | |
EuroDollar | | | | | | | | | |
CME | | 17 | | 4,067 | | Sep-08 | | 39 | |
EuroDollar | | | | | | | | | |
CME | | 17 | | 4,067 | | Dec-08 | | 40 | |
EuroDollar | | | | | | | | | |
CME | | 17 | | 4,064 | | Mar-09 | | 39 | |
EuroDollar | | | | | | | | | |
CME | | 17 | | 4,059 | | Jun-09 | | (4 | ) |
Hong Kong Dollar | | | | | | | | | |
H-Shares | | 38 | | 4,204 | | Oct-07 | | 222 | |
Japanese Yen | | | | | | | | | |
10 yr. Bond | | 6 | | 7,051 | | Dec-07 | | (2 | ) |
MSCI | | | | | | | | | |
Singapore | | 15 | | 921 | | Oct-07 | | 20 | |
S&P 500 Emini | | | | | | | | | |
(U.S. Dollar) | | 63 | | 4,845 | | Dec-07 | | 17 | |
SGX CNX | | | | | | | | | |
Nifty | | 89 | | 4,484 | | Oct-07 | | 32 | |
U.S. Treasury | | | | | | | | | |
2 yr. Note | | 53 | | 10,973 | | Dec-07 | | 13 | |
U.S. Treasury | | | | | | | | | |
5 yr. Note | | 80 | | 8,563 | | Dec-07 | | 54 | |
| | | | | | | | | |
Short: | | | | | | | | | |
Russell Mini | | | | | | | | | |
Index | | 40 | | 3,253 | | Dec-07 | | 4 | |
S&P Mid 400 | | | | | | | | | |
Emini | | 35 | | 3,127 | | Dec-07 | | 7 | |
Topix Index | | 2 | | 283 | | Dec-07 | | (18 | ) |
U.S. Treasury | | | | | | | | | |
10 yr. Note | | 24 | | 2,623 | | Dec-07 | | 11 | |
U.S. Treasury | | | | | | | | | |
Long Bond | | 99 | | 11,023 | | Dec-07 | | 21 | |
| | | | | | | | $ | 511 | |
| | | | | | | | | | | |
CME Chicago Mercantile Exchange
The accompanying notes are an integral part of the financial statements.
22
| 2007 Annual Report |
| |
| September 30, 2007 |
Portfolio of Investments (cont’d)
Balanced Portfolio
Credit Default Swap Contracts
The Portfolio had the following credit default swap agreement(s) open at period end:
| | | | | | | | | | Unrealized | |
| | | | Notional | | | | | | Appreciation | |
| | Buy/Sell | | Amount | | Pay/Receive | | Termination | | (Depreciation) | |
Swap Counterparty and Reference Obligation | | Protection | | (000) | | Fixed Rate | | Date | | (000) | |
Bank of America | | Buy | | $ | 220 | | 1.19 | % | 3/20/12 | | $ | (3 | ) |
The Gap, Inc., 8.80%, 12/15/08 | | | | | | | | | | | |
Citigroup | | Buy | | 430 | | 0.43 | | 3/20/12 | | (1 | ) |
Tyco International Ltd., Zero Coupon, 11/17/20 | | | | | | | | | | | |
Citigroup | | Buy | | 225 | | 0.43 | | 3/20/12 | | @— | |
Tyco International Ltd., Zero Coupon, 11/17/20 | | | | | | | | | | | |
Goldman Sachs | | Buy | | 1,100 | | 0.75 | | 6/20/11 | | 20 | |
Dow Jones CDX North America Investment Grade High Volatility Index, Series 7 | | | | | | | | | | | |
Goldman Sachs | | Buy | | 1,450 | | 0.75 | | 12/20/11 | | 33 | |
Dow Jones CDX North America Investment Grade High Volatility Index, Series 7 | | | | | | | | | | | |
Goldman Sachs | | Buy | | 120 | | 0.15 | | 12/20/11 | | 1 | |
Motorola, Inc., 6.50%, 9/1/25 | | | | | | | | | | | |
Goldman Sachs | | Buy | | 250 | | 0.16 | | 12/20/11 | | 1 | |
Motorola, Inc., 6.50%, 9/1/25 | | | | | | | | | | | |
Goldman Sachs | | Buy | | 350 | | 0.12 | | 12/20/11 | | 2 | |
The Hartford Financial Services Group, Inc., 4.75%, 3/1/14 | | | | | | | | | | | |
Goldman Sachs | | Buy | | 370 | | 0.10 | | 3/20/12 | | 2 | |
The Chubb Corp., 6.00%, 11/15/11 | | | | | | | | | | | |
Goldman Sachs | | Buy | | 185 | | 0.22 | | 3/20/12 | | @— | |
Dell, Inc., 7.10%, 4/15/28 | | | | | | | | | | | |
JPMorgan Chase | | Buy | | 70 | | 1.18 | | 6/20/14 | | 1 | |
Belo Corp., 8.00%, 11/1/08 | | | | | | | | | | | |
JPMorgan Chase | | Buy | | 190 | | 1.30 | | 6/20/14 | | 1 | |
Belo Corp., 8.00%, 11/1/08 | | | | | | | | | | | |
Lehman Brothers | | Buy | | 175 | | 0.20 | | 12/20/11 | | @— | |
Union Pacific Corp., 6.13%, 1/15/12 | | | | | | | | | | | |
| | | | | | | | | | $ | 57 | |
| | | | | | | | | | | | | |
Interest Rate Swap Contracts
The Portfolio had the following interest rate swap agreement(s) open at period end:
| | | | | | | | | | | | Unrealized | |
| | | | | | | | | | Notional | | Appreciation | |
| | Floating Rate | | Pay/Receive | | Fixed | | Termination | | Amount | | (Depreciation) | |
Swap Counterparty | | Index | | Floating Rate | | Rate | | Date | | (000) | | (000) | |
Citigroup | | 3 Month LIBOR | | Pay | | 5.33 | % | 5/22/17 | | $ | 1,600 | | $ | 38 | |
| | 3 Month LIBOR | | Pay | | 5.37 | | 5/23/17 | | 1,850 | | 49 | |
| | 3 Month LIBOR | | Pay | | 5.44 | | 5/29/17 | | 2,825 | | 91 | |
| | 3 Month LIBOR | | Pay | | 5.02 | | 9/11/17 | | 1,150 | | (18 | ) |
| | 3 Month LIBOR | | Receive | | 5.29 | | 9/28/17 | | 700 | | (5 | ) |
Deutsche Bank | | 3 Month LIBOR | | Pay | | 5.39 | | 5/25/17 | | 4,175 | | 117 | |
| | 3 Month LIBOR | | Pay | | 5.43 | | 5/29/17 | | 2,750 | | 86 | |
Goldman Sachs | | 3 Month LIBOR | | Pay | | 5.34 | | 5/24/17 | | 4,250 | | 103 | |
JPMorgan Chase | | 3 Month LIBOR | | Pay | | 5.37 | | 5/23/17 | | 650 | | 18 | |
| | 3 Month LIBOR | | Pay | | 5.09 | | 9/11/17 | | 2,550 | | (26 | ) |
| | 3 Month LIBOR | | Pay | | 5.16 | | 9/20/17 | | 1,050 | | (4 | ) |
| | 3 Month LIBOR | | Receive | | 5.23 | | 9/27/17 | | 1,200 | | (3 | ) |
| | 3 Month LIBOR | | Receive | | 5.30 | | 9/28/17 | | 1,400 | | (11 | ) |
| | | | | | | | | | | | $ | 435 | |
| | | | | | | | | | | | | | | |
LIBOR — London Inter Bank Offer Rate
The accompanying notes are an integral part of the financial statements.
23
2007 Annual Report
September 30, 2007
Investment Overview (unaudited)
Equities Plus Portfolio
The Equities Plus Portfolio seeks long-term capital appreciation. The Portfolio invests in a portfolio primarily composed of equity index derivatives to gain exposure to the S&P 500® Index, combined with investment grade dollar-denominated fixed income securities, particularly U.S. government, corporate and mortgage securities. The S&P 500® Index is a well known stock market index that includes common stocks of 500 companies representing a significant portion of the market value of all common stocks publicly traded in the United States. The Portfolio also may opportunistically invest in equity securities (in addition to equity index derivatives) to gain exposure to the S&P 500® Index. With respect to its fixed income component, the Portfolio will ordinarily seek to maintain an average duration between zero and one year, although there is no minimum or maximum maturity for any individual security.
Performance
For the fiscal year ended September 30, 2007, the Portfolio’s Institutional Class had a total return based on net asset value and reinvestment of distributions per share of 15.54%, net of fees. The Portfolio’s Institutional Class underperformed against its benchmark the S&P 500® Index (the ‘‘Index”) which returned 16.44%.
Factors Affecting Performance
• The strategy utilizes S&P 500 Index futures to deliver the performance of that Index. By design, any performance over or under the S&P 500 Index is the result of our success in investing the cash held as collateral for those futures in a short-duration fixed income strategy.
• During the period, we positioned the fixed income segment of the Portfolio for a yield curve steepening, which occurred as rates declined, especially in the short end, as Treasuries rallied during the liquidity crisis of July and August. As a result, the fixed income returns drove the overall Portfolio’s returns above the Index.
• The Porfolio realized underperformance relative to the Index due to holdings of AAA-rated floating rate mortgage-backed securities, whose prices fell in sympathy with general mortgage market distress.
Management Strategies
• The economy faces more headwind due to the continuing weakness in the housing markets. However, the combination of tight labor markets and galloping commodities prices continue to put upward pressure on wages and inflation. Over the past three years, core inflation measures, which omit food and energy price effects, have been falling behind gradually rising total inflation measures. Though we are wary of the eventual pass through of energy and agricultural price rises to the general economy, housing market weakness should be disinflationary. Given this uncertainty, we believe that the market is making an extreme forecast for low, stable inflation, evident in low risk premiums at the long end of the yield curve. We have positioned the Portfolio to be slightly short interest rate risk, with a bias toward yield curve steepening, which we believe will occur whether the economy contracts or grows.
• Floating rate mortgage-backed securities constitute the Portfolio’s core bond holdings because we believe they offer attractive value on a risk-adjusted expected return basis.
• The fixed income component of the Portfolio emphasizes high credit quality (AAA average) and short duration. These characteristics may help the Portfolio to meet its objectives of balancing strong risk adjusted performance, deflation protection, and preservation of capital.
• Overall, the compensation now offered by the market to take on risk - whether it be interest rate, credit, volatility, or liquidity risk - remains at unattractive levels. As a result, we have positioned the Portfolio defensively to protect capital as we await better opportunities to add these risks back.

24
| 2007 Annual Report |
| |
| September 30, 2007 |
Investment Overview (cont’d)
Equities Plus Portfolio

* Minimum Investment
** Commenced operations on April 26, 2006.
In accordance with SEC regulations, the Portfolio’s performance shown assumes that all recurring fees (including management fees) were deducted and all dividends and distributions were reinvested. The performance of Adviser Class shares will vary from the Institutional Class shares based upon its different inception date and will be negatively impacted by additional fees assessed to this class.
Performance Compared to the S&P 500® Index(1)
| | Total Returns(2) | |
| | | | Average Annual | |
| | One | | Since | |
| | Year | | Inception(4) | |
| | | | | |
Portfolio — Institutional Class(3) | | 15.54 | % | 12.88 | % |
S&P 500® Index | | 16.44 | | 13.71 | |
Portfolio — Adviser Class(3) | | 15.26 | | 12.58 | |
S&P 500® Index | | 16.44 | | 13.71 | |
Performance data quoted represents past performance, which is no guarantee of future results, and current performance may be lower or higher than the figures shown. Performance assumes that all dividends and distributions, if any, were reinvested. For the most recent month-end performance figures, please visit www.morganstanley.com/im. Investment return and principal value will fluctuate so that Portfolio shares, when redeemed, may be worth more or less than their original cost. Total returns do not reflect the deduction of taxes that a shareholder would pay on Portfolio distributions or the redemption of Portfolio shares.
(1) | The S&P 500® Index is a capitalization-weighted index of 500 stocks. The index is designed to measure performance of the broad domestic economy through changes in aggregate market value of 500 stocks representing all major industries. The Index is unmanaged and its returns do not include any sales charges or fees. Such costs would lower performance. It is not possible to invest directly in an index. |
(2) | Total returns for the Portfolio reflect expenses waived and/or reimbursed, if applicable, by the Adviser. Without such waivers and/or reimbursements, total returns would have been lower. Fee waivers and/or reimbursements are voluntary and the Adviser reserves the right to commence or terminate any waiver and/or reimbursement at any time. |
(3) | Commenced operations on April 26, 2006. |
(4) | For comparative purposes, average annual since inception returns listed for the Index refer to the inception date or initial offering of the respective share class of the Portfolio, not the inception of the Index. |
Expense Examples
As a shareholder of the Portfolio, you incur two types of costs: (1) transactional costs, including redemption fees; (2) ongoing costs, including management fees, shareholder servicing fees, and other Portfolio expenses. These examples are intended to help you understand your ongoing costs (in dollars) of investing in the Portfolio and to compare these costs with the ongoing costs of investing in other mutual funds.
The examples are based on an investment of $1,000 invested at the beginning of the six-month period ended September 30, 2007 and held for the entire six-month period.
Actual Expenses
The first line of the tables below provides information about actual account values and actual expenses. You may use the information in this line, together with the amount you invested, to estimate the expenses that you paid over the period. Simply divide your account value by $1,000 (for example, an $8,600 account value divided by $1,000 = 8.6), then multiply the result by the number in the first line under the heading entitled “Expenses Paid During Period” to estimate the expenses you paid on your account during this period.
Please note that “Expenses Paid During Period” are grossed up to reflect Portfolio expenses prior to the effect of Expense Offset (See Note E in the Notes to Financial Statements). Therefore, the annualized net expense ratios may differ from the ratio of expenses to average net assets shown in the Financial Highlights.
Hypothetical Example for Comparison Purposes
The second line of the tables below provides information about hypothetical account values and hypothetical expenses based on the Portfolio’s actual expense ratio and an assumed rate of return of 5% per year before expenses, which is not the Portfolio’s actual return. The hypothetical account values and expenses may not be used to estimate the actual ending account balance or expenses you paid for the period. You may use this information to compare the ongoing costs of investing in the Portfolio and other funds. To do so, compare this 5% hypothetical example with the 5% hypothetical examples that appear in the shareholder reports of the other funds.
Please note that the expenses shown in the table are meant to highlight your ongoing costs only and do not reflect any transactional costs, such as redemption fees. Therefore, the second line of the table is useful in comparing ongoing costs only, and will not help you determine the relative total costs of
25
2007 Annual Report
September 30, 2007
Investment Overview (cont’d)
Equities Plus Portfolio
owning different funds. In addition, if these transactional costs were included, your costs would have been higher.
| | | | | | Expenses Paid | |
| | | | Ending Account | | During Period* | |
| | Beginning | | Value | | April 1, 2007 — | |
| | Account Value | | September 30, | | September 30, | |
| | April 1, 2007 | | 2007 | | 2007 | |
Institutional Class | | | | | | | |
Actual | | $ | 1,000.00 | | $ | 1,073.40 | | $ | 3.12 | |
Hypothetical (5% average annual return before expenses) | | 1,000.00 | | 1,022.06 | | 3.04 | |
| | | | | | | |
Adviser Class | | | | | | | |
Actual | | 1,000.00 | | 1,071.10 | | 4.41 | |
Hypothetical (5% average annual return before expenses) | | 1,000.00 | | 1,020.81 | | 4.31 | |
| | | | | | | | | | |
* Expenses are equal to Institutional Class’ and Adviser Class’ annualized net expense ratios of 0.60% and 0.85%, respectively, multiplied by the average account value over the period, multiplied by 183/365 (to reflect the one-half year period).
Graphic Presentation of Portfolio Holdings
The following graph depicts the Portfolio’s holdings by industry and/or investment type, as a percentage of total investments.
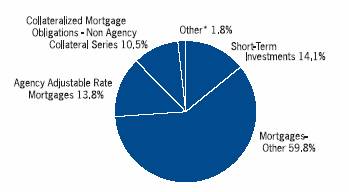
* Industries and/or investment types which do not appear in the above graph, as well as those which represent less than 5% of total investments, if applicable, are included in the category labeled “Other.”
26
| 2007 Annual Report |
| |
| September 30, 2007 |
Portfolio of Investments
Equities Plus Portfolio
| | Face | | | |
| | Amount | | Value | |
| | (000) | | (000) | |
Fixed Income Securities (85.4%) | | | | | |
Agency Adjustable Rate Mortgages (13.8%) | | | | | |
Federal National Mortgage Association, | | | | | |
6.98%, 3/1/36 | | $ | (n)735 | | $ | 748 | |
7.01%, 7/1/35 | | (n)528 | | 543 | |
7.47%, 7/1/36 | | (n)927 | | 949 | |
7.48%, 7/1/36 | | 916 | | 935 | |
7.49%, 8/1/36 | | 696 | | 713 | |
| | | | 3,888 | |
Collateralized Mortgage Obligations — Non Agency Collateral Series (10.5%) | | | | | |
Bear Stearns Structured Products, Inc., | | | | | |
IO | | | | | |
1.41%, 1/27/37 | | (e)2,030 | | 59 | |
1.45%, 6/26/37 | | (e)7,152 | | 223 | |
1.46%, 1/27/37 | | (e)2,846 | | 86 | |
1.57%, 1/27/37 | | (e)1,717 | | 57 | |
2.02%, 5/25/37 | | (e)9,558 | | 320 | |
Countrywide Alternative Loan Trust, | | | | | |
IO | | | | | |
1.08%, 9/25/35 | | (h)3,645 | | 76 | |
1.30%, 8/25/46 | | (h)1,878 | | 72 | |
1.51%, 3/20/47 | | (h)8,442 | | 434 | |
1.88%, 10/25/35 | | (h)3,060 | | 81 | |
2.07%, 12/20/46 | | (h)6,334 | | 283 | |
2.18%, 10/25/46 | | (h)11,733 | | 526 | |
3.31%, 7/20/46 | | (h)1,226 | | 48 | |
Countrywide Home Loan Mortgage Pass Through Trust, | | | | | |
IO | | | | | |
0.44%, 2/25/35 | | (h)1,502 | | 32 | |
1.37%, 9/25/34 | | (h)1,324 | | 24 | |
1.74%, 2/25/35 | | (h)1,609 | | 30 | |
Harborview Mortgage Loan Trust, | | | | | |
IO | | | | | |
2.02%, 7/19/46 | | (h)1,007 | | 36 | |
PO | | | | | |
7/19/47 | | @— | | @— | |
Harborview NIM Corp., | | | | | |
IO | | | | | |
Zero Coupon, 12/15/36 | | (e)(h)188 | | 103 | |
Residential Accredit Loans, Inc., | | | | | |
2.76%, 5/25/47 | | (e)4,883 | | 208 | |
2.80%, 3/25/47 | | (e)819 | | 33 | |
Washington Mutual, Inc., | | | | | |
IO | | | | | |
0.22%, 1/25/45 | | 4,919 | | 65 | |
0.27%, 7/25/46 | | 9,084 | | 68 | |
0.46%, 9/25/46 | | 3,893 | | 29 | |
1.25%, 6/25/46 | | 2,932 | | 63 | |
| | | | 2,956 | |
Finance (1.2%) | | | | | |
Capmark Financial Group, Inc., | | | | | |
5.88%, 5/10/12 | | (e)40 | | 37 | |
6.30%, 5/10/17 | | (e)20 | | 17 | |
Goldman Sachs Capital II, | | | | | |
5.79% | | $ | (h)(o)50 | | $ | 47 | |
Popular North America, Inc., | | | | | |
5.65%, 4/15/09 | | 55 | | 56 | |
USB Capital IX, | | | | | |
6.19% | | (h)(o)40 | | 40 | |
Wachovia Capital Trust III, | | | | | |
5.80% | | (h)(o)130 | | 129 | |
| | | | 326 | |
Industrials (0.4%) | | | | | |
Telecom Italia Capital S.A., | | | | | |
4.00%, 11/15/08 | | 65 | | 64 | |
Viacom, Inc., | | | | | |
5.75%, 4/30/11 | | 60 | | 61 | |
| | | | 125 | |
Mortgages — Other (59.4%) | | | | | |
Bear Stearns Mortgage Funding Trust, | | | | | |
5.34%, 12/25/36 | | (h)766 | | 750 | |
Countrywide Alternative Loan Trust, | | | | | |
5.32%, 11/25/46 | | (h)(n)778 | | 761 | |
5.36%, 7/25/46 | | (h)(n)806 | | 785 | |
5.88%, 11/20/35 | | (h)601 | | 587 | |
6.68%, 2/25/36 | | (h)533 | | 526 | |
7.02%, 11/25/35 | | (h)470 | | 472 | |
Deutsche ALT-A Securities, Inc., Alternate Loan Trust, | | | | | |
5.81%, 2/25/47 | | (h)95 | | 90 | |
Downey Savings & Loan Association Mortgage Loan Trust, | | | | | |
5.68%, 3/19/37 | | (h)840 | | 815 | |
Federal Home Loan Mortgage Corp., | | | | | |
6.35%, 10/15/22 | | 45 | | 45 | |
6.40%, 3/15/22 - 10/15/22 | | 106 | | 106 | |
Federal National Mortgage Association, | | | | | |
5.71%, 12/25/21 | | (h)74 | | 75 | |
5.76%, 11/25/20 | | (h)19 | | 19 | |
5.91%, 10/25/22 | | (h)46 | | 46 | |
GS Mortgage Securities Corp., | | | | | |
6.25%, 8/25/46 | | (e)169 | | 168 | |
6.41%, 6/25/46 | | (e)26 | | 26 | |
Harborview Mortgage Loan Trust, | | | | | |
5.71%, 11/19/36 | | (h)240 | | 236 | |
5.83%, 9/19/35 | | (h)652 | | 643 | |
5.84%, 1/19/36 | | (h)(n)476 | | 466 | |
Harborview NIM Corp., | | | | | |
6.41%, 12/19/36 - 3/19/38 | | (e)607 | | 604 | |
Indymac Index NIM Corp., | | | | | |
6.65%, 6/25/46 | | (e)13 | | 13 | |
Lehman XS Net Interest Margin Notes, | | | | | |
6.25%, 5/28/46 | | (e)15 | | 14 | |
Lehman XS Trust, | | | | | |
5.47%, 2/25/46 | | (h)623 | | 607 | |
Luminent Mortgage Trust, | | | | | |
5.33%, 10/25/46 | | (h)(n)766 | | 749 | |
5.36%, 5/25/46 | | (h)(n)598 | | 585 | |
5.37%, 4/25/36 | | (h)661 | | 648 | |
The accompanying notes are an integral part of the financial statements.
27
2007 Annual Report
September 30, 2007
Portfolio of Investments (cont’d)
Equities Plus Portfolio
| | Face | | | |
| | Amount | | Value | |
| | (000) | | (000) | |
Mortgages — Other (cont’d) | | | | | |
5.38%, 5/25/36 | | $ | (h)(n)605 | | $ | 593 | |
5.41%, 2/25/46 | | (h)(n)623 | | 610 | |
Mastr Adjustable Rate Mortgages Trust, | | | | | |
5.38%, 4/25/46 | | (h)(n)518 | | 510 | |
Novastar Mortgage Backed Notes, | | | | | |
5.37%, 9/25/46 | | (h)571 | | 559 | |
Residential Accredit Loans, Inc., | | | | | |
5.33%, 1/25/37 | | (h)850 | | 813 | |
5.36%, 5/25/46 | | (h)(n)820 | | 799 | |
5.40%, 2/25/46 | | (h)(n)653 | | 635 | |
Sharp SP I, LLC Net Interest Margin Trust, | | | | | |
7.00%, 10/25/46 | | (e)116 | | 113 | |
Structured Asset Mortgage Investments, Inc., | | | | | |
5.36%, 6/25/36 | | (h)(n)609 | | 599 | |
5.40%, 4/25/36 | | (h)601 | | 594 | |
Washington Mutual, Inc., | | | | | |
5.41%, 6/25/46 | | (h)82 | | 77 | |
5.43%, 10/25/46 | | (h)83 | | 79 | |
5.47%, 11/25/45 | | (h)453 | | 443 | |
5.49%, 10/25/45 | | (h)405 | | 399 | |
5.92%, 4/25/46 | | (h)141 | | 139 | |
| | | | 16,798 | |
Utilities (0.1%) | | | | | |
Kinder Morgan Finance Co., | | | | | |
5.70%, 1/5/16 | | (c)40 | | 37 | |
Total Fixed Income Securities (Cost $24,744) | | | | 24,130 | |
| | | | | | | |
| | No. of | | | |
| | Contracts | | | |
Put Options Purchased (0.1%) | | | | | |
90 Day EuroDollar | | | | | |
12/07 @ $94.75 | | (a)193 | | 21 | |
3/08 @ $94.50 | | (a)57 | | 2 | |
Total Put Options Purchased (Cost $41) | | | | 23 | |
| | Face | | | |
| | Amount | | | |
| | (000) | | | |
Short-Term Investments (14.1%) | | | | | |
Short-Term Debt Securities held as Collateral on Loaned Securities (0.1%) | | | | | |
AIG Match Funding Corp., | | | | | |
5.73%, 10/17/07 | | $ | (h)1 | | 1 | |
Alliance & Leicester plc, | | | | | |
5.83%, 10/9/07 | | (h)1 | | 1 | |
Bancaja, | | | | | |
5.36%, 10/19/07 | | 1 | | 1 | |
Bank of New York Co., Inc., | | | | | |
5.82%, 10/10/07 | | (h)1 | | 1 | |
BASF AG, | | | | | |
5.36%, 10/22/07 | | (h)@— | | @— | |
BNP Paribas plc, | | | | | |
5.50%, 11/19/07 | | (h)1 | | 1 | |
CAM US Finance S.A. Unipersonal, | | | | | |
5.37%, 10/3/07 | | 2 | | 2 | |
Canadian Imperial Bank of Commerce, New York, | | | | | |
4.92%, 10/1/07 | | $ | (h)1 | | $ | 1 | |
CC USA, Inc., | | | | | |
4.68%, 10/1/07 | | (h)1 | | 1 | |
CIT Group Holdings, | | | | | |
5.38%, 10/18/07 | | (h)2 | | 2 | |
Citigroup Global Markets Holdings, Inc., | | | | | |
5.26%, 10/1/07 | | 4 | | 4 | |
Credit Suisse First Boston, New York, | | | | | |
4.82%, 10/1/07 | | (h)1 | | 1 | |
First Tennessee Bank, | | | | | |
5.76%, 10/17/07 | | (h)1 | | 1 | |
5.77%, 10/17/07 | | (h)2 | | 2 | |
Goldman Sachs Group, Inc., | | | | | |
5.37%, 10/1/07 | | 1 | | 1 | |
5.82%, 10/15/07 | | (h)1 | | 1 | |
HSBC Finance Corp., | | | | | |
5.81%, 10/9/07 | | (h)1 | | 1 | |
IBM Corp., | | | | | |
5.79%, 10/9/07 | | 2 | | 2 | |
Macquarie Bank Ltd., | | | | | |
5.17%, 10/22/07 | | (h)1 | | 1 | |
Marshall & Ilsley Bank, | | | | | |
5.37%, 12/17/07 | | 1 | | 1 | |
Metropolitan Life Global Funding, | | | | | |
5.13%, 10/22/07 | | (h)2 | | 2 | |
National Bank of Canada, | | | | | |
5.66%, 10/2/07 | | (h)2 | | 2 | |
National Rural Utilities Cooperative Finance Corp., | | | | | |
5.73%, 10/1/07 | | (h)2 | | 2 | |
Nationwide Building Society, | | | | | |
5.28%, 12/28/07 | | 1 | | 1 | |
Societe Generale, New York, | | | | | |
5.11%, 10/31/07 | | (h)3 | | 3 | |
Unicredito Delaware, Inc., | | | | | |
5.77%, 10/15/07 | | (h)1 | | 1 | |
Unicredito Italiano Bank (Ireland) plc, | | | | | |
5.84%, 10/9/07 | | (h)1 | | 1 | |
| | | | 38 | |
| | | | | | | |
| | Shares | | | |
Investment Company (14.0%) | | | | | |
Morgan Stanley Institutional Liquidity Money Market Portfolio — Institutional Class | | (p)3,938,330 | | 3,938 | |
Total Short-Term Investments (Cost $3,976) | | | | 3,976 | |
| | | | | |
Total Investments (99.6%) (Cost $28,761) — Including $37 of Securities Loaned | | | | 28,129 | |
Other Assets in Excess of Liabilities (0.4%) | | | | 116 | |
Net Assets (100%) | | | | $ | 28,245 | |
| | | | | | |
(a) | Non-income producing security. |
(c) | All or a portion of security on loan at September 30, 2007. |
The accompanying notes are an integral part of the financial statements.
28
| 2007 Annual Report |
| |
| September 30, 2007 |
Portfolio of Investments (cont’d)
Equities Plus Portfolio
(e) | 144A security — Certain conditions for public sale may exist. Unless otherwise noted, these securities are deemed to be liquid. |
(h) | Variable/Floating Rate Security — Interest rate changes on these instruments are based on changes in a designated base rate. The rates shown are those in effect on September 30, 2007. |
(n) | All or a portion of the security was pledged to cover securities sold short. |
(o) | Perpetual — Security does not have a predetermined maturity date. Rate for this security is fixed for a period of time then reverts to a floating rate. The interest rate shown is the rate in effect at September 30, 2007. |
(p) | See Note F within the Notes to Financial Statements regarding investment in Morgan Stanley Institutional Liquidity Government Portfolio — Institutional Class, Morgan Stanley Institutional Liquidity Money Market Portfolio — Institutional Class and/or Morgan Stanley Institutional Liquidity Tax-Exempt Portfolio — Institutional Class. |
@ | Face Amount/Value is less than $500. |
IO | Interest Only |
PO | Principal Only |
| | Face | | | |
| | Amount | | Value | |
| | (000) | | (000) | |
Securities Sold Short - Debt Instruments (14.0%) | | | | | |
Federal National Mortgage Association, | | | | | |
October TBA, | | | | | |
5.50%, 10/25/37 | | $ | 1,275 | | $ | 1,249 | |
6.00%, 10/15/37 | | 2,700 | | 2,704 | |
(Total Proceeds $3,979) | | | | $ | 3,953 | |
| | | | | | | |
TBA To Be Announced
Futures Contracts:
The Portfolio had the following futures contract(s) open at period end:
| | | | | | | | Net | |
| | | | | | | | Unrealized | |
| | Number | | | | | | Appreciation | |
| | of | | Value | | Expiration | | (Depreciation) | |
| | Contracts | | (000) | | Date | | (000) | |
Long: | | | | | | | | | |
EuroDollar | | | | | | | | | |
CME | | 1 | | $ | 239 | | Jun-08 | | $ | 2 | |
EuroDollar | | | | | | | | | |
CME | | 1 | | 239 | | Sep-08 | | 2 | |
EuroDollar | | | | | | | | | |
CME | | 3 | | 718 | | Dec-08 | | 6 | |
EuroDollar | | | | | | | | | |
CME | | 3 | | 717 | | Mar-09 | | 6 | |
EuroDollar | | | | | | | | | |
CME | | 31 | | 7,401 | | Jun-09 | | (7 | ) |
S&P 500 Emini | | 2 | | 154 | | Dec-07 | | @— | |
S&P 500 Index | | 73 | | 28,070 | | Dec-07 | | 978 | |
U.S. Treasury | | | | | | | | | |
2 yr. Note | | 24 | | 4,969 | | Dec-07 | | 1 | |
10 yr. Swap | | 10 | | 1,061 | | Dec-07 | | (17 | ) |
Short: | | | | | | | | | |
U.S. Treasury | | | | | | | | | |
5 yr. Note | | 2 | | 214 | | Dec-07 | | 1 | |
U.S. Treasury | | | | | | | | | |
10 yr. Note | | 44 | | 4,808 | | Dec-07 | | 38 | |
U.S. Treasury | | | | | | | | | |
Long Bond | | 12 | | 1,336 | | Dec-07 | | 19 | |
| | | | | | | | $ | 1,029 | |
| | | | | | | | | | | |
CME Chicago Mercantile Exchange
Credit Default Swap Contracts
The Portfolio had the following credit default swap agreement(s) open at period end:
| | | | | | | | | | Unrealized | |
| | | | Notional | | | | | | Appreciation | |
| | Buy/Sell | | Amount | | Pay/Receive | | Termination | | (Depreciation) | |
Swap Counterparty and Reference Obligation | | Protection | | (000) | | Fixed Rate | | Date | | (000) | |
Goldman Sachs | | Sell | | $ | 65 | | 3.08 | % | 6/20/11 | | $ | @— | |
General Motors Acceptance Corp., 6.88%, 8/28/12 | | | | | | | | | | | |
JPMorgan Chase | | Buy | | 30 | | 1.18 | | 6/20/14 | | @— | |
Belo Corp., 8.00%, 11/1/08 | | | | | | | | | | | |
JPMorgan Chase | | Buy | | 70 | | 1.30 | | 6/20/14 | | @— | |
Belo Corp., 8.00%, 11/1/08 | | | | | | | | | | | |
| | | | | | | | | | $ | @— | |
| | | | | | | | | | | | | |
Interest Rate Swap Contracts
The Portfolio had the following interest rate swap agreement(s) open at period end:
| | | | | | | | | | | | Unrealized | |
| | | | | | | | | | Notional | | Appreciation | |
| | Floating Rate | | Pay/Receive | | Fixed | | Termination | | Amount | | (Depreciation) | |
Swap Counterparty | | Index | | Floating Rate | | Rate | | Date | | (000) | | (000) | |
JPMorgan Chase | | 3 Month LIBOR | | Pay | | 5.38 | % | 5/24/17 | | $ | 3,600 | | $ | 99 | |
| | | | | | | | | | | | | | | |
LIBOR — London Inter Bank Offer Rate
The accompanying notes are an integral part of the financial statements.
29
2007 Annual Report
September 30, 2007
Investment Overview (unaudited)
Mid Cap Growth Portfolio
The Mid Cap Growth Portfolio seeks long-term capital growth. The Portfolio seeks long-term capital appreciation by investing primarily in growth-oriented equity securities of U.S. mid cap companies and foreign companies. The Portfolio selects issues from a universe comprised of mid cap companies, most with market capitalizations of generally less than $35 billion. Generally speaking, small and mid-capitalization stock prices experience a greater degree of market volatility than those of large-capitalization companies.
Performance
For the fiscal year ended September 30, 2007, the Portfolio’s Institutional Class had a total return based on net asset value and reinvestment of distributions per share of 34.24%, net of fees. The Portfolio’s Institutional Class outperformed its benchmark the Russell Midcap® Growth Index (the “Index”) which returned 21.22%.
Factors Affecting Performance
• The Portfolio’s outperformance versus the Index for the period was largely due to security selection; however, sector allocation decisions modestly detracted from relative returns.
• The most significant contributor to performance came from stock selection within the consumer discretionary sector. Here, investment in hotel/motel, retail, commercial services, and communications and media companies greatly added to relative returns.
• Within the health care sector, security selection in medical and dental instruments and supplies and health care services companies, and an underweight allocation, benefited performance. In addition, selection in computer services software firms within the technology sector bolstered returns.
• Areas of weakness for the Portfolio included the energy sector, where overall stock selection and an underweight position diminished performance. In this sector, the Portfolio’s lack of exposure to oil well equipment turned out to be the main detractor to relative returns.
• The materials and processing sector was also a drawback to overall performance due to security selection coupled with an underweight allocation. The Portfolio’s underweight in the multi-industry sector, which includes conglomerates, also hurt relative performance.
Management Strategies
• As of the close of the reporting period, consumer discretionary represented the largest sector weight and overweight in the Portfolio, followed by the financial services and health care sectors. The financial services and health care sectors were both underweighted versus the Index.
• It is our goal to hold a portfolio of high quality growth stocks we believe will perform well regardless of the market environment. We continue to favor companies that have some uniqueness or dynamic competitive advantage in their business model, with a high quality stream of cash flow and the ability to redeploy capital at a high rate of return.
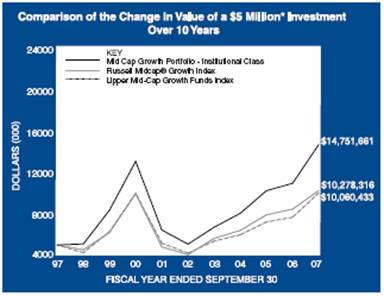

* Minimum Investment
In accordance with SEC regulations, the Portfolio’s performance shown assumes that all recurring fees (including management fees) were deducted and all dividends and distributions were reinvested. The performance of Adviser Class shares will vary from the Institutional Class shares based upon the different inception date and will be negatively impacted by additional fees assessed to this class.
30
| 2007 Annual Report |
| |
| September 30, 2007 |
Investment Overview (cont’d)
Mid Cap Growth Portfolio
Performance Compared to the Russell Midcap® Growth Index(1) and the Lipper Mid-Cap Growth Funds Index(2)
| | Total Returns(3) | |
| | | | Average Annual | |
| | One | | Five | | Ten | | Since | |
| | Year | | Years | | Years | | Inception(6) | |
| | | | | | | | | |
Portfolio — Institutional Class (4) | | 34.24 | % | 23.76 | % | 11.43 | % | 15.61 | % |
Russell Midcap® Growth Index | | 21.22 | | 20.39 | | 7.47 | | 11.73 | |
Lipper Mid-Cap Growth Funds Index | | 30.80 | | 19.02 | | 7.24 | | 11.52 | |
Portfolio — Adviser Class(5) | | 33.89 | | 23.46 | | 11.16 | | 13.01 | |
Russell Midcap® Growth Index | | 21.22 | | 20.39 | | 7.47 | | 8.89 | |
Lipper Mid-Cap Growth Funds Index | | 30.80 | | 19.02 | | 7.24 | | 8.11 | |
Performance data quoted represents past performance, which is no guarantee of future results, and current performance may be lower or higher than the figures shown. Performance assumes that all dividends and distributions, if any, were reinvested. For the most recent month-end performance figures, please visit www.morganstanley.com/im. Investment return and principal value will fluctuate so that Portfolio shares, when redeemed, may be worth more or less than their original cost. Total returns do not reflect the deduction of taxes that a shareholder would pay on Portfolio distributions or the redemption of Portfolio shares.
(1) | | The Russell Midcap® Growth Index measures the performance of those Russell Midcap® Index companies with higher price-to-book ratios and higher forecasted growth values. The stocks are also members of the Russell 1000® Growth Index. The Index is unmanaged and its returns do not include any sales charges or fees. Such costs would lower performance. It is not possible to invest directly in an index. |
(2) | | The Lipper Mid-Cap Growth Funds Index is an equally weighted performance index of the largest qualifying funds (based on net assets) in the Lipper Mid-Cap Growth Funds classification. The Index, which is adjusted for capital gains distributions and income dividends, is unmanaged and should not be considered an investment. There are currently 30 funds represented in this Index. As of the date of this report, the Portfolio is in the Lipper Mid-Cap Growth Funds classification. |
(3) | | Total returns for the Portfolio reflect expenses waived and/or reimbursed, if applicable, by the Adviser. Without such waivers and/or reimbursements, total returns would have been lower. Fee waivers and/or reimbursements are voluntary and the Adviser reserves the right to commence or terminate any waiver and/or reimbursement at any time. |
(4) | | Commenced operations on March 30, 1990. |
(5) | | Commenced operations on January 31, 1997. |
(6) | | For comparative purposes, average annual since inception returns listed for the Indexes refer to the inception date or initial offering of the respective share class of the Portfolio, not the inception of the Indexes. |
Expense Examples
As a shareholder of the Portfolio, you incur two types of costs: (1) transactional costs, including redemption fees; (2) ongoing costs, including management fees, shareholder servicing fees, and other Portfolio expenses. These examples are intended to help you understand your ongoing costs (in dollars) of investing in the Portfolio and to compare these costs with the ongoing costs of investing in other mutual funds.
The examples are based on an investment of $1,000 invested at the beginning of the six-month period ended September 30, 2007 and held for the entire six-month period.
Actual Expenses
The first line of the tables below provides information about actual account values and actual expenses. You may use the information in this line, together with the amount you invested, to estimate the expenses that you paid over the period. Simply divide your account value by $1,000 (for example, an $8,600 account value divided by $1,000 = 8.6), then multiply the result by the number in the first line under the heading entitled “Expenses Paid During Period” to estimate the expenses you paid on your account during this period.
Please note that “Expenses Paid During Period” are grossed up to reflect Portfolio expenses prior to the effect of Expense Offset (See Note E in the Notes to Financial Statements). Therefore, the annualized net expense ratios may differ from the ratio of expenses to average net assets shown in the Financial Highlights.
Hypothetical Example for Comparison Purposes
The second line of the tables below provides information about hypothetical account values and hypothetical expenses based on the Portfolio’s actual expense ratio and an assumed rate of return of 5% per year before expenses, which is not the Portfolio’s actual return. The hypothetical account values and expenses may not be used to estimate the actual ending account balance or expenses you paid for the period. You may use this information to compare the ongoing costs of investing in the Portfolio and other funds. To do so, compare this 5% hypothetical example with the 5% hypothetical examples that appear in the shareholder reports of the other funds.
Please note that the expenses shown in the table are meant to highlight your ongoing costs only and do not reflect any transactional costs, such as redemption fees. Therefore, the second line of the table is useful in comparing ongoing costs only, and will not help you determine the relative total costs of owning different funds. In addition, if these transactional costs were included, your costs would have been higher.
| | | | | | Expenses Paid | |
| | | | Ending Account | | During Period* | |
| | Beginning | | Value | | April 1, 2007— | |
| | Account Value | | September 30, | | September 30, | |
| | April 1, 2007 | | 2007 | | 2007 | |
| | | | | | | |
Institutional Class | | | | | | | |
Actual | | $ | 1,000.00 | | $ | 1,199.40 | | $ | 3.42 | |
Hypothetical (5% average annual return before expenses) | | 1,000.00 | | 1,021.96 | | 3.14 | |
| | | | | | | |
Adviser Class | | | | | | | |
Actual | | 1,000.00 | | 1,198.10 | | 4.79 | |
Hypothetical (5% average annual return before expenses) | | 1,000.00 | | 1,020.71 | | 4.41 | |
| | | | | | | | | | |
* | | Expenses are equal to Institutional Class’ and Adviser Class’ annualized net expense ratios of 0.62% and 0.87%, respectively, multiplied by the average account value over the period, multiplied by 183/365 (to reflect the one-half year period). |
31
2007 Annual Report
September 30, 2007
Investment Overview (cont’d)
Mid Cap Growth Portfolio
Graphic Presentation of Portfolio Holdings
The following graph depicts the Portfolio’s holdings by industry and/or investment type, as a percentage of total investments.

* Industries and/or investment types which do not appear in the above graph, as well as those which represent less than 5% of total investments, if applicable, are included in the category labeled “Other”.
32
| 2007 Annual Report |
| |
| September 30, 2007 |
Portfolio of Investments
Mid Cap Growth Portfolio
| | | | Value | |
| | Shares | | (000) | |
Common Stocks (92.6%) | | | | | |
Auto & Transportation (6.2%) | | | | | |
C.H. Robinson Worldwide, Inc. | | 1,540,497 | | $ | 83,633 | |
Expeditors International Washington, Inc. | | 1,424,138 | | 67,362 | |
UAL Corp. | | (a)957,704 | | 44,562 | |
| | | | 195,557 | |
Consumer Discretionary (33.3%) | | | | | |
Abercrombie & Fitch Co., Class A | | 1,089,285 | | 87,905 | |
Apollo Group, Inc., Class A | | (a)1,087,960 | | 65,441 | |
AutoZone, Inc. | | (a)332,375 | | 38,602 | |
Chipotle Mexican Grill, Inc., Class B | | (a)359,509 | | 38,468 | |
Choice Hotels International, Inc. | | 690,955 | | 26,028 | |
ChoicePoint, Inc. | | (a)1,163,849 | | 44,133 | |
Corporate Executive Board Co. | | 1,159,577 | | 86,087 | |
Ctrip.com International Ltd. ADR | | 758,188 | | 39,274 | |
Discovery Holding Co., Class A | | (a)1,739,728 | | 50,191 | |
Focus Media Holding Ltd. ADR | | (a)717,688 | | 41,640 | |
Grupo Televisa S.A. ADR | | 2,695,706 | | 65,155 | |
Iron Mountain, Inc. | | (a)1,452,987 | | 44,287 | |
Leucadia National Corp. | | 1,255,828 | | 60,556 | |
Li & Fung Ltd. | | 16,148,000 | | 68,548 | |
Monster Worldwide, Inc. | | (a)1,496,407 | | 50,968 | |
Under Armour, Inc., Class A | | (a)534,326 | | 31,963 | |
Weight Watchers International, Inc. | | 507,627 | | 29,219 | |
Wendy’s International, Inc. | | 1,084,903 | | 37,874 | |
Wynn Resorts Ltd. | | 938,483 | | 147,868 | |
| | | | 1,054,207 | |
Energy (7.5%) | | | | | |
Questar Corp. | | 838,079 | | 44,024 | |
Southwestern Energy Co. | | (a)1,595,574 | | 66,775 | |
Ultra Petroleum Corp. | | (a)2,077,270 | | 128,874 | |
| | | | 239,673 | |
Financial Services (11.2%) | | | | | |
Alleghany Corp. | | (a)99,813 | | 40,524 | |
Brookfield Asset Management, Inc., Class A | | 1,151,650 | | 44,338 | |
Brown & Brown, Inc. | | 399,793 | | 10,515 | |
Calamos Asset Management, Inc., Class A | | 1,147,705 | | 32,400 | |
Freedom Acquisition Holding, Inc. | | (a)1,347,698 | | 15,162 | |
IntercontinentalExchange, Inc. | | (a)337,475 | | 51,262 | |
Janus Capital Group, Inc. | | 2,308,861 | | 65,295 | |
Mastercard, Inc., Class A | | 322,727 | | 47,754 | |
Moody’s Corp. | | 945,683 | | 47,662 | |
| | | | 354,912 | |
Health Care (7.2%) | | | | | |
Gen-Probe, Inc. | | (a)905,871 | | 60,313 | |
Illumina, Inc. | | (a)609,076 | | 31,599 | |
Stericycle, Inc. | | (a)1,260,706 | | 72,062 | |
Techne Corp. | | (a)995,942 | | 62,824 | |
| | | | 226,798 | |
Materials & Processing (2.6%) | | | | | |
Grupo Aeroportuario del Pacifico S.A. de C.V. ADR | | 838,315 | | 45,772 | |
Texas Industries, Inc. | | 468,515 | | 36,778 | |
| | | | 82,550 | |
Producer Durables (5.3%) | | | | | |
Desarrolladora Homex S.A. de C.V. ADR | | (a)485,218 | | $ | 26,930 | |
Itron, Inc. | | (a)343,217 | | 31,943 | |
Nalco Holding Co. | | 2,857,454 | | 84,724 | |
NVR, Inc. | | (a)50,544 | | 23,768 | |
| | | | 167,365 | |
Real Estate (1.5%) | | | | | |
Forest City Enterprises, Inc., Class A | | 857,789 | | 47,316 | |
Technology (15.0%) | | | | | |
Aecom Technology Corp. | | (a)654,761 | | 22,871 | |
Autodesk, Inc. | | (a)625,538 | | 31,258 | |
Baidu.com ADR | | (a)278,096 | | 80,550 | |
Crown Castle International Corp. | | (a)1,120,560 | | 45,528 | |
Equinix, Inc. | | (a)634,308 | | 56,257 | |
Global Payments, Inc. | | 1,030,617 | | 45,574 | |
NHN Corp. | | (a)225,135 | | 52,102 | |
Salesforce.com, Inc. | | (a)890,658 | | 45,709 | |
SAVVIS, Inc. | | (a)698,346 | | 27,082 | |
Tencent Holdings Ltd. | | 10,406,000 | | 67,197 | |
| | | | 474,128 | |
Utilities (2.8%) | | | | | |
NII Holdings, Inc. | | (a)1,101,564 | | 90,494 | |
Total Common Stocks (Cost $2,304,308) | | | | 2,933,000 | |
Investment Company (3.0%) | | | | | |
Aeroplan Income Fund (Cost $66,647) | | 4,252,748 | | 95,132 | |
Short-Term Investment (5.2%) | | | | | |
Investment Company (5.2%) | | | | | |
Morgan Stanley Institutional Liquidity Money Market Portfolio — Institutional Class (Cost $166,488) | | (p)166,487,618 | | 166,488 | |
Total Investments (100.8%) (Cost $2,537,443) | | | | 3,194,620 | |
Liabilities in Excess of Other Assets (-0.8%) | | | | (27,198 | ) |
Net Assets (100%) | | | | $ | 3,167,422 | |
(a) | | Non-income producing security. |
(p) | | See Note F within the Notes to Financial Statements regarding investment in Morgan Stanley Institutional Liquidity Government Portfolio — Institutional Class, Morgan Stanley Institutional Liquidity Money Market Portfolio — Institutional Class and/or Morgan Stanley Institutional Liquidity Tax-Exempt Portfolio — Institutional Class. |
ADR | | American Depositary Receipt |
Foreign Currency Exchange Contract Information:
The Portfolio had the following foreign currency exchange contract(s) open at period end:
| | | | | | | | | | Net | |
Currency | | | | | | In | | | | Unrealized | |
to | | | | | | Exchange | | | | Appreciation | |
Deliver | | Value | | Settlement | | For | | Value | | (Depreciation) | |
(000) | | (000) | | Date | | (000) | | (000) | | (000) | |
USD | 1,225 | | $ | 1,225 | | 10/2/07 | | HKD | 9,504 | | $ | 1,223 | | $ | (2 | ) |
| | | | | | | | | | | | | | | | |
HKD — Hong Kong Dollar
USD — United States Dollar
The accompanying notes are an integral part of the financial statements.
33
2007 Annual Report
September 30, 2007
Investment Overview (unaudited)
U.S. Mid Cap Value Portfolio
The U.S. Mid Cap Value Portfolio seeks above-average total return over a market cycle of three to five years. The Portfolio invests primarily in common stocks of companies traded on a U.S. securities exchange with capitalizations generally in the range of companies included in the Russell Midcap® Value Index. The Portfolio may purchase stocks that typically do not pay dividends. Generally speaking, small and mid-capitalization stock prices experience a greater degree of market volatility than those of large-capitalization companies.
Performance
For the fiscal year ended September 30, 2007, the Portfolio’s Institutional Class had a total return based on net asset value and reinvestment of distributions per share of 26.19%, net of fees. The Portfolio’s Institutional Class ourperformed against its benchmark the Russell Midcap® Value Index (the “Index”) which returned 13.75%.
Factors Affecting Performance
• For most of the 12-month period, the environment remained supportive for mid-cap stocks, as economic growth moderated and merger and acquisition (“M&A”) activity and speculation both remained strong.
• However, the market’s sharp volatility and repricing of risk in July and August of 2007 prompted a rotation into the large-cap and growth segments of the stock market. Moreover, the liquidity crunch arising out of the subprime market collapse curtailed the M&A boom. Stocks rebounded in September following the Federal Open Market Committee’s 50 basis point cut in the federal funds rate.
• All sectors within the Index had positive performance during the period, except for the financials sector.
• Stock selection in the financial sector was the largest positive contributor to relative performance against the Index. The Portfolio’s diversified financials stocks were buoyed by their capital markets exposure. Moreover, the Portfolio had no exposure to real estate investment trusts (“REITs”) and limited exposure to banks.
• The technology sector also added to relative performance, primarily from a holding in the hardware and equipment industry that benefited from the rising demand for video content on the Internet.
• Stock selection in the consumer discretionary sector was another standout. Good performance among media holdings was driven by an acquisition announcement during the period.
• Detractors from relative performance included stock selection in the consumer staples sector primarily because of weak performance of some food and staples retailing stocks.
• An underweight allocation to the utilities sector also limited relative results. The sector performed well, but the Portfolio had very modest exposure to the sector.
Management Strategies
• In keeping with our investment discipline, we continue to seek undervalued companies that are experiencing a positive change or catalyst that should have a positive impact on the stock valuation. Such catalysts could be new company management, growth or consolidation within an industry or sector, or new products.
• We maintained the Portfolio’s underweight in the financials sector, with no exposure to REITs and limited exposure to banks and mortgage-related companies, and underweight in the utilities sector.
• The Portfolio held a notable overweight in the health care sector, particularly in the health care equipment and services sector. The industrials and consumer discretionary sectors remain underweight relative to the Index.

34
| 2007 Annual Report |
| |
| September 30, 2007 |
Investment Overview (cont’d)
U.S. Mid Cap Value Portfolio


* Minimum Investment
** Commenced operations on July 17, 1998.
In accordance with SEC regulations, the Portfolio’s performance shown assumes that all recurring fees (including management fees) were deducted and all dividends and distributions were reinvested. The performance of Investment Class and Adviser Class shares will vary from the Institutional Class shares based upon their different inception dates and will be negatively impacted by additional fees assessed to those classes.
Performance Compared to the Russell Midcap® Value Index(1) and the Lipper Mid-Cap Core Funds Index(2)
| | Total Returns(3) | |
| | | | Average Annual | |
| | One | | Five | | Ten | | Since | |
| | Year | | Years | | Years | | Inception(7) | |
| | | | | | | | | |
Portfolio — Institutional Class(4) | | 26.19 | % | 22.49 | % | 10.47 | % | 16.73 | % |
Russell Midcap® Value Index | | 13.75 | | 21.02 | | 11.31 | | 15.26 | |
Lipper Mid-Cap Core Funds Index | | 18.00 | | 18.11 | | 9.21 | | 12.51 | |
Portfolio — Investment Class (5) | | 26.01 | | 22.31 | | 10.31 | | 14.15 | |
Russell Midcap® Value Index | | 13.75 | | 21.02 | | 11.31 | | 13.57 | |
Lipper Mid-Cap Core Funds Index | | 18.00 | | 18.11 | | 9.21 | | 10.70 | |
Portfolio — Adviser Class(6) | | 25.87 | | 22.19 | | — | | 9.79 | |
Russell Midcap® Value Index | | 13.75 | | 21.02 | | — | | 10.91 | |
Lipper Mid-Cap Core Funds Index | | 18.00 | | 18.11 | | — | | 9.12 | |
Performance data quoted represents past performance, which is no guarantee of future results, and current performance may be lower or higher than the figures shown. Performance assumes that all dividends and distributions, if any, were reinvested. For the most recent month-end performance figures, please visit www.morganstanley.com/im. Investment return and principal value will fluctuate so that Portfolio shares, when redeemed, may be worth more or less than their original cost. Total returns do not reflect the deduction of taxes that a shareholder would pay on Portfolio distributions or the redemption of Portfolio shares.
(1) | | The Russell Midcap® Value Index measures the performance of those Russell Midcap® Index companies with lower price-to-book ratios and lower forecasted growth values. The stocks are also members of the Russell 1000® Value Index. The Index is unmanaged and its returns do not include any sales charges or fees. Such costs would lower performance. It is not possible to invest directly in an index. |
(2) | | The Lipper Mid-Cap Core Funds Index is an equally weighted performance index of the largest qualifying funds (based on net assets) in the Lipper Mid-Cap Core Funds classification. The Index, which is adjusted for capital gains distributions and income dividends, is unmanaged and should be considered an investment. There are currently 30 funds represented in this Index. As of the date of this report, the Portfolio is in the Lipper Mid-Cap Core Funds classification. |
(3) | | Total returns for the Portfolio reflect expenses waived and/or reimbursed, if applicable, by the Adviser. Without such waivers and/or reimbursements, total returns would have been lower. Fee waivers and/or reimbursements are voluntary and the Adviser reserves the right to commence or terminate any waiver and/or reimbursement at any time. |
(4) | | Commenced operations on December 30, 1994. |
(5) | | Commenced operations on May 10, 1996. |
(6) | | Commenced operations on July 17, 1998. |
(7) | | For comparative purposes, average annual since inception returns listed for the Indexes refer to the inception date or initial offering of the respective share class of the Portfolio, not the inception of the Indexes. |
35
2007 Annual Report
September 30, 2007
Investment Overview (cont’d)
U.S. Mid Cap Value Portfolio
Expense Examples
As a shareholder of the Portfolio, you incur two types of costs: (1) transactional costs, including redemption fees; (2) ongoing costs, including management fees, shareholder servicing fees (in the case of Investment Class and Adviser Class); and other Portfolio expenses. These examples are intended to help you understand your ongoing costs (in dollars) of investing in the Portfolio and to compare these costs with the ongoing costs of investing in other mutual funds.
The examples are based on an investment of $1,000 invested at the beginning of the six-month period ended September 30, 2007 and held for the entire six-month period.
Actual Expenses
The first line of the tables below provides information about actual account values and actual expenses. You may use the information in this line, together with the amount you invested, to estimate the expenses that you paid over the period. Simply divide your account value by $1,000 (for example, an $8,600 account value divided by $1,000 = 8.6), then multiply the result by the number in the first line under the heading entitled “Expenses Paid During Period” to estimate the expenses you paid on your account during this period.
Please note that “Expenses Paid During Period” are grossed up to reflect Portfolio expenses prior to the effect of Expense Offset (See Note E in the Notes to Financial Statements). Therefore, the annualized net expense ratios may differ from the ratio of expenses to average net assets shown in the Financial Highlights.
Hypothetical Example for Comparison Purposes
The second line of the tables below provides information about hypothetical account values and hypothetical expenses based on the Portfolio’s actual expense ratio and an assumed rate of return of 5% per year before expenses, which is not the Portfolio’s actual return. The hypothetical account values and expenses may not be used to estimate the actual ending account balance or expenses you paid for the period. You may use this information to compare the ongoing costs of investing in the Portfolio and other funds. To do so, compare this 5% hypothetical example with the 5% hypothetical examples that appear in the shareholder reports of the other funds.
Please note that the expenses shown in the table are meant to highlight your ongoing costs only and do not reflect any transactional costs, such as redemption fees. Therefore, the second line of the table is useful in comparing ongoing costs only, and will not help you determine the relative total costs of owning different funds. In addition, if these transactional costs were included, your costs would have been higher.
| | | | | | Expenses Paid | |
| | | | Ending Account | | During Period* | |
| | Beginning | | Value | | April 1, 2007 — | |
| | Account Value | | September 30, | | September 30, | |
| | April 1, 2007 | | 2007 | | 2007 | |
Institutional Class | | | | | | | |
Actual | | $ | 1,000.00 | | $ | 1,098.20 | | $ | 4.58 | |
Hypothetical (5% average annual return before expenses) | | 1,000.00 | | 1,020.71 | | 4.41 | |
| | | | | | | |
Investment Class | | | | | | | |
Actual | | 1,000.00 | | 1,097.40 | | 5.36 | |
Hypothetical (5% average annual return before expenses) | | 1,000.00 | | 1,019.95 | | 5.16 | |
| | | | | | | |
Adviser Class | | | | | | | |
Actual | | 1,000.00 | | 1,096.80 | | 5.89 | |
Hypothetical (5% average annual return before expenses) | | 1,000.00 | | 1,019.45 | | 5.67 | |
| | | | | | | | | | |
* Expenses are equal to Institutional Class’, Investment Class’ and Adviser Class’ annualized net expense ratios of 0.87%, 1.02% and 1.12%, respectively, multiplied by the average account value over the period, multiplied by 183/365 (to reflect the one-half year period).
Graphic Presentation of Portfolio Holdings
The following graph depicts the Portfolio’s holdings by industry and/or investment type, as a percentage of total investments.
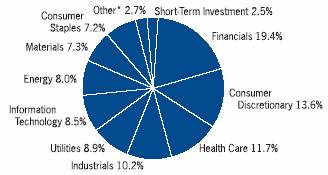
* Industries and/or investment types which do not appear in the above graph, as well as those which represent less than 5% of total investments, if applicable, are included in the category labeled “Other”.
36
| 2007 Annual Report |
| |
| September 30, 2007 |
Portfolio of Investments
U.S. Mid Cap Value Portfolio
| | | | | |
| | | | Value | |
| | Shares | | (000) | |
Common Stocks (96.1%) | | | | | |
Consumer Discretionary (13.6%) | | | | | |
Apollo Group, Inc., Class A | | (a)81,260 | | $ | 4,888 | |
Fortune Brands, Inc. | | 41,486 | | 3,381 | |
Live Nation, Inc. | | (a)236,573 | | 5,027 | |
Newell Rubbermaid, Inc. | | 138,010 | | 3,977 | |
Office Depot, Inc. | | (a)181,230 | | 3,737 | |
Orbitz Worldwide, Inc. | | (a)225,155 | | 2,542 | |
| | | | 23,552 | |
Consumer Staples (7.3%) | | | | | |
ConAgra Foods, Inc. | | 178,950 | | 4,676 | |
Estee Lauder Cos., Inc. (The) | | 100,430 | | 4,264 | |
Rite Aid Corp. | | (a)785,990 | | 3,631 | |
| | | | 12,571 | |
Energy (8.0%) | | | | | |
Cameron International Corp. | | (a)27,370 | | 2,526 | |
El Paso Corp. | | 221,130 | | 3,753 | |
Hess Corp. | | 55,020 | | 3,660 | |
Newfield Exploration Co. | | (a)81,480 | | 3,924 | |
| | | | 13,863 | |
Financials (19.5%) | | | | | |
ACE Ltd. | | 72,380 | | 4,384 | |
Allied World Assurance Holdings Ltd. | | 101,942 | | 5,292 | |
Aspen Insurance Holdings Ltd. | | 141,380 | | 3,946 | |
Bear Stearns Cos., Inc. (The) | | 26,301 | | 3,230 | |
Hudson City Bancorp, Inc. | | 319,630 | | 4,916 | |
Invesco plc ADR | | 142,807 | | 3,898 | |
Marsh & McLennan Cos., Inc. | | 170,668 | | 4,352 | |
Northern Trust Corp. | | 56,360 | | 3,735 | |
| | | | 33,753 | |
Health Care (11.8%) | | | | | |
Affymetrix, Inc. | | (a)150,260 | | 3,812 | |
Beckman Coulter, Inc. | | 70,980 | | 5,235 | |
Healthsouth Corp. | | (a)202,568 | | 3,547 | |
Omnicare, Inc. | | 113,870 | | 3,773 | |
Owens & Minor, Inc. | | 105,220 | | 4,008 | |
| | | | 20,375 | |
Industrials (10.2%) | | | | | |
Goodrich Corp. | | 90,430 | | 6,170 | |
Pentair, Inc. | | 114,920 | | 3,813 | |
Pitney Bowes, Inc. | | 89,410 | | 4,061 | |
Tata Motors Ltd. ADR | | 188,216 | | 3,602 | |
| | | | 17,646 | |
Information Technology (8.5%) | | | | | |
Diebold, Inc. | | 125,200 | | 5,687 | |
Flextronics International Ltd. | | (a)331,587 | | 3,707 | |
Juniper Networks, Inc. | | (a)71,390 | | 2,614 | |
Perot Systems Corp. | | (a)160,756 | | 2,718 | |
| | | | 14,726 | |
Materials (7.3%) | | | | | |
Domtar Corp. | | (a)437,500 | | 3,588 | |
International Flavors & Fragrances, Inc. | | 92,630 | | 4,896 | |
Valspar Corp. | | 153,410 | | $ | 4,174 | |
| | | | 12,658 | |
Telecommunication Services (0.9%) | | | | | |
Embarq Corp. | | 28,823 | | 1,603 | |
Utilities (9.0%) | | | | | |
American Electric Power Co., Inc. | | 88,490 | | 4,078 | |
Constellation Energy Group, Inc. | | 41,685 | | 3,576 | |
DPL, Inc. | | 83,140 | | 2,183 | |
Entergy Corp. | | 16,100 | | 1,744 | |
Wisconsin Energy Corp. | | 86,440 | | 3,892 | |
| | | | 15,473 | |
Total Common Stocks (Cost $150,876) | | | | 166,220 | |
Investment Company (1.8%) | | | | | |
Market Vectors Gold Miners ETF (Cost $3,057) | | 69,900 | | 3,170 | |
Short-Term Investment (2.6%) | | | | | |
Investment Company (2.6%) | | | | | |
Morgan Stanley Institutional Liquidity Money Market Portfolio — Institutional Class (Cost $4,405) | | (p)4,404,904 | | 4,405 | |
Total Investments (100.5%) (Cost $158,338) | | | | 173,795 | |
Liabilities in Excess of Other Assets (-0.5%) | | | | (875 | ) |
Net Assets (100%) | | | | $ | 172,920 | |
(a) | | Non-income producing security. |
(p) | | See Note F within the Notes to Financial Statements regarding investment in Morgan Stanley Institutional Liquidity Government Portfolio — Institutional Class, Morgan Stanley Institutional Liquidity Money Market Portfolio — Institutional Class and/or Morgan Stanley Institutional Liquidity Tax-Exempt Portfolio — Institutional Class. |
ADR | | American Depositary Receipt |
The accompanying notes are an integral part of the financial statements.
37
2007 Annual Report
September 30, 2007
Investment Overview (unaudited)
U.S. Small Cap Value Portfolio
The U.S. Small Cap Value Portfolio seeks above-average total return over a market cycle of three to five years. The Portfolio invests primarily in common stocks of small capitalization companies traded on a U.S. securities exchange. The Portfolio may purchase stocks that typically do not pay dividends. Generally speaking, small and mid-capitalization stock prices experience a greater degree of market volatility than those of large-capitalization companies.
Performance
For the fiscal year ended September 30, 2007, the Portfolio’s Institutional Class had a total return based on net asset value and reinvestment of distributions per share of 19.74%, net of fees. The Portfolio’s Institutional Class outperformed its benchmark, the Russell 2000® Value Index (the “Index”), which returned 6.09%.
Factors Affecting Performance
• Most major equity indexes produced double-digit gains during the 12-month period. Strong merger and acquisition activity, a modestly growing U.S. economy, the end of the Federal Open Market Committee’s (the “Fed”) rate increases, and contained inflation helped sustain investor confidence for most of the period.
• However, as the subprime mortgage market collapsed and began to spill over into the credit markets, investors began to reassess risk, fueling a flight to quality in the bond markets. Moreover, market volatility further extended a slide in the U.S. dollar relative to other major currencies. Investor sentiment improved following the Federal Reserve Board’s lowering of the discount rate on August 17, and equity prices strengthened further when the Fed surprised the markets with a 50 basis point cut to the target federal funds rate on September 18.
• As investors began to pay closer attention to the mounting risks to economic growth going forward, small-cap stocks began to lag behind large- and mid-caps, reversing their sustained period of outperformance. Value stocks also began to trail their growth counterparts by a noticeable margin. Within the Index, the materials and processing, consumer staples, and energy sectors were the best performing sectors during the period. The financial services, consumer discretionary, and utilities sectors were the Index’s weakest performing groups.
• Consistent with our bottom-up investment philosophy, outperformance relative to the Index was driven largely by individual stock picks. The Portfolio was bolstered by stock selection in the consumer discretionary sector, largely due to holdings in the commercial and business services industry. During the reporting period, the Portfolio also benefited from an avoidance of the sector’s weaker areas (primarily those dependent directly on the consumer).
• Stock selection within the producer durables sector added further to relative performance, as a variety of holdings performed well. In addition, the Portfolio had no exposure to homebuilding stocks, one of the Index’s worst performing areas.
• A number of holdings across the health care sector contributed to relative gains, as did favorable positioning within the financials sector. The Portfolio was underweighted in lagging industry groups such as banks, savings and loans, and real estate investment trusts (“REITs”), and holdings in two financial processing stocks performed well during the period.
• However, the Portfolio’s stock selection in the auto and transportation sector disappointed. Two transportation holdings lagged, detracting from relative performance. Stock selection within the utilities sector also was detrimental due to the weak performance of some electric companies.
• An underweight in the consumer staples sector also cost the Portfolio relative performance, as the sector performed well during the period.
Management Strategies
• Notable portfolio shifts during the period included a slight reduction in the autos and transportation sector weighting and a slight increase in the health care and producer durables sector weightings.
• The Portfolio continued to maintain its significant underweight in the financial services sector, especially in banks and REITs (although insurance and reinsurance remained slightly overweight). The Portfolio’s smaller underweights were in the utilities and consumer staples sectors.
• Conversely, the Portfolio carried an overweight in the producer durables sector, with particular emphasis on office supplies, telecommunications equipment, and aerospace. Other overweight allocations included the consumer discretionary sector, mainly within business services and commercial printing, and the health care sector.
38
| 2007 Annual Report |
| |
| September 30, 2007 |
Investment Overview (cont’d)
U.S. Small Cap Value Portfolio
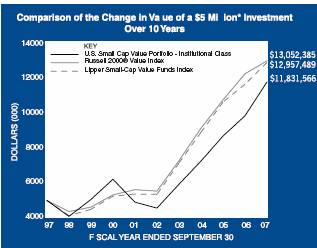
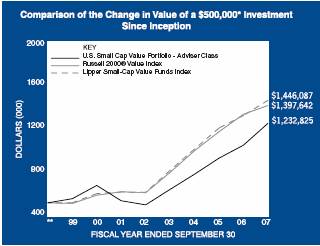
* Minimum Investment
** Commenced operations on January 22, 1999.
In accordance with SEC regulations, the Portfolio’s performance shown assumes that all recurring fees (including management fees) were deducted and all dividends and distributions were reinvested. The performance of Adviser Class shares will vary from the Institutional Class shares based upon the different inception date and will be negatively impacted by additional fees assessed to this class.
Performance Compared to the Russell 2000® Value Index(1) and Lipper Small-Cap Value Funds Index(2)
| | Total Returns(3) | |
| | | | Average Annual | |
| | One | | Five | | Ten | | Since | |
| | Year | | Years | | Years | | Inception(6) | |
| | | | | | | | | |
Portfolio — Institutional Class(4) | | 19.74 | % | 21.01 | % | 9.00 | % | 12.36 | % |
Russell 2000® Value Index | | 6.09 | | 18.70 | | 10.07 | | 12.03 | |
Lipper Small-Cap Value Funds Index | | 10.71 | | 19.35 | | 9.99 | | — | |
Portfolio — Adviser Class(5) | | 19.45 | | 20.71 | | — | | 10.95 | |
Russell 2000® Value Index | | 6.09 | | 18.70 | | — | | 12.56 | |
Lipper Small-Cap Value Funds Index | | 10.71 | | 19.35 | | — | | 13.00 | |
Performance data quoted represents past performance, which is no guarantee of future results, and current performance may be lower or higher than the figures shown. Performance assumes that all dividends and distributions, if any, were reinvested. For the most recent month-end performance figures, please visit www.morganstanley.com/im. Investment return and principal value will fluctuate so that Portfolio shares, when redeemed, may be worth more or less than their original cost. Total returns do not reflect the deduction of taxes that a shareholder would pay on Portfolio distributions or the redemption of Portfolio shares.
(1) | | The Russell 2000® Value Index measures the performance of those Russell 2000® Index companies with lower price-to-book ratios and lower forecasted growth values. The Index is unmanaged and its returns do not include any sales charges or fees. Such costs would lower performance. It is not possible to invest directly in an index. |
(2) | | The Lipper Small-Cap Value Funds Index is an equally weighted performance index of the largest qualifying funds (based on net assets) in the Lipper Small-Cap Value Funds classification. The Index, which is adjusted for capital gains distributions and income dividends, is unmanaged and should not be considered an investment. There are currently 30 funds represented in this Index. As of the date of this report, the Portfolio is in the Lipper Small-Cap Value Funds classification. |
(3) | | Total returns for the Portfolio reflect expenses waived and/or reimbursed, if applicable, by the Adviser. Without such waivers and/or reimbursements, total returns would have been lower. Fee waivers and/or reimbursements are voluntary and the Adviser reserves the right to commence or terminate any waiver and/or reimbursement at any time. |
(4) | | Commenced operations on July 1, 1986. |
(5) | | Commenced operations on January 22, 1999. |
(6) | | For comparative purposes, average annual since inception returns listed for the Indexes refer to the inception date or initial offering of the respective share class of the Portfolio, not the inception of the Indexes. |
Expense Examples
As a shareholder of the Portfolio, you incur two types of costs: (1) transactional costs, including redemption fees; (2) ongoing costs, including management fees, shareholder servicing fees (in the case of Adviser Class); and other Portfolio expenses. These examples are intended to help you understand your ongoing costs (in dollars) of investing in the Portfolio and to compare these costs with the ongoing costs of investing in other mutual funds.
39
2007 Annual Report
September 30, 2007
Investment Overview (cont’d)
U.S. Small Cap Value Portfolio
The examples are based on an investment of $1,000 invested at the beginning of the six-month period ended September 30, 2007 and held for the entire six-month period.
Actual Expenses
The first line of the tables below provides information about actual account values and actual expenses. You may use the information in this line, together with the amount you invested, to estimate the expenses that you paid over the period. Simply divide your account value by $1,000 (for example, an $8,600 account value divided by $1,000 = 8.6), then multiply the result by the number in the first line under the heading entitled “Expenses Paid During Period” to estimate the expenses you paid on your account during this period.
Please note that “Expenses Paid During Period” are grossed up to reflect Portfolio expenses prior to the effect of Expense Offset (See Note E in the Notes to Financial Statements). Therefore, the annualized net expense ratios may differ from the ratio of expenses to average net assets shown in the Financial Highlights.
Hypothetical Example for Comparison Purposes
The second line of the tables below provides information about hypothetical account values and hypothetical expenses based on the Portfolio’s actual expense ratio and an assumed rate of return of 5% per year before expenses, which is not the Portfolio’s actual return. The hypothetical account values and expenses may not be used to estimate the actual ending account balance or expenses you paid for the period. You may use this information to compare the ongoing costs of investing in the Portfolio and other funds. To do so, compare this 5% hypothetical example with the 5% hypothetical examples that appear in the shareholder reports of the other funds.
Please note that the expenses shown in the table are meant to highlight your ongoing costs only and do not reflect any transactional costs, such as redemption fees. Therefore, the second line of the table is useful in comparing ongoing costs only, and will not help you determine the relative total costs of owning different funds. In addition, if these transactional costs were included, your costs would have been higher.
| | | | | | Expenses Paid | |
| | Beginning | | Ending Account | | During Period* | |
| | Account | | Value | | April 1, 2007 — | |
| | Value | | September 30, | | September 30, | |
| | April 1, 2007 | | 2007 | | 2007 | |
Institutional Class | | | | | | | |
Actual | | $ | 1,000.00 | | $ | 1,029.20 | | $ | 4.12 | |
Hypothetical (5% average annual return before expenses) | | 1,000.00 | | 1,021.01 | | 4.10 | |
| | | | | | | |
Adviser Class | | | | | | | |
Actual | | 1,000.00 | | 1,027.90 | | 5.39 | |
Hypothetical (5% average annual return before expenses) | | 1,000.00 | | 1,019.75 | | 5.37 | |
| | | | | | | | | | |
* Expenses are equal to Institutional Class’ and Adviser Class’ annualized net expense ratios of 0.81% and 1.06%, respectively, multiplied by the average account value over the period, multiplied by 183/365 (to reflect the one-half year period).
Graphic Presentation of Portfolio Holdings
The following graph depicts the Portfolio’s holdings by industry and/or investment type, as a percentage of total investments.
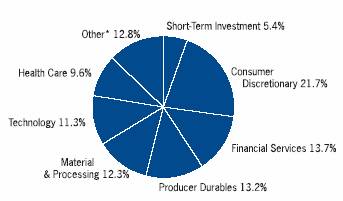
* Industries and/or investment types which do not appear in the above graph, as well as those which represent less than 5% of total investments, if applicable, are included in the category labeled “Other”.
40
| 2007 Annual Report |
| |
| September 30, 2007 |
Portfolio of Investments
U.S. Small Cap Value Portfolio
| | | | | |
| | | | Value | |
| | Shares | | (000) | |
Common Stocks (94.5%) | | | | | |
Autos & Transportation (2.9%) | | | | | |
AAR Corp. | | (a)353,660 | | $ | 10,730 | |
Forward Air Corp. | | 188,200 | | 5,605 | |
Pacer International, Inc. | | 468,400 | | 8,923 | |
| | | | 25,258 | |
Consumer Discretionary (21.7%) | | | | | |
AFC Enterprises, Inc. | | (a)693,300 | | 10,434 | |
Brink’s Co. (The) | | 248,300 | | 13,875 | |
Central Garden & Pet Co. | | (a)329,664 | | 2,934 | |
Cenveo, Inc. | | (a)810,600 | | 17,533 | |
Consolidated Graphics, Inc. | | (a)295,900 | | 18,580 | |
Denny’s Corp. | | (a)2,494,380 | | 9,977 | |
Dolan Media Co. | | (a)295,100 | | 7,171 | |
Dollar Thrifty Automotive Group, Inc. | | (a)189,400 | | 6,570 | |
Geo Group, Inc. (The) | | (a)251,952 | | 7,460 | |
IKON Office Solutions, Inc. | | 1,078,263 | | 13,856 | |
Landry’s Restaurants, Inc. | | 104,400 | | 2,762 | |
Lin TV Corp., Class A | | (a)233,300 | | 3,035 | |
Maidenform Brands, Inc. | | (a)528,119 | | 8,387 | |
MAXIMUS, Inc. | | 734,570 | | 32,013 | |
Sinclair Broadcast Group, Inc., Class A | | 716,300 | | 8,624 | |
Stage Stores, Inc. | | 495,400 | | 9,031 | |
Tween Brands, Inc. | | (a)346,700 | | 11,386 | |
Viad Corp. | | 131,632 | | 4,739 | |
| | | | 188,367 | |
Energy — Other (4.2%) | | | | | |
Denbury Resources, Inc. | | (a)210,100 | | 9,389 | |
Exterran Holdings, Inc. | | (a)110,255 | | 8,858 | |
St. Mary Land & Exploration Co. | | 261,760 | | 9,337 | |
Superior Energy Services, Inc. | | (a)249,830 | | 8,854 | |
| | | | 36,438 | |
Financial Services (13.6%) | | | | | |
Amtrust Financial Services, Inc. | | 366,000 | | 5,552 | |
Anthracite Capital, Inc. REIT | | 869,900 | | 7,916 | |
Conseco, Inc. | | (a)927,200 | | 14,835 | |
Employers Holdings, Inc. | | 442,600 | | 9,122 | |
Greater Bay Bancorp. | | 83,600 | | 2,307 | |
Integra Bank Corp. | | 210,100 | | 3,809 | |
LaSalle Hotel Properties REIT | | 147,800 | | 6,220 | |
Max Capital Group Ltd. | | 483,440 | | 13,556 | |
MB Financial, Inc. | | 210,300 | | 7,266 | |
National Financial Partners Corp. | | 149,600 | | 7,926 | |
NYMAGIC, Inc. | | 142,360 | | 3,959 | |
Platinum Underwriters Holdings Ltd. | | 301,000 | | 10,824 | |
ProAssurance Corp. | | (a)204,951 | | 11,041 | |
Provident New York Bancorp., Inc. | | 490,100 | | 6,425 | |
United America Indemnity Ltd., Class A | | (a)370,909 | | 7,978 | |
| | | | 118,736 | |
Health Care (9.6%) | | | | | |
Apria Healthcare Group, Inc. | | (a)476,830 | | 12,402 | |
Bio-Rad Laboratories, Inc., Class A | | (a)156,700 | | 14,181 | |
Perrigo Co. | | 491,183 | | 10,487 | |
PharMerica Corp. | | (a)334,000 | | 4,983 | |
PRA International | | (a)605,411 | | 17,799 | |
Sciele Pharma, Inc. | | (a)580,741 | | $ | 15,111 | |
Valeant Pharmaceuticals International | | (a)525,800 | | 8,140 | |
| | | | 83,103 | |
Materials & Processing (12.3%) | | | | | |
Acuity Brands, Inc. | | 262,560 | | 13,254 | |
Aecom Technology Corp. | | (a)243,800 | | 8,516 | |
Albany International Corp., Class A | | 280,400 | | 10,512 | |
CIRCOR International, Inc. | | 259,872 | | 11,801 | |
Corn Products International, Inc. | | 294,100 | | 13,490 | |
Cytec Industries, Inc. | | 187,500 | | 12,823 | |
Hercules, Inc. | | 665,135 | | 13,981 | |
Rock-Tenn Co., Class A | | 494,800 | | 14,300 | |
Silgan Holdings, Inc. | | 155,800 | | 8,374 | |
| | | | 107,051 | |
Producer Durables (13.2%) | | | | | |
A.O. Smith Corp. | | 171,700 | | 7,534 | |
ACCO Brands Corp. | | (a)1,345,920 | | 30,203 | |
Actuant Corp., Class A | | 151,100 | | 9,817 | |
Belden, Inc. | | 563,998 | | 26,457 | |
Cognex Corp. | | 391,800 | | 6,958 | |
General Cable Corp. | | (a)117,500 | | 7,886 | |
Moog, Inc., Class A | | (a)242,700 | | 10,664 | |
MTC Technologies, Inc. | | (a)386,027 | | 7,454 | |
TAL International Group, Inc. | | 316,602 | | 7,937 | |
| | | | 114,910 | |
Technology (11.3%) | | | | | |
DRS Technologies, Inc. | | 450,100 | | 24,810 | |
Cirrus Logic, Inc. | | (a)394,047 | | 2,522 | |
Electronics for Imaging | | (a)740,500 | | 19,890 | |
Gartner, Inc. | | (a)416,900 | | 10,197 | |
Microsemi Corp. | | (a)316,100 | | 8,813 | |
MSC.Software Corp. | | (a)964,820 | | 13,141 | |
Syniverse Holdings, Inc. | | (a)579,900 | | 9,221 | |
Tekelec | | (a)820,500 | | 9,928 | |
| | | | 98,522 | |
Utilities (2.2%) | | | | | |
Avista Corp. | | 385,421 | | 7,843 | |
PNM Resources, Inc. | | 247,550 | | 5,763 | |
UGI Corp. | | 231,100 | | 6,004 | |
| | | | 19,610 | |
Other (3.5%) | | | | | |
AerCap Holdings N.V. | | (a)361,900 | | 9,008 | |
Cellcom Israel Ltd. | | 266,400 | | 6,479 | |
Dayton Superior Corp. | | (a)492,600 | | 4,084 | |
Stantec, Inc. | | (a)318,806 | | 10,527 | |
| | | | 30,098 | |
Total Common Stocks (Cost $679,789) | | | | 822,093 | |
Short-Term Investment (5.5%) | | | | | |
Investment Company (5.5%) | | | | | |
Morgan Stanley Institutional Liquidity Money Market Portfolio — Institutional Class (Cost $47,310) | | (p)47,309,590 | | 47,310 | |
The accompanying notes are an integral part of the financial statements.
41
2007 Annual Report
September 30, 2007
Portfolio of Investments (cont’d)
U.S. Small Cap Value Portfolio
| | Value | |
| | (000) | |
Total Investments (100.0%) (Cost $727,099) | | $ | 869,403 | |
Other Assets in Excess of Liabilities (0.0%) | | 310 | |
Net Assets (100.0%) | | $ | 869,713 | |
(a) | | Non-income producing security. |
(p) | | See Note F within the Notes to Financial Statements regarding investment in Morgan Stanley Institutional Liquidity Government Portfolio — Institutional Class, Morgan Stanley Institutional Liquidity Money Market Portfolio — Institutional Class and/or Morgan Stanley Institutional Liquidity Tax-Exempt Portfolio — Institutional Class. |
REIT | | Real Estate Investment Trust |
The accompanying notes are an integral part of the financial statements.
42
| 2007 Annual Report |
| |
| September 30, 2007 |
Investment Overview (unaudited)
Value Portfolio
The Value Portfolio seeks above-average total return over a market cycle of three to five years. The Portfolio invests primarily in common stocks of companies with capitalizations generally greater than $1 billion. The Portfolio emphasizes a value style of investing, seeking well established companies that appear undervalued and currently are not being recognized within the market place. The Portfolio may purchase stocks that do not pay dividends. The Portfolio may invest, to a limited extent, in foreign equity securities, and may also invest in securities of foreign companies that are listed in the United States on a national exchange.
Performance
For the fiscal year ended September 30, 2007, the Portfolio’s Institutional Class had a total return based on net asset value and reinvestment of distributions per share of 10.95%, net of fees. The Portfolio’s Institutional Class underperformed against its benchmarks, the Russell 1000® Value Index and the S&P 500® Index, which returned 14.45% and 16.44%, respectively.
Factors Affecting Performance
• The turbulence in July and August of 2007 initiated a rotation away from the themes that had been driving the markets for the past several years. Growing recession fears and the long overdue repricing of risk led investors to flee cyclicals for more defensive areas of the market. The Portfolio was well positioned during the summer’s more volatile environment given our steadfast attention to valuation risk.
• For the period overall, the Portfolio’s lack of exposure to the energy sector was the most significant detractor from relative performance, as energy was the Russell 1000® Value Index’s best performing sector over the period. Minimal exposure to the strong performing industrials sector also cost the Portfolio relative returns during the period.
• Stock selection and an overweight allocation to pharmaceuticals were detrimental to relative returns, as the industry group declined amid rising political risks and pipeline concerns.
• The Portfolio’s relative overweight in the financial sector overwhelmed the positive influence of stock selection in the sector.
• However, an overweight in the materials sector contributed positively to relative performance as several well received merger and acquisition announcements bolstered gains there.
• The Portfolio’s consumer staples holdings benefited from investors’ renewed interest in large-cap, higher quality stocks.
• Stock selection and a modest overweight in the telecommunication services sector also added value on a relative basis. The industry continued to show improved fundamentals following its consolidation phase.
Management Strategies
• We continue to position the Portfolio on a bottom-up basis in stocks that we believe have reasonable valuations relative to our assessment of fair value.
• We believe investors have continued to overlook the considerable downside risks (particularly in the cyclical sectors) in a decelerating economic environment. As such, the Portfolio has remained in a “defensive” posture for some time, including notable weights in health care, consumer discretionary and consumer staples stocks. In contrast, the valuation risk presented by cyclical stocks has resulted in the Portfolio’s very modest exposure to the industrials sector and its zero weighting in energy stocks.
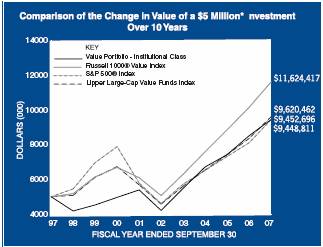
43
2007 Annual Report
September 30, 2007
Investment Overview (cont’d)
Value Portfolio
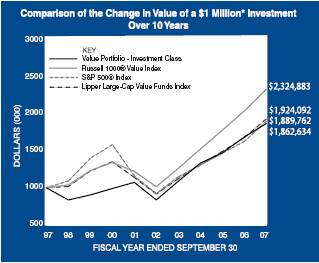
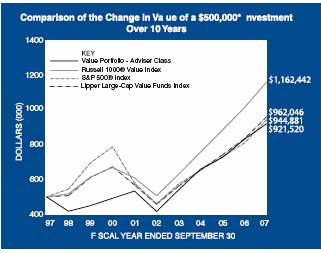
* Minimum Investment
In accordance with SEC regulations, the Portfolio’s performance shown assumes that all recurring fees (including management fees) were deducted and all dividends and distributions were reinvested. The performance of Investment Class and Adviser Class shares will vary from the Institutional Class shares based upon their different inception dates and will be negatively impacted by additional fees assessed to those classes.
Performance Compared to the Russell 1000® Value Index(1) , S&P 500® Index(2), and Lipper Large-Cap Value Funds
Index (3)
| | Total Returns(4) | |
| | | | Average Annual | |
| | One | | Five | | Ten | | Since | |
| | Year | | Years | | Years | | Inception (8) | |
| | | | | | | | | |
Portfolio — Institutional Class (5) | | 10.95 | % | 17.55 | % | 6.58 | % | 13.18 | % |
Russell 1000® Value Index | | 14.45 | | 18.07 | | 8.80 | | 13.75 | |
S&P 500® Index | | 16.44 | | 15.45 | | 6.57 | | 12.83 | |
Lipper Large-Cap Value Funds Index | | 15.02 | | 16.04 | | 6.76 | | 12.31 | |
Portfolio — Investment Class (6) | | 10.83 | | 17.39 | | 6.42 | | 9.28 | |
Russell 1000® Value Index | | 14.45 | | 18.07 | | 8.80 | | 11.68 | |
S&P 500® Index | | 16.44 | | 15.45 | | 6.57 | | 9.70 | |
Lipper Large-Cap Value Funds Index | | 15.02 | | 16.04 | | 6.76 | | 9.51 | |
Portfolio — Adviser Class (7) | | 10.69 | | 17.25 | | 6.30 | | 9.87 | |
Russell 1000® Value Index | | 14.45 | | 18.07 | | 8.80 | | 12.02 | |
S&P 500® Index | | 16.44 | | 15.45 | | 6.57 | | 9.94 | |
Lipper Large-Cap Value Funds Index | | 15.02 | | 16.04 | | 6.76 | | 9.81 | |
Performance data quoted represents past performance, which is no guarantee of future results, and current performance may be lower or higher than the figures shown. Performance assumes that all dividends and distributions, if any, were reinvested. For the most recent month-end performance figures, please visit www.morganstanley.com/im. Investment return and principal value will fluctuate so that Portfolio shares, when redeemed, may be worth more or less than their original cost. Total returns do not reflect the deduction of taxes that a shareholder would pay on Portfolio distributions or the redemption of Portfolio shares.
(1) | | The Russell 1000® Value Index measures the performance of those companies in the Russell 1000® Index with lower price-to-book ratios and lower forecasted growth values. The Index is unmanaged and its returns do not include any sales charges or fees. Such costs would lower performance. It is not possible to invest directly in an index. |
(2) | | The S&P 500® Index is a capitalization-weighted index of 500 stocks. The index is designed to measure performance of the broad domestic economy through changes in aggregate market value of 500 stocks representing all major industries. The Index is unmanaged and its returns do not include any sales charges or fees. Such costs would lower performance. It is not possible to invest directly in an index. |
(3) | | The Lipper Large-Cap Value Funds Index is an equally weighted performance index of the largest qualifying funds (based on net assets) in the Lipper Large-Cap Value Funds classification. The Index, which is adjusted for capital gains distributions and income dividends, is unmanaged and should not be considered an investment. There are currently 30 funds represented in this Index. As of the date of this report, the Portfolio is in the Lipper Large-Cap Value Funds classification. |
(4) | | Total returns for the Portfolio reflect expenses waived and/or reimbursed, if applicable, by the Adviser. Without such waivers and/or reimbursements, total returns would have been lower. Fee waivers and/or reimbursements are voluntary and the Adviser reserves the right to commence or terminate any waiver and/or reimbursement at any time. |
(5) | | Commenced operations on November 5, 1984. |
(6) | | Commenced operations on May 6, 1996. |
(7) | | Commenced operations on July 17, 1996. |
(8) | | For comparative purposes, average annual since inception returns listed for the Indexes refer to the inception date or initial offering of the respective share class of the Portfolio, not the inception of the Indexes. |
44
| 2007 Annual Report |
| |
| September 30, 2007 |
Investment Overview (cont’d)
Value Portfolio
Expense Examples
As a shareholder of the Portfolio, you incur two types of costs: (1) transactional costs, including redemption fees; (2) ongoing costs, including management fees, shareholder servicing fees (in the case of Investment Class and Adviser Class); and other Portfolio expenses. These examples are intended to help you understand your ongoing costs (in dollars) of investing in the Portfolio and to compare these costs with the ongoing costs of investing in other mutual funds.
The examples are based on an investment of $1,000 invested at the beginning of the six-month period ended September 30, 2007 and held for the entire six-month period.
Actual Expenses
The first line of the tables below provides information about actual account values and actual expenses. You may use the information in this line, together with the amount you invested, to estimate the expenses that you paid over the period. Simply divide your account value by $1,000 (for example, an $8,600 account value divided by $1,000 = 8.6), then multiply the result by the number in the first line under the heading entitled “Expenses Paid During Period” to estimate the expenses you paid on your account during this period.
Please note that “Expenses Paid During Period” are grossed up to reflect Portfolio expenses prior to the effect of Expense Offset (See Note E in the Notes to Financial Statements). Therefore, the annualized net expense ratios may differ from the ratio of expenses to average net assets shown in the Financial Highlights.
Hypothetical Example for Comparison Purposes
The second line of the tables below provides information about hypothetical account values and hypothetical expenses based on the Portfolio’s actual expense ratio and an assumed rate of return of 5% per year before expenses, which is not the Portfolio’s actual return. The hypothetical account values and expenses may not be used to estimate the actual ending account balance or expenses you paid for the period. You may use this information to compare the ongoing costs of investing in the Portfolio and other funds. To do so, compare this 5% hypothetical example with the 5% hypothetical examples that appear in the shareholder reports of the other funds.
Please note that the expenses shown in the table are meant to highlight your ongoing costs only and do not reflect any transactional costs, such as redemption fees. Therefore, the second line of the table is useful in comparing ongoing costs only, and will not help you determine the relative total costs of owning different funds. In addition, if these transactional costs were included, your costs would have been higher.
| | | | | | Expenses Paid | |
| | | | Ending Account | | During Period* | |
| | Beginning | | Value | | April 1, 2007 | |
| | Account Value | | September 30, | | September 30, | |
| | April 1, 2007 | | 2007 | | 2007 | |
Institutional Class | | | | | | | |
Actual | | $ | 1,000.00 | | $ | 1,032.70 | | $ | 3.11 | |
Hypothetical (5% average annual return before expenses) | | 1,000.00 | | 1,022.01 | | 3.09 | |
| | | | | | | |
Investment Class | | | | | | | |
Actual | | 1,000.00 | | 1,031.90 | | 3.87 | |
Hypothetical (5% average annual return before expenses) | | 1,000.00 | | 1,021.26 | | 3.85 | |
| | | | | | | |
Adviser Class | | | | | | | |
Actual | | 1,000.00 | | 1,031.50 | | 4.38 | |
Hypothetical (5% average annual return before expenses) | | 1,000.00 | | 1,020.76 | | 4.36 | |
| | | | | | | | | | |
* Expenses are equal to Institutional Class’, investment Class' and Adviser Class' annualized net expense ratios of 0.61%, 0.76% and 0.86%, respectively, multiplied by the average account value over the period, multiplied by 183/365 (to reflect the one-half year period).
Graphic Presentation of Portfolio Holdings
The following graph depicts the Portfolio’s holdings by industry and/or investment type, as a percentage of total investments.
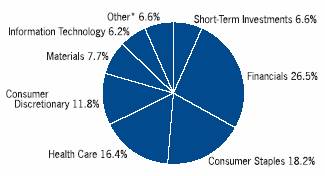
* Industries and/or investment types which do not appear in the above graph, as well as those which represent less than 5% of total investments, if applicable, are included in the category labeled “Other”.
45
2007 Annual Report
September 30, 2007
Portfolio of Investments
Value Portfolio
| | | | | |
| | | | Value | |
| | Shares | | (000) | |
Common Stocks (96.8%) | | | | | |
Consumer Discretionary (12.2%) | | | | | |
Clear Channel Communications, Inc. | | 83,999 | | $ | 3,145 | |
Comcast Corp., Class A | | (a)638,100 | | 15,429 | |
Home Depot, Inc. | | 59,300 | | 1,924 | |
Liberty Media Corp. - Capital, Class A | | (a)46,700 | | 5,829 | |
Liberty Media Corp. - Interactive, Class A | | (a)276,500 | | 5,312 | |
Live Nation, Inc. | | (a)(c)1 | | @— | |
Lowe’s Cos., Inc. | | 80,900 | | 2,267 | |
News Corp., Inc., Class B | | (c)282,500 | | 6,608 | |
Time Warner, Inc. | | 777,700 | | 14,279 | |
Viacom, Inc., Class B | | (a)371,350 | | 14,471 | |
| | | | 69,264 | |
Consumer Staples (18.9%) | | | | | |
Altria Group, Inc. | | 128,400 | | 8,928 | |
Anheuser-Busch Cos., Inc. | | 91,350 | | 4,567 | |
Cadbury Schweppes plc ADR | | (c)246,400 | | 11,463 | |
Coca-Cola Co. (The) | | 309,800 | | 17,804 | |
CVS/Caremark Corp. | | 253,300 | | 10,038 | |
Kimberly-Clark Corp. | | (c)143,100 | | 10,054 | |
Kraft Foods, Inc., Class A | | 334,450 | | 11,542 | |
Procter & Gamble Co. | | 73,700 | | 5,184 | |
Sara Lee Corp. | | 45,900 | | 766 | |
Unilever N.V. | | 423,400 | | 13,062 | |
Wal-Mart Stores, Inc. | | 321,200 | | 14,020 | |
| | | | 107,428 | |
Financials (27.5%) | | | | | |
Aflac, Inc. | | 59,800 | | 3,411 | |
American International Group, Inc. | | 99,200 | | 6,711 | |
Bank of America Corp. | | 399,200 | | 20,068 | |
Bank of New York Mellon Corp. (The) | | 188,146 | | 8,305 | |
Barclays plc ADR | | (c)19,100 | | 929 | |
Bear Stearns Cos., Inc. (The) | | (c)15,100 | | 1,854 | |
Berkshire Hathaway, Inc., Class B | | (a)1,018 | | 4,023 | |
Chubb Corp. | | 226,480 | | 12,148 | |
Citigroup, Inc. | | 459,400 | | 21,440 | |
Fannie Mae | | 38,300 | | 2,329 | |
Freddie Mac | | 137,300 | | 8,102 | |
Genworth Financial, Inc. | | 68,300 | | 2,099 | |
Hartford Financial Services Group, Inc. (The) | | 27,000 | | 2,499 | |
JPMorgan Chase & Co. | | 176,300 | | 8,078 | |
MBIA, Inc. | | (c)32,800 | | 2,002 | |
Merrill Lynch & Co., Inc. | | 81,900 | | 5,838 | |
Metlife, Inc. | | 84,200 | | 5,871 | |
PNC Financial Services Group, Inc. | | 73,900 | | 5,033 | |
Torchmark Corp. | | 52,900 | | 3,297 | |
Travelers Cos., Inc. (The) | | 75,415 | | 3,796 | |
U.S. Bancorp | | 96,300 | | 3,133 | |
Wachovia Corp. | | (c)311,900 | | 15,642 | |
Wells Fargo & Co. | | 276,000 | | 9,831 | |
| | | | 156,439 | |
Health Care (17.0%) | | | | | |
Abbott Laboratories | | 173,400 | | 9,298 | |
Boston Scientific Corp. | | (a)271,000 | | 3,780 | |
Bristol-Myers Squibb Co. | | 596,700 | | $ | 17,197 | |
Cardinal Health, Inc. | | 113,000 | | 7,066 | |
Eli Lilly & Co. | | 201,900 | | 11,494 | |
GlaxoSmithKline plc ADR | | (c)131,000 | | 6,969 | |
Pfizer, Inc. | | 403,200 | | 9,850 | |
Roche Holding A.G. ADR | | 32,500 | | 2,937 | |
Sanofi-Aventis ADR | | 39,800 | | 1,688 | |
Schering-Plough Corp. | | 409,900 | | 12,965 | |
Wyeth | | 301,000 | | 13,410 | |
| | | | 96,654 | |
Industrials (2.2%) | | | | | |
General Electric Co. | | 203,500 | | 8,425 | |
Southwest Airlines Co. | | 273,400 | | 4,046 | |
| | | | 12,471 | |
Information Technology (6.4%) | | | | | |
Cisco Systems, Inc. | | (a)67,300 | | 2,228 | |
Computer Sciences Corp. | | (a)17,727 | | 991 | |
Dell, Inc. | | (a)255,200 | | 7,043 | |
Flextronics International Ltd. | | (a)(c)99,600 | | 1,114 | |
Hewlett-Packard Co. | | 68,600 | | 3,416 | |
Intel Corp. | | 122,000 | | 3,155 | |
International Business Machines Corp. | | 56,600 | | 6,667 | |
KLA-Tencor Corp. | | (c)34,200 | | 1,908 | |
Microsoft Corp. | | 115,700 | | 3,409 | |
Telefonaktiebolaget LM Ericsson ADR | | (c)55,400 | | 2,205 | |
Texas Instruments, Inc. | | (c)53,000 | | 1,939 | |
Western Union Co. (The) | | 107,600 | | 2,256 | |
| | | | 36,331 | |
Materials (8.0%) | | | | | |
Alcoa, Inc. | | 108,700 | | 4,252 | |
E.I. Du Pont de Nemours & Co. | | 280,200 | | 13,887 | |
International Paper Co. | | 558,623 | | 20,038 | |
Newmont Mining Corp. | | 53,800 | | 2,406 | |
Rohm & Haas Co. | | 85,200 | | 4,743 | |
| | | | 45,326 | |
Telecommunication Services (4.6%) | | | | | |
AT&T, Inc. | | 215,800 | | 9,130 | |
Verizon Communications, Inc. | | 387,100 | | 17,141 | |
| | | | 26,271 | |
Total Common Stocks (Cost $482,168) | | | | 550,184 | |
| | | | | |
| | Face | | | |
| | Amount | | | |
| | (000) | | | |
Short-Term Investments (6.9%) | | | | | |
Short-Term Debt Securities held as Collateral on Loaned Securities (4.9%) | | | | | |
AIG Match Funding Corp., | | | | | |
5.73%, 10/17/07 | | $ | (h)1,133 | | 1,133 | |
Alliance & Leicester plc, | | | | | |
5.83%, 10/9/07 | | (h)809 | | 809 | |
Bancaja, | | | | | |
5.36%, 10/19/07 | | 405 | | 405 | |
Bank of New York Co., Inc., | | | | | |
5.82%, 10/10/07 | | (h)405 | | 405 | |
| | | | | | | |
The accompanying notes are an integral part of the financial statements.
46
| 2007 Annual Report |
| |
| September 30, 2007 |
Portfolio of Investments (cont’d)
Value Portfolio
| | Face | | | |
| | Amount | | Value | |
| | (000) | | (000) | |
Short-Term Debt Securities held as Collateral on Loaned Securities (cont’d) | | | | | |
BASF AG, | | | | | |
5.36%, 10/22/07 | | $ | (h)405 | | $ | 405 | |
BNP Paribas plc, | | | | | |
5.50%, 11/19/07 | | (h)809 | | 809 | |
CAM US Finance S.A. Unipersonal, | | | | | |
5.37%, 10/3/07 | | 1,619 | | 1,619 | |
Canadian Imperial Bank of Commerce, New York, | | | | | |
4.92%, 10/1/07 | | (h)809 | | 809 | |
CC USA, Inc., | | | | | |
4.68%, 10/1/07 | | (h)405 | | 405 | |
CIT Group Holdings, | | | | | |
5.38%, 10/18/07 | | (h)1,457 | | 1,457 | |
Citigroup Global Markets Holdings, Inc., | | | | | |
5.26%, 10/1/07 | | 3,208 | | 3,208 | |
Credit Suisse First Boston, New York, | | | | | |
4.82%, 10/1/07 | | (h)809 | | 809 | |
First Tennessee Bank, | | | | | |
5.76%, 10/17/07 | | (h)405 | | 405 | |
5.77%, 10/17/07 | | (h)1,618 | | 1,618 | |
Goldman Sachs Group, Inc., | | | | | |
5.37%, 10/1/07 | | 761 | | 761 | |
5.82%, 10/15/07 | | (h)405 | | 405 | |
HSBC Finance Corp., | | | | | |
5.81%, 10/9/07 | | (h)405 | | 405 | |
IBM Corp., | | | | | |
5.79%, 10/9/07 | | 1,619 | | 1,619 | |
Macquarie Bank Ltd., | | | | | |
5.17%, 10/22/07 | | (h)809 | | 809 | |
Marshall & Ilsley Bank, | | | | | |
5.37%, 12/17/07 | | 812 | | 812 | |
Metropolitan Life Global Funding, | | | | | |
5.13%, 10/22/07 | | (h)1,214 | | 1,214 | |
National Bank of Canada, | | | | | |
5.66%, 10/2/07 | | (h)1,619 | | 1,619 | |
National Rural Utilities Cooperative Finance Corp., | | | | | |
5.73%, 10/1/07 | | (h)1,619 | | 1,619 | |
Nationwide Building Society, | | | | | |
5.28%, 12/28/07 | | 939 | | 939 | |
Societe Generale, New York, | | | | | |
5.11%, 10/31/07 | | (h)1,942 | | 1,942 | |
Unicredito Delaware, Inc., | | | | | |
5.77%, 10/15/07 | | (h)890 | | 890 | |
Unicredito Italiano Bank (Ireland) plc, | | | | | |
5.84%, 10/9/07 | | (h)567 | | 567 | |
| | | | 27,897 | |
| | | | | | | |
| | Shares | | | |
Investment Company (2.0%) | | | | | |
Morgan Stanley Institutional Liquidity Government Portfolio — Institutional Class | | (p)10,960,775 | | 10,961 | |
Total Short-Term Investments (Cost $38,858) | | | | 38,858 | |
Total Investments (103.7%) (Cost $521,026) — Including $27,394 of Securities Loaned | | | | 589,042 | |
Liabilities in Excess of Other Assets (-3.7%) | | | | (20,814 | ) |
Net Assets (100%) | | | | $ | 568,228 | |
| | | | | | |
(a) | | Non-income producing security. |
(c) | | All or a portion of security on loan at September 30, 2007. |
(h) | | Variable/Floating Rate Security — Interest rate changes on these instruments are based on changes in a designated base rate. The rates shown are those in effect on September 30, 2007. |
(p) | | See Note F within the Notes to Financial Statements regarding investment in Morgan Stanley Institutional Liquidity Government Portfolio — Institutional Class, Morgan Stanley Institutional Liquidity Money Market Portfolio — Institutional Class and/or Morgan Stanley Institutional Liquidity Tax-Exempt Portfolio — Institutional Class. |
@ | | Value is less than $500. |
ADR | | American Depositary Receipt |
| | |
The accompanying notes are an integral part of the financial statements.
47
2007 Annual Report
September 30, 2007
Investment Overview (unaudited)
Core Fixed Income Portfolio
Core Fixed-Income Portfolios: Distinguishing Characteristics and General Strategy
• Core Fixed Income Portfolio
• Core Plus Fixed Income Portfolio
• Investment Grade Fixed Income Portfolio
The MSIF Trust core fixed-income portfolios invest in a broad array of fixed-income securities — including U.S. Treasury and Agency securities, corporate obligations, and mortgage-backed issues. To meet the various needs of different core fixed-income investors, MSIF Trust offers three different core fixed-income mutual funds — all of which are actively managed by Morgan Stanley Investment Management’s taxable fixed-income team.
The Core Plus Fixed Income Portfolio is the flagship offering of the MSIF Trust core fixed-income portfolios, and is structured to take full advantage of the Advisor’s core fixed-income capabilities. The Investment Grade Fixed Income Portfolio invests only in fixed-income securities with credit-quality ratings of BBB or better, while the Core Fixed Income Portfolio invests primarily in dollar-denominated fixed-income securities issued by domestic entities with a credit-quality rating of BBB or better.
Morgan Stanley Investment Management’s core fixed-income strategies have two major objectives. The first is to provide investors with a positive real return — a total return including income and capital gains that is greater than the rate of inflation. The second is to help diversify equity-oriented strategies in other areas of clients’ investment programs. This approach positions each Portfolio to potentially perform well when other market sectors experience poor returns. Foreign investments are subject to certain risks such as currency fluctuations, economic instability, and political developments. High yield fixed income securities, otherwise known as
“Junk bonds”, represent a much greater risk of default and tend to be more volatile than higher rated bonds. Federal Home Loan Mortgage Corp., Federal National Mortgage Association, and Federal Home Loan Bank, although chartered and sponsored by Congress, are not funded by congressional appropriations and securities issued by them are neither guaranteed nor insured by the U.S. government.
Performance
For the fiscal year ended September 30, 2007, the Core Fixed Income Portfolio’s Institutional Class had a total return based on net asset value and reinvestment of distributions per share of 4.76%, net of fees. The Portfolio underperformed against its benchmark the Lehman Brothers U.S. Aggregate Index (the “Index”) which returned 5.14%.
Factors Affecting Performance
• Fears stemming from a residential housing downturn persisted throughout the 12-month period. Confronted with increasing delinquency rates on subprime loans, high-profile hedge fund collapses, and a series of subprime mortgage related credit downgrades, markets responded severely in the latter months of the reporting period. The impact was exacerbated by an influx of forced sellers looking to liquidate assets to help meet margin calls and capital withdrawals, which fueled concerns about the potential impact on the broader financial markets and economy and led to a flight to quality.
• In August, the Federal Open Market Committee (the “Fed”) lowered the discount rate by half a percent, from 6.25% to 5.75%, and began encouraging member banks to make greater use of the discount window without fear of such action being viewed negatively by the Fed. In September, the Fed elected to cut the target federal funds rate by 50 basis points to 4.75%, noting that while economic growth remained moderate, inflation risks remain and “the tightening of credit conditions has the potential to intensify the housing correction and to restrain economic growth.”
• U.S. Treasury yields fluctuated throughout the 12month period, with the yield curve beginning the period relatively flat and ending the period steep. As the yield curve steepened, shorter dated U.S. Treasury yields experienced the greatest decline, while longer dated yields rose slightly. Within the U.S. government sector, Treasuries and agencies outperformed other investment-grade sectors.
• The mortgage market was hit by the turmoil affecting residential housing, and especially by its spillover effects on secondary market activity, most notably in the non-agency mortgage area, casting a pall across the entire sector with little regard for whether the securities or loans in question were subprime or prime. The result was a further reduction in mortgage market liquidity, as well as a sharp diminishment in the availability of non-conforming mortgage loans to the general public.
• Widening credit spreads led corporate issues to underperform other major asset classes. Within the investment-grade corporate sector, lower-rated (Baa) and higher-rated (AAA) issues outpaced the middle investment grade issues and intermediate-term issues outperformed longer-dated issues. Industrials outpaced utilities and financials, which was the corporate sector hit hardest by the recent liquidity crisis.
48
| 2007 Annual Report |
| |
| September 30, 2007 |
Investment Overview (cont’d)
Core Fixed Income Portfolio
• A defensive interest rate positioning benefited the Portfolio’s performance for the overall period, as did a relative underweight to the corporate sector, particularly in the latter months of the reporting year when credit spreads significantly widened.
• Although the Portfolio maintained an underweight to agency mortgage backed securities, holdings here detracted from returns as the recent turmoil in the mortgage market and drying up of liquidity hurt the performance of the sector.
Management Strategies
• Throughout the period, we employed a defensive interest rate strategy by maintaining a lower interest rate sensitivity (as measured by duration) than that of the Index. In March of this year, the position was adjusted to underweight longer dated issues and overweight intermediate dated issues. As the spread between intermediate and long date yields widened and the yield curve steepened during the summer, relative performance benefited. Subsequently, in August, we further reduced the Portfolio’s interest rate sensitivity.
• We have held an underweight corporate position for some time now, which has benefited relative performance. While we are looking for areas to take advantage of the recent spread widening and add to corporate positions, we remain cautious because we believe the credit market remains vulnerable to potential credit downgrades and/or an economic downturn.
• We maintained an underweight position to agency mortgage-backed securities, with a focus on high-coupon, slow-prepaying issues, and non-agency mortgages issued to high quality borrowers.
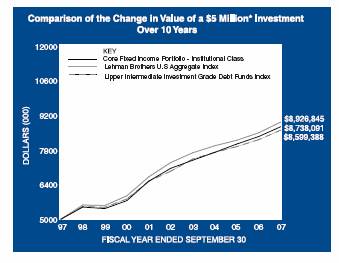
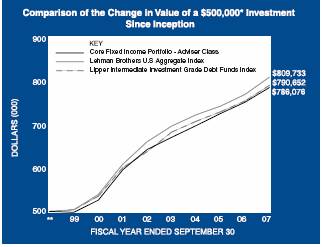
* Minimum Investment
** Commenced operations on March 1, 1999.
In accordance with SEC regulations, the Portfolio’s performance shown assumes that all recurring fees (including management fees) were deducted and all dividends and distributions were reinvested. The performance of Adviser Class shares will vary from the Institutional Class shares based upon the different inception date and will be negatively impacted by additional fees assessed to this class.
49
2007 Annual Report
September 30, 2007
Investment Overview (cont’d)
Core Fixed Income Portfolio
Performance Compared to the Lehman Brothers U.S. Aggregate Index(1), and Lipper Intermediate Investment Grade Debt Funds Index(2)
| | Total Returns(3) | |
| | | | Average Annual | |
| | One | | Five | | Ten | | Since | |
| | Year | | Years | | Years | | Inception(6) | |
| | | | | | | | | |
Portfolio — Institutional Class(4) | | 4.76 | % | 4.36 | % | 5.74 | % | 7.86 | % |
Lehman Brothers U.S. Aggregate Index | | 5.14 | | 4.13 | | 5.97 | | 7.71 | |
Lipper Intermediate Investment Grade Debt | | | | | | | | | |
Funds Index | | 4.69 | | 4.38 | | 5.57 | | — | |
Portfolio — Adviser Class(5) | | 4.53 | | 4.10 | | — | | 5.41 | |
Lehman Brothers U.S. Aggregate Index | | 5.14 | | 4.13 | | — | | 5.78 | |
Lipper Intermediate Investment Grade Debt | | | | | | | | | |
Funds Index | | 4.69 | | 4.38 | | — | | 5.48 | |
Performance data quoted represents past performance, which is no guarantee of future results, and current performance may be lower or higher than the figures shown. Performance assumes that all dividends and distributions, if any, were reinvested. For the most recent month-end performance figures, please visit www.morganstanley.com/im. Investment return and principal value will fluctuate so that Portfolio shares, when redeemed, may be worth more or less than their original cost. Total returns do not reflect the deduction of taxes that a shareholder would pay on Portfolio distributions or the redemption of Portfolio shares.
(1) | | The Lehman Brothers U.S. Aggregate Index tracks the performance of all U.S. government agency and Treasury securities, investment-grade corporate debt securities, agency mortgage-backed securities, asset-backed securities and commercial mortgage-backed securities. The Index is unmanaged and its returns do not include any sales charges or fees. Such costs would lower performance. It is not possible to invest directly in an index. |
(2) | | The Lipper Intermediate Investment Grade Debt Funds Index is an equally weighted performance index of the largest qualifying funds (based on net assets) in the Lip-per Intermediate Investment Grade Debt Funds classification. The Index, which is adjusted for capital gains distributions and income dividends, is unmanaged and should not be considered an investment. There are currently 30 funds represented in this Index. As of the date of this report, the Portfolio is in the Lipper Intermediate Investment Grade Debt Funds classification. |
(3) | | Total returns for the Portfolio reflect expenses waived and/or reimbursed, if applicable, by the Adviser. Without such waivers and/or reimbursements, total returns would have been lower. Fee waivers and/or reimbursements are voluntary and the Adviser reserves the right to commence or terminate any waiver and/or reimbursement at any time. |
(4) | | Commenced operations on September 29, 1987. |
(5) | | Commenced operations on March 1, 1999. |
(6) | | For comparative purposes, average annual since inception returns listed for the Indexes refer to the inception date or initial offering of the respective share class of the Portfolio, not the inception of the Indexes. |
Expense Examples
As a shareholder of the Portfolio, you incur two types of costs: (1) transactional costs, including redemption fees; (2) ongoing costs, including management fees, shareholder servicing fees (in the case of Adviser Class); and other Portfolio expenses. These examples are intended to help you understand your ongoing costs (in dollars) of investing in the Portfolio and to compare these costs with the ongoing costs of investing in other mutual funds.
The examples are based on an investment of $1,000 invested at the beginning of the six-month period ended September 30, 2007 and held for the entire six-month period.
Actual Expenses
The first line of the tables below provides information about actual account values and actual expenses. You may use the information in this line, together with the amount you invested, to estimate the expenses that you paid over the period. Simply divide your account value by $1,000 (for example, an $8,600 account value divided by $1,000 = 8.6), then multiply the result by the number in the first line under the heading entitled “Expenses Paid During Period” to estimate the expenses you paid on your account during this period.
Please note that “Expenses Paid During Period” are grossed up to reflect Portfolio expenses prior to the effect of Expense Offset (See Note E in the Notes to Financial Statements). Therefore, the annualized net expense ratios may differ from the ratio of expenses to average net assets shown in the Financial Highlights.
Hypothetical Example for Comparison Purposes
The second line of the tables below provides information about hypothetical account values and hypothetical expenses based on the Portfolio’s actual expense ratio and an assumed rate of return of 5% per year before expenses, which is not the Portfolio’s actual return. The hypothetical account values and expenses may not be used to estimate the actual ending account balance or expenses you paid for the period. You may use this information to compare the ongoing costs of investing in the Portfolio and other funds. To do so, compare this 5% hypothetical example with the 5% hypothetical examples that appear in the shareholder reports of the other funds.
50
| 2007 Annual Report |
| |
| September 30, 2007 |
Investment Overview (cont’d)
Core Fixed Income Portfolio
Please note that the expenses shown in the table are meant to highlight your ongoing costs only and do not reflect any transactional costs, such as redemption fees. Therefore, the second line of the table is useful in comparing ongoing costs only, and will not help you determine the relative total costs of owning different funds. In addition, if these transactional costs were included, your costs would have been higher.
| | | | | | Expenses Paid | |
| | | | Ending Account | | During Period* | |
| | Beginning | | Value | | April 1, 2007 — | |
| | Account Value | | September 30, | | September 30, | |
| | April 1, 2007 | | 2007 | | 2007 | |
Institutional Class | | | | | | | |
Actual | | $ | 1,000.00 | | $ | 1,021.90 | | $ | 2.48 | |
Hypothetical (5% average annual return before expenses) | | 1,000.00 | | 1,022.61 | | 2.48 | |
Adviser Class | | | | | | | |
Actual | | 1,000.00 | | 1,021.70 | | 3.75 | |
Hypothetical (5% average annual return before expenses) | | 1,000.00 | | 1,021.36 | | 3.75 | |
| | | | | | | | | | |
* | | Expenses are equal to Institutional Class’ and Adviser Class’ annualized net expense ratios of 0.49% and 0.74%, respectively, multiplied by the average account value over the period, multiplied by 183/365 (to reflect the one-half year period). |
Graphic Presentation of Portfolio Holdings
The following graph depicts the Portfolio’s holdings by industry and/or investment type, as a percentage of total investments.

* | | Industries and/or investment types which do not appear in the above graph, as well as those which represent less than 5% of total investments, if applicable, are included in the category labeled “Other”. |
51
2007 Annual Report
September 30, 2007
Portfolio of Investments
Core Fixed Income Portfolio
| | Face | | | |
| | Amount | | Value | |
| | (000) | | (000) | |
Fixed Income Securities (105.2%) | | | | | |
Agency Adjustable Rate Mortgages (4.0%) | | | | | |
Federal Home Loan Mortgage Corp., | | | | | |
5.85%, 10/1/36 | | $ | 1,516 | | $ | 1,532 | |
Conventional Pools: | | | | | |
5.63%, 4/1/37 | | 1,448 | | 1,459 | |
5.73%, 1/1/37 | | 2,078 | | 2,094 | |
5.97%, 1/1/37 | | 757 | | 767 | |
Federal National Mortgage Association, | | | | | |
5.19%, 12/25/36 | | 1,110 | | 1,101 | |
7.41%, 5/1/36 | | 1,142 | | 1,164 | |
7.47%, 7/1/36 | | 1,023 | | 1,048 | |
7.48%, 7/1/36 | | 1,279 | | 1,305 | |
Conventional Pools: | | | | | |
5.24%, 3/1/37 | | 1,350 | | 1,351 | |
Government National Mortgage Association, | | | | | |
5.75%, 8/20/25 - 9/20/27 | | 188 | | 190 | |
6.13%, 10/20/27 - 12/20/27 | | 25 | | 25 | |
6.38%, 2/20/25 - 1/20/28 | | 714 | | 721 | |
| | | | 12,757 | |
Agency Fixed Rate Mortgages (22.4%) | | | | | |
Federal Home Loan Mortgage Corp.,
Conventional Pools: | | | | | |
10.00%, 10/1/12 - 11/1/20 | | 22 | | 25 | |
11.50%, 8/1/19 | | 21 | | 24 | |
Gold Pools: | | | | | |
6.50%, 2/1/29 - 4/1/29 | | 83 | | 85 | |
7.50%, 2/1/30 - 6/1/32 | | 485 | | 507 | |
8.00%, 10/1/29 - 10/1/31 | | 419 | | 444 | |
8.50%, 3/1/30 - 7/1/31 | | 186 | | 200 | |
10.00%, 6/1/17 - 3/1/21 | | 69 | | 75 | |
Federal National Mortgage Association,
Conventional Pools: | | | | | |
7.50%, 7/1/29 - 9/1/35 | | 2,642 | | 2,765 | |
8.00%, 4/1/25 - 6/1/32 | | 1,898 | | 2,003 | |
8.50%, 5/1/23 - 5/1/32 | | 1,301 | | 1,398 | |
6.50%, 10/1/29 - 2/1/33 | | 1,909 | | 1,956 | |
7.00%, 2/1/26 - 6/1/36 | | 7,075 | | 7,344 | |
9.00%, 4/1/26 | | 348 | | 375 | |
9.50%, 2/1/20 - 8/1/21 | | 144 | | 158 | |
10.00%, 8/1/18 - 2/1/25 | | 28 | | 32 | |
10.50%, 11/1/10 - 10/1/18 | | 34 | | 38 | |
11.00%, 9/1/19 - 9/1/20 | | 37 | | 41 | |
11.50%, 11/1/19 | | 41 | | 45 | |
October TBA | | | | | |
5.50%, 10/25/37 | | (i)8,100 | | 7,934 | |
6.50%, 10/25/37 | | (i)2,400 | | 2,444 | |
November TBA | | | | | |
5.00%, 11/25/37 | | (i)16,800 | | 16,021 | |
5.50%, 11/25/37 | | (i)24,450 | | 23,934 | |
7.00%, 11/25/37 | | (i)2,850 | | 2,939 | |
Government National Mortgage Association, | | | | | |
Various Pools: | | | | | |
9.00%, 11/15/17 | | 33 | | 35 | |
9.50%, 12/15/17 - 12/15/21 | | 218 | | 237 | |
10.00%, 9/15/18 - 4/15/25 | | $ | 222 | | $ | 252 | |
10.50%, 11/15/14 - 2/15/25 | | 364 | | 418 | |
11.00%, 12/15/09 - 7/15/20 | | 40 | | 45 | |
11.50%, 4/15/13 - 8/15/13 | | 28 | | 32 | |
12.00%, 12/15/12 - 3/15/14 | | 7 | | 8 | |
| | | | 71,814 | |
Asset Backed Corporates (22.3%) | | | | | |
American Express Credit Account Master Trust, | | | | | |
5.75%, 10/15/12 | | (h)1,425 | | 1,417 | |
Argent Securities, Inc., | | | | | |
5.18%, 10/25/36 | | (h)1,377 | | 1,366 | |
Banc of America Securities Auto Trust, | | | | | |
3.99%, 8/18/09 | | 645 | | 642 | |
Bayview Financial Acquisition Trust, | | | | | |
5.24%, 11/28/36 | | (h)653 | | 648 | |
Bear Stearns Asset Backed Securities, Inc., | | | | | |
5.23%, 1/25/37 | | (h)911 | | 906 | |
5.33%, 9/25/34 | | (h)130 | | 130 | |
5.35%, 3/25/35 | | (h)163 | | 162 | |
Capital Auto Receivables Asset Trust, | | | | | |
4.05%, 7/15/09 | | 681 | | 678 | |
4.98%, 5/15/11 | | 2,275 | | 2,272 | |
5.03%, 10/15/09 | | 1,400 | �� | 1,398 | |
5.31%, 10/20/09 | | (e)2,700 | | 2,700 | |
5.38%, 7/20/10 | | (h)2,175 | | 2,157 | |
5.76%, 11/15/11 | | (h)1,600 | | 1,587 | |
Capital One Auto Finance Trust, | | | | | |
5.07%, 7/15/11 | | 1,200 | | 1,199 | |
Caterpillar Financial Asset Trust, | | | | | |
3.90%, 2/25/09 | | 188 | | 188 | |
5.57%, 5/25/10 | | 1,500 | | 1,505 | |
CIT Equipment Collateral, | | | | | |
3.50%, 9/20/08 | | 58 | | 58 | |
5.07%, 2/20/10 | | 1,250 | | 1,242 | |
Citibank Credit Card Issuance Trust, | | | | | |
5.20%, 3/22/12 | | (h)1,725 | | 1,718 | |
5.65%, 9/20/19 | | (c)1,475 | | 1,470 | |
6.88%, 11/16/09 | | 1,240 | | 1,243 | |
Citicorp Residential Mortgage Securities, Inc., | | | | | |
5.21%, 9/25/36 | | (h)988 | | 982 | |
CNH Equipment Trust, | | | | | |
4.02%, 4/15/09 | | 359 | | 358 | |
4.27%, 1/15/10 | | 949 | | 945 | |
5.20%, 6/15/10 | | 1,050 | | 1,048 | |
Countrywide Asset Backed Certificates, | | | | | |
5.24%, 6/25/35 | | (h)472 | | 466 | |
5.28%, 7/25/25 | | (h)403 | | 402 | |
DaimlerChrysler Auto Trust, | | | | | |
4.04%, 9/8/09 | | 427 | | 426 | |
Fieldstone Mortgage Investment Corp., | | | | | |
5.20%, 11/25/36 | | (h)1,647 | | 1,628 | |
First Franklin Mortgage Loan Asset Backed Certificates, | | | | | |
5.18%, 7/25/36 | | (h)1,020 | | 1,013 | |
5.20%, 2/25/36 | | (h)773 | | 769 | |
The accompanying notes are an integral part of the financial statements.
52
| 2007 Annual Report |
| |
| September 30, 2007 |
Portfolio of Investments (cont’d)
Core Fixed Income Portfolio
| | Face | | | |
| | Amount | | Value | |
| | (000) | | (000) | |
Asset Backed Corporates (cont’d) | | | | | |
5.25%, 10/25/35 | | $ | (h)279 | | $ | 277 | |
Ford Credit Auto Owner Trust, | | | | | |
4.17%, 1/15/09 | | 116 | | 116 | |
5.26%, 10/15/10 | | 2,150 | | 2,152 | |
5.76%, 4/15/10 | | (h)3,125 | | 3,113 | |
Fremont Home Loan Owner Trust, | | | | | |
5.18%, 10/25/36 | | (h)1,648 | | 1,637 | |
GE Equipment Small Ticket, LLC, | | | | | |
4.38%, 7/22/09 | | (e)667 | | 665 | |
4.88%, 10/22/09 | | (e)1,056 | | 1,056 | |
GSAMP Trust, | | | | | |
5.20%, 1/25/37 | | (h)1,069 | | 1,063 | |
GS Auto Loan Trust, | | | | | |
5.37%, 12/15/10 | | 2,300 | | 2,304 | |
Harley-Davidson Motorcycle Trust, | | | | | |
3.76%, 12/17/12 | | 1,624 | | 1,599 | |
4.07%, 2/15/12 | | 1,125 | | 1,114 | |
Hertz Vehicle Financing, LLC, | | | | | |
4.93%, 2/25/10 | | 825 | | 823 | |
Honda Auto Receivables Owner Trust, | | | | | |
3.87%, 4/20/09 | | 551 | | 548 | |
3.93%, 1/15/09 | | 183 | | 183 | |
4.85%, 10/19/09 | | 970 | | 968 | |
Hyundai Auto Receivables Trust, | | | | | |
3.98%, 11/16/09 | | 525 | | 521 | |
Long Beach Mortgage Loan Trust, | | | | | |
5.22%, 1/25/36 | | (h)218 | | 218 | |
MBNA Master Credit Card Trust USA, | | | | | |
7.80%, 10/15/12 | | 1,480 | | 1,590 | |
National City Auto Receivables Trust, | | | | | |
2.88%, 5/15/11 | | 749 | | 739 | |
Nationstar Home Equity Loan Trust, | | | | | |
5.20%, 9/25/36 | | (h)812 | | 810 | |
Nissan Auto Receivables Owner Trust, | | | | | |
3.99%, 7/15/09 | | 727 | | 724 | |
Novastar Home Equity Loan, | | | | | |
5.20%, 11/25/36 | | (h)980 | | 974 | |
RAAC Series, | | | | | |
5.23%, 9/25/45 | | (h)309 | | 306 | |
Residential Asset Mortgage Products, Inc., | | | | | |
5.20%, 6/25/29 | | (h)1,237 | | 1,229 | |
Residential Asset Securities Corp., | | | | | |
5.21%, 10/25/36 | | (h)800 | | 795 | |
Securitized Asset Backed Receivables, LLC Trust, | | | | | |
5.21%, 11/25/36 | | (h)1,402 | | 1,388 | |
5.24%, 2/25/37 | | (h)1,559 | | 1,547 | |
5.26%, 5/25/37 | | (h)1,475 | | 1,464 | |
SLM Student Loan Trust, | | | | | |
5.35%, 10/25/14 | | (h)2,343 | | 2,344 | |
Soundview Home Equity Loan Trust, | | | | | |
5.21%, 1/25/37 | | (h)990 | | 983 | |
5.24%, 2/25/37 | | (h)1,297 | | 1,288 | |
Structured Asset Securities Corp., | | | | | |
5.22%, 6/25/37 | | $ | (h)1,315 | | $ | 1,304 | |
TXU Electric Delivery Transition Bond Co., | | | | | |
4.81%, 11/17/14 | | 300 | | 299 | |
USAA Auto Owner Trust, | | | | | |
3.58%, 2/15/11 | | 1,071 | | 1,065 | |
3.90%, 7/15/09 | | 266 | | 265 | |
Volkswagen Auto Loan Enhanced Trust, | | | | | |
4.80%, 7/20/09 | | 779 | | 778 | |
Wachovia Auto Owner Trust, | | | | | |
2.91%, 4/20/09 | | 16 | | 16 | |
4.06%, 9/21/09 | | 332 | | 331 | |
| | | | 71,319 | |
Collateralized Mortgage Obligations — Agency Collateral Series (0.5%) | | | | | |
Federal Home Loan Mortgage Corp., | | | | | |
Inv Fl IO | | | | | |
0.25%, 3/15/24 | | 478 | | 18 | |
Inv Fl IO PAC | | | | | |
2.80%, 10/15/29 | | 37 | | 1 | |
IO | | | | | |
5.00%, 12/15/16 | | 1,015 | | 93 | |
6.00%, 5/1/31 | | 623 | | 141 | |
6.50%, 4/1/28 - 5/15/33 | | 1,156 | | 269 | |
8.00%, 1/1/28 - 6/1/31 | | 70 | | 18 | |
Federal National Mortgage Association, | | | | | |
Inv Fl IO | | | | | |
1.80%, 2/17/31 | | 338 | | 18 | |
3.07%, 10/25/28 | | 343 | | 15 | |
IO | | | | | |
1.38%, 3/25/36 | | (h)4,981 | | 106 | |
6.00%, 8/25/32 - 11/25/32 | | 910 | | 111 | |
6.50%, 2/25/33 - 5/25/33 | | 1,530 | | 348 | |
7.00%, 4/25/33 | | 549 | | 125 | |
8.00%, 4/1/24 - 12/1/31 | | 490 | | 117 | |
9.00%, 11/1/26 | | 31 | | 8 | |
IO PAC | | | | | |
8.00%, 8/18/27 | | 29 | | 7 | |
Government National Mortgage Association, | | | | | |
Inv Fl IO | | | | | |
1.83%, 9/16/31 | | 71 | | 5 | |
2.20%, 12/16/25 | | 423 | | 40 | |
2.25%, 9/16/27 | | 207 | | 20 | |
2.85%, 8/16/29 | | 394 | | 39 | |
3.00%, 9/20/30 | | 76 | | 7 | |
| | | | 1,506 | |
Collateralized Mortgage Obligations — Non Agency Collateral Series (5.8%) | | | | | |
Banc of America Commercial Mortgage, Inc., | | | | | |
5.84% | | (h)(o)1,250 | | 1,259 | |
5.87% | | (h)(o)900 | | 910 | |
Bear Stearns Commercial Mortgage Securities, | | | | | |
5.90%, 6/11/40 | | (h)1,575 | | 1,596 | |
Citigroup Commercial Mortgage Trust, | | | | | |
5.89% | | (h)(o)1,225 | | 1,241 | |
| | | | | | | | |
The accompanying notes are an integral part of the financial statements.
53
2007 Annual Report
September 30, 2007
Portfolio of Investments (cont’d)
Core Fixed Income Portfolio
| | Face | | | |
| | Amount | | Value | |
| | (000) | | (000) | |
Collateralized Mortgage Obligations — Non Agency Collateral Series (cont’d) | | | | | |
Commercial Mortgage Pass Through Certificates, | | | | | |
6.01% | | $ | (h)(o)1,150 | | $ | 1,174 | |
Countrywide Alternative Loan Trust, | | | | | |
IO | | | | | |
1.08%, 9/25/35 | | 8,642 | | 181 | |
1.19%, 3/20/46 | | 4,773 | | 198 | |
1.29%, 8/25/46 | | 3,714 | | 143 | |
1.51%, 3/20/47 | | 13,085 | | 672 | |
1.66%, 12/20/35 | | (e)5,318 | | 142 | |
2.07%, 12/20/46 | | 15,229 | | 680 | |
2.09%, 2/25/37 | | 5,271 | | 254 | |
2.14%, 12/20/35 | | (e)(h)6,826 | | 271 | |
2.18%, 10/25/46 | | (h)9,238 | | 415 | |
Greenpoint Mortgage Funding Trust, | | | | | |
IO | | | | | |
0.81%, 8/25/45 - 10/25/45 | | (h)6,661 | | 190 | |
GS Mortgage Securities Corp. II, | | | | | |
5.99%, 8/10/45 | | (h)1,775 | | 1,809 | |
Harborview Mortgage Loan Trust, | | | | | |
IO | | | | | |
1.24%, 6/19/35 | | (h)3,529 | | 75 | |
1.53%, 5/19/35 | | (h)5,177 | | 112 | |
1.89%, 3/19/37 | | (h)4,576 | | 194 | |
2.02%, 7/19/46 | | (h)8,232 | | 296 | |
PO | | | | | |
3/19/37 | | 3 | | 2 | |
7/19/47 | | @— | | @— | |
Indymac Index Mortgage Loan Trust, | | | | | |
IO | | | | | |
1.43%, 7/25/35 | | (h)3,352 | | 117 | |
JPMorgan Chase Commercial Mortgage Securities Corp., | | | | | |
5.44%, 6/12/47 | | (h)725 | | 717 | |
6.01% | | (h)(o)1,850 | | 1,886 | |
Lehman Brothers Commercial Conduit Mortgage Trust, | | | | | |
6.13%, 7/15/44 | | (h)1,250 | | 1,288 | |
Lehman Brothers-UBS Commercial Mortgage Trust, | | | | | |
5.43%, 2/15/40 | | 500 | | 494 | |
Wachovia Bank Commercial Mortgage Trust, | | | | | |
5.34%, 12/15/43 | | (h)900 | | 883 | |
6.10%, 2/15/51 | | 950 | | 976 | |
Washington Mutual, Inc., | | | | | |
IO | | | | | |
0.46%, 9/25/46 | | (h)49,001 | | 367 | |
| | | | 18,542 | |
Finance (5.7%) | | | | | |
AIG SunAmerica Global Financing VI, | | | | | |
6.30%, 5/10/11 | | (e)1,185 | | 1,223 | |
American General Finance Corp., | | | | | |
4.63%, 5/15/09 - 9/1/10 | | 790 | | 776 | |
AXA Financial, Inc., | | | | | |
6.50%, 4/1/08 | | 230 | | 231 | |
Bank of New York Co., Inc. (The), | | | | | |
3.80%, 2/1/08 | | 250 | | 249 | |
Capmark Financial Group, Inc., | | | | | |
5.88%, 5/10/12 | | $ | (e)435 | | $ | 396 | |
6.30%, 5/10/17 | | (e)180 | | 157 | |
Catlin Insurance Co., Ltd., | | | | | |
7.25% | | (e)(h)(o)555 | | 524 | |
CIT Group, Inc., | | | | | |
4.75%, 8/15/08 | | 215 | | 212 | |
Countrywide Home Loans, Inc., | | | | | |
3.25%, 5/21/08 | | 380 | | 366 | |
Farmers Exchange Capital, | | | | | |
7.05%, 7/15/28 | | (c)165 | | 165 | |
Farmers Insurance Exchange, | | | | | |
8.63%, 5/1/24 | | 475 | | 546 | |
General Electric Capital Corp., | | | | | |
4.25%, 12/1/10 | | (c)230 | | 225 | |
4.75%, 9/15/14 | | (c)60 | | 58 | |
5.88%, 2/15/12 | | 50 | | 51 | |
Goldman Sachs Capital II, | | | | | |
5.79% | | (h)(o)570 | | 540 | |
HSBC Finance Corp., | | | | | |
4.13%, 12/15/08 | | (c)100 | | 99 | |
5.88%, 2/1/09 | | 290 | | 293 | |
6.38%, 10/15/11 | | 570 | | 589 | |
6.75%, 5/15/11 | | 235 | | 245 | |
8.00%, 7/15/10 | | 150 | | 161 | |
Huntington National Bank, | | | | | |
4.38%, 1/15/10 | | 250 | | 245 | |
iStar Financial, Inc., | | | | | |
6.07%, 3/9/10 | | (h)705 | | 658 | |
JPMorgan Chase & Co., | | | | | |
6.00%, 2/15/09 | | 635 | | 644 | |
Mantis Reef Ltd., | | | | | |
4.69%, 11/14/08 | | (e)400 | | 398 | |
Marshall & Ilsley Bank, | | | | | |
3.80%, 2/8/08 | | 575 | | 572 | |
MBNA Corp., | | | | | |
5.79%, 5/5/08 | | (e)(h)615 | | 617 | |
Nationwide Building Society, | | | | | |
4.25%, 2/1/10 | | 615 | | 603 | |
Platinum Underwriters Finance, Inc., | | | | | |
7.50%, 6/1/17 | | 265 | | 281 | |
Platinum Underwriters Holdings Ltd., | | | | | |
6.37%, 11/16/07 | | 260 | | 260 | |
Popular North American, Inc., | | | | | |
5.65%, 4/15/09 | | 310 | | 313 | |
Sovereign Bancorp, | | | | | |
5.44%, 3/23/10 | | (h)935 | | 935 | |
Sovereign Bank, | | | | | |
4.00%, 2/1/08 | | 100 | | 99 | |
Two-Rock Pass Through Trust, | | | | | |
6.44% | | (e)(h)(o)315 | | 266 | |
Unicredit Luxembourg Finance S.A., | | | | | |
5.41%, 10/24/08 | | (e)(h)985 | | 986 | |
| | | | | | | | | |
The accompanying notes are an integral part of the financial statements.
54
| 2007 Annual Report |
| |
| September 30, 2007 |
Portfolio of Investments (cont’d)
Core Fixed Income Portfolio
| | Face | | | |
| | Amount | | Value | |
| | (000) | | (000) | |
Finance (cont’d) | | | | | |
USB Capital IX, | | | | | |
6.19% | | $ | (e)(h)(o)540 | | $ | 541 | |
Wachovia Capital Trust III, | | | | | |
5.80% | | (h)(o)1,535 | | 1,526 | |
Washington Mutual Preferred Funding II, | | | | | |
6.67% | | (e)(h)(o)300 | | 259 | |
Washington Mutual, Inc., | | | | | |
8.25%, 4/1/10 | | 664 | | 701 | |
World Financial Properties, | | | | | |
6.91%, 9/1/13 | | (e)135 | | 139 | |
6.95%, 9/1/13 | | (e)546 | | 563 | |
Xlliac Global Funding, | | | | | |
4.80%, 8/10/10 | | (e)630 | | 627 | |
| | | | 18,339 | |
Industrials (4.7%) | | | | | |
America West Airlines, Inc., | | | | | |
7.10%, 4/2/21 | | 566 | | 589 | |
AT&T Corp., | | | | | |
8.00%, 11/15/31 | | 50 | | 61 | |
Brookfield Asset Management, Inc., | | | | | |
5.80%, 4/25/17 | | 215 | | 216 | |
7.13%, 6/15/12 | | 520 | | 558 | |
Burlington Northern Santa Fe Corp., | | | | | |
6.13%, 3/15/09 | | 260 | | 263 | |
Caterpillar Financial Services Corp., | | | | | |
3.63%, 11/15/07 | | 110 | | 110 | |
Clorox Co., | | | | | |
5.83%, 12/14/07 | | (h)620 | | 621 | |
Comcast Cable Communications, Inc., | | | | | |
7.13%, 6/15/13 | | 175 | | 186 | |
Comcast Cable Communications, LLC, | | | | | |
6.75%, 1/30/11 | | (c)265 | | 275 | |
ConAgra Foods, Inc., | | | | | |
7.00%, 10/1/28 | | 120 | | 126 | |
8.25%, 9/15/30 | | (c)285 | | 338 | |
Consumers Energy Co., | | | | | |
4.80%, 2/17/09 | | 380 | | 378 | |
Cooper Industries, Inc., | | | | | |
5.25%, 11/15/12 | | 295 | | 294 | |
CVS/Caremark Corp., | | | | | |
5.75%, 8/15/11 - 6/1/17 | | 410 | | 406 | |
6.04%, 12/10/28 | | (e)585 | | 570 | |
DaimlerChrysler N.A. Holding Corp., | | | | | |
8.50%, 1/18/31 | | (c)265 | | 329 | |
FBG Finance Ltd., | | | | | |
5.13%, 6/15/15 | | (c)(e)490 | | 463 | |
Federated Department Stores, Inc., | | | | | |
6.63%, 9/1/08 | | (c)120 | | 121 | |
France Telecom S.A., | | | | | |
8.50%, 3/1/31 | | 505 | | 651 | |
Fred Meyer, Inc., | | | | | |
7.45%, 3/1/08 | | 450 | | 454 | |
Home Depot, Inc., (The) | | | | | |
5.82%, 12/16/09 | | $ | (h)710 | | $ | 701 | |
ICI Wilmington, Inc., | | | | | |
4.38%, 12/1/08 | | 300 | | 299 | |
LG Electronics, Inc., | | | | | |
5.00%, 6/17/10 | | (e)210 | | 208 | |
Miller Brewing Co., | | | | | |
4.25%, 8/15/08 | | (e)475 | | 470 | |
AT&T, Inc., | | | | | |
6.15%, 9/15/34 | | 250 | | 248 | |
Sprint Capital Corp., | | | | | |
8.75%, 3/15/32 | | 80 | | 92 | |
Systems 2001 Asset Trust, LLC, | | | | | |
6.66%, 9/15/13 | | (e)352 | | 371 | |
Telecom Italia Capital S.A., | | | | | |
4.00%, 11/15/08 - 1/15/10 | | 650 | | 635 | |
Telefonica Europe B.V., | | | | | |
8.25%, 9/15/30 | | 525 | | 629 | |
Textron Financial Corp., | | | | | |
4.13%, 3/3/08 | | 230 | | 229 | |
5.13%, 2/3/11 | | 550 | | 548 | |
Time Warner, Inc., | | | | | |
5.73%, 11/13/09 | | (h)895 | | 885 | |
Union Pacific Corp., | | | | | |
6.63%, 2/1/08 | | 305 | | 306 | |
UnitedHealth Group, Inc., | | | | | |
4.13%, 8/15/09 | | 265 | | 260 | |
5.66%, 3/2/09 | | (h)365 | | 365 | |
Valero Energy Corp., | | | | | |
3.50%, 4/1/09 | | 345 | | 338 | |
Viacom, Inc., | | | | | |
6.88%, 4/30/36 | | 475 | | 475 | |
Vodafone Group plc, | | | | | |
5.29%, 12/28/07 | | (h)335 | | 335 | |
Yum! Brands, Inc., | | | | | |
8.88%, 4/15/11 | | 380 | | 424 | |
| | | | 14,827 | |
Mortgages — Other (28.9%) | | | | | |
American Home Mortgage Assets, | | | | | |
5.26%, 3/25/47 | | (h)1,874 | | 1,826 | |
5.36%, 9/25/46 | | (h)1,157 | | 1,142 | |
5.39%, 10/25/46 | | (h)2,106 | | 2,045 | |
5.43%, 6/25/47 | | (h)984 | | 882 | |
5.45%, 10/25/46 | | (h)1,022 | | 954 | |
American Home Mortgage Investment Trust, | | | | | |
5.32%, 5/25/47 | | (h)1,504 | | 1,477 | |
Banc of America Funding Corp., | | | | | |
5.85%, 9/20/35 | | (h)382 | | 378 | |
Bear Stearns Mortgage Funding Trust, | | | | | |
5.27%, 8/25/36 | | (h)1,827 | | 1,780 | |
5.29%, 12/25/36 | | (h)1,947 | | 1,911 | |
5.30%, 3/25/37 | | (h)1,701 | | 1,663 | |
5.31%, 10/25/36 | | (h)1,712 | | 1,674 | |
5.33%, 9/25/36 | | (h)2,000 | | 1,956 | |
| | | | | | | | | |
The accompanying notes are an integral part of the financial statements.
55
2007 Annual Report
September 30, 2007
Portfolio of Investments (cont’d)
Core Fixed Income Portfolio
| | Face | | | |
| | Amount | | Value | |
| | (000) | | (000) | |
Mortgages — Other (cont’d) | | | | | |
5.38%, 7/25/36 | | $ | (h)1,161 | | $ | 1,097 | |
Countrywide Alternative Loan Trust, | | | | | |
5.29%, 7/25/46 | | (h)406 | | 405 | |
5.30%, 5/25/47 | | (h)1,976 | | 1,930 | |
5.38%, 10/25/46 | | (h)1,979 | | 1,921 | |
5.42%, 6/25/47 | | (h)1,481 | | 1,448 | |
5.76%, 11/20/35 | | (h)318 | | 317 | |
5.81%, 3/20/46 | | (h)687 | | 672 | |
5.88%, 11/20/35 | | (h)661 | | 646 | |
5.89%, 12/20/35 | | (h)1,714 | | 1,670 | |
6.50%, 10/25/46 | | (e)220 | | 219 | |
6.68%, 2/25/36 | | (h)867 | | 854 | |
Deutsche ALT-A Securities, Inc. Alternate Loan Trust, | | | | | |
5.28%, 2/25/47 | | (h)2,150 | | 2,103 | |
5.81%, 2/25/47 | | (h)833 | | 788 | |
Deutsche ALT-A Securities, Inc., NIM Trust, | | | | | |
6.75%, 2/25/47 | | (e)627 | | 603 | |
Downey Savings & Loan Association Mortgage Loan Trust, | | | | | |
5.64%, 4/19/38 | | (h)1,563 | | 1,526 | |
5.70%, 11/19/37 | | (h)1,666 | | 1,632 | |
5.92%, 4/19/46 | | (h)1,025 | | 1,015 | |
Gemsco Mortgage Pass Through Certificates, | | | | | |
8.70%, 11/25/10 | | (d)(k)3 | | 3 | |
Greenpoint Mortgage Funding Trust, | | | | | |
5.30%, 4/25/47 | | (h)1,966 | | 1,923 | |
5.31%, 1/25/37 | | (h)1,460 | | 1,412 | |
5.45%, 3/25/36 | | (h)895 | | 879 | |
GS Mortgage Securities Corp., | | | | | |
6.25%, 1/25/37 | | (e)528 | | 522 | |
GSR Mortgage Loan Trust, | | | | | |
5.39%, 8/25/46 | | (h)2,002 | | 1,946 | |
Harborview Mortgage Loan Trust, | | | | | |
5.40%, 7/21/36 | | (h)1,546 | | 1,514 | |
5.59%, 1/19/38 | | (h)457 | | 455 | |
5.63%, 3/19/37 | | (h)2,101 | | 2,049 | |
5.65%, 3/19/38 | | (h)1,465 | | 1,429 | |
5.68%, 11/19/36 | | (h)1,801 | | 1,763 | |
5.69%, 1/19/38 | | (h)2,100 | | 2,052 | |
5.70%, 9/19/36 - 3/19/38 | | (h)1,912 | | 1,871 | |
5.73%, 7/19/46 | | (h)930 | | 905 | |
5.75%, 10/19/37 | | (h)943 | | 925 | |
5.78%, 11/19/36 | | (h)1,801 | | 1,755 | |
5.79%, 7/19/45 | | (h)255 | | 252 | |
5.88%, 11/19/35 | | (h)506 | | 493 | |
6.20%, 1/19/36 | | (h)394 | | 346 | |
Harborview NIM Corp., | | | | | |
6.41%, 3/19/37 - 3/19/38 | | (e)752 | | 748 | |
Indymac Index Mortgage Loan Trust, | | | | | |
5.25%, 7/25/46 | | (h)1,566 | | 1,557 | |
5.34%, 11/25/36 | | (h)1,524 | | 1,490 | |
5.35%, 4/25/46 | | (h)1,747 | | 1,713 | |
Lehman XS Trust, | | | | | |
5.53%, 11/25/46 | | (h)450 | | 401 | |
Luminent Mortgage Trust, | | | | | |
5.33%, 10/25/46 | | $ | (h)1,104 | | $ | 1,080 | |
5.36%, 5/25/46 | | (h)771 | | 755 | |
5.37%, 4/25/36 | | (h)661 | | 648 | |
5.49%, 7/25/36 | | (h)398 | | 338 | |
Mastr Adjustable Rate Mortgages Trust, | | | | | |
5.38%, 4/25/46 | | (h)660 | | 651 | |
5.53%, 1/25/47 | | (h)700 | | 556 | |
5.98%, 5/25/47 | | (h)400 | | 288 | |
6.23%, 5/25/47 | | (h)900 | | 684 | |
Merrill Lynch Mortgage Investors, Inc., | | | | | |
5.25%, 8/25/35 | | (h)65 | | 65 | |
Residential Accredit Loans, Inc., | | | | | |
5.29%, 3/25/47 | | (h)2,736 | | 2,681 | |
5.32%, 12/25/36 | | (h)1,598 | | 1,570 | |
5.33%, 6/25/37 | | (h)852 | | 835 | |
5.39%, 2/25/46 - 5/25/47 | | (h)1,624 | | 1,585 | |
5.40%, 2/25/46 | | (h)329 | | 325 | |
5.43%, 6/25/37 | | (h)803 | | 770 | |
5.53%, 10/25/45 | | (h)1,319 | | 1,274 | |
Structured Asset Mortgage Investments, Inc., | | | | | |
5.32%, 2/25/36 | | (h)281 | | 276 | |
5.33%, 10/25/36 | | (h)1,897 | | 1,862 | |
5.36%, 8/25/36 - 7/25/36 | | (h)3,586 | | 3,503 | |
5.40%, 4/25/36 | | (h)1,088 | | 1,075 | |
Washington Mutual Alternative Mortgage Pass-Through Certificates, | | | | | |
5.92%, 4/25/46 | | (h)900 | | 878 | |
5.94%, 8/25/46 | | (h)1,025 | | 1,001 | |
5.36%, 7/25/47 | | (h)2,676 | | 2,604 | |
Washington Mutual, Inc., | | | | | |
5.21%, 6/25/46 | | (h)75 | | 75 | |
5.38%, 11/25/45-12/25/45 | | (h)556 | | 554 | |
5.39%, 10/25/45 | | (h)162 | | 162 | |
5.42%, 8/25/45 | | (h)76 | | 75 | |
5.92%, 5/25/46 | | (h)762 | | 732 | |
Zuni Mortgage Loan Trust, | | | | | |
5.26%, 8/25/36 | | (h)641 | | 636 | |
| | | | 92,475 | |
U.S. Treasury Securities (9.6%) | | | | | |
U.S. Treasury Bonds, | | | | | |
4.50%, 2/15/36 | | (c)1,250 | | 1,185 | |
5.38%, 2/15/31 | | (c)10,750 | | 11,511 | |
6.13%, 8/15/29 | | (c)7,000 | | 8,168 | |
U.S. Treasury Note, | | | | | |
2.63%, 5/15/08 | | (c)10,000 | | 9,910 | |
| | | | 30,774 | |
Utilities (1.3%) | | | | | |
Appalachian Power Co., | | | | | |
5.65%, 8/15/12 | | 150 | | 151 | |
Arizona Public Service Co., | | | | | |
5.80%, 6/30/14 | | 500 | | 496 | |
Carolina Power & Light Co., | | | | | |
5.13%, 9/15/13 | | 340 | | 333 | |
| | | | | | | | | |
The accompanying notes are an integral part of the financial statements.
56
| 2007 Annual Report |
| |
| September 30, 2007 |
Portfolio of Investments (cont’d)
Core Fixed Income Portfolio
| | Face | | | |
| | Amount | | Value | |
| | (000) | | (000) | |
Utilities (cont’d) | | | | | |
CenterPoint Energy Resources Corp., | | | | | |
6.25%, 2/1/37 | | $ | 135 | | $ | 133 | |
7.88%, 4/1/13 | | 85 | | 93 | |
Consolidated Natural Gas Co., | | | | | |
6.25%, 11/1/11 | | 175 | | 180 | |
Detroit Edison Co., | | | | | |
6.13%, 10/1/10 | | 295 | | 305 | |
Entergy Gulf States, Inc., | | | | | |
3.60%, 6/1/08 | | 320 | | 315 | |
5.98%, 12/1/09 | | (h)155 | | 154 | |
NiSource Finance Corp., | | | | | |
6.06%, 11/23/09 | | (h)240 | | 238 | |
Ohio Power Corp., | | | | | |
6.00%, 6/1/16 | | 460 | | 463 | |
Plains All American Pipeline, LP, | | | | | |
6.70%, 5/15/36 | | 465 | | 467 | |
Public Service Electric & Gas Co., | | | | | |
5.00%, 1/1/13 | | 230 | | 223 | |
Texas Eastern Transmission, LP, | | | | | |
7.00%, 7/15/32 | | (c)280 | | 297 | |
Wisconsin Electric Power Co., | | | | | |
3.50%, 12/1/07 | | 250 | | 249 | |
| | | | 4,097 | |
Total Fixed Income Securities (Cost $340,761) | | | | 336,450 | |
| | | | | |
| | No. of | | | |
| | Contracts | | | |
Put Option Purchased (0.0%) | | | | | |
90 Day EuroDollar | | | | | |
12/07 @ $94.75 (Cost $78) | | (a)436 | | 46 | |
| | | | | |
| | Shares | | | |
Preferred Stock (0.2%) | | | | | |
Mortgages — Other (0.2%) | | | | | |
Home Ownership Funding Corp., | | | | | |
13.33% (Cost $458) | | (e)2,975 | | 446 | |
| | | | | |
| | Face | | | |
| | Amount | | | |
| | (000) | | | |
Short-Term Investments (11.8%) | | | | | |
Short-Term Debt Securities held as Collateral on Loaned Securities (1.3%) | | | | | |
AIG Match Funding Corp., | | | | | |
5.73%, 10/17/07 | | $ | (h)169 | | 169 | |
Alliance & Leicester plc, | | | | | |
5.83%, 10/9/07 | | (h)121 | | 121 | |
Bancaja, | | | | | |
5.36%, 10/19/07 | | 60 | | 60 | |
Bank of New York Co., Inc., | | | | | |
5.82%, 10/10/07 | | (h)60 | | 60 | |
BASF AG, | | | | | |
5.36%, 10/22/07 | | (h)60 | | 60 | |
BNP Paribas plc, | | | | | |
5.50%, 11/19/07 | | (h)121 | | 121 | |
CAM US Finance S.A. Unipersonal, | | | | | |
5.37%, 10/3/07 | | 242 | | 242 | |
Canadian Imperial Bank of Commerce, New York, | | | | | |
4.92%, 10/1/07 | | $ | (h)121 | | $ | 121 | |
CC USA, Inc., | | | | | |
4.68%, 10/1/07 | | (h)60 | | 60 | |
CIT Group Holdings, | | | | | |
5.38%, 10/18/07 | | (h)218 | | 218 | |
Citigroup Global Markets Holdings, Inc., | | | | | |
5.26%, 10/1/07 | | 479 | | 479 | |
Credit Suisse First Boston, New York, | | | | | |
4.82%, 10/1/07 | | (h)121 | | 121 | |
First Tennessee Bank, | | | | | |
5.76%, 10/17/07 | | (h)60 | | 60 | |
5.77%, 10/17/07 | | (h)242 | | 242 | |
Goldman Sachs Group, Inc., | | | | | |
5.37%, 10/1/07 | | 114 | | 114 | |
5.82%, 10/15/07 | | (h)60 | | 60 | |
HSBC Finance Corp., | | | | | |
5.81%, 10/9/07 | | (h)60 | | 60 | |
IBM Corp., | | | | | |
5.79%, 10/9/07 | | 242 | | 242 | |
Macquarie Bank Ltd., | | | | | |
5.17%, 10/22/07 | | (h)121 | | 121 | |
Marshall & Ilsley Bank, | | | | | |
5.37%, 12/17/07 | | 121 | | 121 | |
Metropolitan Life Global Funding, | | | | | |
5.13%, 10/22/07 | | (h)181 | | 181 | |
National Bank of Canada, | | | | | |
5.66%, 10/2/07 | | (h)242 | | 242 | |
National Rural Utilities Cooperative Finance Corp., | | | | | |
5.73%, 10/1/07 | | (h)242 | | 242 | |
Nationwide Building Society, | | | | | |
5.28%, 12/28/07 | | 140 | | 140 | |
Societe Generale, New York, | | | | | |
5.11%, 10/31/07 | | (h)290 | | 290 | |
Unicredito Delaware, Inc., | | | | | |
5.77%, 10/15/07 | | (h)133 | | 133 | |
Unicredito Italiano Bank (Ireland) plc, | | | | | |
5.84%, 10/9/07 | | (h)85 | | 85 | |
| | | | 4,165 | |
| | | | | |
| | Shares | | | |
Investment Company (10.3%) | | | | | |
Morgan Stanley Institutional Liquidity | | | | | |
Money Market Portfolio — Institutional Class | | (p)32,976,087 | | 32,976 | |
| | | | | | | | | |
The accompanying notes are an integral part of the financial statements.
57
2007 Annual Report
September 30, 2007
Portfolio of Investments (cont’d)
Core Fixed Income Portfolio
| | Face | | | |
| | Amount | | Value | |
| | (000) | | (000) | |
U.S. Treasury Security (0.2%) | | | | | |
U.S. Treasury Bill | | | | | |
3.82%, 1/10/08 | | $ | (j)(r)705 | | $ | 698 | |
Total Short-Term Investments (Cost $37,836) | | | | 37,839 | |
Total Investments (117.2%) (Cost $379,133) — Including $31,753 of Securities Loaned | | | | 374,781 | |
Liabilities in Excess of Other Assets (-17.2%) | | | | (54,865 | ) |
Net Assets (100%) | | | | $ | 319,916 | |
| | | | | | | |
(a) | Non-income producing security. |
(c) | All or a portion of security on loan at September 30, 2007. |
(d) | Security was valued at fair value — At September 30, 2007, the Portfolio held $3,000 of fair valued securities, representing less than 0.05% of net assets. |
(e) | 144A security — Certain conditions for public sale may exist. Unless otherwise noted, these securities are deemed to be liquid. |
(h) | Variable/Floating Rate Security — Interest rate changes on these instruments are based on changes in a designated base rate. The rates shown are those in effect on September 30, 2007. |
(i) | Security is subject to delayed delivery. |
(j) | All or a portion of the security was pledged to cover margin requirements for futures contracts. |
(k) | Security has been deemed illiquid at September 30, 2007. |
(o) | Perpetual — Security does not ha ve a predetermined maturity date. Rate for this security is fixed for a period of time then reverts to a floating rate. The interest rate shown is the rate in effect at September 30, 2007. |
(p) | See Note F within the Notes to Financial Statements regarding investment in Morgan Stanley Institutional Liquidity Government Portfolio — Institutional Class, Morg an Stanley Institutional Liquidity Money Market Portfolio — Institutional Class and/or Morgan Stanley Institutional Liquidity Tax-Exempt Portfolio — Institutional Class. |
(r) | Rate shown is the Yield to Maturity at September 30, 2007. |
@ | Face Amount/Value is less than $500. |
Inv Fl | Inverse Floating Rate — Inter est rate fluctuates with an inverse relationship to an associated interest rate. Indicated rate is the effective rate at September 30, 2007. |
IO | Interest Only |
PAC | Planned Amortization Class |
PO | Principal Only |
TBA | To Be Announced |
Futures Contracts
The Portfolio had the following futures contract(s) open at period end:
| | | | | | | | Net | |
| | | | | | | | Unrealized | |
| | Number | | | | | | Appreciation | |
| | of | | Value | | Expiration | | (Depreciation) | |
| | Contracts | | (000) | | Date | | (000) | |
Long: | | | | | | | | | |
EuroDollar | | | | | | | | | |
CME | | 40 | | $ | 9,515 | | Dec-07 | | | $ | 25 | |
EuroDollar | | | | | | | | | | |
CME | | 40 | | 9,548 | | Mar-08 | | | 42 | |
EuroDollar | | | | | | | | | | |
CME | | 40 | | 9,562 | | Jun-08 | | | 48 | |
EuroDollar | | | | | | | | | | |
CME | | 40 | | 9,569 | | Sep-08 | | | 53 | |
EuroDollar | | | | | | | | | | |
CME | | 40 | | 9,569 | | Dec-08 | | | 54 | |
EuroDollar | | | | | | | | | | |
CME | | 40 | | 9,562 | | Mar-09 | | | 52 | |
EuroDollar | | | | | | | | | | |
CME | | 40 | | 9,550 | | Jun-09 | | | (9 | ) |
U.S. Treasury | | | | | | | | | | |
2 yr. Note | | 190 | | 39,339 | | Dec-07 | | | 129 | |
U.S. Treasury | | | | | | | | | | |
5 yr. Note | | 417 | | 44,632 | | Dec-07 | | | 282 | |
Short: | | | | | | | | | | |
U.S. Treasury | | | | | | | | | | |
10yr. Note | | 179 | | 19,561 | | Dec-07 | | | 119 | |
U.S. Treasury | | | | | | | | | | |
Long Bond | | 334 | | 37,189 | | Dec-07 | | | 119 | |
| | | | | | | | $ | 914 | |
| | | | | | | | | | | | |
CME Chicago Mercantile Exchange
The accompanying notes are an integral part of the financial statements.
58
| 2007 Annual Report |
| |
| September 30, 2007 |
Portfolio of Investments (cont’d)
Core Fixed Income Portfolio
Credit Default Swap Contracts
The Portfolio had the following credit default swap agreement(s) open at period end:
| | | | | | | | | | Unrealized | |
| | | | Notional | | | | | | Appreciation | |
| | Buy/Sell | | Amount | | Pay/Receive | | Termination | | (Depreciation) | |
Swap Counterparty and Reference Obligation | | Protection | | (000) | | Fixed Rate | | Date | | (000) | |
Citigroup | | Buy | | $ | 500 | | 0.43 | % | 3/20/12 | | | $ | (1 | ) |
Tyco International Ltd., Zero Coupon, 11/17/20 | | | | | | | | | | | | |
Citigroup | | Buy | | 1,000 | | 0.43 | | 3/20/12 | | | (2 | ) |
Tyco International Ltd., Zero Coupon, 11/17/20 | | | | | | | | | | | | |
Goldman Sachs | | Buy | | 1,600 | | 0.12 | | 12/20/11 | | | 8 | |
The Hartford Financial Services Group, Inc., 4.75%, 3/1/14 | | | | | | | | | | | | |
Goldman Sachs | | Buy | | 510 | | 0.15 | | 12/20/11 | | | 3 | |
Motorola, Inc., 6.50%, 9/1/25 | | | | | | | | | | | | |
Goldman Sachs | | Buy | | 1,050 | | 0.16 | | 12/20/11 | | | 5 | |
Motorola, Inc., 6.50%, 9/1/25 | | | | | | | | | | | | |
Goldman Sachs | | Buy | | 780 | | 0.22 | | 3/20/12 | | | (1 | ) |
Dell, Inc., 7.10%, 4/15/28 | | | | | | | | | | | | |
Goldman Sachs | | Buy | | 1,550 | | 0.10 | | 3/20/12 | | | 9 | |
The Chubb Corp., 6.00%, 11/15/11 | | | | | | | | | | | | |
JPMorgan Chase | | Buy | | 1,300 | | 0.65 | | 3/20/11 | | | (16 | ) |
Tyco International Ltd., 2.75%, 1/15/18 | | | | | | | | | | | | |
JPMorgan Chase | | Buy | | 280 | | 1.18 | | 6/20/14 | | | 3 | |
Belo Corp., 8.00%, 11/1/08 | | | | | | | | | | | | |
JPMorgan Chase | | Buy | | 800 | | 1.30 | | 6/20/14 | | | 3 | |
Belo Corp., 8.00%, 11/1/08 | | | | | | | | | | | | |
Lehman Brothers | | Buy | | 800 | | 0.20 | | 12/20/11 | | | 1 | |
Union Pacific Corp., 6.13%, 1/15/12 | | | | | | | | | | | |
| | | | | | | | | | $ | 12 | |
| | | | | | | | | | | | | | |
Interest Rate Swap Contracts
The Portfolio had the following interest rate swap agreement(s) open at period end:
| | | | | | | | | | | | Unrealized | |
| | | | | | | | | | Notional | | Appreciation | |
| | Floating Rate | | Pay/Receive | | Fixed | | Termination | | Amount | | (Depreciation) | |
Swap Counterparty | | Index | | Floating Rate | | Rate | | Date | | (000) | | (000) | |
Citigroup | | 3 Month LIBOR | | Pay | | 5.37 | % | 5/22/17 | | $ | 7,800 | | $ | 185 | |
| | 3 Month LIBOR | | Pay | | 5.37 | | 5/23/17 | | 7,800 | | 207 | |
| | 3 Month LIBOR | | Pay | | 5.34 | | 5/24/17 | | 6,800 | | 164 | |
| | 3 Month LIBOR | | Pay | | 5.02 | | 9/11/17 | | 5,000 | | (77 | ) |
| | 3 Month LIBOR | | Pay | | 5.24 | | 9/27/17 | | 5,000 | | 14 | |
| | 3 Month LIBOR | | Receive | | 5.29 | | 9/28/17 | | 6,000 | | (40 | ) |
Deutsche Bank | | 3 Month LIBOR | | Pay | | 5.39 | | 5/25/17 | | 17,600 | | 494 | |
| | 3 Month LIBOR | | Pay | | 5.43 | | 5/29/17 | | 12,075 | | 377 | |
JPMorgan Chase | | 3 Month LIBOR | | Pay | | 5.37 | | 5/23/17 | | 7,800 | | 209 | |
| | 3 Month LIBOR | | Pay | | 5.34 | | 5/24/17 | | 11,200 | | 272 | |
| | 3 Month LIBOR | | Pay | | 5.45 | | 5/29/17 | | 11,425 | | 374 | |
| | 3 Month LIBOR | | Pay | | 5.44 | | 8/20/17 | | 2,300 | | 42 | |
| | 3 Month LIBOR | | Pay | | 5.09 | | 9/11/17 | | 10,800 | | (110 | ) |
| | 3 Month LIBOR | | Pay | | 5.16 | | 9/20/17 | | 4,500 | | (18 | ) |
| | 3 Month LIBOR | | Receive | | 5.23 | | 9/27/17 | | 5,100 | | (12 | ) |
| | 3 Month LIBOR | | Receive | | 5.30 | | 9/28/17 | | 5,550 | | (42 | ) |
| | | | | | | | | | | | $ | 2,039 | |
| | | | | | | | | | | | | | | |
LIBOR — London Inter Bank Offer Rate
The accompanying notes are an integral part of the financial statements.
59
2007 Annual Report |
| |
September 30, 2007 |
Investment Overview (unaudited)
Core Plus Fixed Income Portfolio
Performance
For the fiscal year ended September 30, 2007, the Portfolio’s Institutional Class had a total return based on net asset value and reinvestment of distributions per share of 4.77%, net of fees. The Portfolio’s Institutional Class underperformed its benchmark the Lehman Brothers U.S. Aggregate Index (the “Index”) which returned 5.14%.
Factors Affecting Performance
• Fears stemming from a residential housing downturn persisted throughout the 12-month period. Confronted with increasing delinquency rates on subprime loans, high-profile hedge fund collapses, and a series of subprime mortgage related credit downgrades, the markets responded severely in the latter months of the reporting period. The impact was exacerbated by an influx of forced sellers looking to liquidate assets to help meet margin calls and capital withdrawals, which fueled concerns about the potential impact on the broader financial markets and economy and led to a flight to quality.
• In August, the Federal Open Market Committee (the “Fed”) lowered the discount rate by half a percent, from 6.25% to 5.75%, and began encouraging member banks to make greater use of the discount window without fear of such action being viewed negatively by the Fed. In September, the Fed elected to cut the target federal funds rate by 50 basis points to 4.75%, noting that while economic growth remained moderate, inflation risks remain and “the tightening of credit conditions has the potential to intensify the housing correction and to restrain economic growth.”
• U.S. Treasury yields fluctuated throughout the 12-month period, with the yield curve beginning the period relatively flat and ending the period steep. As the yield curve steepened, shorter dated U.S. Treasury yields experienced the greatest decline, while longer dated yields rose slightly. Within the U.S. government sector, Treasuries and agencies outperformed other investment-grade sectors.
• The mortgage market was hit by the turmoil affecting residential housing, and especially by its spillover effects on secondary market activity, most notably in the non-agency mortgage area, casting a pall across the entire sector with little regard for whether the securities or loans in question were subprime or prime. The result was a further reduction in mortgage market liquidity, as well as a sharp diminishment in the availability of non-conforming mortgage loans to the general public.
• Widening credit spreads led corporate issues to underperform other major asset classes. Within the investment-grade corporate sector, lower-rated (Baa) and higher-rated (AAA) issues outpaced the middle investment grade issues, and intermediate-term issues outperformed longer-dated issues. Within the below investment-grade corporate sector, intermediate-term and lower quality issues outpaced longer term and higher quality issues, respectively. Industrials outpaced utilities and financials, which was the corporate sector hit hardest by the recent liquidity crisis.
• A defensive interest rate positioning benefited the Portfolio’s performance for the overall period.
• A relative underweight to the corporate sector, in both investment-grade and high-yield, was additive to performance, particularly in the latter months of the reporting year when credit spreads significantly widened. Within the high-yield portion of the Portfolio, an underweight to lower-rated securities also helped boost performance.
• Although the Portfolio maintained an underweight to agency mortgage backed securities, holdings here detracted from returns as the recent turmoil in the mortgage market and drying up of liquidity hurt the performance of the sector.
Management Strategies
• Throughout the period, we employed a defensive interest rate strategy by maintaining a lower interest rate sensitivity (as measured by duration) than that of the Index. In March of this year, the position was adjusted to underweight longer dated issues and overweight intermediate dated issues. As the spread between intermediate and long date yields widened and the yield curve steepened during the summer, relative performance benefited. Subsequently, in August, we further reduced the Portfolio’s interest rate sensitivity.
• We have held an underweight corporate position for some time now, which has benefited relative performance. While we are looking for areas to take advantage of the recent spread widening and add to corporate positions, we remain cautious because we believe the credit market remains vulnerable to potential credit downgrades and/or an economic downturn.
• We maintained an underweight position to agency mortgage-backed securities, with a focus on high-coupon, slow-prepaying issues and non-agency mortgages issued to high quality borrowers.
60
| 2007 Annual Report |
| |
| September 30, 2007 |
Investment Overview (cont’d)
Core Plus Fixed Income Portfolio
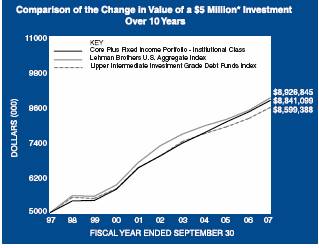
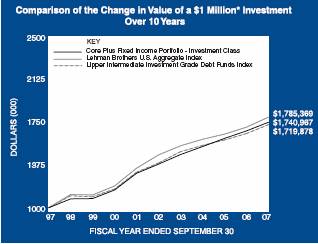
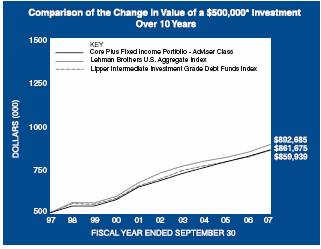
* Minimum Investment
In accordance with SEC regulations, the Portfolio’s performance shown assumes that all recurring fees (including management fees) were deducted and all dividends and distributions were reinvested. The performance of Investment Class and Adviser Class shares will vary from the Institutional Class shares based upon their different inception dates and will be negatively impacted by additional fees assessed to those classes.
Performance Compared to the Lehman Brothers U.S. Aggregate Index(1) and Lipper Intermediate Investment Grade Debt Funds Index(2)
| | Total Returns(3) | |
| | | | Average Annual | |
| | One | | Five | | Ten | | Since | |
| | Year | | Years | | Years | | Inception(7) | |
| | | | | | | | | |
Portfolio — Institutional Class(4) | | 4.77 | % | 4.96 | % | 5.87 | % | 8.71 | % |
Lehman Brothers U.S. Aggregate Index | | 5.14 | | 4.13 | | 5.97 | | 8.29 | |
Lipper Intermediate Investment Grade Debt Funds Index | | 4.69 | | 4.38 | | 5.57 | | — | |
Portfolio — Investment Class(5) | | 4.52 | | 4.79 | | 5.70 | | 6.11 | |
Lehman Brothers U.S. Aggregate Index | | 5.14 | | 4.13 | | 5.97 | | 6.24 | |
Lipper Intermediate Investment Grade Debt Funds Index | | 4.69 | | 4.38 | | 5.57 | | 5.84 | |
Portfolio — Adviser Class(6) | | 4.42 | | 4.69 | | 5.59 | | 5.85 | |
Lehman Brothers U.S. Aggregate Index | | 5.14 | | 4.13 | | 5.97 | | 6.10 | |
Lipper Intermediate Investment Grade Debt Funds Index | | 4.69 | | 4.38 | | 5.57 | | 5.71 | |
Performance data quoted represents past performance, which is no guarantee of future results, and current performance may be lower or higher than the figures shown. Performance assumes that all dividends and distributions, if any, were reinvested. For the most recent month-end performance figures, please visit www.morganstanley.com/im. Investment return and principal value will fluctuate so that Portfolio shares, when redeemed, may be worth more or less than their original cost. Total returns do not reflect the deduction of taxes that a shareholder would pay on Portfolio distributions or the redemption of Portfolio shares.
(1) | The Lehman Brothers U.S. Aggregate Index tracks the performance of all U.S. government agency and Treasury securities, investment-grade corporate debt securities, agency mortgage-backed securities, asset-backed securities and commercial mortgage-backed securities. The index is unmanaged and its returns do not include any sales charges or fees. Such costs would lower performance. It is not possible to invest directly in an index. |
(2) | The Lipper Intermediate Investment Grade Debt Funds Index is an equally weighted performance index of the largest qualifying funds (based on net assets) in the Lipper Intermediate Investment Grade Debt Funds classification. The Index, which is adjusted for capital gains distributions and income dividends, is unamanaged and should not be considered an investment. There are currently 30 funds represented in this Index. As of the date of this report, the Portfolio is in the Lipper Intermediate Investment Grade Debt Funds classification. |
(3) | Total returns for the Portfolio reflect expenses waived and/or reimbursed, if applicable, by the Adviser. Without such waivers and/or reimbursements, total returns would have been lower. Fee waivers and/or reimbursements are voluntary and the Adviser reserves the right to commence or terminate any waiver and/or reimbursement at any time. |
(4) | Commenced operations on November 14, 1984. |
(5) | Commenced operations on October 15, 1996. |
(6) | Commenced operations on November 7, 1996. |
(7) | For comparative purposes, average annual since inception returns listed for the Indexes refer to the inception date or initial offering of the respective share class of the Portfolio, not the inception of the Indexes. |
61
2007 Annual Report |
| |
September 30, 2007 |
Investment Overview (cont’d)
Core Plus Fixed Income Portfolio
Expense Examples
As a shareholder of the Portfolio, you incur two types of costs: (1) transactional costs, including redemption fees; (2) ongoing costs, including management fees, shareholder servicing fees (in the case of Investment Class and Adviser Class); and other Portfolio expenses. These examples are intended to help you understand your ongoing costs (in dollars) of investing in the Portfolio and to compare these costs with the ongoing costs of investing in other mutual funds.
The examples are based on an investment of $1,000 invested at the beginning of the six-month period ended September 30, 2007 and held for the entire six-month period.
Actual Expenses
The first line of the tables below provides information about actual account values and actual expenses. You may use the information in this line, together with the amount you invested, to estimate the expenses that you paid over the period. Simply divide your account value by $1,000 (for example, an $8,600 account value divided by $1,000 = 8.6), then multiply the result by the number in the first line under the heading entitled “Expenses Paid During Period” to estimate the expenses you paid on your account during this period.
Please note that “Expenses Paid During Period” are grossed up to reflect Portfolio expenses prior to the effect of Expense Offset (See Note E in the Notes to Financial Statements). Therefore, the annualized net expense ratios may differ from the ratio of expenses to average net assets shown in the Financial Highlights.
Hypothetical Example for Comparison Purposes
The second line of the tables below provides information about hypothetical account values and hypothetical expenses based on the Portfolio’s actual expense ratio and an assumed rate of return of 5% per year before expenses, which is not the Portfolio’s actual return. The hypothetical account values and expenses may not be used to estimate the actual ending account balance or expenses you paid for the period. You may use this information to compare the ongoing costs of investing in the Portfolio and other funds. To do so, compare this 5% hypothetical example with the 5% hypothetical examples that appear in the shareholder reports of the other funds.
Please note that the expenses shown in the table are meant to highlight your ongoing costs only and do not reflect any transactional costs, such as redemption fees. Therefore, the second line of the table is useful in comparing ongoing costs only, and will not help you determine the relative total costs of owning different funds. In addition, if these transactional costs were included, your costs would have been higher.
| | | | | | Expenses Paid | |
| | | | Ending Account | | During Period* | |
| | Beginning | | Value | | April 1, 2007 – | |
| | Account Value | | September 30, | | September 30, | |
| | April 1, 2007 | | 2007 | | 2007 | |
Institutional Class | | | | | | | |
Actual | | $ | 1,000.00 | | $ | 1,018.80 | | $ | 2.18 | |
Hypothetical (5% average annual return before expenses) | | 1,000.00 | | 1,022.91 | | 2.18 | |
Investment Class | | | | | | | |
Actual | | 1,000.00 | | 1,017.20 | | 2.93 | |
Hypothetical (5% average annual return before expenses) | | 1,000.00 | | 1,022.16 | | 2.94 | |
Adviser Class | | | | | | | |
Actual | | 1,000.00 | | 1,017.60 | | 3.44 | |
Hypothetical (5% average annual return before expenses) | | 1,000.00 | | 1,021.66 | | 3.45 | |
| | | | | | | | | | |
* Expenses are equal to Institutional Class’, Investment Class’ and Adviser Class’ annualized net expense ratios of 0.43%, 0.58% and 0.68%, respectively, multiplied by the average account value over the period, multiplied by 183/365 (to reflect the one-half year period).
Graphic Presentation of Portfolio Holdings
The following graph depicts the Portfolio’s holdings by industry and/or investment type, as a percentage of total investments.

* Industries and/or investment types which do not appear in the above graph, as well as those which represent less than 5% of total investments, if applicable, are included in the category labeled “Other”.
62
| 2007 Annual Report |
| |
| September 30, 2007 |
Portfolio of Investments
Core Plus Fixed Income Portfolio
| | Face | | | |
| | Amount | | Value | |
| | (000) | | (000) | |
Fixed Income Securities (108.2%) | | | | | |
Agency Adjustable Rate Mortgages (3.8%) | | | | | |
Federal Home Loan Mortgage Corp., | | | | | |
5.33%, 4/1/37 | | $ | 11,375 | | $ | 11,372 | |
5.63%, 3/1/37 | | 10,410 | | 10,487 | |
5.73%, 1/1/37 | | 16,602 | | 16,730 | |
Federal National Mortgage Association, | | | | | |
4.74%, 6/1/36 | | 11,500 | | 11,347 | |
7.44%, 5/1/36 | | 14,754 | | 15,099 | |
7.46%, 4/1/36 | | 9,795 | | 10,024 | |
7.47%, 7/1/36 | | 11,105 | | 11,368 | |
7.48%, 7/1/36 | | 611 | | 623 | |
7.49%, 8/1/36 | | 369 | | 378 | |
Government National Mortgage Association, | | | | | |
5.75%, 7/20/25 - 9/20/27 | | 1,017 | | 1,027 | |
6.13%, 10/20/25 - 12/20/27 | | 1,563 | | 1,579 | |
6.38%, 1/20/25 - 1/20/28 | | 9,230 | | 9,339 | |
| | | | 99,373 | |
Agency Fixed Rate Mortgages (26.5%) | | | | | |
Federal Home Loan Mortgage Corp., | | | | | |
Conventional Pools: | | | | | |
10.00%, 10/1/10 - 11/1/20 | | 1,117 | | 1,254 | |
10.50%, 8/1/09 - 10/1/20 | | 243 | | 265 | |
11.00%, 12/1/10 - 9/1/20 | | 292 | | 322 | |
11.25%, 10/1/11 - 12/1/15 | | 129 | | 140 | |
11.50%, 1/1/11 - 12/1/11 | | 2 | | 2 | |
11.75%, 4/1/19 | | 9 | | 9 | |
12.00%, 10/1/09 - 2/1/15 | | 10 | | 10 | |
13.00%, 6/1/19 | | 3 | | 3 | |
14.75%, 3/1/10 | | 1 | | 1 | |
Gold Pools: | | | | | |
6.50%, 3/1/16 - 8/1/33 | | 32,728 | | 33,298 | |
7.00%, 2/1/28 - 7/1/32 | | 2,054 | | 2,134 | |
7.50%, 8/1/17 - 10/1/32 | | 10,912 | | 11,413 | |
8.00%, 11/1/25 - 12/1/31 | | 3,176 | | 3,366 | |
8.50%, 3/1/09 - 8/1/31 | | 6,864 | | 7,359 | |
9.00%, 7/1/17 | | 486 | | 522 | |
9.50%, 1/1/21 - 12/1/22 | | 516 | | 562 | |
10.00%, 6/1/17 - 3/1/21 | | 372 | | 421 | |
10.50%, 11/1/15 - 4/1/21 | | 172 | | 188 | |
12.00%, 10/1/10 | | 4 | | 5 | |
Federal National Mortgage Association, | | | | | |
Conventional Pools: | | | | | |
6.50%, 11/1/23 - 1/1/34 | | 25,680 | | 26,337 | |
7.00%, 11/1/13 - 4/1/36 | | 52,117 | | 54,183 | |
7.50%, 11/1/22 - 8/1/37 | | 37,268 | | 38,892 | |
8.00%, 2/1/12 - 10/1/32 | | 20,098 | | 21,199 | |
8.50%, 11/1/08 - 5/1/32 | | 17,332 | | 18,631 | |
9.00%, 12/1/08 - 1/1/22 | | 961 | | 1,025 | |
9.50%, 11/1/13 - 4/1/30 | | 4,513 | | 4,906 | |
10.00%, 9/1/10 - 10/1/25 | | 802 | | 895 | |
10.50%, 5/1/12 - 7/1/25 | | 605 | | 679 | |
11.00%, 7/1/20 - 11/1/20 | | 101 | | 112 | |
11.50%, 1/1/13 - 2/1/20 | | 191 | | 215 | |
12.00%, 11/1/15 | | $ | 207 | | $ | 230 | |
12.50%, 9/1/15 - 2/1/16 | | 34 | | 37 | |
October TBA | | | | | |
5.50%, 10/25/37 | | (i)68,350 | | 66,951 | |
6.50%, 10/25/37 | | (i)27,950 | | 28,461 | |
7.00%, 10/1/36 | | (i)15,375 | | 15,870 | |
November TBA | | | | | |
5.00%, 11/25/37 | | (i)138,800 | | 132,359 | |
5.50%, 11/25/37 | | (i)202,200 | | 197,935 | |
7.00%, 11/25/37 | | (i)8,975 | | 9,255 | |
Government National Mortgage Association, | | | | | |
Various Pools: | | | | | |
9.00%, 12/15/21 - 11/15/24 | | 1,965 | | 2,122 | |
9.50%, 8/15/09 - 12/15/19 | | 1,835 | | 1,991 | |
10.00%, 11/15/09 - 1/15/26 | | 12,254 | | 13,898 | |
10.50%, 7/15/13 - 4/15/25 | | 1,400 | | 1,595 | |
11.00%, 12/15/09 - 2/15/25 | | 3,119 | | 3,511 | |
11.50%, 4/15/13 - 4/20/19 | | 88 | | 101 | |
12.00%, 3/15/11 - 11/15/19 | | 1,508 | | 1,730 | |
12.50%, 6/15/10 | | 6 | | 7 | |
| | | | 704,401 | |
Asset Backed Corporates (16.1%) | | | | | |
ACE Securities Corp., | | | | | |
5.45%, 5/25/34 | | (h)1,861 | | 1,783 | |
American Express Credit Account Master Trust, | | | | | |
5.75%, 10/15/12 | | (h)13,950 | | 13,875 | |
Argent Securities, Inc., | | | | | |
5.18%, 10/25/36 | | (h)11,177 | | 11,093 | |
Bear Stearns Asset Backed Securities, Inc., | | | | | |
5.23%, 1/25/37 | | (h)8,684 | | 8,631 | |
5.33%, 9/25/34 | | (h)1,501 | | 1,498 | |
5.35%, 3/25/35 | | (h)1,915 | | 1,911 | |
Capital Auto Receivables Asset Trust, | | | | | |
5.38%, 7/20/10 | | (h)16,250 | | 16,117 | |
5.76%, 11/15/11 | | (h)14,725 | | 14,602 | |
5.81%, 5/15/11 | | (h)21,375 | | 21,242 | |
Capital One Multi-Asset Execution Trust, | | | | | |
5.75%, 7/15/20 | | 13,450 | | 13,534 | |
Carrington Mortgage Loan Trust, | | | | | |
5.44%, 3/25/47 | | (h)8,805 | | 8,745 | |
Citibank Credit Card Issuance Trust, | | | | | |
5.20%, 3/22/12 | | (h)15,075 | | 15,015 | |
5.53%, 2/7/10 | | (h)14,100 | | 14,107 | |
6.88%, 11/16/09 | | 18,410 | | 18,454 | |
Citicorp Residential Mortgage, | | | | | |
5.21%, 9/25/36 | | (h)67 | | 66 | |
Citigroup Mortgage Loan Trust, Inc., | | | | | |
5.20%, 1/25/37 | | (h)11,005 | | 10,978 | |
5.54%, 10/25/34 | | (h)4 | | 4 | |
Conti Mortgage Home Equity Loan Trust, | | | | | |
8.10%, 8/15/25 | | 99 | | 98 | |
Countrywide Asset Backed Certificates, | | | | | |
5.28%, 7/25/25 | | (h)4,576 | | 4,561 | |
The accompanying notes are an integral part of the financial statements.
63
2007 Annual Report
September 30, 2007
Portfolio of Investments (cont’d)
Core Plus Fixed Income Portfolio
| | Face | | | |
| | Amount | | Value | |
| | (000) | | (000) | |
Asset Backed Corporates (cont’d) | | | | | |
First Franklin Mortgage Loan Asset Backed Certificates, | | | | | |
5.18%, 7/25/36 | | $ | (h)6,990 | | $ | 6,942 | |
5.20%, 2/25/36 | | (h)5,723 | | 5,700 | |
5.25%, 10/25/35 | | (h)2,803 | | 2,788 | |
Ford Credit Auto Owner Trust, | | | | | |
5.76%, 4/15/10 | | (h)25,146 | | 25,051 | |
Fremont Home Loan Owner Trust, | | | | | |
5.18%, 10/25/36 | | (h)11,872 | | 11,791 | |
GS Mortgage Securities Corp. II, | | | | | |
5.99%, 8/10/45 | | (h)15,000 | | 15,285 | |
GSAMP Trust, | | | | | |
5.20%, 1/25/37 | | (h)9,033 | | 8,982 | |
5.25%, 3/25/47 | | (h)13,422 | | 13,323 | |
Lehman XS Trust, | | | | | |
5.43%, 2/25/46 | | (e)(h)8,270 | | 8,033 | |
Long Beach Mortgage Loan Trust, | | | | | |
5.22%, 1/25/36 | | (h)20 | | 20 | |
MBNA Master Credit Card Trust USA, | | | | | |
5.90%, 8/15/11 | | 19,530 | | 19,842 | |
7.80%, 10/15/12 | | 15,505 | | 16,657 | |
Nationstar Home Equity Loan Trust, | | | | | |
5.20%, 9/25/36 | | (h)57 | | 56 | |
Novastar Home Equity Loan, | | | | | |
5.20%, 11/25/36 | | (h)45 | | 45 | |
RAAC Series, | | | | | |
5.23%, 9/25/45 | | (h)3,450 | | 3,420 | |
Residential Asset Mortgage Products, Inc., | | | | | |
5.20%, 6/25/29 | | (h)10,795 | | 10,721 | |
5.22%, 10/25/36 | | (h)8,364 | | 8,300 | |
Securitized Asset Backed Receivable, LLC Trust, | | | | | |
5.20%, 12/25/35 | | (h)2,450 | | 2,442 | |
5.21%, 11/25/36 | | (h)12,005 | | 11,890 | |
5.24%, 2/25/37 | | (h)7,773 | | 7,714 | |
5.26%, 5/25/37 | | (h)12,379 | | 12,280 | |
SLM Student Loan Trust, | | | | | |
5.35%, 10/25/14 | | (h)21,847 | | 21,853 | |
Soundview Home Equity Loan Trust, | | | | | |
5.24%, 2/25/37 | | (h)13,265 | | 13,167 | |
Structured Asset Investment Loan Trust, | | | | | |
5.20%, 3/25/36 | | (h)24 | | 24 | |
Structured Asset Securities Corp., | | | | | |
5.22%, 2/25/37 | | (h)11,191 | | 11,105 | |
5.48%, 12/25/34 | | (h)22 | | 22 | |
TXU Electric Delivery Transition Bond Co., | | | | | |
4.81%, 11/17/14 | | 3,115 | | 3,105 | |
Washington Mutual Asset Backed Certificates, | | | | | |
5.24%, 4/25/37 | | (h)11,505 | | 11,427 | |
| | | | 428,299 | |
Collateralized Mortgage Obligations — Agency Collateral Series (0.6%) | | | | | |
Federal Home Loan Mortgage Corp., | | | | | |
Inv Fl IO | | | | | |
18.50%, 11/15/07 | | $ | 3 | | $ | @— | |
Inv Fl IO PAC | | | | | |
3.85%, 3/15/08 | | 43 | | @— | |
4.97%, 2/15/08 | | 98 | | 1 | |
Inv Fl IO REMIC | | | | | |
1.75%, 8/15/30 | | 204 | | 13 | |
IO | | | | | |
6.00%, 5/1/31 | | 6,514 | | 1,478 | |
7.50%, 12/1/29 | | 378 | | 128 | |
8.00%, 1/1/28 - 6/1/31 | | 2,663 | | 670 | |
Federal National Mortgage Association, | | | | | |
Inv Fl IO | | | | | |
1.27%, 7/25/34 | | 7,971 | | 381 | |
2.94%, 10/18/30 | | 2,287 | | 156 | |
3.07%, 10/25/28 | | 5,462 | | 241 | |
3.37%, 7/25/30 | | 3,949 | | 375 | |
3.97%, 10/25/07 | | 17 | | @— | |
Inv FI IO REMIC | | | | | |
31.94%, 9/25/20 | | 53 | | 88 | |
36.84%, 9/25/22 | | 90 | | 106 | |
IO | | | | | |
1.38%, 3/25/36 | | 57,768 | | 1,228 | |
6.50%, 9/1/29 - 6/25/33 | | 8,022 | | 1,827 | |
7.00%, 4/1/32 | | 4,910 | | 1,381 | |
8.00%, 4/1/24 - 12/1/31 | | 8,835 | | 2,116 | |
8.50%, 10/1/25 | | 270 | | 77 | |
9.00%, 11/1/26 | | 427 | | 109 | |
IO PAC REMIC | | | | | |
6.00%, 8/25/32 - 7/25/33 | | 4,378 | | 910 | |
6.50%, 2/25/33 - 6/25/33 | | 16,669 | | 3,833 | |
8.00%, 9/18/27 | | 1,448 | | 354 | |
Government National Mortgage Association, | | | | | |
Inv Fl IO | | | | | |
2.40%, 5/16/31 | | 6,442 | | 645 | |
2.45%, 8/16/31 | | 2,191 | | 187 | |
2.85%, 8/16/29 | | 318 | | 35 | |
| | | | 16,339 | |
Collateralized Mortgage Obligations — Non Agency Collateral Series (7.1%) | | | | | |
Banc of America Commercial Mortgage, Inc., | | | | | |
5.84% | | (h)(o)11,000 | | 11,077 | |
5.87% | | (h)(o)7,525 | | 7,607 | |
Bear Stearns Commercial Mortgage Securities, | | | | | |
5.90%, 6/11/40 | | (h)7,925 | | 8,033 | |
Bear Stearns Structured Products, Inc., | | | | | |
IO | | | | | |
1.21%, 3/27/36 | | (e)94,647 | | 1,567 | |
1.27%, 2/27/36 | | (e)126,204 | | 2,465 | |
1.41%, 1/27/37 | | (e)174,665 | | 5,048 | |
1.45%, 1/27/36 | | (e)214,782 | | 6,712 | |
The accompanying notes are an integral part of the financial statements.
64
| 2007 Annual Report |
| |
| September 30, 2007 |
Portfolio of Investments (cont’d)
Core Plus Fixed Income Portfolio
| | Face | | | |
| | Amount | | Value | |
| | (000) | | (000) | |
Collateralized Mortgage Obligations — Non Agency Collateral Series (cont’d) | | | | | |
1.46%, 1/27/36 - 5/27/36 | | $ | (e)310,872 | | $ | 8,133 | |
2.02%, 5/25/37 | | (e)256,468 | | 8,592 | |
Citigroup Commercial Mortgage Trust, | | | | | |
5.89% | | (h)(o)9,700 | | 9,825 | |
Commercial Mortgage Pass Through Certificates, | | | | | |
6.01% | | (h)(o)11,975 | | 12,228 | |
Countrywide Alternative Loan Trust, | | | | | |
2.37%, 2/25/47 | | (e)154,565 | | 5,376 | |
IO | | | | | |
1.19%, 3/20/46 | | 54,701 | | 2,272 | |
1.51%, 3/20/47 | | 108,989 | | 5,598 | |
1.66%, 12/20/35 | | (e)(h)57,325 | | 1,527 | |
1.90%, 5/25/47 | | (e)57,362 | | 2,268 | |
2.07%, 12/20/46 | | 128,424 | | 5,739 | |
2.09%, 2/25/37 | | 61,664 | | 2,967 | |
2.14%, 12/20/35 | | (e)(h)79,610 | | 3,159 | |
Credit Suisse Mortgage Capital Certificates, | | | | | |
5.91%, 6/15/39 | | (h)10,815 | | 10,956 | |
Greenpoint Mortgage Funding Trust, | | | | | |
IO | | | | | |
0.81%, 8/25/45 - 10/25/45 | | 79,281 | | 2,267 | |
GS Mortgage Securities Corp., | | | | | |
IO | | | | | |
2.60%, 3/25/36 | | (e)(h)23,273 | | 811 | |
Harborview Mortgage Loan Trust, | | | | | |
IO | | | | | |
1.24%, 6/19/35 | | (h)44,398 | | 943 | |
1.53%, 5/19/35 | | (h)58,410 | | 1,259 | |
1.89%, 3/19/37 | | (h)51,796 | | 2,201 | |
PO | | | | | |
3/19/37 | | 29 | | 22 | |
Harborview NIM Corp., | | | | | |
IO | | | | | |
Zero Coupon, 12/15/36 | | (e)(h)6,034 | | 3,304 | |
Indymac Index Mortgage Loan Trust, | | | | | |
IO | | | | | |
1.43%, 7/25/35 | | (h)39,440 | | 1,380 | |
Kidder Peabody Mortgage Assets Trust, | | | | | |
IO | | | | | |
9.50%, 4/22/18 | | 3 | | 1 | |
Lehman Brothers Commercial Conduit Mortgage Trust, | | | | | |
6.13%, 7/15/44 | | (h)10,575 | | 10,898 | |
Lehman Brothers-UBS Commercial Mortgage Trust, | | | | | |
5.43%, 2/15/40 | | 7,425 | | 7,341 | |
5.86%, 7/17/40 | | (h)11,500 | | 11,500 | |
Residential Accredit Loans, Inc., | | | | | |
2.76%, 5/25/47 | | (e)(h)167,640 | | 7,125 | |
Wachovia Bank Commercial Mortgage Trust, | | | | | |
5.34%, 12/15/43 | | 7,725 | | 7,579 | |
6.10%, 2/15/51 | | (h)10,550 | | 10,837 | |
| | | | 188,617 | |
Finance (5.5%) | | | | | |
AIG SunAmerica Global Financing VI, | | | | | |
6.30%, 5/10/11 | | $ | (e)9,957 | | $ | 10,277 | |
American General Finance Corp., | | | | | |
4.63%, 5/15/09 - 9/1/10 | | 2,415 | | 2,390 | |
AXA Financial, Inc., | | | | | |
6.50%, 4/1/08 | | 5,450 | | 5,481 | |
Capmark Financial Group, Inc., | | | | | |
5.88%, 5/10/12 | | (e)3,680 | | 3,355 | |
6.30%, 5/10/17 | | (e)1,495 | | 1,303 | |
Catlin Insurance Co., Ltd., | | | | | |
7.25% | | (e)(h)(o)4,980 | | 4,705 | |
CIT Group, Inc., | | | | | |
3.65%, 11/23/07 | | 2,385 | | 2,374 | |
Countrywide Home Loans, Inc., | | | | | |
3.25%, 5/21/08 | | (c)3,040 | | 2,930 | |
Farmers Exchange Capital, | | | | | |
7.05%, 7/15/28 | | (c)(e)100 | | 100 | |
Farmers Insurance Exchange, | | | | | |
8.63%, 5/1/24 | | (e)6,970 | | 8,008 | |
General Electric Capital Corp., | | | | | |
4.25%, 12/1/10 | | (c)2,180 | | 2,135 | |
Goldman Sachs Capital II, | | | | | |
5.79% | | (h)(o)4,875 | | 4,618 | |
HSBC Finance Corp., | | | | | |
4.13%, 12/15/08 | | (c)10 | | 10 | |
5.88%, 2/1/09 | | (c)9,960 | | 10,039 | |
6.38%, 10/15/11 | | 60 | | 62 | |
6.75%, 5/15/11 | | 735 | | 767 | |
8.00%, 7/15/10 | | 1,100 | | 1,181 | |
JPMorgan Chase & Co., | | | | | |
6.00%, 2/15/09 | | 7,660 | | 7,764 | |
Marshall & Ilsley Bank, | | | | | |
3.80%, 2/8/08 | | 6,390 | | 6,353 | |
Mantis Reef Ltd., | | | | | |
4.69%, 11/14/08 | | (e)4,615 | | 4,593 | |
MBNA Corp., | | | | | |
5.79%, 5/5/08 | | (c)(h)4,775 | | 4,789 | |
Metlife, Inc., | | | | | |
6.13%, 12/1/11 | | 45 | | 47 | |
Nationwide Building Society, | | | | | |
4.25%, 2/1/10 | | (e)5,000 | | 4,900 | |
Platinum Underwriters Finance, Inc., | | | | | |
7.50%, 6/1/17 | | 3,015 | | 3,198 | |
Platinum Underwriters Holdings Ltd., | | | | | |
6.37%, 11/16/07 | | 2,900 | | 2,898 | |
SLM Corp., | | | | | |
4.00%, 1/15/10 | | 3,595 | | 3,370 | |
Two-Rock Pass Through Trust, | | | | | |
6.44% | | (e)(h)(o)2,930 | | 2,476 | |
Unicredit Luxembourg Finance S.A., | | | | | |
5.41%, 10/24/08 | | (e)(h)8,220 | | 8,226 | |
USB Capital IX, | | | | | |
6.19% | | (h)(o)4,795 | | 4,802 | |
The accompanying notes are an integral part of the financial statements.
65
2007 Annual Report
September 30, 2007
Portfolio of Investments (cont’d)
Core Plus Fixed Income Portfolio
| | Face | | | |
| | Amount | | Value | |
| | (000) | | (000) | |
Finance (cont’d) | | | | | |
Wachovia Capital Trust Ill, | | | | | |
5.80% | | $ | (h)(o)13,545 | | $ | 13,464 | |
Washington Mutual Bank FA, | | | | | |
5.50%, 1/15/13 | | 25 | | 24 | |
Washington Mutual Preferred Funding II, | | | | | |
6.67% | | (e)(h)(o)1,300 | | 1,122 | |
Washington Mutual, Inc., | | | | | |
8.25%, 4/1/10 | | 5,330 | | 5,626 | |
World Financial Properties, | | | | | |
6.91%, 9/1/13 | | (e)1,077 | | 1,112 | |
6.95%, 9/1/13 | | (e)6,794 | | 7,019 | |
Xlliac Global Funding, | | | | | |
4.80%, 8/10/10 | | (e)5,360 | | 5,334 | |
| | | | 146,852 | |
Industrials (5.7%) | | | | | |
America West Airlines, Inc., | | | | | |
7.10%, 4/2/21 | | 43 | | 45 | |
ArvinMeritor, Inc., | | | | | |
8.75%, 3/1/12 | | (c)3,695 | | 3,787 | |
AT&T Corp., | | | | | |
6.15%, 9/15/34 | | 3,110 | | 3,084 | |
8.00%, 11/15/31 | | 5,300 | | 6,468 | |
Brookfield Asset Management, Inc., | | | | | |
5.80%, 4/25/17 | | 1,605 | | 1,610 | |
7.13%, 6/15/12 | | 4,680 | | 5,022 | |
Caterpillar Financial Services Corp., | | | | | |
3.63%, 11/15/07 | | 1,090 | | 1,088 | |
Clorox Co., | | | | | |
5.83%, 12/14/07 | | (h)5,160 | | 5,166 | |
Comcast Cable Communications, Inc., | | | | | |
6.75%, 1/30/11 | | 2,515 | | 2,611 | |
7.13%, 6/15/13 | | 1,000 | | 1,066 | |
ConAgra Foods, Inc., | | | | | |
7.00%, 10/1/28 | | 1,505 | | 1,584 | |
8.25%, 9/15/30 | | 1,920 | | 2,275 | |
Consumers Energy Co., | | | | | |
4.00%, 5/15/10 | | 1,410 | | 1,370 | |
4.80%, 2/17/09 | | 2,100 | | 2,091 | |
Cooper Industries, Inc., | | | | | |
5.25%, 11/15/12 | | 3,490 | | 3,482 | |
CVS/Caremark Corp., | | | | | |
5.75%, 8/15/11 - 6/1/17 | | 3,365 | | 3,331 | |
6.04%, 12/10/28 | | (c)(e)4,884 | | 4,758 | |
DaimlerChrysler N.A. Holding Corp., | | | | | |
7.20%, 9/1/09 | | 25 | | 26 | |
8.50%, 1/18/31 | | (c)2,320 | | 2,884 | |
Delhaize America, Inc., | | | | | |
9.00%, 4/15/31 | | 4,841 | | 5,791 | |
Echostar DBS Corp., | | | | | |
6.38%, 10/1/11 | | 4,850 | | 4,886 | |
6.63%, 10/1/14 | | 545 | | 549 | |
FBG Finance Ltd., | | | | | |
5.13%, 6/15/15 | | (e)3,825 | | 3,613 | |
Ford Motor Credit Co., | | | | | |
7.25%, 10/25/11 | | $ | 3,985 | | $ | 3,738 | |
France Telecom S.A., | | | | | |
8.50%, 3/1/31 | | (c)4,130 | | 5,324 | |
General Mills, Inc., | | | | | |
3.88%, 11/30/07 | | 20 | | 20 | |
General Motors Acceptance Corp., | | | | | |
6.88%, 9/15/11 | | (c)7,430 | | 7,077 | |
Home Depot, Inc., (The) | | | | | |
5.82%, 12/16/09 | | (h)5,975 | | 5,900 | |
Hospira, Inc., | | | | | |
5.68%, 3/30/10 | | (h)5,425 | | 5,382 | |
ICI Wilmington, Inc., | | | | | |
4.38%, 12/1/08 | | 2,040 | | 2,031 | |
Interpublic Group of Cos., Inc., | | | | | |
6.25%, 11/15/14 | | 2,365 | | 2,129 | |
Kroger Co. (The), | | | | | |
6.40%, 8/15/17 | | (c)1,080 | | 1,103 | |
LG Electronics, Inc., | | | | | |
5.00%, 6/17/10 | | (e)2,765 | | 2,738 | |
Miller Brewing Co., | | | | | |
4.25%, 8/15/08 | | (e)3,885 | | 3,847 | |
Pilgrim’s Pride Corp., | | | | | |
7.63%, 5/1/15 | | (c)2,540 | | 2,591 | |
Sprint Capital Corp., | | | | | |
8.75%, 3/15/32 | | 845 | | 972 | |
Systems 2001 Asset Trust, LLC, | | | | | |
6.66%, 9/15/13 | | (e)5,196 | | 5,477 | |
Telecom Italia Capital S.A., | | | | | |
4.00%, 11/15/08 - 1/15/10 | | 5,345 | | 5,207 | |
Telefonica Europe B.V., | | | | | |
8.25%, 9/15/30 | | (c)4,380 | | 5,250 | |
Time Warner, Inc., | | | | | |
5.73%, 11/13/09 | | (h)7,390 | | 7,307 | |
Union Pacific Corp., | | | | | |
5.45%, 1/31/13 | | 6,135 | | 6,095 | |
6.63%, 2/1/08 | | 1,225 | | 1,229 | |
6.79%, 11/9/07 | | 1,020 | | 1,021 | |
Verizon New England, Inc., | | | | | |
6.50%, 9/15/11 | | 2,100 | | 2,178 | |
Viacom, Inc., | | | | | |
6.88%, 4/30/36 | | 3,720 | | 3,716 | |
WellPoint, Inc., | | | | | |
3.75%, 12/14/07 | | 1,010 | | 1,006 | |
Yum! Brands, Inc., | | | | | |
8.88%, 4/15/11 | | 3,140 | | 3,506 | |
| | | | 151,431 | |
Mortgages — Other (31.0%) | | | | | |
American Express Co., | | | | | |
9.63%, 12/1/12 | | (d)(k)22 | | 22 | |
American Home Mortgage Assets, | | | | | |
5.26%, 3/25/47 | | (h)14,461 | | 14,094 | |
5.32%, 10/25/46 - 6/25/47 | | (h)40,772 | | 39,577 | |
5.36%, 5/25/46 - 9/25/46 | | (h)19,746 | | 19,457 | |
The accompanying notes are an integral part of the financial statements.
66
| 2007 Annual Report |
| |
| September 30, 2007 |
Portfolio of Investments (cont’d)
Core Plus Fixed Income Portfolio
| | Face | | | |
| | Amount | | Value | |
| | (000) | | (000) | |
Mortgages — Other (cont’d) | | | | | |
5.37%, 6/25/47 | | $ | (h)2,952 | | $ | 2,805 | |
5.43%, 6/25/47 | | (h)8,570 | | 7,680 | |
American Home Mortgage Investment Trust, | | | | | |
5.32%, 5/25/47 | | 17,829 | | 17,508 | |
American Housing Trust, | | | | | |
9.55%, 9/25/20 | | 29 | | 29 | |
Banc of America Funding Corp., | | | | | |
5.85%, 9/20/35 | | (h)4,213 | | 4,170 | |
Bear Stearns Mortgage Funding Trust, | | | | | |
5.30%, 3/25/37 | | (h)9,911 | | 9,687 | |
5.33%, 9/25/36 | | (h)93 | | 91 | |
5.34%, 12/25/36 | | (h)16,723 | | 16,354 | |
5.38%, 7/25/36 | | (h)12,165 | | 11,489 | |
Bear Stearns Structured Products, | | | | | |
6.50%, 3/27/36 - 5/27/36 | | (e)2,641 | | 2,461 | |
Countrywide Alternative Loan Trust, | | | | | |
5.30%, 5/25/47 | | (h)16,596 | | 16,207 | |
5.32%, 10/25/46 | | (h)16,455 | | 16,102 | |
5.36%, 7/25/46 - 6/25/47 | | (h)25,158 | | 24,462 | |
5.40%, 7/25/46 | | 87 | | 85 | |
5.65%, 5/20/46 | | (h)45 | | 45 | |
5.76%, 11/20/35 | | (h)3,530 | | 3,514 | |
5.77%, 5/20/46 | | (h)12,759 | | 12,435 | |
5.79%, 8/25/35 | | (h)2,908 | | 2,891 | |
6.68%, 2/25/36 | | (h)67 | | 66 | |
Countrywide Home Loan Mortgage Pass Through Trust, | | | | | |
5.40%, 4/25/46 | | (h)7,190 | | 7,110 | |
5.43%, 4/25/36 | | (h)65 | | 64 | |
Deutsche ALT-A Securities, Inc., Alternate Loan Trust, | | | | | |
5.28%, 2/25/47 | | (h)18,318 | | 17,914 | |
5.81%, 2/25/47 | | (h)6,978 | | 6,594 | |
Deutsche ALT-A Securities, Inc., NIM Trust, | | | | | |
6.75%, 2/25/47 | | (e)3,538 | | 3,402 | |
Downey Savings & Loan Association Mortgage Loan Trust, | | | | | |
5.70%, 11/19/37 | | (h)13,700 | | 13,417 | |
5.92%, 4/19/46 | | (h)8,818 | | 8,724 | |
Federal Home Loan Mortgage Corp., | | | | | |
5.85%, 10/1/36 | | (h)13,428 | | 13,572 | |
PAC | | | | | |
9.50%, 4/15/20 | | 3 | | 3 | |
Federal National Mortgage Association, | | | | | |
Conventional Pool: | | | | | |
7.00%, 9/25/32 | | 3,213 | | 3,359 | |
Greenpoint Mortgage Funding Trust, | | | | | |
5.30%, 4/25/47 | | (h)13,762 | | 13,460 | |
5.45%, 3/25/36 | | (h)11,032 | | 10,843 | |
GSR Mortgage Loan Trust, | | | | | |
5.32%, 8/25/46 | | (h)111 | | 109 | |
5.39%, 8/25/46 | | (h)14,439 | | 14,040 | |
Harborview Mortgage Loan Trust, | | | | | |
5.40%, 7/21/36 | | (h)12,658 | | 12,397 | |
5.71%, 11/19/36 | | (h)15,451 | | 15,151 | |
5.59%, 1/19/38 | | (h)3,771 | | 3,754 | |
5.63%, 3/19/37 | | (h)9,169 | | 8,940 | |
5.65%, 3/19/38 | | $ | (h)11,625 | | $ | 11,343 | |
5.68%, 11/19/36 | | (h)19,685 | | 19,269 | |
5.69%, 1/19/38 | | (h)17,036 | | 16,642 | |
5.70%, 9/19/36 - 3/19/38 | | (h)18,558 | | 18,132 | |
5.73%, 7/19/46 | | (h)9,763 | | 9,505 | |
5.74%, 11/19/36 - 3/19/37 | | (h)5,231 | | 5,104 | |
5.75%, 10/19/37 | | (h)11,160 | | 10,949 | |
5.84%, 1/19/36 | | (h)48 | | 47 | |
5.88%, 11/19/35 | | (h)5,564 | | 5,422 | |
Harborview NIM Corp., | | | | | |
6.40%, 3/19/37 | | (e)2,658 | | 2,638 | |
6.41%, 3/19/38 | | (e)4,454 | | 4,432 | |
Indymac Index Mortgage Loan Trust, | | | | | |
5.23%, 2/25/37 | | (h)11,820 | | 11,735 | |
5.51%, 10/25/36 | | (h)7,082 | | 6,906 | |
5.25%, 7/25/46 | | (h)16,235 | | 16,135 | |
5.34%, 11/25/36 | | (h)16,794 | | 16,421 | |
5.38%, 6/25/46 | | (h)90 | | 87 | |
5.41%, 7/25/35 | | (h)2,899 | | 2,818 | |
JPMorgan Chase Commercial Mortgage Securities Corp., | | | | | |
5.44%, 6/12/47 | | 10,700 | | 10,573 | |
5.94% | | (h)(o)10,700 | | 10,842 | |
6.01% | | (h)(o)15,650 | | 15,956 | |
Lehman XS Net Interest Margin Notes, | | | | | |
6.25%, 6/28/46 | | 1,311 | | 1,305 | |
Luminent Mortgage Trust, | | | | | |
5.33%, 10/25/46 | | (h)13,549 | | 13,256 | |
5.35%, 12/25/36 | | (h)17,739 | | 17,259 | |
5.37%, 4/25/36 | | (h)7,455 | | 7,304 | |
5.41%, 2/25/46 | | (h)62 | | 61 | |
Mastr Adjustable Rate Mortgages Trust, | | | | | |
5.24%, 5/25/47 | | (h)4,620 | | 4,607 | |
5.38%, 4/25/46 | | (h)52 | | 51 | |
Merrill Lynch Mortgage Investors, Inc., | | | | | |
5.25%, 8/25/35 | | (h)747 | | 748 | |
Mid-State Trust, | | | | | |
8.33%, 4/1/30 | | 75 | | 78 | |
Pelican Homestead Savings Association, | | | | | |
9.36%, 10/1/07 | | (d)(k)18 | | 18 | |
Residential Accredit Loans, Inc., | | | | | |
2.80%, 3/25/47 | | (e)96,296 | | 3,852 | |
5.27%, 2/25/37 | | (h)12,977 | | 12,664 | |
5.29%, 2/25/37 - 3/25/47 | | (h)39,018 | | 38,180 | |
5.32%, 12/25/36 | | (h)14,502 | | 14,248 | |
5.33%, 6/25/37 | | (h)28,308 | | 27,729 | |
5.36%, 6/25/46 | | (h)101 | | 99 | |
5.39%, 2/25/46 | | (h)4,450 | | 4,368 | |
5.40%, 2/25/46 | | (h)3,435 | | 3,392 | |
Ryland Acceptance Corp. IV, | | | | | |
6.65%, 7/1/11 | | 233 | | 232 | |
Structured Adjustable Rate Mortgage Loan Trust, | | | | | |
5.39%, 5/25/36 | | 4,495 | | 4,432 | |
5.43%, 9/25/34 | | (h)1,074 | | 1,073 | |
Structured Asset Mortgage Investments, Inc., | | | | | |
5.32%, 2/25/36 | | (h)5,207 | | 5,109 | |
The accompanying notes are an integral part of the financial statements.
67
2007 Annual Report
September 30, 2007
Portfolio of Investments (cont’d)
Core Plus Fixed Income Portfolio
| | Face | | | |
| | Amount | | Value | |
| | (000) | | (000) | |
Mortgages — Other (cont’d) | | | | | |
5.33%, 10/25/36 | | $ | (h)88 | | $ | 87 | |
5.36%, 8/25/36 | | (h)11,167 | | 10,948 | |
5.40%, 4/25/36 | | (h)13,044 | | 12,894 | |
5.41%, 7/25/36 | | (h)6,551 | | 6,382 | |
Washington Mutual Alternative Mortgage Pass Through Certificates, | | | | | |
5.32%, 7/25/46 | | (h)48 | | 48 | |
5.43%, 10/25/46 | | (h)9,013 | | 8,573 | |
5.92%, 4/25/46 | | (h)10,398 | | 10,142 | |
5.94%, 8/25/46 | | (h)10,250 | | 10,004 | |
Washington Mutual MSC Mortgage Pass Through Certificates, | | | | | |
5.33%, 12/25/46 | | (h)10,944 | | 10,738 | |
Washington Mutual, Inc., | | | | | |
5.21%, 6/25/46 | | (h)7 | | 7 | |
5.38%, 11/25/45 - 12/25/45 | | (h)6,870 | | 6,839 | |
5.39%, 10/25/45 | | (h)1,799 | | 1,795 | |
5.40%, 4/25/45 | | (h)45 | | 45 | |
5.42%, 8/25/45 | | (h)818 | | 816 | |
5.49%, 7/25/45 | | (h)33 | | 32 | |
5.92%, 5/25/46 | | (h)6,732 | | 6,459 | |
Zuni Mortgage Loan Trust, | | | | | |
5.26%, 8/25/36 | | (h)6,770 | | 6,719 | |
| | | | 821,633 | |
Sovereign (1.4%) | | | | | |
Government of Argentina, | | | | | |
5.83%, 12/31/33 | | 4,113 | | 3,706 | |
Government of Japan, | | | | | |
0.30%, 3/20/08 | | JPY | 3,045,000 | | 26,474 | |
United Mexican States, | | | | | |
9.50%, 12/18/14 | | MXN | 75,635 | | 7,547 | |
| | | | 37,727 | |
U.S. Treasury Securities (8.6%) | | | | | |
U.S. Treasury Bonds, | | | | | |
4.50%, 2/15/36 | | $ | (c)10,550 | | 10,005 | |
5.38%, 2/15/31 | | (c)38,800 | | 41,546 | |
5.50%, 8/15/28 | | (c)75 | | 81 | |
6.13%, 8/15/29 | | (c)94,745 | | 110,556 | |
6.38%, 8/15/27 | | (c)15,140 | | 17,971 | |
U.S. Treasury Notes, | | | | | |
2.63%, 5/15/08 | | (c)45,000 | | 44,592 | |
4.25%, 8/15/13 - 11/15/13 | | 3,045 | | 3,039 | |
| | | | 227,790 | |
Utilities (1.9%) | | | | | |
Ameren, | | | | | |
6.40%, 6/15/17 | | 3,495 | | 3,608 | |
Appalachian Power Co., | | | | | |
5.65%, 8/15/12 | | 1,395 | | 1,406 | |
Arizona Public Service Co., | | | | | |
5.80%, 6/30/14 | | 3,935 | | 3,901 | |
CenterPoint Energy Resources Corp., | | | | | |
6.25%, 2/1/37 | | 1,130 | | 1,113 | |
7.88%, 4/1/13 | | (c)730 | | 798 | |
Consolidated Natural Gas Co., | | | | | |
6.25%, 11/1/11 | | $ | 1,760 | | $ | 1,811 | |
Detroit Edison Co., | | | | | |
6.13%, 10/1/10 | | 2,590 | | 2,677 | |
Entergy Gulf States, Inc., | | | | | |
3.60%, 6/1/08 | | 1,705 | | 1,679 | |
5.98%, 12/1/09 | | (h)1,995 | | 1,980 | |
6.47%, 12/8/08 | | (e)(h)4,225 | | 4,241 | |
Kinder Morgan Finance Co., | | | | | |
5.70%, 1/5/16 | | (c)3,970 | | 3,628 | |
NiSource Finance Corp., | | | | | |
6.06%, 11/23/09 | | (h)2,785 | | 2,764 | |
7.88%, 11/15/10 | | 3,590 | | 3,845 | |
Ohio Power Co., | | | | | |
6.00%, 6/1/16 | | 3,605 | | 3,628 | |
Plains All American Pipeline, LP, | | | | | |
6.70%, 5/15/36 | | (c)3,635 | | 3,651 | |
PSEG Energy Holdings, LLC, | | | | | |
8.63%, 2/15/08 | | (c)2,547 | | 2,573 | |
Public Service Electric & Gas Co., | | | | | |
5.00%, 1/1/13 | | 20 | | 20 | |
Texas Eastern Transmission, LP, | | | | | |
7.00%, 7/15/32 | | 2,295 | | 2,431 | |
TXU Energy Co., LLC, | | | | | |
7.00%, 3/15/13 | | 3,155 | | 3,469 | |
Wisconsin Electric Power Co., | | | | | |
3.50%, 12/1/07 | | 565 | | 563 | |
| | | | 49,786 | |
Total Fixed Income Securities (Cost $2,923,428) | | | | 2,872,248 | |
| | | | | |
| | No. of | | | |
| | Contracts | | | |
Put Options Purchased (0.0%) | | | | | |
90 Day EuroDollar | | | | | |
12/07 @ 94.75 | | (a)6,220 | | 661 | |
3/08 @ 94.75 | | (a)2,158 | | 236 | |
Total Put Options Purchased (Cost $1,824) | | | | 897 | |
| | | | | |
| | Shares | | | |
Preferred Stock (0.4%) | | | | | |
Mortgages — Other (0.4%) | | | | | |
Home Ownership Funding Corp., | | | | | |
13.33% (Cost $8,816) | | (e)65 | | 9,673 | |
| | | | | |
| | Face | | | |
| | Amount | | | |
| | (000) | | | |
Short-Term Investments (11.0%) | | | | | |
Short-Term Debt Securities held as Collateral on Loaned Securities (2.2%) | | | | | |
AIG Match Funding Corp., | | | | | |
5.73%, 10/17/07 | | $ | (h)2,377 | | 2,377 | |
Alliance & Leicester plc, | | | | | |
5.83%, 10/9/07 | | (h)1,698 | | 1,698 | |
Bancaja, | | | | | |
5.36%, 10/19/07 | | 849 | | 849 | |
Bank of New York Co., Inc., | | | | | |
5.82%, 10/10/07 | | (h)849 | | 849 | |
| | | | | | | | | |
The accompanying notes are an integral part of the financial statements.
68
| 2007 Annual Report |
| |
| September 30, 2007 |
| |
Portfolio of Investments (cont’d) | |
| |
Core Plus Fixed Income Portfolio | |
| | Face | | | |
| | Amount | | Value | |
| | (000) | | (000) | |
Short-Term Debt Securities held as Collateral on Loaned Securities (cont’d) | | | | | |
BASF AG, | | | | | |
5.36%, 10/22/07 | | $ | (h)849 | | $ | 849 | |
BNP Paribas plc, | | | | | |
5.50%, 11/19/07 | | (h)1,698 | | 1,698 | |
CAM US Finance S.A. Unipersonal, | | | | | |
5.37%, 10/3/07 | | 3,395 | | 3,395 | |
Canadian Imperial Bank of Commerce, New York, | | | | | |
4.92%, 10/1/07 | | (h)1,698 | | 1,698 | |
CC USA, Inc., | | | | | |
4.68%, 10/1/07 | | (h)848 | | 848 | |
CIT Group Holdings, | | | | | |
5.38%, 10/18/07 | | (h)3,056 | | 3,056 | |
Citigroup Global Markets Holdings, Inc., | | | | | |
5.26%, 10/1/07 | | 6,728 | | 6,728 | |
Credit Suisse First Boston, New York, | | | | | |
4.82%, 10/1/07 | | (h)1,698 | | 1,698 | |
First Tennessee Bank, | | | | | |
5.76%, 10/17/07 | | (h)849 | | 849 | |
5.77%, 10/17/07 | | (h)3,395 | | 3,395 | |
Goldman Sachs Group, Inc., | | | | | |
5.37%, 10/1/07 | | 849 | | 849 | |
5.82%, 10/15/07 | | (h)1,596 | | 1,596 | |
HSBC Finance Corp., | | | | | |
5.81%, 10/9/07 | | (h)849 | | 849 | |
IBM Corp., | | | | | |
5.79%, 10/9/07 | | 3,395 | | 3,395 | |
Macquarie Bank Ltd., | | | | | |
5.17%, 10/22/07 | | (h)1,698 | | 1,698 | |
Marshall & Ilsley Bank, | | | | | |
5.37%, 12/17/07 | | 1,702 | | 1,702 | |
Metropolitan Life Global Funding, | | | | | |
5.13%, 10/22/07 | | (h)2,546 | | 2,546 | |
National Bank of Canada, | | | | | |
5.66%, 10/2/07 | | (h)3,395 | | 3,395 | |
National Rural Utilities Cooperative Finance Corp., | | | | | |
5.73%, 10/1/07 | | (h)3,395 | | 3,395 | |
Nationwide Building Society, | | | | | |
5.28%, 12/28/07 | | 1,969 | | 1,969 | |
Societe Generale, New York, | | | | | |
5.11%, 10/31/07 | | (h)4,074 | | 4,074 | |
Unicredito Delaware, Inc., | | | | | |
5.77%, 10/15/07 | | (h)1,867 | | 1,867 | |
Unicredito Italiano Bank (Ireland) plc, | | | | | |
5.84%, 10/9/07 | | (h)1,188 | | 1,188 | |
| | | | 58,510 | |
| | | | | |
| | Shares | | | |
Investment Company (8.7%) | | | | | |
Morgan Stanley Institutional Liquidity Money Market Portfolio — Institutional Class | | (p)230,944,934 | | 230,945 | |
| | | | | |
| | Face | | | |
| | Amount | | Value | |
| | (000) | | (000) | |
U.S. Treasury Security (0.1%) | | | | | |
U.S. Treasury Bill | | | | | |
4.85%, 1/10/08 | | $ | (c)(j)(r)2,810 | | $ | 2,780 | |
Total Short-Term Investments (Cost $292,229) | | | | 292,235 | |
Total Investments (119.6%) (Cost $3,226,297) — Including $207,604 of Securities Loaned | | | | 3,175,053 | |
Liabilities in Excess of Other Assets (-19.6%) | | | | (519,606 | ) |
Net Assets(100%) | | | | $ | 2,655,447 | |
| | | | | | | | |
(a) | | Non-income producing security. |
(c) | | All or a portion of security on loan at September 30, 2007. |
(d) | | Security was valued at fair value — At September 30, 2007, the Portfolio held $40,000 of fair valued securities, representing less than 0.05% of net assets. |
(e) | | 144A security — Certain conditions for public sale may exist. Unless otherwise noted, these securities are deemed to be liquid. |
(h) | | Variable/Floating Rate Security — Interest rate changes on these instruments are based on changes in a designated base rate. The rates shown are those in effect on September 30, 2007. |
(i) | | Security is subject to delayed delivery. |
(j) | | All or a portion of the security was pledged to cover margin requirements for futures contracts. |
(k) | | Security has been deemed illiquid at September 30, 2007. |
(o) | | Perpetual — Security does not have a predetermined maturity date. Rate for this security is fixed for a period of time then reverts to a floating rate. The interest rate shown is the rate in effect at September 30, 2007. |
(p) | | See Note F within the Notes to Financial Statements regarding investment in Morgan Stanley Institutional Liquidity Government Portfolio — Institutional Class, Morgan Stanley Institutional Liquidity Money Market Portfolio -— Institutional Class and/or Morgan Stanley Institutional Liquidity Tax-Exempt Portfolio — Institutional Class. |
(r) | | Rate shown is the Yield to Maturity at September 30, 2007. |
@ | | Value is less than $500. |
Inv Fl | | Inverse Floating Rate — Interest rate fluctuates with an inverse relationship to an associated interest rate. Indicated rate is the effective rate at September 30, 2007. |
IO | | Interest Only |
JPY | | Japanese Yen |
MXN | | Mexican Peso |
PAC | | Planned Amortization Class |
PO | | Principal Only |
REMIC | | Real Estate Mortgage Investment Conduit |
TBA | | To Be Announced |
Foreign Currency Exchange Contract Information:
The Portfolio had the following foreign currency exchange contract(s) open at period end:
| | | | | | | | | | Net | |
Currency | | | | | | In | | | | Unrealized | |
to | | | | | | Exchange | | | | Appreciation | |
Deliver | | Value | | Settlement | | For | | Value | | (Depreciation) | |
(000) | | (000) | | Date | | (000) | | (000) | | (000) | |
EUR | 19,754 | | $ | 28,196 | | 11/14/07 | | USD | 27,094 | | $ | 27,094 | | $ | (1,102 | ) |
| | | | | | | | | | | | | | | | |
EUR — Euro
USD — United States Dollar
The accompanying notes are an integral part of the financial statements.
69
2007 Annual Report
September 30, 2007
Portfolio of Investments (cont’d)
Core Plus Fixed Income Portfolio
Futures Contracts:
The Portfolio had the following futures contract(s) open at period end:
| | | | | | | | Net | |
| | | | | | | | Unrealized | |
| | Number | | | | | | Appreciation | |
| | of | | Value | | Expiration | | (Depreciation) | |
| | Contracts | | (000) | | Date | | (000) | |
Long: | | | | | | | | | |
U.S. Treasury | | | | | | | | | |
2 yr. Note | | 626 | | $ | 129,611 | | Dec-07 | | $ | 208 | |
U.S. Treasury | | | | | | | | | |
5 yr. Note | | 2,968 | | 317,669 | | Dec-07 | | 1,932 | |
EuroDollar | | | | | | | | | |
CME | | 617 | | 146,777 | | Dec-07 | | 751 | |
EuroDollar | | | | | | | | | |
CME | | 617 | | 147,278 | | Mar-08 | | 1,168 | |
EuroDollar | | | | | | | | | |
CME | | 617 | | 147,502 | | Jun-08 | | 1,322 | |
EuroDollar | | | | | | | | | |
CME | | 617 | | 147,602 | | Sep-08 | | 1,406 | |
EuroDollar | | | | | | | | | |
CME | | 617 | | $ | 147,594 | | Dec-08 | | $ | 1,434 | |
EuroDollar | | | | | | | | | |
CME | | 617 | | 147,486 | | Mar-09 | | 1,403 | |
EuroDollar | | | | | | | | | |
CME | | 617 | | 147,309 | | Jun-09 | | (143 | ) |
Short: | | | | | | | | | |
U.S. Treasury | | | | | | | | | |
10 yr. Note | | 518 | | 56,608 | | Dec-07 | | 157 | |
U.S. Treasury | | | | | | | | | |
Long Bond | | 3,502 | | 389,926 | | Dec-07 | | 739 | |
| | | | | | | | $ | 10,377 | |
Credit Default Swap Contracts
The Portfolio had the following credit default swap agreement(s) open at period end:
| | | | | | | | | | Unrealized | |
| | | | Notional | | | | | | Appreciation | |
| | Buy/Sell | | Amount | | Pay/Receive | | Termination | | (Depreciation) | |
Swap Counterparty and Reference Obligation | | Protection | | (000) | | Fixed Rate | | Date | | (000) | |
Bank of America | | Buy | | $ | 7,950 | | 1.19 | % | 03/20/12 | | | $ | (125 | ) |
The Gap, Inc., 8.80%, 12/15/08 | | | | | | | | | | | | |
Citigroup | | Buy | | 8,000 | | 0.43 | | 03/20/12 | | | (15 | ) |
Tyco International Ltd., Zero Coupon, 11/17/20 | | | | | | | | | | | | |
Goldman Sachs | | Buy | | 7,800 | | 0.80 | | 03/20/11 | | | (129 | ) |
Tyco International Ltd., 6.38%, 10/15/11 | | | | | | | | | | | | |
Goldman Sachs | | Buy | | 40,500 | | 0.75 | | 06/20/11 | | | 754 | |
Dow Jones CDX North America Investment Grade High Volatility Index, Series 7 | | | | | | | | | | | | |
Goldman Sachs | | Buy | | 53,000 | | 0.75 | | 12/20/11 | | | 1,200 | |
Dow Jones CDX North America Investment Grade High Volatility Index, Series 7 | | | | | | | | | | | | |
Goldman Sachs | | Buy | | 13,000 | | 0.12 | | 12/20/11 | | | 65 | |
The Hartford Financial Services Group, Inc., 4.75%, 3/1/14 | | | | | | | | | | | | |
Goldman Sachs | | Buy | | 4,240 | | 0.15 | | 12/20/11 | | | 23 | |
Motorola, Inc., 6.50%, 9/1/25 | | | | | | | | | | | | |
Goldman Sachs | | Buy | | 8,800 | | 0.16 | | 12/20/11 | | | 46 | |
Motorola, Inc., 6.50%, 9/1/25 | | | | | | | | | | | | |
Goldman Sachs | | Buy | | 13,200 | | 0.10 | | 03/20/12 | | | 74 | |
The Chubb Corp., 6.00%, 11/15/11 | | | | | | | | | | | | |
Goldman Sachs | | Buy | | 6,650 | | 0.22 | | 03/20/12 | | | (8 | ) |
Dell, Inc., 7.10%, 4/15/28 | | | | | | | | | | | | |
JPMorgan Chase | | Buy | | 5,390 | | 0.65 | | 03/20/11 | | | (92 | ) |
Tyco International Ltd., 2.75%, 1/15/18 | | | | | | | | | | | | |
JPMorgan Chase | | Buy | | 2,330 | | 1.18 | | 06/20/14 | | | 24 | |
Belo Corp., 8.00%, 11/1/08 | | | | | | | | | | | | |
JPMorgan Chase | | Buy | | 6,300 | | 1.30 | | 06/20/14 | | | 22 | |
Belo Corp., 8.00%, 11/1/08 | | | | | | | | | | | | |
Lehman Brothers | | Buy | | 6,500 | | 0.20 | | 12/20/11 | | | 5 | |
Union Pacific Corp., 6.13%, 1/15/12 | | | | | | | | | | | |
| | | | | | | | | | $ | 1,844 | |
| | | | | | | | | | | | | | |
The accompanying notes are an integral part of the financial statements.
70
| 2007 Annual Report |
| |
| September 30, 2007 |
| |
Portfolio of Investments (cont’d) | |
| |
Core Plus Fixed Income Portfolio | |
The Portfolio had the following interest rate swap agreement(s) open at period end:
| | | | | | | | | | | | Unrealized | |
| | | | | | | | | | Notional | | Appreciation | |
| | Floating Rate | | Pay/Receive | | Fixed | | Termination | | Amount | | (Depreciation) | |
Swap Counterparty | | Index | | Floating Rate | | Rate | | Date | | (000) | | (000) | |
Citigroup | | 3 Month LIBOR | | Pay | | 5.33 | % | 5/22/17 | | | $ | 55,500 | | $ | 1,319 | |
| | 3 Month LIBOR | | Pay | | 5.37 | | 5/23/17 | | | 65,500 | | 1,739 | |
| | 3 Month LIBOR | | Pay | | 5.41 | | 5/25/17 | | | 26,200 | | 788 | |
| | 3 Month LIBOR | | Pay | | 5.44 | | 5/29/17 | | | 78,200 | | 2,514 | |
| | 3 Month LIBOR | | Pay | | 5.02 | | 9/11/17 | | | 40,000 | | (624 | ) |
| | 3 Month LIBOR | | Receive | | 5.29 | | 9/28/17 | | | 45,000 | | (298 | ) |
Deutsche Bank | | 3 Month LIBOR | | Pay | | 5.35 | | 5/24/17 | | | 75,500 | | 1,886 | |
| | 3 Month LIBOR | | Pay | | 5.39 | | 5/25/17 | | | 95,775 | | 2,693 | |
| | 3 Month LIBOR | | Pay | | 5.43 | | 5/29/17 | | | 101,350 | | 3,170 | |
JPMorgan Chase | | 3 Month LIBOR | | Pay | | 5.37 | | 5/23/17 | | | 22,700 | | 612 | |
| | 3 Month LIBOR | | Pay | | 5.34 | | 5/24/17 | | | 50,000 | | 1,213 | |
| | 3 Month LIBOR | | Pay | | 5.08 | | 9/11/17 | | | 88,500 | | (907 | ) |
| | 3 Month LIBOR | | Pay | | 5.16 | | 9/20/17 | | | 37,000 | | (149 | ) |
| | 3 Month LIBOR | | Receive | | 5.23 | | 9/27/17 | | | 46,000 | | (107 | ) |
| | 3 Month LIBOR | | Receive | | 5.30 | | 9/28/17 | | | 47,000 | | (353 | ) |
Lehman Brothers | | 3 Month LIBOR | | Pay | | 5.34 | | 5/24/17 | | | 24,500 | | 587 | |
| | 3 Month LIBOR | | Pay | | 5.40 | | 5/25/17 | | | 25,000 | | 731 | |
| | | | | | | | | | | | $ | 14,814 | |
| | | | | | | | | | | | | | | | |
CME | | Chicago Mercantile Exchange |
LIBOR — | | London Inter Bank Offer Rate |
The accompanying notes are an integral part of the financial statements.
71
2007 Annual Report
September 30, 2007
Investment Overview (unaudited)
High Yield Portfolio
The High Yield Portfolio seeks above-average total return over a market cycle of three to five years. The Portfolio invests primarily in high yield securities (commonly referred to as “junk bonds”). The Portfolio also may invest in investment grade fixed income securities, including U.S. government, corporate and mortgage securities. The Portfolio may invest to a limited extent in foreign fixed income securities, including emerging market securities. The Portfolio will ordinarily seek to maintain an average weighted maturity in excess of five years, although there is no minimum or maximum maturity for any individual security. The Portfolio may invest in asset-backed securities and may use futures, options, forwards, collateralized mortgage obligations, swaps, options on swaps and other derivatives. High yield fixed income securities represent a much greater risk of default and tend to be more volatile than higher rated bonds.
Performance
For the fiscal year ended September 30, 2007, the Portfolio’s Institutional Class had a total return based on net asset value and reinvestment of distributions per share of 7.38%, net of fees. The Portfolio’s Institutional Class underperformed against its benchmark the Lehman Brothers U.S. Corporate High Yield - 2% Issuer Cap Index (the “Index”) which returned 7.61%.
Factors Affecting Performance
• Strong fundamental and technical factors supported the high yield market for much of the 12-month reporting period, helping it to outperform Treasuries for the first eight months. In June, however, a combination of factors including the contagion effect of the troubled subprime mortgage market, increased market volatility, falling equity prices, and a heavy new-issue calendar put downward pressure on the high yield market, and Treasuries rallied. In August, however, the high yield market rebounded and in September, outperformed Treasuries. The strong returns of the high yield market in the last month of the period were fueled in part by the aggressive 50 basis point cut in the target federal funds rate mid-month, which helped boost investor confidence in the market and willingness to take on more risk.
• High yield credit spreads tightened throughout much of the period, widened in July and August, then tightened again in September to end the period 434 basis points over Treasuries. The lower-quality tiers of the high yield market turned in the best performance through June, with CCC rated bonds outperforming higher-quality issues. In July and August, higher-quality B and BB rated bonds outperformed but a renewed appetite for risk in September led CCC rated issues to once again outperform higher-rated issues.
• New-issue supply was strong overall, particularly in May and June when monthly issuance reached approximately $25 billion. The new-issue market essentially closed in July and August when only $5 billion and $3 billion, respectively, came to market but reopened slightly in September.
• The most significant driver of the Portfolio’s performance during the period was its defensive positioning in terms of credit quality. We have long been of the opinion that high yield credit spreads are too tight, and have continued to position the Portfolio defensively with an emphasis on higher-quality securities. Although this stance detracted from performance when the lowest-quality tiers of the market outperformed, it was beneficial when the market’s flight to quality during the summer months boosted the performance of higher-rated bonds.
• The Portfolio’s interest rate positioning was also somewhat defensive in that its duration was below that of the Index. The lower relative sensitivity to interest rate changes had a small positive impact on performance early in the reporting period as interest rates remained fairly stable, but dampened performance somewhat in the first calendar quarter of the year when rates declined. In April, however, we repositioned the Portfolio to benefit from a steepening yield curve, while still maintaining a slightly shorter duration. This stance was additive to returns in the latter months of the period when the flight to quality forced yields lower on the front end of the curve and the curve steepened.
• Strong security selection in various sectors, including energy and paper & forest products, added to relative returns, as well as an underweight to the building product/home builders sector. Conversely, security selection in the auto/vehicle parts, financials, and gaming/lodging sectors and an underweight to the utilities sector detracted from overall performance.
Management Strategies
• In our opinion, while current spreads are more realistic, they still remain tighter than long-term historical averages and therefore, unattractive given the possibility of slower economic growth in the coming months. For this reason, we continue to feel that it is prudent to maintain the Portfolio’s defensive posture, but will continue to look for attractive opportunities to add value to the Portfolio.
72
| 2007 Annual Report |
| |
| September 30, 2007 |
Investment Overview (cont’d)
High Yield Portfolio
• We kept the Portfolio well-diversified across a varied group of approximately 120 issuers to help minimize the Portfolio’s credit risk. As of the end of the period, the average credit quality of the Portfolio stood between BB- and B+, which is higher than that of the Index.
• We continued to implement strategic overweights in securities and sectors that we believed offered the most attractive risk profiles. As of the end of the reporting period, the Portfolio’s major sector overweights were in the health care, food/tobacco, and auto/vehicle parts sectors. The largest sector underweights were in technology, cable, media and telecommunications.
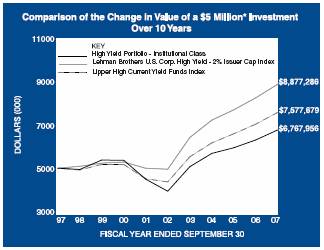
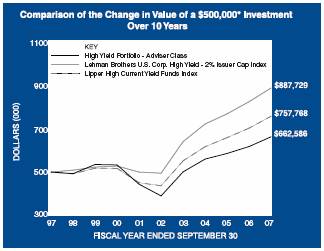
* Minimum Investment
In accordance with SEC regulations, the Portfolio’s performance shown assumes that all recurring fees (including management fees) were deducted and all dividends and distributions were reinvested. The performance of Investment Class and Adviser Class shares will vary from the Institutional Class shares based upon their different inception dates and will be negatively impacted by additional fees assessed to those classes.
Performance Compared to the Lehman Brothers U.S. Corporate High Yield - 2% Issuer Cap Index(1), and the Lipper High Current Yield Funds Index(2)
| | Total Returns(3) | |
| | | | Average Annual | |
| | One | | Five | | Ten | | Since | |
| | Year | | Years | | Years | | Inception(6) | |
| | | | | | | | | |
Portfolio — Institutional Class(4) | | 7.38 | % | 11.44 | % | 3.07 | % | 7.28 | % |
Lehman Brothers U.S. Corporate High Yield - 2% Issuer Cap Index | | 7.61 | | 12.37 | | 5.91 | | — | |
Lipper High Current Yield Funds Index | | 7.73 | | 11.65 | | 4.25 | | 7.19 | |
Portfolio — Adviser Class(5) | | 7.26 | | 11.20 | | 2.86 | | 3.83 | |
Lehman Brothers U.S. Corporate High Yield - 2% Issuer Cap Index | | 7.61 | | 12.37 | | 5.91 | | 6.44 | |
Lipper High Current Yield Funds Index | | 7.73 | | 11.65 | | 4.25 | | 4.94 | |
Performance data quoted represents past performance, which is no guarantee of future results, and current performance may be lower or higher than the figures shown. Performance assumes that all dividends and distributions, if any, were reinvested. For the most recent month-end performance figures, please visit www.morganstanley.com/im. Investment return and principal value will fluctuate so that Portfolio shares, when redeemed, may be worth more or less than their original cost. Total returns do not reflect the deduction of taxes that a shareholder would pay on Portfolio distributions or the redemption of Portfolio shares.
(1) | The Lehman Brothers U.S. Corporate High Yield - 2% Issuer Cap Index is the 2% Issuer Cap component of the Lehman Brothers U.S. Corporate High Yield Index which covers the U.S. dollar-denominated, non-investment grade, fixed rate, taxable corporate bond market. Securities are classified as high-yield if the middle rating of Moody’s, Fitch, and S&P is Ba1/BB+/BB+ or below. The Index excludes emerging markets debt. The Index is unmanaged and its returns do not include any sales charges or fees. Such costs would lower performance. It is not possible to invest directly in an index. |
(2) | The Lipper High Current Yield Funds Index is an equally weighted performance index of the largest qualifying funds (based on net assets) in the Lipper High Current Yield Funds classification. The Index, which is adjusted for capital gains distributions and income dividends, is unmanaged and should not be considered an investment. There are currently 30 funds represented in this Index. As of the date of this report, the Portfolio is in the Lipper High Current Yield Funds classification. |
(3) | Total returns for the Portfolio reflect expenses waived and/or reimbursed, if applicable, by the Adviser. Without such waivers and/or reimbursements, total returns would have been lower. Fee waivers and/or reimbursements are voluntary and the Adviser reserves the right to commence or terminate any waiver and/or reimbursement at any time. |
(4) | Commenced operations on February 28, 1989. |
(5) | Commenced operations on January 31, 1997. |
(6) | For comparative purposes, average annual since inception returns listed for the Indexes refer to the inception date or initial offering of the respective share class of the Portfolio, not the inception of the Indexes. |
Expense Examples
As a shareholder of the Portfolio, you incur two types of costs: (1) transactional costs, including redemption fees; (2) ongoing costs, including management fees, shareholder servicing fees (in the case of Adviser Class); and other Portfolio expenses. These examples are intended to help you understand your
73
2007 Annual Report
September 30, 2007
Investment Overview (cont’d)
High Yield Portfolio
ongoing costs (in dollars) of investing in the Portfolio and to compare these costs with the ongoing costs of investing in other mutual funds.
The examples are based on an investment of $1,000 invested at the beginning of the six-month period ended September 30, 2007 and held for the entire six-month period.
Actual Expenses
The first line of the tables below provides information about actual account values and actual expenses. You may use the information in this line, together with the amount you invested, to estimate the expenses that you paid over the period. Simply divide your account value by $1,000 (for example, an $8,600 account value divided by $1,000 = 8.6), then multiply the result by the number in the first line under the heading entitled “Expenses Paid During Period” to estimate the expenses you paid on your account during this period.
Please note that “Expenses Paid During Period” are grossed up to reflect Portfolio expenses prior to the effect of Expense Offset (See Note E in the Notes to Financial Statements). Therefore, the annualized net expense ratios may differ from the ratio of expenses to average net assets shown in the Financial Highlights.
Hypothetical Example for Comparison Purposes
The second line of the tables below provides information about hypothetical account values and hypothetical expenses based on the Portfolio’s actual expense ratio and an assumed rate of return of 5% per year before expenses, which is not the Portfolio’s actual return. The hypothetical account values and expenses may not be used to estimate the actual ending account balance or expenses you paid for the period. You may use this information to compare the ongoing costs of investing in the Portfolio and other funds. To do so, compare this 5% hypothetical example with the 5% hypothetical examples that appear in the shareholder reports of the other funds.
Please note that the expenses shown in the table are meant to highlight your ongoing costs only and do not reflect any transactional costs, such as redemption fees. Therefore, the second line of the table is useful in comparing ongoing costs only, and will not help you determine the relative total costs of owning different funds. In addition, if these transactional costs were included, your costs would have been higher.
| | | | | | Expenses Paid | |
| | | | Ending Account | | During Period* | |
| | Beginning | | Value | | April 1, 2007 — | |
| | Account Value | | September 30, | | September 30, | |
| | April 1, 2007 | | 2007 | | 2007 | |
Institutional Class | | | | | | | |
Actual | | $ | 1,000.00 | | $ | 1,015.30 | | $ | 3.28 | |
Hypothetical (5% average annual return before expenses) | | 1,000.00 | | 1,021.81 | | 3.29 | |
| | | | | | | |
Adviser Class | | | | | | | |
Actual | | 1,000.00 | | 1,013.80 | | 4.54 | |
Hypothetical (5% average annual return before expenses) | | 1,000.00 | | 1,020.56 | | 4.56 | |
| | | | | | | | | | |
* Expenses are equal to Institutional Class’ and Adviser Class’ annualized net expense ratios of 0.65% and 0.90%, respectively, multiplied by the average account value over the period, multiplied by 183/365 (to reflect the one-half year period).
Graphic Presentation of Portfolio Holdings
The following graph depicts the Portfolio’s holdings by industry and/or investment type, as a percentage of total investments.
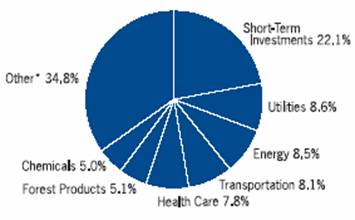
* Industries and/or investment types which do not appear in the above graph, as well as those which represent less than 5% of total investments, if applicable, are included in the category labeled “Other”.
74
| 2007 Annual Report |
| |
| September 30, 2007 |
Portfolio of Investments
High Yield Portfolio
| | Face | | | |
| | Amount | | Value | |
| | (000) | | (000) | |
Fixed Income Securities (92.4%) | | | | | |
Aerospace (1.1%) | | | | | |
DAE Aviation Holdings, Inc., | | | | | |
11.25%, 8/1/15 | | $ | (e)515 | | $ | 541 | |
Hexcel Corp., | | | | | |
6.75%, 2/1/15 | | (c)1,655 | | 1,642 | |
| | | | 2,183 | |
Broadcasting (0.8%) | | | | | |
Lin Television Corp., | | | | | |
6.50%, 5/15/13 | | 1,045 | | 1,021 | |
Univision Communications, Inc., | | | | | |
9.75%, 3/15/15 | | (c)(e)710 | | 696 | |
| | | | 1,717 | |
Cable (4.1%) | | | | | |
Cablevision Systems Corp., | | | | | |
9.82%, 4/1/09 | | (h)1,930 | | 1,998 | |
Charter Communications Holdings I, LLC, | | | | | |
11.00%, 10/1/15 | | 652 | | 663 | |
Charter Communications Holdings II, LLC, | | | | | |
10.25%, 9/15/10 | | 485 | | 498 | |
Echostar DBS Corp., | | | | | |
6.38%, 10/1/11 | | 2,105 | | 2,121 | |
Intelsat Bermuda Ltd., | | | | | |
8.89%, 1/15/15 | | (h)305 | | 310 | |
Intelsat Subsidiary Holding Co., Ltd., | | | | | |
8.63%, 1/15/15 | | 2,045 | | 2,096 | |
NTL Cable plc, | | | | | |
8.75%, 4/15/14 | | (c)230 | | 237 | |
9.13%, 8/15/16 | | 145 | | 151 | |
PanAmSat Corp., | | | | | |
9.00%, 8/15/14 | | 307 | | 318 | |
| | | | 8,392 | |
Chemicals (6.0%) | | | | | |
Berry Plastics Holding Corp., | | | | | |
8.88%, 9/15/14 | | (c)2,055 | | 2,112 | |
Equistar Chemicals, LP, | | | | | |
10.13%, 9/1/08 | | 1,173 | | 1,217 | |
Innophos Holdings, Inc., | | | | | |
9.50%, 4/15/12 | | (e)600 | | 606 | |
Innophos, Inc., | | | | | |
8.88%, 8/15/14 | | (c)1,050 | | 1,045 | |
Koppers, Inc., | | | | | |
9.88%, 10/15/13 | | 490 | | 521 | |
Koppers Industry, Inc., | | | | | |
Zero Coupon, 11/15/14 | | (g)1,155 | | 993 | |
Nalco Co., | | | | | |
7.75%, 11/15/11 | | (c)975 | | 999 | |
8.88%, 11/15/13 | | (c)1,375 | | 1,451 | |
Rockwood Specialties Group, Inc., | | | | | |
7.63%, 11/15/14 | | EUR | 700 | | 998 | |
Terra Capital, Inc., | | | | | |
7.00%, 2/1/17 | | $ | 1,080 | | 1,058 | |
Westlake Chemical Corp., | | | | | |
6.63%, 1/15/16 | | $ | (c)1,130 | | $ | 1,079 | |
| | | | 12,079 | |
Collateralized Mortgage Obligations — Non Agency Collateral Series (2.1%) | | | | | |
Bear Stearns Structured Products, Inc., | | | | | |
IO | | | | | |
0.47%, 2/27/36 | | (e)15,640 | | 305 | |
1.41%, 1/27/37 | | (e)15,481 | | 447 | |
1.45%, 6/26/36 | | (e)15,523 | | 485 | |
1.46%, 1/27/37 | | (e)21,345 | | 643 | |
2.02%, 5/25/37 | | (e)19,230 | | 644 | |
Countrywide Alternative Loan Trust, | | | | | |
2.37%, 2/25/47 | | (e)12,683 | | 441 | |
Harborview NIM Corp., | | | | | |
IO | | | | | |
Zero Coupon, 12/15/36 | | (e)(h)863 | | 473 | |
Residential Accredit Loans, Inc., | | | | | |
IO | | | | | |
2.76%, 5/25/47 | | (e)(h)12,695 | | 540 | |
2.80%, 3/25/47 | | (e)(h)6,507 | | 260 | |
| | | | 4,238 | |
Consumer Products (1.2%) | | | | | |
Jarden Corp., | | | | | |
7.50%, 5/1/17 | | (c)1,375 | | 1,337 | |
Oxford Industries, Inc., | | | | | |
8.88%, 6/1/11 | | 1,145 | | 1,162 | |
| | | | 2,499 | |
Diversified Media (3.7%) | | | | | |
CanWest Media, Inc., | | | | | |
8.00%, 9/15/12 | | (c)2,052 | | 2,021 | |
Dex Media East, LLC/Dex Media East Finance Co., | | | | | |
12.13%, 11/15/12 | | 872 | | 933 | |
Dex Media West, LLC/Dex Media Finance Co., | | | | | |
9.88%, 8/15/13 | | 1,030 | | 1,101 | |
Idearc, Inc., | | | | | |
8.00%, 11/15/16 | | 1,550 | | 1,554 | |
Interpublic Group of Companies, Inc., | | | | | |
6.25%, 11/15/14 | | 750 | | 675 | |
Valassis Communications, Inc., | | | | | |
8.25%, 3/1/15 | | (c)1,410 | | 1,234 | |
| | | | 7,518 | |
Energy (10.1%) | | | | | |
Chaparral Energy, Inc., | | | | | |
8.50%, 12/1/15 | | 1,735 | | 1,635 | |
8.88%, 2/1/17 | | (c)(e)240 | | 226 | |
CHC Helicopter Corp., | | | | | |
7.38%, 5/1/14 | | 2,455 | | 2,345 | |
Chesapeake Energy Corp., | | | | | |
6.63%, 1/15/16 | | 1,025 | | 1,025 | |
7.50%, 9/15/13 | | 1,090 | | 1,126 | |
CIE Generale de Geophysique, | | | | | |
7.50%, 5/15/15 | | (c)760 | | 787 | |
| | | | | | | | |
The accompanying notes are an integral part of the financial statements.
75
2007 Annual Report | |
| |
September 30, 2007 | |
Portfolio of Investments (cont’d)
High Yield Portfolio
| | Face | | | |
| | Amount | | Value | |
| | (000) | | (000) | |
Energy (cont’d) | | | | | |
Cimarex Energy Co., | | | | | |
7.13%, 5/1/17 | | $ | 330 | | $ | 329 | |
Hilcorp Energy I, LP/Hilcorp Finance Co., | | | | | |
7.75%, 11/1/15 | | (c)(e)2,275 | | 2,235 | |
Husky Oil Co., | | | | | |
8.90%, 8/15/28 | | (h)1,530 | | 1,583 | |
Kinder Morgan Finance Co. ULC, | | | | | |
5.70%, 1/5/16 | | 1,900 | | 1,737 | |
Massey Energy Co., | | | | | |
6.88%, 12/15/13 | | 2,205 | | 2,067 | |
OPTI Canada, Inc., | | | | | |
8.25%, 12/15/14 | | (e)1,425 | | 1,443 | |
Pacific Energy Partners, LP/Pacific Energy Finance Corp., | | | | | |
7.13%, 6/15/14 | | 1,415 | | 1,452 | |
Pogo Producing Co., | | | | | |
6.88%, 10/1/17 | | (c)1,440 | | 1,454 | |
Sandridge Energy, | | | | | |
8.63%, 4/1/15 | | 970 | | 960 | |
| | | | 20,404 | |
Financial (0.5%) | | | | | |
Capmark Financial Group, Inc., | | | | | |
5.88%, 5/10/12 | | (e)295 | | 269 | |
6.30%, 5/10/17 | | (e)120 | | 105 | |
GrafTech Finance, Inc., | | | | | |
10.25%, 2/15/12 | | 686 | | 718 | |
| | | | 1,092 | |
Food & Drug (2.2%) | | | | | |
CA FM Lease Trust, | | | | | |
8.50%, 7/15/17 | | (e)992 | | 1,079 | |
Delhaize America, Inc., | | | | | |
9.00%, 4/15/31 | | 772 | | 923 | |
Rite Aid Corp., | | | | | |
8.13%, 5/1/10 | | 1,185 | | 1,194 | |
SUPERVALU, Inc., | | | | | |
7.50%, 5/15/12 | | 805 | | 838 | |
7.50%, 11/15/14 | | 490 | | 501 | |
| | | | 4,535 | |
Food & Tobacco (3.4%) | | | | | |
Constellations Brands, Inc., | | | | | |
7.25%, 5/15/17 | | (e)825 | | 829 | |
Michael Foods, Inc., | | | | | |
8.00%, 11/15/13 | | 1,170 | | 1,176 | |
Pilgrim’s Pride Corp., | | | | | |
7.63%, 5/1/15 | | 1,670 | | 1,703 | |
Reynolds American, Inc., | | | | | |
6.50%, 7/15/10 | | 1,045 | | 1,078 | |
Smithfield Foods, Inc., | | | | | |
7.00%, 8/1/11 | | 160 | | 163 | |
7.75%, 5/15/13 | | (c)1,000 | | 1,025 | |
8.00%, 10/15/09 | | (c)885 | | 918 | |
| | | | 6,892 | |
Forest Products (6.1%) | | | | | |
Crown Americas, Inc., | | | | | |
7.63%, 11/15/13 | | $ | 965 | | $ | 995 | |
Crown European Holdings S.A., | | | | | |
6.25%, 9/1/11 | | EUR | 520 | | 754 | |
Georgia Pacific Corp., | | | | | |
7.13%, 1/15/17 | | $ | (e)1,110 | | 1,080 | |
Glatfelter, | | | | | |
7.13%, 5/1/16 | | 205 | | 205 | |
Graham Packaging Co., Inc., | | | | | |
8.50%, 10/15/12 | | 615 | | 613 | |
9.88%, 10/15/14 | | (c)1,340 | | 1,333 | |
Graphic Packaging International Corp., | | | | | |
9.50%, 8/15/13 | | (c)1,745 | | 1,802 | |
Owens-Illinois, Inc., | | | | | |
7.35%, 5/15/08 | | (c)60 | | 61 | |
7.50%, 5/15/10 | | (c)3,030 | | 3,068 | |
Packaging Corp. of America, | | | | | |
4.38%, 8/1/08 | | 2,500 | | 2,478 | |
| | | | 12,389 | |
Gaming & Leisure (5.5%) | | | | | |
Host Marriott, LP, | | | | | |
6.38%, 3/15/15 | | (c)1,700 | | 1,670 | |
Isle of Capri Casinos, Inc., | | | | | |
7.00%, 3/1/14 | | 2,465 | | 2,218 | |
Las Vegas Sands Corp., | | | | | |
6.38%, 2/15/15 | | (c)1,340 | | 1,303 | |
MGM Mirage, | | | | | |
6.00%, 10/1/09 | | 3,375 | | 3,367 | |
Station Casinos, Inc., | | | | | |
6.00%, 4/1/12 | | 970 | | 926 | |
6.88%, 3/1/16 | | 1,580 | | 1,383 | |
7.75%, 8/15/16 | | (c)365 | | 363 | |
| | | | 11,230 | |
Health Care (9.2%) | | | | | |
Community Health Systems, Inc., | | | | | |
8.88%, 7/15/15 | | (e)1,020 | | 1,053 | |
DaVita, Inc., | | | | | |
6.63%, 3/15/13 | | 1,170 | | 1,167 | |
Fisher Scientific International, Inc., | | | | | |
6.13%, 7/1/15 | | 2,450 | | 2,409 | |
FMC Finance III S.A., | | | | | |
6.88%, 7/15/17 | | (c)(e)1,420 | | 1,420 | |
Fresenius Medical Care Capital Trust, | | | | | |
7.38%, 6/15/11 | | EUR | 450 | | 666 | |
7.88%, 6/15/11 | | $ | (c)1,095 | | 1,142 | |
Fresenius Medical Care Capital Trust II, | | | | | |
7.88%, 2/1/08 | | 1,361 | | 1,368 | |
HCA, Inc., | | | | | |
5.75%, 3/15/14 | | 625 | | 526 | |
6.25%, 2/15/13 | | 2,215 | | 1,966 | |
6.50%, 2/15/16 | | (c)1,450 | | 1,240 | |
9.13%, 11/15/14 | | (e)210 | | 222 | |
| | | | | | | | |
The accompanying notes are an integral part of the financial statements.
76
| 2007 Annual Report |
| |
| September 30, 2007 |
Portfolio of Investments (cont’d)
High Yield Portfolio
| | Face | | | |
| | Amount | | Value | |
| | (000) | | (000) | |
Health Care (cont’d) | | | �� | | |
Invacare Corp., | | | | | |
9.75%, 2/15/15 | | $ | 235 | | $ | 236 | |
National Mentor Holdings, Inc., | | | | | |
11.25%, 7/1/14 | | 975 | | 1,033 | |
Omnicare, Inc., | | | | | |
6.75%, 12/15/13 | | 1,615 | | 1,514 | |
Sun Healthcare Group, Inc., | | | | | |
9.13%, 4/15/15 | | (e)775 | | 794 | |
Tenet Healthcare Corp., | | | | | |
7.38%, 2/1/13 | | 670 | | 571 | |
9.88%, 7/1/14 | | (c)425 | | 391 | |
Warner Chilcott Corp., | | | | | |
8.75%, 2/1/15 | | (c)945 | | 983 | |
| | | | 18,701 | |
Housing (1.2%) | | | | | |
Goodman Global Holding Co., Inc., | | | | | |
8.36%, 6/15/12 | | (h)441 | | 438 | |
Nortek, Inc., | | | | | |
8.50%, 9/1/14 | | 1,780 | | 1,553 | |
Realogy Corp., | | | | | |
10.50%, 4/15/14 | | (c)(e)530 | | 453 | |
| | | | 2,444 | |
Information Technology (2.7%) | | | | | |
Freescale Semiconductor, Inc., | | | | | |
10.13%, 12/15/16 | | (c)(e)1,650 | | 1,543 | |
Iron Mountain, Inc., | | | | | |
8.63%, 4/1/13 | | 2,085 | | 2,121 | |
Vangent, Inc., | | | | | |
9.63%, 2/15/15 | | (e)775 | | 727 | |
SunGard Data Systems, Inc., | | | | | |
9.13%, 8/15/13 | | 990 | | 1,034 | |
| | | | 5,425 | |
Manufacturing (2.3%) | | | | | |
Baldor Electric Co., | | | | | |
8.63%, 2/15/17 | | (c)460 | | 483 | |
Johnsondiversey, Inc., | | | | | |
9.63%, 5/15/12 | | (c)2,095 | | 2,137 | |
9.63%, 5/15/12 | | EUR | 55 | | 80 | |
Propex Fabrics, Inc., | | | | | |
10.00%, 12/1/12 | | $ | 1,210 | | 926 | |
RBS Global Inc./Rexnord Corp., | | | | | |
8.88%, 9/1/16 | | (c)1,000 | | 1,010 | |
| | | | 4,636 | |
Metals (0.8%) | | | | | |
Foundation PA Coal Co., | | | | | |
7.25%, 8/1/14 | | 575 | | 566 | |
Freeport-McMoran Copper & Gold, Inc., | | | | | |
8.38%, 4/1/17 | | 910 | | 997 | |
| | | | 1,563 | |
Mortgages - Other (2.0%) | | | | | |
American Home Mortgage Assets, | | | | | |
5.43%, 6/25/47 | | $ | (h)615 | | $ | 551 | |
Countrywide Alternative Loan Trust, | | | | | |
5.65%, 10/25/46 | | (h)600 | | 406 | |
5.83%, 2/25/36 | | (h)448 | | 404 | |
Harborview Mortgage Loan Trust, | | | | | |
5.70%, 8/21/36 | | (h)575 | | 396 | |
6.20%, 1/19/36 | | (h)936 | | 821 | |
Lehman XS Trust, | | | | | |
6.13%, 3/25/47 | | (h)1,000 | | 812 | |
Luminent Mortgage Trust, | | | | | |
5.49%, 7/25/36 | | (h)722 | | 614 | |
| | | | 4,004 | |
Retail (1.3%) | | | | | |
Brown Shoe Co., Inc., | | | | | |
8.75%, 5/1/12 | | (c)1,145 | | 1,185 | |
Phillips - Van Heusen, | | | | | |
7.25%, 2/15/11 | | 1,400 | | 1,421 | |
| | | | 2,606 | |
Services (0.9%) | | | | | |
Allied Waste North America, | | | | | |
6.38%, 4/15/11 | | (c)1,050 | | 1,058 | |
Aramark Corp., | | | | | |
8.50%, 2/1/15 | | (c)175 | | 180 | |
8.86%, 2/1/15 | | (h)85 | | 86 | |
Aramark Services, Inc., | | | | | |
5.00%, 6/1/12 | | (c)595 | | 528 | |
| | | | 1,852 | |
Sovereign (0.4%) | | | | | |
Mexican Bonos, | | | | | |
9.50%, 12/18/14 | | MXN | 9,120 | | 910 | |
Telecommunications (3.4%) | | | | | |
Axtel S.A. de C.V., | | | | | |
11.00%, 12/15/13 | | $ | (c)1,438 | | 1,565 | |
Citizens Communications Co., | | | | | |
6.25%, 1/15/13 | | 535 | | 524 | |
Esprit Telecom Group plc, | | | | | |
10.88%, 6/15/08 | | (b)(d)(k)965 | | @— | |
11.00%, 6/15/08 | | DEM | (b)(d)(k)2,608 | | @— | |
11.50%, 12/15/07 | | EUR | (b)(d)(k)1,669 | | @— | |
11.50%, 12/15/07 | | $ | (b)(d)(k)600 | | @— | |
Exodus Communications, Inc., | | | | | |
11.63%, 7/15/10 | | (b)(c)(d)(k)3,899 | | @— | |
Nordic Telephonen Co. Holdings A.p.S., | | | | | |
8.88%, 5/1/16 | | (e)465 | | 493 | |
Qwest Communications International, Inc., | | | | | |
9.06%, 2/15/09 | | (c)(h)1,507 | | 1,530 | |
Qwest Corp., | | | | | |
5.63%, 11/15/08 | | 355 | | 356 | |
| | | | | | | | | | |
The accompanying notes are an integral part of the financial statements.
77
2007 Annual Report | |
| |
September 30, 2007 | |
Portfolio of Investments (cont’d)
High Yield Portfolio
| | Face | | | |
| | Amount | | Value | |
| | (000) | | (000) | |
Telecommunications (cont’d) | | | | | |
Rhythms NetConnections, Inc., | | | | | |
12.75%, 4/15/09 | | $ | (b)(d)(k)433 | | $ | @— | |
13.88%, 5/15/08 | | (b)(d)(k)12,869 | | @— | |
14.00%, 2/15/10 | | (b)(d)(k)11,487 | | @— | |
TDC AS, | | | | | |
6.50%, 4/19/12 | | EUR | 380 | | 540 | |
Wind Acquisition Finance S.A., | | | | | |
10.75%, 12/1/15 | | $ | (e)1,170 | | 1,302 | |
Windstream Corp., | | | | | |
8.13%, 8/1/13 | | 490 | | 518 | |
| | | | 6,828 | |
Transportation (9.7%) | | | | | |
ArvinMeritor, Inc., | | | | | |
8.75%, 3/1/12 | | (c)1,520 | | 1,558 | |
Asbury Automotive Group, Inc., | | | | | |
7.63%, 3/15/17 | | (e)555 | | 513 | |
Ford Motor Credit Co., | | | | | |
5.80%, 1/12/09 | | 1,340 | | 1,295 | |
7.00%, 10/1/13 | | 2,000 | | 1,810 | |
7.25%, 10/25/11 | | 1,475 | | 1,384 | |
General Motors Acceptance Corp., | | | | | |
4.38%, 12/10/07 | | (c)1,615 | | 1,607 | |
6.88%, 9/15/11 - 8/28/12 | | 3,760 | | 3,576 | |
General Motors Corp., | | | | | |
7.13%, 7/15/13 | | (c)710 | | 653 | |
8.38%, 7/15/33 | | (c)1,370 | | 1,207 | |
Petro Stopping Centers, LP/Petro Financial Corp., | | | | | |
9.00%, 2/15/12 | | 1,955 | | 2,053 | |
Sonic Automotive, Inc., | | | | | |
8.63%, 8/15/13 | | 2,945 | | 2,923 | |
United Auto Group, Inc., | | | | | |
7.75%, 12/15/16 | | (c)1,060 | | 1,020 | |
| | | | 19,599 | |
Utilities (10.2%) | | | | | |
AES Corp. (The), | | | | | |
7.75%, 3/1/14 | | (c)1,105 | | 1,127 | |
8.88%, 2/15/11 | | 243 | | 255 | |
9.00%, 5/15/15 | | (e)105 | | 111 | |
9.38%, 9/15/10 | | 396 | | 420 | |
Colorado Interstate Gas Co., | | | | | |
6.80%, 11/15/15 | | (c)2,880 | | 2,996 | |
Dynegy Holdings, Inc., | | | | | |
7.75%, 6/1/19 | | (e)1,100 | | 1,057 | |
Intergen N.V., | | | | | |
9.00%, 6/30/17 | | (e)1,125 | | 1,187 | |
Ipalco Enterprises, Inc., | | | | | |
8.38%, 11/14/08 | | 640 | | 656 | |
8.63%, 11/14/11 | | 730 | | 775 | |
Nevada Power Co., | | | | | |
8.25%, 6/1/11 | | 950 | | 1,037 | |
NRG Energy, | | | | | |
7.38%, 1/15/17 | | 1,200 | | 1,203 | |
Ormat Funding Corp., | | | | | |
8.25%, 12/30/20 | | $ | 1,498 | | $ | 1,530 | |
PSEG Energy Holdings, LLC, | | | | | |
8.63%, 2/15/08 | | 1,145 | | 1,157 | |
Reliant Resources, Inc., | | | | | |
7.88%, 6/15/17 | | (c)1,035 | | 1,047 | |
Texas Utilities, | | | | | |
6.38%, 1/1/08 | | 1,000 | | 1,005 | |
Transcontinental Gas Pipe Line Corp., | | | | | |
6.25%, 1/15/08 | | 2,300 | | 2,311 | |
TXU Energy Co., LLC, | | | | | |
7.00%, 3/15/13 | | 515 | | 566 | |
Williams Cos., Inc., | | | | | |
7.88%, 9/1/21 | | 2,160 | | 2,360 | |
| | | | 20,800 | |
Wireless Communications (1.5%) | | | | | |
American Tower Corp., | | | | | |
7.13%, 10/15/12 | | 900 | | 925 | |
7.50%, 5/1/12 | | 1,475 | | 1,523 | |
Rural Cellular Corp., | | | | | |
8.25%, 3/15/12 | | 500 | | 521 | |
| | | | 2,969 | |
Total Fixed Income Securities (Cost $213,803) | | | | 187,505 | |
| | | | | | | | |
| | Shares | | | |
Common Stocks (0.1%) | | | | | |
Telecommunications (0.1%) | | | | | |
Neon Communications, Inc. | | (a)5,279 | | 26 | |
Viatel Holding Bermuda Ltd. | | (a)7,617 | | @— | |
XO Holdings, Inc. | | (a)6,978 | | 24 | |
| | | | 50 | |
Utilities (0.0%) | | | | | |
PNM Resources, Inc. | | 854 | | 20 | |
Total Common Stocks (Cost $10,801) | | | | 70 | |
| | No. of | | | |
| | Contracts | | | |
Put Options Purchased (0.0%) | | | | | |
90 Day EuroDollar | | | | | |
12/07 @ $94.75 | | (a)230 | | 25 | |
3/08 @ $94.75 | | (a)193 | | 18 | |
Total Put Options Purchased (Cost $95) | | | | 43 | |
| | No. of | | | |
| | Warrants | | | |
Warrants (0.0%) | | | | | |
Telecommunications (0.0%) | | | | | |
XO Holdings, Inc., Series A, expiring 1/16/10 | | (a)(c)13,962 | | 7 | |
XO Holdings, Inc., Series B, expiring 1/16/10 | | (a)(c)10,470 | | 3 | |
XO Holdings, Inc., Series C, expiring 1/16/10 | | (a)(c)10,471 | | 1 | |
Utilities (0.0%) | | | | | |
SW Acquisition, LP, expiring 4/1/11 | | (a)(d)(k)1 | | @— | |
Total Warrants (Cost $0) | | | | 11 | |
The accompanying notes are an integral part of the financial statements.
78
| 2007 Annual Report |
| |
| September 30, 2007 |
Portfolio of Investments (cont’d)
High Yield Portfolio
| | Face | | | |
| | Amount | | Value | |
| | (000) | | (000) | |
Short-Term Investments (26.2%) | | | | | |
Short-Term Debt Securities held as Collateral on Loaned Securities (20.7%) | | | | | |
AIG Match Funding Corp., | | | | | |
5.73%, 10/17/07 | | $ | (h)1,710 | | $ | 1,710 | |
Alliance & Leicester plc, | | | | | |
5.83%, 10/9/07 | | (h)1,221 | | 1,221 | |
Bancaja, | | | | | |
5.36%, 10/19/07 | | 611 | | 611 | |
Bank of New York Co., Inc., | | | | | |
5.82%, 10/10/07 | | (h)611 | | 611 | |
BASF AG, | | | | | |
5.36%, 10/22/07 | | (h)611 | | 611 | |
BNP Paribas plc, | | | | | |
5.50%, 11/19/07 | | (h)1,221 | | 1,221 | |
CAM US Finance S.A. Unipersonal, | | | | | |
5.37%, 10/3/07 | | 2,443 | | 2,443 | |
Canadian Imperial Bank of Commerce, New York, | | | | | |
4.92%, 10/1/07 | | (h)1,221 | | 1,221 | |
CC USA, Inc., | | | | | |
4.68%, 10/1/07 | | (h)610 | | 610 | |
CIT Group Holdings, | | | | | |
5.38%, 10/18/07 | | (h)2,198 | | 2,198 | |
Citigroup Global Markets Holdings, Inc., | | | | | |
5.26%, 10/1/07 | | 4,840 | | 4,840 | |
Credit Suisse First Boston, New York, | | | | | |
4.82%, 10/1/07 | | (h)1,221 | | 1,221 | |
First Tennessee Bank, | | | | | |
5.76%, 10/17/07 | | (h)611 | | 611 | |
5.77%, 10/17/07 | | (h)2,442 | | 2,442 | |
Goldman Sachs Group, Inc., | | | | | |
5.37%, 10/1/07 | | 1,148 | | 1,148 | |
5.82%, 10/15/07 | | (h)611 | | 611 | |
HSBC Finance Corp., | | | | | |
5.81%, 10/9/07 | | (h)611 | | 611 | |
IBM Corp., | | | | | |
5.79%, 10/9/07 | | 2,443 | | 2,443 | |
Macquarie Bank Ltd., | | | | | |
5.17%, 10/22/07 | | (h)1,221 | | 1,221 | |
Marshall & Ilsley Bank, | | | | | |
5.37%, 12/17/07 | | 1,225 | | 1,225 | |
Metropolitan Life Global Funding, | | | | | |
5.13%, 10/22/07 | | (h)1,832 | | 1,832 | |
National Bank of Canada, | | | | | |
5.66%, 10/2/07 | | (h)2,442 | | 2,442 | |
National Rural Utilities Cooperative Finance Corp., | | | | | |
5.73%, 10/1/07 | | (h)2,442 | | 2,442 | |
Nationwide Building Society, | | | | | |
5.28%, 12/28/07 | | 1,417 | | 1,417 | |
Societe Generale, New York, | | | | | |
5.11%, 10/31/07 | | (h)2,931 | | 2,931 | |
Unicredito Delaware, Inc., | | | | | |
5.77%, 10/15/07 | | (h)1,344 | | 1,344 | |
Unicredito Italiano Bank (Ireland) plc, | | | | | |
5.84%, 10/9/07 | | (h)855 | | 855 | |
| | | | 42,093 | |
| | | | | | | |
| | | | Value | |
| | Shares | | (000) | |
Investment Company (5.4%) | | | | | |
Morgan Stanley Institutional Liquidity Money Market Portfolio — Institutional Class | | (p)10,942,880 | | $ | 10,943 | |
| | | | | | |
| | Face | | | |
| | Amount | | | |
| | (000) | | | |
U.S. Treasury Security (0.1%) | | | | | |
U.S. Treasury Bill, | | | | | |
3.82%, 1/10/08 | | $ | (j)(r)160 | | 158 | |
Total Short-Term Investments (Cost $53,194) | | | | 53,194 | |
Total Investments (118.7%) (Cost $277,893) —
Including $41,597 of Securities Loaned | | | | $ | 240,823 | |
Liabilities in Excess of Other Assets (-18.7%) | | | | (37,866 | ) |
Net Assets (100%) | | | | $ | 202,957 | |
| | | | | | | |
(a) | | Non-income producing security. |
(b) | | Issuer is in default. |
(c) | | All or a portion of security on loan at September 30, 2007. |
(d) | | Security was valued at fair value — At September 30, 2007, the Portfolio held fair valued securities, each valued at less than $500, representing less than 0.05% of net assets. |
(e) | | 144A security — Certain conditions for public sale may exist. Unless otherwise noted, these securities are deemed to be liquid. |
(g) | | Step Bond — Coupon rate increases in increments to maturity. Rate disclosed is as of September 30, 2007. Maturity date disclosed is the ultimate maturity date. |
(h) | | Variable/Floating Rate Security — Interest rate changes on these instruments are based on changes in a designated base rate. The rates shown are those in effect on September 30, 2007. |
(j) | | All or a portion of the security was pledged to cover margin requirements for futures contracts. |
(k) | | Security has been deemed illiquid at September 30, 2007. |
(p) | | See Note F within the Notes to Financial Statements regarding investment in Morgan Stanley Institutional Liquidity Government Portfolio — Institutional Class, Morgan Stanley Institutional Liquidity Money Market Portfolio — Institutional Class and/or Morgan Stanley Institutional Liquidity Tax-Exempt Portfolio — Institutional Class. |
(r) | | Rate shown is the Yield to Maturity at September 30, 2007. |
@ | | Face Amount/Value is less than $500 |
EUR | | Euro |
DEM | | German Mark |
IO | | Interest Only |
MXN | | Mexican Peso |
The accompanying notes are an integral part of the financial statements.
79
2007 Annual Report | |
| |
September 30, 2007 | |
Portfolio of Investments (cont’d)
High Yield Portfolio
Foreign Currency Exchange Contract Information:
The Portfolio had the following foreign currency exchange contract(s) open at period end:
| | | | | | | | | | | | | | Net | |
Currency | | | | | | In | | | | Unrealized | |
to | | | | | | Exchange | | | | Appreciation | |
Deliver | | Value | | Settlement | | For | | Value | | (Depreciation) | |
(000) | | (000) | | Date | | (000) | | (000) | | (000) | |
EUR | | 2,696 | | $ | 3,847 | | 10/31/07 | | USD | | 3,687 | | $ | 3,687 | | $ | (160 | ) |
USD | | 799 | | 799 | | 10/31/07 | | EUR | | 585 | | 835 | | 36 | |
| | | | $ | 4,646 | | | | | | | | $ | 4,522 | | $ | (124 | ) |
USD — United States Dollar
Futures Contracts:
The Portfolio had the following futures contract(s) open at period end:
| | | | | | | | Net | |
| | | | | | | | Unrealized | |
| | Number | | | | | | Appreciation | |
| | of | | Value | | Expiration | | (Depreciation) | |
| | Contracts | | (000) | | Date | | (000) | |
Long: | | | | | | | | | |
U.S. Treasury | | | | | | | | | |
2 yr. Note | | 78 | | $ | 16,150 | | Dec-07 | | $ | 67 | |
U.S. Treasury | | | | | | | | | |
5yr. Note | | 76 | | 8,134 | | Dec-07 | | 46 | |
U.S. Treasury | | | | | | | | | |
10 yr. Note | | 87 | | 9,507 | | Dec-07 | | 59 | |
Short: | | | | | | | | | |
U.S. Treasury | | | | | | | | | |
Long Bond | | 159 | | 17,704 | | Dec-07 | | 5 | |
| | | | | | | | $ | 177 | |
| | | | | | | | | | | |
Credit Default Swap Contracts
The Portfolio had the following credit default swap agreement(s) open at period end:
| | | | | | | | | | Unrealized | |
| | | | Notional | | | | | | Appreciation | |
| | Buy/Sell | | Amount | | Pay/Receive | | Termination | | (Depreciation) | |
Swap Counterparty and Reference Obligation | | Protection | | (000) | | Fixed Rate | | Date | | (000) | |
Goldman Sachs | | Buy | | $ | 1,000 | | 0.80 | % | 3/20/11 | | $ | (17 | ) |
Tyco International Ltd., 6.38%, 10/15/11 | | | | | | | | | | | |
JPMorgan Chase | | Sell | | 6,020 | | 2.75 | | 6/20/12 | | 247 | |
Dow Jones CDX North America High Yield Index, | | | | | | | | | | | |
Series 8 | | | | | | | | | | | |
JPMorgan Chase | | Buy | | 375 | | 1.18 | | 6/20/14 | | 4 | |
Belo Corp., 8.00%, 11/1/08 | | | | | | | | | | | |
JPMorgan Chase | | Buy | | 1,050 | | 1.30 | | 6/20/14 | | 4 | |
Belo Corp., 8.00%, 11/1/08 | | | | | | | | | | | |
JPMorgan Chase | | Buy | | 1,000 | | 0.65 | | 3/20/11 | | (12 | ) |
Tyco International Ltd., 2.75%, 1/15/18 | | | | | | | | | | | |
| | | | | | | | | | $ | 226 | |
| | | | | | | | | | | | | |
Interest Rate Swap Contracts
The Portfolio had the following interest rate swap agreement(s) open at period end:
| | | | | | | | | | | | Unrealized | |
| | | | | | | | | | Notional | | Appreciation | |
| | Floating Rate | | Pay/Receive | | Fixed | | Termination | | Amount | | (Depreciation) | |
Swap Counterparty | | Index | | Floating Rate | | Rate | | Date | | (000) | | (000) | |
JPMorgan Chase | | 3 Month LIBOR | | Pay | | 5.43 | % | 8/20/17 | | $ | 13,400 | | $ | 228 | |
| | 3 Month LIBOR | | Pay | | 5.36 | | 8/24/17 | | 10,500 | | 122 | |
| | | | | | | | | | | | $ | 350 | |
| | | | | | | | | | | | | | | |
LIBOR — London Inter Bank Offer Rate
The accompanying notes are an integral part of the financial statements.
80
2007 Annual Report
September 30, 2007
Investment Overview (unaudited)
Intermediate Duration Portfolio
The Intermediate Duration Portfolio seeks above-average total return over a market cycle of three to five years. The Portfolio invests primarily in a diversified mix of U.S. government securities, investment grade corporate bonds and mortgage securities. The Portfolio also may invest, to a limited extent, in non-dollar denominated securities. The Portfolio seeks value in the fixed income market with only a moderate sensitivity to changes in interest rates. The Portfolio will ordinarily seek to maintain an average duration between two and five years although there is no minimum or maximum maturity for any individual security. The Portfolio may invest over 50% of its assets in mortgage securities. The Portfolio may invest in TBAs. The Portfolio may invest in asset-backed securities and may use futures, options, forwards, collateralized mortgage obligations, swaps, options on swaps and other derivatives. Federal Home Loan Mortgage Corp., Federal National Mortgage Association, and Federal Home Loan Banks, although chartered and sponsored by Congress, are not funded by congressional appropriations and securities issued by them are neither guaranteed nor insured by the U.S. government.
Performance
For the fiscal year ended September 30, 2007, the Portfolio’s Institutional Class had a total return based on net asset value and reinvestment of distributions per share of 4.87%, net of fees. The Portfolio’s Institutional Class underperformed against its benchmark the Lehman Brothers Intermediate U.S. Government/Credit Index (the “Index”) which returned 5.43%.
Factors Affecting Performance
• Fears stemming from a residential housing downturn persisted throughout the 12-month period. Confronted with increasing delinquency rates on sub prime loans, high-profile hedge fund collapses, and a series of sub prime mortgage related credit downgrades, markets responded severely in the latter months of the reporting period. The impact was exacerbated by an influx of forced sellers looking to liquidate assets to help meet margin calls and capital withdrawals, which fueled concerns about the potential impact on the broader financial markets and economy and led to a flight to quality.
• In August, the Federal Open Market Committee (the “Fed”) lowered the discount rate by half a percent, from 6.25% to 5.75%, and began encouraging member banks to make greater use of the discount window without fear of such action being viewed negatively by the Fed. In September, the Fed elected to cut the target federal funds rate by 50 basis points to 4.75%, noting that while economic growth remained moderate, inflation risks remain and “the tightening of credit conditions has the potential to intensify the housing correction and to restrain economic growth”.
• U.S. Treasury yields fluctuated throughout the 12-month period, with the yield curve beginning the period relatively flat and ending the period steep. As the yield curve steepened, shorter dated U.S. Treasury yields experienced the greatest decline, while longer dated yields rose slightly. Within the U.S. government sector, Treasuries and agencies outperformed other investment-grade sectors.
• The mortgage market was hit by the turmoil affecting residential housing, and especially by its spillover effects on secondary market activity, most notably in the non-agency mortgage area, casting a pall across the entire sector with little regard for whether the securities or loans in question were sub prime or prime. The result was a further reduction in mortgage market liquidity, as well as a sharp diminishment in the availability of non-conforming mortgage loans to the general public.
• Widening credit spreads led corporate issues to underperform other major asset classes. Within the investment-grade corporate sector, lower-rated (Baa) and higher-rated (AAA) issues outpaced the middle investment grade issues and intermediate-term issues outperformed longer-dated issues. Industrials outpaced utilities and financials, which was the corporate sector hit hardest by the recent liquidity crisis.
• A defensive interest rate positioning benefited the Portfolio’s performance for the overall period, as did a relative underweight to the corporate sector, particularly in the latter months of the reporting year when credit spreads significantly widened.
• Although the Portfolio maintained an underweight to agency mortgage-backed securities, holdings here detracted from returns as the recent turmoil in the mortgage market and drying up of liquidity hurt the performance of the sector.
Management Strategies
• Throughout the period, we employed a defensive interest rate strategy by maintaining a lower interest-rate sensitivity (as measured by duration) than that of the Index. In March of this year, the position was adjusted to underweight longer dated issues and overweight intermediate dated issues. As the spread between intermediate and long date yields widened and the curve
81
2007 Annual Report
September 30, 2007
Investment Overview (cont’d)
Intermediate Duration Portfolio
steepened during the summer, relative performance benefited. Subsequently, in August, we further reduced the Portfolio’s interest rate sensitivity.
• We have held an underweight corporate position for some time now, which has benefited relative performance. While we are looking for areas to take advantage of the recent spread widening and add to corporate positions, we remain cautious because we believe the credit market remains vulnerable to potential credit downgrades and/or an economic downturn.
• We maintained an underweight position to agency mortgage-backed securities, with a focus on high-coupon, slow-prepaying issues, and non-agency mortgages issued to high quality borrowers.
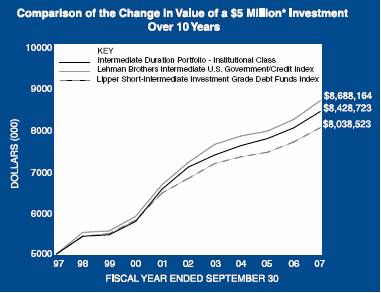
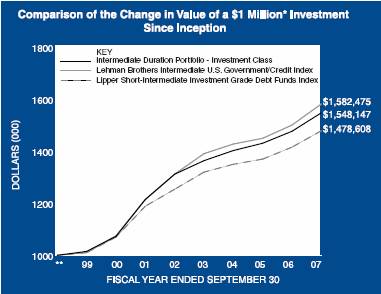
* Minimum Investment
** Commenced operations on August 16, 1999.
In accordance with SEC regulations, the Portfolio’s performance shown assumes that all recurring fees (including management fees) were deducted and all dividends and distributions were reinvested. The performance of Investment Class and the Adviser Class shares will vary from the Institutional Class shares based upon the different inception dates and will be negatively impacted by additional fees assessed to those classes.
Performance Compared to the Lehman Brothers Intermediate U.S. Government/Credit Index(1) and the Lipper Short-Intermediate Investment Grade Debt Funds Index(2)
| | Total Returns(3) | |
| | | | Average Annual | |
| | One | | Five | | Ten | | Since | |
| | Year | | Years | | Years | | Inception(7) | |
| | | | | | | | | |
Portfolio — Institutional Class(4) | | 4.87 | % | 3.52 | % | 5.36 | % | 6.16 | % |
Lehman Brothers Intermediate U.S. Government/Credit Index | | 5.43 | | 3.82 | | 5.68 | | 6.27 | |
Lipper Short-Intermediate Investment Grade Debt Funds Index | | 4.43 | | 3.34 | | 4.86 | | 5.47 | |
| | | | | | | | | |
Portfolio — Investment Class(5) | | 4.84 | | 3.37 | | — | | 5.53 | |
Lehman Brothers Intermediate U.S. Government/Credit Index | | 5.43 | | 3.82 | | — | | 5.81 | |
Lipper Short-Intermediate Investment Grade Debt Funds Index | | 4.43 | | 3.34 | | — | | 4.94 | |
| | | | | | | | | |
Portfolio — Adviser Class(6) | | — | | — | | — | | — | |
Lehman Brothers Intermediate U.S. Government/Credit Index | | — | | — | | — | | — | |
Lipper Short-Intermediate Investment Grade Debt Funds Index | | — | | — | | — | | — | |
Performance data quoted represents past performance, which is no guarantee of future results, and current performance may be lower or higher than the figures shown. Performance assumes that all dividends and distributions, if any, were reinvested. For the most recent month-end performance figures, please visit www.morganstanley.com/im. Investment return and principal value will fluctuate so that Portfolio shares, when redeemed, may be worth more or less than their original cost. Total returns do not reflect the deduction of taxes that a shareholder would pay on Portfolio distributions or the redemption of Portfolio shares.
(1) | | The Lehman Brothers Intermediate U.S. Government/Credit Index is a fixed income market capitalization-weighted index of investment-grade (BBB-/Baa3) or higher publicly-traded fixed-rate U.S. government, U.S. agency, and corporate issues with remaining maturities of at least one year and not longer than ten years. To be included in the Index, bonds must have an outstanding par value of at least $250 million. Non-dollar denominated and convertible bonds are excluded from the Index. The Index is unmanaged and its returns do not include any sales charges or fees. Such costs would lower performance. It is not possible to invest directly in an index. |
(2) | | The Lipper Short-Intermediate Investment Grade Debt Funds Index is an equally weighted performance index of the largest qualifying funds (based on net assets) in the Lipper Short-Intermediate Investment Grade Debt Funds classification. The Index, which is adjusted for capital gains distributions and income dividends, is unamanaged and should not be considered an investment. There are currently 30 funds represented in this Index. As of the date of this report, the Portfolio is in the Lipper Short-Intermediate Investment Grade Debt Funds classification. |
(3) | | Total returns for the Portfolio reflect expenses waived and/or reimbursed, if applicable, by the Adviser. Without such waivers and/or reimbursements, total returns would have been lower. Fee waivers and/or reimbursements are voluntary |
82
2007 Annual Report
September 30, 2007
Investment Overview (cont’d)
Intermediate Duration Portfolio
| | and the Adviser reserves the right to commence or terminate any waiver and/or reimbursement at any time. Returns for periods less than one year are not annualized. |
(4) | | Commenced operations on October 3, 1994. |
(5) | | Commenced operations on August 16, 1999. |
(6) | | Commenced operations on September 28, 2007 and therefore do not have any historical performance to report as the date of this report. |
(7) | | For comparative purposes, average annual since inception returns listed for the Indexes refer to the inception date or initial offering of the respective share class of the Portfolio, not the inception of the Indexes. |
Expense Examples
As a shareholder of the Portfolio, you incur two types of costs: (1) transactional costs, including redemption fees; (2) ongoing costs, including management fees, shareholder servicing fees (in the case of Investment Class); and other Portfolio expenses. These examples are intended to help you understand your ongoing costs (in dollars) of investing in the Portfolio and to compare these costs with the ongoing costs of investing in other mutual funds.
The examples are based on an investment of $1,000 invested at the beginning of the six-month period ended September 30, 2007 and held for the entire six-month period.
Actual Expenses
The first line of the tables below provides information about actual account values and actual expenses. You may use the information in this line, together with the amount you invested, to estimate the expenses that you paid over the period. Simply divide your account value by $1,000 (for example, an $8,600 account value divided by $1,000 = 8.6), then multiply the result by the number in the first line under the heading entitled “Expenses Paid During Period” to estimate the expenses you paid on your account during this period.
Please note that “Expenses Paid During Period” are grossed up to reflect Portfolio expenses prior to the effect of Expense Offset (See Note E in the Notes to Financial Statements). Therefore, the annualized net expense ratios may differ from the ratio of expenses to average net assets shown in the Financial Highlights.
Please note that the Portfolio’s Adviser Class Share commenced operations on September 28, 2007; therefore, actual expenses paid during the period reflect activity from September 28, 2007 through September 30, 2007.
Hypothetical Example for Comparison Purposes
The second line of the tables below provides information about hypothetical account values and hypothetical expenses based on the Portfolio’s actual expense ratio and an assumed rate of return of 5% per year before expenses, which is not the Portfolio’s actual return. The hypothetical account values and expenses may not be used to estimate the actual ending account balance or expenses you paid for the period. You may use this information to compare the ongoing costs of investing in the Portfolio and other funds. To do so, compare this 5% hypothetical example with the 5% hypothetical examples that appear in the shareholder reports of the other funds.
Please note that while the Portfolio’s Adviser Class Share commenced operations on September 28, 2007, the hypothetical expenses paid during the period reflect projected activity for the full six month period for the purposes of comparability. This projection assumes that the annualized expense ratio for the Portfolio’s Adviser Class Share was in effect during the period from April 1, 2007 to September, 2007.
Please note that the expenses shown in the table are meant to highlight your ongoing costs only and do not reflect any transactional costs, such as redemption fees. Therefore, the second line of the table is useful in comparing ongoing costs only, and will not help you determine the relative total costs of owning different funds. In addition, if these transactional costs were included, your costs would have been higher.
| | | | | | Expenses Paid | |
| | | | Ending Account | | During Period* | |
| | Beginning | | Value | | April 1, 2007 — | |
| | Account Value | | September 30, | | September 30, | |
| | April 1, 2007 | | 2007 | | 2007 | |
Institutional Class | | | | | | | |
Actual | | $ | 1,000.00 | | $ | 1,023.10 | | $ | 2.64 | |
Hypothetical (5% average annual return before expenses) | | 1,000.00 | | 1,022.46 | | 2.64 | |
| | | | | | | |
Investment Class | | | | | | | |
Actual | | 1,000.00 | | 1,023.40 | | 3.40 | |
Hypothetical (5% average annual return before expenses) | | 1,000.00 | | 1,021.71 | | 3.40 | |
| | | | | | | | | | |
| | | | | | Expenses Paid | |
| | | | | | During Period* | |
| | | | Ending Account | | September 28, | |
| | | | Value | | 2007 — | |
| | Beginning | | September 30, | | September 30, | |
| | Account Value | | 2007 | | 2007 | |
Adviser Class | | | | | | | |
Actual | | $ | 1,000.00 | | $ | 1,000.00 | | $ | 0.10 | |
Hypothetical (5% average annual return before expenses) | | 1,000.00 | | 1,019.20 | | 5.92 | |
| | | | | | | | | | |
* Expenses are equal to Institutional Class’, Investment Class’ and Adviser Class’ annualized net expense ratios of 0.52%, 0.67% and 1.17%, respectively, multiplied by the average account value over the period, multiplied by 183/365 for the Institutional and Investment Class (to reflect the one-half year period) and multiplied by 3/365 for the Adviser Class (to reflect the actual days in the period).
83
2007 Annual Report
September 30, 2007
Investment Overview (cont’d)
Intermediate Duration Portfolio
Graphic Presentation of Portfolio Holdings
The following graph depicts the Portfolio’s holdings by industry and/or investment type, as a percentage of total investments.
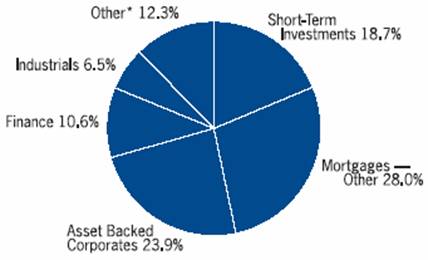
* Industries and/or investment types which do not appear in the above graph, as well as those which represent less than 5% of total investments, if applicable, are included in the category labeled “Other.”
84
| 2007 Annual Report |
| |
| September 30, 2007 |
Portfolio of Investments |
|
Intermediate Duration Portfolio |
| | Face | | | |
| | Amount | | Value | |
| | (000) | | (000) | |
Fixed Income Securities (81.9%) | | | | | |
Agency Adjustable Rate Mortgages (1.2%) | | | | | |
Government National Mortgage Association, | | | | | |
5.33%, 4/1/37 | | $ | 542 | | $ | 542 | |
5.73%, 1/1/37 | | 928 | | 936 | |
5.75%, 7/20/25 - 9/20/27 | | 43 | | 44 | |
6.13%, 11/20/25 - 11/20/27 | | 51 | | 51 | |
6.37%, 3/20/25 - 1/20/28 | | 142 | | 144 | |
| | | | 1,717 | |
Agency Fixed Rate Mortgages (3.5%) | | | | | |
Federal Home Loan Mortgage Corp., | | | | | |
Conventional Pools: | | | | | |
11.00%, 7/1/13 | | 3 | | 4 | |
Gold Pools: | | | | | |
7.00%, 6/1/28 - 6/1/32 | | 93 | | 96 | |
7.50%, 8/1/30 - 1/1/31 | | 111 | | 116 | |
8.00%, 6/1/30 - 9/1/31 | | 412 | | 437 | |
8.50%, 7/1/30 - 7/1/31 | | 75 | | 80 | |
9.50%, 12/1/22 | | 18 | | 19 | |
10.00%, 6/1/17 | | 17 | | 19 | |
Federal National Mortgage Association, | | | | | |
Conventional Pools: | | | | | |
5.50%, 4/1/37 | | 697 | | 701 | |
6.50%, 7/1/30 - 5/1/33 | | 368 | | 377 | |
7.00%, 1/1/32 - 11/1/34 | | 1,555 | | 1,620 | |
7.50%, 8/1/29 - 3/1/32 | | 801 | | 838 | |
8.00%, 10/1/30 - 9/1/31 | | 124 | | 130 | |
8.50%, 8/1/30 | | 7 | | 8 | |
9.50%, 12/1/17 - 12/1/21 | | 353 | | 384 | |
10.00%, 7/1/18 - 5/1/22 | | 12 | | 14 | |
Government National Mortgage Association, | | | | | |
Various Pools: | | | | | |
9.50%, 11/15/16 - 12/15/21 | | 115 | | 125 | |
10.00%, 4/15/16 - 3/15/25 | | 232 | | 263 | |
10.50%, 1/15/18 - 2/15/18 | | 33 | | 38 | |
11.00%, 3/15/10 - 6/15/20 | | 83 | | 92 | |
11.50%, 6/15/13 | | 5 | | 5 | |
12.00%, 5/15/14 | | 7 | | 8 | |
12.50%, 12/15/10 | | @— | | 1 | |
| | | | 5,375 | |
Asset Backed Corporates (24.1%) | | | | | |
Argent Securities, Inc., | | | | | |
5.18%, 10/25/36 | | (h)637 | | 632 | |
Bayview Financial Acquisition Trust, | | | | | |
5.24%, 11/28/36 | | (h)311 | | 309 | |
Bear Stearns Asset Backed Securities, Inc., | | | | | |
5.23%, 1/25/37 | | (h)509 | | 506 | |
5.33%, 9/25/34 | | (h)105 | | 105 | |
Capital Auto Receivables Asset Trust, | | | | | |
4.05%, 7/15/09 | | 617 | | 615 | |
4.98%, 5/15/11 | | 1,075 | | 1,074 | |
5.31%, 10/20/09 | | (e)1,250 | | 1,250 | |
5.38%, 7/20/10 | | (h)1,000 | | 992 | |
Capital One Auto Finance Trust, | | | | | |
5.07%, 7/15/11 | | $ | 575 | | $ | 574 | |
Caterpillar Financial Asset Trust, | | | | | |
3.90%, 2/25/09 | | 166 | | 166 | |
5.57%, 5/25/10 | | 925 | | 928 | |
CIT Equipment Collateral, | | | | | |
5.07%, 2/20/10 | | 600 | | 596 | |
Citibank Credit Card Issuance Trust, | | | | | |
5.20%, 3/22/12 | | (h)900 | | 896 | |
5.65%, 9/20/19 | | 700 | | 698 | |
Citigroup Mortgage Loan Trust, Inc., | | | | | |
5.20%, 8/25/36 - 1/25/37 | | (h)865 | | 863 | |
CNH Equipment Trust, | | | | | |
4.02%, 4/15/09 | | 323 | | 323 | |
4.27%, 1/15/10 | | 1,355 | | 1,350 | |
5.20%, 6/15/10 | | 500 | | 499 | |
Countrywide Asset Backed Certificates, | | | | | |
5.24%, 6/25/35 | | (h)572 | | 565 | |
Credit Based Asset Servicing and Securitization, LLC, | | | | | |
5.19%, 6/25/36 | | (h)278 | | 277 | |
5.20%, 1/25/37 | | (h)869 | | 863 | |
Ford Credit Auto Owner Trust, | | | | | |
5.26%, 10/15/10 | | 1,000 | | 1,001 | |
Fremont Home Loan Owner Trust, | | | | | |
5.18%, 10/25/36 | | (h)626 | | 621 | |
GE Equipment Small Ticket, LLC, | | | | | |
4.38%, 7/22/09 | | (e)877 | | 874 | |
4.88%, 10/22/09 | | (e)1,633 | | 1,631 | |
GS Auto Loan Trust, | | | | | |
5.37%, 12/15/10 | | 925 | | 926 | |
GSAMP Trust, | | | | | |
5.20%, 6/25/36 - 1/25/37 | | (h)1,680 | | 1,667 | |
Harley-Davidson Motorcycle Trust, | | | | | |
2.63%, 11/15/10 | | 152 | | 151 | |
2.76%, 5/15/11 | | 603 | | 600 | |
3.76%, 12/17/12 | | 510 | | 502 | |
4.07%, 2/15/12 | | 1,150 | | 1,139 | |
4.41%, 6/15/12 | | 1,500 | | 1,460 | |
Hertz Vehicle Financing, LLC, | | | | | |
4.93%, 2/25/10 | | (e)1,325 | | 1,322 | |
Honda Auto Receivables Owner Trust, | | | | | |
4.85%, 10/19/09 | | 1,466 | | 1,464 | |
Hyundai Auto Receivables Trust, | | | | | |
3.98%, 11/16/09 | | 538 | | 535 | |
Nationstar Home Equity Loan Trust, | | | | | |
5.20%, 9/25/36 | | (h)378 | | 377 | |
Nissan Auto Receivables Grantor Trust, | | | | | |
5.44%, 4/15/10 | | 1,150 | | 1,153 | |
Nissan Auto Receivables Owner Trust, | | | | | |
3.99%, 7/15/09 | | 707 | | 703 | |
Residential Asset Mortgage Products, Inc., | | | | | |
5.22%, 10/25/36 | | (h)471 | | 468 | |
Residential Asset Securities Corp., | | | | | |
5.21%, 10/25/36 | | (h)347 | | 345 | |
The accompanying notes are an integral part of the financial statements.
85
2007 Annual Report
September 30, 2007
Portfolio of Investments (cont’d)
Intermediate Duration Portfolio
| | Face | | | |
| | Amount | | Value | |
| | (000) | | (000) | |
Asset Backed Corporates (cont’d) | | | | | |
Securitized Asset Backed Receivables, LLC Trust, | | | | | |
5.21%, 11/25/36 | | $ | (h)731 | | $ | 724 | |
5.26%, 5/25/37 | | (h)692 | | 686 | |
SLM Student Loan Trust, | | | | | |
5.35%, 10/25/14 | | (h)768 | | 768 | |
Soundview Home Equity Loan Trust, | | | | | |
5.21%, 1/25/37 - 6/25/37 | | (h)1,090 | | 1,083 | |
Structured Asset Securities Corp., | | | | | |
5.22%, 6/25/37 | | (h)679 | | 674 | |
Terwin Mortgage Trust, | | | | | |
5.60%, 12/25/34 | | (h)151 | | 147 | |
TXU Electric Delivery Transition Bond Co., | | | | | |
4.81%, 11/17/14 | | 175 | | 174 | |
Volkswagen Auto Loan Enhanced Trust, | | | | | |
4.80%, 7/20/09 | | 1,130 | | 1,128 | |
Wachovia Auto Owner Trust, | | | | | |
4.06%, 9/21/09 | | 302 | | 300 | |
Whole Auto Loan Trust, | | | | | |
2.58%, 3/15/10 | | 175 | | 173 | |
| | | | 36,877 | |
Collateralized Mortgage Obligations — Agency Collateral Series (0.4%) | | | | | |
Federal Home Loan Mortgage Corp., | | | | | |
Inv Fl IO | | | | | |
2.25%, 3/15/32 | | 443 | | 39 | |
IO | | | | | |
5.00%, 9/15/14 | | 268 | | 7 | |
6.00%, 5/1/31 | | 222 | | 51 | |
6.50%, 4/1/28 - 8/1/28 | | 501 | | 118 | |
7.00%, 2/15/32 | | 82 | | 16 | |
8.00%, 1/1/28 - 6/1/31 | | 18 | | 5 | |
IO PAC | | | | | |
6.00%, 4/15/32 | | 231 | | 28 | |
Federal National Mortgage Association, | | | | | |
IO | | | | | |
6.00%, 5/25/33 - 6/25/33 | | 645 | | 149 | |
6.50%, 6/1/31 | | 144 | | 36 | |
7.00%, 4/25/33 | | 272 | | 62 | |
8.00%, 5/1/30 | | 10 | | 3 | |
9.00%, 11/1/26 | | 33 | | 8 | |
IO PAC | | | | | |
8.00%, 8/18/27 | | 33 | | 8 | |
Government National Mortgage Association, | | | | | |
Inv Fl IO | | | | | |
2.20%, 12/16/25 | | 163 | | 15 | |
2.25%, 9/16/27 - 5/16/32 | | 208 | | 18 | |
| | | | 563 | |
Collateralized Mortgage Obligations — Non Agency Collateral Series (1.5%) | | | | | |
Countrywide Alternative Loan Trust, | | | | | |
IO | | | | | |
1.51%, 3/20/47 | | 5,129 | | 264 | |
1.66%, 12/20/35 | | (e)(h)7,848 | | 209 | |
2.07%, 12/20/46 | | 6,118 | | 273 | |
2.09%, 2/25/37 | | $ | 8,914 | | $ | 429 | |
2.14%, 12/20/35 | | (e)(h)10,090 | | 400 | |
Harborview Mortgage Loan Trust, | | | | | |
IO | | | | | |
1.24%, 6/19/35 | | (h)7,105 | | 151 | |
1.53%, 5/19/35 | | (h)8,869 | | 191 | |
1.89%, 3/19/37 | | (h)7,734 | | 329 | |
PO | | | | | |
3/19/37 | | 4 | | 3 | |
| | | | 2,249 | |
Finance (10.7%) | | | | | |
AIG SunAmerica Global Financing VI, | | | | | |
6.30%, 5/10/11 | | (e)610 | | 629 | |
American General Finance Corp., | | | | | |
4.63%, 5/15/09 | | 755 | | 749 | |
AXA Financial, Inc., | | | | | |
6.50%, 4/1/08 | | 295 | | 297 | |
Bank of America Corp., | | | | | |
3.38%, 2/17/09 | | 245 | | 240 | |
3.88%, 1/15/08 | | 165 | | 164 | |
Bank of New York Co., Inc. (The), | | | | | |
3.80%, 2/1/08 | | 250 | | 249 | |
Bank One Corp., | | | | | |
6.00%, 2/17/09 | | 455 | | 461 | |
Capmark Financial Group, Inc., | | | | | |
5.88%, 5/10/12 | | (e)195 | | 178 | |
6.30%, 5/10/17 | | (e)85 | | 74 | |
Catlin Insurance Co., Ltd., | | | | | |
7.25% | | (e)(h)(o)250 | | 236 | |
CIT Group, Inc., | | | | | |
3.65%, 11/23/07 | | 285 | | 284 | |
4.75%, 8/15/08 | | 100 | | 99 | |
Countrywide Home Loans, Inc., | | | | | |
3.25%, 5/21/08 | | 237 | | 228 | |
Farmers Insurance Exchange, | | | | | |
8.63%, 5/1/24 | | (e)300 | | 345 | |
General Electric Capital Corp., | | | | | |
4.75%, 9/15/14 | | 95 | | 91 | |
5.73%, 3/12/10 | | (h)515 | | 513 | |
Goldman Sachs Capital II, | | | | | |
5.79%, | | (h)(o)260 | | 246 | |
HSBC Finance Corp., | | | | | |
4.13%, 12/15/08 | | 90 | | 89 | |
6.40%, 6/17/08 | | 270 | | 272 | |
6.75%, 5/15/11 | | 285 | | 297 | |
Huntington National Bank (The), | | | | | |
4.38%, 1/15/10 | | 300 | | 294 | |
iStar Financial, Inc., | | | | | |
6.07%, 3/9/10 | | (h)320 | | 298 | |
John Hancock Global Funding II, | | | | | |
7.90%, 7/2/10 | | (e)715 | | 767 | |
JPMorgan Chase & Co., | | | | | |
6.00%, 2/15/09 | | 275 | | 279 | |
The accompanying notes are an integral part of the financial statements.
86
| 2007 Annual Report |
| |
| September 30, 2007 |
Portfolio of Investments (cont’d)
Intermediate Duration Portfolio
| | Face | | | |
| | Amount | | Value | |
| | (000) | | (000) | |
Finance (cont’d) | | | | | |
Marshall & Ilsley Bank, | | | | | |
3.80%, 2/8/08 | | $ | 410 | | $ | 408 | |
Mantis Reef Ltd., | | | | | |
4.69%, 11/14/08 | | (e)255 | | 254 | |
MBNA Corp., | | | | | |
5.79%, 5/5/08 | | (h)625 | | 627 | |
Monumental Global Funding II, | | | | | |
3.85%, 3/3/08 | | (e)760 | | 755 | |
Nationwide Building Society, | | | | | |
4.25%, 2/1/10 | | (e)325 | | 318 | |
Platinum Underwriters Holdings Ltd., | | | | | |
6.37%, 11/16/07 | | 350 | | 350 | |
Popular North America, Inc., | | | | | |
5.65%, 4/15/09 | | 155 | | 156 | |
Pricoa Global Funding I, | | | | | |
3.90%, 12/15/08 | | (e)795 | | 782 | |
Simon Property Group, LP, | | | | | |
6.38%, 11/15/07 | | 355 | | 355 | |
Sovereign Bancorp, Inc., | | | | | |
5.44%, 3/23/10 | | (h)425 | | 425 | |
Sovereign Bank, | | | | | |
4.00%, 2/1/08 | | 100 | | 99 | |
TIAA Global Markets, Inc., | | | | | |
4.13%, 11/15/07 | | (e)630 | | 629 | |
Two-Rock Pass Through Trust, | | | | | |
6.44% | | (e)(h)(o)290 | | 245 | |
Unicredit Luxembourg Finance S.A., | | | | | |
5.41%, 10/24/08 | | (e)(h)470 | | 470 | |
USB Capital IX, | | | | | |
6.19% | | (h)(o)260 | | 260 | |
Wachovia Capital Trust III, | | | | | |
5.80% | | (h)(o)720 | | 716 | |
Washington Mutual Preferred Funding II, | | | | | |
6.67% | | (e)(h)(o)300 | | 259 | |
Washington Mutual, Inc., | | | | | |
8.25%, 4/1/10 | | 365 | | 385 | |
World Financial Properties, | | | | | |
6.91%, 9/1/13 | | (e)821 | | 848 | |
6.95%, 9/1/13 | | (e)199 | | 206 | |
Xlliac Global Funding, | | | | | |
4.80%, 8/10/10 | | (e)375 | | 373 | |
| | | | 16,299 | |
Industrials (6.5%) | | | | | |
America West Airlines, Inc., | | | | | |
7.10%, 4/2/21 | | 228 | | 237 | |
American Honda Finance Corp., | | | | | |
3.85%, 11/6/08 | | (e)325 | | 320 | |
AT&T, Inc., | | | | | |
5.30%, 11/15/10 | | 160 | | 162 | |
Brookfield Asset Management, Inc., | | | | | |
5.80%, 4/25/17 | | 30 | | 30 | |
7.13%, 6/15/12 | | 300 | | 322 | |
Burlington Northern Santa Fe Corp., | | | | | |
6.13%, 3/15/09 | | $ | 140 | | $ | 142 | |
Clorox Co., | | | | | |
5.83%, 12/14/07 | | (h)485 | | 486 | |
Comcast Cable Communications, LLC, | | | | | |
6.75%, 1/30/11 | | 235 | | 244 | |
Comcast Corp., | | | | | |
6.50%, 1/15/15 | | 75 | | 78 | |
Comcast LCI Holdings, | | | | | |
7.63%, 2/15/08 | | 40 | | 40 | |
Consumers Energy Co., | | | | | |
4.00%, 5/15/10 | | 100 | | 97 | |
4.80%, 2/17/09 | | 175 | | 174 | |
Cooper Industries, Inc., | | | | | |
5.25%, 11/15/12 | | 225 | | 225 | |
CVS Lease Pass Through, | | | | | |
5.75%, 6/1/17 | | 125 | | 122 | |
6.04%, 12/10/28 | | (e)207 | | 201 | |
CVS/Caremark Corp., | | | | | |
3.88%, 11/1/07 | | 65 | | 65 | |
5.75%, 8/15/11 | | 65 | | 66 | |
Deutsche Telekom International Finance B.V., | | | | | |
8.00%, 6/15/10 | | 435 | | 466 | |
FBG Finance Ltd., | | | | | |
5.13%, 6/15/15 | | (e)255 | | 241 | |
Federated Department Stores, Inc., | | | | | |
6.30%, 4/1/09 | | 265 | | 268 | |
6.63%, 9/1/08 | | 80 | | 81 | |
FedEx Corp., | | | | | |
5.50%, 8/15/09 | | 145 | | 147 | |
France Telecom S.A., | | | | | |
7.75%, 3/1/11 | | 290 | | 312 | |
Fred Meyer, Inc., | | | | | |
7.45%, 3/1/08 | | 300 | | 302 | |
General Mills, Inc., | | | | | |
3.88%, 11/30/07 | | 85 | | 85 | |
Home Depot, Inc. (The), | | | | | |
5.82%, 12/16/09 | | (h)330 | | 326 | |
ICI Wilmington, Inc., | | | | | |
4.38%, 12/1/08 | | 190 | | 189 | |
LG Electronics, Inc., | | | | | |
5.00%, 6/17/10 | | (e)165 | | 163 | |
May Department Stores Co. (The), | | | | | |
5.95%, 11/1/08 | | 295 | | 295 | |
Miller Brewing Co., | | | | | |
4.25%, 8/15/08 | | (e)280 | | 277 | |
Sara Lee Corp., | | | | | |
2.75%, 6/15/08 | | 380 | | 373 | |
Systems 2001 Asset Trust, LLC, | | | | | |
6.66%, 9/15/13 | | (e)237 | | 250 | |
Telecom Italia Capital S.A., | | | | | |
4.00%, 1/15/10 | | 335 | | 326 | |
The accompanying notes are an integral part of the financial statements.
87
2007 Annual Report
September 30, 2007
Portfolio of Investments (cont’d)
Intermediate Duration Portfolio
| | Face | | | |
| | Amount | | Value | |
| | (000) | | (000) | |
Industrials (cont’d) | | | | | |
Textron Financial Corp., | | | | | |
4.13%, 3/3/08 | | $ | 305 | | $ | 304 | |
5.13%, 2/3/11 | | 95 | | 95 | |
Time Warner, Inc., | | | | | |
5.73%, 11/13/09 | | (h)445 | | 440 | |
Union Pacific Corp., | | | | | |
6.63%, 2/1/08 | | 416 | | 418 | |
UnitedHealth Group, Inc., | | | | | |
4.13%, 8/15/09 | | 150 | | 147 | |
5.66%, 3/2/09 | | (h)145 | | 145 | |
Valero Energy Corp., | | | | | |
3.50%, 4/1/09 | | 205 | | 201 | |
Verizon Global Funding Corp., | | | | | |
7.25%, 12/1/10 | | 140 | | 149 | |
Verizon New England, Inc., | | | | | |
6.50%, 9/15/11 | | 200 | | 207 | |
Viacom, Inc., | | | | | |
5.75%, 4/30/11 | | 300 | | 303 | |
Vodafone Group plc, | | | | | |
5.29%, 12/28/07 | | (h)215 | | 215 | |
Yum! Brands, Inc., | | | | | |
8.88%, 4/15/11 | | 190 | | 212 | |
| | | | 9,948 | |
Mortgages — Other (28.2%) | | | | | |
Alliance Bancorp., | | | | | |
5.37%, 7/25/37 | | (h)792 | | 778 | |
American Home Mortgage Assets, | | | | | |
5.26%, 3/25/47 | | (h)856 | | 834 | |
5.32%, 6/25/47 | | (h)1,132 | | 1,092 | |
5.43%, 6/25/47 | | (h)467 | | 419 | |
American Home Mortgage Investment, | | | | | |
5.32%, 5/25/47 | | (h)1,098 | | 1,078 | |
5.51%, 3/25/46 | | (h)350 | | 285 | |
5.85%, 11/25/45 | | (h)375 | | 305 | |
Banc of America Funding Corp., | | | | | |
5.85%, 9/20/35 | | (h)286 | | 283 | |
Bear Stearns Mortgage Funding Trust, | | | | | |
5.29%, 12/25/36 | | (h)974 | | 956 | |
5.30%, 3/25/37 | | (h)997 | | 974 | |
5.31%, 10/25/36 | | (h)832 | | 814 | |
5.33%, 9/25/36 | | (h)930 | | 910 | |
Citigroup Mortgage Loan Trust, Inc., | | | | | |
5.21%, 1/25/37 | | (h)440 | | 439 | |
Countrywide Alternative Loan Trust, | | | | | |
5.25%, 7/25/46 | | (e)62 | | 62 | |
5.27%, 4/25/47 | | (h)883 | | 862 | |
5.32%, 11/25/46 | | (h)566 | | 554 | |
5.36%, 6/25/47 | | (h)931 | | 904 | |
5.42%, 6/25/47 | | (h)964 | | 943 | |
5.76%, 11/20/35 | | (h)437 | | 435 | |
5.89%, 12/20/35 | | (h)804 | | 784 | |
6.50%, 10/25/46 | | (e)97 | | 96 | |
Countrywide Home Loan Mortgage Pass Through Trust, | | | | | |
5.40%, 4/25/35 | | $ | (h)1,099 | | $ | 1,077 | |
5.43%, 3/25/35 | | (h)180 | | 179 | |
Deutsche ALT-A Securities, Inc., NIM Trust, | | | | | |
6.75%, 2/25/47 | | (e)289 | | 278 | |
Deutsche ALT-A Securities, Inc., Alternate Loan Trust, | | | | | |
5.28%, 2/25/47 | | (h)967 | | 946 | |
5.81%, 2/25/47 | | (h)310 | | 293 | |
Downey Savings & Loan Association Mortgage Loan Trust, | | | | | |
5.64%, 4/19/38 | | (h)747 | | 729 | |
Federal National Mortgage Association, | | | | | |
5.19%, 12/25/36 | | 517 | | 513 | |
Greenpoint Mortgage Funding Trust, | | | | | |
5.30%, 4/25/47 | | (h)983 | | 961 | |
5.33%, 3/25/47 | | (h)741 | | 726 | |
5.45%, 3/25/36 | | (h)1,486 | | 1,461 | |
GS Mortgage Securities Corp., | | | | | |
6.25%, 1/25/37 | | (e)236 | | 234 | |
GSR Mortgage Loan Trust, | | | | | |
5.39%, 8/25/46 | | (h)741 | | 721 | |
Harborview Mortgage Loan Trust, | | | | | |
5.59%, 1/19/38 | | (h)221 | | 220 | |
5.63%, 3/19/37 | | (h)1,012 | | 987 | |
5.65%, 3/19/38 | | (h)721 | | 703 | |
5.68%, 11/19/36 | | (h)858 | | 840 | |
5.69%, 1/19/38 | | (h)955 | | 933 | |
5.74%, 3/19/37 | | (h)1,207 | | 1,187 | |
5.79%, 7/19/45 | | (h)328 | | 323 | |
5.88%, 11/19/35 | | (h)645 | | 628 | |
Harborview NIM Corp., | | | | | |
6.40%, 3/19/37 | | (e)170 | | 169 | |
Indymac Index Mortgage Loan Trust, | | | | | |
5.23%, 2/25/37 | | (h)662 | | 657 | |
5.34%, 11/25/36 | | (h)650 | | 636 | |
5.35%, 4/25/46 | | (h)667 | | 654 | |
5.63%, 1/25/35 | | (h)362 | | 310 | |
Luminent Mortgage Trust, | | | | | |
5.37%, 4/25/36 - 10/25/46 | | (h)1,824 | | 1,782 | |
Mastr Adjustable Rate Mortgages Trust, | | | | | |
5.24%, 5/25/47 | | (h)393 | | 392 | |
5.53%, 1/25/47 | | (h)400 | | 318 | |
Merrill Lynch Mortgage Investors, Inc., | | | | | |
5.25%, 8/25/35 | | (h)83 | | 83 | |
Residential Accredit Loans, Inc., | | | | | |
5.29%, 1/25/37 - 3/25/47 | | (h)2,215 | | 2,163 | |
5.32%, 12/25/36 | | (h)776 | | 762 | |
5.33%, 6/25/37 | | (h)389 | | 381 | |
5.39%, 2/25/46 - 5/25/47 | | (h)1,812 | | 1,752 | |
5.40%, 2/25/46 | | (h)530 | | 523 | |
5.43%, 6/25/37 | | (h)365 | | 350 | |
Structured Adjustable Rate Mortgage Loan Trust, | | | | | |
5.47%, 8/25/35 | | (h)647 | | 636 | |
Structured Asset Mortgage Investments, Inc., | | | | | |
5.31%, 9/25/47 | | (h)1,139 | | 1,106 | |
5.33%, 10/25/36 | | (h)882 | | 866 | |
The accompanying notes are an integral part of the financial statements.
88
| 2007 Annual Report |
| |
| September 30, 2007 |
Portfolio of Investments (cont’d)
Intermediate Duration Portfolio
| | Face | | | |
| | Amount | | Value | |
| | (000) | | (000) | |
Mortgages — Other (cont’d) | | | | | |
Washington Mutual, Inc., | | | | | |
5.38%, 11/25/45 - 12/25/45 | | $ | (h)822 | | $ | 818 | |
5.39%, 10/25/45 | | (h)223 | | 222 | |
5.40%, 4/25/45 | | (h)733 | | 722 | |
5.42%, 8/25/45 | | (h)95 | | 95 | |
| | | | 43,143 | |
Sovereign (0.4%) | | | | | |
Province of Quebec, Canada, | | | | | |
6.13%, 1/22/11 | | 550 | | 574 | |
U.S. Treasury Security (3.7%) | | | | | |
U.S. Treasury Note, | | | | | |
3.88%, 2/15/13 | | 5,825 | | 5,730 | |
Utilities (1.7%) | | | | | |
Appalachian Power Co., | | | | | |
3.60%, 5/15/08 | | 355 | | 351 | |
Arizona Public Service Co., | | | | | |
5.80%, 6/30/14 | | 330 | | 327 | |
Carolina Power & Light Co., | | | | | |
5.13%, 9/15/13 | | 245 | | 240 | |
CenterPoint Energy Resources Corp., | | | | | |
7.88%, 4/1/13 | | 100 | | 109 | |
Columbus Southern Power Co., | | | | | |
4.40%, 12/1/10 | | 100 | | 98 | |
Consolidated Natural Gas Co., | | | | | |
6.25%, 11/1/11 | | 160 | | 165 | |
Detroit Edison Co., | | | | | |
6.13%, 10/1/10 | | 155 | | 160 | |
Entergy Gulf States, Inc., | | | | | |
5.98%, 12/1/09 | | (h)215 | | 213 | |
NiSource Finance Corp., | | | | | |
6.06%, 11/23/09 | | (h)165 | | 164 | |
Ohio Power Co., | | | | | |
6.00%, 6/1/16 | | 190 | | 191 | |
Public Service Electric & Gas Co., | | | | | |
5.00%, 1/1/13 | | 145 | | 141 | |
TXU Energy Co., LLC, | | | | | |
6.13%, 3/15/08 | | 125 | | 126 | |
Wisconsin Electric Power Co., | | | | | |
3.50%, 12/1/07 | | 395 | | 394 | |
| | | | 2,679 | |
Total Fixed Income Securities (Cost $126,819) | | | | $ | 125,154 | |
| | | | | | |
| | Shares | | | |
Preferred Stock (0.1%) | | | | | |
Mortgages — Other (0.1%) | | | | | |
Home Ownership Funding Corp., | | | | | |
13.33% (Cost $89) | | (e)650 | | 97 | |
| | | | | |
| | No. of
Contracts | | Value
(000) | |
Put Options Purchased (0.0%) | | | | | |
90 Day EuroDollar | | | | | |
12/07 @ $94.75 | | (a)198 | | $ | 21 | |
3/08 @ $94.50 | | (a)42 | | 2 | |
Total Put Options Purchased (Cost $44) | | | | 23 | |
| | | | | |
| | Shares | | | |
Short-Term Investments (18.8%) | | | | | |
Investment Company (18.3%) | | | | | |
Morgan Stanley Institutional Liquidity | | | | | |
Money Market Portfolio | | | | | |
— Institutional Class | | (p)27,992,537 | | 27,993 | |
| | | | | |
| | Face | | | |
| | Amount | | | |
| | (000) | | | |
U.S. Treasury Security (0.5%) | | | | | |
U.S. Treasury Bill, | | | | | |
3.82%, 1/10/08 | | $ | (j)(r)850 | | 841 | |
Total Short-Term Investments (Cost $28,831) | | | | 28,834 | |
Total Investments (100.8%) (Cost $155,783) | | | | 154,108 | |
Liabilities in Excess of Other Assets (-0.8%) | | | | (1,236 | ) |
Net Assets (100%) | | | | $ | 152,872 | |
(a) | Non-income producing security. |
(e) | 144A security — Certain conditions for public sale may exist. Unless otherwise noted, these securities are deemed to be liquid. |
(h) | Variable/Floating Rate Security — Interest rate changes on these instruments are based on changes in a designated rate. The rates shown are those in effect on September 30, 2007. |
(j) | All or a portion of the security was pledged to cover margin requirements for futures contracts. |
(o) | Perpetual — Security does not have a predetermined maturity date. Rate for this security is fixed for a period of time then reverts to a floating rate. The interest rate shown is the rate in effect at September 30, 2007. |
(p) | See Note F within the Notes to Financial Statements regarding investment in Morgan Stanley Institutional Liquidity Government Portfolio — Institutional Class, Morgan Stanley Institutional Liquidity Money Market Portfolio —Institutional Class and/or Morgan Stanley Institutional Liquidity Tax-Exempt Portfolio — Institutional Class. |
(r) | Rate shown is the Yield to Maturity at September 30, 2007. |
@ | Face Amount/Value is less than $500. |
Inv Fl | Inverse Floating Rate — Interest rate fluctuates with an inverse relationship to an associated interest rate. Indicated rate is the effective rate at September 30, 2007. |
IO | Interest Only |
PAC | Planned Amortization Class |
PO | Principal Only |
The accompanying notes are an integral part of the financial statements.
89
2007 Annual Report
September 30, 2007
Portfolio of Investments (cont’d)
Intermediate Duration Portfolio
Futures Contracts:
The Portfolio had the following futures contract(s) open at period end:
| | | | | | | | Net | |
| | | | | | | | Unrealized | |
| | Number | | | | | | Appreciation | |
| | of | | Value | | Expiration | | (Depreciation) | |
| | Contracts | | (000) | | Date | | (000) | |
Long: | | | | | | | | | |
U.S. Treasury | | | | | | | | | |
2 yr. Note | | 238 | | $ | 49,277 | | Dec-07 | | $ | 189 | |
U.S. Treasury | | | | | | | | | |
5yr. Note | | 269 | | 28,791 | | Dec-07 | | 188 | |
U.S. Treasury | | | | | | | | | |
10 yr. Note | | 48 | | 5,246 | | Dec-07 | | 31 | |
| | | | | | | | | |
Short: | | | | | | | | | |
U.S. Treasury | | | | | | | | | |
Short Bond | | 170 | | 18,928 | | Dec-07 | | 14 | |
| | | | | | | | $ | 422 | |
| | | | | | | | | | | |
Credit Default Swap Contracts
The Portfolio had the following credit default swap agreement(s) open at period end:
| | | | | | | | | | Unrealized | |
| | | | | | | | | | Appreciation | |
| | Buy/Sell | | Value | | Pay/Receive | | Termination | | (Depreciation) | |
Swap Counterparty and Reference Obligation | | Protection | | (000) | | Fixed Rate | | Date | | (000) | |
Citigroup | | Buy | | $ | 200 | | 0.43 | % | 3/20/12 | | $ | @— | |
Tyco International Ltd., Zero Coupon, 11/17/20 | | | | | | | | | | | |
Goldman Sachs | | Buy | | 750 | | 0.12 | | 12/20/11 | | 4 | |
The Hartford Financial Services Group, 4.75%, 3/1/14 | | | | | | | | | | | |
Goldman Sachs | | Buy | | 250 | | 0.15 | | 12/20/11 | | 1 | |
Motorola, Inc., 6.50%, 9/1/25 | | | | | | | | | | | |
Goldman Sachs | | Buy | | 500 | | 0.16 | | 12/20/11 | | 3 | |
Motorola, Inc., 6.50%, 9/1/25 | | | | | | | | | | | |
Goldman Sachs | | Buy | | 730 | | 0.10 | | 3/20/12 | | 4 | |
The Chubb Corp., 6.00%, 11/15/11 | | | | | | | | | | | |
Goldman Sachs | | Buy | | 350 | | 0.22 | | 3/20/12 | | @— | |
Dell, Inc., 7.10%, 4/15/28 | | | | | | | | | | | |
JPMorgan Chase | | Buy | | 1,100 | | 0.65 | | 3/20/11 | | (13 | ) |
Tyco International Ltd., 2.75%, 1/15/18 | | | | | | | | | | | |
JPMorgan Chase | | Buy | | 130 | | 1.18 | | 6/20/14 | | 1 | |
Belo Corp., 8.00%, 11/1/08 | | | | | | | | | | | |
JPMorgan Chase | | Buy | | 370 | | 1.30 | | 6/20/14 | | 1 | |
Belo Corp., 8.00%, 11/1/08 | | | | | | | | | | | |
Lehman Brothers | | Buy | | 375 | | 0.20 | | 12/20/11 | | @— | |
Union Pacific Corp., 6.13%, 1/15/12 | | | | | | | | | | $ | 1 | |
| | | | | | | | | | | | | |
The accompanying notes are an integral part of the financial statements.
90
| 2007 Annual Report |
| |
| September 30, 2007 |
Portfolio of Investments (cont’d)
Intermediate Duration Portfolio
Interest Rate Swap Contracts
The Portfolio had the following interest rate swap agreement(s) open at period end:
| | | | | | | | | | | | Unrealized | |
| | | | | | | | | | Notional | | Appreciation | |
| | Floating Rate | | Pay/Receive | | Fixed | | Termination | | Amount | | (Depreciation) | |
Swap Counterparty | | Index | | Floating Rate | | Rate | | Date | | (000) | | (000) | |
Citibank | | 3 Month LIBOR | | Pay | | 5.45 | % | 8/9/17 | | $ | 10,000 | | $ | 189 | |
| | 3 Month LIBOR | | Pay | | 5.24 | | 9/27/17 | | 12,200 | | 34 | |
Deutsche Bank | | 3 Month LIBOR | | Pay | | 5.39 | | 5/25/17 | | 14,250 | | 401 | |
| | 3 Month LIBOR | | Pay | | 5.43 | | 5/29/17 | | 2,250 | | 70 | |
JPMorgan Chase | | 3 Month LIBOR | | Pay | | 5.45 | | 5/29/17 | | 2,250 | | 74 | |
| | 3 Month LIBOR | | Pay | | 5.09 | | 9/11/17 | | 5,150 | | (53 | ) |
| | | | | | | | | | | | $ | 715 | |
| | | | | | | | | | | | | | | |
LIBOR — London Inter Bank Offer Rate
The accompanying notes are an integral part of the financial statements.
91
2007 Annual Report
September 30, 2007
Investment Overview (unaudited)
International Fixed Income Portfolio
The International Fixed Income Portfolio seeks above-average total return over a market cycle of three to five years. The Portfolio invests primarily in investment grade fixed income securities of government and corporate issuers in countries other than the U.S., including securities of issuers located in emerging markets, and, including, to a limited degree, high yield securities (commonly referred to as a “junk bonds”). The securities held by the Portfolio ordinarily will be denominated in foreign currencies, including the Euro. The Portfolio will ordinarily seek to maintain an average weighted maturity in excess of five years, although there is no minimum or maximum maturity for any individual security. The Portfolio may use futures, options, forwards, collateralized mortgage obligations, swaps, options on swaps and other derivatives. Foreign investments are subject to certain risks such as currency fluctuations, economic instability, and political developments.
Performance
For the fiscal year ended September 30, 2007 the Portfolio’s Institutional Class had a total return based on net asset value and reinvestment of distributions per share of 8.76%, net of fees. The Portfolio’s Institutional Class underperformed against its benchmark the Citigroup World Government Bond Ex-U.S. Index (the “Index”) which returned 9.53%.
Factors Affecting Performance
• Interest rate strategy had a small positive impact on relative returns for the review period. The Portfolio was underweight duration across major markets based on low real yields and risks of higher inflation and further tightening of monetary policy. This strategy added to relative returns through the first half of 2007, but hurt performance in the third quarter as a global liquidity crisis pushed bond yields significantly lower.
• Currency strategy had a modestly negative impact on relative performance. The most significant exposure during the fiscal year was an overweight in the Yen, funded with Euro. This positioning was based on the substantial undervaluation of the Yen and market expectations that this undervaluation would persist indefinitely. These expectations of persistent undervaluation are inconsistent with historic behavior of exchange rates, and we believe positioning against them will prove profitable. The Yen continued to depreciate relative to the Euro through the first three quarters of the review period, but rebounded in the last quarter. The Portfolio also added exposure to eastern European and Scandinavian currencies funded with the Euro and Pound Sterling. This positioning added some value across the year as peripheral currencies performed well.
• The Portfolio’s small exposure to corporate bonds had a slight negative effect on relative returns following the sharp flight-to-quality government bond rally in the third quarter of 2007, which caused all non-sovereign bonds to underperform the Index.
Management strategies
• The Portfolio maintains a defensive exposure to interest rate risk spread across Europe, Japan, and Canada. Real bond yields remain very low, and generally offer limited opportunity for bonds to outperform cash unless economies weaken considerably and central banks ease monetary policy. We believe this is unlikely; economic growth outside the U.S. remains robust and well-insulated from credit problems in the U.S. mortgage market.
• We continue to overweight the Yen, and have added small exposures to other Asian currencies. We have shifted the funding of this exposure away from the Euro to the U.S. dollar. Lower interest rates in the U.S. make the dollar more attractive from a funding perspective, and tensions in credit markets could interrupt the flow of Asian finance of the U.S. current account deficit.
• Recent disruptions in credit markets have created opportunities, primarily in high-quality issues primarily exposed to liquidity risk. We have added to this sector to take advantage of higher yields.
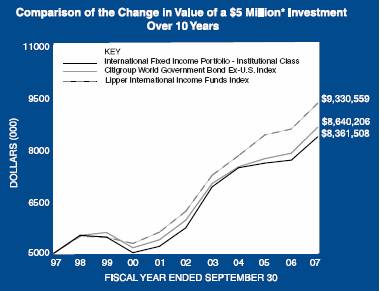
* Minimum Investment
In accordance with SEC regulations, the Portfolio’s performance shown assumes that all recurring fees (including management fees) were deducted and all dividends and distributions were reinvested. The performance of Adviser Class shares will vary from the Institutional Class shares based upon the different inception date and will be negatively impacted by additional fees assessed to this class.
92
| 2007 Annual Report |
| |
| September 30, 2007 |
Investment Overview (cont’d)
International Fixed Income Portfolio
Performance Compared to the Citigroup World Government Bond Ex-U.S. Index(1) and the Lipper International Income Funds Index(2)
| | Total Returns(3) | |
| | | | Average Annual | |
| | One | | Five | | Ten | | Since | |
| | Year | | Years | | Years | | Inception(6) | |
Portfolio — Institutional Class(4) | | 8.76 | % | 7.84 | % | 5.28 | % | 5.67 | % |
Citigroup World Government Bond Ex-U.S.Index | | 9.53 | | 7.73 | | 5.62 | | 5.89 | |
Lipper International Income Funds Index | | 8.69 | | 8.48 | | 6.44 | | 6.86 | |
Portfolio — Adviser Class(5) | | — | | — | | — | | — | |
Citigroup World Government Bond Ex-U.S.Index | | — | | — | | — | | — | |
Lipper International Income Funds Index | | — | | — | | — | | — | |
Performance data quoted represents past performance, which is no guarantee of future results, and current performance may be lower or higher than the figures shown. Performance assumes that all dividends and distributions, if any, were reinvested. For the most recent month-end performance figures, please visit www.morganstanley.com/im. Investment return and principal value will fluctuate so that Portfolio shares, when redeemed, may be worth more or less than their original cost. Total returns do not reflect the deduction of taxes that a shareholder would pay on Portfolio distributions or the redemption of Portfolio shares.
(1) | | The Citigroup World Government Bond Ex-U.S. Index is a market-capitalization weighted benchmark that tracks the performance of the 20 government bond markets of Australia, Austria, Belgium, Canada, Denmark, Finland, France, Germany, Greece, Ireland, Italy, Japan, the Netherlands, Norway, Poland, Portugal, Spain, Sweden, Switzerland, and the United Kingdom. Issuers must carry an investment grade (BBB-/Baa3) or higher credit rating to remain eligible for inclusion. The Index is unmanaged and its returns do not include any sales charges or fees. Such costs would lower performance. It is not possible to invest directly in an index. |
(2) | | The Lipper International Income Funds Index is an equally weighted performance index of the largest qualifying funds (based on net assets) in the Lipper International Income Funds classification. The Index, which is adjusted for capital gains distributions and income dividends, is unmanaged and should not be considered an investment. There are currently 10 funds represented in this Index. As of the date of this report, the Portfolio is in the Lipper International Income Funds classification. |
(3) | | Total returns for the Portfolio reflect expenses waived and/or reimbursed, if applicable, by the Adviser. Without such waivers and/or reimbursements, total returns would have been lower. Fee waivers and/or reimbursements are voluntary and the Adviser reserves the right to commence or terminate any waiver and/or reimbursement at any time. Returns for periods less than one year are not annualized. |
(4) | | Commenced operations on April 29, 1994. |
(5) | | Commenced operations on September 28, 2007 and therefore do not have any historical performance to report as the date of this report. |
(6) | | For comparative purposes, average annual since inception returns listed for the Indexes refer to the inception date or initial offering of the share class of the Portfolio, not the inception of the Indexes. |
Expense Example
As a shareholder of the Portfolio, you incur two types of costs: (1) transactional costs, including redemption fees; (2) ongoing costs, including management fees, shareholder servicing fees and other Portfolio expenses. These examples are intended to help you understand your ongoing costs (in dollars) of investing in the Portfolio and to compare these costs with the ongoing costs of investing in other mutual funds.
These examples are based on an investment of $1,000 invested at the beginning of the six-month period ended September 30, 2007 and held for the entire six-month period.
Actual Expenses
The first line of the tables below provides information about actual account values and actual expenses. You may use the information in this line, together with the amount you invested, to estimate the expenses that you paid over the period. Simply divide your account value by $1,000 (for example, an $8,600 account value divided by $1,000 = 8.6), then multiply the result by the number in the first line under the heading entitled “Expenses Paid During Period” to estimate the expenses you paid on your account during this period.
Please note that “Expenses Paid During Period” are grossed up to reflect Portfolio expenses prior to the effect of Expense Offset (See Note E in the Notes to Financial Statements). Therefore, the annualized net expense ratios may differ from the ratio of expenses to average net assets shown in the Financial Highlights.
Please note that the Portfolio’s Adviser Class Share commenced operations on September 28, 2007; therefore, actual expenses paid during the period reflect activity from September 28, 2007 through September 30, 2007.
Hypothetical Example for Comparison Purposes
The second line of the tables below provides information about hypothetical account values and hypothetical expenses based on the Portfolio’s actual expense ratio and an assumed rate of return of 5% per year before expenses, which is not the Portfolio’s actual return. The hypothetical account values and expenses may not be used to estimate the actual ending account balance or expenses you paid for the period. You may use this information to compare the ongoing costs of investing in the Portfolio and other funds. To do so, compare this 5% hypothetical example with the 5% hypothetical examples that appear in the shareholder reports of the other funds.
Please note that while the Portfolio’s Adviser Class Share commenced operations on September 28, 2007, the hypothetical expenses paid during the period reflect projected activity for the full six month period for the purposes of comparability. This projection assumes that the annualized expense ratio for the Portfolio’s Adviser Class Share was in effect during the period from April 1, 2007 to September, 2007.
93
2007 Annual Report
September 30, 2007
Investment Overview (cont’d)
International Fixed Income Portfolio
Please note that the expenses shown in the table are meant to highlight your ongoing costs only and do not reflect any transactional costs, such as redemption fees. Therefore, the second line of the table is useful in comparing ongoing costs only, and will not help you determine the relative total costs of owning different funds. In addition, if these transactional costs were included, your costs would have been higher.
| | Beginning
Account Value
April 1, 2007 | | Ending Account
Value
September 30,
2007 | | Expenses Paid
During Period*
April 1, 2007 —
September 30,
2007 | |
Institutional Class | | | | | | | |
Actual | | $ | 1,000.00 | | $ | 1,053.80 | | $ | 2.93 | |
Hypothetical (5% average annual return before expenses) | | 1,000.00 | | 1,022.21 | | 2.89 | |
| | | | | | | | | | |
| | Beginning
Account Value | | Ending Account
Value
September 30,
2007 | | Expenses Paid
During Period*
September 28,
2007 —
September 30,
2007 | |
Adviser Class | | | | | | | |
Actual | | $ | 1,000.00 | | $ | 1,000.00 | | $ | 0.12 | |
Hypothetical (5% average annual return before expenses) | | 1,000.00 | | 1,017.80 | | 7.33 | |
| | | | | | | | | | |
* Expenses are equal to Institutional Class’ and Adviser Class’ annualized net expense ratios of 0.57% and 1.45%, respectively, multiplied by the average account value over the period, multiplied by 183/365 for the Institutional Class (to reflect the one-half year period) and multiplied by 3/365 for the Adviser Class (to reflect the actual days in the period).
Graphic Presentation of Portfolio Holdings
The following graph depicts the Portfolio’s holdings by country and/or investment type, as a percentage of total investments.

* Countries and/or investment types which do not appear in the above graph, as well as those which represent less than 5% of total investments, if applicable, are included in the category labeled “Other”.
94
2007 Annual Report
September 30, 2007
Portfolio of Investments
International Fixed Income Portfolio
| | Face | | | |
| | Amount | | Value | |
| | (000) | | (000) | |
Fixed Income Securities (95.2%) | | | | | | | |
Argentina (0.7%) | | | | | | | |
Government of Argentina, | | | | | | | |
5.83%, 12/31/33 | | $ | (h)2,266 | | $ | 872 | |
8.28%, 12/31/33 | | | 802 | | | 723 | |
| | | | | | 1,595 | |
Australia (0.6%) | | | | | | | |
New South Wales Treasury Corp., | | | | | | | |
6.00%, 5/1/12 | | AUD | 1,000 | | | 859 | |
Telstra Corp. Ltd., | | | | | | | |
6.38%, 6/29/11 | | EUR | 300 | | | 450 | |
| | | | | | 1,309 | |
Austria (1.3%) | | | | | | | |
Republic of Austria, | | | | | | | |
3.50%, 7/15/15 | | | 2,000 | | | 2,694 | |
Belgium (3.9%) | | | | | | | |
Government of Belgium, | | | | | | | |
3.00%, 3/28/10 | | | 6,000 | | | 8,339 | |
Canada (3.3%) | | | | | | | |
Government of Canada, | | | | | | | |
4.25%, 12/1/09 | | CAD | 5,500 | | | 5,519 | |
Quebec Province, | | | | | | | |
1.60%, 5/9/13 | | JPY | 180,000 | | | 1,581 | |
| | | | | | 7,100 | |
Cayman Islands (0.3%) | | | | | | | |
MBNA America European Structured Offerings, | | | | | | | |
5.13%, 4/19/08 | | DEM | 511 | | | 729 | |
Denmark (1.0%) | | | | | | | |
Kingdom of Denmark, | | | | | | | |
6.00%, 11/15/11 | | DKK | 10,000 | | | 2,035 | |
France (11.4%) | | | | | | | |
Alcatel-Lucent, | | | | | | | |
4.75%, 1/1/11 | | EUR | 2,808 | | | 647 | |
Compagnie de Financement Foncier, | | | | | | | |
1.25%, 12/1/11 | | JPY | 400,000 | | | 3,482 | |
Compagnie Generale des Etablissements Michelin, | | | | | | | |
6.38%, 12/3/33 | | EUR | (h)300 | | | 430 | |
Crown European Holdings S.A., | | | | | | | |
6.25%, 9/1/11 | | | 295 | | | 428 | |
Dexia Municipal Agency, | | | | | | | |
3.50%, 9/21/09 | | | 1,500 | | | 2,103 | |
France Telecom S.A., | | | | | | | |
1.60%, 1/1/09 | | | 145 | | | 216 | |
8.13%, 1/28/33 | | | 120 | | | 219 | |
French Treasury Note, | | | | | | | |
3.50%, 7/12/11 | | | 3,000 | | | 4,177 | |
4.50%, 7/12/12 | | | 3,600 | | | 5,193 | |
Government of France O.A.T., | | | | | | | |
5.50%, 4/25/29 | | | 4,800 | | | 7,614 | |
| | | | | | 24,509 | |
Germany (11.4%) | | | | | | | |
Bundesrepublik Deutschland, | | | | | | | |
3.75%, 7/4/13 | | EUR | 3,000 | | $ | 4,181 | |
5.50%, 1/4/31 | | | 2,400 | | | 3,844 | |
6.25%, 1/4/24 | | | 6,100 | | | 10,375 | |
Kreditanstalt fuer Wiederaufbau, | | | | | | | |
2.05%, 9/21/09 | | JPY | 440,000 | | | 3,906 | |
WestLB A.G., | | | | | | | |
4.00%, 2/2/09 | | EUR | 1,500 | | | 2,123 | |
| | | | | | 24,429 | |
Ireland (6.5%) | | | | | | | |
Depfa ACS Bank, | | | | | | | |
0.75%, 9/22/08 | | JPY | 730,000 | | | 6,344 | |
Government of Ireland, | | | | | | | |
4.25%, 10/18/07 | | EUR | 5,100 | | | 7,270 | |
Smurfit Kappa Funding plc, | | | | | | | |
7.75%, 4/1/15 | | | 165 | | | 234 | |
| | | | | | 13,848 | |
Italy (1.8%) | | | | | | | |
Republic of Italy, | | | | | | | |
0.65%, 3/20/09 | | JPY | 440,000 | | | 3,814 | |
Japan (16.9%) | | | | | | | |
Development Bank of Japan, | | | | | | | |
1.60%, 6/20/14 | | | 600,000 | | | 5,299 | |
Fujitsu Ltd., | | | | | | | |
Zero Coupon, 5/27/09 | | | 50,000 | | | 447 | |
Government of Japan, | | | | | | | |
1.20%, 6/20/11 | | | 660,000 | | | 5,773 | |
1.70%, 6/20/33 | | | 520,000 | | | 3,940 | |
1.90%, 6/20/16 | | | 755,000 | | | 6,767 | |
2.40%, 3/20/34 | | | 430,000 | | | 3,756 | |
2.50%, 9/20/36 | | | 230,000 | | | 2,038 | |
Japan Finance Corp. for Municipal Enterprises, | | | | | | | |
1.55%, 2/21/12 | | | 530,000 | | | 4,693 | |
2.00%, 5/9/16 | | | 330,000 | | | 2,973 | |
Sharp Corp., | | | | | | | |
Zero Coupon, 9/30/13 | | | 60,000 | | | 561 | |
| | | | | | 36,247 | |
Luxembourg (0.6%) | | | | | | | |
Fiat Finance & Trade Ltd., | | | | | | | |
6.63%, 2/15/13 | | EUR | 150 | | | 224 | |
Gaz Capital for Gazprom, | | | | | | | |
4.56%, 12/9/12 | | | 170 | | | 228 | |
Telecom Italia Finance S.A., | | | | | | | |
7.75%, 1/24/33 | | | 315 | | | 513 | |
Wind Acquisition Finance S.A., | | | | | | | |
9.75%, 12/1/15 | | | 150 | | | 235 | |
| | | | | | 1,200 | |
Mexico (1.7%) | | | | | | | |
Mexican Bonos, | | | | | | | |
9.50%, 12/18/14 | | MXN | 36,200 | | | 3,612 | |
The accompanying notes are an integral part of the financial statements.
95
2007 Annual Report
September 30, 2007
Portfolio of Investments (cont’d)
International Fixed Income Portfolio
| | Face | | | |
| | Amount | | Value | |
| | (000) | | (000) | |
Multi-Country (2.3%) | | | | | | | |
Inter-American Development Bank, | | | | | | | |
1.90%, 7/8/09 | | JPY | 545,000 | | $ | 4,819 | |
Netherlands (7.3%) | | | | | | | |
Bank Nederlandse Gemeenten, | | | | | | | |
0.80%, 9/22/08 | | | 250,000 | | | 2,174 | |
Government of Netherlands, | | | | | | | |
3.75%, 1/15/23 | | EUR | 1,800 | | | 2,338 | |
4.00%, 1/15/37 | | | 5,600 | | | 7,179 | |
5.00%, 7/15/12 | | | 1,750 | | | 2,578 | |
Fresenius Finance B.V., | | | | | | | |
5.00%, 1/31/13 | | | 165 | | | 225 | |
Impress Holdings, | | | | | | | |
7.33%, 9/15/13 | | | (h)155 | | | 224 | |
Linde Finance B.V., | | | | | | | |
4.75%, 4/24/17 | | | 300 | | | 402 | |
Telefonica Europe B.V., | | | | | | | |
5.88%, 2/14/33 | | | 320 | | | 453 | |
| | | | | | 15,573 | |
Norway (0.8%) | | | | | | | |
Kingdom of Norway, | | | | | | | |
5.50%, 5/15/09 | | NOK | 9,400 | | | 1,761 | |
Poland (0.9%) | | | | | | | |
Poland Government Bond, | | | | | | | |
5.75%, 6/24/08 | | PLN | 5,300 | | | 2,014 | |
Spain (3.5%) | | | | | | | |
Government of Spain, | | | | | | | |
5.15%, 7/30/09 | | EUR | 4,200 | | | 6,101 | |
5.40%, 7/30/11 | | | 1,000 | | | 1,485 | |
| | | | | | 7,586 | |
Sweden (1.6%) | | | | | | | |
Government of Sweden, | | | | | | | |
4.00%, 12/1/09 | | SEK | 14,600 | | | 2,262 | |
Kingdom of Sweden, | | | | | | | |
5.25%, 3/15/11 | | | 5,600 | | | 898 | |
Telefonaktiebolaget LM Ericsson, | | | | | | | |
6.75%, 11/28/10 | | EUR | 230 | | | 340 | |
| | | | | | 3,500 | |
United Kingdom (11.7%) | | | | | | | |
Allied Domecq Financial Services plc, | | | | | | | |
6.63%, 4/18/11 | | GBP | 190 | | | 394 | |
BAA plc, | | | | | | | |
4.50%, 2/15/18 | | EUR | 170 | | | 222 | |
British Telecommunications plc, | | | | | | | |
7.38%, 2/15/11 | | | 220 | | | 337 | |
EUR Capital S.P.V. Ltd., | | | | | | | |
6.28%, 12/31/49 | | | (h)315 | | | 422 | |
FCE Bank plc, | | | | | | | |
7.13%, 1/15/13 | | | 550 | | | 729 | |
Imperial Tobacco Finance plc, | | | | | | | |
4.38%, 11/22/13 | | | 500 | | | 670 | |
Ineos Group Holdings plc, | | | | | | | |
7.88%, 2/15/16 | | EUR | 200 | | $ | 268 | |
United Kingdom Treasury Bond, | | | | | | | |
4.00%, 9/7/16 | | GBP | 8,050 | | | 15,291 | |
4.25%, 6/7/32 | | | 800 | | | 1,537 | |
4.75%, 6/7/10 | | | 2,600 | | | 5,291 | |
| | | | | | 25,161 | |
United States (5.7%) | | | | | | | |
Chesapeake Energy Corp., | | | | | | | |
6.25%, 1/15/17 | | EUR | 165 | | | 229 | |
Countrywide Financial Corp., | | | | | | | |
5.06%, 11/23/10 | | | (h)400 | | | 528 | |
Federal National Mortgage Association, | | | | | | | |
1.75%, 3/26/08 | | JPY | 600,000 | | | 5,243 | |
General Electric Capital Corp., | | | | | | | |
0.75%, 2/5/09 | | | 250,000 | | | 2,166 | |
General Motors Acceptance Corp., | | | | | | | |
5.38%, 6/6/11 | | EUR | 370 | | | 485 | |
6.00%, 7/3/08 | | | 260 | | | 365 | |
General Motors Corp., | | | | | | | |
1.50%, 6/1/09 | | $ | 8 | | | 226 | |
Omnicom Group, Inc., | | | | | | | |
Zero Coupon, 7/31/32 | | | 400 | | | 409 | |
WDAC Subsidiary Corp., | | | | | | | |
8.50%, 12/1/14 | | EUR | 150 | | | 210 | |
WM Covered Bond Program, | | | | | | | |
3.88%, 9/27/11 | | | 1,500 | | | 2,071 | |
Wyeth, | | | | | | | |
4.88%, 1/15/24 | | $ | (h)390 | | | 413 | |
| | | | | | 12,345 | |
Total Fixed Income Securities (Cost $195,349) | | | | | | 204,219 | |
| | Shares | | | | |
Short-Term Investment (2.7%) | | | | | | | |
Investment Company (2.7%) | | | | | | | |
Morgan Stanley Institutional Liquidity | | | | | | | |
Money Market Portfolio | | | | | | | |
— Institutional Class (Cost $5,845) | | (p) | 5,844,534 | | | 5,845 | |
Total Investments (97.9%) (Cost $201,194) | | | | | | 210,064 | |
Other Assets in Excess of Liabilities (2.1%) | | | | | | 4,564 | |
Net Assets (100%) | | | | | $ | 214,628 | |
(h) | | Variable/Floating Rate Security - Interest rate changes on these instruments are based on changes in a designated base rate. The rates shown are those in effect on September 30, 2007. |
(p) | | See Note F within the Notes to Financial Statements regarding investment in Morgan Stanley Institutional Liquidity Government Portfolio — Institutional Class, Morgan Stanley Institutional Liquidity Money Market Portfolio -— Institutional Class and/or Morgan Stanley Institutional Liquidity Tax-Exempt Portfolio — Institutional Class. |
AUD | | Australian Dollar |
CAD | | Canadian Dollar |
The accompanying notes are an integral part of the financial statements.
96
2007 Annual Report
September 30, 2007
Portfolio of Investments (cont’d)
International Fixed Income Portfolio
DEM | | German Mark |
DKK | | Danish Krone |
EUR | | Euro |
GBP | | British Pound |
JPY | | Japanese Yen |
MXN | | Mexican Peso |
NOK | | Norwegian Krone |
PLN | | Polish Zloty |
SEK | | Swedish Krona |
Foreign Currency Exchange Contract Information:
The Portfolio had the following foreign currency exchange contract(s) open at period end:
| | | | | | | | | | | | | | Net | |
Currency | | | | | | In | | | | Unrealized | |
to | | | | | | Exchange | | | | Appreciation | |
Deliver | | Value | | Settlement | | For | | Value | | (Depreciation) | |
(000) | | (000) | | Date | | (000) | | (000) | | (000) | |
ARS | | 5,660 | | $ | 1,791 | | 10/22/07 | | USD | | 1,807 | | $ | 1,807 | | $ | 16 | |
CAD | | 2,225 | | 2,237 | | 10/10/07 | | USD | | 2,112 | | 2,112 | | (125 | ) |
CHF | | 735 | | 632 | | 10/11/07 | | USD | | 611 | | 611 | | (21 | ) |
CZK | | 21,250 | | 1,101 | | 10/16/07 | | USD | | 1,042 | | 1,042 | | (59 | ) |
DKK | | 14,400 | | 2,755 | | 10/11/07 | | USD | | 2,643 | | 2,643 | | (112 | ) |
EUR | | 500 | | 713 | | 10/12/07 | | USD | | 685 | | 685 | | (28 | ) |
EUR | | 100 | | 142 | | 10/16/07 | | USD | | 138 | | 138 | | (4 | ) |
EUR | | 850 | | 1,212 | | 10/16/07 | | USD | | 1,171 | | 1,171 | | (41 | ) |
EUR | | 1,560 | | 2,225 | | 10/16/07 | | USD | | 2,135 | | 2,135 | | (90 | ) |
EUR | | 650 | | 927 | | 10/16/07 | | USD | | 890 | | 890 | | (37 | ) |
EUR | | 1,525 | | 2,175 | | 10/16/07 | | USD | | 2,092 | | 2,092 | | (83 | ) |
EUR | | 550 | | 785 | | 10/16/07 | | USD | | 752 | | 752 | | (33 | ) |
EUR | | 325 | | 464 | | 10/16/07 | | USD | | 439 | | 439 | | (25 | ) |
EUR | | 3,000 | | 4,278 | | 10/16/07 | | USD | | 4,175 | | 4,175 | | (103 | ) |
EUR | | 1,575 | | 2,246 | | 10/16/07 | | USD | | 2,227 | | 2,227 | | (19 | ) |
GBP | | 350 | | 716 | | 10/12/07 | | USD | | 705 | | 705 | | (11 | ) |
GBP | | 5,150 | | 10,534 | | 10/18/07 | | USD | | 10,480 | | 10,480 | | (54 | ) |
GBP | | 700 | | 1,432 | | 10/18/07 | | USD | | 1,417 | | 1,417 | | (15 | ) |
GBP | | 1,000 | | 2,046 | | 10/18/07 | | USD | | 2,024 | | 2,024 | | (22 | ) |
JPY | | 32,085 | | 279 | | 10/1/07 | | USD | | 278 | | 278 | | (1 | ) |
JPY | | 50,000 | | 436 | | 10/12/07 | | USD | | 412 | | 412 | | (24 | ) |
JPY | | 250,000 | | 2,179 | | 10/12/07 | | USD | | 2,068 | | 2,068 | | (111 | ) |
JPY | | 50,000 | | 436 | | 10/12/07 | | USD | | 414 | | 414 | | (22 | ) |
JPY | | 125,000 | | 1,090 | | 10/12/07 | | USD | | 1,059 | | 1,059 | | (31 | ) |
JPY | | 125,000 | | 1,090 | | 10/12/07 | | USD | | 1,079 | | 1,079 | | (11 | ) |
JPY | | 150,000 | | 1,308 | | 10/12/07 | | USD | | 1,306 | | 1,306 | | (2 | ) |
JPY | | 100,000 | | 871 | | 10/12/07 | | USD | | 876 | | 876 | | 5 | |
KRW | | 475,000 | | 519 | | 10/22/07 | | USD | | 506 | | 506 | | (13 | ) |
MXN | | 23,225 | | 2,122 | | 10/10/07 | | USD | | 2,137 | | 2,137 | | 15 | |
MYR | | 31,000 | | 9,105 | | 10/22/07 | | USD | | 9,032 | | 9,032 | | (73 | ) |
NZD | | 2,900 | | 2,196 | | 10/10/07 | | USD | | 2,064 | | 2,064 | | (132 | ) |
PLN | | 9,775 | | 3,699 | | 10/12/07 | | USD | | 3,552 | | 3,552 | | (147 | ) |
SEK | | 7,100 | | 1,102 | | 10/11/07 | | USD | | 1,073 | | 1,073 | | (29 | ) |
TWD | | 26,775 | | 823 | | 10/22/07 | | USD | | 821 | | 821 | | (2 | ) |
USD | | 882 | | 882 | | 10/22/07 | | ARS | | 2,850 | | 902 | | 20 | |
USD | | 43 | | 43 | | 10/10/07 | | AUD | | 50 | | 44 | | 1 | |
USD | | 2,057 | | 2,057 | | 10/10/07 | | AUD | | 2,500 | | 2,218 | | 161 | |
USD | | 2,137 | | 2,137 | | 10/11/07 | | CHF | | 2,525 | | 2,170 | | 33 | |
USD | | 1,054 | | 1,054 | | 10/16/07 | | CZK | | 21,250 | | 1,101 | | 47 | |
USD | | 2,335 | | $ | 2,335 | | 10/11/07 | | DKK | | 12,500 | | $ | 2,391 | | $ | 56 | |
USD | | 1,612 | | 1,612 | | 10/10/07 | | EUR | | 1,175 | | 1,676 | | 64 | |
USD | | 1,589 | | 1,589 | | 10/16/07 | | EUR | | 1,150 | | 1,640 | | 51 | |
USD | | 16,953 | | 16,953 | | 10/16/07 | | EUR | | 12,270 | | 17,503 | | 550 | |
USD | | 2,722 | | 2,722 | | 10/16/07 | | EUR | | 1,975 | | 2,817 | | 95 | |
USD | | 1,318 | | 1,318 | | 10/16/07 | | EUR | | 960 | | 1,369 | | 51 | |
USD | | 351 | | 351 | | 10/16/07 | | EUR | | 260 | | 371 | | 20 | |
USD | | 341 | | 341 | | 10/16/07 | | EUR | | 250 | | 357 | | 16 | |
USD | | 476 | | 476 | | 10/18/07 | | GBP | | 235 | | 480 | | 4 | |
USD | | 2,233 | | 2,233 | | 10/18/07 | | GBP | | 1,100 | | 2,250 | | 17 | |
USD | | 3,775 | | 3,775 | | 10/18/07 | | GBP | | 1,870 | | 3,825 | | 50 | |
USD | | 1,056 | | 1,056 | | 10/16/07 | | HUF | | 190,000 | | 1,079 | | 23 | |
USD | | 981 | | 981 | | 10/22/07 | | IDR | | 8,900,000 | | 971 | | (10 | ) |
USD | | 898 | | 898 | | 10/1/07 | | JPY | | 103,381 | | 900 | | 2 | |
USD | | 2,114 | | 2,114 | | 10/10/07 | | JPY | | 250,000 | | 2,179 | | 65 | |
USD | | 530 | | 530 | | 10/12/07 | | JPY | | 60,000 | | 522 | | (8 | ) |
USD | | 304 | | 304 | | 10/12/07 | | JPY | | 35,000 | | 305 | | 1 | |
USD | | 11,859 | | 11,859 | | 10/12/07 | | JPY | | 1,440,000 | | 12,552 | | 693 | |
USD | | 2,095 | | 2,095 | | 10/12/07 | | JPY | | 250,000 | | 2,179 | | 84 | |
USD | | 519 | | 519 | | 10/22/07 | | KRW | | 475,000 | | 519 | | @— | |
USD | | 71 | | 71 | | 10/10/07 | | MXN | | 775 | | 71 | | @— | |
USD | | 519 | | 519 | | 10/22/07 | | MYR | | 1,775 | | 521 | | 2 | |
USD | | 10,578 | | 10,578 | | 10/22/07 | | MYR | | 36,250 | | 10,647 | | 69 | |
USD | | 1,103 | | 1,103 | | 10/11/07 | | NOK | | 6,400 | | 1,187 | | 84 | |
USD | | 810 | | 810 | | 10/16/07 | | PLN | | 2,225 | | 842 | | 32 | |
USD | | 1,388 | | 1,388 | | 10/16/07 | | PLN | | 3,775 | | 1,429 | | 41 | |
USD | | 3,718 | | 3,718 | | 10/16/07 | | PLN | | 10,125 | | 3,832 | | 114 | |
USD | | 939 | | 939 | | 10/11/07 | | SEK | | 6,425 | | 997 | | 58 | |
USD | | 101 | | 101 | | 10/11/07 | | SEK | | 675 | | 105 | | 4 | |
USD | | 1,069 | | 1,069 | | 10/12/07 | | SGD | | 1,600 | | 1,077 | | 8 | |
| | | | $ | 146,196 | | | | | | | | $ | 147,250 | | $ | 1,054 | |
ARS | — Argentinian Peso |
CHF | — Swiss Franc |
CZK | — Czech Republic Koruny |
HUF | — Hungarian Forint |
IDR | — Indonesian Rupiah |
KRW | — Korean Won |
MYR | — Malaysian Ringgit |
NZD | — New Zealand Dollar |
SGD | — Singapore Dollar |
TWD | — Taiwan Dollar |
USD | — United States Dollar |
The accompanying notes are an integral part of the financial statements.
97
2007 Annual Report
September 30, 2007
Portfolio of Investments (cont’d)
International Fixed Income Portfolio
Futures Contracts:
The Portfolio had the following futures contract(s) open at period end:
| | | | | | | | Net | |
| | | | | | | | Unrealized | |
| | Number | | | | | | Appreciation | |
| | of | | Value | | Expiration | | (Depreciation) | |
| | Contracts | | (000) | | Date | | (000) | |
Long: | | | | | | | | | |
Euro-Schatz | | 30 | | $ | 4,422 | | Dec-07 | | $ | (6 | ) |
Euro-Bund | | 15 | | 2,410 | | Dec-07 | | (18 | ) |
| | | | | | | | $ | (24 | ) |
| | | | | | | | | | | |
The accompanying notes are an integral part of the financial statements.
98
2007 Annual Report
September 30, 2007
Investment Overview (unaudited)
Investment Grade Fixed Income Portfolio
Performance
For the fiscal year ended September 30, 2007, the Portfolio’s Institutional Class had a total return based on net asset value and reinvestment of distributions per share of 4.82%, net of fees. The Portfolio’s Institutional Class underperformed against its benchmark the Lehman Brothers U.S. Aggregate Index (the “Index”) which returned 5.14%.
Factors Affecting Performance
• Fears stemming from a residential housing downturn persisted throughout the 12-month period. Confronted with increasing delinquency rates on subprime loans, high-profile hedge fund collapses, and a series of subprime mortgage related credit downgrades, markets responded severely in the latter months of the reporting period. The impact was exacerbated by an influx of forced sellers looking to liquidate assets to help meet margin calls and capital withdrawals, which fueled concerns about the potential impact on the broader financial markets and economy and led to a flight to quality.
• In August, the Federal Open Market Committee (the “Fed”) lowered the discount rate by half a percent, from 6.25% to 5.75%, and began encouraging member banks to make greater use of the discount window without fear of such action being viewed negatively by the Fed. In September, the Fed elected to cut the target federal funds rate by 50 basis points to 4.75%, noting that while economic growth remained moderate, inflation risks remain and “the tightening of credit conditions has the potential to intensify the housing correction and to restrain economic growth”.
• U.S. Treasury yields fluctuated throughout the 12-month period, with the yield curve beginning the period relatively flat and ending the period steep. As the yield curve steepened, shorter dated U.S. Treasury yields experienced the greatest decline, while longer dated yields rose slightly. Within the U.S. government sector, Treasuries and agencies outperformed other investment-grade sectors.
• The mortgage market was hit by the turmoil affecting residential housing, and especially by its spillover effects on secondary market activity, most notably in the non-agency mortgage area, casting a pall across the entire sector with little regard for whether the securities or loans in question were subprime or prime. The result was a further reduction in mortgage market liquidity, as well as a sharp diminishment in the availability of nonconforming mortgage loans to the general public.
• Widening credit spreads led corporate issues to underperform other major asset classes. Within the investment-grade corporate sector, lower-rated (Baa) and higher-rated (AAA) issues outpaced the middle investment grade issues and intermediate-term issues outperformed longer-dated issues. Industrials outpaced utilities and financials, which was the corporate sector hit hardest by the recent liquidity crisis.
• A defensive interest rate positioning benefited the Portfolio’s performance for the overall period, as did a relative underweight to the corporate sector, particularly in the latter months of the reporting year when credit spreads significantly widened.
• Although the Portfolio maintained an underweight to agency mortgage-backed securities, holdings here detracted from returns as the recent turmoil in the mortgage market and drying up of liquidity hurt the performance of the sector.
Management Strategies
• Throughout the period, we employed a defensive interest rate strategy by maintaining a lower interest-rate sensitivity (as measured by duration) than that of the Index. In March of this year, the position was adjusted to underweight longer dated issues and overweight intermediate dated issues. As the spread between intermediate and long date yields widened and the curve steepened during the summer, relative performance benefited. Subsequently, in August, we further reduced the Portfolio’s interest rate sensitivity.
• We have held an underweight corporate position for some time now, which has benefited relative performance. While we are looking for areas to take advantage of the recent spread widening and add to corporate positions, we remain cautious because we believe the credit market remains vulnerable to potential credit downgrades and/or an economic downturn.
• We maintained an underweight position to agency mortgage-backed securities, with a focus on high-coupon, slow-prepaying issues, and non-agency mortgages issued to high quality borrowers.
99
2007 Annual Report
September 30, 2007
Investment Overview (cont’d)
Investment Grade Fixed Income Portfolio
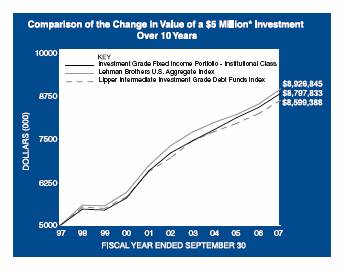
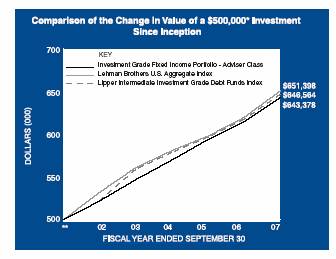
* Minimum Investment
** Commenced operations on May 20, 2002.
In accordance with SEC regulations, the Portfolio’s Institutional Class performance shown assumes that all recurring fees (including management fees) were deducted and all dividends and distributions were reinvested. The performance of Adviser Class shares will vary from the Institutional Class shares based upon the different inception date and will be negatively impacted by additional fees assessed to this class.
Performance Compared to the Lehman Brothers U.S. Aggregate Index(1) and Lipper Intermediate Investment Grade Debt Funds Index(2)
| | Total Returns(3) | |
| | | | Average Annual | |
| | One | | Five | | Ten | | Since | |
| | Year | | Years | | Years | | Inception(6) | |
| | | | | | | | | |
Portfolio — Institutional Class(4) | | 4.82 | % | 4.44 | % | 5.81 | % | 7.56 | % |
Lehman Brothers U.S. Aggregate Index | | 5.14 | | 4.13 | | 5.97 | | 7.21 | |
Lipper Intermediate Investment Grade Debt Funds Index | | 4.69 | | 4.38 | | 5.57 | | 6.72 | |
Portfolio — Adviser Class(5) | | 4.56 | | 4.27 | | — | | 4.81 | |
Lehman Brothers U.S. Aggregate Index | | 5.14 | | 4.13 | | — | | 5.05 | |
Lipper Intermediate Investment Grade Debt Funds Index | | 4.69 | | 4.38 | | — | | 4.91 | |
Performance data quoted represents past performance, which is no guarantee of future results, and current performance may be lower or higher than the figures shown. Performance assumes that all dividends and distributions, if any, were reinvested. For the most recent month-end performance figures, please visit www.morganstanley.com/im. Investment return and principal value will fluctuate so that Portfolio shares, when redeemed, may be worth more or less than their original cost. Total returns do not reflect the deduction of taxes that a shareholder would pay on Portfolio distributions or the redemption of Portfolio shares.
(1) | The Lehman Brothers U.S. Aggregate Index tracks the performance of all U.S. government agency and Treasury securities, investment-grade corporate debt securities, agency mortgage-backed securities, asset-backed securities and commercial mortgage-backed securities. The Index is unmanaged and its returns do not include any sales charges or fees. Such costs would lower performance. It is not possible to invest directly in an index. |
(2) | The Lipper Intermediate Investment Grade Debt Funds Index is an equally weighted performance index of the largest qualifying funds (based on net assets) in the Lip-per Intermediate Investment Grade Debt Funds classification. The Index, which is adjusted for capital gains distributions and income dividends, is unmanaged and should not be considered an investment. There are currently 30 funds represented in this Index. As of the date of this report, the Portfolio is in the Lipper Intermediate Investment Grade Debt Funds classification. |
(3) | Total returns for the Portfolio reflect expenses waived and/or reimbursed, if applicable, by the Adviser and Distributor. Without such waivers and/or reimbursements, total returns would have been lower. Fee waivers and/or reimbursements are voluntary and the Adviser and Distributor reserve the right to commence or terminate any waiver and/or reimbursement at any time. |
(4) | Commenced operations on August 31, 1990. |
(5) | Commenced operations on May 20, 2002. |
(6) | For comparative purposes, average annual since inception returns listed for the Indexes refer to the inception date or initial offering of the respective share class of the Portfolio, not the inception of the Indexes. |
100
2007 Annual Report
September 30, 2007
Investment Overview (cont’d)
Investment Grade Fixed Income Portfolio
Expense Examples
As a shareholder of the Portfolio, you incur two types of costs: (1) transactional costs, including redemption fees; (2) ongoing costs, including management fees, shareholder servicing fees (in the case of Adviser Class); and other Portfolio expenses. These examples are intended to help you understand your ongoing costs (in dollars) of investing in the Portfolio and to compare these costs with the ongoing costs of investing in other mutual funds.
The examples are based on an investment of $1,000 invested at the beginning of the six-month period ended September 30, 2007 and held for the entire six-month period.
Actual Expenses
The first line of the tables below provides information about actual account values and actual expenses. You may use the information in this line, together with the amount you invested, to estimate the expenses that you paid over the period. Simply divide your account value by $1,000 (for example, an $8,600 account value divided by $1,000 = 8.6), then multiply the result by the number in the first line under the heading entitled “Expenses Paid During Period” to estimate the expenses you paid on your account during this period.
Please note that “Expenses Paid During Period” are grossed up to reflect Portfolio expenses prior to the effect of Expense Offset (See Note E in the Notes to Financial Statements). Therefore, the annualized net expense ratios may differ from the ratio of expenses to average net assets shown in the Financial Highlights.
Hypothetical Example for Comparison Purposes
The second line of the tables below provides information about hypothetical account values and hypothetical expenses based on the Portfolio’s actual expense ratio and an assumed rate of return of 5% per year before expenses, which is not the Portfolio’s actual return. The hypothetical account values and expenses may not be used to estimate the actual ending account balance or expenses you paid for the period. You may use this information to compare the ongoing costs of investing in the Portfolio and other funds. To do so, compare this 5% hypothetical example with the 5% hypothetical examples that appear in the shareholder reports of the other funds.
Please note that the expenses shown in the table are meant to highlight your ongoing costs only and do not reflect any transactional costs, such as redemption fees. Therefore, the second line of the table is useful in comparing ongoing costs only, and will not help you determine the relative total costs of owning different funds. In addition, if these transactional costs were included, your costs would have been higher.
| | | | | | Expenses Paid | |
| | | | Ending | | During Period* | |
| | Beginning | | Account Value | | April 1, 2007 — | |
| | Account Value | | September | | September 30, | |
| | April 1, 2007 | | 30, 2007 | | 2007 | |
Institutional Class | | | | | | | |
Actual | | $ | 1,000.00 | | $ | 1,022.10 | | $ | 2.53 | |
Hypothetical (5% average annual return before expenses) | | 1,000.00 | | 1,022.56 | | 2.54 | |
| | | | | | | |
Adviser Class | | | | | | | |
Actual | | 1,000.00 | | 1,021.30 | | 3.24 | |
Hypothetical (5% average annual return before expenses) | | 1,000.00 | | 1,021.86 | | 3.24 | |
| | | | | | | | | | |
* Expenses are equal to Institutional Class’ and Adviser Class’ annualized net expense ratios of 0.50% and 0.64%, respectively, multiplied by the average account value over the period, multiplied by 183/365 (to reflect the one-half year period).
Graphic Presentation of Portfolio Holdings
The following graph depicts the Portfolio’s holdings by industry and/or investment type, as a percentage of total investments.
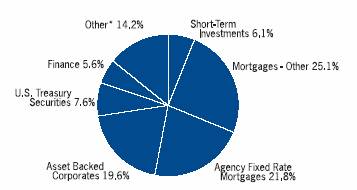
* Industries and/or investment types which do not appear in the above graph, as well as those which represent less than 5% of total investments, if applicable, are included in the category labeled “Other”.
101
2007 Annual Report
September 30, 2007
Portfolio of Investments
Investment Grade Fixed Income Portfolio
| | Face | | | |
| | Amount | | Value | |
| | (000) | | (000) | |
Fixed Income Securities (110.6%) | | | | | |
Agency Adjustable Rate Mortgages (3.7%) | | | | | |
Federal Home Loan Mortgage Corp., | | | | | |
Conventional Pools: | | | | | |
4.76%, 7/1/35 | | $ | 2,301 | | $ | 2,275 | |
5.63%, 4/1/37 | | 2,312 | | 2,331 | |
5.73%, 1/1/37 | | 3,470 | | 3,497 | |
5.97%, 1/1/37 | | 1,253 | | 1,270 | |
Federal National Mortgage Association, | | | | | |
7.41%, 5/1/36 | | 2,695 | | 2,747 | |
7.48%, 7/1/36 | | 2,729 | | 2,785 | |
7.49%, 8/1/36 | | 1,987 | | 2,035 | |
Government National Mortgage Association, | | | | | |
5.75%, 7/20/25 | | 33 | | 33 | |
6.13%, 11/20/25 - 12/20/27 | | 407 | | 411 | |
6.37%, 2/20/25 - 2/20/28 | | 1,762 | | 1,783 | |
6.38%, 2/20/28 | | 8 | | 8 | |
| | | | 19,175 | |
Agency Fixed Rate Mortgages (25.7%) | | | | | |
Federal Home Loan Mortgage Corp., | | | | | |
Conventional Pools: | | | | | |
10.00%, 9/1/17 - 11/1/20 | | 34 | | 37 | |
10.25%, 7/1/09 | | 3 | | 3 | |
11.00%, 1/1/16 | | 13 | | 13 | |
13.00%, 9/1/10 | | @— | | 1 | |
Gold Pools: | | | | | |
6.00%, 2/1/32 - 4/1/32 | | 84 | | 84 | |
6.50%, 7/1/25 - 3/1/32 | | 386 | | 396 | |
7.00%, 2/1/26 | | 22 | | 23 | |
7.50%, 5/1/16 - 6/1/32 | | 3,277 | | 3,430 | |
8.00%, 11/1/29 - 10/1/31 | | 540 | | 572 | |
8.50%, 12/1/30 | | 116 | | 125 | |
10.00%, 10/1/19 - 1/1/21 | | 56 | | 63 | |
10.50%, 3/1/16 | | 29 | | 30 | |
November TBA | | | | | |
6.50%, 11/15/31 | | (i)4,100 | | 4,170 | |
Federal National Mortgage Association, | | | | | |
7.50%, 9/1/35 | | 1,943 | | 2,035 | |
Conventional Pools: | | | | | |
6.00%, 10/1/31 - 12/1/31 | | 128 | | 129 | |
6.50%, 6/1/26 - 9/1/32 | | 1,346 | | 1,380 | |
7.00%, 11/1/25 - 12/1/34 | | 20,925 | | 21,711 | |
7.50%, 5/1/23 - 12/1/32 | | 3,607 | | 3,775 | |
8.00%, 2/1/12 - 4/1/32 | | 2,451 | | 2,584 | |
8.50%, 4/1/30 - 5/1/32 | | 2,191 | | 2,355 | |
9.00%, 2/1/17 | | 78 | | 84 | |
9.50%, 8/1/22 | | 102 | | 110 | |
10.00%, 5/1/22 | | 114 | | 126 | |
10.50%, 12/1/17 - 10/1/18 | | 36 | | 41 | |
11.00%, 4/1/21 | | 44 | | 48 | |
11.25%, 8/1/13 | | 42 | | 47 | |
11.50%, 1/1/17 - 11/1/19 | | 27 | | 29 | |
October TBA | | | | | |
5.50%, 10/25/37 | | $ | (i)13,200 | | $ | 12,930 | |
6.50%, 10/25/37 | | (i)7,100 | | 7,230 | |
November TBA | | | | | |
5.00%, 11/25/37 | | (i)27,300 | | 26,033 | |
5.50%, 11/25/37 | | (i)39,800 | | 38,961 | |
7.00%, 11/25/37 | | (i)3,000 | | 3,093 | |
Government National Mortgage Association, | | | | | |
Various Pools: | | | | | |
9.00%, 11/15/17 | | 175 | | 187 | |
9.50%, 12/15/17 - 9/15/22 | | 650 | | 706 | |
10.00%, 11/15/09 - 2/15/25 | | 1,020 | | 1,151 | |
10.50%, 3/15/19 | | 4 | | 5 | |
11.00%, 3/15/10 - 2/15/16 | | 120 | | 136 | |
11.50%, 1/20/18 | | 2 | | 2 | |
| | | | 133,835 | |
Asset Backed Corporates (23.1%) | | | | | |
American Express Credit Account Master Trust, | | | | | |
5.75%, 10/15/12 | | (h)2,375 | | 2,362 | |
Argent Securities, Inc., | | | | | |
5.18%, 10/25/36 | | (h)2,324 | | 2,307 | |
Banc of America Securities Auto Trust, | | | | | |
3.99%, 8/18/09 | | 1,376 | | 1,370 | |
Bear Stearns Asset Backed Securities, Inc., | | | | | |
5.23%, 1/25/37 | | (h)1,505 | | 1,496 | |
5.33%, 9/25/34 | | (h)294 | | 293 | |
5.35%, 3/25/35 | | (h)356 | | 355 | |
Capital Auto Receivables Asset Trust, | | | | | |
4.05%, 7/15/09 | | 1,372 | | 1,367 | |
4.98%, 5/15/11 | | 3,825 | | 3,820 | |
5.31%, 10/20/09 | | (e)4,600 | | 4,600 | |
5.38%, 7/20/10 | | (h)3,550 | | 3,521 | |
5.76%, 11/15/11 | | (h)2,500 | | 2,479 | |
Capital One Auto Finance Trust, | | | | | |
5.07%, 7/15/11 | | 2,025 | | 2,023 | |
Carrington Mortgage Loan Trust, | | | | | |
5.44%, 3/25/47 | | (h)2,264 | | 2,249 | |
Caterpillar Financial Asset Trust, | | | | | |
3.90%, 2/25/09 | | 398 | | 397 | |
5.57%, 5/25/10 | | 3,200 | | 3,212 | |
CIT Equipment Collateral, | | | | | |
3.50%, 9/20/08 | | 125 | | 125 | |
Citibank Credit Card Issuance Trust, | | | | | |
5.20%, 3/22/12 | | (h)2,900 | | 2,888 | |
5.65%, 9/20/19 | | (c)2,400 | | 2,392 | |
CNH Equipment Trust, | | | | | |
4.02%, 4/15/09 | | 759 | | 758 | |
4.27%, 1/15/10 | | 2,409 | | 2,400 | |
5.20%, 6/15/10 | | 1,775 | | 1,773 | |
Countrywide Asset Backed Certificates, | | | | | |
5.28%, 7/25/25 | | (h)897 | | 894 | |
DaimlerChrysler Auto Trust, | | | | | |
4.04%, 9/8/09 | | 854 | | 851 | |
The accompanying notes are an integral part of the financial statements.
102
2007 Annual Report
September 30, 2007
Portfolio of Investments (cont’d)
Investment Grade Fixed Income Portfolio
| | Face | | | |
| | Amount | | Value | |
| | (000) | | (000) | |
Asset Backed Corporates (cont’d) | | | | | |
First Franklin Mortgage Loan Asset Backed Certificates, | | | | | |
5.18%, 7/25/36 | | $ | (h)1,523 | | $ | 1,513 | |
5.20%, 2/25/36 | | (h)1,112 | | 1,108 | |
5.25%, 10/25/35 | | (h)563 | | 560 | |
Ford Credit Auto Owner Trust, | | | | | |
4.17%, 1/15/09 | | 251 | | 250 | |
5.05%, 3/15/10 | | 1,567 | | 1,565 | |
5.26%, 10/15/10 | | 4,000 | | 4,003 | |
5.76%, 4/15/10 | | (h)5,075 | | 5,056 | |
Fremont Home Loan Owner Trust, | | | | | |
5.18%, 10/25/36 | | (h)2,747 | | 2,728 | |
GE Equipment Small Ticket, LLC, | | | | | |
4.38%, 7/22/09 | | (e)1,570 | | 1,565 | |
4.88%, 10/22/09 | | (e)2,363 | | 2,360 | |
GS Auto Loan Trust, | | | | | |
5.37%, 12/15/10 | | 3,375 | | 3,381 | |
GSAMP Trust, | | | | | |
5.20%, 1/25/37 | | (h)1,758 | | 1,748 | |
5.25%, 4/25/47 | | (h)2,572 | | 2,553 | |
Harley-Davidson Motorcycle Trust, | | | | | |
3.76%, 12/17/12 | | 3,526 | | 3,471 | |
4.07%, 2/15/12 | | 2,300 | | 2,278 | |
Hertz Vehicle Financing, LLC, | | | | | |
4.93%, 2/25/10 | | (e)1,825 | | 1,821 | |
Honda Auto Receivables Owner Trust, | | | | | |
3.87%, 4/20/09 | | 1,111 | | 1,106 | |
3.93%, 1/15/09 | | 383 | | 382 | |
4.85%, 10/19/09 | | 2,135 | | 2,131 | |
Hyundai Auto Receivables Trust, | | | | | |
3.98%, 11/16/09 | | 1,215 | | 1,206 | |
Indymac Residential Asset Backed Trust, | | | | | |
5.26%, 4/25/37 | | (h)2,000 | | 1,987 | |
Long Beach Mortgage Loan Trust, | | | | | |
5.22%, 1/25/36 | | (h)472 | | 470 | |
MBNA Master Credit Card Trust USA, | | | | | |
5.90%, 8/15/11 | | 940 | | 955 | |
7.80%, 10/15/12 | | 2,715 | | 2,917 | |
Merrill Auto Trust Securitization, | | | | | |
4.10%, 8/25/09 | | 1,387 | | 1,382 | |
National City Auto Receivables Trust, | | | | | |
2.88%, 5/15/11 | | 1,466 | | 1,447 | |
Nationstar Home Equity Loan Trust, | | | | | |
5.20%, 9/25/36 | | (h)1,200 | | 1,196 | |
Nissan Auto Receivables Owner Trust, | | | | | |
3.99%, 7/15/09 | | 1,496 | | 1,489 | |
RAAC Series, | | | | | |
5.23%, 9/25/45 | | (h)625 | | 619 | |
Residential Asset Mortgage Products, Inc., | | | | | |
5.20%, 6/25/29 | | (h)2,088 | | 2,073 | |
5.22%, 10/25/36 | | (h)1,666 | | 1,653 | |
Residential Asset Securities Corp., | | | | | |
5.24%, 2/25/30 | | (h)2,144 | | 2,129 | |
Securitized Asset Backed Receivables, LLC Trust, | | | | | |
5.20%, 12/25/35 | | $ | (h)467 | | $ | 466 | |
5.24%, 2/25/37 | | (h)2,728 | | 2,707 | |
5.26%, 5/25/37 | | (h)2,397 | | 2,378 | |
SLM Student Loan Trust, | | | | | |
5.35%, 10/25/14 | | (h)2,848 | | 2,849 | |
Soundview Home Equity Loan Trust, | | | | | |
5.24%, 2/25/37 | | (h)2,349 | | 2,331 | |
Structured Asset Securities Corp., | | | | | |
5.22%, 6/25/37 | | (h)2,476 | | 2,457 | |
Terwin Mortgage Trust, | | | | | |
5.60%, 12/25/34 | | (h)410 | | 398 | |
TXU Electric Delivery Transition Bond Co., | | | | | |
4.81%, 11/17/14 | | 700 | | 698 | |
USAA Auto Owner Trust, | | | | | |
3.90%, 7/15/09 | | 620 | | 618 | |
Volkswagen Auto Loan Enhanced Trust, | | | | | |
4.80%, 7/20/09 | | 1,676 | | 1,672 | |
Wachovia Auto Owner Trust, | | | | | |
2.91%, 4/20/09 | | 35 | | 34 | |
4.06%, 9/21/09 | | 684 | | 681 | |
| | | | 120,323 | |
Collateralized Mortgage Obligations — Agency Collateral Series (0.6%) | | | | | |
Federal Home Loan Mortgage Corporation, | | | | | |
Inv FI I0 | | | | | |
0.24%, 3/15/24 | | 2,389 | | 91 | |
2.25%, 3/15/32 | | 463 | | 42 | |
IO | | | | | |
6.00%, 5/1/31 | | 972 | | 221 | |
6.50%, 4/1/28 - 5/15/33 | | 1,791 | | 416 | |
8.00%, 1/1/28 - 6/1/31 | | 184 | | 46 | |
IO PAC | | | | | |
6.00%, 5/15/30 - 4/15/32 | | 1,403 | | 157 | |
PAC | | | | | |
10.00%, 6/15/20 | | 13 | | 14 | |
Federal National Mortgage Association, | | | | | |
Inv FI I0 | | | | | |
2.87%, 5/18/27 | | 691 | | 75 | |
3.07%, 10/25/28 | | 329 | | 14 | |
3.42%, 10/25/30 | | 186 | | 13 | |
IO | | | | | |
6.00%, 8/25/32 - 11/25/32 | | 1,409 | | 170 | |
6.50%, 2/25/33 - 6/25/33 | | 4,720 | | 1,087 | |
7.00%, 4/25/33 | | 685 | | 156 | |
7.50%, 11/1/29 | | 949 | | 303 | |
8.00%, 4/1/24 - 12/1/31 | | 761 | | 182 | |
9.00%, 11/1/26 | | 81 | | 21 | |
Government National Mortgage Association, | | | | | |
Inv FI IO | | | | | |
2.85%, 8/16/29 | | 486 | | 45 | |
| | | | 3,053 | |
The accompanying notes are an integral part of the financial statements.
103
2007 Annual Report
September 30, 2007
Portfolio of Investments (cont’d)
Investment Grade Fixed Income Portfolio
| | Face | | | |
| | Amount | | Value | |
| | (000) | | (000) | |
Collateralized Mortgage Obligations — Non Agency Collateral Series (5.8%) | | | | | |
Banc of America Commercial Mortgage, Inc., | | | | | |
5.84% | | $ | (h)(o)2,050 | | $ | 2,064 | |
5.87% | | (h)(o)1,475 | | 1,491 | |
Bear Stearns Commercial Mortgage Securities, | | | | | |
5.90%, 6/11/40 | | (h)2,700 | | 2,737 | |
Citigroup Commercial Mortgage Trust, | | | | | |
5.89% | | (h)(o)1,950 | | 1,975 | |
Commercial Mortgage Pass Through Certificates, | | | | | |
6.01% | | (h)(o)1,850 | | 1,889 | |
Countrywide Alternative Loan Trust, | | | | | |
IO | | | | | |
1.19%, 3/20/46 | | 10,561 | | 439 | |
1.51%, 3/20/47 | | (h)21,317 | | 1,095 | |
1.66%, 12/20/35 | | (e)(h)11,701 | | 312 | |
2.07%, 12/20/46 | | (h)25,750 | | 1,151 | |
2.09%, 2/25/37 | | (h)11,627 | | 559 | |
2.14%, 12/20/35 | | (e)(h)15,061 | | 598 | |
2.18%, 10/25/46 | | 15,564 | | 699 | |
GS Mortgage Securities Corp., | | | | | |
IO | | | | | |
2.60%, 3/25/36 | | (e)(h)5,223 | �� | 182 | |
GS Mortgage Securities Corp. II, | | | | | |
5.99%, 8/10/45 | | (h)2,900 | | 2,955 | |
Greenpoint Mortgage Funding Trust, | | | | | |
IO | | | | | |
0.81%, 8/25/45 - 10/25/45 | | (h)15,218 | | 435 | |
Harborview Mortgage Loan Trust, | | | | | |
IO | | | | | |
1.24%, 6/19/35 | | (h)8,113 | | 172 | |
1.53%, 5/19/35 | | (h)11,534 | | 249 | |
1.89%, 3/19/37 | | (h)10,146 | | 431 | |
2.02%, 7/19/46 | | (h)17,704 | | 636 | |
PO | | | | | |
3/19/37 - 7/19/47 | | 6 | | 4 | |
Indymac Index Mortgage Loan Trust, | | | | | |
IO | | | | | |
1.43%, 7/25/35 | | (h)7,494 | | 262 | |
JPMorgan Chase Commercial Mortgage Securities Corp., | | | | | |
5.44%, 6/12/47 | | (h)1,200 | | 1,186 | |
5.94%, 2/12/49 | | (h)1,050 | | 1,064 | |
6.01% | | (h)(o)3,025 | | 3,084 | |
Lehman Brothers Commercial Conduit Mortgage Trust, | | | | | |
6.13%, 7/15/44 | | (h)2,050 | | 2,113 | |
Lehman Brothers-UBS Commercial Mortgage Trust, | | | | | |
5.43%, 2/15/40 | | 800 | | 791 | |
Wachovia Bank Commercial Mortgage Trust, | | | | | |
5.34%, 12/15/43 | | 1,475 | | 1,447 | |
| | | | 30,020 | |
Finance (6.6%) | | | | | |
AIG SunAmerica Global Financing VI, | | | | | |
6.30%, 5/10/11 | | (e)1,910 | | 1,971 | |
American General Finance Corp., | | | | | |
4.63%, 9/1/10 | | 915 | | 898 | |
AXA Financial, Inc., | | | | | |
6.50%, 4/1/08 | | $ | 760 | | $ | 764 | |
Bank of New York Co., Inc. (The), | | | | | |
3.80%, 2/1/08 | | 250 | | 249 | |
Bank One Corp., | | | | | |
6.00%, 2/17/09 | | 1,350 | | 1,369 | |
Capmark Financial Group, Inc., | | | | | |
5.88%, 5/10/12 | | (e)715 | | 652 | |
6.30%, 5/10/17 | | (e)295 | | 257 | |
Caterpillar Financial Services Corp., | | | | | |
3.63%, 11/15/07 | | 190 | | 190 | |
Catlin Insurance Co., Ltd., | | | | | |
7.25% | | (e)(h)(o)925 | | 874 | |
CIT Group, Inc., | | | | | |
4.75%, 8/15/08 | | 490 | | 483 | |
Citicorp, | | | | | |
6.38%, 11/15/08 | | 705 | | 716 | |
Countrywide Home Loans, Inc., | | | | | |
3.25%, 5/21/08 | | 660 | | 636 | |
Farmers Exchange Capital, | | | | | |
7.05%, 7/15/28 | | (c)(e)675 | | 674 | |
Farmers Insurance Exchange, | | | | | |
8.63%, 5/1/24 | | (e)725 | | 833 | |
General Electric Capital Corp., | | | | | |
4.25%, 12/1/10 | | (c)445 | | 436 | |
Goldman Sachs Capital II, | | | | | |
5.79% | | (h)(o)930 | | 881 | |
HSBC Finance Corp., | | | | | |
4.13%, 12/15/08 | | 450 | | 445 | |
5.88%, 2/1/09 | | 345 | | 348 | |
6.38%, 10/15/11 | | 688 | | 711 | |
6.40%, 6/17/08 | | 465 | | 468 | |
6.75%, 5/15/11 | | 365 | | 381 | |
Huntington National Bank, | | | | | |
4.38%, 1/15/10 | | 520 | | 510 | |
iStar Financial, Inc., | | | | | |
6.07%, 3/9/10 | | (h)1,175 | | 1,096 | |
JPMorgan Chase & Co., | | | | | |
6.00%, 2/15/09 | | 640 | | 649 | |
Mantis Reef Ltd., | | | | | |
4.69%, 11/14/08 | | (e)1,100 | | 1,095 | |
Marshall & Ilsley Bank, | | | | | |
3.80%, 2/8/08 | | 1,365 | | 1,357 | |
MBNA Corp., | | | | | |
5.79%, 5/5/08 | | (h)995 | | 998 | |
Nationwide Building Society, | | | | | |
4.25%, 2/1/10 | | (e)1,065 | | 1,044 | |
Platinum Underwriters Finance, Inc., | | | | | |
7.50%, 6/1/17 | | 550 | | 583 | |
Platinum Underwriters Holdings Ltd., | | | | | |
6.37%, 11/16/07 | | 585 | | 584 | |
Popular North America, Inc., | | | | | |
5.65%, 4/15/09 | | 455 | | 459 | |
The accompanying notes are an integral part of the financial statements.
104
2007 Annual Report
September 30, 2007
Portfolio of Investments (cont’d)
Investment Grade Fixed Income Portfolio
| | Face | | | |
| | Amount | | Value | |
| | (000) | | (000) | |
Finance (cont’d) | | | | | |
Sovereign Bancorp, | | | | | |
5.44%, 3/23/10 | | $ | (h)1,540 | | $ | 1,541 | |
Sovereign Bank, | | | | | |
4.00%, 2/1/08 | | 105 | | 104 | |
Two-Rock Pass Through Trust, | | | | | |
6.44% | | (e)(h)(o)645 | | 545 | |
Unicredit Luxembourg Finance S.A., | | | | | |
5.41%, 10/24/08 | | (h)1,665 | | 1,666 | |
USB Capital IX, | | | | | |
6.19% | | (e)(h)(o)895 | | 896 | |
Wachovia Capital Trust Ill, | | | | | |
5.80% | | (h)(o)2,545 | | 2,530 | |
Washington Mutual Preferred Funding II, | | | | | |
6.67% | | (e)(h)(o)300 | | 259 | |
Washington Mutual, Inc., | | | | | |
5.50%, 1/15/13 | | 170 | | 164 | |
8.25%, 4/1/10 | | 920 | | 971 | |
World Financial Properties, | | | | | |
6.91%, 9/1/13 | | (e)1,713 | | 1,767 | |
Xlliac Global Funding, | | | | | |
4.80%, 8/10/10 | | (e)1,110 | | 1,105 | |
| | | | 34,159 | |
Industrials (5.1%) | | | | | |
America West Airlines, Inc., | | | | | |
7.10%, 4/2/21 | | 1,086 | | 1,129 | |
AT&T, Inc., | | | | | |
6.15%, 9/15/34 | | 545 | | 541 | |
Brookfield Asset Management, Inc., | | | | | |
5.80%, 4/25/17 | | 340 | | 341 | |
7.13%, 6/15/12 | | 865 | | 928 | |
Burlington Northern Santa Fe Corp., | | | | | |
6.13%, 3/15/09 | | 540 | | 547 | |
Clorox Co., | | | | | |
5.83%, 12/14/07 | | (h)920 | | 921 | |
Comcast Cable Communications, Inc., | | | | | |
6.75%, 1/30/11 | | 440 | | 457 | |
7.13%, 6/15/13 | | 145 | | 155 | |
Comcast Corp., | | | | | |
6.50%, 1/15/15 | | 150 | | 155 | |
ConAgra Foods, Inc., | | | | | |
7.00%, 10/1/28 | | 280 | | 295 | |
8.25%, 9/15/30 | | 365 | | 432 | |
Consumers Energy Co., | | | | | |
4.80%, 2/17/09 | | 625 | | 622 | |
Cooper Industries, Inc., | | | | | |
5.25%, 11/15/12 | | 660 | | 658 | |
CVS/Caremark Corp., | | | | | |
5.75%, 6/1/17 - 8/15/11 | | 1,115 | | 668 | |
CVS Lease Pass Through, | | | | | |
6.04%, 12/10/28 | | (e)934 | | 910 | |
DaimlerChrysler N.A. Holding Corp., | | | | | |
8.50%, 1/18/31 | | (c)430 | | 535 | |
FBG Finance Ltd., | | | | | |
5.13%, 6/15/15 | | $ | (e)795 | | $ | 751 | |
Federated Department Stores, Inc., | | | | | |
6.30%, 4/1/09 | | 370 | | 374 | |
France Telecom S.A., | | | | | |
8.50%, 3/1/31 | | 790 | | 1,018 | |
Fred Meyer, Inc., | | | | | |
7.45%, 3/1/08 | | 765 | | 771 | |
Home Depot, Inc. (The), | | | | | |
5.48%, 12/16/09 | | (h)1,155 | | 1,141 | |
ICI Wilmington, Inc., | | | | | |
4.38%, 12/1/08 | | 505 | | 503 | |
LG Electronics, Inc., | | | | | |
5.00%, 6/17/10 | | (e)520 | | 515 | |
Miller Brewing Co., | | | | | |
4.25%, 8/15/08 | | (e)800 | | 792 | |
Sprint Capital Corp., | | | | | |
8.75%, 3/15/32 | | 220 | | 253 | |
Systems 2001 Asset Trust, LLC, | | | | | |
6.66%, 9/15/13 | | (e)1,117 | | 1,177 | |
Telecom Italia Capital S.A., | | | | | |
4.00%, 1/15/10 | | 1,100 | | 1,072 | |
Telefonica Europe B.V., | | | | | |
8.25%, 9/15/30 | | (c)885 | | 1,061 | |
Textron Financial Corp., | | | | | |
4.13%, 3/3/08 | | 510 | | 508 | |
5.13%, 2/3/11 | | 750 | | 747 | |
Time Warner, Inc., | | | | | |
5.73%, 11/13/09 | | (h)1,580 | | 1,562 | |
Union Pacific Corp., | | | | | |
6.63%, 2/1/08 | | 370 | | 371 | |
6.79%, 11/9/07 | | 225 | | 225 | |
UnitedHealth Group, Inc., | | | | | |
4.13%, 8/15/09 | | 440 | | 432 | |
5.66%, 3/2/09 | | (h)615 | | 615 | |
Valero Energy Corp., | | | | | |
3.50%, 4/1/09 | | 575 | | 564 | |
Verizon New England, Inc., | | | | | |
6.50%, 9/15/11 | | 610 | | 633 | |
Viacom, Inc., | | | | | |
6.88%, 4/30/36 | | 755 | | 754 | |
Vodafone Group plc, | | | | | |
5.29%, 12/28/07 | | (h)745 | | 745 | |
Yum! Brands, Inc., | | | | | |
8.88%, 4/15/11 | | 610 | | 681 | |
| | | | 26,559 | |
Mortgages — Other (29.6%) | | | | | |
Alliance Bancorp, | | | | | |
5.37%, 7/25/37 | | (h)2,821 | | 2,773 | |
American Home Mortgage Assets, | | | | | |
5.26%, 3/25/47 | | (h)3,147 | | 3,067 | |
5.32%, 10/25/46 - 6/25/47 | | (h)7,702 | | 7,476 | |
5.36%, 9/25/46 | | (h)2,525 | | 2,491 | |
5.43%, 6/25/47 | | (h)1,575 | | 1,411 | |
The accompanying notes are an integral part of the financial statements.
105
2007 Annual Report
September 30, 2007
Portfolio of Investments (cont’d)
Investment Grade Fixed Income Portfolio
| | Face | | | |
| | Amount | | Value | |
| | (000) | | (000) | |
Mortgages — Other (cont’d) | | | | | |
5.45%, 10/25/46 | | $ | (h)1,658 | | $ | 1,548 | |
Banc of America Funding Corp., | | | | | |
5.85%, 9/20/35 | | (h)821 | | 812 | |
Bear Stearns Commercial Mortgage, | | | | | |
5.27%, 8/25/36 | | (h)3,044 | | 2,967 | |
Bear Stearns Mortgage Funding Trust, | | | | | |
5.29%, 12/25/36 | | (h)2,434 | | 2,389 | |
5.33%, 9/25/36 | | (h)2,418 | | 2,366 | |
5.38%, 7/25/36 | | (h)2,554 | | 2,412 | |
California Federal Savings & Loan Association, | | | | | |
8.80%, 1/25/14 | | (d)(k)1 | | 1 | |
Countrywide Alternative Loan Trust, | | | | | |
5.32%, 10/25/46 - 11/25/46 | | (h)4,970 | | 4,863 | |
5.40%, 7/25/46 | | (h)1,523 | | 1,502 | |
5.42%, 6/25/47 | | (h)2,422 | | 2,368 | |
5.76%, 11/20/35 | | (h)725 | | 722 | |
5.81%, 3/20/46 | | (h)1,534 | | 1,500 | |
5.88%, 11/20/35 | | (h)1,503 | | 1,467 | |
5.89%, 12/20/35 | | (h)2,238 | | 2,181 | |
6.50%, 10/25/46 | | (e)343 | | 342 | |
6.68%, 2/25/36 | | (h)1,880 | | 1,854 | |
Deutsche ALT-A Securities, Inc., NIM Trust, | | | | | |
6.75%, 2/25/47 | | (e)(h)1,045 | | 1,005 | |
Deutsche ALT-A Securities, Inc., Alternate Loan Trust, | | | | | |
5.28%, 2/25/47 | | (h)3,590 | | 3,511 | |
5.81%, 2/25/47 | | (h)1,357 | | 1,283 | |
Downey Savings & Loan Association Mortgage Loan Trust, | | | | | |
5.64%, 4/19/38 | | (h)2,567 | | 2,505 | |
5.70%, 11/19/37 | | (h)2,829 | | 2,771 | |
5.92%, 4/19/46 | | (h)2,287 | | 2,263 | |
Federal Home Loan Mortgage Corp., | | | | | |
5.85%, 10/1/36 | | 2,695 | | 2,724 | |
Federal National Mortgage Association, | | | | | |
5.19%, 12/25/36 | | 1,819 | | 1,803 | |
Greenpoint Mortgage Funding Trust, | | | | | |
5.30%, 4/25/47 | | (h)3,735 | | 3,653 | |
5.45%, 3/25/36 | | (h)1,927 | | 1,894 | |
5.52%, 3/25/47 | | (h)3,509 | | 3,435 | |
5.50%, 1/25/37 | | (h)3,414 | | 3,303 | |
GS Mortgage Securities Corp. II, | | | | | |
6.25%, 1/25/37 | | (e)875 | | 866 | |
GSR Mortgage Loan Trust, | | | | | |
5.32%, 8/25/46 | | (h)2,595 | | 2,539 | |
Harborview Mortgage Loan Trust, | | | | | |
5.40%, 7/21/36 | | (h)2,625 | | 2,571 | |
5.59%, 1/19/38 | | (h)766 | | 763 | |
5.60%, 11/19/36 | | (h)2,982 | | 2,906 | |
5.61%, 7/19/45 | | (h)583 | | 575 | |
5.63%, 3/19/37 | | (h)1,987 | | 1,937 | |
5.65%, 3/19/38 | | (h)2,325 | | 2,269 | |
5.68%, 11/19/36 | | (h)3,045 | | 2,981 | |
5.69%, 1/19/38 | | (h)3,352 | | 3,275 | |
5.70%, 3/19/38 - 9/19/36 | | (h)3,179 | | 3,111 | |
5.73%, 7/19/46 | | (h)1,995 | | 1,942 | |
5.75%, 10/19/37 | | $ | (h)2,057 | | $ | 2,018 | |
5.88%, 11/19/35 | | (h)1,163 | | 1,134 | |
6.20%, 1/19/36 | | (h)641 | | 562 | |
Harborview NIM Corp., | | | | | |
6.41%, 3/19/37 - 3/19/38 | | (e)1,200 | | 1,192 | |
Indymac Index Mortgage Loan Trust, | | | | | |
5.23%, 2/25/37 | | (h)2,735 | | 2,715 | |
5.25%, 7/25/46 | | (h)3,325 | | 3,305 | |
5.34%, 11/25/36 | | (h)1,883 | | 1,841 | |
5.51%, 10/25/36 | | (h)1,379 | | 1,345 | |
Lehman XS Trust, | | | | | |
5.53%, 11/25/46 | | (h)700 | | 624 | |
Luminent Mortgage Trust, | | | | | |
5.37%, 4/25/36 | | (h)1,473 | | 1,443 | |
5.49%, 7/25/36 | | (h)622 | | 529 | |
Mastr Adjustable Rate Mortgages Trust, | | | | | |
5.24%, 5/25/47 | | (h)1,406 | | 1,402 | |
5.38%, 4/25/46 | | (h)1,489 | | 1,468 | |
5.53% 1/25/47 | | (h)1,150 | | 914 | |
5.98%, 5/25/47 | | (h)625 | | 450 | |
6.23%, 5/25/47 | | (h)1,500 | | 1,139 | |
Merrill Lynch Mortgage Investors, Inc., | | | | | |
5.25%, 8/25/35 | | (h)150 | | 150 | |
Residential Accredit Loans, Inc., | | | | | |
5.29%, 3/25/47 | | (h)4,560 | | 4,470 | |
5.32%, 12/25/36 | | (h)2,468 | | 2,425 | |
5.33%, 6/25/37 | | (h)1,412 | | 1,383 | |
5.39%, 2/25/46 | | (h)708 | | 695 | |
5.40%, 2/25/46 | | (h)716 | | 707 | |
5.55%, 5/25/46 | | (h)1,536 | | 1,496 | |
5.58%, 5/25/47 | | (h)2,166 | | 2,111 | |
5.62%, 6/25/37 | | (h)1,314 | | 1,261 | |
Ryland Acceptance Corp. IV, | | | | | |
6.65%, 7/1/11 | | 30 | | 30 | |
Structured Asset Mortgage Investments, Inc., | | | | | |
5.32%, 2/25/36 | | (h)611 | | 599 | |
5.33%, 10/25/36 | | (h)2,294 | | 2,251 | |
5.36%, 8/25/36 | | (h)2,449 | | 2,401 | |
5.40%, 4/25/36 | | (h)2,433 | | 2,405 | |
Washington Mutual, Inc., | | | | | |
5.21%, 6/25/46 | | (h)159 | | 159 | |
5.38%, 11/25/45 - 12/25/45 | | (h)1,219 | | 1,213 | |
5.39%, 10/25/45 | | (h)367 | | 366 | |
5.42%, 8/25/45 | | (h)175 | | 174 | |
5.92%, 4/25/46 | | (h)1,977 | | 1,929 | |
5.94%, 8/25/46 | | (h)2,136 | | 2,084 | |
Zuni Mortgage Loan Trust, | | | | | |
5.26%, 8/25/36 | | (h)1,381 | | 1,371 | |
| | | | 154,158 | |
U.S. Treasury Securities (9.0%) | | | | | |
U.S. Treasury Bonds, | | | | | |
4.50%, 2/15/36 | | (c)900 | | 853 | |
5.38%, 2/15/31 | | (c)18,250 | | 19,542 | |
6.13%, 8/15/29 | | (c)10,000 | | 11,669 | |
The accompanying notes are an integral part of the financial statements.
106
2007 Annual Report
September 30, 2007
Portfolio of Investments (cont’d)
Investment Grade Fixed Income Portfolio
| | Face | | | |
| | Amount | | Value | |
| | (000) | | (000) | |
U.S. Treasury Securities (cont’d) | | | | | |
U.S. Treasury Notes, | | | | | |
2.63%, 5/15/08 | | $ | (c)15,000 | | $ | 14,864 | |
| | | | 46,928 | |
Utilities (1.4%) | | | | | |
Appalachian Power Co., | | | | | |
5.65%, 8/15/12 | | 255 | | 257 | |
Arizona Public Service Co., | | | | | |
5.80%, 6/30/14 | | 745 | | 739 | |
Carolina Power & Light Co., | | | | | |
5.13%, 9/15/13 | | 760 | | 745 | |
CenterPoint Energy Resources Corp., | | | | | |
6.25%, 2/1/37 | | 225 | | 222 | |
7.88%, 4/1/13 | | 135 | | 148 | |
Consolidated Natural Gas Co., | | | | | |
6.25%, 11/1/11 | | 355 | | 365 | |
Detroit Edison Co., | | | | | |
6.13%, 10/1/10 | | 480 | | 496 | |
Entergy Gulf States, Inc., | | | | | |
3.60%, 6/1/08 | | 345 | | 340 | |
5.98%, 12/1/09 | | (h)455 | | 451 | |
NiSource Finance Corp., | | | | | |
6.06%, 11/23/09 | | (h)535 | | 531 | |
Ohio Power Corp., | | | | | |
6.00%, 6/1/16 | | 740 | | 745 | |
Plains All American Pipeline, LP, | | | | | |
6.70%, 5/15/36 | | 750 | | 753 | |
Public Service Electric & Gas Co., | | | | | |
5.00%, 1/1/13 | | 580 | | 563 | |
Texas Eastern Transmission, LP, | | | | | |
7.00%, 7/15/32 | | (c)425 | | 450 | |
Wisconsin Electric Power Co., | | | | | |
3.50%, 12/1/07 | | 540 | | 538 | |
| | | | 7,343 | |
Total Fixed Income Securities (Cost $580,705) | | | | 575,553 | |
| | | | | |
| | Shares | | | |
Preferred Stock (0.2%) | | | | | |
Mortgages — Other (0.2%) | | | | | |
Home Ownership Funding Corp., | | | | | |
13.33% (Cost $1,110) | | (e)7,150 | | 1,070 | |
| | | | | |
| | No.of | | | |
| | Contracts | | | |
Put Options Purchased (0.0%) | | | | | |
90 Day EuroDollar | | | | | |
12/07 @ 94.75 (Cost $122) | | (a)678 | | 72 | |
| | | | | |
| | Face | | | |
| | Amount | | | |
| | (000) | | | |
Short-Term Investments (7.2%) | | | | | |
Short-Term Debt Securities held as Collateral on Loaned Securities (0.8%) | | | | | |
AIG Match Funding Corp., | | | | | |
5.73%, 10/17/07 | | $ | (h)176 | | 176 | |
Alliance & Leicester plc, | | | | | |
5.83%, 10/9/07 | | $ | (h)126 | | $ | 126 | |
Bancaja, | | | | | |
5.36%, 10/19/07 | | 63 | | 63 | |
Bank of New York Co., Inc., | | | | | |
5.82%, 10/10/07 | | (h)63 | | 63 | |
BASF AG, | | | | | |
5.36%, 10/22/07 | | (h)63 | | 63 | |
BNP Paribas plc, | | | | | |
5.50%, 11/19/07 | | (h)126 | | 126 | |
CAM US Finance S.A. Unipersonal, | | | | | |
5.37%, 10/3/07 | | 252 | | 252 | |
Canadian Imperial Bank of Commerce, New York, | | | | | |
4.92%, 10/1/07 | | (h)126 | | 126 | |
CC USA, Inc., | | | | | |
4.68%, 10/1/07 | | (h)63 | | 63 | |
CIT Group Holdings, | | | | | |
5.38%, 10/18/07 | | (h)226 | | 226 | |
Citigroup Global Markets Holdings, Inc., | | | | | |
5.26%, 10/1/07 | | 499 | | 499 | |
Credit Suisse First Boston, New York, | | | | | |
4.82%, 10/1/07 | | (h)126 | | 126 | |
First Tennessee Bank, | | | | | |
5.76%, 10/17/07 | | (h)63 | | 63 | |
5.77%, 10/17/07 | | (h)252 | | 252 | |
Goldman Sachs Group, Inc., | | | | | |
5.37%, 10/1/07 | | 118 | | 118 | |
5.82%, 10/15/07 | | (h)63 | | 63 | |
HSBC Finance Corp., | | | | | |
5.81%, 10/9/07 | | (h)63 | | 63 | |
IBM Corp., | | | | | |
5.79%, 10/9/07 | | 252 | | 252 | |
Macquarie Bank Ltd., | | | | | |
5.17%, 10/22/07 | | (h)126 | | 126 | |
Marshall & Ilsley Bank, | | | | | |
5.37%, 12/17/07 | | 125 | | 125 | |
Metropolitan Life Global Funding, | | | | | |
5.13%, 10/22/07 | | (h)188 | | 188 | |
National Rural Utilities Cooperative Finance Corp., | | | | | |
5.73%, 10/1/07 | | (h)252 | | 252 | |
Nationwide Building Society, | | | | | |
5.28%, 12/28/07 | | 146 | | 146 | |
National Bank of Canada, | | | | | |
5.66%, 10/2/07 | | (h)252 | | 252 | |
Societe Generale, New York, | | | | | |
5.11%, 10/31/07 | | (h)302 | | 302 | |
Unicredito Delaware, Inc., | | | | | |
5.77%, 10/15/07 | | (h)138 | | 138 | |
Unicredito Italiano Bank (Ireland) plc, | | | | | |
5.84%, 10/9/07 | | (h)88 | | 88 | |
| | | | 4,337 | |
| | | | | |
| | Shares | | | |
Investment Company (6.1%) | | | | | |
Morgan Stanley Institutional Liquidity | | | | | |
Money Market Portfolio | | | | | |
—Institiutional Class | | (p)31,653,574 | | 31,654 | |
The accompanying notes are an integral part of the financial statements.
107
2007 Annual Report
September 30, 2007
Portfolio of Investments (cont’d)
Investment Grade Fixed Income Portfolio
| | Face | | | |
| | Amount | | Value | |
| | (000) | | (000) | |
U.S. Treasury Security (0.3%) | | | | | |
U.S. Treasury Bill | | | | | |
3.82%, 1/10/08 | | $ | (c)(j)(r)1,800 | | $ | 1,781 | |
Total Short-Term Investments (Cost $37,766) | | | | 37,772 | |
Total Investments (118.0%) (Cost $619,703) | | | | | |
— Including $48,038 of Securities Loaned | | | | 614,467 | |
Liabilities in Excess of Other Assets (-18.0%) | | | | (93,786 | ) |
Net Assets (100%) | | | | $ | 520,681 | |
| | | | | | | |
(a) | Non-income producing security. |
(c) | All or a portion of security on loan at September 30, 2007. |
(d) | Security was valued at fair value — At September 30, 2007, the Portfolio held $1,000 of fair valued securities, representing less than 0.05% of net assets. |
(e) | 144A security — Certain conditions for public sale may exist. Unless otherwise noted, these securities are deemed to be liquid. |
(h) | Variable/Floating Rate Security — Interest rate changes on these instruments are based on changes in a designated base rate. The rates shown are those in effect on September 30, 2007. |
(i) | Security is subject to delayed delivery. |
(j) | All or a portion of the security was pledged to cover margin requirements for futures contracts. |
(k) | Security has been deemed illiquid — At September 30, 2007. |
(o) | Perpetual — Security does not have a predetermined maturity date. Rate for this security is fixed for a period of time then reverts to a floating rate. The interest rate shown is the rate in effect at September 30, 2007. |
(p) | See Note F within the Notes to Financial Statements regarding investment in Morgan Stanley Institutional Liquidity Government Portfolio — Institutional Class, Morgan Stanley Institutional Liquidity Money Market Portfolio —Institutional Class and/or Morgan Stanley Institutional Liquidity Tax-Exempt Portfolio — Institutional Class. |
(r) | Rate shown is the Yield to Maturity at September 30, 2007. |
@ | Face Amount/Value is less than $500. |
Inv Fl | Inverse Floating Rate — Interest rate fluctuates with an inverse relationship to an associated interest rate. Indicated rate is the effective rate at September 30, 2007. |
IO | Interest Only |
PAC | Planned Amortization Class |
PO | Principal Only |
TBA | To Be Announced |
Futures Contracts:
The Portfolio had the following futures contract(s) open at period end:
| | | | | | | | Net | |
| | | | | | | | Unrealized | |
| | Number | | | | | | Appreciation | |
| | of | | Value | | Expiration | | (Depreciation) | |
| | Contracts | | (000) | | Date | | (000) | |
Long: | | | | | | | | | |
EuroDollar | | | | | | | | | |
CME | | 20 | | $ | 4,758 | | Dec-07 | | $ | 13 | |
EuroDollar | | | | | | | | | |
CME | | 20 | | 4,774 | | Mar-08 | | 21 | |
EuroDollar | | | | | | | | | |
CME | | 20 | | 4,781 | | Jun–08 | | 24 | |
EuroDollar | | | | | | | | | |
CME | | 20 | | 4,785 | | Sep-08 | | 26 | |
EuroDollar | | | | | | | | | |
CME | | 20 | | 4,784 | | Dec-08 | | 27 | |
EuroDollar | | | | | | | | | |
CME | | 20 | | 4,781 | | Mar-09 | | 26 | |
EuroDollar | | | | | | | | | |
CME | | 20 | | 4,775 | | Jun-09 | | (5 | ) |
U.S. Treasury | | | | | | | | | |
2yr. Note | | 430 | | 89,030 | | Dec-07 | | 319 | |
U.S. Treasury | | | | | | | | | |
5yr. Note | | 648 | | 69,356 | | Dec-07 | | 436 | |
| | | | | | | | | |
Short: | | | | | | | | | |
U.S. Treasury | | | | | | | | | |
10 yr. Note | | 299 | | 32,675 | | Dec-07 | | 194 | |
U.S. Treasury | | | | | | | | | |
Long Bond | | 540 | | 60,126 | | Dec-07 | | 175 | |
| | | | | | | | $ | 1,256 | |
| | | | | | | | | | | |
CME | Chicago Mercantile Exchange |
The accompanying notes are an integral part of the financial statements.
108
2007 Annual Report
September 30, 2007
Portfolio of Investments (cont’d)
Investment Grade Fixed Income Portfolio
Credit Default Swap Contracts
The Portfolio had the following credit default swap agreement(s) open at period end:
| | | | | | | | | | Unrealized | |
| | | | Notional | | | | | | Appreciation | |
| | Buy/Sell | | Amount | | Pay/Receive | | Termination | | (Depreciation) | |
Swap Counterparty and Reference Obligation | | Protection | | (000) | | Fixed Rate | | Date | | (000) | |
Citigroup | | Buy | | $ | 1,600 | | 0.43 | % | 3/20/12 | | $ | (3 | ) |
Tyco International Ltd., Zero Coupon, 11/17/20 | | | | | | | | | | | |
Goldman Sachs | | Buy | | 1,500 | | 0.80 | | 3/20/11 | | (25 | ) |
Tyco International Ltd., 6.38%, 10/15/11 | | | | | | | | | | | |
Goldman Sachs | | Buy | | 2,600 | | 0.12 | | 12/20/11 | | 13 | |
The Hartford Financial Services Group, Inc., 4.75%, 3/1/14 | | | | | | | | | | | |
Goldman Sachs | | Buy | | 850 | | 0.15 | | 12/20/11 | | 5 | |
Motorola, Inc., 6.50%, 9/1/25 | | | | | | | | | | | |
Goldman Sachs | | Buy | | 1,750 | | 0.16 | | 12/20/11 | | 9 | |
Motorola, Inc., 6.50%, 9/1/25 | | | | | | | | | | | |
Goldman Sachs | | Buy | | 2,600 | | 0.10 | | 3/20/12 | | 15 | |
The Chubb Corp., 6.00%, 11/15/11 | | | | | | | | | | | |
Goldman Sachs | | Buy | | 1,300 | | 0.22 | | 3/20/12 | | (2 | ) |
Dell, Inc., 7.10% 4/15/28 | | | | | | | | | | | |
JPMorgan Chase | | Buy | | 1,500 | | 0.65 | | 3/20/11 | | (18 | ) |
Tyco International Ltd., 2.75%, 1/15/18 | | | | | | | | | | | |
JPMorgan Chase | | Buy | | 455 | | 1.18 | | 6/20/14 | | 4 | |
Belo Corp., 8.00%, 11/1/08 | | | | | | | | | | | |
JPMorgan Chase | | Buy | | 1,300 | | 1.30 | | 6/20/14 | | 4 | |
Belo Corp., 8.00%, 11/1/08 | | | | | | | | | | | |
Lehman Brothers | | Buy | | 1,300 | | 0.20 | | 12/20/11 | | 1 | |
Union Pacific Corp., 6.30%, 1/15/12 | | | | | | | | | | | |
| | | | | | | | | | $ | 3 | |
| | | | | | | | | | | | | |
Interest Rate Swap Contracts
The Portfolio had the following interest rate swap agreement(s) open at period end:
| | | | | | | | | | | | Unrealized | |
| | | | | | | | | | Notional | | Appreciation | |
| | Floating Rate | | Pay/Receive | | Fixed | | Termination | | Amount | | (Depreciation) | |
Swap Counterparty | | Index | | Floating Rate | | Rate | | Date | | (000) | | (000) | |
Citigroup | | 3 Month LIBOR | | Pay | | 5.33 | % | 5/22/17 | | $ | 12,800 | | $ | 304 | |
| | 3 Month LIBOR | | Pay | | 5.37 | | 5/23/17 | | 12,800 | | 340 | |
| | 3 Month LIBOR | | Pay | | 5.34 | | 5/24/17 | | 11,000 | | 265 | |
| | 3 Month LIBOR | | Pay | | 5.02 | | 9/11/17 | | 8,000 | | (125 | ) |
| | 3 Month LIBOR | | Pay | | 5.24 | | 9/27/17 | | 8,000 | | 22 | |
| | 3 Month LIBOR | | Receive | | 5.29 | | 9/28/17 | | 9,000 | | (60 | ) |
Deutsche Bank | | 3 Month LIBOR | | Pay | | 5.39 | | 5/25/17 | | 28,700 | | 807 | |
| | 3 Month LIBOR | | Pay | | 5.43 | | 5/29/17 | | 19,625 | | 614 | |
JPMorgan Chase | | 3 Month LIBOR | | Pay | | 5.37 | | 5/23/17 | | 12,800 | | 343 | |
| | 3 Month LIBOR | | Pay | | 5.34 | | 5/24/17 | | 18,000 | | 437 | |
| | 3 Month LIBOR | | Pay | | 5.45 | | 5/29/17 | | 19,625 | | 643 | |
| | 3 Month LIBOR | | Pay | | 5.44 | | 8/20/17 | | 3,700 | | 68 | |
| | 3 Month LIBOR | | Pay | | 5.09 | | 9/11/17 | | 17,500 | | (179 | ) |
| | 3 Month LIBOR | | Pay | | 5.16 | | 9/20/17 | | 7,500 | | (30 | ) |
| | 3 Month LIBOR | | Receive | | 5.23 | | 9/27/17 | | 8,300 | | (19 | ) |
| | 3 Month LIBOR | | Receive | | 5.30 | | 9/28/17 | | 9,000 | | (68 | ) |
| | | | | | | | | | | | $ | 3,362 | |
| | | | | | | | | | | | | | | |
LIBOR — London Inter Bank Offer Rate
The accompanying notes are an integral part of the financial statements.
109
2007 Annual Report
September 30, 2007
Investment Overview (unaudited)
Limited Duration Portfolio
The Limited Duration Portfolio seeks above-average total return over a market cycle of three to five years. The Portfolio invests primarily in U.S. government securities, investment grade corporate bonds and mortgage securities. The Portfolio seeks value in the fixed income market with only a limited sensitivity to changes in interest rates. The Portfolio will ordinarily seek to maintain an average duration similar to that of the Citigroup 1-3 Year Treasury/Government Sponsored Index, which generally ranges between zero and three years, although there is no minimum or maximum maturity for any individual security. The Portfolio may invest in asset-backed securities and may use futures, options, forwards, collateralized mortgage obligations, swaps, options on swaps and other derivatives.
Performance
For the fiscal year ended September 30, 2007, the Portfolio’s Institutional Class had a total return based on net asset value and reinvestment of distributions per share of 4.26%, net of fees. The Portfolio’s Institutional Class underperformed against its benchmark Citigroup 1-3 Year Treasury/ Government Sponsored Index (the “Index”) which returned 5.76%.
Factors Affecting Performance
• Fears stemming from a residential housing downturn persisted throughout the 12-month period. Confronted with increasing delinquency rates on subprime loans, high-profile hedge fund collapses, and a series of subprime mortgage related credit downgrades, markets responded severely in the latter months of the reporting period. The impact was exacerbated by an influx of forced sellers looking to liquidate assets to help meet margin calls and capital withdrawals, which fueled concerns about the potential impact on the broader financial markets and economy and led to a flight to quality.
• In August, the Federal Open Market Committee (the “Fed”) lowered the discount rate by half a percent, from 6.25% to 5.75%, and began encouraging member banks to make greater use of the discount window without fear of such action being viewed negatively by the Fed. In September, the Fed elected to cut the target federal funds rate by 50 basis points to 4.75%, noting that while economic growth remained moderate, inflation risks remain and “the tightening of credit conditions has the potential to intensify the housing correction and to restrain economic growth”.
• U.S. Treasury yields fluctuated throughout the 12-month period, with the yield curve beginning the period relatively flat and ending the period steep. As the yield curve steepened, shorter dated U.S. Treasury yields experienced the greatest decline, while longer dated yields rose slightly. Within the U.S. government sector, Treasuries and agencies outperformed other investment-grade sectors.
• The mortgage market was hit by the turmoil affecting residential housing, and especially by its spillover effects on secondary market activity, most notably in the non-agency mortgage area, casting a pall across the entire sector with little regard for whether the securities or loans in question were subprime or prime. The result was a further reduction in mortgage market liquidity, as well as a sharp diminishment in the availability of nonconforming mortgage loans to the general public.
• Widening credit spreads led corporate issues to underperform other major asset classes. Within the investment-grade corporate sector, lower-rated (Baa) and higher-rated (AAA) issues outpaced the middle investment grade issues and intermediate-term issues outperformed longer-dated issues. Industrials outpaced utilities and financials, which was the corporate sector hit hardest by the recent liquidity crisis.
• The two primary reasons for the Portfolio’s relative underperformance were its duration positioning and a low relative weighting in Treasury and government-sponsored bonds.
• Increasing leveraged buyout (“LBO”) activity caused credit spread widening in the corporate sector, which hindered the performance of the Portfolio’s holdings in corporate credit. However, security selection in the sector was additive to performance.
• The Portfolio’s mortgage strategy, specifically its holdings in adjustable-rate mortgages (“ARMs”), dampened returns as subprime related issues and illiquidity hurt the sector’s performance.
Management Strategies
• The Portfolio maintained a lower relative interest rate sensitivity, as measured by duration, than that of the Index during the period. Given that interest rates declined for the overall period, this defensive positioning detracted from performance. Additionally, the Portfolio’s yield curve positioning was detrimental to performance as it was not configured to take advantage of the yield curve steepening that occurred during the period.
• We have sought to minimize the Portfolio’s exposure to corporate event risk by attempting to identify and avoid LBO targets, which has proved challenging. Our
110
| 2007 Annual Report |
| |
| September 30, 2007 |
Investment Overview (cont’d)
Limited Duration Portfolio
approach has been to overweight the financial services segment of the market such as banks and insurance companies, to invest in structured credit (asset-backed securities), and to hold small and diversified exposures to industrial companies. This strategy was successful during the period as the incremental income gained from these positions more than offset the negative impact of credit spread widening.
• Within the mortgage sector, we focused on both ARMs and seasoned, higher coupon fixed-rate mortgages originated in a higher interest rate environment. It appears that most of the outstanding higher coupon mortgages have been immune to incentives to refinance into a lower coupon rate as prepayment rates on this product have been slower than expected. The slower prepayments allowed the Portfolio to collect additional interest income on its holdings in this sector. However, the ARMs holdings, comprised largely of non-agency collateral securities, were subject to selling pressures as a result of subprime mortgage events. The severe price adjustments these securities suffered were a function of liquidity being withdrawn from the market rather than a deterioration in credit characteristics.
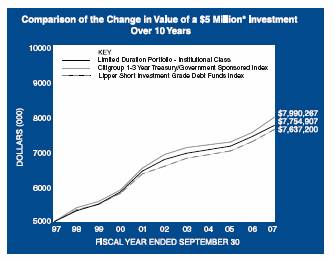
* Minimum Investment
In accordance with SEC regulations, the Portfolio’s performance shown assumes that all recurring fees (including management fees) were deducted and all dividends and distributions were reinvested. The performance of Adviser Class shares will vary from the Institutional Class shares based upon the different inception date and will be negatively impacted by additional fees assessed to this class.
Performance Compared to the Citigroup 1-3 Year Treasury/Government Sponsored Index(1) and the Lipper Short Investment Grade Debt Funds Index(2)
| | Total Returns(3) | |
| | | | Average Annual | |
| | One | | Five | | Ten | | Since | |
| | Year | | Years | | Years | | Inception(6) | |
| | | | | | | | | |
Portfolio — Institutional Class(4) | | 4.26 | % | 2.73 | % | 4.49 | % | 5.02 | % |
Citigroup 1-3 Year Treasury/Government Sponsored Index | | 5.76 | | 2.92 | | 4.80 | | 5.20 | |
Lipper Short Investment Grade Debt Funds Index | | 4.73 | | 3.02 | | 4.33 | | 4.92 | |
Portfolio — Adviser Class(5) | | — | | — | | — | | — | |
Citigroup 1-3 Year Treasury/Government Sponsored Index | | — | | — | | — | | — | |
Lipper Short Investment Grade Debt Funds Index | | — | | — | | — | | — | |
Performance data quoted represents past performance, which is no guarantee of future results, and current performance may be lower or higher than the figures shown. Performance assumes that all dividends and distributions, if any, were reinvested. For the most recent month-end performance figures, please visit www.morganstanley.com/im. Investment return and principal value will fluctuate so that Portfolio shares, when redeemed, may be worth more or less than their original cost. Total returns do not reflect the deduction of taxes that a shareholder would pay on Portfolio distributions or the redemption of Portfolio shares.
(1) | The Citigroup 1-3 Year Treasury/Government Sponsored Index is a fixed income market-value weighted index that includes all U.S. Treasury and U.S. agency securities with remaining maturities of at least one year and not longer than three years. The Index is unmanaged and its returns do not include any sales charges or fees. Such costs would lower performance. It is not possible to invest directly in an index. |
(2) | The Lipper Short Investment Grade Debt Funds Index is an equally weighted performance index of the largest qualifying funds (based on net assets) in the Lipper Short Investment Grade Debt Funds classification. The Index, which is adjusted for capital gains distributions and income dividend, is unmanaged and should not be considered an investment. There are currently 30 funds represented in this Index. As of the date of this report, the Portfolio is in the Lipper Short Investment Grade Debt Funds classification. |
(3) | Total returns for the Portfolio reflect expenses waived and/or reimbursed, if applicable, by the Adviser. Without such waivers and/or reimbursements, total returns would have been lower. Fee waivers and/or reimbursements are voluntary and the Adviser reserves the right to commence or terminate any waiver and/or reimbursement at any time. Returns for periods less than one year are not annualized. |
(4) | Commenced operations on March 31, 1992. |
(5) | Commenced operations on September 28, 2007 and therefore do not have any historical performance to report as the date of this report. |
(6) | For comparative purposes, average annual since inception returns listed for the Indexes refer to the inception date or initial offering of the share class of the Portfolio, not the inception of the Indexes. |
111
2007 Annual Report
September 30, 2007
Investment Overview (cont’d)
Limited Duration Portfolio
Expense Example
As a shareholder of the Portfolio, you incur two types of costs: (1) transactional costs, including redemption fees; (2) ongoing costs, including management fees and other Portfolio expenses. These examples are intended to help you understand your ongoing costs (in dollars) of investing in the Portfolio and to compare these costs with the ongoing costs of investing in other mutual funds.
These examples are based on an investment of $1,000 invested at the beginning of the six-month period ended September 30, 2007 and held for the entire six-month period.
Actual Expenses
The first line of the tables below provides information about actual account values and actual expenses. You may use the information in this line, together with the amount you invested, to estimate the expenses that you paid over the period. Simply divide your account value by $1,000 (for example, an $8,600 account value divided by $1,000 = 8.6), then multiply the result by the number in the first line under the heading entitled ‘‘Expenses Paid During Period’’ to estimate the expenses you paid on your account during this period.
Please note that ‘‘Expenses Paid During Period’’ are grossed up to reflect Portfolio expenses prior to the effect of Expense Offset (See Note E in the Notes to Financial Statements). Therefore, the annualized net expense ratios may differ from the ratio of expenses to average net assets shown in the Financial Highlights.
Please note that the Portfolio’s Adviser Class Share commenced operations on September 28, 2007; therefore, actual expenses paid during the period reflect activity from September 28, 2007 through September 30, 2007.
Hypothetical Example for Comparison Purposes
The second line of the tables below provides information about hypothetical account values and hypothetical expenses based on the Portfolio’s actual expense ratio and an assumed rate of return of 5% per year before expenses, which is not the Portfolio’s actual return. The hypothetical account values and expenses may not be used to estimate the actual ending account balance or expenses you paid for the period. You may use this information to compare the ongoing costs of investing in the Portfolio and other funds. To do so, compare this 5% hypothetical example with the 5% hypothetical examples that appear in the shareholder reports of the other funds.
Please note that while the Portfolio’s Adviser Class Share commenced operations on September 28, 2007, the hypothetical expenses paid during the period reflect projected activity for the full six month period for the purposes of comparability. This projection assumes that the annualized expense ratio for the Portfolio’s Adviser Class Share was in effect during the period from April 1, 2007 to September 30, 2007.
Please note that the expenses shown in the table are meant to highlight your ongoing costs only and do not reflect any transactional costs, such as redemption fees. Therefore, the second line of the table is useful in comparing ongoing costs only, and will not help you determine the relative total costs of owning different funds. In addition, if these transactional costs were included, your costs would have been higher.
| | | | | | Expenses Paid | |
| | | | Ending Account | | During Period* | |
| | Beginning | | Value | | April 1, 2007 — | |
| | Account Value | | September 30, | | September 30, | |
| | April 1, 2007 | | 2007 | | 2007 | |
| | | | | | | |
Institutional Class | | | | | | | |
Actual | | $ | 1,000.00 | | $ | 1,016.70 | | $ | 2.17 | |
Hypothetical (5% average annual return before expenses) | | 1,000.00 | | 1,022.91 | | 2.18 | |
| | | | | | | | | | |
| | | | | | Expenses Paid | |
| | | | | | During Period* | |
| | | | Ending Account | | September 28, | |
| | | | Value | | 2007 — | |
| | Beginning | | September 30, | | September 30, | |
| | Account Value | | 2007 | | 2007 | |
Adviser Class | | | | | | | |
Actual | | $ | 1,000.00 | | $ | 1,000.00 | | $ | 0.05 | |
Hypothetical (5% average annual return before expenses) | | 1,000.00 | | 1,022.11 | | 2.99 | |
| | | | | | | | | | |
* Expenses are equal to Institutional Class’ and Adviser Class’ annualized net expense ratios of 0.43% and 0.59%, respectively, multiplied by the average account value over the period, multiplied by 183/365 for the Institutional Class (to reflect the one-half year period) and multiplied by 3/365 for the Adviser Class (to reflect the actual days in the period).
Graphic Presentation of Portfolio Holdings
The following graph depicts the Portfolio’s holdings by industry and/or investment type, as a percentage of total investments.
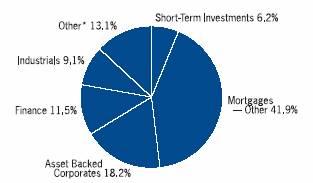
* Industries and/or investment types which do not appear in the above graph, as well as those which represent less than 5% of total investments, if applicable, are included in the category labeled “Other.”
112
| 2007 Annual Report |
| |
| September 30, 2007 |
Portfolio of Investments
Limited Duration Portfolio
| | Face | | | |
| | Amount | | Value | |
| | (000) | | (000) | |
Fixed Income Securities (95.0%) | | | | | |
Agency Adjustable Rate Mortgages (4.1%) | | | | | |
Federal Home Loan Mortgage Corp., | | | | | |
4.35%, 10/1/33 | | $ | 5,291 | | $ | 5,324 | |
4.38%, 7/1/35 | | 6,609 | | 6,573 | |
5.47%, 7/1/34 | | 959 | | 971 | |
Federal National Mortgage Association, | | | | | |
4.08%, 2/1/35 | | 896 | | 898 | |
4.22%, 5/1/35 | | 3,768 | | 3,850 | |
4.55%, 4/1/35 | | 1,370 | | 1,372 | |
4.72%, 9/1/35 | | 4,494 | | 4,455 | |
4.74%, 5/1/35 | | 6,108 | | 6,051 | |
5.50%, 7/1/34 | | 912 | | 917 | |
5.60%, 6/1/34 | | 440 | | 443 | |
6.98%, 3/1/36 | | 5,594 | | 5,694 | |
7.49%, 8/1/36 | | 5,633 | | 5,769 | |
Government National Mortgage Association, | | | | | |
5.75%, 7/20/27 - 9/20/27 | | 123 | | 124 | |
6.13%, 12/20/25 - 12/20/27 | | 119 | | 121 | |
6.38%, 1/20/25 - 1/20/28 | | 510 | | 517 | |
| | | | 43,079 | |
Agency Fixed Rate Mortgages (1.5%) | | | | | |
Federal Home Loan Mortgage Corp., | | | | | |
Conventional Pools: | | | | | |
10.00%, 3/1/11 - 10/1/20 | | 98 | | 108 | |
11.00%, 5/1/20 | | 6 | | 7 | |
11.50%, 1/1/18 | | 14 | | 15 | |
Gold Pools: | | | | | |
6.50%, 9/1/19 - 11/1/29 | | 206 | | 213 | |
7.00%, 3/1/32 | | 3 | | 3 | |
7.50%, 11/1/19 - 11/1/32 | | 2,486 | | 2,602 | |
8.50%, 8/1/28 | | 64 | | 69 | |
10.00%, 10/1/21 | | 8 | | 9 | |
10.50%, 1/1/19 - 10/1/20 | | 22 | | 25 | |
11.50%, 8/1/10 | | 7 | | 8 | |
12.00%, 6/1/15 - 9/1/15 | | 31 | | 36 | |
Federal National Mortgage Association, | | | | | |
Conventional Pools: | | | | | |
6.50%, 3/1/18 - 10/1/32 | | 3,044 | | 3,122 | |
7.00%, 5/1/26 - 12/1/34 | | 4,050 | | 4,209 | |
7.50%, 9/1/29 - 7/1/32 | | 3,676 | | 3,842 | |
8.00%, 12/1/29 - 8/1/31 | | 223 | | 236 | |
9.50%, 11/1/20 | | 26 | | 29 | |
10.00%, 8/1/16 - 9/1/16 | | 25 | | 29 | |
10.50%, 12/1/16 | | 13 | | 14 | |
11.00%, 7/1/20 | | 9 | | 10 | |
11.50%, 11/1/19 | | 24 | | 27 | |
12.50%, 2/1/15 | | 18 | | 21 | |
Government National Mortgage Association, | | | | | |
Various Pools: | | | | | |
9.00%, 11/15/16 - 1/15/17 | | 95 | | 102 | |
9.50%, 12/15/17 - 12/15/21 | | 202 | | 220 | |
10.00%, 11/15/09 - 7/15/22 | | 481 | | 544 | |
10.50%, 8/15/21 | | $ | 26 | | $ | 30 | |
11.00%, 1/15/10 - 1/15/21 | | 201 | | 227 | |
11.50%, 2/15/13 - 11/15/19 | | 131 | | 149 | |
| | | | 15,906 | |
Asset Backed Corporates (18.5%) | | | | | |
ACE Securities Corp., | | | | | |
7.83%, 9/25/33 | | (h)515 | | 123 | |
Aegis Asset Backed Securities Trust, | | | | | |
7.13%, 6/25/34 | | (h)2,325 | | 1,656 | |
Ameriquest Mortgage Securities, Inc., | | | | | |
6.28%, 8/25/34 | | (h)2,675 | | 2,486 | |
Amortizing Residential Collateral Trust, | | | | | |
8.88%, 1/25/33 | | (h)122 | | 11 | |
Capital Auto Receivables Asset Trust, | | | | | |
4.05%, 7/15/09 | | 2,670 | | 2,660 | |
4.98%, 5/15/11 | | 9,700 | | 9,688 | |
5.02%, 9/15/11 | | 5,250 | | 5,258 | |
5.31%, 10/20/09 | | (e)9,750 | | 9,750 | |
5.38%, 7/20/10 | | 9,100 | | 9,137 | |
Capital One Auto Finance Trust, | | | | | |
5.07%, 7/15/11 | | 4,250 | | 4,246 | |
Caterpillar Financial Asset Trust, | | | | | |
5.57%, 5/25/10 | | 7,800 | | 7,828 | |
Chase Issuance Trust, | | | | | |
4.96%, 9/15/12 | | 10,225 | | 10,233 | |
Chase Manhattan Auto Owner Trust, | | | | | |
2.83%, 9/15/10 | | 4,709 | | 4,667 | |
2.94%, 6/15/10 | | 671 | | 671 | |
CIT Equipment Collateral, | | | | | |
3.50%, 9/20/08 | | 437 | | 436 | |
5.07%, 2/20/10 | | 4,675 | | 4,645 | |
CNH Equipment Trust, | | | | | |
5.20%, 6/15/10 | | 3,650 | | 3,646 | |
5.40%, 10/17/11 | | 3,000 | | 3,000 | |
Countrywide Asset Backed Certificates, | | | | | |
4.37%, 11/25/35 | | (h)2,929 | | 2,908 | |
Credit Based Asset Servicing and Securitization, LLC, | | | | | |
5.17%, 7/25/36 | | (h)2,842 | | 2,823 | |
DaimlerChrysler Auto Trust, | | | | | |
2.58%, 4/8/09 | | 1,773 | | 1,772 | |
Ford Credit Auto Owner Trust, | | | | | |
5.05%, 3/15/10 | | 4,208 | | 4,202 | |
5.26%, 10/15/10 | | 5,725 | | 5,730 | |
5.40%, 8/15/11 | | 8,950 | | 9,010 | |
GE Equipment Small Ticket, LLC, | | | | | |
4.38%, 7/22/09 | | (e)3,140 | | 3,130 | |
4.88%, 10/22/09 | | (e)6,128 | | 6,122 | |
Harley-Davidson Motorcycle Trust, | | | | | |
2.63%, 11/15/10 | | 770 | | 770 | |
2.76%, 5/15/11 | | 1,570 | | 1,562 | |
3.56%, 2/15/12 | | 3,375 | | 3,335 | |
3.76%, 12/17/12 | | 8,792 | | 8,655 | |
4.07%, 2/15/12 | | 5,600 | | 5,547 | |
4.41%, 6/15/12 | | 5,420 | | 5,276 | |
The accompanying notes are an integral part of the financial statements.
113
2007 Annual Report
September 30, 2007
Portfolio of Investments (cont’d)
Limited Duration Portfolio
| | Face | | | |
| | Amount | | Value | |
| | (000) | | (000) | |
Asset Backed Corporates (cont’d) | | | | | |
Hertz Vehicle Financing, LLC, | | | | | |
4.93%, 2/25/10 | | $ | (e)4,550 | | $ | 4,539 | |
Home Equity Asset Trust, | | | | | |
7.23%, 8/25/34 | | (h)1,100 | | 993 | |
Honda Auto Receivables Owner Trust, | | | | | |
4.85%, 10/19/09 | | 5,995 | | 5,984 | |
Hyundai Auto Receivables Trust, | | | | | |
2.97%, 5/15/09 | | 556 | | 554 | |
5.04%, 1/17/12 | | 7,900 | | 7,878 | |
Lehman XS Trust, | | | | | |
5.43%, 2/25/46 | | (h)4,120 | | 4,002 | |
Long Beach Mortgage Loan Trust, | | | | | |
5.22%, 1/25/34 | | (h)1,415 | | 1,411 | |
National City Auto Receivables Trust, | | | | | |
2.88%, 5/15/11 | | 3,755 | | 3,706 | |
Nationstar Home Equity Loan Trust, | | | | | |
5.19%, 6/25/37 | | (h)4,808 | | 4,772 | |
New Century Home Equity Loan Trust, | | | | | |
4.46%, 8/25/35 | | (g)1,415 | | 1,404 | |
Park Place Securities, Inc., | | | | | |
6.98%, 10/25/34 | | (h)3,125 | | 2,650 | |
Securitized Asset Backed Receivables, LLC Trust, | | | | | |
5.20%, 11/25/35 - 12/25/35 | | (h)2,372 | | 2,366 | |
Soundview Home Equity Loan Trust, | | | | | |
5.19%, 6/25/36 | | (h)944 | | 942 | |
Structured Asset Investment Loan Trust, | | | | | |
8.13%, 6/25/33 | | (h)1,423 | | 1,328 | |
USAA Auto Owner Trust, | | | | | |
3.58%, 2/15/11 | | 1,737 | | 1,727 | |
4.90%, 2/15/12 | | 8,900 | | 8,913 | |
Whole Auto Loan Trust, | | | | | |
2.58%, 3/15/10 | | 1,339 | | 1,327 | |
| | | | 195,479 | |
Collateralized Mortgage Obligations — Agency Collateral Series (0.9%) | | | | | |
Federal Home Loan Mortgage Corp., | | | | | |
7.50%, 9/15/29 | | 3,791 | | 3,949 | |
PAC | | | | | |
3.50%, 5/15/22 | | 1,338 | | 1,329 | |
Federal National Mortgage Association, | | | | | |
PAC | | | | | |
5.50%, 1/25/24 | | 2,364 | | 2,365 | |
6.50%, 6/25/35 | | 2,372 | | 2,451 | |
| | | | 10,094 | |
Collateralized Mortgage Obligations — Non Agency Collateral Series (1.8%) | | | | | |
Citigroup Commercial Mortgage Trust, | | | | | |
5.62% | | (h)(o)2,137 | | 2,165 | |
Countrywide Alternative Loan Trust, | | | | | |
IO | | | | | |
1.19%, 3/20/46 | | (h)25,320 | | 1,052 | |
2.09%, 2/25/37 | | 19,689 | | 947 | |
Greenpoint Mortgage Funding Trust, | | | | | |
IO | | | | | |
0.81%, 8/25/45 - 10/25/45 | | (h)34,387 | | 983 | |
GS Mortgage Securities Corp., | | | | | |
IO | | | | | |
2.60%, 8/25/35 | | $ | (e)(h)14,429 | | $ | 503 | |
Harborview Mortgage Loan Trust, | | | | | |
IO | | | | | |
1.24%, 6/19/35 | | (h)19,160 | | 407 | |
1.53%, 5/19/35 | | (h)22,667 | | 489 | |
1.85%, 1/19/36 | | (h)29,671 | | 760 | |
1.89%, 3/19/37 | | (h)24,408 | | 1,037 | |
2.02%, 7/19/47 | | (h)43,080 | | 1,548 | |
2.08%, 1/19/36 | | (h)12,353 | | 363 | |
PO | | | | | |
3/19/37 | | 14 | | 10 | |
7/19/47 | | @— | | @— | |
Indymac Index Mortgage Loan Trust, | | | | | |
IO | | | | | |
0.80%, 7/25/34 | | 20,253 | | 3 | |
1.43%, 7/25/35 | | (h)17,748 | | 621 | |
JPMorgan Chase Commercial Mortgage Securities Corp., | | | | | |
5.65% | | (o)5,690 | | 5,751 | |
Washington Mutual, Inc., | | | | | |
IO | | | | | |
0.21%, 6/25/44 | | 8,721 | | 134 | |
0.36%, 7/25/44 | | 16,534 | | 248 | |
0.37%, 10/25/44 | | 22,908 | | 337 | |
0.54%, 3/25/47 | | 117,330 | | 1,537 | |
| | | | 18,895 | |
Finance (11.6%) | | | | | |
Allstate Life Global Funding Trusts, | | | | | |
4.50%, 5/29/09 | | 690 | | 686 | |
American General Finance Corp., | | | | | |
4.63%, 5/15/09 - 9/1/10 | | 1,485 | | 1,466 | |
AXA Financial, Inc., | | | | | |
6.50%, 4/1/08 | | 870 | | 875 | |
Bank of America Corp., | | | | | |
3.38%, 2/17/09 | | 3,095 | | 3,027 | |
3.88%, 1/15/08 | | 1,100 | | 1,095 | |
Bank One Corp., | | | | | |
6.00%, 2/17/09 | | 664 | | 673 | |
Capital One Financial Corp., | | | | | |
6.00%, 9/10/09 | | (h)3,240 | | 3,221 | |
Capmark Financial Group, Inc., | | | | | |
5.88%, 5/10/12 | | (e)2,065 | | 1,882 | |
CIT Group, Inc., | | | | | |
4.75%, 8/15/08 | | 2,270 | | 2,237 | |
Citicorp, | | | | | |
6.38%, 11/15/08 | | 1,055 | | 1,072 | |
Citigroup, Inc., | | | | | |
3.63%, 2/9/09 | | 2,655 | | 2,609 | |
4.63%, 8/3/10 | | 1,120 | | 1,112 | |
Countrywide Home Loans, Inc., | | | | | |
3.25%, 5/21/08 | | 2,515 | | 2,424 | |
Credit Suisse USA, Inc., | | | | | |
6.13%, 11/15/11 | | 1,040 | | 1,072 | |
The accompanying notes are an integral part of the financial statements.
114
| 2007 Annual Report |
| |
| September 30, 2007 |
Portfolio of Investments (cont’d)
Limited Duration Portfolio
| | Face | | | |
| | Amount | | Value | |
| | (000) | | (000) | |
Finance (cont’d) | | | | | |
Goldman Sachs Group, Inc., | | | | | |
4.13%, 1/15/08 | | $ | 3,435 | | $ | 3,421 | |
6.88%, 1/15/11 | | 2,550 | | 2,671 | |
Hartford Financial Services Group, Inc. (The), | | | | | |
5.55%, 8/16/08 | | 3,700 | | 3,709 | |
HBOS Treasury Services, | | | | | |
5.63%, 7/20/09 | | (e)5,400 | | 5,453 | |
HSBC Finance Corp., | | | | | |
4.13%, 12/15/08 | | 760 | | 752 | |
5.88%, 2/1/09 | | 1,580 | | 1,593 | |
6.38%, 10/15/11 | | 285 | | 295 | |
6.40%, 6/17/08 | | 1,470 | | 1,480 | |
6.75%, 5/15/11 | | 630 | | 658 | |
International Lease Finance Corp., | | | | | |
4.63%, 6/2/08 | | 4,015 | | 3,992 | |
iStar Financial, Inc., | | | | | |
6.07%, 3/9/10 | | (h)2,380 | | 2,220 | |
John Hancock Financial Services, Inc., | | | | | |
5.63%, 12/1/08 | | 3,365 | | 3,393 | |
John Hancock Global Funding II, | | | | | |
7.90%, 7/2/10 | | (e)625 | | 671 | |
JPMorgan Chase & Co., | | | | | |
6.00%, 2/15/09 | | 805 | | 816 | |
6.75%, 2/1/11 | | 2,600 | | 2,734 | |
7.00%, 11/15/09 | | 315 | | 327 | |
Lehman Brothers Holdings, Inc., | | | | | |
5.26%, 12/23/08 | | (h)2,130 | | 2,107 | |
5.42%, 12/23/10 | | (h)1,155 | | 1,118 | |
Mantis Reef Ltd., | | | | | |
4.69%, 11/14/08 | | (e)2,350 | | 2,339 | |
MBNA Corp., | | | | | |
5.63%, 11/30/07 | | 1,250 | | 1,251 | |
5.79%, 5/5/08 | | (h)1,605 | | 1,610 | |
Metropolitan Life Global Funding I, | | | | | |
4.63%, 8/19/10 | | (e)4,310 | | 4,303 | |
Monumental Global Funding II, | | | | | |
3.85%, 3/3/08 | | (e)2,596 | | 2,578 | |
4.38%, 7/30/09 | | (e)2,335 | | 2,319 | |
Platinum Underwriters Holdings Ltd., | | | | | |
6.37%, 11/16/07 | | 1,650 | | 1,649 | |
Popular North America, Inc., | | | | | |
5.65%, 4/15/09 | | 2,245 | | 2,264 | |
Pricoa Global Funding I, | | | | | |
3.90%, 12/15/08 | | (e)2,930 | | 2,883 | |
Prudential Funding, LLC, | | | | | |
6.60%, 5/15/08 | | (e)1,970 | | 1,982 | |
Residential Capital Corp., | | | | | |
7.00%, 2/22/11 | | 1,300 | | 1,060 | |
Santander Central Hispano Issuance Ltd., | | | | | |
7.63%, 11/3/09 | | 3,900 | | 4,102 | |
Simon Property Group, LP, | | | | | |
6.38%, 11/15/07 | | 2,115 | | 2,116 | |
SLM Corp., | | | | | |
4.00%, 1/15/10 | | $ | 3,825 | | $ | 3,585 | |
Sovereign Bancorp, | | | | | |
5.44%, 3/23/10 | | (h)3,160 | | 3,162 | |
Sovereign Bank, | | | | | |
4.00%, 2/1/08 | | 635 | | 632 | |
Suntrust Bank, | | | | | |
4.55%, 5/25/09 | | 4,238 | | 4,217 | |
Unicredit Luxembourg Finance S.A., | | | | | |
5.41%, 10/24/08 | | (e)(h)4,310 | | 4,313 | |
Wachovia Capital Trust Ill, | | | | | |
5.80% | | (h)(o)3,170 | | 3,151 | |
Wachovia Corp., | | | | | |
3.63%, 2/17/09 | | 1,030 | | 1,011 | |
Washington Mutual, Inc., | | | | | |
4.00%, 1/15/09 | | 1,130 | | 1,110 | |
8.25%, 4/1/10 | | 2,233 | | 2,357 | |
Wells Fargo & Co., | | | | | |
3.12%, 8/15/08 | | 2,638 | | 2,587 | |
World Financial Properties, | | | | | |
6.91%, 9/1/13 | | (e)2,397 | | 2,473 | |
6.95%, 9/1/13 | | (e)738 | | 763 | |
Xlliac Global Funding, | | | | | |
4.80%, 8/10/10 | | (e)2,485 | | 2,473 | |
| | | | 123,151 | |
Industrials (9.2%) | | | | | |
American Honda Finance Corp., | | | | | |
3.85%, 11/6/08 | | (e)2,650 | | 2,610 | |
AT&T, Inc., | | | | | |
5.30%, 11/15/10 | | 600 | | 606 | |
5.46%, 2/5/10 | | (h)3,145 | | 3,136 | |
BAE Systems Holdings, Inc., | | | | | |
4.75%, 8/15/10 | | (e)2,200 | | 2,176 | |
Baxter International, Inc., | | | | | |
5.20%, 2/16/08 | | 3,405 | | 3,403 | |
Brookfield Asset Management, Inc., | | | | | |
8.13%, 12/15/08 | | 2,555 | | 2,654 | |
Burlington Northern Santa Fe Corp., | | | | | |
6.13%, 3/15/09 | | 3,165 | | 3,204 | |
Clorox Co., | | | | | |
5.83%, 12/14/07 | | (h)2,820 | | 2,823 | |
Comcast Cable Communications, Inc., | | | | | |
6.88%, 6/15/09 | | 1,110 | | 1,141 | |
Comcast Corp., | | | | | |
5.85%, 1/15/10 | | 900 | | 915 | |
Consumers Energy Co., | | | | | |
4.80%, 2/17/09 | | 2,345 | | 2,335 | |
COX Communications, Inc., | | | | | |
6.25%, 12/14/07 | | (h)1,134 | | 1,135 | |
CVS/Caremark Corp., | | | | | |
3.88%, 11/1/07 | | 50 | | 50 | |
4.00%, 9/15/09 | | 2,710 | | 2,656 | |
DaimlerChrysler N.A. Holding Corp., | | | | | |
4.05%, 6/4/08 | | 1,140 | | 1,128 | |
The accompanying notes are an integral part of the financial statements.
115
2007 Annual Report
September 30, 2007
Portfolio of Investments (cont’d)
Limited Duration Portfolio
| | Face | | | |
| | Amount | | Value | |
| | (000) | | (000) | |
Industrials (cont’d) | | | | | |
6.13%, 3/13/09 | | $ | (h)2,425 | | $ | 2,416 | |
8.00%, 6/15/10 | | 85 | | 91 | |
Deutsche Telekom International Finance B.V., | | | | | |
8.00%, 6/15/10 | | 2,245 | | 2,406 | |
Federated Department Stores, Inc., | | | | | |
6.30%, 4/1/09 | | 790 | | 798 | |
6.63%, 9/1/08 | | 1,790 | | 1,804 | |
FedEx Corp., | | | | | |
5.50%, 8/15/09 | | 2,100 | | 2,124 | |
Fred Meyer, Inc., | | | | | |
7.45%, 3/1/08 | | 2,116 | | 2,133 | |
General Mills, Inc., | | | | | |
3.88%, 11/30/07 | | 3,070 | | 3,062 | |
Home Depot, Inc. (The), | | | | | |
5.82%, 12/16/09 | | (h)2,425 | | 2,395 | |
Hospira, Inc., | | | | | |
5.68%, 3/30/10 | | (h)2,130 | | 2,113 | |
ICI Wilmington, Inc., | | | | | |
4.38%, 12/1/08 | | 1,070 | | 1,065 | |
J.C. Penney Corp., | | | | | |
7.38%, 8/15/08 | | 2,610 | | 2,648 | |
Kraft Foods, Inc., | | | | | |
4.00%, 10/1/08 | | 910 | | 900 | |
4.13%, 11/12/09 | | 2,560 | | 2,517 | |
Lenfest Communications, Inc., | | | | | |
7.63%, 2/15/08 | | 185 | | 186 | |
Miller Brewing Co., | | | | | |
4.25%, 8/15/08 | | (e)3,095 | | 3,065 | |
Safeway, Inc., | | | | | |
7.50%, 9/15/09 | | 1,585 | | 1,654 | |
Sara Lee Corp., | | | | | |
2.75%, 6/15/08 | | 2,770 | | 2,719 | |
Sealed Air Corp., | | | | | |
6.95%, 5/15/09 | | (e)440 | | 455 | |
Sprint Nextel Corp., | | | | | |
5.60%, 6/28/10 | | (h)2,515 | | 2,516 | |
Telecom Italia Capital S.A., | | | | | |
4.00%, 1/15/10 | | 385 | | 375 | |
4.88%, 10/1/10 | | 2,400 | | 2,374 | |
Textron Financial Corp., | | | | | |
4.13%, 3/3/08 | | 3,135 | | 3,122 | |
Time Warner, Inc., | | | | | |
5.73%, 11/13/09 | | (h)3,310 | | 3,273 | |
Union Pacific Corp., | | | | | |
6.79%, 11/9/07 | | 3,150 | | 3,154 | |
UnitedHealth Group, Inc., | | | | | |
4.13%, 8/15/09 | | 1,065 | | 1,045 | |
5.66%, 3/2/09 | | (h)1,090 | | 1,090 | |
Valero Energy Corp., | | | | | |
3.50%, 4/1/09 | | 3,280 | | 3,216 | |
Verizon Global Funding Corp., | | | | | |
7.25%, 12/1/10 | | 1,140 | | 1,212 | |
Viacom, Inc., | | | | | |
5.75%, 4/30/11 | | $ | 2,145 | | $ | 2,167 | |
6.04%, 6/16/09 | | (h)1,270 | | 1,266 | |
Vodafone Group plc, | | | | | |
5.29%, 12/28/07 | | (h)3,800 | | 3,798 | |
WellPoint, Inc., | | | | | |
3.75%, 12/14/07 | | 1,130 | | 1,126 | |
Yum! Brands, Inc., | | | | | |
7.65%, 5/15/08 | | 3,110 | | 3,153 | |
| | | | 97,410 | |
Mortgages — Other (42.5%) | | | | | |
American Home Mortgage Assets, | | | | | |
5.36%, 5/25/46 | | (h)5,217 | | 5,130 | |
5.37%, 6/25/47 | | (h)8,390 | | 7,971 | |
5.39%, 10/25/46 | | (h)7,848 | | 7,624 | |
5.43%, 6/25/47 | | (h)3,272 | | 2,933 | |
5.45%, 10/25/46 | | (h)3,362 | | 3,138 | |
American Home Mortgage Investment Trust, | | | | | |
4.34%, 2/25/44 | | (h)691 | | 692 | |
5.32%, 5/25/47 | | (h)8,139 | | 7,992 | |
5.55%, 3/25/46 | | (h)2,693 | | 2,020 | |
Banc of America Funding Corp., | | | | | |
6.21%, 9/20/46 | | (h)5,777 | | 5,823 | |
Banc of America Mortgage Securities, Inc., | | | | | |
4.37%, 1/25/35 | | (h)4,492 | | 4,434 | |
5.66%, 7/25/34 | | (h)731 | | 736 | |
Bear Stearns Mortgage Funding Trust, | | | | | |
5.31%, 10/25/36 | | (h)6,182 | | 6,044 | |
5.34%, 12/25/36 | | (h)6,791 | | 6,637 | |
Citigroup Mortgage Loan Trust, Inc., | | | | | |
5.79%, 9/25/34 | | (h)2,214 | | 2,222 | |
5.98%, 8/25/34 | | (h)1,245 | | 1,264 | |
Countrywide Alternative Loan Trust,, | | | | | |
5.25%, 7/25/46 | | (e)339 | | 338 | |
5.32%, 11/25/46 | | (h)4,561 | | 4,465 | |
5.34%, 2/25/47 | | (h)4,770 | | 4,628 | |
5.36%, 8/25/46 | | (h)7,499 | | 7,290 | |
5.38%, 9/25/47 | | (h)5,331 | | 5,218 | |
5.50%, 2/25/35 - 5/25/35 | | (h)13,652 | | 13,567 | |
5.77%, 5/20/46 | | (h)4,725 | | 4,605 | |
5.79%, 8/25/35 - 11/20/35 | | (h)2,947 | | 2,932 | |
5.88%, 11/20/35 | | (h)6,581 | | 6,427 | |
6.48%, 11/25/35 | | (h)5,043 | | 5,037 | |
6.68%, 2/25/36 | | (h)3,027 | | 2,985 | |
Countrywide Home Loan Mortgage Pass Through Trust, | | | | | |
4.56%, 11/20/34 | | (h)2,027 | | 1,998 | |
5.40%, 4/25/46 | | (h)3,641 | | 3,601 | |
Downey Savings & Loan Association Mortgage Loan Trust, | | | | | |
5.64%, 4/19/38 | | (h)5,343 | | 5,214 | |
5.70%, 11/19/37 | | (h)6,046 | | 5,921 | |
5.75%, 3/19/45 | | (h)3,771 | | 3,707 | |
5.80%, 8/19/45 | | (h)5,992 | | 5,866 | |
5.87%, 10/19/35 | | (h)5,975 | | 5,831 | |
5.92%, 4/19/47 | | (h)5,458 | | 5,400 | |
The accompanying notes are an integral part of the financial statements.
116
| 2007 Annual Report |
| |
| September 30, 2007 |
Portfolio of Investments (cont’d)
Limited Duration Portfolio
| | Face | | | |
| | Amount | | Value | |
| | (000) | | (000) | |
Mortgages — Other (cont’d) | | | | | |
First Horizon Alternative Mortgage Securities, | | | | | |
5.50%, 4/25/35 | | $ | (h)7,005 | | $ | 6,813 | |
6.00%, 2/25/37 | | 6,423 | | 6,374 | |
First Horizon Asset Securities, Inc., | | | | | |
5.11%, 10/25/34 | | (h)927 | | 930 | |
5.55%, 6/25/34 | | (h)388 | | 393 | |
Greenpoint Mortgage Funding Trust, | | | | | |
5.36%, 1/26/37 | | (h)6,593 | | 6,386 | |
6.98%, 3/25/36 | | (h)3,890 | | 3,939 | |
GS Mortgage Securities Corp., | | | | | |
6.25%, 1/25/37 - 8/25/46 | | (e)3,215 | | 3,183 | |
6.41%, 6/25/46 | | (e)227 | | 226 | |
GSR Mortgage Loan Trust, | | | | | |
5.39%, 8/25/46 | | (h)5,635 | | 5,479 | |
Harborview Mortgage Loan Trust, | | | | | |
5.70%, 10/19/36 - 3/19/38 | | (h)9,467 | | 9,244 | |
5.73%, 7/19/46 | | (h)4,843 | | 4,715 | |
5.74%, 11/19/36 | | (h)7,677 | | 7,489 | |
5.75%, 1/19/36 | | (h)8,337 | | 8,114 | |
5.86%, 2/19/36 | | (h)4,505 | | 4,387 | |
5.88%, 11/19/35 | | (h)2,390 | | 2,329 | |
6.10%, 6/20/35 | | (h)1,512 | | 1,496 | |
6.98%, 10/19/35 - 1/19/36 | | (h)14,077 | | 14,264 | |
Harborview NIM Corp., | | | | | |
6.41%, 11/19/36 - 3/19/38 | | (e)5,503 | | 5,476 | |
Indymac Index Mortgage Loan Trust, | | | | | |
5.38%, 6/25/46 | | (h)6,800 | | 6,596 | |
5.63%, 7/25/34 | | (h)1,293 | | 1,288 | |
Indymac Index NIM Corp., | | | | | |
6.65%, 6/25/46 | | (e)137 | | 137 | |
Lehman XS Trust, | | | | | |
6.25%, 5/28/46 | | (e)191 | | 187 | |
6.50%, 4/28/46 | | (e)345 | | 335 | |
Luminent Mortgage Trust, | | | | | |
5.33%, 10/25/46 | | (h)5,626 | | 5,504 | |
5.36%, 5/25/46 - 7/25/36 | | (h)8,301 | | 7,950 | |
5.38%, 5/25/36 | | (h)3,906 | | 3,830 | |
Mastr Adjustable Rate Mortgages Trust, | | | | | |
6.23%, 5/25/47 | | (h)2,700 | | 2,051 | |
Merrill Lynch Mortgage Investors, Inc., | | | | | |
5.74%, 7/25/34 | | (h)540 | | 539 | |
Novastar Mortgage Backed Notes, | | | | | |
5.37%, 9/25/46 | | (h)4,301 | | 4,214 | |
Residential Accredit Loans, Inc., | | | | | |
5.29%, 1/25/37 | | (h)5,995 | | 5,829 | |
5.30%, 3/25/37 | | (h)6,428 | | 6,233 | |
5.32%, 12/25/36 - 2/25/37 | | (h)14,622 | | 14,278 | |
5.33%, 1/25/37 | | (h)7,553 | | 7,227 | |
5.36%, 5/25/46 - 6/25/46 | | (h)14,661 | | 14,286 | |
5.39%, 2/25/46 - 5/25/47 | | (h)11,530 | | 11,111 | |
5.40%, 2/25/46 | | (h)7,756 | | 7,565 | |
5.43%, 6/25/37 | | (h)2,653 | | 2,546 | |
5.53%, 10/25/45 | | (h)4,782 | | 4,617 | |
6.05%, 4/25/46 | | $ | (e)(h)207 | | $ | 206 | |
Sharp SP I, LLC Net Interest Margin Trust, | | | | | |
7.00%, 10/25/46 | | (e)369 | | 358 | |
Structured Asset Mortgage Investments, Inc., | | | | | |
5.32%, 2/25/36 - 2/25/37 | | (h)7,231 | | 7,054 | |
5.33%, 10/25/36 | | (h)6,837 | | 6,710 | |
5.34%, 1/25/37 | | (h)6,299 | | 6,260 | |
5.40%, 4/25/36 | | (h)5,768 | | 5,701 | |
5.44%, 2/25/36 | | (h)2,909 | | 2,853 | |
Washington Mutual, Inc., | | | | | |
5.33%, 12/25/46 - 2/25/47 | | (h)11,945 | | 11,634 | |
5.42%, 8/25/45 | | (h)352 | | 351 | |
5.49%, 7/25/45 - 10/25/45 | | (h)6,534 | | 6,435 | |
5.92%, 4/25/46 - 5/25/46 | | (h)13,062 | | 12,641 | |
5.94%, 8/25/46 | | (h)5,125 | | 5,002 | |
5.96%, 7/25/46 | | (h)6,429 | | 6,298 | |
5.98%, 8/25/46 | | (h)8,221 | | 8,058 | |
Wells Fargo Mortgage Backed Securities Trust, | | | | | |
3.46%, 9/25/34 | | (h)1,199 | | 1,202 | |
4.11%, 6/25/35 | | (h)6,555 | | 6,506 | |
4.57%, 12/25/34 | | (h)5,489 | | 5,457 | |
6.02%, 7/25/34 | | (h)222 | | 223 | |
| | | | 450,199 | |
U.S. Treasury Security (1.1%) | | | | | |
U.S. Treasury Note, | | | | | |
5.13%, 6/30/11 | | 11,000 | | 11,386 | |
Utilities (3.8%) | | | | | |
Baltimore Gas & Electric, | | | | | |
6.63%, 3/15/08 | | 3,500 | | 3,514 | |
Columbus Southern Power Co., | | | | | |
4.40%, 12/1/10 | | 1,750 | | 1,709 | |
Detroit Edison Co., | | | | | |
6.13%, 10/1/10 | | 2,100 | | 2,170 | |
Dominion Resources, Inc., | | | | | |
5.69%, 5/15/08 | | (g)2,340 | | 2,341 | |
Duke Energy Corp., | | | | | |
3.75%, 3/5/08 | | 1,245 | | 1,237 | |
Enbridge Energy Partners, LP, | | | | | |
4.00%, 1/15/09 | | 3,520 | | 3,479 | |
Entergy Gulf States, Inc., | | | | | |
3.60%, 6/1/08 | | 585 | | 576 | |
5.98%, 12/1/09 | | (h)1,225 | | 1,216 | |
6.47%, 12/8/08 | | (e)(h)1,170 | | 1,175 | |
FPL Group Capital, Inc., | | | | | |
5.55%, 2/16/08 | | 3,400 | | 3,394 | |
Keyspan Corp., | | | | | |
4.90%, 5/16/08 | | 1,300 | | 1,294 | |
NiSource Finance Corp., | | | | | |
6.06%, 11/23/09 | | (h)1,145 | | 1,137 | |
Ohio Power Co., | | | | | |
5.54%, 4/5/10 | | (h)2,025 | | 2,005 | |
The accompanying notes are an integral part of the financial statements.
117
2007 Annual Report
September 30, 2007
Portfolio of Investments (cont’d)
Limited Duration Portfolio
| | Face | | | |
| | Amount | | Value | |
| | (000) | | (000) | |
Utilities (cont’d) | | | | | |
Pacific Gas & Electric Co., | | | | | |
3.60%, 3/1/09 | | $ | 2,110 | | $ | 2,065 | |
Peco Energy Co., | | | | | |
3.50%, 5/1/08 | | 2,940 | | 2,912 | |
Public Service Co. of Colorado, | | | | | |
6.88%, 7/15/09 | | 870 | | 898 | |
Sempra Energy, | | | | | |
4.75%, 5/15/09 | | 3,025 | | 3,002 | |
Southwestern Public Service Co., | | | | | |
6.20%, 3/1/09 | | 2,260 | | 2,295 | |
Texas-New Mexico Power Co., | | | | | |
6.25%, 1/15/09 | | 2,700 | | 2,689 | |
Wisconsin Electric Power Co., | | | | | |
3.50%, 12/1/07 | | 1,340 | | 1,336 | |
| | | | 40,444 | |
Total Fixed Income Securities (Cost $1,022,858) | | | | 1,006,043 | |
| | | | | |
| | Shares | | | |
Preferred Stock (0.0%) | | | | | |
Mortgages — Other (0.0%) | | | | | |
Home Ownership Funding Corp., | | | | | |
13.33% (Cost $246) | | (e)1,800 | | 269 | |
Short-Term Investments (6.3%) | | | | | |
Investment Company (6.2%) | | | | | |
Morgan Stanley Institutional Liquidity | | | | | |
Money Market Portfolio | | | | | |
— Institutional Class | | (p)65,596,884 | | 65,597 | |
| | | | | |
| | Face | | | |
| | Amount | | | |
| | (000) | | | |
U.S. Treasury Security (0.1%) | | | | | |
U.S. Treasury Bill, | | | | | |
3.82%, 1/10/08 | | $ | (j)(r)1,430 | | 1,415 | |
Total Short-Term Investments (Cost $67,008) | | | | 67,012 | |
Total Investments (101.3%) (Cost $1,090,112) | | | | 1,073,324 | |
Liabilities in Excess of Other Assets (-1.3%) | | | | (14,153 | ) |
Net Assets (100%) | | | | $ | 1,059,171 | |
(e) | 144A security — Certain conditions for public sale may exist. Unless otherwise noted, these securities are deemed to be liquid. |
(g) | Step Bond — Coupon rate increases in increments to maturity. Rate disclosed is as of September 30, 2007. Maturity date disclosed is the ultimate maturity date. |
(h) | Variable/Floating Rate Security — Interest rate changes on these instruments are based on changes in a designated base rate. The rates shown are those in effect on September 30, 2007. |
(j) | All or a portion of the security was pledged to cover margin requirements for futures contracts. |
(o) | Perpetual — Security does not have a predetermined maturity date. Rate for this security is fixed for a period of time then reverts to a floating rate. The interest rate shown is the rate in effect at September 30, 2007. |
(p) | See Note F within the Notes to Financial Statements regarding investment in Morgan Stanley Institutional Liquidity Government Portfolio — Institutional Class, Morgan Stanley Institutional Liquidity Money Market Portfolio -— Institutional Class and/or Morgan Stanley Institutional Liquidity Tax-Exempt Portfolio — Institutional Class. |
(r) | Rate shown is the Yield to Maturity at September 30, 2007. |
@ | Face Amount/Value is less than $500. |
IO | Interest Only |
PAC | Planned Amortization Class |
PO | Principal Only |
Futures Contracts:
The Portfolio had the following futures contract(s) open at period end:
| | | | | | | | Net | |
| | | | | | | | Unrealized | |
| | Number | | | | | | Appreciation | |
| | of | | Value | | Expiration | | (Depreciation) | |
| | Contracts | | (000) | | Date | | (000) | |
Long: | | | | | | | | | |
U.S. Treasury | | | | | | | | | |
2 yr. Note | | 2,125 | | $ | 439,975 | | Dec-07 | | $ | 1,784 | |
U.S. Treasury | | | | | | | | | |
10 yr. Note | | 179 | | 19,561 | | Dec-07 | | 103 | |
| | | | | | | | | |
Short: | | | | | | | | | |
EuroDollar | | | | | | | | | |
CME | | 500 | | 119,350 | | Mar-08 | | (589 | ) |
U.S. Treasury | | | | | | | | | |
5 yr. Note | | 65 | | 6,957 | | Dec-07 | | (12 | ) |
U.S. Treasury | | | | | | | | | |
Short Bond | | 432 | | 48,101 | | Dec-07 | | 21 | |
| | | | | | | | $ | 1,307 | |
| | | | | | | | | | | |
CME Chicago Mercantile Exchange
The accompanying notes are an integral part of the financial statements.
118
| 2007 Annual Report |
| |
| September 30, 2007 |
Portfolio of Investments (cont’d)
Limited Duration Portfolio
Credit Default Swap Contracts
The Portfolio had the following credit default swap agreement(s) open at period end:
| | | | | | | | | | Unrealized | |
| | | | Notional | | | | | | Appreciation | |
| | Buy/Sell | | Amount | | Pay/Receive | | Termination | | (Depreciation) | |
Swap Counterparty and Reference Obligation | | Protection | | (000) | | Fixed Rate | | Date | | (000) | |
Citigroup | | Buy | | $ | 2,770 | | 0.43 | % | 3/20/12 | | $ | (5 | ) |
Tyco International Ltd., Zero Coupon, 11/17/20 | | | | | | | | | | | |
Citigroup | | Buy | | 1,400 | | 0.43 | | 3/20/12 | | (3 | ) |
Tyco International Ltd., Zero Coupon, 11/17/20 | | | | | | | | | | | |
Goldman Sachs | | Buy | | 2,665 | | 0.22 | | 3/20/12 | | (3 | ) |
Dell, Inc., 7.10%, 4/15/28 | | | | | | | | | | | |
Goldman Sachs | | Sell | | 8,000 | | 0.35 | | 6/20/12 | | 24 | |
Dow Jones CDX North America Investment Grade Index, Series 8 | | | | | | | | | | | |
| | | | | | | | | | $ | 13 | |
| | | | | | | | | | | | | |
Interest Rate Swap Contracts
The Portfolio had the following interest rate swap agreement(s) open at period end:
| | | | | | | | | | | | Unrealized | |
| | | | | | | | | | Notional | | Appreciation | |
| | Floating Rate | | Pay/Receive | | Fixed | | Termination | | Amount | | (Depreciation) | |
Swap Counterparty | | Index | | Floating Rate | | Rate | | Date | | (000) | | (000) | |
Citigroup | | 3 Month LIBOR | | Pay | | 4.47 | % | 10/1/07 | | $ | 11,000 | | $ | (1 | ) |
| | 3 Month LIBOR | | Pay | | 4.67 | | 10/26/07 | | 21,300 | | 206 | |
Goldman Sachs | | 3 Month LIBOR | | Pay | | 5.07 | | 10/05/08 | | 11,000 | | 151 | |
| | 3 Month LIBOR | | Pay | | 4.64 | | 9/11/09 | | 21,200 | | (36 | ) |
JPMorgan Chase | | 3 Month LIBOR | | Pay | | 5.23 | | 9/22/08 | | 11,000 | | 35 | |
| | 3 Month LIBOR | | Pay | | 5.20 | | 10/13/08 | | 13,500 | | 213 | |
| | 3 Month LIBOR | | Pay | | 5.33 | | 1/30/09 | | 10,700 | | 75 | |
| | 3 Month LIBOR | | Pay | | 4.96 | | 3/12/09 | | 21,500 | | 47 | |
| | 3 Month LIBOR | | Pay | | 5.39 | | 6/6/09 | | 21,200 | | 507 | |
| | 3 Month LIBOR | | Pay | | 5.49 | | 6/14/09 | | 21,300 | | 551 | |
| | 3 Month LIBOR | | Pay | | 5.36 | | 6/28/09 | | 21,300 | | 536 | |
| | 3 Month LIBOR | | Pay | | 5.36 | | 7/13/09 | | 21,350 | | 245 | |
| | 3 Month LIBOR | | Pay | | 5.08 | | 8/1/09 | | 22,000 | | 144 | |
| | 3 Month LIBOR | | Pay | | 4.79 | | 9/20/09 | | 21,100 | | 38 | |
| | | | | | | | | | | | $ | 2,711 | |
| | | | | | | | | | | | | | | |
LIBOR — London Inter Bank Offer Rate
The accompanying notes are an integral part of the financial statements.
119
2007 Annual Report
September 30, 2007
Investment Overview (unaudited)
Long Duration Fixed Income Portfolio
The Long Duration Fixed Income Portfolio seeks an above-average total return over a market cycle of three to five years. The Portfolio invests primarily in a diversified mix of dollar-denominated investment grade fixed income securities, particularly U.S. government, corporate and mortgage securities. The securities in which the Portfolio invests carry an investment grade rating or, if unrated, are determined to be of a comparable quality by the Adviser, at the time of purchase and the Portfolio may continue to hold such securities in the event they are downgraded to below investment grade. The Portfolio will ordinarily seek to maintain an average duration of approximately ten or more years. Although there is no minimum or maximum maturity for any individual security, the Adviser actively manages the interest rate risk of the Portfolio within a range relative to its benchmark. The Portfolio may invest over 50% of its assets in mortgage securities. The Portfolio may invest in TBAs. The Portfolio may invest in foreign securities, including emerging market securities. These securities may be denominated in U.S. dollars or in currencies other than U.S. dollars. The Portfolio may invest in asset-backed securities and may use futures, options, collateralized mortgage obligations, swaps, options on swaps and other derivatives.
Performance
For the fiscal year ended September 30, 2007, the Portfolio’s Institutional Class had a total return based on net asset value and reinvestment of distributions per share of 3.06%, net of fees. The Portfolio’s Institutional Class underperformed against its benchmark the Lehman Brothers U.S. Long Government/Credit Index (the “Index”) which returned 3.70%.
Factors Affecting Performance
• Fears stemming from a residential housing downturn persisted throughout the 12-month period. Confronted with increasing delinquency rates on subprime loans, high-profile hedge fund collapses, and a series of subprime mortgage related credit downgrades, markets responded severely in the latter months of the reporting period. The impact was exacerbated by an influx of forced sellers looking to liquidate assets to help meet margin calls and capital withdrawals, which fueled concerns about the potential impact on the broader financial markets and economy and led to a flight to quality.
• In August, the Federal Open Market Committee (the “Fed”) lowered the discount rate by half a percent, from 6.25% to 5.75%, and began encouraging member banks to make greater use of the discount window without fear of such action being viewed negatively by the Fed. In September, the Fed elected to cut the target federal funds rate by 50 basis points to 4.75%, noting that while economic growth remained moderate, inflation risks remain and “the tightening of credit conditions has the potential to intensify the housing correction and to restrain economic growth”.
• U.S. Treasury yields fluctuated throughout the 12-month period, with the yield curve beginning the period relatively flat and ending the period steep. As the yield curve steepened, shorter dated U.S. Treasury yields experienced the greatest decline, while longer dated yields rose slightly. Within the U.S. government sector, Treasuries and agencies outperformed other investment-grade sectors.
• The mortgage market was hit by the turmoil affecting residential housing, and especially by its spillover effects on secondary market activity, most notably in the non-agency mortgage area, casting a pall across the entire sector with little regard for whether the securities or loans in question were subprime or prime. The result was a further reduction in mortgage market liquidity, as well as a sharp diminishment in the availability of nonconforming mortgage loans to the general public.
• Widening credit spreads led corporate issues to underperform other major asset classes. Within the investment-grade corporate sector, lower-rated (Baa) and higher-rated (AAA) issues outpaced the middle investment grade issues and intermediate-term issues outperformed longer-dated issues. Industrials outpaced utilities and financials, which was the corporate sector hit hardest by the recent liquidity crisis.
• A defensive interest rate positioning benefited the Portfolio’s performance for the overall period.
• We maintained a relative underweight to the corporate sector, which aided performance. However, a relative overweight to financials detracted from returns, causing the Portfolio’s overall holdings in the corporate sector to underperform those of the Index.
• Although the Portfolio maintained an underweight to agency mortgage backed securities, holdings here detracted from returns as the recent turmoil in the mortgage market and drying up of liquidity hurt the performance of the sector.
Management Strategies
• Throughout the period, we employed a defensive interest rate strategy by maintaining a lower interest-rate sensitivity (as measured by duration) than that of the Index. In March of this year, the position was adjusted
120
2007 Annual Report
September 30, 2007
Investment Overview (cont’d)
Long Duration Fixed Income Portfolio
to underweight longer dated issues and overweight intermediate dated issues. As the spread between intermediate and long date yields widened and the curve steepened during the summer, relative performance benefited. Subsequently, in August, we further reduced the Portfolio’s interest rate sensitivity.
• We have held an underweight corporate position for some time now. While we are looking for areas to take advantage of the recent spread widening and add to corporate positions, we remain cautious because we believe the credit market remains vulnerable to potential credit downgrades and/or an economic downturn.
• We maintained an underweight position to agency mortgage-backed securities, with a focus on high-coupon, slow-prepaying issues, and non-agency mortgages issued to high quality borrowers.
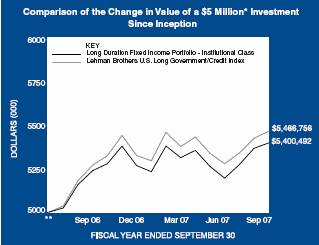
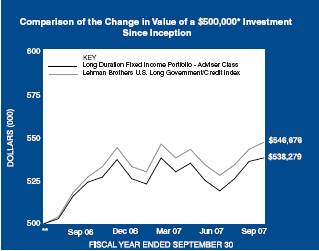
* Minimum Investment
** Commenced operations on July 21, 2006.
In accordance with SEC regulations, the Portfolio’s performance shown assumes that all recurring fees (including management fees) were deducted and all dividends and distributions were reinvested. The performance of Adviser Class shares will vary from the Institutional Class shares based upon the different inception date and will be negatively impacted by additional fees assessed to this class.
Performance Compared to the Lehman Brothers U.S. Long Government/Credit Index(1)
| | Total Returns(2) | |
| | | | Average Annual | |
| | One | | Since | |
| | Year | | Inception(4) | |
| | | | | |
Portfolio — Institutional Class(3) | | 3.06 | % | 6.66 | % |
Lehman Brothers U.S. Long Government/Credit Index | | 3.70 | | 7.76 | |
Portfolio — Adviser Class(3) | | 2.72 | | 6.37 | |
Lehman Brothers U.S. Long Government/Credit Index | | 3.70 | | 7.76 | |
Performance data quoted represents past performance, which is no guarantee of future results, and current performance may be lower or higher than the figures shown. Performance assumes that all dividends and distributions, if any, were reinvested. For the most recent month-end performance figures, please visit www.morganstanley.com/im. Investment return and principal value will fluctuate so that Portfolio shares, when redeemed, may be worth more or less than their original cost. Total returns do not reflect the deduction of taxes that a shareholder would pay on Portfolio distributions or the redemption of Portfolio shares.
(1) The Lehman Brothers U.S. Long Government/Credit Index tracks the securities in the long maturity range of the Lehman Brothers U.S. Government/Credit Index which tracks investment-grade (BBB-/Baa3) or higher publicly traded fixed-rate U.S. government, U.S. agency and corporate issues. The Index is unmanaged and its returns do not include any sales charges or fees. Such costs would lower performance. It is not possible to invest directly in an index.
(2) Total returns for the Portfolio reflect expenses waived and/or reimbursed, if applicable, by the Adviser. Without such waivers and/or reimbursements, total returns would have been lower. Fee waivers and/or reimbursements are voluntary and the Adviser reserves the right to commence or terminate any waiver and/or reimbursement at any time.
(3) Commenced operations on July 21, 2006.
(4) For comparative purposes, average annual since inception returns listed for the Index refer to the inception date or initial offering of the respective share class of the Portfolio, not the inception of the Index.
Expense Examples
As a shareholder of the Portfolio, you incur two types of costs: (1) transactional costs, including redemption fees; (2) ongoing costs, including management fees, shareholder servicing fees (in the case of Adviser Class); and other Portfolio expenses. These examples are intended to help you understand your ongoing costs (in dollars) of investing in the Portfolio and to compare these costs with the ongoing costs of investing in other mutual funds.
The examples are based on an investment of $1,000 invested at the beginning of the six-month period ended September 30, 2007 and held for the entire six-month period.
121
2007 Annual Report
September 30, 2007
Investment Overview (cont’d)
Long Duration Fixed Income Portfolio
Actual Expenses
The first line of the tables below provides information about actual account values and actual expenses. You may use the information in this line, together with the amount you invested, to estimate the expenses that you paid over the period. Simply divide your account value by $1,000 (for example, an $8,600 account value divided by $1,000 = 8.6), then multiply the result by the number in the first line under the heading entitled “Expenses Paid During Period” to estimate the expenses you paid on your account during this period.
Please note that “Expenses Paid During Period” are grossed up to reflect Portfolio expenses prior to the effect of Expense Offset (See Note E in the Notes to Financial Statements). Therefore, the annualized net expense ratios may differ from the ratio of expenses to average net assets shown in the Financial Highlights.
Hypothetical Example for Comparison Purposes
The second line of the tables below provides information about hypothetical account values and hypothetical expenses based on the Portfolio’s actual expense ratio and an assumed rate of return of 5% per year before expenses, which is not the Portfolio’s actual return. The hypothetical account values and expenses may not be used to estimate the actual ending account balance or expenses you paid for the period. You may use this information to compare the ongoing costs of investing in the Portfolio and other funds. To do so, compare this 5% hypothetical example with the 5% hypothetical examples that appear in the shareholder reports of the other funds.
Please note that the expenses shown in the table are meant to highlight your ongoing costs only and do not reflect any transactional costs, such as redemption fees. Therefore, the second line of the table is useful in comparing ongoing costs only, and will not help you determine the relative total costs of owning different funds. In addition, if these transactional costs were included, your costs would have been higher.
| | | | | | Expenses Paid | |
| | | | Ending Account | | During Period* | |
| | Beginning | | Value | | April 1, 2007 — | |
| | Account Value | | September 30, | | September 30, | |
| | April 1, 2007 | | 2007 | | 2007 | |
Institutional Class | | | | | | | |
Actual | | $ | 1,000.00 | | $ | 1,016.00 | | $ | 2.58 | |
Hypothetical (5% average annual return before expenses) | | 1,000.00 | | 1,022.51 | | 2.59 | |
| | | | | | | |
Adviser Class | | | | | | | |
Actual | | 1,000.00 | | 1,014.70 | | 3.84 | |
Hypothetical (5% average annual return before expenses) | | 1,000.00 | | 1,021.26 | | 3.85 | |
| | | | | | | | | | |
* Expenses are equal to Institutional Class’ and Adviser Class’ annualized net expense ratios of 0.51% and 0.76%, respectively, multiplied by the average account value over the period, multiplied by 183/365 (to reflect the one-half year period).
Graphic Presentation of Portfolio Holdings
The following graph depicts the Portfolio’s holdings by industry and/or investment type, as a percentage of total investments.

* Industries and/or investment types which do not appear in the above graph, as well as those which represent less than 5% of total investments, if applicable, are included in the category labeled “Other.”
122
2007 Annual Report
September 30, 2007
Portfolio of Investments
Long Duration Fixed Income Portfolio
| | Face | | | |
| | Amount
(000) | | Value
(000) | |
Fixed Income Securities (94.0%) | | | | | |
Agency Fixed Rate Mortgages (8.9%) | | | | | |
Federal Home Loan Mortgage Corp., | | | | | |
6.75%, 3/15/31 | | $ | 240 | | $ | 289 | |
Federal National Mortgage Association, | | | | | |
5.38%, 7/15/16 | | 1,150 | | 1,185 | |
Conventional Pools: | | | | | |
7.25%, 5/15/30 | | 645 | | 815 | |
| | | | 2,289 | |
Finance (9.6%) | | | | | |
Abbey National plc, | | | | | |
7.95%, 10/26/29 | | 50 | | 61 | |
Allstate Corp. (The), | | | | | |
5.95%, 4/1/36 | | 40 | | 38 | |
Bank of America N.A., | | | | | |
6.00%, 10/15/36 | | 365 | | 359 | |
Bank One Corp., | | | | | |
8.00%, 4/29/27 | | 250 | | 295 | |
BB&T Corp., | | | | | |
5.25%, 11/1/19 | | 90 | | 84 | |
Capmark Financial Group, Inc., | | | | | |
6.30%, 5/10/17 | | (e)15 | | 13 | |
Catlin Insurance Co., Ltd., | | | | | |
7.25%, | | (e)(h)(o)100 | | 95 | |
Citigroup, Inc., | | | | | |
5.85%, 12/11/34 | | 325 | | 315 | |
Farmers Exchange Capital, | | | | | |
7.05%, 7/15/28 | | (e)100 | | 100 | |
General Electric Capital Corp., | | | | | |
6.75%, 3/15/32 | | 90 | | 99 | |
Goldman Sachs Group, Inc. (The), | | | | | |
6.13%, 2/15/33 | | 50 | | 49 | |
HSBC Holdings plc, | | | | | |
6.50%, 5/2/36 | | 235 | | 238 | |
iStar Financial, Inc., | | | | | |
6.07%, 3/9/10 | | (h)95 | | 89 | |
Nationwide Building Society, | | | | | |
4.25%, 2/1/10 | | (e)105 | | 103 | |
Platinum Underwriters Finance, Inc., | | | | | |
7.50%, 6/1/17 | | 15 | | 16 | |
Popular North America, Inc., | | | | | |
5.65%, 4/15/09 | | 50 | | 50 | |
Sovereign Bancorp, Inc., | | | | | |
5.44%, 3/23/10 | | (h)105 | | 105 | |
Travelers Cos., Inc. (The), | | | | | |
6.75%, 6/20/36 | | 25 | | 26 | |
USB Capital IX, | | | | | |
6.19%, | | (h)(o)75 | | 75 | |
Wachovia Capital Trust Ill, | | | | | |
5.80%, | | (h)(o)180 | | 179 | |
Washington Mutual Preferred Funding II, | | | | | |
6.67%, | | $ | (e)(h)(o)100 | | $ | 86 | |
| | | | 2,475 | |
Industrials (16.0%) | | | | | |
America West Airlines, Inc., | | | | | |
7.10%, 4/2/21 | | 79 | | 82 | |
Anadarko Petroleum Corp., | | | | | |
6.45%, 9/15/36 | | 40 | | 40 | |
Apache Corp., | | | | | |
6.00%, 1/15/37 | | 25 | | 24 | |
AT&T Corp., | | | | | |
8.00%, 11/15/31 | | 360 | | 439 | |
BellSouth Corp., | | | | | |
6.55%, 6/15/34 | | 80 | | 82 | |
Boeing Co., | | | | | |
6.13%, 2/15/33 | | 50 | | 50 | |
Bristol-Myers Squibb Co., | | | | | |
5.88%, 11/15/36 | | 40 | | 38 | |
Canadian Natural Resources Ltd., | | | | | |
6.25%, 3/15/38 | | 15 | | 15 | |
6.45%, 6/30/33 | | 40 | | 40 | |
Caterpillar, Inc., | | | | | |
6.05%, 8/15/36 | | 35 | | 35 | |
Clorox Co., | | | | | |
5.83%, 12/14/07 | | (h)115 | | 115 | |
Coca-Cola Enterprises, Inc., | | | | | |
6.95%, 11/15/26 | | 45 | | 49 | |
Comcast Corp., | | | | | |
6.45%, 3/15/37 | | 155 | | 154 | |
ConAgra Foods, Inc., | | | | | |
8.25%, 9/15/30 | | 80 | | 95 | |
ConocoPhillips Holding Co., | | | | | |
6.95%, 4/15/29 | | 105 | | 116 | |
CVS/Caremark Corp., | | | | | |
5.75%, 8/15/11 | | 25 | | 25 | |
CVS Lease Pass Through, | | | | | |
6.04%, 12/10/28 | | (e)128 | | 125 | |
Daimler Finance North America, LLC, | | | | | |
8.50%, 1/18/31 | | 135 | | 168 | |
Devon Financing Corp., | | | | | |
7.88%, 9/30/31 | | 35 | | 42 | |
EnCana Corp., | | | | | |
6.63%, 8/15/37 | | 30 | | 31 | |
France Telecom S.A., | | | | | |
8.50%, 3/1/31 | | 110 | | 142 | |
Fred Meyer, Inc., | | | | | |
7.45%, 3/1/08 | | 50 | | 50 | |
General Mills, Inc., | | | | | |
3.88%, 11/30/07 | | 115 | | 115 | |
Hess Corp., | | | | | |
7.13%, 3/15/33 | | 45 | | 49 | |
Home Depot, Inc. (The), | | | | | |
5.82%, 12/16/09 | | (h)40 | | 38 | |
5.88%, 12/16/36 | | 45 | | 39 | |
The accompanying notes are an integral part of the financial statements.
123
2007 Annual Report
September 30, 2007
Portfolio of Investments (cont’d)
Long Duration Fixed Income Portfolio
| | Face | | | |
| | Amount
(000) | | Value
(000) | |
Industrials (cont’d) | | | | | |
IBM Corp., | | | | | |
5.88%, 11/29/32 | | $ | 50 | | $ | 49 | |
ICI Wilmington, Inc., | | | | | |
4.38%, 12/1/08 | | 45 | | 45 | |
J.C. Penney Co., Inc., | | | | | |
7.40%, 4/1/37 | | 35 | | 37 | |
John Deere Capital Corp., | | | | | |
5.41%, 4/15/08 | | (h)130 | | 130 | |
Kellogg Co., | | | | | |
7.45%, 4/1/31 | | 35 | | 40 | |
Lockheed Martin Corp., | | | | | |
6.15%, 9/1/36 | | 60 | | 61 | |
Macy’s Retail Holdings, Inc., | | | | | |
6.38%, 3/15/37 | | 40 | | 37 | |
Merck & Co., Inc., | | | | | |
5.75%, 11/15/36 | | 35 | | 33 | |
News America, Inc., | | | | | |
6.40%, 12/15/35 | | 115 | | 111 | |
Nexen, Inc., | | | | | |
6.40%, 5/15/37 | | 25 | | 24 | |
Norfolk Southern Corp., | | | | | |
7.05%, 5/1/37 | | 45 | | 48 | |
Northrop Grumman Corp., | | | | | |
7.75%, 2/15/31 | | 55 | | 65 | |
Petro-Canada, | | | | | |
5.95%, 5/15/35 | | 55 | | 52 | |
Proctor & Gamble Co., | | | | | |
5.55%, 3/5/37 | | 40 | | 38 | |
Raytheon Co., | | | | | |
7.00%, 11/1/28 | | 20 | | 22 | |
Sprint Capital Corp., | | | | | |
6.13%, 11/15/08 | | 80 | | 81 | |
8.75%, 3/15/32 | | 90 | | 103 | |
Suncor Energy, Inc., | | | | | |
6.50%, 6/15/38 | | 25 | | 26 | |
Telefonica Europe B.V., | | | | | |
8.25%, 9/15/30 | | 130 | | 156 | |
Time Warner Cable, Inc., | | | | | |
6.55%, 5/1/37 | | (e)40 | | 39 | |
Time Warner, Inc. | | | | | |
7.70%, 5/1/32 | | 170 | | 187 | |
UnitedHealth Group, Inc. | | | | | |
5.66%, 3/2/09 | | (h)80 | | 80 | |
Valero Energy Corp., | | | | | |
3.50%, 4/1/09 | | 50 | | 49 | |
6.63%, 6/15/37 | | 45 | | 46 | |
Verizon Communications, Inc., | | | | | |
5.85%, 9/15/35 | | 135 | | 129 | |
Viacom, Inc., | | | | | |
6.88%, 4/30/36 | | 120 | | 120 | |
Wal-Mart Stores, Inc., | | | | | |
5.25%, 9/1/35 | | 40 | | 35 | |
Wyeth, | | | | | |
5.95%, 4/1/37 | | $ | 40 | | $ | 39 | |
6.50%, 2/1/34 | | 40 | | 41 | |
XTO Energy, Inc., | | | | | |
6.75%, 8/1/37 | | 25 | | 26 | |
| | | | 4,147 | |
U.S. Treasury Securities (55.2%) | | | | | |
U.S. Treasury Bonds, | | | | | |
4.50%, 2/15/36 | | 100 | | 95 | |
5.38%, 2/15/31 | | 3,025 | | 3,239 | |
6.13%, 11/15/27 | | 550 | | 637 | |
6.38%, 8/15/27 | | 2,000 | | 2,374 | |
6.63%, 2/15/27 | | 3,500 | | 4,254 | |
8.13%, 8/15/19 | | 2,795 | | 3,641 | |
| | | | 14,240 | |
Utilities (4.3%) | | | | | |
Arizona Public Service Co., | | | | | |
5.50%, 9/1/35 | | 85 | | 73 | |
Carolina Power & Light Co., | | | | | |
6.13%, 9/15/33 | | 40 | | 40 | |
CenterPoint Energy Resources Corp., | | | | | |
6.25%, 2/1/37 | | 25 | | 25 | |
Consolidated Edison Co. of New York, Inc., | | | | | |
5.85%, 3/15/36 | | 40 | | 38 | |
Consumer’s Energy Co., | | | | | |
4.40%, 8/15/09 | | 55 | | 54 | |
5.65%, 4/15/20 | | 40 | | 39 | |
Detroit Edison Co., | | | | | |
6.13%, 10/1/10 | | 30 | | 31 | |
6.35%, 10/15/32 | | 15 | | 15 | |
Enterprise Products Operating, LP, | | | | | |
6.65%, 10/15/34 | | 40 | | 40 | |
6.88%, 3/1/33 | | 70 | | 72 | |
Florida Power & Light Co., | | | | | |
5.63%, 4/1/34 | | 40 | | 38 | |
Kinder Morgan Energy Partners, LP, | | | | | |
6.50%, 2/1/37 | | 65 | | 62 | |
Northern States Power Co., | | | | | |
6.25%, 6/1/36 | | 35 | | 36 | |
Ohio Edison Co., | | | | | |
6.88%, 7/15/36 | | 70 | | 74 | |
Ohio Power Co., | | | | | |
6.60%, 2/15/33 | | 110 | | 115 | |
Pacific Gas & Electric Co., | | | | | |
6.05%, 3/1/34 | | 40 | | 39 | |
Pacificorp, | | | | | |
5.75%, 4/1/37 | | 40 | | 38 | |
6.25%, 10/15/37 | | 20 | | 20 | |
Plains All American Pipeline, LP, | | | | | |
6.70%, 5/15/36 | | 85 | | 85 | |
Public Service Electricity & Gas Co., | | | | | |
5.80%, 5/1/37 | | 40 | | 37 | |
Southern California Edison Co., | | | | | |
5.55%, 1/15/37 | | 40 | | 37 | |
The accompanying notes are an integral part of the financial statements.
124
2007 Annual Report
September 30, 2007
Portfolio of Investments (cont'd)
Long Duration Fixed Income Portfolio
| | Face | | | |
| | Amount
(000) | | Value
(000) | |
Utilities (cont’d) | | | | | |
Texas Eastern Transmission, LP, | | | | | |
7.00%, 7/15/32 | | $ | 45 | | $ | 48 | |
Virginia Electric & Power Co., | | | | | |
6.00%, 1/15/36 | | 65 | | 62 | |
| | | | 1,118 | |
Total Fixed Income Securities (Cost $23,889) | | | | 24,269 | |
| | | | | | | |
| | Shares | | | |
Short-Term Investments (4.7%) | | | | | |
Investment Company (4.3%) | | | | | |
Morgan Stanley Institutional | | | | | |
Liquidity Money Market Portfolio | | | | | |
— Institutional Class | | (p)1,102,508 | | 1,103 | |
| | Face | | | |
| | Amount
(000) | | | |
U.S. Treasury Security (0.4%) | | | | | |
U.S. Treasury Bill, | | | | | |
3.82%, 1/10/08 | | $ | (j)(r)95 | | 94 | |
Total Short-Term Investments (Cost $1,197) | | | | 1,197 | |
Total Investments (98.7%) (Cost $25,086) | | | | 25,466 | |
Other Assets in Excess of Liabilities (1.3%) | | | | 347 | |
Net Assets (100%) | | | | $ | 25,813 | |
| | | | | | | |
(e) | 144A security — Certain conditions for public sale may exist. Unless otherwise noted, these securities are deemed to be liquid. |
(h) | Variable/Floating Rate Security — Interest rate changes on these instruments are based on changes in a designated base rate. The rates shown are those in effect on September 30, 2007. |
(j) | All or a portion of the security was pledged to cover margin requirements for futures contracts. |
(o) | Perpetual — Security does not have a predetermined maturity date. Rate for this security is fixed for a period of time then reverts to a floating rate. The interest rate shown is the rate in effect at September 30, 2007. |
(p) | See Note F within the Notes to Financial Statements regarding investment in Morgan Stanley Institutional Liquidity Government Portfolio — Institutional Class, Morgan Stanley Institutional Liquidity Money Market Portfolio — Institutional Class and/or Morgan Stanley Institutional Liquidity Tax-Exempt Portfolio — Institutional Class. |
(r) | Rate shown is the Yield to Maturity at September 30, 2007. |
Futures Contracts:
The Portfolio had the following futures contract(s) open at period end:
| | | | | | | | Net | |
| | | | | | | | Unrealized | |
| | Number | | | | | | Appreciation | |
| | of | | Value | | Expiration | | (Depreciation) | |
| | Contracts | | (000) | | Date | | (000) | |
Long: | | | | | | | | | |
U.S. Treasury | | | | | | | | | |
2 yr. Note | | 17 | | $ | 3,520 | | Dec-07 | | $ | 12 | |
U.S. Treasury | | | | | | | | | |
5 yr. Note | | 7 | | 749 | | Dec-07 | | 5 | |
| | | | | | | | | |
Short: | | | | | | | | | |
10 yr. Swap | | 2 | | 212 | | Dec-07 | | @— | |
U.S. Treasury | | | | | | | | | |
10 yr. Note | | 68 | | 7,431 | | Dec-07 | | (1 | ) |
U.S. Treasury | | | | | | | | | |
Long Bond | | 35 | | 3,897 | | Dec-07 | | 4 | |
| | | | | | | | $ | 20 | |
| | | | | | | | | | | |
@ Value is less than $500.
The accompanying notes are an integral part of the financial statements.
125
2007 Annual Report
September 30, 2007
Portfolio of Investments (cont'd)
Long Duration Fixed Income Portfolio
Credit Default Swap Contracts
The Portfolio had the following credit default swap agreement(s) open at period end:
| | | | | | | | | | Unrealized | |
| | | | Notional | | | | | | Appreciation | |
| | Buy/Sell | | Amount | | Pay/Receive | | Termination | | (Depreciation) | |
Swap Counterparty and Reference Obligation | | Protection | | (000) | | Fixed Rate | | Date | | (000) | |
Goldman Sachs | | Buy | | $ | 65 | | 0.22 | % | 3/20/12 | | $ | @— | |
Dell, Inc., 7.10%, 4/15/28 | | | | | | | | | | | |
Goldman Sachs | | Buy | | 125 | | 0.11 | | 3/20/12 | | 1 | |
The Chubb Corp., 6.00%, 11/15/11 | | | | | | | | | | | |
Goldman Sachs | | Buy | | 125 | | 0.11 | | 3/20/12 | | 1 | |
The Hartford Financial Services Group, Inc., 4.75%, 3/1/14 | | | | | | | | | | | |
Goldman Sachs | | Buy | | 125 | | 0.39 | | 3/20/12 | | @— | |
Motorola, Inc., 6.50%, 9/1/25 | | | | | | | | | | | |
Goldman Sachs | | Buy | | 65 | | 0.26 | | 3/20/12 | | @— | |
Union Pacific Corp., 6.13%, 1/15/12 | | | | | | | | | | | |
Goldman Sachs | | Buy | | 230 | | 0.44 | | 3/20/12 | | (1 | ) |
Tyco International Ltd., 6.38%, 10/15/11 | | | | | | | | | | | |
JPMorgan Chase | | Buy | | 25 | | 1.18 | | 6/20/14 | | @— | |
Belo Corp., 8.00%, 11/1/08 | | | | | | | | | | | |
JPMorgan Chase | | Buy | | 60 | | 1.30 | | 6/20/14 | | @— | |
Belo Corp., 8.00%, 11/1/08 | | | | | | | | | | | |
| | | | | | | | | | $ | 1 | |
| | | | | | | | | | | | | |
Interest Rate Swap Contracts
The Portfolio had the following interest rate swap agreement(s) open at period end:
| | | | | | | | | | | | Unrealized | |
| | | | | | | | | | Notional | | Appreciation | |
| | Floating Rate | | Pay/Receive | | Fixed | | Termination | | Amount | | (Depreciation) | |
Swap Counterparty | | Index | | Floating Rate | | Rate | | Date | | (000) | | (000) | |
Citigroup | | 3 Month LIBOR | | Pay | | 5.44 | % | 5/29/17 | | $ | 1,875 | | $ | 60 | |
| | 3 Month LIBOR | | Pay | | 5.46 | | 8/7/17 | | 1,000 | | 20 | |
Deutsche Bank | | 3 Month LIBOR | | Pay | | 5.39 | | 5/25/17 | | 2,925 | | 82 | |
| | 3 Month LIBOR | | Pay | | 5.45 | | 8/9/17 | | 1,300 | | 25 | |
JPMorgan Chase | | 3 Month LIBOR | | Pay | | 5.45 | | 5/29/17 | | 1,850 | | 61 | |
| | 3 Month LIBOR | | Pay | | 5.09 | | 9/11/17 | | 1,450 | | (15 | ) |
| | 3 Month LIBOR | | Pay | | 5.42 | | 9/21/37 | | 1,000 | | (5 | ) |
| | | | | | | | | | | | $ | 228 | |
| | | | | | | | | | | | | | | |
LIBOR — London Inter Bank Offer Rate
The accompanying notes are an integral part of the financial statements.
126
2007 Annual Report
September 30, 2007
Investment Overview (unaudited)
Municipal Portfolio
The Municipal Portfolio seeks to realize above-average total return over a market cycle of three to five years, consistent with the conservation of capital and the realization of current income that is exempt from federal income tax. The Portfolio invests primarily in fixed income securities issued by local, state and regional governments that provide income that is exempt from federal income taxes (municipal securities). The Portfolio may purchase municipal securities that pay interest that is subject to the federal alternative minimum tax, and securities on which the interest payments are taxable. The Portfolio may invest in high yield municipal securities (commonly referred to as “junk bonds”). The Portfolio will ordinarily seek to maintain an average weighted maturity of between five and ten years, although there is no minimum or maximum maturity for any individual security. The Portfolio may use futures, options, forwards, collateralized mortgage obligations, swaps, options on swaps and other derivatives. The Portfolio may invest up to 20% of its assets in public bank loans made by banks or other financial institutions. These public bank loans may be rated investment grade or below investment grade.
Performance
For the fiscal year ended September 30, 2007, the Portfolio’s Institutional Class had a total return based on net asset value and reinvestment of distributions per share of 3.76%, net of fees. The Portfolio’s Institutional Class underperformed against its benchmark the Lehman Brothers 5 Year Municipal Index, outperformed against its benchmark the Lehman Brothers 10 Year Municipal Index and outperformed against its benchmark the Blended Municipal Index (a 50%/50% blend of the Lehman Brothers 5 & 10 Year Municipal Indexes) which returned 3.82%, 3.45% and 3.64%, respectively.
Factors Affecting Performance
• We were short interest rate risk during the year, with a bias toward yield curve steepening. The yield curve declined and steepened, with most of the steepening occurring during the third quarter. This helped relative performance.
• The Portfolio was short municipal risk, which helped relative returns as municipals underperformed high quality taxable bonds.
• Opportunistic exposure to taxable corporate securities and mortgages detracted from performance as all fixed income spread sectors underperformed throughout the year.
Management Strategies
• The Portfolio maintained a defensive position because of the extremely rich prices in the municipal market, especially at the long end of the municipal curve.
• Holdings continued to have higher than average call protection and credit quality.
• Overall, the compensation now offered by the market to take on risk - whether it be interest rate, credit, volatility, or liquidity risk - remains at unattractive levels. As a result, we have positioned the Portfolio defensively to protect capital as we await better opportunities to add these risks back.


* Minimum Investment
**Commenced operations on June 20, 2007.
127
2007 Annual Report
September 30, 2007
Investment Overview (cont’d)
Municipal Portfolio
In accordance with SEC regulations, the Portfolio’s performance shown assumes that all recurring fees (including management fees) were deducted and all dividends and distributions were reinvested. The performance of Adviser Class shares will vary from the Institutional Class shares based upon the different inception date and will be negatively impacted by additional fees assessed to this class.
Performance Compared to the Lehman Brothers 5 Year Municipal Index(1), Lehman Brothers 10 Year Municipal Index(2), Blended Municipal Index(3) and the Lipper Intermediate Municipal Debt Funds Index(4)
| | Total Returns(5) | |
| | | | Average Annual | |
| | One | | Five | | Ten | | Since | |
| | Year | | Years | | Years | | Inception(8) | |
| | | | | | | | | |
Portfolio—Institutional Class(6) | | 3.76 | % | 4.17 | % | 5.25 | % | 6.14 | % |
Lehman Brothers 5 Year Municipal Index | | 3.82 | | 3.03 | | 4.55 | | 4.97 | |
Lehman Brothers 10 Year Municipal Index | | 3.45 | | 3.85 | | 5.30 | | 5.99 | |
Blended Municipal Index | | 3.64 | | 3.45 | | 4.93 | | 5.69 | |
Lipper Intermediate Municipal Debt Funds Index | | 2.78 | | 3.03 | | 4.30 | | 4.91 | |
Portfolio—Adviser Class(7) | | — | | — | | — | | 2.02 | |
Lehman Brothers 5 Year Municipal Index | | — | | — | | — | | 2.85 | |
Lehman Brothers 10 Year Municipal Index | | — | | — | | — | | 2.84 | |
Blended Municipal Index | | — | | — | | — | | 2.84 | |
Lipper Intermediate Municipal Debt Funds Index | | — | | — | | — | | 2.16 | |
Performance data quoted represents past performance, which is no guarantee of future results, and current performance may be lower or higher than the figures shown. Performance assumes that all dividends and distributions, if any, were reinvested. For the most recent month-end performance figures, please visit www.morganstanley.com/im. Investment return and principal value will fluctuate so that Portfolio shares, when redeemed, may be worth more or less than their original cost. Total returns do not reflect the deduction of taxes that a shareholder would pay on Portfolio distributions or the redemption of Portfolio shares.
(1) The Lehman Brothers 5 Year Municipal Index is a market capitalization-weighted index of investment-grade (BBB-/Baa3) or higher municipal bonds with maturities of four to six years. To be included in the Index, bonds must have an outstanding par value of at least $5 million and be issued as part of a transaction of at least $50 million. The bonds must be at least one year from their maturity date. Remarketed issues, taxable municipal bonds, bonds with floating rates, and derivatives, are excluded from the Index. The index is unmanaged and its returns do not include any sales charges or fees. Such costs would lower performance. It is not possible to invest directly in an index.
(2) The Lehman Brothers 10 Year Municipal Index is market capitalization-weighted index of investment-grade (BBB-/Baa3) or higher municipal bonds with maturities of eight to twelve years. To be included in the Index, bonds must have an outstanding par value of at least $5 million and be issued as part of a transaction of at least $50 million. The bonds must be at least one year from their maturity date. Remarketed issues, taxable municipal bonds, bonds with floating rates, and derivatives, are excluded from the Index. The Index is unmanaged and its returns do not include any sales charges or fees. Such costs would lower performance. It is not possible to invest directly in an index.
(3) The Blended Municipal Index is an unmanaged index comprised of the Lehman Brothers Long Municipal Index from 10/1/92 to 3/31/96 and 50% Lehman Brothers 10 Year Municipal Index and 50% Lehman Brothers 5 Year Municipal Index thereafter.
(4) The Lipper Intermediate Municipal Debt Funds Index is an equally weighted performance index of the largest qualifying funds (based on net assets) in the Lipper Intermediate Municipal Debt Funds classification. The Index, which is adjusted for capital gains distributions and income dividends, is unnmanaged and should not be considered an investment. There are currently 30 funds represented in this Index. As of the date of this report, the Portfolio is in the Lipper Intermediate Municipal Debt Funds classification.
(5) Total returns for the Portfolio reflect expenses waived and/or reimbursed, if applicable, by the Adviser. Without such waivers and/or reimbursements, total returns would have been lower. Fee waivers and/or reimbursements are voluntary and the Adviser reserves the right to commence or terminate any waiver and/or reimbursement at any time. Returns for periods less than one year are not annualized.
(6) Commenced operations on October 1, 1992.
(7) Commenced operations on June 20, 2007.
(8) For comparative purposes, average annual since inception returns listed for the Indexes refer to the inception date or initial offering of the share class of the Portfolio, not the inception of the Indexes.
Expense Example
As a shareholder of the Portfolio, you incur two types of costs: (1) transactional costs, including redemption fees; (2) ongoing costs, including management fees and other Portfolio expenses. These examples are intended to help you understand your ongoing costs (in dollars) of investing in the Portfolio and to compare these costs with the ongoing costs of investing in other mutual funds.
The examples are based on an investment of $1,000 invested at the beginning of the six-month period ended September 30, 2007 and held for the entire six-month period.
Actual Expenses
The first line of the tables below provides information about actual account values and actual expenses. You may use the information in this line, together with the amount you invested, to estimate the expenses that you paid over the period. Simply divide your account value by $1,000 (for example, an $8,600 account value divided by $1,000 = 8.6), then multiply the result by the number in the first line under the heading entitled “Expenses Paid During Period” to estimate the expenses you paid on your account during this period.
Please note that “Expenses Paid During Period” are grossed up to reflect Portfolio expenses prior to the effect of Expense Offset (See Note E in the Notes to Financial Statements). Therefore, the annualized net expense ratios may differ from the ratio of expenses to average net assets shown in the Financial Highlights.
Please note that the Portfolio’s Adviser Class Share commenced operations on June 20, 2007; therefore, actual expenses paid during the period reflect activity from June 20, 2007 through September 30, 2007.
128
2007 Annual Report
September 30, 2007
Investment Overview (cont’d)
Municipal Portfolio
Hypothetical Example for Comparison Purposes
The second line of the tables below provides information about hypothetical account values and hypothetical expenses based on the Portfolio’s actual expense ratio and an assumed rate of return of 5% per year before expenses, which is not the Portfolio’s actual return. The hypothetical account values and expenses may not be used to estimate the actual ending account balance or expenses you paid for the period. You may use this information to compare the ongoing costs of investing in the Portfolio and other funds. To do so, compare this 5% hypothetical example with the 5% hypothetical examples that appear in the shareholder reports of the other funds.
Please note that while the Portfolio’s Adviser Class Share commenced operations on June 20, 2007, the hypothetical expenses paid during the period reflect projected activity for the full six month period for the purposes of comparability. This projection assumes that the annualized expense ratio for the Portfolio’s Adviser Class Share was in effect during the period from April 1, 2007 to September 30, 2007.
Please note that the expenses shown in the table are meant to highlight your ongoing costs only and do not reflect any transactional costs, such as redemption fees. Therefore, the second line of the table is useful in comparing ongoing costs only, and will not help you determine the relative total costs of owning different funds. In addition, if these transactional costs were included, your costs would have been higher.
| | | | | | Expenses Paid | |
| | | | Ending Account | | During Period* | |
| | Beginning | | Value | | April 1, 2007 — | |
| | Account Value | | September 30, | | September 30, | |
| | April 1, 2007 | | 2007 | | 2007 | |
| | | | | | | |
Institutional Class | | | | | | | |
Actual | | $ | 1,000.00 | | $ | 1,015.80 | | $ | 2.58 | |
Hypothetical (5% average annual return before expenses) | | 1,000.00 | | 1,022.51 | | 2.59 | |
| | | | | | | | | | |
| | | | | | Expenses Paid | |
| | | | Ending Account | | During Period* | |
| | | | Value | | June 20, 2007 | |
| | Beginning | | September 30, | | — September | |
| | Account Value | | 2007 | | 30, 2007 | |
Adviser Class | | | | | | | |
Actual | | $ | 1,000.00 | | $ | 1,020.20 | | $ | 2.08 | |
Hypothetical (5% average annual return before expenses) | | 1,000.00 | | 1,021.41 | | 3.70 | |
| | | | | | | | | | |
* Expenses are equal to Institutional Class’ and Adviser Class’ annualized net expense ratios of 0.51% and 0.73%, respectively, multiplied by the average account value over the period, multiplied by 183/365 for the Institutional Class (to reflect the one-half year period) and multiplied by 103/365 for the Adviser Class (to reflect the actual days in the period).
Graphic Presentation of Portfolio Holdings
The following graph depicts the Portfolio’s holdings by investment type, as a percentage of total net investments.

* Investment types which do not appear in the above graph, as well as those which represent less than 5% of total investments, if applicable, are included in the category labeled “Other”.
129
2007 Annual Report
September 30, 2007
Portfolio of Investments
Municipal Portfolio
| | Face | | | |
| | Amount
(000) | | Value
(000) | |
Fixed Income Securities (99.4%) | | | | | |
Collateralized Mortgage Obligations — Agency Collateral Series (0.3%) | | | | | |
Federal Home Loan Mortgage Corp., | | | | | |
IO | | | | | |
6.50%, 3/15/33 | | $ | 533 | | $ | 120 | |
IO PAC | | | | | |
6.00%, 4/15/32 | | 1,272 | | 155 | |
Federal National Mortgage Association, | | | | | |
Inv Fl IO | | | | | |
3.87%, 3/25/23 | | 522 | | 50 | |
IO | | | | | |
1.38%, 3/25/36 | | 12,728 | | 270 | |
6.00%, 5/25/33 - 8/25/35 | | 5,247 | | 1,507 | |
6.50%, 6/1/31 - 5/25/33 | | 1,427 | | 335 | |
7.00%, 4/1/32 - 4/25/33 | | 605 | | 144 | |
Government National Mortgage Association, | | | | | |
Inv Fl IO | | | | | |
2.20%, 12/16/25 | | 322 | | 30 | |
2.25%, 5/16/32 | | 221 | | 17 | |
2.80%, 4/16/19 - 12/16/29 | | 772 | | 70 | |
| | | | 2,698 | |
Collateralized Mortgage Obligations — Non Agency Collateral Series (4.3%) | | | | | |
Bear Stearns Structured Products, Inc., | | | | | |
IO | | | | | |
1.41%, 1/27/37 | | (e)53,550 | | 1,548 | |
1.45%, 6/26/36 | | (e)78,396 | | 2,450 | |
1.46%, 1/27/37 | | (e)77,908 | | 2,345 | |
1.57%, 1/27/37 | | (e)45,508 | | 1,525 | |
2.02%, 5/25/37 | | (e)83,498 | | 2,797 | |
Countrywide Alternative Loan Trust, | | | | | |
1.90%, 5/25/47 | | (e)(h)17,609 | | 696 | |
2.37%, 2/25/47 | | (e)(h)39,074 | | 1,359 | |
IO | | | | | |
1.19%, 3/20/46 | | 11,881 | | 493 | |
1.30%, 8/25/46 | | (h)9,881 | | 380 | |
1.51%, 3/20/47 | | 29,886 | | 1,535 | |
1.66%, 12/20/35 | | (e)(h)12,331 | | 328 | |
2.07%, 12/20/46 | | 31,911 | | 1,426 | |
2.09%, 2/25/37 | | 12,558 | | 604 | |
2.14%, 12/20/35 | | (e)(h)15,859 | | 629 | |
Countrywide Home Loan Mortgage Pass Through Trust, | | | | | |
IO | | | | | |
0.37%, 10/25/34 | | (h)8,274 | | 134 | |
Deutsche ALT-A Securities, Inc., Alternate Loan Trust, | | | | | |
5.81%, 2/25/47 | | (h)2,453 | | 2,318 | |
Greenpoint Mortgage Funding Trust, | | | | | |
IO | | | | | |
0.70%, 6/25/45 | | 9,350 | | 259 | |
0.81%, 8/25/45 | | 8,341 | | 239 | |
Harborview Mortgage Loan Trust, | | | | | |
IO | | | | | |
1.24%, 6/19/35 | | (h)8,709 | | 185 | |
1.53%, 5/19/35 | | (h)12,028 | | 259 | |
1.89%, 3/19/37 | | (h)10,998 | | 467 | |
2.02%, 7/19/46 | | (h)19,487 | | 700 | |
PO | | | | | |
3/19/37 - 7/19/47 | | $ | 6 | | $ | 5 | |
Harborview NIM Corp., | | | | | |
IO | | | | | |
Zero Coupon, 12/15/36 | | (e)2,401 | | 1,315 | |
Indymac Index Mortgage Loan Trust, | | | | | |
IO | | | | | |
1.43%, 7/25/35 | | (h)11,586 | | 406 | |
Residential Accredit Loans Inc., | | | | | |
Zero Coupon, 8/25/47 | | 142,208 | | 3,911 | |
2.76%, 5/25/47 | | (e)(h)58,374 | | 2,481 | |
2.80%, 3/25/47 | | (e)(h)24,099 | | 964 | |
Washington Mutual Mortgage Pass Through Certificates, | | | | | |
5.38%, 1/25/47 | | (h)2,523 | | 2,453 | |
IO | | | | | |
0.30%, 4/25/45 | | 77,851 | | 1,022 | |
Washington Mutual, Inc., | | | | | |
5.41%, 6/25/46 | | (h)2,929 | | 2,761 | |
5.43%, 10/25/46 | | (h)2,914 | | 2,772 | |
| | | | 40,766 | |
Industrials (0.1%) | | | | | |
Echostar DBS Corp., | | | | | |
6.38%, 10/1/11 | | 580 | | 584 | |
6.63%, 10/1/14 | | 20 | | 20 | |
Pilgrim’s Pride Corp., | | | | | |
7.63%, 5/1/15 | | 730 | | 745 | |
| | | | 1,349 | |
Municipal Bonds (94.7%) | | | | | |
Abilene, TX, Health Facilities Development Corp., | | | | | |
SAVRS, Revenue Bonds (MBIA), | | | | | |
4.03%, 9/19/25 | | (h)4,950 | | 4,950 | |
Alameda, CA, Unified School District, | | | | | |
General Obligation Bonds (FSA), | | | | | |
Zero Coupon, 8/1/33 | | 9,915 | | 2,859 | |
Alamo Community College District, TX, | | | | | |
General Obligation Bonds (FSA), | | | | | |
5.00%, 2/15/13 - 2/15/14 | | 4,880 | | 5,220 | |
Alaska Railroad Corp., Revenue Bonds, | | | | | |
5.00%, 8/1/15 | | 2,680 | | 2,898 | |
Aldine Independent School District, | | | | | |
General Obligation Bonds (PSFG), | | | | | |
5.00%, 2/15/13 | | 3,040 | | 3,240 | |
Allegheny County, PA, Industrial Development Authority, | | | | | |
Revenue Bonds, | | | | | |
4.75%, 12/1/32 | | 525 | | 534 | |
Amarillo, TX, General Obligation Bonds (MBIA), | | | | | |
5.00%, 5/15/13 | | 1,020 | | 1,090 | |
Austin, TX, Convention Enterprises, Inc., | | | | | |
Revenue Bonds, | | | | | |
6.70%, 1/1/28 | | 400 | | 438 | |
Austin, TX, Water & Wastewater System | | | | | |
Revenue Bonds (MBIA), | | | | | |
5.25%, 11/15/13 | | 4,100 | | 4,437 | |
The accompanying notes are an integral part of the financial statements.
130
2007 Annual Report
September 30, 2007
Portfolio of Investments (cont’d)
Municipal Portfolio
| | Face | | | |
| | Amount
(000) | | Value
(000) | |
Municipal Bonds (cont’d) | | | | | |
Badger TOB Asset Securitization Corp., WI, | | | | | |
Revenue Bonds, | | | | | |
6.13%, 6/1/27 | | $ | 1,085 | | $ | 1,122 | |
Berks County, PA, General Obligation Bonds (FGIC), | | | | | |
Zero Coupon, 5/15/19 - 11/15/20 | | 2,250 | | 1,321 | |
Brazos River Authority, TX, Pollution | | | | | |
Collateral Revenue Bonds, | | | | | |
5.40%, 10/1/29 | | (h)325 | | 318 | |
Brunswick County, NC, | | | | | |
General Obligation Bonds (FGIC), | | | | | |
5.00%, 5/1/17 | | 1,700 | | 1,805 | |
Butler & Sedgwick Counties, KS, Unified School District, | | | | | |
General Obligation Bonds (FSA), | | | | | |
5.85%, 9/1/17 | | 1,375 | | 1,462 | |
California State Department of Water Resources Power Supply, | | | | | |
Revenue Bonds (MBIA), | | | | | |
5.25%, 5/1/12 | | 2,200 | | 2,359 | |
California State, General Obligation Bonds, | | | | | |
5.25%, 2/1/14 | | 1,375 | | 1,484 | |
California State Public Works Board, Revenue Bonds, | | | | | |
5.25%, 6/1/13 | | 1,150 | | 1,240 | |
5.50%, 6/1/15 | | 1,275 | | 1,398 | |
Camden, AL, Industrial Development Board, | | | | | |
Revenue Bonds, | | | | | |
6.13%, 12/1/24 | | 625 | | 668 | |
Carbon County, PA, Industrial Development Authority, | | | | | |
Revenue Bonds, | | | | | |
6.65%, 5/1/10 | | 190 | | 197 | |
Carrollton, TX, General Obligation Bonds (FSA), | | | | | |
5.13%, 8/15/16 | | 1,470 | | 1,546 | |
Center Township, PA, Sewer Authority, | | | | | |
Revenue Bonds (MBIA), | | | | | |
Zero Coupon, 4/15/17 | | 615 | | 415 | |
Central Michigan University, Revenue Bonds (FGIC) | | | | | |
4.14%, 10/1/15 | | (h)9,750 | | 9,750 | |
Chandler, AZ, Industrial Development Authority, | | | | | |
Revenue Bonds, | | | | | |
4.38%, 12/1/35 | | (h)1,400 | | 1,423 | |
Chelsea, MA, Lease Revenue Bonds (FSA), | | | | | |
3.88%, 6/6/23 | | (h)5,950 | | 5,950 | |
Chelsea, MA, Lease Revenue Bonds, Series B, SAVRS (FSA), | | | | | |
3.98%, 6/13/23 | | (h)11,200 | | 11,200 | |
Cherokee County, GA, School Systems, | | | | | |
General Obligation Bonds (MBIA), | | | | | |
5.00%, 8/1/13 | | 1,000 | | 1,076 | |
Chicago, IL, Board of Education, | | | | | |
General Obligation Bonds (XLCA), | | | | | |
3.98%, 3/1/34 | | (h)14,575 | | 14,575 | |
Chicago, IL, General Obligation Bonds (FGIC), | | | | | |
Zero Coupon, 1/1/19 | | 4,000 | | 2,456 | |
Children’s Trust Fund, Revenue Bonds, | | | | | |
5.38%, 5/15/33 | | 1,835 | | 1,824 | |
5.75%, 7/1/20 | | 600 | | 624 | |
Citizens Property Insurance Corp., FL, | | | | | |
Revenue Bonds (M1BIA), | | | | | |
5.00%, 3/1/12 | | $ | 3,000 | | $ | 3,172 | |
City of Tallahassee, FL, Revenue Bonds, | | | | | |
5.00%, 10/1/11 | | 2,470 | | 2,600 | |
Clark County, NEV School District | | | | | |
General Obligation LTD (AMBAC), | | | | | |
4.50%, 6/15/11 | | 14,000 | | 14,453 | |
Clark County, WA School District No. 117, Camas | | | | | |
General Obligation Bonds (FSA), | | | | | |
5.00%, 12/1/13 | | 1,500 | | 1,612 | |
Clark County, WA School District No.114, Evergreen General | | | | | |
Obligation Bonds (FSA), | | | | | |
5.00%, 6/1/13 | | 2,500 | | 2,674 | |
Clear Creek, TX, Independent School District (PSFG), | | | | | |
5.65%, 2/15/19 | | 1,000 | | 1,048 | |
Coachella Valley Unified School District, CA, | | | | | |
General Obligation Bonds (FGIC), | | | | | |
Zero Coupon, 8/1/30 | | 1,000 | | 338 | |
Colorado E470 Public Highway Authority, | | | | | |
Revenue Bonds (MBIA), | | | | | |
Zero Coupon, 9/1/29 | | 18,900 | | 6,609 | |
Colorado Educational & Cultural Facilities Authority, | | | | | |
Revenue Bonds (MBIA), | | | | | |
4.38%, 3/1/14 | | 1,400 | | 1,448 | |
4.50%, 3/1/15 | | 1,600 | | 1,658 | |
4.60%, 3/1/16 | | 1,000 | | 1,037 | |
Colorado Health Facilities Authority, Revenue Bonds, | | | | | |
Zero Coupon, 7/15/20 | | 1,000 | | 564 | |
Commerce, CA, Energy Authority Revenue Bonds (MBIA), | | | | | |
5.25%, 7/1/09 | | 1,355 | | 1,396 | |
Cook County, IL, School District, | | | | | |
General Obligation Bonds (MBIA), | | | | | |
Zero Coupon, 12/1/22 | | 4,125 | | 2,075 | |
Council Rock, PA, School District, | | | | | |
General Obligation Bonds (MBIA), | | | | | |
5.00%, 11/15/19 | | 1,285 | | 1,355 | |
County of Bexar, TX, General Obligation Bonds (FSA), | | | | | |
5.00%, 6/15/12 - 6/15/14 | | 2,640 | | 2,819 | |
County of Craven, NC, COP (MBIA), | | | | | |
5.00%, 6/1/11 | | 1,730 | | 1,811 | |
County of Miami-Dade, FL, Revenue Bonds (FGIC), | | | | | |
5.00%, 8/1/11 - 8/1/13 | | 15,480 | | 16,384 | |
County of Osceola, FL, Revenue Bonds (AMBAC), | | | | | |
5.00%, 10/1/12 - 10/1/13 | | 5,070 | | 5,410 | |
County of Riverside, CA, COP (AMBAC), | | | | | |
5.00%, 11/1/14 | | 3,500 | | 3,784 | |
County of St. Lucie, FL, Transportation | | | | | |
Revenue Bonds (AMBAC), | | | | | |
5.00%, 8/1/13 | | 1,000 | | 1,068 | |
Cranberry Township, PA, General Obligation Bonds (FGIC), | | | | | |
4.80%, 12/1/18 | | 1,310 | | 1,356 | |
Crandall, TX Independent School District, | | | | | |
General Obligation Bonds (PSFG), | | | | | |
Zero Coupon, 8/15/19 - 8/15/21 | | 4,315 | | 2,414 | |
The accompanying notes are an integral part of the financial statements.
131
2007 Annual Report
September 30, 2007
Portfolio of Investments (cont’d)
Municipal Portfolio
| | Face | | | |
| | Amount
(000) | | Value
(000) | |
Municipal Bonds (cont’d) | | | | | |
Crisp County Development Authority, Revenue Bonds, | | | | | |
5.55%, 2/1/15 | | $ | 200 | | $ | 208 | |
Crowley, TX, Independent School District, | | | | | |
General Obligation Bonds (PSFG), | | | | | |
5.00%, 8/1/10 - 8/1/11 | | 3,350 | | 3,495 | |
Crown Point, IN, Multi-School Building Corp., | | | | | |
Revenue Bonds (MBIA), | | | | | |
Zero Coupon, 1/15/24 | | 5,200 | | 2,447 | |
Cypress-Fairbanks, TX, Independent School District, | | | | | |
General Obligation Bonds (PSFG), | | | | | |
4.80%, 2/15/19 | | 1,650 | | 1,709 | |
5.00%, 2/15/11 | | 2,045 | | 2,137 | |
Dallas County, TX, Utility & Reclamation District, SAVRS, | | | | | |
General Obligations Bonds (AMBAC), | | | | | |
4.03%, 2/15/29 | | (h)4,625 | | 4,625 | |
Dallas, TX, Waterworks & Sewer Systems, | | | | | |
Revenue Bonds | | | | | |
5.00%, 10/1/12 - 10/1/13 | | 15,000 | | 16,049 | |
Dallas, TX, Area Rapid Transit Revenue Bonds, (AMBAC), | | | | | |
5.00%, 12/1/11 | | 1,915 | | 2,020 | |
Delaware County, PA, Industrial Development Authority, | | | | | |
Revenue Bonds, | | | | | |
6.50%, 1/1/08 | | 200 | | 201 | |
Delta County, MI, Economic Development Corp., | | | | | |
Revenue Bonds, | | | | | |
6.25%, 4/15/27 | | 450 | | 499 | |
Denton, TX, Independent School District, | | | | | |
General Obligation Bonds, | | | | | |
5.00%, 8/15/12 | | 1,905 | | 2,022 | |
Denton, TX, Utility System Revenue Bonds, | | | | | |
5.00%, 12/1/16 | | 1,865 | | 1,955 | |
Detroit, MI, City School District, | | | | | |
General Obligation Bonds (FGIC), | | | | | |
5.15%, 5/1/22 | | 2,500 | | 2,692 | |
Director of the State of Nevada | | | | | |
Department of Business & Industry, | | | | | |
Revenue Bonds, | | | | | |
5.63%, 12/1/26 | | (h)1,100 | | 1,128 | |
Director of the State of Nevada Department of | | | | | |
Business & Industry, Revenue Bonds (AMBAC), | | | | | |
Zero Coupon, 1/1/21 - 1/1/23 | | 3,845 | | 1,987 | |
Dover, PA, Area School District, | | | | | |
General Obligation Bonds (FGIC), | | | | | |
5.00%, 4/1/16 | | 1,000 | | 1,043 | |
Duncanville Independent School District, TX, | | | | | |
General Obligation Bonds (PSFG), | | | | | |
Zero Coupon, 2/15/22 | | 4,000 | | 2,089 | |
Eagle, IN, Union Middle School Building, | | | | | |
Revenue Bonds (AMBAC), | | | | | |
4.90%, 7/5/16 | | 1,000 | | 1,041 | |
5.00%, 7/5/17 | | 1,500 | | 1,569 | |
Eanes, TX, Independent School District, | | | | | |
General Obligation Bonds (PSFG), | | | | | |
4.80%, 8/1/19 | | 1,365 | | 1,407 | |
East Porter County, IN, School Building Corp., | | | | | |
Revenue Bonds (MBIA), | | | | | |
4.70%, 7/15/12 | | $ | 1,025 | | $ | 1,045 | |
Edgewood, TX, Independent School District (PSFG), | | | | | |
4.75%, 8/15/16 | | 1,310 | | 1,366 | |
4.85%, 8/15/17 | | 880 | | 913 | |
Elizabeth Forward, PA, School District (MBIA), | | | | | |
Zero Coupon, 9/1/11 | | 1,250 | | 1,079 | |
Erie County Industrial Development Agency, NY, | | | | | |
Revenue Bonds (FSA), | | | | | |
5.00%, 5/1/14 - 5/1/15 | | 5,925 | | 6,345 | |
Essex County, NJ, Utility Authority | | | | | |
Revenue Bonds (FSA), | | | | | |
4.80%, 4/1/14 | | 1,005 | | 1,021 | |
Eureka Union School District, CA, | | | | | |
General Obligation Bonds (MBIA), | | | | | |
Zero Coupon, 8/1/28 - 8/1/30 | | 5,090 | | 1,812 | |
Everett, WA, Water & Sewer Revenue Bonds (MBIA), | | | | | |
5.00%, 7/1/13 | | 1,630 | | 1,745 | |
Florida Municipal Loan Council, Revenue Bonds (MBIA), | | | | | |
5.00%, 10/1/11 - 10/1/13 | | 3,850 | | 4,080 | |
Fort Wayne Hospital Authority, IN, Revenue Bonds (MBIA), | | | | | |
4.70%, 11/15/11 | | 1,100 | | 1,133 | |
Fort Worth, TX, Water & Sewer Revenue Bonds (FSA), | | | | | |
3.44%, 2/15/24 | | (h)16,900 | | 16,900 | |
Frisco, TX, Independent School District, | | | | | |
General Obligation Bonds (PSFG), | | | | | |
Zero Coupon, 8/15/20 - 8/15/22 | | 6,260 | | 3,343 | |
Geneva, IL, Industrial Development, Revenue Bonds (FSA), | | | | | |
4.80%, 5/1/19 | | 1,705 | | 1,755 | |
Georgetown County, SC, Pollution Control Facility, | | | | | |
Revenue Bonds, | | | | | |
5.13%, 2/1/12 | | 725 | | 744 | |
Gilliam County, OR, Solid Waste Disposal, Revenue Bonds, | | | | | |
4.88%, 7/1/38 | | 1,400 | | 1,410 | |
Girard Area, PA, School District, | | | | | |
General Obligation Bonds (FGIC), | | | | | |
Zerp Coupon, 10/1/18 - 10/1/19 | | 950 | | 602 | |
Grand Prairie, TX, Independent School District, | | | | | |
General Obligation Bonds (PSFG), | | | | | |
Zero Coupon, 2/15/14 | | 2,240 | | 1,744 | |
Grapevine, TX, Certificates of Obligation, | | | | | |
General Obligation Bonds (FGIC), | | | | | |
5.75%, 8/15/17 | | 1,000 | | 1,060 | |
Greenwood Fifty School Facilities, SC, Inc., | | | | | |
Installment Purchase Revenue Bonds (AGC), | | | | | |
5.00%, 12/1/11 | | 1,000 | | 1,052 | |
Gulf Coast Waste Disposal Authority, TX, Revenue Bonds, | | | | | |
4.55%, 4/1/12 | | 830 | | 826 | |
Harris County Hospital District, TX, Revenue Bonds (MBIA), | | | | | |
5.00%, 2/15/11 | | 345 | | 360 | |
Hawaii State, COP, General Obligation | | | | | |
Bonds (AMBAC), | | | | | |
4.80%, 5/1/12 | | 1,275 | | 1,302 | |
5.00%, 4/1/13 | | 8,290 | | 8,861 | |
The accompanying notes are an integral part of the financial statements.
132
2007 Annual Report
September 30, 2007
Portfolio of Investments (cont’d)
Municipal Portfolio
| | Face | | | |
| | Amount
(000) | | Value
(000) | |
Municipal Bonds (cont’d) | | | | | |
Houston, TX, Community College Revenue Bonds, | | | | | |
4.00%, 4/15/11 - 4/15/12 | | $ | 2,865 | | $ | 2,908 | |
Houston, TX, Utility System Revenue Bonds, | | | | | |
5.00%, 11/15/13 | | 1,000 | | 1,074 | |
Houston, TX, General Obligation Bonds (MBIA), | | | | | |
5.00%, 3/1/12 | | 3,400 | | 3,593 | |
Houston, TX, Independent School District, | | | | | |
General Obligation Bonds (PSFG), | | | | | |
5.00%, 2/15/13 | | 6,000 | | 6,395 | |
Houston, TX, Revenue Bonds (MBIA), | | | | | |
5.25%, 5/15/11 | | 2,000 | | 2,113 | |
Houston, TX, Water & Sewer System, | | | | | |
Revenue Bonds (FSA), | | | | | |
Zero Coupon, 12/1/25 | | 12,350 | | 5,274 | |
Illinois Development Finance Authority, | | | | | |
Revenue Bonds (FGIC), | | | | | |
Zero Coupon, 12/1/09 | | 2,000 | | 1,846 | |
Illinois Educational Facilities Authority, SAVRS, | | | | | |
Revenue Bonds (MBIA), | | | | | |
4.10%, 4/1/28 | | (h)11,500 | | 11,500 | |
Illinois Health Facilities Authority, Revenue Bonds (MBIA), | | | | | |
5.00%, 11/15/12 | | 1,000 | | 1,017 | |
Illinois Health Facilities Authority, SAVRS, | | | | | |
Revenue Bonds (AMBAC), | | | | | |
4.00%, 8/16/24 | | (h)21,200 | | 21,200 | |
Illinois Municipal Electric Agency, | | | | | |
Revenue Bonds (FGIC), | | | | | |
5.00%, 2/1/13 - 2/1/15 | | 2,065 | | 2,213 | |
Indiana Port Commission, Revenue Bonds, | | | | | |
4.10%, 5/1/12 | | 3,450 | | 3,445 | |
Indiana State Development Finance Authority, | | | | | |
Revenue Bonds, | | | | | |
4.70%, 10/1/31 | | (h)100 | | 99 | |
Indiana State University, Revenue Bonds (FGIC), | | | | | |
5.20%, 10/1/12 | | 1,640 | | 1,670 | |
Indiana Transportation Finance Authority, | | | | | |
Highway Revenue Bonds (AMBAC), | | | | | |
Zero Coupon, 12/1/16 | | 1,695 | | 1,165 | |
Intermountain Power Agency, UT, | | | | | |
Power Supply Revenue Bonds, | | | | | |
Zero Coupon, 7/1/17 | | 1,750 | | 1,153 | |
Iowa Finance Authority, Private University Revenue Bonds, | | | | | |
5.00%, 4/1/13 | | 1,210 | | 1,288 | |
Irving, TX, Independent School District, | | | | | |
General Obligation Bonds (PSFG), | | | | | |
Zero Coupon, 2/15/13 | | 1,945 | | 1,581 | |
Judson TX, Independent School District, | | | | | |
General Obligation Bonds, | | | | | |
5.00%, 2/1/13 | | 1,000 | | 1,066 | |
Kane & De Kalb Counties, IL, Community Unit School District, | | | | | |
General Obligation Bonds (AMBAC), | | | | | |
Zero Coupon, 12/1/09 | | 725 | | 669 | |
Kent State University, OH, SAVRS, | | | | | |
Revenue Bonds (MBIA), | | | | | |
3.74%, 5/1/32 | | $ | (h)11,725 | | $ | 11,725 | |
Kentucky Asset Liability Commission, KY, | | | | | |
Revenue Bonds (MBIA), | | | | | |
5.00%, 9/1/11 - 9/1/14 | | 17,810 | | 18,803 | |
King County, WA, General Obligation Bonds (MBIA), | | | | | |
5.00%, 12/1/19 | | 1,075 | | 1,121 | |
Lake County, IL, Community Consolidated School District, | | | | | |
General Obligation Bonds (FGIC), | | | | | |
Zero Coupon, 12/1/19 - 12/1/21 | | 12,775 | | 7,083 | |
Lakeview, MI, Public School District, | | | | | |
General Obligation Bonds, | | | | | |
5.00%, 5/1/16 | | 1,060 | | 1,111 | |
Lamar, TX, Consolidated Independent School District, | | | | | |
General Obligation Bonds, | | | | | |
5.00%, 2/15/12 | | 1,000 | | 1,056 | |
Lancaster, TX, Independent School District, | | | | | |
General Obligation Bonds (FSA), | | | | | |
Zero Coupon, 2/15/09 | | 1,795 | | 1,706 | |
Lewisville, TX, Independent School School District, | | | | | |
General Obligation Bonds (FGIC), | | | | | |
4.00%, 8/15/10 | | 4,905 | | 4,963 | |
Lexington County, SC, Revenue Bonds, | | | | | |
5.00%, 11/1/16 | | 165 | | 173 | |
Long Beach, CA, Community College District, | | | | | |
General Obligation Bonds (FGIC), | | | | | |
Zero Coupon, 5/1/14 | | 2,465 | | 1,916 | |
Long Island, NY, Power Authority Electric System, | | | | | |
Revenue Bonds (FSA), | | | | | |
Zero Coupon, 6/1/16 | | 3,700 | | 2,623 | |
Louisiana Correctional Facilities Corp., LA, | | | | | |
Revenue Bonds (AMBAC), | | | | | |
5.00%, 9/1/12 | | 1,230 | | 1,305 | |
Louisiana Offshore Terminal Authority, LA, | | | | | |
Revenue Bonds, | | | | | |
4.30%, 10/1/37 | | 2,600 | | 2,624 | |
Lubbock, TX, General Obligation Bonds (FSA), | | | | | |
5.00%, 2/15/11 - 2/15/14 | | 3,160 | | 3,339 | |
Madera, CA, Unified School District, | | | | | |
General Obligation Bonds (FGIC), | | | | | |
Zero Coupon, 8/1/26 - 8/1/28 | | 7,000 | | 2,800 | |
Madison & Jersey Counties, IL, Unit School District, | | | | | |
General Obligation Bonds (FSA), | | | | | |
Zero Coupon, 12/1/20 | | 2,900 | | 1,606 | |
Maine Health & Higher Educational Facilities Authority, | | | | | |
ME, SAVRS, Revenue Bonds (FGIC), | | | | | |
3.80%, 7/1/14 | | (h)5,250 | | 5,250 | |
Maricopa County, AZ, Pollution Control, | | | | | |
2.90%, 6/1/35 | | 1,600 | | 1,569 | |
4.00%, 1/1/38 | | (h)350 | | 350 | |
Maryland State Economic Development Corp., | | | | | |
Revenue Bonds, | | | | | |
7.50%, 12/1/14 | | 350 | | 381 | |
| | | | | | | | |
The accompanying notes are an integral part of the financial statements.
133
2007 Annual Report
September 30, 2007
Portfolio of Investments (cont’d)
Municipal Portfolio
| | Face | | | |
| | Amount
(000) | | Value
(000) | |
Municipal Bonds (cont’d) | | | | | |
Massachusetts State Development Financing Agency Resource | | | | | |
Recovery, Revenue Bonds, | | | | | |
6.90%, 12/1/29 | | $ | (h)250 | | $ | 262 | |
Massachusetts State Health & Educational Facilities Authority, | | | | | |
Revenue Bonds (AMBAC), | | | | | |
4.80%, 7/1/12 | | 1,665 | | 1,704 | |
Massachusetts State Health & Educational Facilities Authority, | | | | | |
Revenue Bonds (MBIA), | | | | | |
3.65%, 10/1/22 | | (h)11,550 | | 11,550 | |
4.22%, 10/1/33 | | (h)11,900 | | 11,900 | |
Massachusetts State Water Reserve Authority, | | | | | |
SAVRS, Revenue Bonds (AMBAC), | | | | | |
4.02%, 4/1/29 | | (h)15,775 | | 15,775 | |
Maury County, TN, Industrial Development Board | | | | | |
Solid Waste Disposal, Revenue Bonds, | | | | | |
6.30%, 8/1/18 | | 1,075 | | 1,115 | |
Memphis, TN, Electric System Revenue Bonds (XLCA), | | | | | |
3.99%, 12/1/18 | | (h)4,000 | | 4,000 | |
Memphis-Shelby County Sports Authority Inc., | | | | | |
Revenue Bonds, Memphis Arena Project (MBIA), | | | | | |
5.00%, 11/1/13 | | 1,410 | | 1,509 | |
Memphis-Shelby County, TN, Airport Authority Special Facilities, | | | | | |
Revenue Bonds, Federal Express Corp., | | | | | |
5.00%, 9/1/09 | | 850 | | 865 | |
Merced City, CA, School District, | | | | | |
General Obligation Bonds (MBIA), | | | | | |
Zero Coupon, 8/1/28 - 8/1/29 | | 4,665 | | 1,686 | |
Metropolitan Pier & Exposition Authority, IL, Dedicated State Tax | | | | | |
Revenue Bonds (MBIA), | | | | | |
Zero Coupon, 6/15/20 - 12/15/23 | | 5,175 | | 2,821 | |
Miami-Dade County, FL, School Board, COP, | | | | | |
General Obligation Bonds (FGIC), | | | | | |
5.00%, 5/1/11 - 5/1/13 | | 15,005 | | 15,865 | |
Michigan City, IN, Area-Wide School Building Corp., | | | | | |
Revenue Bonds (FGIC), | | | | | |
Zero Coupon, 1/15/17 - 1/15/20 | | 6,750 | | 4,298 | |
Michigan State Building Authority, Revenue Bonds (MBIA), | | | | | |
5.25%, 10/1/10 - 10/1/11 | | 3,000 | | 3,159 | |
Michigan State Strategic Fund, Solid Waste Management Project, | | | | | |
Revenue Bonds, | | | | | |
4.63%, 12/1/12 | | 275 | | 275 | |
Midland, TX, Independent School District, | | | | | |
General Obligation Bonds (FGIC), | | | | | |
5.95%, 3/1/18 | | 1,225 | | 1,293 | |
Milwaukee, WI, Sewer Revenue Bonds (AMBAC), | | | | | |
4.88%, 6/1/19 | | 2,070 | | 2,131 | |
Montana State Health Facilities Authority, | | | | | |
Revenue Bonds (AMBAC), | | | | | |
4.10%, 2/15/17 | | (h)1,800 | | 1,800 | |
Montour, PA, School District, | | | | | |
General Obligation Bonds (MBIA), | | | | | |
Zero Coupon, 1/1/13 | | 300 | | 245 | |
Morton Grove, IL, General Obligation Bonds (FGIC), | | | | | |
4.50%, 12/1/13 | | 1,480 | | 1,494 | |
Mount San Antonio, CA, Community College District, | | | | | |
General Obligation Bonds (MBIA), | | | | | |
Zero Coupon, 8/1/16 - 8/1/17 | | $ | 27,555 | | $ | 18,755 | |
Municipal Electric Authority, GA, Revenue Bonds, | | | | | |
Combustion Turbine Project (XLCA), | | | | | |
3.50%, 11/1/29 | | (h)1,985 | | 1,985 | |
Nassau County, NY, Improvement Bonds, | | | | | |
General Obligation Bonds (FSA), | | | | | �� |
6.00%, 3/1/17 | | 1,275 | | 1,349 | |
Nebraska Public Power District, Revenue Bonds (FSA), | | | | | |
5.00%, 1/1/11 - 1/1/13 | | 9,360 | | 9,844 | |
New Jersey Economic Development Authority, | | | | | |
Revenue Bonds | | | | | |
Zero Coupon, 4/1/12 | | 625 | | 528 | |
New Jersey Transportation Trust Fund Authority, | | | | | |
Revenue Bonds (XLCA), | | | | | |
3.99%, 12/15/17 | | (h)5,000 | | 5,000 | |
New Mexico Finance Authority, Revenue Bonds (MBIA), | | | | | |
5.00%, 6/15/12 - 6/15/15 | | 7,115 | | 7,655 | |
New Orleans, LA, Audubon Commission, | | | | | |
General Obligation Bonds (FSA), | | | | | |
5.00%, 10/1/13 | | 1,695 | | 1,808 | |
New York City, NY Industrial Development Agency, | | | | | |
Revenue Bonds (FSA), | | | | | |
6.00%, 11/1/15 | | 1,485 | | 1,489 | |
New York State Dormitory Authority, Revenue Bonds (FSA), | | | | | |
5.10%, 2/15/11 | | 2,075 | | 2,118 | |
Noblesville, IN, High School Building Corp., | | | | | |
Revenue Bonds (AMBAC), | | | | | |
Zero Coupon, 2/15/19 | | 1,850 | | 1,131 | |
5.00%, 1/10/12 - 7/10/13 | | 4,880 | | 5,192 | |
Norman, OK, Regional Hospital Authority, SAVRS, | | | | | |
Revenue Bonds (MBIA), | | | | | |
4.22%, 9/1/22 | | (h)4,350 | | 4,350 | |
North Carolina Infrastructure Finance Corp., COP, | | | | | |
General Obligation Bonds (FSA), | | | | | |
5.00%, 5/1/12 - 5/1/14 | | 14,115 | | 14,999 | |
North Carolina Municipal Power Agency, Electric Revenue Bonds, | | | | | |
6.63%, 1/1/10 | | 850 | | 898 | |
North Side, IN, High School Building Corp., | | | | | |
Revenue Bonds (FSA) | | | | | |
5.25%, 7/15/13 | | 2,910 | | 3,151 | |
North Slope Borough, AK, General Obligation Bonds (MBIA), | | | | | |
Zero Coupon, 6/30/12 | | 2,900 | | 2,421 | |
Norwalk-LA Mirada, CA, Unified School District, | | | | | |
General Obligation Bonds (FGIC), | | | | | |
Zero Coupon, 8/1/25 | | 8,900 | | 3,919 | |
Ohio State Higher Educational Facility Commission (Denison | | | | | |
University), Revenue Bonds (AMBAC), | | | | | |
4.22%, 12/1/34 | | (h)8,775 | | 8,775 | |
Ohio State, Solid Waste Revenue Bonds, | | | | | |
4.25%, 4/1/33 | | (h)700 | | 687 | |
Okemos, MI, Public School District, | | | | | |
General Obligation Bonds (MBIA), | | | | | |
Zero Coupon, 5/1/15 | | 900 | | 665 | |
The accompanying notes are an integral part of the financial statements.
134
2007 Annual Report
September 30, 2007
Portfolio of Investments (cont’d)
Municipal Portfolio
| | Face | | | |
| | Amount
(000) | | Value
(000) | |
Municipal Bonds (cont’d) | | | | | |
Ouachita Parish, LA, West Ouachita Parish School District, | | | | | |
Revenue Bonds (MBIA), | | | | | |
4.70%, 9/1/14 | | $ | 1,020 | | $ | 1,048 | |
Pajaro Valley, CA, Unified School District Certificates | | | | | |
Partnership, General Obligation Bonds (FSA), | | | | | |
Zero Coupon, 8/1/27 | | 2,220 | | 878 | |
Palm Beach County School Board, FL, COP, | | | | | |
General Obligation Bonds (FGIC), | | | | | |
5.00%, 8/1/11- 8/1/12 | | 7,770 | | 8,199 | |
Palm Beach County School Board, FL, COP, | | | | | |
General Obligation Bonds (MBIA), | | | | | |
5.00%, 8/1/12 - 8/1/13 | | 7,280 | | 7,729 | |
Pearland, TX, Independent School District, | | | | | |
General Obligation Bonds (PSFG), | | | | | |
4.88%, 2/15/19 | | 1,425 | | 1,499 | |
Penn Hills Municipality, PA, General Obligation Bonds, | | | | | |
Zero Coupon, 6/1/12 - 12/1/13 | | 2,115 | | 1,691 | |
Pennsylvania Convention Center Authority, | | | | | |
Revenue Bonds (FGIC), | | | | | |
6.70%, 9/1/16 | | 500 | | 576 | |
Pennsylvania State Financing Authority, | | | | | |
Aliquippa School District, Revenue Bonds, | | | | | |
Zero Coupon, 6/1/12 | | 685 | | 568 | |
Pennsylvania State Public School Building Authority, Marple | | | | | |
Newtown School District Project, Revenue Bonds (MBIA), | | | | | |
4.60%, 3/1/15 | | 1,065 | | 1,104 | |
4.70%, 3/1/16 | | 715 | | 744 | |
Philadelphia, PA, Water & Wastewater, | | | | | |
Revenue Bonds (AMBAC), | | | | | |
5.00%, 8/1/11 - 8/1/13 | | 8,005 | | 8,506 | |
Piedmont, SC, Municipal Power Agency, | | | | | |
Revenue Bonds (AMBAC), | | | | | |
Zero Coupon, 1/1/31 - 1/1/32 | | 22,300 | | 7,003 | |
Pittsburgh, PA, Stadium Authority Lease | | | | | |
Revenue Bonds, | | | | | |
6.50%, 4/1/11 | | 105 | | 110 | |
Pittsburgh, PA, Water & Sewer Authority, Water & Sewer | | | | | |
System Revenue Bonds (FSA), | | | | | |
5.00%, 9/1/13 | | 1,000 | | 1,068 | |
Port Authority, NY & NJ, Special Obligation Revenue Bonds, | | | | | |
7.00%, 10/1/07 | | 100 | | 100 | |
Regional Transportation District, CO, COP, | | | | | |
5.00%, 12/1/12 - 12/1/13 | | 14,085 | | 15,033 | |
Rescue Union School District, CA, | | | | | |
General Obligation Bonds (MBIA), | | | | | |
Zero Coupon, 9/1/27 | | 2,000 | | 788 | |
Richardson, TX, Hotel Occupancy Certificates of Obligation, | | | | | |
General Obligation Bonds (FGIC), | | | | | |
5.75%, 2/15/17 | | 1,405 | | 1,475 | |
Richland County, SC, Revenue Bonds, | | | | | |
6.10%, 4/1/23 | | 725 | | 758 | |
Rincon Valley, CA, Union School District, | | | | | |
General Obligation Bonds (FGIC), | | | | | |
Zero Coupon, 8/1/32 - 8/1/35 | | 9,675 | | 2,733 | |
Riverside, CA, Electric Revenue Bonds (MBIA), | | | | | |
5.00%, 10/1/11 - 10/1/12 | | $ | 3,380 | | $ | 3,590 | |
Robinson Township, PA, Municipal Authority Revenue Bonds, | | | | | |
6.90%, 5/15/18 | | 100 | | 108 | |
Saginaw Valley State University, MI, | | | | | |
Revenue Bonds, SAVRS (MBIA), | | | | | |
3.94%, 7/1/31 | | (h)12,000 | | 12,000 | |
Saginaw, MI, Hospital Financing Authority, | | | | | |
Revenue Bonds (MBIA), | | | | | |
5.38%, 7/1/19 | | 1,265 | | 1,308 | |
Sam Rayburn, TX, Municipal Power Agency, Revenue Bonds, | | | | | |
6.00%, 10/1/21 | | 650 | | 677 | |
San Antonio County, TX, Parking System | | | | | |
Revenue Bonds (AMBAC), | | | | | |
5.50%, 8/15/17 | | 700 | | 729 | |
Sanger, TX, Independent School District, | | | | | |
General Obligation Bonds (PSFG), | | | | | |
Zero Coupon, 2/15/19 - 2/15/22 | | 4,265 | | 2,376 | |
Santa Ana, CA, Unified School District, | | | | | |
General Obligation Bonds (FGIC), | | | | | |
Zero Coupon, 8/1/19 - 8/1/20 | | 5,475 | | 3,232 | |
Scranton-Lackawanna, PA, Health & Welfare Authority, | | | | | |
Revenue Bonds, | | | | | |
6.63%, 7/1/09 | | 35 | | 36 | |
Seminole County, FL, School Board, COP (AMBAC), | | | | | |
5.00%, 7/1/11 - 7/1/12 | | 6,750 | | 7,106 | |
Spokane County, WA, General Obligation Bonds (MBIA), | | | | | |
5.00%, 12/1/11 | | 1,000 | | 1,055 | |
Spring, TX, Independent School District, | | | | | |
General Obligation Bonds (PSFG), | | | | | |
5.00%, 8/15/19 | | 1,760 | | 1,830 | |
State of Nevada, General Obligation Bonds (FGIC), | | | | | |
5.00%, 12/1/11 - 12/1/13 | | 13,360 | | 14,211 | |
State of North Carolina, Revenue Bonds (MBIA), | | | | | |
5.00%, 3/1/13 - 3/1/14 | | 18,075 | | 19,411 | |
Steel Valley, PA, Allegheny County School District, | | | | | |
General Obligation Bonds, | | | | | |
Zero Coupon, 11/1/11 - 11/1/17 | | 1,820 | | 1,415 | |
Tallahassee Blueprint 2000 Intergovernmental Agency, | | | | | |
Revenue Bonds (MBIA), | | | | | |
5.00%, 10/1/11 - 10/1/14 | | 7,505 | | 7,960 | |
Texas State Turnpike Authority, Revenue Bonds (AMBAC), | | | | | |
Zero Coupon, 8/15/18 | | 5,700 | | 3,582 | |
Tobacco Securitization Authority of Northern California, | | | | | |
Asset Backed Revenue Bonds, Series A-1, | | | | | |
4.75%, 6/1/23 | | 5,975 | | 5,801 | |
Tobacco Settlement Authority of Washington, | | | | | |
Asset Backed Revenue Bonds, | | | | | |
6.50%, 6/1/26 | | 905 | | 950 | |
Tobacco Settlement Financing Corp., LA, | | | | | |
Asset Backed Revenue Bonds, | | | | | |
5.50%, 5/15/30 | | 1,350 | | 1,346 | |
Tobacco Settlement Financing Corp., NJ, | | | | | |
Asset Backed Revenue Bonds, | | | | | |
4.38%, 6/1/19 | | 325 | | 327 | |
The accompanying notes are an integral part of the financial statements.
135
2007 Annual Report
September 30, 2007
Portfolio of Investments (cont’d)
Municipal Portfolio
| | Face | | | |
| | Amount
(000) | | Value
(000) | |
Municipal Bonds (cont’d) | | | | | |
Tobacco Settlement Financing Corp., RI, | | | | | |
Asset Backed Revenue Bonds, | | | | | |
6.00%, 6/1/23 | | $ | 1,575 | | $ | 1,618 | |
Toledo-Lucas County, OH, Port Authority | | | | | |
Revenue Bonds, | | | | | |
6.45%, 12/15/21 | | 900 | | 1,023 | |
Tomball, TX, Independent School District, | | | | | |
General Obligation Bonds (PSFG), | | | | | |
4.75%, 2/15/15 | | 1,205 | | 1,240 | |
Union Elementary School District, CA, | | | | | |
General Obligation Bonds (MBIA), | | | | | |
Zero Coupon, 9/1/27 - 9/1/28 | | 8,000 | | 3,131 | |
University of Arkansas, Revenue Bonds (FSA), | | | | | |
4.90%, 12/1/19 | | 2,315 | | 2,434 | |
University of Massachusetts Building Authority, | | | | | |
Revenue Bonds (AMBAC), | | | | | |
5.25%, 11/1/11 | | 2,100 | | 2,237 | |
University of Southern Indiana, IN, | | | | | |
Revenue Bonds (AMBAC), | | | | | |
5.00%, 10/1/09 | | 1,095 | | 1,127 | |
University of Utah, COP, | | | | | |
General Obligation Bonds (AMBAC), | | | | | |
5.00%, 12/1/11 - 12/1/13 | | 4,040 | | 4,283 | |
Upper Darby Township, PA, | | | | | |
General Obligation Bonds (AMBAC), | | | | | |
Zero Coupon, 7/15/11 | | 525 | | 455 | |
Utah County, UT, Environmental Improvement | | | | | |
Revenue Bonds, | | | | | |
5.05%, 11/1/17 | | 170 | | 175 | |
Vancouver, WA, Water & Sewer Revenue Bonds (MBIA), | | | | | |
4.60%, 6/1/13 | | 1,000 | | 1,006 | |
Vermont Educational & Health Buildings Funding Agency, | | | | | |
SAVRS, Revenue Bonds (FGIC), | | | | | |
4.10%, 9/12/13 | | (h)4,300 | | 4,300 | |
Victor Elementary School District, CA, | | | | | |
General Obligation Bonds (FGIC), | | | | | |
Zero Coupon, 2/1/30 | | 2,100 | | 726 | |
Virginia State Peninsula Regional Jail Authority, | | | | | |
Revenue Bonds (MBIA), | | | | | |
5.00%, 10/1/12 - 10/1/13 | | 2,705 | | 2,882 | |
Waco, TX, Educational Finance Corp., | | | | | |
SAVRS, Revenue Bonds, | | | | | |
3.55%, 2/1/32 | | (h)12,000 | | 12,000 | |
Wake County Industrial Facilities & Pollution Control | | | | | |
Financing Authority, NC, Revenue Bonds (AMBAC), | | | | | |
3.89%, 5/1/24 | | (h)11,400 | | 11,400 | |
Warren, MI, Consolidated School District, | | | | | |
General Obligation Bonds, | | | | | |
4.15%, 5/1/14 | | 1,000 | | 1,022 | |
Washington State Health Care Facilities (Children’s Hospital), | | | | | |
Revenue Bonds (FSA), | | | | | |
4.70%, 10/1/11 | | 1,075 | | 1,097 | |
Washington State Health Care Facilities (Fred Hutchinson), | | | | | |
SAVRS, Revenue Bonds (AMBAC), | | | | | |
4.05%, 1/1/33 | | (h)14,900 | | 14,900 | |
Washington State Health Care Facilities Authority, | | | | | |
Revenue Bonds (AMBAC), | | | | | |
5.13%, 11/15/11 | | $ | 1,000 | | $ | 1,026 | |
Washington State Motor Vehicle Fuel Facilities, | | | | | |
General Obligation Bonds (AMBAC), | | | | | |
Zero Coupon, 6/1/14 - 6/1/16 | | 8,160 | | 6,048 | |
Washington State Recreational Facilities, | | | | | |
General Obligation Bonds (FGIC), | | | | | |
Zero Coupon, 1/1/17 | | 6,900 | | 4,696 | |
Washoe County, NV, General Obligation Bonds (FSA), | | | | | |
Zero Coupon, 7/1/18 | | 4,235 | | 2,670 | |
Wayne State University, MI, University | | | | | |
Revenue Bonds (FGIC), | | | | | |
4.02%, 11/15/33 | | (h)10,950 | | 10,950 | |
West Contra Costa Unified School District, CA, | | | | | |
General Obligation Bonds (FGIC), | | | | | |
Zero Coupon, 8/1/25 - 8/1/27 | | 23,200 | | 9,609 | |
West Ottawa Public School District, MI, | | | | | |
General Obligation Bonds, | | | | | |
5.00%, 5/1/21 | | 850 | | 904 | |
West Virginia School Building Authority (FGIC), | | | | | |
5.00%, 7/1/11 - 7/1/12 | | 8,135 | | 8,597 | |
West Virginia University Revenue Bonds (AMBAC), | | | | | |
Zero Coupon, 4/1/22 - 4/1/24 | | 2,000 | | 990 | |
Western Michigan University, MI, | | | | | |
SAVRS, Revenue Bonds (AMBAC), | | | | | |
3.94%, 11/15/32 | | (h)10,100 | | 10,100 | |
Westfield High School Building Corp, IN, | | | | | |
Revenue Bonds (FSA), | | | | | |
5.00%, 1/10/13 | | 1,285 | | 1,363 | |
Will County, IL, Community High School District No. 210, | | | | | |
Lincoln Way School Building, General Obligation Bonds (FGIC), | | | | | |
5.00%, 1/1/11 | | 1,155 | | 1,206 | |
William S Hart Union High School District, CA, | | | | | |
General Obligation Bonds (FSA), | | | | | |
Zero Coupon, 9/1/21 - 9/1/28 | | 18,290 | | 9,111 | |
Winnebago County, IL, School District, | | | | | |
General Obligation Bonds (FSA), | | | | | |
Zero Coupon, 1/1/14 | | 3,600 | | 2,818 | |
Wisconsin State Health & Educational Facilities Authority, | | | | | |
Revenue Bonds (AMBAC), | | | | | |
5.63%, 2/15/12 | | 1,000 | | 1,078 | |
York County, PA, Hospital Authority, SAVRS, | | | | | |
Revenue Bonds (AMBAC), | | | | | |
3.90%, 7/1/21 | | (h)4,950 | | 4,950 | |
Ypsilanti, MI, School District, | | | | | |
General Obligation Bonds (FGIC), | | | | | |
4.70%, 5/1/12 | | 1,115 | | 1,134 | |
| | | | 895,990 | |
Total Fixed Income Securities (Cost $922,982) | | | | 940,803 | |
| | No. of | | | |
| | Contracts | | | |
Put Options Purchased (0.0%) | | | | | |
90 Day EuroDollar | | | | | |
12/07 @ $94.75 | | (a)1,703 | | 181 | |
The accompanying notes are an integral part of the financial statements.
136
2007 Annual Report
September 30, 2007
Portfolio of Investments (cont’d)
Municipal Portfolio
| | No. of
Contracts | | Value
(000) | |
Put Options Purchased (cont’d) | | | | | |
3/08 @ $94.50 | | (a)497 | | $ | 21 | |
3/08 @ $94.75 | | (a)723 | | 68 | |
Total Put Options Purchased (Cost $557) | | | | 270 | |
| | | | | | |
| | Shares | | | |
Preferred Stocks (2.6%) | | | | | |
Finance (2.6%) | | | | | |
ABN AMRO North America Capital Funding Trust I | | (e)5,875 | | 6,211 | |
Federal Home Loan Mortgage Corp. | | 88,000 | | 4,356 | |
Goldman Sachs Group, Inc. | | 121,000 | | 2,916 | |
International Lease Finance Corp. | | 31 | | 3,125 | |
Pitney Bowes International Holdings, Inc. | | 34 | | 3,292 | |
U.S. Bancorp | | 178,000 | | 4,361 | |
Total Preferred Stocks (Cost $24,508) | | | | 24,261 | |
Short-Term Investments (2.5%) | | | | | |
Investment Companies (2.5%) | | | | | |
Dreyfus Tax Exempt Cash Management | | 11,590,857 | | 11,591 | |
Morgan Stanley Institutional Liquidity | | | | | |
Tax-Exempt Portfolio | | | | | |
— Institutional Class | | (p)12,492,620 | | 12,492 | |
Total Short-Term Investments (Cost $24,083) | | | | 24,083 | |
Total Investments (104.5%) (Cost $972,130) | | | | 989,417 | |
Liabilities in Excess of Other Assets (-4.5%) | | | | (42,839 | ) |
Net Assets (100%) | | | | $ | 946,578 | |
| | | | | | |
(a) | | Non-income producing security. |
(e) | | 144A security — Certain conditions for public sale may exist. Unless |
| | otherwise noted, these securities are deemed to be liquid. |
(h) | | Variable/Floating Rate Security — Interest rate changes on these |
| | instruments are based on changes in a designated base rate. The |
| | rates shown are those in effect on September 30, 2007. |
(p) | | See Note F within the Notes to Financial Statements regarding |
| | investment in Morgan Stanley Institutional Liquidity Government |
| | Portfolio — Institutional Class, Morgan Stanley Institutional Liquidity |
| | Money Market Portfolio — Institutional Class and/or Morgan Stanley |
| | Institutional Liquidity Tax-Exempt Portfolio — Institutional Class. |
AGC | | Assured Guaranty Corp. |
AMBAC | | Ambac Assurance Corp. |
COP | | Certificate of Participation |
FGIC | | Financial Guaranty Insurance Co. |
FHA | | Federal Housing Administration |
FSA | | Financial Security Assurance, Inc. |
Inv Fl | | Inverse Floating Rate — Interest rate fluctuates with an inverse |
| | relationship to an associated interest rate. Indicated rate is the |
| | effective rate at September 30, 2007. |
IO | | Interest Only |
MBIA | | MBIA Insurance Corp. |
PAC | | Planned Amortization Class |
PO | | Principal Only |
PSFG | | Permanent School Fund Guaranteed |
SAVRS | | Semi-Annual Variable Rate Security |
TOB | | Tender Option Bonds |
XLCA | | XL Capital Assurance |
Futures Contracts:
The Portfolio had the following futures contract(s) open at period end:
| | | | | | | | Net | |
| | | | | | | | Unrealized | |
| | Number | | | | | | Appreciation | |
| | of | | Value | | Expiration | | (Depreciation) | |
| | Contracts | | (000) | | Date | | (000) | |
Long: | | | | | | | | | |
U.S. Treasury | | | | | | | | | |
2 yr. Note | | 559 | | $ | 115,739 | | Dec-07 | | $ | 474 | |
U.S. Treasury | | | | | | | | | |
5 yr. Note | | 1,196 | | 128,009 | | Dec-07 | | 829 | |
10 yr. Swap | | 3,943 | | 418,389 | | Dec-07 | | (5,493 | ) |
| | | | | | | | | |
Short: | | | | | | | | | |
EuroDollar | | | | | | | | | |
CME | | 6 | | 1,427 | | Dec-07 | | (6 | ) |
| | | | | | | | | |
EuroDollar | | | | | | | | | |
CME | | 5 | | 1,194 | | Mar-08 | | (8 | ) |
| | | | | | | | | |
EuroDollar | | | | | | | | | |
CME | | 4 | | 957 | | Sep-08 | | (8 | ) |
| | | | | | | | | |
EuroDollar | | | | | | | | | |
CME | | 4 | | 957 | | Dec-08 | | (8 | ) |
| | | | | | | | | |
EuroDollar | | | | | | | | | |
CME | | 5 | | 1,195 | | Jun-08 | | (9 | ) |
| | | | | | | | | |
EuroDollar | | | | | | | | | |
CME | | 3 | | 717 | | Mar-09 | | (6 | ) |
| | | | | | | | | |
EuroDollar | | | | | | | | | |
CME | | 3 | | 716 | | Jun-09 | | (5 | ) |
| | | | | | | | | |
U.S. Treasury | | | | | | | | | |
10 yr. Note | | 2,629 | | 287 | | Dec-07 | | 340 | |
| | | | | | | | | |
U.S. Treasury | | | | | | | | | |
Long Bond | | 706 | | 78,609 | | Dec-07 | | 8 | |
| | | | | | | | $ | (3,892 | ) |
| | | | | | | | | | | |
CME Chicago Mercantile Exchange
The accompanying notes are an integral part of the financial statements.
137
2007 Annual Report
September 30, 2007
Portfolio of Investments (cont’d)
Municipal Portfolio
Credit Default Swap Contracts
The Portfolio had the following credit default swap agreement(s) open at period end:
| | | | | | | | | | Unrealized | |
| | | | Notional | | | | | | Appreciation | |
| | Buy/Sell | | Amount | | Pay/Receive | | Termination | | (Depreciation) | |
Swap Counterparty and Reference Obligation | | Protection | | (000) | | Fixed Rate | | Date | | (000) | |
JPMorgan Chase | | Buy | | $ | 710 | | 1.18 | % | 6/20/14 | | $ | 7 | |
Belo Corp., 8.00%, 11/1/08 | | | | | | | | | | | |
JPMorgan Chase | | Buy | | 2,050 | | 1.30 | | 6/20/14 | | 7 | |
Belo Corp., 8.00%, 11/1/08 | | | | | | | | | | | |
JPMorgan Chase | | Sell | | 1,000 | | 4.15 | | 12/20/10 | | 27 | |
General Motors Acceptance Corp., 6.88%, 8/28/12 | | | | | | | | | | | |
| | | | | | | | | | $ | 41 | |
| | | | | | | | | | | | | |
Zero Coupon Swap Contracts
The Portfolio had the following zero coupon swap agreement(s) open at period end:
| | | | | | | | Unrealized | |
| | Notional | | | | | | Appreciation | |
| | Amount | | | | Termination | | (Depreciation) | |
Swap Counterparty | | (000) | | Receive | | Date | | (000) | |
Bank of America | | $ | 7,550 | | 3 month LIBOR | | 2/15/22 | | $ | 312 | |
| | 21,400 | | 3 month LIBOR | | 5/16/22 | | 890 | |
Goldman Sachs | | 24,500 | | 3 month LIBOR | | 8/15/21 | | 1,146 | |
| | | | | | | | $ | 2,348 | |
| | | | | | | | | | | |
Interest Rate Swap Contracts
The Portfolio had the following interest rate swap agreement(s) open at period end:
| | | | | | | | | | | | Unrealized | |
| | | | | | | | | | Notional | | Appreciation | |
| | Floating Rate | | Pay/Receive | | Fixed | | Termination | | Amount | | (Depreciation) | |
Swap Counterparty | | Index | | Floating Rate | | Rate | | Date | | (000) | | (000) | |
Citigroup | | USD-BMA Municipal Swap Index | | Receive | | 3.97 | % | 3/16/27 | | $ | 35,000 | | $ | 783 | |
JPMorgan Chase | | 3 Month LIBOR | | Receive | | 5.62 | | 5/11/27 | | 84,000 | | 859 | |
| | USD-BMA Municipal Swap Index | | Receive | | 3.96 | | 11/7/21 | | 44,000 | | 21 | |
Lehman Brothers | | 3 Month LIBOR | | Pay | | 5.10 | | 2/2/15 | | 65,000 | | (111 | ) |
| | | | | | | | | | | | $ | 1,552 | |
| | | | | | | | | | | | | | | |
LIBOR — London Inter Bank Offer Rate
The accompanying notes are an integral part of the financial statements.
138
| 2007 Annual Report |
| |
| September 30, 2007 |
Statements of Assets and Liabilities
| | | | Equities | | Mid Cap | | U.S. Mid | |
| | Balanced | | Plus | | Growth | | Cap Value | |
| | Portfolio | | Portfolio | | Portfolio | | Portfolio | |
| | (000) | | (000) | | (000) | | (000) | |
Assets: | | | | | | | | | |
Investments in Securities of Unaffiliated Issuers, at Cost: | | $ | 262,634 | | $ | 24,823 | | $ | 2,370,955 | | $ | 153,933 | |
Investment in Security of Affiliated Issuer, at Cost: | | 48,557 | | 3,938 | | 166,488 | | 4,405 | |
Total Investments in Securities, at Cost: | | 311,191 | | 28,761 | | 2,537,443 | | 158,338 | |
Foreign Currency, at Cost: | | 697 | | — | | 1 | | — | |
Investments in Securities of Unaffiliated Issuers, at Value:(1) | | 316,827 | | 24,191 | | 3,028,132 | | 169,390 | |
Investments in Security of Affiliated Issuer, at Value: | | 48,557 | | 3,938 | | 166,488 | | 4,405 | |
Total Investments in Securities, at Value: | | 365,384 | | 28,129 | | 3,194,620 | | 173,795 | |
Foreign Currency, at Value: | | 702 | | — | | 1 | | — | |
Cash | | 17 | | 7 | | 1 | | 19 | |
Receivable for Delayed Delivery Commitments | | 6,769 | | 5,282 | | — | | — | |
Due from Broker | | 3,408 | | — | | — | | — | |
Receivable for Portfolio Shares Sold | | 1,395 | | — | | 12,804 | | 96 | |
Receivable for Investments Sold | | 277 | | 51 | | 55,345 | | 3,028 | |
Unrealized Appreciation on Swap Agreements | | 563 | | 99 | | — | | — | |
Unrealized Appreciation on Foreign Currency Exchange Contracts | | 100 | | — | | — | | — | |
Receivable from Affiliate | | 7 | | 1 | | 24 | | 3 | |
Dividends Receivable | | 170 | | — | | 981 | | 144 | |
Interest Receivable | | 763 | | 171 | | 478 | | 28 | |
OtherAssets | | 3 | | @— | | 22 | | 1 | |
Total Assets | | 379,558 | | 33,740 | | 3,264,276 | | 177,114 | |
Liabilities: | | | | | | | | | |
Collateral on Securities Loaned, at Value: | | 8,365 | | 38 | | — | | — | |
Payable for Delayed Delivery Commitments | | 20,282 | | 1,299 | | — | | — | |
Payable for Investments Purchased | | 1,905 | | — | | 86,340 | | 3,613 | |
Due To Broker | | — | | 120 | | — | | — | |
Unrealized Depreciation on Foreign Currency Exchange Contracts | | 31 | | — | | 2 | | — | |
Unrealized Depreciation on Swap Agreements | | 71 | | @— | | — | | — | |
Payable for Portfolio Shares Redeemed | | 1,224 | | — | | 6,056 | | 171 | |
Payable for Investment Advisory Fees | | 361 | | 15 | | 3,590 | | 308 | |
Payable for Administration Fees | | 21 | | 2 | | 195 | | 11 | |
Payable for Custodian Fees | | 25 | | 11 | | 49 | | 12 | |
Payable for Trustees’ Fees and Expenses | | 8 | | — | | 29 | | 24 | |
Payable for Securities Sold Short, at Value (Proceeds $3,979) | | — | | 3,953 | | — | | — | |
Payable for Shareholder Servicing Fees — Adviser Class | | 6 | | @— | | 292 | | 4 | |
Payable for Shareholder Servicing Fees — Investment Class | | 1 | | — | | — | | @— | |
Other Liabilities | | 86 | | 57 | | 301 | | 51 | |
Total Liabilities | | 32,386 | | 5,495 | | 96,854 | | 4,194 | |
Net Assets | | $ | 347,172 | | $ | 28,245 | | $ | 3,167,422 | | $ | 172,920 | |
Net Assets Consist Of: | | | | | | | | | |
Paid-in Capital | | $ | 313,594 | | $ | 26,215 | | $ | 2,970,468 | | $ | 295,716 | |
Undistributed (Distributions in Excess of) Net Investment Income | | 2,365 | | 503 | | 8,678 | | 932 | |
Accumulated Net Realized Gain (Loss) | | (24,051 | ) | 1,005 | | (468,903 | ) | (139,185 | ) |
Unrealized Appreciation (Depreciation) on: | | | | | | | | | |
Investments | | 54,193 | | (632 | ) | 657,177 | | 15,457 | |
Foreign Currency Exchange Contracts and Translations | | 68 | | — | | 2 | | — | |
Futures Contracts | | 511 | | 1,029 | | — | | — | |
Securities Sold Short | | — | | 26 | | — | | — | |
Swap Agreements | | 492 | | 99 | | — | | — | |
Net Assets | | $ | 347,172 | | $ | 28,245 | | $ | 3,167,422 | | $ | 172,920 | |
The accompanying notes are an integral part of the financial statements.
139
2007 Annual Report
September 30, 2007
Statements of Assets and Liabilities (cont’)
| | | | Equities | | Mid Cap | | U.S. Mid | |
| | Balanced | | Plus | | Growth | | Cap Value | |
| | Portfolio | | Portfolio | | Portfolio | | Portfolio | |
| | (000) | | (000) | | (000) | | (000) | |
INSTITUTIONAL CLASS: | | | | | | | | | |
Net Assets | | $ | 310,886 | | $ | 27,709 | | $ | 1,647,326 | | $ | 151,610 | |
Shares Outstanding (unlimited number of shares authorized, no par value) (not in 000) | | 21,156,352 | | 2,582,183 | | 48,910,108 | | 4,158,127 | |
Net Asset Value, Offering and Redemption Price Per Share | | $ | 14.69 | | $ | 10.73 | | $ | 33.68 | | $ | 36.46 | |
INVESTMENT CLASS: | | | | | | | | | |
Net Assets | | $ | 5,103 | | $ | — | | $ | — | | $ | 3,649 | |
Shares Outstanding (unlimited number of shares authorized, no par value) (not in 000) | | 347,882 | | — | | — | | 100,597 | |
Net Asset Value, Offering and Redemption Price Per Share | | $ | 14.67 | | $ | — | | $ | — | | $ | 36.27 | |
ADVISER CLASS: | | | | | | | | | |
Net Assets | | $ | 31,183 | | $ | 536 | | $ | 1,520,096 | | $ | 17,661 | |
Shares Outstanding (unlimited number of shares authorized, no par value) (not in 000) | | 2,126,469 | | 50,000 | | 46,366,170 | | 487,066 | |
Net Asset Value, Offering and Redemption Price Per Share | | $ | 14.66 | | $ | 10.72 | | $ | 32.78 | | $ | 36.26 | |
(1) Including: | | | | | | | | | |
Securities on Loan, at Value: | | $ | 23,249 | | $ | 37 | | $ | — | | $ | — | |
| | | | | | | | | | | | | |
@ Amount is less than $500.
The accompanying notes are an integral part of the financial statements.
140
| 2007 Annual Report |
| |
| September 30, 2007 |
Statements of Assets and Liabilities
| | U.S. Small | | | | Core Fixed | | Core Plus Fixed | |
| | Cap Value | | Value | | Income | | Income | |
| | Portfolio | | Portfolio | | Portfolio | | Portfolio | |
| | (000) | | (000) | | (000) | | (000) | |
Assets: | | | | | | | | | |
Investments in Securities of Unaffiliated Issuers, at Cost: | | $ | 679,789 | | $ | 510,065 | | $ | 346,157 | | $ | 2,995,352 | |
Investment in Security of Affiliated Issuer, at Cost: | | 47,310 | | 10,961 | | 32,976 | | 230,945 | |
Total Investments in Securities, at Cost: | | 727,099 | | 521,026 | | 379,133 | | 3,226,297 | |
Foreign Currency, at Cost: | | — | | — | | — | | @— | |
Investments in Securities of Unaffiliated Issuers, at Value:(1) | | 822,093 | | 578,081 | | 341,805 | | 2,944,108 | |
Investment in Security of Affiliated Issuer, at Value: | | 47,310 | | 10,961 | | 32,976 | | 230,945 | |
Total Investments in Securities, at Value: | | 869,403 | | 589,042 | | 374,781 | | 3,175,053 | |
Foreign Currency, at Value: | | — | | — | | — | | @— | |
Cash | | 1 | | 1 | | 6 | | 476 | |
Receivable for Portfolio Shares Sold | | 1,217 | | 4,948 | | 320 | | 6,417 | |
Receivable For Delayed Delivery Commitments | | — | | — | | 26,867 | | 238,336 | |
Interest Receivable | | 218 | | 58 | | 1,629 | | 16,334 | |
Unrealized Appreciation on Swap Agreements | | — | | — | | 2,370 | | 19,465 | |
Receivable for Investments Sold | | 4,267 | | 3,651 | | 337 | | 4,797 | |
Receivable from Affiliate | | 13 | | 4 | | 10 | | 57 | |
Dividends Receivable | | 700 | | 830 | | 8 | | 162 | |
OtherAssets | | 7 | | 6 | | 3 | | 26 | |
Total Assets | | 875,826 | | 598,540 | | 406,331 | | 3,461,123 | |
Liabilities: | | | | | | | | | |
Collateral on Securities Loaned, at Value: | | — | | 27,897 | | 4,165 | | 58,510 | |
Payable for Delayed Delivery Commitments | | — | | — | | 80,013 | | 719,748 | |
Payable for Investments Purchased | | 3,339 | | 945 | | — | | 3,977 | |
Unrealized Depreciation on Foreign Currency Exchange Contracts | | — | | — | | — | | 1,102 | |
Unrealized Depreciation on Swap Agreements | | — | | — | | 319 | | 2,807 | |
Due to Broker | | — | | — | | 1,107 | | 10,509 | |
Payable for Portfolio Shares Redeemed | | 1,056 | | 501 | | 418 | | 6,193 | |
Payable for Investment Advisory Fees | | 1,452 | | 720 | | 287 | | 2,183 | |
Payable for Administration Fees | | 56 | | 37 | | 21 | | 174 | |
Payable for Custodian Fees | | 18 | | 19 | | 10 | | 38 | |
Payable for Trustees’ Fees and Expenses | | 20 | | 27 | | 4 | | 94 | |
Payable for Shareholder Servicing Fees — Investment Class | | — | | 10 | | — | | 18 | |
Payable for Shareholder Servicing Fees — Adviser Class | | 11 | | 41 | | 2 | | 27 | |
Other Liabilities | | 161 | | 115 | | 69 | | 296 | |
Total Liabilities | | 6,113 | | 30,312 | | 86,415 | | 805,676 | |
Net Assets | | $ | 869,713 | | $ | 568,228 | | $ | 319,916 | | $ | 2,655,447 | |
Net Assets Consist Of: | | | | | | | | | |
Paid-in Capital | | $ | 641,749 | | $ | 469,777 | | $ | 320,395 | | $ | 2,756,523 | |
Undistributed (Distributions in Excess of) Net Investment Income | | 1,241 | | 3,298 | | 3,412 | | 7,928 | |
Accumulated Net Realized Gain (Loss) | | 84,419 | | 27,137 | | (2,504 | ) | (83,698 | ) |
Unrealized Appreciation (Depreciation) on: | | | | | | | | | |
Investments | | 142,304 | | 68,016 | | (4,352 | ) | (51,244 | ) |
Foreign Currency Exchange Contracts and Translations | | — | | — | | — | | (1,097 | ) |
Futures Contracts | | — | | — | | 914 | | 10,377 | |
Swap Agreements | | — | | — | | 2,051 | | 16,658 | |
Net Assets | | $ | 869,713 | | $ | 568,228 | | $ | 319,916 | | $ | 2,655,447 | |
The accompanying notes are an integral part of the financial statements.
141
2007 Annual Report
September 30, 2007
Statements of Assets and Liabilities (cont’d)
| | U.S. Small | | | | Core Fixed | | Core Plus Fixed | |
| | Cap Value | | Value | | Income | | Income | |
| | Portfolio | | Portfolio | | Portfolio | | Portfolio | |
| | (000) | | (000) | | (000) | | (000) | |
INSTITUTIONAL CLASS: | | | | | | | | | |
Net Assets | | $ | 810,194 | | $ | 285,533 | | $ | 308,111 | | $ | 2,367,043 | |
Shares Outstanding (unlimited number of shares authorized, no par value) (not in 000) | | 28,743,792 | | 15,467,590 | | 28,610,141 | | 207,720,472 | |
Net Asset Value, Offering and Redemption Price Per Share | | $ | 28.19 | | $ | 18.46 | | $ | 10.77 | | $ | 11.40 | |
INVESTMENT CLASS: | | | | | | | | | |
Net Assets | | $ | — | | $ | 82,941 | | $ | — | | $ | 150,671 | |
Shares Outstanding (unlimited number of shares authorized, no par value) (not in 000) | | — | | 4,486,451 | | — | | 13,226,291 | |
Net Asset Value, Offering and Redemption Price Per Share | | $ | — | | $ | 18.49 | | $ | — | | $ | 11.39 | |
ADVISER CLASS: | | | | | | | | | |
Net Assets | | $ | 59,519 | | $ | 199,754 | | $ | 11,805 | | $ | 137,733 | |
Shares Outstanding (unlimited number of shares authorized, no par value) (not in 000) | | 2,123,679 | | 10,836,853 | | 1,102,513 | | 12,103,031 | |
Net Asset Value, Offering and Redemption Price Per Share | | $ | 28.03 | | $ | 18.43 | | $ | 10.71 | | $ | 11.38 | |
(1) Including: | | | | | | | | | |
Securities on Loan, at Value: | | $ | — | | $ | 27,394 | | $ | 31,753 | | $ | 207,604 | |
| | | | | | | | | | | | | |
@ Amount is less than $500.
The accompanying notes are an integral part of the financial statements.
142
| 2007 Annual Report |
| |
| September 30, 2007 |
Statements of Assets and Liabilities
| | | | | | | | Investment | |
| | | | Intermediate | | International | | Grade Fixed | |
| | High Yield | | Duration | | Fixed Income | | Income | |
| | Portfolio | | Portfolio | | Portfolio | | Portfolio | |
| | (000) | | (000) | | (000) | | (000) | |
Assets: | | | | | | | | | |
Investments in Securities of Unaffiliated Issuers, at Cost: | | $ | 266,950 | | $ | 127,790 | | $ | 195,349 | | $ | 588,049 | |
Investment in Security of Affiliated Issuer, at Cost: | | 10,943 | | 27,993 | | 5,845 | | 31,654 | |
Total Investments in Securities, at Cost: | | 277,893 | | 155,783 | | 201,194 | | 619,703 | |
Foreign Currency, at Cost: | | @— | | — | | 362 | | — | |
Investments in Securities of Unaffiliated Issuers, at Value:(1) | | 229,880 | | 126,115 | | 204,219 | | 582,813 | |
Investment in Security of Affiliated Issuer, at Value: | | 10,943 | | 27,993 | | 5,845 | | 31,654 | |
Total Investments in Securities, at Value: | | 240,823 | | 154,108 | | 210,064 | | 614,467 | |
Foreign Currency, at Value: | | @— | | — | | 362 | | — | |
Cash | | 33 | | 122 | | @— | | 11 | |
Receivable for Delayed Delivery Commitments | | — | | — | | — | | 46,599 | |
Due from Broker | | — | | — | | 1,926 | �� | — | |
Interest Receivable | | 3,858 | | 793 | | 2,850 | | 2,672 | |
Unrealized Appreciation on Foreign Currency Exchange Contracts | | 36 | | — | | 2,552 | | — | |
Unrealized Appreciation on Swap Agreements | | 605 | | 782 | | — | | 3,894 | |
Receivable from Affiliate | | 2 | | 6 | | 1 | | 9 | |
Receivable for Investments Sold | | 535 | | 123 | | 5,582 | | 372 | |
Receivable for Portfolio Shares Sold | | 235 | | — | | 1,251 | | 887 | |
Dividends Receivable | | — | | 2 | | — | | 18 | |
OtherAssets | | 2 | | 1 | | 2 | | 5 | |
Total Assets | | 246,129 | | 155,937 | | 224,590 | | 668,934 | |
Liabilities: | | | | | | | | | |
Collateral on Securities Loaned, at Value: | | 42,093 | | — | | — | | 4,337 | |
Payable for Delayed Delivery Commitments | | — | | — | | — | | 138,560 | |
Payable for Investments Purchased | | — | | 1,978 | | 6,499 | | — | |
Due To Broker | | 347 | | 666 | | — | | 2,919 | |
Unrealized Depreciation on Foreign Currency Exchange Contracts | | 160 | | — | | 1,498 | | — | |
Unrealized Depreciation on Swap Agreements | | 29 | | 66 | | — | | 529 | |
Payable for Portfolio Shares Redeemed | | 215 | | 118 | | 1,665 | | 1,274 | |
Payable for Investment Advisory Fees | | 212 | | 142 | | 197 | | 488 | |
Payable for Administration Fees | | 13 | | 10 | | 14 | | 34 | |
Payable for Custodian Fees | | 9 | | 5 | | 28 | | 12 | |
Payable for Trustees’ Fees and Expenses | | 24 | | 2 | | 2 | | 15 | |
Payable for Shareholder Servicing Fees — Adviser Class | | 2 | | @— | | — | | @— | |
Payable for Shareholder Servicing Fees — Investment Class | | — | | 18 | | @— | | — | |
Other Liabilities | | 68 | | 60 | | 59 | | 85 | |
Total Liabilities | | 43,172 | | 3,065 | | 9,962 | | 148,253 | |
Net Assets | | $ | 202,957 | | $ | 152,872 | | $ | 214,628 | | $ | 520,681 | |
Net Assets Consist Of: | | | | | | | | | |
Paid-in Capital | | $ | 752,167 | | $ | 160,587 | | $ | 200,552 | | $ | 522,518 | |
Undistributed (Distributions in Excess of) Net Investment Income | | 4,499 | | 931 | | 3,878 | | 4,881 | |
Accumulated Net Realized Gain (Loss) | | (517,271 | ) | (8,109 | ) | 194 | | (6,103 | ) |
Unrealized Appreciation (Depreciation) on: | | | | | | | | | |
Investments | | (37,070 | ) | (1,675 | ) | 8,870 | | (5,236 | ) |
Foreign Currency Exchange Contracts and Translations | | (121 | ) | — | | 1,158 | | — | |
Futures Contracts | | 177 | | 422 | | (24 | ) | 1,256 | |
Swap Agreements | | 576 | | 716 | | — | | 3,365 | |
Net Assets | | $ | 202,957 | | $ | 152,872 | | $ | 214,628 | | $ | 520,681 | |
The accompanying notes are an integral part of the financial statements.
143
2007 Annual Report
September 30, 2007
Statements of Assets and Liabilities (cont’d)
| | | | | | | | Investment | |
| | | | Intermediate | | International | | Grade Fixed | |
| | High Yield | | Duration | | Fixed Income | | Income | |
| | Portfolio | | Portfolio | | Portfolio | | Portfolio | |
| | (000) | | (000) | | (000) | | (000) | |
INSTITUTIONAL CLASS: | | | | | | | | | |
Net Assets | | $ | 193,934 | | $ | 7,015 | | $ | 213,392 | | $ | 519,504 | |
Shares Outstanding (unlimited number of shares authorized, no par value) (not in 000) | | 18,362,585 | | 690,713 | | 19,450,707 | | 46,609,681 | |
Net Asset Value, Offering and Redemption Price Per Share | | $ | 10.56 | | $ | 10.16 | | $ | 10.97 | | $ | 11.15 | |
INVESTMENT CLASS: | | | | | | | | | |
Net Assets | | $ | — | | $ | 145,739 | | $ | — | | $ | — | |
Shares Outstanding (unlimited number of shares authorized, no par value) (not in 000) | | — | | 14,402,242 | | — | | — | |
Net Asset Value, Offering and Redemption Price Per Share | | $ | — | | $ | 10.12 | | $ | — | | $ | — | |
ADVISER CLASS: | | | | | | | | | |
Net Assets | | $ | 9,023 | | $ | 118 | | $ | 1,236 | | $ | 1,177 | |
Shares Outstanding (unlimited number of shares authorized, no par value) (not in 000) | | 851,311 | | 11,635 | | 111,589 | | 105,741 | |
Net Asset Value, Offering and Redemption Price Per Share | | $ | 10.60 | | $ | 10.16 | | $ | 11.08 | | $ | 11.14 | |
(1) Including: | | | | | | | | | |
Securities on Loan, at Value: | | $ | 41,597 | | $ | — | | $ | — | | $ | 48,038 | |
| | | | | | | | | | | | | |
@ Amount is less than $500.
The accompanying notes are an integral part of the financial statements.
144
| 2007 Annual Report |
| |
| September 30, 2007 |
Statements of Assets and Liabilities
| | Limited | | Long Duration | | | |
| | Duration | | Fixed Income | | Municipal | |
| | Portfolio | | Portfolio | | Portfolio | |
| | (000) | | (000) | | (000) | |
Assets: | | | | | | | |
Investments in Securities of Unaffiliated Issuers, at Cost: | | $ | 1,024,515 | | $ | 23,983 | | $ | 959,638 | |
Investments in Securities of Affiliated Issuer, at Cost: | | 65,597 | | 1,103 | | 12,492 | |
Total Investments in Securities, at Cost: | | 1,090,112 | | 25,086 | | 972,130 | |
Investments in Securities of Unaffiliated Issuers, at Value: | | 1,007,727 | | 24,363 | | 976,925 | |
Investments in Securities of Affiliated Issuer, at Value: | | 65,597 | | 1,103 | | 12,492 | |
Total Investments in Securities, at Value: | | 1,073,324 | | 25,466 | | 989,417 | |
Cash | | 218 | | — | | 4,095 | |
Receivable for Delayed Delivery Commitments | | — | | — | | 32,499 | |
Interest Receivable | | 5,424 | | 267 | | 6,914 | |
Unrealized Appreciation on Swap Agreements | | 2,772 | | 250 | | 4,052 | |
Receivable for Investments Sold | | 437 | | 521 | | 25 | |
Receivable for Portfolio Shares Sold | | 459 | | — | | 11,228 | |
Due from Broker | | — | | 6 | | — | |
Receivable from Affiliate | | 17 | | @— | | 5 | |
Due from Adviser | | — | | 3 | | — | |
Dividends Receivable | | 5 | | — | | 102 | |
OtherAssets | | 10 | | @— | | 7 | |
Total Assets | | 1,082,666 | | 26,513 | | 1,048,344 | |
Liabilities: | | | | | | | |
Payable for Delayed Delivery Commitments | | — | | — | | 53,110 | |
Payable for Investments Purchased | | 19,123 | | 613 | | 31,518 | |
Due to Broker | | 2,656 | | — | | 5,214 | |
Unrealized Depreciation on Swap Agreements | | 48 | | 21 | | 111 | |
Payable for Portfolio Shares Redeemed | | 591 | | — | | 10,806 | |
Payable for Investment Advisory Fees | | 805 | | — | | 832 | |
Payable for Administration Fees | | 70 | | 2 | | 61 | |
Payable for Custodian Fees | | 6 | | 6 | | 18 | |
Payable for Trustees’ Fees and Expenses | | 3 | | — | | 1 | |
Payable for Bank Overdraft | | — | | 5 | | — | |
Payable for Shareholder Servicing Fees — Adviser Class | | @— | | @— | | @— | |
Other Liabilities | | 193 | | 53 | | 95 | |
Total Liabilities | | 23,495 | | 700 | | 101,766 | |
Net Assets | | $ | 1,059,171 | | $ | 25,813 | | $ | 946,578 | |
Net Assets Consist Of: | | | | | | | |
Paid-in Capital | | $ | 1,091,460 | | $ | 24,911 | | $ | 918,622 | |
Undistributed (Distributions in Excess of) Net Investment Income | | 5,916 | | 367 | | 3,448 | |
Accumulated Net Realized Gain (Loss) | | (25,448 | ) | (94 | ) | 7,172 | |
Unrealized Appreciation (Depreciation) on: | | | | | | | |
Investments | | (16,788 | ) | 380 | | 17,287 | |
Futures Contracts | | 1,307 | | 20 | | (3,892 | ) |
Swap Agreements | | 2,724 | | 229 | | 3,941 | |
Net Assets | | $ | 1,059,171 | | $ | 25,813 | | $ | 946,578 | |
The accompanying notes are an integral part of the financial statements.
145
2007 Annual Report
September 30, 2007
Statements of Assets and Liabilities (cont’d)
| | Limited | | Long Duration | | | |
| | Duration | | Fixed Income | | Municipal | |
| | Portfolio | | Portfolio | | Portfolio | |
| | (000) | | (000) | | (000) | |
INSTITUTIONAL CLASS: | | | | | | | |
Net Assets | | $ | 1,058,151 | | $ | 25,297 | | $ | 936,633 | |
Shares Outstanding (unlimited number of shares authorized, no par value) (not in 000) | | 103,343,036 | | 2,450,000 | | 73,082,364 | |
Net Asset Value, Offering and Redemption Price Per Share | | $ | 10.24 | | $ | 10.33 | | $ | 12.82 | |
ADVISER CLASS: | | | | | | | |
Net Assets | | $ | 1,020 | | $ | 516 | | $ | 9,945 | |
Shares Outstanding (unlimited number of shares authorized, no par value) (not in 000) | | 99,592 | | 50,000 | | 775,545 | |
Net Asset Value, Offering and Redemption Price Per Share | | $ | 10.24 | | $ | 10.32 | | $ | 12.82 | |
@ Amount is less than $500.
The accompanying notes are an integral part of the financial statements.
146
| 2007 Annual Report |
| |
| September 30, 2007 |
Statements of Operations
For the Year Ended September 30, 2007
| | | | Equities | | Mid Cap | | U.S. Mid | | U.S. Small | |
| | Balanced | | Plus | | Growth | | Cap Value | | Cap Value | |
| | Portfolio | | Portfolio | | Portfolio | | Portfolio | | Portfolio | |
| | (000) | | (000) | | (000) | | (000) | | (000) | |
Investment Income: | | | | | | | | | | | |
Dividends from Securities of Unaffiliated Issuers† | | $ | 3,494 | | $ | — | | $ | 26,446 | | $ | 2,234 | | $ | 6,817 | |
Interest from Securities of Unaffiliated Issuers | | 5,176 | | 1,838 | | 1,604 | | 246 | | 1,216 | |
Interest from Security of Affiliated Issuer | | 675 | | 48 | | 1,620 | | 210 | | 1,012 | |
Total Investment Income | | 9,345 | | 1,886 | | 29,670 | | 2,690 | | 9,045 | |
Expenses: | | | | | | | | | | | |
Investment Advisory Fees (Note B) | | 1,417 | | 104 | | 12,353 | | 1,143 | | 5,599 | |
Administration Fees (Note C) | | 252 | | 22 | | 1,976 | | 127 | | 679 | |
Custodian Fees (Note E) | | 54 | | 22 | | 88 | | 25 | | 38 | |
Shareholder Reporting Fees | | 106 | | 2 | | 497 | | 19 | | 336 | |
Professional Fees | | 48 | | 51 | | 100 | | 30 | | 55 | |
Shareholder Servicing Fees — Investment Class Shares (Note D) | | 7 | | — | | — | | 5 | | — | |
Shareholder Servicing Fees — Adviser Class Shares (Note D) | | 78 | | 1 | | 2,997 | | 39 | | 110 | |
Transfer Agency Fees | | 13 | | 6 | | 39 | | 17 | | 12 | |
Trustees’ Fees and Expenses | | 7 | | 1 | | 41 | | 7 | | 16 | |
Proxy Fees | | 10 | | @— | | 353 | | 10 | | 321 | |
Registration Fees | | 31 | | 25 | | 133 | | 30 | | 58 | |
Other Expenses | | 15 | | 6 | | 71 | | 9 | | 30 | |
Total Expenses | | 2,038 | | 240 | | 18,648 | | 1,461 | | 7,254 | |
Waiver of Investment Advisory Fees (Note B) | | — | | (71 | ) | — | | — | | — | |
Rebate from Morgan Stanley Affiliated Cash Sweep (Note F) | | (13 | ) | (1 | ) | (32 | ) | (4 | ) | (20 | ) |
Expense Offset (Note E) | | (3 | ) | (2 | ) | (6 | ) | (1 | ) | (3 | ) |
Net Expenses | | 2,022 | | 166 | | 18,610 | | 1,456 | | 7,231 | |
Net Investment Income (Loss) | | 7,323 | | 1,720 | | 11,060 | | 1,234 | | 1,814 | |
Realized Gain (Loss): | | | | | | | | | | | |
Investments Sold | | 19,566 | | 161 | | 321,890 | | 33,174 | | 97,626 | |
Foreign Currency Transactions | | 263 | | — | | (85 | ) | — | | — | |
Futures Contracts | | 1,981 | | 2,182 | | — | | 103 | | — | |
Swap Agreements | | (89 | ) | (56 | ) | — | | — | | — | |
Net Realized Gain (Loss) | | 21,721 | | 2,287 | | 321,805 | | 33,277 | | 97,626 | |
Change in Unrealized Appreciation (Depreciation): | | | | | | | | | | | |
Investments | | 23,703 | | (625 | ) | 402,599 | | 762 | | 46,261 | |
Foreign Currency Exchange Contracts and Translations | | 174 | | — | | 2 | | — | | — | |
Futures Contracts | | 160 | | 462 | | — | | — | | — | |
Securities Sold Short | | — | | 36 | | — | | — | | — | |
Swap Agreements | | 475 | | 95 | | — | | — | | — | |
Net Change in Unrealized Appreciation (Depreciation) | | 24,512 | | (32 | ) | 402,601 | | 762 | | 46,261 | |
Total Net Realized Gain (Loss) and Change in Unrealized Appreciation (Depreciation) | | 46,233 | | 2,255 | | 724,406 | | 34,039 | | 143,887 | |
Net Increase (Decrease) in Net Assets Resulting from Operations | | $ | 53,556 | | $ | 3,975 | | $ | 735,466 | | $ | 35,273 | | $ | 145,701 | |
† | Net of $35, $382 and $53 Foreign Withholding Tax for the Balanced, Mid Cap Growth and U.S. Small Cap Value Portfolios, respectively. |
@ | Amount is less than $500. |
The accompanying notes are an integral part of the financial statements.
147
2007 Annual Report
September 30, 2007
Statements of Operations
For the Year Ended September 30, 2007
| | | | Core | | Core Plus | | | | | |
| | | | Fixed | | Fixed | | | | Intermediate | |
| | Value | | Income | | Income | | High Yield | | Duration | |
| | Portfolio | | Portfolio | | Portfolio | | Portfolio | | Portfolio | |
| | (000) | | (000) | | (000) | | (000) | | (000) | |
Investment Income: | | | | | | | | | | | |
Dividends from Securities of Unaffiliated Issuers† | | $ | 13,976 | | $ | 31 | | $ | 681 | | $ | 1 | | $ | 7 | |
Interest from Securities of Unaffiliated Issuers | | 676 | | 15,550 | | 139,126 | | 17,287 | | 7,291 | |
Interest from Security of Affiliated Issuer | | 373 | | 1,095 | | 6,494 | | 194 | | 407 | |
Total Investment Income | | 15,025 | | 16,676 | | 146,301 | | 17,482 | | 7,705 | |
Expenses: | | | | | | | | | | | |
Investment Advisory Fees (Note B) | | 2,970 | | 1,175 | | 8,675 | | 896 | | 549 | |
Administration Fees (Note C) | | 475 | | 251 | | 2,113 | | 171 | | 117 | |
Custodian Fees (Note E) | | 40 | | 21 | | 95 | | 22 | | 14 | |
Shareholder Reporting Fees | | 57 | | 85 | | 364 | | 114 | | 31 | |
Professional Fees | | 47 | | 38 | | 137 | | 48 | | 30 | |
Shareholder Servicing Fees — Investment Class Shares (Note D) | | 121 | | — | | 216 | | @— | | 207 | |
Shareholder Servicing Fees — Adviser Class Shares (Note D) | | 521 | | 26 | | 318 | | 14 | | @— | |
Transfer Agency Fees | | 20 | | 8 | | 26 | | 15 | | 6 | |
Trustees’ Fees and Expenses | | 14 | | 6 | | 62 | | 8 | | 3 | |
Proxy Fees | | 48 | | 73 | | 156 | | 137 | | 3 | |
Registration Fees | | 44 | | 39 | | 78 | | 33 | | 32 | |
Other Expenses | | 22 | | 15 | | 90 | | 11 | | 12 | |
Total Expenses | | 4,379 | | 1,737 | | 12,330 | | 1,469 | | 1,004 | |
Waiver of Investment Advisory Fees (Note B) | | — | | (141 | ) | — | | — | | — | |
Rebate from Morgan Stanley Affiliated Cash Sweep (Note F) | | (7 | ) | (22 | ) | (129 | ) | (4 | ) | (8 | ) |
Expense Offset (Note E) | | @— | | (3 | ) | (27 | ) | (4 | ) | (2 | ) |
Net Expenses | | 4,372 | | 1,571 | | 12,174 | | 1,461 | | 994 | |
Net Investment Income (Loss) | | 10,653 | | 15,105 | | 134,127 | | 16,021 | | 6,711 | |
Realized Gain (Loss): | | | | | | | | | | | |
Investments Sold | | 30,107 | | 1,763 | | 27,762 | | 3,503 | | (209 | ) |
Foreign Currency Transactions | | — | | — | | (683 | ) | 310 | | — | |
Futures Contracts | | — | | 548 | | (582 | ) | 132 | | 845 | |
Swap Agreements | | — | | (571 | ) | 379 | | (516 | ) | (375 | ) |
Net Realized Gain (Loss) | | 30,107 | | 1,740 | | 26,876 | | 3,429 | | 261 | |
Change in Unrealized Appreciation (Depreciation): | | | | | | | | | | | |
Investments | | 20,120 | | (3,301 | ) | (52,924 | ) | (4,252 | ) | (678 | ) |
Foreign Currency Exchange Contracts and Translations | | — | | — | | (1,095 | ) | (161 | ) | — | |
Futures Contracts | | — | | (793 | ) | 1,448 | | 256 | | (63 | ) |
Swap Agreements | | — | | 1,896 | | 13,376 | | 595 | | 722 | |
Net Change in Unrealized Appreciation (Depreciation) | | 20,120 | | (2,198 | ) | (39,195 | ) | (3,562 | ) | (19 | ) |
Total Net Realized Gain (Loss) and Change in Unrealized Appreciation (Depreciation) | | 50,227 | | (458 | ) | (12,319 | ) | (133 | ) | 242 | |
Net Increase (Decrease) in Net Assets Resulting from Operations | | $ | 60,880 | | $ | 14,647 | | $ | 121,808 | | $ | 15,888 | | $ | 6,953 | |
† | Net of $ @— Foreign Withholding Tax for the Core Plus Fixed Income Portfolio. |
@ | Amount is less than $500. |
The accompanying notes are an integral part of the financial statements.
148
| 2007 Annual Report |
| |
| September 30, 2007 |
Statements of Operations
For the Year Ended September 30, 2007
| | | | | | | | Long | | | |
| | | | Investment | | | | Duration | | | |
| | International | | Grade Fixed | | Limited | | Fixed | | | |
| | Fixed Income | | Income | | Duration | | Income | | Municipal | |
| | Portfolio | | Portfolio | | Portfolio | | Portfolio | | Portfolio | |
| | (000) | | (000) | | (000) | | (000) | | (000) | |
Investment Income: | | | | | | | | | | | |
Dividends from Securities of Unaffiliated Issuers† | | $ | @— | | $ | 75 | | $ | 19 | | $ | — | | $ | 1,797 | |
Interest from Securities of Unaffiliated Issuers | | 6,501 | | 26,053 | | 56,243 | | 1,336 | | 31,431 | |
Interest from Security of Affiliated Issuer | | 173 | | 1,052 | | 1,317 | | 9 | | 269 | |
Total Investment Income | | 6,674 | | 27,180 | | 57,579 | | 1,345 | | 33,497 | |
Expenses: | | | | | | | | | | | |
Investment Advisory Fees (Note B) | | 768 | | 1,944 | | 3,202 | | 96 | | 2,924 | |
Administration Fees (Note C) | | 164 | | 414 | | 854 | | 21 | | 623 | |
Custodian Fees (Note E) | | 53 | | 27 | | 27 | | 11 | | 34 | |
Shareholder Reporting Fees | | 59 | | 83 | | 235 | | 39 | | 117 | |
Professional Fees | | 42 | | 44 | | 68 | | 37 | | 56 | |
Shareholder Servicing Fees — Adviser Class Shares (Note D) | | @— | | 2 | | @— | | 1 | | @— | |
Transfer Agency Fees | | 7 | | 11 | | 6 | | 6 | | 9 | |
Trustees’ Fees and Expenses | | 4 | | 12 | | 17 | | 1 | | 13 | |
Proxy Fees | | 90 | | 30 | | 233 | | @— | | 21 | |
Registration Fees | | 38 | | 36 | | 114 | | 23 | | 82 | |
Other Expenses | | 10 | | 21 | | 44 | | 7 | | 33 | |
Total Expenses | | 1,235 | | 2,624 | | 4,800 | | 242 | | 3,912 | |
Waiver of Investment Advisory Fees (Note B) | | — | | — | | — | | (96 | ) | (9 | ) |
Expenses Reimbursed by the Adviser (Note B) | | — | | — | | — | | (14 | ) | — | |
Waiver of Shareholder Servicing Fees - Adviser Class Shares (Note D) | | — | | (1 | ) | — | | — | | — | |
Rebate from Morgan Stanley Affiliated Cash Sweep (Note F) | | (3 | ) | (21 | ) | (26 | ) | @— | | (6 | ) |
Expense Offset (Note E) | | @— | | (5 | ) | (12 | ) | (2 | ) | (6 | ) |
Net Expenses | | 1,232 | | 2,597 | | 4,762 | | 130 | | 3,891 | |
Net Investment Income (Loss) | | 5,442 | | 24,583 | | 52,817 | | 1,215 | | 29,606 | |
Realized Gain (Loss): | | | | | | | | | | | |
Investments Sold | | 386 | | 1,833 | | (1,921 | ) | 212 | | 3,203 | |
Foreign Currency Transactions | | 2,813 | | — | | — | | — | | — | |
Futures Contracts | | 97 | | 939 | | 1,318 | | (198 | ) | 5,025 | |
Swap Agreements | | — | | (41 | ) | (2,358 | ) | (118 | ) | 5,791 | |
Net Realized Gain (Loss) | | 3,296 | | 2,731 | | (2,961 | ) | (104 | ) | 14,019 | |
Change in Unrealized Appreciation (Depreciation): | | | | | | | | | | | |
Investments | | 7,571 | | (4,036 | ) | (10,476 | ) | (594 | ) | (8,940 | ) |
Foreign Currency Exchange Contracts and Translations | | 1,348 | | — | | — | | — | | — | |
Futures Contracts | | (24 | ) | (1,450 | ) | 1,948 | | 16 | | (5,760 | ) |
Securities Sold Short | | — | | — | | — | | — | | 105 | |
Swap Agreements | | — | | 2,866 | | 3,258 | | 229 | | 1,217 | |
Net Change in Unrealized Appreciation (Depreciation) | | 8,895 | | (2,620 | ) | (5,270 | ) | (349 | ) | (13,378 | ) |
Total Net Realized Gain (Loss) and Change in Unrealized Appreciation (Depreciation) | | 12,191 | | 111 | | (8,231 | ) | (453 | ) | 641 | |
Net Increase (Decrease) in Net Assets Resulting from Operations | | $ | 17,633 | | $ | 24,694 | | $ | 44,586 | | $ | 762 | | $ | 30,247 | |
† | Net of $3 Foreign Withholding Tax for the International Fixed Income Portfolio. |
@ | Amount is less than $500. |
The accompanying notes are an integral part of the financial statements.
149
2007 Annual Report | |
| |
September 30, 2007 | |
Statements of Changes in Net Assets
| | Balanced
Portfolio | | Equities Plus
Portfolio | | Mid Cap Growth
Portfolio | |
| | Year Ended | | Year Ended | | Year Ended | | Period Ended | | Year Ended | | Year Ended | |
| | September
30, 2007 | | September
30, 2006 | | September
30, 2007 | | September
30, 2006^ | | September
30, 2007 | | September
30, 2006 | |
| | (000) | | (000) | | (000) | | (000) | | (000) | | (000) | |
Increase (Decrease) in Net Assets | | | | | | | | | | | | | |
Operations: | | | | | | | | | | | | | |
Net Investment Income (Loss) | | $ | 7,323 | | $ | 5,769 | | $ | 1,720 | | $ | 535 | | $ | 11,060 | | $ | 4,667 | |
Net Realized Gain (Loss) | | 21,721 | | 24,876 | | 2,287 | | (308 | ) | 321,805 | | 150,838 | |
Net Change in Unrealized Appreciation (Depreciation) | | 24,512 | | (7,443 | ) | (32 | ) | 562 | | 402,601 | | (34,400 | ) |
Net Increase (Decrease) in Net Assets Resulting from Operations | | 53,556 | | 23,202 | | 3,975 | | 789 | | 735,466 | | 121,105 | |
Distributions from and/or in Excess of: | | | | | | | | | | | | | |
Institutional Class: | | | | | | | | | | | | | |
Net Investment Income | | (5,256 | ) | (5,898 | ) | (1,664 | ) | (147 | ) | (4,826 | ) | — | |
Net Realized Gain | | — | | — | | (919 | ) | — | | — | | — | |
Investment Class: | | | | | | | | | | | | | |
Net Investment Income | | (79 | ) | (86 | ) | — | | — | | — | | — | |
Adviser Class: | | | | | | | | | | | | | |
Net Investment Income | | (570 | ) | (761 | ) | (31 | ) | (3 | ) | (2,109 | ) | — | |
Net Realized Gain | | — | | — | | (18 | ) | — | | — | | — | |
Total Distributions | | (5,905 | ) | (6,745 | ) | (2,632 | ) | (150 | ) | (6,935 | ) | — | |
Capital Share Transactions:(1) | | | | | | | | | | | | | |
Institutional Class: | | | | | | | | | | | | | |
Subscribed | | 77,419 | | 91,029 | | 1,548 | | 25,465 | | 481,835 | | 493,188 | |
Distributions Reinvested | | 5,249 | | 5,886 | | 119 | | — | | 4,628 | | — | |
Redeemed | | (70,685 | ) | (91,232 | ) | (1,369 | ) | — | | (215,062 | ) | (303,382 | ) |
Investment Class: | | | | | | | | | | | | | |
Subscribed | | 227 | | 216 | | — | | — | | — | | — | |
Distributions Reinvested | | 79 | | 86 | | — | | — | | — | | — | |
Redeemed | | — | | (127 | ) | — | | — | | — | | — | |
Adviser Class: | | | | | | | | | | | | | |
Subscribed | | 3,482 | | 5,388 | | @— | | 500 | | 530,183 | | 459,373 | |
Distributions Reinvested | | 570 | | 762 | | — | | — | | 2,084 | | — | |
Redeemed | | (14,546 | ) | (9,038 | ) | @— | | — | | (386,812 | ) | (440,176 | ) |
Net Increase (Decrease) in Net Assets Resulting from Capital Share Transactions | | 1,795 | | 2,970 | | 298 | | 25,965 | | 416,856 | | 209,003 | |
Redemption Fees | | @— | | @— | | — | | — | | 29 | | 19 | |
Total Increase (Decrease) in Net Assets | | 49,446 | | 19,427 | | 1,641 | | 26,604 | | 1,145,416 | | 330,127 | |
Net Assets: | | | | | | | | | | | | | |
Beginning of Period | | 297,726 | | 278,299 | | 26,604 | | — | | 2,022,006 | | 1,691,879 | |
End of Period | | $ | 347,172 | | $ | 297,726 | | $ | 28,245 | | $ | 26,604 | | $ | 3,167,422 | | $ | 2,022,006 | |
Undistributed (Distributions in Excess of) Net Investment Income Included in End of Period Net Assets | | $ | 2,365 | | $ | 1,510 | | $ | 503 | | $ | 417 | | $ | 8,678 | | $ | 4,640 | |
The accompanying notes are an integral part of the financial statements.
150
| 2007 Annual Report |
| |
| September 30, 2007 |
Statements of Changes in Net Assets (cont’d)
| | | Balanced
Portfolio | | Equities Plus
Portfolio | | Mid Cap Growth
Portfolio | |
| | | Year Ended | | Year Ended | | Year Ended | | Period Ended | | Year Ended | | Year Ended | |
| | | September | | September | | September | | September | | September | | September | |
| | | 30, 2007 | | 30, 2006 | | 30, 2007 | | 30, 2006^ | | 30, 2007 | | 30, 2006 | |
| | | (000) | | (000) | | (000) | | (000) | | (000) | | (000) | |
(1) | Capital Share Transactions: | | | | | | | | | | | | | |
| Institutional Class: | | | | | | | | | | | | | |
| Shares Subscribed | | 5,641 | | 7,514 | | 147 | | 2,552 | | 16,515 | | 19,562 | |
| Shares Issued on Distributions Reinvested | | 396 | | 484 | | 12 | | — | | 170 | | — | |
| Shares Redeemed | | (5,202 | ) | (7,485 | ) | (129 | ) | — | | (7,503 | ) | (11,916 | ) |
| Net Increase (Decrease) in Institutional Class Shares Outstanding | | 835 | | 513 | | 30 | | 2,552 | | 9,182 | | 7,646 | |
| Investment Class: | | | | | | | | | | | | | |
| Shares Subscribed | | 17 | | 18 | | — | | — | | — | | — | |
| Shares Issued on Distributions Reinvested | | 6 | | 7 | | — | | — | | — | | — | |
| Shares Redeemed | | — | | (10 | ) | — | | — | | — | | — | |
| Net Increase (Decrease) in Investment Class Shares Outstanding | | 23 | | 15 | | — | | — | | — | | — | |
| Adviser Class: | | | | | | | | | | | | | |
| Shares Subscribed | | 257 | | 442 | | @— | | 50 | | 18,457 | | 18,713 | |
| Shares Issued on Distributions Reinvested | | 43 | | 63 | | — | | — | | 79 | | — | |
| Shares Redeemed | | (1,098 | ) | (756 | ) | @— | | — | | (13,766 | ) | (17,884 | ) |
| Net Increase (Decrease) in Adviser Class Shares Outstanding | | (798 | ) | (251 | ) | — | | 50 | | 4,770 | | 829 | |
^ | | Equities Plus Portfolio commenced operations on April 26, 2006. |
@ | | Amount/Shares is less than 500. |
The accompanying notes are an integral part of the financial statements.
151
2007 Annual Report | |
| |
September 30, 2007 | |
Statements of Changes in Net Assets
| | U.S. Mid Cap Value
Portfolio | | U.S. Small Cap Value
Portfolio | | Value
Portfolio | |
| | Year Ended | | Year Ended | | Year Ended | | Year Ended | | Year Ended | | Year Ended | |
| | September | | September | | September | | September | | September | | September | |
| | 30, 2007 | | 30, 2006 | | 30, 2007 | | 30, 2006 | | 30, 2007 | | 30, 2006 | |
| | (000) | | (000) | | (000) | | (000) | | (000) | | (000) | |
Increase (Decrease) in Net Assets | | | | | | | | | | | | | |
Operations: | | | | | | | | | | | | | |
Net Investment Income (Loss) | | $ | 1,234 | | $ | 967 | | $ | 1,814 | | $ | 2,382 | | $ | 10,653 | | $ | 14,992 | |
Net Realized Gain (Loss) | | 33,277 | | 22,333 | | 97,626 | | 70,110 | | 30,107 | | 150,265 | |
Net Change in Unrealized Appreciation (Depreciation) | | 762 | | (4,622 | ) | 46,261 | | 24,779 | | 20,120 | | (54,946 | ) |
Net Increase (Decrease) in Net Assets Resulting from Operations | | 35,273 | | 18,678 | | 145,701 | | 97,271 | | 60,880 | | 110,311 | |
Distributions from and/or in Excess of: | | | | | | | | | | | | | |
Institutional Class: | | | | | | | | | | | | | |
Net Investment Income | | (909 | ) | (935 | ) | (2,134 | ) | (4,962 | ) | (6,009 | ) | (6,240 | ) |
Net Realized Gain | | — | | — | | (78,066 | ) | (32,618 | ) | (28,754 | ) | (21,707 | ) |
Investment Class: | | | | | | | | | | | | | |
Net Investment Income | | (15 | ) | (36 | ) | — | | — | | (1,395 | ) | (1,159 | ) |
Net Realized Gain | | — | | — | | — | | — | | (7,060 | ) | (4,260 | ) |
Adviser Class: | | | | | | | | | | | | | |
Net Investment Income | | (68 | ) | (106 | ) | (17 | ) | (105 | ) | (3,507 | ) | (13,749 | ) |
Net Realized Gain | | — | | — | | (2,990 | ) | (1,102 | ) | (18,579 | ) | (79,388 | ) |
Total Distributions | | (992 | ) | (1,077 | ) | (83,207 | ) | (38,787 | ) | (65,304 | ) | (126,503 | ) |
Capital Share Transactions:(1) | | | | | | | | | | | | | |
Institutional Class: | | | | | | | | | | | | | |
Subscribed | | 31,116 | | 35,071 | | 96,672 | | 423,362 | | 52,456 | | 60,716 | |
Distributions Reinvested | | 871 | | 903 | | 79,964 | | 37,251 | | 29,227 | | 23,658 | |
Redeemed | | (28,642 | ) | (60,948 | ) | (142,380 | ) | (156,849 | ) | (101,463 | ) | (83,459 | ) |
Investment Class: | | | | | | | | | | | | | |
Subscribed | | 781 | | 1,871 | | — | | — | | 21,832 | | 11,824 | |
Distributed Reinvested | | 14 | | 35 | | — | | — | | 8,455 | | 5,419 | |
Redeemed | | (420 | ) | (5,609 | ) | — | | — | | (12,859 | ) | (11,982 | ) |
Adviser Class: | | | | | | | | | | | | | |
Subscribed | | 6,308 | | 5,771 | | 35,582 | | 5,575 | | 28,458 | | 47,095 | |
Distributions Reinvested | | 67 | | 104 | | 3,006 | | 1,207 | | 21,997 | | 93,062 | |
Redeemed | | (5,194 | ) | (20,701 | ) | (8,277 | ) | (7,929 | ) | (36,838 | ) | (1,033,702 | ) |
Net Increase (Decrease) in Net Assets Resulting from Capital Share Transactions | | 4,901 | | (43,503 | ) | 64,567 | | 302,617 | | 11,265 | | (887,369 | ) |
Redemption Fees | | 1 | | 1 | | 16 | | 4 | | 4 | | 8 | |
Total Increase (Decrease) in Net Assets | | 39,183 | | (25,901 | ) | 127,077 | | 361,105 | | 6,845 | | (903,553 | ) |
Net Assets: | | | | | | | | | | | | | |
Beginning of Period | | 133,737 | | 159,638 | | 742,636 | | 381,531 | | 561,383 | | 1,464,936 | |
End of Period | | $ | 172,920 | | $ | 133,737 | | $ | 869,713 | | $ | 742,636 | | $ | 568,228 | | $ | 561,383 | |
Undistributed (Distributions in Excess of) Net Investment Income Included in End of Period Net Assets | | $ | 932 | | $ | 690 | | $ | 1,241 | | $ | 1,936 | | $ | 3,298 | | $ | 3,556 | |
The accompanying notes are an integral part of the financial statements.
152
| 2007 Annual Report |
| |
| September 30, 2007 |
Statements of Changes in Net Assets (cont’d)
| | | | U.S. Mid Cap Value | | U.S. Small Cap Value | | Value | |
| | | | Portfolio | | Portfolio | | Portfolio | |
| | | | Year Ended | | Year Ended | | Year Ended | | Year Ended | | Year Ended | | Year Ended | |
| | | | September | | September | | September | | September | | September | | September | |
| | | | 30, 2007 | | 30, 2006 | | 30, 2007 | | 30, 2006 | | 30, 2007 | | 30, 2006 | |
| | | | (000) | | (000) | | (000) | | (000) | | (000) | | (000) | |
(1) | | Capital Share Transactions: | | | | | | | | | | | | | |
| | Institutional Class: | | | | | | | | | | | | | |
| | Shares Subscribed | | 917 | | 1,292 | | 3,507 | | 17,434 | | 2,850 | | 3,403 | |
| | Shares Issued on Distributions Reinvested | | 27 | | 34 | | 3,048 | | 1,576 | | 1,636 | | 1,362 | |
| | Shares Redeemed | | (842 | ) | (2,264 | ) | (5,128 | ) | (6,266 | ) | (5,481 | ) | (4,706 | ) |
| | Net Increase (Decrease) in Institutional Class Shares Outstanding | | 102 | | (938 | ) | 1,427 | | 12,744 | | (995 | ) | 59 | |
| | Investment Class: | | | | | | | | | | | | | |
| | Shares Subscribed | | 23 | | 72 | | — | | — | | 1,167 | | 663 | |
| | Shares Issued on Distributions Reinvested | | 1 | | 1 | | — | | — | | 472 | | 312 | |
| | Shares Redeemed | | (12 | ) | (204 | ) | — | | — | | (701 | ) | (678 | ) |
| | Net Increase (Decrease) in Investment Class Shares Outstanding | | 12 | | (131 | ) | — | | — | | 938 | | 297 | |
| | Adviser Class: | | | | | | | | | | | | | |
| | Shares Subscribed | | 186 | | 216 | | 1,294 | | 221 | | 1,535 | | 2,627 | |
| | Shares Issued on Distributions Reinvested | | 2 | | 4 | | 115 | | 51 | | 1,232 | | 5,371 | |
| | Shares Redeemed | | (155 | ) | (784 | ) | (298 | ) | (324 | ) | (1,998 | ) | (60,250 | ) |
| | Net Increase (Decrease) in Adviser Class Shares Outstanding | | 33 | | (564 | ) | 1,111 | | (52 | ) | 769 | | (52,252 | ) |
The accompanying notes are an integral part of the financial statements.
153
2007 Annual Report | |
| |
September 30, 2007 | |
Statements of Changes in Net Assets
| | Core Fixed | | Core Plus Fixed | | High Yield | |
| | Income Portfolio | | Income Portfolio | | Portfolio | |
| | Year Ended | | Year Ended | | Year Ended | | Year Ended | | Year Ended | | Year Ended | |
| | September | | September | | September | | September | | September | | September | |
| | 30, 2007 | | 30, 2006 | | 30, 2007 | | 30, 2006 | | 30, 2007 | | 30, 2006 | |
| | (000) | | (000) | | (000) | | (000) | | (000) | | (000) | |
Increase (Decrease) in Net Assets | | | | | | | | | | | | | |
Operations: | | | | | | | | | | | | | |
Net Investment Income (Loss) | | $ | 15,105 | | $ | 8,949 | | $ | 134,127 | | $ | 106,191 | | $ | 16,021 | | $ | 16,593 | |
Net Realized Gain (Loss) | | 1,740 | | 1,483 | | 26,876 | | 13,012 | | 3,429 | | (4,637 | ) |
Net Change in Unrealized Appreciation (Depreciation) | | (2,198 | ) | (156 | ) | (39,195 | ) | (19,741 | ) | (3,562 | ) | 1,683 | |
Net Increase (Decrease) in Net Assets Resulting from Operations | | 14,647 | | 10,276 | | 121,808 | | 99,462 | | 15,888 | | 13,639 | |
Distributions from and/or in Excess of: | | | | | | | | | | | | | |
Institutional Class: | | | | | | | | | | | | | |
Net Investment Income | | (14,770 | ) | (11,417 | ) | (133,961 | ) | (115,657 | ) | (16,292 | ) | (16,732 | ) |
Net Realized Gain | | — | | (2,265 | ) | — | | — | | — | | — | |
Investment Class: | | | | | | | | | | | | | |
Net Investment Income | | — | | — | | (7,932 | ) | (15,864 | ) | — | | (20 | ) |
Adviser Class: | | | | | | | | | | | | | |
Net Investment Income | | (485 | ) | (486 | ) | (6,885 | ) | (6,254 | ) | (336 | ) | (408 | ) |
Net Realized Gain | | — | | (102 | ) | — | | — | | — | | — | |
Total Distributions | | (15,255 | ) | (14,270 | ) | (148,778 | ) | (137,775 | ) | (16,628 | ) | (17,160 | ) |
Capital Share Transactions:(1) | | | | | | | | | | | | | |
Institutional Class: | | | | | | | | | | | | | |
Subscribed | | 41,762 | | 130,146 | | 438,720 | | 502,531 | | 20,986 | | 95,830 | |
Distributions Reinvested | | 14,751 | | 13,660 | | 122,810 | | 106,805 | | 15,674 | | 16,107 | |
Redeemed | | (47,805 | ) | (60,428 | ) | (484,513 | ) | (371,452 | ) | (68,050 | ) | (78,251 | ) |
Investment Class**: | | | | | | | | | | | | | |
Subscribed | | — | | — | | 11,086 | | 100,710 | | — | | 3,434 | |
Distributions Reinvested | | — | | — | | 7,922 | | 15,855 | | — | | 20 | |
Redeemed | | — | | — | | (9,737 | ) | (273,854 | ) | (897 | ) | (3,788 | ) |
Adviser Class: | | | | | | | | | | | | | |
Subscribed | | 4,246 | | 1,860 | | 28,336 | | 28,690 | | 9,539 | | 4,975 | |
Distributions Reinvested | | 485 | | 588 | | 6,837 | | 6,189 | | 289 | | 377 | |
Redeemed | | (2,725 | ) | (2,327 | ) | (22,769 | ) | (19,359 | ) | (5,294 | ) | (7,155 | ) |
Net Increase (Decrease) in Net Assets Resulting from Capital Share Transactions | | 10,714 | | 83,499 | | 98,692 | | 96,115 | | (27,753 | ) | 31,549 | |
Redemption Fees | | 1 | | @— | | @— | | 6 | | 1 | | @— | |
Total Increase (Decrease) in Net Assets | | 10,107 | | 79,505 | | 71,722 | | 57,808 | | (28,492 | ) | 28,028 | |
Net Assets: | | | | | | | | | | | | | |
Beginning of Period | | 309,809 | | 230,304 | | 2,583,725 | | 2,525,917 | | 231,449 | | 203,421 | |
End of Period | | $ | 319,916 | | $ | 309,809 | | $ | 2,655,447 | | $ | 2,583,725 | | $ | 202,957 | | $ | 231,449 | |
Undistributed (Distributions in Excess of) Net Investment Income Included in End of Period Net Assets | | $ | 3,412 | | $ | 3,665 | | $ | 7,928 | | $ | 34,506 | | $ | 4,499 | | $ | 4,746 | |
The accompanying notes are an integral part of the financial statements.
154
| 2007 Annual Report |
| |
| September 30, 2007 |
Statements of Changes in Net Assets (cont’d)
| | | | Core Fixed | | Core Plus Fixed | | High Yield | |
| | | | Income Portfolio | | Income Portfolio | | Portfolio | |
| | | | Year Ended | | Year Ended | | Year Ended | | Year Ended | | Year Ended | | Year Ended | |
| | | | September | | September | | September | | September | | September | | September | |
| | | | 30, 2007 | | 30, 2006 | | 30, 2007 | | 30, 2006 | | 30, 2007 | | 30, 2006 | |
| | | | (000) | | (000) | | (000) | | (000) | | (000) | | (000) | |
(1) | | Capital Share Transactions†: | | | | | | | | | | | | | |
| | Institutional Class: | | | | | | | | | | | | | |
| | Shares Subscribed | | 3,916 | | 12,248 | | 38,659 | | 44,104 | | 1,969 | | 9,113 | |
| | Shares Issued on Distributions Reinvested | | 1,388 | | 1,277 | | 10,875 | | 9,394 | | 1,496 | | 1,550 | |
| | Shares Redeemed | | (4,477 | ) | (5,614 | ) | (42,714 | ) | (32,539 | ) | (6,427 | ) | (7,472 | ) |
| | Net Increase (Decrease) in Institutional Class Shares Outstanding | | 827 | | 7,911 | | 6,820 | | 20,959 | | (2,962 | ) | 3,191 | |
| | Investment Class**: | | | | | | | | | | | | | |
| | Shares Subscribed | | — | | — | | 965 | | 8,779 | | — | | 325 | |
| | Shares Issued on Distributions Reinvested | | — | | — | | 701 | | 1,391 | | — | | 2 | |
| | Shares Redeemed | | — | | — | | (858 | ) | (24,341 | ) | (83 | ) | (353 | ) |
| | Net Increase (Decrease) in Investment Class Shares Outstanding | | — | | — | | 808 | | (14,171 | ) | (83 | ) | (26 | ) |
| | Adviser Class: | | | | | | | | | | | | | |
| | Shares Subscribed | | 400 | | 174 | | 2,496 | | 2,508 | | 906 | | 471 | |
| | Shares Issued on Distributions Reinvested | | 46 | | 55 | | 606 | | 545 | | 28 | | 36 | |
| | Shares Redeemed | | (257 | ) | (217 | ) | (2,011 | ) | (1,698 | ) | (495 | ) | (680 | ) |
| | Net Increase (Decrease) in Adviser Class Shares Outstanding | | 189 | | 12 | | 1,091 | | 1,355 | | 439 | | (173 | ) |
** | On October 3, 2006, the Investment Class for the High Yield Portfolio was fully liquidated, however, this Class is still active. |
@ | Amount is less than $500. |
† | Capital share transactions prior to November 13, 2006 for the High Yield Portfolio have been restated to reflect the effect of a reverse stock split as described in the Notes to Financial Statements. |
The accompanying notes are an integral part of the financial statements.
155
2007 Annual Report | |
| |
September 30, 2007 | |
Statements of Changes in Net Assets
| | Intermediate Duration | | International Fixed Income | | Investment Grade Fixed | |
| | Portfolio | | Portfolio | | Income Portfolio | |
| | Year Ended | | Year Ended | | Year Ended | | Year Ended | | Year Ended | | Year Ended | |
| | September | | September | | September | | September | | September | | September | |
| | 30, 2007 | | 30, 2006 | | 30, 2007 | | 30, 2006 | | 30, 2007 | | 30, 2006 | |
| | (000) | | (000) | | (000) | | (000) | | (000) | | (000) | |
Increase (Decrease) in Net Assets | | | | | | | | | | | | | |
Operations: | | | | | | | | | | | | | |
Net Investment Income (Loss) | | $ | 6,711 | | $ | 10,730 | | $ | 5,442 | | $ | 3,120 | | $ | 24,583 | | $ | 18,318 | |
Net Realized Gain (Loss) | | 261 | | (6,969 | ) | 3,296 | | 2,075 | | 2,731 | | 4,974 | |
Net Change in Unrealized Appreciation (Depreciation) | | (19 | ) | 976 | | 8,895 | | (3,592 | ) | (2,620 | ) | (4,464 | ) |
Net Increase (Decrease) in Net Assets Resulting from Operations | | 6,953 | | 4,737 | | 17,633 | | 1,603 | | 24,694 | | 18,828 | |
Distributions from and/or in Excess of: | | | | | | | | | | | | | |
Institutional Class: | | | | | | | | | | | | | |
Net Investment Income | | (404 | ) | (349 | ) | (4,284 | ) | (6,814 | ) | (27,708 | ) | (24,331 | ) |
Net Realized Gain | | — | | — | | (929 | ) | (680 | ) | — | | (2,329 | ) |
Investment Class: | | | | | | | | | | | | | |
Net Investment Income | | (6,675 | ) | (10,127 | ) | — | | — | | — | | — | |
Adviser Class#: | | | | | | | | | | | | | |
Net Investment Income | | — | | — | | — | | — | | (36 | ) | (54 | ) |
Net Realized Gain | | — | | — | | — | | — | | — | | (5 | ) |
Total Distributions | | (7,079 | ) | (10,476 | ) | (5,213 | ) | (7,494 | ) | (27,744 | ) | (26,719 | ) |
Capital Share Transactions:(1) | | | | | | | | | | | | | |
Institutional Class: | | | | | | | | | | | | | |
Subscribed | | 32 | | 1,777 | | 49,671 | | 96,944 | | 107,207 | | 155,208 | |
Distributions Reinvested | | 344 | | 292 | | 4,988 | | 7,288 | | 26,867 | | 25,701 | |
Redeemed | | (2,166 | ) | (2,575 | ) | (49,334 | ) | (60,593 | ) | (137,208 | ) | (146,904 | ) |
Investment Class: | | | | | | | | | | | | | |
Subscribed | | 10,912 | | 100,709 | | — | | — | | — | | — | |
Distributions Reinvested | | 6,675 | | 10,127 | | — | | — | | — | | — | |
Redeemed | | (7,938 | ) | (273,807 | ) | — | | — | | — | | — | |
Adviser Class#: | | | | | | | | | | | | | |
Subscribed | | 118 | | — | | 1,224 | | — | | 560 | | 30 | |
Distributions Reinvested | | — | | — | | — | | — | | 34 | | 54 | |
Redeemed | | — | | — | | — | | — | | (190 | ) | (464 | ) |
Net Increase (Decrease) in Net Assets Resulting from Capital Share Transactions | | 7,977 | | (163,477 | ) | 6,549 | | 43,639 | | (2,730 | ) | 33,625 | |
Redemption Fees | | — | | — | | — | | — | | 3 | | @— | |
Total Increase (Decrease) in Net Assets | | 7,851 | | (169,216 | ) | 18,969 | | 37,748 | | (5,777 | ) | 25,734 | |
Net Assets: | | | | | | | | | | | | | |
Beginning of Period | | 145,021 | | 314,237 | | 195,659 | | 157,911 | | 526,458 | | 500,724 | |
End of Period | | $ | 152,872 | | $ | 145,021 | | $ | 214,628 | | $ | 195,659 | | $ | 520,681 | | $ | 526,458 | |
Undistributed (Distributions in Excess of) Net Investment Income (Loss) Included in End of Period Net Assets | | $ | 931 | | $ | 1,693 | | $ | 3,878 | | $ | (191 | ) | $ | 4,881 | | $ | 7,208 | |
The accompanying notes are an integral part of the financial statements.
156
| 2007 Annual Report |
| |
| September 30, 2007 |
Statements of Changes in Net Assets (cont’d)
| | | | Intermediate Duration | | International Fixed Income | | Investment Grade Fixed | |
| | | | Portfolio | | Portfolio | | Income Portfolio | |
| | | | Year Ended | | Year Ended | | Year Ended | | Year Ended | | Year Ended | | Year Ended | |
| | | | September | | September | | September | | September | | September | | September | |
| | | | 30, 2007 | | 30, 2006 | | 30, 2007 | | 30, 2006 | | 30, 2007 | | 30, 2006 | |
| | | | (000) | | (000) | | (000) | | (000) | | (000) | | (000) | |
(1) | | Capital Share Transactions: | | | | | | | | | | | | | |
| | Institutional Class: | | | | | | | | | | | | | |
| | Shares Subscribed | | 3 | | 175 | | 4,809 | | 9,441 | | 9,721 | | 13,985 | |
| | Shares Issued on Distributions Reinvested | | 34 | | 29 | | 483 | | 727 | | 2,443 | | 2,314 | |
| | Shares Redeemed | | (214 | ) | (255 | ) | (4,752 | ) | (5,863 | ) | (12,398 | ) | (13,186 | ) |
| | Net Increase (Decrease) in Institutional Class Shares Outstanding | | (177 | ) | (51 | ) | 540 | | 4,305 | | (234 | ) | 3,113 | |
| | Investment Class: | | | | | | | | | | | | | |
| | Shares Subscribed | | 1,086 | | 9,961 | | — | | — | | — | | — | |
| | Shares Issued on Distributions Reinvested | | 664 | | 1,006 | | — | | — | | — | | — | |
| | Shares Redeemed | | (791 | ) | (27,436 | ) | — | | — | | — | | — | |
| | Net Increase (Decrease) in Investment Class Shares Outstanding | | 959 | | (16,469 | ) | — | | — | | — | | — | |
| | Adviser Class#: | | | | | | | | | | | | | |
| | Shares Subscribed | | 12 | | — | | 112 | | — | | 50 | | 3 | |
| | Shares Issued on Distributions Reinvested | | — | | — | | — | | — | | 3 | | 5 | |
| | Shares Redeemed | | — | | — | | — | | — | | (17 | ) | (43 | ) |
| | Net Increase (Decrease) in Adviser Class Shares Outstanding | | 12 | | — | | 112 | | — | | 36 | | (35 | ) |
# | | The Intermediate Duration and International Fixed Income Portfolios’ Adviser Class commenced operations on September 28, 2007. |
@ | | Amount is less than $500. |
The accompanying notes are an integral part of the financial statements.
157
2007 Annual Report | |
| |
September 30, 2007 | |
Statements of Changes in Net Assets
| | | | | | Long Duration | | | | | |
| | Limited Duration | | Fixed Income | | Municipal | |
| | Portfolio | | Portfolio | | Portfolio | |
| | Year Ended | | Year Ended | | Year Ended | | Period Ended | | Year Ended | | Year Ended | |
| | September | | September | | September | | September | | September | | September | |
| | 30, 2007 | | 30, 2006 | | 30, 2007 | | 30, 2006^ | | 30, 2007 | | 30, 2006 | |
| | (000) | | (000) | | (000) | | (000) | | (000) | | (000) | |
Increase (Decrease) in Net Assets | | | | | | | | | | | | | |
Operations: | | | | | | | | | | | | | |
Net Investment Income (Loss) | | $ | 52,817 | | $ | 45,797 | | $ | 1,215 | | $ | 225 | | $ | 29,606 | | $ | 17,908 | |
Net Realized Gain (Loss) | | (2,961 | ) | (6,573 | ) | (104 | ) | (2 | ) | 14,019 | | 4,008 | |
Net Change in Unrealized Appreciation (Depreciation) | | (5,270 | ) | 4,691 | | (349 | ) | 978 | | (13,378 | ) | 9,926 | |
Net Increase (Decrease) in Net Assets Resulting from Operations | | 44,586 | | 43,915 | | 762 | | 1,201 | | 30,247 | | 31,842 | |
Distributions from and/or in Excess of: | | | | | | | | | | | | | |
Institutional Class: | | | | | | | | | | | | | |
Net Investment Income | | (54,837 | ) | (44,031 | ) | (1,050 | ) | — | | (31,533 | ) | (21,892 | ) |
Net Realized Gain | | — | | — | | (79 | ) | — | | — | | — | |
Adviser Class#: | | | | | | | | | | | | | |
Net Investment Income | | — | | — | | (20 | ) | — | | @— | | — | |
Net Realized Gain | | — | | — | | (1 | ) | — | | — | | — | |
Total Distributions | | (54,837 | ) | (44,031 | ) | (1,150 | ) | — | | (31,533 | ) | (21,892 | ) |
Capital Share Transactions:(1) | | | | | | | | | | | | | |
Institutional Class: | | | | | | | | | | | | | |
Subscribed | | 133,490 | | 359,275 | | @— | | 24,500 | | 387,749 | | 260,411 | |
Distributions Reinvested | | 54,830 | | 43,998 | | — | | — | | 30,637 | | 20,925 | |
Redeemed | | (197,885 | ) | (395,146 | ) | @— | | — | | (142,622 | ) | (138,164 | ) |
Adviser Class#: | | | | | | | | | | | | | |
Subscribed | | 1,020 | | — | | — | | 500 | | 9,935 | | — | |
Distributions Reinvested | | @— | | @— | | @— | | @— | | @— | | @— | |
Redeemed | | @— | | @— | | @— | | @— | | @— | | @— | |
Net Increase (Decrease) in Net Assets Resulting from Capital Share Transactions | | (8,545 | ) | 8,127 | | — | | 25,000 | | 285,699 | | 143,172 | |
Redemption Fees | | @— | | — | | — | | — | | 3 | | 1 | |
Total Increase (Decrease) in Net Assets | | (18,796 | ) | 8,011 | | (388 | ) | 26,201 | | 284,416 | | 153,123 | |
Net Assets: | | | | | | | | | | | | | |
Beginning of Period | | 1,077,967 | | 1,069,956 | | 26,201 | | — | | 662,162 | | 509,039 | |
End of Period | | $ | 1,059,171 | | $ | 1,077,967 | | $ | 25,813 | | $ | 26,201 | | $ | 946,578 | | $ | 662,162 | |
Undistributed (Distributions in Excess of) Net Investment Income Included in End of Period Net Assets | | $ | 5,916 | | $ | 8,572 | | $ | 367 | | $ | 225 | | $ | 3,448 | | $ | 2,523 | |
The accompanying notes are an integral part of the financial statements.
158
| 2007 Annual Report |
| |
| September 30, 2007 |
Statements of Changes in Net Assets (cont’d)
| | | | | | | | Long Duration | | | | | |
| | | | Limited Duration | | Fixed Income | | Municipal | |
| | | | Portfolio | | Portfolio | | Portfolio | |
| | | | Year Ended | | Year Ended | | Year Ended | | Period Ended | | Year Ended | | Year Ended | |
| | | | September | | September | | September | | September | | September | | September | |
| | | | 30, 2007 | | 30, 2006 | | 30, 2007 | | 30, 2006^ | | 30, 2007 | | 30, 2006 | |
| | | | (000) | | (000) | | (000) | | (000) | | (000) | | (000) | |
(1) | | Capital Share Transactions: | | | | | | | | | | | | | �� |
| | Institutional Class: | | | | | | | | | | | | | |
| | Shares Subscribed | | 12,988 | | 34,896 | | @— | | 2,450 | | 30,350 | | 20,547 | |
| | Shares Issued on Distributions Reinvested | | 5,344 | | 4,282 | | — | | — | | 2,397 | | 1,655 | |
| | Shares Redeemed | | (19,255 | ) | (38,408 | ) | @— | | — | | (11,154 | ) | (10,913 | ) |
| | Net Increase (Decrease) in Institutional Class Shares Outstanding | | (923 | ) | 770 | | @— | | 2,450 | | 21,593 | | 11,289 | |
| | Adviser Class#: | | | | | | | | | | | | | |
| | Shares Subscribed | | 100 | | — | | — | | 50 | | 776 | | — | |
| | Shares Issued on Distributions Reinvested | | — | | — | | — | | — | | @— | | — | |
| | Shares Redeemed | | — | | — | | — | | — | | @— | | — | |
| | Net Increase (Decrease) in Adviser Class Shares Outstanding | | 100 | | — | | — | | 50 | | 776 | | — | |
^ | The Long Duration Fixed Income Portfolio commenced operations on July 21, 2006. |
# | The Limited Duration and Municipal Portfolios’ Adviser Class commenced operations on September 28, 2007 and June 20, 2007, respectively. |
@ | Amount/Shares is less than $500. |
The accompanying notes are an integral part of the financial statements.
159
2007 Annual Report
September 30, 2007
Statements of Cash Flows
For the Year Ended September 30, 2007
| | | | | | Core | | Core Plus | |
| | | | Equities | | Fixed | | Fixed | |
| | Balanced | | Plus | | Income | | Income | |
| | Portfolio | | Portfolio | | Portfolio | | Portfolio | |
| | (000) | | (000) | | (000) | | (000) | |
Cash Flows From Operating Activities: | | | | | | | | | |
Proceeds from Sales and Maturities of Investments | | $ | 136,542 | | $ | 13,372 | | $ | 203,196 | | $ | 2,231,414 | |
Purchases of Investments | | (128,444 | ) | (13,440 | ) | (262,095 | ) | (2,636,387 | ) |
Proceeds from Sales of Delayed Delivery Commitments | | 42,386 | | — | | 75,951 | | 1,100,975 | |
Purchases of Delayed Delivery Commitments | | (32,494 | ) | — | | (33,960 | ) | (724,894 | ) |
Proceeds from Delayed Delivery Commitments Sold Short | | — | | 96,377 | | — | | — | |
Close-out of Delayed Delivery Commitments Sold Short | | — | | (96,281 | ) | — | | — | |
Net (Increase) Decrease in Short-Term Investments | | (22,369 | ) | (1,519 | ) | 6,587 | | (53,373 | ) |
Net (Increase) Decrease in Foreign Currency Holdings | | (688 | ) | — | | — | | — | |
Net Realized Gain (Loss) on Foreign Currency Transactions | | 263 | | — | | — | | (683 | ) |
Net Realized Gain (Loss) on Futures Contracts | | 1,981 | | 2,182 | | 548 | | (582 | ) |
Net Realized Gain (Loss) on Swap Agreements | | (89 | ) | (56 | ) | (571 | ) | 379 | |
Net Investment Income | | 7,323 | | 1,720 | | 15,105 | | 134,127 | |
Adjustments to Reconcile Net Investment Income to Net Cash Provided by Operating Activities: | | | | | | | | | |
Net (Increase) Decrease in Receivables Related to Operations | | (250 | ) | (64 | ) | (493 | ) | (3,771 | ) |
Net Increase (Decrease) in Payables Related to Operations | | 87 | | 50 | | 49 | | 212 | |
Accretion/Amortization of Discounts and Premiums | | 70 | | (1 | ) | (36 | ) | 767 | |
Net Cash Provided (Used) in Operating Activities | | 4,318 | | 2,340 | | 4,281 | | 48,184 | |
Cash Flows from Financing Activities: | | | | | | | | | |
Proceeds from Portfolio Shares Sold | | 79,774 | | 1,548 | | 45,724 | | 473,412 | |
Payment on Portfolio Shares Redeemed | | (84,151 | ) | (1,369 | ) | (50,321 | ) | (511,472 | ) |
Cash Dividends and Distributions Paid | | (7 | ) | (2,513 | ) | (19 | ) | (11,209 | ) |
Net Cash Provided (Used) by Financing Activities | | (4,384 | ) | (2,334 | ) | (4,616 | ) | (49,269 | ) |
Net Increase (Decrease) in Cash | | (66 | ) | 6 | | (335 | ) | (1,085 | ) |
Cash at Beginning of Period | | 83 | | 1 | | 341 | | 1,561 | |
Cash at End of Period | | $ | 17 | | $ | 7 | | $ | 6 | | $ | 476 | |
The accompanying notes are an integral part of the financial statements.
160
| 2007 Annual Report |
| |
| September 30, 2007 |
Statements of Cash Flows
For the Year Ended September 30, 2007
| | | | Investment | | | |
| | Intermediate | | Grade Fixed | | Limited | |
| | Duration | | Income | | Duration | |
| | Portfolio | | Portfolio | | Portfolio | |
| | (000) | | (000) | | (000) | |
Cash Flows From Operating Activities: | | | | | | | |
Proceeds from Sales and Maturities of Investments | | $ | 78,975 | | $ | 396,273 | | $ | 508,830 | |
Purchases of Investments | | (71,855 | ) | (439,767 | ) | (450,412 | ) |
Proceeds from Sales of Delayed Delivery Commitments | | 45,856 | | 209,172 | | 118,604 | |
Purchases of Delayed Delivery Commitments | | (47,975 | ) | (148,466 | ) | (130,080 | ) |
Net (Increase) Decrease in Short-Term Investments | | (13,321 | ) | (12,796 | ) | (36,869 | ) |
Net Realized Gain (Loss) on Futures Contracts | | 845 | | 939 | | 1,318 | |
Net Realized Gain (Loss) on Swap Agreements | | (375 | ) | (41 | ) | (2,358 | ) |
Net Investment Income | | 6,711 | | 24,583 | | 52,817 | |
Adjustments to Reconcile Net Investment Income to Net Cash Provided by Operating Activities: | | | | | | | |
Net (Increase) Decrease in Receivables Related to Operations | | 32 | | (571 | ) | 428 | |
Net Increase (Decrease) in Payables Related to Operations | | 33 | | 27 | | 20 | |
Accretion/Amortization of Discounts and Premiums | | 50 | | (15 | ) | 923 | |
Net Cash Provided (Used) in Operating Activities | | (1,024 | ) | 29,338 | | 63,221 | |
Cash Flows from Financing Activities: | | | | | | | |
Proceeds from Portfolio Shares Sold | | 11,062 | | 107,405 | | 134,387 | |
Payment on Portfolio Shares Redeemed | | (9,989 | ) | (136,480 | ) | (198,008 | ) |
Cash Dividends and Distributions Paid | | (60 | ) | (843 | ) | (7 | ) |
Net Cash Provided (Used) by Financing Activities | | 1,013 | | (29,918 | ) | (63,628 | ) |
Net Increase (Decrease) in Cash | | (11 | ) | (580 | ) | (407 | ) |
Cash at Beginning of Period | | 133 | | 591 | | 625 | |
Cash at End of Period | | $ | 122 | | $ | 11 | | $ | 218 | |
The accompanying notes are an integral part of the financial statements.
161
2007 Annual Report
September 30, 2007
Financial Highlights
Balanced Portfolio
| | Institutional Class | |
| | Year Ended September 30, | |
Selected Per Share Data and Ratios | | 2007 | | 2006 | | 2005 | | 2004 | | 2003 | |
Net Asset Value, Beginning of Period | | $ | 12.63 | | $ | 11.95 | | $ | 10.90 | | $ | 10.15 | | $ | 8.78 | |
Income (Loss) from Investment Operations | | | | | | | | | | | |
Net Investment Income (Loss)† | | 0.32 | | 0.25 | | 0.24 | | 0.18 | | 0.21 | |
Net Realized and Unrealized Gain (Loss) on Investments | | 2.00 | | 0.72 | | 1.09 | | 0.78 | | 1.47 | |
Total from Investment Operations | | 2.32 | | 0.97 | | 1.33 | | 0.96 | | 1.68 | |
Distributions from and/or in Excess of: | | | | | | | | | | | |
Net Investment Income | | (0.26 | ) | (0.29 | ) | (0.28 | ) | (0.21 | ) | (0.31 | ) |
Redemption Fees | | 0.00 | †† | 0.00 | †† | — | | — | | — | |
Net Asset Value, End of Period | | $ | 14.69 | | $ | 12.63 | | $ | 11.95 | | $ | 10.90 | | $ | 10.15 | |
Total Return+ | | 18.57 | % | 8.21 | % | 12.33 | % | 9.49 | % | 19.48 | % |
Ratios and Supplemental Data: | | | | | | | | | | | |
Net Assets, End of Period (Thousands) | | $ | 310,886 | | $ | 256,754 | | $ | 236,730 | | $ | 203,889 | | $ | 262,960 | |
Ratio of Expenses to Average Net Assets | | 0.61 | %++ | 0.60 | % | 0.62 | % | 0.62 | % | 0.60 | % |
Ratio of Net Investment Income (Loss) to Average Net Assets | | 2.35 | %++ | 2.02 | % | 2.11 | % | 1.67 | % | 2.17 | % |
Portfolio Turnover Rate# | | 60 | % | 71 | % | 111 | % | 208 | % | 84 | % |
| | Investment Class | |
| | Year Ended September 30, | |
Selected Per Share Data and Ratios | | 2007 | | 2006 | | 2005 | | 2004 | | 2003 | |
Net Asset Value, Beginning of Period | | $ | 12.61 | | $ | 11.93 | | $ | 10.89 | | $ | 10.13 | | $ | 8.76 | |
Income (Loss) from Investment Operations | | | | | | | | | | | |
Net Investment Income (Loss)† | | 0.30 | | 0.23 | | 0.22 | | 0.17 | | 0.18 | |
Net Realized and Unrealized Gain (Loss) on Investments | | 2.00 | | 0.72 | | 1.08 | | 0.78 | | 1.48 | |
Total from Investment Operations | | 2.30 | | 0.95 | | 1.30 | | 0.95 | | 1.66 | |
Distributions from and/or in Excess of: | | | | | | | | | | | |
Net Investment Income | | (0.24 | ) | (0.27 | ) | (0.26 | ) | (0.19 | ) | (0.29 | ) |
Redemption Fees | | 0.00 | †† | 0.00 | †† | — | | — | | — | |
Net Asset Value, End of Period | | $ | 14.67 | | $ | 12.61 | | $ | 11.93 | | $ | 10.89 | | $ | 10.13 | |
Total Return+ | | 18.43 | % | 8.07 | % | 12.09 | % | 9.43 | % | 19.28 | % |
Ratios and Supplemental Data: | | | | | | | | | | | |
Net Assets, End of Period (Thousands) | | $ | 5,103 | | $ | 4,102 | | $ | 3,706 | | $ | 3,117 | | $ | 8,209 | |
Ratio of Expenses to Average Net Assets | | 0.76 | %++ | 0.75 | % | 0.77 | % | 0.77 | % | 0.75 | % |
Ratio of Net Investment Income (Loss) to Average Net Assets | | 2.21 | %++ | 1.87 | % | 1.95 | % | 1.59 | % | 2.02 | % |
Portfolio Turnover Rate# | | 60 | % | 71 | % | 111 | % | 208 | % | 84 | % |
† Per share amount is based on average shares outstanding.
†† Amount is less than $0.005 per share.
+ Calculated based on the net asset value as of the last business day of the period.
++ Reflects rebate of certain Portfolio’s expenses in connection with the investments in Morgan Stanley Institutional Liquidity Money Market Portfolio — Institutional Class during the period. The impact of the rebate was less than 0.005%.
# The Portfolio’s turnover rate is calculated by dividing the lesser of purchases and sales of securities for a fiscal year by the average monthly value of portfolio securities during such fiscal year. The turnover rate may vary greatly from year to year as well as within a year. The Portfolio turnover rate reflects mortgage pool forward commitments as purchases and sales, which was not the case prior to the year ended September 30, 2004. The inclusion of such securities caused the reported turnover rate to be higher during the period than in previous fiscal years.
The accompanying notes are an integral part of the financial statements.
162
| 2007 Annual Report |
| |
| September 30, 2007 |
Financial Highlights
Balanced Portfolio
| | Adviser Class | |
| | Year Ended September 30, | |
Selected Per Share Data and Ratios | | 2007 | | 2006 | | 2005 | | 2004 | | 2003 | |
Net Asset Value, Beginning of Period | | $ | 12.61 | | $ | 11.93 | | $ | 10.88 | | $ | 10.13 | | $ | 8.77 | |
Income (Loss) from Investment Operations | | | | | | | | | | | |
Net Investment Income (Loss)† | | 0.29 | | 0.22 | | 0.22 | | 0.15 | | 0.18 | |
Net Realized and Unrealized Gain (Loss) on Investments | | 1.98 | | 0.72 | | 1.08 | | 0.78 | | 1.46 | |
Total from Investment Operations | | 2.27 | | 0.94 | | 1.30 | | 0.93 | | 1.64 | |
Distributions from and/or in Excess of: | | | | | | | | | | | |
Net Investment Income | | (0.22 | ) | (0.26 | ) | (0.25 | ) | (0.18 | ) | (0.28 | ) |
Redemption Fees | | 0.00 | †† | 0.00 | †† | — | | — | | — | |
Net Asset Value, End of Period | | $ | 14.66 | | $ | 12.61 | | $ | 11.93 | | $ | 10.88 | | $ | 10.13 | |
Total Return+ | | 18.23 | % | 7.96 | % | 12.05 | % | 9.27 | % | 19.12 | % |
Ratios and Supplemental Data: | | | | | | | | | | | |
Net Assets, End of Period (Thousands) | | $ | 31,183 | | $ | 36,870 | | $ | 37,863 | | $ | 57,322 | | $ | 59,254 | |
Ratio of Expenses to Average Net Assets | | 0.87 | %++ | 0.85 | % | 0.87 | % | 0.87 | % | 0.85 | % |
Ratio of Net Investment Income (Loss) to Average Net Assets | | 2.11 | %++ | 1.77 | % | 1.90 | % | 1.42 | % | 1.92 | % |
Portfolio Turnover Rate# | | 60 | % | 71 | % | 111 | % | 208 | % | 84 | % |
† Per share amount is based on average shares outstanding.
†† Amount is less than $0.005 per share.
+ Calculated based on the net asset value as of the last business day of the period.
++ Reflects rebate of certain Portfolio’s expenses in connection with the investments in Morgan Stanley Institutional Liquidity Money Market Portfolio — Institutional Class during the period. The impact of the rebate was less than 0.005%.
# The Portfolio’s turnover rate is calculated by dividing the lesser of purchases and sales of securities for a fiscal year by the average monthly value of portfolio securities during such fiscal year. The turnover rate may vary greatly from year to year as well as within a year. The Portfolio turnover rate reflects mortgage pool forward commitments as purchases and sales, which was not the case prior to the year ended September 30, 2004. The inclusion of such securities caused the reported turnover rate to be higher during the period than in previous fiscal years.
The accompanying notes are an integral part of the financial statements.
163
2007 Annual Report
September 30, 2007
Financial Highlights
Equities Plus Portfolio
| | Institutional Class | |
| | | | Period from | |
| | Year Ended | | April 26, 2006^ | |
| | September | | to September | |
Selected Per Share Data and Ratios | | 30, 2007 | | 30, 2006 | |
Net Asset Value, Beginning of Period | | $ | 10.22 | | $ | 10.00 | |
Income (Loss) from Investment Operations | | | | | |
Net Investment Income (Loss)† | | 0.65 | | 0.21 | |
Net Realized and Unrealized Gain (Loss) on Investments | | 0.87 | | 0.07 | |
Total from Investment Operations | | 1.52 | | 0.28 | |
Distributions from and/or in Excess of: | | | | | |
Net Investment Income | | (0.65 | ) | (0.06 | ) |
Net Realized Gain | | (0.36 | ) | — | |
Total from Investment Operations | | (1.01 | ) | (0.06 | ) |
Net Asset Value, End of Period | | $ | 10.73 | | $ | 10.22 | |
Total Return+ | | 15.54 | % | 2.93 | %‡ |
Ratios and Supplemental Data: | | | | | |
Net Assets, End of Period (Thousands) | | $ | 27,709 | | $ | 26,093 | |
Ratio of Expenses to Average Net Assets (1) | | 0.60 | %++ | 0.60 | %* |
Ratio of Net Investment Income (Loss) to Average Net Assets (1) | | 6.23 | %++ | 4.97 | %* |
Portfolio Turnover Rate | | 47 | % | 9 | %‡ |
(1) Supplemental Information on the Ratios to Average Net Assets: | | | | | |
Ratios Before Expense Limitation: | | | | | |
Expenses to Average Net Assets | | 0.86 | %++ | 1.06 | %* |
Net Investment Income (loss) to Average Net Assets | | 5.96 | %++ | 4.53 | %* |
| | Adviser Class | |
| | | | Period from | |
| | Year Ended | | April 26, 2006^ | |
| | September | | to September | |
Selected Per Share Data and Ratios | | 30, 2007 | | 30, 2006 | |
Net Asset Value, Beginning of Period | | $ | 10.22 | | $ | 10.00 | |
Income (Loss) from Investment Operations | | | | | |
Net Investment Income (Loss)† | | 0.63 | | 0.20 | |
Net Realized and Unrealized Gain (Loss) on Investments | | 0.85 | | 0.08 | |
Total from Investment Operations | | 1.48 | | 0.28 | |
Distributions from and/or in Excess of: | | | | | |
Net Investment Income | | (0.62 | ) | (0.06 | ) |
Net Realized Gain | | (0.36 | ) | — | |
Total from Investment Operations | | (0.98 | ) | (0.06 | ) |
Net Asset Value, End of Period | | $ | 10.72 | | $ | 10.22 | |
Total Return+ | | 15.26 | % | 2.79 | %‡ |
Ratios and Supplemental Data: | | | | | |
Net Assets, End of Period (Thousands) | | $ | 536 | | $ | 511 | |
Ratio of Expenses to Average Net Assets (2) | | 0.85 | %++ | 0.85 | %* |
Ratio of Net Investment Income (Loss) to Average Net Assets (2) | | 5.97 | %++ | 4.71 | %* |
Portfolio Turnover Rate | | 47 | % | 9 | %‡ |
(2) Supplemental Information on the Ratios to Average Net Assets: | | | | | |
Ratios Before Expense Limitation: | | | | | |
Expenses to Average Net Assets | | 1.11 | %++ | 1.31 | %* |
Net Investment Income (loss) to Average Net Assets | | 5.70 | %++ | 4.26 | %* |
^ Commencement of operations
† Per share amount is based on average shares outstanding.
+ Calculated based on the net asset value as of the last business day of the period.
‡ Not Annualized
++ Reflects rebate of certain Portfolio’s expenses in connection with the investments in Morgan Stanley Institutional Liquidity Money Market Portfolio — Institutional Class during the period. The impact of the rebate was less than 0.005%.
* Annualized
The accompanying notes are an integral part of the financial statements.
164
| 2007 Annual Report |
| |
| September 30, 2007 |
Financial Highlights
Mid Cap Growth Portfolio
| | Institutional Class | |
| | Year Ended September 30, | |
Selected Per Share Data and Ratios | | 2007 | | 2006 | | 2005 | | 2004 | | 2003 | |
Net Asset Value, Beginning of Period | | $ | 25.21 | | $ | 23.54 | | $ | 18.52 | | $ | 15.42 | | $ | 11.65 | |
Income (Loss) from Investment Operations | | | | | | | | | | | |
Net Investment Income (Loss)† | | 0.17 | | 0.09 | | (0.03 | ) | (0.04 | ) | (0.05 | ) |
Net Realized and Unrealized Gain (Loss) on Investments | | 8.42 | | 1.58 | | 5.05 | | 3.14 | | 3.82 | |
Total from Investment Operations | | 8.59 | | 1.67 | | 5.02 | | 3.10 | | 3.77 | |
Distributions from and/or in Excess of: | | | | | | | | | | | |
Net Investment Income | | (0.12 | ) | — | | — | | — | | — | |
Redemption Fees | | 0.00 | †† | 0.00 | †† | — | | — | | — | |
Net Asset Value, End of Period | | $ | 33.68 | | $ | 25.21 | | $ | 23.54 | | $ | 18.52 | | $ | 15.42 | |
Total Return+ | | 34.24 | % | 7.05 | %^^ | 27.11 | % | 20.10 | % | 32.36 | % |
Ratios and Supplemental Data: | | | | | | | | | | | |
Net Assets, End of Period (Thousands) | | $ | 1,647,326 | | $ | 1,001,395 | | $ | 755,313 | | $ | 589,479 | | $ | 559,760 | |
Ratio of Expenses to Average Net Assets | | 0.63 | %++ | 0.63 | % | 0.62 | % | 0.63 | % | 0.64 | % |
Ratio of Net Investment Income (Loss) to Average Net Assets | | 0.57 | %++ | 0.37 | % | (0.12 | )% | (0.23 | )% | (0.37 | )% |
Portfolio Turnover Rate | | 64 | % | 65 | % | 115 | % | 147 | % | 180 | % |
| | Adviser Class | |
| | Year Ended September 30, | |
Selected Per Share Data and Ratios | | 2007 | | 2006 | | 2005 | | 2004 | | 2003 | |
Net Asset Value, Beginning of Period | | $ | 24.54 | | $ | 22.97 | | $ | 18.12 | | $ | 15.13 | | $ | 11.45 | |
Income (Loss) from Investment Operations | | | | | | | | | | | |
Net Investment Income (Loss)† | | 0.09 | | 0.03 | | (0.08 | ) | (0.08 | ) | (0.08 | ) |
Net Realized and Unrealized Gain (Loss) on Investments | | 8.20 | | 1.54 | | 4.93 | | 3.07 | | 3.76 | |
Total from Investment Operations | | 8.29 | | 1.57 | | 4.85 | | 2.99 | | 3.68 | |
Distributions from and/or in Excess of: | | | | | | | | | | | |
Net Investment Income | | (0.05 | ) | — | | — | | — | | — | |
Redemption Fees | | 0.00 | †† | 0.00†† | | — | | — | | — | |
Net Asset Value, End of Period | | $ | 32.78 | | $ | 24.54 | | $ | 22.97 | | $ | 18.12 | | $ | 15.13 | |
Total Return+ | | 33.89 | % | 6.79 | %^^ | 26.77 | % | 19.76 | % | 32.14 | % |
Ratios and Supplemental Data: | | | | | | | | | | | |
Net Assets, End of Period (Thousands) | | $ | 1,520,096 | | $ | 1,020,611 | | $ | 936,566 | | $ | 728,058 | | $ | 531,571 | |
Ratio of Expenses to Average Net Assets | | 0.88 | %++ | 0.88 | % | 0.87 | % | 0.88 | % | 0.89 | % |
Ratio of Net Investment Income (Loss) to Average Net Assets | | 0.31 | %++ | 0.10 | % | (0.37 | )% | (0.48 | )% | (0.62 | )% |
Portfolio Turnover Rate | | 64 | % | 65 | % | 115 | % | 147 | % | 180 | % |
† Per share amount is based on average shares outstanding.
†† Amount is less than $0.005 per share.
+ Calculated based on the net asset value as of the last business day of the period.
++ Reflects rebate of certain Portfolio’s expenses in connection with the investments in Morgan Stanley Institutional Liquidity Money Market Portfolio — Institutional Class during the period. The impact of the rebate was less than 0.005%.
^^ The Adviser fully reimbursed the Portfolio for losses incurred resulting from the disposal of investments in violation of restrictions. The impact of this reimbursement is not reflected in the total return shown above. With this reimbursement, the total returns for the Institutional and Adviser Classes would have been 7.09% and 6.84%, respectively.
The accompanying notes are an integral part of the financial statements.
165
2007 Annual Report
September 30, 2007
Financial Highlights
U.S. Mid Cap Value Portfolio
| | Institutional Class | |
| | Year Ended September 30, | |
Selected Per Share Data and Ratios | | 2007 | | 2006 | | 2005 | | 2004 | | 2003 | |
Net Asset Value, Beginning of Period | | $ | 29.09 | | $ | 25.65 | | $ | 21.13 | | $ | 18.07 | | $ | 13.50 | |
Income (Loss) from Investment Operations | | | | | | | | | | | |
Net Investment Income (Loss)† | | 0.27 | | 0.20 | | 0.11 | | 0.12 | | 0.02 | |
Net Realized and Unrealized Gain (Loss) on Investments | | 7.32 | | 3.44 | | 4.50 | | 2.99 | | 4.55 | |
Total from Investment Operations | | 7.59 | | 3.64 | | 4.61 | | 3.11 | | 4.57 | |
Distributions from and/or in Excess of: | | | | | | | | | | | |
Net Investment Income | | (0.22 | ) | (0.20 | ) | (0.09 | ) | (0.05 | ) | — | |
Redemption Fees | | 0.00 | †† | 0.00 | †† | — | | — | | — | |
Net Asset Value, End of Period | | $ | 36.46 | | $ | 29.09 | | $ | 25.65 | | $ | 21.13 | | $ | 18.07 | |
Total Return+ | | 26.19 | % | 14.27 | % | 21.86 | % | 17.23 | % | 33.85 | % |
Ratios and Supplemental Data: | | | | | | | | | | | |
Net Assets, End of Period (Thousands) | | $ | 151,610 | | $ | 118,005 | | $ | 128,084 | | $ | 246,694 | | $ | 441,775 | |
Ratio of Expenses to Average Net Assets | | 0.89 | %++ | 0.90 | % | 0.87 | % | 0.90 | % | 0.88 | % |
Ratio of Net Investment Income (Loss) to Average Net Assets | | 0.80 | %++ | 0.74 | % | 0.49 | % | 0.57 | % | 0.13 | % |
Portfolio Turnover Rate | | 87 | % | 66 | % | 72 | % | 146 | % | 138 | % |
| | Investment Class | |
| | Year Ended September 30, | |
Selected Per Share Data and Ratios | | 2007 | | 2006 | | 2005 | | 2004 | | 2003 | |
Net Asset Value, Beginning of Period | | $ | 28.94 | | $ | 25.51 | | $ | 21.00 | | $ | 17.95 | | $ | 13.43 | |
Income (Loss) from Investment Operations | | | | | | | | | | | |
Net Investment Income (Loss)† | | 0.22 | | 0.13 | | 0.08 | | 0.08 | | (0.01 | ) |
Net Realized and Unrealized Gain (Loss) on Investments | | 7.27 | | 3.46 | | 4.47 | | 2.99 | | 4.53 | |
Total from Investment Operations | | 7.49 | | 3.59 | | 4.55 | | 3.07 | | 4.52 | |
Distributions from and/or in Excess of: | | | | | | | | | | | |
Net Investment Income | | (0.16 | ) | (0.16 | ) | (0.04 | ) | (0.02 | ) | — | |
Redemption Fees | | 0.00 | †† | 0.00 | †† | — | | — | | — | |
Net Asset Value, End of Period | | $ | 36.27 | | $ | 28.94 | | $ | 25.51 | | $ | 21.00 | | $ | 17.95 | |
Total Return+ | | 26.01 | % | 14.10 | % | 21.67 | % | 17.09 | % | 33.66 | % |
Ratios and Supplemental Data: | | | | | | | | | | | |
Net Assets, End of Period (Thousands) | | $ | 3,649 | | $ | 2,588 | | $ | 5,611 | | $ | 8,886 | | $ | 13,004 | |
Ratio of Expenses to Average Net Assets | | 1.04 | %++ | 1.05 | % | 1.02 | % | 1.05 | % | 1.03 | % |
Ratio of Net Investment Income (Loss) to Average Net Assets | | 0.66 | %++ | 0.50 | % | 0.33 | % | 0.42 | % | (0.02 | )% |
Portfolio Turnover Rate | | 87 | % | 66 | % | 72 | % | 146 | % | 138 | % |
† Per share amount is based on average shares outstanding.
†† Amount is less than $0.005 per share.
+ Calculated based on the net asset value as of the last business day of the period.
++ Reflects rebate of certain Portfolio’s expenses in connection with the investments in Morgan Stanley Institutional Liquidity Money Market Portfolio — Institutional Class during the period. The impact of the rebate was less than 0.005%.
The accompanying notes are an integral part of the financial statements.
166
| 2007 Annual Report |
| |
| September 30, 2007 |
Financial Highlights
U.S. Mid Cap Value Portfolio
| | Adviser Class | |
| | Year Ended September 30, | |
Selected Per Share Data and Ratios | | 2007 | | 2006 | | 2005 | | 2004 | | 2003 | |
Net Asset Value, Beginning of Period | | $ | 28.94 | | $ | 25.48 | | $ | 20.99 | | $ | 17.95 | | $ | 13.44 | |
Income (Loss) from Investment Operations | | | | | | | | | | | |
Net Investment Income (Loss)† | | 0.19 | | 0.13 | | 0.04 | | 0.07 | | (0.02 | ) |
Net Realized and Unrealized Gain (Loss) on Investments | | 7.28 | | 3.43 | | 4.47 | | 2.97 | | 4.53 | |
Total from Investment Operations | | 7.47 | | 3.56 | | 4.51 | | 3.04 | | 4.51 | |
Distributions from and/or in Excess of: | | | | | | | | | | | |
Net Investment Income | | (0.15 | ) | (0.10 | ) | (0.02 | ) | (0.00†† | ) | — | |
Redemption Fees | | 0.00 | †† | 0.00 | †† | — | | — | | — | |
Net Asset Value, End of Period | | $ | 36.26 | | $ | 28.94 | | $ | 25.48 | | $ | 20.99 | | $ | 17.95 | |
Total Return+ | | 25.87 | % | 14.02 | % | 21.52 | % | 16.95 | % | 33.56 | % |
Ratios and Supplemental Data: | | | | | | | | | | | |
Net Assets, End of Period (Thousands) | | $ | 17,661 | | $ | 13,144 | | $ | 25,943 | | $ | 55,340 | | $ | 84,733 | |
Ratio of Expenses to Average Net Assets | | 1.14 | %++ | 1.15 | % | 1.12 | % | 1.15 | % | 1.13 | % |
Ratio of Net Investment Income (Loss) to Average Net Assets | | 0.56 | %++ | 0.48 | % | 0.18 | % | 0.32 | % | (0.12 | )% |
Portfolio Turnover Rate | | 87 | % | 66 | % | 72 | % | 146 | % | 138 | % |
† | Per share amount is based on average shares outstanding. |
†† | Amount is less than $0.005 per share. |
+ | Calculated based on the net asset value as of the last business day of the period. |
++ | Reflects rebate of certain Portfolio’s expenses in connection with the investments in Morgan Stanley Institutional Liquidity Money Market Portfolio — Institutional Class during the period. The impact of the rebate was less than 0.005%. |
The accompanying notes are an integral part of the financial statements.
167
2007 Annual Report
September 30, 2007
Financial Highlights
U.S. Small Cap Value Portfolio
| | Institutional Class | |
| | Year Ended September 30, | |
Selected Per Share Data and Ratios | | 2007 | | 2006 | | 2005 | | 2004 | | 2003 | |
Net Asset Value, Beginning of Period | | $ | 26.22 | | $ | 24.41 | | $ | 22.26 | | $ | 18.19 | | $ | 14.04 | |
Income (Loss) from Investment Operations | | | | | | | | | | | |
Net Investment Income (Loss)† | | 0.06 | | 0.09 | | 0.30 | | 0.04 | | 0.03 | |
Net Realized and Unrealized Gain (Loss) on Investments | | 4.89 | | 3.04 | | 3.93 | | 4.06 | | 4.18 | |
Total from Investment Operations | | 4.95 | | 3.13 | | 4.23 | | 4.10 | | 4.21 | |
Distributions from and/or in Excess of: | | | | | | | | | | | |
Net Investment Income | | (0.08 | ) | (0.17 | ) | (0.01 | ) | (0.03 | ) | (0.06 | ) |
Net Realized Gain | | (2.90 | ) | (1.15 | ) | (2.07 | ) | — | | — | |
Total Distributions | | (2.98 | ) | (1.32 | ) | (2.08 | ) | (0.03 | ) | (0.06 | ) |
Redemption Fees | | 0.00 | †† | 0.00 | †† | — | | — | | — | |
Net Asset Value, End of Period | | $ | 28.19 | | $ | 26.22 | | $ | 24.41 | | $ | 22.26 | | $ | 18.19 | |
Total Return+ | | 19.74 | % | 13.42 | % | 19.83 | % | 22.57 | % | 30.09 | % |
Ratios and Supplemental Data: | | | | | | | | | | | |
Net Assets, End of Period (Thousands) | | $ | 810,194 | | $ | 716,208 | | $ | 355,671 | | $ | 382,898 | | $ | 536,620 | |
Ratio of Expenses to Average Net Assets | | 0.84 | %++ | 0.81 | % | 0.82 | % | 0.90 | % | 0.89 | % |
Ratio of Net Investment Income (Loss) to Average Net Assets | | 0.23 | %++ | 0.35 | % | 1.29 | % | 0.18 | % | 0.21 | % |
Portfolio Turnover Rate | | 46 | % | 51 | % | 61 | % | 104 | % | 159 | % |
| | Adviser Class | |
| | Year Ended September 30, | |
Selected Per Share Data and Ratios | | 2007 | | 2006 | | 2005 | | 2004 | | 2003 | |
Net Asset Value, Beginning of Period | | $ | 26.09 | | $ | 24.29 | | $ | 22.20 | | $ | 18.16 | | $ | 14.01 | |
Income (Loss) from Investment Operations | | | | | | | | | | | |
Net Investment Income (Loss)† | | 0.00 | †† | 0.02 | | 0.24 | | (0.02 | ) | (0.01 | ) |
Net Realized and Unrealized Gain (Loss) on Investments | | 4.86 | | 3.04 | | 3.92 | | 4.06 | | 4.18 | |
Total from Investment Operations | | 4.86 | | 3.06 | | 4.16 | | 4.04 | | 4.17 | |
Distributions from and/or in Excess of: | | | | | | | | | | | |
Net Investment Income | | (0.02 | ) | (0.11 | ) | — | | — | | (0.02 | ) |
Net Realized Gain | | (2.90 | ) | (1.15 | ) | (2.07 | ) | — | | — | |
Total Distributions | | (2.92 | ) | (1.26 | ) | (2.07 | ) | — | | (0.02 | ) |
Redemption Fees | | 0.00 | †† | 0.00 | †† | — | | — | | — | |
Net Asset Value, End of Period | | $ | 28.03 | | $ | 26.09 | | $ | 24.29 | | $ | 22.20 | | $ | 18.16 | |
Total Return+ | | 19.45 | % | 13.13 | % | 19.49 | % | 22.30 | % | 29.76 | % |
Ratios and Supplemental Data: | | | | | | | | | | | |
Net Assets, End of Period (Thousands) | | $ | 59,519 | | $ | 26,428 | | $ | 25,860 | | $ | 22,530 | | $ | 64,391 | |
Ratio of Expenses to Average Net Assets | | 1.09 | %++ | 1.06 | % | 1.07 | % | 1.15 | % | 1.14 | % |
Ratio of Net Investment Income (Loss) to Average Net Assets | | (0.01 | )%++ | 0.08 | % | 1.06 | % | (0.07 | )% | (0.04 | )% |
Portfolio Turnover Rate | | 46 | % | 51 | % | 61 | % | 104 | % | 159 | % |
† | Per share amount is based on average shares outstanding. |
†† | Amount is less than $0.005 per share. |
+ | Calculated based on the net asset value as of the last business day of the period. |
++ | Reflects rebate of certain Portfolio’s expenses in connection with the investments in Morgan Stanley Institutional Liquidity Money Market Portfolio — Institutional Class during the period. The impact of the rebate was less than 0.005%. |
The accompanying notes are an integral part of the financial statements.
168
| 2007 Annual Report |
| |
| September 30, 2007 |
Financial Highlights
Value Portfolio
| | Institutional Class | |
| | Year Ended September 30, | |
Selected Per Share Data and Ratios | | 2007 | | 2006 | | 2005 | | 2004 | | 2003 | |
Net Asset Value, Beginning of Period | | $ | 18.67 | | $ | 17.89 | | $ | 16.44 | | $ | 13.64 | | $ | 10.65 | |
Income (Loss) from Investment Operations | | | | | | | | | | | |
Net Investment Income (Loss)† | | 0.35 | | 0.37 | | 0.33 | | 0.27 | | 0.19 | |
Net Realized and Unrealized Gain (Loss) on Investments | | 1.60 | | 2.11 | | 1.40 | | 2.79 | | 2.99 | |
Total from Investment Operations | | 1.95 | | 2.48 | | 1.73 | | 3.06 | | 3.18 | |
Distributions from and/or in Excess of: | | | | | | | | | | | |
Net Investment Income | | (0.37 | ) | (0.38 | ) | (0.28 | ) | (0.26 | ) | (0.19 | ) |
Net Realized Gain | | (1.79 | ) | (1.32 | ) | — | | — | | — | |
Total Distributions | | (2.16 | ) | (1.70 | ) | (0.28 | ) | (0.26 | ) | (0.19 | ) |
Redemption Fees | | 0.00 | †† | 0.00 | †† | — | | — | | — | |
Net Asset Value, End of Period | | $ | 18.46 | | $ | 18.67 | | $ | 17.89 | | $ | 16.44 | | $ | 13.64 | |
Total Return+ | | 10.95 | % | 14.68 | % | 10.55 | % | 22.56 | % | 30.19 | % |
Ratios and Supplemental Data: | | | | | | | | | | | |
Net Assets, End of Period (Thousands) | | $ | 285,533 | | $ | 307,331 | | $ | 293,426 | | $ | 275,494 | | $ | 363,636 | |
Ratio of Expenses to Average Net Assets | | 0.63 | %++ | 0.65 | % | 0.60 | % | 0.63 | % | 0.63 | % |
Ratio of Net Investment Income (Loss) to Average Net Assets | | 1.90 | %++ | 2.07 | % | 1.88 | % | 1.75 | % | 1.57 | % |
Portfolio Turnover Rate | | 28 | % | 26 | % | 38 | % | 95 | % | 65 | % |
| | Investment Class | |
| | Year Ended September 30, | |
Selected Per Share Data and Ratios | | 2007 | | 2006 | | 2005 | | 2004 | | 2003 | |
Net Asset Value, Beginning of Period | | $ | 18.69 | | $ | 17.91 | | $ | 16.46 | | $ | 13.65 | | $ | 10.65 | |
Income (Loss) from Investment Operations | | | | | | | | | | | |
Net Investment Income (Loss)† | | 0.32 | | 0.34 | | 0.31 | | 0.25 | | 0.17 | |
Net Realized and Unrealized Gain (Loss) on Investments | | 1.61 | | 2.11 | | 1.39 | | 2.79 | | 3.00 | |
Total from Investment Operations | | 1.93 | | 2.45 | | 1.70 | | 3.04 | | 3.17 | |
Distributions from and/or in Excess of: | | | | | | | | | | | |
Net Investment Income | | (0.34 | ) | (0.35 | ) | (0.25 | ) | (0.23 | ) | (0.17 | ) |
Net Realized Gain | | (1.79 | ) | (1.32 | ) | — | | — | | — | |
Total Distributions | | (2.13 | ) | (1.67 | ) | (0.25 | ) | (0.23 | ) | (0.17 | ) |
Redemption Fees | | 0.00 | †† | 0.00 | †† | — | | — | | — | |
Net Asset Value, End of Period | | $ | 18.49 | | $ | 18.69 | | $ | 17.91 | | $ | 16.46 | | $ | 13.65 | |
Total Return+ | | 10.83 | % | 14.48 | % | 10.38 | % | 22.37 | % | 30.06 | % |
Ratios and Supplemental Data: | | | | | | | | | | | |
Net Assets, End of Period (Thousands) | | $ | 82,941 | | $ | 66,334 | | $ | 58,236 | | $ | 38,742 | | $ | 26,169 | |
Ratio of Expenses to Average Net Assets | | 0.78 | %++ | 0.80 | % | 0.75 | % | 0.78 | % | 0.78 | % |
Ratio of Net Investment Income (Loss) to Average Net Assets | | 1.75 | %++ | 1.92 | % | 1.73 | % | 1.60 | % | 1.42 | % |
Portfolio Turnover Rate | | 28 | % | 26 | % | 38 | % | 95 | % | 65 | % |
† | Per share amount is based on average shares outstanding. |
†† | Amount is less than $0.005 per share. |
+ | Calculated based on the net asset value as of the last business day of the period. |
++ | Reflects rebate of certain Portfolio’s expenses in connection with the investments in Morgan Stanley Institutional Liquidity Government Portfolio — Institutional Class during the period. The impact of the rebate was less than 0.005%. |
The accompanying notes are an integral part of the financial statements.
169
2007 Annual Report
September 30, 2007
Financial Highlights
Value Portfolio
| | Adviser Class | |
| | Year Ended September 30, | |
Selected Per Share Data and Ratios | | 2007 | | 2006 | | 2005 | | 2004 | | 2003 | |
Net Asset Value, Beginning of Period | | $ | 18.64 | | $ | 17.86 | | $ | 16.42 | | $ | 13.62 | | $ | 10.63 | |
Income (Loss) from Investment Operations | | | | | | | | | | | |
Net Investment Income (Loss)† | | 0.31 | | 0.33 | | 0.29 | | 0.23 | | 0.16 | |
Net Realized and Unrealized Gain (Loss) on Investments | | 1.60 | | 2.10 | | 1.38 | | 2.79 | | 2.99 | |
Total from Investment Operations | | 1.91 | | 2.43 | | 1.67 | | 3.02 | | 3.15 | |
Distributions from and/or in Excess of: | | | | | | | | | | | |
Net Investment Income | | (0.33 | ) | (0.33 | ) | (0.23 | ) | (0.22 | ) | (0.16 | ) |
Net Realized Gain | | (1.79 | ) | (1.32 | ) | — | | — | | — | |
Total Distributions | | (2.12 | ) | (1.65 | ) | (0.23 | ) | (0.22 | ) | (0.16 | ) |
Redemption Fees | | 0.00 | †† | 0.00 | †† | — | | — | | — | |
Net Asset Value, End of Period | | $ | 18.43 | | $ | 18.64 | | $ | 17.86 | | $ | 16.42 | | $ | 13.62 | |
Total Return+ | | 10.69 | % | 14.38 | % | 10.24 | % | 22.28 | % | 29.87 | % |
Ratios and Supplemental Data: | | | | | | | | | | | |
Net Assets, End of Period (Thousands) | | $ | 199,754 | | $ | 187,718 | | $ | 1,113,274 | | $ | 943,182 | | $ | 622,230 | |
Ratio of Expenses to Average Net Assets | | 0.88 | %++ | 0.87 | % | 0.85 | % | 0.88 | % | 0.88 | % |
Ratio of Net Investment Income (Loss) to Average Net Assets | | 1.65 | %++ | 1.84 | % | 1.63 | % | 1.50 | % | 1.32 | % |
Portfolio Turnover Rate | | 28 | % | 26 | % | 38 | % | 95 | % | 65 | % |
† | Per share amount is based on average shares outstanding. |
†† | Amount is less than $0.005 per share. |
+ | Calculated based on the net asset value as of the last business day of the period. |
++ | Reflects rebate of certain Portfolio’s expenses in connection with the investments in Morgan Stanley Institutional Liquidity Government Portfolio — Institutional Class during the period. The impact of the rebate was less than 0.005%. |
The accompanying notes are an integral part of the financial statements.
170
| 2007 Annual Report |
| |
| September 30, 2007 |
Financial Highlights
Core Fixed Income Portfolio
| | Institutional Class | |
| | Year Ended September 30, | |
Selected Per Share Data and Ratios | | 2007 | | 2006 | | 2005 | | 2004 | | 2003 | |
Net Asset Value, Beginning of Period | | $ | 10.80 | | $ | 11.09 | | $ | 11.26 | | $ | 11.26 | | $ | 11.46 | |
Income (Loss) from Investment Operations | | | | | | | | | | | |
Net Investment Income (Loss)† | | 0.52 | | 0.40 | | 0.40 | | 0.33 | | 0.32 | |
Net Realized and Unrealized Gain (Loss) on Investments | | (0.02 | ) | 0.00 | †† | 0.07 | | 0.14 | | 0.19 | |
Total from Investment Operations | | 0.50 | | 0.40 | | 0.47 | | 0.47 | | 0.51 | |
Distributions from and/or in Excess of: | | | | | | | | | | | |
Net Investment Income | | (0.53 | ) | (0.57 | ) | (0.45 | ) | (0.47 | ) | (0.51 | ) |
Net Realized Gain | | — | | (0.12 | ) | (0.19 | ) | — | | (0.20 | ) |
Total Distributions | | (0.53 | ) | (0.69 | ) | (0.64 | ) | (0.47 | ) | (0.71 | ) |
Redemption Fees | | 0.00 | †† | 0.00 | †† | — | | — | | — | |
Net Asset Value, End of Period | | $ | 10.77 | | $ | 10.80 | | $ | 11.09 | | $ | 11.26 | | $ | 11.26 | |
Total Return+ | | 4.76 | % | 3.79 | % | 4.35 | % | 4.33 | % | 4.61 | % |
Ratios and Supplemental Data: | | | | | | | | | | | |
Net Assets, End of Period (Thousands) | | $ | 308,111 | | $ | 299,997 | | $ | 220,350 | | $ | 226,555 | | $ | 320,036 | |
Ratio of Expenses to Average Net Assets (2) | | 0.49 | %++ | 0.50 | % | 0.50 | % | 0.50 | % | 0.50 | % |
Ratio of Net Investment Income (Loss) to Average Net Assets (2) | | 4.83 | %++ | 3.71 | % | 3.62 | % | 2.94 | % | 2.82 | % |
Portfolio Turnover Rate# | | 107 | % | 139 | % | 236 | % | 371 | % | 109 | % |
(2) Supplemental Information on the Ratios to Average Net Assets: | | | | | |
Ratios Before Expense Limitation: | | | | | | | | | | | |
Expenses to Average Net Assets | | 0.54 | %++ | 0.56 | % | 0.53 | % | 0.52 | % | 0.51 | % |
Net Investment Income (Loss) to Average Net Assets | | 4.78 | %++ | 3.65 | % | 3.59 | % | 2.92 | % | 2.81 | % |
† | Per share amount is based on average shares outstanding. |
†† | Amount is less than $0.005 per share. |
+ | Calculated based on the net asset value as of the last business day of the period. |
++ | Reflects rebate of certain Portfolio’s expenses in connection with the investments in Morgan Stanley Institutional Liquidity Money Market Portfolio — Institutional Class during the period. The impact of the rebate was less than 0.001%. |
# | The Portfolio’s turnover rate is calculated by dividing the lesser of purchases and sales of securities for a fiscal year by the average monthly value of portfolio securities during such fiscal year. The turnover rate may vary greatly from year to year as well as within a year. The Portfolio turnover rate reflects mortgage pool forward commitments as purchases and sales, which was not the case prior to the year ended September 30, 2004. The inclusion of such securities caused the reported turnover rate to be higher during the period than in previous fiscal years. |
The accompanying notes are an integral part of the financial statements
171
2007 Annual Report |
| |
September 30, 2007 |
Financial Highlights | | | | | | | | | | |
| | | | | | | | | | |
Core Fixed Income Portfolio | | | | | | | | | | |
| | Adviser Class | |
| | Year Ended September 30, | |
Selected Per Share Data and Ratios | | 2007 | | 2006 | | 2005 | | 2004 | | 2003 | |
Net Asset Value, Beginning of Period | | $ | 10.74 | | $ | 11.03 | | $ | 11.21 | | $ | 11.22 | | $ | 11.42 | |
Income (Loss) from Investment Operations | | | | | | | | | | | |
Net Investment Income (Loss)† | | 0.49 | | 0.37 | | 0.37 | | 0.30 | | 0.29 | |
Net Realized and Unrealized Gain (Loss) on Investments | | (0.02 | ) | 0.01 | | 0.06 | | 0.14 | | 0.19 | |
Total from Investment Operations | | 0.47 | | 0.38 | | 0.43 | | 0.44 | | 0.48 | |
Distributions from and/or in Excess of: | | | | | | | | | | | |
Net Investment Income | | (0.50 | ) | (0.55 | ) | (0.42 | ) | (0.45 | ) | (0.48 | ) |
Net Realized Gain | | — | | (0.12 | ) | (0.19 | ) | 0.00 | | (0.20 | ) |
Total Distributions | | (0.50 | ) | (0.67 | ) | (0.61 | ) | (0.45 | ) | (0.68 | ) |
Redemption Fees | | 0.00 | †† | 0.00 | †† | — | | — | | — | |
Net Asset Value, End of Period | | $ | 10.71 | | $ | 10.74 | | $ | 11.03 | | $ | 11.21 | | $ | 11.22 | |
Total Return+ | | 4.53 | % | 3.55 | % | 4.01 | % | 4.12 | % | 4.28 | % |
Ratios and Supplemental Data: | | | | | | | | | | | |
Net Assets, End of Period (Thousands) | | $ | 11,805 | | $ | 9,812 | | $ | 9,954 | | $ | 9,564 | | $ | 10,585 | |
Ratio of Expenses to Average Net Assets (1) | | 0.74 | %++ | 0.75 | % | 0.75 | % | 0.75 | % | 0.75 | % |
Ratio of Net Investment Income (Loss) to Average Net Assets (1) | | 4.58 | %++ | 3.43 | % | 3.37 | % | 2.69 | % | 2.57 | % |
Portfolio Turnover Rate# | | 107 | % | 139 | % | 236 | % | 371 | % | 109 | % |
(1) Supplemental Information on the Ratios to Average Net Assets: | | | | | | | |
Ratios Before Expense Limitation: | | | | | | | | | | | |
Expenses to Average Net Assets | | 0.79 | %++ | 0.81 | % | 0.78 | % | 0.77 | % | 0.76 | % |
Net Investment Income (Loss) to Average Net Assets | | 4.54 | %++ | 3.37 | % | 3.34 | % | 2.67 | % | 2.56 | % |
† | | Per share amount is based on average shares outstanding. |
†† | | Amount is less than $0.005 per share. |
+ | | Calculated based on the net asset value as of the last business day of the period. |
++ | | Reflects rebate of certain Portfolio’s expenses in connection with the investments in Morgan Stanley Institutional Liquidity Money Market Portfolio — Institutional Class during the period. The impact of the rebate was approximately 0.01%. |
# | | The Portfolio’s turnover rate is calculated by dividing the lesser of purchases and sales of securities for a fiscal year by the average monthly value of portfolio securities during such fiscal year. The turnover rate may vary greatly from year to year as well as within a year. The Portfolio turnover rate reflects mortgage pool forward commitments as purchases and sales, which was not the case prior to the year ended September 30, 2004. The inclusion of such securities caused the reported turnover rate to be higher during the period than in previous fiscal years. |
The accompanying notes are an integral part of the financial statements
172
| 2007 Annual Report |
| |
| September 30, 2007 |
Financial Highlights | | | | | | | | | | |
| | | | | | | | | | |
Core Plus Fixed Income Portfolio | | | | | | | | | | |
| | Institutional Class | |
| | Year Ended September 30, | |
Selected Per Share Data and Ratios | | 2007 | | 2006 | | 2005 | | 2004 | | 2003 | |
Net Asset Value, Beginning of Period | | $ | 11.52 | | $ | 11.69 | | $ | 11.69 | | $ | 11.71 | | $ | 11.82 | |
Income (Loss) from Investment Operations | | | | | | | | | | | |
Net Investment Income (Loss)† | | 0.58 | | 0.48 | | 0.47 | | 0.38 | | 0.40 | |
Net Realized and Unrealized Gain (Loss) on Investments | | (0.05 | ) | (0.02 | ) | 0.08 | | 0.17 | | 0.31 | |
Total from Investment Operations | | 0.53 | | 0.46 | | 0.55 | | 0.55 | | 0.71 | |
Distributions from and/or in Excess of: | | | | | | | | | | | |
Net Investment Income | | (0.65 | ) | (0.63 | ) | (0.55 | ) | (0.57 | ) | (0.67 | ) |
Net Realized Gain | | — | | — | | — | | — | | (0.15 | ) |
Total Distributions | | (0.65 | ) | (0.63 | ) | (0.55 | ) | (0.57 | ) | (0.82 | ) |
Redemption Fees | | 0.00 | †† | 0.00 | †† | — | | — | | — | |
Net Asset Value, End of Period | | $ | 11.40 | | $ | 11.52 | | $ | 11.69 | | $ | 11.69 | | $ | 11.71 | |
Total Return+ | | 4.77 | % | 4.13 | % | 4.84 | % | 4.80 | % | 6.24 | % |
Ratios and Supplemental Data: | | | | | | | | | | | |
Net Assets, End of Period (Thousands) | | $ | 2,367,043 | | $ | 2,314,052 | | $ | 2,102,609 | | $ | 2,120,149 | | $ | 2,600,453 | |
Ratio of Expenses to Average Net Assets | | 0.44 | %++ | 0.44 | % | 0.45 | % | 0.50 | % | 0.50 | % |
Ratio of Net Investment Income (Loss) to Average Net Assets | | 5.10 | %++ | 4.24 | % | 4.04 | % | 3.29 | % | 3.39 | % |
Portfolio Turnover Rate# | | 139 | % | 142 | % | 180 | % | 334 | % | 92 | % |
| | Investment Class | |
| | Year Ended September 30, | |
Selected Per Share Data and Ratios | | 2007 | | 2006 | | 2005 | | 2004 | | 2003 | |
Net Asset Value, Beginning of Period | | $ | 11.52 | | $ | 11.68 | | $ | 11.69 | | $ | 11.71 | | $ | 11.81 | |
Income (Loss) from Investment Operations | | | | | | | | | | | |
Net Investment Income (Loss)† | | 0.56 | | 0.45 | | 0.45 | | 0.36 | | 0.37 | |
Net Realized and Unrealized Gain (Loss) on Investments | | (0.06 | ) | (0.00 | )†† | 0.07 | | 0.17 | | 0.33 | |
Total from Investment Operations | | 0.50 | | 0.45 | | 0.52 | | 0.53 | | 0.70 | |
Distributions from and/or in Excess of: | | | | | | | | | | | |
Net Investment Income | | (0.63 | ) | (0.61 | ) | (0.53 | ) | (0.55 | ) | (0.65 | ) |
Net Realized Gain | | — | | — | | — | | — | | (0.15 | ) |
Total Distributions | | (0.63 | ) | (0.61 | ) | (0.53 | ) | (0.55 | ) | (0.80 | ) |
Redemption Fees | | 0.00 | †† | 0.00 | †† | — | | — | | — | |
Net Asset Value, End of Period | | $ | 11.39 | | $ | 11.52 | | $ | 11.68 | | $ | 11.69 | | $ | 11.71 | |
Total Return+ | | 4.52 | % | 4.04 | % | 4.61 | % | 4.73 | % | 6.07 | % |
Ratios and Supplemental Data: | | | | | | | | | | | |
Net Assets, End of Period (Thousands) | | $ | 150,671 | | $ | 142,990 | | $ | 310,592 | | $ | 146,146 | | $ | 114,509 | |
Ratio of Expenses to Average Net Assets | | 0.59 | %++ | 0.59 | % | 0.60 | % | 0.65 | % | 0.65 | % |
Ratio of Net Investment Income (Loss) to Average Net Assets | | 4.97 | %++ | 3.96 | % | 3.89 | % | 3.14 | % | 3.24 | % |
Portfolio Turnover Rate# | | 139 | % | 142 | % | 180 | % | 334 | % | 92 | % |
† | | Per share amount is based on average shares outstanding. |
†† | | Amount is less than $0.005 per share. |
+ | | Calculated based on the net asset value as of the last business day of the period. |
++ | | Reflects rebate of certain Portfolio’s expenses in connection with the investments in Morgan Stanley Institutional Liquidity Money Market Portfolio — Institutional Class during the period. The impact of the rebate was less than 0.005%. |
# | | The Portfolio’s turnover rate is calculated by dividing the lesser of purchases and sales of securities for a fiscal year by the average monthly value of portfolio securities during such fiscal year. The turnover rate may vary greatly from year to year as well as within a year. The Portfolio turnover rate reflects mortgage pool forward commitments as purchases and sales, which was not the case prior to the year ended September 30, 2004. The inclusion of such securities caused the reported turnover rate to be higher during the period than in previous fiscal years. |
The accompanying notes are an integral part of the financial statements.
173
2007 Annual Report |
| |
September 30, 2007 |
Financial Highlights | | | | | | | | | | |
| | | | | | | | | | |
Core Plus Fixed Income Portfolio | | | | | | | | | | |
| | Adviser Class | |
| | Year Ended September 30, | |
Selected Per Share Data and Ratios | | 2007 | | 2006 | | 2005 | | 2004 | | 2003 | |
Net Asset Value, Beginning of Period | | $ | 11.50 | | $ | 11.67 | | $ | 11.68 | | $ | 11.70 | | $ | 11.81 | |
Income (Loss) from Investment Operations | | | | | | | | | | | |
Net Investment Income (Loss)† | | 0.55 | | 0.46 | | 0.44 | | 0.35 | | 0.36 | |
Net Realized and Unrealized Gain (Loss) on Investments | | (0.05 | ) | (0.03 | ) | 0.07 | | 0.17 | | 0.32 | |
Total from Investment Operations | | 0.50 | | 0.43 | | 0.51 | | 0.52 | | 0.68 | |
Distributions from and/or in Excess of: | | | | | | | | | | | |
Net Investment Income | | (0.62 | ) | (0.60 | ) | (0.52 | ) | (0.54 | ) | (0.64 | ) |
Net Realized Gain | | — | | — | | — | | — | | (0.15 | ) |
Total Distributions | | (0.62 | ) | (0.60 | ) | (0.52 | ) | (0.54 | ) | (0.79 | ) |
Redemption Fees | | 0.00 | †† | 0.00 | †† | — | | — | | — | |
Net Asset Value, End of Period | | $ | 11.38 | | $ | 11.50 | | $ | 11.67 | | $ | 11.68 | | $ | 11.70 | |
Total Return+ | | 4.42 | % | 3.97 | % | 4.49 | % | 4.57 | % | 5.99 | % |
Ratios and Supplemental Data: | | | | | | | | | | | |
Net Assets, End of Period (Thousands) | | $ | 137,733 | | $ | 126,683 | | $ | 112,716 | | $ | 114,841 | | $ | 211,260 | |
Ratio of Expenses to Average Net Assets | | 0.69 | %++ | 0.69 | % | 0.70 | % | 0.75 | % | 0.75 | % |
Ratio of Net Investment Income (Loss) to Average Net Assets | | 4.84 | %++ | 4.00 | % | 3.79 | % | 3.04 | % | 3.14 | % |
Portfolio Turnover Rate# | | 139 | % | 142 | % | 180 | % | 334 | % | 92 | % |
† | | Per share amount is based on average shares outstanding. |
†† | | Amount is less than $0.005 per share. |
+ | | Calculated based on the net asset value as of the last business day of the period. |
++ | | Reflects rebate of certain Portfolio’s expenses in connection with the investments in Morgan Stanley Institutional Liquidity Money Market Portfolio — Institutional Class during the period. The impact of the rebate was 0.005%. |
# | | The Portfolio’s turnover rate is calculated by dividing the lesser of purchases and sales of securities for a fiscal year by the average monthly value of portfolio securities during such fiscal year. The turnover rate may vary greatly from year to year as well as within a year. The Portfolio turnover rate reflects mortgage pool forward commitments as purchases and sales, which was not the case prior to the year ended September 30, 2004. The inclusion of such securities caused the reported turnover rate to be higher during the period than in previous fiscal years. |
The accompanying notes are an integral part of the financial statements.
174
| 2007 Annual Report |
| |
| September 30, 2007 |
Financial Highlights | | | | | | | | | | |
| | | | | | | | | | |
High Yield Portfolio | | | | | | | | | | |
| | Institutional Class^^ | |
| | Year Ended September 30, | |
Selected Per Share Data and Ratios | | 2007 | | 2006 | | 2005 | | 2004 | | 2003 | |
Net Asset Value, Beginning of Period | | $ | 10.60 | | $ | 10.80 | | $ | 11.18 | | $ | 10.60 | | $ | 8.82 | |
Income (Loss) from Investment Operations | | | | | | | | | | | |
Net Investment Income (Loss)† | | 0.79 | | 0.76 | | 0.80 | | 0.84 | | 0.86 | |
Net Realized and Unrealized Gain (Loss) on Investments | | (0.11 | ) | (0.16 | ) | (0.30 | ) | 0.40 | | 1.54 | |
Total from Investment Operations | | 0.68 | | 0.60 | | 0.50 | | 1.24 | | 2.40 | |
Distributions from and/or in Excess of: | | | | | | | | | | | |
Net Investment Income | | (0.72 | ) | (0.80 | ) | (0.88 | ) | (0.66 | ) | (0.62 | ) |
Redemption Fees | | 0.00 | †† | 0.00 | †† | — | | — | | — | |
Net Asset Value, End of Period | | $ | 10.56 | | $ | 10.60 | | $ | 10.80 | | $ | 11.18 | | $ | 10.60 | |
Total Return+ | | 7.38 | % | 6.03 | % | 4.63 | % | 12.11 | % | 28.68 | % |
Ratios and Supplemental Data: | | | | | | | | | | | |
Net Assets, End of Period (Thousands) | | $ | 193,934 | | $ | 226,162 | | $ | 195,880 | | $ | 314,440 | | $ | 330,990 | |
Ratio of Expenses to Average Net Assets | | 0.68 | %++ | 0.61 | % | 0.62 | % | 0.61 | % | 0.61 | % |
Ratio of Net Investment Income (Loss) to Average Net Assets | | 7.51 | %++ | 7.23 | % | 7.37 | % | 7.70 | % | 9.05 | % |
Portfolio Turnover Rate | | 40 | % | 58 | % | 55 | % | 89 | % | 97 | % |
| | Adviser Class^^ | |
| | Year Ended September 30, | |
Selected Per Share Data and Ratios | | 2007 | | 2006 | | 2005 | | 2004 | | 2003 | |
Net Asset Value, Beginning of Period | | $ | 10.64 | | $ | 10.84 | | $ | 11.20 | | $ | 10.62 | | $ | 8.80 | |
Income (Loss) from Investment Operations | | | | | | | | | | | |
Net Investment Income (Loss)† | | 0.78 | | 0.74 | | 0.78 | | 0.80 | | 0.84 | |
Net Realized and Unrealized Gain (Loss) on Investments | | (0.12 | ) | (0.18 | ) | (0.28 | ) | 0.42 | | 1.56 | |
Total from Investment Operations | | 0.66 | | 0.56 | | 0.50 | | 1.22 | | 2.40 | |
Distributions from and/or in Excess of: | | | | | | | | | | | |
Net Investment Income | | (0.70 | ) | (0.76 | ) | (0.86 | ) | (0.64 | ) | (0.58 | ) |
Redemption Fees | | 0.00 | †† | 0.00 | †† | — | | — | | — | |
Net Asset Value, End of Period | | $ | 10.60 | | $ | 10.64 | | $ | 10.84 | | $ | 11.20 | | $ | 10.62 | |
Total Return+ | | 7.26 | % | 5.51 | % | 4.52 | % | 11.86 | % | 28.54 | % |
Ratios and Supplemental Data: | | | | | | | | | | | |
Net Assets, End of Period (Thousands) | | $ | 9,023 | | $ | 4,391 | | $ | 6,349 | | $ | 17,923 | | $ | 13,936 | |
Ratio of Expenses to Average Net Assets | | 0.93 | %++ | 0.86 | % | 0.87 | % | 0.86 | % | 0.86 | % |
Ratio of Net Investment Income (Loss) to Average Net Assets | | 7.31 | %++ | 7.00 | % | 7.11 | % | 7.45 | % | 8.80 | % |
Portfolio Turnover Rate | | 40 | % | 58 | % | 55 | % | 89 | % | 97 | % |
^^ | | On November 13, 2006, the Portfolio effected a reverse stock split as described in the Notes to Financial Statements. Per share data prior to this date has been restated to give effect to the reverse stock split. |
† | | Per share amount is based on average shares outstanding. |
†† | | Amount is less than $0.005 per share. |
+ | | Calculated based on the net asset value as of the last business day of the period. |
++ | | Reflects rebate of certain Portfolio’s expenses in connection with the investments in Morgan Stanley Institutional Liquidity Money Market Portfolio — Institutional Class during the period. The impact of the rebate was less than 0.005%. |
The accompanying notes are an integral part of the financial statements.
175
2007 Annual Report |
| |
September 30, 2007 |
Financial Highlights | | | | | | | | | |
| | | | | | | | | |
Intermediate Duration Portfolio | | | | | | | | | |
| | Institutional Class | |
| | Year Ended September 30, | |
Selected Per Share Data and Ratios | | 2007 | | 2006 | | 2005 | | 2004 | | 2003 | |
Net Asset Value, Beginning of Period | | $ | 10.17 | | $ | 10.22 | | $ | 10.40 | | $ | 10.49 | | $ | 10.71 | |
Income (Loss) from Investment Operations | | | | | | | | | | | |
Net Investment Income (Loss)† | | 0.48 | | 0.42 | | 0.37 | | 0.32 | | 0.28 | |
Net Realized and Unrealized Gain (Loss) on Investments | | 0.01 | | (0.08 | ) | (0.16 | ) | (0.01 | ) | 0.14 | |
Total from Investment Operations | | 0.49 | | 0.34 | | 0.21 | | 0.31 | | 0.42 | |
Distributions from and/or in Excess of: | | | | | | | | | | | |
Net Investment Income | | (0.50 | ) | (0.39 | ) | (0.36 | ) | (0.40 | ) | (0.36 | ) |
Net Realized Gain | | — | | — | | (0.03 | ) | — | | (0.28 | ) |
Total Distributions | | (0.50 | ) | (0.39 | ) | (0.39 | ) | (0.40 | ) | (0.64 | ) |
Net Asset Value, End of Period | | $ | 10.16 | | $ | 10.17 | | $ | 10.22 | | $ | 10.40 | | $ | 10.49 | |
Total Return+ | | 4.87 | % | 3.33 | % | 2.22 | % | 3.06 | % | 4.12 | % |
Ratios and Supplemental Data: | | | | | | | | | | | |
Net Assets, End of Period (Thousands) | | $ | 7,015 | | $ | 8,823 | | $ | 9,393 | | $ | 18,828 | | $ | 23,991 | |
Ratio of Expenses to Average Net Assets | | 0.54 | %++ | 0.50 | % | 0.50 | % | 0.53 | % | 0.54 | % |
Ratio of Net Investment Income (Loss) to Average Net Assets | | 4.71 | %++ | 4.20 | % | 3.59 | % | 3.07 | % | 2.63 | % |
Portfolio Turnover Rate# | | 89 | % | 70 | % | 146 | % | 211 | % | 89 | % |
| | Investment Class | |
| | Year Ended September 30, | |
Selected Per Share Data and Ratios | | 2007 | | 2006 | | 2005 | | 2004 | | 2003 | |
Net Asset Value, Beginning of Period | | $ | 10.13 | | $ | 10.19 | | $ | 10.37 | | $ | 10.46 | | $ | 10.68 | |
Income (Loss) from Investment Operations | | | | | | | | | | | |
Net Investment Income (Loss)† | | 0.46 | | 0.39 | | 0.33 | | 0.30 | | 0.26 | |
Net Realized and Unrealized Gain (Loss) on Investments | | 0.02 | | (0.07 | ) | (0.13 | ) | (0.01 | ) | 0.15 | |
Total from Investment Operations | | 0.48 | | 0.32 | | 0.20 | | 0.29 | | 0.41 | |
Distributions from and/or in Excess of: | | | | | | | | | | | |
Net Investment Income | | (0.49 | ) | (0.38 | ) | (0.35 | ) | (0.38 | ) | (0.35 | ) |
Net Realized Gain | | — | | — | | (0.03 | ) | — | | (0.28 | ) |
Total Distributions | | (0.49 | ) | (0.38 | ) | (0.38 | ) | (0.38 | ) | (0.63 | ) |
Net Asset Value, End of Period | | $ | 10.12 | | $ | 10.13 | | $ | 10.19 | | $ | 10.37 | | $ | 10.46 | |
Total Return+ | | 4.84 | % | 3.19 | % | 1.99 | % | 2.86 | % | 3.97 | % |
Ratios and Supplemental Data: | | | | | | | | | | | |
Net Assets, End of Period (Thousands) | | $ | 145,739 | | $ | 136,198 | | $ | 304,844 | | $ | 138,813 | | $ | 99,441 | |
Ratio of Expenses to Average Net Assets | | 0.69 | %++ | 0.65 | % | 0.65 | % | 0.68 | % | 0.69 | % |
Ratio of Net Investment Income (Loss) to Average Net Assets | | 4.58 | %++ | 3.87 | % | 3.22 | % | 2.92 | % | 2.48 | % |
Portfolio Turnover Rate# | | 89 | % | 70 | % | 146 | % | 211 | % | 89 | % |
† | | Per share amount is based on average shares outstanding. |
+ | | Calculated based on the net asset value as of the last business day of the period. |
++ | | Reflects rebate of certain Portfolio’s expenses in connection with the investments in Morgan Stanley Institutional Liquidity Money Market Portfolio — Institutional Class during the period. The impact of the rebate was less than 0.005% and approximately 0.01% for the Institutional and Investment Class, respectively. |
# | | The Portfolio’s turnover rate is calculated by dividing the lesser of purchases and sales of securities for a fiscal year by the average monthly value of portfolio securities during such fiscal year. The turnover rate may vary greatly from year to year as well as within a year. The Portfolio turnover rate reflects mortgage pool forward commitments as purchases and sales, which was not the case prior to the year ended September 30, 2004. The inclusion of such securities caused the reported turnover rate to be higher during the period than in previous fiscal years. |
The accompanying notes are an integral part of the financial statements.
176
| 2007 Annual Report |
| |
| September 30, 2007 |
Financial Highlights | | |
| | |
Intermediate Duration Portfolio | | |
| | Adviser Class | |
| | Period from | |
| | September 28, | |
| | 2007^ | |
| | to September 30, | |
Selected Per Share Data and Ratios | | 2007 | |
Net Asset Value, Beginning of Period | | $ | 10.15 | |
Income (Loss) from Investment Operations | | | |
Net Investment Income (Loss)† | | 0.00 | †† |
Net Realized and Unrealized Gain (Loss) on Investments | | 0.01 | |
Total from Investment Operations | | 0.01 | |
Net Asset Value, End of Period | | $ | 10.16 | |
Total Return+ | | — | |
Ratios and Supplemental Data: | | | |
Net Assets, End of Period (Thousands) | | $ | 118 | |
Ratio of Expenses to Average Net Assets | | 1.17 | %*++ |
Ratio of Net Investment Income (Loss) to Average Net Assets | | 4.49 | %*++ |
Portfolio Turnover Rate | | 89 | % |
^ | | Commencement of operations |
† | | Per share amount is based on average shares outstanding. |
†† | | Amount is less than $0.005 per share. |
* | | Annualized |
+ | | Calculated based on the net asset value as of the last business day of the period. |
++ | | Reflects rebate of certain Portfolio’s expenses in connection with the investments in Morgan Stanley Institutional Liquidity Money Market Portfolio — Institutional Class during the period. The impact of the rebate was approximately 0.21%. |
The accompanying notes are an integral part of the financial statements.
177
2007 Annual Report |
| |
September 30, 2007 |
Financial Highlights | | |
International Fixed Income Portfolio | | |
| | Institutional Class | |
| | Year Ended September 30, | |
Selected Per Share Data and Ratios | | 2007 | | 2006 | | 2005 | | 2004 | | 2003 | |
Net Asset Value, Beginning of Period | | $ | 10.35 | | $ | 10.81 | | $ | 11.24 | | $ | 11.92 | | $ | 9.88 | |
Income (Loss) from Investment Operations | | | | | | | | | | | |
Net Investment Income (Loss)† | | 0.28 | | 0.21 | | 0.25 | | 0.28 | | 0.38 | |
Net Realized and Unrealized Gain (Loss) on Investments | | 0.61 | | (0.11 | ) | 0.01 | | 0.63 | | 1.66 | |
Total from Investment Operations | | 0.89 | | 0.10 | | 0.26 | | 0.91 | | 2.04 | |
Distributions from and/or in Excess of: | | | | | | | | | | | |
Net Investment Income | | (0.22 | ) | (0.51 | ) | (0.69 | ) | (1.59 | ) | — | |
Net Realized Gain | | (0.05 | ) | (0.05 | ) | — | | — | | — | |
Total Distributions | | (0.27 | ) | (0.56 | ) | (0.69 | ) | (1.59 | ) | — | |
Net Asset Value, End of Period | | $ | 10.97 | | $ | 10.35 | | $ | 10.81 | | $ | 11.24 | | $ | 11.92 | |
Total Return+ | | 8.76 | % | 1.12 | % | 1.81 | % | 7.95 | % | 20.65 | % |
Ratios and Supplemental Data: | | | | | | | | | | | |
Net Assets, End of Period (Thousands) | | $ | 213,392 | | $ | 195,659 | | $ | 157,911 | | $ | 154,111 | | $ | 114,932 | |
Ratio of Expenses to Average Net Assets | | 0.60 | %++ | 0.60 | % | 0.55 | % | 0.56 | % | 0.56 | % |
Ratio of Net Investment Income (Loss) to Average Net Assets | | 2.66 | %++ | 2.02 | % | 2.17 | % | 2.52 | % | 3.51 | % |
Portfolio Turnover Rate | | 82 | % | 69 | % | 38 | % | 15 | % | 41 | % |
| | Adviser Class | |
| | Period from | |
| | September 28, 2007^ | |
| | to September | |
Selected Per Share Data and Ratios | | 30, 2007 | |
Net Asset Value, Beginning of Period | | $ | 10.97 | |
Income (Loss) from Investment Operations | | | |
Net Investment Income (Loss)† | | 0.00 | †† |
Net Realized and Unrealized Gain (Loss) on Investments | | 0.11 | |
Total from Investment Operations | | 0.11 | |
Net Asset Value, End of Period | | $ | 11.08 | |
Total Return+ | | — | |
Ratios and Supplemental Data: | | | |
Net Assets, End of Period (Thousands) | | $ | 1,236 | |
Ratio of Expenses to Average Net Assets | | 1.45 | %*++ |
Ratio of Net Investment Income (Loss) to Average Net Assets | | 1.39 | %*++ |
Portfolio Turnover Rate | | 82 | % |
^ | Commencement of operations |
† | Per share amount is based on average shares outstanding. |
†† | Amount is less than $0.005 per share. |
* | Annualized |
+ | Calculated based on the net asset value as of the last business day of the period. |
++ | Reflects rebate of certain Portfolio’s expenses in connection with the investments in Morgan Stanley Institutional Liquidity Money Market Portfolio — Institutional Class during the period. The impact of the rebate was less than 0.005% and approximately 0.03% for the Institutional and Adviser Class, respectively. |
The accompanying notes are an integral part of the financial statements
178
| 2007 Annual Report |
| |
| September 30, 2007 |
Financial Highlights | | |
| | |
Investment Grade Fixed Income Portfolio | | |
| | Institutional Class | |
| | Year Ended September 30, | |
Selected Per Share Data and Ratios | | 2007 | | 2006 | | 2005 | | 2004 | | 2003 | |
Net Asset Value, Beginning of Period | | $ | 11.22 | | $ | 11.42 | | $ | 11.57 | | $ | 11.54 | | $ | 11.57 | |
Income (Loss) from Investment Operations | | | | | | | | | | | |
Net Investment Income (Loss)† | | 0.52 | | 0.41 | | 0.42 | | 0.34 | | 0.34 | |
Net Realized and Unrealized Gain (Loss) on Investments | | 0.01 | | (0.00 | )†† | 0.06 | | 0.14 | | 0.23 | |
Total from Investment Operations | | 0.53 | | 0.41 | | 0.48 | | 0.48 | | 0.57 | |
Distributions from and/or in Excess of: | | | | | | | | | | | |
Net Investment Income | | (0.60 | ) | (0.56 | ) | (0.49 | ) | (0.45 | ) | (0.55 | ) |
Net Realized Gain | | — | | (0.05 | ) | (0.14 | ) | — | | (0.05 | ) |
Total Distributions | | (0.60 | ) | (0.61 | ) | (0.63 | ) | (0.45 | ) | (0.60 | ) |
Redemption Fees | | 0.00 | †† | 0.00 | †† | — | | — | | — | |
Net Asset Value, End of Period | | $ | 11.15 | | $ | 11.22 | | $ | 11.42 | | $ | 11.57 | | $ | 11.54 | |
Total Return+ | | 4.82 | % | 3.65 | % | 4.39 | % | 4.36 | % | 4.36 | % |
Ratios and Supplemental Data: | | | | | | | | | | | |
Net Assets, End of Period (Thousands) | | $ | 519,504 | | $ | 525,680 | | $ | 499,534 | | $ | 527,837 | | $ | 569,593 | |
Ratio of Expenses to Average Net Assets | | 0.50 | %++ | 0.50 | % | 0.50 | % | 0.50 | % | 0.51 | % |
Ratio of Net Investment Income (Loss) to Average Net Assets | | 4.74 | %++ | 3.66 | % | 3.67 | % | 2.94 | % | 2.96 | % |
Portfolio Turnover Rate# | | 124 | % | 154 | % | 240 | % | 332 | % | 81 | % |
| | Adviser Class | |
| | Year Ended September 30, | |
Selected Per Share Data and Ratios | | 2007 | | 2006 | | 2005 | | 2004 | | 2003 | |
Net Asset Value, Beginning of Period | | $ | 11.21 | | $ | 11.42 | | $ | 11.56 | | $ | 11.53 | | $ | 11.57 | |
Income (Loss) from Investment Operations | | | | | | | | | | | |
Net Investment Income (Loss)† | | 0.51 | | 0.39 | | 0.41 | | 0.32 | | 0.32 | |
Net Realized and Unrealized Gain (Loss) on Investments | | 0.00 | †† | (0.01 | ) | 0.06 | | 0.14 | | 0.22 | |
Total from Investment Operations | | 0.51 | | 0.38 | | 0.47 | | 0.46 | | 0.54 | |
Distributions from and/or in Excess of: | | | | | | | | | | | |
Net Investment Income | | (0.58 | ) | (0.54 | ) | (0.47 | ) | (0.43 | ) | (0.53 | ) |
Net Realized Gain | | — | | (0.05 | ) | (0.14 | ) | — | | (0.05 | ) |
Total Distributions | | (0.58 | ) | (0.59 | ) | (0.61 | ) | (0.43 | ) | (0.58 | ) |
Redemption Fees | | 0.00 | †† | 0.00 | †† | — | | — | | — | |
Net Asset Value, End of Period | | $ | 11.14 | | $ | 11.21 | | $ | 11.42 | | $ | 11.56 | | $ | 11.53 | |
Total Return+ | | 4.56 | % | 3.59 | % | 4.23 | % | 4.10 | % | 4.87 | % |
Ratios and Supplemental Data: | | | | | | | | | | | |
Net Assets, End of Period (Thousands) | | $ | 1,177 | | $ | 778 | | $ | 1,190 | | $ | 1,400 | | $ | 1,581 | |
Ratio of Expenses to Average Net Assets (1) | | 0.65 | %++ | 0.65 | % | 0.65 | % | 0.65 | % | 0.66 | % |
Ratio of Net Investment Income (Loss) to Average Net Assets (1) | | 4.59 | %++ | 3.46 | % | 3.55 | % | 2.79 | % | 2.81 | % |
Portfolio Turnover Rate# | | 124 | % | 154 | % | 240 | % | 332 | % | 81 | % |
(1) Supplemental Information on the Ratios to Average Net Assets: | | | | | | | |
Ratios Before Expense Limitation: | | | | | | | | | | | |
Expenses to Average Net Assets | | 0.75 | %++ | 0.75 | % | 0.75 | % | 0.75 | % | 0.76 | % |
Net Investment Income (Loss) to Average Net Assets | | 4.49 | %++ | 3.36 | % | 3.45 | % | 2.69 | % | 2.71 | % |
† | Per share amount is based on average shares outstanding. |
†† | Amount is less than $0.005 per share. |
+ | Calculated based on the net asset value as of the last business day of the period. |
++ | Reflects rebate of certain Portfolio’s expenses in connection with the investments in Morgan Stanley Institutional Liquidity Money Market Portfolio — Institutional |
| Class during the period. The impact of the rebate was less than 0.005%. |
# | The Portfolio’s turnover rate is calculated by dividing the lesser of purchases and sales of securities for a fiscal year by the average monthly value of portfolio securities during such fiscal year. The turnover rate may vary greatly from year to year as well as within a year. The Portfolio turnover rate reflects mortgage pool forward commitments as purchases and sales, which was not the case prior to the year ended September 30, 2004. The inclusion of such securities caused the reported turnover rate to be higher during the period than in previous fiscal years. |
The accompanying notes are an integral part of the financial statements.
179
2007 Annual Report |
| |
September 30, 2007 |
Financial Highlights | | |
| | |
Limited Duration Portfolio | | |
| | Institutional Class | |
| | Year Ended September 30, | |
Selected Per Share Data and Ratios | | 2007 | | 2006 | | 2005 | | 2004 | | 2003 | |
Net Asset Value, Beginning of Period | | $ | 10.34 | | $ | 10.34 | | $ | 10.50 | | $ | 10.65 | | $ | 10.69 | |
Income (Loss) from Investment Operations | | | | | | | | | | | |
Net Investment Income (Loss)† | | 0.51 | | 0.41 | | 0.30 | | 0.25 | | 0.23 | |
Net Realized and Unrealized Gain (Loss) on Investments | | (0.08 | ) | (0.02 | ) | (0.15 | ) | (0.10 | ) | 0.05 | |
Total from Investment Operations | | 0.43 | | 0.39 | | 0.15 | | 0.15 | | 0.28 | |
Distributions from and/or in Excess of: | | | | | | | | | | | |
Net Investment Income | | (0.53 | ) | (0.39 | ) | (0.31 | ) | (0.28 | ) | (0.27 | ) |
Net Realized Gain | | — | | — | | — | | (0.02 | ) | (0.05 | ) |
Total Distributions | | (0.53 | ) | (0.39 | ) | (0.31 | ) | (0.30 | ) | (0.32 | ) |
Redemption Fees | | 0.00 | †† | — | | — | | — | | — | |
Net Asset Value, End of Period | | $ | 10.24 | | $ | 10.34 | | $ | 10.34 | | $ | 10.50 | | $ | 10.65 | |
Total Return+ | | 4.26 | % | 3.88 | % | 1.44 | % | 1.47 | % | 2.65 | % |
Ratios and Supplemental Data: | | | | | | | | | | | |
Net Assets, End of Period (Thousands) | | $ | 1,058,151 | | $ | 1,077,967 | | $ | 1,069,956 | | $ | 957,367 | | $ | 622,801 | |
Ratio of Expenses to Average Net Assets | | 0.45 | %++ | 0.42 | % | 0.42 | % | 0.42 | % | 0.43 | % |
Ratio of Net Investment Income (Loss) to Average Net Assets | | 4.94 | %++ | 3.96 | % | 2.92 | % | 2.36 | % | 2.17 | % |
Portfolio Turnover Rate# | | 56 | % | 64 | % | 66 | % | 135 | % | 68 | % |
| | | | | | | | | | | | | | | | | | |
| | Adviser Class | |
| | Period from | |
| | September 28, | |
| | 2007^ to | |
| | September | |
Selected Per Share Data and Ratios | | 30, 2007 | |
Net Asset Value, Beginning of Period | | $ | 10.24 | |
Income (Loss) from Investment Operations | | | |
Net Investment Income (Loss)† | | 0.00 | †† |
Net Realized and Unrealized Gain (Loss) on Investments | | (0.00 | )†† |
Total from Investment Operations | | 0.00 | †† |
Redemption Fees | | 0.00 | †† |
Net Asset Value, End of Period | | $ | 10.24 | |
Total Return+ | | — | |
Ratios and Supplemental Data: | | | |
Net Assets, End of Period (Thousands) | | $ | 1,020 | |
Ratio of Expenses to Average Net Assets | | 0.59 | %++ |
Ratio of Net Investment Income (Loss) to Average Net Assets | | 5.38 | %++ |
Portfolio Turnover Rate | | 56 | % |
^ | Commencement of operations |
† | Per share amount is based on average shares outstanding. |
†† | Amount is less than $0.005 per share. |
* | Annualized |
+ | Calculated based on the net asset value as of the last business day of the period. |
++ | Reflects rebate of certain Portfolio’s expenses in connection with the investments in Morgan Stanley Institutional Liquidity Money Market Portfolio — Institutional Class during the period. The impact of the rebate was less than 0.005% and approximately 0.06% for the Institutional and Adviser Class, respectively. |
# | The Portfolio’s turnover rate is calculated by dividing the lesser of purchases and sales of securities for a fiscal year by the average monthly value of portfolio securities during such fiscal year. The turnover rate may vary greatly from year to year as well as within a year. The Portfolio turnover rate reflects mortgage pool forward commitments as purchases and sales, which was not the case prior to the year ended September 30, 2004. The inclusion of such securities caused the reported turnover rate to be higher during the period than in previous fiscal years. |
The accompanying notes are an integral part of the financial statements.
180
| 2007 Annual Report |
| |
| September 30, 2007 |
Financial Highlights | | |
| | |
Long Duration Fixed Income Portfolio | | |
| | Institutional Class | |
| | | | Period from | |
| | Year Ended | | July 21, 2006^ | |
| | September | | to September | |
Selected Per Share Data and Ratios | | 30, 2007 | | 30, 2006 | |
Net Asset Value, Beginning of Period | | $ | 10.48 | | $ | 10.00 | |
Income (Loss) from Investment Operations | | | | | |
Net Investment Income (Loss)† | | 0.49 | | 0.09 | |
Net Realized and Unrealized Gain (Loss) on Investments | | (0.18 | ) | 0.39 | |
Total from Investment Operations | | 0.31 | | 0.48 | |
Distributions from and/or in Excess of: | | | | | |
Net Investment Income | | (0.43 | ) | — | |
Net Realized Gain | | (0.03 | ) | — | |
Total Distributions | | (0.46 | ) | — | |
Net Asset Value, End of Period | | $ | 10.33 | | $ | 10.48 | |
Total Return+ | | 3.06 | % | 4.80 | %‡ |
Ratios and Supplemental Data: | | | | | |
Net Assets, End of Period (Thousands) | | $ | 25,297 | | $ | 25,677 | |
Ratio of Expenses to Average Net Assets (1) | | 0.50 | %++ | 0.50 | %* |
Ratio of Net Investment Income (Loss) to Average Net Assets (1) | | 4.73 | %++ | 4.66 | %* |
Portfolio Turnover Rate | | 49 | % | 7 | %‡ |
(1) Supplemental Information on the Ratios to Average Net Assets: | | | | | |
Ratios Before Expense Limitation: | | | | | |
Expenses to Average Net Assets | | 0.94 | %++ | 1.52 | %* |
Net Investment Income (Loss) to Average Net Assets | | 4.29 | %++ | 3.64 | %* |
| | Adviser Class | |
| | | | Period from | |
| | Year Ended | | July 21, 2006^ | |
| | September | | to September | |
Selected Per Share Data and Ratios | | 30, 2007 | | 30, 2006 | |
Net Asset Value, Beginning of Period | | $ | 10.48 | | $ | 10.00 | |
Income (Loss) from Investment Operations | | | | | |
Net Investment Income (Loss)† | | 0.46 | | 0.09 | |
Net Realized and Unrealized Gain (Loss) on Investments | | (0.19 | ) | 0.39 | |
Total from Investment Operations | | 0.27 | | 0.48 | |
Distributions from and/or in Excess of: | | | | | |
Net Investment Income | | (0.40 | ) | — | |
Net Realized Gain | | (0.03 | ) | — | |
Total Distributions | | (0.43 | ) | — | |
Net Asset Value, End of Period | | $ | 10.32 | | $ | 10.48 | |
Total Return+ | | 2.72 | % | 4.80 | %‡ |
Ratios and Supplemental Data: | | | | | |
Net Assets, End of Period (Thousands) | | $ | 516 | | $ | 524 | |
Ratio of Expenses to Average Net Assets (2) | | 0.75 | %++ | 0.75 | %* |
Ratio of Net Investment Income (Loss) to Average Net Assets (2) | | 4.48 | %++ | 4.40 | %* |
Portfolio Turnover Rate | | 49 | % | 7 | %‡ |
(2) Supplemental Information on the Ratios to Average Net Assets: | | | | | |
Ratios Before Expense Limitation: | | | | | |
Expenses to Average Net Assets | | 1.19 | %++ | 1.77 | %* |
Net Investment Income (Loss) to Average Net Assets | | 4.04 | %++ | 3.39 | %* |
^ | Commencement of operations |
† | Per share amount is based on average shares outstanding. |
+ | Calculated based on the net asset value as of the last business day of the period. |
++ | Reflects rebate of certain Portfolio’s expenses in connection with the investments in Morgan Stanley Institutional Liquidity Money Market Portfolio — Institutional Class during the period. The impact of the rebate was less than 0.005%. |
‡ | Not Annualized |
* | Annualized |
The accompanying notes are an integral part of the financial statements.
181
2007 Annual Report |
| |
September 30, 2007 |
Financial Highlights | | |
| | |
Municipal Portfolio | | |
| | Institutional Class | |
| | Year Ended September 30, | |
Selected Per Share Data and Ratios | | 2007 | | 2006 | | 2005 | | 2004 | | 2003 | |
Net Asset Value, Beginning of Period | | $ | 12.86 | | $ | 12.66 | | $ | 12.66 | | $ | 12.53 | | $ | 12.49 | |
Income (Loss) from Investment Operations | | | | | | | | | | | |
Net Investment Income (Loss)† | | 0.49 | | 0.39 | | 0.40 | | 0.38 | | 0.50 | |
Net Realized and Unrealized Gain (Loss) on Investments | | (0.01 | ) | 0.29 | | 0.02 | | 0.14 | | (0.01 | ) |
Total from Investment Operations | | 0.48 | | 0.68 | | 0.42 | | 0.52 | | 0.49 | |
Distributions from and/or in Excess of: | | | | | | | | | | | |
Net Investment Income | | (0.52 | ) | (0.48 | ) | (0.42 | ) | (0.39 | ) | (0.45 | ) |
Redemption Fees | | 0.00 | †† | 0.00 | †† | — | | — | | — | |
Net Asset Value, End of Period | | $ | 12.82 | | $ | 12.86 | | $ | 12.66 | | $ | 12.66 | | $ | 12.53 | |
Total Return+ | | 3.76 | % | 5.53 | % | 3.38 | % | 4.02 | % | 4.19 | % |
Ratios and Supplemental Data: | | | | | | | | | | | |
Net Assets, End of Period (Thousands) | | $ | 936,633 | | $ | 662,162 | | $ | 509,039 | | $ | 368,686 | | $ | 313,999 | |
Ratio of Expenses to Average Net Assets (1) | | 0.50 | %++ | 0.49 | % | 0.50 | % | 0.50 | % | 0.50 | % |
Ratio of Net Investment Income (Loss) to Average Net Assets (1) | | 3.80 | %++ | 3.09 | % | 3.12 | % | 3.01 | % | 4.01 | % |
Portfolio Turnover Rate# | | 29 | % | 43 | % | 34 | % | 105 | % | 47 | % |
| | | | | | | | | | | |
| | | | | | | | | | | |
(1) Supplemental Information on the Ratios to Average Net Assets: | | | | | | | |
Ratios Before Expense Limitation: | | | | | | | | | | | |
Expenses to Average Net Assets | | N/A | | N/A | | N/A | | 0.51 | % | 0.51 | % |
Net Investment Income (Loss) to Average Net Assets | | N/A | | N/A | | N/A | | 3.00 | % | 4.00 | % |
| | Adviser Class | |
| | Period from June 20, | |
| | 2007^ | |
| | to September | |
Selected Per Share Data and Ratios | | 30, 2007 | |
Net Asset Value, Beginning of Period | | $ | 12.69 | |
Income (Loss) from Investment Operations | | | |
Net Investment Income (Loss)† | | 0.24 | |
Net Realized and Unrealized Gain (Loss) on Investments | | 0.02 | |
Total from Investment Operations | | 0.26 | |
Distributions from and/or in Excess of: | | | |
Net Investment Income | | (0.13 | ) |
Redemption Fees | | 0.00 | †† |
Net Asset Value, End of Period | | $ | 12.82 | |
Total Return+ | | 2.02 | %‡ |
Ratios and Supplemental Data: | | | |
Net Assets, End of Period (Thousands) | | $ | 9,945 | |
Ratio of Expenses to Average Net Assets (2) | | 0.73 | %*++ |
Ratio of Net Investment Income (Loss) to Average Net Assets (2) | | 6.66 | %*++ |
Portfolio Turnover Rate | | 29 | % |
(2) Supplemental Information on the Ratios to Average Net Assets: | | | |
Ratios Before Expense Limitation: | | | |
Expenses to Average Net Assets | | 0.99 | %*++ |
Net Investment Income (Loss) to Average Net Assets | | 6.41 | %*++ |
^ | Commencement of operations |
† | Per share amount is based on average shares outstanding. |
†† | Amount is less than $0.005 per share. |
‡ | Not Annualized |
* | Annualized |
+ | Calculated based on the net asset value as of the last business day of the period. |
++ | Reflects rebate of certain Portfolio’s expenses in connection with the investments in Morgan Stanley Institutional Liquidity Tax Exempt Portfolio — Institutional Class during the period. The impact of the rebate was less than 0.005% and approximately 0.02% for the Institutional and Adviser Class, respectively. |
# | The Portfolio’s turnover rate is calculated by dividing the lesser of purchases and sales of securities for a fiscal year by the average monthly value of portfolio securities during such fiscal year. The turnover rate may vary greatly from year to year as well as within a year. The Portfolio turnover rate reflects mortgage pool forward commitments as purchases and sales, which was not the case prior to the September 30, 2004. The inclusion of such securities caused the reported turnover rate to be higher during the period than in previous fiscal years. |
The accompanying notes are an integral part of the financial statements.
182
| 2007 Annual Report |
| |
| September 30, 2007 |
Notes to Financial Statements
Morgan Stanley Institutional Fund Trust (“MSIFT” or the “Fund”) is registered under the Investment Company Act of 1940, as amended (the “1940 Act”), as an open-end investment company. The Fund is comprised of eighteen active portfolios. The accompanying financial statements and financial highlights are those of the Balanced, Equities Plus, Mid Cap Growth, U.S. Mid Cap Value, U.S. Small Cap Value, Value, Core Fixed Income, Core Plus Fixed Income, High Yield, Intermediate Duration, International Fixed Income, Investment Grade Fixed Income, Limited Duration, Long Duration Fixed Income and Municipal Portfolios, all of which except the International Fixed Income Portfolio are considered diversified for purposes of the 1940 Act (each referred to as a “Portfolio”). Effective June 20, 2007, the Adviser Class shares of the Municipal Portfolio commenced operations. Effective September 28, 2007, the Adviser Class shares for the Intermediate Duration, International Fixed Income and Limited Duration Portfolios commenced operations. The financial statements of the remaining portfolios of the Fund are presented separately.
The Fund offers up to three different classes of shares for certain Portfolios — Institutional Class shares, Investment Class shares and Adviser Class shares. Each class of shares has identical voting rights (except shareholders of each Class have exclusive voting rights regarding any matter relating solely to that particular Class of shares), dividend, liquidation and other rights, except each class bears different shareholder service fees as described in Note D.
A. Significant Accounting Policies. The following significant accounting policies are in conformity with U.S. generally accepted accounting principles. Such policies are consistently followed by the Fund in the preparation of the financial statements. U.S. generally accepted accounting principles may require management to make estimates and assumptions that affect the reported amounts and disclosures in the financial statements. Actual results may differ from those estimates.
1. Security Valuation: Bonds and other fixed income securities may be valued according to the broadest and most representative market. In addition, bonds and other fixed income securities may be valued on the basis of prices provided by a pricing service. The prices provided by a pricing service take into account broker dealer market price quotations for institutional size trading in similar groups of securities, security quality, maturity, coupon and other security characteristics as well as any developments related to the specific security. Debt securities purchased with remaining maturities of 60 days or less are valued at amortized cost, if it approximates market value. Equity securities listed on a U.S. exchange are valued at the latest quoted sales price on the valuation date. Equity securities listed or traded on NASDAQ, for which market quotations are available, are valued at the NASDAQ Official Closing Price. Securities listed on a foreign exchange are valued at their closing price, except as noted below. Unlisted and listed equity securities not traded on the valuation date, for which market quotations are readily available, are valued at the mean between the current bid and asked prices obtained from reputable brokers.
All other securities and investments for which market values are not readily available, including restricted securities, and those securities for which it is inappropriate to determine prices in accordance with the aforementioned procedures, are valued at fair value as determined in good faith under procedures adopted by the Board of Trustees (the “Trustees”), although the actual calculations may be done by others. Factors considered in making this determination may include, but are not limited to, information obtained by contacting the issuer, analysts, or the appropriate stock exchange (for exchange-traded securities), analysis of the issuer’s financial statements or other available documents and, if necessary, available information concerning other securities in similar circumstances.
Most foreign markets close before the New York Stock Exchange (NYSE). Occasionally, developments that could affect the closing prices of securities and other assets may occur between the times at which valuations of such securities are determined (that is, close of the foreign market on which the securities trade) and the close of business on the NYSE. If these developments are expected to materially affect the value of the securities, the valuations may be adjusted to reflect the estimated fair value as of the close of the NYSE, as determined in good faith under procedures established by the Trustees.
2. Repurchase Agreements: Each Portfolio may enter into repurchase agreements under which a Portfolio lends excess cash and takes possession of securities with an agreement that the counterparty will repurchase such securities. In connection with transactions in repurchase agreements, a bank as custodian for the Fund takes possession of the underlying securities which are held as collateral, with a market value at least equal to the amount of the repurchase transaction, including principal and accrued interest. To the extent that any repurchase transaction exceeds one business day, the value of the collateral is marked-to-market on a daily basis to determine the adequacy of the collateral. In the event of default on the obligation to repurchase, the Fund has the right to liquidate the collateral and apply the proceeds in satisfaction of the obligation. In the event of default or bankruptcy by the counterparty to the agreement, realization and/or retention of the collateral or proceeds may be subject to legal proceedings.
183
2007 Annual Report | |
| |
September 30, 2007 | |
Notes to Financial Statements (cont’d)
Pursuant to an exemptive order issued by the Securities and Exchange Commission, the Portfolios may transfer their uninvested cash balances into a joint trading account with other Portfolios of the Fund which invests in one or more repurchase agreements. Any such joint repurchase agreement is covered by the same collateral requirements as discussed above.
At September 30, 2007, the Portfolios did not have any outstanding repurchase agreements.
3. Futures: Financial futures contracts (secured by cash and securities deposited with brokers as “initial margin”) are valued based upon their quoted daily settlement prices; changes in initial settlement value (represented by cash paid to or received from brokers as “variation margin”) are accounted for as unrealized appreciation (depreciation). When futures contracts are closed, the difference between the opening value at the date of purchase and the value at closing is recorded as realized gain or loss in the Statements of Operations. “Due from (to) Broker” includes initial margin and variation margin, as stated in the Statements of Assets and Liabilities.
Futures contracts may be used by each Portfolio in order to hedge against unfavorable changes in the value of securities or to attempt to realize profits from the value of the related securities.
Futures contracts involve market risk that may exceed the amounts recognized in the Statements of Assets and Liabilities. Risks arise from the possible movements in the prices of securities relating to these instruments. The change in value of futures contracts primarily corresponds with the value of their related securities, but may not precisely correlate with the change in value of such securities. In addition, there is the risk that a Portfolio may not be able to enter into a closing transaction because of an illiquid secondary market.
4. Securities Sold Short: Each Portfolio may sell securities short. A short sale is a transaction in which the Portfolio sells securities it may or may not own, but has borrowed, in anticipation of a decline in the market price of the securities. The Portfolio is obligated to replace the borrowed securities at their market price at the time of replacement. The Portfolio may have to pay a premium to borrow the securities as well as pay any dividends or interest payable on the securities until they are replaced. The Portfolio’s obligation to replace the securities borrowed in connection with a short sale will generally be secured by collateral deposited with the broker that consists of cash, U.S. government securities or other liquid high grade debt obligations. In addition, the Portfolio will either place in a segregated account with its custodian or denote on its custody records an amount of cash, U.S. government securities or other liquid high grade debt obligations equal to the difference, if any, between (1) the market value of the securities sold at the time they were sold short and (2) any cash, U.S. government securities or other liquid high grade debt obligations deposited as collateral with the broker in connection with the short sale (not including the proceeds of the short sale). Short sales by the Portfolios involve certain risks and special considerations. Possible losses from short sales differ from losses that could be incurred from a purchase of a security because losses from short sales may be unlimited, whereas losses from purchases cannot exceed the total amount invested.
5. Swap Agreements: Each Portfolio (other than the Mid Cap Growth Portfolio) may enter into swap agreements to exchange the interest rate on, or return generated by, one nominal instrument for the return generated by another nominal instrument. Cash collateral for swap agreements, if applicable, is deposited with the broker serving as counter-party to the agreement, and is included in “Due from (to) Broker” on the Statements of Assets and Liabilities. The following summarizes swaps entered into by the Portfolios:
Credit Default Swaps: Credit default swaps involve commitments to pay a fixed rate in exchange for payment if a credit event affecting a third party (the referenced company) occurs. Credit events may include a failure to pay interest, bankruptcy, or restructuring. The Portfolio accrues for interim payments on swap contracts on a daily basis, with the net amount recorded within unrealized appreciation (depreciation) of swap contracts on the Statements of Assets and Liabilities. Once interim payments are settled in cash, the net amount is recorded within realized gain (loss) on swaps on the Statements of Operations. Credit default swaps are marked-to-market daily based upon quotations from market makers and the change, if any, is recorded as unrealized appreciation or depreciation in the Statements of Operations.
Interest Rate Swaps: Interest rate swaps involve the exchange of commitments to pay and receive interest based on a notional principal amount. The Portfolio accrues for interim payments on swap contracts on a daily basis, with the net amount recorded within unrealized appreciation (depreciation) of swap contracts on the Statements of Assets and Liabilities. Once interim payments are settled in cash, the net amount is recorded within realized gain (loss) on swaps on the Statements of Operations. In a zero-coupon interest rate swap, payments only occur at maturity, at which time one counterparty pays the total compounded fixed rate over the life of the swap and the other pays the
184
| 2007 Annual Report |
| |
| September 30, 2007 |
Notes to Financial Statements (cont’d)
total compounded floating rate that would have been earned had a series of LIBOR investments been rolled over through the life of the swap. The Portfolio amortizes its interest payment obligation over the life of the swap. The amortized portion of this payment is recorded within realized gain (loss) on the Statements of Operations. The unamortized portion of this payment is included in “Due from (to) Broker” on the Statements of Assets and Liabilities. Interest rate swaps are marked-to-market daily based upon quotations from market makers and the change, if any, is recorded as unrealized appreciation or depreciation in the Statements of Operations.
Total Return Swaps: Total return swaps involve commitments to pay interest in exchange for a market-linked return based on a notional amount. To the extent the total return of the security or index underlying the transaction exceeds or falls short of the offsetting interest rate obligation, the Portfolio will receive a payment from or make a payment to the counterparty, respectively. Total return swaps are marked-to-market daily based upon quotations from market makers and the change, if any, is recorded as unrealized appreciation or depreciation in the Statements of Operations. Periodic payments received or made at the end of each measurement period, but prior to termination, are recorded as realized gains or losses in the Statements of Operations.
Realized gains or losses on maturity or termination of swaps are presented in the Statements of Operations. Because there is no organized market for these swap agreements, the unrealized gain (loss) reported in the Statements of Assets and Liabilities may differ from that which would be realized in the event the Portfolio terminated its position in the agreement. Risks may arise upon entering into these agreements from the potential inability of the counterparties to meet the terms of the agreements and are generally limited to the amount of net interest payments to be received, if any, at the date of default. Risks also arise from potential losses from adverse market movements and such losses could exceed the related amounts shown in the Statements of Assets and Liabilities.
6. Structured Investments: Certain Portfolios may invest in structured investments whose values are linked either directly or inversely to changes in foreign currencies, interest rates, commodities, indices, equity securities or other underlying instruments. A Portfolio uses these securities to increase or decrease its exposure to different underlying instruments and to gain exposure to markets that might be difficult to invest in through conventional securities. Structured investments may be more volatile than their underlying instruments, but any loss is limited to the amount of the original investment.
7. Delayed Delivery Commitments: Each Portfolio may purchase or sell securities on a when-issued or forward commitment basis. Payment and delivery may take place a month or more after the date of the transaction. The price of the underlying securities and the date when the securities will be delivered and paid for are fixed at the time the transaction is negotiated. Liquid securities or cash is designated in an amount at least equal to these commitments. Securities held for this purpose cannot be sold while this strategy is outstanding, unless replaced with other assets. As a result, there is a possibility that as designated assets reach certain levels, a Portfolio may lose some flexibility in managing its investments, responding to shareholder redemption requests, or meeting other current obligations. Such transactions may give rise to a form of leverage. This can cause a Portfolio to be more volatile than if it had not been leveraged, as leverage tends to exaggerate the effect of any increase or decrease in the value of the Portfolio’s securities.
8. Foreign Currency Translation and Foreign Currency Exchange Contracts: The books and records of the Fund are maintained in U.S. dollars. Foreign currency amounts are translated into U.S. dollars at the bid prices of such currencies against U.S. dollars quoted by a bank. Net realized gains (losses) on foreign currency transactions represent net foreign exchange gains (losses) from foreign currency exchange contracts, disposition of foreign currencies, currency gains or losses realized between the trade and settlement dates on securities transactions, and the difference between the amount of investment income and foreign withholding taxes recorded on a Portfolio’s books and the U.S. dollar equivalent of amounts actually received or paid.
A foreign currency exchange contract is an agreement between two parties to buy or sell currency at a set price on a future date. Each Portfolio (except the Core Fixed Income and Long Duration Fixed Income Portfolios) may enter into foreign currency exchange contracts to protect securities and related receivables and payables against future changes in foreign exchange rates and, in certain situations, to gain exposure to foreign currencies. Certain Portfolios may also enter into cross currency hedges which involve the sale of one currency against the positive exposure to a different currency. Cross currency hedges may be used for hedging purposes or to establish an active exposure to the exchange rate between any two currencies. Fluctuations in the value of such contracts are recorded as unrealized appreciation or depreciation; realized gains or losses, which are disclosed in the Statements of Operations, include net gains or losses on contracts which have been terminated by settlements.
185
2007 Annual Report | |
| |
September 30, 2007 | |
Notes to Financial Statements (cont’d)
Risks may arise upon entering into these contracts from the potential inability of counterparties to meet the terms of their contracts and are generally limited to the amount of unrealized gain on the contract, if any, at the date of default. Risks may also arise from unanticipated movements in the value of the foreign currency relative to the U.S. dollar.
Certain Portfolios’ net assets include foreign denominated securities and currency. The net assets of these Portfolios are presented at the foreign exchange rates and market values at the close of the period. The Portfolios do not isolate that portion of the results of operations arising as a result of changes in the foreign exchange rates from the fluctuations arising from changes in the market prices of the securities held at period end. Similarly, the Portfolios do not isolate the effect of changes in foreign exchange rates from the fluctuations arising from changes in the market prices of securities sold during the period. Accordingly, the components of realized and unrealized foreign currency gains (losses) representing foreign exchange changes on investments is included in the reported net realized and unrealized gains (losses) on investment transactions and balances. Changes in currency exchange rates will affect the value of and investment income from such securities and currency.
Foreign security and currency transactions may involve certain considerations and risks not typically associated with those of U.S. dollar denominated transactions as a result of, among other factors, the possibly lower level of governmental supervision, relative currency valuation fluctuation, regulation of foreign securities markets and the possibility of political or economic instability.
9. Purchased and Written Options: Certain Portfolios may write covered call and put options on portfolio securities and other financial instruments. Premiums are received and are recorded as liabilities. The liabilities are subsequently adjusted to reflect the current value of the options written. Premiums received from writing options which expire are treated as realized gains. Premiums received from writing options which are exercised or are closed are added to or offset against the proceeds or amount paid on the transaction to determine the net realized gain or loss. By writing a covered call option, a Portfolio, in exchange for the premium, foregoes the opportunity for capital appreciation above the exercise price should the market price of the underlying security increase. By writing a put option, a Portfolio, in exchange for the premium, accepts the risk of having to purchase a security at an exercise price that is above the current market price.
Certain Portfolios may purchase call and put options on their portfolio securities or other financial instruments. Each Portfolio may purchase call options to protect against an increase in the price of the security or financial instrument it anticipates purchasing. Each Portfolio may purchase put options on securities which it holds or other financial instruments to protect against a decline in the value of the security or financial instrument or to close out covered written put positions. Risks may arise from an imperfect correlation between the change in market value of the securities held by the Portfolio and the prices of options relating to the securities purchased or sold by the Portfolio and from the possible lack of a liquid secondary market for an option. The maximum exposure to loss for any purchased option is limited to the premium initially paid for the option.
10. Redemption Fees: Shares of the Balanced, Equities Plus, Mid Cap Growth, U.S. Mid Cap Value, Value, Core Fixed Income, Core Plus Fixed Income, Intermediate Duration, Investment Grade Fixed Income, Limited Duration, Long Duration Fixed Income and Municipal Portfolios redeemed within seven days (30 days with respect to the U.S. Small Cap Value, High Yield and International Fixed Income Portfolios) of purchase may be subject to a 2% redemption fee, payable to the Portfolio. The redemption fee is designed to protect each Portfolio and its shareholders from the effects of short-term trading. These fees, if any, are included on the Statements of Changes in Net Assets.
11. New Accounting Pronouncements: In July 2006, the Financial Accounting Standards Board (“FASB”) issued Interpretation 48, “Accounting for Uncertainty in Income Taxes — an Interpretation of FASB Statement No. 109” (“FIN 48”). FIN 48 clarifies the accounting for income taxes by prescribing the minimum recognition threshold a tax position must meet before being recognized in the financial statements. FIN 48 is effective for fiscal years beginning after December 15, 2006 and is to be applied to all open tax years as of the effective date. Recent SEC guidance allows implementing FIN 48 in the Portfolio NAV calculations as late as the Portfolio’s last NAV calculation in the first required financial statement period. As a result, the Fund will incorporate FIN 48 in its next semi annual report. The impact to the Portfolios’ financial statements, if any, is currently being assessed.
In September 2006, Statement of Financial Accounting Standards No. 157, Fair Value Measurements (“SFAS 157”), was issued and is effective for fiscal years beginning after November 15, 2007. SFAS 157 defines fair value, establishes a framework for measuring fair value and expands disclosures about fair value measurements. Management is currently evaluating the impact the adoption of
186
| 2007 Annual Report |
| |
| September 30, 2007 |
Notes to Financial Statements (cont’d)
SFAS 157 will have on the Portfolios’ financial statement disclosures.
In February 2007, the FASB issued Statement of Financial Accounting Standards No. 159, “The Fair Value Option for Financial Assets and Financial Liabilities – including an amendment of FASB Statement No. 115” (“SFAS 159”), which is effective for fiscal years beginning after November 15, 2007. SFAS 159 permits entities to elect to measure certain financial assets and liabilities at fair value. The fair value option may be applied instrument by instrument, is irrevocable and is applied only to entire instruments and not to portions of instruments. SFAS 159 also establishes presentation and disclosure requirements designed to facilitate comparisons between entities that choose different measurement attributes for similar types of assets and liabilities. Management is currently evaluating the impact the adoption of SFAS 159 will have on the Portfolios’ financial statement disclosures.
12. Other: Security transactions are accounted for on the date the securities are purchased or sold. Costs used in determining realized gains and losses on the sale of investment securities are those of specific securities sold.
Discounts and premiums on securities purchased are accreted/amortized over their respective lives. Most expenses of the Fund can be directly attributed to a particular Portfolio. Expenses which cannot be directly attributed are apportioned among the Portfolios on the basis of their relative net assets. Income, expenses (other than class specific expenses) and realized and unrealized gains or losses are allocated to each class of shares based upon their relative net assets.
B. Investment Advisory Fees. Morgan Stanley Investment Management Inc. (the Adviser” or “MS Investment Management”), a wholly-owned subsidiary of Morgan Stanley, performs investment advisory services at a fee calculated by applying a quarterly rate based on the annual percentage rate listed below, to each Portfolio’s average daily net assets for the quarter.
Portfolio | | Advisory Fee |
Balanced | | 0.450% |
Equities Plus | | 0.375% |
Mid Cap Growth | | 0.500% |
U.S. Mid Cap Value | | 0.720% first $1 billion |
| | 0.650% over $1 billion |
U.S. Small Cap Value | | 0.670% first $500 million |
| | 0.645% next $500 million |
| | 0.620% over $1 billion |
Value | | 0.500% first $1 billion |
| | 0.450% next $1 billion |
| | 0.400% next $1 billion |
| | 0.350% over $3 billion |
Core Fixed Income | | 0.375% |
Core Plus Fixed Income | | 0.375% first $1 billion |
| | 0.300% over $1 billion |
High Yield | | 0.420% first $500 million |
| | 0.345% next $250 million |
| | 0.295% next $250 million |
| | 0.270% next $1 billion |
| | 0.245% next $1 billion |
| | 0.220% over $3 billion |
Intermediate Duration | | 0.375% |
International Fixed Income | | 0.375% |
Investment Grade Fixed Income | | 0.375% |
Limited Duration | | 0.300% |
Long Duration Fixed Income | | 0.375% |
Municipal | | 0.375% |
With respect to certain portfolios, the Adviser has voluntarily agreed to reduce the fees payable to it and, if necessary, reimburse the Portfolios for certain expenses, after giving effect to custody fee offsets, so that annual operating expenses will not exceed voluntary expense limitations established for each class of shares as presented in the table below.
| | Voluntary Expense Limitations | |
| | Institutional | | Investment | | Adviser | |
Portfolio | | Class | | Class | | Class | |
| | | | | | | |
Balanced | | — | % | — | % | — | % |
Equities Plus | | 0.600 | | — | | 0.850 | |
Mid Cap Growth | | — | | — | | — | |
U.S. Mid Cap Value | | — | | — | | — | |
U.S. Small Cap Value | | — | | — | | — | |
Value | | — | | — | | — | |
Core Fixed Income | | 0.500 | | 0.500 | | 0.750 | |
Core Plus Fixed Income | | — | | — | | — | |
High Yield | | — | | — | | — | |
Intermediate Duration | | — | | — | | — | |
International Fixed Income | | — | | — | | — | |
Investment Grade Fixed Income | | — | | — | | — | |
Limited Duration | | — | | — | | — | |
Long Duration Fixed Income | | 0.500 | | — | | 0.750 | |
Municipal | | 0.500 | | — | | 0.750 | |
Fee waivers and/or expense reimbursements are voluntary and may be commenced or terminated at any time. For the year ended September 30, 2007, the Portfolios had advisory fees waived and/or certain expenses reimbursed as follows:
| | Advisory Fees Waived | |
| | and/or Reimbursed | |
Portfolio | | (000) | |
Equities Plus | | $ | 71 | |
Core Fixed Income | | 141 | |
Long Duration Fixed Income | | 110 | |
Municipal | | 9 | |
| | | | |
187
2007 Annual Report | |
| |
September 30, 2007 | |
Notes to Financial Statements (cont’d)
Morgan Stanley Investment Management Limited (“MSIM Limited”) serves as Sub-Adviser to the International Fixed Income Portfolio. MSIM Limited is a wholly-owned subsidiary of Morgan Stanley. Under an Investment Sub-Advisory Agreement with the Adviser, MSIM Limited, subject to the control and supervision of the Fund, its Officers, Trustees and the Adviser, and in accordance with the investment objectives, policies and restrictions of the Portfolio, makes certain day-today investment decisions for the Portfolio and places certain of the Portfolio’s purchase and sales orders. The Adviser pays MSIM Limited on a monthly basis a portion of the net advisory fees the Adviser receives from the Portfolio.
C. Administration Fees. MS Investment Management (the “Administrator”) also provides the Fund with administration services pursuant to an administration agreement for an annual fee, accrued daily and paid monthly, of 0.08% of each Portfolio’s average daily net assets.
Under an agreement between the Administrator and JPMorgan Investor Services Co. (“JPMIS”), a corporate affiliate of JPMorgan Chase Bank, N.A., JPMIS provides certain administrative services to the Fund. For such services, the Administrator pays JPMIS a portion of the fee the Administrator receives from the Fund. An employee of JPMIS is an officer of the Fund.
D. Distribution and Shareholder Servicing Fees. Morgan Stanley Distribution, Inc. (“MSDI” or the “Distributor”), a wholly-owned subsidiary of the Adviser, serves as the distributor for the Fund.
Each Portfolio pays the Distributor a shareholder servicing fee, accrued daily and paid monthly, at an annual rate of up to 0.15% of the Portfolio’s average daily net assets attributable to Investment Class shares pursuant to a Shareholder Service Agreement (the “Agreement”). Effective July 1, 2007, each Portfolio pays the Distributor a shareholder servicing fee, accrued daily and paid monthly, at an annual rate of up to 0.25% of the Portfolio’s average daily net assets attributable to Adviser Class shares pursuant to a Shareholder Service Plan. The shareholder servicing fee is used to support the expenses associated with servicing and maintaining accounts. The Distributor may compensate other parties for providing shareholder support services to investors who purchase Investment Class or Adviser Class shares. The Distributor has voluntarily agreed to waive 0.10% of the 0.25% shareholder servicing fee it is entitled to receive from the Adviser Class shares’ average daily net assets for the Investment Grade Fixed Income Portfolio.
Prior to July 1, 2007, in accordance with a Plan of Distribution (the “12b-1 Plan”) pursuant to Rule 12b-1 under the 1940 Act between the Adviser Class shares of the Fund and the Distributor, the Distributor had provided certain services in connection with the promotion of sales of the Fund’s Adviser Class shares. The 12b-1 Plan was terminated effective July 1, 2007.
E. Custodian Fees. JPMorgan Chase Bank, N.A. (the “Custodian”) serves as Custodian for the Fund in accordance with a custodian agreement. The Custodian holds cash, securities, and other assets of the Fund as required by the 1940 Act.
The Fund has entered into an arrangement with its Custodian whereby credits realized on uninvested cash balances were used to offset a portion of each applicable Portfolio’s expenses. These custodian credits are shown as “Expense Offset” on the Statements of Operations.
F. Portfolio Investment Activity
1. Security Transactions: For the year ended September 30, 2007, purchases and sales of investment securities other than temporary cash investments and long-term U.S. government securities were:
| | Purchases | | Sales | |
Portfolio | | (000) | | (000) | |
Balanced | | $ | 155,240 | | $ | 156,072 | |
Equities Plus | | 13,053 | | 11,977 | |
Mid Cap Growth | | 1,859,949 | | 1,542,527 | |
U.S. Mid Cap Value | | 141,777 | | 130,574 | |
U.S. Small Cap Value | | 367,926 | | 417,381 | |
Value | | 160,129 | | 197,385 | |
Core Fixed Income | | 327,982 | | 244,388 | |
Core Plus Fixed Income | | 3,762,874 | | 2,890,901 | |
High Yield | | 75,049 | | 88,523 | |
Intermediate Duration | | 112,498 | | 116,406 | |
International Fixed Income | | 168,188 | | 150,704 | |
Investment Grade Fixed Income | | 642,698 | | 518,965 | |
Limited Duration | | 570,346 | | 613,348 | |
Long Duration Fixed Income | | 7,673 | | 2,207 | |
Municipal | | 564,822 | | 228,795 | |
| | | | | | | |
For the year ended September 30, 2007, purchases and sales of long-term U.S. government securities were:
| | Purchases | | Sales | |
Portfolio | | (000) | | (000) | |
Balanced | | $ | 18,545 | | $ | 24,753 | |
Core Fixed Income | | 31,128 | | 53,569 | |
Core Plus Fixed Income | | 173,006 | | 602,698 | |
High Yield | | 5,214 | | 21,163 | |
Intermediate Duration | | 5,891 | | 5,890 | |
International Fixed Income | | — | | 6,999 | |
Investment Grade Fixed Income | | 47,791 | | 107,063 | |
Limited Duration Portfolio | | 11,220 | | — | |
Long Duration Fixed Income | | 4,581 | | 10,589 | |
| | | | | | | |
188
| 2007 Annual Report |
| |
| September 30, 2007 |
Notes to Financial Statements (cont’d)
2. Transactions with Affiliates: The Portfolios invest in the Institutional Class of portfolios within the Morgan Stanley Institutional Liquidity Funds (the “Liquidity Funds”), an open-end management investment companies managed by the Adviser.
A summary of the Portfolio’s transactions in the shares of affiliated issuers during the year ended September 30, 2007 is set forth below:
| | Market Value | | Purchases | | Sales | | Interest | | Market Value | |
| | September 30, 2006 | | at Cost | | Proceeds | | Income | | September 30, 2007 | |
Portfolio | | (000) | | (000) | | (000) | | (000) | | (000) | |
Balanced | | $ | — | | $ | 101,049 | | $ | 52,492 | | $ | 675 | | $ | 48,557 | |
Equities Plus | | — | | 18,218 | | 14,280 | | 48 | | 3,938 | |
Mid Cap Growth | | — | | 559,808 | | 393,320 | | 1,620 | | 166,488 | |
U.S. Mid Cap Value | | — | | 53,517 | | 49,112 | | 210 | | 4,405 | |
U.S. Small Cap Value | | — | | 126,513 | | 79,203 | | 1,012 | | 47,310 | |
Value | | — | | 80,010 | | 69,049 | | 373 | | 10,961 | |
Core Fixed Income | | — | | 115,719 | | 82,743 | | 1,095 | | 32,976 | |
Core Plus Fixed Income | | — | | 998,503 | | 767,558 | | 6,494 | | 230,945 | |
High Yield | | — | | 55,089 | | 44,146 | | 194 | | 10,943 | |
Intermediate Duration | | — | | 46,763 | | 18,770 | | 407 | | 27,993 | |
International Fixed Income | | — | | 59,402 | | 53,557 | | 173 | | 5,845 | |
Investment Grade Fixed Income | | — | | 182,786 | | 151,132 | | 1,052 | | 31,654 | |
Limited Duration | | — | | 218,857 | | 153,260 | | 1,317 | | 65,597 | |
Long Duration Fixed Income | | — | | 3,866 | | 2,763 | | 9 | | 1,103 | |
Municipal | | — | | 220,039 | | 207,547 | | 269 | | 12,492 | |
| | | | | | | | | | | | | | | | |
Investment Advisory fees paid by the Portfolios are reduced by an amount equal to their pro-rata share of the advisory and administration fees paid by the Liquidity Funds (“Rebate”). For the year ended September 30, 2007, advisory fees paid were reduced as follows:
| | Rebate | |
Portfolio | | (000) | |
Balanced | | $ | 13 | |
Equities Plus | | 1 | |
Mid Cap Growth | | 32 | |
U.S. Mid Cap Value | | 4 | |
U.S. Small Cap Value | | 20 | |
Value | | 7 | |
Core Fixed Income | | 22 | |
Core Plus Fixed Income | | 129 | |
High Yield | | 4 | |
Intermediate Duration | | 8 | |
International Fixed Income | | 3 | |
Investment Grade Fixed Income | | 21 | |
Limited Duration | | 26 | |
Long Duration Fixed Income | | @— | |
Municipal | | 6 | |
| | | | |
@ Amount is less than $500. | | | |
During the year ended September 30, 2007, the following Portfolios paid brokerage commissions to Morgan Stanley & Co., an affiliated broker/dealer.
Portfolio | | Broker
Commissions
(000) | |
Balanced | | $ | @–– | |
Mid Cap Growth | | 56 | |
U.S. Mid Cap Value | | 6 | |
U.S. Small Cap Value | | 2 | |
Value | | 6 | |
| | | | |
@ Amount is less than $500.
G. Securities Lending. Certain Portfolios may lend securities to qualified financial institutions, such as broker-dealers, to earn additional income. Any increase or decrease in the fair value of the securities loaned that might occur and any interest earned or dividends declared on those securities during the term of the loan would remain in the Portfolio. Portfolios that lend securities receive cash or securities as collateral in an amount equal to or exceeding 100% of the current fair value of the loaned securities. The collateral is marked to market daily, by the securities lending agent, to ensure that a minimum of 100% collateral coverage is maintained.
189
2007 Annual Report | |
| |
September 30, 2007 | |
Notes to Financial Statements (cont’d)
Based on pre-established guidelines, the securities lending agent invests any cash collateral that is received in high-quality short-term investments. Securities lending income is generated from the earnings on the invested collateral and borrowing fees, less any rebates owed to the borrowers and compensation to the lending agent, and is included in the Portfolios’ Statements of Operations in interest income. Risks in securities lending transactions are that a borrower may not provide additional collateral when required or return the securities when due, and that the value of the short-term investments will be less than the amount of cash collateral plus any rebate that is required to be returned to the borrower. The value of loaned securities and related collateral outstanding at September 30, 2007 are as follows:
| | Value of | | | |
| | Loaned | | Value of | |
| | Securities | | Collateral | |
Portfolio | | (000) | | (000) | |
| | | | | |
Balanced | | $ | 23,249 | | $ | 23,627 | |
Value | | 27,394 | | 27,897 | |
Equities Plus | | 37 | | 38 | |
Core Fixed Income | | 31,753 | | 32,371 | |
Core Plus Fixed Income | | 207,604 | | 211,574 | |
High Yield | | 41,597 | | 42,093 | |
Investment Grade Fixed Income | | 48,038 | | 48,943 | |
| | | | | | | |
The following Portfolios had income from securities lending (after rebates to borrowers and allocation to the securities lending agent):
| | Net Interest Earned | |
| | by Portfolio | |
Portfolio | | (000) | |
| | | |
Balanced | | $ | 27 | |
Equities Plus | | @— | |
Value | | 71 | |
Core Fixed Income | | 32 | |
Core Plus Fixed Income | | 389 | |
High Yield | | 117 | |
Investment Grade Fixed Income | | 48 | |
| | | | |
@ Amount is less than $500. | | | |
H. Federal Income Taxes. It is each Portfolio’s intention to continue to qualify as a regulated investment company and distribute all of its taxable income. Accordingly, no provision for Federal income taxes is required in the financial statements. Dividend income and distributions to shareholders are recorded on the ex-dividend date. Interest income is recognized on the accrual basis. Dividends from net investment income, if any, are declared and paid quarterly except for those of the Intermediate Duration, Limited Duration and Municipal Portfolios which are declared and paid monthly and those of the International Fixed Income, Mid Cap Growth, U.S. Mid Cap Value and U.S. Small Cap Value Portfolios which are declared and paid annually. Net realized capital gains, if any, are distributed at least annually.
The tax character of the Municipal Portfolio’s ordinary income distributions include tax exempt as well as taxable components. The undistributed ordinary income for the Municipal Portfolio includes tax exempt as well as taxable components.
The tax character for distributions paid may differ from the character of distributions shown on the Statements of Changes in Net Assets due to short-term capital gains being treated as ordinary income for tax purposes. The tax character of distributions paid during fiscal 2007 and 2006 were as follows:
| | 2007
Distributions
Paid From: | | 2006
Distributions
Paid From: | |
| | | | | | Long- | | | | | | Long- | |
| | | | Tax- | | term | | | | Tax- | | term | |
| | Ordinary | | Exempt | | Capital | | Ordinary | | Exempt | | Capital | |
| | Income | | Income | | Gain | | Income | | Income | | Gain | |
Portfolio | | (000) | | (000) | | (000) | | (000) | | (000) | | (000) | |
| | | | | | | | | | | | | |
Balanced | | $ | 5,905 | | $ | — | | $ | — | | $ | 6,745 | | $ | — | | $ | — | |
Equities Plus | | 2,025 | | — | | 607 | | 150 | | — | | — | |
Mid Cap Growth | | 6,935 | | — | | — | | — | | — | | — | |
U.S. Mid Cap Value | | 992 | | — | | — | | 1,077 | | — | | — | |
U.S. Small Cap Value | | 19,628 | | — | | 63,579 | | 9,470 | | — | | 29,317 | |
Value | | 16,197 | | — | | 49,107 | | 21,148 | | — | | 105,355 | |
Core Fixed Income | | 15,255 | | — | | — | | 13,189 | | — | | 1,081 | |
Core Plus Fixed Income | | 148,778 | | — | | — | | 137,775 | | — | | — | |
High Yield | | 16,628 | | — | | — | | 17,160 | | — | | — | |
Intermediate Duration | | 7,079 | | — | | — | | 10,476 | | — | | — | |
International Fixed Income | | 5,213 | | — | | — | | 7,333 | | — | | 161 | |
Investment Grade Fixed Income | | 27,744 | | — | | — | | 26,432 | | — | | 287 | |
Limited Duration | | 54,837 | | — | | — | | 44,031 | | — | | — | |
Long Duration Fixed Income | | 1,102 | | — | | 48 | | — | | — | | — | |
Municipal | | 25,018 | | 6,515 | | — | | 2,236 | | 19,656 | | — | |
| | | | | | | | | | | | | | | | | | | |
The amount and character of income and gains to be distributed are determined in accordance with income tax regulations which may differ from U.S. generally accepted accounting principles. The book/tax differences are either considered temporary or permanent in nature.
Temporary differences are generally due to differing book and tax treatments in the timing of the recognition of gains or losses on securities, options, swaps, forwards and futures, including Post October losses.
190
| 2007 Annual Report |
| |
| September 30, 2007 |
Notes to Financial Statements (cont’d)
Permanent differences are generally due to REIT adjustments, foreign currency transactions, foreign futures transactions, swap transactions, distribution reclass, paydown adjustments, non-deductible organization costs and expiration of capital loss carryforward. These resulted in the following reclassifications among the Portlios’components of net assets at September 30, 2007:
| | Accumulated | | | | | |
| | Undistributed | | | | | |
| | (Distributions | | | | | |
| | in Excess of) | | | | | |
| | Net Investment | | Accumulated | | | |
| | Income | | Net Realized | | Paid-in | |
| | (Loss) | | Gain (Loss) | | Capital | |
Portfolio | | (000)s | | (000) | | (000) | |
Balanced | | $ | 825 | | $ | (585 | ) | $ | (240 | ) |
Equities Plus | | 53 | | (6 | ) | (47 | ) |
Mid Cap Growth | | (87 | ) | 87 | | — | |
U.S. Mid Cap Value | | (@— | ) | @— | | — | |
U.S. Small Cap Value | | (358 | ) | 396 | | (38 | ) |
Value | | (@— | ) | @— | | — | |
Core Fixed Income | | 1,709 | | (615 | ) | (1,094 | ) |
Core Plus Fixed Income | | 20,712 | | (12,508 | ) | (8,204 | ) |
High Yield | | 360 | | 7,307 | | (7,667 | ) |
Intermediate Duration | | 177 | | 71 | | (248 | ) |
International Fixed Income | | 2,911 | | (2,911 | ) | — | |
Investment Grade Fixed Income | | 4,957 | | (2,936 | ) | (2,021 | ) |
Limited Duration | | (907 | ) | 2,201 | | (1,294 | ) |
Long Duration Fixed Income | | (3 | ) | 92 | | (89 | ) |
Municipal | | 3,457 | | (3,261 | ) | (196 | ) |
| | | | | | | | | | |
@ Amount is less than $500.
At September 30, 2007, the components of distributable earnings on a tax basis were as follows:
| | Undistributed | | | | Undistributed | |
| | Ordinary | | Tax-Exempt | | Long-Term | |
| | Income | | Income | | Capital Gain | |
Portfolio | | (000) | | (000) | | (000) | |
Balanced | | $ | 2,497 | | — | | $ | — | |
Equities Plus | | 1,396 | | — | | 1,126 | |
Mid Cap Growth | | 8,804 | | — | | — | |
U.S. Mid Cap Value | | 953 | | — | | — | |
U.S. Small Cap Value | | 30,913 | | — | | 55,446 | |
Value | | 6,334 | | — | | 24,662 | |
Core Fixed Income | | 3,688 | | — | | — | |
Core Plus Fixed Income | | 10,349 | | — | | — | |
High Yield | | 5,234 | | — | | — | |
Intermediate Duration | | 935 | | — | | — | |
International Fixed Income | | 9,885 | | — | | — | |
Investment Grade Fixed Income | | 4,903 | | — | | — | |
Limited Duration | | 5,938 | | — | | — | |
Long Duration Fixed Income | | 406 | | — | | — | |
Municipal | | 1,997 | | 2,751 | | 1,358 | |
| | | | | | | | | |
At September 30, 2007, cost, unrealized appreciation, unrealized depreciation and net unrealized appreciation (depreciation) of securities for Federal income tax purposes were:
| | | | | | | | Net | |
| | | | | | | | Unrealized | |
| | | | | | | | Appreciation | |
| | Cost | | Appreciation | | Depreciation | | (Depreciation) | |
Portfolio | | (000) | | (000) | | (000) | | (000) | |
Balanced | | $ | 313,126 | | $ | 58,386 | | $ | (6,128 | ) | $ | 52,258 | |
Equities Plus | | 28,743 | | 63 | | (677 | ) | (614 | ) |
Mid Cap Growth | | 2,537,562 | | 705,627 | | (48,569 | ) | 657,058 | |
U.S. Mid Cap Value | | 158,343 | | 21,342 | | (5,890 | ) | 15,452 | |
U.S. Small Cap Value | | 727,821 | | 165,605 | | (24,023 | ) | 141,582 | |
Value | | 521,582 | | 75,351 | | (7,891 | ) | 67,460 | |
Core Fixed Income | | 379,119 | | 1,468 | | (5,806 | ) | (4,338 | ) |
Core Plus Fixed | | | | | | | | | |
Income | | 3,226,933 | | 19,958 | | (71,838 | ) | (51,880 | ) |
High Yield | | 277,894 | | 3,227 | | (40,298 | ) | (37,071 | ) |
Intermediate Duration | | 155,802 | | 364 | | (2,058 | ) | (1,694 | ) |
International Fixed | | | | | | | | | |
Income | | 201,202 | | 10,495 | | (1,633 | ) | 8,862 | |
Investment Grade | | | | | | | | | |
Fixed Income | | 619,680 | | 2,855 | | (8,068 | ) | (5,213 | ) |
Limited Duration | | 1,090,112 | | 1,531 | | (18,319 | ) | (16,788 | ) |
Long Duration Fixed | | | | | | | | | |
Income | | 25,086 | | 527 | | (147 | ) | 380 | |
Municipal | | 971,844 | | 25,171 | | (7,598 | ) | 17,573 | |
| | | | | | | | | | | | | |
At September 30, 2007, the following Portfolios had available for Federal income tax purposes unused capital losses, which will expire on the indicated dates:
| | Expiration Date September 30, | |
| | (000) | |
Portfolio | | 2008 | | 2009 | | 2010 | | 2011 | |
| | | | | | | | | |
Balanced | | $ | — | | $ | — | | $ | — | | $ | 21,499 | |
Mid Cap Growth | | — | | — | | 165,460 | | 303,325 | |
U.S. Mid Cap Value | | — | | — | | — | | 139,180 | |
Core Fixed Income | | — | | — | | — | | — | |
Core Plus Fixed Income | | — | | — | | — | | 36,930 | |
High Yield | | 12,236 | | 26,962 | | 20,212 | | 183,778 | |
Intermediate Duration | | — | | — | | — | | — | |
Investment Grade Fixed Income | | — | | — | | — | | — | |
Limited Duration | | — | | — | | — | | — | |
| | | | | | | | | | | | | |
191
2007 Annual Report | |
| |
September 30, 2007 | |
Notes to Financial Statements (cont’d)
| | Expiration Date September 30, | |
| | (000) | |
Portfolio | | 2012 | | 2013 | | 2014 | | 2015 | | Total | |
| | | | | | | | | | | |
Balanced | | $ | — | | $ | — | | $ | — | | $ | — | | $ | 21,499 | |
Mid Cap Growth | | — | | — | | — | | — | | 468,785 | |
U.S. Mid Cap Value | | — | | — | | — | | — | | 139,180 | |
Core Fixed Income | | — | | — | | 489 | | — | | 489 | |
Core Plus Fixed Income | | — | | — | | 7,135 | | 15,680 | | 59,745 | |
High Yield | | 205,458 | | 11,840 | | 874 | | 737 | | 462,097 | |
Intermediate Duration | | — | | 673 | | 1,559 | | 5,324 | | 7,556 | |
Investment Grade Fixed Income | | — | | — | | 607 | | 12 | | 619 | |
Limited Duration | | — | | 8,253 | | 8,229 | | 7,068 | | 23,550 | |
| | | | | | | | | | | | | | | | |
In addition to the $462,097,000 in unused capital losses attributed to the High Yield Portfolio in the table above, approximately $54,190,000 has been brought forward as a result of the Portfolio’s merger with the MSIF Inc. High Yield II Portfolio. The utilization of the capital loss carryforward in subsequent years may be limited pursuant to sections 382 and 383 of the Internal Revenue Code. This acquired capital loss carryforward is expected to expire between 2007-2014.
To the extent that capital loss carryforwards are used to offset any future capital gains realized during the carryforward period as provided by U.S. Federal income tax regulations, no capital gains tax liability will be incurred by a portfolio for gains realized and not distributed. To the extent that capital gains are offset, such gains will not be distributed to the shareholders.
During the year ended September 30, 2007, the following Portfolios utilized capital loss carryforwards for U.S. Federal income tax purposes of approximately:
| | Capital Loss | |
| | Carryforward | |
| | Utilized | |
Portfolio | | (000) | |
Balanced | | $ | 20,215 | |
Mid Cap Growth | | 321,771 | |
U.S. Mid Cap Value | | 33,211 | |
Core Fixed Income | | 96 | |
Municipal | | 943 | |
| | | | |
Under current tax law, certain capital and net foreign exchange losses realized after October 31 may be deferred and treated as occurring on the first day of the following fiscal year. For the year ended September 30, 2007, the following Portfolios elected to defer capital and currency losses occurring between November 1, 2006 and September 30, 2007 up to the following amounts:
| | Post-October | |
| | Capital | | Currency | |
| | Losses | | Losses | |
Portfolio | | (000) | | (000) | |
Mid Cap Growth | | $ | — | | $ | 86 | |
Core Fixed Income | | 606 | | — | |
Core Plus Fixed Income | | 745 | | 1,820 | |
High Yield | | — | | 635 | |
Investment Grade Fixed Income | | 2,778 | | — | |
Long Duration Fixed Income | | 27 | | — | |
| | | | | | | |
I. Contractual Obligations. The Fund enters into contracts that contain a variety of indemnifications. The Fund’s maximum exposure under these arrangements is unknown. However, the Fund has not had prior claims or losses pursuant to these contracts and expects the risk of loss to be remote.
J. Other. The High Yield Portfolio’s net assets are substantially comprised of high yield fixed income securities. The financial condition of an issuer of these securities and general economic and industry specific conditions may affect an issuer’s ability to make payments of income and principal on these securities and ultimately impact their valuation.
A portion of the securities of the Municipal Portfolio are insured by certain companies specializing in the insurance of municipal debt obligations. At September 30, 2007, approximately 82% of the net assets of the Municipal Portfolio are covered by such insurance. Listed below are the insurers that insure obligations constituting more than 10% of the Portfolio’s net assets:
| | % of | |
| | Portfolio’s | |
Insurers | | Net Assets | |
AMBAC | | 20.3 | % |
MBIA | | 24.2 | |
FGIC | | 17.4 | |
FSA | | 14.0 | |
192
| 2007 Annual Report |
| |
| September 30, 2007 |
Notes to Financial Statements (cont’d)
At September 30, 2007, certain Portfolios had otherwise unaffiliated record owners of 10% or greater. Investment activities of these shareholders could have a material impact on these Portfolios. These Portfolios and the aggregate percentage of such owners was as follows:
| | Percentage of Ownership | |
| | Institutional | | Investment | | Adviser | |
Portfolio | | Class | | Class | | Class | |
Balanced | | 83.4 | % | 98.6 | % | 96.6 | % |
Mid Cap Growth | | 30.4 | | — | | 79.0 | |
U.S. Mid Cap Value | | 64.3 | | 85.4 | | 78.1 | |
U.S. Small Cap Value | | 15.1 | | — | | 66.6 | |
Value | | 58.0 | | 100.0 | | 94.4 | |
Core Fixed Income | | — | | — | | 99.0 | |
Core Plus Fixed Income | | 24.2 | | 96.4 | | 90.0 | |
High Yield | | 18.6 | | — | | 84.1 | |
Intermediate Duration | | 47.1 | | 100.0 | | — | |
International Fixed Income | | 12.7 | | — | | — | |
Investment Grade Fixed Income | | 21.2 | | — | | — | |
Municipal | | 18.2 | | — | | 100.0 | |
K. Reverse Stock Split. After the close of business on November 10, 2006, High Yield Portfolio effected a 1 for 2 reverse stock split for the shares of the Portfolio. All transactions in capital stock and per share data prior to November 13, 2006 have been restated to give effect to the reverse stock split. The reverse stock split had no impact on the overall value of a shareholder’s investment in the Portfolio.
193
2007 Annual Report |
| |
September 30, 2007 |
Report of Independent Registered Public Accounting Firm
To the Board of Trustees and Shareholders of Morgan Stanley Institutional Fund Trust:
We have audited the accompanying Statements of Assets and Liabilities of Balanced Portfolio, Equities Plus Portfolio, Mid Cap Growth Portfolio, U.S. Mid Cap Value Portfolio, U.S. Small Cap Value Portfolio, Value Portfolio, Core Fixed Income Portfolio, Core Plus Fixed Income Portfolio, High Yield Portfolio, Intermediate Duration Portfolio, International Fixed Income Portfolio, Investment Grade Fixed Income Portfolio, Limited Duration Portfolio, Long Duration Fixed Income Portfolio, and Municipal Portfolio (the “Portfolios”) (fifteen of the portfolios constituting Morgan Stanley Institutional Fund Trust), including the portfolios of investments, as of September 30, 2007, and the related statements of operations for the year then ended, the statements of cash flows for Balanced Portfolio, Core Fixed Income Portfolio, Core Plus Fixed Income Portfolio, Intermediate Duration Portfolio, Investment Grade Fixed Income Portfolio, and Limited Duration Portfolio for the year then ended, and the statements of changes in net assets and the financial highlights for each of the periods indicated therein. These financial statements and financial highlights are the responsibility of the Funds’ management. Our responsibility is to express an opinion on these financial statements and financial highlights based on our audits.
We conducted our audits in accordance with the standards of the Public Company Accounting Oversight Board (United States). Those standards require that we plan and perform the audit to obtain reasonable assurance about whether the financial statements and financial highlights are free of material misstatement. We were not engaged to perform an audit of the Portfolios’ internal control over financial reporting. Our audits included consideration of internal control over financial reporting as a basis for designing audit procedures that are appropriate in the circumstances, but not for the purpose of expressing an opinion on the effectiveness of the Portfolios’ internal control over financial reporting. Accordingly, we express no such opinion. An audit also includes examining, on a test basis, evidence supporting the amounts and disclosures in the financial statements and financial highlights, assessing the accounting principles used and significant estimates made by management, and evaluating the overall financial statement presentation. Our procedures included confirmation of securities owned as of September 30, 2007, by correspondence with the custodian and brokers or by other appropriate auditing procedures where replies from brokers were not received. We believe that our audits provide a reasonable basis for our opinion.
In our opinion, the financial statements and financial highlights referred to above present fairly, in all material respects, the financial position of the aforementioned fifteen Portfolios of Morgan Stanley Institutional Trust Fund at September 30, 2007, the results of their operations for the year then ended, the cash flows for the aforementioned seven portfolios for the year then ended, and the changes in their net assets and the financial highlights for each of the periods indicated therein, in conformity with U.S. generally accepted accounting principles.
Boston, Massachusetts
November 19, 2007
194
| 2007 Annual Report |
| |
| September 30, 2007 |
Federal Income Tax Information: (unaudited)
For Federal income tax purposes, the following information is furnished with respect to the distributions paid by each applicable Portfolio during the taxable year ended September 30, 2007.
For corporate shareholders, the following percentages of dividends paid by each Portfolio qualified for the dividends received deduction. Additionally, the following percentages of each Portfolio’s dividends was attributable to qualifying U.S. Government obligations. (Please consult your tax advisor to determine if any portion of the dividends you received is exempt from state income tax.):
| | Div. Received | | Qualifying U.S. | |
Portfolio | | Deduction % | | Govt. Income % | |
Balanced | | 35.8 | % | 19.5 | % |
Mid Cap Growth | | 100.0 | | — | |
U.S. Mid Cap Value | | 100.0 | | — | |
U.S. Small Cap Value | | 28.2 | | — | |
Value | | 88.2 | | — | |
Core Fixed Income | | — | | 17.3 | |
Core Plus Fixed Income | | — | | 21.0 | |
High Yield | | 0.1 | | — | |
Investment Grade Fixed Income | | 0.3 | | 17.2 | |
Intermediate Duration | | — | | 14.2 | |
International Fixed Income | | — | | 7.0 | |
Limited Duration | | — | | 10.7 | |
Long Duration Fixed Income | | — | | 76.8 | |
Municipal | | 16.1 | | — | |
Each of the applicable Portfolios designated the following percentages of its income dividends as tax-exempt income dividends:
Portfolio | | Percentage | |
Municipal | | 79.3 | % |
Each of the applicable Portfolios designated and paid the following amounts as a long-term capital gain distribution:
| | Amount | |
Portfolio | | (000) | |
Equities Plus | | $ | 607 | |
U.S. Small Cap Value | | 63,579 | |
Value | | 49,107 | |
Long Duration Fixed Income | | 48 | |
| | | | |
For Federal income tax purposes, the following information is furnished with respect to the earnings of each applicable Portfolio for the taxable year ended September 30, 2007.
When distributed, certain earnings may be subject to a maximum tax rate of 15% as provided for the Jobs and Growth Tax Relief Reconiliation Act of 2003. Each of the applicable Portfolios designated up to the following maximum amounts as taxable at this lower rate:
| | Amount | |
Portfolio | | (000) | |
Balanced | | $ | 3,440 | |
Mid Cap Growth | | 6,935 | |
U.S. Mid Cap Value | | 992 | |
U.S. Small Cap Value | | 5,722 | |
Value | | 13,922 | |
Municipal | | 1,367 | |
| | | | |
In January, each applicable Portfolio provides tax information to shareholders for the preceding calendar year.
195
2007 Annual Report |
| |
September 30, 2007 |
An Important Notice Concerning Our U.S. Privacy Policy (unaudited)
POLICY CONCERNING CUSTOMER INFORMATION
Morgan Stanley Institutional Fund Trust (the “Fund”) is required by federal law to provide you with a copy of their Privacy Policy (the “Policy”) annually. The following Policy applies to current and former individual clients of the Fund. This Policy is not applicable to partnerships, corporations, trusts or other non-individual clients or account holders. Please note that this Policy may be amended at any time, and that you will be informed of any changes to this Policy as required by law.
THE FUND RESPECTS YOUR PRIVACY
The Fund appreciates that you have provided your personal financial information and strive to maintain the privacy of such information. This Policy describes, and is designed to help you understand, what non-public personal information the Fund may collect about you, why the Fund collects it, and when the Fund may share it with others. Throughout this Policy, the non-public information that personally identifies you or your accounts is referred to as “personal information.”
1. WHAT PERSONAL INFORMATION DOES THE FUND COLLECT ABOUT YOU?
To serve you better and manage your investment, it is important that the Fund collects and maintains accurate information about you. The Fund obtains this information from applications and other forms you submit, from your dealings with the Fund, and from third parties and other sources.
For example:
• The Fund collects information such as your name, address, e-mail address, and telephone/fax numbers through applications and other forms you may submit.
• The Fund may obtain information about account balances, your use of account(s) and the types of products and services you prefer to receive through your dealings and transactions with the Fund and other sources.
• The Fund may collect background information from and through third-party vendors to verify representations you have made and to comply with various regulatory requirements.
2. WHEN DOES THE FUND DISCLOSE PERSONAL INFORMATION COLLECTED ABOUT YOU?
To provide you with the products and services you request, to serve you better and to manage your investment, the Fund may disclose personal information collected about you to affiliated companies and to non-affiliated third parties as required or permitted by law.
a. Information the Fund discloses to affiliated companies:
The Fund does not disclose personal information collected about you to affiliated companies except to enable them to provide services on their behalf or as otherwise required or permitted by law.
b. Information the Fund discloses to third parties:
The Fund does not disclose personal information collected about you to non-affiliated third parties except to enable them to provide services on the Fund’s behalf, to perform joint marketing agreements with other financial institutions, or as otherwise required or permitted by law. For example, some instances where the Fund may disclose information about you to non-affiliated third parties include: for servicing and processing transactions, to protect against fraud, for institutional risk control or to respond to judicial process. When the Fund shares personal information with these third parties, they are required to limit their use of personal information to the particular purpose for which it was shared and they are not allowed to share personal information with others except to fulfill that limited purpose.
196
| 2007 Annual Report |
| |
| September 30, 2007 |
An Important Notice Concerning Our U.S. Privacy Policy (cont’d)
3. HOW DOES THE FUND PROTECT THE SECURITY AND CONFIDENTIALITY OF PERSONAL INFORMATION COLLECTED ABOUT YOU?
The Fund and/or its service providers maintain physical, electronic and procedural security measures to help safeguard the personal information collected about you. The Fund and its service providers have internal policies governing the proper handling of client information. Third parties that provide support or marketing services on the Fund’s behalf may also receive personal information, and they are required to adhere to confidentiality standards with respect to such information.
If you have any questions regarding this Policy, please contact a Fund representative at (800) 548-7786.
© 2007 Morgan Stanley Institutional Fund Trust
197
2007 Annual Report |
| |
September 30, 2007 |
Trustee and Officer Information (unaudited)
Independent Trustees:
| | | | | | | | Number of | | | |
| | | | | | | | Portfolios in | | | |
| | | | | | | | Fund Complex | | | |
| | | | | | | | Overseen by | | | |
Name, Age and Address of | | Position(s) Held | | Length of | | | | Independent | | Other Directorships Held by | |
Independent Trustee | | with Registrant | | Time Served* | | Principal Occupation(s) During Past 5 Years | | Trustee** | | Independent Trustee | |
Frank L. Bowman (62)
c/o Kramer Levin Naftalis &
Frankel LLP
Counsel to the Independent
Trustees
1177 Avenue of the Americas
New York, NY 10036 | | Trustee | | Since
August
2006 | | President and Chief Executive Officer, Nuclear Energy Institute (policy organization) (since February 2005); Director or Trustee of various Retail Funds and Institutional Funds (since August 2006); Chairperson of the Insurance Sub-Committee of the Valuation, Insurance and Compliance Committee (since February 2007); formerly, variously, Admiral in the U.S. Navy, Director of Naval Nuclear Propulsion Program and Deputy Administrator — Naval Reactors in the National Nuclear Security Administration at the U.S. Department of Energy (1996-2004). Honorary Knight Commander of the Most Excellent Order of the British Empire. | | 171 | | Director of the National Energy Foundation, the U.S. Energy Association, the American Council for Capital Formation and the Armed Services YMCA of the USA. | |
| | | | | | | | | | | |
Michael Bozic (66)
c/o Kramer Levin Naftalis &
Frankel LLP
Counsel to the Independent Trustees
1177 Avenue of the Americas
New York, NY 10036 | | Trustee | | Since
April
1994 | | Private investor; Chairperson of the Valuation, Insurance and Compliance Committee (since October 2006); Director or Trustee of the Retail Funds (since April 1994) and the Institutional Funds (since July 2003); formerly, Chairperson of the Insurance Committee (July 2006-September 2006); Vice Chairman of Kmart Corporation (December 1998-October 2000), Chairman and Chief Executive Officer of Levitz Furniture Corporation (November 1995-November 1998) and President and Chief Executive Officer of Hills Department Stores (May 1991-July 1995); variously Chairman, Chief Executive Officer, President and Chief Operating Officer (1987-1991) of the Sears Merchandise Group of Sears, Roebuck & Co. | | 173 | | Director of various business organizations. | |
| | | | | | | | | | | |
Kathleen A. Dennis (54)
c/o Kramer Levin Naftalis & Frankel LLP
Counsel to the Independent Trustees
1177 Avenue of the Americas
New York, NY 10036 | | Trustee | | Since August
2006 | | President, Cedarwood Associates (mutual fund consulting) (since July 2006); Chairperson of the Money Market and Alternatives Sub-Committee of the Investment Committee (since October 2006) and Director or Trustee of various Retail Funds and Institutional Funds (since August 2006); formerly, Senior Managing Director of Victory Capital Management (1993-2006). | | 171 | | None. | |
| | | | | | | | | | | |
Dr. Manuel H. Johnson (58)
c/o Johnson Smick
Group, Inc.
888 16th Street, NW
Suite 740
Washington, D.C. 20006 | | Trustee | | Since
July
1991 | | Senior Partner, Johnson Smick International, Inc. (consulting firm); Chairperson of the Investment Committee (since October 2006) and Director or Trustee of the Retail Funds (since July 1991) and the Institutional Funds (since July 2003); Co-Chairman and a founder of the Group of Seven Council (G7C) (international economic commission); formerly, Chairperson of the Audit Committee (July 1991-September 2006); Vice Chairman of the Board of Governors of the Federal Reserve System and Assistant Secretary of the U.S. Treasury. | | 173 | | Director of NVR, Inc. (home construction); Director of Evergreen Energy. | |
| | | | | | | | | | | |
Joseph J. Kearns (65)
c/o Kearns & Associates LLC
PMB754
23852 Pacific Coast Highway
Malibu, CA 90265 | | Trustee | | Since
August
1994 | | President, Kearns & Associates LLC (investment consulting); Chairperson of the Audit Committee (since October 2006) and Director or Trustee of the Retail Funds (since July 2003) and the Institutional Funds (since August 1994); formerly, Deputy Chairperson of the Audit Committee (July 2003-September 2006) and Chairperson of the Audit Committee of the Institutional Funds (October 2001- July 2003); CFO of the J. Paul Getty Trust. | | 174 | | Director of Electro Rent Corporation (equipment leasing), The Ford Family Foundation and the UCLA Foundation. | |
198
| 2007 Annual Report |
| |
| September 30, 2007 |
Trustee and Officer Information (cont’d)
Independent Trustees:
| | | | | | | | Number of | | | |
| | | | | | | | Portfolios in | | | |
| | | | | | | | Fund Complex | | | |
| | | | | | | | Overseen by | | | |
Name, Age and Address of | | Position(s) Held | | Length of | | | | Independent | | Other Directorships Held by | |
Independent Trustee | | with Registrant | | Time Served* | | Principal Occupation(s) During Past 5 Years | | Trustee** | | Independent Trustee | |
Michael F. Klein (48)
c/o Kramer Levin Naftalis &
Frankel LLP Counsel to the
Independent Trustees
1177 Avenue of the Americas
New York, NY 10036 | | Trustee | | Since August
2006 | | Managing Director, Aetos Capital, LLC (since March 2000) and Co-President, Aetos Alternatives Management, LLC (since January 2004); Chairperson of the Fixed-Income Sub-Committee of the Investment Committee (since October 2006) and Director or Trustee of various Retail Funds and Institutional Funds (since August 2006); formerly, Managing Director, Morgan Stanley & Co., Inc. and Morgan Stanley Dean Witter Investment Management, President, Morgan Stanley Institutional Funds (June 1998-March 2000) and Principal, Morgan Stanley & Co., Inc. and Morgan Stanley Dean Witter Investment Management (August 1997-December 1999). | | 171 | | Director of certain investment funds managed or sponsored by Aetos Capital, LLC; Director of Sanitized AG and Sanitized Marketing AG (specialty chemicals). | |
| | | | | | | | | | | |
Michael E. Nugent (71)
c/o Triumph Capital, L.P.
445 Park Avenue
New York, NY 10022 | | Chairperson of the Board and Trustee | | Chairperson of the Boards since July 2006 and Trustee since July 1991 | | General Partner, Triumph Capital, L.P. (private investment partnership); Chairperson of the Boards of the Retail Funds and Institutional Funds (since July 2006); Director or Trustee of the Retail Funds (since July 1991) and the Institutional Funds (since July 2001); formerly, Chairperson of the Insurance Committee (until July 2006); Vice President, Bankers Trust Company and BT Capital Corporation (1984-1988). | | 173 | | None. | |
| | | | | | | | | | | |
W. Allen Reed (60)
c/o Kramer Levin Naftalis &
Frankel LLP Counsel to the Independent Trustees
1177 Avenue of the Americas
New York, NY 10036 | | Trustee | | Since
August
2006 | | Chairperson of the Equity Sub-Committee of the Investment Committee (since October 2006) and Director or Trustee of various Retail Funds and Institutional Funds (since August 2006); formerly, President and CEO of General Motors Asset Management; Chairman and Chief Executive Officer of the GM Trust Bank and Corporate Vice President of General Motors Corporation (July 1994-December 2005). | | 171 | | Director of GMAC (financial services) and Temple-Inland Industries (packaging, banking and forest products); Director of Legg Mason, Inc. and Director of the Auburn University Foundation. | |
| | | | | | | | | | | |
Fergus Reid (75)
c/o Lumelite Plastics
Corporation
85 Charles Coleman Blvd.
Pawling, NY 12564 | | Trustee | | Since
June
1992 | | Chairman of Lumelite Plastics Corporation; Chairperson of the Governance Committee and Director or Trustee of the Retail Funds (since July 2003) and the Institutional Funds (since June 1992). | | 174 | | Trustee and Director of certain investment companies in the JPMorgan Funds complex managed by JP Morgan Investment Management Inc. | |
199
2007 Annual Report |
| |
September 30, 2007 |
Trustee and Officer Information (cont’d)
Independent Trustees:
| | | | | | | | Number of | | | |
| | | | | | | | Portfolios in | | | |
| | | | | | | | Fund Complex | | | |
| | Position(s) | | Term of Office | | | | Overseen by | | | |
Name, Age and Address of | | Held with | | and Length of | | | | Interested | | Other Directorships Held by Interested | |
Independent Trustee | | Registrant | | Time Served* | | Principal Occupation(s) During Past 5 Years | | Trustee** | | Trustee | |
James F. Higgins (59)
c/o Morgan Stanley Trust
Harborside Financial Center
Plaza Two Jersey City, NJ 07311 | | Trustee | | Since
June
2000 | | Director or Trustee of the Retail Funds (since June 2000) and the Institutional Funds (since July 2003); Senior Advisor of Morgan Stanley (since August 2000). | | 173 | | Director of AXA Financial, Inc. and The Equitable Life Assurance Society of the United States (financial services). | |
* This is the earliest date the Trustee began serving the Retail Funds or Institutional Funds. Each Trustee serves an indefinite term, until his or her successor is elected.
** The Fund Complex includes all funds advised by Morgan Stanley Investments LP (“MSI”) that have an investment advisor that is an affiliated entity of MSI (including but not limited to, Morgan Stanley Investment Management Inc. (“MSIM”), Morgan Stanley Investment Advisors Inc. (“MSIA”) and Morgan Stanley AIP GP LP). The Retail Funds are those funds advised by MSIA. The Institutional Funds are certain U.S. registered funds advised by MSI, MSIM and Morgan Stanley AIP GP LP.
Additional information about the Fund’s Trustees can be found in the Fund’s Statement of Additional Information (SAI). The SAI may be obtained without charge upon request, by calling the Fund at 1-800-548-7786. You may also retrieve this information on-line at the Securities and Exchange Commission’s website at “http://www.sec.gov”. To aid you in obtaining this information on-line, the Fund’s Central Index Key (CIK) number is 0000741375 and the SAI is found within form type 485BPOS.
200
| 2007 Annual Report |
| |
| September 30, 2007 |
Trustee and Officer Information (cont’d)
Executive Officers:
| | Position(s) | | Term of Office | | | |
| | Held with | | and Length of | | | |
Name, Age and Address of Executive Officer | | Registrant | | Time Served* | | Principal Occupation(s) During Past 5 Years | |
| | | | | | | |
Ronald E. Robison (68)
Morgan Stanley Investment Management Inc.
522 Fifth Avenue
New York, NY 10036 | | President and
Principal
Executive
Officer | | President since September 2005 and Principal Executive Officer since May 2003 | | President (since September 2005) and Principal Executive Officer (since May 2003) of funds in the Fund Complex; President (since September 2005) and Principal Executive Officer (since May 2003) of the Van Kampen Funds; Managing Director, Director and/or Officer of the Adviser and various entities affiliated with the Adviser; Director of Morgan Stanley SICAV (since May 2004). Formerly, Executive Vice President (July 2003 to September 2005) of funds in the Fund Complex and the Van Kampen Funds; President and Director of the Institutional Funds (March 2001 to July 2003); Chief Administrative Officer of Morgan Stanley Investment Advisors Inc.; Chief Administrative Officer of Morgan Stanley Services Company Inc. | |
| | | | | | | |
J. David Germany (53)
Morgan Stanley Investment Management Ltd. 20 Bank Street Canary Wharf London, England E144AD | | Vice President | | Since
February
2006 | | Managing Director and (since December 2005) Chief Investment Officer—Global Fixed Income of Morgan Stanley Investment Management; Managing Director and Director of Morgan Stanley Investment Management Limited; Vice President of the Retail Funds and Institutional Funds (since February 2006). | |
| | | | | | | |
Dennis F. Shea (54)
Morgan Stanley Investment Management Inc.
522 Fifth Avenue New York, NY 10036 | | Vice President | | Since
February
2006 | | Managing Director and (since February 2006) Chief Investment Officer—Global Equity of Morgan Stanley Investment Management; Vice President of the Retail Funds and Institutional Funds (since February 2006). Formerly, Managing Director and Director of Global Equity Research at Morgan Stanley. | |
| | | | | | | |
Amy R. Doberman (45)
Morgan Stanley Investment Management Inc.
522 Fifth Avenue New York, NY 10036 | | Vice President | | Since
July
2004 | | Managing Director and General Counsel, U.S. Investment Management of Morgan Stanley Investment Management (since July 2004); Vice President of the Retail Funds and Institutional Funds (since July 2004); Vice President of the Van Kampen Funds (since August 2004); Secretary (since February 2006) and Managing Director (since July 2004) of the Adviser and various entities affiliated with the Adviser. Formerly, Managing Director and General Counsel — Americas, UBS Global Asset Management (July 2000-July 2004). | |
| | | | | | | |
Carsten Otto (43)
Morgan Stanley Investment Management Inc.
522 Fifth Avenue
New York, NY 10036 | | Chief Compliance Officer | | Since
October
2004 | | Managing Director and Global Head of Compliance for Morgan Stanley Investment Management (since April 2007) and Chief Compliance Officer of Morgan Stanley Retail Funds and Institutional Funds (since October 2004). Formerly, U.S. Director of Compliance (October 2004 - April 2007) and Assistant Secretary and Assistant General Counsel of the Retail Funds. | |
| | | | | | | |
Stefanie V. Chang Yu (40)
Morgan Stanley Investment Management Inc.
522 Fifth Avenue New York, NY 10036 | | Vice President | | Since
December
1997 | | Executive Director of the Adviser and various entities affiliated with the Adviser; Vice President of the Retail Funds (since July 2002) and the Institutional Funds (since December 1997). Formerly, Secretary of various entities affiliated with the Adviser. | |
| | | | | | | |
Mary E. Mullin (40)
Morgan Stanley Investment Management Inc.
522 Fifth Avenue New York, NY 10036 | | Secretary | | Since
June
1999 | | Executive Director of the Adviser and various entities affiliated with the Adviser; Secretary of the Retail Funds (since July 2003) and the Institutional Funds (since June 1999). | |
| | | | | | | |
James W. Garrett (38)
Morgan Stanley Investment Management Inc.
522 Fifth Avenue New York, NY 10036 | | Treasurer and Chief Financial Officer | | Treasurer since February 2002 and Chief Financial Officer since July 2003 | | Head of Global Fund Administration; Managing Director of the Adviser and various entities affiliated with the Adviser; Treasurer and Chief Financial Officer of the Institutional Funds. | |
* This is the earliest date the Officer began serving the Retail Funds or Institutional Funds. Each Officer serves an indefinite term, until his or her successor is elected.
201
2007 Annual Report |
| |
September 30, 2007 |
Investment Adviser and Administrator
Morgan Stanley Investment Management Inc.
522 Fifth Avenue
New York, NY 10036
Distributor
Morgan Stanley Distribution, Inc.
One Tower Bridge
100 Front Street, Suite 1100
West Conshohocken, PA 19428-2899
Custodian
JPMorgan Chase Bank, N.A.
270 Park Avenue
New York, NY 10017
Legal Counsel
Clifford Chance US LLP
31 West 52nd Street
New York, NY 10019-6131
Independent Registered Public Accounting Firm
Ernst & Young LLP
200 Clarendon Street
Boston, MA 02116-5072
Reporting to Shareholders
Each Morgan Stanley Fund provides a complete schedule of portfolio holdings in its semi-annual and annual reports within 60 days of the end of the Fund’s second and fourth fiscal quarters. The semi-annual reports and the annual reports are filed electronically with the Securities and Exchange Commission (SEC) on Form N-CSRS and Form N-CSR, respectively. Morgan Stanley also delivers the semi-annual and annual reports to Fund shareholders and makes these reports available on its public website, www.morganstanley.com. Each Morgan Stanley Fund also files a complete schedule of portfolio holdings with the SEC for the Fund’s first and third fiscal quarters on Form N-Q. Morgan Stanley does not deliver the reports for the first and third fiscal quarters to shareholders, nor are the reports posted to the Morgan Stanley public website. You may, however, obtain the Form N-Q filings (as well as the Form N-CSR and N-CSRS filings) by accessing the SEC’s website, http:/www.sec.gov. You may also review and copy them at the SEC’s public reference room in Washington, DC. Information on the operation of the SEC’s Public Reference Room may be obtained by calling the SEC at 1(800) SEC-0330. You can also request copies of these materials, upon payment of a duplicating fee, by electronic request at the SEC’s email address (publicinfo@sec.gov) or by writing the Public Reference section of the SEC, Washington, DC 20549-0102.
Proxy Voting Policies and Procedures and Proxy Voting Record
You may obtain a copy of the Fund’s Proxy Voting Policy and Procedures and information regarding how the Fund voted proxies relating to portfolio securities during the most recent twelve-month period ended June 30, without charge, upon request, by calling toll-free 1(800) 548-7786 or by visiting our website at www.morganstanley.com/im. This information is also available on the SEC’s website at http://www.sec.gov.
This report is authorized for distribution only when preceded or accompanied by the prospectus of the Morgan Stanley Institutional Fund Trust which describes in detail each Investment Portfolio’s investment policies, risks, fees and expenses. Please read the prospectus carefully before you invest or send money. For additional information, including information regarding the investments comprising the Portfolio, please visit our website at www.morganstanley.com/im or call 1(800) 548-7786.
202
Printed in U.S.A.
This Report has been prepared for shareholders and may be distributed to others only if preceded or accompanied by a current prospectus.
Morgan Stanley Investment Management Inc.
522 Fifth Avenue
New York, NY 10036
Investment Adviser: 1(610) 940-5000 • MSIF Trust 1(800) 548-7786
© 2007 Morgan Stanley

| IFEQFIANN
IU07-04528P-Y09/07 |
Item 2. Code of Ethics.
(a) The Fund has adopted a code of ethics (the “Code of Ethics”) that applies to its principal executive officer, principal financial officer, principal accounting officer or controller, or persons performing similar functions, regardless of whether these individuals are employed by the Fund or a third party.
(b) No information need be disclosed pursuant to this paragraph.
(c) Not applicable.
(d) Not applicable.
(e) Not applicable.
(f)
(1) The Fund’s Code of Ethics is attached hereto as Exhibit 12 A.
(2) Not applicable.
(3) Not applicable.
Item 3. Audit Committee Financial Expert.
The Fund’s Board of Trustees has determined that Joseph J. Kearns, an “independent” Trustee, is an “audit committee financial expert” serving on its audit committee. Under applicable securities laws, a person who is determined to be an audit committee financial expert will not be deemed an “expert” for any purpose, including without limitation for the purposes of Section 11 of the Securities Act of 1933, as a result of being designated or identified as an audit committee financial expert. The designation or identification of a person as an audit committee financial expert does not impose on such person any duties, obligations, or liabilities that are greater than the duties, obligations, and liabilities imposed on such person as a member of the audit committee and Board of Trustees in the absence of such designation or identification.
Item 4. Principal Accountant Fees and Services.
(a)(b)(c)(d) and (g). Based on fees billed for the periods shown:
2007
| | Registrant | | Covered Entities(1) | |
Audit Fees | | $ | 555,250 | | N/A | |
| | | | | |
Non-Audit Fees | | | | | |
Audit-Related Fees | | $ | — | | $ | 781,800 | (2) |
Tax Fees | | $ | 57,600 | (3) | $ | 59,185 | (4) |
All Other Fees | | $ | — | | $ | 74,100 | (5) |
Total Non-Audit Fees | | $ | 57,600 | | $ | 915,085 | |
| | | | | |
Total | | $ | 612,850 | | $ | 915,085 | |
2006
| | Registrant | | Covered Entities(1) | |
Audit Fees | | $ | 539,000 | | N/A | |
| | | | | |
Non-Audit Fees | | | | | |
Audit-Related Fees | | $ | — | | $ | 706,000 | (2) |
Tax Fees | | $ | 60,500 | (3) | $ | 79,422 | (4) |
All Other Fees | | $ | — | | $ | 749,041 | (5) |
Total Non-Audit Fees | | $ | 60,500 | | $ | 1,534,463 | |
| | | | | |
Total | | $ | 599,500 | | $ | 1,534,463 | |
N/A- Not applicable, as not required by Item 4.
(1) Covered Entities include the Adviser (excluding sub-advisors) and any entity controlling, controlled by or under common control with the Adviser that provides ongoing services to the Registrant.
(2) Audit-Related Fees represent assurance and related services provided that are reasonably related to the performance of the audit of the financial statements of the Covered Entities and funds advised by the Adviser or its affiliates, specifically attestation services provided in connection with a SAS 70 Report.
(3) Tax Fees represent tax advice and compliance services provided in connection with the review of the Registrant’s tax returns.
(4) Tax Fees represent tax advice services provided to Covered Entities, including research and identification of PFIC entities.
(5) All Other Fees represent attestation services provided in connection with performance presentation standards and a compliance review project performed.
(e)(1) The audit committee’s pre-approval policies and procedures are as follows:
APPENDIX A
AUDIT COMMITTEE
AUDIT AND NON-AUDIT SERVICES
PRE-APPROVAL POLICY AND PROCEDURES
OF THE
MORGAN STANLEY RETAIL AND INSTITUTIONAL FUNDS
AS ADOPTED AND AMENDED JULY 23, 2004,(1)
1. Statement of Principles
The Audit Committee of the Board is required to review and, in its sole discretion, pre-approve all Covered Services to be provided by the Independent Auditors to the Fund and Covered Entities in order to assure that services performed by the Independent Auditors do not impair the auditor’s independence from the Fund.
The SEC has issued rules specifying the types of services that an independent auditor may not provide to its audit client, as well as the audit committee’s administration of the engagement of the independent auditor. The SEC’s rules establish two different approaches to pre-approving services, which the SEC considers to be equally valid. Proposed services either: may be pre-approved without consideration of specific case-by-case services by the Audit Committee (“general pre-approval”); or require the specific pre-approval of the Audit Committee or its delegate (“specific pre-approval”). The Audit Committee believes that the combination of these two approaches in this Policy will result in an effective and efficient procedure to pre-approve services performed by the Independent Auditors. As set forth in this Policy, unless a type of service has received general pre-approval, it will require specific pre-approval by the Audit Committee (or by any member of the Audit Committee to which pre-approval authority has been delegated) if it is to be provided by the Independent Auditors. Any proposed services exceeding pre-approved cost levels or budgeted amounts will also require specific pre-approval by the Audit Committee.
The appendices to this Policy describe the Audit, Audit-related, Tax and All Other services that have the general pre-approval of the Audit Committee. The term of any general pre-approval is 12 months from the date of pre-approval, unless the Audit Committee considers and provides a different period and states otherwise. The Audit Committee will annually review and pre-approve the services that may be provided by the Independent Auditors without obtaining specific pre-approval from the Audit
(1) This Audit Committee Audit and Non-Audit Services Pre-Approval Policy and Procedures (the “Policy”), adopted as of the date above, supersedes and replaces all prior versions that may have been adopted from time to time.
Committee. The Audit Committee will add to or subtract from the list of general pre-approved services from time to time, based on subsequent determinations.
The purpose of this Policy is to set forth the policy and procedures by which the Audit Committee intends to fulfill its responsibilities. It does not delegate the Audit Committee’s responsibilities to pre-approve services performed by the Independent Auditors to management.
The Fund’s Independent Auditors have reviewed this Policy and believes that implementation of the Policy will not adversely affect the Independent Auditors’ independence.
2. Delegation
As provided in the Act and the SEC’s rules, the Audit Committee may delegate either type of pre-approval authority to one or more of its members. The member to whom such authority is delegated must report, for informational purposes only, any pre-approval decisions to the Audit Committee at its next scheduled meeting.
3. Audit Services
The annual Audit services engagement terms and fees are subject to the specific pre-approval of the Audit Committee. Audit services include the annual financial statement audit and other procedures required to be performed by the Independent Auditors to be able to form an opinion on the Fund’s financial statements. These other procedures include information systems and procedural reviews and testing performed in order to understand and place reliance on the systems of internal control, and consultations relating to the audit. The Audit Committee will approve, if necessary, any changes in terms, conditions and fees resulting from changes in audit scope, Fund structure or other items.
In addition to the annual Audit services engagement approved by the Audit Committee, the Audit Committee may grant general pre-approval to other Audit services, which are those services that only the Independent Auditors reasonably can provide. Other Audit services may include statutory audits and services associated with SEC registration statements (on Forms N-1A, N-2, N-3, N-4, etc.), periodic reports and other documents filed with the SEC or other documents issued in connection with securities offerings.
The Audit Committee has pre-approved the Audit services in Appendix B.1. All other Audit services not listed in Appendix B.1 must be specifically pre-approved by the Audit Committee (or by any member of the Audit Committee to which pre-approval has been delegated).
4. Audit-related Services
Audit-related services are assurance and related services that are reasonably related to the performance of the audit or review of the Fund’s financial statements and, to the extent they are Covered Services, the Covered Entities or that are traditionally performed by the Independent Auditors. Because the Audit Committee believes that the provision of Audit-related services does not impair the independence of the auditor and is consistent with the SEC’s rules on auditor independence, the Audit Committee may grant general
pre-approval to Audit-related services. Audit-related services include, among others, accounting consultations related to accounting, financial reporting or disclosure matters not classified as “Audit services”; assistance with understanding and implementing new accounting and financial reporting guidance from rulemaking authorities; agreed-upon or expanded audit procedures related to accounting and/or billing records required to respond to or comply with financial, accounting or regulatory reporting matters; and assistance with internal control reporting requirements under Forms N-SAR and/or N-CSR.
The Audit Committee has pre-approved the Audit-related services in Appendix B.2. All other Audit-related services not listed in Appendix B.2 must be specifically pre-approved by the Audit Committee (or by any member of the Audit Committee to which pre-approval has been delegated).
5. Tax Services
The Audit Committee believes that the Independent Auditors can provide Tax services to the Fund and, to the extent they are Covered Services, the Covered Entities, such as tax compliance, tax planning and tax advice without impairing the auditor’s independence, and the SEC has stated that the Independent Auditors may provide such services.
Pursuant to the preceding paragraph, the Audit Committee has pre-approved the Tax Services in Appendix B.3. All Tax services in Appendix B.3 must be specifically pre-approved by the Audit Committee (or by any member of the Audit Committee to which pre-approval has been delegated).
6. All Other Services
The Audit Committee believes, based on the SEC’s rules prohibiting the Independent Auditors from providing specific non-audit services, that other types of non-audit services are permitted. Accordingly, the Audit Committee believes it may grant general pre-approval to those permissible non-audit services classified as All Other services that it believes are routine and recurring services, would not impair the independence of the auditor and are consistent with the SEC’s rules on auditor independence.
The Audit Committee has pre-approved the All Other services in Appendix B.4. Permissible All Other services not listed in Appendix B.4 must be specifically pre-approved by the Audit Committee (or by any member of the Audit Committee to which pre-approval has been delegated).
7. Pre-Approval Fee Levels or Budgeted Amounts
Pre-approval fee levels or budgeted amounts for all services to be provided by the Independent Auditors will be established annually by the Audit Committee. Any proposed services exceeding these levels or amounts will require specific pre-approval by the Audit Committee. The Audit Committee is mindful of the overall relationship of fees for audit and non-audit services in determining whether to pre-approve any such services.
8. Procedures
All requests or applications for services to be provided by the Independent Auditors that do not require specific approval by the Audit Committee will be submitted to the Fund’s Chief Financial Officer and must include a detailed description of the services to be rendered. The Fund’s Chief Financial Officer will determine whether such services are included within the list of services that have received the general pre-approval of the Audit Committee. The Audit Committee will be informed on a timely basis of any such services rendered by the Independent Auditors. Requests or applications to provide services that require specific approval by the Audit Committee will be submitted to the Audit Committee by both the Independent Auditors and the Fund’s Chief Financial Officer, and must include a joint statement as to whether, in their view, the request or application is consistent with the SEC’s rules on auditor independence.
The Audit Committee has designated the Fund’s Chief Financial Officer to monitor the performance of all services provided by the Independent Auditors and to determine whether such services are in compliance with this Policy. The Fund’s Chief Financial Officer will report to the Audit Committee on a periodic basis on the results of its monitoring. Both the Fund’s Chief Financial Officer and management will immediately report to the chairman of the Audit Committee any breach of this Policy that comes to the attention of the Fund’s Chief Financial Officer or any member of management.
9. Additional Requirements
The Audit Committee has determined to take additional measures on an annual basis to meet its responsibility to oversee the work of the Independent Auditors and to assure the auditor’s independence from the Fund, such as reviewing a formal written statement from the Independent Auditors delineating all relationships between the Independent Auditors and the Fund, consistent with Independence Standards Board No. 1, and discussing with the Independent Auditors its methods and procedures for ensuring independence.
10. Covered Entities
Covered Entities include the Fund’s investment adviser(s) and any entity controlling, controlled by or under common control with the Fund’s investment adviser(s) that provides ongoing services to the Fund(s). Beginning with non-audit service contracts entered into on or after May 6, 2003, the Fund’s audit committee must pre-approve non-audit services provided not only to the Fund but also to the Covered Entities if the engagements relate directly to the operations and financial reporting of the Fund. This list of Covered Entities would include:
Morgan Stanley Retail Funds
Morgan Stanley Investment Advisors Inc.
Morgan Stanley & Co. Incorporated
Morgan Stanley DW Inc.
Morgan Stanley Investment Management Inc.
Morgan Stanley Investment Management Limited
Morgan Stanley Investment Management Private Limited
Morgan Stanley Asset & Investment Trust Management Co., Limited
Morgan Stanley Investment Management Company
Van Kampen Asset Management
Morgan Stanley Services Company, Inc.
Morgan Stanley Distributors Inc.
Morgan Stanley Trust FSB
Morgan Stanley Institutional Funds
Morgan Stanley Investment Management Inc.
Morgan Stanley Investment Advisors Inc.
Morgan Stanley Investment Management Limited
Morgan Stanley Investment Management Private Limited
Morgan Stanley Asset & Investment Trust Management Co., Limited
Morgan Stanley Investment Management Company
Morgan Stanley & Co. Incorporated
Morgan Stanley Distribution, Inc.
Morgan Stanley AIP GP LP
Morgan Stanley Alternative Investment Partners LP
(e)(2) Beginning with non-audit service contracts entered into on or after May 6, 2003, the audit committee also is required to pre-approve services to Covered Entities to the extent that the services are determined to have a direct impact on the operations or financial reporting of the Registrant. 100% of such services were pre-approved by the audit committee pursuant to the Audit Committee’s pre-approval policies and procedures (attached hereto).
(f) Not applicable.
(g) See table above.
(h) The audit committee of the Board of Trustees has considered whether the provision of services other than audit services performed by the auditors to the Registrant and Covered Entities is compatible with maintaining the auditors’ independence in performing audit services.
Item 5. Audit Committee of Listed Registrants.
(a) The Fund has a separately-designated standing audit committee established in accordance with Section 3(a)(58)(A) of the Exchange Act whose members are: Frank Joseph Kearns, Michael Nugent and Allen Reed.
(b) Not applicable.
Item 6. Schedule of Investments
Refer to Item 1.
Item 7. Disclosure of Proxy Voting Policies and Procedures for Closed-End Management Investment Companies.
Applicable only to reports filed by closed-end funds.
Item 8. Portfolio Managers of Closed-End Management Investment Companies
Applicable only to reports filed by closed-end funds.
Item 9. Closed-End Fund Repurchases
Applicable only to reports filed by closed-end funds.
Item 10. Submission of Matters to a Vote of Security Holders
Not applicable.
Item 11. Controls and Procedures
(a) The Fund’s principal executive officer and principal financial officer have concluded that the Fund’s disclosure controls and procedures are sufficient to ensure that information required to be disclosed by the Fund in this Form N-CSR was recorded, processed, summarized and reported within the time periods specified in the Securities and Exchange Commission’s rules and forms, based upon such officers’ evaluation of these controls and procedures as of a date within 90 days of the filing date of the report.
(b) There were no changes in the registrant’s internal control over financial reporting that occurred during the second fiscal quarter of the period covered by this report that has materially affected, or is reasonably likely to materially affect, the registrant’s internal control over financial reporting.
Item 12. Exhibits
(a) The Code of Ethics for Principal Executive and Senior Financial Officers is attached hereto.
(b) A separate certification for each principal executive officer and principal financial officer of the registrant are attached hereto as part of EX-99.CERT.
SIGNATURES
Pursuant to the requirements of the Securities Exchange Act of 1934 and the Investment company Act of 1940, the registrants has duly caused this report to be signed on its behalf by the undersigned, thereunto duly autorized.
(Registrant) morgan Stanley Institutional Fund Trust
By: | /s/ Ronald E. Robinson | |
Name: | Ronald E. Robinson |
Title: | Principal Executive Officer |
Date: | November 20, 2007 |
Pursuant to the requirements of the Securities Exchange Act of 1934 and the Investment Company Act of 1940, this report has been signed by the following persons on behalf of the registrant and in the capacities and on the dates indicated.
By: | /s/ Ronald E. Robinson | |
Name: | Ronald E. Robinson |
Title: | Principal Executive Officer |
Date: | November 20, 2007 |
By: | /s/ James W. Garrett | |
Name: | James W. Garrett |
Title: | Principal Financial Officer |
Date: | November 20, 2007 |
