| | OMB APPROVAL |
| | OMB Number: | 3235-0570 |
| | Expires: | November 30, 2005 |
| UNITED STATES | Estimated average burden hours per response. . . . . . . . . . . . . . . . .5.0 |
| SECURITIES AND EXCHANGE COMMISSION | |
| Washington, D.C. 20549 | |
| | | | |
FORM N-CSR
CERTIFIED SHAREHOLDER REPORT OF REGISTERED
MANAGEMENT INVESTMENT COMPANIES
Investment Company Act file number | 811-03980 |
|
Morgan Stanley Institutional Fund Trust |
(Exact name of registrant as specified in charter) |
|
522 FIFTH AVENUE NEW YORK, NY | | 10036 |
(Address of principal executive offices) | | (Zip code) |
|
RANDY TAKIAN 522 FIFTH AVENUE NEW YORK, NY 10036 |
(Name and address of agent for service) |
|
Registrant’s telephone number, including area code: | 1-800-231-2608 | |
|
Date of fiscal year end: | 9/30 | |
|
Date of reporting period: | 9/30/08 | |
| | | | | | | | |
Form N-CSR is to be used by management investment companies to file reports with the Commission not later than 10 days after the transmission to stockholders of any report that is required to be transmitted to stockholders under Rule 30e-1 under the Investment Company Act of 1940 (17 CFR 270.30e-1). The Commission may use the information provided on Form N-CSR in its regulatory, disclosure review, inspection, and policymaking roles.
A registrant is required to disclose the information specified by Form N-CSR, and the Commission will make this information public. A registrant is not required to respond to the collection of information contained in Form N-CSR unless the Form displays a currently valid Office of Management and Budget (“OMB”) control number. Please direct comments concerning the accuracy of the information collection burden estimate and any suggestions for reducing the burden to Secretary, Securities and Exchange Commission, 450 Fifth Street, NW, Washington, DC 20549-0609. The OMB has reviewed this collection of information under the clearance requirements of 44 U.S.C. Section 3507.
ITEM 1. REPORTS TO STOCKHOLDERS.
The Fund’s annual report transmitted to shareholders pursuant to Rule 30e-1 under the Investment Company Act of 1940 is as follows:
Morgan Stanley Investment Management

| | Morgan Stanley
Institutional Fund Trust |
| | |
| | |
| | Advisory Portfolios
Advisory
Advisory II
Advisory III
Advisory IV |
| | |
| | |
| | September 30, 2008 |
| | |
| | |
| | Annual Report |
| 2008 Annual Report |
| |
| September 30, 2008 |
Table of Contents
Shareholders’ Letter | 2 |
Expense Examples | 3 |
Investment Advisory Agreement Approval | 4 |
Investment Overviews & Portfolios of Investments Advisory Portfolios: | |
Advisory | 6 |
Advisory II | 14 |
Advisory III | 22 |
Advisory IV | 25 |
Statements of Assets and Liabilities | 28 |
Statements of Operations | 29 |
Statements of Changes in Net Assets | 30 |
Financial Highlights | 32 |
Notes to Financial Statements | 36 |
Report of Independent Registered Public Accounting Firm | 44 |
Federal Income Tax Information | 45 |
U.S. Privacy Policy | 46 |
Trustee and Officer Information | 49 |
This report is authorized for distribution only when preceded or accompanied by prospectuses of the Morgan Stanley Institutional Fund Trust. To receive a prospectus and/or SAI, which contains more complete information such as investment objectives, charges, expenses, policies for voting proxies, risk considerations, and describes in detail each of the Portfolio’s investment policies to the prospective investor, please call 1 (800) 548-7786. Please read the prospectus carefully before you invest or send money.
Market forecasts provided in this report may not necessarily come to pass. There is no guarantee that any sectors mentioned will continue to perform as discussed herein or that securities in such sectors will be held by the Portfolio in the future. There is no assurance that a Portfolio will achieve its investment objective. Portfolios are subject to market risk, which is the possibility that market values of securities owned by the Portfolio will decline and, therefore, the value of the Portfolio’s shares may be less than what you paid for them. Accordingly, you can lose money investing in Portfolios. Please see the prospectus for more complete information on investment risks.
1
2008 Annual Report | |
| |
September 30, 2008 | |
Shareholder’s Letter
Dear Shareholders:
We are pleased to present to you the Morgan Stanley Institutional Fund Trust’s (the “Fund”) Annual Report for the Advisory Portfolios for the year ended September 30, 2008. Our Fund currently consists of 18 portfolios. The Fund’s portfolios, together with the portfolios of the Morgan Stanley Institutional Fund, Inc., provide investors with a means to help them meet specific investment needs and to allocate their investments among equities (e.g., value and growth; small, medium, and large capitalization) and fixed income (e.g., short, medium, and long duration; investment grade and high yield).
Sincerely,

| |
| |
Randy Takian
President and Principal Executive Officer
October 2008 | |
2
| 2008 Annual Report |
| |
| September 30, 2008 |
Expense Examples (unaudited)
Expense Examples
As a shareholder of a Portfolio, you may incur ongoing costs, including management fees and other Portfolio expenses. These examples are intended to help you understand your ongoing costs (in dollars) of investing in a Portfolio and to compare these costs with the ongoing costs of investing in other mutual funds.
The examples are based on an investment of $1,000 invested at the beginning of the six-month period ended September 30, 2008 and held for the entire six-month period.
Actual Expenses
The table below provides information about actual account values and actual expenses. You may use the information in this table, together with the amount you invested, to estimate the expenses that you paid over the period. Simply divide your account value by $1,000 (for example, an $8,600 account value divided by $1,000 = 8.6), then multiply the result by the number in the table under the heading entitled “Expenses Paid During Period” to estimate the expenses you paid on your account during this period.
Please note that “Actual Expenses Paid During Period” are grossed up to reflect Portfolio expenses prior to the effect of Expense Offset (See Note F in the Notes to Financial Statements). Therefore, the annualized net expense ratios may differ from the ratio of expenses to average net assets shown in the Financial Highlights.
Hypothetical Example for Comparison Purposes
The table below provides information about hypothetical account values and hypothetical expenses based on the Portfolio’s actual expense ratio and an assumed rate of return of 5% per year before expenses, which is not the Portfolio’s actual return. The hypothetical account values and expenses may not be used to estimate the actual ending account balance or expenses you paid for the period. You may use this information to compare the ongoing costs of investing in the Portfolio and other funds. To do so, compare this 5% hypothetical example with the 5% hypothetical examples that appear in the shareholder reports of the other funds.
| | Beginning
Account
Value 4/1/08 | | Actual Ending
Account
Value
9/30/08 | | Hypothetical
Ending Account
Value | | Actual
Expenses
Paid
During
Period* | | Hypothetical
Expenses Paid
During Period* | | Net
Expense
Ratio
During
Period | |
Advisory Portfolio Class I | | $ | 1,000.00 | | $ | 892.90 | | $ | 1,025.00 | | $ | — | | $ | — | | 0.00 | % | |
Advisory Portfolio II Class I | | 1,000.00 | | 919.30 | | 1,024.85 | | 0.14 | | 0.15 | | 0.03 | | |
Advisory Portfolio III Class I | | 1,000.00 | | 967.20 | | 1,025.00 | | — | | — | | 0.00 | | |
Advisory Portfolio IV Class I | | 1,000.00 | | 1,008.80 | | 1,024.95 | | 0.05 | | 0.05 | | 0.01 | | |
| | | | | | | | | | | | | | | | | | | |
* Expenses are calculated using each Portfolio Class’ annualized net expense ratio (as disclosed), multiplied by the average account value over the period, and multiplied by 183/366 (to reflect the most recent one-half year period).
3
2008 Annual Report | |
| |
September 30, 2008 | |
Investment Advisory Agreement Approval (unaudited)
Nature, Extent and Quality of Services
The Board reviewed and considered the nature and extent of the investment advisory services provided by the Adviser (as defined herein) under the advisory agreement, including portfolio management, investment research and fixed income and equity securities trading. The Board reviewed similar information and factors regarding the Sub-Adviser (as defined herein) to the extent applicable. The Board also reviewed and considered the nature and extent of the non-advisory, administrative services provided by the Adviser under the administration agreement, including accounting, clerical, bookkeeping, compliance, business management and planning, and the provision of supplies, office space and utilities at the Adviser’s expense. (The Adviser, Sub-Adviser and administrator together are referred to as the “Adviser” and the advisory, sub-advisory and administration agreements together are referred to as the “Management Agreement.”) The Board also compared the nature of the services provided by the Adviser with similar services provided by non-affiliated advisers as reported to the Board by Lipper Inc. (“Lipper”).
The Board reviewed and considered the qualifications of the portfolio managers, the senior administrative managers and other key personnel of the Adviser who provide the advisory and administrative services to the Portfolios. The Board determined that the Adviser’s portfolio managers and key personnel are well qualified by education and/or training and experience to perform the services in an efficient and professional manner. The Board concluded that the nature and extent of the advisory and administrative services provided were necessary and appropriate for the conduct of the business and investment activities of each Portfolio. The Board also concluded that the overall quality of the advisory and administrative services provided was satisfactory.
Performance Relative to Comparable Funds Managed by Other Advisers
On a regular basis, the Board reviews the performance of all funds in the Morgan Stanley Fund Complex, including the Portfolios, compared to their peers, paying specific attention to the underperforming funds. In addition, the Board specifically reviewed each Portfolio’s performance for the one-, three- and five-year periods ended December 31, 2007, as shown in reports provided by Lipper (the “Lipper Reports”), compared to the performance of comparable funds selected by Lipper (the “performance peer group”) for each Portfolio. The Board also discussed with the Adviser the performance goals and the actual results achieved in managing each Portfolio. When a fund/portfolio underperforms its performance peer group, the Board discusses with the Adviser the causes of the underperformance and, where necessary, specific changes to the fund’s/portfolio’s investment strategy and/or investment personnel.
With respect to the Advisory, Advisory Global Fixed Income (now known as Advisory Portfolio III) and Advisory Global Fixed Income II (now known as Advisory Portfolio IV) Portfolios, the Board reviewed a separate account attribution analysis provided by the Adviser in addition to each Portfolio’s Lipper Report. The Board concluded that each Portfolio’s performance was acceptable based on its review of the Portfolio’s Lipper Report.
Fees Relative to Other Proprietary Funds Managed by the Adviser with Comparable Investment Strategies
The Board reviewed the advisory and administrative fee (together, the “management fee”) rate paid by each Portfolio under the Management Agreement. The Board noted that the Adviser did not manage any other proprietary funds with investment strategies comparable to those of the Portfolios.
Fees and Expenses Relative to Comparable Funds Managed by Other Advisers
The Board reviewed the management fee rate and total expense ratio of each Portfolio as compared to the expense peer group. The Board concluded that each Portfolio’s management fee rate and total expense ratio were competitive with those of its expense peer group.
Breakpoints and Economies of Scale
The Board reviewed the structure of each Portfolio’s management fee schedule under the Management Agreement.
With respect to the Advisory Global Fixed Income and Advisory Global Fixed Income II Portfolios, the Board noted that the Portfolios’ management fee schedules do not include any breakpoints. The Board considered that the Portfolios’ assets under management were relatively small. The Board concluded that economies of scale for the Portfolios were not a factor that needed to be considered at the present time.
4
| 2008 Annual Report |
| |
| September 30, 2008 |
Investment Advisory Agreement Approval (cont’d)
With respect to the Advisory Portfolio, the Board noted that the Portfolio’s management fee schedules do not include any breakpoints. The Board also reviewed the level of the Portfolio’s management fee and concluded that the fee, compared to the Portfolio’s expense peer group, was sufficiently low, so that, in effect, economies of scale were built into each management fee structure.
Profitability of the Adviser and Affiliates
The Board considered information concerning the costs incurred and profits realized by the Adviser and affiliates during the last year from their relationship with each Portfolio and during the last two years from their relationship with the Morgan Stanley Fund Complex and reviewed with the Adviser the cost allocation methodology used to determine the profitability of the Adviser and affiliates. Based on its review of the information it received, the Board concluded that the profits earned by the Adviser and affiliates were not excessive in light of the advisory, administrative and other services provided to the Portfolios.
Fall-Out Benefits
The Board considered so-called “fall-out benefits” derived by the Adviser and affiliates from their relationship with each Portfolio and the Morgan Stanley Fund Complex. The Board considered the “float” benefits derived from handling of checks for purchases and sales of Portfolio shares, through a broker-dealer affiliate of the Adviser. The Board also considered that, from time to time, the Adviser may, directly or indirectly, effect trades on behalf of certain Morgan Stanley Funds through various electronic communications networks or other alternative trading systems in which the Adviser’s affiliates have ownership interests and/or board seats. The Board also considered that a broker-dealer affiliate of the Adviser receives from each Portfolio 12b-1 fees for distribution and shareholder services. The Board concluded that the fall-out benefits were relatively small and the sales charges and 12b-1 fees were competitive with those of other broker-dealers.
Soft Dollar Benefits
The Board considered whether the Adviser realizes any benefits as a result of brokerage transactions executed through “soft dollar” arrangements. Under such arrangements, brokerage commissions paid by the Portfolios and/or other funds managed by the Adviser would be used to pay for research that a securities broker obtains from third parties, or to pay for both research and execution services from securities brokers who effect transactions for the Portfolios. The Board noted that the Portfolios invest only in fixed income securities, which do not generate soft dollars.
Adviser Financially Sound and Financially Capable of Meeting the Portfolios’ Needs
The Board considered whether the Adviser is financially sound and has the resources necessary to perform its obligations under the Management Agreement. The Board concluded that the Adviser has the financial resources necessary to fulfill its obligations under the Management Agreement.
Historical Relationship Between the Portfolios and the Adviser
The Board also reviewed and considered the historical relationship between each Portfolio and the Adviser, including the organizational structure of the Adviser, the policies and procedures formulated and adopted by the Adviser for managing the Portfolios’ operations and the Board’s confidence in the competence and integrity of the senior managers and key personnel of the Adviser. The Board concluded that it is beneficial for each Portfolio to continue its relationship with the Adviser.
Other Factors and Current Trends
The Board considered the controls and procedures adopted and implemented by the Adviser and monitored by the Fund’s Chief Compliance Officer and concluded that the conduct of business by the Adviser indicates a good faith effort on its part to adhere to high ethical standards in the conduct of each Portfolio’s business.
General Conclusion
After considering and weighing all of the above factors, the Board concluded that it would be in the best interest of each Portfolio and its shareholders to approve renewal of the Management Agreement for another year.
5
2008 Annual Report
September 30, 2008
Investment Overview (unaudited)
Advisory Portfolio
The Advisory Portfolio seeks returns consistent with returns generated by the market for mortgage securities. The Portfolio invests primarily in U.S. dollar-denominated investment grade mortgage securities of the U.S. government and private issuers and in mortgage derivatives. A portion of the securities in which the Portfolio may invest may be below investment grade (commonly referred to as “high yield securities” or “junk bonds”). The Portfolio also invests in other U.S. government securities and investment grade fixed income securities. In addition, the Portfolio may invest a portion of its assets in structured investments, structured notes and other types of similarly structured products consistent with the Portfolio’s investment objective and policies. Generally, structured investments are interests in entities organized and operated for the purpose of restructuring the investment characteristics of underlying investment interests or securities. The Portfolio may invest in asset-backed securities and may use futures, options, forwards, collateralized mortgage obligations (“CMOs”), swaps, options on swaps and other derivatives. The Portfolio may also invest in to-be-announced pass-through mortgage securities, which settle on a delayed delivery basis (“TBAs”). The Portfolio may also invest in securities of foreign issuers, including issuers located in emerging market countries. The securities in which the Portfolio may invest may be denominated in currencies other than U.S. dollars.
Performance
For the fiscal year ended September 30, 2008, the Portfolio had a total return based on net asset value and reinvestment of distributions per share of - -19.23%, net of fees. The Portfolio underperformed against its benchmark the Lehman Brothers Mortgage Index (the “Index”) which returned 7.02%.
Factors Affecting Performance
· The financial markets were under pressure throughout the period amid disrupted credit markets, ongoing deterioration of the housing market, losses in the financial sector, and growing fears of recession.
· The third quarter of 2008, however, will most certainly go down as a defining moment in the history of the financial industry. Investor confidence plummeted and credit markets seized as several venerable financial institutions were forced into mergers or dissolved entirely in September, resulting in significant price erosion across all but the U.S. Treasury sector.
· The primary detractor from the Portfolio’s relative performance was an overweight to non-agency mortgage securities as spreads in the sector moved wider over the course of the reporting period.
· The Portfolio held an underweight allocation to agency mortgage-backed securities for much of the period which was additive to relative performance as it helped mitigate the impact of spread widening in the sector.
· The Portfolio’s position in U.S. Treasury securities also enhanced performance as the flight to quality during the period boosted returns.
Management Strategies
· The Portfolio maintained an overweight to non-agency mortgage-backed securities. The specific non-agency issues held in the Portfolio are backed primarily by Alt-A borrowers (those who have relatively strong credit but are not considered “prime” borrowers) and are concentrated in the senior and middle tranches of the capital structure. Given our expectations that the housing market situation may take some time to work itself out and therefore, these securities would continue to add volatility, we began reducing the Portfolio’s exposure to non-agency mortgage-backed securities in the third quarter of 2008.
· Conversely, we maintained an underweight position in agency mortgage-backed securities through November of 2007. In response to widening spreads, we subsequently increased the allocation to this sector.
6
| 2008 Annual Report |
| |
| September 30, 2008 |
Investment Overview (cont’d)
Advisory Portfolio

* Minimum Investment
In accordance with SEC regulations, the Portfolio performance shown assumes that all recurring fees (including management fees) were deducted and all dividends and distributions were reinvested.
Performance Compared to the Lehman Brothers Mortgage Index(1)
| | | Total Returns(2) |
| | | | Average Annual |
| | One | | Five | | Ten | | Since |
| | Year | | Years | | Years | | Inception(4) |
Portfolio(3) | | (19.23 | )% | | (0.68 | )% | | 2.82 | % | | 4.58 | % |
Lehman Brothers Mortgage Index | | 7.02 | | | 4.84 | | | 5.68 | | | 6.51 | |
Performance data quoted represents past performance, which is no guarantee of future results, and current performance may be lower or higher than the figures shown. Performance assumes that all dividends and distributions, if any, were reinvested. For the most recent month-end performance figures, please call 1 (800) 548-7786. Investment returns and principal value will fluctuate so that Portfolio shares, when redeemed, may be worth more or less than their original cost. Total returns do not reflect the deduction of taxes that a shareholder would pay on Portfolio distributions or the redemption of Portfolio shares.
(1) | The Lehman Brothers Mortgage Index includes GNMA, FNMA and FHLMC pass-through securities with original maturities of 15, 20, and 30 years, as well as balloon mortgages. The Index is formed by grouping the universe of over 600,000 individual fixed rate MBS pools into approximately 3,500 generic aggregates. These aggregates are defined according to agency, program, pass-through coupon and origination year. Index maturity and liquidity criteria are then applied to these aggregates to determine which qualify for inclusion in the Index. The Index excludes buydown, graduated equity mortgages, project loans, ARMS, non-agency mortgages and CMOs. The Index is unmanaged and its returns do not include any sales charges or fees. Such costs would lower performance. It is not possible to invest directly in an index. |
(2) | Total returns for the Portfolio reflect expenses waived and/or reimbursed, if applicable, by the Adviser. Without such waivers and/or reimbursements, total returns would have been lower. Fee waivers and/or reimbursements are voluntary and the Adviser reserves the right to commence or terminate any waiver and/or reimbursement at any time. |
(3) | Commenced operations on April 12, 1995. |
(4) | For comparative purposes, average annual since inception returns listed for the Index refer to the inception date or initial offering of the Portfolio, not the inception of the Index. |
Portfolio Composition*
| | Percentage of | |
Classification | | | Total Investments | |
Agency Fixed Rate Mortgages | | 59.2 | % |
Mortgages - Other | | 9.2 | |
Collateralized Mortgage Obligations - Agency Collateral Series | | 6.8 | |
Agency Adjustable Rate Mortgages | | 6.5 | |
Other** | | 3.5 | |
Short-Term Investments | | 14.8 | |
Total Investments | | 100.0 | % |
| | | | |
* Percentages indicated are based upon total investments (excluding Securities held as collateral on Loaned Securities) as of September 30, 2008.
** Industries and/or Investment types which do not appear in the above table, as well as those which represent less than 5% of total investments, if applicable, are included in the category labeled “Other”.
7
2008 Annual Report
September 30, 2008
Portfolio of Investments
Advisory Portfolio
| | Face Amount | | Value | |
| | (000) | | (000) | |
Fixed Income Securities (101.0%) | | | | | |
Agency Adjustable Rate Mortgages (7.8%) | | | | | |
Federal Home Loan Mortgage Corp., | | | | | |
Conventional Pools: | | | | | |
3.54%, 5/1/34 | | $ | 617 | | $ | 622 | |
5.54%, 4/1/37 | | 10,468 | | 10,633 | |
5.59%, 11/1/36 | | 3,697 | | 3,770 | |
5.71%, 1/1/37 | | 589 | | 591 | |
5.97%, 1/1/37 | | 4,516 | | 4,621 | |
Federal National Mortgage Association, | | | | | |
Conventional Pools: | | | | | |
4.26%, 6/1/34 | | 9 | | 9 | |
4.87%, 5/1/35 | | 1,232 | | 1,237 | |
4.98%, 3/1/37 | | 1,673 | | 1,691 | |
5.27%, 4/1/36 | | 8,666 | | 8,823 | |
5.34%, 7/1/36 | | 46 | | 47 | |
5.80%, 5/1/37 | | 5,287 | | 5,365 | |
5.98%, 4/1/37 | | 9,441 | | 9,593 | |
Government National Mortgage Association, | | | | | |
Various Pools: | | | | | |
5.13%, 10/20/25 - 12/20/27 | | 1,576 | | 1,597 | |
5.38%, 5/20/24 - 2/20/28 | | 6,335 | | 6,418 | |
5.63%, 7/20/25 - 9/20/27 | | 1,140 | | 1,154 | |
| | | | 56,171 | |
Agency Fixed Rate Mortgages (70.3%) | | | | | |
Federal Home Loan Mortgage Corp., | | | | | |
Conventional Pools: | | | | | |
9.00%, 10/1/16 | | 10 | | 11 | |
9.50%, 10/1/16 - 3/1/20 | | 168 | | 188 | |
10.00%, 1/1/09 - 12/1/20 | | 697 | | 792 | |
10.25%, 12/1/11 | | 3 | | 4 | |
10.50%, 11/1/08 - 12/1/20 | | 364 | | 413 | |
11.00%, 2/1/11 - 9/1/20 | | 250 | | 288 | |
11.25%, 6/1/10 - 12/1/15 | | 4 | | 4 | |
11.50%, 12/1/09 - 9/1/19 | | 142 | | 159 | |
11.75%, 8/1/14 | | 1 | | 1 | |
12.00%, 10/1/09 - 7/1/20 | | 180 | | 206 | |
12.50%, 10/1/09 - 6/1/15 | | 11 | | 13 | |
13.00%, 9/1/10 - 12/1/13 | | 1 | | 1 | |
13.50%, 2/1/10 | | — | @ | — | @ |
Gold Pools: | | | | | |
5.50%, 12/1/36 - 12/1/37 | | 32,889 | | 32,746 | |
6.00%, 10/1/28 - 10/1/37 | | 4,843 | | 4,909 | |
6.50%, 5/1/21 - 11/1/33 | | 1,748 | | 1,807 | |
7.00%, 12/1/26 - 11/1/32 | | 5,087 | | 5,351 | |
7.50%, 2/1/23 - 1/1/34 | | 10,010 | | 10,843 | |
8.00%, 5/1/20 - 12/1/31 | | 4,642 | | 5,036 | |
8.50%, 8/1/14 - 7/1/31 | | 10,815 | | 12,008 | |
9.00%, 10/1/17 - 1/1/31 | | 853 | | 948 | |
9.50%, 11/1/16 - 12/1/22 | | 482 | | 537 | |
10.00%, 6/1/17 - 4/1/25 | | 288 | | 330 | |
10.50%, 7/1/19 - 3/1/21 | | 121 | | 140 | |
11.00%, 8/1/19 - 9/1/20 | | 92 | | 101 | |
11.50%, 2/1/16 - 6/1/20 | | 60 | | 66 | |
12.00%, 6/1/20 | | 75 | | 86 | |
12.50%, 7/1/19 | | 3 | | 3 | |
October TBA: | | | | | |
5.00%, 10/15/38(i) | | 74,200 | | 72,287 | |
5.50%, 10/15/38(i) | | 106,475 | | 105,926 | |
6.00%, 10/15/38(i) | | 31,700 | | 32,091 | |
Federal National Mortgage Association, | | | | | |
Conventional Pools: | | | | | |
4.50%, 8/1/18 | | 113 | | 111 | |
5.00%, 4/1/38 | | 197 | | 192 | |
5.50%, 3/1/17 - 3/1/38 | | 455 | | 457 | |
6.00%, 4/1/13 - 11/1/32 | | 257 | | 265 | |
6.50%, 6/1/15 - 4/1/34 | | 17,064 | | 17,641 | |
7.00%, 12/1/12 - 4/1/36 | | 28,071 | | 29,527 | |
7.50%, 10/1/12 - 8/1/37 | | 24,974 | | 26,845 | |
8.00%, 7/1/14 - 4/1/33 | | 16,265 | | 17,638 | |
8.50%, 4/1/09 - 5/1/32 | | 14,992 | | 16,532 | |
9.00%, 6/1/18 - 4/1/26 | | 401 | | 442 | |
9.50%, 8/1/17 - 4/1/30 | | 1,803 | | 2,010 | |
10.00%, 1/1/10 - 11/1/25 | | 1,944 | | 2,222 | |
10.50%, 10/1/11 - 6/1/27 | | 621 | | 713 | |
10.75%, 10/1/11 | | 1 | | 1 | |
11.00%, 10/1/13 - 7/1/25 | | 179 | | 204 | |
11.50%, 8/1/11 - 8/1/25 | | 320 | | 366 | |
12.00%, 1/1/13 - 5/1/20 | | 112 | | 123 | |
12.50%, 2/1/11 - 9/1/15 | | 126 | | 148 | |
October TBA: | | | | | |
5.50%, 10/25/38(i) | | 27,779 | | 27,705 | |
6.00%, 10/15/37(i) | | 5,895 | | 5,971 | |
6.50%, 10/25/38(i) | | 41,544 | | 42,602 | |
Government National Mortgage Association, | | | | | |
Various Pools: | | | | | |
5.50%, 12/15/32 | | 17 | | 17 | |
6.50%, 10/15/10 | | 8 | | 9 | |
7.00%, 7/15/31 | | 72 | | 76 | |
8.50%, 7/15/16 - 3/15/20 | | 499 | | 549 | |
9.00%, 11/15/16 - 11/15/24 | | 2,684 | | 2,947 | |
9.50%, 7/15/09 - 8/15/23 | | 6,255 | | 6,929 | |
10.00%, 11/15/09 - 2/15/26 | | 10,561 | | 12,015 | |
10.50%, 4/15/13 - 4/15/25 | | 2,630 | | 3,017 | |
11.00%, 12/15/09 - 4/15/21 | | 2,840 | | 3,193 | |
11.50%, 3/15/10 - 11/15/19 | | 259 | | 292 | |
12.00%, 11/15/12 - 5/15/16 | | 439 | | 500 | |
12.50%, 5/15/10 - 4/15/19 | | 43 | | 48 | |
13.00%, 1/15/11 - 10/15/13 | | 18 | | 21 | |
13.50%, 5/15/10 - 5/15/13 | | 19 | | 22 | |
| | | | 508,645 | |
Collateralized Mortgage Obligations - Agency Collateral Series (7.7%) | | | | | |
Federal Home Loan Mortgage Corp., | | | | | |
Inv Fl IO REMIC | | | | | |
3.50%, 3/15/24 | | 11,431 | | 765 | |
4.50%, 6/17/27 | | 83 | | 8 | |
4.85%, 12/15/23 | | 1,139 | | 219 | |
5.01%, 8/15/30 | | 40 | | 3 | |
5.46%, 3/15/32 | | 88 | | 9 | |
5.51%, 6/15/28 - 3/15/32 | | 1,496 | | 53 | |
6.01%, 9/15/30 | | 879 | | 85 | |
| | | | | | | |
8 | The accompanying notes are an integral part of the financial statements. |
| 2008 Annual Report |
| |
| September 30, 2008 |
Portfolio of Investments (cont’d)
Advisory Portfolio
| | Face Amount | | Value | |
| | (000) | | (000) | |
Collateralized Mortgage Obligations - Agency Collateral Series (cont’d) | | | | | |
6.06%, 10/15/29 | | $ | 6 | | $ | — | @ |
IO | | | | | |
6.00%, 5/1/31 | | 461 | | 93 | |
6.50%, 4/1/28 - 8/1/28 | | 247 | | 65 | |
7.00%, 6/1/30 - 3/1/32 | | 1,493 | | 386 | |
7.50%, 4/1/28 - 9/1/30 | | 838 | | 245 | |
8.00%, 1/1/28 - 6/1/31 | | 2,395 | | 624 | |
10.00%, 5/1/20 - 6/1/20 | | 35 | | 7 | |
IO PAC REMIC | | | | | |
1.00%, 2/15/27 | | 2,303 | | 19 | |
6.00%, 4/15/32 | | 227 | | 19 | |
7.00%, 9/15/27 | | 28 | | 10 | |
IO REMIC | | | | | |
5.00%, 6/15/17 | | 148 | | 11 | |
5.50%, 1/15/29 - 8/15/30 | | 3,093 | | 142 | |
6.50%, 3/15/33 - 5/15/33 | | 691 | | 134 | |
8.00%, 10/15/12 | | 64 | | 5 | |
PAC REMIC | | | | | |
8.55%, 1/15/21 | | 18 | | 19 | |
9.50%, 4/15/20 | | 67 | | 71 | |
9.60%, 4/15/20 | | 61 | | 65 | |
9.90%, 10/15/19 | | 182 | | 194 | |
10.00%, 5/15/20 - 6/15/20 | | 211 | | 229 | |
Federal National Mortgage Association, | | | | | |
Inv Fl IO REMIC | | | | | |
2.69%, 8/25/34 | | 100,371 | | 1,889 | |
3.19%, 7/25/34 | | 8,429 | | 547 | |
4.99%, 10/25/28 | | 1,269 | | 57 | |
5.05%, 2/17/31 | | 402 | | 31 | |
5.22%, 7/18/27 | | 358 | | 23 | |
5.29%, 7/25/30 - 8/25/30 | | 1,144 | | 102 | |
5.39%, 10/25/29 | | 198 | | 6 | |
5.75%, 11/18/30 | | 582 | | 54 | |
5.80%, 10/18/30 | | 188 | | 16 | |
52.88%, 9/25/22 | | 84 | | 116 | |
Inv Fl REMIC | | | | | |
3.27%, 12/25/36 | | 1,328 | | 1,279 | |
3.78%, 12/25/08 | | — | @ | — | @ |
43.23%, 9/25/20 | | 52 | | 77 | |
IO | | | | | |
6.50%, 6/1/31 - 2/1/32 | | 3,168 | | 847 | |
7.00%, 4/1/32 | | 1,410 | | 384 | |
7.50%, 4/1/27 - 1/1/32 | | 1,989 | | 541 | |
8.00%, 2/1/23 - 12/1/31 | | 7,283 | | 1,846 | |
8.50%, 10/1/24 - 10/1/25 | | 1,420 | | 496 | |
9.00%, 11/1/26 | | 727 | | 233 | |
9.50%, 9/1/18 | | — | @ | — | @ |
IO PAC REMIC | | | | | |
8.00%, 8/18/27 - 9/18/27 | | 2,713 | | 557 | |
1,159.20%, 7/25/21 | | — | @ | 1 | |
IO REMIC | | | | | |
5.50%, 3/25/17 | | 138 | | 6 | |
6.00%, 8/25/32 - 7/25/33 | | 6,769 | | 1,186 | |
6.50%, 5/25/33 - 6/25/33 | | 3,639 | | 731 | |
7.00%, 4/25/33 - 5/25/33 | | 3,877 | | 730 | |
8.00%, 7/18/27 - 12/25/30 | | 396 | | 84 | |
PAC REMIC | | | | | |
8.50%, 9/25/20 | | 28 | | 30 | |
8.75%, 11/25/19 | | 4 | | 4 | |
REMIC | | | | | |
7.00%, 9/25/32 | | 2,152 | | 2,225 | |
Government National Mortgage Association, | | | | | |
Inv Fl IO | | | | | |
4.96%, 5/20/31 | | 915 | | 124 | |
5.50%, 9/16/27 | | 148 | | 19 | |
5.51%, 4/16/29 | | 3,302 | | 262 | |
6.06%, 12/16/19 | | 397 | | 52 | |
6.11%, 8/16/29 | | 4,357 | | 598 | |
PAC | | | | | |
6.00%, 6/20/38 | | 38,811 | | 39,812 | |
| | | | 58,445 | |
Collateralized Mortgage Obligations - Non Agency Collateral Series (2.1%) | | | | | |
Banc of America Funding Corp., | | | | | |
IO | | | | | |
0.42%, 9/20/35 | | 23,503 | | 617 | |
Countrywide Alternative Loan Trust, | | | | | |
IO | | | | | |
0.94%, 3/20/46 | | 10,003 | | 312 | |
0.96%, 11/20/35 | | 83,865 | | 1,441 | |
2.18%, 3/20/46 | | 39,463 | | 1,208 | |
2.40%, 12/20/46 | | 92,817 | | 2,842 | |
2.54%, 12/20/35(e)(h) | | 58,158 | | 1,745 | |
2.56%, 2/25/37 | | 52,614 | | 1,347 | |
2.57%, 2/20/47 | | 45,002 | | 1,575 | |
Countrywide Home Loan Mortgage Pass Through Trust, | | | | | |
IO | | | | | |
0.84%, 2/25/35 | | 20,830 | | 248 | |
Greenpoint Mortgage Funding Trust, | | | | | |
IO | | | | | |
3.12%, 6/25/45 | | 19,115 | | 502 | |
GS Mortgage Securities Corp., | | | | | |
IO | | | | | |
2.84%, 8/25/35(e)(h) | | 19,091 | | 275 | |
Harborview Mortgage Loan Trust, | | | | | |
IO | | | | | |
2.59%, 5/19/35(h) | | 40,028 | | 400 | |
2.85%, 10/20/45(h) | | 26,725 | | 484 | |
2.88%, 1/19/36(h) | | 16,834 | | 258 | |
2.93%, 3/19/37(h) | | 35,067 | | 816 | |
PO | | | | | |
3/19/37 - 10/20/45 | | 1,766 | | 301 | |
Indymac Index Mortgage Loan Trust, | | | | | |
IO | | | | | |
2.34%, 7/25/35(h) | | 28,298 | | 380 | |
PO | | | | | |
7/25/35 | | — | @ | — | @ |
Kidder Peabody Mortgage Assets Trust, | | | | | |
IO | | | | | |
9.50%, 4/22/18 | | 16 | | 3 | |
| | | | | | | |
The accompanying notes are an integral part of the financial statements. | | 9 |
2008 Annual Report
September 30, 2008
Portfolio of Investments (cont’d)
Advisory Portfolio
| | Face Amount | | Value | |
| | (000) | | (000) | |
Collateralized Mortgage Obligations - Non Agency Collateral Series (cont’d) | | | | | |
Lehman Structured Securities Corp., | | | | | |
IO | | | | | |
7.00%, 10/26/29(e)(k) | | $ | 7,919 | | $ | 119 | |
| | | | 14,873 | |
Mortgages - Other (11.1%) | | | | | |
American Express Co., | | | | | |
9.63%, 12/25/12(d)(k) | | 56 | | 56 | |
American Home Mortgage Assets, | | | | | |
3.33%, 3/25/47(d)(h) | | 11,346 | | 6,241 | |
3.40%, 10/25/46(d)(h) | | 6,952 | | 3,806 | |
3.44%, 5/25/46(c)(d)(h) | | 13,540 | | 4,851 | |
3.45%, 6/25/47(h) | | 10,286 | | 3,292 | |
3.51%, 6/25/47(d)(h) | | 9,900 | | 1,459 | |
3.62%, 10/25/46(d)(k)(h) | | 3,678 | | 44 | |
American Home Mortgage Investment Trust, | | | | | |
3.51%, 9/25/45(d)(h) | | 982 | | 516 | |
3.63%, 3/25/46(k)(h) | | 2,318 | | 261 | |
3.93%, 11/25/45(d)(k)(h) | | 2,675 | | 57 | |
American Housing Trust, | | | | | |
9.55%, 9/25/20 | | 232 | | 219 | |
Bear Stearns Mortgage Funding Trust, | | | | | |
3.39%, 10/25/36(d)(h) | | 242 | | 138 | |
California Federal Savings & Loan Association, | | | | | |
8.80%, 1/25/14(d)(k) | | — | @ | — | @ |
Countrywide Alternative Loan Trust, | | | | | |
2.87%, 12/20/35(h) | | 7 | | 2 | |
3.38%, 5/25/47(d)(h) | | 6,844 | | 3,833 | |
3.40%, 3/20/46(d)(h) | | 5,373 | | 3,132 | |
3.48%, 12/25/46(d)(h) | | 6,198 | | 1,413 | |
3.50%, 10/25/35(d)(h) | | 1,069 | | 935 | |
3.73%, 7/25/46(d)(k)(h) | | 5,022 | | 63 | |
3.84%, 3/25/47(d)(k)(h) | | 1,848 | | 14 | |
4.01%, 6/25/46(d)(k)(h) | | 6,186 | | 67 | |
4.19%, 11/20/35(d)(k)(h) | | 6,335 | | 147 | |
4.35%, 12/20/46(d)(k)(h) | | 2,047 | | 452 | |
4.46%, 6/25/47(d)(k)(h) | | 1,815 | | 28 | |
Deutsche ALT-A Securities NIM Trust, | | | | | |
6.75%, 2/25/47(e) | | 336 | | 312 | |
Deutsche ALT-A Securities, Inc. Alternate Loan Trust, | | | | | |
3.69%, 2/25/47(d)(h) | | 5,519 | | 1,092 | |
Downey Savings & Loan Association Mortgage Loan Trust, | | | | | |
3.21%, 4/19/48(d)(h) | | 1,707 | | 532 | |
Gemsco Mortgage Pass Through Certificate, | | | | | |
8.70%, 11/25/10(d)(k) | | 2 | | 2 | |
GSR Mortgage Loan Trust, | | | | | |
3.40%, 8/25/46(d)(h) | | 9,458 | | 7,093 | |
Harborview Mortgage Loan Trust, | | | | | |
3.27%, 3/19/37(d)(h) | | 6,381 | | 3,665 | |
3.32%, 7/19/45(d)(h) | | 1,128 | | 467 | |
3.44%, 8/21/36(d)(h) | | 1 | | — | @ |
Impac CMB Trust, | | | | | |
4.05%, 9/25/34(h) | | 50 | | 40 | |
Indymac Index Mortgage Loan Trust, | | | | | |
3.49%, 7/25/35(d)(h) | | 1,269 | | 466 | |
Lehman XS Trust, | | | | | |
3.62%, 8/25/46(d)(k)(h) | | 6,150 | | 148 | |
4.21%, 3/25/47(d)(k)(h) | | 6,398 | | 111 | |
Mastr Adjustable Rate Mortgages Trust, | | | | | |
3.46%, 4/25/46(d)(h) | | 5,514 | | 2,081 | |
3.86%, 4/25/46(d)(k)(h) | | 4,409 | | 57 | |
3.96%, 4/25/46(d)(k)(h) | | 2,275 | | 18 | |
4.41%, 5/25/47(d)(k)(h) | | 4,188 | | 38 | |
Residential Accredit Loans, Inc., | | | | | |
3.35%, 3/25/37(d)(h) | | 10,411 | | 5,622 | |
3.36%, 2/25/47(d)(h) | | 4,065 | | 2,312 | |
3.47%, 5/25/47(c)(d)(h) | | 9,591 | | 3,273 | |
Ryland Acceptance Corp. IV, | | | | | |
6.65%, 7/1/11 | | 36 | | 36 | |
Structured Asset Mortgage Investments, Inc., | | | | | |
3.40%, 2/25/36(d)(h) | | 4,222 | | 2,238 | |
3.48%, 4/25/36(h) | | 464 | | 191 | |
3.49%, 7/25/46(d)(h) | | 2,750 | | 688 | |
3.51%, 5/25/46(d)(h) | | 2,760 | | 669 | |
3.52%, 2/25/36(d)(h) | | 11,674 | | 4,487 | |
3.74%, 12/25/35(d)(k)(h) | | 3,895 | | 156 | |
Washington Mutual Alternative Mortgage Pass Through Certificates, | | | | | |
3.80%, 4/25/46(d)(h) | | 14,913 | | 6,894 | |
Washington Mutual Mortgage Pass Through Certificates, | | | | | |
3.48%, 4/25/45(d)(h) | | 3,580 | | 1,432 | |
3.50%, 8/25/45(h) | | 109 | | 108 | |
Washington Mutual, Inc., | | | | | |
3.44%, 7/25/47(d)(h) | | 493 | | 139 | |
3.47%, 10/25/45(h) | | 436 | | 429 | |
3.56%, 6/25/46(d)(h) | | 1,570 | | 188 | |
3.57%, 7/25/45(h) | | 2,931 | | 1,186 | |
3.80%, 5/25/46(d)(h) | | 5,156 | | 2,166 | |
| | | | 79,362 | |
U.S. Treasury Security (2.0%) | | | | | |
U.S. Treasury Bond STRIPS, | | | | | |
Zero Coupon, 5/15/21 | | 25,115 | | 14,109 | |
Total Fixed Income Securities (Cost $912,118) | | | | 731,605 | |
| | | | | | | |
| | | | Value | |
| | Shares | | (000) | |
Short-Term Investments (17.5%) | | | | | |
Securities held as Collateral on Loaned Securities (0.0%) | | | | | |
Investment Company (0.0%) | | | | | |
Morgan Stanley Institutional Liquidity Money Market Portfolio — Institutional Class (p) | | 542 | | 1 | |
| | Face Amount | | Value | |
| | (000) | | (000) | |
Short-Term Debt (0.0%) | | | | | |
Bancaja, | | | | | |
2.96%, 11/12/08 (h) | | $ | — | @ | — | @ |
| | | | | | |
10 | The accompanying notes are an integral part of the financial statements. |
| 2008 Annual Report |
| |
| September 30, 2008 |
Portfolio of Investments (cont’d)
Advisory Portfolio
| | Face Amount | | Value | |
| | (000) | | (000) | |
Short-Term Debt (0.0%) (cont’d) | | | | | |
Citigroup Global Markets, Inc., | | | | | |
1.00%, 10/1/08 | | $ | — | @ | $ | — | @ |
| | | | — | |
| | | | 1 | |
| | | | | | | |
| | | | Value | |
| | Shares | | (000) | |
Investment Company (13.9%) | | | | | |
Morgan Stanley Institutional Liquidity Money Market Portfolio — Institutional Class (p) | | 100,514,911 | | 100,515 | |
| | Face Amount | | Value | |
| | (000) | | (000) | |
U.S. Treasury Securities (3.6%) | | | | | |
U.S. Treasury Bills, | | | | | |
0.17%, 10/9/08(r)(j) | | $ | 22,905 | | 22,904 | |
0.95%, 1/15/09(r) | | 3,750 | | 3,740 | |
| | | | 26,644 | |
Total Short-Term Investments (Cost $127,157) | | | | 127,160 | |
Total Investments (118.5%) (Cost $1,039,275) — Including $1 of Securities Loaned | | | | 858,765 | |
Liabilities in Excess of Other Assets (-18.5%) | | | | (134,169 | ) |
Net Assets (100%) | | | | $ | 724,596 | |
| | | | | | | |
(c) | All or a portion of security on loan at September 30, 2008. |
(d) | Security was valued at fair value — At September 30, 2008, the Portfolio held $73,286,000 of fair valued securities, representing 10.1% of net assets. |
(e) | 144A security — Certain conditions for public sale may exist. Unless otherwise noted, these securities are deemed to be liquid. |
(h) | Variable/Floating Rate Security — Interest rate changes on these instruments are based on changes in a designated rate. The rates shown are those in effect on September 30, 2008. |
(i) | Security is subject to delayed delivery. |
(j) | All or a portion of the security was pledged to cover margin requirements for futures contracts. |
(k) | Security has been deemed illiquid at September 30, 2008. |
(p) | See Note G within the Notes to Financial Statements regarding investment in Morgan Stanley Institutional Liquidity Money Market Portfolio — Institutional Class. |
(r) | Rate shown is the yield to maturity at September 30, 2008. |
@ | Value is less than $500. |
| |
Inv Fl | Inverse Floating Rate - Interest rate fluctuates with an inverse relationship to an associated interest rate. Indicated rate is the effective rate at September 30, 2008. |
IO | Interest Only |
PAC | Planned Amortization Class |
PO | Principal Only |
REMIC | Real Estate Mortgage Investment Conduit |
STRIPS | Separate Trading of Registered Interest and Principal of Securities |
TBA | To Be Announced |
| | |
Futures Contracts:
The Portfolio had the following futures contract(s) open at period end:
| | | | | | | | Net Unrealized | |
| | Number | | | | | | Appreciation | |
| | of | | Value | | Expiration | | (Depreciation) | |
| | Contracts | | (000) | | Date | | (000) | |
| | | | | | | | | |
Long: | | | | | | | | | |
| | | | | | | | | |
EuroDollar
CME | | 351 | | $ | 84,718 | | Dec-08 | | $ | 1,123 | |
EuroDollar
CME | | 376 | | 91,213 | | Mar-09 | | 1,743 | |
EuroDollar
CME | | 399 | | 96,718 | | Jun-09 | | 1,077 | |
EuroDollar
CME | | 147 | | 35,602 | | Sep-09 | | 58 | |
EuroDollar
CME | | 321 | | 77,489 | | Dec-09 | | 49 | |
U.S. Treasury 2 yr. Note | | 176 | | 37,565 | | Dec-08 | | 104 | |
U.S. Treasury
10 yr. Note | | 529 | | 60,636 | | Dec-08 | | (623 | ) |
U.S. Treasury
Long Bond | | 574 | | 67,257 | | Dec-08 | | (550 | ) |
| | | | | | | | | |
Short: | | | | | | | | | |
| | | | | | | | | |
U.S. Treasury | | | | | | | | | |
5 yr. Note | | 1,886 | | 211,674 | | Dec-08 | | (658 | ) |
5 yr. Swap | | 100 | | 10,850 | | Dec-08 | | (50 | ) |
10 yr. Swap | | 450 | | 50,330 | | Dec-08 | | (166 | ) |
| | | | | | | | $ | 2,107 | |
| | | | | | | | | | | |
CME — Chicago Mercantile Exchange
The accompanying notes are an integral part of the financial statements. | 11 |
2008 Annual Report
September 30, 2008
Portfolio of Investments (cont’d)
Advisory Portfolio
Interest Rate Swap Contracts
The Portfolio had the following interest rate swap agreement(s) open at period end:
| | | | | | | | | | | | Unrealized | |
| | | | | | | | | | Notional | | Appreciation | |
| | Floating Rate | | Pay/Receive | | | | Termination | | Amount | | (Depreciation) | |
Swap Counterparty | | Index | | Floating Rate | | Fixed Rate | | Date | | (000) | | (000) | |
Bank of America | | | | | | | | | | | | | |
| | 3 Month LIBOR | | Pay | | 4.20 | % | | 6/3/13 | | $ | 36,500 | | $ | 694 | |
| | 3 Month LIBOR | | Pay | | 4.15 | | | 6/9/13 | | 205,415 | | 3,440 | |
| | 3 Month LIBOR | | Receive | | 5.38 | | | 7/24/18 | | 224,008 | | (3,452 | ) |
| | 3 Month LIBOR | | Receive | | 3.90 | | | 9/10/13 | | 131,580 | | 780 | |
| | 3 Month LIBOR | | Pay | | 4.09 | | | 9/17/17 | | 37,575 | | (838 | ) |
| | 3 Month LIBOR | | Pay | | 5.37 | | | 2/12/18 | | 66,643 | | 1,102 | |
| | 3 Month LIBOR | | Pay | | 5.47 | | | 2/25/18 | | 13,295 | | 269 | |
| | 3 Month LIBOR | | Pay | | 5.07 | | | 4/14/18 | | 59,075 | | 294 | |
| | 3 Month LIBOR | | Pay | | 4.98 | | | 4/15/18 | | 37,900 | | 67 | |
| | 3 Month LIBOR | | Receive | | 4.67 | | | 8/4/18 | | 311,470 | | (5,944 | ) |
| | 3 Month LIBOR | | Receive | | 5.15 | | | 8/26/18 | | 14,000 | | (96 | ) |
| | 3 Month LIBOR | | Receive | | 5.82 | | | 2/12/23 | | 85,595 | | (1,824 | ) |
| | 3 Month LIBOR | | Receive | | 5.88 | | | 2/25/23 | | 17,223 | | (400 | ) |
| | 3 Month LIBOR | | Receive | | 5.47 | | | 4/14/23 | | 75,655 | | (850 | ) |
| | 3 Month LIBOR | | Receive | | 5.38 | | | 4/15/23 | | 43,455 | | (377 | ) |
| | 3 Month LIBOR | | Pay | | 5.56 | | | 7/24/23 | | 286,607 | | 3,872 | |
| | 3 Month LIBOR | | Receive | | 4.17 | | | 8/4/13 | | 98,000 | | (645 | ) |
| | 3 Month LIBOR | | Pay | | 5.34 | | | 8/26/23 | | 17,925 | | 133 | |
Citigroup | | | | | | | | | | | | | | |
| | 3 Month LIBOR | | Receive | | 5.07 | | | 11/9/09 | | 9,065 | | (582 | ) |
| | 3 Month LIBOR | | Pay | | 5.37 | | | 5/23/17 | | 76,990 | | 6,644 | |
| | 3 Month LIBOR | | Receive | | 5.29 | | | 9/28/17 | | 63,605 | | (4,073 | ) |
| | 3 Month LIBOR | | Receive | | 5.00 | | | 11/13/17 | | 16,589 | | (963 | ) |
| | 3 Month LIBOR | | Pay | | 4.47 | | | 1/10/18 | | 45,324 | | 232 | |
Deutsche Bank | | | | | | | | | | | | | | |
| | 3 Month LIBOR | | Pay | | 5.35 | | | 5/24/17 | | 88,835 | | 7,537 | |
| | 3 Month LIBOR | | Pay | | 5.39 | | | 5/25/17 | | 113,522 | | 9,969 | |
| | 3 Month LIBOR | | Pay | | 5.43 | | | 5/29/17 | | 197,220 | | 17,905 | |
| | 6 Month EUR LIBOR | | Receive | | 4.93 | | | 7/1/18 | | 97,570 | | (1,184 | ) |
| | 6 Month EUR LIBOR | | Receive | | 4.86 | | | 7/10/18 | | 92,355 | | (782 | ) |
| | 6 Month EUR LIBOR | | Pay | | 4.96 | | | 7/24/18 | | 145,960 | | 1,934 | |
| | 6 Month EUR LIBOR | | Receive | | 4.68 | | | 9/11/18 | | 129,071 | | — | |
| | 6 Month EUR LIBOR | | Pay | | 4.71 | | | 9/11/18 | | 129,071 | | 149 | |
| | 3 Month LIBOR | | Receive | | 4.83 | | | 9/11/18 | | 171,290 | | 809 | |
| | 3 Month LIBOR | | Pay | | 4.86 | | | 9/11/18 | | 171,290 | | — | |
| | 6 Month EUR LIBOR | | Pay | | 5.27 | | | 7/2/23 | | 122,240 | | 4,462 | |
| | 6 Month EUR LIBOR | | Pay | | 5.24 | | | 7/9/23 | | 127,940 | | 1,751 | |
| | 6 Month EUR LIBOR | | Pay | | 5.24 | | | 7/10/23 | | 116,010 | | 1,592 | |
| | 6 Month EUR LIBOR | | Receive | | 4.86 | | | 7/9/18 | | 102,010 | | (867 | ) |
| | 6 Month EUR LIBOR | | Receive | | 5.19 | | | 7/24/23 | | 183,093 | | (2,132 | ) |
Goldman Sachs | | | | | | | | | | | | | | |
| | 3 Month LIBOR | | Pay | | 5.63 | | | 2/28/18 | | 219,290 | | 5,693 | |
| | 3 Month LIBOR | | Receive | | 6.04 | | | 2/25/23 | | 281,353 | | (7,754 | ) |
JPMorgan Chase | | | | | | | | | | | | | | |
| | 3 Month LIBOR | | Pay | | 4.07 | | | 5/16/13 | | 122,025 | | 1,662 | |
| | 3 Month LIBOR | | Pay | | 4.07 | | | 5/16/13 | | 90,000 | | 1,236 | |
| | 3 Month LIBOR | | Pay | | 4.27 | | | 6/2/13 | | 61,850 | | 1,400 | |
| | 3 Month LIBOR | | Pay | | 4.49 | | | 6/23/13 | | 25,000 | | 782 | |
| | 3 Month LIBOR | | Pay | | 5.37 | | | 5/23/17 | | 38,314 | | 3,315 | |
| | 3 Month LIBOR | | Pay | | 5.34 | | | 5/24/17 | | 77,474 | | 6,520 | |
| | 3 Month LIBOR | | Pay | | 5.09 | | | 9/11/17 | | 114,821 | | 5,959 | |
| | 3 Month LIBOR | | Pay | | 5.16 | | | 9/20/17 | | 49,645 | | 2,801 | |
| | | | | | | | | | | | | | | | |
12 | The accompanying notes are an integral part of the financial statements. |
| 2008 Annual Report |
| |
| September 30, 2008 |
Portfolio of Investments (cont’d)
Advisory Portfolio
Interest Rate Swap Contracts (cont’d)
The Portfolio had the following interest rate swap agreement(s) open at period end:
| | | | | | | | | | | | Unrealized | |
| | | | | | | | | | Notional | | Appreciation | |
| | Floating Rate | | Pay/Receive | | | | Termination | | Amount | | (Depreciation) | |
Swap Counterparty | | Index | | Floating Rate | | Fixed Rate | | Date | | (000) | | (000) | |
JPMorgan Chase (cont’d) | | | | | | | | | | | | | |
| | 3 Month LIBOR | | Receive | | 5.23 | % | | 9/27/17 | | $ | 60,190 | | $ | (3,610 | ) |
| | 3 Month LIBOR | | Receive | | 5.30 | | | 9/28/17 | | 60,432 | | (3,920 | ) |
| | 3 Month LIBOR | | Pay | | 5.25 | | | 10/11/17 | | 33,328 | | 2,650 | |
| | 3 Month LIBOR | | Receive | | 5.01 | | | 11/13/17 | | 31,606 | | (1,883 | ) |
| | 3 Month LIBOR | | Receive | | 4.24 | | | 1/22/18 | | 35,323 | | 459 | |
| | 3 Month LIBOR | | Receive | | 4.52 | | | 2/19/18 | | 27,315 | | (221 | ) |
| | 3 Month LIBOR | | Pay | | 4.48 | | | 2/25/18 | | 46,533 | | 213 | |
| | 3 Month LIBOR | | Receive | | 3.96 | | | 3/20/18 | | 40,000 | | 1,473 | |
| | 3 Month LIBOR | | Receive | | 4.41 | | | 5/1/18 | | 224,625 | | (2,248 | ) |
Merrill Lynch | | | | | | | | | | | | | | |
| | 3 Month LIBOR | | Pay | | 5.00 | | | 4/15/18 | | 50,600 | | 123 | |
| | 3 Month LIBOR | | Receive | | 5.40 | | | 4/16/23 | | 61,045 | | (556 | ) |
| | | | | | | | | | | | | $ | 52,720 | |
| | | | | | | | | | | | | | | | |
Zero Coupon Swap Contracts
The Portfolio had the following zero coupon swap agreement(s) open at period end:
Swap Counterparty | | Notional
Amount
(000) | | Receive | | Termination
Date | | Unrealized
Appreciation
(Depreciation)
(000) | |
JPMorgan Chase | | | | | | | | | |
| | $14,116 | | 3 Month LIBOR | | 5/15/21 | | $ | — | |
| | | | | | | | | | |
EUR — Euro
LIBOR — London Inter Bank Offer Rate
The accompanying notes are an integral part of the financial statements. | 13 |
2008 Annual Report
September 30, 2008
Investment Overview (unaudited)
Advisory Portfolio II
The Advisory Portfolio II seeks returns consistent with returns generated by the market for mortgage securities. The Portfolio invests primarily in U.S. dollar-denominated investment grade mortgage securities of the U.S. government and private issuers and in mortgage derivatives. The Portfolio also invests in other U.S. government securities and U.S. dollar-denominated investment grade fixed income securities. In addition, the Portfolio may invest a portion of its assets in structured investments, structured notes and other types of similarly structured products consistent with the Portfolio’s investment objectives and policies. Generally, structured investments are interests in entities organized and operated for the purpose of restructuring the investment characteristics of underlying investment interests or securities. The Portfolio may invest in asset-backed securities and may use futures, options, forwards, CMOs, swaps, options on swaps and other derivatives. The Portfolio may also invest in TBAs. The Portfolio may also invest in securities of foreign issuers, including issuers located in emerging market countries. The securities in which the Portfolio may invest will be denominated in U.S. dollars and will be investment grade.
Performance
For the period from March 11, 2008 (commencement of operations) to September 30, 2008, the Portfolio had a cumulative total return based on net asset value and reinvestment of distributions per share of -8.18%, net of fees. The Portfolio underperformed against its benchmark the Lehman Brothers Mortgage Index (the “Index”) which returned 3.36%.
Factors Affecting Performance
· The financial markets were under pressure throughout the period since the Portfolio’s inception on March 11, 2008, amid disrupted credit markets, ongoing deterioration of the housing market, losses in the financial sector, and growing fears of recession.
· The third quarter of 2008, however, will most certainly go down as a defining moment in the history of the financial industry. Investor confidence plummeted and credit markets seized as several venerable financial institutions were forced into mergers or dissolved entirely in September, resulting in significant price erosion across all but the U.S. Treasury sector.
· The primary detractor from the Portfolio’s relative performance was an overweight in non-agency mortgage securities as spreads in the sector moved wider over the course of the period.
· An underweight in agency mortgage-backed securities, however, benefited relative performance as it helped mitigate the impact on the Portfolio of spread widening in the sector that occurred during the period.
· An overweight exposure to U.S. Treasury securities was additive to relative performance as the flight to quality that took place, particularly in the last month of the period, helped Treasuries outperform all other sectors of the fixed income market.
Management Strategies
· The Portfolio maintained an overweight in non-agency mortgage-backed securities. The specific non-agency issues held in the Portfolio are backed primarily by Alt-A borrowers (those who have relatively strong credit but are not considered “prime” borrowers) and are concentrated in the senior and middle tranches of the capital structure. Given our expectations that the housing market situation may take some time to work itself out and therefore, these securities would continue to add volatility, we began reducing the Portfolio’s exposure to non-agency mortgage-backed securities in the third quarter of 2008.
· The Portfolio maintained an underweight to agency mortgage-backed securities, resulting in an overweight to U.S. Treasuries.
14
| 2008 Annual Report |
| |
| September 30, 2008 |
Investment Overview (cont’d)
Advisory Portfolio II

* Minimum Investment
** Commenced operations on March 11, 2008.
In accordance with SEC regulations, the Portfolio performance shown assumes that all recurring fees (including management fees) were deducted and all dividends and distributions were reinvested.
Performance Compared to the Lehman Brothers Mortgage Index(1)
| | Total Returns(2) | |
| | Cumulative Since
Inception(4) | |
Portfolio(3) | | (8.18 | )% |
Lehman Brothers Mortgage Index | | 3.36 | |
| | | | |
Performance data quoted represents past performance, which is no guarantee of future results, and current performance may be lower or higher than the figures shown. Performance assumes that all dividends and distributions, if any, were reinvested. For the most recent month-end performance figures, please call 1(800) 548-7786. Investment returns and principal value will fluctuate so that Portfolio shares, when redeemed, may be worth more or less than their original cost. Total returns do not reflect the deduction of taxes that a shareholder would pay on Portfolio distributions or the redemption of Portfolio shares.
(1) The Lehman Brothers Mortgage Index includes GNMA, FNMA and FHLMC pass-through securities with original maturities of 15, 20, and 30 years, as well as balloon mortgages. The Index is formed by grouping the universe of over 600,000 individual fixed rate MBS pools into approximately 3,500 generic aggregates. These aggregates are defined according to agency, program, pass-through coupon and origination year. Index maturity and liquidity criteria are then applied to these aggregates to determine which qualify for inclusion in the Index. The Index excludes buydown, graduated equity mortgages, project loans, ARMS, non-agency mortgages and CMOs. The Index is unmanaged and its returns do not include any sales charges or fees. Such costs would lower performance. It is not possible to invest directly in an index.
(2) Total returns for the Portfolio reflect expenses waived and/or reimbursed, if applicable, by the Adviser. Without such waivers and/or reimbursements, total returns would have been lower. Fee waivers and/or reimbursements are voluntary and the Adviser reserves the right to commence or terminate any waiver and/or reimbursement at any time. Returns for periods less than one year are not annualized.
(3) Commenced operations on March 11, 2008.
(4) For comparative purposes, cumulative since inception return listed for the Index refer to the inception date or initial offering of the Portfolio, not the inception of the Index.
Portfolio Composition
Classification | | | Percentage of
Total Investments | |
Agency Fixed Rate Mortgages | | 63.5 | % | |
Agency Adjustable Rate Mortgages | | 7.8 | | |
Mortgages - Other | | 7.5 | | |
Other* | | 6.3 | | |
Short-Term Investments | | 14.9 | | |
Total Investments | | 100.0 | % | |
* Industries and/or Investment types which do not appear in the above table, as well as those which represent less than 5% of total investments, if applicable, are included in the category labeled “Other”.
15
2008 Annual Report
September 30, 2008
Portfolio of Investments
Advisory Portfolio II
| | Face Amount | | Value | |
| | (000) | | (000) | |
Fixed Income Securities (91.9%) | | | | | |
Agency Adjustable Rate Mortgages (8.5%) | | | | | |
Federal Home Loan Mortgage Corp., | | | | | |
Conventional Pools: | | | | | |
3.54%, 5/1/34 | | $ | 628 | | $ | 633 | |
5.54%, 4/1/37 | | 9,944 | | 10,101 | |
5.59%, 11/1/36 | | 3,520 | | 3,590 | |
5.71%, 1/1/37 | | 5,456 | | 5,477 | |
5.97%, 1/1/37 | | 4,297 | | 4,396 | |
Federal National Mortgage Association, | | | | | |
Conventional Pools: | | | | | |
4.26%, 6/1/34 | | 6 | | 6 | |
4.87%, 5/1/35 | | 1,173 | | 1,178 | |
4.98%, 3/1/37 | | 1,797 | | 1,816 | |
5.27%, 4/1/36 | | 8,233 | | 8,382 | |
5.80%, 5/1/37 | | 5,016 | | 5,090 | |
5.98%, 4/1/37 | | 8,970 | | 9,115 | |
Government National Mortgage Association, | | | | | |
Various Pools: | | | | | |
5.13%, 10/20/25 - 12/20/27 | | 1,504 | | 1,524 | |
5.38%, 5/20/24 - 2/20/28 | | 6,573 | | 6,661 | |
5.63%, 7/20/25 - 9/20/27 | | 1,121 | | 1,135 | |
| | | | 59,104 | |
Agency Fixed Rate Mortgages (68.4%) | | | | | |
Federal Home Loan Mortgage Corp., | | | | | |
Conventional Pools: | | | | | |
9.00%, 10/1/16 | | 7 | | 7 | |
9.50%, 10/1/16 - 3/1/20 | | 283 | | 317 | |
10.00%, 1/1/09 - 12/1/20 | | 608 | | 692 | |
10.25%, 12/1/11 | | 2 | | 2 | |
10.50%, 11/1/08 - 12/1/20 | | 249 | | 283 | |
11.00%, 2/1/11 - 9/1/20 | | 173 | | 199 | |
11.25%, 6/1/10 - 12/1/15 | | 2 | | 3 | |
11.50%, 12/1/09 - 9/1/19 | | 93 | | 104 | |
11.75%, 8/1/14 | | 1 | | 1 | |
12.00%, 10/1/09 - 7/1/20 | | 118 | | 135 | |
12.50%, 10/1/09 - 6/1/15 | | 7 | | 8 | |
13.00%, 9/1/10 - 12/1/13 | | — @ | | 1 | |
13.50%, 2/1/10 | | — @ | | — | @ |
Gold Pools: | | | | | |
5.00%, 7/1/38 | | 50,678 | | 49,405 | |
5.50%, 12/1/36 - 7/1/38 | | 58,786 | | 58,530 | |
6.00%, 10/1/28 - 7/1/38 | | 48,522 | | 49,175 | |
6.50%, 5/1/21 - 11/1/33 | | 1,629 | | 1,684 | |
7.00%, 8/1/27 - 11/1/32 | | 4,924 | | 5,178 | |
7.50%, 2/1/23 - 9/1/32 | | 9,600 | | 10,399 | |
8.00%, 5/1/20 - 12/1/31 | | 4,445 | | 4,822 | |
8.50%, 8/1/14 - 7/1/31 | | 10,359 | | 11,502 | |
9.00%, 10/1/17 - 1/1/31 | | 870 | | 966 | |
9.50%, 11/1/16 - 12/1/22 | | 388 | | 432 | |
10.00%, 6/1/17 - 4/1/25 | | 227 | | 260 | |
10.50%, 7/1/19 - 3/1/21 | | 79 | | 91 | |
11.00%, 8/1/19 - 9/1/20 | | 60 | | 67 | |
11.50%, 2/1/16 - 6/1/20 | | 39 | | 43 | |
12.00%, 6/1/20 | | 73 | | 83 | |
12.50%, 7/1/19 | | 2 | | 2 | |
October TBA: | | | | | |
6.00%, 10/15/38(i) | | 25,150 | | 25,460 | |
6.50%, 10/15/49(i) | | 3,550 | | 3,640 | |
Federal National Mortgage Association, | | | | | |
Conventional Pools: | | | | | |
4.50%, 8/1/18 | | 107 | | 106 | |
5.50%, 3/1/17 - 6/1/38 | | 64,893 | | 64,774 | |
6.00%, 4/1/13 - 11/1/32 | | 204 | | 209 | |
6.50%, 6/1/15 - 4/1/34 | | 17,801 | | 18,401 | |
7.00%, 12/1/12 - 6/1/35 | | 29,120 | | 30,639 | |
7.50%, 10/1/12 - 8/1/37 | | 24,089 | | 25,921 | |
8.00%, 7/1/14 - 4/1/33 | | 15,555 | | 16,869 | |
8.50%, 4/1/09 - 5/1/32 | | 14,381 | | 15,859 | |
9.00%, 1/1/20 - 4/1/26 | | 305 | | 336 | |
9.50%, 7/1/17 - 4/1/30 | | 1,808 | | 2,015 | |
10.00%, 10/1/12 - 11/1/25 | | 1,732 | | 1,981 | |
10.50%, 10/1/11 - 6/1/27 | | 479 | | 551 | |
10.75%, 10/1/11 | | 1 | | 1 | |
11.00%, 10/1/13 - 7/1/25 | | 117 | | 134 | |
11.50%, 8/1/11 - 8/1/25 | | 229 | | 262 | |
12.00%, 1/1/13 - 5/1/20 | | 72 | | 80 | |
12.50%, 2/1/11 - 9/1/15 | | 118 | | 139 | |
October TBA: | | | | | |
5.00%, 10/25/23(i) | | 12,818 | | 12,728 | |
6.50%, 10/25/38(i) | | 18,725 | | 19,202 | |
7.00%, 10/25/38(i) | | 19,400 | | 20,273 | |
Government National Mortgage Association, | | | | | |
Various Pools: | | | | | |
5.50%, 12/15/32 | | 11 | | 11 | |
6.50%, 10/15/10 | | 6 | | 6 | |
7.00%, 7/15/31 | | 47 | | 50 | |
8.50%, 7/15/16 - 3/15/20 | | 498 | | 548 | |
9.00%, 11/15/16 - 11/15/24 | | 2,783 | | 3,056 | |
9.50%, 7/15/09 - 10/15/24 | | 6,480 | | 7,181 | |
10.00%, 11/15/09 - 2/15/26 | | 10,636 | | 12,099 | |
10.50%, 4/15/13 - 4/15/25 | | 2,415 | | 2,771 | |
11.00%, 12/15/09 - 4/15/21 | | 2,590 | | 2,911 | |
11.50%, 3/15/10 - 11/15/19 | | 170 | | 191 | |
12.00%, 11/15/12 - 5/15/16 | | 370 | | 421 | |
12.50%, 5/15/10 - 4/15/19 | | 28 | | 31 | |
13.00%, 1/15/11 - 10/15/13 | | 12 | | 14 | |
13.50%, 5/15/10 - 5/15/13 | | 12 | | 14 | |
| | | | 483,275 | |
Collateralized Mortgage Obligations - Agency Collateral Series (2.1%) | | | | | |
Federal Home Loan Mortgage Corp., | | | | | |
Inv FI IO REMIC | | | | | |
3.50%, 3/15/24 | | 11,818 | | 791 | |
4.50%, 6/17/27 | | 55 | | 5 | |
4.85%, 12/15/23 | | 1,161 | | 224 | |
5.01%, 8/15/30 | | 26 | | 2 | |
5.46%, 3/15/32 | | 58 | | 6 | |
5.51%, 6/15/28 - 3/15/32 | | 979 | | 34 | |
6.01%, 9/15/30 | | 700 | | 68 | |
6.06%, 10/15/29 | | 4 | | — | @ |
IO | | | | | |
6.00%, 5/1/31 | | 444 | | 90 | |
| | | | | | | |
16 | The accompanying notes are an integral part of the financial statements. |
| 2008 Annual Report |
| |
| September 30, 2008 |
Portfolio of Investments (cont’d)
Advisory Portfolio II
| | Face Amount | | Value | |
| | (000) | | (000) | |
Collateralized Mortgage Obligations - Agency Collateral Series (cont’d) | | | | | |
6.50%, 4/1/28 - 8/1/28 | | $ | 162 | | $ | 43 | |
7.00%, 6/1/30 - 3/1/32 | | 1,586 | | 410 | |
7.50%, 4/1/28 - 9/1/30 | | 834 | | 245 | |
8.00%, 1/1/28 - 6/1/31 | | 2,417 | | 628 | |
10.00%, 5/1/20 - 6/1/20 | | 23 | | 4 | |
IO PAC REMIC | | | | | |
1.00%, 2/15/27 | | 1,508 | | 12 | |
6.00%, 4/15/32 | | 149 | | 12 | |
7.00%, 9/15/27 | | 19 | | 6 | |
IO REMIC | | | | | |
5.00%, 6/15/17 | | 97 | | 7 | |
5.50%, 1/15/29 - 8/15/30 | | 2,604 | | 125 | |
6.50%, 3/15/33 - 5/15/33 | | 568 | | 111 | |
8.00%, 10/15/12 | | 42 | | 3 | |
PAC REMIC | | | | | |
8.55%, 1/15/21 | | 12 | | 12 | |
9.50%, 4/15/20 | | 43 | | 46 | |
9.60%, 4/15/20 | | 39 | | 42 | |
9.90%, 10/15/19 | | 180 | | 193 | |
10.00%, 5/15/20 - 6/15/20 | | 174 | | 188 | |
Federal National Mortgage Association, | | | | | |
Inv FI IO REMIC | | | | | |
2.69%, 8/25/34 | | 100,037 | | 1,883 | |
3.19%, 7/25/34 | | 8,592 | | 558 | |
4.99%, 10/25/28 | | 831 | | 37 | |
5.05%, 2/17/31 | | 263 | | 20 | |
5.22%, 7/18/27 | | 234 | | 15 | |
5.29%, 7/25/30 - 8/25/30 | | 885 | | 79 | |
5.39%, 10/25/29 | | 130 | | 4 | |
5.75%, 11/18/30 | | 381 | | 35 | |
5.80%, 10/18/30 | | 123 | | 10 | |
52.88%, 9/25/22 | | 81 | | 112 | |
IO | | | | | |
6.50%, 6/1/31 - 2/1/32 | | 3,274 | | 876 | |
7.00%, 4/1/32 | | 1,436 | | 391 | |
7.50%, 4/1/27 - 1/1/32 | | 1,903 | | 522 | |
8.00%, 2/1/23 - 12/1/31 | | 7,387 | | 1,871 | |
8.50%, 10/1/24 - 10/1/25 | | 1,540 | | 537 | |
9.00%, 11/1/26 | | 788 | | 253 | |
9.50%, 9/1/18 | | — @ | | — | @ |
IO PAC REMIC | | | | | |
8.00%, 8/18/27 - 9/18/27 | | 2,700 | | 554 | |
IO REMIC | | | | | |
5.50%, 3/25/17 | | 90 | | 4 | |
6.00%, 8/25/32 - 7/25/33 | | 6,471 | | 1,162 | |
6.50%, 5/25/33 - 6/25/33 | | 3,680 | | 740 | |
7.00%, 4/25/33 - 5/25/33 | | 3,970 | | 748 | |
8.00%, 7/18/27 - 12/25/30 | | 259 | | 55 | |
PAC REMIC | | | | | |
8.50%, 9/25/20 | | 18 | | 19 | |
8.75%, 11/25/19 | | 3 | | 3 | |
REMIC | | | | | |
3.78%, 12/25/08(h) | | — @ | | — | @ |
7.00%, 9/25/32 | | 2,240 | | 2,316 | |
43.23%, 9/25/20(h) | | 50 | | 74 | |
Government National Mortgage Association, | | | | | |
Inv Fl IO | | | | | |
4.96%, 5/20/31 | | 880 | | 120 | |
5.50%, 9/16/27 | | 97 | | 12 | |
5.51%, 4/16/29 | | 3,365 | | 267 | |
6.06%, 12/16/19 | | 260 | | 34 | |
6.11%, 8/16/29 | | 4,387 | | 608 | |
| | | | 17,226 | |
Collateralized Mortgage Obligations - Non Agency Collateral Series (2.2%) | | | | | |
Banc of America Funding Corp., | | | | | |
IO | | | | | |
0.42%, 9/20/35 | | 23,960 | | 629 | |
Countrywide Alternative Loan Trust, | | | | | |
IO | | | | | |
0.94%, 3/20/46 | | 10,182 | | 318 | |
0.96%, 11/20/35 | | 85,186 | | 1,464 | |
2.18%, 3/20/46 | | 40,950 | | 1,254 | |
2.40%, 12/20/46 | | 96,364 | | 2,951 | |
2.54%, 12/20/35(e)(h) | | 60,372 | | 1,811 | |
2.56%, 2/25/37 | | 54,629 | | 1,398 | |
2.57%, 2/20/47 | | 46,698 | | 1,634 | |
Countrywide Home Loan Mortgage Pass Through Trust, | | | | | |
IO | | | | | |
0.84%, 2/25/35 | | 21,204 | | 252 | |
Greenpoint Mortgage Funding Trust, | | | | | |
IO | | | | | |
3.12%, 6/25/45 | | 19,322 | | 508 | |
GS Mortgage Securities Corp., | | | | | |
IO | | | | | |
2.84%, 8/25/35(e)(h) | | 19,424 | | 280 | |
Harborview Mortgage Loan Trust, | | | | | |
IO | | | | | |
2.59%, 5/19/35(h) | | 41,220 | | 412 | |
2.85%, 10/20/45(h) | | 27,058 | | 490 | |
2.88%, 1/19/36(h) | | 17,117 | | 262 | |
2.93%, 3/19/37(h) | | 36,167 | | 842 | |
PO | | | | | |
3/19/37 - 10/20/45 | | 1,187 | | 201 | |
Indymac Index Mortgage Loan Trust, | | | | | |
IO | | | | | |
2.34%, 7/25/35(h) | | 29,092 | | 391 | |
PO | | | | | |
7/25/35 | | — @ | | — | @ |
Kidder Peabody Mortgage Assets Trust, | | | | | |
IO | | | | | |
9.50%, 4/22/18 | | 10 | | 2 | |
Lehman Structured Securities Corp., | | | | | |
IO | | | | | |
7.00%, 10/26/29(e)(k) | | 7,502 | | 113 | |
| | | | 15,212 | |
Mortgages - Other (8.4%) | | | | | |
American Home Mortgage Assets, | | | | | |
3.44%, 5/25/46(d)(h) | | 11,579 | | 4,148 | |
3.45%, 6/25/47(d)(h) | | 8,798 | | 2,815 | |
3.51%, 6/25/47(d)(h) | | 8,462 | | 1,247 | |
3.62%, 10/25/46(d)(k)(h) | | 2,255 | | 27 | |
American Home Mortgage Investment Trust, | | | | | |
3.51%, 9/25/45(d)(h) | | 1,013 | | 532 | |
3.93%, 11/25/45(d)(k)(h) | | 1,650 | | 35 | |
| | | | | | | |
The accompanying notes are an integral part of the financial statements. | 17 |
2008 Annual Report
September 30, 2008
Portfolio of Investments (cont’d)
Advisory Portfolio II
| | Face Amount | | Value | |
| | (000) | | (000) | |
Mortgages - Other (cont’d) | | | | | |
American Housing Trust, | | | | | |
9.55%, 9/25/20 | | $ | 236 | | $ | 223 | |
Bear Stearns Mortgage Funding Trust, | | | | | |
3.39%, 10/25/36(d)(h) | | 248 | | 142 | |
Countrywide Alternative Loan Trust, | | | | | |
3.38%, 5/25/47(d)(h) | | 7,119 | | 3,987 | |
3.40%, 3/20/46(d)(h) | | 5,591 | | 3,260 | |
3.48%, 12/25/46(d)(h) | | 5,298 | | 1,207 | |
3.73%, 7/25/46(d)(k)(h) | | 3,090 | | 39 | |
3.84%, 3/25/47(d)(k)(h) | | 1,210 | | 9 | |
4.01%, 6/25/46(d)(k)(h) | | 3,800 | | 41 | |
4.35%, 12/20/46(d)(k)(h) | | 2,113 | | 467 | |
4.46%, 6/25/47(d)(k)(h) | | 1,110 | | 17 | |
Deutsche ALT-A Securities NIM Trust, | | | | | |
6.75%, 2/25/47(e) | | 347 | | 322 | |
GSR Mortgage Loan Trust, | | | | | |
3.40%, 8/25/46(d)(h) | | 9,840 | | 7,380 | |
Harborview Mortgage Loan Trust, | | | | | |
3.27%, 3/19/37(d)(h) | | 6,639 | | 3,813 | |
3.32%, 7/19/45(d)(h) | | 1,162 | | 481 | |
Impac CMB Trust, | | | | | |
4.05%, 9/25/34(h) | | 33 | | 26 | |
Indymac Index Mortgage Loan Trust, | | | | | |
3.49%, 7/25/35(d)(h) | | 1,311 | | 482 | |
Mastr Adjustable Rate Mortgages Trust, | | | | | |
3.46%, 4/25/46(d)(h) | | 4,723 | | 1,783 | |
3.86%, 4/25/46(d)(k)(h) | | 2,710 | | 35 | |
3.96%, 4/25/46(d)(k)(h) | | 1,490 | | 12 | |
4.41%, 5/25/47(d)(k)(h) | | 2,740 | | 25 | |
Residential Accredit Loans, Inc., | | | | | |
3.35%, 3/25/37(d)(h) | | 10,843 | | 5,855 | |
3.36%, 2/25/47(d)(h) | | 4,230 | | 2,406 | |
Ryland Acceptance Corp. IV, | | | | | |
6.65%, 7/1/11 | | 24 | | 24 | |
Structured Asset Mortgage Investments, Inc., | | | | | |
3.40%, 2/25/36(d)(h) | | 4,385 | | 2,324 | |
3.51%, 5/25/46(d)(h) | | 2,847 | | 690 | |
3.52%, 2/25/36(d)(h) | | 11,855 | | 4,557 | |
Washington Mutual Alternative Mortgage Pass Through Certificates, | | | | | |
3.80%, 4/25/46(d)(h) | | 7,723 | | 2,783 | |
Washington Mutual Mortgage Pass Through Certificates, | | | | | |
3.48%, 4/25/45(d)(h) | | 3,602 | | 1,441 | |
3.50%, 8/25/45(h) | | 106 | | 105 | |
Washington Mutual, Inc., | | | | | |
3.44%, 7/25/47(d)(h) | | 512 | | 144 | |
3.47%, 10/25/45(h) | | 450 | | 442 | |
3.56%, 6/25/46(d)(h) | | 1,600 | | 192 | |
3.57%, 7/25/45(h) | | 3,048 | | 1,234 | |
3.80%, 5/25/46(d)(h) | | 5,359 | | 2,251 | |
| | | | 57,003 | |
U.S. Treasury Security (2.3%) | | | | | |
U.S. Treasury Bond STRIPS, | | | | | |
Zero Coupon, 5/15/21 | | 28,630 | | 16,084 | |
Total Fixed Income Securities (Cost $698,796) | | | | 647,904 | |
| | | | Value | |
| | Shares | | (000) | |
Short-Term Investments (16.1%) | | | | | |
Investment Company (14.6%) | | | | | |
Morgan Stanley Institutional Liquidity Money Market Portfolio — Institutional Class (p) | | 102,736,845 | | 102,737 | |
| | Face Amount | | Value | |
| | (000) | | (000) | |
U.S. Treasury Security (1.5%) | | | | | |
U.S. Treasury Bill, | | | | | |
0.17%, 10/9/08(r)(j) | | $ | 10,814 | | 10,813 | |
Total Short-Term Investments (Cost $113,547) | | | | 113,550 | |
Total Investments (108.0%) (Cost $812,343) | | | | 761,454 | |
Liabilities in Excess of Other Assets (-8.0%) | | | | (56,079 | ) |
Net Assets (100%) | | | | $ | 705,375 | |
(d) | Security was valued at fair value — At September 30, 2008, the Portfolio held $54,627,000 of fair valued securities, representing 7.7% of net assets. |
(e) | 144A security — Certain conditions for public sale may exist. Unless otherwise noted, these securities are deemed to be liquid. |
(h) | Variable/Floating Rate Security — Interest rate changes on these instruments are based on changes in a designated rate. The rates shown are those in effect on September 30, 2008. |
(i) | Security is subject to delayed delivery. |
(j) | All or a portion of the security was pledged to cover margin requirements for futures contracts. |
(k) | Security has been deemed illiquid at September 30, 2008. |
(p) | See Note G within the Notes to Financial Statements regarding investment in Morgan Stanley Institutional Liquidity Money Market Portfolio — Institutional Class. |
(r) | Rate shown is the yield to maturity at September 30, 2008. |
@ | Value is less than $500. |
| |
Inv Fl | Inverse Floating Rate - Interest rate fluctuates with an inverse relationship to an associated interest rate. Indicated rate is the effective rate at September 30, 2008. |
IO | Interest Only |
PAC | Planned Amortization Class |
PO | Principal Only |
REMIC | Real Estate Mortgage Investment Conduit |
STRIPS | Separate Trading of Registered Interest and Principal of Securities |
TBA | To Be Announced |
18 | The accompanying notes are an integral part of the financial statements. |
| 2008 Annual Report |
| |
| September 30, 2008 |
Portfolio of Investments (cont’d)
Advisory Portfolio II
The Portfolio had the following futures contract(s) open at period end:
| | | | | | | | Net Unrealized | |
| | Number | | | | | | Appreciation | |
| | of | | Value | | Expiration | | (Depreciation) | |
| | Contracts | | (000) | | Date | | (000) | |
Long: | | | | | | | | | | |
EuroDollar | | | | | | | | | | |
CME | | 305 | | $ | 73,616 | | | Dec-08 | | $ | 745 | |
EuroDollar | | | | | | | | | | |
CME | | 268 | | 65,013 | | | Mar-09 | | 935 | |
EuroDollar | | | | | | | | | | |
CME | | 341 | | 82,658 | | | Jun-09 | | 763 | |
U.S. Treasury | | | | | | | | | | |
2 yr. Note | | 4 | | 854 | | | Dec-08 | | 2 | |
U.S. Treasury | | | | | | | | | | |
Long Bond | | 456 | | 53,430 | | | Dec-08 | | (880) | |
Short: | | | | | | | | | | |
U.S. Treasury | | | | | | | | | | |
5 yr. Note | | 2,546 | | 285,749 | | | Dec-08 | | (1,208) | |
U.S. Treasury | | | | | | | | | | |
10 yr. Note | | 24 | | 2,751 | | | Dec-08 | | 27 | |
5 yr. Swap | | 90 | | 9,765 | | | Dec-08 | | (42) | |
10 yr. Swap | | 836 | | 93,501 | | | Dec-08 | | 290 | |
| | | | | | | | | $ | 632 | |
| | | | | | | | | | | | |
CME — Chicago Mercantile Exchange
The accompanying notes are an integral part of the financial statements. | 19 |
2008 Annual Report
September 30, 2008
Portfolio of Investments (cont’d)
Advisory Portfolio II
Interest Rate Swap Contracts
The Portfolio had the following interest rate swap agreement(s) open at period end:
Swap Counterparty | | Floating Rate
Index | | Pay/Receive
Floating Rate | | Fixed Rate | | Termination
Date | | Notional
Amount
(000) | | Unrealized
Appreciation
(Depreciation)
(000) | |
Bank of America | | | | | | | | | | | | | |
| | 3 Month LIBOR | | Pay | | 4.15 | % | | 6/9/13 | | $ | 130,825 | | $ | 2,191 | |
| | 3 Month LIBOR | | Pay | | 4.09 | | | 9/17/17 | | 41,625 | | (929 | ) |
| | 3 Month LIBOR | | Pay | | 5.37 | | | 2/12/18 | | 46,398 | | 800 | |
| | 3 Month LIBOR | | Pay | | 5.47 | | | 2/25/18 | | 8,705 | | 151 | |
| | 3 Month LIBOR | | Pay | | 5.07 | | | 4/14/18 | | 38,415 | | 191 | |
| | 3 Month LIBOR | | Pay | | 4.98 | | | 4/15/18 | | 20,200 | | 36 | |
| | 3 Month LIBOR | | Receive | | 4.67 | | | 8/4/18 | | 133,600 | | (2,550 | ) |
| | 3 Month LIBOR | | Receive | | 5.15 | | | 8/26/18 | | 23,000 | | (158 | ) |
| | 3 Month LIBOR | | Receive | | 5.08 | | | 9/2/18 | | 261,000 | | (1,130 | ) |
| | 3 Month LIBOR | | Receive | | 5.82 | | | 2/12/23 | | 59,593 | | (1,285 | ) |
| | 3 Month LIBOR | | Receive | | 5.88 | | | 2/25/23 | | 11,277 | | (244 | ) |
| | 3 Month LIBOR | | Receive | | 5.47 | | | 4/14/23 | | 49,190 | | (553 | ) |
| | 3 Month LIBOR | | Receive | | 5.38 | | | 4/15/23 | | 22,445 | | (195 | ) |
| | 3 Month LIBOR | | Pay | | 5.34 | | | 8/26/23 | | 29,450 | | 219 | |
| | 3 Month LIBOR | | Pay | | 5.28 | | | 9/2/23 | | 334,400 | | 1,909 | |
Citigroup | | | | | | | | | | | | | | |
| | 3 Month LIBOR | | Receive | | 5.07 | | | 11/9/17 | | 5,935 | | (41 | ) |
| | 3 Month LIBOR | | Pay | | 5.37 | | | 5/23/17 | | 50,410 | | 238 | |
| | 3 Month LIBOR | | Receive | | 5.29 | | | 9/28/17 | | 41,645 | | 431 | |
| | 3 Month LIBOR | | Receive | | 5.00 | | | 11/13/17 | | 10,861 | | (75 | ) |
| | 3 Month LIBOR | | Pay | | 4.47 | | | 1/10/18 | | 29,676 | | (53 | ) |
Deutsche Bank | | | | | | | | | | | | | | |
| | 3 Month LIBOR | | Pay | | 5.35 | | | 5/24/17 | | 58,165 | | 274 | |
| | 3 Month LIBOR | | Pay | | 5.39 | | | 5/25/17 | | 74,328 | | 344 | |
| | 3 Month LIBOR | | Pay | | 5.43 | | | 5/29/17 | | 129,130 | | 587 | |
Goldman Sachs | | | | | | | | | | | | | | |
| | 3 Month LIBOR | | Pay | | 5.63 | | | 2/28/18 | | 143,580 | | 2,506 | |
| | 3 Month LIBOR | | Receive | | 6.04 | | | 2/28/23 | | 184,217 | | (4,016 | ) |
JPMorgan Chase | | | | | | | | | | | | | | |
| | 3 Month LIBOR | | Pay | | 4.07 | | | 5/16/13 | | 58,395 | | 795 | |
| | 3 Month LIBOR | | Pay | | 4.07 | | | 5/16/13 | | 75,000 | | 1,030 | |
| | 3 Month LIBOR | | Pay | | 3.93 | | | 5/19/13 | | 19,000 | | 135 | |
| | 3 Month LIBOR | | Pay | | 4.43 | | | 6/12/13 | | 52,000 | | 1,533 | |
| | 3 Month LIBOR | | Pay | | 4.53 | | | 6/19/13 | | 46,000 | | 1,548 | |
| | 3 Month LIBOR | | Pay | | 4.49 | | | 6/23/13 | | 55,000 | | 1,721 | |
| | 3 Month LIBOR | | Pay | | 5.37 | | | 5/23/17 | | 25,086 | | 118 | |
| | 3 Month LIBOR | | Pay | | 5.34 | | | 5/24/17 | | 50,726 | | 240 | |
| | 3 Month LIBOR | | Pay | | 5.09 | | | 9/11/17 | | 69,179 | | (512 | ) |
| | 3 Month LIBOR | | Pay | | 5.16 | | | 9/20/17 | | 32,505 | | (278 | ) |
| | 3 Month LIBOR | | Receive | | 5.23 | | | 9/27/17 | | 39,410 | | 398 | |
| | 3 Month LIBOR | | Receive | | 5.30 | | | 9/28/17 | | 39,568 | | 414 | |
| | 3 Month LIBOR | | Pay | | 5.25 | | | 10/11/17 | | 21,822 | | 184 | |
| | 3 Month LIBOR | | Receive | | 5.01 | | | 11/13/17 | | 20,694 | | (143 | ) |
| | 3 Month LIBOR | | Receive | | 4.24 | | | 1/22/18 | | 23,128 | | 29 | |
| | 3 Month LIBOR | | Pay | | 4.48 | | | 2/25/18 | | 30,467 | | (79 | ) |
| | 3 Month LIBOR | | Receive | | 4.41 | | | 5/1/18 | | 141,150 | | (1,412 | ) |
Merrill Lynch | | | | | | | | | | | | | | |
| | 3 Month LIBOR | | Pay | | 5.00 | | | 4/15/18 | | 26,955 | | 65 | |
| | 3 Month LIBOR | | Receive | | 5.40 | | | 4/16/23 | | 31,530 | | (287 | ) |
| | | | | | | | | | | | | $ | 4,147 | |
| | | | | | | | | | | | | | | | |
20 | The accompanying notes are an integral part of the financial statements. |
| |
| 2008 Annual Report |
| |
| September 30, 2008 |
Portfolio of Investments (cont’d)
Advisory Portfolio II
Zero Coupon Swap Contracts
The Portfolio had the following zero coupon swap agreement(s) open at period end:
Swap Counterparty | | Notional
Amount
(000) | | Receive | | Termination
Date | | Unrealized
Appreciation
(Depreciation)
(000) | |
JPMorgan Chase | | | | | | | | | |
| | $16,092 | | 3 Month LIBOR | | 5/15/21 | | $ | - | |
LIBOR — London Inter Bank Offer Rate | | | | | | | | | |
| | | | | | | | | | |
The accompanying notes are an integral part of the financial statements. | 21 |
2008 Annual Report
September 30, 2008
Investment Overview (unaudited)
Advisory Portfolio III
The Advisory Portfolio III seeks above average total return over a market cycle of three to five years. The Portfolio invests primarily in fixed income securities of government and corporate issuers including U.S. and non-U.S. issuers, including issuers located in emerging markets, that are both investment grade and high yield securities (commonly referred to as “junk bonds”). A portion of these securities may be asset-backed and mortgage securities. In addition, the Portfolio may invest a portion of its assets in structured investments, structured notes and other types of similarly structured products consistent with the Portfolio’s investment objectives and policies. Generally, structured investments are interests in entities organized and operated for the purpose of restructuring the investment characteristics of underlying investment interests or securities. There is no minimum or maximum maturity for any individual security. The Adviser may use futures, options, forwards, CMOs, swaps, options on swaps and other derivatives in managing the Portfolio. The securities in which the Portfolio may invest may be denominated in U.S. dollars or in currencies other than U.S. dollars.
Performance
For the fiscal year ended September 30, 2008, the Portfolio had a total return based on net asset value and reinvestment of distributions per share of -1.78%, net of fees. The Portfolio underperformed against its benchmarks, the Citigroup World Government Bond Index, excluding the United States, hedged to U.S. dollars (the “Index”) and the Citigroup U.S. Broad Investment Grade Bond Index, which returned 4.33% and 4.48%, respectively.
Factors Affecting Performance
· The financial markets were under pressure throughout the period amid disrupted credit markets, ongoing deterioration of the housing market, losses in the financial sector, and growing fears of recession.
· The third quarter of 2008, however, will most certainly go down as a defining moment in the history of the financial industry. Investor confidence plummeted and credit markets seized as several venerable financial institutions were forced into mergers or dissolved entirely in September, resulting in significant price erosion across all but the U.S. Treasury sector.
· An underweight exposure to the corporate credit market was additive to relative performance as credit spreads significantly widened, particularly in the financial sector.
· Our emerging market debt positioning also enhanced performance in 2007. Our emerging market debt positions were mostly liquidated in the first quarter of 2008 which was beneficial to performance, especially since emerging market debts underperformed toward the end of the reporting period.
· A position in non-U.S. dollar denominated debt detracted from relative performance in the last months of the period.
Management Strategies
· In the first quarter of 2008, the Portfolio was restructured to be a U.S. corporate bond portfolio.
· At the time of the restructuring, market conditions in the corporate credit sector were, in our view, generally unfavorable for investment. Therefore, we believed it was prudent to invest the majority of portfolio assets in cash equivalent securities. This has proved favorable for performance as corporate credits, particularly financials, have been under increasing pressure. We will continue to closely monitor the market, seeking opportunities to add to corporate holdings.
· The Portfolio’s emerging market debt strategy prior to the restructuring favored local-currency denominated securities in Argentina, Brazil, Mexico, Turkey, and a few other small countries. The Portfolio maintains a Mexican bond holding as of the end of the period.
| 2008 Annual Report |
| |
| September 30, 2008 |
Investment Overview (cont’d)
Advisory Portfolio III
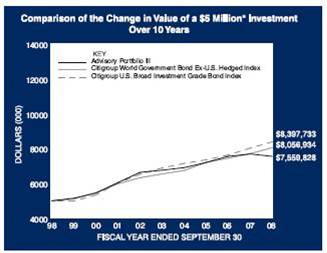
* Minimum Investment
In accordance with SEC regulations, the Portfolio performance shown assumes that all recurring fees (including management fees) were deducted and all dividends and distributions were reinvested.
Performance Compared to the Citigroup World Government Bond Ex-U.S. Hedged Index(1) and the Citigroup U.S. Broad Investment Grade Bond Index(2)
| | Total Returns (3) | |
| | | | Average Annual | |
| | One
Year | | Five
Years | | Ten
Years | | Since
Inception(5) | |
Portfolio(4) | | (1.78)% | | 2.25% | | 4.22% | | 6.72% | |
Citigroup World Government Bond Ex-U.S Hedged Index | | 4.33 | | 4.24 | | 4.89 | | 7.26 | |
Citigroup U.S. Broad Investment Grade Bond Index | | 4.48 | | 4.03 | | 5.32 | | 6.67 | |
Performance data quoted represents past performance, which is no guarantee of future results, and current performance may be lower or higher than the figures shown. Performance assumes that all dividends and distributions, if any, were reinvested. For the most recent month-end performance figures, please call 1 (800) 548-7786. Investment returns and principal value will fluctuate so that Portfolio shares, when redeemed, may be worth more or less than their original cost. Total returns do not reflect the deduction of taxes that a shareholder would pay on Portfolio distributions or the redemption of Portfolio shares.
(1) The Citigroup World Government Bond Ex-U.S Hedged Index is a market capitalization weighted index that tracks the performance of the 20 government bond markets of Australia, Austria, Belgium, Canada, Denmark, Finland, France, Germany, Greece, Ireland, Italy, Japan, the Netherlands, Norway, Poland, Portugal, Spain, Sweden, Switzerland, and the United Kingdom. Issuers must carry an investment grade (BBB-/Baa3) or higher credit rating to remain eligible for inclusion. The Index is hedged to the U.S. dollar by using a rolling one-month forward exchange contract as a hedging instrument. The Index is unmanaged and its returns do not include any sales charges or fees. Such costs would lower performance. It is not possible to invest directly in an index.
(2) The Citigroup U.S. Broad Investment Grade Bond Index is a fixed income, market value-weighted index that includes publicly-traded U.S. Treasury, U.S. agency, mortgage pass-through, asset-backed, supranational, corporate, Yankee and global debt issues, including securities issued under Rule 144A with registration rights, carrying investment grade (BBB-/Baa3) or higher credit ratings with remaining maturities of at least one year. The Index is unmanaged and its returns do not include any sales charges or fees. Such costs would lower performance. It is not possible to invest directly in an index.
(3) Total returns for the Portfolio reflect expenses waived and/or reimbursed, if applicable, by the Adviser. Without such waivers and/or reimbursements, total returns would have been lower. Fee waivers and/or reimbursements are voluntary and the Adviser reserves the right to commence or terminate any waiver and/or reimbursement at any time.
(4) Commenced operations on October 7, 1994.
(5) For comparative purposes, average annual since inception returns listed for the Indexes refer to the inception date or initial offering of the Portfolio, not the inception of the Indexes.
Portfolio Composition
Country | | | Percentage of
Total Investments | |
Mexico | | 14.3% | |
Short-Term Investments | | 85.7 | |
Total Investments | | 100.0% | |
2008 Annual Report
September 30, 2008
Portfolio of Investments
Advisory Portfolio III
| | Face
Amount
(000) | | Value
(000) | |
Fixed Income Security (14.1%) | | | | | |
Mexico (14.1%) | | | | | |
Mexican Bonos, | | | | | |
9.50%, 12/18/14 | | | | | |
(Cost $14,854) | | MXN 148,305 | | $ | 14,299 | |
Total Fixed Income Securities (Cost $14,854) | | | | 14,299 | |
| | Shares | | Value
(000) | |
Short-Term Investments (84.3%) | | | | | |
Investment Company (10.3%) | | | | | |
Morgan Stanley Institutional | | | | | |
Liquidity Money Market Portfolio | | | | | |
— Institutional Class (p) | | 10,428,865 | | 10,429 | |
| | Face
Amount
(000) | | Value
(000) | |
U.S. Treasury Securities (74.0%) | | | | | |
U.S. Treasury Bills, | | | | | |
0.25%, 10/30/08(r) | | 25,000 | | 24,991 | |
0.70%, 12/4/08(r) | | 25,000 | | 24,968 | |
1.11%, 10/16/08(r) | | 25,000 | | 24,988 | |
| | | | 74,947 | |
Total Short-Term Investments (Cost $85,336) | | | | 85,376 | |
Total Investments (98.4%) (Cost $100,190) | | | | 99,675 | |
Other Assets in Excess of Liabilities (1.6%) | | | | 1,664 | |
Net Assets (100%) | | | | $ | 101,339 | |
(p) See Note G within the Notes to Financial Statements regarding investment in Morgan Stanley Institutional Liquidity Money Market Portfolio — Institutional Class.
(r) Rate shown is the yield to maturity at September 30, 2008.
Foreign Currency Exchange Contract Information:
The Portfolio had the following foreign currency exchange contract(s) open at period end:
| | | | | | | | | | Net | |
Currency | | | | | | In | | | | Unrealized | |
to | | | | | | Exchange | | | | Appreciation | |
Deliver | | Value | | Settlement | | For | | Value | | (Depreciation) | |
(000) | | (000) | | Date | | (000) | | (000) | | (000) | |
GBP 3,935 | | $ | 7,010 | | | 10/27/08 | | USD | 7,824 | | | $ | 7,824 | | | $ | 814 | |
USD 7,606 | | 7,606 | | | 10/27/08 | | GBP | 3,935 | | | 7,010 | | | (596 | ) |
| | $ | 14,616 | | | | | | | | $ | 14,834 | | | $ | 218 | |
GBP | — | British Pound |
MXN | — | Mexican Peso |
USD | — | United States Dollar |
24 | The accompanying notes are an integral part of the financial statements. |
| 2008 Annual Report |
| |
| September 30, 2008 |
Investment Overview (unaudited)
Advisory Portfolio IV
The Advisory Portfolio IV seeks above average total return over a market cycle of three to five years. The Portfolio invests primarily in U.S. dollar-denominated investment grade fixed income securities of government and corporate issuers including U.S. and non-U.S. issuers, including issuers located in emerging markets. A portion of these securities may be asset-backed and, to a lesser extent, mortgage securities. In addition, the Portfolio may invest a portion of its assets in structured investments, structured notes and other types of similarly structured products consistent with the Portfolio’s investment objectives and policies. Generally, structured investments are interests in entities organized and operated for the purpose of restructuring the investment characteristics of underlying investment interests or securities. There is no minimum or maximum maturity for any individual security. The Adviser may use futures, options, forwards, CMOs, swaps, options on swaps and other types of derivatives in managing the Portfolio. The securities in which the Portfolio may invest will be denominated in U.S. dollars and will be investment grade.
Performance
For the fiscal year ended September 30, 2008, the Portfolio had a total return based on net asset value and reinvestment of distributions per share of 3.42%, net of fees. The Portfolio underperformed against its benchmarks, the Citigroup World Government Bond Index, excluding the United States, hedged to U.S. dollars, (the “Index”) and the Citigroup U.S. Broad Investment Grade Bond Index which returned 4.33% and 4.48%, respectively.
Factors Affecting Performance
· The financial markets were under pressure throughout the reporting period amid disrupted credit markets, ongoing deterioration of the housing market, losses in the financial sector, and growing fears of recession.
· The third quarter of 2008, however, will most certainly go down as a defining moment in the history of the financial industry. Investor confidence plummeted and credit markets seized as several venerable financial institutions were forced into mergers or dissolved entirely in September, resulting in significant price erosion across all but the U.S. Treasury sector.
· An underweight exposure to the corporate credit market was additive to relative performance as credit spreads significantly widened, particularly in the financial sector. Our emerging market debt activities also enhanced performance.
· An overweight to U.S. Treasury securities was additive to relative performance as the flight to quality that took place, particularly in the last month of the period, helped Treasuries outperform all other sectors of the fixed income market.
· The Portfolio’s shorter duration, or interest-rate sensitivity, detracted from relative performance as interest rates declined during the reporting year.
Management Strategies
· In the first quarter of 2008, the Portfolio was restructured to be a U.S. corporate bond portfolio.
· At the time of the restructuring, market conditions in the corporate credit sector were, in our view, unfavorable for investment. Therefore, we believed it was prudent to invest the balance of portfolio assets in cash equivalent securities. This has proved favorable for performance as corporate credits, particularly financials, have been under increasing pressure. We will continue to closely monitor the market, seeking opportunities to invest in the corporate sector.

* Minimum Investment
** Commenced operations on June 20, 2000.
In accordance with SEC regulations, the Portfolio performance shown assumes that all recurring fees (including management fees) were deducted and all dividends and distributions were reinvested.
25
2008 Annual Report
September 30, 2008
Investment Overview (cont’d)
Advisory Portfolio IV
Performance Compared to the Citigroup World Government Bond Ex-U.S. Hedged Index(1) and the Citigroup U.S. Broad Investment Grade Bond Index(2)
| | Total Returns (3) | |
| | | | Average Annual | |
| | One | | Five | | Since | |
| | Year | | Years | | Inception(5) | |
Portfolio(4) | | 3.42 | % | | 3.59 | % | | 5.26 | % | |
Citigroup World Government | | | | | | | | | | |
Bond Ex-U.S Hedged Index | | 4.33 | | | 4.24 | | | 4.98 | | |
Citigroup U.S. Broad | | | | | | | | | | |
Investment Grade Bond Index | | 4.48 | | | 4.03 | | | 6.04 | | |
Performance data quoted represents past performance, which is no guarantee of future results, and current performance may be lower or higher than the figures shown. Performance assumes that all dividends and distributions, if any, were reinvested. For the most recent month-end performance figures, please call 1 (800) 548-7786. Investment returns and principal value will fluctuate so that Portfolio shares, when redeemed, may be worth more or less than their original cost. Total returns do not reflect the deduction of taxes that a shareholder would pay on Portfolio distributions or the redemption of Portfolio shares.
(1) | The Citigroup World Government Bond Ex-U.S Hedged Index is a market-capitalization weighted index that tracks the performance of the 20 government bond markets of Australia, Austria, Belgium, Canada, Denmark, Finland, France, Germany, Greece, Ireland, Italy, Japan, the Netherlands, Norway, Poland, Portugal, Spain, Sweden, Switzerland, and the United Kingdom. Issuers must carry an investment grade (BBB-/Baa3) or higher credit rating to remain eligible for inclusion. The Index is hedged to the U.S. dollar by using a rolling one-month forward exchange contract as a hedging instrument. The Index is unmanaged and its returns do not include any sales charges or fees. Such costs would lower performance. It is not possible to invest directly in an index. |
(2) | The Citigroup U.S. Broad Investment Grade Bond Index is a fixed income, market value-weighted Index that includes publicly-traded U.S. Treasury, U.S. agency, mortgage pass-through, asset-backed, supranational, corporate, Yankee and global debt issues, including securities issued under Rule 144A with registration rights, carrying investment grade (BBB-/Baa3) or higher credit ratings with remaining maturities of at least one year. The Index is unmanaged and its returns do not include any sales charges or fees. Such costs would lower performance. It is not possible to invest directly in an index. |
(3) | Total returns for the Portfolio reflect expenses waived and/or reimbursed, if applicable, by the Adviser. Without such waivers and/or reimbursements, total returns would have been lower. Fee waivers and/or reimbursements are voluntary and the Adviser reserves the right to commence or terminate any waiver and/or reimbursement at any time. |
(4) | Commenced operations on June 20, 2000. |
(5) | For comparative purposes, average annual since inception returns listed for the Indexes refer to the inception date or initial offering of the Portfolio, not the inception of the Indexes. |
Portfolio Composition
| | Percentage of | |
Country | | | Total Investments | |
United States | | 96.5 | % | |
Short-Term Investments | | 3.5 | | |
Total Investments | | 100.0 | % | |
| | | | | |
26
| 2008 Annual Report |
| |
| September 30, 2008 |
Portfolio of Investments
Advisory Portfolio IV
| | Face | | | |
| | Amount | | Value | |
| | (000) | | (000) | |
Fixed Income Securities (95.7%) | | | | | |
United States (95.7%) | | | | | |
U.S. Treasury Notes, | | | | | |
2.63% , 3/15/09 | | $ | 250 | | $ | 251 | |
4.50% , 2/15/09 | | 250 | | 253 | |
4.75% , 12/31/08 | | 225 | | 227 | |
4.88% , 6/30/09 | | 250 | | 256 | |
| | | | 987 | |
Total Fixed Income Securities (Cost $987) | | | | 987 | |
| | | | Value | |
| | Shares | | (000) | |
Short-Term Investment (3.4%) | | | | | |
Investment Company (3.4%) | | | | | |
Morgan Stanley Institutional Liquidity Money Market Portfolio — Institutional Class (Cost $36) (p) | | 35,607 | | 36 | |
Total Investments (99.1%) (Cost $1,023) | | | | 1,023 | |
Other Assets in Excess of Liabilities (0.9%) | | | | 9 | |
Net Assets (100%) | | | | $ | 1,032 | |
| | | | | | | |
(p) See Note G within the Notes to Financial Statements regarding investment in Morgan Stanley Institutional Liquidity Money Market Portfolio — Institutional Class.
The accompanying notes are an integral part of the financial statements. | 27 |
2008 Annual Report
September 30, 2008
Statements of Assets and Liabilities
| | Advisory | | Advisory | | Advisory | | Advisory | |
| | Portfolio | | Portfolio II | | Portfolio III | | Portfolio IV | |
| | (000) | | (000) | | (000) | | (000) | |
Assets: | | | | | | | | | |
Investments in Securities of Unaffiliated Issuers, at Cost: | | $ | 938,759 | | $ | 709,606 | | $ | 89,761 | | $ | 987 | |
Investment in Securities of Affiliated Issuers, at Cost: | | 100,516 | | 102,737 | | 10,429 | | 36 | |
Total Investments in Securities, at Cost: | | 1,039,275 | | 812,343 | | 100,190 | | 1,023 | |
Foreign Currency, at Cost: | | — | | — | | 4 | | — | |
Investments in Securities of Unaffiliated Issuers, at Value:(1) | | 758,249 | | 658,717 | | 89,246 | | 987 | |
Investment in Securities of Affiliated Issuers, at Value: | | 100,516 | | 102,737 | | 10,429 | | 36 | |
Total Investments in Securities, at Value: | | 858,765 | | 761,454 | | 99,675 | | 1,023 | |
Foreign Currency, at Value: | | — | | — | | 4 | | — | |
Cash | | 156,459 | | 1,280 | | — | | — | |
Due from Adviser | | 425 | | 238 | | 54 | | 26 | |
Due from Broker | | — | | 539 | | 1,049 | | — | |
Unrealized Appreciation on Swap Agreements | | 97,921 | | 18,087 | | — | | — | |
Receivable for Delayed Delivery Commitments† | | 203,231 | | 294,159 | | — | | — | |
Receivable for Investments Sold | | 944,048 | | 19,222 | | — | | — | |
Unrealized Appreciation on Foreign Currency Exchange Contracts | | — | | — | | 814 | | — | |
Receivable from Affiliates | | 52 | | 77 | | 15 | | — | @ |
Dividends Receivable | | 541 | | 498 | | 27 | | — | @ |
Interest Receivable | | 3,855 | | 4,534 | | 333 | | 8 | |
Other Assets | | 19 | | 40 | | 2 | | — | @ |
Total Assets | | 2,265,316 | | 1,100,128 | | 101,973 | | 1,057 | |
Liabilities: | | | | | | | | | |
Collateral on Securities Loaned, at Value: | | 1 | | — | | — | | — | |
Unrealized Depreciation on Foreign Currency Exchange Contracts | | — | | — | | 596 | | — | |
Due to Broker | | 52,290 | | — | | — | | — | |
Payable for Delayed Delivery Commitments | | 487,377 | | 347,319 | | — | | — | |
Payable for Investments Purchased | | 954,748 | | 32,328 | | — | | — | |
Bank Overdraft | | — | | 185 | | — | | — | |
Unrealized Depreciation on Swap Agreements | | 45,201 | | 13,940 | | — | | — | |
Payable for Offering Cost | | — | | 46 | | — | | — | |
Payable for Administration Fees | | 68 | | 55 | | 8 | | — | @ |
Payable for Custodian Fees | | 40 | | 35 | | 3 | | 1 | |
Payable for Lehman Brothers Closed Swap Transactions | | 741 | | 824 | | — | | — | |
Payable for Trustees’ Fees and Expenses | | 122 | | — | | 2 | | — | |
Other Liabilities | | 132 | | 21 | | 25 | | 24 | |
Total Liabilities | | 1,540,720 | | 394,753 | | 634 | | 25 | |
Net Assets | | $ | 724,596 | | $ | 705,375 | | $ | 101,339 | | $ | 1,032 | |
Net Assets Consist Of: | | | | | | | | | |
Paid-in Capital | | $ | 1,516,394 | | $ | 819,956 | | $ | 111,595 | | $ | 1,009 | |
Undistributed (Distributions in Excess of) Net Investment Income | | 17,516 | | 15,150 | | (3,612) | | 24 | |
Accumulated Net Realized Loss | | (683,631) | | (83,621) | | (6,512) | | (1 | ) |
Unrealized Appreciation (Depreciation) on: | | | | | | | | | |
Investments | | (180,510) | | (50,889) | | (515) | | — | @ |
Foreign Currency Exchange Contracts and Translations | | — | | — | | 383 | | — | |
Futures Contracts | | 2,107 | | 632 | | — | | — | |
Swap Agreements | | 52,720 | | 4,147 | | — | | — | |
Net Assets | | $ | 724,596 | | $ | 705,375 | | $ | 101,339 | | $ | 1,032 | |
CLASS I: | | | | | | | | | |
Shares Outstanding (unlimited number of shares authorized, no par value) (not in 000) | | 102,846,897 | | 96,831,309 | | 31,541,042 | | 82,148 | |
Net Asset Value, Offering and Redemption Price Per Share | | $ | 7.05 | | $ | 7.28 | | $ | 3.21 | | $ | 12.57 | |
(1) Including: | | | | | | | | | |
Securities on Loan, at Value: | | $ | 1 | | $ | — | | $ | — | | $ | — | |
| | | | | | | | | | | | | | | | | |
† | Receivable for Delayed Delivery Commitments balance for Advisory and Advisory II Portfolios include approximately $69,000 and $61,000 of exposure to Lehman Brothers as of September 30, 2008, respectively. Due to the uncertain nature surrounding the collectability of these receivables, these balances have been written down from their original amounts. |
@ | Amount is less than $500. |
28 | The accompanying notes are an integral part of the financial statements. |
| 2008 Annual Report |
| |
| September 30, 2008 |
Statements of Operations
For the Year Ended September 30, 2008
| | Advisory Portfolio (000) | | Advisory Portfolio II (000)^ | | Advisory Portfolio III (000) | | Advisory Portfolio IV (000) | |
Investment Income: | | | | | | | | | |
Dividends from Securities of Unaffiliated Issuers | | $ | 846 | | $ | 300 | | $ | — | | $ | — | |
Dividends from Securities of Affiliated Issuers | | 7,569 | | 3,866 | | 3,778 | | 13 | |
Interest from Securities of Unaffiliated Issuers | | 139,883 | | 36,196 | | 3,025 | | 17 | |
Total Investment Income | | 148,298 | | 40,362 | | 6,803 | | 30 | |
Expenses: | | | | | | | | | |
Investment Advisory Fees (Note B) | | 8,803 | | 2,224 | | 592 | | 4 | |
Administration Fees (Note C) | | 1,881 | | 474 | | 126 | | 1 | |
Custodian Fees (Note F) | | 172 | | 64 | | — | | — | |
Professional Fees | | 166 | | 47 | | 33 | | 29 | |
Shareholder Reporting Fees | | 53 | | 14 | | 8 | | 3 | |
Transfer Agency Fees (Note E) | | 11 | | 2 | | 4 | | 3 | |
Offering Cost Fee | | — | | 37 | | — | | — | |
Trustees’ Fees and Expenses | | 32 | | 5 | | 3 | | — | @ |
Registration Fees | | 20 | | 2 | | 20 | | 20 | |
Other Expenses | | 158 | | 6 | | 3 | | 5 | |
Total Expenses | | 11,296 | | 2,875 | | 789 | | 65 | |
Voluntary Waiver of Investment Advisory Fees (Note B) | | (8,803 | ) | (2,224 | ) | (592 | ) | (4 | ) |
Expenses Reimbursed by Adviser (Note B) | | (1,500 | ) | (645 | ) | (138 | ) | (60 | ) |
Rebate from Morgan Stanley Affiliated Cash Sweep (Note G) | | (229 | ) | (5 | ) | (57 | ) | (1 | ) |
Expense Offset (Note F) | | (94 | ) | (1 | ) | (2 | ) | — | @ |
Net Expenses | | 670 | | — | | — | | — | @ |
Net Investment Income | | 147,628 | | 40,362 | | 6,803 | | 30 | |
Realized Gain (Loss): | | | | | | | | | |
Investments Sold | | (545,418 | ) | (73,618 | ) | (6,513 | ) | — | @ |
Foreign Currency Transactions | | (827 | ) | — | | (3,400 | ) | 26 | |
Options Written | | (694 | ) | (509 | ) | — | | — | |
Futures Contracts | | (90,954 | ) | (7,550 | ) | (1,343 | ) | 1 | |
Swap Agreements | | 40,774 | | (3,453 | ) | — | | — | |
Net Realized Gain (Loss) | | (597,119 | ) | (85,130 | ) | (11,256 | ) | 27 | |
Change in Unrealized Appreciation (Depreciation): | | | | | | | | | |
Investments | | (66,238 | ) | (50,889 | ) | (823 | ) | (42 | ) |
Foreign Currency Exchange Contracts and Translations | | — | | — | | 3,098 | | 18 | |
Futures Contracts | | (15,190 | ) | 632 | | 123 | | 1 | |
Swap Agreements | | 23,561 | | 4,147 | | — | | — | |
Net Change in Unrealized Appreciation (Depreciation) | | (57,867 | ) | (46,110 | ) | 2,398 | | (23 | ) |
Total Net Realized Gain (Loss) and Change in Unrealized Appreciation (Depreciation) | | (654,986 | ) | (131,240 | ) | (8,858 | ) | 4 | |
Net Increase (Decrease) in Net Assets Resulting from Operations | | $ | (507,358 | ) | $ | (90,878 | ) | $ | (2,055 | ) | $ | 34 | |
| | | | | | | | | | | | | | | | | |
^ | For the period from March 11, 2008 (commencement of operations) to September 30, 2008. |
@ | Amount is less than $500. |
The accompanying notes are an integral part of the financial statements. | 29 |
2008 Annual Report
September 30, 2008
Statements of Changes in Net Assets
| | Advisory Portfolio | | Advisory Portfolio
II | |
| | Year Ended September 30, 2008
(000) | | Year Ended September 30, 2007
(000) | | Period Ended September 30, 2008^
(000) | |
Increase (Decrease) in Net Assets Operations: | | | | | | | |
Net Investment Income | | $ | 147,628 | | $ | 169,409 | | $ | 40,362 | |
Net Realized Gain (Loss) | | (597,119 | ) | 27,075 | | (85,130 | ) |
Net Change in Unrealized Appreciation (Depreciation) | | (57,867 | ) | (45,020 | ) | (46,110 | ) |
Net Increase (Decrease) in Net Assets Resulting from Operations | | (507,358 | ) | 151,464 | | (90,878 | ) |
Distributions from and/or in Excess of: | | | | | | | |
Class I: | | | | | | | |
Net Investment Income | | (140,353 | ) | (205,869 | ) | (34,236 | ) |
Return of Capital | | — | | (12,396 | ) | — | |
Total Distributions | | (140,353 | ) | (218,265 | ) | (34,236 | ) |
Capital Share Transactions:(1) | | | | | | | |
Class I: | | | | | | | |
Subscribed | | 670,806 | | 578,396 | | 1,365,318 | |
Distributions Reinvested | | 125,376 | | 190,371 | | 28,107 | |
Redeemed | | (2,651,954 | ) | (650,927 | ) | (562,936 | ) |
Net Increase (Decrease) in Net Assets Resulting from Capital Share Transactions | | (1,855,772 | ) | 117,840 | | 830,489 | |
Total Increase (Decrease) in Net Assets | | (2,503,483 | ) | 51,039 | | 705,375 | |
Net Assets: | | | | | | | |
Beginning of Period | | 3,228,079 | | 3,177,040 | | — | |
End of Period | | $ | 724,596 | | $ | 3,228,079 | | $ | 705,375 | |
Undistributed (Distributions in Excess of) Net Investment Income Included in End of Period Net Assets | | $ | 17,516 | | $ | (130 | ) | $ | 15,150 | |
(1) Capital Share Transactions: | | | | | | | |
Class I: | | | | | | | |
Shares Subscribed | | 75,355 | | 62,148 | | 166,876 | |
Shares Issued on Distributions Reinvested | | 14,815 | | 20,429 | | 3,651 | |
Shares Redeemed | | (334,758 | ) | (69,823 | ) | (73,696 | ) |
Net Increase (Decrease) in Class I Shares Outstanding | | (244,588 | ) | 12,754 | | 96,831 | |
| | | | | | | | | | | | | |
^ Advisory Portfolio II commenced operations on March 11, 2008.
30 | The accompanying notes are an integral part of the financial statements. |
2008 Annual Report
September 30, 2008
Statements of Changes in Net Assets
| | Advisory Portfolio III | | Advisory Portfolio IV | |
| | Year Ended | | Year Ended | | Year Ended | | Year Ended | |
| | September 30, | | September 30, | | September 30, | | September 30, | |
| | 2008 | | 2007 | | 2008 | | 2007 | |
| | (000) | | (000) | | (000) | | (000) | |
Increase (Decrease) in Net Assets Operations: | | | | | | | | | |
Net Investment Income | | $ | 6,803 | | $ | 8,093 | | $ | 30 | | $ | 47 | |
Net Realized Gain (Loss) | | (11,256 | ) | (2,508 | ) | 27 | | (14 | ) |
Net Change in Unrealized Appreciation (Depreciation) | | 2,398 | | (2,924 | ) | (23 | ) | 15 | |
Net Increase (Decrease) in Net Assets Resulting from Operations | | (2,055 | ) | 2,661 | | 34 | | 48 | |
Distributions from and/or in Excess of: | | | | | | | | | |
Class I: | | | | | | | | | |
Net Investment Income | | (1,988 | ) | (7,273 | ) | (24 | ) | (36 | ) |
Net Realized Gain | | (2,447 | ) | (415 | ) | — | | — | |
Return of Capital | | (2,114 | ) | — | | — | | — | |
Total Distributions | | (6,549 | ) | (7,688 | ) | (24 | ) | (36 | ) |
Capital Share Transactions:(1) | | | | | | | | | |
Class I: | | | | | | | | | |
Subscribed | | 4,814 | | 16,569 | | 167 | | — | |
Distributions Reinvested | | 6,220 | | 6,901 | | 23 | | 34 | |
Redeemed | | (71,672 | ) | (12,372 | ) | (84 | ) | (198 | ) |
Net Increase (Decrease) in Net Assets Resulting from Capital Share Transactions | | (60,638 | ) | 11,098 | | 106 | | (164 | ) |
Total Increase (Decrease) in Net Assets | | (69,242 | ) | 6,071 | | 116 | | (152 | ) |
Net Assets: | | | | | | | | | |
Beginning of Period | | 170,581 | | 164,510 | | 916 | | 1,068 | |
End of Period | | $ | 101,339 | | $ | 170,581 | | $ | 1,032 | | $ | 916 | |
Undistributed (Distributions in Excess of) Net Investment Income Included in End of Period Net Assets | | $ | (3,612 | ) | $ | (3,683 | ) | $ | 24 | | $ | (10 | ) |
(1) Capital Share Transactions: | | | | | | | | | |
Class I: | | | | | | | | | |
Shares Subscribed | | 1,431 | | 4,753 | | 14 | | — | |
Shares Issued on Distributions Reinvested | | 1,871 | | 1,976 | | 2 | | 3 | |
Shares Redeemed | | (21,961 | ) | (3,508 | ) | (7 | ) | (16 | ) |
Net Increase (Decrease) in Class I Shares Outstanding | | (18,659 | ) | 3,221 | | 9 | | (13 | ) |
| | | | | | | | | | | | | | | | | |
The accompanying notes are an integral part of the financial statements. | 31 |
2008 Annual Report
September 30, 2008
Financial Highlights
Advisory Portfolio
| | Class I | |
| | Year Ended September 30, | |
Selected Per Share Data and Ratios | | 2008 | | 2007 | | 2006 | | 2005 | | 2004 | |
Net Asset Value, Beginning of Period | | $ | 9.29 | | $ | 9.49 | | $ | 9.84 | | $ | 10.03 | | $ | 10.11 | |
Income (Loss) from Investment Operations: | | | | | | | | | | | |
Net Investment Income† | | 0.54 | | 0.51 | | 0.33 | | 0.36 | | 0.21 | |
Net Realized and Unrealized Gain (Loss) on Investments | | (2.28) | | (0.06) | | 0.11 | | 0.07 | | 0.21 | |
Total from Investment Operations | | (1.74) | | 0.45 | | 0.44 | | 0.43 | | 0.42 | |
Distributions from and/or in Excess of: | | | | | | | | | | | |
Net Investment Income | | (0.50) | | (0.61) | | (0.63) | | (0.62) | | (0.50) | |
Return of Capital | | — | | (0.04) | | (0.16) | | — | | — | |
Total Distributions | | (0.50) | | (0.65) | | (0.79) | | (0.62) | | (0.50) | |
Net Asset Value, End of Period | | $ | 7.05 | | $ | 9.29 | | $ | 9.49 | | $ | 9.84 | | $ | 10.03 | |
Total Return++ | | (19.23) | % | 4.88 | % | 4.76 | % | 4.44 | % | 4.30 | % |
Ratios and Supplemental Data: | | | | | | | | | | | |
Net Assets, End of Period (Thousands) | | $ | 724,596 | | $ | 3,228,079 | | $ | 3,177,040 | | $ | 3,298,677 | | $ | 3,760,527 | |
Ratio of Expenses to Average Net Assets (1) | | 0.03% | +^^ | 0.07 | %+ | 0.08 | % | 0.08 | % | 0.08 | % |
Ratio of Net Investment Income to Average Net Assets (1) | | 6.29% | +^^ | 5.42 | %+ | 3.41 | % | 3.66 | % | 2.09 | % |
Portfolio Turnover Rate | | 484 | % | 218 | % | 230 | % | 240 | % | 512 | % |
(1) Supplemental Information on the Ratios to Average Net Assets: | | | | | | | | | | | |
Ratios Before Expense Limitation: | | | | | | | | | | | |
Expenses to Average Net Assets | | 0.47% | +^^ | 0.47 | %+ | 0.48 | % | 0.47 | % | 0.49 | % |
Net Investment Income to Average Net Assets | | 5.85% | +^^ | 5.02 | %+ | 3.01 | % | 3.27 | % | 1.68 | % |
† Per share amount is based on average shares outstanding.
++ Calculated based on the net asset value as of the last business day of the period.
+ Reflects rebate of certain Portfolio expenses in connection with the investments in Morgan Stanley Institutional Liquidity Money Market Portfolio — Institutional Class during the period. As a result of such rebate, the expenses as a percentage of its net assets were effected by approximately 0.01%.
^^ Effective January 31, 2008, the Adviser has voluntarily agreed to waive its advisory fee and/or reimburse all expenses, other than fees paid on behalf of the Portfolio to the Trustees and after giving effect to custody fee offsets. Prior to January 31, 2008, the Portfolio had a 0.08% cap as described in Note B in the Notes to the Financial Statements.
32 | The accompanying notes are an integral part of the financial statements. |
2008 Annual Report
September 30, 2008
Financial Highlights
Advisory Portfolio II
| | Class I |
| | Period from |
| | March 11, |
| | 2008^ to |
| | September |
Selected Per Share Data and Ratios | | 30, 2008 |
Net Asset Value, Beginning of Period | | $ | 8.19 | |
Income (Loss) from Investment Operations: | | | |
Net Investment Income† | | 0.30 | |
Net Realized and Unrealized Loss on Investments | | (0.96 | ) |
Total from Investment Operations | | (0.66 | ) |
Distributions from and/or in Excess of: | | | |
Net Investment Income | | (0.25 | ) |
Total Distributions | | (0.25 | ) |
Net Asset Value, End of Period | | $ | 7.28 | |
Total Return++ | | (8.18 | )%# |
Ratios and Supplemental Data: | | | |
Net Assets, End of Period (Thousands) | | $ | 705,375 | |
Ratio of Expenses to Average Net Assets (1) | | 0.00 | %*+ |
Ratio of Net Investment Income to Average Net Assets (1) | | 6.81 | %*+ |
Portfolio Turnover Rate | | 356 | %# |
(1) Supplemental Information on the Ratios to Average Net Assets: | | | |
Ratios Before Expense Limitation: | | | |
Expenses to Average Net Assets | | 0.48 | %*+ |
Net Investment Income to Average Net Assets | | 6.33 | %*+ |
^ Commencement of Operations.
† Per share amount is based on average shares outstanding.
++ Calculated based on the net asset value as of the last business day of the period.
# Not Annualized.
* Annualized
+ Reflects rebate of certain Portfolio expenses in connection with the investments in Morgan Stanley Institutional Liquidity Money Market Portfolio — Institutional Class during the period. As a result of such rebate, the expenses as a percentage of its net assets were effected by less than 0.005%.
The accompanying notes are an integral part of the financial statements. | 33 |
2008 Annual Report
September 30, 2008
Financial Highlights
Advisory Portfolio III
| | Class I | |
| | Year Ended September 30, | |
Selected Per Share Data and Ratios | | 2008 | | 2007 | | 2006 | | 2005 | | 2004 | |
Net Asset Value, Beginning of Period | | $ | 3.40 | | $ | 3.50 | | $ | 3.41 | | $ | 3.34 | | $ | 3.29 | |
Income (Loss) from Investment Operations: | | | | | | | | | | | |
Net Investment Income† | | 0.14 | | 0.17 | | 0.18 | | 0.08 | | 0.06 | |
Net Realized and Unrealized Gain (Loss) on Investments | | (0.19) | | (0.11) | | (0.01) | †† | 0.06 | | 0.01 | |
Total from Investment Operations | | (0.05) | | 0.06 | | 0.17 | | 0.14 | | 0.07 | |
Distributions from and/or in Excess of: | | | | | | | | | | | |
Net Investment Income | | (0.04) | | (0.15) | | (0.08) | | (0.07) | | (0.02) | |
Net Realized Gain | | (0.05) | | (0.01) | | — | | (0.00) | ‡ | (0.00) | ‡ |
Return of Capital | | (0.05) | | — | | — | | — | | — | |
Total Distributions | | (0.14) | | (0.16) | | (0.08) | | (0.07) | | (0.02) | |
Net Asset Value, End of Period | | $ | 3.21 | | $ | 3.40 | | $ | 3.50 | | $ | 3.41 | | $ | 3.34 | |
Total Return++ | | (1.78) | % | 1.77 | % | 4.93 | % | 4.30 | % | 2.15 | % |
Ratios and Supplemental Data: | | | | | | | | | | | |
Net Assets, End of Period (Thousands) | | $ | 101,339 | | $ | 170,581 | | $ | 164,510 | | $ | 5,188 | | $ | 101,210 | |
Ratio of Expenses to Average Net Assets (1) | | 0.00% | +^^ | 0.11 | %+ | 0.15 | % | 0.15 | % | 0.15 | % |
Ratio of Net Investment Income to Average Net Assets (1) | | 4.31% | +^^ | 4.85 | %+ | 5.18 | % | 2.45 | % | 1.91 | % |
Portfolio Turnover Rate | | 1 | % | 69 | % | 11 | % | 7 | % | 10 | % |
(1) Supplemental Information on the Ratios to Average Net Assets: | | | | | | | | | | | |
Ratios Before Expense Limitation: | | | | | | | | | | | |
Expenses to Average Net Assets | | 0.46% | +^^ | 0.49 | %+ | 0.63 | % | 0.57 | % | 0.53 | % |
Net Investment Income to Average Net Assets | | 3.85% | +^^ | 4.47 | %+ | 4.70 | % | 2.03 | % | 1.53 | % |
† Per share amount is based on average shares outstanding.
†† The amount shown for a share outstanding does not correspond with the aggregate net gain (loss) on investments for the period due to timing of sales and repurchases of shares in relation to fluctuating market values of the investments of the Portfolio.
‡ Amount is less than $0.005 per share.
++ Calculated based on the net asset value as of the last business day of the period.
+ Reflects rebate of certain Portfolio expenses in connection with the investments in Morgan Stanley Institutional Liquidity Money Market Portfolio — Institutional Class during the period. As a result of such rebate, the expenses as a percentage of its net assets were effected by approximately 0.04% and 0.03% for the years ended September 30, 2008 and September 30, 2007, respectively.
^^ Effective January 31, 2008, the Adviser has voluntarily agreed to waive its advisory fee and/or reimburse all expenses, other than fees paid on behalf of the Portfolio to the Trustees and after giving effect to custody fee offsets. Prior to January 31, 2008, the Portfolio had a 0.15% cap as described in Note B in the Notes to the Financial Statements.
34 | The accompanying notes are an integral part of the financial statements. |
2008 Annual Report
September 30, 2008
Financial Highlights
Advisory Portfolio IV
| | Class I |
| | Year Ended September 30, |
Selected Per Share Data and Ratios | | 2008 | | 2007 | | 2006 | | 2005 | | 2004 | |
Net Asset Value, Beginning of Period | | $ | 12.46 | | $ | 12.30 | | $ | 12.00 | | $ | 11.84 | | $ | 11.63 | |
Income (Loss) from Investment Operations: | | | | | | | | | | | |
Net Investment Income† | | 0.35 | | 0.55 | | 0.49 | | 0.29 | | 0.22 | |
Net Realized and Unrealized Gain on Investments | | 0.07 | | 0.03 | | 0.02 | | 0.07 | | 0.05 | |
Total from Investment Operations | | 0.42 | | 0.58 | | 0.51 | | 0.36 | | 0.27 | |
Distributions from and/or in Excess of: | | | | | | | | | | | |
Net Investment Income | | (0.31) | | (0.42) | | (0.21) | | (0.20) | | (0.06) | |
Net Realized Gain | | — | | — | | — | | — | | 0.00 | ‡ |
Total Distributions | | (0.31) | | (0.42) | | (0.21) | | (0.20) | | (0.06) | |
Net Asset Value, End of Period | | $ | 12.57 | | $ | 12.46 | | $ | 12.30 | | $ | 12.00 | | $ | 11.84 | |
Total Return++ | | 3.42 | % | 4.82 | % | 4.30 | % | 3.11 | % | 2.35 | % |
Ratios and Supplemental Data: | | | | | | | | | | | |
Net Assets, End of Period (Thousands) | | $ | 1,032 | | $ | 916 | | $ | 1,068 | | $ | 1,285 | | $ | 25,671 | |
Ratio of Expenses to Average Net Assets (1) | | 0.04% | +^^ | 0.13 | %+ | 0.15 | % | 0.15 | % | 0.15 | % |
Ratio of Net Investment Income to Average Net Assets (1) | | 2.81% | +^^ | 4.46 | %+ | 4.04 | % | 2.41 | % | 1.92 | % |
Portfolio Turnover Rate | | 63 | % | 12 | % | 91 | % | 15 | % | 11 | % |
(1) Supplemental Information on the Ratios to Average Net Assets: | | | | | | | | | | | |
Ratios Before Expense Limitation: | | | | | | | | | | | |
Expenses to Average Net Assets | | 6.09 | %+^^ | 6.16 | %+ | 5.36 | % | 0.81 | % | 0.62 | % |
Net Investment Income (Loss) to Average Net Assets | | (3.24) | %+^^ | (1.57) | %+ | (1.17) | % | 1.75 | % | 1.45 | % |
† Per share amount is based on average shares outstanding.
‡ Amount is less than $0.005 per share.
++ Calculated based on the net asset value as of the last business day of the period.
+ Reflects rebate of certain Portfolio expenses in connection with the investments in Morgan Stanley Institutional Liquidity Money Market Portfolio — Institutional Class during the period. As a result of such rebate, the expenses as a percentage of its net assets were effected by approximately 0.03% and 0.02% for the years ended September 30, 2008 and September 30, 2007, respectively.
^^ Effective January 31, 2008, the Adviser has voluntarily agreed to waive its advisory fee and/or reimburse all expenses, other than fees paid on behalf of the Portfolio to the Trustees and after giving effect to custody fee offsets. Prior to January 31, 2008, the Portfolio had a 0.15% cap as described in Note B in the Notes to the Financial Statements.
The accompanying notes are an integral part of the financial statements. | 35 |
2008 Annual Report | |
| |
September 30, 2008 | |
Notes to Financial Statements
Morgan Stanley Institutional Fund Trust (“MSIFT” or the “Fund”) is registered under the Investment Company Act of 1940, as amended (the “1940 Act”), as an open-end management investment company. The Fund is comprised of eighteen active portfolios. The accompanying financial statements and financial highlights are those of the Advisory Portfolio, Advisory Portfolio II, Advisory Portfolio III (formerly Advisory Global Fixed Income Portfolio) and Advisory Portfolio IV (formerly Advisory Global Fixed Income Portfolio II)(each referred to as a “Portfolio” or together as “Portfolios”) only. For the purposes of the 1940 Act, the Advisory Portfolio II, Advisory Portfolio III and Advisory Portfolio IV are considered non-diversified funds; the Advisory Portfolio is considered a diversified fund. Effective January 2, 2008, Institutional Class shares of the Portfolio were renamed Class I shares. Effective March 11, 2008, the Advisory Portfolio II commenced operations. The financial statements of the remaining portfolios are presented separately.
A. Significant Accounting Policies: The following significant accounting policies are in conformity with U.S. generally accepted accounting principles. Such policies are consistently followed by the Fund in the preparation of the financial statements. U.S. generally accepted accounting principles may require management to make estimates and assumptions that affect the reported amounts and disclosures in the financial statements. Actual results may differ from those estimates.
1. Security Valuation: Bonds and other fixed income securities may be valued according to the broadest and most representative market. In addition, bonds and other fixed income securities may be valued on the basis of prices provided by a pricing service. The prices provided by a pricing service take into account broker dealer market price quotations for institutional size trading in similar groups of securities, security quality, maturity, coupon and other security characteristics as well as any developments related to the specific securities. Debt securities purchased with remaining maturities of 60 days or less are valued at amortized cost, if it approximates market value. Equity securities listed on a U.S. exchange are valued at the latest quoted sales price on the valuation date. Equity securities listed or traded on NASDAQ, for which market quotations are available, are valued at the NASDAQ Official Closing Price. Securities listed on a foreign exchange are valued at their closing price, except as noted below. Unlisted and listed equity securities not traded on the valuation date, for which market quotations are readily available, are valued at the mean between the current bid and asked prices obtained from reputable brokers.
All other securities and investments for which market values are not readily available, including restricted securities, and those securities for which it is inappropriate to determine prices in accordance with the aforementioned procedures, are valued at fair value as determined in good faith under procedures adopted by the Board of Trustees (the “Trustees”), although the actual calculations may be done by others. Factors considered in making this determination may include, but are not limited to, information obtained by contacting the issuer, analysts, or the appropriate stock exchange (for exchange-traded securities), analysis of the issuer’s financial statements or other available documents and, if necessary, available information concerning other securities in similar circumstances.
Most foreign markets close before the New York Stock Exchange (NYSE). Occasionally, developments that could affect the closing prices of securities and other assets may occur between the times at which valuations of such securities are determined (that is, close of the foreign market on which the securities trade) and the close of business on the NYSE. If these developments are expected to materially affect the value of the securities, the valuations may be adjusted to reflect the estimated fair value as of the close of the NYSE, as determined in good faith under procedures established by the Trustees.
2. Futures: Financial futures contracts (secured by cash and securities deposited with brokers as “initial margin”) are valued based upon their quoted daily settlement prices; changes in initial settlement value (represented by cash paid to or received from brokers as “variation margin”) are accounted for as unrealized appreciation (depreciation). When futures contracts are closed, the difference between the opening value at the date of purchase and the value at closing is recorded as realized gain (loss) in the Statements of Operations. “Due from (to) Broker” includes initial margin and variation margin, as stated in the Statements of Assets and Liabilities.
Futures contracts may be used by each Portfolio in order to hedge against unfavorable changes in the value of securities or to attempt to realize profits from the value of the related securities.
Futures contracts involve market risk that may exceed the amounts recognized in the Statements of Assets and Liabilities. Risks arise from the possible movements in the prices of securities relating to these instruments. The change in value of futures contracts primarily corresponds with the value of their related securities, but may not precisely correlate with the change in value of such securities. In addition, there is the risk that a Portfolio may not be able to enter into a closing transaction because of an illiquid secondary market.
3. Securities Sold Short: Each Portfolio may sell securities short. A short sale is a transaction in which the Portfolio sells securities it may or may not own, but has borrowed, in anticipation of a decline in the market price of the securities.
36
| 2008 Annual Report |
| |
| September 30, 2008 |
Notes to Financial Statements (cont’d)
The Portfolio is obligated to replace the borrowed securities at their market price at the time of replacement. The Portfolio may have to pay a premium to borrow the securities as well as pay any dividends or interest payable on the securities until they are replaced. The Portfolio’s obligation to replace the securities borrowed in connection with a short sale will generally be secured by collateral deposited with the broker that consists of cash, U.S. government securities or other liquid high grade debt obligations. In addition, the Portfolio will either place in a segregated account with its custodian or denote on its custody records an amount of cash, U.S. government securities or other liquid high grade debt obligations equal to the difference, if any, between (1) the market value of the securities sold at the time they were sold short and (2) any cash, U.S. government securities or other liquid high grade debt obligations deposited as collateral with the broker in connection with the short sale (not including the proceeds of the short sale). Short sales by the Portfolios involve certain risks and special considerations. Possible losses from short sales differ from losses that could be incurred from a purchase of a security because losses from short sales may be unlimited, whereas losses from purchases cannot exceed the total amount invested.
4. Swap Agreements: Each Portfolio may enter into swap agreements to exchange the interest rate on, or return generated by, one nominal instrument for the return generated by another nominal instrument. Cash collateral for swap agreements, if applicable, is deposited with the broker serving as counterparty to the agreement, and is included in “Due from (to) Broker” on the Statements of Assets and Liabilities. The following summarizes swaps entered into by the Portfolios:
Credit Default Swaps: Credit default swaps involve commitments to pay a fixed rate in exchange for payment if a credit event affecting a third party (the referenced company) occurs. Credit events may include a failure to pay interest, bankruptcy, or restructuring. The Portfolio accrues for interim payments on swap contracts on a daily basis, with the net amount recorded within unrealized appreciation (depreciation) of swap contracts on the Statements of Assets and Liabilities. Once interim payments are settled in cash, the net amount is recorded within realized gain (loss) on swaps on the Statements of Operations. Credit default swaps are marked-to-market daily based upon quotations from market makers and the change, if any, is recorded as unrealized appreciation or depreciation in the Statements of Operations.
Interest Rate Swaps: Interest rate swaps involve the exchange of commitments to pay and receive interest based on a notional principal amount. The Portfolio accrues for interim payments on swap contracts on a daily basis, with the net amount recorded within unrealized appreciation (depreciation) of swap contracts on the Statements of Assets and Liabilities. Once interim payments are settled in cash, the net amount is recorded within realized gain (loss) on swaps on the Statements of Operations. In a zero-coupon interest rate swap, payments only occur at maturity, at which time one counterparty pays the total compounded fixed rate over the life of the swap and the other pays the total compounded floating rate that would have been earned had a series of LIBOR investments been rolled over through the life of the swap. The Portfolio amortizes its interest payment obligation over the life of the swap. The amortized portion of this payment is recorded within realized gain (loss) on the Statements of Operations. The unamortized portion of this payment is included in “Due from (to) Broker” on the Statements of Assets and Liabilities. Interest rate swaps are marked-to-market daily based upon quotations from market makers and the change, if any, is recorded as unrealized appreciation or depreciation in the Statements of Operations.
Total Return Swaps: Total return swaps involve commitments to pay interest in exchange for a market-linked return based on a notional amount. To the extent the total return of the security or index underlying the transaction exceeds or falls short of the offsetting interest rate obligation, the Portfolio will receive a payment from or make a payment to the counterparty, respectively. Total return swaps are marked-to-market daily based upon quotations from market makers and the change, if any, is recorded as unrealized appreciation or depreciation in the Statements of Operations. Periodic payments received or made at the end of each measurement period, but prior to termination, are recorded as realized gains (losses) in the Statements of Operations.
Realized gains (losses) on maturity or termination of swaps are presented in the Statements of Operations. Because there is no organized market for these swap agreements, the unrealized gain (loss) reported in the Statements of Assets and Liabilities may differ from that which would be realized in the event the Portfolio terminated its position in the agreement. Risks may arise upon entering into these agreements from the potential inability of the counterparties to meet the terms of the agreements and are generally limited to the amount of net interest payments to be received, if any, at the date of default. Risks also arise from potential losses from adverse market movements and such losses could exceed the related amounts shown in the Statements of Assets and Liabilities.
5. Structured Investments: Each Portfolio may invest in structured investments whose values are linked either directly or inversely to changes in foreign currencies, interest rates, commodities, indices, equity securities or other underlying instruments. A Portfolio uses these securities to increase or decrease its exposure to different underlying
37
2008 Annual Report | |
| |
September 30, 2008 | |
Notes to Financial Statements (cont’d)
instruments and to gain exposure to markets that might be difficult to invest in through conventional securities. Structured investments may be more volatile than their underlying instruments, but any loss is limited to the amount of the original investment.
6. Delayed Delivery Commitments: Each Portfolio may purchase or sell securities on a when-issued or forward commitment basis. Payment and delivery may take place a month or more after the date of the transaction. The price of the underlying securities and the date when the securities will be delivered and paid for are fixed at the time the transaction is negotiated. Liquid securities or cash is designnated in an amount at least equal to these commitments. Securities held for this purpose cannot be sold while this strategy is outstanding, unless replaced with other assets. As a result, there is a possibility that as designated assets reach certain levels, a Portfolio may lose some flexibility in managing its investments, responding to shareholder redemption requests, or meeting other current obligations. Such transactions may give rise to a form of leverage. This can cause a Portfolio to be more volatile than if it had not been leveraged, as leverage tends to exaggerate the effect of any increase or decrease in the value of the Portfolio’s securities.
7. Foreign Currency Translation and Foreign Currency Exchange Contracts: The books and records of the Fund are maintained in U.S. dollars. Foreign currency amounts are translated into U.S. dollars at the bid prices of such currencies against U.S. dollars quoted by a bank. Net realized gains (losses) on foreign currency transactions represent net foreign exchange gains (losses) from foreign currency exchange contracts, disposition of foreign currencies, currency gains (losses) realized between the trade and settlement dates on securities transactions, and the difference between the amount of investment income and foreign withholding taxes recorded on a Portfolio’s books and the U.S. dollar equivalent of amounts actually received or paid.
A foreign currency exchange contract is an agreement between two parties to buy or sell currency at a set price on a future date. Each Portfolio may enter into foreign currency exchange contracts to protect securities and related receivables and payables against future changes in foreign exchange rates and, in certain situations, to gain exposure to foreign currencies. Certain Portfolios may also enter into cross currency hedges which involve the sale of one currency against the positive exposure to a different currency. Cross currency hedges may be used for hedging purposes or to establish an active exposure to the exchange rate between any two currencies. Fluctuations in the value of such contracts are recorded as unrealized appreciation or depreciation; realized gains (losses), which are disclosed in the Statements of Operations, include net gains (losses) on contracts which have been terminated by settlements. Risks may arise upon entering into these contracts from the potential inability of counterparties to meet the terms of their contracts and are generally limited to the amount of unrealized gain on the contract, if any, at the date of default. Risks may also arise from unanticipated movements in the value of the foreign currency relative to the U.S. dollar.
The Advisory III and Advisory IV Portfolios’ net assets include foreign denominated securities and currency. The net assets of these Portfolios are presented at the foreign exchange rates and market values at the close of the period. The Portfolios do not isolate that portion of the results of operations arising as a result of changes in the foreign exchange rates from the fluctuations arising from changes in the market prices of the securities held at period end. Similarly, the Portfolios do not isolate the effect of changes in foreign exchange rates from the fluctuations arising from changes in the market prices of securities sold during the period. Accordingly, the components of realized and unrealized foreign currency gains (losses) representing foreign exchange changes on investments is included in the reported net realized and unrealized gains (losses) on investment transactions and balances. Changes in currency exchange rates will affect the value of and investment income from such securities and currency.
Foreign security and currency transactions may involve certain considerations and risks not typically associated with those of U.S. dollar denominated transactions as a result of, among other factors, the possibly lower level of governmental supervision, relative currency valuation fluctuation, regulation of foreign securities markets and the possibility of political or economic instability.
8. Purchased and Written Options: Certain Portfolios may write covered call and put options on portfolio securities and other financial instruments. Premiums are received and are recorded as liabilities. The liabilities are subsequently adjusted to reflect the current value of the options written. Premiums received from writing options which expire are treated as realized gains. Premiums received from writing options which are exercised or are closed are added to or offset against the proceeds or amount paid on the transaction to determine the net realized gain (loss). By writing a covered call option, a Portfolio, in exchange for the premium, foregoes the opportunity for capital appreciation above the exercise price should the market price of the underlying security increase. By writing a put option, a Portfolio, in exchange for the premium, accepts the risk of having to purchase a security at an exercise price that is above the current market price.
Certain Portfolios may purchase call and put options on their portfolio securities or other financial instruments. Each Portfolio may purchase call options to protect against
38
| 2008 Annual Report |
| |
| September 30, 2008 |
Notes to Financial Statements (cont’d)
an increase in the price of the security or financial instrument it anticipates purchasing. Each Portfolio may purchase put options on securities which it holds or other financial instruments to protect against a decline in the value of the security or financial instrument or to close out covered written put positions. Risks may arise from an imperfect correlation between the change in market value of the securities held by the Portfolio and the prices of options relating to the securities purchased or sold by the Portfolio and from the possible lack of a liquid secondary market for an option. The maximum exposure to loss for any purchased option is limited to the premium initially paid for the option.
Options written for the year ended September 30, 2008, were as follows:
| | | | Total Premiums | |
| | Total Number of | | Received | |
Portfolio | | Contracts | | (000) | |
Advisory | | | | | |
Options Outstanding — October 1, 2007 | | — | | $ | — | |
Options Written | | 5,718 | | 2,859 | |
Closing Purchase Transactions | | (5,718 | ) | (2,859 | ) |
Options Outstanding — September 30, 2008 | | — | | $ | — | |
| | | | | |
Advisory II | | | | | |
Options Outstanding — October 1, 2007 | | — | | $ | — | |
Options Written | | 3,654 | | 1,827 | |
Closing Purchase Transactions | | (3,654 | ) | (1,827 | ) |
Options Outstanding — September 30, 2008 | | — | | $ | — | |
9. New Accounting Pronouncements: In September 2006, Statement of Financial Accounting Standards No. 157, Fair Value Measurements (“SFAS 157”), was issued and is effective for fiscal years beginning after November 15, 2007. SFAS 157 defines fair value, establishes a framework for measuring fair value and expands disclosures about fair value measurements. As of September 30, 2008, the Adviser does not believe the adoption of SFAS 157 will impact the amounts reported in the financial statements, however, additional disclosures will be required about the inputs used to develop the measurements of fair value and the effect of certain measurements reported in the Statement of Operations for a fiscal period.
On March 19, 2008, Financial Accounting Standards Board released Statement of Financial Accounting Standards No. 161, “Disclosures about Derivative Instruments and Hedging Activities” (“SFAS 161”). SFAS 161 requires qualitative disclosures about objectives and strategies for using derivatives, quantitative disclosures about fair value amounts of and gains and losses on derivative instruments, and disclosures about credit-risk-related contingent features in derivative agreements. The application of SFAS 161 is required for fiscal years beginning after November 15, 2008 and interim periods within those fiscal years. At this time, management is evaluating the implications of SFAS 161 and its impact on the financial statements has not yet been determined.
10. Other: Security transactions are accounted for on the date the securities are purchased or sold. Costs used in determining realized gains (losses) on the sale of investment securities are those of specific securities sold.
Discounts and premiums on securities purchased are accreted/amortized over their respective lives. Most expenses of the Fund can be directly attributed to a particular Portfolio. Expenses which cannot be directly attributed are apportioned among the Portfolios on the basis of their relative net assets.
B. Investment Advisory Fees. Morgan Stanley Investment Management Inc. (the “Adviser” or “MS Investment Management”), a wholly-owned subsidiary of Morgan Stanley, performs investment advisory services at a fee calculated by applying a quarterly rate based on the annual percentage rate of 0.375% to each Portfolio’s average daily net assets for the quarter.
Effective January 31, 2008, the Adviser has voluntarily agreed to waive its advisory fee and/or reimburse all expenses for each Portfolio, other than fees paid on behalf of each Portfolio to the Trustees and after giving effect to custody fee offsets. Prior to January 31, 2008, the Adviser has voluntarily agreed to reduce the fees payable to it and, if necessary, reimburse the Advisory Portfolio, Advisory Portfolio III and Advisory Portfolio IV for certain expenses, after giving effect to custody fee offsets, if annual operating expenses exceed 0.08%, 0.15% and 0.15% of average net assets, respectively.
Fee waivers and/or expense reimbursements are voluntary and may be commenced or terminated at any time. For the year ended September 30, 2008, the Portfolios had advisory fees waived and/or certain expenses reimbursed as follows:
| | Advisory Fees |
| | Waived |
| | and/or |
| | Reimbursed |
Portfolio | | (000) |
Advisory | | $10,303 |
Advisory II | | 2,869 |
Advisory III | | 730 |
Advisory IV | | 64 |
Prior to January 31, 2008, Morgan Stanley Investment Management Limited (“MSIM Limited”) served as Sub-Adviser to Advisory Portfolio III and Advisory Portfolio IV.
39
2008 Annual Report | |
| |
September 30, 2008 | |
Notes to Financial Statements (cont’d)
MSIM Limited is a wholly-owned subsidiary of Morgan Stanley. Under an Amended and Restated Sub-Advisory Agreement with the Adviser, MSIM Limited, subject to the control and supervision of the Fund, its officers, Trustees and the Adviser, and in accordance with the investment objectives, policies and restrictions of each Portfolio, made certain day-to-day investment decisions for each Portfolio and placed certain of each Portfolio’s purchase and sales orders. The Adviser paid MSIM Limited on a monthly basis a portion of the net advisory fees the Adviser received from these Portfolios. Effective January 31, 2008, the Amended and Restated Sub-Advisory Agreement was terminated with respect to Advisory Portfolio III and Advisory Portfolio IV.
C. Administration Fees. MS Investment Management (the “Administrator”) also provides the Fund with administration services pursuant to an administration agreement for an annual fee, accrued daily and paid monthly, of 0.08% of each Portfolio’s average daily net assets.
Under an agreement between the Administrator and JPMorgan Investor Services Co. (“JPMIS”), a corporate affiliate of JPMorgan Chase Bank, N.A., JPMIS provides certain administrative services to the Fund. For such services, the Administrator pays JPMIS a portion of the fee the Administrator receives from the Fund.
D. Distributor. Morgan Stanley Distribution, Inc. (“MSDI” or the “Distributor”), a wholly-owned subsidiary of the Adviser, serves as the distributor for the Fund.
E. Dividend Disbursing and Transfer Agent. Effective June 9, 2008, the Fund dividend disbursing and transfer agent is Morgan Stanley Services Company Inc. (“Morgan Stanley Services”). Pursuant to a Transfer Agency Agreement, the Fund pays Morgan Stanley Services a fee generally based on the number of classes, accounts and transactions relating to the Portfolios of the Fund. Prior to June 9, 2008, JPMorgan Investor Services Company provided dividend disbursing and transfer agency services for the Fund.
F. Custodian Fees. JPMorgan Chase Bank, N.A. (the “Custodian”) serves as Custodian for the Fund in accordance with a custodian agreement. The Custodian holds cash, securities, and other assets of the Fund as required by the 1940 Act.
The Fund has entered into an arrangement with its Custodian whereby credits realized on uninvested cash balances were used to offset a portion of each applicable Portfolio’s expenses. These custodian credits are shown as “Expense Offset” on the Statements of Operations.
G. Portfolio Investment Activity.
1. | Security Transactions: For the year ended September 30, 2008, purchases and sales of investment securities other than long-term U.S. government securities and short-term investments were: |
Portfolio | | Purchases
(000) | | Sales
(000) |
Advisory | | $14,851,596 | | $17,401,856 |
Advisory II | | 5,424,214 | | 4,627,663 |
Advisory III | | 476 | | 44,642 |
Advisory IV | | — | | 426 |
For the year ended September 30, 2008, purchases and sales of long-term U.S. government securities were:
Portfolio | | Purchases
(000) | | Sales
(000) |
Advisory | | $ | 14,241 | | $ | — |
Advisory II | | 16,234 | | — |
Advisory III | | — | | — |
Advisory IV | | 1,025 | | 26 |
| | | | | | |
40
| 2008 Annual Report |
| |
| September 30, 2008 |
Notes to Financial Statements (cont’d)
2. Transactions with Affiliates: The Portfolios invest in the Institutional Class of portfolios within the Morgan Stanley Institutional Liquidity Funds (the “Liquidity Funds”), an open-end management investment company managed by the Adviser, both directly, and/or as a portion of the securities held as collateral on loaned securities. A summary of the Portfolio’s transactions in the shares of the Liquidity Funds during the year ended September 30, 2008 is set forth below:
| | Market Value
September 30,
2007 | | Purchases
at Cost | | Sales
Proceeds | | Dividend
Income | | Market Value
September 30,
2008 |
Portfolio | | (000) | | (000) | | (000) | | (000) | | (000) |
Advisory | | $331,395 | | $2,112,954 | | $2,343,833 | | $7,569 | | $100,516 |
Advisory II | | — | | 861,463 | | 758,726 | | 3,866 | | 102,737 |
Advisory III | | 105,856 | | 98,575 | | 194,002 | | 3,778 | | 10,429 |
Advisory IV | | 408 | | 972 | | 1,344 | | 13 | | 36 |
Investment Advisory fees paid by the Portfolios are reduced by an amount equal to their pro-rata share of the advisory and administration fees paid by the Liquidity Funds (“Rebate”). For the year ended September 30, 2008, advisory fees paid were reduced as follows:
| | Rebate |
Portfolio | | (000) |
Advisory | | $229 |
Advisory II | | 5 |
Advisory III | | 57 |
Advisory IV | | 1 |
H. Securities Lending. The Portfolios may lend securities to qualified financial institutions, such as broker-dealers, to earn additional income. Any increase or decrease in the fair value of the securities loaned that might occur and any interest earned or dividends declared on those securities during the term of the loan would remain in the Portfolio. Portfolios that lend securities receive cash or securities as collateral in an amount equal to or exceeding 100% of the current fair value of the loaned securities. The collateral is marked to market daily, by the securities lending agent, to ensure that a minimum of 100% collateral coverage is maintained.
Based on pre-established guidelines, the securities lending agent invests any cash collateral that is received in an affiliated money market portfolio and high-quality short-term investments. Securities lending income is generated from the earnings on the invested collateral and borrowing fees, less any rebates owed to the borrowers and compensation to the lending agent, and is included in the Portfolios’ Statements of Operations in affiliated dividend income and interest income. Risks in securities lending transactions are that a borrower may not provide additional collateral when required or return the securities when due, and that the value of the short-term investments will be less than the amount of cash collateral plus any rebate that is required to be returned to the borrower.
The value of loaned securities and related collateral outstanding at September 30, 2008 are as follows:
Portfolio | | Value of
Loaned
Securities
(000) | | Value of
Collateral
(000) |
Advisory | | $ | 1 | | $ | 1 |
| | | | | | |
For the year ended September 30, 2008, the following Portfolios had income from securities lending (after rebates to borrowers and fee paid to securities lending agent):
Portfolio | | Net Interest
Earned by
Portfolio
(000) |
Advisory | | $233 |
I. Federal Income Taxes. It is each Portfolio’s intention to qualify as a regulated investment company and distribute all of its taxable and tax-exempt income. Accordingly, no provision for Federal income taxes is required in the financial statements.
Dividend income and distributions to shareholders are recorded on the ex-dividend date. Interest income is recognized on the accrual basis. Dividends from net investment income, if any, are declared and paid quarterly for the Advisory Portfolio III and Advisory Portfolio IV and monthly for the Advisory Portfolio and Advisory Portfolio II. Net realized capital gains, if any, are distributed at least annually.
The Portfolios adopted the provisions of the FASB Interpretation number 48 Accounting for Uncertainty in
41
2008 Annual Report | |
| |
September 30, 2008 | |
Notes to Financial Statements (cont’d)
Income Taxes (the “Interpretation”), on March 31, 2008. For the year ended September 30, 2008, the Portfolios did not have any liabilities for any unrecognized tax benefits. The Portfolios recognize interest and penalties, if any, related to unrecognized tax benefits as income tax expense in the Statement of Operations. During the year, the Portfolios did not incur any interest or penalties.
Each of the tax years in the four year period ended September 30, 2008 remains subject to examination by the Internal Revenue Service and state taxing authorities. The adoption of FIN 48 had no impact on the operations of the Portfolios for the year ended September 30, 2008.
The tax character for distributions paid may differ from the character of distributions shown on the Statements of Changes in Net Assets due to short-term capital gains being treated as ordinary income for tax purposes. The tax character of distributions paid during fiscal 2008 and 2007 were as follows:
| | 2008 Distributions Paid | | 2007 Distributions Paid |
| | From: | | From: |
| | | | | | Long- | | | | | | Long- |
| | | | | | term | | | | | | term |
| | Ordinary | | Return of | | Capital | | Ordinary | | Return of | | Capital |
| | Income | | Capital | | Gain | | Income | | Capital | | Gain |
Portfolio | | (000) | | (000) | | (000) | | (000) | | (000) | | (000) |
Advisory | | $140,353 | | $ — | | $ — | | $205,869 | | $12,396 | | $ — |
Advisory II | | 34,236 | | — | | — | | — | | — | | — |
Advisory III | | 4,435 | | 2,114 | | — | | 7,688 | | — | | — |
Advisory IV | | 24 | | — | | — | | 36 | | — | | — |
The amount and character of income and gains to be distributed are determined in accordance with income tax regulations which may differ from U.S. generally accepted accounting principles. The book/tax differences are either considered temporary or permanent in nature.
Temporary differences are generally due to differing book and tax treatments in the timing of the recognition of gains (losses) on securities, options, swaps, forwards and futures, including Post October losses.
Permanent differences, primarily due to differing treatments of gains (losses) related to foreign currency transactions, foreign futures transactions, swap transactions, paydown adjustments, return of capital dividend distributions and in-kind resulted in the following reclassifications among the Portfolios’ components of net assets at September 30, 2008:
| | Accumulated | | | | |
| | Undistributed | | | | |
| | (Distribution | | | | |
| | in Excess of) | | Accumulated | | |
| | Net Investment | | Net Realized | | Paid-in |
| | Income (Loss) | | Gain (Loss) | | Capital |
Portfolio | | (000) | | (000) | | (000) |
Advisory | | $ 10,371 | | $ 295,707 | | $ (306,078) |
Advisory II | | 9,024 | | 1,509 | | (10,533) |
Advisory III | | (4,744) | | 4,744 | | — |
Advisory IV | | 28 | | (28) | | — |
At September 30, 2008, the components of distributable earnings on a tax basis were as follows:
| | Undistributed | | Tax- | | Undistributed |
| | Ordinary | | Exempt | | Long-term |
| | Income | | Income | | Capital Gain |
Portfolio | | (000) | | (000) | | (000) |
Advisory | | $ | 18,464 | | $ | — | | $ | — |
Advisory II | | 15,150 | | — | | — |
Advisory III | | — | | — | | — |
Advisory IV | | 24 | | — | | — |
| | | | | | | | | |
At September 30, 2008, cost, unrealized appreciation, unrealized depreciation, and net unrealized appreciation (depreciation) for U.S. Federal income tax purposes of the investments of each of the Portfolios were:
| | | | | | | | Net |
| | | | | | | | Appreciation |
| | Cost | | Appreciation | | Depreciation | | (Depreciation) |
Portfolio | | (000) | | (000) | | (000) | | (000) |
Advisory | | $1,040,541 | | $8,315 | | $(190,091) | | $(181,776) |
Advisory II | | 812,385 | | 3,459 | | (54,390) | | (50,931) |
Advisory III | | 100,190 | | 46 | | (561) | | (515) |
Advisory IV | | 1,023 | | 1 | | (1) | | —@ |
@ Amount is less than $500.
At September 30, 2008, the following Portfolios had available for Federal income tax purposes unused capital losses, which will expire on the indicated dates:
Portfolio | | 2012 | | 2013 | | 2014 | |
Advisory | | $152,714 | | $62,736 | | $19,857 | |
Advisory II | | — | | — | | — | |
Advisory III | | — | | — | | — | |
Advisory IV | | — | | — | | — | |
Portfolio | | 2015 | | 2016 | | Total | |
Advisory | | $61,283 | | $64,638 | | $361,228 | |
Advisory II | | — | | — | | — | |
Advisory III | | — | | — | | — | |
Advisory IV | | —@ | | — | | —@ | |
@ Amount is less than $500.
42
| 2008 Annual Report |
| |
| September 30, 2008 |
Notes to Financial Statements (cont’d)
To the extent that capital loss carryforwards are used to offset any future capital gains realized during the carryforwards period as provided by U.S. Federal income tax regulations, no capital gains tax liability will be incurred by a portfolio for gains realized and not distributed. To the extent that capital gains are offset, such gains will not be distributed to the shareholders.
Net capital and currency losses incurred after October 31, and within the taxable year are deemed to arise on the first day of the Portfolio’s next taxable year. For the year ended September 30, 2008, the Portfolio deferred to October 1, 2008 for U.S. Federal income tax purposes, post-October capital and currency losses as indicated:
| | | | Post-October |
Portfolio | | | | Capital
Losses
(000) | | Currency
Losses
(000) |
| | | | | | |
Advisory | | | | $ 311,831 | | $ 827 |
Advisory II | | | | 81,243 | | — |
Advisory III | | | | 6,513 | | 3,391 |
Advisory IV | | | | —@ | | — |
@ Amount is less than $500.
For the year ended September 30, 2008, the Advisory Portfolio and Advisory Portfolio II realized losses from in-kind redemptions of approximately $294,336,000 and $1,594,000, respectively. The losses are not taxable income to the Advisory Portfolio and Advisory Portfolio II.
J. Contractual Obligations. The Fund enters into contracts that contain a variety of indemnifications. The Fund’s maximum exposure under these arrangements is unknown. However, the Fund has not had prior claims or losses pursuant to these contracts and expects the risk of loss to be remote.
K. Other (unaudited). At September 30, 2008, the Advisory Portfolio, Advisory Portfolio II, Advisory Portfolio III and Advisory Portfolio IV each had otherwise unaffiliated record owners of 10% or greater. Investment activities of these shareholders could have a material impact on the Portfolios. The aggregate percentage of such owners was 62.6%, 77.1%, 31.8% and 87.0%, respectively.
L. Subsequent Event. As of November 19, 2008, there were no shareholders in the Advisory Portfolio III and Advisory Portfolio IV and on that date the Board of Trustees approved the termination of both Portfolios.
Subsequent to September 30, 2008, conditions in the worldwide debt and equity markets have deteriorated significantly. These conditions have had a negative effect on the market value of the Portfolios’ investments since September 30, 2008.
43
2008 Annual Report | |
| |
September 30, 2008 | |
Report of Independent Registered Public Accounting Firm
To the Board of Trustees and Shareholders of Morgan Stanley Institutional Fund Trust:
We have audited the accompanying statements of assets and liabilities of Advisory Portfolio, Advisory Portfolio II, Advisory Portfolio III (formerly, Advisory Global Fixed Income Portfolio), and Advisory Portfolio IV (formerly, Advisory Global Fixed Income II Portfolio (the “Funds”) (four of the portfolios constituting Morgan Stanley Institutional Fund Trust), including the portfolios of investments, as of September 30, 2008, and the related statements of operations for the year then ended, the statements of changes in net assets for each of the two years in the period then ended, and the financial highlights for each of the five years in the period then ended for Advisory Portfolio, Advisory Portfolio III and Advisory Portfolio IV. We have also audited the related statements of operations and changes in net assets and the financial highlights for Advisory Portfolio II for the period from March 11, 2008 (commencement of operations) to September 30, 2008. These financial statements and financial highlights are the responsibility of the Funds’ management. Our responsibility is to express an opinion on these financial statements and financial highlights based on our audits.
We conducted our audits in accordance with the standards of the Public Company Accounting Oversight Board (United States). Those standards require that we plan and perform the audit to obtain reasonable assurance about whether the financial statements and financial highlights are free of material misstatement. We were not engaged to perform an audit of the Funds’ internal control over financial reporting. Our audits included consideration of internal control over financial reporting as a basis for designing audit procedures that are appropriate in the circumstances, but not for the purpose of expressing an opinion on the effectiveness of the Funds’ internal control over financial reporting. Accordingly, we express no such opinion. An audit also includes examining, on a test basis, evidence supporting the amounts and disclosures in the financial statements and financial highlights, assessing the accounting principles used and significant estimates made by management, and evaluating the overall financial statement presentation. Our procedures included confirmation of securities owned as of September 30, 2008, by correspondence with the custodian and brokers or by other appropriate auditing procedures where replies from brokers were not received. We believe that our audits provide a reasonable basis for our opinion.
In our opinion, the financial statements and financial highlights referred to above present fairly, in all material respects, the financial position of the aforementioned four Funds of Morgan Stanley Institutional Fund Trust at September 30, 2008, the results of their operations, the changes in their net assets, and the financial highlights for each of the periods indicated above, in conformity with U.S. generally accepted accounting principles.

Boston, Massachusetts
November 21, 2008
44
| 2008 Annual Report |
| |
| September 30, 2008 |
Federal Income Tax Information: (unaudited)
For Federal income tax purposes, the following information is furnished with respect to the distributions paid by each applicable Portfolio during the taxable year ended September 30, 2008.
For corporate shareholders, the following percentages of dividends paid by each Portfolio qualified for the dividends received deduction. Additionally, the following percentages of each Portfolio’s dividends was attributable to qualifying U.S. Government obligations. (Please consult your tax advisor to determine if any portion of the dividends you received is exempt from state income taxes.):
Portfolio | | Div. Received
Deduction % | | Qualifying U.S.
Govt. Income % |
Advisory | | —% | | 10.8% |
Advisory II | | — | | 0.7 |
Advisory III | | — | | — |
Advisory IV | | — | | 35.0 |
In January, each applicable Portfolio provides tax information to shareholders for the preceding calendar year.
45
2008 Annual Report | |
| |
September 30, 2008 | |
U.S. Privacy Policy (unaudited)
An Important Notice Concerning Our U.S. Privacy Policy
Morgan Stanley Institutional Fund Trust (collectively, the “Fund”) is required by federal law to provide you with a copy of their Privacy Policy (“the Policy”) annually.
This Policy applies to individual clients who are current and former advisory clients of certain Morgan Stanley Investment Management’s U.S. investment advisers and to current and former individual investors in the Fund. This Policy is not applicable to partnerships, corporations, trusts or other non-individual clients or account holders, nor is this Policy applicable to individuals who are either beneficiaries of a trust for which we serve as trustee or participants in an employee benefit plan administered or advised by us. This Policy is, however, applicable to individuals who select us to be a custodian of securities or assets in individual retirement accounts, 401(k) accounts, or accounts subject to the Uniform Gifts to Minors Act.
Please note that we may amend this Policy at any time, and will inform you of any changes to this Policy as required by law.
We Respect Your Privacy
We appreciate that you have provided us with your personal financial information and understand your concerns about safeguarding such information. We strive to maintain the privacy of such information while we help you achieve your financial objectives.
This Policy describes what nonpublic personal information we collect about you, how we collect it, when we may share it with others, and how others may use it. It discusses the steps you may take to limit our sharing of information about you with affiliated Morgan Stanley companies (“other Morgan Stanley companies”), including but not limited to our global financial services affiliates that are part of our integrated securities and investment management business, and our credit services affiliates. It also discloses how you may limit our affiliates’ use of shared information for marketing purposes.
Throughout this Policy, we refer to the nonpublic information that personally identifies you or your accounts as “personal information.”
1. What Personal Information Do We Collect About You?
To better serve you and manage our business, it is important that we collect and maintain accurate information about you. We obtain this information from applications and other forms you submit to us, from your dealings with us, from consumer reporting agencies and from third parties and other sources. For example:
· We collect information such as your name, address, e-mail address, phone number and account title.
· We may obtain information about account balances, your use of account(s) and the types of products and services you prefer to receive from us through your dealings and transactions with us and other sources.
· We may obtain information about your creditworthiness and credit history from consumer reporting agencies.
· We may collect background information from and through third-party vendors to verify representations you have made and to comply with various regulatory requirements.
2. When Do We Disclose Personal Information We Collect About You?
To provide you with the products and services you request, to better serve you, to manage our business and as otherwise required or permitted by law, we may disclose personal information we collect about you to other Morgan Stanley companies and to nonaffiliated third parties.
a. Information we disclose to other Morgan Stanley companies
In order to manage your account(s) effectively, including servicing and processing your transactions, to let you know about products and services offered by us and other Morgan Stanley companies, to manage our business, and as otherwise required or permitted by law, we may disclose personal information to other Morgan Stanley companies. Offers for products and services from other Morgan Stanley companies are developed under conditions designed to safeguard your personal information.
46
| 2008 Annual Report |
| |
| September 30, 2008 |
U.S. Privacy Policy (cont’d)
b. Information we discloses to third parties:
We do not disclose personal information that we collect about you to nonaffiliated third parties except to enable them to provide marketing services on our behalf, to perform joint marketing agreements with other financial institutions, and as otherwise required or permitted by law. For example, some instances where we may disclose information about you to third parties include: for servicing and processing transactions, to offer our own products and services, to protect against fraud, for institutional risk control, to respond to judicial process or to perform services on our behalf.
Morgan Stanley recognizes that your relationship with your Financial Advisor is important. If your Financial Advisor’s affiliation with Morgan Stanley ends and he/she joins a nonaffiliated securities broker-dealer with which Morgan Stanley has entered into an agreement limiting the use of information, Morgan Stanley will permit your Financial Advisor to retain certain of your contact information, limited to your name, address, e-mail address, phone number and account title.
When we share personal information with a nonaffiliated third party, they are required to limit their use of personal information to the particular purpose for which it was shared and they are not allowed to share personal information with others except to fulfill that limited purpose.
3. How Do We Protect The Security And Confidentiality Of Personal Information We Collect About You?
We maintain physical, electronic and procedural security measures to help safeguard the personal information we collect about you. We have internal policies governing the proper handling of client information. Third parties that provide support or marketing services on our behalf may also receive personal information, and we require them to adhere to confidentiality standards with respect to such information.
4. How Can You Limit The Sharing Of Certain Types Of Personal Information With Other Morgan Stanley Companies?
We respect your privacy and offer you choices as to whether we share with other Morgan Stanley companies personal information that was collected to determine your eligibility for products and services you request (“eligibility information”). Please note that, even if you direct us not to share eligibility information with other Morgan Stanley companies (“opt-out”), we may still share personal information, including eligibility information, with those companies in circumstances excluded from the opt-out under applicable law, such as to process transactions or to service your account. We may also share certain other types of personal information with other Morgan Stanley companies—such as your name, address, telephone number, e-mail address and account number(s), and information about your transactions and experiences with us.
5. How Can You Limit The Use Of Certain Types Of Personal Information By Other Morgan Stanley Companies For Marketing?
You may limit other Morgan Stanley companies from marketing their products or services to you based on your personal information that they receive from other Morgan Stanley companies. This information includes your income, assets and account history. Your choice to limit marketing offers from other Morgan Stanley companies will apply until you tell us to change your choice.
If you wish to opt-out of sharing and to limit marketing offers, you may do so by:
· Calling us at (800) 548-7786
Monday–Friday between 8 a.m. and 5 p.m. (ET)
· Writing to us at the following address:
Morgan Stanley Institutional Fund Trust
c/o Morgan Stanley Services Company, Inc.
PO Box 219804
Kansas City, MO 64121-9804
If you choose to write to us, your written request should include your name, address, telephone number and account number(s) to which the opt-out applies and should not be sent with any other correspondence. In order to process your request, we require that the request be provided by you directly and not through a third party.
47
2008 Annual Report | |
| |
September 30, 2008 | |
U.S. Privacy Policy (cont’d)
If you have previously notified us about your privacy preferences, it is not necessary to do so again unless you decide to change your preferences. Your opt-out preference will remain in effect with respect to this Policy (as it may be amended) until you notify us otherwise in writing. If you have a joint account, your direction for us not to share this information with other Morgan Stanley companies and for those Morgan Stanley companies not to use your personal information for marketing will be applied to all account holders on that account.
Please understand that if you opt-out, you and any joint account holders may not receive information about Morgan Stanley products and services that could help you manage your financial resources and achieve your investment objectives.
If you hold more than one account with Morgan Stanley, you may receive multiple privacy policies from us, and would need to follow the directions stated in each particular policy for each account you have with us.
SPECIAL NOTICE TO RESIDENTS OF VERMONT This section supplements our Policy with respect to our individual clients who have a Vermont address and supersedes anything to the contrary in the above Policy with respect to those clients only. The State of Vermont requires financial institutions to obtain your consent prior to sharing personal information that they collect about you with affiliated companies and nonaffiliated third parties other than in certain limited circumstances. Except as permitted by law, we will not share personal information we collect about you with nonaffiliated third parties or other Morgan Stanley companies unless you provide us with your written consent to share such information (“opt-in”). If you wish to receive offers for investment products and services offered by or through other Morgan Stanley companies, please notify us in writing at the following address: Morgan Stanley Institutional Fund Trust
c/o Morgan Stanley Services Company, Inc.
PO Box 219804
Kansas City, MO 64121-9804 Your authorization should include your name, address, telephone number and account number(s) to which the opt-in applies and should not be sent with any other correspondence. In order to process your authorization, we require that the authorization be provided by you directly and not through a third-party. |
© 2008 Morgan Stanley Institutional Fund Trust
48
| 2008 Annual Report |
| |
| September 30, 2008 |
Trustee and Officer Information (unaudited)
Independent Trustees:
Name, Age and Address of
Independent Trustee | | Position(s)
Held with
Registrant | | Length of Time
Served* | | Principal Occupation(s) During Past 5 Years | | Number of
Portfolios in
Fund Complex
Overseen by
Independent
Trustee** | | Other Directorships
Held by Trustees |
Frank L. Bowman (63)
c/o Kramer Levin Naftalis &
Frankel LLP
Counsel to the Independent
Trustees
1177 Avenue of the Americas
New York, NY 10036 | | Trustee | | Since
August
2006 | | President and Chief Executive Officer, Nuclear Energy Institute (policy organization) (since February 2005); Director or Trustee of various Retail Funds and Institutional Funds (since August 2006); Chairperson of the Insurance Sub-Committee of the Insurance, Valuation and Compliance Committee (since February 2007); formerly, variously, Admiral in the U.S. Navy, Director of Naval Nuclear Propulsion Program and Deputy Administrator — Naval Reactors in the National Nuclear Security Administration at the U.S. Department of Energy (1996-2004). Honorary Knight Commander of the Most Excellent Order of the British Empire. | | 180 | | Director of the National Energy Foundation, the U.S. Energy Association, the American Council for Capital Formation and the Armed Services YMCA of the USA. |
| | | | | | | | | | |
Michael Bozic (67)
c/o Kramer Levin Naftalis &
Frankel LLP
Counsel to the Independent
Directors
1177 Avenue of the Americas
New York, NY 10036 | | Trustee | | Since
April
1994 | | Private Investor; Chairperson of the Insurance, Valuation and Compliance Committee (since October 2006); Director or Trustee of the Retail Funds (since April 1994) and Institutional Funds (since July 2003); formerly, Chairperson of the Insurance Committee (July 2006-September 2006), Vice Chairman of Kmart Corporation (December 1998-October 2000), Chairman and Chief Executive Officer of Levitz Furniture Corporation (November 1995-November 1998) and President and Chief Executive Officer of Hills Department Stores (May 1991-July 1995); variously Chairman, Chief Executive Officer, President and Chief Operating Officer (1987-1991) of the Sears Merchandise Group of Sears Roebuck & Co. | | 182 | | Director of various business organizations. |
| | | | | | | | | | |
Kathleen A. Dennis (55)
c/o Kramer Levin Naftalis &
Frankel LLP
Counsel to the Independent
Directors
1177 Avenue of the Americas
New York, NY 10036 | | Trustee | | Since
August
2006 | | President, Cedarwood Associates (mutual fund and investment management) (since July 2006); Chairperson of the Money Market and Alternatives Sub-Committee of the Investment Committee (since October 2006) and Director or Trustee of various Retail Funds and Institutional Funds (since August 2006); formerly, Senior Managing Director of Victory Capital Management (1993-2006). | | 180 | | Director of various non- profit organizations. |
| | | | | | | | | | |
Dr. Manuel H. Johnson (59)
c/o Johnson Smick
Group, Inc.
888 16th Street, N.W.
Suite 740
Washington, D.C. 20006 | | Trustee | | Since
July
1991 | | Senior Partner, Johnson Smick International, Inc. (consulting firm); Chairperson of the Investment Committee (since October 2006) and Director or Trustee of the Retail Funds (since July 1991) and Institutional Funds (since July 2003); Co-Chairman and a founder of the Group of Seven Council (G7C) (international economic commission); formerly, Chairperson of the Audit Committee (July 1991-September 2006); Vice Chairman of the Board of Governors of the Federal Reserve System and Assistant Secretary of the U.S. Treasury. | | 182 | | Director of NVR, Inc. (home construction); Director of Evergreen Energy. |
| | | | | | | | | | |
Joseph J. Kearns (66)
c/o Kearns & Associates LLC
PMB754
23852 Pacific Coast Highway
Malibu, CA 90265 | | Trustee | | Since
August
1994 | | President, Kearns & Associates LLC (investment consulting); Chairperson of the Audit Committee (since October 2006) and Director or Trustee of the Retail Funds (since July 2003) and the Institutional Funds (since August 1994); formerly Deputy Chairperson of the Audit Committee (July 2003-September 2006) and Chairperson of the Audit Committee of the Institutional Funds (October 2001- July 2003); CFO of the J. Paul Getty Trust. | | 183 | | Director of Electro Rent Corporation (equipment leasing) and The Ford Family Foundation. |
49
2008 Annual Report | |
| |
September 30, 2008 | |
Trustee and Officer Information (cont’d)
Independent Trustees:
Name, Age and Address of
Independent Trustee | | Position(s)
Held with
Registrant | | Length of Time
Served* | | Principal Occupation(s) During Past 5 Years | | Number of
Portfolios in
Fund Complex
Overseen by
Independent Trustee** | | Other Directorships
Held by Independent
Trustees |
Michael F. Klein (49)
c/o Kramer Levin Naftalis &
Frankel LLP
Counsel to the
Independent Directors
1177 Avenue of the Americas
New York, NY 10036 | | Trustee | | Since
August
2006 | | Managing Director, Aetos Capital, LLC (since March 2000) and Co-President, Aetos Alternatives Management, LLC (since January 2004); Chairperson of the Fixed Income Sub-Committee of the Investment Committee (since October 2006) and Director or Trustee of various Retail Funds and Institutional Funds (since August 2006); formerly, Managing Director, Morgan Stanley & Co., Inc. and Morgan Stanley Dean Witter Investment Management, President, Morgan Stanley Institutional Funds (June 1998-March 2000) and Principal, Morgan Stanley & Co., Inc. and Morgan Stanley Dean Witter Investment Management (August 1997-December 1999). | | 180 | | Director of certain investment funds managed or sponsored by Aetos Capital LLC; Director of Sanitized AG and Sanitized Marketing AG (specialty chemicals). |
| | | | | | | | | | |
Michael E. Nugent (72)
c/o Triumph Capital, L.P.
445 Park Avenue
New York, NY 10022 | | Chairperson
of the
Board and
Trustee | | Chairperson of
the Boards since
July 2006 and
Trustee since July 1991 | | General Partner of Triumph Capital, L.P. (private investment partnership); Chairman of the Boards of the Retail Funds and Institutional Funds (since July 2006); Director or Trustee of the Retail Funds (since July 1991) and Institutional Funds (since July 2001); formerly, Chairperson of the Insurance Committee (until July 2006). | | 182 | | None. |
| | | | | | | | | | |
W. Allen Reed (61)
c/o Kramer Levin Naftalis &
Frankel LLP
Counsel to the
Independent Directors
1177 Avenue of the Americas
New York, NY 10036 | | Trustee | | Since
August
2006 | | Chairperson of the Equity Sub-Committee of the Investment Committee (since October 2006) and Director or Trustee of various Retail and Institutional Funds (since August 2006); formerly, President and CEO of General Motors Asset Management; Chairman and Chief Executive Officer of the GM Trust Bank and Corporate Vice President of General Motors Corporation (July 1994-December 2005). | | 180 | | Director of Temple- Inland Industries (packaging and forest products); Director of Legg Mason, Inc. and Director of the Auburn University Foundation. |
| | | | | | | | | | |
Fergus Reid (76)
c/o Lumelite Plastics
Corporation
85 Charles Coleman Blvd.
Pawling, NY 12564 | | Trustee | | Since
June
1992 | | Chairman of Lumelite Plastics Corporation; Chairperson of the Governance Committee and Director or Trustee of the Retail Funds (since July 2003) and Institutional Funds (since June 1992). | | 183 | | Trustee and Director of certain investment companies in the JPMorgan Funds complex managed by JPMorgan Investment Management Inc. |
Interested Trustees:
Name, Age and Address of
Interested Trustee | | Position(s) Held
with Registrant | | Term of Office
and Length of
Time Served* | | Principal Occupation(s) During Past 5 Years | | Number of
Portfolios in
Fund Complex
Overseen by
Interested
Trustee** | | Other Directorships
Held by Interested
Trustee |
James F. Higgins (60)
c/o Morgan Stanley Trust
Harborside Financial Center
Plaza Two
Jersey City, NJ 07311 | | Trustee | | Since
June
2000 | | Director or Trustee of the Retail Funds (since June 2000) and Institutional Funds (since July 2003); Senior Advisor of Morgan Stanley (since August 2000). | | 181 | | Director of AXA Financial, Inc. and The Equitable Life Assurance Society of the United States (financial services). |
| | | | | | | | | | |
* | | This is the earliest date the Trustees began serving the Retail Funds or Institutional Funds. Each Trustee serves an indefinite term, until his or her successor is elected. |
| | |
** | | The Fund Complex includes all funds advised by Morgan Stanley Investments LP (“MSI”) that have an investment advisor that is an affiliated entity of MSI (including but not limited to, Morgan Stanley Investment Management Inc. (“MSIM”), Morgan Stanley Investment Advisors Inc. (“MSIA”) and Morgan Stanley AIP GP LP). The Retail Funds are those funds advised by MSIA. The Institutional Funds are certain U.S. registered funds advised by MSI, MSIM and Morgan Stanley AIP GP LP. |
Additional information about the Fund’s Trustees can be found in the Fund’s Statement of Additional Information (SAI). The SAI may be obtained without charge upon request, by calling the Fund at 1-800-548-7786. You may also retrieve this information on-line at the Securities and Exchange Commission’s website at “http://www.sec.gov”. To aid you in obtaining this information on-line., the Fund’s Central Index Key (CIK) number is 0000741375 and the SAI is found within form type 485BPOS.
50
| 2008 Annual Report |
| |
| September 30, 2008 |
Trustee and Officer Information (cont’d)
Executive Officers:
Name, Age and Address of Executive Officer | | Position(s) Held
with
Registrant | | Term of Office
and Length of
Time Served* | | Principal Occupation(s) During Past 5 Years |
Randy Takian (34)
Morgan Stanley Investment Management Inc.
522 Fifth Avenue
New York, NY 10036 | | President and
Principal
Executive
Officer | | Since
September
2008 | | President and Principal Executive Officer (since September 2008) of funds in the Fund Complex; President and Chief Executive Officer of Morgan Stanley Services Company Inc. (since September 2008). President of Morgan Stanley Investment Advisors Inc. (since July 2008). Head of the Retail and Intermediary business within Morgan Stanley Investment Management (since July 2008). Head of Liquidity and Bank Trust business (since July 2008) and the Latin American franchise (since July 2008) at Morgan Stanley Investment Management. Managing Director, Director and/or Officer of the Adviser and various entities affiliated with the Adviser. Formerly, Head of Strategy and Product Development for the Alternatives Group and Senior Loan Investment Management. Formerly with Bank of America (July 1996-March 2006), most recently as Head of the Strategy, Mergers and Acquisitions team for Global Wealth and Investment Management. |
| | | | | | |
Kevin Klingert (46)
Morgan Stanley Investment Management Inc.
522 Fifth Avenue
New York, NY 10036 | | Vice President | | Since June
2008 | | Chief Operating Officer of the Global Fixed Income Group of the Adviser and Morgan Stanley Investment Advisors Inc. (since March 2008). Head of Global Liquidity Portfolio Management and co-Head of Liquidity Credit Research of Morgan Stanley Investment Management (since December 2007). Managing Director of the Adviser and Morgan Stanley Investment Advisors Inc. (since December 2007). Previously, Managing Director on the Management Committee and head of Municipal Portfolio Management and Liquidity at BlackRock (October 1991 to January 2007). |
| | | | | | |
Dennis F. Shea (55)
Morgan Stanley Investment Management Inc.
522 Fifth Avenue
New York, NY 10036 | | Vice President | | Since
February
2006 | | Managing Director and (since February 2006) Chief Investment Officer—Global Equity of Morgan Stanley Investment Management; Vice President of the Retail Funds and Institutional Funds (since February 2006). Formerly, Managing Director and Director of Global Equity Research at Morgan Stanley. |
| | | | | | |
Amy R. Doberman (46)
Morgan Stanley Investment Management Inc.
522 Fifth Avenue
New York, NY 10036 | | Vice President | | Since
July
2004 | | Managing Director and General Counsel, U.S. Investment Management of Morgan Stanley Investment Management (since July 2004); Vice President of the Retail Funds and Institutional Funds (since July 2004); Vice President of the Van Kampen Funds (since August 2004); Secretary (since February 2006) and Managing Director (since July 2004) of the Adviser and various entities affiliated with the Adviser. Formerly, Managing Director and General Counsel — Americas, UBS Global Asset Management (July 2000-July 2004). |
| | | | | | |
Carsten Otto (44)
Morgan Stanley Investment Management Inc.
522 Fifth Avenue
New York, NY 10036 | | Chief Compliance Officer | | Since
October
2004 | | Managing Director and Global Head of Compliance for Morgan Stanley Investment Management (since April 2007) and Chief Compliance Officer of the Retail Funds and Institutional Funds (since October 2004). Formerly, U.S. Director of Compliance (October 2004 - April 2007) and Assistant Secretary and Assistant General Counsel of the Retail Funds. |
| | | | | | |
Stefanie V. Chang Yu (41)
Morgan Stanley Investment Management Inc.
522 Fifth Avenue
New York, NY 10036 | | Vice President | | Since
December
1997 | | Managing Director of the Adviser and various entities affiliated with the Adviser; Vice President of the Retail Funds (since July 2002) and Institutional Funds (since December 1997). Formerly, Secretary of various entities affiliated with the Adviser. |
| | | | | | |
Mary E. Mullin (41)
Morgan Stanley Investment Management Inc.
522 Fifth Avenue
New York, NY 10036 | | Secretary | | Since
June
1999 | | Executive Director of the Adviser and various entities affiliated with the Adviser; Secretary of the Retail Funds (since July 2003) and Institutional Funds (since June 1999). |
| | | | | | |
James W. Garrett (39)
Morgan Stanley Investment Management Inc.
522 Fifth Avenue
New York, NY 10036 | | Treasurer and
Chief Financial
Officer | | Treasurer
since February
2002 and
Chief Financial
Officer since
July 2003 | | Head of Global Fund Administration; Managing Director of the Adviser and various entities affiliated with the Adviser; Treasurer and Chief Financial Officer of the Institutional Funds. |
| | | | | | |
* This is the earliest date the Officer began serving the Retail Funds or Institutional Funds. Each Officer serves an indefinite term, until his or her successor is elected.
51
2008 Annual Report | |
| |
September 30, 2008 | |
Investment Adviser and Administrator
Morgan Stanley Investment Management Inc.
522 Fifth Avenue
New York, NY 10036
Distributor
Morgan Stanley Distribution, Inc.
One Tower Bridge Road
100 Front Street, Suite 1100
West Conshohocken, PA 19428-2899
Dividend Disbursing and Transfer Agent
Morgan Stanley Services Company, Inc.
P.O. Box 219804
Kansas City, MO 64121-9804
Custodian
JPMorgan Chase Bank, N.A.
270 Park Avenue
New York, NY 10017
Legal Counsel
Clifford Chance US LLP
31 West 52nd Street
New York, NY 10019-6131
Independent Registered Public Accounting Firm
Ernst & Young LLP
200 Clarendon Street
Boston, MA 02116-5072
Reporting to Shareholders
Each Morgan Stanley Fund provides a complete schedule of portfolio holdings in its semi-annual and annual reports within 60 days of the end of the Fund’s second and fourth fiscal quarters. The semi-annual reports and the annual reports are filed electronically with the Securities and Exchange Commission (SEC) on Form N-CSRS and Form N-CSR, respectively. Morgan Stanley also delivers the semi-annual and annual reports to Fund shareholders and makes these reports available on its public website, www.morganstanley.com. Each Morgan Stanley Fund also files a complete schedule of portfolio holdings with the SEC for the Fund’s first and third fiscal quarters on Form N-Q. Morgan Stanley does not deliver the reports for the first and third fiscal quarters to shareholders, nor are the reports posted to the Morgan Stanley public website. You may, however, obtain the Form N-Q filings (as well as the Form N-CSR and N-CSRS filings) by accessing the SEC’s website, www.sec.gov. You may also review and copy them at the SEC’s public reference room in Washington, DC. Information on the operation of the SEC’s Public Reference Room may be obtained by calling the SEC at 1(800) SEC-0330. You can also request copies of these materials, upon payment of a duplicating fee, by electronic request at the SEC’s email address (publicinfo@sec.gov) or by writing the Public Reference section of the SEC, Washington, DC 20549-0102.
Proxy Voting Policies and Procedures and Proxy Voting Record
You may obtain a copy of the Fund’s Proxy Voting Policy and Procedures and information regarding how the Fund voted proxies relating to portfolio securities during the most recent twelve-month period ended June 30, without charge, upon request, by calling 1(800) 548-7786 or by visiting our website at www.morganstanley.com. This information is also available on the SEC’s website at www.sec.gov.
This report is authorized for distribution only when preceded or accompanied by a prospectus of the Morgan Stanley Institutional Fund Trust which describes in detail each Investment Portfolio’s investment policies, risks, fees and expenses. Please read the prospectus carefully before you invest or send money. For additional information, including information regarding the investments comprising the Portfolio, please visit our website at www.morganstanley.com or call 1 (800) 548-7786
52
Printed in U.S.A.
This Report has been prepared for shareholders and may be distributed to
others only if preceded or accompanied by a current prospectus.
Morgan Stanley Investment Management Inc.
522 Fifth Avenue
New York, NY 10036
Investment Adviser: (610) 940-5000 · MSIF Trust (800) 548-7786
© 2008 Morgan Stanley

| |
| |
| IFTAPANN
IU08-05675P-N09/08 |
Morgan Stanley Investment Management

| Morgan Stanley
Institutional Fund Trust |
| | |
| Balanced Portfolio | |
| Balanced | |
| | |
| Equity Portfolios | |
| Mid Cap Growth | U.S. Small Cap Value |
| U.S. Mid Cap Value | Value |
| | |
| Fixed Income Portfolios | |
| Core Fixed Income | Investment Grade Fixed Income |
| Core Plus Fixed Income | Limited Duration |
| High Yield | Long Duration Fixed Income |
| Intermediate Duration | Municipal |
| International Fixed Income | |
| | |
| | |
| September 30, 2008 | |
| | |
| | |
| Annual Report |
| 2008 Annual Report |
| |
| September 30, 2008 |
Table of Contents
Shareholder’s Letter | | 3 |
Expense Examples | | 4 |
Investment Advisory Agreement Approval | | 6 |
Investment Overviews & Portfolios of Investments Balanced Portfolio: | | |
Balanced | | 10 |
Equity Portfolios: | | |
Mid Cap Growth | | 19 |
U.S. Mid Cap Value | | 22 |
U.S. Small Cap Value | | 25 |
Value | | 29 |
Fixed Income Portfolios: | | |
Core Fixed Income | | 33 |
Core Plus Fixed Income | | 44 |
High Yield | | 57 |
Intermediate Duration | | 65 |
International Fixed Income | | 76 |
Investment Grade Fixed Income | | 82 |
Limited Duration | | 93 |
Long Duration Fixed Income | | 102 |
Municipal | | 110 |
Statements of Assets and Liabilities | | 124 |
Statements of Operations | | 132 |
Statements of Changes in Net Assets | | 135 |
Financial Highlights | | 145 |
Notes to Financial Statements | | 167 |
Report of Independent Registered Public Accounting Firm | | 177 |
Federal Income Tax Information | | 178 |
U.S. Privacy Policy | | 179 |
Trustee and Officer Information | | 182 |
This report is authorized for distribution only when preceded or accompanied by prospectuses of the Morgan Stanley Institutional Fund Trust. To receive a prospectus and/or SAI, which contains more complete information such as investment objectives, charges, expenses, policies for voting proxies, risk considerations, and describes in detail each of the Portfolio’s investment policies to the prospective investor, please call 1 (800) 548-7786. Please read the prospectuses carefully before you invest or send money.
Additionally, you can access portfolio information including performance, characteristics, and investment team commentary through Morgan Stanley Investment Management’s website: www.morganstanley.com/msim.
Market forecasts provided in this report may not necessarily come to pass. There is no guarantee that any sectors mentioned will continue to perform as discussed herein or that securities in such sectors will be held by the Portfolio in the future. There is no assurance that a Portfolio will achieve its investment objective. Portfolios are subject to market risk, which is the possibility that market values of securities owned by the Portfolio will decline and, therefore, the value of the Portfolio’s shares may be less than what you paid for them. Accordingly, you can lose money investing in Portfolios. Please see the prospectus for more complete information on investment risks.
1
(This Page has been left blank intentionally.)
2
| 2008 Annual Report |
| |
| September 30, 2008 |
Shareholder’s Letter
Dear Shareholders:
We are pleased to present to you the Morgan Stanley Institutional Fund Trust’s (the “Fund”) Annual Report for the year ended September 30, 2008. Our Fund currently consists of 18 portfolios. The Fund’s portfolios, together with the portfolios of the Morgan Stanley Institutional Fund, Inc., provide investors with a means to help them meet specific investment needs and to allocate their investments among equities (e.g., value and growth; small, medium, and large capitalization) and fixed income (e.g., short, medium, and long duration; investment grade and high yield).
Sincerely,

Randy Takian
President and Principal Executive Officer
October 2008
3
2008 Annual Report |
|
September 30, 2008 |
Expense Examples (unaudited)
Expense Examples
As a shareholder of a Portfolio, you may incur two types of costs: (1) transactional costs, including sales charge (loads) on purchase payments, if applicable, and redemption fees; and (2) ongoing costs, including management fees, distribution and shareholder servicing fees (in the case of Investment Class, Class P, Class H and Class L); and other Portfolio expenses. These examples are intended to help you understand your ongoing costs (in dollars) of investing in a Portfolio and to compare these costs with the ongoing costs of investing in other mutual funds.
The examples are based on an investment of $1,000 invested at the beginning of the six-month period ended September 30, 2008 and held for the entire six-month period.
Actual Expenses
The table below provides information about actual account values and actual expenses. You may use the information in this table, together with the amount you invested, to estimate the expenses that you paid over the period. Simply divide your account value by $1,000 (for example, an $8,600 account value divided by $1,000 = 8.6), then multiply the result by the number in the table under the heading entitled “Actual Expenses Paid During Period” to estimate the expenses you paid on your account during this period.
Please note that the Class L shares of International Fixed Income, Investment Grade Fixed Income and Municipal Portfolios commenced operations on June 16, 2008, however, expenses did not begin accruing until June 17, 2008; therefore, “Actual Expenses Paid During Period” reflect activity from June 17, 2008 through September 30, 2008.
Please note that “Actual Expenses Paid During Period” are grossed up to reflect Portfolio expenses prior to the effect of Expense Offset (See Note F in the Notes to Financial Statements). Therefore, the annualized net expense ratios may differ from the ratio of expenses to average net assets shown in the Financial Highlights.
Hypothetical Example for Comparison Purposes
The table below provides information about hypothetical account values and hypothetical expenses based on the Portfolio’s actual expense ratio and an assumed rate of return of 5% per year before expenses, which is not the Portfolio’s actual return. The hypothetical account values and expenses may not be used to estimate the actual ending account balance or expenses you paid for the period. You may use this information to compare the ongoing costs of investing in the Portfolio and other funds. To do so, compare this 5% hypothetical example with the 5% hypothetical examples that appear in the shareholder reports of the other funds.
Please note that while the Class L shares of International Fixed Income, Investment Grade Fixed Income and Municipal Portfolios commenced operations on June 16, 2008, the “Hypothetical Expenses Paid During the Period” reflect projected activity for the full six month period for the purposes of comparability. This projection assumes that the annualized expense ratio for the Class L shares was in effect during the period from April 1, 2008 through September 30, 2008.
Please note that the expenses shown in the table are meant to highlight your ongoing costs only and do not reflect any transactional costs, such as sales charges load, if applicable, and redemption fees. Therefore, the hypothetical account values and hypothetical expenses are useful in comparing ongoing costs only, and will not help you determine the relative total costs of owning different funds. In addition, if these transactional costs were included, your costs would have been higher.
4
| 2008 Annual Report |
| |
| September 30, 2008 |
Expense Examples (cont’d)
| | | | | | | | Actual | | | | Net | |
| | | | Actual Ending | | | | Expenses | | | | Expense | |
| | Beginning | | Account | | Hypothetical | | Paid | | Hypothetical | | Ratio | |
| | Account | | Value | | Ending Account | | During | | Expenses Paid | | During | |
| | Value 4/1/08 | | 9/30/08 | | Value | | Period* | | During Period* | | Period | |
Balanced Class I | | $1,000.00 | | $876.20 | | $1,022.10 | | $ | 2.72 | | $ | 2.93 | | 0.58 | % |
Balanced Investment Class | | 1,000.00 | | 875.40 | | 1,020.70 | | | 4.03 | | | 4.34 | | 0.86 | |
Balanced Class P | | 1,000.00 | | 874.90 | | 1,020.15 | | | 4.55 | | | 4.90 | | 0.97 | |
Mid Cap Growth Class I | | 1,000.00 | | 819.90 | | 1,021.85 | | | 2.87 | | | 3.18 | | 0.63 | |
Mid Cap Growth Class P | | 1,000.00 | | 818.70 | | 1,020.60 | | | 4.00 | | | 4.45 | | 0.88 | |
U.S. Mid Cap Value Class I | | 1,000.00 | | 914.60 | | 1,020.50 | | | 4.31 | | | 4.55 | | 0.90 | |
U.S. Mid Cap Value Investment Class | | 1,000.00 | | 914.10 | | 1,019.85 | | | 4.93 | | | 5.20 | | 1.03 | |
U.S. Mid Cap Value Class P | | 1,000.00 | | 913.50 | | 1,019.25 | | | 5.50 | | | 5.81 | | 1.15 | |
U.S. Small Cap Value Class I | | 1,000.00 | | 967.60 | | 1,021.05 | | | 3.89 | | | 3.99 | | 0.79 | |
U.S. Small Cap Value Class P | | 1,000.00 | | 966.00 | | 1,019.80 | | | 5.11 | | | 5.25 | | 1.04 | |
Value Class I | | 1,000.00 | | 915.90 | | 1,021.65 | | | 3.21 | | | 3.39 | | 0.67 | |
Value Class P | | 1,000.00 | | 915.80 | | 1,020.45 | | | 4.36 | | | 4.60 | | 0.91 | |
Core Fixed Income Class I | | 1,000.00 | | 917.50 | | 1,022.55 | | | 2.35 | | | 2.48 | | 0.49 | |
Core Fixed Income Class P | | 1,000.00 | | 915.90 | | 1,021.30 | | | 3.54 | | | 3.74 | | 0.74 | |
Core Plus Fixed Income Class I | | 1,000.00 | | 899.40 | | 1,022.75 | | | 2.14 | | | 2.28 | | 0.45 | |
Core Plus Fixed Income Investment Class | | 1,000.00 | | 899.60 | | 1,022.00 | | | 2.85 | | | 3.03 | | 0.60 | |
Core Plus Fixed Income Class P | | 1,000.00 | | 899.00 | | 1,021.50 | | | 3.32 | | | 3.54 | | 0.70 | |
High Yield Class I | | 1,000.00 | | 897.20 | | 1,021.65 | | | 3.18 | | | 3.39 | | 0.67 | |
High Yield Class P | | 1,000.00 | | 896.30 | | 1,020.45 | | | 4.31 | | | 4.60 | | 0.91 | |
Intermediate Duration Class I | | 1,000.00 | | 930.90 | | 1,022.30 | | | 2.61 | | | 2.73 | | 0.54 | |
Intermediate Duration Investment Class | | 1,000.00 | | 929.90 | | 1,021.55 | | | 3.33 | | | 3.49 | | 0.69 | |
International Fixed Income Class I | | 1,000.00 | | 907.30 | | 1,022.05 | | | 2.81 | | | 2.98 | | 0.59 | |
International Fixed Income Class P | | 1,000.00 | | 907.90 | | 1,020.80 | | | 4.01 | | | 4.24 | | 0.84 | |
International Fixed Income Class H | | 1,000.00 | | 895.00 | | 1,007.75 | | | 16.34 | | | 17.32 | | 3.45 | |
International Fixed Income Class L | | 1,000.00 | | 970.70 | | 1,019.20 | | | 3.31 | ** | | 5.86 | | 1.16 | |
Investment Grade Fixed Income Class I | | 1,000.00 | | 928.10 | | 1,022.35 | | | 2.55 | | | 2.68 | | 0.53 | |
Investment Grade Fixed Income Class P | | 1,000.00 | | 926.30 | | 1,021.60 | | | 3.27 | | | 3.44 | | 0.68 | |
Investment Grade Fixed Income Class H | | 1,000.00 | | 912.10 | | 1,004.50 | | | 19.60 | | | 20.55 | | 4.10 | |
Investment Grade Fixed Income Class L | | 1,000.00 | | 952.70 | | 1,019.75 | | | 3.00 | ** | | 5.35 | | 1.05 | |
Limited Duration Class I | | 1,000.00 | | 893.20 | | 1,022.85 | | | 2.04 | | | 2.17 | | 0.43 | |
Limited Duration Class P | | 1,000.00 | | 892.10 | | 1,021.60 | | | 3.22 | | | 3.44 | | 0.68 | |
Long Duration Fixed Income Class I | | 1,000.00 | | 946.10 | | 1,022.55 | | | 2.38 | | | 2.48 | | 0.49 | |
Long Duration Fixed Income Class P | | 1,000.00 | | 944.90 | | 1,021.30 | | | 3.60 | | | 3.74 | | 0.74 | |
Municipal Class I | | 1,000.00 | | 948.30 | | 1,022.55 | | | 2.39 | | | 2.48 | | 0.49 | |
Municipal Class P | | 1,000.00 | | 947.20 | | 1,021.30 | | | 3.60 | | | 3.74 | | 0.74 | |
Municipal Class H | | 1,000.00 | | 947.00 | | 1,021.00 | | | 3.89 | | | 4.04 | | 0.80 | |
Municipal Class L | | 1,000.00 | | 947.40 | | 1,019.95 | | | 2.82 | ** | | 5.05 | | 1.00 | |
* Expenses are calculated using each Portfolio Class’ annualized net expense ratio (as disclosed), multiplied by the average account value over the period, and multiplied by 183/366 (to reflect the most recent one-half year period).
** Expenses are calculated using Class L’s annualized net expense ratio (as disclosed), multiplied by the average account value over the period, and multiplied by 106/366 (to reflect actual days in the period).
5
2008 Annual Report | |
| |
September 30, 2008 | |
Investment Advisory Agreement Approval (unaudited)
Nature, Extent and Quality of Services
The Board reviewed and considered the nature and extent of the investment advisory services provided by the Adviser (as defined herein) under the advisory agreement, including portfolio management, investment research and fixed income and equity securities trading. The Board reviewed similar information and factors regarding the Sub-Adviser (as defined herein) to the extent applicable. The Board also reviewed and considered the nature and extent of the non-advisory, administrative services provided by the Adviser under the administration agreement, including accounting, clerical, bookkeeping, compliance, business management and planning, and the provision of supplies, office space and utilities at the Adviser’s expense. (The Adviser, Sub-Adviser and administrator together are referred to as the “Adviser” and the advisory, sub-advisory and administration agreements together are referred to as the “Management Agreement.”) The Board also compared the nature of the services provided by the Adviser with similar services provided by non-affiliated advisers as reported to the Board by Lipper Inc. (“Lipper”).
The Board reviewed and considered the qualifications of the portfolio managers, the senior administrative managers and other key personnel of the Adviser who provide the advisory and administrative services to the Portfolios. The Board determined that the Adviser’s portfolio managers and key personnel are well qualified by education and/or training and experience to perform the services in an efficient and professional manner. The Board concluded that the nature and extent of the advisory and administrative services provided were necessary and appropriate for the conduct of the business and investment activities of each Portfolio. The Board also concluded that the overall quality of the advisory and administrative services provided was satisfactory.
Performance Relative to Comparable Funds Managed by Other Advisers
On a regular basis, the Board reviews the performance of all funds in the Morgan Stanley Fund Complex, including the Portfolios, compared to their peers, paying specific attention to the underperforming funds. In addition, the Board specifically reviewed each Portfolio’s performance for the one-, three- and five-year periods ended December 31, 2007 (except with respect to the Equities Plus and Long Duration Fixed Income Portfolios whereby the Board reviewed the Equities Plus Portfolio’s performance for the one-year period ended December 31, 2007 and the period April 30, 2006 to December 31, 2007; and the Long Duration Fixed Income Portfolio’s performance for the one-year period ended December 31, 2007 and the period July 31, 2006 to December 31, 2007), as shown in reports provided by Lipper (the “Lipper Reports”), compared to the performance of comparable funds selected by Lipper (the “performance peer group”) for each Portfolio. The Board also discussed with the Adviser the performance goals and the actual results achieved in managing each Portfolio. When a fund/portfolio underperforms its performance peer group, the Board discusses with the Adviser the causes of the underperformance and, where necessary, specific changes to the fund’s/portfolio’s investment strategy and/or investment personnel.
With respect to the U.S. Mid Cap Value, High Yield, Balanced, U.S. Small Cap Value, Mid Cap Growth, Core Fixed Income, Core Plus Fixed Income, Intermediate Duration, Investment Grade Fixed Income, International Fixed Income, Long Duration Fixed Income and Municipal Portfolios, the Board concluded that each Portfolio’s performance was competitive with that of its performance peer group.
With respect to the Limited Duration Portfolio, the Board noted that a change in the portfolio management team was implemented effective May 1, 2008. The Board concluded that it would continue to monitor performance.
With respect to the Value Portfolio, the Board concluded that the Portfolio’s performance was acceptable.
With respect to the Equities Plus Portfolio, the Board supported Management’s recommendation to liquidate the Portfolio.
Fees Relative to Other Proprietary Funds Managed by the Adviser with Comparable Investment Strategies
The Board reviewed the advisory and administrative fee (together, the “management fee”) rate paid by each Portfolio under the Management Agreement.
With respect to the Core Fixed Income and Investment Grade Fixed Income Portfolios, the Board noted that the management fee rates were comparable to the management fee rates charged by the Adviser to other proprietary funds it manages with investment strategies comparable to those of the Portfolios.
6
| 2008 Annual Report |
| |
| September 30, 2008 |
Investment Advisory Agreement Approval (cont’d)
With respect to the U.S. Small Cap Value, U.S. Mid Cap Value, High Yield, Core Plus Fixed Income and Limited Duration Portfolios, the Board noted that the management fee rates were comparable to the management fee rates charged by the Adviser to other proprietary funds it manages with investment strategies comparable to those of the Portfolios taking into account the scope of the services provided.
With respect to the Balanced, Equities Plus, Intermediate Duration, Long Duration Fixed Income, Municipal and International Fixed Income Portfolios, the Board noted that the Adviser did not manage any other proprietary funds with investment strategies comparable to those of the Portfolios.
With respect to the Value and Mid Cap Growth Portfolios, the Board noted that the management fee rates were higher than certain management fee rates charged by the Adviser to other proprietary funds that it manages with investment strategies comparable to those of the Portfolios. The Board also noted that each Portfolio’s management fee rate and total expense ratio were lower than the average management fee rate and total expense ratio for funds, selected by Lipper for each Portfolio (the “expense peer group”), managed by other advisers with investment strategies comparable to those of the Portfolios, as shown in the Portfolios’ Lipper Reports.
Fees and Expenses Relative to Comparable Funds Managed by Other Advisers
The Board reviewed the management fee rate and total expense ratio of each Portfolio as compared to the expense peer group. The Board concluded that each Portfolio’s management fee rate and total expense ratio were competitive with those of its expense peer group.
Breakpoints and Economies of Scale
The Board reviewed the structure of each Portfolio’s management fee schedule under the Management Agreement.
With respect to the U.S. Mid Cap Value, Value, U.S. Small Cap Value, Core Plus Fixed Income and High Yield Portfolios, the Board noted that each Portfolio’s management fee schedule includes one or more breakpoints. The Board also reviewed the level of each Portfolio’s management fee and noted that each fee, as a percentage of the Portfolio’s net assets, would decrease as net assets increase because each management fee includes one or more breakpoints. The Board concluded that each Portfolio’s management fee would reflect economies of scale as assets increase.
With respect to the Equities Plus, Intermediate Duration, Long Duration Fixed Income and International Fixed Income Portfolios, the Board noted that the Portfolios’ management fee schedules do not include any breakpoints. The Board considered that the Portfolios’ assets under management were relatively small. The Board concluded that economies of scale for the Portfolios were not a factor that needed to be considered at the present time.
With respect to the Core Fixed Income, Balanced, Mid Cap Growth, Investment Grade Fixed Income and Municipal Portfolios, the Board noted that the Portfolios’ management fee schedules do not include any breakpoints. The Board also reviewed the level of each Portfolio’s management fee and concluded that the fee, compared to the Portfolio’s expense peer group, was sufficiently low, so that, in effect, economies of scale were built into each management fee structure.
With respect to the Limited Duration Portfolio, the Board noted that the Portfolio’s management fee schedule does not include any breakpoints. The Board noted that the Portfolio’s management fee schedule and total expense ratio were competitive with those of its expense peer group and concluded that economies of scale for the Portfolio were not a factor that needed to be considered at the present time.
Profitability of the Adviser and Affiliates
The Board considered information concerning the costs incurred and profits realized by the Adviser and affiliates during the last year from their relationship with each Portfolio and during the last two years from their relationship with the Morgan Stanley Fund Complex and reviewed with the Adviser the cost allocation methodology used to determine the profitability of the Adviser and affiliates. Based on its review of the information it received, the Board concluded that the profits earned by the Adviser and affiliates were not excessive in light of the advisory, administrative and other services provided to the Portfolios.
7
2008 Annual Report | |
| |
September 30, 2008 | |
Investment Advisory Agreement Approval (cont’d)
Fall-Out Benefits
The Board considered so-called “fall-out benefits” derived by the Adviser and affiliates from their relationship with each Portfolio and the Morgan Stanley Fund Complex. The Board considered the “float” benefits derived from handling of checks for purchases and sales of Portfolio shares, through a broker-dealer affiliate of the Adviser. The Board also considered that, from time to time, the Adviser may, directly or indirectly, effect trades on behalf of certain Morgan Stanley Funds through various electronic communications networks or other alternative trading systems in which the Adviser’s affiliates have ownership interests and/or board seats. The Board also considered that a broker-dealer affiliate of the Adviser receives from each Portfolio 12b-1 fees for distribution and shareholder services. The Board concluded that the fall-out benefits were relatively small and the sales charges and 12b-1 fees were competitive with those of other broker-dealers.
With respect to the U.S. Mid Cap Value, Balanced, Value, U.S. Small Cap Value, Mid Cap Growth and Equities Plus Portfolios, the Board considered “soft dollar” benefits (discussed in the next section).
Soft Dollar Benefits
The Board considered whether the Adviser realizes any benefits as a result of brokerage transactions executed through “soft dollar” arrangements. Under such arrangements, brokerage commissions paid by the Portfolios and/or other funds managed by the Adviser would be used to pay for research that a securities broker obtains from third parties, or to pay for both research and execution services from securities brokers who effect transactions for the Portfolios.
With respect to the U.S. Mid Cap Value, Balanced, Value, U.S. Small Cap Value, Mid Cap Growth and Equities Plus Portfolios, the Board recognized that the receipt of such research from brokers may reduce the Adviser’s costs but concluded that the receipt of such research strengthens the investment management resources of the Adviser, which may ultimately benefit the Portfolios and other funds in the Morgan Stanley Fund Complex.
With respect to the Intermediate Duration, Investment Grade Fixed Income, Limited Duration, Long Duration Fixed Income, Municipal, Core Plus Fixed Income, Core Fixed Income, High Yield and International Fixed Income Portfolios, the Board noted that the Portfolios invest only in fixed income securities, which do not generate soft dollars.
Adviser Financially Sound and Financially Capable of Meeting the Portfolios’ Needs
The Board considered whether the Adviser is financially sound and has the resources necessary to perform its obligations under the Management Agreement. The Board concluded that the Adviser has the financial resources necessary to fulfill its obligations under the Management Agreement.
Historical Relationship Between the Portfolios and the Adviser
The Board also reviewed and considered the historical relationship between each Portfolio and the Adviser, including the organizational structure of the Adviser, the policies and procedures formulated and adopted by the Adviser for managing the Portfolios’ operations and the Board’s confidence in the competence and integrity of the senior managers and key personnel of the Adviser. The Board concluded that it is beneficial for each Portfolio to continue its relationship with the Adviser.
Other Factors and Current Trends
The Board considered the controls and procedures adopted and implemented by the Adviser and monitored by the Fund’s Chief Compliance Officer and concluded that the conduct of business by the Adviser indicates a good faith effort on its part to adhere to high ethical standards in the conduct of each Portfolio’s business.
8
| 2008 Annual Report |
| |
| September 30, 2008 |
Investment Advisory Agreement Approval (cont’d)
General Conclusion
After considering and weighing all of the above factors, the Board concluded that it would be in the best interest of each Portfolio and its shareholders to approve renewal of the Management Agreement for another year. With regard to the Equities Plus Portfolio, the Board supported Management’s recommendation to liquidate the Portfolio.
9
2008 Annual Report | |
| |
September 30, 2008 | |
Investment Overview (unaudited)
Balanced Portfolio
The Balanced Portfolio seeks above-average total return over a market cycle of three to five years. The Portfolio invests in a mix of equity and fixed income securities. The Portfolio normally invests 45 to 75% of its assets in equity securities and 25 to 55% of its assets in fixed income securities. The Portfolio may invest up to 30% of its assets in securities of foreign issuers, including issuers located in emerging market countries. The securities in which the Portfolio may invest may be denominated in U.S. dollars or in currencies other then U.S. dollars. The Portfolio’s equity securities generally will be common stocks of large corporations with market capitalizations generally greater than $1 billion. The Portfolio’s fixed income investments generally will include mortgage securities and high yield securities (commonly referred to as “junk bonds”). The Portfolio will ordinarily seek to maintain an average weighted maturity in excess of five years, although there is no minimum or maximum maturity for any individual security. The Portfolio may invest up to 10% of its assets in real estate investment trusts (“REITs”). The Portfolio may invest in asset-backed securities and may use futures, options, forwards, “CMOs”, swaps, options on swaps and other derivatives. The Portfolio may invest up to 20% of its assets in public bank loans made by banks or other financial institutions. These public bank loans may be rated investment grade or below investment grade at the time of purchase.
Performance
For the fiscal year ended September 30, 2008, the Portfolio’s Class I had a total return based on net asset value and reinvestment of distributions per share of -17.02%, net of fees. The Portfolio’s Class I outperformed against the S&P 500® Index which returned -21.98% and underperformed against the Lehman Brothers U.S. Aggregate Index which returned 3.65% and the 60/40 Blended Index, a blend of 60% S&P 500® Index and 40% Lehman Brothers U.S. Aggregate Index which returned -12.32%.
Factors Affecting Performance
· The period under review almost directly coincides with the October 9, 2008 market peak and a recent market trough. In the past 12 months, equities struggled amidst rising inflation concerns early in the period and continued credit and housing market problems. Woes in the subprime mortgage market led to the collapse of Bear Stearns in March, marking the first of many major financial institution failures and unprecedented government interventions. Adding to the turmoil were oil prices, which hit a historical high of $146 in July and fueled concerns about rising inflation for the first half of the year. These inflation concerns diminished in August, but signs of rapidly slowing growth in the global economy were evident. In September, worries about the financial markets deepened with the government rescues of mortgage giants Freddie Mac and Fannie Mae and insurer AIG. Turmoil erupted with the bankruptcy of Lehman Brothers, sending credit spreads to historical highs and investors fleeing from equities into government bonds and cash.
· The Portfolio’s asset allocation, consisting of an overweight to equities and an underweight to fixed income, detracted from relative results. An overweight to cash partially offset these losses. Over the past year, global equities suffered under lingering woes from the housing and credit crisis. At the same time, international government bond prices declined due to rising inflation through June 2008, but that trend reversed when the financial crisis intensified in the third quarter of 2008 and allowed bonds to gain from their relative safe-haven status.
· Within equities, the Portfolio’s exposure to Hong Kong and Singapore was unfavorable to returns. Both countries traded lower on poor momentum from China as well as concerns of declining export growth from slowing external demand. In addition, the overweight to emerging markets detracted from results as rising risk aversion and extraordinary volatility in financials markets caused investors to flee from these regions. An underweight in the U.S. was beneficial, as U.S. equities were under pressure from the credit crisis.
· The opportunistic investment in gold through April was favorable. Gold appreciated on the back of the U.S. dollar weakness, inflation worries, and supply concerns.
· Within U.S. equities, sector and stock selection was favorable to returns. The Portfolio’s underweight in financials, energy, telecommunication services, and automobiles and components contributed to results, as these sectors underperformed the overall market. Financial stocks continued to decline as a result of exposure to subprime mortgage assets and high risk aversion to counterparty risk. Energy stocks followed the trajectory of oil prices and fell when the commodity price dropped. Consumer cyclicals (such as automobiles) were pressured by lowered consumer spending as a result of wealth destruction. However, the overweight to health care detracted from results on worries about drug patent expirations in the near future.
10
| 2008 Annual Report |
| |
| September 30, 2008 |
Investment Overview (cont’d)
Balanced Portfolio
· Within fixed income, an overweight in the U.K detracted from returns while an overweight to Australia and Eurobonds contributed positively to relative performance. Global government bond returns were mixed throughout the year on rising inflation concerns and risk aversion as a result of financial turmoil from the credit crisis. The allocation to U.S. core fixed income, with its exposure to non-agency mortgages, was detrimental to performance.
Management Strategies
· In the third quarter, we increased the Portfolio’s exposure to global government bonds, while decreasing its exposure to emerging markets as a result of high market volatility. Overall, the Portfolio remains neutral equities, underweight bonds, and overweight cash relative to the Index.
· Within equities, we are becoming more positive on the U.S. since global growth is drastically slowing, as seen by weak gross domestic product (GDP) numbers in various developed markets. The OECD (Organization of Economic Cooperation and Development) recently revised its global growth estimates and predicted the U.S. will grow at the fastest pace of all G7 nations (Group of Seven industrialized nations) this year. In recent weeks, U.S. government agencies have taken significant actions to help reduce downward risks on the economy. While headwinds to the financial markets are still present, we believe these actions, along with the relative positioning of the U.S. to the rest of the world in the economic cycle, make the U.S. a more attractive market. In addition, the Portfolio maintains an overweight to emerging markets, as we believe these markets are still exhibiting few signs of excesses in their economies and financial markets.
· Within U.S. equities, the Portfolio is overweight defensive growth sectors such as health care and consumer staples, and underweight banks and energy.
· Within fixed income, we remain underweight the U.S. and overweight Australia and Eurobonds. U.S. bonds appear expensive in terms of valuations as investors are fleeing to safe haven assets in the U.S. Therefore, we believe non-U.S. bonds such as Australia and Eurobonds are more attractive in terms of real yields and other dynamics such as changes in yield curve and volatility.
The information contained in this overview regarding specific securities is for informational purposes only and should not be construed as a recommendation to purchase or sell the securities mentioned.
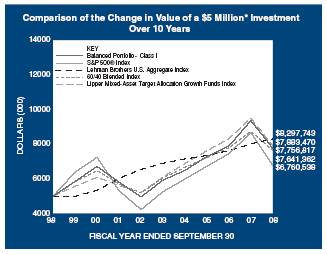
* Minimum Investment
In accordance with SEC regulations, the Portfolio’s performance shown assumes that all recurring fees (including management fees) were deducted and all dividends and distributions were reinvested. The performance of Investment Class and Class P shares will vary from the Class I shares based upon their different inception dates and will be negatively impacted by additional fees assessed to those classes.
Performance Compared to the S&P 500® Index(1), Lehman Brothers U.S. Aggregate Index(2), 60/40 Blended Index(3) and the Lipper Mixed-Asset Target Allocation Growth Funds Index(4)
| | Total Returns(5) | |
| | | | Average Annual | |
| | One | | Five | | Ten | | Since |
| | Year | | Years | | Years | | Inception(9) |
Portfolio – Class I (6) | | (17.02 | )% | 5.54 | % | 4.49 | % | 7.31 | % |
S&P 500® Index | | (21.98 | ) | 5.17 | | 3.06 | | 8.49 | |
Lehman Brothers U.S. Aggregate Index | | 3.65 | | 3.78 | | 5.20 | | 6.20 | |
60/40 Blended Index | | (12.32 | ) | 4.77 | | 4.33 | | 7.90 | |
Lipper Mixed-Asset Target Allocation
Growth Funds Index | | (17.03 | ) | 5.25 | | 4.66 | | 7.59 | |
| | | | | | | | | |
Portfolio – Investment Class (7) | | (17.17 | ) | 5.39 | | 4.30 | | 5.50 | |
S&P 500® Index | | (21.98 | ) | 5.17 | | 3.06 | | 5.64 | |
Lehman Brothers U.S. Aggregate Index | | 3.65 | | 3.78 | | 5.20 | | 6.10 | |
60/40 Blended Index | | (12.32 | ) | 4.77 | | 4.33 | | 6.26 | |
Lipper Mixed-Asset Target Allocation
Growth Funds Index | | (17.03 | ) | 5.25 | | 4.66 | | 5.91 | |
| | | | | | | | | |
Portfolio – Class P (8) | | (17.26 | ) | 5.28 | | 4.23 | | 5.63 | |
S&P 500® Index | | (21.98 | ) | 5.17 | | 3.06 | | 6.08 | |
Lehman Brothers U.S. Aggregate Index | | 3.65 | | 3.78 | | 5.20 | | 5.94 | |
60/40 Blended Index | | (12.32 | ) | 4.77 | | 4.33 | | 6.44 | |
Lipper Mixed-Asset Target Allocation
Growth Funds Index | | (17.03 | ) | 5.25 | | 4.66 | | 6.09 | |
Performance data quoted represents past performance, which is no guarantee of future results, and current performance may be lower or higher than the figures shown. Performance assumes that all dividends and
11
2008 Annual Report | |
| |
September 30, 2008 | |
Investment Overview (cont’d)
Balanced Portfolio
distributions, if any, were reinvested. For the most recent month-end performance figures, please visit www.morganstanley.com/msim. Investment returns and principal value will fluctuate so that Portfolio shares, when redeemed, may be worth more or less than their original cost. Total returns do not reflect the deduction of taxes that a shareholder would pay on Portfolio distributions or the redemption of Portfolio shares. Performance of share classes will vary due to differences in sales charges and expenses.
(1) | The Standard & Poor’s 500® Index (S&P 500®) measures the performance of the large cap segment of the U.S. equities market, covering approximately 75% of the U.S. equities market. The Index includes 500 leading companies in leading industries of the U.S. economy. The Index is unmanaged and its returns do not include any sales charges or fees. Such costs would lower performance. It is not possible to invest directly in an index. |
(2) | The Lehman Brothers U.S. Aggregate Index tracks the performance of all U.S. government agency and Treasury securities, investment-grade corporate debt securities, agency mortgage-backed securities, asset-backed securities and commercial mortgage-backed securities. The Index is unmanaged and its returns do not include any sales charges or fees. Such costs would lower performance. It is not possible to invest directly in an index. |
(3) | The 60/40 Blended Index is comprised of 60% S&P 500® Index and 40% Lehman Brothers U.S. Aggregate Index. |
(4) | The Lipper Mixed-Asset Target Allocation Growth Funds Index is an equally-weighted performance index of the largest qualifying funds (based on net assets) in the Lipper Mixed-Asset Target Allocation Growth Funds classification. The Index, which is adjusted for capital gains distributions and income dividends, is unmanaged and should not be considered an investment. There are currently 30 funds represented in this Index. As of the date of this report, the Portfolio was in the Lipper Mixed-Asset Target Allocation Growth Funds classification. |
(5) | Total returns for the Portfolio reflect expenses waived and/or reimbursed, if applicable, by the Adviser. Without such waivers and/or reimbursements, total returns would have been lower. Fee waivers and/or reimbursements are voluntary and the Adviser reserves the right to commence or terminate any waiver and/or reimbursement at any time. |
(6) | Commenced operations on December 31, 1992. |
(7) | Commenced operations on April 3, 1997. |
(8) | Commenced operations on November 1, 1996. |
(9) | For comparative purposes, average annual since inception returns listed for the Indexes refer to the inception date or initial offering of the respective share class of the Portfolio, not the inception of the Indexes. |
Portfolio Composition
| | Percentage of | |
Classification | | Total Investments | |
Common Stocks | | 48.2 | % |
Investment Companies | | 6.5 | |
Other* | | 2.7 | |
Short-Term Investments | | | 42.6 | |
Total Investments | | | 100.0 | % |
* | Industries and/or investment types which do not appear in the above table, as well as those which represent less than 5% of total investments, if applicable, are included in the category labeled “Other”. |
12
| 2008 Annual Report |
| |
| September 30, 2008 |
Portfolio of Investments
Balanced Portfolio
| | Face | | | |
| | Amount | | Value | |
| | (000) | | (000) | |
Fixed Income Securities (2.6%) | | | | | |
Agency Adjustable Rate Mortgages (1.3%) | | | | | |
Federal National Mortgage Association, Conventional Pools: | | | | | |
5.28%, 5/1/36 | | $ | 421 | | $ | 428 | |
5.34%, 7/1/36 | | 320 | | 326 | |
5.36%, 8/1/36 | | 232 | | 237 | |
| | | | 991 | |
Collateralized Mortgage Obligations — Agency Collateral Series (0.3%) | | | | | |
Federal Home Loan Mortgage Corp., | | | | | |
Inv Fl IO REMIC | | | | | |
6.06%, 10/15/29 | | 11 | | — | @ |
IO REMIC | | | | | |
5.00%, 6/15/17 | | 39 | | 3 | |
Federal National Mortgage Association, | | | | | |
Inv Fl REMIC | | | | | |
3.27%, 12/25/36 | | 213 | | 206 | |
IO | | | | | |
8.00%, 4/1/24 | | 15 | | 4 | |
IO PAC REMIC | | | | | |
8.00%, 8/18/27 | | 15 | | 3 | |
IO REMIC | | | | | |
1.42%, 3/25/36 | | 319 | | 5 | |
6.00%, 8/25/32 | | 24 | | 1 | |
Government National Mortgage Association, | | | | | |
Inv Fl IO | | | | | |
5.51%, 4/16/29 | | 165 | | 13 | |
6.11%, 8/16/29 | | 89 | | 8 | |
| | | | 243 | |
Collateralized Mortgage Obligations — Non Agency Collateral Series (0.3%) | | | | | |
Bear Stearns Structured Products, Inc., | | | | | |
IO | | | | | |
0.01%, 1/27/37(e)(l) | | 3,534 | | — | @ |
0.02%, 6/26/36(e)(d)(l) | | 5,344 | | 1 | |
0.16%, 1/27/37(d)(e)(l) | | 7,057 | | 1 | |
0.18%, 1/27/37(d)(e)(l) | | 4,888 | | — | @ |
1.22%, 5/25/37(e)(d)(l) | | 6,063 | | 1 | |
Countrywide Alternative Loan Trust, | | | | | |
IO | | | | | |
0.18%, 5/25/47(e)(d)(l) | | 1,848 | | — | @ |
0.41%, 2/25/47(d)(l) | | 3,617 | | — | @ |
2.18%, 3/20/46 | | 1,498 | | 46 | |
2.40%, 12/20/46 | | 1,583 | | 48 | |
2.51%, 12/20/35(e)(h) | | 1,609 | | 41 | |
2.56%, 2/25/37 | | 512 | | 13 | |
Countrywide Home Loan Mortgage Pass Through Trust, | | | | | |
IO | | | | | |
0.84%, 2/25/35 | | 1,142 | | 14 | |
Greenpoint Mortgage Funding Trust, | | | | | |
IO | | | | | |
1.30%, 8/25/45 | | 762 | | 17 | |
Harborview Mortgage Loan Trust, | | | | | |
IO | | | | | |
2.93%, 3/19/37(h) | | 1,468 | | 34 | |
PO | | | | | |
3/19/37 | | 3 | | — | @ |
Harborview NIM Corp., | | | | | |
IO | | | | | |
1.52%, 12/15/36(d)(l) | | 184 | | — | @ |
Indymac Index Mortgage Loan Trust, | | | | | |
IO | | | | | |
2.34%, 7/25/35(h) | | 917 | | 12 | |
Residential Accredit Loans, Inc., | | | | | |
IO | | | | | |
0.68%, 3/25/47(d)(h)(l) | | 2,149 | | — | @ |
0.76%, 5/25/47(d)(h)(l) | | 4,253 | | 1 | |
| | | | 229 | |
Mortgages — Other (0.7%) | | | | | |
American Home Mortgage Assets, | | | | | |
3.40%, 6/25/47(d)(h) | | 91 | | 49 | |
3.51%, 6/25/47(d)(h) | | 204 | | 30 | |
Banc of America Funding Corp., | | | | | |
3.54%, 9/20/35(d)(h) | | 112 | | 45 | |
Countrywide Alternative Loan Trust, | | | | | |
3.37%, 2/25/47(h) | | 109 | | 67 | |
3.40%, 11/25/46(d)(h) | | 93 | | 54 | |
3.52%, 7/25/46(d)(h) | | 123 | | 27 | |
3.71%, 6/25/47(h) | | 230 | | 45 | |
Countrywide Home Loan Mortgage Pass Through Trust, | | | | | |
3.51%, 3/25/35(h) | | 29 | | 17 | |
Deutsche ALT-A Securities NIM Trust, | | | | | |
6.75%, 2/25/47(e) | | 20 | | 18 | |
Harborview Mortgage Loan Trust, | | | | | |
3.23%, 1/25/47(d)(h) | | 65 | | 23 | |
3.32%, 7/19/45(d)(h) | | 76 | | 31 | |
Luminent Mortgage Trust, | | | | | |
3.46%, 5/25/36(d)(h) | | 51 | | 18 | |
Ryland Acceptance Corp. IV, | | | | | |
6.65%, 7/1/11 | | 1 | | 1 | |
Structured Asset Mortgage Investments, Inc., | | | | | |
3.40%, 2/25/36(d)(h) | | 83 | | 44 | |
Washington Mutual Mortgage Pass Through Certificates, | | | | | |
3.46%, 1/25/47(d)(h) | | 190 | | 36 | |
3.48%, 4/25/45(d)(h) | | 121 | | 48 | |
3.50%, 8/25/45(h) | | 4 | | 4 | |
| | | | 557 | |
Total Fixed Income Securities (Cost $4,916) | | | | 2,020 | |
| | | | | | | |
The accompanying notes are an integral part of the financial statements. | 13 |
2008 Annual Report | |
| |
September 30, 2008 | |
Portfolio of Investments (cont’d)
Balanced Portfolio
| | | | Value | |
| | Shares | | (000) | |
Common Stocks (47.3%) | | | | | |
Aerospace & Defense (0.9%) | | | | | |
Boeing Co. | | 1,850 | | $ | 106 | |
General Dynamics Corp. | | 900 | | 66 | |
Honeywell International, Inc. | | 1,900 | | 79 | |
L-3 Communications Holdings, Inc. | | 400 | | 39 | |
Lockheed Martin Corp. | | 750 | | 82 | |
Northrop Grumman Corp. | | 800 | | 48 | |
Precision Castparts Corp. | | 400 | | 32 | |
Raytheon Co. | | 950 | | 51 | |
Rockwell Collins, Inc. | | 600 | | 29 | |
United Technologies Corp. | | 2,400 | | 145 | |
| | | | 677 | |
Air Transport (0.3%) | | | | | |
Expeditors International Washington, Inc. | | 6,391 | | 223 | |
Auto Components (0.0%) | | | | | |
Johnson Controls, Inc. | | 100 | | 3 | |
Automobiles (0.0%) | | | | | |
Ford Motor Co.(a) | | 900 | | 5 | |
General Motors Corp. | | 200 | | 2 | |
| | | | 7 | |
Beverages (1.5%) | | | | | |
Anadolu Efes Biracilik Ve Malt Sanayii A.S. | | 4,539 | | 47 | |
Anheuser-Busch Cos., Inc. | | 3,338 | | 217 | |
Coca-Cola Co. (The) | | 8,780 | | 464 | |
PepsiCo., Inc. | | 5,825 | | 415 | |
| | | | 1,143 | |
Biotechnology (1.3%) | | | | | |
Amgen, Inc.(a) | | 4,100 | | 243 | |
Biogen Idec, Inc.(a) | | 1,200 | | 60 | |
Celgene Corp.(a) | | 1,600 | | 101 | |
Genzyme Corp.(a) | | 1,100 | | 89 | |
Gilead Sciences, Inc.(a) | | 3,400 | | 155 | |
Illumina, Inc.(a) | | 8,794 | | 356 | |
| | | | 1,004 | |
Capital Markets (0.5%) | | | | | |
Bank of New York Mellon Corp. (The) | | 1,060 | | 35 | |
Charles Schwab Corp. (The) | | 2,151 | | 56 | |
Franklin Resources, Inc. | | 1,080 | | 95 | |
Goldman Sachs Group, Inc. (The) | | 870 | | 111 | |
Merrill Lynch & Co., Inc. | | 1,570 | | 40 | |
Northern Trust Corp. | | 170 | | 12 | |
State Street Corp. | | 480 | | 27 | |
| | | | 376 | |
Casinos & Gambling (0.8%) | | | | | |
Wynn Resorts Ltd. | | 8,046 | | 656 | |
Chemicals (1.8%) | | | | | |
Monsanto Co. | | 13,721 | | 1,359 | |
Commercial Banks (0.9%) | | | | | |
Akbank T.A.S. | | 16,754 | | 86 | |
Ameriprise Financial, Inc. | | 360 | | 14 | |
Asya Katilim Bankasi A.S.(a) | | 11,911 | | 19 | |
Fifth Third Bancorp. | | 4,800 | | 57 | |
KeyCorp. | | 4,800 | | 57 | |
National City Corp. | | 10,800 | | 19 | |
Regions Financial Corp. | | 7,200 | | 69 | |
SunTrust Banks, Inc. | | 2,400 | | 108 | |
Turkiye Garanti Bankasi A.S.(a) | | 37,749 | | 90 | |
Turkiye Halk Bankasi A.S. | | 6,700 | | 30 | |
Turkiye Is Bankasi A.S., Class C | | 18,753 | | 78 | |
Turkiye Vakiflar Bankasi T.A.O., Class D | | 16,296 | | 27 | |
Wells Fargo & Co. | | 1,200 | | 45 | |
Yapi ve Kredi Bankasi A.S.(a) | | 16,371 | | 35 | |
| | | | 734 | |
Commercial Services & Supplies (0.1%) | | | | | |
Monster Worldwide, Inc.(a) | | 6,005 | | 90 | |
Communications Equipment (0.9%) | | | | | |
Cisco Systems, Inc.(a) | | 10,100 | | 228 | |
Corning, Inc. | | 2,700 | | 42 | |
Juniper Networks, Inc.(a) | | 1,100 | | 23 | |
Motorola, Inc. | | 3,700 | | 26 | |
Research In Motion Ltd.(a) | | 5,453 | | 372 | |
| | | | 691 | |
Communications Technology (0.6%) | | | | | |
QUALCOMM, Inc. | | 10,025 | | 432 | |
Computers & Peripherals (0.9%) | | | | | |
Dell, Inc.(a) | | 4,100 | | 68 | |
EMC Corp.(a) | | 3,700 | | 44 | |
Hewlett-Packard Co. | | 4,300 | | 199 | |
International Business Machines Corp. | | 2,400 | | 281 | |
Sun Microsystems, Inc.(a) | | 1,800 | | 14 | |
| | | | 606 | |
Computer Services Software & Systems (1.9%) | | | | | |
Baidu.com ADR(a) | | 1,055 | | 262 | |
Google, Inc., Class A(a) | | 2,259 | | 905 | |
Tencent Holdings Ltd. | | 36,000 | | 259 | |
| | | | 1,426 | |
Computer Technology (0.9%) | | | | | |
Apple, Inc.(a) | | 6,386 | | 725 | |
Construction & Engineering (0.1%) | | | | | |
Fluor Corp. | | 400 | | 22 | |
Tekfen Holding A.S. | | 3,100 | | 17 | |
| | | | 39 | |
Construction Materials (0.7%) | | | | | |
Cemex S.A.B. de C.V. ADR(a) | | 15,566 | | 268 | |
Martin Marietta Materials, Inc. | | 2,665 | | 298 | |
| | | | 566 | |
Consumer Finance (0.6%) | | | | | |
American Express Co. | | 12,589 | | 446 | |
Capital One Financial Corp. | | 373 | | 19 | |
SLM Corp.(a) | | 300 | | 4 | |
| | | | 469 | |
Distributors (0.3%) | | | | | |
Li & Fung Ltd. | | 96,000 | | 234 | |
| | | | | | |
14 | The accompanying notes are an integral part of the financial statements. |
| 2008 Annual Report |
| |
| September 30, 2008 |
Portfolio of Investments (cont’d)
Balanced Portfolio
| | | | Value | |
| | Shares | | (000) | |
Diversified Financial Services (2.7%) | | | | | |
Bank of America Corp. | | 5,571 | | $ | 195 | |
Brookfield Asset Management, Inc., Class A | | 29,372 | | 806 | |
Citigroup, Inc. | | 6,645 | | 136 | |
CME Group, Inc. | | 1,074 | | 399 | |
Haci Omer Sabanci Holding A.S. | | 9,500 | | 36 | |
JPMorgan Chase & Co. | | 4,268 | | 199 | |
Moody’s Corp. | | 540 | | 18 | |
Redecard S.A. | | 25,911 | | 323 | |
| | | | 2,112 | |
Diversified Telecommunication Services (0.6%) | | | | | |
AT&T, Inc. | | 11,020 | | 307 | |
Sprint Nextel Corp. | | 5,000 | | 31 | |
Turk Telekomunikasyon A.S.(a) | | 11,000 | | 33 | |
Verizon Communications, Inc. | | 4,600 | | 148 | |
| | | | 519 | |
Electric Utilities (0.8%) | | | | | |
American Electric Power Co., Inc. | | 1,400 | | 52 | |
Consolidated Edison, Inc. | | 900 | | 39 | |
Edison International | | 1,200 | | 48 | |
Entergy Corp. | | 700 | | 62 | |
Exelon Corp. | | 1,900 | | 118 | |
FirstEnergy Corp. | | 1,200 | | 80 | |
FPL Group, Inc. | | 1,300 | | 65 | |
PPL Corp. | | 1,500 | | 56 | |
Progress Energy, Inc. | | 800 | | 35 | |
Southern Co. (The) | | 1,900 | | 72 | |
| | | | 627 | |
Electrical Equipment (0.1%) | | | | | |
Emerson Electric Co. | | 2,100 | | 86 | |
Electronic Equipment & Instruments (0.0%) | | | | | |
Agilent Technologies, Inc.(a) | | 700 | | 21 | |
Tyco Electronics Ltd. | | 1,000 | | 28 | |
| | | | 49 | |
Electronics: Semi-Conductors/Components (0.2%) | | | | | |
First Solar, Inc.(a) | | 772 | | 146 | |
Energy Equipment & Services (0.7%) | | | | | |
Baker Hughes, Inc. | | 700 | | 42 | |
Halliburton Co. | | 2,300 | | 74 | |
National Oilwell Varco, Inc.(a) | | 800 | | 40 | |
Noble Corp. | | 800 | | 35 | |
Schlumberger Ltd. | | 2,900 | | 227 | |
Smith International, Inc. | | 600 | | 35 | |
Transocean, Inc.(a) | | 700 | | 77 | |
Weatherford International Ltd.(a) | | 1,700 | | 43 | |
| | | | 573 | |
Energy — Miscellaneous (0.2%) | | | | | |
Questar Corp. | | 1,455 | | 60 | |
Range Resources Corp. | | 1,556 | | 67 | |
| | | | 127 | |
Finance Companies (0.3%) | | | | | |
BMG&F BOVESPA S.A. | | 56,999 | | 251 | |
Food & Staples Retailing (1.4%) | | | | | |
BIM Birlesik Magazalar A.S. | | 895 | | 28 | |
Costco Wholesale Corp. | | 1,700 | | 110 | |
CVS Caremark Corp. | | 5,600 | | 188 | |
Kroger Co. (The) | | 2,600 | | 71 | |
Migros Turk T.A.S. | | 1,886 | | 33 | |
Safeway, Inc. | | 1,400 | | 33 | |
SYSCO Corp. | | 3,100 | | 96 | |
Walgreen Co. | | 3,700 | | 115 | |
Wal-Mart Stores, Inc. | | 8,500 | | 509 | |
| | | | 1,183 | |
Food Products (1.0%) | | | | | |
Archer-Daniels-Midland Co. | | 3,402 | | 75 | |
ConAgra Foods, Inc. | | 2,311 | | 45 | |
General Mills, Inc. | | 1,867 | | 128 | |
Heinz (H.J.) Co. | | 1,459 | | 73 | |
Kellogg Co. | | 1,193 | | 67 | |
Kraft Foods, Inc. | | 7,448 | | 243 | |
Sara Lee Corp. | | 1,878 | | 24 | |
W.M. Wrigley Jr. Co. | | 1,071 | | 85 | |
| | | | 740 | |
Gas Utilities (0.1%) | | | | | |
Sempra Energy | | 1,000 | | 50 | |
Health Care Equipment & Supplies (1.4%) | | | | | |
Baxter International, Inc. | | 2,000 | | 131 | |
Becton Dickinson & Co. | | 800 | | 64 | |
Boston Scientific Corp.(a) | | 4,700 | | 58 | |
C.R. Bard, Inc. | | 600 | | 57 | |
Covidien Ltd. | | 1,600 | | 86 | |
Gen-Probe, Inc.(a) | | 2,219 | | 118 | |
Intuitive Surgical, Inc.(a) | | 938 | | 227 | |
Medtronic, Inc. | | 3,400 | | 170 | |
St. Jude Medical, Inc.(a) | | 1,200 | | 52 | |
Stryker Corp. | | 1,000 | | 62 | |
Zimmer Holdings, Inc.(a) | | 900 | | 58 | |
| | | | 1,083 | |
Health Care Providers & Services (0.7%) | | | | | |
Aetna, Inc. | | 1,500 | | 54 | |
Cardinal Health, Inc. | | 1,400 | | 69 | |
Cigna Corp. | | 1,200 | | 41 | |
Express Scripts, Inc.(a) | | 1,000 | | 74 | |
Humana, Inc.(a) | | 600 | | 25 | |
McKesson Corp. | | 1,000 | | 54 | |
Medco Health Solutions, Inc.(a) | | 1,700 | | 77 | |
UnitedHealth Group, Inc. | | 4,300 | | 108 | |
WellPoint, Inc.(a) | | 1,400 | | 65 | |
| | | | 567 | |
Hotels Restaurants & Leisure (0.5%) | | | | | |
Carnival Corp. | | 100 | | 4 | |
Marriott International, Inc., Class A | | 100 | | 3 | |
| | | | | | |
The accompanying notes are an integral part of the financial statements. | 15 |
2008 Annual Report
September 30, 2008
Portfolio of Investments (cont’d)
Balanced Portfolio
| | | | Value | |
| | Shares | | (000) | |
Hotels Restaurants & Leisure (cont’d) | | | | | |
McDonald’s Corp. | | 300 | | $ | 18 | |
Starbucks Corp.(a) | | 23,991 | | 356 | |
Yum! Brands, Inc. | | 200 | | 7 | |
| | | | 388 | |
Household Durables (0.1%) | | | | | |
Fortune Brands, Inc. | | 700 | | 40 | |
Household Products (1.4%) | | | | | |
Colgate-Palmolive Co. | | 1,892 | | 143 | |
Kimberly-Clark Corp. | | 1,900 | | 123 | |
Procter & Gamble Co. | | 11,680 | | 814 | |
| | | | 1,080 | |
Independent Power Producers & Energy Traders (0.1%) | | | | | |
AES Corp. (The)(a) | | 2,400 | | 28 | |
Constellation Energy Group, Inc. | | 600 | | 15 | |
| | | | 43 | |
Industrial Conglomerates (1.0%) | | | | | |
3M Co. | | 1,700 | | 116 | |
Enka Insaat ve Sanayi A.S. | | 4,747 | | 32 | |
General Electric Co. | | 23,600 | | 601 | |
KOC Holding A.S.(a) | | 7,781 | | 24 | |
Textron, Inc. | | 600 | | 18 | |
Tyco International Ltd. | | 1,425 | | 50 | |
| | | | 841 | |
Information Technology Services (0.7%) | | | | | |
Mastercard, Inc., Class A | | 2,312 | | 409 | |
Paychex, Inc. | | 300 | | 10 | |
Total System Services, Inc. | | 271 | | 4 | |
Visa, Inc., Class A | | 2,389 | | 147 | |
| | | | 570 | |
Insurance (0.9%) | | | | | |
Aflac, Inc. | | 660 | | 39 | |
Allstate Corp. (The) | | 940 | | 43 | |
AON Corp. | | 500 | | 22 | |
Berkshire Hathaway, Inc., Class B(a) | | 78 | | 343 | |
Chubb Corp. | | 700 | | 38 | |
Genworth Financial, Inc. | | 900 | | 8 | |
Hartford Financial Services Group, Inc. | | 700 | | 29 | |
Lincoln National Corp. | | 559 | | 24 | |
Marsh & McLennan Cos., Inc. | | 840 | | 27 | |
MetLife, Inc. | | 1,190 | | 67 | |
Principal Financial Group | | 470 | | 20 | |
Progressive Corp. (The) | | 1,340 | | 23 | |
Prudential Financial, Inc. | | 800 | | 58 | |
Travelers Cos., Inc. (The) | | 998 | | 45 | |
| | | | 786 | |
Insurance: Multi-Line (0.6%) | | | | | |
Loews Corp. | | 9,062 | | 358 | |
Internet Software & Services (0.8%) | | | | | |
eBay, Inc.(a) | | 24,963 | | 559 | |
Machinery (0.7%) | | | | | |
Caterpillar, Inc. | | 1,700 | | 102 | |
Cummins, Inc. | | 800 | | 35 | |
Danaher Corp. | | 700 | | 49 | |
Deere & Co. | | 1,100 | | 54 | |
Eaton Corp. | | 700 | | 39 | |
Illinois Tool Works, Inc. | | 1,400 | | 63 | |
Ingersoll-Rand Co., Ltd., Class A | | 1,200 | | 37 | |
ITT Corp. | | 800 | | 44 | |
PACCAR, Inc. | | 1,255 | | 48 | |
Parker Hannifin Corp. | | 650 | | 34 | |
| | | | 505 | |
Media (0.2%) | | | | | |
CBS Corp., Class B | | 500 | | 7 | |
Comcast Corp., Class A | | 1,600 | | 31 | |
DIRECTV Group, Inc. (The)(a) | | 500 | | 13 | |
International Game Technology | | 100 | | 2 | |
McGraw-Hill Cos., Inc. (The) | | 200 | | 6 | |
News Corp., Class A | | 1,300 | | 16 | |
Omnicom Group, Inc. | | 200 | | 8 | |
Time Warner, Inc. | | 2,000 | | 26 | |
Viacom, Inc., Class B(a) | | 400 | | 10 | |
Walt Disney Co. (The) | | 1,400 | | 44 | |
| | | | 163 | |
Metals & Mining (0.1%) | | | | | |
Eregli Demir ve Celik Fabrikalari T.A.S. | | 10,610 | | 54 | |
Multi-Utilities (0.4%) | | | | | |
Ameren Corp. | | 800 | | 31 | |
Dominion Resources, Inc. | | 2,400 | | 103 | |
Duke Energy Corp. | | 4,128 | | 72 | |
PG&E Corp. | | 800 | | 30 | |
Public Service Enterprise Group, Inc. | | 1,600 | | 52 | |
Williams Cos., Inc. | | 1,800 | | 43 | |
| | | | 331 | |
Office Electronics (0.0%) | | | | | |
Xerox Corp. | | 2,200 | | 25 | |
Oil & Gas Exploration & Production (0.0%) | | | | | |
Noble Energy, Inc. | | 500 | | 28 | |
Oil, Gas & Consumable Fuels (4.9%) | | | | | |
Anadarko Petroleum Corp. | | 1,300 | | 63 | |
Apache Corp. | | 800 | | 83 | |
Chesapeake Energy Corp. | | 1,300 | | 47 | |
Chevron Corp. | | 5,100 | | 421 | |
ConocoPhillips | | 4,100 | | 300 | |
Consol Energy, Inc. | | 500 | | 23 | |
Devon Energy Corp. | | 1,100 | | 100 | |
El Paso Corp. | | 2,000 | | 26 | |
EOG Resources, Inc. | | 700 | | 63 | |
Exxon Mobil Corp. | | 12,700 | | 986 | |
Hess Corp. | | 700 | | 57 | |
Marathon Oil Corp. | | 1,700 | | 68 | |
Murphy Oil Corp. | | 500 | | 32 | |
Occidental Petroleum Corp. | | 1,900 | | 134 | |
| | | | | | |
16 | The accompanying notes are an integral part of the financial statements. | |
| 2008 Annual Report |
| |
| September 30, 2008 |
Portfolio of Investments (cont’d)
Balanced Portfolio
| | | | Value | |
| | Shares | | (000) | |
Oil, Gas & Consumable Fuels (cont’d) | | | | | |
Peabody Energy Corp. | | 700 | | $ | 32 | |
Southwestern Energy Co.(a) | | 11,757 | | 359 | |
Spectra Energy Corp. | | 1,300 | | 31 | |
Tupras Turkiye Petrol Rafine | | 2,428 | | 45 | |
Ultra Petroleum Corp.(a) | | 15,546 | | 860 | |
Valero Energy Corp. | | 1,600 | | 48 | |
XTO Energy, Inc. | | 1,300 | | 60 | |
| | | | 3,838 | |
Personal Products (0.1%) | | | | | |
Avon Products, Inc. | | 1,690 | | 70 | |
Pharmaceuticals (3.6%) | | | | | |
Abbott Laboratories | | 5,900 | | 340 | |
Allergan, Inc. | | 4,670 | | 241 | |
Bristol-Myers Squibb Co. | | 7,500 | | 156 | |
Eli Lilly & Co. | | 3,300 | | 145 | |
Forest Laboratories, Inc.(a) | | 1,400 | | 40 | |
Johnson & Johnson | | 10,100 | | 700 | |
Merck & Co., Inc. | | 7,900 | | 249 | |
Pfizer, Inc. | | 25,200 | | 465 | |
Schering-Plough Corp. | | 5,800 | | 107 | |
Thermo Fisher Scientific, Inc.(a) | | 2,000 | | 110 | |
Wyeth | | 5,000 | | 185 | |
| | | | 2,738 | |
Retail (1.3%) | | | | | |
Amazon.com, Inc.(a) | | 13,988 | | 1,018 | |
Semiconductors & Semiconductor Equipment (0.7%) | | | | | |
Applied Materials, Inc. | | 4,363 | | 66 | |
Broadcom Corp., Class A(a) | | 1,630 | | 30 | |
Intel Corp. | | 18,350 | | 345 | |
MEMC Electronic Materials, Inc.(a) | | 700 | | 20 | |
Nvidia Corp.(a) | | 2,000 | | 21 | |
Texas Instruments, Inc. | | 4,578 | | 98 | |
| | | | 580 | |
Services: Commercial (1.1%) | | | | | |
Corporate Executive Board Co. | | 4,831 | | 151 | |
Leucadia National Corp. | | 14,072 | | 640 | |
| | | | 791 | |
Shipping (0.5%) | | | | | |
C.H. Robinson Worldwide, Inc. | | 7,234 | | 368 | |
Software (0.1%) | | | | | |
Electronic Arts, Inc.(a) | | 200 | | 7 | |
VMware, Inc., Class A(a) | | 3,485 | | 93 | |
| | | | 100 | |
Textiles, Apparel & Luxury Goods (0.4%) | | | | | |
Coach, Inc.(a) | | 7,674 | | 192 | |
Nike, Inc., Class B | | 1,200 | | 80 | |
| | | | 272 | |
Tobacco (1.0%) | | | | | |
Altria Group, Inc. | | 10,430 | | 207 | |
Philip Morris International, Inc. | | 10,430 | | 501 | |
Reynolds American, Inc. | | 1,000 | | 49 | |
| | | | 757 | |
Wireless Telecommunication Services (0.9%) | | | | | |
America Movil S.A.B. de C.V., Class L ADR | | 7,930 | | 367 | |
American Tower Corp., Class A(a) | | 800 | | 29 | |
China Mobile Ltd. ADR | | 3,972 | | 199 | |
Turkcell Iletisim Hizmet A.S. | | 12,359 | | 76 | |
| | | | 671 | |
Total Common Stocks (Cost $43,505) | | | | 36,547 | |
Investment Companies (6.3%) | | | | | |
iShares Lehman Aggregate Bond Fund | | 37,705 | | 3,717 | |
iShares MSCI EMU Index Fund | | 200 | | 8 | |
Morgan Stanley Institutional Fund Inc. — Emerging Markets Portfolio, Class I(p) | | 58,635 | | 1,182 | |
Total Investment Companies (Cost $5,561) | | | | 4,907 | |
Short-Term Investments (41.8%) | | | | | |
Investment Company (41.4%) | | | | | |
Morgan Stanley Institutional Liquidity Money Market Portfolio — Institutional Class(p) | | 32,016,291 | | 32,016 | |
| | | | | | |
| | Face | | | |
| | Amount | | | |
| | (000) | | | |
U.S. Treasury Security (0.4%) | | | | | |
U.S. Treasury Bill, 0.17%, 10/9/08(r)(j) | | $ | 275 | | 275 | |
Total Short-Term Investments (Cost $32,291) | | | | 32,291 | |
Total Investments (98.0%) (Cost $86,273)(s) | | | | 75,765 | |
Other Assets in Excess of Liabilities (2.0%) | | | | 1,573 | |
Net Assets (100%) | | | | $77,338 | |
| | | | | | |
(a) | Non-income producing security. |
(d) | Security was valued at fair value — At September 30, 2008, the Portfolio held $409,000 of fair valued securities, representing 0.5% of net assets. |
(e) | 144A security — Certain conditions for public sale may exist. Unless otherwise noted, these securities are deemed to be liquid. |
(h) | Variable/Floating Rate Security — Interest rate changes on these instruments are based on changes in a designated rate. The rates shown are those in effect on September 30, 2008. |
(j) | All or a portion of the security was pledged to cover margin requirements for futures contracts. |
(l) | Security has been deemed illiquid at September 30, 2008. |
(p) | See Note G within the Notes to Financial Statements regarding investment in Morgan Stanley Institutional Fund, Inc. — Emerging Markets Portfolio Class I and Morgan Stanley Institutional Liquidity Money Market Portfolio — Institutional Class. |
(r) | Rate shown is the yield to maturity at September��30, 2008. |
(s) | The approximate market value and percentage of the investments, $1,282,000 and 1.7%, respectively, represent the securities that have been fair valued under the fair valuation policy for international investments as described in Note A within the Notes to Financial Statements. |
@ | Value is less than $500. |
ADR | American Depositary Receipt |
Inv Fl | Inverse Floating Rate — Interest rate fluctuates with an inverse relationship to an associated interest rate. Indicated rate is the effective rate at September 30, 2008. |
IO | Interest Only |
PAC | Planned Amortization Class |
PO | Principal Only |
REMIC | Real Estate Mortgage Investment Conduit |
| The accompanying notes are an integral part of the financial statements. | 17 |
2008 Annual Report
September 30, 2008
Portfolio of Investments (cont’d)
Balanced Portfolio
Foreign Currency Exchange Contract Information:
The Portfolio had the following foreign currency exchange contract(s) open at period end:
| | | | | | | | | | Net | |
Currency | | | | | | In | | | | Unrealized | |
to | | | | | | Exchange | | | | Appreciation | |
Deliver | | Value | | Settlement | | For | | Value | | (Depreciation) | |
(000) | | (000) | | Date | | (000) | | (000) | | (000) | |
AUD | 929 | | $ | 732 | | | 12/11/08 | | USD | 771 | | $ | 771 | | | $ | 39 | |
CZK | 4,434 | | 255 | | | 10/1/08 | | USD | 259 | | 259 | | | 4 | |
CZK | 515 | | 29 | | | 10/2/08 | | USD | 30 | | 30 | | | 1 | |
EUR | 538 | | 759 | | | 12/11/08 | | USD | 787 | | 787 | | | 28 | |
PLN | 889 | | 368 | | | 10/3/08 | | USD | 368 | | 368 | | | — | @ |
USD | 739 | | 739 | | | 12/11/08 | | AUD | 922 | | 726 | | | (13 | ) |
USD | 1,644 | | 1,644 | | | 12/11/08 | | CHF | 1,782 | | 1,597 | | | (47 | ) |
USD | 757 | | 757 | | | 12/11/08 | | EUR | 536 | | 757 | | | — | @ |
USD | 822 | | 822 | | | 12/11/08 | | JPY | 87,726 | | 833 | | | 11 | |
USD | 430 | | 430 | | | 10/6/08 | | TRY | 531 | | 418 | | | (12 | ) |
| | | $ | 6,535 | | | | | | | $ | 6,546 | | | $ | 11 | |
| |
| |
AUD | — Australian Dollar |
CHF | — Swiss Franc |
CZK | — Czech Koruna |
EUR | — Euro |
JPY | — Japanese Yen |
PLN | — Polish Zloty |
TRY | — Turkish Lira |
USD | — United States Dollar |
| | | | | | | | | | | | | | | | | | | |
The Portfolio had the following futures contract(s) open at period end:
| | | | | | Net Unrealized | |
| Number | | | | | Appreciation | |
| of | | Value | | Expiration | (Depreciation) | |
| Contracts | | (000) | | Date | (000) | |
Long: | | | | | | |
Australian Dollar | | | | | | |
10 yr. Bond | 12 | | | $ | 993 | | Dec-08 | | $ | 13 | | |
Euro-Bond | 7 | | | 1,134 | | Dec-08 | | 9 | | |
S&P 500 Emini | | | | | | | | | | |
(U.S. Dollar) | 179 | | | 10,462 | | Dec-08 | | (293 | ) | |
U.S. Treasury | | | | | | | | | | |
2 yr. Note | 9 | | | 1,921 | | Dec-08 | | 9 | | |
U.S. Treasury | | | | | | | | | | |
5 yr. Note | 35 | | | 3,928 | | Dec-08 | | 10 | | |
U.S. Treasury | | | | | | | | | | |
10 yr. Note | 68 | | | 7,794 | | Dec-08 | | (63 | ) | |
U.S. Treasury | | | | | | | | | | |
Long Bond | 33 | | | 3,866 | | Dec-08 | | (19 | ) | |
Short: | | | | | | | | | | |
EuroDollar | | | | | | | | | | |
CME | 7 | | | 1,695 | | Sep-09 | | (11 | ) | |
EuroDollar | | | | | | | | | | |
CME | 6 | | | 1,448 | | Dec-09 | | (19 | ) | |
EuroDollar | | | | | | | | | | |
CME | 7 | | | 1,687 | | Mar-10 | | (20 | ) | |
EuroDollar | | | | | | | | | | |
CME | 4 | | | 959 | | Sep-10 | | (8 | ) | |
EuroDollar | | | | | | | | | | |
CME | 3 | | | 717 | | Dec-10 | | (5 | ) | |
Russell Mini | | | | | | | | | | |
Index | 1 | | | 68 | | Dec-08 | | 1 | | |
| | | | | | | | $ | (396 | ) | |
| | | | | | | | | | | | |
| |
CME — Chicago Mercantile Exchange |
18 | The accompanying notes are an integral part of the financial statements. | |
| 2008 Annual Report |
| |
| September 30, 2008 |
Investment Overview (unaudited)
Mid Cap Growth Portfolio
The Mid Cap Growth Portfolio seeks long-term capital growth. The Portfolio seeks long-term capital appreciation by investing primarily in growth-oriented equity securities of U.S. and non-U.S. mid cap companies and foreign companies. The Portfolio selects issues from a universe comprised of mid cap companies, most with market capitalizations of generally less than $35 billion. The Portfolio may invest up to 25% of its net assets in securities of foreign issuers, including issuers located in emerging market countries. The securities in which the Portfolio may invest may be denominated in U.S. dollars or in currencies other than U.S. dollars. Generally speaking, small and mid-capitalization stock prices experience a greater degree of market volatility than those of large-capitalization companies.
Performance
For the fiscal year ended September 30, 2008, the Portfolio’s Class I had a total return based on net asset value and reinvestment of distributions per share of -28.42%, net of fees. The Portfolio’s Class I underperformed against its benchmark the Russell Midcap® Growth Index (the “Index”) which returned - -24.65%.
Factors Affecting Performance
· The Portfolio underperformed the Index due to stock selection decisions and the resulting sector allocations.
· Stock selection and an overweight allocation in the consumer discretionary sector were the most significant detractors. Within the sector, commercial services, hotel/motel, and communications and media were areas of weakness for the Portfolio, despite better results in radio and TV broadcasters and consumer electronics holdings.
· Stock selection in the materials and processing sector was detrimental, primarily due to holdings in agriculture fishing and ranching and in building materials. Avoidance of consumer staples, the best performing Index sector, was also disadvantageous.
· An underweight allocation in the financial services sector was advantageous, but this was more than offset by stock selection within the sector. Holdings in financial information services, rental and leasing services, and securities brokerage and services dampened relative results.
· Stock selection and an underweight allocation in the technology sector had the largest positive effect on relative performance, led by selection in semiconductors and computer technology stocks. The avoidance of communications technology stocks was also advantageous.
· Stock selection in the health care and autos and transportation sectors also added to relative performance. In health care, the Portfolio benefited from its selection in medical systems and drugs and pharmaceuticals stocks, as well as avoidance of the health care management services segment. Within autos and transportation, avoidance of auto trucks and parts stocks, as well as tire and rubber companies was beneficial.
Management Strategies
· In our view, market volatility is far greater than fundamental business volatility. The market is fearful, with investors making little differentiation on fundamentals and quality. The investment team continues to focus on quality — evaluating the nature and sustainability of a company’s competitive advantage and balance sheet strength. At the margin, we have eliminated names that are more cyclical or where we believe there are stronger long-term opportunities. We believe the Portfolio is well positioned for when the market once again begins to differentiate on fundamentals.
· The investment team is looking for high quality growth companies that have the following attributes: high barriers to entry, business visibility, rising return on invested capital, free cash flow and a favorable risk/reward. We strive to find these companies through intense fundamental research. Our emphasis is on secular growth, and as a result, short-term market events are not as meaningful in the stock selection process. It is our goal to hold a portfolio of high quality growth stocks we believe will perform well regardless of the market environment. We continue to favor companies that have some uniqueness or dynamic competitive advantage in their business model, with a high quality stream of cash flow and earnings growth and the ability to redeploy capital at a high rate of return.
2008 Annual Report
September 30, 2008
Investment Overview (cont’d)
Mid Cap Growth Portfolio

* Minimum Investment
In accordance with SEC regulations, the Portfolio’s performance shown assumes that all recurring fees (including management fees) were deducted and all dividends and distributions were reinvested. The performance of Class P shares will vary from the Class I shares based upon their different inception dates and will be negatively impacted by additional fees assessed to that class.
Performance Compared to the Russell Midcap® Growth Index(1) and the Lipper Mid-Cap Growth Funds Index(2)
| | Total Returns(3) | |
| | | | Average Annual | |
| | One | | Five | | Ten | | Since |
| | Year | | Years | | Years | | Inception(6) |
Portfolio – Class I (4) | | (28.42 | )% | 9.45 | % | 7.55 | % | 12.65 | % |
Russell Midcap® Growth Index | | (24.65 | ) | 6.53 | | 5.51 | | 9.38 | |
Lipper Mid-Cap Growth Funds Index | | (24.16 | ) | 7.23 | | 6.01 | | 9.22 | |
| | | | | | | | | |
Portfolio – Class P (5) | | (28.59 | ) | 9.16 | | 7.29 | | 8.65 | |
Russell Midcap® Growth Index | | (24.65 | ) | 6.53 | | 5.51 | | 5.51 | |
Lipper Mid-Cap Growth Funds Index | | (24.16 | ) | 7.23 | | 6.01 | | 4.88 | |
Performance data quoted represents past performance, which is no guarantee of future results, and current performance may be lower or higher than the figures shown. Performance assumes that all dividends and distributions, if any, were reinvested. For the most recent month-end performance figures, please visit www.morganstanley.com/msim. Investment returns and principal value will fluctuate so that Portfolio shares, when redeemed, may be worth more or less than their original cost. Total returns do not reflect the deduction of taxes that a shareholder would pay on Portfolio distributions or the redemption of Portfolio shares. Performance of share classes will vary due to differences in sales charges and expenses.
(1) The Russell Midcap® Growth Index measures the performance of the mid-cap growth segment of the U.S. equity universe. It includes those Russell Midcap® Index companies with higher price-to-book ratios and higher forecasted growth values. The Index is unmanaged and its returns do not include any sales charges or fees. Such costs would lower performance. It is not possible to invest directly in an index.
(2) The Lipper Mid-Cap Growth Funds Index is an equally weighted performance index of the largest qualifying funds (based on net assets) in the Lipper Mid-Cap Growth Funds classification. The Index, which is adjusted for capital gains distributions and income dividends, is unmanaged and should not be considered an investment. There are currently 30 funds represented in this Index. As of the date of this report, the Portfolio was in the Lipper Mid-Cap Growth Funds classification.
(3) Total returns for the Portfolio reflect expenses waived and/or reimbursed, if applicable, by the Adviser. Without such waivers and/or reimbursements, total returns would have been lower. Fee waivers and/or reimbursements are voluntary and the Adviser reserves the right to commence or terminate any waiver and/or reimbursement at any time.
(4) Commenced operations on March 30, 1990.
(5) Commenced operations on January 31, 1997.
(6) For comparative purposes, average annual since inception returns listed for the Indexes refer to the inception date or initial offering of the respective share class of the Portfolio, not the inception of the Indexes.
Portfolio Composition
| | Percentage of |
Classification | | Total Investments |
Consumer Discretionary | | | 28.9 | % |
Technology | | | 12.9 | |
Energy | | | 12.7 | |
Health Care | | | 11.3 | |
Financial Services | | | 9.2 | |
Materials & Processing | | | 7.5 | |
Producer Durables | | �� | 5.9 | |
Other* | | | 8.8 | |
Short-Term Investment | | | 2.8 | |
Total Investments | | | 100.0 | % |
* Industries and/or investment types which do not appear in the above table, as well as those which represent less than 5% of total investments, if applicable, are included in the category labeled “Other”.
20
| 2008 Annual Report |
| |
| September 30, 2008 |
Portfolio of Investments
Mid Cap Growth Portfolio
| | | | Value | |
| | Shares | | (000) | |
Common Stocks (95.0%) | | | | | |
Auto & Transportation (4.8%) | | | | | |
C.H. Robinson Worldwide, Inc. | | 1,638,897 | | $ | 83,518 | |
Expeditors International Washington, Inc. | | 1,515,106 | | 52,786 | |
| | | | 136,304 | |
Chemicals (0.8%) | | | | | |
Intrepid Potash, Inc.(a) | | 772,097 | | 23,271 | |
Consumer Discretionary (28.7%) | | | | | |
Abercrombie & Fitch Co., Class A | | 1,079,771 | | 42,597 | |
Ascent Media Corp., Class A(a) | | 111,240 | | 2,715 | |
Choice Hotels International, Inc. | | 950,395 | | 25,756 | |
Corporate Executive Board Co. | | 1,159,577 | | 36,237 | |
Ctrip.com International Ltd. ADR | | 1,837,430 | | 70,943 | |
Discovery Communications, Inc., Class A(a) | | 1,112,400 | | 15,852 | |
Discovery Communications, Inc., Class C(a) | | 1,112,400 | | 15,752 | |
Grupo Televisa S.A. ADR | | 1,489,431 | | 32,574 | |
Leucadia National Corp. | | 2,448,194 | | 111,246 | |
Li & Fung Ltd. | | 20,434,000 | | 49,905 | |
Lululemon Athletica, Inc.(a) | | 1,150,936 | | 26,506 | |
Monster Worldwide, Inc.(a) | | 1,591,992 | | 23,737 | |
Morningstar, Inc.(a) | | 1,059,805 | | 58,787 | |
New Oriental Education & Technology Group ADR(a) | | 505,727 | | 32,488 | |
Penn National Gaming, Inc.(a) | | 426,749 | | 11,339 | |
Priceline.com, Inc.(a) | | 682,450 | | 46,700 | |
Starbucks Corp.(a) | | 4,196,463 | | 62,401 | |
Strayer Education, Inc. | | 169,254 | | 33,895 | |
Wynn Resorts Ltd. | | 1,430,675 | | 116,800 | |
| | | | 816,230 | |
Energy (12.6%) | | | | | |
PetroHawk Energy Corp.(a) | | 699,166 | | 15,123 | |
Questar Corp. | | 962,674 | | 39,392 | |
Range Resources Corp. | | 795,236 | | 34,092 | |
Southwestern Energy Co.(a) | | 4,059,886 | | 123,989 | |
Ultra Petroleum Corp.(a) | | 2,670,073 | | 147,762 | |
| | | | 360,358 | |
Financial Services (9.1%) | | | | | |
Alleghany Corp.(a) | | 108,311 | | 39,533 | |
Brookfield Asset Management, Inc., Class A | | 1,825,142 | | 50,082 | |
Calamos Asset Management, Inc., Class A | | 1,147,705 | | 20,567 | |
Forest City Enterprises, Inc., Class A | | 1,248,021 | | 38,277 | |
GLG Partners, Inc. | | 2,585,558 | | 14,014 | |
IntercontinentalExchange, Inc.(a) | | 506,593 | | 40,872 | |
Redecard S.A. | | 4,510,842 | | 56,182 | |
| | | | 259,527 | |
Health Care (11.3%) | | | | | |
Gen-Probe, Inc.(a) | | 963,735 | | 51,126 | |
Illumina, Inc.(a) | | 2,634,958 | | 106,795 | |
Intuitive Surgical, Inc.(a) | | 163,194 | | 39,327 | |
Mindray Medical International Ltd. ADR | | 1,392,147 | | 46,957 | |
Techne Corp.(a) | | 1,059,559 | | 76,415 | |
| | | | 320,620 | |
Materials & Processing (7.4%) | | | | | |
Aecom Technology Corp.(a) | | 936,928 | | 22,899 | |
Grupo Aeroportuario del Pacifico S.A. de C.V. ADR | | 1,086,852 | | 27,780 | |
Martin Marietta Materials, Inc. | | 796,374 | | 89,178 | |
Mohawk Industries, Inc.(a) | | 418,148 | | 28,179 | |
Rockwood Holdings, Inc.(a) | | 885,364 | | 22,718 | |
Texas Industries, Inc. | | 498,442 | | 20,366 | |
| | | | 211,120 | |
Producer Durables (5.9%) | | | | | |
Covanta Holding Corp.(a) | | 1,776,070 | | 42,519 | |
Gafisa S.A. ADR | | 1,466,875 | | 37,699 | |
Nalco Holding Co. | | 3,039,976 | | 56,361 | |
NVR, Inc.(a) | | 53,773 | | 30,758 | |
| | | | 167,337 | |
Technology (12.8%) | | | | | |
Akamai Technologies, Inc.(a) | | 1,073,245 | | 18,717 | |
Alibaba.com Ltd.(a) | | 28,218,000 | | 26,144 | |
Baidu.com ADR(a) | | 317,152 | | 78,727 | |
Equinix, Inc.(a) | | 412,341 | | 28,641 | |
IHS, Inc., Class A(a) | | 1,121,538 | | 53,430 | |
Salesforce.com, Inc.(a) | | 947,550 | | 45,861 | |
Tencent Holdings Ltd. | | 11,715,400 | | 84,399 | |
Teradata Corp.(a) | | 1,522,146 | | 29,682 | |
| | | | 365,601 | |
Utilities (1.6%) | | | | | |
NII Holdings, Inc.(a) | | 1,171,928 | | 44,440 | |
Total Common Stocks (Cost $3,146,065) | | | | 2,704,808 | |
Preferred Stock (0.6%) | | | | | |
Health Care (0.6%) | | | | | |
Ironwood Pharmaceutical, Inc.
(Convertible) (Cost $15,974) (a)(d)(l) | | 1,331,207 | | 15,974 | |
Investment Company (1.0%) | | | | | |
Groupe Aeroplan, Inc.
(Cost $39,477) | | 2,236,356 | | 27,717 | |
Short-Term Investment (2.8%) | | | | | |
Investment Company (2.8%) | | | | | |
Morgan Stanley Institutional Liquidity Money Market Portfolio — Institutional Class (Cost $79,591)(p) | | 79,591,234 | | 79,591 | |
Total Investments (99.4%) (Cost$3,281,107)(s) | | | | 2,828,090 | |
Other Assets in Excess of Liabilities (0.6%) | | | | 18,361 | |
Net Assets (100%) | | | | $2,846,451 | |
| | | | | | |
(a) Non-income producing security.
(d) Security was valued at fair value — At September 30, 2008, the Portfolio held $15,974,000 of fair valued securities, representing 0.6% of net assets.
(l) Security has been deemed illiquid at September 30, 2008.
(p) See Note G within the Notes to Financial Statements regarding investment in Morgan Stanley Institutional Liquidity Money Market Portfolio — Institutional Class.
(s) The approximate market value and percentage of the investments, $160,448,000 and 5.7%, respectively, represent the securities that have been fair valued under the fair valuation policy for international investments as described in Note A within the Notes to Financial Statements.
ADR American Depositary Receipt
| The accompanying notes are an integral part of the financial statements. | 21 |
2008 Annual Report
September 30, 2008
Investment Overview (unaudited)
U.S. Mid Cap Value Portfolio
The U.S. Mid Cap Value Portfolio seeks above-average total return over a market cycle of three to five years. The Portfolio invests primarily in common stocks of companies traded on a U.S. securities exchange with capitalizations generally in the range of companies included in the Russell Midcap® Value Index. The Portfolio may purchase stocks that typically do not pay dividends. Generally speaking, small and mid-capitalization stock prices experience a greater degree of market volatility than those of large-capitalization companies.
Performance
For the fiscal year ended September 30, 2008, the Portfolio’s Class I had a total return based on net asset value and reinvestment of distributions per share of -20.07%, net of fees. The Portfolio’s Class I outperformed against its benchmark the Russell Midcap® Value Index (the “Index”) which returned - -20.50%.
Factors Affecting Performance
· The U.S. financial markets declined significantly during the review period as frozen credit markets, declining home values and multi-billion dollar asset writedowns in the financial sector prompted a major loss of confidence. The bankruptcy or forced sale of some of Wall Street’s largest and oldest banks, and the effective nationalization of Fannie Mae, Freddie Mac and AIG led to further panic in the markets, escalating the crisis to a level not seen since the Great Depression. The economy continued to slow, with the headwinds of high energy prices and the tumbling housing market. Tightening credit conditions also prevented consumers and businesses from obtaining loans, which is expected to contribute to further slowing in economic activity.
· In this environment, investors had nowhere to hide. Mid-cap and large-cap equities sustained double-digit declines, and small-caps fared only slightly better. All sectors in the Index were down for the period.
· The financials sector was the largest relative contributor to relative performance, primarily due to stock selection in the insurance group. Additionally, the Portfolio benefited from an underweight in regional banks, as well as a holding in a savings and loan that performed well because it was not involved in subprime mortgages and related securities. Finally, very minimal exposure to real estate investment trusts (REITs) also bolstered relative performance.
· Stock selection in the technology sector was additive, driven by strong performing holdings in software and services, and in technology hardware and equipment.
· A zero weight in the telecommunication services sector also bolstered relative performance.
· However, stock selection in the basic materials sector detracted from relative performance, as the Portfolio held a pulp and paper stock which suffered on softening demand and rising energy costs.
· In the consumer discretionary sector, stock selection in retailing was another source of diminished returns. Here, the Portfolio lost value in an office supplies company that was hurt by missteps in its business plan and difficulty accessing credit.
· Weakness in the consumer staples sector came from stock selection in a pharmaceuticals retailer which investors feared would be unable to refinance its debt in the tighter credit markets.
Management Strategies
· In our view, until the credit market thaws and financial institutions are once again willing to lend to one another, fear will continue to drive the markets. We believe the interventions by the central bank and the federal government are likely to restore the functioning of the financial system but it will take time to work. In the meantime, the markets will likely face further downward pressure.
· That said, the turmoil of the past 18 months has not changed our underlying investment philosophy or our stock selection process. We continue to seek undervalued companies that are experiencing a positive change or catalyst that should have a positive impact on the stock valuation. Such catalysts could be new company management, growth or consolidation within an industry or sector, or new products.
The information contained in this overview regarding specific securities is for informational purposes only and should not be construed as a recommendation to purchase or sell the securities mentioned.
22
| 2008 Annual Report |
| |
| September 30, 2008 |
Investment Overview (cont’d)
U.S. Mid Cap Value Portfolio
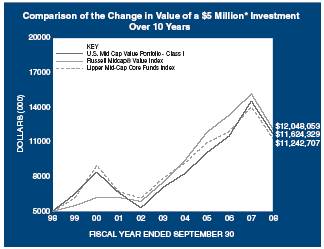
* Minimum Investment
In accordance with SEC regulations, the Portfolio’s performance shown assumes that all recurring fees (including management fees) were deducted and all dividends and distributions were reinvested. The performance of Investment Class and Class P shares will vary from the Class I shares based upon their different inception dates and will be negatively impacted by additional fees assessed to those classes.
Performance Compared to the Russell Midcap® Value Index(1) and the Lipper Mid-Cap Core Funds Index(2)
| | Total Returns(3) | |
| | | Average Annual | |
| | One | | | Five | | Ten | | Since |
| | Year | | Years | | Years | | Inception(7) |
Portfolio – Class I (4) | | (20.07 | )% | 10.49 | % | 8.80 | % | 13.56 | % |
Russell Midcap® Value Index | | (20.50 | ) | 9.97 | | 9.19 | | 12.19 | |
Lipper Mid-Cap Core Funds Index | | (19.93 | ) | 7.40 | | 8.44 | | 9.76 | |
| | | | | | | | | |
Portfolio – Investment Class (5) | | (20.18 | ) | 10.33 | | 8.65 | | 10.91 | |
Russell Midcap® Value Index | | (20.50 | ) | 9.97 | | 9.19 | | 10.35 | |
Lipper Mid-Cap Core Funds Index | | (19.93 | ) | 7.40 | | 8.44 | | 7.85 | |
| | | | | | | | | |
Portfolio – Class P (6) | | (20.29 | ) | 10.21 | | 8.53 | | 6.40 | |
Russell Midcap® Value Index | | (20.50 | ) | 9.97 | | 9.19 | | 7.35 | |
Lipper Mid-Cap Core Funds Index | | (19.93 | ) | 7.40 | | 8.44 | | 5.86 | |
| | | | | | | | | | |
Performance data quoted represents past performance, which is no guarantee of future results, and current performance may be lower or higher than the figures shown. Performance assumes that all dividends and distributions, if any, were reinvested. For the most recent month-end performance figures, please visit www.morganstanley.com/msim. Investment returns and principal value will fluctuate so that Portfolio shares, when redeemed, may be worth more or less than their original cost. Total returns do not reflect the deduction of taxes that a shareholder would pay on Portfolio distributions or the redemption of Portfolio shares. Performance of share classes will vary due to differences in sales charges and expenses.
(1) The Russell Midcap® Value Index measures the performance of the mid-cap value segment of the U.S. equity universe. It includes those Russell Midcap® Index companies with lower price-to-book ratios and lower forecasted growth values. The Index is unmanaged and its returns do not include any sales charges or fees. Such costs would lower performance. It is not possible to invest directly in an index.
(2) The Lipper Mid-Cap Core Funds Index is an equally weighted performance index of the largest qualifying funds (based on net assets) in the Lipper Mid-Cap Core Funds classification. The Index, which is adjusted for capital gains distributions and income dividends, is unmanaged and should be considered an investment. There are currently 30 funds represented in this Index. As of the date of this report, the Portfolio was in the Lipper Mid-Cap Core Funds classification.
(3) Total returns for the Portfolio reflect expenses waived and/or reimbursed, if applicable, by the Adviser. Without such waivers and/or reimbursements, total returns would have been lower. Fee waivers and/or reimbursements are voluntary and the Adviser reserves the right to commence or terminate any waiver and/or reimbursement at any time.
(4) Commenced operations on December 30, 1994.
(5) Commenced operations on May 10, 1996.
(6) Commenced operations on July 17, 1998.
(7) For comparative purposes, average annual since inception returns listed for the Indexes refer to the inception date or initial offering of the respective share class of the Portfolio, not the inception of the Indexes.
Portfolio Composition
| | Percentage of |
Classification | | Total Investments |
Financials | | | 21.5 | % |
Information Technology | | | 12.3 | |
Industrials | | | 11.8 | |
Consumer Discretionary | | | 11.4 | |
Health Care | | | 11.0 | |
Materials | | | 9.0 | |
Utilities | | | 8.8 | |
Consumer Staples | | | 6.6 | |
Other* | | | 3.0 | |
Short-Term Investment | | | 4.6 | |
Total Investments | | | 100.0 | % |
* Industries and/or investment types which do not appear in the above table, as well as those which represent less than 5% of total investments, if applicable, are included in the category labeled “Other”.
23
2008 Annual Report
September 30, 2008
Portfolio of Investments
U.S. Mid Cap Value Portfolio
| | | | Value | |
| | Shares | | (000) | |
Common Stocks (93.3%) | | | | | |
Consumer Discretionary (11.2%) | | | | | |
Apollo Group, Inc., Class A(a) | | 24,471 | | $ | 1,451 | |
Autoliv, Inc. | | 78,500 | | 2,649 | |
Harley-Davidson, Inc. | | 75,781 | | 2,827 | |
Macy’s, Inc. | | 158,500 | | 2,850 | |
Newell Rubbermaid, Inc. | | 221,110 | | 3,816 | |
O’Reilly Automotive, Inc.(a) | | 56,100 | | 1,502 | |
| | | | 15,095 | |
Consumer Staples (6.4%) | | | | | |
ConAgra Foods, Inc. | | 188,550 | | 3,669 | |
Estee Lauder Cos., Inc. (The) | | 100,730 | | 5,028 | |
| | | | 8,697 | |
Energy (2.9%) | | | | | |
El Paso Corp. | | 149,230 | | 1,904 | |
Hess Corp. | | 25,520 | | 2,095 | |
| | | | 3,999 | |
Financials (21.0%) | | | | | |
ACE Ltd. | | 88,047 | | 4,766 | |
Aspen Insurance Holdings Ltd. | | 134,851 | | 3,708 | |
CapitalSource, Inc. REIT | | 290,100 | | 3,568 | |
CIT Group, Inc. | | 383,338 | | 2,668 | |
Invesco Ltd. | | 170,523 | | 3,578 | |
KeyCorp. | | 122,500 | | 1,463 | |
Marsh & McLennan Cos., Inc. | | 170,668 | | 5,420 | |
Northern Trust Corp. | | 45,176 | | 3,262 | |
| | | | 28,433 | |
Health Care (10.7%) | | | | | |
Beckman Coulter, Inc. | | 59,080 | | 4,194 | |
Brookdale Senior Living, Inc. | | 124,300 | | 2,733 | |
Health Management Associates, Inc., Class A(a) | | 513,700 | | 2,137 | |
Healthsouth Corp.(a) | | 296,068 | | 5,457 | |
| | | | 14,521 | |
Industrials (11.5%) | | | | | |
Avery Dennison Corp. | | 85,200 | | 3,790 | |
Goodrich Corp. | | 59,530 | | 2,476 | |
Pentair, Inc. | | 154,320 | | 5,335 | |
Pitney Bowes, Inc. | | 119,610 | | 3,978 | |
| | | | 15,579 | |
Information Technology (12.1%) | | | | | |
Diebold, Inc. | | 136,800 | | 4,529 | |
Flextronics International Ltd.(a) | | 436,887 | | 3,093 | |
Perot Systems Corp., Class A(a) | | 288,230 | | 5,001 | |
Zebra Technologies Corp.(a) | | 133,492 | | 3,718 | |
| | | | 16,341 | |
Materials (8.9%) | | | | | |
Domtar Corp.(a) | | 861,400 | | 3,963 | |
International Flavors & Fragrances, Inc. | | 82,571 | | 3,258 | |
Valspar Corp. | | 213,110 | | 4,750 | |
| | | | 11,971 | |
Utilities (8.6%) | | | | | |
American Electric Power Co., Inc. | | 74,690 | | 2,766 | |
DPL, Inc. | | 79,340 | | 1,968 | |
NRG Energy, Inc.(a) | | 107,800 | | 2,668 | |
Wisconsin Energy Corp. | | 93,440 | | 4,195 | |
| | | | 11,597 | |
Total Common Stocks (Cost $144,525) | | | | 126,233 | |
Short-Term Investment (4.5%) | | | | | |
Investment Company (4.5%) | | | | | |
Morgan Stanley Institutional Liquidity Money Market Portfolio — Institutional Class (Cost $6,068)(p) | | 6,068,386 | | 6,068 | |
Total Investments (97.8%) (Cost $150,593) | | | | 132,301 | |
Other Assets in Excess of Liabilities (2.2%) | | | | 2,957 | |
Net Assets (100%) | | | | $ | 135,258 | |
(a) Non-income producing security.
(p) See Note G within the Notes to Financial Statements regarding investment in Morgan Stanley Institutional Liquidity Money Market Portfolio — Institutional Class.
REIT Real Estate Investment Trust
24 | The accompanying notes are an integral part of the financial statements. | |
| 2008 Annual Report |
| |
| September 30, 2008 |
Investment Overview (unaudited)
U.S. Small Cap Value Portfolio
The U.S. Small Cap Value Portfolio seeks above-average total return over a market cycle of three to five years. The Portfolio invests primarily in common stocks of small capitalization companies traded on a U.S. securities exchange. The Portfolio may purchase stocks that typically do not pay dividends. Generally speaking, small and mid-capitalization stock prices experience a greater degree of market volatility than those of large-capitalization companies.
Performance
For the fiscal year ended September 30, 2008, the Portfolio’s Class I had a total return based on net asset value and reinvestment of distributions per share of -14.34%, net of fees. The Portfolio’s Class I underperformed its benchmark, the Russell 2000® Value Index (the “Index”), which returned - -12.25%.
Factors Affecting Performance
· U.S. equity markets were turbulent, with volatility increasing sharply in the final months of the period as concerns about the credit markets and the global economic slowdown moved front and center.
· A tightening in lending standards following the subprime mortgage market collapse contributed to investors’ worries for most of the period. However, as concerns about the worsening economic backdrop gained momentum, and risk perceptions sharply increased, credit markets froze. Without access to the capital needed to shore up ailing balance sheets, a number of major U.S. financial institutions were left to fail, merge, or be rescued by the federal government. These events triggered a severe loss of confidence in the markets and created a panic environment in the final weeks of September. Furthermore, the federal government’s $700 billion plan failed to ease investors’ panic, even after it was passed by Congress shortly after the end of the period.
· Economic data continued to be mixed throughout the period. Consumer confidence and retail sales data fell as high energy and food prices, declining home values, rising unemployment, and the restrictive credit environment sapped consumers’ buying power. Gross domestic product growth remained sluggish and observers continued to debate whether or not a recession had technically begun. After reaching a high in July, oil prices declined considerably on concerns about falling global demand. While oil’s retreat helped ease global inflation worries, questions about the potential severity of a global economic downturn further roiled the markets.
· Following a strong showing in the third quarter of 2008, small-cap equities finished the 12-month period ahead of large- and mid-caps, although all three segments were down on an absolute basis. Within the small-cap market, value outperformed growth during the period. The Index was driven by the energy, health care and utilities sectors, while autos and transportation, consumer discretionary and technology were the weakest performing groups.
· Positive contributors to the Portfolio’s relative performance included stock selection and an overweight in the health care sector, where a number of holdings in specialty pharmaceuticals and health care services companies helped results.
· Stock selection in the technology sector was another source of gains due to a holding in a defense electronics company, which was acquired at a premium during the period, as well as our relative lack of exposure to weak-performing semiconductor and semiconductor-related stocks.
· In the materials sector, the Portfolio was well positioned with an underweight to areas that struggled such as metals, minerals and gold, while owning better relative performers including a commercial lighting company and a packaging company.
· The Portfolio’s chief detractors included stock selection in the financial services sector. Bank stocks rallied in the third quarter, but the Portfolio’s underweight there held back gains. In addition, the Portfolio had exposure to some insurance stocks which had declining returns.
· Stock selection in the producer durables sector also was a detriment, as a variety of holdings declined due to company-specific events.
· Further relative underperformance came from the consumer discretionary sector. The Portfolio was hurt by an overweight and stock selection in the sector, with particular weakness from the commercial printing, media and restaurant segments.
· Finally, both an underweight and stock selection in the energy sector were unfavorable to relative performance. The Portfolio held more exposure to oil services stocks, which were down for the period, and less exposure to exploration and production stocks, which performed well.
Management Strategies
· During the period, the implementation of our bottom-up stock selection process resulted in slight reductions in the Portfolio’s weightings in the consumer discretionary, energy, and producer durables sectors, and slight increases in health care and technology.
25
2008 Annual Report
September 30, 2008
Investment Overview (cont’d)
U.S. Small Cap Value Portfolio
· Relative to the Index, we maintained a significant underweight in financial services stocks, especially banks and real estate investment trusts (REITs), although insurance and reinsurance remained slightly overweight. The Portfolio had smaller relative underweights in the consumer staples and utilities sectors.
· In contrast, the Portfolio’s largest overweights were in health care, technology, producer durables, and materials and processing.
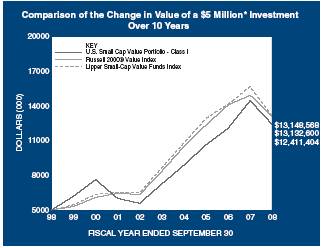
* Minimum Investment
In accordance with SEC regulations, the Portfolio’s performance shown assumes that all recurring fees (including management fees) were deducted and all dividends and distributions were reinvested. The performance of Class P shares will vary from the Class I shares based upon their different inception dates and will be negatively impacted by additional fees assessed to that class.
Performance Compared to the Russell 2000® Value Index(1) and the Lipper Small-Cap Value Funds Index(2)
| | Total Returns(3) | |
| | | Average Annual | |
| | One | | Five | | Ten | | Since |
| | Year | | Years | | Years | | Inception(6) |
Portfolio – Class I (4) | | (14.34 | )% | 11.31 | % | 9.52 | % | 11.00 | % |
Russell 2000® Value Index | | (12.25 | ) | 9.45 | | 10.14 | | 10.81 | |
Lipper Small-Cap Value Funds Index | | (16.35 | ) | 8.65 | | 10.15 | | — | |
Portfolio – Class P (5) | | (14.58 | ) | 11.02 | | — | | 7.99 | |
Russell 2000® Value Index | | (12.25 | ) | 9.45 | | — | | 9.70 | |
Lipper Small-Cap Value Funds Index | | (16.35 | ) | 8.65 | | — | | 9.55 | |
Performance data quoted represents past performance, which is no guarantee of future results, and current performance may be lower or higher than the figures shown. Performance assumes that all dividends and distributions, if any, were reinvested. For the most recent month-end performance figures, please visit www.morganstanley.com/msim. Investment returns and principal value will fluctuate so that Portfolio shares, when redeemed, may be worth more or less than their original cost. Total returns do not reflect the deduction of taxes that a shareholder would pay on Portfolio distributions or the redemption of Portfolio shares. Performance of share classes will vary due to differences in sales charges and expenses.
(1) The Russell 2000® Value Index measures the performance of the small-cap value segment of the U.S. equity universe. It includes those Russell 2000® Index companies with lower price-to-book ratios and lower forecasted growth values. The Index is unmanaged and its returns do not include any sales charges or fees. Such costs would lower performance. It is not possible to invest directly in an index.
(2) The Lipper Small-Cap Value Funds Index is an equally weighted performance index of the largest qualifying funds (based on net assets) in the Lipper Small-Cap Value Funds classification. The Index, which is adjusted for capital gains distributions and income dividends, is unmanaged and should not be considered an investment. There are currently 30 funds represented in this Index. As of the date of this report, the Portfolio was in the Lipper Small-Cap Value Funds classification.
(3) Total returns for the Portfolio reflect expenses waived and/or reimbursed, if applicable, by the Adviser. Without such waivers and/or reimbursements, total returns would have been lower. Fee waivers and/or reimbursements are voluntary and the Adviser reserves the right to commence or terminate any waiver and/or reimbursement at any time.
(4) Commenced operations on July 1, 1986.
(5) Commenced operations on January 22, 1999.
(6) For comparative purposes, average annual since inception returns listed for the Indexes refer to the inception date or initial offering of the respective share class of the Portfolio, not the inception of the Indexes.
Portfolio Composition
| | Percentage of |
Classification | | Total Investments |
Financial Services | | | 16.6 | % |
Consumer Discretionary | | | 14.8 | |
Technology | | | 14.6 | |
Health Care | | | 13.5 | |
Materials & Processing | | | 13.0 | |
Producer Durables | | | 10.7 | |
Auto & Transportation | | | 5.9 | |
Other* | | | 5.7 | |
Short-Term Investment | | | 5.2 | |
Total Investments | | | 100.0 | % |
* Industries and/or investment types which do not appear in the above table, as well as those which represent less than 5% of total investments, if applicable, are included in the category labeled “Other”.
26
| 2008 Annual Report |
| |
| September 30, 2008 |
Portfolio of Investments
U.S. Small Cap Value Portfolio
| | | | Value | |
| | Shares | | (000) | |
Common Stocks (95.5%) | | | | | |
Auto & Transportation (6.0%) | | | | | |
AAR Corp.(a) | | 1,140,271 | | $ 18,917 | |
ATC Technology Corp.(a) | | 441,800 | | 10,488 | |
Forward Air Corp. | | 249,200 | | 6,786 | |
UTI Worldwide, Inc. | | 415,600 | | 7,073 | |
| | | | 43,264 | |
Consumer Discretionary (14.9%) | | | | | |
AFC Enterprises, Inc.(a) | | 614,200 | | 4,459 | |
Brink’s Co. (The) | | 243,800 | | 14,877 | |
Central Garden & Pet Co.(a) | | 325,264 | | 1,913 | |
Cenveo, Inc.(a) | | 965,309 | | 7,423 | |
Denny’s Corp.(a) | | 2,546,180 | | 6,570 | |
Dolan Media Co.(a) | | 520,222 | | 5,249 | |
IKON Office Solutions, Inc. | | 675,463 | | 11,490 | |
LIN TV Corp., Class A(a) | | 530,700 | | 2,738 | |
Maidenform Brands, Inc.(a) | | 374,119 | | 5,428 | |
MAXIMUS, Inc. | | 926,809 | | 34,145 | |
Stage Stores, Inc. | | 542,895 | | 7,416 | |
Viad Corp. | | 202,803 | | 5,839 | |
| | | | 107,547 | |
Energy (1.5%) | | | | | |
Exterran Holdings, Inc.(a) | | 80,455 | | 2,571 | |
St. Mary Land & Exploration Co. | | 79,860 | | 2,847 | |
Superior Energy Services, Inc.(a) | | 164,530 | | 5,124 | |
| | | | 10,542 | |
Financial Services (16.7%) | | | | | |
AerCap Holdings N.V.(a) | | 1,082,000 | | 11,480 | |
Amtrust Financial Services, Inc. | | 654,184 | | 8,890 | |
Argo Group International Holdings Ltd.(a) | | 319,600 | | 11,777 | |
Conseco, Inc.(a) | | 1,732,132 | | 6,097 | |
Employers Holdings, Inc. | | 515,345 | | 8,957 | |
Greenhill & Co., Inc. | | 73,700 | | 5,435 | |
LaSalle Hotel Properties REIT | | 282,600 | | 6,590 | |
Max Capital Group Ltd. | | 494,040 | | 11,477 | |
MB Financial, Inc. | | 89,205 | | 2,950 | |
National Financial Partners Corp. | | 361,100 | | 5,417 | |
Platinum Underwriters Holdings Ltd. | | 307,900 | | 10,924 | |
Potlatch Corp. REIT | | 164,227 | | 7,618 | |
ProAssurance Corp.(a) | | 253,718 | | 14,208 | |
Provident New York Bancorp., Inc. | | 501,000 | | 6,623 | |
Wright Express Corp.(a) | | 73,700 | | 2,200 | |
| | | | 120,643 | |
Health Care (13.6%) | | | | | |
Allscripts Healthcare Solutions, Inc.(a) | | 786,100 | | 9,779 | |
Apria Healthcare Group, Inc.(a) | | 427,430 | | 7,796 | |
Bio-Rad Laboratories, Inc., Class A(a) | | 133,234 | | 13,206 | |
Healthsouth Corp.(a) | | 589,700 | | 10,868 | |
Hill-Rom Holdings, Inc. | | 367,586 | | 11,142 | |
KV Pharmaceutical Co., Class A(a) | | 266,000 | | 6,041 | |
Perrigo Co. | | 342,183 | | 13,160 | |
PharMerica Corp.(a) | | 515,800 | | 11,600 | |
Valeant Pharmaceuticals International(a) | | 705,200 | | 14,436 | |
| | | | 98,028 | |
Materials & Processing (13.1%) | | | | | |
Aecom Technology Corp.(a) | | 197,100 | | 4,817 | |
Albany International Corp., Class A | | 201,300 | | 5,502 | |
CIRCOR International, Inc. | | 197,066 | | 8,559 | |
Cytec Industries, Inc. | | 222,575 | | 8,660 | |
Dayton Superior Corp.(a) | | 674,800 | | 958 | |
Hercules, Inc. | | 635,835 | | 12,584 | |
Orion Marine Group, Inc.(a) | | 257,300 | | 2,699 | |
Polypore International, Inc.(a) | | 286,984 | | 6,173 | |
Quanex Building Products Corp. | | 74,400 | | 1,134 | |
Rock-Tenn Co., Class A | | 294,900 | | 11,790 | |
Schnitzer Steel Industries, Inc., Class A | | 30,100 | | 1,181 | |
Silgan Holdings, Inc. | | 163,900 | | 8,374 | |
Stantec, Inc.(a) | | 325,706 | | 7,752 | |
Zep, Inc. | | 803,536 | | 14,175 | |
| | | | 94,358 | |
Producer Durables (10.8%) | | | | | |
ACCO Brands Corp.(a) | | 779,524 | | 5,878 | |
Actuant Corp., Class A | | 348,400 | | 8,794 | |
Belden, Inc. | | 751,098 | | 23,877 | |
Cognex Corp. | | 492,274 | | 9,923 | |
General Cable Corp.(a) | | 71,700 | | 2,555 | |
John Bean Technologies Corp.(a) | | 442,636 | | 5,604 | |
Moog, Inc., Class A(a) | | 248,600 | | 10,660 | |
Spirit Aerosystems Holdings, Inc., Class A(a) | | 80,200 | | 1,289 | |
TAL International Group, Inc. | | 445,202 | | 9,269 | |
| | | | 77,849 | |
Technology (14.7%) | | | | | |
Adtran, Inc. | | 333,600 | | 6,502 | |
Checkpoint Systems, Inc.(a) | | 596,200 | | 11,220 | |
Cirrus Logic, Inc.(a) | | 859,447 | | 4,684 | |
Electronics for Imaging(a) | | 641,800 | | 8,940 | |
Epicor Software Corp.(a) | | 605,200 | | 4,775 | |
Gartner, Inc.(a) | | 378,100 | | 8,575 | |
Microsemi Corp.(a) | | 293,700 | | 7,483 | |
MSC.Software Corp.(a) | | 980,020 | | 10,487 | |
Ness Technologies, Inc.(a) | | 683,902 | | 7,844 | |
Syniverse Holdings, Inc.(a) | | 805,250 | | 13,375 | |
Tekelec(a) | | 1,029,900 | | 14,408 | |
Zebra Technologies Corp.(a) | | 285,500 | | 7,951 | |
| | | | 106,244 | |
Utilities (4.2%) | | | | | |
ALLETE, Inc. | | 68,000 | | 3,026 | |
Avista Corp. | | 529,021 | | 11,485 | |
Portland General Electric Co. | | 356,400 | | 8,432 | |
UGI Corp. | | 300,700 | | 7,752 | |
| | | | 30,695 | |
Total Common Stocks (Cost $702,150) | | | | 689,170 | |
The accompanying notes are an integral part of the financial statements. | 27 |
2008 Annual Report | |
| |
September 30, 2008 | |
Portfolio of Investments (cont’d)
U.S. Small Cap Value Portfolio
| | | | Value | |
| | Shares | | (000) | |
Short-Term Investment (5.3%) | | | | | |
Investment Company (5.3%) | | | | | |
Morgan Stanley Institutional Liquidity Money Market Portfolio — Institutional Class
(Cost $38,246)(p) | | 38,246,073 | | $ 38,246 | |
Total Investments (100.8%) (Cost $740,396) | | | | 727,416 | |
Liabilities in Excess of Other Assets (-0.8%) | | | | (5,491 | ) |
Net Assets (100%) | | | | $721,925 | |
(a) | | Non-income producing security. |
(p) | | See Note G within the Notes to Financial Statements regarding investment in Morgan Stanley Institutional Liquidity Money Market Portfolio — Institutional Class. |
REIT | | Real Estate Investment Trust |
28 | The accompanying notes are an integral part of the financial statements. |
| 2008 Annual Report |
| |
| September 30, 2008 |
Investment Overview (unaudited)
Value Portfolio
The Value Portfolio seeks above-average total return over a market cycle of three to five years. The Portfolio invests primarily in common stocks of companies with capitalizations generally greater than $1 billion. The Portfolio emphasizes a value style of investing, seeking well established companies that appear undervalued and currently are not being recognized within the market place. The Portfolio may purchase stocks that do not pay dividends. The Portfolio may invest, to a limited extent, in equity securities of foreign issuers, including issuers located in emerging market countries, and may also invest in securities of foreign companies that are listed in the United States on a national exchange. The securities in which the Portfolio may invest may be denominated in U.S. dollars or in currencies other than U.S. dollars.
Performance
For the fiscal year ended September 30, 2008, the Portfolio’s Class I had a total return based on net asset value and reinvestment of distributions per share of -22.51%, net of fees. The Portfolio’s Class I outperformed against the Russell 1000® Value Index, which returned -23.56% and underperformed against the S&P 500® Index, which returned -21.98%.
Factors Affecting Performance
· Market volatility increased profoundly during the period under review as the financial crisis intensified and severely undermined investor confidence. With credit markets in turmoil, billions of dollars in asset writedowns, and stock prices plummeting, several large Wall Street banks were forced to declare bankruptcy, merge, or change status from investment banks to deposit-taking institutions. Furthermore, mortgage giants Fannie Mae and Freddie Mac and insurance company AIG were granted massive federal rescue packages. These events created a panic environment that rippled across all sectors of the market, despite the aggressive and unprecedented intervention by the Federal Reserve and the federal government’s bailout plan (which was passed shortly after the end of the reporting period).
· Investors also remained anxious about the financial crisis’ effect on the already dampened economy. Although oil prices fell from their July highs, consumers and businesses continued to face no apparent bottom to sliding home values and frozen credit markets.
· In this environment, all sectors of the Index had negative returns for the period.
· On a relative basis, the Portfolio benefited most significantly from its overweight to the consumer staples sector, which was built from the bottom-up as are all of the sector weightings. The Portfolio continued to hold a mix of personal care, food and beverage companies.
· Favorable stock selection and a resulting overweight allocation in the materials sector also added to relative performance. The Portfolio’s holdings within the sector included exposure to papers, diversified chemicals and an aluminum company.
· However, a lack of exposure to the energy and utilities sectors continued to be the largest detractor from relative performance.
Management Strategies
· We continue to position the Portfolio from a bottom-up basis, selecting stocks that we believe have reasonable valuations relative to our assessment of fair value.
· Applying our strictly bottom-up approach has resulted in an underweight in financials, an overweight in health care and significant underweights in cyclical sectors such as energy and industrials. This relatively defensive positioning served the Portfolio well in the past few months as cyclical stocks retreated.
· Although we do not position the Portfolio based on macro views, we nevertheless believe the environment is likely to remain difficult for a prolonged period. The crisis has completely reshaped the U.S. financial infrastructure and further consolidation is likely. However, we believe long-term opportunity can arise out of adversity and we continue to closely monitor the stock universe for the same fundamental characteristics we have used in the past.
The information contained in this overview regarding specific securities is for informational purposes only and should not be construed as a recommendation to purchase or sell the securities mentioned.
29
2008 Annual Report | |
| |
September 30, 2008 | |
Investment Overview (cont’d)
Value Portfolio

* Minimum Investment
In accordance with SEC regulations, the Portfolio’s performance shown assumes that all recurring fees (including management fees) were deducted and all dividends and distributions were reinvested. The performance of Class P shares will vary from the Class I shares based upon their different inception dates and will be negatively impacted by additional fees assessed to that class.
Performance Compared to the Russell 1000® Value Index(1), S&P 500® Index(2), and Lipper Large-Cap Value Funds Index(3)
| | Total Returns(4) | |
| | | | Average Annual | |
| | One | | Five | | Ten | | Since |
| | Year | | Years | | Years | | Inception(7) |
Portfolio – Class I (5) | | (22.51 | )% | 5.96 | % | 5.77 | % | 11.40 | % |
Russell 1000® Value Index | | (23.56 | ) | 7.12 | | 5.55 | | 11.88 | |
S&P 500® Index | | (21.98 | ) | 5.17 | | 3.06 | | 11.10 | |
Lipper Large-Cap Value Funds Index | | (23.89 | ) | 5.47 | | 3.72 | | 10.50 | |
| | | | | | | | | |
Portfolio – Class P (6) | | (22.65 | ) | 5.71 | | 5.51 | | 6.76 | |
Russell 1000® Value Index | | (23.56 | ) | 7.12 | | 5.55 | | 8.57 | |
S&P 500® Index | | (21.98 | ) | 5.17 | | 3.06 | | 6.89 | |
Lipper Large-Cap Value Funds Index | | (23.89 | ) | 5.47 | | 3.72 | | 6.56 | |
Performance data quoted represents past performance, which is no guarantee of future results, and current performance may be lower or higher than the figures shown. Performance assumes that all dividends and distributions, if any, were reinvested. For the most recent month-end performance figures, please visit www.morganstanley.com/msim. Investment returns and principal value will fluctuate so that Portfolio shares, when redeemed, may be worth more or less than their original cost. Total returns do not reflect the deduction of taxes that a shareholder would pay on Portfolio distributions or the redemption of Portfolio shares. Performance of share classes will vary due to differences in sales charges and expenses.
(1) | | The Russell 1000® Value Index measures the performance of the large-cap value segment of the U.S. equity universe. It includes those Russell 1000® Index companies with lower price-to-book ratios and lower expected growth values. The Index is unmanaged and its returns do not include any sales charges or fees. Such costs would lower performance. It is not possible to invest directly in an index. |
(2) | | The Standard & Poor’s 500® Index (S&P 500®) measures the performance of the large cap segment of the U.S. equities market, covering approximately 75% of the U.S. equities market. The index includes 500 leading companies in leading industries of the U.S. economy. The Index is unmanaged and its returns do not include any sales charges or fees. Such costs would lower performance. It is not possible to invest directly in an index. |
(3) | | The Lipper Large-Cap Value Funds Index is an equally weighted performance index of the largest qualifying funds (based on net assets) in the Lipper Large-Cap Value Funds classification. The Index, which is adjusted for capital gains distributions and income dividends, is unmanaged and should not be considered an investment. There are currently 30 funds represented in this Index. As of the date of this report, the Portfolio was in the Lipper Large-Cap Value Funds classification. |
(4) | | Total returns for the Portfolio reflect expenses waived and/or reimbursed, if applicable, by the Adviser. Without such waivers and/or reimbursements, total returns would have been lower. Fee waivers and/or reimbursements are voluntary and the Adviser reserves the right to commence or terminate any waiver and/or reimbursement at any time. |
(5) | | Commenced operations on November 5, 1984. |
(6) | | Commenced operations on July 17, 1996. |
(7) | | For comparative purposes, average annual since inception returns listed for the Indexes refer to the inception date or initial offering of the respective share class of the Portfolio, not the inception of the Indexes. |
Portfolio Composition*
| | Percentage of | |
Classification | | Total Investments | |
Financials | | | 25.5 | % | |
Consumer Staples | | | 19.8 | | |
Consumer Discretionary | | | 16.1 | | |
Health Care | | | 14.6 | | |
Information Technology | | | 8.9 | | |
Materials | | | 6.4 | | |
Telecommunication Services | | | 5.3 | | |
Other** | | | 2.3 | | |
Short-Term Investment | | | 1.1 | | |
Total Investments | | | 100.0 | % | |
* Percentages indicated are based upon total investments (excluding Securities held as collateral on Loaned Securities) as of September 30, 2008.
** Industries and/or investment types which do not appear in the above table, as well as those which represent less than 5% of total investments, if applicable, are included in the category labeled “Other”.
| 2008 Annual Report |
| |
| September 30, 2008 |
Portfolio of Investments
Value Portfolio
| | | | Value | |
| | Shares | | (000) | |
Common Stocks (98.0%) | | | | | |
Consumer Discretionary (16.0%) | | | | | |
Comcast Corp., Class A(c) | | 367,700 | | $ 7,218 | |
Home Depot, Inc.(c) | | 44,600 | | 1,155 | |
J.C. Penney Co., Inc. | | 35,900 | | 1,197 | |
Liberty Media Corp. - Entertainment, Class A(a) | | 102,100 | | 2,549 | |
Liberty Media Corp. - Interactive, Class A(a) | | 132,900 | | 1,716 | |
Lowe’s Cos., Inc. | | 58,900 | | 1,395 | |
Macy’s, Inc. | | 66,900 | | 1,203 | |
News Corp., Inc., Class B | | 168,847 | | 2,051 | |
Time Warner, Inc. | | 411,500 | | 5,395 | |
Viacom, Inc., Class B(a) | | 219,050 | | 5,441 | |
| | | | 29,320 | |
Consumer Staples (19.6%) | | | | | |
Altria Group, Inc. | | 61,700 | | 1,224 | |
Cadbury plc ADR | | 95,092 | | 3,893 | |
Coca-Cola Co. (The) | | 73,900 | | 3,908 | |
CVS Caremark Corp. | | 57,800 | | 1,945 | |
Dr. Pepper Snapple Group, Inc.(a) | | 54,644 | | 1,447 | |
Kimberly-Clark Corp. | | 46,200 | | 2,996 | |
Kraft Foods, Inc. | | 175,350 | | 5,743 | |
Philip Morris International, Inc. | | 34,900 | | 1,679 | |
Procter & Gamble Co. | | 17,600 | | 1,226 | |
Sara Lee Corp. | | 66,000 | | 834 | |
Unilever N.V. (NY Shares) | | 175,300 | | 4,936 | |
Wal-Mart Stores, Inc. | | 102,000 | | 6,109 | |
| | | | 35,940 | |
Financials (25.2%) | | | | | |
Aflac, Inc. | | 12,900 | | 758 | |
Bank of America Corp. | | 211,000 | | 7,385 | |
Bank of New York Mellon Corp. (The) | | 122,946 | | 4,006 | |
Barclays plc ADR(c) | | 10,400 | | 257 | |
Berkshire Hathaway, Inc., Class B(a) | | 430 | | 1,890 | |
Chubb Corp. | | 119,680 | | 6,570 | |
Citigroup, Inc. | | 242,900 | | 4,982 | |
Genworth Financial, Inc. | | 35,900 | | 309 | |
Goldman Sachs Group, Inc. (The) | | 4,900 | | 627 | |
Hartford Financial Services Group, Inc. | | 45,400 | | 1,861 | |
JPMorgan Chase & Co. | | 93,300 | | 4,357 | |
Merrill Lynch & Co., Inc. | | 35,800 | | 906 | |
MetLife, Inc. | | 44,600 | | 2,498 | |
PNC Financial Services Group, Inc. | | 26,000 | | 1,942 | |
Torchmark Corp. | | 26,600 | | 1,591 | |
Travelers Cos., Inc. (The) | | 49,315 | | 2,229 | |
U.S. Bancorp(c) | | 37,300 | | 1,343 | |
Wells Fargo & Co.(c) | | 76,900 | | 2,886 | |
| | | | 46,397 | |
Health Care (14.5%) | | | | | |
Abbott Laboratories | | 26,200 | | 1,509 | |
Boston Scientific Corp.(a) | | 143,000 | | 1,754 | |
Bristol-Myers Squibb Co. | | 281,500 | | 5,869 | |
Cardinal Health, Inc. | | 63,200 | | 3,114 | |
Eli Lilly & Co.(c) | | 45,600 | | 2,008 | |
GlaxoSmithKline plc ADR(c) | | 27,300 | | 1,186 | |
Pfizer, Inc. | | 183,500 | | 3,384 | |
Roche Holding AG ADR | | 8,400 | | 654 | |
Schering-Plough Corp. | | 192,800 | | 3,561 | |
UnitedHealth Group, Inc. | | 25,000 | | 635 | |
WellPoint, Inc.(a) | | 15,900 | | 744 | |
Wyeth | | 59,900 | | 2,213 | |
| | | | 26,631 | |
Industrials (2.3%) | | | | | |
General Electric Co. | | 84,700 | | 2,160 | |
Southwest Airlines Co.(c) | | 137,500 | | 1,995 | |
| | | | 4,155 | |
Information Technology (8.8%) | | | | | |
Alcatel-Lucent ADR(a) | | 137,400 | | 528 | |
Computer Sciences Corp.(a) | | 20,827 | | 837 | |
Dell, Inc.(a) | | 103,800 | | 1,711 | |
eBay, Inc.(a) | | 149,800 | | 3,353 | |
Flextronics International Ltd.(a) | | 54,300 | | 384 | |
Hewlett-Packard Co. | | 36,300 | | 1,678 | |
Intel Corp. | | 64,500 | | 1,208 | |
International Business Machines Corp. | | 29,800 | | 3,485 | |
KLA-Tencor Corp.(c) | | 26,900 | | 851 | |
Microsoft Corp. | | 37,500 | | 1,001 | |
Telefonaktiebolaget LM Ericsson ADR(c) | | 63,700 | | 601 | |
Western Union Co. (The) | | 22,200 | | 548 | |
| | | | 16,185 | |
Materials (6.3%) | | | | | |
Alcoa, Inc. | | 21,700 | | 490 | |
E.I. Du Pont de Nemours & Co. | | 79,300 | | 3,196 | |
International Paper Co. | | 305,123 | | 7,988 | |
| | | | 11,674 | |
Telecommunication Services (5.3%) | | | | | |
AT&T, Inc. | | 125,400 | | 3,501 | |
Verizon Communications, Inc. | | 193,100 | | 6,197 | |
| | | | 9,698 | |
Total Common Stocks (Cost $191,803) | | | | 180,000 | |
Short-Term Investments (5.8%) | | | | | |
Securities held as Collateral on Loaned Securities (4.8%) | | | | | |
Investment Company (4.3%) | | | | | |
Morgan Stanley Institutional Liquidity Money Market Portfolio — Institutional Class(p) | | 7,899,145 | | 7,899 | |
| | | | | |
| | Face | | | |
| | Amount | | | |
| | (000) | | | |
Short-Term Debt (0.5%) | | | | | |
Bancaja,
2.96%, 11/12/08(h) | | $ 168 | | 168 | |
Citigroup Global Markets, Inc.,
1.00%, 10/1/08 | | 742 | | 742 | |
| | | | 910 | |
| | | | 8,809 | |
The accompanying notes are an integral part of the financial statements. | 31 |
2008 Annual Report | |
| |
September 30, 2008 | |
Portfolio of Investments (cont’d)
Value Portfolio
| | | | Value | |
| | Shares | | (000) | |
Investment Company (1.0%) | | | | | |
Morgan Stanley Institutional Liquidity Government Portfolio — Institutional Class(p) | | 1,911,365 | | $ 1,911 | |
Total Short-Term Investments (Cost $10,720) | | | | 10,720 | |
Total Investments (103.8%) (Cost $202,523) — including $7,754 of Securities Loaned | | | | 190,720 | |
Liabilities in Excess of Other Assets (-3.8%) | | | | (6,990 | ) |
Net Assets (100%) | | | | $183,730 | |
(a) | | Non-income producing security. |
(c) | | All or a portion of security on loan at September 30, 2008. |
(h) | | Variable/Floating Rate Security — Interest rate changes on these instruments are based on changes in a designated rate. The rates shown are those in effect on September 30, 2008. |
(p) | | See Note G within the Notes to Financial Statements regarding investment in Morgan Stanley Institutional Liquidity Government Portfolio — Institutional Class and Morgan Stanley Institutional Liquidity Money Market Portfolio — Institutional Class. |
ADR | | American Depositary Receipt |
32 | The accompanying notes are an integral part of the financial statements. |
| 2008 Annual Report |
| |
| September 30, 2008 |
Investment Overview (unaudited)
Core Fixed Income Portfolio
The Core Fixed Income Portfolio seeks above-average total return over a market cycle of three to five years. The Portfolio invests primarily in a diversified mix of U.S. dollar-denominated fixed income securities, particularly U.S. government, corporate and mortgage securities. The Portfolio will ordinarily seek to maintain an average weighted maturity between five and ten years. Although there is no minimum or maximum maturity for any individual security, the Adviser actively manages the interest rate risk of the Portfolio within a range relative to its benchmark. The securities in which the Portfolio invests carry an investment grade rating or, if unrated, are determined to be of a comparable quality by the Adviser at the time of purchase. The Portfolio may invest in to-be-announced pass-through mortgage securities, which settle on a delayed delivery basis (“TBA”). The Portfolio may invest in asset-backed securities and may use futures, options, forwards, collateralized mortgage obligations (“CMO”), swaps, options on swaps and other derivatives.
Performance
For the fiscal year ended September 30, 2008, the Portfolio’s Class I had a total return based on net asset value and reinvestment of distributions per share of -10.40%, net of fees. The Portfolio’s Class I underperformed against its benchmark the Lehman Brothers U.S. Aggregate Index (the “Index”) which returned 3.65%.
Factors Affecting Performance
· The financial markets were under pressure throughout the period amid disrupted credit markets, ongoing deterioration of the housing market, losses in the financial sector, and growing fears of recession.
· The third quarter of 2008, however, will most certainly go down as a defining moment in the history of the financial industry. Investor confidence plummeted and credit markets seized as several venerable financial institutions were forced into mergers or dissolved entirely in September, resulting in significant price erosion across all but the U.S. Treasury sector.
· The primary detractor from the Portfolio’s relative performance was an overweight to non-agency mortgage securities as spreads in the sector moved wider over the course of the reporting period.
· An underweight in corporate credits for much of the period, however, was additive to relative performance as credit spreads significantly widened, particularly in the financial sector.
· Yield-curve positioning was also beneficial to performance as it enabled the Portfolio to benefit from the steepening of the yield curve that occurred during the reporting year.
Management Strategies
· The Portfolio maintained a neutral exposure to agency mortgage-backed securities and an overweight to non-agency mortgage-backed securities. The specific non-agency issues held in the Portfolio are backed primarily by Alt-A borrowers (those who have relatively strong credit but are not considered “prime” borrowers) and are concentrated in the senior and middle tranches of the capital structure. Given our expectations that the housing market situation may take some time to work itself out and therefore, these securities would continue to add volatility, we began reducing the Portfolio’s exposure to non-agency mortgage-backed securities in the third quarter of 2008.
· With regard to yield-curve positioning, we underweighted longer-dated issues and overweighted intermediate-dated issues in the first half of 2008, a strategy that helped enhance returns as the spread between intermediate- and long-dated yields widened and the curve steepened. This trade was removed during the third quarter of the year and as a result, the Portfolio held a neutral duration, or interest-rate sensitivity, at the end of the period.
· During 2007 and into the first quarter of 2008, we maintained an underweight allocation to corporate credits with an emphasis on high-quality names. In response to sharp spread widening later in the period, this position was brought to a neutral stance.
2008 Annual Report | |
| |
September 30, 2008 | |
Investment Overview (cont’d)
Core Fixed Income Portfolio

* Minimum Investment
In accordance with SEC regulations, the Portfolio’s performance shown assumes that all recurring fees (including management fees) were deducted and all dividends and distributions were reinvested. The performance of Class P shares will vary from the Class I shares based upon their different inception dates and will be negatively impacted by additional fees assessed to that class.
Performance Compared to the Lehman Brothers U.S. Aggregate Index(1) and the Lipper Intermediate Investment Grade Debt Funds Index(2)
| | | | Total Returns(3) | |
| | | | Average Annual | |
| | One | | Five | | Ten | | Since |
| | Year | | Years | | Years | | Inception(6) |
Portfolio – Class I (4) | | (10.40 | )% | 1.18 | % | 3.61 | % | 6.91 | % |
Lehman Brothers U.S. Aggregate Index | | 3.65 | | 3.78 | | 5.20 | | 7.51 | |
Lipper Intermediate Investment Grade Debt Funds Index | | (2.43 | ) | 2.46 | | 4.28 | | — | |
| | | | | | | | | |
Portfolio – Class P (5) | | (10.68 | ) | 0.92 | | — | | 3.61 | |
Lehman Brothers U.S. Aggregate Index | | 3.65 | | 3.78 | | — | | 5.55 | |
Lipper Intermediate Investment Grade Debt Funds Index | | (2.43 | ) | 2.46 | | — | | 4.63 | |
| | | | | | | | | | |
Performance data quoted represents past performance, which is no guarantee of future results, and current performance may be lower or higher than the figures shown. Performance assumes that all dividends and distributions, if any, were reinvested. For the most recent month-end performance figures, please visit www.morganstanley.com/msim. Investment returns and principal value will fluctuate so that Portfolio shares, when redeemed, may be worth more or less than their original cost. Total returns do not reflect the deduction of taxes that a shareholder would pay on Portfolio distributions or the redemption of Portfolio shares. Performance of share classes will vary due to differences in sales charges and expenses.
(1) | | The Lehman Brothers U.S. Aggregate Index tracks the performance of all U.S. government agency and Treasury securities, investment-grade corporate debt securities, agency mortgage-backed securities, asset-backed securities and commercial mortgage-backed securities. The Index is unmanaged and its returns do not include any sales charges or fees. Such costs would lower performance. It is not possible to invest directly in an index. |
(2) | | The Lipper Intermediate Investment Grade Debt Funds Index is an equally weighted performance index of the largest qualifying funds (based on net assets) in the Lipper Intermediate Investment Grade Debt Funds classification. The Index, which is adjusted for capital gains distributions and income dividends, is unmanaged and should not be considered an investment. There are currently 30 funds represented in this Index. As of the date of this report, the Portfolio was in the Lipper Intermediate Investment Grade Debt Funds classification. |
(3) | | Total returns for the Portfolio reflect expenses waived and/or reimbursed, if applicable, by the Adviser. Without such waivers and/or reimbursements, total returns would have been lower. Fee waivers and/or reimbursements are voluntary and the Adviser reserves the right to commence or terminate any waiver and/or reimbursement at any time. |
(4) | | Commenced operations on September 29, 1987. |
(5) | | Commenced operations on March 1, 1999. |
(6) | | For comparative purposes, average annual since inception returns listed for the Indexes refer to the inception date or initial offering of the respective share class of the Portfolio, not the inception of the Indexes. |
Portfolio Composition*
| | Percentage of |
Classification | | Total Investments |
Agency Fixed Rate Mortgages | | | 43.4 | % |
Asset Backed Corporates | | | 12.4 | |
Industrials | | | 8.5 | | |
Other** | | | 20.3 | | |
Short-Term Investments | | | 15.4 | | |
Total Investments | | | 100.0 | % |
* | | Percentages indicated are based upon total investments (excluding Securities held as collateral on Loaned Securities) as of September 30, 2008. |
** | | Industries and/or investment types which do not appear in the above table, as well as those which represent less than 5% of total investments, if applicable, are included in the category labeled “Other”. |
34 | The accompanying notes are an integral part of the financial statements. |
| 2008 Annual Report |
| |
| September 30, 2008 |
Portfolio of Investments
Core Fixed Income Portfolio
| | Face | | | |
| | Amount | | Value | |
| | (000) | | (000) | |
Fixed Income Securities (107.6%) | | | | | |
Agency Adjustable Rate Mortgages (4.5%) | | | | | |
Federal Home Loan Mortgage Corp., | | | | | |
Conventional Pools: | | | | | |
5.54%, 4/1/37 | | $ 1,276 | | $ 1,296 | |
5.70%, 1/1/37 | | 1,719 | | 1,745 | |
5.86%, 10/1/36 | | 1,087 | | 1,115 | |
5.97%, 1/1/37 | | 702 | | 718 | |
Federal National Mortgage Association,
Conventional Pools: | | | | | |
5.28%, 5/1/36 | | 929 | | 945 | |
5.33%, 7/1/36 | | 787 | | 801 | |
5.34%, 7/1/36 | | 1,022 | | 1,040 | |
Government National Mortgage Association,
Various Pools: | | | | | |
5.13%, 10/20/27 - 12/20/27 | | 20 | | 21 | |
5.38%, 2/20/25 - 1/20/28 | | 561 | | 569 | |
5.63%, 8/20/25 - 9/20/27 | | 155 | | 157 | |
| | | | 8,407 | |
Agency Fixed Rate Mortgages (55.2%) | | | | | |
Federal Home Loan Mortgage Corp.,
Conventional Pools: | | | | | |
5.13%, 11/17/17 | | 4,050 | | 4,181 | |
10.00%, 10/1/12 - 11/1/20 | | 12 | | 14 | |
11.50%, 8/1/19 | | 16 | | 18 | |
Gold Pools: | | | | | |
5.50%, 5/1/37 - 10/1/37 | | 14,809 | | 14,744 | |
6.00%, 8/1/37 | | 7,438 | | 7,538 | |
6.50%, 2/1/29 - 4/1/29 | | 81 | | 84 | |
7.50%, 2/1/30 - 6/1/32 | | 428 | | 464 | |
8.00%, 10/1/29 - 10/1/31 | | 354 | | 384 | |
8.50%, 3/1/30 - 7/1/31 | | 163 | | 181 | |
10.00%, 6/1/17 - 3/1/21 | | 55 | | 62 | |
October TBA: | | | | | |
5.50%, 10/15/38(i) | | 8,550 | | 8,506 | |
6.00%, 10/15/38(i) | | 16,710 | | 16,916 | |
Federal National Mortgage Association, | | | | | |
5.38%, 6/12/17(c) | | 2,750 | | 2,888 | |
Conventional Pools: | | | | | |
5.00%, 5/11/17 - 8/1/37(c) | | 5,562 | | 5,499 | |
5.50%, 4/1/34 | | 401 | | 402 | |
6.50%, 7/1/29 - 2/1/33 | | 1,526 | | 1,578 | |
7.00%, 2/1/26 - 6/1/36 | | 5,734 | | 6,024 | |
7.50%, 7/1/29 - 9/1/35 | | 2,302 | | 2,486 | |
8.00%, 4/1/25 - 4/1/32 | | 1,522 | | 1,652 | |
8.50%, 5/1/23 - 5/1/32 | | 1,174 | | 1,295 | |
9.00%, 4/1/26 | | 241 | | 266 | |
9.50%, 2/1/20 - 8/1/21 | | 133 | | 149 | |
10.00%, 8/1/18 - 2/1/25 | �� | 20 | | 23 | |
10.50%, 11/1/10 - 10/1/18 | | 23 | | 27 | |
11.00%, 9/1/19 - 9/1/20 | | 30 | | 34 | |
11.50%, 11/1/19 | | 29 | | 33 | |
October TBA: | | | | | |
4.50%, 10/25/23(i) | | 6,000 | | 5,848 | |
5.00%, 10/25/23 - 10/25/38(i) | | 7,850 | | 7,756 | |
5.50%, 10/25/38(i) | | 2,940 | | 2,932 | |
6.00%, 10/15/37(i) | | 750 | | 760 | |
6.50%, 10/25/38(i) | | 6,363 | | 6,525 | |
7.00%, 10/25/38(i) | | 2,850 | | 2,978 | |
Government National Mortgage Association,
Various Pools: | | | | | |
9.00%, 11/15/17 | | 26 | | 29 | |
9.50%, 12/15/17 - 12/15/21 | | 178 | | 197 | |
10.00%, 9/15/18 - 4/15/25 | | 184 | | 208 | |
10.50%, 11/15/14 - 2/15/25 | | 306 | | 350 | |
11.00%, 12/15/09 - 7/15/20 | | 33 | | 37 | |
11.50%, 4/15/13 - 8/15/13 | | 21 | | 23 | |
12.00%, 12/15/12 - 3/15/14 | | 6 | | 7 | |
| | | | 103,098 | |
Asset Backed Corporates (15.8%) | | | | | |
Argent Securities, Inc., | | | | | |
3.26%, 10/25/36(h) | | 629 | | 615 | |
Bayview Financial Acquisition Trust, | | | | | |
3.82%, 11/28/36(h) | | 215 | | 212 | |
Bear Stearns Asset Backed Securities Trust, | | | | | |
3.31%, 1/25/37(h) | | 643 | | 591 | |
Capital Auto Receivables Asset Trust, | | | | | |
2.50%, 4/15/11(h) | | 1,600 | | 1,561 | |
2.55%, 7/15/10(h) | | 2,175 | | 2,153 | |
4.98%, 5/15/11 | | 1,679 | | 1,663 | |
5.03%, 10/15/09 | | 180 | | 180 | |
5.31%, 10/20/09(e) | | 584 | | 584 | |
Capital One Auto Finance Trust, | | | | | |
5.07%, 7/15/11 | | 589 | | 574 | |
Caterpillar Financial Asset Trust, | | | | | |
5.57%, 5/25/10 | | 343 | | 344 | |
CIT Equipment Collateral, | | | | | |
5.07%, 2/20/10 | | 771 | | 771 | |
Citibank Credit Card Issuance Trust, | | | | | |
3.19%, 3/22/12(h) | | 1,025 | | 1,000 | |
Citicorp Residential Mortgage Securities, Inc., | | | | | |
3.29%, 9/25/36(h) | | 179 | | 178 | |
CNH Equipment Trust, | | | | | |
5.20%, 6/15/10 | | 320 | | 321 | |
Countrywide Asset Backed Certificates, | | | | | |
3.36%, 5/25/36(h) | | 90 | | 89 | |
Fieldstone Mortgage Investment Corp., | | | | | |
3.28%, 11/25/36(h) | | 927 | | 883 | |
First Franklin Mortgage Loan Asset Backed Certificates, | | | | | |
3.26%, 7/25/36(h) | | 324 | | 320 | |
Ford Credit Auto Owner Trust, | | | | | |
2.50%, 4/15/10(h) | | 1,514 | | 1,510 | |
5.26%, 10/15/10 | | 1,521 | | 1,524 | |
The accompanying notes are an integral part of the financial statements. | 35 |
2008 Annual Report | |
| |
September 30, 2008 | |
Portfolio of Investments (cont’d)
Core Fixed Income Portfolio
| | Face | | | |
| | Amount | | Value | |
| | (000) | | (000) | |
Asset Backed Corporates (cont’d) | | | | | |
Fremont Home Loan Owner Trust, | | | | | |
3.26%, 10/25/36(h) | | $ 1,002 | | $ 958 | |
GE Equipment Small Ticket LLC, | | | | | |
4.88%, 10/22/09(e) | | 131 | | 131 | |
GS Auto Loan Trust, | | | | | |
5.37%, 12/15/10 | | 1,256 | | 1,257 | |
GSAMP Trust, | | | | | |
3.28%, 1/25/37(h) | | 555 | | 524 | |
Harley-Davidson Motorcycle Trust, | | | | | |
3.76%, 12/17/12 | | 964 | | 904 | |
4.07%, 2/15/12 | | 707 | | 704 | |
Hertz Vehicle Financing LLC, | | | | | |
4.93%, 2/25/10(e) | | 688 | | 677 | |
Honda Auto Receivables Owner Trust, | | | | | |
4.85%, 10/19/09 | | 101 | | 101 | |
Hyundai Auto Receivables Trust, | | | | | |
3.98%, 11/16/09 | | 1 | | 1 | |
MBNA Master Credit Card Trust, | | | | | |
7.80%, 10/15/12 | | 1,480 | | 1,548 | |
National City Auto Receivables Trust, | | | | | |
2.88%, 5/15/11 | | 203 | | 203 | |
Novastar Home Equity Loan, | | | | | |
3.28%, 11/25/36(h) | | 51 | | 51 | |
Residential Asset Mortgage Products, Inc., | | | | | |
3.28%, 8/25/36(h) | | 436 | | 426 | |
Residential Asset Securities Corp., | | | | | |
3.29%, 10/25/36(h) | | 329 | | 325 | |
Securitized Asset Backed Receivables LLC Trust, | | | | | |
3.29%, 11/25/36(h) | | 888 | | 856 | |
3.32%, 2/25/37(h) | | 1,129 | | 1,054 | |
3.34%, 5/25/37(h) | | 1,095 | | 962 | |
SLM Student Loan Trust, | | | | | |
2.79%, 10/27/14(h) | | 1,052 | | 1,042 | |
Soundview Home Equity Loan Trust, | | | | | |
3.29%, 1/25/37(h) | | 466 | | 455 | |
3.32%, 2/25/37(h) | | 1,002 | | 927 | |
Structured Asset Securities Corp., | | | | | |
3.30%, 6/25/37(h) | | 1,066 | | 969 | |
TXU Electric Delivery Transition Bond Co. LLC, | | | | | |
4.81%, 11/17/14 | | 300 | | 303 | |
| | | | 29,451 | |
Collateralized Mortgage Obligations — Agency Collateral Series (1.4%) | | | | | |
Federal Home Loan Mortgage Corp., | | | | | |
Inv Fl IO REMIC | | | | | |
3.50%, 3/15/24 | | 405 | | 27 | |
6.06%, 10/15/29 | | 10 | | — | @ |
IO | | | | | |
6.00%, 5/1/31 | | 525 | | 106 | |
6.50%, 4/1/28 | | 473 | | 126 | |
8.00%, 1/1/28 - 6/1/31 | | 59 | | 17 | |
IO REMIC | | | | | |
5.00%, 12/15/16 | | 750 | | 40 | |
6.50%, 5/15/33 | | 506 | | 99 | |
Federal National Mortgage Association, | | | | | |
Inv FI IO REMIC | | | | | |
4.99%, 10/25/28 | | 249 | | 11 | |
5.05%, 2/17/31 | | 274 | | 21 | |
Inv Fl REMIC | | | | | |
3.27%, 12/25/36 | | 952 | | 917 | |
IO | | | | | |
8.00%, 4/1/24 - 12/1/31 | | 411 | | 104 | |
9.00%, 11/1/26 | | 26 | | 8 | |
IO PAC REMIC | | | | | |
8.00%, 8/18/27 | | 24 | | 5 | |
IO REMIC | | | | | |
1.42%, 3/25/36 | | 4,018 | | 60 | |
6.00%, 8/25/32 - 11/25/32 | | 735 | | 60 | |
6.50%, 2/25/33 - 5/25/33 | | 1,282 | | 254 | |
7.00%, 4/25/33 | | 468 | | 87 | |
REMIC | | | | | |
5.00%, 6/25/35 | | 501 | | 500 | |
Government National Mortgage Association, | | | | | |
Inv FI IO | | | | | |
5.09%, 9/16/31 | | 54 | | 5 | |
5.31%, 9/20/30 | | 61 | | 7 | |
5.46%, 12/16/25 | | 358 | | 45 | |
5.50%, 9/16/27 | | 172 | | 22 | |
6.11%, 8/16/29 | | 323 | | 42 | |
| | | | 2,563 | |
Collateralized Mortgage Obligations — Non Agency Collateral Series (1.5%) | | | | | |
Countrywide Alternative Loan Trust, | | | | | |
IO | | | | | |
0.91%, 9/25/35 | | 7,300 | | 119 | |
2.18%, 3/20/46 | | 4,310 | | 132 | |
2.40%, 12/20/46 | | 13,891 | | 425 | |
2.51%, 12/20/35(e)(h) | | 4,691 | | 120 | |
2.54%, 12/20/35(e)(h) | | 6,316 | | 189 | |
2.56%, 2/25/37 | | 4,974 | | 127 | |
2.57%, 2/20/47 | | 8,279 | | 290 | |
2.86%, 3/20/47 | | 12,016 | | 391 | |
3.06%, 8/25/46(h) | | 3,514 | | 149 | |
Greenpoint Mortgage Funding Trust, | | | | | |
IO | | | | | |
1.20%, 10/25/45 | | 3,012 | | 81 | |
1.30%, 8/25/45 | | 2,447 | | 54 | |
Harborview Mortgage Loan Trust, | | | | | |
IO | | | | | |
2.36%, 6/19/35(h) | | 3,014 | | 33 | |
2.59%, 5/19/35(h) | | 4,174 | | 42 | |
2.93%, 3/19/37(h) | | 4,209 | | 98 | |
3.03%, 7/19/47(h) | | 7,620 | | 155 | |
PO | | | | | |
3/19/47 - 7/19/47 | | 8 | | 1 | |
Indymac Index Mortgage Loan Trust, | | | | | |
IO | | | | | |
2.34%, 7/25/35(h) | | 2,712 | | 36 | |
Washington Mutual, Inc., | | | | | |
IO | | | | | |
0.62%, 9/25/46 | | 43,742 | | 328 | |
| | | | 2,770 | |
36 | The accompanying notes are an integral part of the financial statements. |
| 2008 Annual Report |
| |
| September 30, 2008 |
Portfolio of Investments (cont’d)
Core Fixed Income Portfolio
| | Face | | | |
| | Amount | | Value | |
| | (000) | | (000) | |
Finance (6.1%) | | | | | |
Ace INA Holding, Inc., | | | | | |
5.60%, 5/15/15 | | $ 175 | | $ 166 | |
AIG SunAmerica Global Financing VI, | | | | | |
6.30%, 5/10/11(e) | | 645 | | 523 | |
Bank of America Corp., | | | | | |
5.75%, 12/1/17 | | 545 | | 463 | |
Bank of New York Mellon Corp. (The), | | | | | |
4.50%, 4/1/13 | | 235 | | 220 | |
Bear Stearns Cos. LLC (The), | | | | | |
6.40%, 10/2/17 | | 450 | | 421 | |
7.25%, 2/1/18 | | 355 | | 342 | |
Berkshire Hathaway Finance Corp., | | | | | |
5.40%, 5/15/18(e) | | 400 | | 388 | |
Catlin Insurance Co., Ltd.,(e)(h)(o) | | | | | |
7.25%, | | 355 | | 158 | |
Chubb Corp., | | | | | |
5.75%, 5/15/18 | | 60 | | 56 | |
Citigroup, Inc., | | | | | |
5.88%, 5/29/37 | | 340 | | 237 | |
6.13%, 11/21/17 - 5/15/18 | | 530 | | 445 | |
Credit Suisse USA, Inc., | | | | | |
5.13%, 8/15/15 | | 85 | | 76 | |
Credit Suisse, New York, | | | | | |
6.00%, 2/15/18 | | 525 | | 458 | |
Farmers Exchange Capital, | | | | | |
7.05%, 7/15/28(e) | | 165 | | 132 | |
Farmers Insurance Exchange, | | | | | |
8.63%, 5/1/24(e) | | 475 | | 454 | |
General Electric Capital Corp., | | | | | |
5.63%, 5/1/18(c) | | 375 | | 318 | |
Goldman Sachs Group, Inc. (The), | | | | | |
6.15%, 4/1/18 | | 510 | | 425 | |
6.75%, 10/1/37 | | 510 | | 341 | |
HBOS plc, | | | | | |
6.75%, 5/21/18(e) | | 340 | | 286 | |
HSBC Finance Corp., | | | | | |
4.13%, 12/15/08 | | 100 | | 99 | |
6.38%, 10/15/11 | | 190 | | 188 | |
6.75%, 5/15/11 | | 235 | | 236 | |
Huntington National Bank (The), | | | | | |
4.38%, 1/15/10 | | 250 | | 236 | |
JPMorgan Chase & Co., | | | | | |
4.75%, 5/1/13 | | 470 | | 438 | |
Lehman Brothers Holdings, Inc., | | | | | |
5.75%, 1/3/17(b) | | 235 | | 1 | |
6.88%, 7/17/37(b) | | 740 | | 4 | |
Mantis Reef Ltd., | | | | | |
4.69%, 11/14/08 | | 400 | (e) | 400 | |
Nationwide Building Society, | | | | | |
4.25%, 2/1/10(e) | | 615 | | 605 | |
NYSE Euronext, | | | | | |
4.80%, 6/28/13 | | 285 | | 272 | |
Platinum Underwriters Finance, Inc., | | | | | |
7.50%, 6/1/17 | | 265 | | 252 | |
Popular North America, Inc., | | | | | |
5.65%, 4/15/09(c) | | 310 | | 306 | |
ProLogis, | | | | | |
6.63%, 5/15/18 | | 70 | | 60 | |
Prudential Financial, Inc., | | | | | |
6.63%, 12/1/37 | | 225 | | 189 | |
Sovereign Bancorp, | | | | | |
3.44%, 3/23/10(h) | | 935 | | 664 | |
Travelers Cos., Inc. (The), | | | | | |
5.80%, 5/15/18 | | 175 | | 161 | |
Two-Rock Pass Through Trust, | | | | | |
3.74%,(e)(h)(o) | | 315 | | 7 | |
Wachovia Capital Trust III, | | | | | |
5.80%,(h)(o) | | 550 | | 231 | |
Wachovia Corp., | | | | | |
5.50%, 5/1/13 | | 100 | | 83 | |
Wells Fargo & Co., | | | | | |
5.63%, 12/11/17 | | 485 | | 447 | |
Xlliac Global Funding, | | | | | |
4.80%, 8/10/10(e) | | 630 | | 606 | |
| | | | 11,394 | |
Industrials 10.9% | | | | | |
America West Airlines, Inc., | | | | | |
7.10%, 4/2/21(c) | | 553 | | 453 | |
Amgen, Inc., | | | | | |
5.85%, 6/1/17 | | 265 | | 255 | |
ArcelorMittal, | | | | | |
6.13%, 6/1/18(e) | | 220 | | 195 | |
Archer-Daniels-Midland Co., | | | | | |
5.45%, 3/15/18 | | 230 | | 213 | |
AstraZeneca plc, | | | | | |
5.90%, 9/15/17 | | 235 | | 232 | |
AT&T Corp., | | | | | |
8.00%, 11/15/31(c) | | 110 | | 112 | |
AT&T, Inc., | | | | | |
6.15%, 9/15/34 | | 250 | | 209 | |
6.30%, 1/15/38 | | 435 | | 361 | |
Baxter International, Inc., | | | | | |
4.63%, 3/15/15 | | 280 | | 269 | |
5.38%, 6/1/18(c) | | 95 | | 91 | |
Biogen Idec, Inc., | | | | | |
6.88%, 3/1/18 | | 265 | | 262 | |
Bristol-Myers Squibb Co., | | | | | |
5.45%, 5/1/18 | | 290 | | 274 | |
Brookfield Asset Management, Inc., | | | | | |
5.80%, 4/25/17 | | 215 | | 189 | |
7.13%, 6/15/12 | | 360 | | 361 | |
Burlington Northern Santa Fe Corp., | | | | | |
6.13%, 3/15/09 | | 430 | | 430 | |
Canadian National Railway Co., | | | | | |
5.55%, 5/15/18 | | 115 | | 114 | |
The accompanying notes are an integral part of the financial statements. | 37 |
2008 Annual Report | |
| |
September 30, 2008 | |
Portfolio of Investments (cont’d)
Core Fixed Income Portfolio
| | Face | | | |
| | Amount | | Value | |
| | (000) | | (000) | |
Industrials (cont’d) | | | | | |
Comcast Cable Communications LLC, | | | | | |
7.13%, 6/15/13 | | $ 175 | | $ 177 | |
Comcast Corp., | | | | | |
5.70%, 5/15/18(c) | | 360 | | 315 | |
ConAgra Foods, Inc., | | | | | |
8.25%, 9/15/30 | | 285 | | 313 | |
ConocoPhillips, | | | | | |
5.20%, 5/15/18 | | 355 | | 332 | |
Covidien International Finance S.A., | | | | | |
6.00%, 10/15/17 | | 285 | | 282 | |
COX Communications, Inc., | | | | | |
6.25%, 6/1/18(e) | | 270 | | 251 | |
CVS Caremark Corp., | | | | | |
5.75%, 6/1/17 | | 135 | | 126 | |
CVS Pass-Through Trust, | | | | | |
6.04%, 12/10/28(e) | | 442 | | 397 | |
Daimler Finance North America LLC, | | | | | |
8.50%, 1/18/31 | | 265 | | 267 | |
Delhaize America, Inc., | | | | | |
9.00%, 4/15/31 | | 100 | | 105 | |
Dell, Inc., | | | | | |
5.65%, 4/15/18(e) | | 155 | | 143 | |
Deutsche Telekom International Finance B.V., | | | | | |
8.75%, 6/15/30 | | 185 | | 179 | |
Devon Financing Corp. UCL, | | | | | |
7.88%, 9/30/31 | | 175 | | 178 | |
Dr. Pepper Snapple Group, Inc., | | | | | |
6.82%, 5/1/18(e) | | 190 | | 184 | |
E.I. Du Pont de Nemours & Co., | | | | | |
6.00%, 7/15/18 | | 190 | | 186 | |
France Telecom S.A., | | | | | |
8.50%, 3/1/31 | | 385 | | 419 | |
Gaz Capital S.A., | | | | | |
6.51%, 3/7/22(e) | | 100 | | 72 | |
General Electric Co., | | | | | |
5.25%, 12/6/17 | | 1,405 | | 1,232 | |
GlaxoSmithKline Capital, Inc., | | | | | |
5.65%, 5/15/18 | | 335 | | 319 | |
Grupo Televisa S.A., | | | | | |
6.00%, 5/15/18(c) | | 220 | | 209 | |
GTL Trade Finance, Inc., | | | | | |
7.25%, 10/20/17(e) | | 145 | | 139 | |
Harley-Davidson Funding Corp., | | | | | |
6.80%, 6/15/18(e) | | 200 | | 188 | |
Hewlett-Packard Co., | | | | | |
5.50%, 3/1/18 | | 140 | | 132 | |
Home Depot, Inc., | | | | | |
5.40%, 3/1/16 | | 245 | | 209 | |
Honeywell International, Inc., | | | | | |
5.30%, 3/1/18 | | 245 | | 231 | |
ICI Wilmington, Inc., | | | | | |
4.38%, 12/1/08 | | 300 | | 299 | |
John Deere Capital Corp., | | | | | |
5.75%, 9/10/18 | | 200 | | 186 | |
KLA-Tencor Corp., | | | | | |
6.90%, 5/1/18 | | 260 | | 242 | |
Koninklijke Philips Electronics N.V., | | | | | |
5.75%, 3/11/18 | | 375 | | 361 | |
Kraft Foods, Inc., | | | | | |
6.13%, 8/23/18 | | 325 | | 304 | |
Kroger Co. (The), | | | | | |
5.00%, 4/15/13 | | 150 | | 143 | |
6.40%, 8/15/17 | | 50 | | 48 | |
LG Electronics, Inc.,(e) | | | | | |
5.00%, 6/17/10 | | 210 | | 208 | |
Marathon Oil Corp., | | | | | |
5.90%, 3/15/18 | | 195 | | 173 | |
6.00%, 10/1/17 | | 150 | | 135 | |
Medco Health Solutions, Inc., | | | | | |
7.13%, 3/15/18 | | 270 | | 274 | |
Monsanto Co., | | | | | |
5.13%, 4/15/18(c) | | 105 | | 100 | |
Oracle Corp., | | | | | |
5.75%, 4/15/18 | | 285 | | 265 | |
Parker Hannifin Corp., | | | | | |
5.50%, 5/15/18 | | 200 | | 200 | |
Pearson Dollar Finance Two plc, | | | | | |
6.25%, 5/6/18(c)(e) | | 130 | | 125 | |
Petro-Canada, | | | | | |
6.05%, 5/15/18 | | 270 | | 236 | |
Philip Morris International, Inc., | | | | | |
5.65%, 5/16/18 | | 275 | | 255 | |
Questar Market Resources, Inc., | | | | | |
6.80%, 4/1/18 | | 225 | | 227 | |
Rio Tinto Finance USA Ltd., | | | | | |
6.50%, 7/15/18 | | 380 | | 360 | |
Starwood Hotels & Resorts Worldwide, Inc., | | | | | |
6.75%, 5/15/18 | | 200 | | 179 | |
Telecom Italia Capital S.A., | | | | | |
4.00%, 1/15/10 | | 400 | | 389 | |
7.00%, 6/4/18 | | 265 | | 238 | |
Telefonica Europe B.V., | | | | | |
8.25%, 9/15/30 | | 450 | | 453 | |
Textron Financial Corp., | | | | | |
5.13%, 2/3/11 | | 550 | | 551 | |
Time Warner Cable, Inc., | | | | | |
6.75%, 7/1/18(c) | | 265 | | 248 | |
Time Warner, Inc., | | | | | |
5.88%, 11/15/16 | | 300 | | 264 | |
Tyco Electronics Group S.A., | | | | | |
5.95%, 1/15/14 | | 490 | | 483 | |
UnitedHealth Group, Inc., | | | | | |
6.00%, 2/15/18 | | 235 | | 213 | |
38 | The accompanying notes are an integral part of the financial statements. |
| 2008 Annual Report |
| |
| September 30, 2008 |
Portfolio of Investments (cont’d)
Core Fixed Income Portfolio
| | Face | | | |
| | Amount | | Value | |
| | (000) | | (000) | |
Industrials (cont’d) | | | | | |
Verizon Communications, Inc., | | | | | |
5.50%, 2/15/18 | | $ | 415 | | $ | 368 | |
Viacom, Inc., | | | | | |
6.88%, 4/30/36 | | 400 | | 322 | |
Vivendi, | | | | | |
6.63%, 4/4/18(e) | | 300 | | 289 | |
Vodafone Group plc, | | | | | |
5.63%, 2/27/17 | | 65 | | 58 | |
Walgreen Co., | | | | | |
4.88%, 8/1/13 | | 200 | | 200 | |
Wal-Mart Stores, Inc., | | | | | |
4.25%, 4/15/13 | | 385 | | 378 | |
Weatherford International Ltd., | | | | | |
6.00%, 3/15/18(c) | | 190 | | 171 | |
Wyeth, | | | | | |
5.45%, 4/1/17(c) | | 130 | | 126 | |
5.50%, 2/15/16 | | 70 | | 68 | |
Xerox Corp., | | | | | |
6.35%, 5/15/18 | | 270 | | 247 | |
XTO Energy, Inc., | | | | | |
5.50%, 6/15/18 | | 320 | | 283 | |
| | | | 20,274 | |
Mortgages — Other (4.0%) | | | | | |
American Home Mortgage Assets, | | | | | |
3.47%, 10/25/46(d)(h) | | 1,924 | | 550 | |
3.51%, 6/25/47(d)(h) | | 907 | | 134 | |
3.53%, 10/25/46(d)(h) | | 1,008 | | 181 | |
Banc of America Funding Corp., | | | | | |
3.54%, 9/20/35(d)(h) | | 321 | | 130 | |
Bear Stearns Mortgage Funding Trust, | | | | | |
3.35%, 3/25/37(d)(h) | | 1,738 | | 938 | |
3.38%, 3/25/37(d)(h) | | 1,548 | | 836 | |
3.39%, 10/25/36(d)(h) | | 933 | | 532 | |
Countrywide Alternative Loan Trust, | | | | | |
3.38%, 5/25/47(d)(h) | | 1,798 | | 1,007 | |
3.46%, 10/25/46(d)(c)(h) | | 1,785 | | 681 | |
Deutsche ALT-A Securities NIM Trust, | | | | | |
6.75%, 2/25/47(e) | | 111 | | 103 | |
Gemsco Mortgage Pass Through Certificate, | | | | | |
8.70%, 11/25/10(d) | | 1 | | 1 | |
Harborview Mortgage Loan Trust, | | | | | |
3.23%, 1/25/47(d)(h) | | 820 | | 286 | |
3.32%, 7/19/45(d)(h) | | 212 | | 88 | |
Mastr Adjustable Rate Mortgages Trust, | | | | | |
3.46%, 4/25/46(d)(h) | | 605 | | 228 | |
Residential Accredit Loans, Inc., | | | | | |
3.61%, 10/25/45(d)(h) | | 1,200 | | 408 | |
Structured Asset Mortgage Investments, Inc., | | | | | |
3.40%, 2/25/36(d)(h) | | 233 | | 123 | |
Washington Mutual Alternative Mortgage Pass Through Certificates, | | | | | |
3.50%, 11/25/46(d)(h) | | 590 | | 114 | |
3.80%, 4/25/46(d)(h) | | 201 | | 113 | |
Washington Mutual Mortgage Pass Through Certificates, | | | | | |
3.50%, 8/25/45(h) | | 11 | | 10 | |
Washington Mutual, Inc., | | | | | |
3.44%, 7/25/47(d)(h) | | 2,515 | | 708 | |
3.47%, 10/25/45(h) | | 45 | | 44 | |
3.56%, 6/25/46(d)(h) | | 300 | | 36 | |
3.80%, 5/25/46(d)(h) | | 627 | | 263 | |
| | | | 7,514 | |
Sovereign (0.5%) | | | | | |
Federative Republic of Brazil, | | | | | |
6.00%, 1/17/17 | | 825 | | 798 | |
Korea Railroad Corp., | | | | | |
5.38%, 5/15/13(e) | | 230 | | 216 | |
| | | | 1,014 | |
U.S. Treasury Securities (5.5%) | | | | | |
U.S. Treasury Bonds, | | | | | |
5.38%, 2/15/31(c) | | 100 | | 113 | |
6.13%, 8/15/29(c) | | 6,500 | | 8,014 | |
U.S. Treasury Bond STRIPS, Zero Coupon, 5/15/21 | | 3,805 | | 2,138 | |
| | | | 10,265 | |
Utilities (2.2%) | | | | | |
Arizona Public Service Co., | | | | | |
5.80%, 6/30/14 | | 415 | | 384 | |
Carolina Power & Light Co., | | | | | |
5.13%, 9/15/13 | | 340 | | 340 | |
CenterPoint Energy Resources Corp., | | | | | |
6.25%, 2/1/37 | | 135 | | 107 | |
7.88%, 4/1/13 | | 85 | | 87 | |
E.ON International Finance B.V., | | | | | |
5.80%, 4/30/18(e) | | 360 | | 345 | |
Equitable Resources, Inc., | | | | | |
6.50%, 4/1/18 | | 85 | | 81 | |
Israel Electric Corp. Ltd., | | | | | |
7.25%, 1/15/19(e) | | 335 | | 336 | |
Kinder Morgan Energy Partners LP, | | | | | |
5.95%, 2/15/18 | | 220 | | 196 | |
NiSource Finance Corp., | | | | | |
3.38%, 11/23/09(h) | | 55 | | 53 | |
6.80%, 1/15/19 | | 170 | | 155 | |
Ohio Edison Co., | | | | | |
6.40%, 7/15/16 | | 225 | | 214 | |
Ohio Power Co., | | | | | |
6.00%, 6/1/16 | | 460 | | 440 | |
Peco Energy Co., | | | | | |
5.35%, 3/1/18 | | 230 | | 209 | |
| | | | | | | |
The accompanying notes are an integral part of the financial statements. | 39 |
2008 Annual Report | |
| |
September 30, 2008 | |
Portfolio of Investments (cont’d)
Core Fixed Income Portfolio
| | Face | | | |
| | Amount | | Value | |
| | (000) | | (000) | |
Utilities (cont’d) | | | | | |
Plains All American Pipeline LP/PAA Finance Corp., | | | | | |
6.70%, 5/15/36 | | $ 390 | | $ 337 | |
PPL Energy Supply LLC, | | | | | |
6.30%, 7/15/13(c) | | 165 | | 161 | |
Public Service Electric & Gas Co., | | | | | |
5.00%, 1/1/13 | | 230 | | 227 | |
Texas Eastern Transmission LP, | | | | | |
7.00%, 7/15/32 | | 280 | | 273 | |
Union Electric Co., | | | | | |
6.70%, 2/1/19 | | 265 | | 256 | |
| | | | 4,201 | |
Total Fixed Income Securities (Cost $220,844) | | | | 200,951 | |
| | | | | |
| | Shares | | | |
Short-Term Investments (25.0%) | | | | | |
Securities held as Collateral on Loaned Securities (5.4%) | | | | | |
Investment Company (4.9%) | | | | | |
Morgan Stanley Institutional Liquidity Money Market Portfolio — Institutional Class(p) | | 9,090,804 | | 9,091 | |
| | | | | |
| | Face | | | |
| | Amount | | | |
| | (000) | | | |
Short-Term Debt (0.5%) | | | | | |
Bancaja, | | | | | |
2.96%, 11/12/08(h) | | $194 | | 194 | |
Citigroup Global Markets, Inc., | | | | | |
1.00%, 10/1/08 | | 854 | | 853 | |
| | | | 1,047 | |
| | | | 10,138 | |
| | | | | |
| | Shares | | | |
Investment Company (3.8%) | | | | | |
Morgan Stanley Institutional Liquidity Money Market Portfolio — Institutional Class(p) | | 7,074,118 | | 7,074 | |
| | | | | |
| | Face | | | |
| | Amount | | | |
| | (000) | | | |
U.S. Government & Agency Securities (9.9%) | | | | | |
Federal Home Loan Bank, | | | | | |
2.05%, 10/15/08(t) | | $7,000 | | 6,999 | |
2.12%, 10/10/08(t) | | 2,000 | | 2,000 | |
Federal Home Loan Mortgage Corp., | | | | | |
2.10%, 10/20/08(t) | | 3,500 | | 3,499 | |
2.25%, 11/10/08(t) | | 6,000 | | 5,987 | |
| | | | 18,485 | |
U.S. Treasury Securities (5.9%) | | | | | |
U.S. Treasury Bills, | | | | | |
0.17%, 10/9/08(c)(r)(j) | | 1,565 | | 1,565 | |
1.01%, 1/8/09(r) | | 9,500 | | 9,474 | |
| | | | 11,039 | |
Total Short-Term Investments (Cost $46,709) | | | | 46,736 | |
Total Investments (132.6%) (Cost $267,553) — including $10,265 of Securities Loaned | | | | 247,687 | |
Liabilities in Excess of Other Assets (-32.6%) | | | | (60,895 | ) |
Net Assets (100%) | | | | $186,792 | |
(b) | Issuer is in default. |
(c) | All or a portion of security on loan at September 30, 2008. |
(d) | Security was valued at fair value — At September 30, 2008, the Portfolio held $7,357,000 of fair valued securities, representing 3.9% of net assets. |
(e) | 144A security — Certain conditions for public sale may exist. Unless otherwise noted, these securities are deemed to be liquid. |
(h) | Variable/Floating Rate Security — Interest rate changes on these instruments are based on changes in a designated rate. The rates shown are those in effect on September 30, 2008. |
(i) | Security is subject to delayed delivery. |
(j) | All or a portion of the security was pledged to cover margin requirements for futures contracts. |
(o) | Perpetual — Security does not have a predetermined maturity date. Rate for this security is fixed for a period of time then reverts to a floating rate. The interest shown is the rate in effect at September 30, 2008. |
(p) | See Note G within the Notes to Financial Statements regarding investment in Morgan Stanley Institutional Liquidity Money Market Portfolio — Institutional Class. |
(r) | Rate shown is the yield to maturity at September 30, 2008. |
(t) | Purchased on a discount basis. The interest rate shown has been adjusted to reflect a money market equivalent yield. |
@ | Value is less than $500. |
Inv Fl | Inverse Floating Rate — Interest rate fluctuates with an inverse relationship to an associated interest rate. Indicated rate is the effective rate at September 30, 2008. |
IO | Interest Only |
PAC | Planned Amortization Class |
PO | Principal Only |
REMIC | Real Estate Mortgage Investment Conduit |
STRIPS | Separate Trading of Registered Interest and Principal of Securities |
TBA | To Be Announced |
40 | The accompanying notes are an integral part of the financial statements. |
| 2008 Annual Report |
| |
| September 30, 2008 |
Portfolio of Investments (cont’d)
Core Fixed Income Portfolio
The Portfolio had the following futures contract(s) open at period end:
| | | | | | | | Net | |
| | | | | | | | Unrealized | |
| | Number | | | | | | Appreciation | |
| | of | | Value | | Expiration | | (Depreciation) | |
| | Contracts | | (000) | | Date | | (000 | ) | |
Long: | | | | | | | | | |
EuroDollar | | | | | | | | | |
CME | | 37 | | | $ 8,931 | | | Dec-08 | | $ 41 | | |
U.S. Treasury | | | | | | | | | | | | |
2 yr. Note | | 35 | | | 7,470 | | | Dec-08 | | 6 | | |
U.S. Treasury | | | | | | | | | | | | |
Long Bond | | 83 | | | 9,725 | | | Dec-08 | | (98 | ) | |
Short: | | | | | | | | | | | | |
EuroDollar | | | | | | | | | | | | |
CME | | 17 | | | 4,117 | | | Sep-09 | | (6 | ) | |
EuroDollar | | | | | | | | | | | | |
CME | | 14 | | | 3,380 | | | Dec-09 | | (43 | ) | |
EuroDollar | | | | | | | | | | | | |
CME | | 10 | | | 2,410 | | | Mar-10 | | (29 | ) | |
EuroDollar | | | | | | | | | | | | |
CME | | 3 | | | 721 | | | Jun-10 | | (3 | ) | |
EuroDollar | | | | | | | | | | | | |
CME | | 2 | | | 480 | | | Sep-10 | | (4 | ) | |
EuroDollar | | | | | | | | | | | | |
CME | | 1 | | | 239 | | | Dec-10 | | (2 | ) | |
U.S. Treasury | | | | | | | | | | | | |
5 yr. Note | | 41 | | | 4,601 | | | Dec-08 | | 6 | | |
U.S. Treasury | | | | | | | | | | | | |
10 yr. Note | | 95 | | | 10,889 | | | Dec-08 | | 180 | | |
5 yr. Swap | | 72 | | | 7,812 | | | Dec-08 | | 3 | | |
10 yr. Swap | | 257 | | | 28,744 | | | Dec-08 | | | 178 | | |
| | | | | | | | | | | $229 | | |
| | | | | | | | | | | | |
CME — Chicago Mercantile Exchange
The accompanying notes are an integral part of the financial statements. | 41 |
2008 Annual Report | |
| |
September 30, 2008 | |
Portfolio of Investments (cont’d)
Core Fixed Income Portfolio
Credit Default Swap Contracts |
The Portfolio had the following credit default swap agreement(s) open at period end:
| | | | | | | | | | Unrealized |
| | | | Notional | | | | | | Appreciation |
| | Buy/Sell | | Amount | | Pay/Receive | | Termination | | (Depreciation) |
Swap Counterparty and Reference Obligation | | Protection | | (000) | | Fixed Rate | | Date | | (000 | ) |
Bank of America | | | | | | | | | | | |
Carnival Corp., 6.65%, 1/15/28 | | Buy | | $ 210 | | 1.57 | % | | 3/20/18 | | | $ (4 | ) |
Goodrich Corp., 7.63%, 12/15/12 | | Buy | | 180 | | 0.82 | | | 3/20/18 | | | (3 | ) |
Textron Financial Corp., 5.13%, 2/3/11 | | Buy | | 220 | | 0.80 | | | 3/20/18 | | | 40 | |
Citigroup | | | | | | | | | | | | | |
Eaton Corp., 7.65%, 11/15/29 | | Buy | | 95 | | 0.82 | | | 3/20/18 | | | 2 | |
Credit Suisse | | | | | | | | | | | | | |
Arrow Electronics, Inc., 6.88%, 6/1/18 | | Buy | | 200 | | 1.00 | | | 3/20/15 | | | (4 | ) |
Goldman Sachs | | | | | | | | | | | | | |
AvalonBay Communities, Inc., 6.13%, 11/1/12 | | Buy | | 180 | | 3.05 | | | 3/20/13 | | | (6 | ) |
Coca-Cola Enterprises, Inc., 6.13%, 8/15/11 | | Buy | | 735 | | 0.59 | | | 3/20/13 | | | (4 | ) |
Dow Jones CDX North America Investment Grade Index, Series 10 | | Sell | | 1,290 | | 1.55 | | | 6/20/13 | | | (21 | ) |
Dow Jones CDX North America Investment Grade Index, Series 9 | | Sell | | 390 | | 0.60 | | | 12/20/12 | | | (6 | ) |
Dow Jones CDX North America Investment Grade Index, Series 9 | | Sell | | 760 | | 0.80 | | | 12/20/17 | | | (19 | ) |
Eaton Corp., 7.65%, 11/15/29 | | Buy | | 200 | | 0.97 | | | 3/20/18 | | | 3 | |
Goodrich Corp., 7.63%, 12/15/12 | | Buy | | 245 | | 0.47 | | | 3/20/18 | | | 2 | |
Sealed Air Corp., 5.63%, 7/15/13 | | Buy | | 130 | | 1.24 | | | 3/20/18 | | | 5 | |
JPMorgan Chase | | | | | | | | | | | | | |
Dow Jones CDX North America Investment Grade Index, Series 9 | | Sell | | 1,595 | | 0.60 | | | 12/20/12 | | | (13 | ) |
Nordstrom, Inc., 6.95%, 3/15/28 | | Buy | | 220 | | 1.07 | | | 3/20/18 | | | 8 | |
Merrill Lynch | | | | | | | | | | | | | |
Carnival Corp., 6.65%, 1/15/28 | | Buy | | 145 | | 1.60 | | | 3/20/18 | | | (3 | ) |
UBS | | | | | | | | | | | | | |
Martin Marietta Materials, Inc., 6.88%, 4/1/11 | | Buy | | 170 | | 1.78 | | | 3/20/13 | | | | 1 | |
| | | | | | | | | | | | | $(22 | ) |
| | | | | | | | | | | | | |
Interest Rate Swap Contracts
The Portfolio had the following interest rate swap agreement(s) open at period end:
| | | | | | | | | | | | Unrealized |
| | | | | | | | | | Notional | | Appreciation |
| | Floating Rate | | Pay/Receive | | Fixed | | Termination | | Amount | | (Depreciation) |
Swap Counterparty | | Index | | Floating Rate | | Rate | | Date | | (000) | | (000) |
Bank of America | | 3 Month LIBOR | | Pay | | 4.15 | % | 6/9/13 | | | $19,050 | | | $ 319 | |
| | 3 Month LIBOR | | Receive | | 3.90 | | 9/10/13 | | | 17,070 | | | 101 | |
| | 3 Month LIBOR | | Pay | | 5.37 | | 2/12/18 | | | 7,668 | | | 127 | |
| | 3 Month LIBOR | | Pay | | 5.07 | | 4/14/18 | | | 5,630 | | | 28 | |
| | 3 Month LIBOR | | Pay | | 4.98 | | 4/15/18 | | | 3,290 | | | 6 | |
| | 3 Month LIBOR | | Receive | | 4.67 | | 8/4/18 | | | 9,450 | | | (180 | ) |
| | 3 Month LIBOR | | Receive | | 5.15 | | 8/26/18 | | | 10,200 | | | (70 | ) |
| | 3 Month LIBOR | | Receive | | 5.08 | | 9/2/18 | | | 32,153 | | | (139 | ) |
| | 3 Month LIBOR | | Receive | | 5.82 | | 2/12/23 | | | 9,845 | | | (210 | ) |
| | 3 Month LIBOR | | Receive | | 5.47 | | 4/14/23 | | | 7,205 | | | (81 | ) |
| | 3 Month LIBOR | | Receive | | 5.38 | | 4/15/23 | | | 3,755 | | | (33 | ) |
| | 3 Month LIBOR | | Pay | | 5.34 | | 8/26/23 | | | 13,050 | | | 97 | |
| | 3 Month LIBOR | | Pay | | 5.28 | | 9/2/23 | | | 41,200 | | | 235 | |
Citigroup | | 3 Month LIBOR | | Pay | | 3.77 | | 4/24/13 | | | 10,500 | | | 2 | |
| | 3 Month LIBOR | | Pay | | 5.33 | | 5/22/17 | | | 7,800 | | | 653 | |
| | 3 Month LIBOR | | Pay | | 5.37 | | 5/23/17 | | | 7,800 | | | 673 | |
| | 3 Month LIBOR | | Pay | | 5.34 | | 5/24/17 | | | 6,800 | | | 571 | |
| | 3 Month LIBOR | | Pay | | 5.24 | | 9/27/17 | | | 5,000 | | | 302 | |
| | 3 Month LIBOR | | Receive | | 5.29 | | 9/28/17 | | | 6,000 | | | (384 | ) |
| | 3 Month LIBOR | | Receive | | 5.00 | | 11/13/17 | | | 2,000 | | | (116 | ) |
| | 3 Month LIBOR | | Receive | | 4.73 | | 12/27/17 | | | 4,275 | | | (145 | ) |
| | 3 Month LIBOR | | Pay | | 4.47 | | 1/10/18 | | | 4,000 | | | 21 | |
42 | The accompanying notes are an integral part of the financial statements. |
| 2008 Annual Report |
| |
| September 30, 2008 |
Portfolio of Investments (cont’d)
Core Fixed Income Portfolio
Interest Rate Swap Contracts (cont’d) |
The Portfolio had the following interest rate swap agreement(s) open at period end:
| | | | | | | | | | | | Unrealized | |
| | | | | | | | | | Notional | | | Appreciation | |
| | Floating Rate | | Pay/Receive | | Fixed | | Termination | | Amount | | | (Depreciation) | |
Swap Counterparty | | Index | | Floating Rate | | Rate | | Date | | (000) | | | (000) | | |
Deutsche Bank | | 3 Month LIBOR | | Pay | | 5.39 | | 5/25/17 | | | $17,600 | | | $1,546 | | |
| | 3 Month LIBOR | | Pay | | 5.43 | | 5/29/17 | | | 12,075 | | | 1,096 | | |
Goldman Sachs | | 3 Month LIBOR | | Pay | | 5.63 | | 2/28/18 | | | 21,380 | | | 555 | | |
| | 3 Month LIBOR | | Receive | | 6.04 | | 2/28/23 | | | 27,435 | | | (756 | ) | |
JPMorgan Chase | | 3 Month LIBOR | | Pay | | 4.07 | | 5/16/13 | | | 14,560 | | | 198 | | |
| | 3 Month LIBOR | | Pay | | 4.27 | | 6/2/13 | | | 5,185 | | | 117 | | |
| | 3 Month LIBOR | | Pay | | 5.37 | | 5/23/17 | | | 3,300 | | | 285 | | |
| | 3 Month LIBOR | | Pay | | 5.34 | | 5/24/17 | | | 4,550 | | | 383 | | |
| | 3 Month LIBOR | | Pay | | 5.45 | | 5/29/17 | | | 11,425 | | | 1,054 | | |
| | 3 Month LIBOR | | Pay | | 5.44 | | 8/20/17 | | | 2,300 | | | 182 | | |
| | 3 Month LIBOR | | Pay | | 5.09 | | 9/11/17 | | | 7,000 | | | 363 | | |
| | 3 Month LIBOR | | Receive | | 5.23 | | 9/27/17 | | | 5,100 | | | (306 | ) | |
| | 3 Month LIBOR | | Receive | | 5.30 | | 9/28/17 | | | 5,550 | | | (360 | ) | |
| | 3 Month LIBOR | | Pay | | 5.25 | | 10/11/17 | | | 5,500 | | | 437 | | |
| | 3 Month LIBOR | | Receive | | 5.01 | | 11/13/17 | | | 3,000 | | | (179 | ) | |
| | 3 Month LIBOR | | Pay | | 4.48 | | 1/8/18 | | | 3,500 | | | 20 | | |
| | 3 Month LIBOR | | Receive | | 4.24 | | 1/22/18 | | | 3,475 | | | 45 | | |
| | 3 Month LIBOR | | Receive | | 4.52 | | 2/19/18 | | | 3,500 | | | (28 | ) | |
| | 3 Month LIBOR | | Receive | | 4.62 | | 2/22/18 | | | 4,500 | | | (72 | ) | |
| | 3 Month LIBOR | | Receive | | 4.41 | | 5/1/18 | | | 21,290 | | | (213 | ) | |
Merrill Lynch | | 3 Month LIBOR | | Pay | | 5.00 | | 4/15/18 | | | 4,385 | | | 11 | | |
| | 3 Month LIBOR | | Receive | | 5.40 | | 4/16/23 | | | 5,275 | | | | (48 | ) | |
| | | | | | | | | | | | | | | $6,107 | | |
| | | | | | | | | | | | | | |
LIBOR — London Inter Bank Offer Rate
Zero Coupon Swap Contracts |
The Portfolio had the following zero coupon swap agreement(s) open at period end:
| | | | | | | | Unrealized | |
| | Notional | | | | | | Appreciation | |
| | Amount | | | | Termination | | (Depreciation) | |
Swap Counterparty | | (000) | | Receive | | Date | | (000) | |
JPMorgan Chase | | $2,139 | | 3 Month LIBOR | | 5/15/21 | | | $— | | |
| | | | | | | | | $— | | |
| | | | | | | | | |
LIBOR — London Inter Bank Offer Rate | | | | | | | | | |
The accompanying notes are an integral part of the financial statements. | 43 |
2008 Annual Report | |
| |
September 30, 2008 | |
Investment Overview (unaudited)
Core Plus Fixed Income Portfolio
The Core Plus Fixed Income Portfolio seeks above-average total return over a market cycle of three to five years. The Portfolio invests primarily in a diversified mix of U.S. dollar-denominated investment grade fixed income securities, particularly U.S. government, corporate and mortgage securities. The Portfolio ordinarily will seek to maintain an average weighted maturity between five and ten years. Although there is no minimum or maximum maturity for any individual security, the Adviser actively manages the interest rate risk of the Portfolio within a range relative to its benchmark. The Portfolio may invest opportunistically in high yield securities (commonly referred to as “junk bonds”). The Portfolio may invest in securities of foreign issuers, including issuers located in emerging market countries. The securities in which the Portfolio may also invest may be denominated in currencies other than U.S. dollars. The Portfolio may also invest in TBAs. The Portfolio may invest in asset-backed securities and may use futures, options, forwards, CMOs, swaps, options on swaps and other derivatives. The Portfolio may invest in public bank loans made by banks or other financial institutions. These public bank loans may be rated investment grade or below investment grade.
Performance
For the fiscal year ended September 30, 2008, the Portfolio’s Class I had a total return based on net asset value and reinvestment of distributions per share of -13.07%, net of fees. The Portfolio’s Class I underperformed against its benchmark the Lehman Brothers U.S. Aggregate Index (the “Index”) which returned 3.65%.
Factors Affecting Performance
· The financial markets were under pressure throughout the period amid disrupted credit markets, ongoing deterioration of the housing market, losses in the financial sector, and growing fears of recession.
· The third quarter of 2008, however, will most certainly go down as a defining moment in the history of the financial industry. Investor confidence plummeted and credit markets seized as several venerable financial institutions were forced into mergers or dissolved entirely in September, resulting in significant price erosion across all but the U.S. Treasury sector.
· The primary detractor from the Portfolio’s relative performance was an overweight to non-agency mortgage securities as spreads in the sector moved wider over the course of the reporting period.
· An underweight in corporate credits for much of the period, however, was additive to relative performance as credit spreads significantly widened, particularly in the financial sector.
· Yield-curve positioning was also beneficial to performance as it enabled the Portfolio to benefit from the steepening of the yield curve that occurred during the reporting year.
Management Strategies
· The Portfolio maintained a neutral exposure to agency mortgage-backed securities and an overweight to non-agency mortgage-backed securities. The specific non-agency issues held in the Portfolio are backed primarily by Alt-A borrowers (those who have relatively strong credit but are not considered “prime” borrowers) and are concentrated in the senior and middle tranches of the capital structure. Given our expectations that the housing market situation may take some time to work itself out and therefore, these securities would continue to add volatility, we began reducing the Portfolio’s exposure to non-agency mortgage-backed securities in the third quarter of 2008.
· With regard to yield-curve positioning, we underweighted longer-dated issues and overweighted intermediate-dated issues in the first half of 2008, a strategy that helped enhance returns as the spread between intermediate- and long-dated yields widened and the curve steepened. This trade was removed during the third quarter of the year and as a result, the Portfolio held a neutral duration, or interest-rate sensitivity, at the end of the period.
· During 2007 and into the first quarter of 2008, we maintained an underweight allocation to corporate credits with an emphasis on high-quality names. In response to sharp spread widening later in the period, this position was brought to a neutral stance.
| 2008 Annual Report |
| |
| September 30, 2008 |
Investment Overview (cont’d)
Core Plus Fixed Income Portfolio
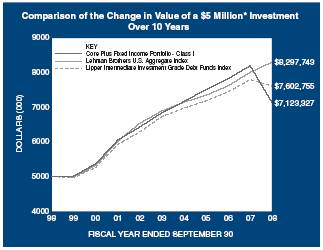
* Minimum Investment
In accordance with SEC regulations, the Portfolio’s performance shown assumes that all recurring fees (including management fees) were deducted and all dividends and distributions were reinvested. The performance of Investment Class and Class P shares will vary from the Class I shares based upon their different inception dates and will be negatively impacted by additional fees assessed to those classes.
Performance Compared to the Lehman Brothers U.S. Aggregate Index(1) and Lipper Intermediate Investment Grade Debt Funds Index(2)
| | Total Returns(3) | |
| | | | Average Annual | |
| | One | | | Five | | | Ten | | | Since | |
| | Year | | | Years | | | Years | | | Inception(7) | |
Portfolio – Class I (4) | | (13.07 | )% | | 0.83 | % | | 3.60 | % | | 7.69 | % | |
Lehman Brothers U.S. Aggregate Index | | 3.65 | | | 3.78 | | | 5.20 | | | 8.09 | | |
Lipper Intermediate Investment Grade Debt Funds Index | | (2.43 | ) | | 2.46 | | | 4.28 | | | — | | |
| | | | | | | | | | | | | |
Portfolio – Investment Class (5) | | (13.12 | ) | | 0.69 | | | 3.45 | | | 4.35 | | |
Lehman Brothers U.S. Aggregate Index | | 3.65 | | | 3.78 | | | 5.20 | | | 6.02 | | |
Lipper Intermediate Investment Grade Debt Funds Index | | (2.43 | ) | | 2.46 | | | 4.28 | | | 5.12 | | |
| | | | | | | | | | | | | |
Portfolio – Class P (6) | | (13.23 | ) | | 0.58 | | | 3.34 | | | 4.09 | | |
Lehman Brothers U.S. Aggregate Index | | 3.65 | | | 3.78 | | | 5.20 | | | 5.89 | | |
Lipper Intermediate Investment Grade Debt Funds Index | | (2.43 | ) | | 2.46 | | | 4.28 | | | 5.00 | | |
Performance data quoted represents past performance, which is no guarantee of future results, and current performance may be lower or higher than the figures shown. Performance assumes that all dividends and distributions, if any, were reinvested. For the most recent month-end performance figures, please visit www.morganstanley.com/msim. Investment returns and principal value will fluctuate so that Portfolio shares, when redeemed, may be worth more or less than their original cost. Total returns do not reflect the deduction of taxes that a shareholder would pay on Portfolio distributions or the redemption of Portfolio shares. Performance of share classes will vary due to differences in sales charges and expenses.
(1) The Lehman Brothers U.S. Aggregate Index tracks the performance of all U.S. government agency and Treasury securities, investment-grade corporate debt securities, agency mortgage-backed securities, asset-backed securities and commercial mortgage-backed securities. The Index is unmanaged and its returns do not include any sales charges or fees. Such costs would lower performance. It is not possible to invest directly in an index.
(2) The Lipper Intermediate Investment Grade Debt Funds Index is an equally weighted performance index of the largest qualifying funds (based on net assets) in the Lipper Intermediate Investment Grade Debt Funds classification. The Index, which is adjusted for capital gains distributions and income dividends, is unmanaged and should not be considered an investment. There are currently 30 funds represented in this Index. As of the date of this report, the Portfolio was in the Lipper Intermediate Investment Grade Debt Funds classification.
(3) Total returns for the Portfolio reflect expenses waived and/or reimbursed, if applicable, by the Adviser. Without such waivers and/or reimbursements, total returns would have been lower. Fee waivers and/or reimbursements are voluntary and the Adviser reserves the right to commence or terminate any waiver and/or reimbursement at any time.
(4) Commenced operations on November 14, 1984.
(5) Commenced operations on October 15, 1996.
(6) Commenced operations on November 7, 1996.
(7) For comparative purposes, average annual since inception returns listed for the Indexes refer to the inception date or initial offering of the respective share class of the Portfolio, not the inception of the Indexes.
Portfolio Composition*
Classification | | Percentage of
Total Investments | |
Agency Fixed Rate Mortgages | | 41.8 | % |
Industrials | | 12.7 | |
Asset Backed Corporates | | 11.2 | | |
Finance | | 6.9 | | |
Mortgages – Other | | 6.5 | | |
Agency Adjustable Rate Mortgages | | 5.7 | | |
Other** | | 9.5 | | |
Short-Term Investments | | | 5.7 | | |
Total Investments | | | 100.0 | % |
* | | Percentages indicated are based upon total investments (excluding Securities held as collateral on Loaned Securities) as of September 30, 2008. |
** | | Industries and/or investment types which do not appear in the above table, as well as those which represent less than 5% of total investments, if applicable, are included in the category labeled “Other”. |
2008 Annual Report | |
| |
September 30, 2008 | |
Portfolio of Investments
Core Plus Fixed Income Portfolio
| | Face | | | |
| | Amount | | Value | |
| | (000) | | (000) | |
Fixed Income Securities (113.5%) | | | | | |
Agency Adjustable Rate Mortgages (6.8%) | | | | | |
Federal Home Loan Mortgage Corp.,
Conventional Pools: | | | | | |
5.30%, 4/1/37 | | $ | 9,652 | | $ | 9,778 | |
5.58%, 3/1/37 | | 10,338 | | 10,500 | |
5.70%, 1/1/37 | | 13,738 | | 13,942 | |
5.86%, 10/1/36 | | 9,629 | | 9,874 | |
Federal National Mortgage Association,
Conventional Pools: | | | | | |
4.73%, 6/1/36 | | 9,401 | | 9,484 | |
5.31%, 5/1/36 | | 12,295 | | 12,509 | |
5.33%, 7/1/36 | | 9,310 | | 9,480 | |
5.34%, 7/1/36 | | 2,272 | | 2,313 | |
5.35%, 4/1/36 | | 8,739 | | 8,906 | |
5.36%, 8/1/36 | | 1,161 | | 1,183 | |
Government National Mortgage Association,
Various Pools: | | | | | |
5.13%, 10/20/25 - 12/20/27 | | 1,299 | | 1,315 | |
5.38%, 1/20/25 - 1/20/28 | | 7,740 | | 7,837 | |
5.63%, 7/20/25 - 9/20/27 | | 868 | | 879 | |
| | | | 98,000 | |
Agency Fixed Rate Mortgages (50.3%) | | | | | |
Federal Home Loan Mortgage Corp.,
Conventional Pools: | | | | | |
5.00%, 1/1/37 - 10/1/37 | | 2,500 | | 2,438 | |
5.13%, 11/17/17(c) | | 23,760 | | 24,529 | |
5.50%, 8/23/17 - 1/1/37(c) | | 10,238 | | 10,836 | |
6.75%, 3/15/31(c) | | 5,500 | | 6,759 | |
10.00%, 10/1/10 - 11/1/20 | | 890 | | 1,022 | |
10.50%, 9/1/09 - 10/1/20 | | 165 | | 186 | |
11.00%, 12/1/10 - 9/1/20 | | 160 | | 182 | |
11.25%, 10/1/11 - 12/1/15 | | 93 | | 105 | |
11.50%, 1/1/11 - 12/1/11 | | 1 | | 1 | |
11.75%, 4/1/19 | | 5 | | 6 | |
12.00%, 10/1/09 - 2/1/15 | | 6 | | 7 | |
13.00%, 6/1/19 | | 2 | | 2 | |
14.75%, 3/1/10 | | — | @ | — | @ |
Gold Pools: | | | | | |
5.50%, 1/1/37 - 10/1/37 | | 115,860 | | 115,357 | |
6.00%, 8/1/37 | | 115 | | 116 | |
6.50%, 3/1/16 - 8/1/33 | | 1,225 | | 1,268 | |
7.00%, 2/1/28 - 7/1/32 | | 1,698 | | 1,787 | |
7.50%, 8/1/17 - 10/1/32 | | 9,166 | | 9,925 | |
8.00%, 11/1/25 - 12/1/31 | | 2,516 | | 2,730 | |
8.50%, 3/1/20 - 8/1/31 | | 5,254 | | 5,833 | |
9.00%, 7/1/17 | | 385 | | 423 | |
9.50%, 1/1/21 - 12/1/22 | | 408 | | 454 | |
10.00%, 6/1/17 - 3/1/21 | | 301 | | 350 | |
10.50%, 12/1/20 - 4/1/21 | | 123 | | 142 | |
11.00%, 9/1/20 | | 42 | | 48 | |
October TBA: | | | | | |
5.00%, 10/15/38(i) | | 43,057 | | 41,947 | |
6.00%, 10/15/38(i) | | 100,010 | | 101,245 | |
Federal National Mortgage Association, | | | | | |
5.38%, 6/12/17(c) | | 10,000 | | 10,503 | |
Conventional Pools: | | | | | |
5.00%, 4/1/36 - 11/1/37 | | 30,755 | | 29,997 | |
5.50%, 6/1/35 - 8/1/37 | | 553 | | 553 | |
6.50%, 11/1/23 - 1/1/34 | | 21,619 | | 22,364 | |
6.63%, 11/15/30(c) | | 4,000 | | 4,843 | |
7.00%, 11/1/13 - 4/1/36 | | 43,325 | | 45,538 | |
7.50%, 11/1/22 - 8/1/37 | | 30,413 | | 32,668 | |
8.00%, 2/1/12 - 10/1/32 | | 16,554 | | 17,950 | |
8.50%, 1/1/15 - 5/1/32 | | 14,791 | | 16,314 | |
9.00%, 12/1/08 - 1/1/22 | | 525 | | 576 | |
9.50%, 11/1/13 - 4/1/30 | | 3,495 | | 3,882 | |
10.00%, 9/1/10 - 10/1/25 | | 628 | | 719 | |
10.50%, 5/1/12 - 7/1/25 | | 515 | | 595 | |
11.00%, 7/1/20 - 11/1/20 | | 69 | | 76 | |
11.50%, 1/1/13 - 2/1/20 | | 123 | | 140 | |
12.00%, 11/1/15 | | 138 | | 158 | |
12.50%, 9/1/15 - 2/1/16 | | 17 | | 19 | |
October TBA: | | | | | |
5.50%, 10/25/38(i) | | 84,199 | | 83,975 | |
6.00%, 10/15/37(i) | | 28,000 | | 28,363 | |
6.50%, 10/25/38(i) | | 45,535 | | 46,695 | |
7.00%, 10/25/38(i) | | 24,350 | | 25,446 | |
Government National Mortgage Association,
Various Pools: | | | | | |
9.00%, 12/15/21 - 11/15/24 | | 1,665 | | 1,832 | |
9.50%, 8/15/09 - 12/15/19 | | 1,492 | | 1,650 | |
10.00%, 11/15/09 - 1/15/26 | | 10,250 | | 11,686 | |
10.50%, 9/15/15 - 4/15/25 | | 1,138 | | 1,305 | |
11.00%, 12/15/09 - 2/15/25 | | 2,330 | | 2,632 | |
11.50%, 4/15/13 - 4/20/19 | | 72 | | 82 | |
12.00%, 3/15/11 - 11/15/19 | | 1,190 | | 1,363 | |
12.50%, 6/15/10 | | 4 | | 4 | |
| | | | 719,626 | |
Asset Backed Corporates (13.5%) | | | | | |
ACE Securities Corp., | | | | | |
3.53%, 5/25/34(h) | | 1,861 | | 1,368 | |
Argent Securities, Inc., | | | | | |
3.26%, 10/25/36(h) | | 5,103 | | 4,991 | |
Bear Stearns Asset Backed Securities Trust, | | | | | |
3.31%, 1/25/37(h) | | 6,123 | | 5,633 | |
Capital Auto Receivables Asset Trust, | | | | | |
2.50%, 4/15/11(h) | | 14,725 | | 14,363 | |
2.55%, 7/15/10 - 5/15/11(h) | | 27,555 | | 27,108 | |
Capital One Multi-Asset Execution Trust, | | | | | |
5.75%, 7/15/20 | | 13,450 | | 10,919 | |
Carrington Mortgage Loan Trust, | | | | | |
3.33%, 2/25/35(h) | | 6,519 | | 6,234 | |
Citibank Credit Card Issuance Trust, | | | | | |
3.19%, 3/22/12(h) | | 8,975 | | 8,752 | |
Citicorp Residential Mortgage Securities, Inc., | | | | | |
3.29%, 9/25/36(h) | | 12 | | 12 | |
| | | | | | | |
46 | The accompanying notes are an integral part of the financial statements. |
| 2008 Annual Report |
| |
| September 30, 2008 |
Portfolio of Investments (cont’d)
Core Plus Fixed Income Portfolio
| | Face | | | |
| | Amount | | Value | |
| | (000) | | (000) | |
Asset Backed Corporates (cont’d) | | | | | |
Citigroup Mortgage Loan Trust, Inc., | | | | | |
3.28%, 1/25/37(h) | | $ | 8,354 | | $ | 6,473 | |
3.62%, 10/25/34(h) | | 34 | | 32 | |
Contimortgage Home Equity Trust, | | | | | |
8.10%, 8/15/25 | | 78 | | 64 | |
Countrywide Asset Backed Certificates, | | | | | |
3.36%, 5/25/36(h) | | 1,021 | | 1,008 | |
First Franklin Mortgage Loan Asset | | | | | |
Backed Certificates, | | | | | |
3.26%, 7/25/36(h) | | 2,218 | | 2,194 | |
Ford Credit Auto Owner Trust, | | | | | |
2.50%, 4/15/10(h) | | 12,180 | | 12,147 | |
Fremont Home Loan Owner Trust, | | | | | |
3.26%, 10/25/36(h) | | 7,218 | | 6,901 | |
GSAMP Trust, | | | | | |
3.28%, 1/25/37(h) | | 4,687 | | 4,425 | |
3.33%, 3/25/47(h) | | 9,190 | | 8,618 | |
MBNA Master Credit Card Trust, | | | | | |
7.80%, 10/15/12 | | 5,505 | | 5,759 | |
Mid-State Trust, | | | | | |
8.33%, 4/1/30 | | 63 | | 53 | |
Novastar Home Equity Loan, | | | | | |
3.28%, 11/25/36(h) | | 2 | | 2 | |
Residential Asset Mortgage Products, Inc., | | | | | |
3.28%, 8/25/36(h) | | 3,805 | | 3,721 | |
3.30%, 10/25/36(h) | | 3,805 | | 3,593 | |
Securitized Asset Backed Receivables LLC Trust, | | | | | |
3.29%, 11/25/36(h) | | 7,609 | | 7,329 | |
3.32%, 2/25/37(h) | | 5,630 | | 5,256 | |
3.34%, 5/25/37(h) | | 9,188 | | 8,075 | |
SLM Student Loan Trust, | | | | | |
2.79%, 10/27/14(h) | | 9,808 | | 9,714 | |
Soundview Home Equity Loan Trust, | | | | | |
3.32%, 2/25/37(h) | | 11,069 | | 10,249 | |
Structured Asset Securities Corp., | | | | | |
3.30%, 2/25/37(h) | | 7,167 | | 7,064 | |
TXU Electric Delivery Transition Bond Co. LLC, | | | | | |
4.81%, 11/17/14 | | 3,115 | | 3,151 | |
Washington Mutual Asset Backed Certificates, | | | | | |
3.32%, 4/25/37(h) | | 8,060 | | 7,509 | |
| | | | 192,717 | |
Collateralized Mortgage Obligations — Agency Collateral Series (4.6%) | | | | | |
Federal Home Loan Mortgage Corp., | | | | | |
Inv Fl IO REMIC | | | | | |
5.01%, 8/15/30 | | 176 | | 14 | |
Inv Fl REMIC | | | | | |
2.94%, 10/15/36 | | 4,662 | | 4,508 | |
IO | | | | | |
6.00%, 5/1/31 | | 5,480 | | 1,112 | |
7.50%, 12/1/29 | | 317 | | 95 | |
8.00%, 1/1/28 - 6/1/31 | | 2,210 | | 575 | |
PAC REMIC | | | | | |
9.50%, 4/15/20 | | 3 | | 3 | |
Federal National Mortgage Association, | | | | | |
Inv Fl IO REMIC | | | | | |
2.69%, 8/25/34 | | 110,565 | | 2,081 | |
3.19%, 7/25/34 | | 6,723 | | 436 | |
4.99%, 10/25/28 | | 3,965 | | 178 | |
5.29%, 7/25/30 | | 3,257 | | 361 | |
5.80%, 10/18/30 | | 2,021 | | 168 | |
52.88%, 9/25/22 | | 78 | | 108 | |
Inv Fl REMIC | | | | | |
43.23%, 9/25/20 | | 42 | | 61 | |
IO | | | | | |
6.50%, 12/25/29 - 2/1/32 | | 6,644 | | 1,648 | |
7.00%, 4/1/32 | | 4,165 | | 1,133 | |
8.00%, 4/1/24 - 12/1/31 | | 7,404 | | 1,882 | |
8.50%, 10/1/25 | | 231 | | 81 | |
9.00%, 11/1/26 | | 362 | | 116 | |
IO PAC REMIC | | | | | |
8.00%, 9/18/27 | | 1,226 | | 252 | |
IO REMIC | | | | | |
1.42%, 3/25/36 | | 46,599 | | 699 | |
6.00%, 8/25/32 - 7/25/33 | | 3,804 | | 643 | |
6.50%, 2/25/33 - 6/25/33 | | 14,002 | | 2,784 | |
REMIC | | | | | |
7.00%, 9/25/32 | | 2,725 | | 2,818 | |
Government National Mortgage Association, | | | | | |
Inv Fl IO | | | | | |
5.66%, 5/16/31 | | 5,295 | | 704 | |
5.71%, 8/16/31 | | 1,721 | | 198 | |
6.11%, 8/16/29 | | 269 | | 38 | |
PAC | | | | | |
6.00%, 6/20/38 | | 41,690 | | 42,765 | |
| | | | 65,461 | |
Collateralized Mortgage Obligations — Non Agency Collateral Series (1.2%) | | | | | |
Bear Stearns Structured Products, Inc., | | | | | |
IO | | | | | |
Zero Coupon, 3/27/36 - 5/27/36(e)(l) | | 202,905 | | — | |
0.02%, 6/26/36(e)(d)(l) | | 189,458 | | 19 | |
0.16%, 1/27/37(e)(l) | | 159,740 | | 16 | |
0.18%, 1/27/37(e)(l) | | 160,193 | | 16 | |
1.22%, 5/25/37(e)(d)(l) | | 238,087 | | 24 | |
Countrywide Alternative Loan Trust, | | | | | |
IO | | | | | |
0.18%, 5/25/47(e)(d)(l) | | 53,309 | | 5 | |
0.41%, 2/25/47(d)(l) | | 136,359 | | 14 | |
2.18%, 3/20/46 | | 49,396 | | 1,512 | |
2.40%, 12/20/46 | | 117,141 | | 3,587 | |
2.51%, 12/20/35(e)(h) | | 50,574 | | 1,296 | |
2.54%, 12/20/35(e)(h) | | 73,663 | | 2,210 | |
2.56%, 2/25/37 | | 58,190 | | 1,490 | |
2.86%, 3/20/47 | | 100,085 | | 3,253 | |
Greenpoint Mortgage Funding Trust, | | | | | |
IO | | | | | |
1.20%, 10/25/45 | | 37,445 | | 1,012 | |
1.30%, 8/25/45 | | 28,562 | | 627 | |
| | | | | | | |
The accompanying notes are an integral part of the financial statements. | 47 |
2008 Annual Report | |
| |
September 30, 2008 | |
Portfolio of Investments (cont’d)
Core Plus Fixed Income Portfolio
| | Face | | | |
| | Amount | | Value | |
| | (000) | | (000) | |
Collateralized Mortgage Obligations — Non Agency Collateral Series (cont’d) | | | | | |
GS Mortgage Securities Corp., | | | | | |
IO | | | | | |
2.84%, 8/25/35(e)(h) | | $ | 19,146 | | $ | 276 | |
Harborview Mortgage Loan Trust, | | | | | |
IO | | | | | |
2.36%, 6/19/35(h) | | 39,011 | | 433 | |
2.59%, 5/19/35(h) | | 48,559 | | 486 | |
2.93%, 3/19/37(h) | | 47,636 | | 1,109 | |
PO | | | | | |
3/19/37 | | 86 | | 12 | |
Harborview NIM Corp., | | | | | |
IO | | | | | |
1.52%, 12/15/36(d)(l) | | 4,237 | | — | @ |
Indymac Index Mortgage Loan Trust, | | | | | |
IO | | | | | |
2.34%, 7/25/35(h) | | 31,904 | | 428 | |
Kidder Peabody Mortgage Assets Trust, | | | | | |
IO | | | | | |
9.50%, 4/22/18 | | 2 | | — | @ |
Residential Accredit Loans, Inc., | | | | | |
IO | | | | | |
0.68%, 3/25/47(d)(h)(l) | | 93,322 | | 9 | |
0.76%, 5/25/47(d)(h)(l) | | 159,565 | | 16 | |
| | | | 17,850 | |
Finance (8.3%) | | | | | |
Ace INA Holding, Inc., | | | | | |
5.60%, 5/15/15 | | 1,425 | | 1,350 | |
AIG SunAmerica Global Financing VI, | | | | | |
6.30%, 5/10/11(e) | | 5,667 | | 4,595 | |
American Express Credit Corp., | | | | | |
7.30%, 8/20/13(c) | | 2,800 | | 2,703 | |
Bank of America Corp., | | | | | |
5.75%, 12/1/17 | | 4,725 | | 4,014 | |
Bank of New York Mellon Corp. (The), | | | | | |
4.50%, 4/1/13 | | 1,865 | | 1,748 | |
Bear Stearns Cos. LLC (The), | | | | | |
5.55%, 1/22/17 | | 3,665 | | 3,152 | |
7.25%, 2/1/18 | | 2,620 | | 2,526 | |
Berkshire Hathaway Finance Corp., | | | | | |
5.40%, 5/15/18(e) | | 3,335 | | 3,237 | |
Capmark Financial Group, Inc., | | | | | |
5.88%, 5/10/12 | | 3,680 | | 1,836 | |
6.30%, 5/10/17 | | 1,495 | | 588 | |
Caterpillar Financial Services Corp., | | | | | |
4.90%, 8/15/13 | | 740 | | 701 | |
Catlin Insurance Co., Ltd., | | | | | |
7.25%,(e)(h)(o) | | 4,980 | | 2,226 | |
Chubb Corp., | | | | | |
5.75%, 5/15/18 | | 475 | | 441 | |
Citigroup, Inc., | | | | | |
5.88%, 5/29/37 | | 2,815 | | 1,957 | |
6.13%, 5/15/18 | | 875 | | 726 | |
8.40%(h)(o) | | 3,825 | | 2,608 | |
Credit Suisse USA, Inc., | | | | | |
5.13%, 8/15/15 | | 690 | | 616 | |
Credit Suisse, New York, | | | | | |
6.00%, 2/15/18 | | 4,710 | | 4,110 | |
Farmers Exchange Capital, | | | | | |
7.05%, 7/15/28(e) | | 100 | | 80 | |
Farmers Insurance Exchange, | | | | | |
8.63%, 5/1/24(e) | | 6,970 | | 6,667 | |
General Electric Capital Corp., | | | | | |
5.63%, 5/1/18(c) | | 4,650 | | 3,937 | |
Goldman Sachs Group, Inc. (The), | | | | | |
6.15%, 4/1/18 | | 4,370 | | 3,640 | |
6.75%, 10/1/37 | | 4,765 | | 3,189 | |
HBOS plc, | | | | | |
6.75%, 5/21/18(e) | | 2,800 | | 2,352 | |
HSBC Finance Corp., | | | | | |
5.88%, 2/1/09 | | 6,275 | | 6,211 | |
6.75%, 5/15/11 | | 735 | | 739 | |
JPMorgan Chase & Co., | | | | | |
4.75%, 5/1/13 | | 1,575 | | 1,467 | |
6.00%, 1/15/18 | | 2,500 | | 2,284 | |
Lehman Brothers Holdings, Inc., | | | | | |
5.75%, 1/3/17(b) | | 1,710 | | 9 | |
6.88%, 7/17/37(b) | | 6,060 | | 30 | |
Magnolia Federal Bank, | | | | | |
9.36%, 10/1/07(d) | | 16 | | 16 | |
Mantis Reef Ltd., | | | | | |
4.69%, 11/14/08(e) | | 4,615 | | 4,613 | |
Merrill Lynch Co., Inc., | | | | | |
6.88%, 4/25/18 | | 6,140 | | 5,441 | |
Metlife, Inc., | | | | | |
6.13%, 12/1/11 | | 45 | | 45 | |
6.82%, 8/15/18 | | 1,755 | | 1,663 | |
Nationwide Building Society, | | | | | |
4.25%, 2/1/10(e) | | 5,000 | | 4,918 | |
NYSE Euronext, | | | | | |
4.80%, 6/28/13 | | 2,345 | | 2,235 | |
Platinum Underwriters Finance, Inc., | | | | | |
7.50%, 6/1/17 | | 3,015 | | 2,867 | |
ProLogis, | | | | | |
6.63%, 5/15/18 | | 560 | | 482 | |
Prudential Financial, Inc., | | | | | |
6.63%, 12/1/37 | | 1,840 | | 1,549 | |
SLM Corp., | | | | | |
4.00%, 1/15/10(c) | | 3,595 | | 2,823 | |
Travelers Cos., Inc. (The), | | | | | |
5.80%, 5/15/18 | | 1,445 | | 1,327 | |
Two-Rock Pass Through Trust, | | | | | |
3.74%,(e)(h)(o) | | 2,930 | | 62 | |
Unicredit Luxembourg Finance S.A., | | | | | |
2.85%, 10/24/08(e)(h) | | 8,220 | | 8,214 | |
Wachovia Capital Trust III, | | | | | |
5.80%,(h)(o) | | 6,060 | | 2,546 | |
Wachovia Corp., | | | | | |
5.50%, 5/1/13 | | 1,095 | | 907 | |
| | | | | | | |
48 | The accompanying notes are an integral part of the financial statements. |
| 2008 Annual Report |
| |
| September 30, 2008 |
Portfolio of Investments (cont’d)
Core Plus Fixed Income Portfolio
| | Face | | | |
| | Amount | | Value | |
| | (000) | | (000) | |
Finance (cont’d) | | | | | |
Wells Fargo & Co., | | | | | |
5.63%, 12/11/17 | | $ | 4,630 | | $ | 4,263 | |
Xlliac Global Funding, | | | | | |
4.80%, 8/10/10(e) | | 5,360 | | 5,154 | |
| | | | 118,864 | |
Industrials 15.3% | | | | | |
Amgen, Inc., | | | | | |
5.85%, 6/1/17 | | 2,210 | | 2,125 | |
ArcelorMittal, | | | | | |
6.13%, 6/1/18(e) | | 2,040 | | 1,811 | |
Archer-Daniels-Midland Co., | | | | | |
5.45%, 3/15/18 | | 2,330 | | 2,158 | |
AstraZeneca plc, | | | | | |
5.90%, 9/15/17 | | 1,925 | | 1,899 | |
AT&T Corp., | | | | | |
8.00%, 11/15/31(c) | | 3,105 | | 3,153 | |
AT&T, Inc., | | | | | |
6.15%, 9/15/34 | | 3,110 | | 2,601 | |
Baxter International, Inc., | | | | | |
4.63%, 3/15/15 | | 2,325 | | 2,232 | |
5.38%, 6/1/18 | | 750 | | 718 | |
Biogen Idec, Inc., | | | | | |
6.88%, 3/1/18 | | 2,240 | | 2,212 | |
Bristol-Myers Squibb Co., | | | | | |
5.45%, 5/1/18 | | 2,435 | | 2,304 | |
Brookfield Asset Management, Inc., | | | | | |
5.80%, 4/25/17 | | 1,605 | | 1,414 | |
7.13%, 6/15/12 | | 3,255 | | 3,260 | |
Burlington Northern Santa Fe Corp., | | | | | |
6.13%, 3/15/09 | | 3,605 | | 3,605 | |
Canadian National Railway Co., | | | | | |
5.55%, 5/15/18 | | 940 | | 930 | |
Comcast Cable Communications LLC, | | | | | |
7.13%, 6/15/13 | | 1,000 | | 1,011 | |
Comcast Corp., | | | | | |
5.70%, 5/15/18(c) | | 3,765 | | 3,292 | |
ConAgra Foods, Inc., | | | | | |
7.00%, 10/1/28 | | 930 | | 900 | |
8.25%, 9/15/30 | | 1,920 | | 2,108 | |
ConocoPhillips, | | | | | |
5.20%, 5/15/18 | | 2,910 | | 2,720 | |
Consumers Energy Co., | | | | | |
4.00%, 5/15/10 | | 1,410 | | 1,383 | |
4.80%, 2/17/09 | | 3,595 | | 3,594 | |
Cooper Industries, Inc., | | | | | |
5.25%, 11/15/12 | | 2,765 | | 2,800 | |
Covidien International Finance S.A., | | | | | |
6.00%, 10/15/17 | | 2,375 | | 2,350 | |
COX Communications, Inc., | | | | | |
6.25%, 6/1/18(e) | | 2,180 | | 2,029 | |
CVS Caremark Corp., | | | | | |
5.75%, 6/1/17 | | 1,145 | | 1,072 | |
CVS Pass-Through Trust, | | | | | |
6.04%, 12/10/28(e) | | 3,633 | | 3,270 | |
Daimler Finance North America LLC, | | | | | |
7.20%, 9/1/09 | | 25 | | 25 | |
Daimler Finance North America LLC, | | | | | |
8.50%, 1/18/31 | | 1,790 | | 1,803 | |
Delhaize America, Inc., | | | | | |
9.00%, 4/15/31 | | 2,756 | | 2,900 | |
Dell, Inc., | | | | | |
5.65%, 4/15/18(e) | | 1,280 | | 1,177 | |
Deutsche Telekom International Finance B.V., | | | | | |
8.75%, 6/15/30 | | 1,470 | | 1,425 | |
Devon Financing Corp. UCL, | | | | | |
7.88%, 9/30/31 | | 1,535 | | 1,563 | |
Dr. Pepper Snapple Group, Inc., | | | | | |
6.82%, 5/1/18(e) | | 1,585 | | 1,533 | |
E.I. Du Pont de Nemours & Co., | | | | | |
6.00%, 7/15/18 | | 1,620 | | 1,584 | |
Echostar DBS Corp., | | | | | |
6.38%, 10/1/11 | | 2,395 | | 2,209 | |
6.63%, 10/1/14 | | 545 | | 439 | |
FBG Finance Ltd., | | | | | |
5.13%, 6/15/15(e) | | 2,985 | | 2,803 | |
Fiserve, Inc., | | | | | |
6.80%, 11/20/17(c) | | 3,015 | | 2,914 | |
France Telecom S.A., | | | | | |
8.50%, 3/1/31 | | 3,495 | | 3,802 | |
Gaz Capital S.A., | | | | | |
6.51%, 3/7/22(e) | | 575 | | 415 | |
General Electric Co., | | | | | |
5.25%, 12/6/17 | | 12,215 | | 10,707 | |
General Mills, Inc., | | | | | |
5.25%, 8/15/13 | | 1,120 | | 1,113 | |
GlaxoSmithKline Capital, Inc., | | | | | |
5.65%, 5/15/18 | | 2,760 | | 2,625 | |
Grupo Televisa S.A., | | | | | |
6.00%, 5/15/18(c)(e) | | 1,450 | | 1,376 | |
GTL Trade Finance, Inc., | | | | | |
7.25%, 10/20/17(e) | | 1,175 | | 1,128 | |
Harley-Davidson Funding Corp., | | | | | |
6.80%, 6/15/18(e) | | 1,645 | | 1,543 | |
Hewlett-Packard Co., | | | | | |
5.50%, 3/1/18 | | 1,135 | | 1,067 | |
Home Depot, Inc., | | | | | |
2.94%, 12/16/09(h) | | 4,240 | | 3,990 | |
5.40%, 3/1/16 | | 2,075 | | 1,767 | |
Honeywell International, Inc., | | | | | |
5.30%, 3/1/18 | | 2,020 | | 1,905 | |
Hospira, Inc., | | | | | |
4.24%, 3/30/10(h) | | 3,845 | | 3,736 | |
ICI Wilmington, Inc., | | | | | |
4.38%, 12/1/08 | | 2,040 | | 2,036 | |
Interpublic Group of Cos., Inc., | | | | | |
6.25%, 11/15/14 | | 2,365 | | 1,975 | |
| | | | | | | |
The accompanying notes are an integral part of the financial statements. | 49 |
2008 Annual Report | |
| |
September 30, 2008 | |
Portfolio of Investments (cont’d)
Core Plus Fixed Income Portfolio
| | Face | | | |
| | Amount | | Value | |
| | (000) | | (000) | |
Industrials (cont’d) | | | | | |
John Deere Capital Corp., | | | | | |
5.75%, 9/10/18 | | $ | 1,760 | | $ | 1,640 | |
KLA-Tencor Corp., | | | | | |
6.90%, 5/1/18 | | 2,120 | | 1,974 | |
Koninklijke Philips Electronics N.V., | | | | | |
5.75%, 3/11/18 | | 3,160 | | 3,040 | |
Kraft Foods, Inc., | | | | | |
6.13%, 8/23/18 | | 2,665 | | 2,493 | |
Kroger Co. (The), | | | | | |
6.40%, 8/15/17 | | 1,495 | | 1,436 | |
LG Electronics, Inc., | | | | | |
5.00%, 6/17/10(e) | | 1,830 | | 1,809 | |
Macy’s Retail Holdings, Inc., | | | | | |
5.95%, 11/1/08 | | 705 | | 704 | |
Marathon Oil Corp., | | | | | |
5.90%, 3/15/18 | | 1,565 | | 1,392 | |
6.00%, 10/1/17 | | 1,350 | | 1,215 | |
Medco Health Solutions, Inc., | | | | | |
7.13%, 3/15/18 | | 2,160 | | 2,192 | |
MGM Mirage, | | | | | |
6.00%, 10/1/09 | | 2,075 | | 1,950 | |
Monsanto Co., | | | | | |
5.13%, 4/15/18 | | 840 | | 800 | |
Nine Dragons Paper Holdings Ltd., | | | | | |
7.88%, 4/29/13(e) | | 3,250 | | 2,990 | |
Oracle Corp., | | | | | |
5.75%, 4/15/18 | | 2,390 | | 2,223 | |
Parker Hannifin Corp., | | | | | |
5.50%, 5/15/18 | | 1,635 | | 1,634 | |
Pearson Dollar Finance Two plc, | | | | | |
6.25%, 5/6/18(e) | | 1,035 | | 995 | |
Petro-Canada, | | | | | |
6.05%, 5/15/18 | | 2,210 | | 1,932 | |
Philip Morris International, Inc., | | | | | |
5.65%, 5/16/18 | | 2,235 | | 2,070 | |
Pilgrim’s Pride Corp., | | | | | |
7.63%, 5/1/15 | | 2,540 | | 1,588 | |
Questar Market Resources, Inc., | | | | | |
6.80%, 4/1/18 | | 2,525 | | 2,550 | |
Reynolds American, Inc., | | | | | |
6.50%, 7/15/10 | | 2,540 | | 2,641 | |
Rio Tinto Finance USA Ltd., | | | | | |
6.50%, 7/15/18 | | 3,105 | | 2,941 | |
Rogers Communications, Inc., | | | | | |
6.80%, 8/15/18 | | 1,830 | | 1,734 | |
Sprint Capital Corp., | | | | | |
8.75%, 3/15/32 | | 2,655 | | 2,075 | |
Starwood Hotels & Resorts Worldwide, Inc., | | | | | |
6.75%, 5/15/18 | | 1,655 | | 1,482 | |
Systems 2001 Asset Trust LLC, | | | | | |
6.66%, 9/15/13(e) | | 4,287 | | 4,342 | |
Telecom Italia Capital S.A., | | | | | |
4.00%, 1/15/10 | | 3,370 | | 3,273 | |
7.00%, 6/4/18 | | 2,550 | | 2,293 | |
Telefonica Europe B.V., | | | | | |
8.25%, 9/15/30 | | 3,700 | | 3,729 | |
Time Warner Cable, Inc., | | | | | |
6.75%, 7/1/18 | | 2,165 | | 2,025 | |
Time Warner, Inc., | | | | | |
5.88%, 11/15/16 | | 2,625 | | 2,311 | |
Tyco Electronics Group S.A., | | | | | |
5.95%, 1/15/14 | | 2,630 | | 2,590 | |
Union Pacific Corp., | | | | | |
5.45%, 1/31/13 | | 6,135 | | 6,022 | |
UnitedHealth Group, Inc., | | | | | |
6.00%, 2/15/18 | | 2,450 | | 2,220 | |
Verizon Communications, Inc., | | | | | |
5.50%, 2/15/18 | | 1,245 | | 1,102 | |
Verizon New England, Inc., | | | | | |
6.50%, 9/15/11 | | 2,100 | | 2,083 | |
Viacom, Inc., | | | | | |
6.88%, 4/30/36 | | 3,720 | | 2,990 | |
Vivendi, | | | | | |
6.63%, 4/4/18(e) | | 3,810 | | 3,674 | |
Vodafone Group plc, | | | | | |
5.63%, 2/27/17 | | 1,050 | | 935 | |
Walgreen Co., | | | | | |
4.88%, 8/1/13 | | 1,685 | | 1,686 | |
Wal-Mart Stores, Inc., | | | | | |
4.25%, 4/15/13 | | 3,160 | | 3,105 | |
Weatherford International Ltd., | | | | | |
6.00%, 3/15/18 | | 1,530 | | 1,376 | |
Wyeth, | | | | | |
5.45%, 4/1/17 | | 1,510 | | 1,462 | |
5.50%, 2/15/16 | | 595 | | 581 | |
Xerox Corp., | | | | | |
6.35%, 5/15/18 | | 2,250 | | 2,060 | |
XTO Energy, Inc., | | | | | |
5.50%, 6/15/18 | | 2,635 | | 2,333 | |
Yum! Brands, Inc., | | | | | |
8.88%, 4/15/11 | | 3,140 | | 3,385 | |
| | | | 219,588 | |
Mortgages — Other (7.8%) | | | | | |
American Express Co., | | | | | |
9.63%, 12/25/12(d) | | 17 | | 17 | |
American Home Mortgage Assets, | | | | | |
3.40%, 10/25/46 - 6/25/47(d)(h) | | 33,530 | | 18,215 | |
3.44%, 5/25/46(d)(h) | | 6,604 | | 2,376 | |
3.45%, 6/25/47(h) | | 3,129 | | 1,001 | |
3.51%, 6/25/47(d)(h) | | 7,898 | | 1,164 | |
3.53%, 10/25/46(d)(h) | | 8,206 | | 1,477 | |
American Housing Trust, | | | | | |
9.55%, 9/25/20 | | 25 | | 24 | |
| | | | | | | |
50 | The accompanying notes are an integral part of the financial statements. |
| 2008 Annual Report |
| |
| September 30, 2008 |
Portfolio of Investments (cont’d)
Core Plus Fixed Income Portfolio
| | Face | | | |
| | Amount | | Value | |
| | (000) | | (000) | |
Mortgages — Other (cont’d) | | | | | |
Banc of America Funding Corp., | | | | | |
3.54%, 9/20/35(d)(h) | | $ | 3,537 | | $ | 1,432 | |
Bear Stearns Mortgage Funding Trust, | | | | | |
3.38%, 3/25/37(d)(h) | | 9,017 | | 4,869 | |
Bear Stearns Structured Products, Inc., | | | | | |
6.50%, 3/27/36(d)(e) | | 283 | | 28 | |
Countrywide Alternative Loan Trust, | | | | | |
3.38%, 5/25/47(d)(h) | | 15,100 | | 8,456 | |
3.40%, 10/25/46(h) | | 14,838 | | 9,111 | |
3.48%, 7/25/46(h) | | 77 | | 31 | |
3.49%, 12/20/46(h) | | — | | — | |
3.71%, 6/25/47(h) | | 8,203 | | 1,596 | |
4.56%, 2/25/36(d)(h) | | 10,533 | | 4,088 | |
Deutsche ALT-A Securities NIM Trust, | | | | | |
6.75%, 2/25/47(e) | | 624 | | 580 | |
Deutsche ALT-A Securities, Inc. | | | | | |
Alternate Loan Trust, | | | | | |
3.69%, 2/25/47(d)(h) | | 6,195 | | 1,225 | |
GSR Mortgage Loan Trust, | | | | | |
3.40%, 8/25/46(d)(h) | | 96 | | 72 | |
Harborview Mortgage Loan Trust, | | | | | |
3.23%, 1/25/47(d)(h) | | 9,672 | | 3,374 | |
3.27%, 11/19/36 - 3/19/37(d)(h) | | 4,771 | | 1,739 | |
3.44%, 8/21/36(d)(h) | | 11,234 | | 3,932 | |
Indymac Index Mortgage Loan Trust, | | | | | |
3.31%, 2/25/37(h) | | 10,290 | | 8,628 | |
3.49%, 7/25/35(d)(h) | | 2,407 | | 885 | |
3.59%, 10/25/36(d)(h) | | 6,519 | | 2,249 | |
Luminent Mortgage Trust, | | | | | |
3.43%, 12/25/36(d)(h) | | 16,437 | | 5,289 | |
Mastr Adjustable Rate Mortgages Trust, | | | | | |
3.46%, 4/25/46(d)(h) | | 47 | | 18 | |
3.80%, 4/25/46(h) | | 3,354 | | 708 | |
Residential Accredit Loans, Inc., | | | | | |
3.35%, 3/25/37(d)(h) | | 12,198 | | 6,587 | |
Ryland Acceptance Corp. IV, | | | | | |
6.65%, 7/1/11 | | 52 | | 52 | |
Structured Adjustable Rate | | | | | |
Mortgage Loan Trust, | | | | | |
3.51%, 9/25/34(h) | | 881 | | 681 | |
Structured Asset Mortgage Investments, Inc., | | | | | |
3.40%, 2/25/36(d)(h) | | 4,305 | | 2,282 | |
3.47%, 5/25/36(d)(h) | | 3,988 | | 1,581 | |
3.48%, 4/25/36(h) | | 11,247 | | 4,637 | |
3.49%, 7/25/46(d)(h) | | 8,806 | | 2,201 | |
Washington Mutual Alternative Mortgage | | | | | |
Pass Through Certificates, | | | | | |
3.40%, 7/25/46(d)(h) | | 453 | | 254 | |
3.50%, 11/25/46(d)(h) | | 6,137 | | 1,186 | |
3.80%, 4/25/46(d)(h) | | 9,548 | | 5,378 | |
Washington Mutual Mortgage | | | | | |
Pass Through Certificates, | | | | | |
3.48%, 4/25/45(d)(h) | | 36 | | 15 | |
3.50%, 8/25/45(h) | | 115 | | 113 | |
Washington Mutual, Inc., | | | | | |
3.47%, 10/25/45(h) | | 496 | | 488 | |
3.51%, 10/25/46(d)(h) | | 8,396 | | 1,751 | |
3.80%, 5/25/46(d)(h) | | 5,538 | | 2,326 | |
| | | | 112,116 | |
Sovereign (1.1%) | | | | | |
Federative Republic of Brazil, | | | | | |
6.00%, 1/17/17(c) | | 7,045 | | 6,816 | |
Korea Railroad Corp., | | | | | |
5.38%, 5/15/13(e) | | 1,530 | | 1,436 | |
Mexican Bonos, | | | | | |
9.50%, 12/18/14 | | MXN | 75,635 | | 7,292 | |
| | | | 15,544 | |
U.S. Treasury Security (1.2%) | | | | | |
U.S. Treasury Bond STRIPS, | | | | | |
Zero Coupon, 5/15/21 | | $ | 29,465 | | 16,553 | |
Utilities (3.4%) | | | | | |
Arizona Public Service Co., | | | | | |
5.80%, 6/30/14 | | 3,470 | | 3,214 | |
CenterPoint Energy Resources Corp., | | | | | |
6.25%, 2/1/37 | | 1,130 | | 897 | |
7.88%, 4/1/13 | | 730 | | 750 | |
Colorado Interstate Gas Co., | | | | | |
6.80%, 11/15/15 | | 2,129 | | 2,028 | |
Consolidated Natural Gas Co., | | | | | |
6.25%, 11/1/11 | | 1,760 | | 1,777 | |
Detroit Edison Co. (The), | | | | | |
6.13%, 10/1/10 | | 2,590 | | 2,658 | |
E.ON International Finance B.V., | | | | | |
5.80%, 4/30/18(e) | | 3,305 | | 3,165 | |
Entergy Gulf States, Inc., | | | | | |
3.21%, 12/1/09(h) | | 1,995 | | 1,977 | |
3.57%, 12/8/08(e)(h) | | 1,957 | | 1,953 | |
Equitable Resources, Inc., | | | | | |
6.50%, 4/1/18 | | 1,985 | | 1,897 | |
Israel Electric Corp. Ltd., | | | | | |
7.25%, 1/15/19(e) | | 2,135 | | 2,142 | |
Kinder Morgan Finance Co., | | | | | |
5.70%, 1/5/16 | | 3,075 | | 2,660 | |
NiSource Finance Corp., | | | | | |
6.80%, 1/15/19 | | 1,400 | | 1,274 | |
7.88%, 11/15/10 | | 3,590 | | 3,694 | |
Ohio Edison Co., | | | | | |
6.40%, 7/15/16 | | 2,370 | | 2,258 | |
Ohio Power Co., | | | | | |
6.00%, 6/1/16 | | 3,605 | | 3,445 | |
Peco Energy Co., | | | | | |
5.35%, 3/1/18 | | 1,830 | | 1,665 | |
| | | | | | | |
The accompanying notes are an integral part of the financial statements. | 51 |
2008 Annual Report | |
| |
September 30, 2008 | |
Portfolio of Investments (cont’d)
Core Plus Fixed Income Portfolio
| | Face | | | |
| | Amount | | Value | |
| | (000) | | (000) | |
Utilities (cont’d) | | | | | |
Plains All American Pipeline
LP/PAA Finance Corp., | | | | | |
6.70%, 5/15/36 | | $ 2,850 | | $ 2,463 | |
PPL Energy Supply LLC, | | | | | |
6.30%, 7/15/13(c) | | 1,380 | | 1,344 | |
Public Service Co. of Colorado, | | | | | |
6.50%, 8/1/38 | | 1,290 | | 1,229 | |
Public Service Electric & Gas Co., | | | | | |
5.00%, 1/1/13 | | 20 | | 20 | |
Texas Eastern Transmission LP, | | | | | |
7.00%, 7/15/32 | | 2,295 | | 2,236 | |
Trans-Canada Pipelines Ltd., | | | | | |
6.50%, 8/15/18 | | 1,840 | | 1,788 | |
Union Electric Co., | | | | | |
6.40%, 6/15/17 | | 1,960 | | 1,872 | |
| | | | 48,406 | |
Total Fixed Income Securities (Cost $1,904,390) | | | | 1,624,725 | |
| | | | | |
| | Shares | | | |
Short-Term Investments (12.3%) | | | | | |
Securities held as Collateral on Loaned Securities (5.4%) | | | | | |
Investment Company (4.8%) | | | | | |
Morgan Stanley Institutional Liquidity Money Market Portfolio — Institutional Class(p) | | 69,250,752 | | 69,251 | |
| | | | | |
| | Face | | | |
| | Amount | | | |
| | (000) | | | |
Short-Term Debt (0.6%) | | | | | |
Bancaja, | | | | | |
2.96%, 11/12/08(h) | | $ 1,477 | | 1,477 | |
Citigroup Global Markets, Inc., | | | | | |
1.00%, 10/1/08 | | 6,502 | | 6,502 | |
| | | | 7,979 | |
| | | | 77,230 | |
| | | | | |
| | Shares | | | |
Investment Company (0.8%) | | | | | |
Morgan Stanley Institutional Liquidity Money Market Portfolio — Institutional Class(p) | | 10,902,078 | | 10,902 | |
| | | | | |
| | Face | | | |
| | Amount | | | |
| | (000) | | | |
U.S. Government & Agency Security (1.7%) | | | | | |
Federal Home Loan Bank, | | | | | |
2.12%, 10/10/08(t) | | $ 25,000 | | 24,997 | |
U.S. Treasury Securities (4.4%) | | | | | |
U.S. Treasury Bills, | | | | | |
0.17%, 10/9/08(c)(r)(j) | | 20,225 | | 20,224 | |
0.70%, 12/4/08(c)(r) | | 35,000 | | 34,956 | |
0.95%, 1/15/09(c)(r) | | 7,400 | | 7,380 | |
| | | | 62,560 | |
Total Short-Term Investments (Cost $175,623) | | | | 175,689 | |
Total Investments (125.8%) (Cost $2,080,013) — including $119,803 of Securities Loaned | | | | 1,800,414 | |
Liabilities in Excess of Other Assets (-25.8%) | | | | (368,695 | ) |
Net Assets (100%) | | | | $1,431,719 | |
(b) | Issuer is in default. |
(c) | All or a portion of security on loan at September 30, 2008. |
(d) | Security was valued at fair value — At September 30, 2008, the Portfolio held $84,569,000 of fair valued securities, representing 5.9% of net assets. |
(e) | 144A security — Certain conditions for public sale may exist. Unless otherwise noted, these securities are deemed to be liquid. |
(h) | Variable/Floating Rate Security — Interest rate changes on these instruments are based on changes in a designated rate. The rates shown are those in effect on September 30, 2008. |
(i) | Security is subject to delayed delivery. |
(j) | All or a portion of the security was pledged to cover margin requirements for futures contracts. |
(l) | Security has been deemed illiquid at September 30, 2008. |
(o) | Perpetual — Security does not have a predetermined maturity date. Rate for this security is fixed for a period of time then reverts to a floating rate. The interest shown is the rate in effect at September 30, 2008. |
(p) | See Note G within the Notes to Financial Statements regarding investment in Morgan Stanley Institutional Liquidity Money Market Portfolio — Institutional Class. |
(r) | Rate shown is the yield to maturity at September 30, 2008. |
(t) | Purchased on a discount basis. The interest rate shown has been adjusted to reflect a money market equivalent yield. |
@ | Face Amount/Value is less than $500. |
Inv Fl | Inverse Floating Rate - Interest rate fluctuates with an inverse relationship to an associated interest rate. Indicated rate is the effective rate at September 30, 2008. |
IO | Interest Only |
MXN | Mexican Peso |
PAC | Planned Amortization Class |
PO | Principal Only |
REMIC | Real Estate Mortgage Investment Conduit |
STRIPS | Separate Trading of Registered Interest and Principal of Securities |
TBA | To Be Announced |
52 | The accompanying notes are an integral part of the financial statements. |
| 2008 Annual Report |
| |
| September 30, 2008 |
Portfolio of Investments (cont’d)
Core Plus Fixed Income Portfolio
The Portfolio had the following futures contract(s) open at period end:
| | | | | | | | Net | |
| | | | | | | | Unrealized | |
| | Number | | | | | | Appreciation | |
| | of | | Value | | Expiration | | (Depreciation) | |
| | Contracts | | (000) | | Date | | (000) | |
Long: | | | | | | | | | |
EuroDollar
CME | | 257 | | $ 62,030 | | Dec-08 | | | $1,154 | | |
EuroDollar
CME | | 104 | | 25,210 | | Jun-09 | | | 355 | | |
EuroDollar
CME | | 39 | | 9,375 | | Jun-10 | | | 87 | | |
U.S. Treasury
5 yr. Note | | 4 | | 449 | | Dec-08 | | | — | @ | |
U.S. Treasury
Long Bond | | 1,191 | | 139,552 | | Dec-08 | | | (979 | ) | |
Short: | | | | | | | | | | | |
EuroDollar
CME | | 214 | | 51,660 | | Dec-09 | | | (665 | ) | |
EuroDollar
CME | | 142 | | 33,959 | | Dec-10 | | | (219 | ) | |
U.S. Treasury
2 yr. Note | | 209 | | 44,608 | | Dec-08 | | | (294 | ) | |
U.S. Treasury
10 yr. Note | | 250 | | 28,656 | | Dec-08 | | | 636 | | |
5 yr. Swap | | 475 | | 51,538 | | Dec-08 | | | (236 | ) | |
10 yr. Swap | | 545 | | 60,955 | | Dec-08 | | | 44 | | |
| | | | | | | | | $ (117 | ) | |
CME — Chicago Mercantile Exchange
The accompanying notes are an integral part of the financial statements. | 53 |
2008 Annual Report | |
| |
September 30, 2008 | |
Portfolio of Investments (cont’d)
Core Plus Fixed Income Portfolio
Credit Default Swap Contracts
The Portfolio had the following credit default swap agreement(s) open at period end:
| | | | | | | | | | Unrealized | |
| | | | Notional | | | | | | Appreciation | |
| | Buy/Sell | | Amount | | Pay/Receive | | Termination | | (Depreciation) | |
Swap Counterparty and Reference Obligation | | Protection | | (000) | | Fixed Rate | | Date | | (000) | |
Bank of America | | | | | | | | | | | |
Carnival Corp., 6.65%, 1/15/28 | | Buy | | $ 1,680 | | 1.57 | % | | 3/20/18 | | | $ (31 | ) | |
Goodrich Corp., 7.63%, 12/15/12 | | Buy | | 2,215 | | 0.70 | | 3/20/13 | | | (21 | ) | |
Textron Financial Corp., 5.13%, 2/3/11 | | Buy | | 1,785 | | 0.80 | | 3/20/18 | | | 321 | | |
Citigroup | | | | | | | | | | | | | |
Eaton Corp., 7.65%, 11/15/29 | | Buy | | 1,560 | | 0.82 | | 3/20/18 | | | 20 | | |
Credit Suisse | | | | | | | | | | | | | |
Arrow Electronics, Inc., 6.88%, 6/1/18 | | Buy | | 1,690 | | 1.00 | | 3/20/15 | | | (32 | ) | |
Goldman Sachs | | | | | | | | | | | | | |
American Standard, Inc., 7.63%, 2/15/10 | | Buy | | 1,065 | | 0.50 | | 3/20/13 | | | (2 | ) | |
AvalonBay Communities, Inc., 6.13%, 11/1/12 | | Buy | | 2,840 | | 3.05 | | 3/20/13 | | | (49 | ) | |
Coca-Cola Enterprises, Inc., 6.13%, 8/15/11 | | Buy | | 5,960 | | 0.59 | | 3/20/13 | | | (29 | ) | |
Dow Jones CDX North America Investment Grade Index, Series 10 | | Sell | | 10,420 | | 1.55 | | 6/20/13 | | | (172 | ) | |
Dow Jones CDX North America Investment Grade Index, Series 9 | | Sell | | 3,140 | | 0.60 | | 12/20/12 | | | (45 | ) | |
Dow Jones CDX North America Investment Grade Index, Series 9 | | Sell | | 6,180 | | 0.80 | | 12/20/17 | | | (154 | ) | |
Eaton Corp., 7.65%, 11/15/29 | | Buy | | 1,600 | | 0.97 | | 3/20/18 | | | 23 | | |
Goodrich Corp., 7.63%, 12/15/12 | | Buy | | 1,700 | | 0.47 | | 3/20/18 | | | 14 | | |
Sealed Air Corp., 5.63%, 7/15/13 | | Buy | | 1,015 | | 1.24 | | 3/20/18 | | | 40 | | |
JPMorgan Chase | | | | | | | | | | | | | |
Nordstrom, Inc., 6.95%, 3/15/28 | | Buy | | 1,770 | | 1.07 | | 3/20/18 | | | 62 | | |
SLM Corp., 5.13%, 8/27/12 | | Buy | | 1,745 | | 4.95 | | 3/20/13 | | | (453 | ) | |
Merrill Lynch | | | | | | | | | | | | | |
Carnival Corp., 6.65%, 1/15/28 | | Buy | | 920 | | 1.60 | | 3/20/18 | | | (16 | ) | |
SLM Corp., 5.13%, 8/27/12 | | Buy | | 1,745 | | 5.00 | | 3/20/13 | | | (451 | ) | |
UBS | | | | | | | | | | | | | |
American Standard, Inc., 7.63%, 2/15/10 | | Buy | | 2,065 | | 0.50 | | 3/20/13 | | | (3 | ) | |
American Standard, Inc., 7.63%, 2/15/10 | | Buy | | 3,495 | | 0.60 | | 3/20/18 | | | (2 | ) | |
Martin Marietta Materials, Inc., 6.88%, 4/1/11 | | Buy | | 2,740 | | 1.73 | | 3/20/18 | | | 35 | | |
Martin Marietta Materials, Inc., 6.88%, 4/1/11 | | Buy | | 2,740 | | 1.78 | | 3/20/13 | | | 11 | | |
| | | | | | | | | | | $(934 | ) | |
| | | | | | | | | | | | | | |
Interest Rate Swap Contracts
The Portfolio had the following interest rate swap agreement(s) open at period end:
| | | | | | | | | | | | Unrealized | |
| | | | | | | | | | Notional | | Appreciation | |
| | Floating Rate | | Pay/Receive | | Fixed | | Termination | | Amount | | (Depreciation) | |
Swap Counterparty | | Index | | Floating Rate | | Rate | | Date | | (000) | | (000) | |
Bank of America | | 3 Month LIBOR | | Pay | | 4.20 | % | | 6/3/13 | | $ 25,000 | | $ 475 | | |
| | 3 Month LIBOR | | Pay | | 4.15 | | 6/9/13 | | 157,825 | | 2,643 | | |
| | 3 Month LIBOR | | Receive | | 4.17 | | 8/4/13 | | 195,765 | | (1,289 | ) | |
| | 3 Month LIBOR | | Receive | | 5.38 | | 7/24/18 | | 176,793 | | (2,724 | ) | |
| | 3 Month LIBOR | | Pay | | 3.83 | | 9/9/13 | | 30,000 | | (275 | ) | |
| | 3 Month LIBOR | | Receive | | 3.90 | | 9/10/13 | | 123,460 | | 732 | | |
| | 3 Month LIBOR | | Pay | | 4.09 | | 9/17/17 | | 53,550 | | (1,195 | ) | |
| | 3 Month LIBOR | | Pay | | 5.37 | | 2/12/18 | | 59,830 | | 989 | | |
| | 3 Month LIBOR | | Pay | | 5.07 | | 4/14/18 | | 46,695 | | 233 | | |
| | 3 Month LIBOR | | Pay | | 4.98 | | 4/15/18 | | 30,740 | | 55 | | |
| | 3 Month LIBOR | | Receive | | 4.74 | | 7/7/18 | | 36,000 | | (927 | ) | |
| | 3 Month LIBOR | | Receive | | 4.67 | | 8/4/18 | | 150,250 | | (2,867 | ) | |
| | 3 Month LIBOR | | Receive | | 5.15 | | 8/26/18 | | 15,000 | | (103 | ) | |
| | 3 Month LIBOR | | Receive | | 5.82 | | 2/12/23 | | 76,862 | | (1,638 | ) | |
| | 3 Month LIBOR | | Receive | | 5.47 | | 4/14/23 | | 59,805 | | (672 | ) | |
| | 3 Month LIBOR | | Receive | | 5.38 | | 4/15/23 | | 35,390 | | (307 | ) | |
| | | | | | | | | | | | | | | |
54 | The accompanying notes are an integral part of the financial statements. |
| 2008 Annual Report |
| |
| September 30, 2008 |
Portfolio of Investments (cont’d)
Core Plus Fixed Income Portfolio
Interest Rate Swap Contracts (cont’d)
The Portfolio had the following interest rate swap agreement(s) open at period end:
| | | | | | | | | | | | Unrealized | |
| | | | | | | | | | Notional | | Appreciation | |
| | Floating Rate | | Pay/Receive | | Fixed | | Termination | | Amount | | (Depreciation) | |
Swap Counterparty | | Index | | Floating Rate | | Rate | | Date | | (000) | | (000) | |
Bank of America (cont’d) | | 3 Month LIBOR | | Pay | | 5.56 | % | | 7/24/23 | | $226,242 | | $ 3,057 | | |
| | 3 Month LIBOR | | Pay | | 5.34 | | 8/26/23 | | 19,250 | | 143 | | |
Citigroup | | 3 Month LIBOR | | Pay | | 3.77 | | 4/24/13 | | 65,500 | | 11 | | |
| | 3 Month LIBOR | | Pay | | 5.33 | | 5/22/17 | | 38,500 | | 3,223 | | |
| | 3 Month LIBOR | | Pay | | 5.37 | | 5/23/17 | | 65,500 | | 5,653 | | |
| | 3 Month LIBOR | | Pay | | 5.41 | | 5/25/17 | | 26,200 | | 2,350 | | |
| | 3 Month LIBOR | | Pay | | 5.44 | | 5/29/17 | | 33,500 | | 3,071 | | |
| | 3 Month LIBOR | | Receive | | 5.29 | | 9/28/17 | | 45,000 | | (2,882 | ) | |
| | 3 Month LIBOR | | Receive | | 5.00 | | 11/13/17 | | 15,000 | | (871 | ) | |
| | 3 Month LIBOR | | Receive | | 4.73 | | 12/27/17 | | 35,600 | | (1,208 | ) | |
Deutsche Bank | | 3 Month LIBOR | | Pay | | 5.35 | | 5/24/17 | | 75,500 | | 6,406 | | |
| | 3 Month LIBOR | | Pay | | 5.39 | | 5/25/17 | | 95,775 | | 8,410 | | |
| | 3 Month LIBOR | | Pay | | 5.43 | | 5/29/17 | | 101,350 | | 9,202 | | |
| | 6 Month EUR LIBOR | | Receive | | 4.93 | | 7/1/18 | | 167,475 | | (2,032 | ) | |
| | 6 Month EUR LIBOR | | Receive | | 4.86 | | 7/9/18 | | 26,835 | | (228 | ) | |
| | 6 Month EUR LIBOR | | Receive | | 4.86 | | 7/10/18 | | 24,300 | | (206 | ) | |
| | 6 Month EUR LIBOR | | Pay | | 4.96 | | 7/24/18 | | 109,303 | | 1,448 | | |
| | 6 Month EUR LIBOR | | Receive | | 4.68 | | 9/11/18 | | 122,280 | | — | | |
| | 6 Month EUR LIBOR | | Pay | | 4.71 | | 9/11/18 | | 122,280 | | 141 | | |
| | 3 Month LIBOR | | Receive | | 4.83 | | 9/11/18 | | 162,280 | | 766 | | |
| | 3 Month LIBOR | | Pay | | 4.86 | | 9/11/18 | | 162,280 | | — | | |
| | 6 Month EUR LIBOR | | Pay | | 5.27 | | 7/2/23 | | 210,355 | | 3,124 | | |
| | 6 Month EUR LIBOR | | Pay | | 5.24 | | 7/9/23 | | 33,655 | | 460 | | |
| | 6 Month EUR LIBOR | | Pay | | 5.24 | | 7/10/23 | | 30,450 | | 418 | | |
| | 6 Month EUR LIBOR | | Receive | | 5.19 | | 7/24/23 | | 137,230 | | (1,598 | ) | |
Goldman Sachs | | 3 Month LIBOR | | Pay | | 5.63 | | 2/28/18 | | 174,355 | | 4,526 | | |
| | 3 Month LIBOR | | Receive | | 6.04 | | 2/28/23 | | 223,685 | | (6,165 | ) | |
JPMorgan Chase | | 3 Month LIBOR | | Pay | | 4.07 | | 5/16/13 | | 83,415 | | 1,136 | | |
| | 3 Month LIBOR | | Pay | | 4.07 | | 5/16/13 | | 75,000 | | 1,030 | | |
| | 3 Month LIBOR | | Pay | | 4.27 | | 6/2/13 | | 54,215 | | 1,227 | | |
| | 3 Month LIBOR | | Pay | | 5.37 | | 5/23/17 | | 22,700 | | 1,964 | | |
| | 3 Month LIBOR | | Pay | | 5.34 | | 5/24/17 | | 50,000 | | 4,208 | | |
| | 3 Month LIBOR | | Pay | | 5.09 | | 9/11/17 | | 88,500 | | 4,593 | | |
| | 3 Month LIBOR | | Pay | | 5.16 | | 9/20/17 | | 37,000 | | 2,087 | | |
| | 3 Month LIBOR | | Receive | | 5.23 | | 9/27/17 | | 46,000 | | (2,759 | ) | |
| | 3 Month LIBOR | | Receive | | 5.30 | | 9/28/17 | | 47,000 | | (3,049 | ) | |
| | 3 Month LIBOR | | Pay | | 5.25 | | 10/11/17 | | 44,000 | | 3,498 | | |
| | 3 Month LIBOR | | Receive | | 5.01 | | 11/13/17 | | 25,000 | | (1,489 | ) | |
| | 3 Month LIBOR | | Pay | | 4.48 | | 1/8/18 | | 33,000 | | 186 | | |
| | 3 Month LIBOR | | Receive | | 4.24 | | 1/22/18 | | 27,625 | | 359 | | |
| | 3 Month LIBOR | | Receive | | 4.52 | | 2/19/18 | | 33,000 | | (267 | ) | |
| | 3 Month LIBOR | | Receive | | 4.62 | | 2/22/18 | | 34,500 | | (552 | ) | |
| | 3 Month LIBOR | | Receive | | 4.41 | | 5/1/18 | | 140,425 | | (1,405 | ) | |
| | 3 Month LIBOR | | Receive | | 4.41 | | 5/1/18 | | 34,225 | | (342 | ) | |
| | 3 Month LIBOR | | Receive | | 4.75 | | 6/30/18 | | 65,000 | | (2,209 | ) | |
Merrill Lynch | | 3 Month LIBOR | | Pay | | 5.00 | | 4/15/18 | | 41,010 | | 99 | | |
| | 3 Month LIBOR | | Receive | | 5.40 | | 4/16/23 | | 49,725 | | | (453 | ) | |
| | | | | | | | | | | | | $38,211 | | |
| | | | | | | | | | | | | | | | |
EUR — Euro
LIBOR — London Inter Bank Offer Rate
The accompanying notes are an integral part of the financial statements. | 55 |
2008 Annual Report | |
| |
September 30, 2008 | |
Portfolio of Investments (cont’d)
Core Plus Fixed Income Portfolio
Zero Coupon Swap Contracts
The Portfolio had the following zero coupon swap agreement(s) open at period end:
| | | | | | | | Unrealized | |
| | Notional | | | | | | Appreciation | |
| | Amount | | | | Termination | | (Depreciation) | |
Swap Counterparty | | (000) | | Receive | | Date | | (000) | |
JPMorgan Chase | | $16,561 | | 3 Month LIBOR | | 5/15/21 | | | $— | | |
| | | | | | | | | $— | | |
LIBOR — London Inter Bank Offer Rate
56 | The accompanying notes are an integral part of the financial statements. |
| 2008 Annual Report |
| |
| September 30, 2008 |
Investment Overview (unaudited)
High Yield Portfolio
The High Yield Portfolio seeks above-average total return over a market cycle of three to five years. The Portfolio invests primarily in U.S. dollar-denominated high yield securities (commonly referred to as “junk bonds”). The Portfolio also may invest in investment grade fixed income securities, including U.S. government, corporate and mortgage securities. The Portfolio may invest in securities of foreign issuers, including issuers located in emerging market countries. The securities in which the Portfolio may also invest may be denominated in currencies other than U.S. dollars. The Portfolio will ordinarily seek to maintain an average weighted maturity in excess of five years, although there is no minimum or maximum maturity for any individual security. The Portfolio may invest in asset-backed securities and may use futures, options, forwards, CMOs, swaps, options on swaps and other derivatives. The Portfolio may invest in public bank loans made by banks or other financial institutions. These public bank loans may be rated investment grade or below investment grade.
Performance
For the fiscal year ended September 30, 2008, the Portfolio’s Class I had a total return based on net asset value and reinvestment of distributions per share of - -12.95%, net of fees. The Portfolio’s Class I underperformed against its benchmark the Lehman Brothers U.S. Corporate High Yield - 2% Issuer Cap Index (the “Index”) which returned -10.51%.
Factors Affecting Performance
· The financial markets were under pressure throughout the period amid disrupted credit markets, ongoing deterioration of the housing market, losses in the financial sector, and growing fears of recession.
· The month of September, 2008, however, will undoubtedly be remembered as one of the worst periods in the history of the financial markets. Investor confidence plummeted and credit markets seized as several venerable financial institutions were forced into mergers, taken over by the government, or failed entirely. The extreme volatility and illiquidity in the market led to significant price erosion across all sectors except U.S. Treasuries as investors fled risk assets.
· High-yield spreads widened over the course of the reporting year to close the period 1,064 basis points over Treasuries, near the all-time wide levels seen in 1991 and 2002, while the yield to maturity of the Lehman Brothers 2% Issuer Capped High Yield Index rose to 13.68% by period end. The high-yield market posted its worst monthly and quarterly returns on record for September and the third quarter of 2008, respectively.
· The Portfolio’s higher relative credit quality was additive to performance as higher-rated bonds outperformed those with lower ratings.
· An overweight allocation to the healthcare sector was also additive to returns as this was the top-performing sector of the high-yield market for the period.
· Conversely, holdings in mortgage securities as well as security selection within financials detracted from performance.
Management Strategies
· We continued to position the portfolio defensively in terms of credit quality, focusing on the higher-rated segment of the high-yield market.
· With global economies expected to contract, we believe it is likely that corporate earnings will weaken, credit rating downgrades will increase, and defaults will continue to rise. Whether companies will be able to raise capital in the market will depend on liquidity conditions.
· Although high-yield spreads have dramatically widened, we believe it is prudent to remain defensive at least for the short term until we see signs of improvement in the market.
· As of the end of the period, the Portfolio’s main overweighted sectors were healthcare, chemicals, and food/tobacco/beverage while the major underweighted sectors were building products/home builders, technology, and aerospace/defense.
57
2008 Annual Report | |
| |
September 30, 2008 | |
Investment Overview (cont’d)
High Yield Portfolio
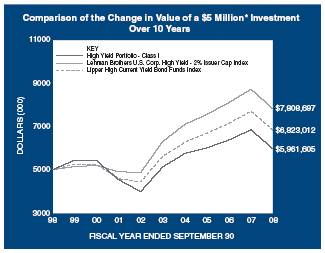
* Minimum Investment
In accordance with SEC regulations, the Portfolio’s performance shown assumes that all recurring fees (including management fees) were deducted and all dividends and distributions were reinvested. The performance of Class P shares will vary from the Class I shares based upon their different inception dates and will be negatively impacted by additional fees assessed to that class.
Performance Compared to the Lehman Brothers U.S. Corporate High Yield - 2% Issuer Cap Index(1), and the Lipper High Current Yield Bond Funds Index(2)
| | Total Returns(3) | |
| | | | Average Annual | |
| | One | | Five | | Ten | | Since | |
| | Year | | Years | | Years | | Inception(6) | |
Portfolio – Class I (4) | | (12.95 | )% | 3.06 | % | 1.77 | % | 6.14 | % | |
Lehman Brothers U.S. Corporate High Yield - 2% Issuer Cap Index | | (10.51 | ) | 4.37 | | 4.56 | | — | | |
Lipper High Current Yield Bond Funds Index | | (11.45 | ) | 3.96 | | 3.16 | | 6.15 | | |
Portfolio – Class P (5) | | (13.17 | ) | 2.81 | | 1.55 | | 2.25 | | |
Lehman Brothers U.S. Corporate High Yield - 2% Issuer Cap Index | | (10.51 | ) | 4.37 | | 4.56 | | 4.87 | | |
Lipper High Current Yield Bond Funds Index | | (11.45 | ) | 3.96 | | 3.16 | | 3.43 | | |
Performance data quoted represents past performance, which is no guarantee of future results, and current performance may be lower or higher than the figures shown. Performance assumes that all dividends and distributions, if any, were reinvested. For the most recent month-end performance figures, please visit www.morganstanley.com/msim. Investment returns and principal value will fluctuate so that Portfolio shares, when redeemed, may be worth more or less than their original cost. Total returns do not reflect the deduction of taxes that a shareholder would pay on Portfolio distributions or the redemption of Portfolio shares. Performance of share classes will vary due to differences in sales charges and expenses.
(1) | The Lehman Brothers U.S. Corporate High Yield -2% Issuer Cap Index is the 2% Issuer Cap component of the Lehman Brothers U.S. Corporate High Yield Index which covers the U.S. dollar-denominated, non-investment grade, fixed rate, taxable corporate bond market. Securities are classified as high-yield if the middle rating of Moody’s, Fitch, and S&P is Ba1/BB+/BB+ or below. The Index excludes emerging markets debt. The Index is unmanaged and its returns do not include any sales charges or fees. Such costs would lower performance. It is not possible to invest directly in an index. |
(2) | The Lipper High Current Yield Bond Funds Index is an equally weighted performance index of the largest qualifying funds (based on net assets) in the Lipper High Current Yield Bond Funds classification. The Index, which is adjusted for capital gains distributions and income dividends, is unmanaged and should not be considered an investment. There are currently 30 funds represented in this Index. As of the date of this report, the Portfolio was in the Lipper High Current Yield Bond Funds classification. |
(3) | Total returns for the Portfolio reflect expenses waived and/or reimbursed, if applicable, by the Adviser. Without such waivers and/or reimbursements, total returns would have been lower. Fee waivers and/or reimbursements are voluntary and the Adviser reserves the right to commence or terminate any waiver and/or reimbursement at any time. |
(4) | Commenced operations on February 28, 1989. |
(5) | Commenced operations on January 31, 1997. |
(6) | For comparative purposes, average annual since inception returns listed for the Indexes refer to the inception date or initial offering of the respective share class of the Portfolio, not the inception of the Indexes. |
Portfolio Composition*
| | Percentage of | |
Classification | | Total Investments | |
Health Care | | 11.7 | % | |
Utilities | | 10.3 | | |
Energy | | 9.7 | | |
Chemicals | | 6.8 | | |
Telecommunications | | 6.6 | | |
Transportation | | 5.5 | | |
Gaming & Leisure | | 5.1 | | |
Other** | | 39.7 | | |
Short-Term Investments | | | 4.6 | | |
Total Investments | | | 100.0 | % | |
| | | | | | |
* | Percentages indicated are based upon total investments (excluding Securities held as collateral on Loaned Securities) as of September 30, 2008. |
** | Industries and/or investment types which do not appear in the above table, as well as those which represent less than 5% of total investments, if applicable, are included in the category labeled “Other”. |
58
| 2008 Annual Report |
| |
| September 30, 2008 |
Portfolio of Investments
High Yield Portfolio
| | Face | | | |
| | Amount | | Value | |
| | (000) | | (000) | |
Fixed Income Securities (93.3%) | | | | | |
Broadcasting (0.8%) | | | | | |
Lin Television Corp., | | | | | |
6.50%, 5/15/13 | $ | | 1,045 | | $ | 820 | |
Cable (4.0%) | | | | | |
Cablevision Systems Corp., | | | | | |
7.13%, 4/1/09(h) | | 585 | | 581 | |
Charter Communications Holdings I LLC, | | | | | |
11.00%, 10/1/15(c) | | 652 | | 434 | |
Charter Communications Holdings II LLC, | | | | | |
10.25%, 10/1/13(e) | | 522 | | 436 | |
CSC Holdings, Inc., | | | | | |
8.50%, 6/15/15(e) | | 340 | | 318 | |
DirecTV Holdings LLC/Direct TV Financing Co., | | | | | |
6.38%, 6/15/15 | | 120 | | 106 | |
7.63%, 5/15/16(e) | | 1,000 | | 910 | |
Echostar DBS Corp., | | | | | |
6.38%, 10/1/11 | | 1,015 | | 936 | |
PanAmSat Corp., | | | | | |
9.00%, 8/15/14(d)(l) | | 307 | | 271 | |
Virgin Media Finance plc, | | | | | |
8.75%, 4/15/14 | | 230 | | 194 | |
9.13%, 8/15/16 | | 145 | | 122 | |
| | | | 4,308 | |
Chemicals (6.7%) | | | | | |
Berry Plastics Holding Corp., | | | | | |
8.88%, 9/15/14 | | 1,405 | | 1,103 | |
Innophos Holdings, Inc., | | | | | |
9.50%, 4/15/12(e) | | 600 | | 609 | |
Innophos, Inc., | | | | | |
8.88%, 8/15/14 | | 1,050 | | 1,055 | |
Koppers Holdings, Inc., | | | | | |
Zero Coupon, 11/15/14(g) | | 1,155 | | 1,040 | |
Koppers, Inc., | | | | | |
9.88%, 10/15/13 | | 490 | | 507 | |
Rockwood Specialties Group, Inc., | | | | | |
7.63%, 11/15/14 | EUR | 700 | | 897 | |
Terra Capital, Inc., | | | | | |
7.00%, 2/1/17 | $ | | 1,080 | | 1,031 | |
Westlake Chemical Corp., | | | | | |
6.63%, 1/15/16 | | 1,130 | | 966 | |
| | | | 7,208 | |
Collateralized Mortgage Obligations — Non Agency Collateral Series (0.0%) | | | | | |
Bear Stearns Structured Products, Inc., | | | | | |
IO | | | | | |
0.02%, 6/26/36(d)(e)(l) | | 13,693 | | 1 | |
0.16%, 1/27/37(d)(e)(l) | | 19,694 | | 2 | |
0.18%, 1/27/37(d)(e)(l) | | 14,199 | | 1 | |
1.22%, 5/25/37(d)(e)(l) | | 17,852 | | 2 | |
Countrywide Alternative Loan Trust, | | | | | |
IO | | | | | |
0.41%, 2/25/47(d)(l) | | 11,189 | | 1 | |
Harborview NIM Corp., | | | | | |
1.52%, 12/15/36(d)(l) | | 606 | | — | @ |
Residential Accredit Loans, Inc., | | | | | |
0.68%, 3/25/47((d)h)(l) | | 6,306 | | 1 | |
0.76%, 5/25/47(d)(h)(l) | | 12,084 | | 1 | |
| | | | 9 | |
Consumer Products (1.5%) | | | | | |
Jarden Corp., | | | | | |
7.50%, 5/1/17(c) | | 875 | | 733 | |
Oxford Industries, Inc., | | | | | |
8.88%, 6/1/11(c) | | 925 | | 841 | |
| | | | 1,574 | |
Diversified Media (3.2%) | | | | | |
CanWest MediaWorks, Inc., | | | | | |
8.00%, 9/15/12(c) | | 1,552 | | 1,304 | |
Dex Media West LLC/Dex Media Finance Co., | | | | | |
9.88%, 8/15/13 | | 1,030 | | 641 | |
Idearc, Inc., | | | | | |
8.00%, 11/15/16 | | 2,760 | | 766 | |
Valassis Communications, Inc., | | | | | |
8.25%, 3/1/15 | | 1,010 | | 702 | |
| | | | 3,413 | |
Energy (8.9%) | | | | | |
Chaparral Energy, Inc., | | | | | |
8.50%, 12/1/15 | | 1,505 | | 1,196 | |
8.88%, 2/1/17 | | 240 | | 191 | |
Chesapeake Energy Corp., | | | | | |
6.63%, 1/15/16(c) | | 1,025 | | 925 | |
Cie Generale de Geophysique S.A., | | | | | |
7.50%, 5/15/15 | | 760 | | 730 | |
Cimarex Energy Co., | | | | | |
7.13%, 5/1/17 | | 330 | | 305 | |
Gaz Capital S.A., | | | | | |
6.51%, 3/7/22(e) | | 175 | | 126 | |
Helix Energy Solutions Group, Inc., | | | | | |
9.50%, 1/15/16(e) | | 835 | | 785 | |
Hilcorp Energy I LP/Hilcorp Finance Co., | | | | | |
7.75%, 11/1/15(e) | | 1,765 | | 1,527 | |
Massey Energy Co., | | | | | |
6.88%, 12/15/13 | | 1,540 | | 1,401 | |
Newfield Exploration Co., | | | | | |
7.13%, 5/15/18 | | 200 | | 175 | |
OPTI Canada, Inc., | | | | | |
8.25%, 12/15/14 | | 1,425 | | 1,282 | |
Pacific Energy Partners, LP/Pacific Energy Finance Corp., | | | | | |
7.13%, 6/15/14 | | 665 | | 654 | |
Plains Exploration & Production Co., | | | | | |
7.63%, 6/1/18 | | 215 | | 191 | |
| | | | 9,488 | |
| | | | | | | |
The accompanying notes are an integral part of the financial statements. | 59 |
2008 Annual Report | |
| |
September 30, 2008 | |
Portfolio of Investments (cont’d)
High Yield Portfolio
| | Face | | | |
| | Amount | | Value | |
| | (000) | | (000) | |
Financial (2.5%) | | | | | |
Alfa MTN Investments Ltd., | | | | | |
9.25%, 6/24/13(e) | $ | 500 | | $ | 447 | |
Capmark Financial Group, Inc., | | | | | |
5.88%, 5/10/12 | | 2,150 | | 1,073 | |
6.30%, 5/10/17 | | 120 | | 47 | |
GrafTech Finance, Inc., | | | | | |
10.25%, 2/15/12 | | 68 | | 70 | |
ProLogis, | | | | | |
6.63%, 5/15/18 | | 190 | | 163 | |
Realogy Corp., | | | | | |
10.50%, 4/15/14 | | 1,085 | | 483 | |
Residential Capital LLC, | | | | | |
8.13%, 11/21/08 | | 247 | | 211 | |
8.50%, 5/15/10(e) | | 47 | | 26 | |
9.63%, 5/15/15(e) | | 616 | | 151 | |
| | | | 2,671 | |
Food & Drug (2.6%) | | | | | |
Axcan Intermediate Holdings, Inc., | | | | | |
12.75%, 3/1/16(e) | | 360 | | 358 | |
CA FM Lease Trust, | | | | | |
8.50%, 7/15/17(e) | | 863 | | 970 | |
Rite Aid Corp., | | | | | |
8.63%, 3/1/15(c) | | 485 | | 257 | |
SUPERVALU, Inc., | | | | | |
7.50%, 5/15/12 - 11/15/14 | | 1,295 | | 1,263 | |
| | | | 2,848 | |
Food & Tobacco (3.2%) | | | | | |
Constellations Brands, Inc., | | | | | |
7.25%, 5/15/17 | | 825 | | 763 | |
Michael Foods, Inc., | | | | | |
8.00%, 11/15/13 | | 1,170 | | 1,141 | |
Pilgrim’s Pride Corp., | | | | | |
7.63%, 5/1/15 | | 1,470 | | 919 | |
Smithfield Foods, Inc., | | | | | |
7.00%, 8/1/11 | | 160 | | 140 | |
7.75%, 5/15/13 | | 520 | | 439 | |
| | | | 3,402 | |
Forest Products (4.5%) | | | | | |
Crown Americas LLC/Crown Americas Capital Corp., | | | | | |
7.63%, 11/15/13 | | 330 | | 327 | |
Crown European Holdings S.A., | | | | | |
6.25%, 9/1/11 | EUR | 520 | | 666 | |
Georgia-Pacific LLC, | | | | | |
7.13%, 1/15/17(e) | $ | 1,110 | | 996 | |
Glatfelter, | | | | | |
7.13%, 5/1/16 | | 205 | | 199 | |
Graham Packaging Co., Inc., | | | | | |
8.50%, 10/15/12(c) | | 615 | | 572 | |
9.88%, 10/15/14(c) | | 850 | | 744 | |
Graphic Packaging International, Inc., | | | | | |
9.50%, 8/15/13(c) | | 1,145 | | 1,042 | |
Owens-Illinois, Inc., | | | | | |
7.50%, 5/15/10(c) | | 355 | | 353 | |
| | | | 4,899 | |
Gaming & Leisure (5.1%) | | | | | |
Harrah’s Operating Co., Inc, | | | | | |
5.38%, 12/15/13(c) | | 2,735 | | 889 | |
Host Hotels & Resorts LP, | | | | | |
6.38%, 3/15/15 | | 1,700 | | 1,390 | |
Isle of Capri Casinos, Inc., | | | | | |
7.00%, 3/1/14(c) | | 2,250 | | 1,519 | |
Las Vegas Sands Corp., | | | | | |
6.38%, 2/15/15(c) | | 1,340 | | 1,032 | |
Station Casinos, Inc., | | | | | |
6.00%, 4/1/12(c) | | 315 | | 178 | |
6.88%, 3/1/16(c) | | 1,580 | | 450 | |
| | | | 5,458 | |
Health Care (11.7%) | | | | | |
CHS/Community Health Systems, Inc., | | | | | |
8.88%, 7/15/15 | | 770 | | 735 | |
DaVita, Inc., | | | | | |
6.63%, 3/15/13 | | 1,170 | | 1,117 | |
Fisher Scientific International, Inc., | | | | | |
6.13%, 7/1/15 | | 885 | | 855 | |
FMC Finance III S.A., | | | | | |
6.88%, 7/15/17 | | 740 | | 716 | |
Fresenius Medical Care Capital Trust IV, | | | | | |
7.88%, 6/15/11 | | 465 | | 472 | |
Fresenius Medical Care Capital Trust V, | | | | | |
7.38%, 6/15/11 | EUR | 450 | | 621 | |
HCA, Inc., | | | | | |
5.75%, 3/15/14 | $ | 625 | | 491 | |
6.25%, 2/15/13 | | 1,725 | | 1,449 | |
6.50%, 2/15/16 | | 565 | | 450 | |
9.13%, 11/15/14(c) | | 210 | | 205 | |
Invacare Corp., | | | | | |
9.75%, 2/15/15 | | 235 | | 236 | |
LVB Acquisition Merger Sub, Inc. PIK, | | | | | |
10.38%, 10/15/17 | | 460 | | 458 | |
Medco Health Solutions, Inc., | | | | | |
7.13%, 3/15/18 | | 525 | | 533 | |
National Mentor Holdings, Inc., | | | | | |
11.25%, 7/1/14 | | 975 | | 980 | |
Omnicare, Inc., | | | | | |
6.75%, 12/15/13 | | 1,140 | | 1,040 | |
Sun Healthcare Group, Inc., | | | | | |
9.13%, 4/15/15 | | 775 | | 744 | |
Tenet Healthcare Corp., | | | | | |
9.88%, 7/1/14 | | 425 | | 416 | |
Warner Chilcott Corp., | | | | | |
8.75%, 2/1/15 | | 945 | | 936 | |
| | | | 12,454 | |
| | | | | | |
60 | The accompanying notes are an integral part of the financial statements. |
| 2008 Annual Report |
| |
| September 30, 2008 |
Portfolio of Investments (cont’d)
High Yield Portfolio
| | Face | | | |
| | Amount | | Value | |
| | (000) | | (000) | |
Housing (1.1%) | | | | | |
Nortek, Inc., | | | | | |
8.50%, 9/1/14 | $ | | 1,780 | | $ | 1,023 | |
Pulte Homes, Inc., | | | | | |
6.38%, 5/15/33 | | 160 | | 117 | |
| | | | 1,140 | |
Industrials (1.9%) | | | | | |
Interpublic Group of Cos., Inc., | | | | | |
6.25%, 11/15/14 | | 510 | | 426 | |
Tenet Healthcare Corp., | | | | | |
7.38%, 2/1/13 | | 1,735 | | 1,588 | |
| | | | 2,014 | |
Information Technology (3.2%) | | | | | |
Freescale Semiconductor, Inc., | | | | | |
8.88%, 12/15/14 | | 1,345 | | 935 | |
KLA-Tencor Corp., | | | | | |
6.90%, 5/1/18 | | 760 | | 708 | |
Lender Processing Services, Inc., | | | | | |
8.13%, 7/1/16(e) | | 90 | | 88 | |
NXP B.V./NXP Funding LLC, | | | | | |
7.88%, 10/15/14 | | 415 | | 280 | |
SunGard Data Systems, Inc., | | | | | |
9.13%, 8/15/13(c) | | 890 | | 805 | |
Vangent, Inc., | | | | | |
9.63%, 2/15/15 | | 775 | | 635 | |
| | | | 3,451 | |
Manufacturing (2.9%) | | | | | |
Baldor Electric Co., | | | | | |
8.63%, 2/15/17(c) | | 460 | | 442 | |
Johnsondiversey, Inc., | | | | | |
9.63%, 5/15/12(c) | | 1,750 | | 1,774 | |
Propex, Inc., | | | | | |
10.00%, 12/1/12(b) | | 1,210 | | 15 | |
RBS Global, Inc./Rexnord Corp., | | | | | |
8.88%, 9/1/16 | | 1,000 | | 915 | |
| | | | 3,146 | |
Metals (1.7%) | | | | | |
Evraz Group S.A., | | | | | |
9.50%, 4/24/18(e)(c) | | 540 | | 392 | |
Foundation PA Coal Co., | | | | | |
7.25%, 8/1/14 | | 575 | | 558 | |
Freeport-McMoran Copper & Gold, Inc., | | | | | |
8.38%, 4/1/17 | | 910 | | 898 | |
| | | | 1,848 | |
Mortgages — Other (0.4%) | | | | | |
American Home Mortgage Assets, | | | | | |
3.51%, 6/25/47(d)(h) | | 567 | | 84 | |
3.52%, 10/25/46(d)(h) | | 525 | | 89 | |
Countrywide Alternative Loan Trust, | | | | | |
3.47%, 3/20/47(d)(h) | | 621 | | 135 | |
3.73%, 10/25/46(d)(h)(l) | | 600 | | 9 | |
3.91%, 2/25/36(d)(h)(l) | | 448 | | 14 | |
Greenpoint Mortgage Funding Trust, | | | | | |
3.62%, 9/25/46(d)(h)(l) | | 425 | | 11 | |
Harborview Mortgage Loan Trust, | | | | | |
3.03%, 8/21/36(d)(h)(l) | | 575 | | 9 | |
3.18%, 1/19/36(d)(h)(l) | | 935 | | 30 | |
Lehman XS Trust, | | | | | |
4.21%, 3/25/47(d)(h)(l) | | 1,001 | | 17 | |
| | | | 398 | |
Retail (2.1%) | | | | | |
Brown Shoe Co., Inc., | | | | | |
8.75%, 5/1/12 | | 1,145 | | 1,116 | |
Phillips-Van Heusen Corp., | | | | | |
7.25%, 2/15/11 | | 1,120 | | 1,106 | |
| | | | 2,222 | |
Services (1.1%) | | | | | |
Aramark Corp., | | | | | |
5.00%, 6/1/12(c) | | 595 | | 503 | |
6.30%, 2/1/15(h) | | 85 | | 75 | |
8.50%, 2/1/15(c) | | 175 | | 165 | |
Expedia, Inc., | | | | | |
8.50%, 7/1/16(e) | | 435 | | 394 | |
| | | | 1,137 | |
Sovereign (0.8%) | | | | | |
Mexican Bonos, | | | | | |
9.50%, 12/18/14 | MXN | 9,120 | | 879 | |
Telecommunications (6.6%) | | | | | |
Exodus Communications, Inc., | | | | | |
11.63%, 7/15/10(b)(c)(d)(i)(l) | $ | 3,885 | | — | |
Frontier Communications Corp., | | | | | |
6.25%, 1/15/13 | | 535 | | 504 | |
7.13%, 3/15/19 | | 600 | | 480 | |
Intelsat Corp., | | | | | |
9.25%, 6/15/16(e) | | 865 | | 800 | |
Nordic Telephone Co. Holdings A.p.S., | | | | | |
8.88%, 5/1/16(e) | | 465 | | 425 | |
Nortel Networks Ltd., | | | | | |
10.75%, 7/15/16(e) | | 610 | | 377 | |
Rhythms Netconnections, Inc., | | | | | |
12.75%, 4/15/09(b)(d)(i)(l) | | 433 | | — | |
14.00%, 2/15/10(b)(d)(i)(l) | | 11,487 | | — | |
Sprint Capital Corp., | | | | | |
6.90%, 5/1/19 | | 1,285 | | 998 | |
Sprint Nextel Corp., | | | | | |
6.00%, 12/1/16(c) | | 1,225 | | 945 | |
TDC AS, | | | | | |
6.50%, 4/19/12 | EUR | 380 | | 514 | |
Wind Acquisition Finance S.A., | | | | | |
10.75%, 12/1/15(e) | $ | 1,170 | | 1,152 | |
Windstream Corp., | | | | | |
8.13%, 8/1/13 | | 490 | | 468 | |
XM Satellite Radio Holdings, Inc., | | | | | |
13.00%, 8/1/14(e) | | 685 | | 408 | |
| | | | 7,071 | |
| | | | | | | |
The accompanying notes are an integral part of the financial statements. | 61 |
2008 Annual Report
September 30, 2008
Portfolio of Investments (cont’d)
High Yield Portfolio
| | Face | | | |
| | Amount | | Value | |
| | (000) | | (000) | |
Transportation (5.5%) | | | | | |
ArvinMeritor, Inc., | | | | | |
8.75%, 3/1/12 | | $ | 690 | | $ | 583 | |
Ford Motor Credit Co. LLC, | | | | | |
7.00%, 10/1/13(c) | | 2,955 | | 1,818 | |
7.25%, 10/25/11 | | 995 | | 633 | |
General Motors Acceptance Corp. LLC, | | | | | |
6.75%, 12/1/14 | | 1,260 | | 484 | |
6.88%, 9/15/11 - 8/28/12 | | 2,510 | | 1,102 | |
General Motors Corp., | | | | | |
8.38%, 7/15/33(c) | | 770 | | 312 | |
Penske Auto Group, Inc., | | | | | |
7.75%, 12/15/16 | | 790 | | 569 | |
Sonic Automotive, Inc., | | | | | |
8.63%, 8/15/13 | | 500 | | 342 | |
| | | | 5,843 | |
Utilities (10.3%) | | | | | |
AES Corp. (The), | | | | | |
7.75%, 3/1/14 | | 525 | | 491 | |
8.00%, 6/1/20(e) | | 1,410 | | 1,241 | |
Dynegy Holdings, Inc., | | | | | |
7.75%, 6/1/19 | | 1,100 | | 886 | |
Equitable Resources, Inc., | | | | | |
6.50%, 4/1/18 | | 435 | | 416 | |
Intergen N.V., | | | | | |
9.00%, 6/30/17(e) | | 1,125 | | 1,130 | |
Israel Electric Corp. Ltd., | | | | | |
7.25%, 1/15/19(e) | | 760 | | 763 | |
NRG Energy, Inc., | | | | | |
7.38%, 1/15/17 | | 1,200 | | 1,095 | |
Ormat Funding Corp., | | | | | |
8.25%, 12/30/20 | | 1,424 | | 1,296 | |
Reliant Energy, Inc., | | | | | |
7.88%, 6/15/17 | | 1,035 | | 771 | |
Texas Competitive Electric Holdings Co. LLC, | | | | | |
10.25%, 11/1/15(e) | | 2,280 | | 2,069 | |
Williams Cos., Inc., | | | | | |
7.88%, 9/1/21 | | 810 | | 812 | |
| | | | 10,970 | |
Wireless Communications (1.0%) | | | | | |
Nextel Communications, Inc., | | | | | |
6.88%, 10/31/13 | | 470 | | 320 | |
Sirius XM Radio, Inc., | | | | | |
9.63%, 8/1/13 | | 440 | | 235 | |
VIP Finance Ireland Ltd. for OJSC Vimpel Communications, | | | | | |
9.13%, 4/30/18(e) | | 620 | | 482 | |
| | | | 1,037 | |
Total Fixed Income Securities (Cost $140,262) | | | | 99,708 | |
Bank Loans (1.9%)(u) | | | | | |
Consumer Products (0.2%) | | | | | |
Bausch & Lomb, Inc. | | | | | |
Zero Coupon, 4/26/15 | | 20 | | 19 | |
7.01%, 4/26/15 | | 229 | | 213 | |
| | | | 232 | |
Energy (0.8%) | | | | | |
Sandridge Energy, Inc. PIK | | | | | |
8.63%, 4/1/15(e) | | 970 | | 873 | |
Information Technology (0.9%) | | | | | |
First Data Corp. | | | | | |
5.93%, 9/24/14 | | 484 | | 416 | |
5.95%, 9/24/14 | | 491 | | 422 | |
6.51%, 9/24/14 | | 64 | | 55 | |
| | | | 893 | |
Total Bank Loans (Cost $2,230) | | | | 1,998 | |
| | Shares | | | |
Common Stocks (0.0%) | | | | | |
Telecommunications (0.0%) | | | | | |
Viatel Holding Bermuda Ltd.(a) | | 25 | | — | @ |
XO Holdings, Inc.(a)(c) | | 6,978 | | 3 | |
| | | | 3 | |
Utilities (0.0%) | | | | | |
PNM Resources, Inc. | | 854 | | 9 | |
Total Common Stocks (Cost $10,637) | | | | 12 | |
Preferred Stocks (0.0%) | | | | | |
Financial (0.0%) | | | | | |
Fannie Mae (Convertible) (Cost $185) | | 3,700 | | 9 | |
| | No. of | | | |
| | Warrants | | | |
Warrants (0.0%) | | | | | |
Telecommunications (0.0%) | | | | | |
XO Holdings, Inc., Series A, expiring 1/16/10(a)(c) | | 13,962 | | 1 | |
XO Holdings, Inc., Series B, expiring 1/16/10(a)(c) | | 10,470 | | — | @ |
XO Holdings, Inc., Series C, expiring 1/16/10(a)(c) | | 10,471 | | — | @ |
| | | | 1 | |
Utilities (0.0%) | | | | | |
SW Acquisition, LP, expiring 4/1/11(a)(d)(l) | | 1 | | — | |
Total Warrants (Cost $—) | | | | 1 | |
| | Shares | | | |
Short-Term Investments (19.3%) | | | | | |
Securities held as Collateral on Loaned Securities (14.7%) | | | | | |
Investment Company (13.2%) | | | | | |
Morgan Stanley Institutional Liquidity Money Market Portfolio — Institutional Class(p) | | 14,064,701 | | 14,065 | |
| | | | | | | |
62 | The accompanying notes are an integral part of the financial statements. |
| 2008 Annual Report |
| |
| September 30, 2008 |
Portfolio of Investments (cont’d)
High Yield Portfolio
| | Face | | | |
| | Amount | | Value | |
| | (000) | | (000) | |
Short-Term Debt (1.5%) | | | | | |
Bancaja, | | | | | |
2.96%, 11/12/08(h) | | $ | 300 | | $ | 300 | |
Citigroup Global Markets, Inc., | | | | | |
1.00%, 10/1/08 | | 1,321 | | 1,320 | |
| | | | 1,620 | |
| | | | 15,685 | |
| | Shares | | | |
Investment Company (2.4%) | | | | | |
Morgan Stanley Institutional Liquidity Money Market Portfolio — Institutional Class(p) | | 2,571,175 | | 2,571 | |
| | Face | | | |
| | Amount | | | |
| | (000) | | | |
U.S. Treasury Security (2.2%) | | | | | |
U.S. Treasury Bill, | | | | | |
0.17%, 10/9/08(c)(r)(j) | | $ | 2,300 | | 2,300 | |
Total Short-Term Investments (Cost $20,556) | | | | 20,556 | |
Total Investments (114.5%) (Cost $173,870) — including $15,129 of Securities Loaned | | | | 122,284 | |
Liabilities in Excess of Other Assets (-14.5%) | | | | (15,453 | ) |
Net Assets (100%) | | | | $ | 106,831 | |
(a) | Non-income producing security. |
(b) | Issuer is in default. |
(c) | All or a portion of security on loan at September 30, 2008. |
(d) | Security was valued at fair value — At September 30, 2008, the Portfolio held $678,000 of fair valued securities, representing 0.6% of net assets. |
(e) | 144A security — Certain conditions for public sale may exist. Unless otherwise noted, these securities are deemed to be liquid. |
(g) | Step Bond — Coupon rate increases in increments to maturity. Rate disclosed is as of September 30, 2008. Maturity date disclosed is the ultimate maturity date. |
(h) | Variable/Floating Rate Security — Interest rate changes on these instruments are based on changes in a designated rate. The rates shown are those in effect on September 30, 2008. |
(j) | All or a portion of the security was pledged to cover margin requirements for futures contracts. |
(l) | Security has been deemed illiquid at September 30, 2008. |
(p) | See Note G within the Notes to Financial Statements regarding investment in Morgan Stanley Institutional Liquidity Money Market Portfolio — Institutional Class. |
(r) | Rate shown is the yield to maturity at September 30, 2008. |
(u) | Remaining maturities of bank loans may be less than stated maturities shown as a result of contractual or optional prepayments by the borrower. Such payments cannot be predicted with certainty. These loans may be subject to restrictions on resale. Bank loans generally have rates of interest which are determined periodically by reference to a base lending rate plus a premium. |
@ | Value is less than $500. |
IO | Interest Only |
PIK | Payment In-Kind |
Foreign Currency Exchange Contract Information:
The Portfolio had the following foreign currency exchange contract(s) open at period end:
| | | | | | | | | | Net | |
Currency | | | | | | | In | | | | Unrealized | |
to | | | | | | | Exchange | | | | Appreciation | |
Deliver | | | Value | | Settlement | | For | | Value | | (Depreciation) | |
(000) | | | (000) | | Date | | (000) | | (000) | | (000) | |
EUR 2,111 | | | $2,981 | | | 10/31/08 | | USD | 3,278 | | | $3,278 | | | | $297 | | |
| | | $2,981 | | | | | | | | | $3,278 | | | | $297 | | |
EUR | — Euro |
MXN | — Mexican Peso |
USD | — United States Dollar |
The accompanying notes are an integral part of the financial statements. | 63 |
2008 Annual Report
September 30, 2008
Portfolio of Investments (cont’d)
High Yield Portfolio
Credit Default Swap Contracts
The Portfolio had the following credit default swap agreement(s) open at period end:
| | | | | | | | | | Unrealized | |
| | | | Notional | | | | | | Appreciation | |
| | Buy/Sell | | Amount | | Pay/Receive | | Termination | | (Depreciation) | |
Swap Counterparty and Reference Obligation | | Protection | | (000) | | Fixed Rate | | Date | | (000) | |
Bank of America | | | | | | | | |
Carnival Corp., 6.65%, 1/15/28 | | Buy | | $ 860 | | 1.57 | % | 3/20/18 | | $ (16 | ) |
Pactiv Corp., 8.13%, 6/15/17 | | Buy | | 170 | | 1.38 | | 3/20/13 | | (3 | ) |
Toll Brothers Finance Corp., 6.88%, 11/15/12 | | Buy | | 735 | | 2.90 | | 3/20/13 | | (14 | ) |
Citigroup | | | | | | | | | | | |
Eaton Corp., 7.65%, 11/15/29 | | Buy | | 560 | | 0.82 | | 3/20/18 | | 14 | |
Credit Suisse | | | | | | | | | | | |
Pactiv Corp., 8.13%, 6/15/17 | | Buy | | 1,270 | | 1.35 | | 3/20/13 | | (19 | ) |
Deutsche Bank | | | | | | | | | | | |
Pactiv Corp., 8.13%, 6/15/17 | | Buy | | 420 | | 1.34 | | 3/20/13 | | (6 | ) |
Goldman Sachs | | | | | | | | | | | |
American Standard, Inc., 7.63%, 2/15/10 | | Buy | | 265 | | 0.50 | | 3/20/18 | | — | @ |
American Standard, Inc., 7.63%, 2/15/10 | | Buy | | 110 | | 0.60 | | 3/20/18 | | — | @ |
AvalonBay Communities, Inc., 6.13%, 11/1/12 | | Buy | | 1,255 | | 2.20 | | 6/20/13 | | — | @ |
Coca-Cola Enterprises, Inc., 6.13%, 8/15/11 | | Buy | | 1,465 | | 0.59 | | 3/20/13 | | (7 | ) |
Dow Jones CDX North America Investment Grade High Volatility Index, Series 9 | | Sell | | 1,620 | | 1.40 | | 12/20/12 | | (18 | ) |
Eaton Corp., 7.65%, 11/15/29 | | Buy | | 430 | | 0.97 | | 3/20/18 | | 6 | |
Prologis, 5.50%, 3/1/13 | | Buy | | 795 | | 2.97 | | 6/20/13 | | 25 | |
Sealed Air Corp., 5.63%, 7/15/13 | | Buy | | 250 | | 1.24 | | 3/20/18 | | 10 | |
JPMorgan Chase | | | | | | | | | | | |
Interpublic Group of Cos., Inc. | | Buy | | 450 | | 3.60 | | 9/20/13 | | 19 | |
Nordstrom, Inc., 6.95%, 3/15/28 | | Buy | | 460 | | 1.15 | | 3/20/18 | | 14 | |
Nordstrom, Inc., 6.95%, 3/15/28 | | Buy | | 160 | | 1.07 | | 3/20/18 | | 6 | |
SLM Corp., 5.13%, 8/27/12 | | Buy | | 415 | | 4.95 | | 3/20/13 | | (108 | ) |
Merrill Lynch | | | | | | | | | | | |
Carnival Corp., 6.65%, 1/15/28 | | Buy | | 465 | | 1.60 | | 3/20/18 | | (8 | ) |
Dow Jones CDX North America Investment Grade High Volatility Index, Series 9 | | Sell | | 860 | | 1.40 | | 12/20/12 | | (3 | ) |
SLM Corp., 5.13%, 8/27/12 | | Buy | | 415 | | 5.00 | | 3/20/13 | | (107 | ) |
Walt Disney Co. (The), 5.63%, 9/15/16 | | Buy | | 2,135 | | 0.77 | | 3/20/13 | | (32 | ) |
UBS | | | | | | | | | | | |
American Standard, Inc., 7.63%, 2/15/10 | | Buy | | 500 | | 0.50 | | 3/20/13 | | (1 | ) |
American Standard, Inc., 7.63%, 2/15/10 | | Buy | | 325 | | 0.60 | | 3/20/18 | | — | @ |
Dow Jones CDX North America High Yield, Series 10 | | Sell | | 885 | | 5.00 | | 6/20/13 | | (58 | ) |
Dow Jones CDX North America High Yield, Series 10 | | Sell | | 3,580 | | 5.00 | | 6/20/13 | | (135 | ) |
Martin Marietta Materials, Inc., 6.88%, 4/1/11 | | Buy | | 230 | | 1.73 | | 3/20/18 | | 4 | |
Martin Marietta Materials, Inc., 6.88%, 4/1/11 | | Buy | | 340 | | 1.78 | | 3/20/13 | | 1 | |
Toll Brothers Finance Corp., 6.88%, 11/15/12 | | Buy | | 1,125 | | 2.90 | | 3/20/13 | | | (22 | ) |
| | | | | | | | | | | $(458 | ) |
| | | | | | | | | | | | | | | |
64 | The accompanying notes are an integral part of the financial statements. |
| 2008 Annual Report |
| |
| September 30, 2008 |
Investment Overview (unaudited)
Intermediate Duration Portfolio
The Intermediate Duration Portfolio seeks above-average total return over a market cycle of three to five years. The Portfolio invests primarily in a diversified mix of U.S. dollar-denominated U.S. government securities, investment grade corporate bonds, and mortgage securities. The Portfolio may also invest in securities of foreign issuers, including issuers located in emerging market countries. The securities in which the Portfolio may invest will be denominated in U.S. dollars. The Portfolio seeks value in the fixed income market with only a moderate sensitivity to changes in interest rates. The Portfolio will ordinarily seek to maintain an average duration between two and five years although there is no minimum or maximum maturity for any individual security. The Portfolio may invest in TBAs. The Portfolio may invest in asset-backed securities and may use futures, options, forwards, CMOs, swaps, options on swaps and other derivatives.
Performance
For the fiscal year ended September 30, 2008, the Portfolio’s Class I had a total return based on net asset value and reinvestment of distributions per share of -7.29%, net of fees. The Portfolio’s Class I underperformed against its benchmark the Lehman Brothers Intermediate U.S. Government/Credit Index (the “Index”) which returned 3.13%.
Factors Affecting Performance
· The financial markets were under pressure throughout the period amid disrupted credit markets, ongoing deterioration of the housing market, losses in the financial sector, and growing fears of recession.
· The third quarter of 2008, however, will most certainly go down as a defining moment in the history of the financial industry. Investor confidence plummeted and credit markets seized as several venerable financial institutions were forced into mergers or dissolved entirely in September, resulting in significant price erosion across all but the U.S. Treasury sector.
· The primary detractor from the Portfolio’s relative performance was an overweight to non-agency mortgage securities as spreads in the sector moved wider over the course of the reporting period.
· An underweight in corporate credits for much of the period, however, was additive to relative performance as credit spreads significantly widened, particularly in the financial sector.
· Yield-curve positioning was also beneficial to performance as it enabled the Portfolio to benefit from the steepening of the yield curve that occurred during the reporting year.
Management Strategies
· The Portfolio maintained a neutral exposure to agency mortgage-backed securities and an overweight to nonagency mortgage-backed securities. The specific nonagency issues held in the Portfolio are backed primarily by Alt-A borrowers (those who have relatively strong credit but are not considered “prime” borrowers) and are concentrated in the senior and middle tranches of the capital structure. Given our expectations that the housing market situation may take some time to work itself out and therefore, these securities would continue to add volatility, we began reducing the Portfolio’s exposure to non-agency mortgage-backed securities in the third quarter of 2008.
· Within the portfolio’s investment range, we underweighted longer-dated issues and overweighted intermediate-dated issues in the first half of 2008. This trade was removed during the third quarter of the year and as a result, the Portfolio held a neutral duration, or interest-rate sensitivity, at the end of the period.
· During 2007 and into the first quarter of 2008, we maintained an underweight allocation to corporate credits with an emphasis on high-quality names. In response to sharp spread widening later in the period, this position was brought to a neutral stance.
65
2008 Annual Report
September 30, 2008
Investment Overview (cont’d)
Intermediate Duration Portfolio

* Minimum Investment
In accordance with SEC regulations, the Portfolio’s performance shown assumes that all recurring fees (including management fees) were deducted and all dividends and distributions were reinvested. The performance of Investment Class shares will vary from the Class I shares based upon their different inception dates and will be negatively impacted by additional fees assessed to that class.
Performance Compared to the Lehman Brothers Intermediate U.S. Government/Credit Index(1) and the Lipper Short-Intermediate Investment Grade Debt Funds Index(2)
| | Total Returns(3) | |
| | | | Average Annual | |
| | One | | Five | | Ten | | Since | |
| | Year | | Years | | Years | | Inception(6) | |
Portfolio — Class I (4) | | (7.29 | )% | 1.14 | % | 3.71 | % | 5.14 | % | |
Lehman Brothers Intermediate U.S. Government/Credit Index | | 3.13 | | 3.25 | | 4.96 | | 6.04 | | |
Lipper Short-Intermediate Investment Grade Debt Funds Index | | (0.89 | ) | 2.11 | | 3.92 | | 5.00 | | |
Portfolio — Investment Class (5) | | (7.54 | ) | 0.97 | | — | | 4.01 | | |
Lehman Brothers Intermediate U.S. Government/Credit Index | | 3.13 | | 3.25 | | — | | 5.52 | | |
Lipper Short-Intermediate Investment Grade Debt Funds Index | | (0.89 | ) | 2.11 | | — | | 4.28 | | |
Performance data quoted represents past performance, which is no guarantee of future results, and current performance may be lower or higher than the figures shown. Performance assumes that all dividends and distributions, if any, were reinvested. For the most recent month-end performance figures, please visit www.morganstanley.com/msim. Investment returns and principal value will fluctuate so that Portfolio shares, when redeemed, may be worth more or less than their original cost. Total returns do not reflect the deduction of taxes that a shareholder would pay on Portfolio distributions or the redemption of Portfolio shares. Performance of share classes will vary due to differences in sales charges and expenses.
(1) | The Lehman Brothers Intermediate U.S. Government/Credit Index is a fixed income market capitalization-weighted index of investment-grade (BBB-/Baa3) or higher publicly-traded fixed-rate U.S. government, U.S. agency, and corporate issues with remaining maturities of at least one year and not longer than ten years. To be included in the Index, bonds must have an outstanding par value of at least $250 million. Non-dollar denominated and convertible bonds are excluded from the Index. The Index is unmanaged and its returns do not include any sales charges or fees. Such costs would lower performance. It is not possible to invest directly in an index. |
(2) | The Lipper Short-Intermediate Investment Grade Debt Funds Index is an equally weighted performance index of the largest qualifying funds (based on net assets) in the Lipper Short-Intermediate Investment Grade Debt Funds classification. The Index, which is adjusted for capital gains distributions and income dividends, is unmanaged and should not be considered an investment. There are currently 30 funds represented in this Index. As of the date of this report, the Portfolio was in the Lipper Short-Intermediate Investment Grade Debt Funds classification. |
(3) | Total returns for the Portfolio reflect expenses waived and/or reimbursed, if applicable, by the Adviser. Without such waivers and/or reimbursements, total returns would have been lower. Fee waivers and/or reimbursements are voluntary and the Adviser reserves the right to commence or terminate any waiver and/or reimbursement at any time. |
(4) | Commenced operations on October 3, 1994. |
(5) | Commenced operations on August 16, 1999. |
(6) | For comparative purposes, average annual since inception returns listed for the Indexes refer to the inception date or initial offering of the respective share class of the Portfolio, not the inception of the Indexes. |
Portfolio Composition
| | Percentage of | |
Classification | | Total Investments | |
Industrials | | 13.2 | % | |
Finance | | 11.8 | | |
Agency Fixed Rate Mortgages | | 11.7 | | |
Asset Backed Corporates | | 11.0 | | |
Other* | | 15.6 | | |
Short-Term Investments | | | 36.7 | | |
Total Investments | | | 100.0 | % | |
* | Industries and/or investment types which do not appear in the above table, as well as those which represent less than 5% of total investments, if applicable, are included in the category labeled “Other”. |
66
| 2008 Annual Report |
| |
| September 30, 2008 |
Portfolio of Investments
Intermediate Duration Portfolio
| | Face | | | |
| | Amount | | Value | |
| | (000 | ) | (000 | ) |
Fixed Income Securities (63.5%) | | | | | |
Agency Adjustable Rate Mortgages (0.1%) | | | | | |
Government National Mortgage Association, | | | | | |
Various Pools: | | | | | |
5.13%, 11/20/25 - 11/20/27 | | $ | 44 | | $ | 44 | |
5.38%, 3/20/25 - 1/20/28 | | 118 | | 119 | |
5.63%, 7/20/25 - 9/20/27 | | 36 | | 36 | |
| | | | 199 | |
Agency Fixed Rate Mortgages (11.8%) | | | | | |
Federal Home Loan Bank, | | | | | |
5.00%, 11/17/17 | | 1,200 | | 1,212 | |
Federal Home Loan Mortgage Corp., | | | | | |
Conventional Pools: | | | | | |
5.50%, 8/23/17 | | 5,850 | | 6,200 | |
11.00%, 7/1/13 | | 2 | | 2 | |
Gold Pools: | | | | | |
7.00%, 6/1/28 - 6/1/32 | | 91 | | 96 | |
7.50%, 8/1/30 - 1/1/31 | | 97 | | 105 | |
8.00%, 6/1/30 - 9/1/31 | | 281 | | 305 | |
8.50%, 7/1/30 - 7/1/31 | | 66 | | 74 | |
9.50%, 12/1/22 | | 14 | | 16 | |
10.00%, 6/1/17 | | 13 | | 15 | |
Federal National Mortgage Association, | | | | | |
5.38%, 6/12/17 | | 4,450 | | 4,674 | |
Conventional Pools: | | | | | |
6.50%, 7/1/30 - 5/1/33 | | 313 | | 323 | |
7.00%, 1/1/32 - 11/1/34 | | 1,301 | | 1,368 | |
7.50%, 8/1/29 - 3/1/32 | | 664 | | 717 | |
8.00%, 10/1/30 - 9/1/31 | | 85 | | 93 | |
8.50%, 8/1/30 | | 6 | | 6 | |
9.50%, 12/1/17 - 12/1/21 | | 316 | | 351 | |
10.00%, 7/1/18 - 5/1/22 | | 10 | | 11 | |
Government National Mortgage Association, | | | | | |
Various Pools: | | | | | |
9.50%, 11/15/16 - 12/15/21 | | 99 | | 110 | |
10.00%, 4/15/16 - 3/15/25 | | 173 | | 197 | |
10.50%, 1/15/18 - 2/15/18 | | 21 | | 24 | |
11.00%, 3/15/10 - 6/15/20 | | 59 | | 66 | |
11.50%, 6/15/13 | | 3 | | 3 | |
12.00%, 5/15/14 | | 6 | | 7 | |
| | | | 15,975 | |
Asset Backed Corporates (11.1%) | | | | | |
Argent Securities, Inc., | | | | | |
3.26%, 10/25/36(h) | | 291 | | 284 | |
Bayview Financial Acquisition Trust, | | | | | |
3.82%, 11/28/36(h) | | 102 | | 101 | |
Bear Stearns Asset Backed Securities Trust, | | | | | |
3.31%, 1/25/37(h) | | 359 | | 330 | |
Capital Auto Receivables Asset Trust, | | | | | |
2.55%, 7/15/10(h) | | 1,000 | | 990 | |
4.98%, 5/15/11 | | 794 | | 786 | |
5.31%, 10/20/09(e) | | 270 | | 270 | |
Capital One Auto Finance Trust, | | | | | |
5.07%, 7/15/11 | | 282 | | 275 | |
Caterpillar Financial Asset Trust, | | | | | |
5.57%, 5/25/10 | | 211 | | 212 | |
CIT Equipment Collateral, | | | | | |
5.07%, 2/20/10 | | 370 | | 370 | |
Citibank Credit Card Issuance Trust, | | | | | |
3.19%, 3/22/12(h) | | 900 | | 878 | |
Citigroup Mortgage Loan Trust, Inc., | | | | | |
3.28%, 1/25/37(h) | | 446 | | 346 | |
CNH Equipment Trust, | | | | | |
5.20%, 6/15/10 | | 153 | | 153 | |
Credit-Based Asset Servicing and Securitization, LLC, | | | | | |
3.27%, 6/25/36(h) | | 34 | | 34 | |
3.28%, 1/25/37(h) | | 604 | | 564 | |
Ford Credit Auto Owner Trust, | | | | | |
5.26%, 10/15/10 | | 707 | | 709 | |
Fremont Home Loan Owner Trust, | | | | | |
3.26%, 10/25/36(h) | | 380 | | 364 | |
GE Equipment Small Ticket LLC, | | | | | |
4.88%, 10/22/09(e) | | 203 | | 203 | |
GS Auto Loan Trust, | | | | | |
5.37%, 12/15/10 | | 505 | | 506 | |
GSAMP Trust, | | | | | |
3.28%, 12/25/36 - 1/25/37(h) | | 871 | | 808 | |
Harley-Davidson Motorcycle Trust, | | | | | |
3.76%, 12/17/12 | | 303 | | 284 | |
4.07%, 2/15/12 | | 723 | | 720 | |
4.41%, 6/15/12 | | 1,071 | | 1,067 | |
Hertz Vehicle Financing LLC, | | | | | |
4.93%, 2/25/10(e) | | 1,104 | | 1,087 | |
Honda Auto Receivables Owner Trust, | | | | | |
4.85%, 10/19/09 | | 152 | | 152 | |
Hyundai Auto Receivables Trust, | | | | | |
3.98%, 11/16/09 | | 1 | | 1 | |
Nissan Auto Receivables Owner Trust, | | | | | |
5.44%, 4/15/10 | | 479 | | 481 | |
Residential Asset Mortgage Products, Inc., | | | | | |
3.30%, 10/25/36(h) | | 214 | | 202 | |
Residential Asset Securities Corp., | | | | | |
3.29%, 10/25/36(h) | | 143 | | 141 | |
Securitized Asset Backed Receivables LLC Trust, | | | | | |
3.29%, 11/25/36(h) | | 464 | | 446 | |
3.34%, 5/25/37(h) | | 513 | | 451 | |
SLM Student Loan Trust, | | | | | |
2.79%, 10/27/14(h) | | 345 | | 341 | |
Soundview Home Equity Loan Trust, | | | | | |
3.29%, 1/25/37 - 6/25/37(h) | | 702 | | 679 | |
Structured Asset Securities Corp., | | | | | |
3.30%, 6/25/37(h) | | 551 | | 500 | |
| | | | | | | |
The accompanying notes are an integral part of the financial statements. | 67 |
2008 Annual Report | |
| |
September 30, 2008 | |
Portfolio of Investments (cont’d)
Intermediate Duration Portfolio
| | Face | | | |
| | Amount | | Value | |
| | (000 | ) | (000 | ) |
Asset Backed Corporates (cont’d) | | | | | |
Terwin Mortgage Trust, | | | | | |
3.68%, 12/25/34(h) | | $ | 151 | | $ | 107 | |
TXU Electric Delivery Transition Bond Co. LLC, | | | | | |
4.81%, 11/17/14 | | 175 | | 177 | |
| | | | 15,019 | |
Collateralized Mortgage Obligations — Agency Collateral Series (1.8%) | | | | | |
Federal Home Loan Mortgage Corp., | | | | | |
Inv FI IO REMIC | | | | | |
5.51%, 3/15/32 | | 385 | | 37 | |
IO | | | | | |
6.00%, 5/1/31 | | 187 | | 38 | |
6.50%, 4/1/28 - 8/1/28 | | 423 | | 112 | |
8.00%, 1/1/28 - 6/1/31 | | 15 | | 4 | |
IO PAC REMIC | | | | | |
6.00%, 4/15/32 | | 188 | | 16 | |
IO REMIC | | | | | |
5.00%, 9/15/14 | | 3 | | — | @ |
7.00%, 2/15/32 | | 66 | | 11 | |
Federal National Mortgage Association, | | | | | |
Inv FI IO REMIC | | | | | |
6.00%, 5/25/33 | | 365 | | 69 | |
IO | | | | | |
6.50%, 6/1/31 | | 120 | | 32 | |
8.00%, 5/1/30 | | 8 | | 2 | |
9.00%, 11/1/26 | | 28 | | 9 | |
IO PAC REMIC | | | | | |
8.00%, 8/18/27 | | 28 | | 6 | |
IO REMIC | | | | | |
6.00%, 6/25/33 | | 198 | | 38 | |
7.00%, 4/25/33 | | 232 | | 43 | |
REMIC | | | | | |
3.27%, 12/25/36(h) | | 443 | | 427 | |
5.00%, 6/25/35 | | 742 | | 741 | |
Government National Mortgage Association, | | | | | |
3.79%, 8/20/30(h) | | 853 | | 852 | |
Inv FI IO | | | | | |
5.46%, 12/16/25 | | 138 | | 17 | |
5.50%, 9/16/27 | | 93 | | 12 | |
5.51%, 5/16/32 | | 76 | | 8 | |
| | | | 2,474 | |
Collateralized Mortgage Obligations — Non Agency Collateral Series (1.0%) | | | | | |
Countrywide Alternative Loan Trust, | | | | | |
IO | | | | | |
2.40%, 12/20/46 | | 5,580 | | 171 | |
2.51%, 12/20/35(e)(h) | | 6,924 | | 177 | |
2.54%, 12/20/35(e)(h) | | 9,337 | | 280 | |
2.56%, 2/25/37 | | 8,412 | | 215 | |
2.86%, 3/20/47 | | 4,710 | | 153 | |
Harborview Mortgage Loan Trust, | | | | | |
IO | | | | | |
2.36%, 6/19/35(h) | | 6,067 | | 67 | |
2.59%, 5/19/35(h) | | 7,152 | | 72 | |
2.93%, 3/19/37(h) | | 7,113 | | 166 | |
PO | | | | | |
3/19/37 | | 13 | | 2 | |
| | | | 1,303 | |
Finance (11.7%) | | | | | |
Ace INA Holding, Inc., | | | | | |
5.60%, 5/15/15 | | 205 | | 194 | |
AIG SunAmerica Global Financing VI, | | | | | |
6.30%, 5/10/11(e) | | 610 | | 495 | |
American Express Credit Corp., | | | | | |
7.30%, 8/20/13 | | 205 | | 198 | |
American General Finance Corp., | | | | | |
4.63%, 5/15/09 | | 235 | | 167 | |
American Honda Finance Corp., | | | | | |
3.85%, 11/6/08(e) | | 325 | | 324 | |
Bank of America Corp., | | | | | |
3.38%, 2/17/09 | | 245 | | 240 | |
5.65%, 5/1/18 | | 870 | | 734 | |
Bank of New York Mellon Corp. (The), | | | | | |
4.50%, 4/1/13 | | 160 | | 150 | |
Bank One Corp., | | | | | |
6.00%, 2/17/09 | | 455 | | 452 | |
Bear Stearns Cos. LLC (The), | | | | | |
6.40%, 10/2/17 | | 425 | | 397 | |
7.25%, 2/1/18 | | 255 | | 246 | |
Berkshire Hathaway Finance Corp., | | | | | |
5.40%, 5/15/18(e) | | 550 | | 534 | |
Caterpillar Financial Services Corp., | | | | | |
4.90%, 8/15/13 | | 60 | | 57 | |
Catlin Insurance Co., Ltd., | | | | | |
7.25%,(e)(h)(o) | | 150 | | 67 | |
Chubb Corp., | | | | | |
5.75%, 5/15/18 | | 55 | | 51 | |
Citigroup, Inc., | | | | | |
6.13%, 11/21/17 - 5/15/18 | | 865 | | 731 | |
Credit Suisse USA, Inc., | | | | | |
5.13%, 8/15/15 | | 85 | | 76 | |
Credit Suisse, New York, | | | | | |
6.00%, 2/15/18 | | 565 | | 493 | |
Farmers Insurance Exchange, | | | | | |
8.63%, 5/1/24(e) | | 300 | | 287 | |
General Electric Capital Corp., | | | | | |
2.85%, 3/12/10(h) | | 515 | | 508 | |
4.75%, 9/15/14 | | 95 | | 87 | |
5.63%, 5/1/18 | | 1,215 | | 1,029 | |
Goldman Sachs Group, Inc. (The), | | | | | |
6.15%, 4/1/18 | | 305 | | 254 | |
6.25%, 9/1/17 | | 670 | | 562 | |
| | | | | | | |
68 | The accompanying notes are an integral part of the financial statements. |
| 2008 Annual Report |
| |
| September 30, 2008 |
Portfolio of Investments (cont’d)
Intermediate Duration Portfolio
| | Face | | | |
| | Amount | | Value | |
| | (000 | ) | (000 | ) |
Finance (cont’d) | | | | | |
HBOS plc, | | | | | |
6.75%, 5/21/18(e) | | $ | 320 | | $ | 269 | |
HSBC Finance Corp., | | | | | |
4.13%, 12/15/08 | | 90 | | 89 | |
5.50%, 1/19/16 | | 480 | | 434 | |
6.75%, 5/15/11 | | 285 | | 286 | |
Huntington National Bank (The), | | | | | |
4.38%, 1/15/10 | | 300 | | 283 | |
John Hancock Global Funding II, | | | | | |
7.90%, 7/2/10(e) | | 715 | | 764 | |
JPMorgan Chase & Co., | | | | | |
4.75%, 5/1/13 | | 535 | | 498 | |
Lehman Brothers Holdings, Inc., | | | | | |
5.75%, 1/3/17(b) | | 695 | | 3 | |
6.50%, 7/19/17(b) | | 360 | | 2 | |
Mantis Reef Ltd., | | | | | |
4.69%, 11/14/08(e) | | 255 | | 255 | |
Merrill Lynch Co., Inc., | | | | | |
6.88%, 4/25/18 | | 725 | | 643 | |
Metlife, Inc., | | | | | |
6.82%, 8/15/18 | | 155 | | 147 | |
Nationwide Building Society, | | | | | |
4.25%, 2/1/10(e) | | 345 | | 339 | |
NYSE Euronext, | | | | | |
4.80%, 6/28/13 | | 315 | | 300 | |
Popular North America, Inc., | | | | | |
5.65%, 4/15/09 | | 155 | | 153 | |
Pricoa Global Funding I, | | | | | |
3.90%, 12/15/08(e) | | 795 | | 792 | |
Sovereign Bancorp, | | | | | |
3.44%, 3/23/10(h) | | 425 | | 302 | |
Travelers Cos., Inc. (The), | | | | | |
5.80%, 5/15/18 | | 175 | | 161 | |
Two-Rock Pass Through Trust, | | | | | |
3.74%, (e)(h)(o) | | 290 | | 6 | |
Unicredit Luxembourg Finance S.A., | | | | | |
2.85%, 10/24/08(e)(h) | | 470 | | 470 | |
Wachovia Capital Trust III, | | | | | |
5.80%, (h)(o) | | 515 | | 217 | |
Wachovia Corp., | | | | | |
5.50%, 5/1/13 | | 490 | | 406 | |
Wells Fargo & Co., | | | | | |
5.63%, 12/11/17 | | 555 | | 511 | |
Xlliac Global Funding, | | | | | |
4.80%, 8/10/10(e) | | 395 | | 380 | |
| | | | 16,043 | |
Industrials (13.3%) | | | | | |
America West Airlines, Inc., | | | | | |
7.10%, 4/2/21 | | 223 | | 183 | |
Amgen, Inc., | | | | | |
5.85%, 6/1/17 | | 285 | | 274 | |
ArcelorMittal, | | | | | |
6.13%, 6/1/18(e) | | 250 | | 222 | |
Archer-Daniels-Midland Co., | | | | | |
5.45%, 3/15/18 | | 210 | | 195 | |
AstraZeneca plc, | | | | | |
5.90%, 9/15/17 | | 195 | | 192 | |
AT&T, Inc., | | | | | |
5.10%, 9/15/14 | | 605 | | 567 | |
5.30%, 11/15/10 | | 160 | | 162 | |
Baxter International, Inc., | | | | | |
4.63%, 3/15/15 | | 160 | | 154 | |
5.38%, 6/1/18 | | 140 | | 134 | |
Biogen Idec, Inc., | | | | | |
6.88%, 3/1/18 | | 265 | | 262 | |
Bristol-Myers Squibb Co., | | | | | |
5.45%, 5/1/18 | | 375 | | 355 | |
Brookfield Asset Management, Inc., | | | | | |
5.80%, 4/25/17 | | 30 | | 26 | |
7.13%, 6/15/12 | | 300 | | 301 | |
Burlington Northern Santa Fe Corp., | | | | | |
6.13%, 3/15/09 | | 260 | | 260 | |
Canadian National Railway Co., | | | | | |
5.55%, 5/15/18 | | 40 | | 40 | |
Comcast Corp., | | | | | |
5.70%, 5/15/18 | | 535 | | 468 | |
6.50%, 1/15/15 | | 75 | | 72 | |
ConocoPhillips, | | | | | |
5.20%, 5/15/18 | | 415 | | 388 | |
Consumers Energy Co., | | | | | |
4.00%, 5/15/10 | | 100 | | 98 | |
4.80%, 2/17/09 | | 185 | | 185 | |
Cooper Industries, Inc., | | | | | |
5.25%, 11/15/12 | | 225 | | 228 | |
Covidien International Finance S.A., | | | | | |
6.00%, 10/15/17 | | 235 | | 233 | |
COX Communications, Inc., | | | | | |
6.25%, 6/1/18(e) | | 145 | | 135 | |
CVS Caremark Corp., | | | | | |
5.75%, 8/15/11 - 6/1/17 | | 130 | | 127 | |
CVS Pass-Through Trust, | | | | | |
6.04%, 12/10/28(e) | | 202 | | 181 | |
Dell, Inc., | | | | | |
5.65%, 4/15/18(e) | | 100 | | 92 | |
Deutsche Telekom International Finance B.V., | | | | | |
8.50%, 6/15/10 | | 435 | | 452 | |
Dr Pepper Snapple Group, Inc., | | | | | |
6.82%, 5/1/18(e) | | 130 | | 126 | |
E.I. Du Pont de Nemours & Co., | | | | | |
6.00%, 7/15/18 | | 115 | | 112 | |
FBG Finance Ltd., | | | | | |
5.13%, 6/15/15(e) | | 255 | | 239 | |
| | | | | | | |
The accompanying notes are an integral part of the financial statements. | 69 |
2008 Annual Report |
|
September 30, 2008 |
Portfolio of Investments (cont’d)
Intermediate Duration Portfolio
| | Face | | | |
| | Amount | | Value | |
| | (000) | | (000) | |
Industrials (cont’d) | | | | | |
FedEx Corp., | | | | | |
5.50%, 8/15/09 | | $ | 145 | | $ | 144 | |
France Telecom S.A., | | | | | |
7.75%, 3/1/11 | | 290 | | 305 | |
General Electric Co., | | | | | |
5.25%, 12/6/17 | | 915 | | 802 | |
General Mills, Inc., | | | | | |
5.25%, 8/15/13 | | 165 | | 164 | |
GlaxoSmithKline Capital, Inc., | | | | | |
5.65%, 5/15/18 | | 380 | | 361 | |
Grupo Televisa S.A., | | | | | |
6.00%, 5/15/18 | | 220 | | 209 | |
GTL Trade Finance, Inc., | | | | | |
7.25%, 10/20/17(e) | | 160 | | 154 | |
Harley-Davidson Funding Corp., | | | | | |
6.80%, 6/15/18(e) | | 85 | | 80 | |
Hewlett-Packard Co., | | | | | |
5.50%, 3/1/18 | | 110 | | 103 | |
Home Depot, Inc., | | | | | |
2.94%, 12/16/09(h) | | 330 | | 311 | |
5.40%, 3/1/16 | | 240 | | 204 | |
Honeywell International, Inc., | | | | | |
5.30%, 3/1/18 | | 190 | | 179 | |
ICI Wilmington, Inc., | | | | | |
4.38%, 12/1/08 | | 190 | | 190 | |
John Deere Capital Corp., | | | | | |
5.75%, 9/10/18 | | 140 | | 130 | |
KLA-Tencor Corp., | | | | | |
6.90%, 5/1/18 | | 270 | | 251 | |
Koninklijke Philips Electronics N.V., | | | | | |
5.75%, 3/11/18 | | 345 | | 332 | |
Kraft Foods, Inc., | | | | | |
6.13%, 8/23/18 | | 355 | | 332 | |
Kroger Co. (The), | | | | | |
5.00%, 4/15/13 | | 100 | | 95 | |
6.40%, 8/15/17 | | 30 | | 29 | |
LG Electronics, Inc., | | | | | |
5.00%, 6/17/10(e) | | 140 | | 138 | |
Macy’s Retail Holdings, Inc., | | | | | |
6.30%, 4/1/09 | | 265 | | 263 | |
Macy’s Retail Holdings, Inc., | | | | | |
5.95%, 11/1/08 | | 295 | | 294 | |
Marathon Oil Corp., | | | | | |
5.90%, 3/15/18 | | 130 | | 116 | |
6.00%, 10/1/17 | | 210 | | 189 | |
Medco Health Solutions, Inc., | | | | | |
7.13%, 3/15/18 | | 200 | | 203 | |
Monsanto Co., | | | | | |
5.13%, 4/15/18 | | 50 | | 48 | |
Oracle Corp., | | | | | |
5.75%, 4/15/18 | | 345 | | 321 | |
Parker Hannifin Corp., | | | | | |
5.50%, 5/15/18 | | 85 | | 85 | |
Pearson Dollar Finance Two plc, | | | | | |
6.25%, 5/6/18(e) | | 145 | | 139 | |
Petro-Canada, | | | | | |
6.05%, 5/15/18 | | 145 | | 127 | |
Philip Morris International, Inc., | | | | | |
5.65%, 5/16/18 | | 295 | | 273 | |
Questar Market Resources, Inc., | | | | | |
6.80%, 4/1/18 | | 235 | | 237 | |
Rio Tinto Finance USA Ltd., | | | | | |
6.50%, 7/15/18 | | 205 | | 194 | |
Sprint Nextel Corp., | | | | | |
6.00%, 12/1/16 | | 240 | | 185 | |
Starwood Hotels & Resorts Worldwide, Inc., | | | | | |
6.75%, 5/15/18 | | 85 | | 76 | |
Systems 2001 Asset Trust LLC, | | | | | |
6.66%, 9/15/13(e) | | 208 | | 211 | |
Telecom Italia Capital S.A., | | | | | |
4.95%, 9/30/14 | | 50 | | 42 | |
Telecom Italia Capital S.A., | | | | | |
4.00%, 1/15/10 | | 335 | | 325 | |
7.00%, 6/4/18 | | 120 | | 108 | |
Textron Financial Corp., | | | | | |
5.13%, 2/3/11 | | 95 | | 95 | |
Time Warner Cable, Inc., | | | | | |
6.75%, 7/1/18 | | 140 | | 131 | |
Time Warner, Inc., | | | | | |
5.88%, 11/15/16 | | 235 | | 207 | |
Tyco Electronics Group S.A., | | | | | |
5.95%, 1/15/14 | | 65 | | 64 | |
UnitedHealth Group, Inc., | | | | | |
6.00%, 2/15/18 | | 185 | | 168 | |
Valero Energy Corp., | | | | | |
3.50%, 4/1/09 | | 205 | | 203 | |
Verizon Communications, Inc., | | | | | |
5.50%, 2/15/18 | | 305 | | 270 | |
Verizon Global Funding Corp., | | | | | |
7.25%, 12/1/10 | | 140 | | 146 | |
Verizon New England, Inc., | | | | | |
6.50%, 9/15/11 | | 200 | | 198 | |
Viacom, Inc., | | | | | |
5.75%, 4/30/11 | | 300 | | 292 | |
Vivendi, | | | | | |
6.63%, 4/4/18(e) | | 335 | | 323 | |
Vodafone Group plc, | | | | | |
5.63%, 2/27/17 | | 110 | | 98 | |
Walgreen Co., | | | | | |
4.88%, 8/1/13 | | 120 | | 120 | |
| | | | | | | |
70 | The accompanying notes are an integral part of the financial statements. |
| 2008 Annual Report |
| |
| September 30, 2008 |
Portfolio of Investments (cont’d)
Intermediate Duration Portfolio
| | Face | | | |
| | Amount | | Value | |
| | (000) | | (000) | |
Industrials (cont’d) | | | | | |
Wal-Mart Stores, Inc., | | | | | |
4.25%, 4/15/13 | | $ | 315 | | $ | 309 | |
Weatherford International Ltd., | | | | | |
6.00%, 3/15/18 | | 145 | | 130 | |
Wyeth, | | | | | |
5.45%, 4/1/17 | | 120 | | 116 | |
5.50%, 2/15/16 | | 45 | | 44 | |
Xerox Corp., | | | | | |
6.35%, 5/15/18 | | 205 | | 188 | |
XTO Energy, Inc., | | | | | |
5.50%, 6/15/18 | | 290 | | 257 | |
Yum! Brands, Inc., | | | | | |
8.88%, 4/15/11 | | 190 | | 205 | |
| | | | 17,976 | |
Mortgages — Other (4.1%) | | | | | |
American Home Mortgage Assets, | | | | | |
3.40%, 6/25/47(d)(h) | | 1,043 | | 563 | |
3.51%, 6/25/47(d)(h) | | 431 | | 63 | |
American Home Mortgage Investment Trust, | | | | | |
3.93%, 11/25/45(d)(l)(h) | | 375 | | 8 | |
Banc of America Funding Corp., | | | | | |
3.54%, 9/20/35(d)(h) | | 240 | | 97 | |
Bear Stearns Mortgage Funding Trust, | | | | | |
3.38%, 3/25/37(d)(h) | | 907 | | 490 | |
3.39%, 10/25/36(d)(h) | | 453 | | 258 | |
Citigroup Mortgage Loan Trust, Inc., | | | | | |
3.29%, 1/25/37(h) | | 284 | | 258 | |
Countrywide Alternative Loan Trust, | | | | | |
3.40%, 11/25/46(d)(h) | | 494 | | 287 | |
Countrywide Home Loan Mortgage Pass Through Trust, | | | | | |
3.48%, 4/25/35(h) | | 858 | | 563 | |
3.51%, 3/25/35(h) | | 114 | | 66 | |
Deutsche ALT-A Securities NIM Trust, | | | | | |
6.75%, 2/25/47(e) | | 51 | | 47 | |
Harborview Mortgage Loan Trust, | | | | | |
3.27%, 3/19/37(d)(h) | | 1,121 | | 644 | |
3.32%, 7/19/45(d)(h) | | 273 | | 113 | |
Indymac Index Mortgage Loan Trust, | | | | | |
3.31%, 2/25/37(h) | | 576 | | 483 | |
Luminent Mortgage Trust, | | | | | |
3.45%, 10/25/46(d)(h) | | 615 | | 223 | |
Structured Adjustable Rate Mortgage Loan Trust, | | | | | |
3.55%, 8/25/35(d)(h) | | 517 | | 336 | |
Structured Asset Mortgage Investments, Inc., | | | | | |
3.39%, 9/25/47(d)(h) | | 1,058 | | 583 | |
Washington Mutual Mortgage Pass Through Certificates, | | | | | |
3.48%, 4/25/45(d)(h) | | 587 | | 235 | |
3.50%, 8/25/45(h) | | 13 | | 13 | |
Washington Mutual, Inc., | | | | | |
3.47%, 10/25/45(h) | | 61 | | 60 | |
3.56%, 6/25/46(d)(h) | | 175 | | 21 | |
| | | | 5,411 | |
Sovereign (0.9%) | | | | | |
Federative Republic of Brazil, | | | | | |
6.00%, 1/17/17 | | 435 | | 421 | |
Korea Railroad Corp., | | | | | |
5.38%, 5/15/13(e) | | 245 | | 230 | |
Province of Quebec Canada, | | | | | |
6.13%, 1/22/11 | | 550 | | 586 | |
| | | | 1,237 | |
U.S. Treasury Securities (4.9%) | | | | | |
U.S. Treasury Bond, | | | | | |
4.50%, 2/15/36 | | 650 | | 667 | |
U.S. Treasury Bond STRIPS, | | 2,750 | | 1,545 | |
Zero Coupon, 5/15/21 | | | | | |
U.S. Treasury Note, | | | | | |
3.88%, 2/15/13 | | 4,325 | | 4,502 | |
| | | | 6,714 | |
Utilities (2.8%) | | | | | |
Arizona Public Service Co., | | | | | |
5.80%, 6/30/14 | | 330 | | 306 | |
Carolina Power & Light Co., | | | | | |
5.13%, 9/15/13 | | 245 | | 245 | |
CenterPoint Energy Resources Corp., | | | | | |
7.88%, 4/1/13 | | 100 | | 103 | |
Columbus Southern Power Co., | | | | | |
4.40%, 12/1/10 | | 100 | | 99 | |
Consolidated Natural Gas Co., | | | | | |
6.25%, 11/1/11 | | 160 | | 162 | |
Detroit Edison Co. (The), | | | | | |
6.13%, 10/1/10 | | 155 | | 159 | |
E.ON International Finance B.V., | | | | | |
5.80%, 4/30/18(e) | | 510 | | 488 | |
Entergy Gulf States, Inc., | | | | | |
3.21%, 12/1/09(h) | | 215 | | 213 | |
Equitable Resources, Inc., | | | | | |
6.50%, 4/1/18 | | 80 | | 76 | |
Israel Electric Corp. Ltd., | | | | | |
7.25%, 1/15/19(e) | | 280 | | 281 | |
Kinder Morgan Energy Partners LP, | | | | | |
5.95%, 2/15/18 | | 110 | | 98 | |
NiSource Finance Corp., | | | | | |
3.38%, 11/23/09(h) | | 165 | | 161 | |
6.80%, 1/15/19 | | 185 | | 168 | |
Ohio Edison Co., | | | | | |
6.40%, 7/15/16 | | 110 | | 105 | |
| | | | | | | |
The accompanying notes are an integral part of the financial statements. | 71 |
2008 Annual Report |
|
September 30, 2008 |
Portfolio of Investments (cont’d)
Intermediate Duration Portfolio
| | Face | | | |
| | Amount | | Value | |
| | (000) | | (000) | |
Utilities (cont’d) | | | | | |
Ohio Power Co., | | | | | |
6.00%, 6/1/16 | | $ | 190 | | $ | 182 | |
Peco Energy Co., | | | | | |
5.35%, 3/1/18 | | 140 | | 127 | |
PPL Energy Supply LLC, | | | | | |
6.30%, 7/15/13 | | 145 | | 141 | |
Public Service Colorado, | | | | | |
5.80%, 8/1/18 | | 125 | | 121 | |
Public Service Electric & Gas Co., | | | | | |
5.00%, 1/1/13 | | 145 | | 143 | |
Trans-Canada Pipelines Ltd., | | | | | |
6.50%, 8/15/18 | | 210 | | 204 | |
Union Electric Co., | | | | | |
6.70%, 2/1/19 | | 195 | | 189 | |
| | | | 3,771 | |
Total Fixed Income Securities (Cost $96,617) | | | | 86,122 | |
| | Shares | | | |
Short-Term Investments (36.8%) | | | | | |
Investment Company (4.4%) | | | | | |
Morgan Stanley Institutional Liquidity Money Market Portfolio — Institutional Class(p) | | 6,028,210 | | 6,028 | |
| | | | | |
| | Face | | | |
| | Amount | | | |
| | (000) | | | |
U.S. Government & Agency Securities (18.3%) | | | | | |
Federal Home Loan Bank, | | | | | |
2.12%, 10/10/08(t) | | $ | 3,900 | | 3,900 | |
2.24%, 10/21/08(t) | | 3,100 | | 3,099 | |
Federal Home Loan Mortgage Corp., | | | | | |
2.10%, 11/12/08(t) | | 2,800 | | 2,794 | |
2.25%, 11/10/08(t) | | 4,200 | | 4,191 | |
Federal National Mortgage Association, | | | | | |
2.05%, 11/5/08(t) | | 3,000 | | 2,994 | |
2.36%, 11/4/08 - 11/10/08(t) | | 7,800 | | 7,784 | |
| | | | 24,762 | |
U.S. Treasury Securities (14.1%) | | | | | |
U.S. Treasury Bills, | | | | | |
0.17%, 10/9/08(r)(j) | | 1,135 | | 1,135 | |
0.45%, 10/30/08(r) | | 2,700 | | 2,699 | |
0.70%, 12/4/08(r) | | 10,000 | | 9,988 | |
1.01%, 1/8/09(r) | | 4,000 | | 3,989 | |
1.11%, 10/16/08(r) | | 1,300 | | 1,299 | |
| | | | 19,110 | |
Total Short-Term Investments (Cost $49,864) | | | | 49,900 | |
Total Investments (100.3%) (Cost $146,481) | | | | 136,022 | |
Liabilities in Excess of Other Assets (-0.3%) | | | | (400 | ) |
Net Assets (100%) | | | | $135,622 | |
| | | | | | | |
(b) | | Issuer is in default. |
(d) | | Security was valued at fair value — At September 30, 2008, the Portfolio held $3,921,000 of fair valued securities, representing 2.9% of net assets. |
(e) | | 144A security — Certain conditions for public sale may exist. Unless otherwise noted, these securities are deemed to be liquid. |
(h) | | Variable/Floating Rate Security — Interest rate changes on these instruments are based on changes in a designated rate. The rates shown are those in effect on September 30, 2008. |
(j) | | All or a portion of the security was pledged to cover margin requirements for futures contracts. |
(l) | | Security has been deemed illiquid at September 30, 2008. |
(o) | | Perpetual — Security does not have a predetermined maturity date. Rate for this security is fixed for a period of time then reverts to a floating rate. The interest shown is the rate in effect at September 30, 2008. |
(p) | | See Note G within the Notes to Financial Statements regarding investment in Morgan Stanley Institutional Liquidity Money Market Portfolio — Institutional Class. |
(r) | | Rate shown is the yield to maturity at September 30, 2008. |
(t) | | Purchased on a discount basis. The interest rate shown has been adjusted to reflect a money market equivalent yield. |
@ | | Value is less than $500. |
Inv Fl | | Inverse Floating Rate — Interest rate fluctuates with an inverse relationship to an associated interest rate. Indicated rate is the effective rate at September 30, 2008. |
IO | | Interest Only |
PAC | | Planned Amortization Class |
PO | | Principal Only |
REMIC | | Real Estate Mortgage Investment Conduit |
STRIPS | | Separate Trading of Registered Interest and Principal of Securities |
72 | The accompanying notes are an integral part of the financial statements. |
| 2008 Annual Report |
| |
| September 30, 2008 |
Portfolio of Investments (cont’d)
Intermediate Duration Portfolio
Futures Contracts:
The Portfolio had the following futures contract(s) open at period end:
| | | | | | | | Net | |
| | | | | | | | Unrealized | |
| | Number | | | | | | Appreciation | |
| | of | | Value | | Expiration | | (Depreciation) | |
| | Contracts | | (000) | | Date | | (000) | |
Long: | | | | | | | | | |
U.S. Treasury | | | | | | | | | |
2 yr. Note | | 220 | | | $46,956 | | | Dec-08 | | | | $223 | | |
U.S. Treasury | | | | | | | | | | | | | | |
5 yr. Note | | 190 | | | 21,325 | | | Dec-08 | | | | 34 | | |
Short: | | | | | | | | | | | | | | |
EuroDollar | | | | | | | | | | | | | | |
CME | | 23 | | | 5,551 | | | Dec-08 | | | | (10 | ) | |
EuroDollar | | | | | | | | | | | | | | |
CME | | 11 | | | 2,669 | | | Mar-09 | | | | (39 | ) | |
EuroDollar | | | | | | | | | | | | | | |
CME | | 11 | | | 2,667 | | | Jun-09 | | | | (40 | ) | |
EuroDollar | | | | | | | | | | | | | | |
CME | | 11 | | | 2,664 | | | Sep-09 | | | | (4 | ) | |
EuroDollar | | | | | | | | | | | | | | |
CME | | 6 | | | 1,448 | | | Dec-09 | | | | (19 | ) | |
EuroDollar | | | | | | | | | | | | | | |
CME | | 5 | | | 1,205 | | | Mar-10 | | | | (14 | ) | |
EuroDollar | | | | | | | | | | | | | | |
CME | | 1 | | | 240 | | | Jun-10 | | | | (2 | ) | |
EuroDollar | | | | | | | | | | | | | | |
CME | | 1 | | | 240 | | | Sep-10 | | | | (2 | ) | |
U.S. Treasury | | | | | | | | | | | | | | |
10 yr. Note | | 85 | | | 9,743 | | | Dec-08 | | | | 57 | | |
U.S. Treasury | | | | | | | | | | | | | | |
Long Bond | | 12 | | | 1,406 | | | Dec-08 | | | | 8 | | |
5 yr. Swap | | 10 | | | 1,085 | | | Dec-08 | | | | (5 | ) | |
10 yr. Swap | | 149 | | | 16,665 | | | Dec-08 | | | | 224 | | |
| | | | | | | | | | $411 | | |
CME — Chicago Mercantile Exchange
| The accompanying notes are an integral part of the financial statements. | 73 |
2008 Annual Report | |
| |
September 30, 2008 | |
Portfolio of Investments (cont’d)
Intermediate Duration Portfolio
Credit Default Swap Contracts
The Portfolio had the following credit default swap agreement(s) open at period end:
| | | | | | | | | | Unrealized | |
| | | | Notional | | | | | | Appreciation | |
| | Buy/Sell | | Amount | | Pay/Receive | | Termination | | (Depreciation) | |
Swap Counterparty and Reference Obligation | | Protection | | (000) | | Fixed Rate | | Date | | (000) | |
Bank of America | | | | | | | | | | | |
Carnival Corp., 6.65%, 1/15/28 | | Buy | | | $ | 165 | | | 1.57 | % | | 3/20/18 | | | | $ | (3 | ) | |
Goodrich Corp., 7.63%, 12/15/12 | | Buy | | | 240 | | | 0.70 | | | 3/20/13 | | | | (2 | ) | |
Goodrich Corp., 7.63%, 12/15/12 | | Buy | | | 170 | | | 0.82 | | | 3/20/18 | | | | (3 | ) | |
Textron Financial Corp., 5.13%, 2/3/11 | | Buy | | | 180 | | | 0.80 | | | 3/20/18 | | | | 32 | | |
Yum! Brands, Inc., 8.88%, 4/15/11 | | Buy | | | 190 | | | 1.18 | | | 3/20/13 | | | | — | | |
Citigroup | | | | | | | | | | | | | | | | | |
Eaton Corp., 7.65%, 11/15/29 | | Buy | | | 80 | | | 0.82 | | | 3/20/18 | | | | 2 | | |
Credit Suisse | | | | | | | | | | | | | | | | | |
Arrow Electronics, Inc., 6.88%, 6/1/18 | | Buy | | | 210 | | | 1.00 | | | 3/20/15 | | | | (4 | ) | |
Goldman Sachs | | | | | | | | | | | | | | | | | |
AvalonBay Communities, Inc., 6.13%, 11/1/12 | | Buy | | | 140 | | | 3.05 | | | 3/20/13 | | | | (5 | ) | |
Coca-Cola Enterprises, Inc., 6.13%, 8/15/11 | | Buy | | | 570 | | | 0.59 | | | 3/20/13 | | | | (3 | ) | |
Dow Jones CDX North America Investment Grade Index, Series 10 | | Sell | | | 700 | | | 1.55 | | | 6/20/13 | | | | (12 | ) | |
Dow Jones CDX North America Investment Grade Index, Series 9 | | Sell | | | 270 | | | 0.60 | | | 12/20/12 | | | | (4 | ) | |
Dow Jones CDX North America Investment Grade Index, Series 9 | | Sell | | | 505 | | | 0.80 | | | 12/20/17 | | | | (13 | ) | |
Eaton Corp., 7.65%, 11/15/29 | | Buy | | | 160 | | | 0.97 | | | 3/20/18 | | | | 2 | | |
Goodrich Corp., 7.63%, 12/15/12 | | Buy | | | 150 | | | 0.47 | | | 3/20/18 | | | | 1 | | |
Sealed Air Corp., 5.63%, 7/15/13 | | Buy | | | 100 | | | 1.24 | | | 3/20/18 | | | | 4 | | |
JPMorgan Chase | | | | | | | | | | | | | | | | | |
Dow Jones CDX North America Investment Grade Index, Series 9 | | Sell | | | 1,265 | | | 0.60 | | | 12/20/12 | | | | (10 | ) | |
Nordstrom, Inc., 6.95%, 3/15/28 | | Buy | | | 185 | | | 1.07 | | | 3/20/18 | | | | 7 | | |
Merrill Lynch | | | | | | | | | | | | | | | | | |
Carnival Corp., 6.65%, 1/15/28 | | Buy | | | 135 | | | 1.60 | | | 3/20/18 | | | | (2 | ) | |
Eaton Corp., 7.65%, 11/15/29 | | Buy | | | 200 | | | 0.92 | | | 3/20/18 | | | | — | | |
UBS | | | | | | | | | | | | | | | | | |
Martin Marietta Materials, Inc., 6.88%, 4/1/11 | | Buy | | | 90 | | | 1.73 | | | 3/20/18 | | | | 2 | | |
Martin Marietta Materials, Inc., 6.88%, 4/1/11 | | Buy | | | 130 | | | 1.78 | | | 3/20/13 | | | | 1 | | |
| | | | | | | | | | | $ | (10 | ) | |
Interest Rate Swap Contracts
The Portfolio had the following interest rate swap agreement(s) open at period end:
| | | | | | | | | | | | Unrealized | |
| | | | | | | | | | Notional | | Appreciation | |
| | Floating Rate | | Pay/Receive | | Fixed | | Termination | | Amount | | (Depreciation) | |
Swap Counterparty | | Index | | Floating Rate | | Rate | | Date | | (000) | | (000) | |
Bank of America | | 3 Month LIBOR | | Pay | | 4.15 | % | | 6/9/13 | | | | $ | 10,070 | | | $ | 169 | | |
| | 3 Month LIBOR | | Receive | | 3.90 | | | 9/10/13 | | | | 9,790 | | | 58 | | |
| | 3 Month LIBOR | | Pay | | 5.37 | | | 2/12/18 | | | | 3,088 | | | 51 | | |
| | 3 Month LIBOR | | Pay | | 5.07 | | | 4/14/18 | | | | 2,780 | | | 14 | | |
| | 3 Month LIBOR | | Pay | | 4.98 | | | 4/15/18 | | | | 2,190 | | | 4 | | |
| | 3 Month LIBOR | | Receive | | 4.67 | | | 8/4/18 | | | | 8,925 | | | (170 | ) | |
| | 3 Month LIBOR | | Receive | | 5.08 | | | 9/2/18 | | | | 21,000 | | | (91 | ) | |
| | 3 Month LIBOR | | Receive | | 5.82 | | | 2/12/23 | | | | 3,970 | | | (85 | ) | |
| | 3 Month LIBOR | | Receive | | 5.47 | | | 4/14/23 | | | | 3,560 | | | (40 | ) | |
| | 3 Month LIBOR | | Receive | | 5.38 | | | 4/15/23 | | | | 2,590 | | | (22 | ) | |
| | 3 Month LIBOR | | Pay | | 5.28 | | | 9/2/23 | | | | 26,900 | | | 154 | | |
Citigroup | | 3 Month LIBOR | | Pay | | 5.45 | | | 8/9/17 | | | | 10,000 | | | 797 | | |
| | 3 Month LIBOR | | Pay | | 5.24 | | | 9/27/17 | | | | 12,200 | | | 736 | | |
Deutsche Bank | | 3 Month LIBOR | | Pay | | 5.39 | | | 5/25/17 | | | | 14,250 | | | 1,251 | | |
| | 3 Month LIBOR | | Pay | | 5.43 | | | 5/29/17 | | | | 2,250 | | | 204 | | |
Goldman Sachs | | 3 Month LIBOR | | Pay | | 5.63 | | | 2/28/18 | | | | 10,030 | | | 260 | | |
| | 3 Month LIBOR | | Receive | | 6.04 | | | 2/28/23 | | | | 12,870 | | | (355 | ) | |
| | | | | | | | | | | | | | | | | | | | | |
74 | The accompanying notes are an integral part of the financial statements. |
| 2008 Annual Report |
| |
| September 30, 2008 |
Portfolio of Investments (cont’d)
Intermediate Duration Portfolio
Interest Rate Swap Contracts (cont’d)
The Portfolio had the following interest rate swap agreement(s) open at period end:
| | | | | | | | | | | | Unrealized | |
| | | | | | | | | | Notional | | Appreciation | |
| | Floating Rate | | Pay/Receive | | Fixed | | Termination | | Amount | | (Depreciation) | |
Swap Counterparty | | Index | | Floating Rate | | Rate | | Date | | (000) | | (000) | |
JPMorgan Chase | | 3 Month LIBOR | | Pay | | 4.07 | | 5/16/13 | | | | $ | 8,065 | | | | $ | 110 | | |
| | 3 Month LIBOR | | Pay | | 5.45 | | 5/29/17 | | | | 2,250 | | | | 208 | | |
| | 3 Month LIBOR | | Pay | | 5.09 | | 9/11/17 | | | | 5,150 | | | | 267 | | |
| | 3 Month LIBOR | | Receive | | 4.41 | | 5/1/18 | | | | 10,675 | | | | (107 | ) | |
Merrill Lynch | | 3 Month LIBOR | | Pay | | 5.00 | | 4/15/18 | | | | 2,920 | | | | 7 | | |
| | 3 Month LIBOR | | Receive | | 5.40 | | 4/16/23 | | | | 3,635 | | | | (33 | ) | |
| | | | | | | | | | | | | $ | 3,387 | | |
LIBOR — London Inter Bank Offer Rate
Zero Coupon Swap Contracts
The Portfolio had the following zero coupon swap agreement(s) open at period end:
| | | | | | | | Unrealized | |
| | Notional | | | | | | Appreciation | |
| | Amount | | | | Termination | | (Depreciation) | |
Swap Counterparty | | (000) | | Receive | | Date | | (000) | |
JPMorgan Chase | | | | | | | | | |
| | $1,546 | | 3 Month LIBOR | | 5/15/21 | | | $— | | |
| | | | | | | | | $— | | |
LIBOR — London Inter Bank Offer Rate
The accompanying notes are an integral part of the financial statements. | 75 |
2008 Annual Report |
|
September 30, 2008 |
Investment Overview (unaudited)
International Fixed Income Portfolio
The International Fixed Income Portfolio seeks above-average total return over a market cycle of three to five years. The Portfolio invests primarily in investment grade fixed income securities of government and corporate issuers in countries other than the United States, including securities of issuers located in emerging markets, and, including, to a limited degree, high yield securities (commonly referred to as “junk bonds”). The securities held by the Portfolio ordinarily will be denominated in foreign currencies. The Portfolio will ordinarily seek to maintain an average weighted maturity in excess of five years, although there is no minimum or maximum maturity for any individual security. The Portfolio may invest in asset-backed and mortgage-backed securities and use futures, options, forwards, CMOs, swaps, options on swaps and other derivatives.
Performance
For the fiscal year ended September 30, 2008, the Portfolio’s Class I had a total return based on net asset value and reinvestment of distributions per share of 3.50%, net of fees. The Portfolio’s Class I underperformed against its benchmark the Citigroup World Government Bond Ex-U.S. Index (the “Index”) which returned 5.16%.
Factors Affecting Performance
· The financial markets were under pressure throughout the reporting period amid disrupted credit markets, losses in the financial sector, and slowing global economic growth.
· The third quarter of 2008, however, will most certainly go down as a defining moment in the history of the financial industry. Investor confidence plummeted and credit markets seized as several venerable U.S. financial institutions were forced into mergers or dissolved entirely in September. Although the U.S. was at the epicenter of the crisis, the impact was felt across the global markets, causing extreme volatility and price deterioration in all but the government sector.
· The Portfolio held an overweight to the corporate credit sector, which is not represented in the benchmark. During the period, corporate credit spreads widened considerably, particularly in financials, and as a result, the Portfolio’s positioning in the sector detracted from relative performance.
· Our currency strategy, however, had a significant positive impact on relative returns. Specifically, an underweight to the U.S. dollar versus a basket of Asian currencies in the first quarter of 2008 and an overweight to various Eastern European currencies versus the British pound and the euro in the second quarter were particularly additive to performance.
Management Strategies
· In the third quarter of 2008, we trimmed currency exposures, taking profits on our positions.
· The Portfolio remained underweight the U.S. dollar, Canadian dollar, British pound and Swedish krona and overweight the Japanese yen, Polish zloty, Norwegian krone and Mexican peso.
· The Portfolio’s interest-rate positioning remained relatively neutral throughout the period and therefore, had a negligible impact on performance.
| 2008 Annual Report |
| |
| September 30, 2008 |
Investment Overview (cont’d)
International Fixed Income Portfolio
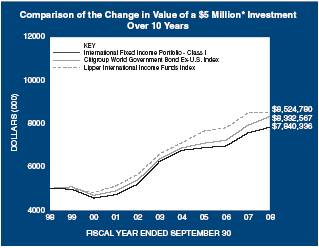
* Minimum Investment
In accordance with SEC regulations, the Portfolio’s performance shown assumes that all recurring fees (including management fees) were deducted and all dividends and distributions were reinvested. The performance of Class P, Class H and Class L shares will vary from the Class I shares based upon their different inception dates and will be negatively impacted by additional fees assessed to those classes.
Performance Compared to the Citigroup World Government Bond Ex-U.S. Index(1) and the Lipper International Income Funds Index(2)
| | Total Returns(3) | |
| | | | Average Annual | |
| | One | | Five | | Ten | | Since | |
| | Year | | Years | | Years | | Inception(8) | |
Portfolio — Class I (4) | | 3.50 | % | 4.58 | % | 4.60 | % | 5.51 | % |
Citigroup World Government Bond Ex-U.S. Index | | 5.16 | | 5.56 | | 5.24 | | 5.93 | |
Lipper International Income Funds Index | | 0.39 | | 5.25 | | 5.48 | | 6.40 | |
| | | | | | | | | |
Portfolio — Class P (5) | | 4.31 | | — | | — | | 4.29 | |
Citigroup World Government Bond Ex-U.S. Index | | 5.16 | | — | | — | | 5.13 | |
Lipper International Income Funds Index | | 0.39 | | — | | — | | 0.39 | |
| | | | | | | | | |
| | | | | | | | Cumulative | |
| | | | | | | | Since | |
| | | | | | | | Inception(8) | |
Portfolio — Class H w/o sales charges (6) | | — | | — | | — | | (2.70 | ) |
Portfolio — Class H with maximum 3.50% sales charges (6) | | — | | — | | — | | (6.06 | ) |
Citigroup World Government Bond Ex-U.S. Index | | — | | — | | — | | (0.15 | ) |
Lipper International Income Funds Index | | — | | — | | — | | (3.19 | ) |
| | | | | | | | | |
Portfolio — Class L (7) | | — | | — | | — | | (2.93 | ) |
Citigroup World Government Bond Ex-U.S. Index | | — | | — | | — | | (1.09 | ) |
Lipper International Income Funds Index | | — | | — | | — | | (3.90 | ) |
Performance data quoted represents past performance, which is no guarantee of future results, and current performance may be lower or higher than the figures shown. Performance assumes that all dividends and distributions, if any, were reinvested. For the most recent month-end performance figures, please visit www.morganstanley.com/msim. Investment returns and principal value will fluctuate so that Portfolio shares, when redeemed, may be worth more or less than their original cost. Total returns do not reflect the deduction of taxes that a shareholder would pay on Portfolio distributions or the redemption of Portfolio shares. Performance of share classes will vary due to differences in sales charges and expenses.
(1) | The Citigroup World Government Bond Ex-U.S. Index is a market capitalization weighted benchmark that tracks the performance of the 20 government bond markets of Australia, Austria, Belgium, Canada, Denmark, Finland, France, Germany, Greece, Ireland, Italy, Japan, the Netherlands, Norway, Poland, Portugal, Spain, Sweden, Switzerland, and the United Kingdom. Issuers must carry an investment grade (BBB-/Baa3) or higher credit rating to remain eligible for inclusion. The Index is unmanaged and its returns do not include any sales charges or fees. Such costs would lower performance. It is not possible to invest directly in an index. |
(2) | The Lipper International Income Funds Index is an equally weighted performance index of the largest qualifying funds (based on net assets) in the Lipper International Income Funds classification. The Index, which is adjusted for capital gains distributions and income dividends, is unmanaged and should not be considered an investment. There are currently 10 funds represented in this Index. As of the date of this report, the Portfolio was in the Lipper International Income Funds classification. |
(3) | Total returns for the Portfolio reflect expenses waived and/or reimbursed, if applicable, by the Adviser. Without such waivers and/or reimbursements, total returns would have been lower. Fee waivers and/or reimbursements are voluntary and the Adviser reserves the right to commence or terminate any waiver and/or reimbursement at any time. Returns for periods less than one year are not annualized. |
(4) | Commenced operations on April 29, 1994. |
(5) | Commenced operations on September 28, 2007. |
(6) | Commenced operations on January 2, 2008. |
(7) | Commenced operations on June 16, 2008. |
(8) | For comparative purposes, average annual and cumulative since inception returns listed for the Indexes refer to the inception date or initial offering of the share class of the Portfolio, not the inception of the Indexes. |
Portfolio Composition
| | Percentage of | |
Country | | Total Investments | |
Japan | | 25.9 | % |
Germany | | 10.8 | |
France | | 8.3 | |
United Kingdom | | 8.1 | |
Austria | | 5.4 | |
Netherlands | | 5.2 | |
Multi-Country | | 5.0 | |
Other* | | 27.2 | |
Short-Term Investment | | | 4.1 | |
Total Investments | | | 100.0 | % |
| | | | | |
* Countries and/or investment types which do not appear in the above table, as well as those which represent less than 5% of total investments, if applicable, are included in the category labeled “Other”.
2008 Annual Report
September 30, 2008
Portfolio of Investments
International Fixed Income Portfolio
| | Face | | | |
| | Amount | | Value | |
| | (000) | | (000) | |
Fixed Income Securities (95.0%) | | | | | |
Australia (1.2%) | | | | | |
Queensland Treasury Corp., | | | | | |
6.00%, 10/14/15 | AUD | 2,250 | | $ | 1,788 | |
Telstra Corp. Ltd., | | | | | |
6.38%, 6/29/11 | EUR | 300 | | 434 | |
| | | | 2,222 | |
Austria (5.4%) | | | | | |
Oesterreichische Kontrollbank AG, | | | | | |
1.80%, 3/22/10 | JPY | 180,000 | | 1,714 | |
Republic of Austria, | | | | | |
4.30%, 7/15/14 | EUR | 5,900 | | 8,368 | |
| | | | 10,082 | |
Belgium (4.8%) | | | | | |
Government of Belgium, | | | | | |
3.00%, 3/28/10 | | 6,500 | | 9,043 | |
Bermuda (0.2%) | | | | | |
Adecco Financial Service | | | | | |
Bermuda Ltd. (Convertible), | | | | | |
Zero Coupon, 8/26/13 | CHF | 425 | | 375 | |
Brazil (0.9%) | | | | | |
Republic of Brazil, | | | | | |
10.00%, 1/1/17 | BRL | 3,700 | | 1,577 | |
Canada (4.1%) | | | | | |
Bombardier, Inc., | | | | | |
7.25%, 11/15/16 | EUR | 150 | | 191 | |
Government of Canada, | | | | | |
4.00%, 9/1/10 - 6/1/16 | CAD | 6,000 | | 5,784 | |
Quebec Province, | | | | | |
1.60%, 5/9/13 | JPY | 180,000 | | 1,720 | |
| | | | 7,695 | |
Denmark (1.3%) | | | | | |
Kingdom of Denmark, | | | | | |
4.00%, 11/15/15 | DKK | 13,000 | | 2,407 | |
France (8.2%) | | | | | |
Air Liquide, | | | | | |
5.00%, 3/22/13 | EUR | 300 | | 417 | |
Compagnie de Financement Foncier, | | | | | |
1.25%, 12/1/11 | JPY | 400,000 | | 3,756 | |
Compagnie Generale des Etablissements Michelin, | | | | | |
6.38%, 12/3/33(h) | EUR | 300 | | 365 | |
Crown European Holdings S.A., | | | | | |
6.25%, 9/1/11 | | 295 | | 378 | |
Europcar Groupe S.A., | | | | | |
8.36%, 5/15/13(h) | | 150 | | 124 | |
France Telecom S.A., | | | | | |
8.13%, 1/28/33 | | 120 | | 196 | |
Government of France O.A.T., | | | | | |
3.25%, 4/25/16 | | 1,000 | | 1,321 | |
3.75%, 4/25/17 | | 1,150 | | 1,562 | |
5.50%, 4/25/29 | | 4,250 | | 6,546 | |
Groupe Danone, | | | | | |
5.50%, 5/6/15 | | 300 | | 415 | |
Societe Generale, | | | | | |
4.20%, 3/5/12 | | 200 | | 271 | |
| | | | 15,351 | |
Germany (10.7%) | | | | | |
Bundesrepublik Deutschland, | | | | | |
4.25%, 7/4/14 - 7/4/17 | | 2,200 | | 3,160 | |
5.50%, 1/4/31 | | 2,200 | | 3,440 | |
6.25%, 1/4/24 | | 5,400 | | 9,023 | |
Deutsche Bank AG, | | | | | |
5.13%, 8/31/17 | | 200 | | 266 | |
Kreditanstalt fuer Wiederaufbau, | | | | | |
1.75%, 3/23/10 | JPY | 130,000 | | 1,238 | |
1.85%, 9/20/10 | | 300,000 | | 2,870 | |
| | | | 19,997 | |
Greece (1.4%) | | | | | |
Government of Greece, | | | | | |
5.25%, 5/18/12 | EUR | 1,800 | | 2,603 | |
Ireland (0.1%) | | | | | |
Smurfit Kappa Funding plc, | | | | | |
7.75%, 4/1/15 | | 150 | | 171 | |
Italy (3.6%) | | | | | |
Italy Buoni Poliennali Del Tesoro, | | | | | |
4.00%, 4/15/12 | | 3,500 | | 4,880 | |
4.25%, 8/1/13 | | 1,300 | | 1,815 | |
| | | | 6,695 | |
Japan (25.6%) | | | | | |
Development Bank of Japan, | | | | | |
1.60%, 6/20/14 | JPY | 780,000 | | 7,490 | |
1.75%, 3/17/17 | | 250,000 | | 2,404 | |
Government of Japan, | | | | | |
0.60%, 3/20/10 | | 250,000 | | 2,347 | |
1.00%, 12/20/12 | | 450,000 | | 4,233 | |
1.20%, 6/20/11 | | 570,000 | | 5,410 | |
1.70%, 6/20/33 | | 440,000 | | 3,672 | |
1.90%, 6/20/16 | | 1,120,000 | | 11,054 | |
2.40%, 3/20/34 | | 410,000 | | 3,938 | |
2.50%, 9/20/36 | | 230,000 | | 2,248 | |
Japan Finance Organization for Municipal Enterprises, | | | | | |
1.55%, 2/21/12 | | 470,000 | | 4,503 | |
Sharp Corp. (Convertible), Zero Coupon, 9/30/13 | | 67,000 | | 582 | |
| | | | 47,881 | |
| | | | | | |
78 | The accompanying notes are an integral part of the financial statements. |
| 2008 Annual Report |
| |
| September 30, 2008 |
Portfolio of Investments (cont’d)
International Fixed Income Portfolio
| | Face | | | |
| | Amount | | Value | |
| | (000) | | (000) | |
Luxembourg (0.7%) | | | | | |
Fiat Finance & Trade Ltd., | | | | | |
6.63%, 2/15/13 | EUR | 300 | | $ | 386 | |
Gaz Capital S.A., | | | | | |
4.56%, 12/9/12 | | 170 | | 196 | |
LyondellBasell Industries AF SCA, | | | | | |
8.38%, 8/15/15 | | 100 | | 64 | |
Telecom Italia Finance S.A., | | | | | |
7.75%, 1/24/33 | | 315 | | 420 | |
Wind Acquisition Finance S.A., | | | | | |
9.75%, 12/1/15 | | 150 | | 192 | |
| | | | 1,258 | |
Mexico (1.0%) | | | | | |
Mexican Bonos, | | | | | |
9.50%, 12/18/14 | MXN | 19,000 | | 1,832 | |
Multi-Country (5.0%) | | | | | |
European Investment Bank, | | | | | |
1.25%, 9/20/12 | JPY | 390,000 | | 3,689 | |
2.15%, 1/18/27 | | 40,000 | | 381 | |
Inter-American Development Bank, | | | | | |
1.90%, 7/8/09 | | 545,000 | | 5,163 | |
| | | | 9,233 | |
Netherlands (5.1%) | | | | | |
ABN Amro Bank N.V. (Convertible), | | | | | |
1.88%, 10/27/10 | EUR | 250 | | 326 | |
Government of Netherlands, | | | | | |
4.00%, 1/15/37 | | 4,600 | | 5,761 | |
5.00%, 7/15/12 | | 1,600 | | 2,337 | |
Impress Holdings B.V., | | | | | |
7.87%, 9/15/13(h) | | 155 | | 191 | |
Linde Finance B.V., | | | | | |
4.75%, 4/24/17 | | 300 | | 382 | |
OI European Group B.V., | | | | | |
6.88%, 3/31/17 | | 150 | | 182 | |
Telefonica Europe B.V., | | | | | |
5.88%, 2/14/33 | | 320 | | 414 | |
| | | | 9,593 | |
Norway (1.1%) | | | | | |
DnB NOR Bank ASA, | | | | | |
5.88%, 6/20/13 | | 200 | | 284 | |
Kingdom of Norway, | | | | | |
6.50%, 5/15/13 | NOK | 9,400 | | 1,741 | |
| | | | 2,025 | |
Poland (0.9%) | | | | | |
Government of Poland, | | | | | |
5.25%, 10/25/17 | PLN | 4,100 | | 1,633 | |
Spain (2.7%) | | | | | |
Government of Spain, | | | | | |
5.15%, 7/30/09 | EUR | — | @ | — | @ |
5.40%, 7/30/11 | | 3,500 | | 5,100 | |
| | | | 5,100 | |
Sweden (0.7%) | | | | | |
Government of Sweden, | | | | | |
4.50%, 8/12/15 | SEK | 5,700 | | 859 | |
Stena AB, | | | | | |
6.13%, 2/1/17 | EUR | 150 | | 155 | |
Telefonaktiebolaget LM Ericsson, | | | | | |
6.75%, 11/28/10 | | 230 | | 326 | |
| | | | 1,340 | |
United Kingdom (8.0%) | | | | | |
Allied Domecq Financial Services plc, | | | | | |
6.63%, 4/18/11 | GBP | 190 | | 327 | |
ASIF III (Jersey) Ltd., | | | | | |
4.75%, 9/11/13 | EUR | 100 | | 106 | |
BAA Funding Ltd., | | | | | |
4.60%, 2/15/20(e)(h) | | 400 | | 461 | |
BAT International Finance plc, | | | | | |
5.38%, 6/29/17 | | 750 | | 951 | |
British Telecommunications plc, | | | | | |
7.38%, 2/15/11 | | 175 | | 255 | |
Credit Agricole S.A. (London), | | | | | |
6.00%, 6/24/13 | | 200 | | 284 | |
FCE Bank plc, | | | | | |
7.13%, 1/15/13 | | 300 | | 277 | |
Imperial Tobacco Finance plc, | | | | | |
4.38%, 11/22/13 | | 500 | | 616 | |
JTI UK Finance plc, | | | | | |
4.50%, 4/2/14 | | 600 | | 801 | |
National Grid Gas plc, | | | | | |
5.13%, 5/14/13 | | 450 | | 626 | |
Rexam plc, | | | | | |
6.75%, 6/29/67(h) | | 400 | | 376 | |
United Kingdom Treasury Bond, | | | | | |
4.00%, 9/7/16 | GBP | | 3,700 | | 6,450 | |
4.25%, 6/7/32 | | 1,200 | | 2,013 | |
4.75%, 6/7/10 | | 800 | | 1,439 | |
| | | | 14,982 | |
United States (2.3%) | | | | | |
C10 - EUR Capital SPV Ltd. BVI, | | | | | |
6.28%(h)(o) | EUR | | 315 | | 325 | |
Chesapeake Energy Corp., | | | | | |
6.25%, 1/15/17 | | 80 | | 97 | |
Countrywide Financial Corp., | | | | | |
5.26%, 11/23/10(h) | | 400 | | 519 | |
General Motors Acceptance Corp., | | | | | |
5.38%, 6/6/11 | | 370 | | 224 | |
Goldman Sachs Group, Inc. (The), | | | | | |
5.31%, 5/23/16(h) | | 350 | | 341 | |
Procter & Gamble Co., | | | | | |
4.50%, 5/12/14 | | 700 | | 939 | |
| | | | | | | |
The accompanying notes are an integral part of the financial statements. | 79 |
2008 Annual Report
September 30, 2008
Portfolio of Investments (cont’d)
International Fixed Income Portfolio
| | Face | | | |
| | Amount | | Value | |
| | (000) | | (000) | |
United States (cont’d) | | | | | |
WM Covered Bond Program, | | | | | |
3.88%, 9/27/11 | EUR | | 1,500 | | $ 1,872 | |
| | | | 4,317 | |
Total Fixed Income Securities (Cost $175,936) | | | | 177,412 | |
| | Shares | | | |
Short-Term Investment (4.0%) | | | | | |
Investment Company (4.0%) | | | | | |
Morgan Stanley Institutional Liquidity Money Market Portfolio — Institutional Class
(Cost $7,498)(p) | | 7,498,237 | | 7,498 | |
Total Investments (99.0%) (Cost $183,434) | | | | 184,910 | |
Other Assets in Excess of Liabilities (1.0%) | | | | 1,907 | |
Net Assets (100%) | | | | $186,817 | |
| | | | | | |
(e) | 144A security — Certain conditions for public sale may exist. Unless otherwise noted, these securities are deemed to be liquid. |
(h) | Variable/Floating Rate Security — Interest rate changes on these instruments are based on changes in a designated rate. The rates shown are those in effect on September 30, 2008. |
(o) | Perpetual — Security does not have a predetermined maturity date. Rate for this security is fixed for a period of time then reverts to floating rate. The interest shown is the rate in effect at September 30, 2008. |
(p) | See Note G within the Notes to Financial Statements regarding investment in Morgan Stanley Institutional Liquidity Money Market Portfolio — Institutional Class. |
@ | Face Amount/Value is less than $500. |
Foreign Currency Exchange Contract Information:
The Portfolio had the following foreign currency exchange contract(s) open at period end:
Currency
to
Deliver
(000) | | Value
(000) | | Settlement
Date | | In
Exchange
For
(000) | | Value
(000) | | Net
Unrealized
Appreciation
(Depreciation)
(000) | |
| | | | | | | |
ARS | 1,125 | | $ 355 | | 10/22/08 | | USD | 358 | | $ 358 | | $ 3 | |
AUD | 1,025 | | 809 | | 10/10/08 | | USD | 951 | | 951 | | 142 | |
AUD | 625 | | 494 | | 10/10/08 | | USD | 588 | | 588 | | 94 | |
AUD | 1,550 | | 1,225 | | 10/10/08 | | USD | 1,418 | | 1,418 | | 193 | |
AUD | 350 | | 277 | | 10/10/08 | | USD | 290 | | 290 | | 13 | |
BRL | 2,800 | | 1,465 | | 10/22/08 | | USD | 1,700 | | 1,700 | | 235 | |
BRL | 1,625 | | 850 | | 10/22/08 | | USD | 977 | | 977 | | 127 | |
CAD | 5,340 | | 5,020 | | 10/10/08 | | USD | 5,253 | | 5,253 | | 233 | |
CHF | 425 | | 378 | | 10/14/08 | | USD | 411 | | 411 | | 33 | |
DKK | 4,600 | | 869 | | 10/14/08 | | USD | 964 | | 964 | | 95 | |
EUR | 491 | | 691 | | 10/3/08 | | USD | 691 | | 691 | | — | @ |
EUR | 550 | | 777 | | 11/18/08 | | USD | 779 | | 779 | | 2 | |
EUR | 350 | | 494 | | 11/18/08 | | USD | 486 | | 486 | | (8 | ) |
EUR | 675 | | 954 | | 11/18/08 | | USD | 938 | | 938 | | (16 | ) |
EUR | 600 | | 847 | | 11/18/08 | | USD | 880 | | 880 | | 33 | |
EUR | 715 | | 1,009 | | 11/18/08 | | USD | 1,048 | | 1,048 | | 39 | |
EUR | 1,275 | | 1,801 | | 11/18/08 | | USD | 1,865 | | 1,865 | | 64 | |
EUR | 675 | | 954 | | 11/18/08 | | USD | 986 | | 986 | | 32 | |
EUR | 2,000 | | 2,825 | | 11/18/08 | | USD | 3,084 | | 3,084 | | 259 | |
EUR | 675 | | 954 | | 11/18/08 | | USD | 981 | | 981 | | 27 | |
EUR | 1,350 | | 1,906 | | 12/16/08 | | USD | 1,931 | | 1,931 | | 25 | |
GBP | 375 | | 667 | | 10/20/08 | | USD | 667 | | 667 | | — | @ |
GBP | 425 | | 757 | | 10/20/08 | | USD | 812 | | 812 | | 55 | |
GBP | 425 | | 756 | | 10/20/08 | | USD | 835 | | 835 | | 79 | |
GBP | 100 | | 178 | | 10/20/08 | | USD | 198 | | 198 | | 20 | |
HUF | 77,975 | | 452 | | 11/18/08 | | USD | 487 | | 487 | | 35 | |
JPY | 18,721 | | 176 | | 10/2/08 | | USD | 178 | | 178 | | 2 | |
JPY | 40,000 | | 380 | | 12/16/08 | | USD | 380 | | 380 | | — | @ |
JPY | 50,000 | | 475 | | 12/16/08 | | USD | 471 | | 471 | | (4 | ) |
JPY | 40,000 | | 380 | | 12/16/08 | | USD | 379 | | 379 | | (1 | ) |
MXN | 14,200 | | 1,298 | | 10/10/08 | | USD | 1,317 | | 1,317 | | 19 | |
NOK | 2,200 | | 374 | | 10/10/08 | | USD | 417 | | 417 | | 43 | |
NOK | 5,500 | | 936 | | 10/14/08 | | USD | 940 | | 940 | | 4 | |
PLN | 3,850 | | 1,596 | | 11/18/08 | | USD | 1,680 | | 1,680 | | 84 | |
PLN | 1,175 | | 487 | | 11/18/08 | | USD | 516 | | 516 | | 29 | |
PLN | 1,200 | | 498 | | 11/18/08 | | USD | 497 | | 497 | | (1 | ) |
PLN | 2,350 | | 974 | | 11/18/08 | | USD | 953 | | 953 | | (21 | ) |
RUB | 9,700 | | 377 | | 10/22/08 | | USD | 389 | | 389 | | 12 | |
RUB | 43,800 | | 1,702 | | 10/22/08 | | USD | 1,769 | | 1,769 | | 67 | |
SEK | 2,575 | | 372 | | 10/14/08 | | USD | 378 | | 378 | | 6 | |
SEK | 2,575 | | 372 | | 10/14/08 | | USD | 383 | | 383 | | 11 | |
SEK | 3,535 | | 510 | | 10/14/08 | | USD | 540 | | 540 | | 30 | |
SGD | 1,275 | | 891 | | 12/16/08 | | USD | 896 | | 896 | | 5 | |
TWD | 12,750 | | 396 | | 10/22/08 | | USD | 421 | | 421 | | 25 | |
TWD | 25,250 | | 783 | | 10/22/08 | | USD | 827 | | 827 | | 44 | |
| | | | | | | | | | | | | | | | |
80 | The accompanying notes are an integral part of the financial statements. |
| 2008 Annual Report |
| |
| September 30, 2008 |
Portfolio of Investments (cont’d)
International Fixed Income Portfolio
Foreign Currency Exchange Contract Information: (cont’d)
The Portfolio had the following foreign currency exchange contract(s) open at period end:
Currency
to
Deliver
(000) | | Value
(000) | | Settlement
Date | | In
Exchange
For
(000) | | Value
(000) | | Net
Unrealized
Appreciation
(Depreciation)
(000) | |
| | | | | | | | |
TWD | 32,400 | | $ 1,006 | | 10/22/08 | | USD | 1,057 | | $ 1,057 | | $ 51 | |
USD | 366 | | 366 | | 10/22/08 | | ARS | 1,125 | | 355 | | (11 | ) |
USD | 1,791 | | 1,791 | | 10/10/08 | | AUD | 2,125 | | 1,679 | | (112 | ) |
USD | 847 | | 847 | | 10/22/08 | | BRL | 1,400 | | 733 | | (114 | ) |
USD | 1,736 | | 1,736 | | 10/10/08 | | CAD | 1,800 | | 1,691 | | (45 | ) |
USD | 1,497 | | 1,497 | | 10/14/08 | | CHF | 1,540 | | 1,372 | | (125 | ) |
USD | 109 | | 109 | | 10/1/08 | | EUR | 76 | | 107 | | (2 | ) |
USD | 1,940 | | 1,940 | | 10/2/08 | | EUR | 1,360 | | 1,915 | | (25 | ) |
USD | 477 | | 477 | | 11/18/08 | | EUR | 325 | | 459 | | (18 | ) |
USD | 1,765 | | 1,765 | | 11/18/08 | | EUR | 1,200 | | 1,695 | | (70 | ) |
USD | 1,774 | | 1,774 | | 11/18/08 | | EUR | 1,250 | | 1,765 | | (9 | ) |
USD | 389 | | 389 | | 11/18/08 | | EUR | 275 | | 388 | | (1 | ) |
USD | 960 | | 960 | | 11/18/08 | | EUR | 650 | | 918 | | (42 | ) |
USD | 277 | | 277 | | 11/18/08 | | EUR | 200 | | 282 | | 5 | |
USD | 1,453 | | 1,453 | | 11/18/08 | | EUR | 1,025 | | 1,447 | | (6 | ) |
USD | 4,117 | | 4,117 | | 11/18/08 | | EUR | 2,900 | | 4,095 | | (22 | ) |
USD | 1,994 | | 1,994 | | 11/18/08 | | EUR | 1,350 | | 1,906 | | (88 | ) |
USD | 329 | | 329 | | 11/18/08 | | EUR | 225 | | 318 | | (11 | ) |
USD | 730 | | 730 | | 11/18/08 | | EUR | 500 | | 706 | | (24 | ) |
USD | 288 | | 288 | | 11/18/08 | | EUR | 200 | | 282 | | (6 | ) |
USD | 951 | | 951 | | 11/18/08 | | EUR | 650 | | 918 | | (33 | ) |
USD | 4,523 | | 4,523 | | 11/18/08 | | EUR | 2,950 | | 4,166 | | (357 | ) |
USD | 770 | | 770 | | 11/18/08 | | EUR | 525 | | 741 | | (29 | ) |
USD | 961 | | 961 | | 10/20/08 | | GBP | 550 | | 978 | | 17 | |
USD | 986 | | 986 | | 10/20/08 | | GBP | 550 | | 978 | | (8 | ) |
USD | 602 | | 602 | | 10/20/08 | | GBP | 325 | | 578 | | (24 | ) |
USD | 775 | | 775 | | 10/20/08 | | GBP | 425 | | 756 | | (19 | ) |
USD | 469 | | 469 | | 11/18/08 | | HUF | 77,975 | | 452 | | (17 | ) |
USD | 3,933 | | 3,933 | | 12/16/08 | | JPY | 420,000 | | 3,993 | | 60 | |
USD | 1,431 | | 1,431 | | 12/16/08 | | JPY | 150,000 | | 1,426 | | (5 | ) |
USD | 192 | | 192 | | 12/16/08 | | JPY | 20,000 | | 190 | | (2 | ) |
USD | 211 | | 211 | | 10/10/08 | | MXN | 2,200 | | 201 | | (10 | ) |
USD | 1,037 | | 1,037 | | 10/10/08 | | MXN | 10,850 | | 991 | | (46 | ) |
USD | 89 | | 89 | | 10/10/08 | | MXN | 925 | | 85 | | (4 | ) |
USD | 1,035 | | 1,035 | | 10/22/08 | | MYR | 3,375 | | 983 | | (52 | ) |
USD | 3,517 | | 3,517 | | 10/14/08 | | NOK | 17,980 | | 3,058 | | (459 | ) |
USD | 4,811 | | 4,811 | | 11/18/08 | | PLN | 10,225 | | 4,239 | | (572 | ) |
USD | 589 | | 589 | | 11/18/08 | | PLN | 1,325 | | 549 | | (40 | ) |
USD | 2,264 | | 2,264 | | 10/22/08 | | RUB | 53,500 | | 2,079 | | (185 | ) |
USD | 587 | | 587 | | 10/14/08 | | SEK | 3,535 | | 511 | | (76 | ) |
USD | 1,656 | | 1,656 | | 12/16/08 | | SGD | 2,365 | | 1,652 | | (4 | ) |
USD | 2,337 | | | 2,337 | | 10/22/08 | | TWD | 70,400 | | | 2,185 | | | (152 | ) |
| | | $98,312 | | | | | | | $97,788 | | | $(524 | ) |
| | | | | | | | | | | | | | | | | | | |
| |
ARS | — Argentina Peso |
AUD | — Australian Dollar |
BRL | — Brazilian Real |
CAD | — Canadian Dollar |
CHF | — Swiss Franc |
DKK | — Denmark Krone |
EUR | — Euro |
GBP | — British Pound |
HUF | — Hungary Forint |
JPY | — Japanese Yen |
MXN | — Mexican Peso |
MYR | — Malaysian Ringgit |
NOK | — Norwegian Krone |
PLN | — Polish Zloty |
RUB | — Russian Ruble |
SEK | — Swedish Krona |
SGD | — Singapore Dollar |
TWD | — Taiwan Dollar |
USD | — United States Dollar |
Futures Contracts:
The Portfolio had the following futures contract(s) open at period end:
| | Number
of
Contracts | | Value
(000) | | Expiration
Date | | Net Unrealized
Appreciation
(Depreciation)
(000) | |
Long: | | | | | | |
Euro-Bobl | | 7 | | $1,081 | | Dec-08 | | $10 | |
Euro-Schatz | | 50 | | 7,347 | | Dec-08 | | 56 | |
British Pound Long Gilt | | 28 | | 5,583 | | Dec-08 | | | 4 | |
| | | | | | | | | $70 | |
| | | | | | | | | |
| | | | | | | | | | | | | |
The accompanying notes are an integral part of the financial statements. | 81 |
2008 Annual Report
September 30, 2008
Investment Overview (unaudited)
Investment Grade Fixed Income Portfolio
The Investment Grade Fixed Income Portfolio seeks above-average total return over a market cycle of three to five years. The Portfolio invests primarily in a diversified mix of U.S. dollar-denominated fixed income securities, particularly U.S. government, corporate and mortgage securities. The Portfolio may also invest in securities of foreign issuers, including issuers located in emerging market countries. The securities in which the Portfolio may invest will be denominated in U.S. dollars. The Portfolio will ordinarily seek to maintain an average weighted maturity between five and ten years. Although there is no minimum or maximum maturity for any individual security, the Adviser actively manages the interest rate risk of the Portfolio within a range relative to its benchmark. The Portfolio invests exclusively in securities that carry an investment grade rating or, if unrated, are determined to be of a comparable quality by the Adviser, at the time of purchase. The Portfolio may invest in securities of foreign issuers, including issuers located in emerging market countries. The Portfolio may invest in TBAs. The Portfolio may invest in asset-backed securities and may use futures, options, forwards, CMOs, swaps, options on swaps and other derivatives.
Performance
For the fiscal year ended September 30, 2008, the Portfolio’s Class I had a total return based on net asset value and reinvestment of distributions per share of -9.37%, net of fees. The Portfolio’s Class I underperformed against its benchmark the Lehman Brothers U.S. Aggregate Index (the “Index”) which returned 3.65%.
Factors Affecting Performance
· The financial markets were under pressure throughout the period amid disrupted credit markets, ongoing deterioration of the housing market, losses in the financial sector, and growing fears of recession.
· The third quarter of 2008, however, will most certainly go down as a defining moment in the history of the financial industry. Investor confidence plummeted and credit markets seized as several venerable financial institutions were forced into mergers or dissolved entirely in September, resulting in significant price erosion across all but the U.S. Treasury sector.
· The primary detractor from the Portfolio’s relative performance was an overweight to non-agency mortgage securities as spreads in the sector moved wider over the course of the reporting period.
· An underweight to corporate credits for much of the period, however, was additive to relative performance as credit spreads significantly widened, particularly in the financial sector.
· Yield-curve positioning was also beneficial to performance as it enabled the Portfolio to benefit from the steepening of the yield curve that occurred during the reporting year.
Management Strategies
· The Portfolio maintained a neutral exposure to agency mortgage-backed securities and an overweight to non-agency mortgage-backed securities. The specific non-agency issues held in the Portfolio are backed primarily by Alt-A borrowers (those who have relatively strong credit but are not considered “prime” borrowers) and are concentrated in the senior and middle tranches of the capital structure. Given our expectations that the housing market situation may take some time to work itself out and therefore, these securities would continue to add volatility, we began reducing the Portfolio’s exposure to non-agency mortgage-backed securities in the third quarter of 2008.
· With regard to yield-curve positioning, we underweighted longer-dated issues and overweighted intermediate-dated issues in the first half of 2008, a strategy that helped enhance returns as the spread between intermediate-and long-dated yields widened and the curve steepened. This trade was removed during the third quarter of the year and as a result, the Portfolio held a neutral duration, or interest-rate sensitivity, at the end of the period.
· During 2007 and into the first quarter of 2008, we maintained an underweight allocation to corporate credits with an emphasis on high-quality names. In response to sharp spread widening later in the period, this position was brought to a neutral stance.
82
| 2008 Annual Report |
| |
| September 30, 2008 |
Investment Overview (cont’d)
Investment Grade Fixed Income Portfolio
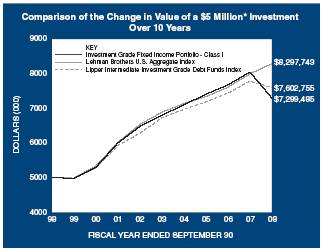
* Minimum Investment
In accordance with SEC regulations, the Portfolio’s performance shown assumes that all recurring fees (including management fees) were deducted and all dividends and distributions were reinvested. The performance of Class P, Class H and Class L shares will vary from the Class I shares based upon their different inception dates and will be negatively impacted by additional fees assessed to those classes.
Performance Compared to the Lehman Brothers U.S. Aggregate Index(1) and Lipper Intermediate Investment Grade Debt Funds Index(2)
| | Total Returns(3) | |
| | | | Average Annual | |
| | One | | Five | | Ten | | Since | |
| | Year | | Years | | Years | | Inception(8) | |
Portfolio – Class I (4) | | (9.37 | )% | 1.41 | % | 3.86 | % | 6.55 | % | |
Lehman Brothers U.S. Aggregate Index | | 3.65 | | 3.78 | | 5.20 | | 7.01 | | |
Lipper Intermediate Investment Grade Debt Funds Index | | (2.43 | ) | 2.46 | | 4.28 | | 6.19 | | |
| | | | | | | | | | |
Portfolio – Class P (5) | | (9.60 | ) | 1.22 | | — | | 2.40 | | |
Lehman Brothers U.S. Aggregate Index | | 3.65 | | 3.78 | | — | | 4.83 | | |
Lipper Intermediate Investment Grade Debt Funds Index | | (2.43 | ) | 2.46 | | — | | 3.72 | | |
| | | | | | | | Cumulative | |
| | | | | | | | Since | |
| | | | | | | | Inception(8) | |
Portfolio – Class H w/o sales charges (6) | | — | | — | | — | | (13.21 | ) | |
Portfolio – Class H with maximum 3.50% sales charges (6) | | — | | — | | — | | (16.21 | ) | |
Lehman Brothers U.S. Aggregate Index | | — | | — | | — | | (0.02 | ) | |
Lipper Intermediate Investment Grade Debt Funds Index | | — | | — | | — | | (5.03 | ) | |
| | | | | | | | | | |
Portfolio – Class L (7) | | — | | — | | — | | (4.73 | ) | |
Lehman Brothers U.S. Aggregate Index | | — | | — | | — | | 0.73 | | |
Lipper Intermediate Investment Grade Debt Funds Index | | — | | — | | — | | (2.72 | ) | |
Performance data quoted represents past performance, which is no guarantee of future results, and current performance may be lower or higher than the figures shown. Performance assumes that all dividends and distributions, if any, were reinvested. For the most recent month-end performance figures, please visit www.morganstanley.com/msim. Investment returns and principal value will fluctuate so that Portfolio shares, when redeemed, may be worth more or less than their original cost. Total returns do not reflect the deduction of taxes that a shareholder would pay on Portfolio distributions or the redemption of Portfolio shares. Performance of share classes will vary due to differences in sales charges and expenses.
(1) | The Lehman Brothers U.S. Aggregate Index tracks the performance of all U.S. government agency and Treasury securities, investment-grade corporate debt securities, agency mortgage-backed securities, asset-backed securities and commercial mortgage-backed securities. The Index is unmanaged and its returns do not include any sales charges or fees. Such costs would lower performance. It is not possible to invest directly in an index. |
(2) | The Lipper Intermediate Investment Grade Debt Funds Index is an equally weighted performance index of the largest qualifying funds (based on net assets) in the Lipper Intermediate Investment Grade Debt Funds classification. The Index, which is adjusted for capital gains distributions and income dividends, is unmanaged and should not be considered an investment. There are currently 30 funds represented in this Index. As of the date of this report, the Portfolio was in the Lipper Intermediate Investment Grade Debt Funds classification. |
(3) | Total returns for the Portfolio reflect expenses waived and/or reimbursed, if applicable, by the Adviser and Distributor. Without such waivers and/or reimbursements, total returns would have been lower. Fee waivers and/or reimbursements are voluntary and the Adviser and Distributor reserve the right to commence or terminate any waiver and/or reimbursement at any time. Returns for periods less than one year are not annualized. |
(4) | Commenced operations on August 31, 1990. |
(5) | Commenced operations on May 20, 2002. |
(6) | Commenced operations on January 2, 2008. |
(7) | Commenced operations on June 16, 2008. |
(8) | For comparative purposes, average annual and cumulative since inception returns listed for the Indexes refer to the inception date or initial offering of the respective share class of the Portfolio, not the inception of the Indexes. |
Portfolio Composition*
| | Percentage of | |
Classification | | Total Investments | |
| | |
Agency Fixed Rate Mortgages | | 44.3 | % |
Asset Backed Corporates | | 12.6 | |
Industrials | | 9.5 | |
Finance | | 6.1 | |
Other** | | 15.5 | |
Short-Term Investments | | | 12.0 | |
Total Investments | | | 100.0 | % |
| | | | | |
* | Percentages indicated are based upon total investments (excluding Securities held as collateral on Loaned Securities) as of September 30, 2008. |
** | Industries and/or investment types which do not appear in the above table, as well as those which represent less than 5% of total investments, if applicable, are included in the category labeled “Other”. |
83
2008 Annual Report
September 30, 2008
Portfolio of Investments
Investment Grade Fixed Income Portfolio
| | Face | | | |
| | Amount | | Value | |
| | (000) | | (000) | |
Fixed Income Securities (112.7%) | | | | | |
Agency Adjustable Rate Mortgages (5.7%) | | | | | |
Federal Home Loan Mortgage Corp., | | | | | |
Conventional Pools: | | | | | |
4.75%, 7/1/35 | | $ | 1,909 | | $ | 1,903 | |
5.54%, 4/1/37 | | 2,037 | | 2,070 | |
5.70%, 1/1/37 | | 2,872 | | 2,914 | |
5.86%, 10/1/36 | | 1,933 | | 1,982 | |
5.97%, 1/1/37 | | 1,163 | | 1,190 | |
Federal National Mortgage Association, | | | | | |
Conventional Pools: | | | | | |
5.28%, 5/1/36 | | 2,192 | | 2,230 | |
5.34%, 7/1/36 | | 2,180 | | 2,220 | |
5.36%, 8/1/36 | | 1,609 | | 1,640 | |
Government National Mortgage Association, | | | | | |
Various Pools: | | | | | |
5.13%, 11/20/25 - 12/20/27 | | 346 | | 351 | |
5.38%, 2/20/25 - 2/20/28 | | 1,453 | | 1,472 | |
5.63%, 7/20/25 | | 28 | | 28 | |
| | | | 18,000 | |
Agency Fixed Rate Mortgages (56.7%) | | | | | |
Federal Home Loan Bank, | | | | | |
5.00%, 11/17/17(c) | | 2,100 | | 2,120 | |
Federal Home Loan Mortgage Corp., | | | | | |
Conventional Pools: | | | | | |
5.13%, 11/17/17(c) | | 4,700 | | 4,852 | |
5.50%, 8/23/17(c) | | 2,750 | | 2,915 | |
10.00%, 9/1/17 - 11/1/20 | | 23 | | 25 | |
10.25%, 7/1/09 | | — | @ | — | @ |
11.00%, 1/1/16 | | 7 | | 8 | |
13.00%, 9/1/10 | | — | @ | — | @ |
Gold Pools: | | | | | |
5.50%, 5/1/37 - 10/1/37 | | 23,874 | | 23,769 | |
6.00%, 2/1/32 - 9/1/37 | | 10,407 | | 10,547 | |
6.50%, 7/1/25 - 3/1/32 | | 348 | | 362 | |
7.00%, 2/1/26 | | 21 | | 22 | |
7.50%, 5/1/16 - 6/1/32 | | 2,756 | | 2,986 | |
8.00%, 11/1/29 - 10/1/31 | | 435 | | 472 | |
8.50%, 12/1/30 | | 94 | | 104 | |
10.00%, 10/1/19 - 1/1/21 | | 44 | | 50 | |
10.50%, 3/1/16 | | 18 | | 21 | |
October TBA: | | | | | |
5.50%, 10/15/38(i) | | 13,300 | | 13,232 | |
6.00%, 10/15/38(i) | | 26,350 | | 26,675 | |
6.50%, 10/15/49(i) | | 4,100 | | 4,204 | |
Federal National Mortgage Association, | | | | | |
Conventional Pools: | | | | | |
5.00%, 5/11/17 - 10/1/37 | | 9,675 | | 9,597 | |
6.00%, 10/1/31 - 12/1/31 | | 117 | | 119 | |
6.50%, 6/1/26 - 9/1/32 | | 1,177 | | 1,217 | |
7.00%, 11/1/25 - 12/1/34 | | 16,658 | | 17,497 | |
7.50%, 5/1/23 - 9/1/35 | | 4,659 | | 5,034 | |
8.00%, 2/1/12 - 4/1/32 | | 2,122 | | 2,298 | |
8.50%, 4/1/30 - 5/1/32 | | 1,862 | | 2,054 | |
9.00%, 2/1/17 | | 64 | | 70 | |
9.50%, 8/1/22 | | 77 | | 85 | |
10.00%, 5/1/22 | | 79 | | 88 | |
10.50%, 12/1/17 - 10/1/18 | | 25 | | 29 | |
11.00%, 4/1/21 | | 13 | | 14 | |
11.25%, 8/1/13 | | 11 | | 12 | |
11.50%, 1/1/17 - 11/1/19 | | 19 | | 21 | |
October TBA: | | | | | |
4.50%, 10/25/23(i) | | 9,800 | | 9,552 | |
5.00%, 10/25/23 - 10/25/38(i) | | 16,225 | | 15,985 | |
5.50%, 10/25/38(i) | | 3,988 | | 3,977 | |
6.00%, 10/15/37(i) | | 950 | | 962 | |
6.50%, 10/25/38(i) | | 13,868 | | 14,222 | |
7.00%, 10/25/38(i) | | 3,000 | | 3,135 | |
Government National Mortgage Association, | | | | | |
Various Pools: | | | | | |
9.00%, 11/15/17 | | 139 | | 152 | |
9.50%, 12/15/17 - 9/15/22 | | 535 | | 592 | |
10.00%, 11/15/09 - 2/15/25 | | 850 | | 963 | |
10.50%, 3/15/19 | | 3 | | 4 | |
11.00%, 3/15/10 - 2/15/16 | | 109 | | 125 | |
11.50%, 1/20/18 | | 2 | | 2 | |
| | | | 180,170 | |
Asset Backed Corporates (16.2%) | | | | | |
Argent Securities, Inc., | | | | | |
3.26%, 10/25/36(h) | | 1,061 | | 1,038 | |
Bear Stearns Asset Backed Securities Trust, | | | | | |
3.31%, 1/25/37(h) | | 1,061 | | 976 | |
Capital Auto Receivables Asset Trust, | | | | | |
2.50%, 4/15/11(h) | | 2,500 | | 2,438 | |
2.55%, 7/15/10(h) | | 3,550 | | 3,513 | |
4.98%, 5/15/11 | | 2,824 | | 2,795 | |
5.31%, 10/20/09(e) | | 995 | | 995 | |
Capital One Auto Finance Trust, | | | | | |
5.07%, 7/15/11 | | 994 | | 969 | |
Carrington Mortgage Loan Trust, | | | | | |
3.33%, 2/25/35(h) | | 1,676 | | 1,603 | |
Caterpillar Financial Asset Trust, | | | | | |
5.57%, 5/25/10 | | 731 | | 734 | |
Citibank Credit Card Issuance Trust, | | | | | |
3.19%, 3/22/12(h) | | 1,775 | | 1,731 | |
CNH Equipment Trust, | | | | | |
5.20%, 6/15/10 | | 542 | | 543 | |
Countrywide Asset Backed Certificates, | | | | | |
3.36%, 5/25/36(h) | | 200 | | 198 | |
First Franklin Mortgage Loan Asset Backed Certificates, | | | | | |
3.26%, 7/25/36(h) | | 483 | | 478 | |
Ford Credit Auto Owner Trust, | | | | | |
2.50%, 4/15/10(h) | | 2,458 | | 2,452 | |
5.05%, 3/15/10 | | 372 | | 372 | |
5.26%, 10/15/10 | | 2,829 | | 2,835 | |
| | | | | | | |
84 | The accompanying notes are an integral part of the financial statements. |
| 2008 Annual Report |
| |
| September 30, 2008 |
Portfolio of Investments (cont’d)
Investment Grade Fixed Income Portfolio
| | Face | | | |
| | Amount | | Value | |
| | (000) | | (000) | |
Asset Backed Corporates (cont’d) | | | | | |
Fremont Home Loan Owner Trust, | | | | | |
3.26%, 10/25/36(h) | | $ | 1,670 | | $ | 1,597 | |
GE Equipment Small Ticket LLC, | | | | | |
4.88%, 10/22/09(e) | | 294 | | 294 | |
GS Auto Loan Trust, | | | | | |
5.37%, 12/15/10 | | 1,842 | | 1,845 | |
GSAMP Trust, | | | | | |
3.28%, 1/25/37(h) | | 912 | | 861 | |
3.33%, 3/25/47(h) | | 1,761 | | 1,652 | |
Harley-Davidson Motorcycle Trust, | | | | | |
3.76%, 12/17/12 | | 2,093 | | 1,962 | |
4.07%, 2/15/12 | | 1,446 | | 1,439 | |
Hertz Vehicle Financing LLC, | | | | | |
4.93%, 2/25/10(e) | | 1,521 | | 1,497 | |
Honda Auto Receivables Owner Trust, | | | | | |
4.85%, 10/19/09 | | 222 | | 222 | |
Hyundai Auto Receivables Trust, | | | | | |
3.98%, 11/16/09 | | 3 | | 3 | |
Indymac Residential Asset Backed Trust, | | | | | |
3.34%, 4/25/37(h) | | 1,206 | | 1,162 | |
MBNA Master Credit Card Trust, | | | | | |
7.80%, 10/15/12 | | 2,715 | | 2,840 | |
National City Auto Receivables Trust, | | | | | |
2.88%, 5/15/11 | | 398 | | 398 | |
Residential Asset Mortgage Products, Inc., | | | | | |
3.28%, 8/25/36(h) | | 736 | | 720 | |
3.30%, 10/25/36(h) | | 758 | | 716 | |
Residential Asset Securities Corp., | | | | | |
3.32%, 2/25/30(h) | | 1,358 | | 1,296 | |
Securitized Asset Backed Receivables LLC Trust, | | | | | |
3.32%, 2/25/37(h) | | 1,976 | | 1,845 | |
3.34%, 5/25/37(h) | | 1,779 | | 1,564 | |
SLM Student Loan Trust, | | | | | |
2.79%, 10/27/14(h) | | 1,279 | | 1,266 | |
Soundview Home Equity Loan Trust, | | | | | |
3.32%, 2/25/37(h) | | 1,813 | | 1,679 | |
Structured Asset Securities Corp., | | | | | |
3.30%, 6/25/37(h) | | 2,007 | | 1,824 | |
Terwin Mortgage Trust, | | | | | |
3.68%, 12/25/34(h) | | 410 | | 290 | |
TXU Electric Delivery Transition Bond Co. LLC, | | | | | |
4.81%, 11/17/14 | | 700 | | 708 | |
| | | | 51,350 | |
Collateralized Mortgage Obligations — Agency Collateral Series (1.3%) | | | | | |
Federal Home Loan Mortgage Corp., | | | | | |
Inv Fl IO REMIC | | | | | |
3.50%, 3/15/24 | | 2,024 | | 135 | |
5.51%, 3/15/32 | | 402 | | 38 | |
IO | | | | | |
6.00%, 5/1/31 | | 818 | | 166 | |
6.50%, 4/1/28 | | 735 | | 195 | |
8.00%, 1/1/28 - 6/1/31 | | 154 | | 41 | |
IO PAC REMIC | | | | | |
6.00%, 4/15/32 | | 1,042 | | 86 | |
IO REMIC | | | | | |
6.50%, 5/15/33 | | 782 | | 153 | |
PAC REMIC | | | | | |
10.00%, 6/15/20 | | 9 | | 10 | |
Federal National Mortgage Association, | | | | | |
Inv Fl IO REMIC | | | | | |
4.99%, 10/25/28 | | 239 | | 11 | |
5.34%, 10/25/30 | | 168 | | 15 | |
5.72%, 5/18/27 | | 580 | | 72 | |
IO | | | | | |
7.50%, 11/1/29 | | 807 | | 231 | |
8.00%, 4/1/24 - 12/1/31 | | 637 | | 160 | |
9.00%, 11/1/26 | | 69 | | 22 | |
IO REMIC | | | | | |
6.00%, 8/25/32 - 11/25/32 | | 1,136 | | 91 | |
6.50%, 2/25/33 - 6/25/33 | | 3,967 | | 791 | |
7.00%, 4/25/33 | | 583 | | 109 | |
REMIC | | | | | |
3.27%, 12/25/36(h) | | 1,559 | | 1,501 | |
7.00%, 9/25/32 | | 500 | | 517 | |
Government National Mortgage Association, | | | | | |
Inv Fl IO | | | | | |
6.11%, 8/16/29 | | 390 | | 47 | |
| | | | 4,391 | |
Collateralized Mortgage Obligations — Non Agency Collateral Series (1.8%) | | | | | |
Bear Stearns Mortgage Funding Trust, | | | | | |
3.35%, 3/25/37(d)(h) | | 2,896 | | 1,564 | |
Countrywide Alternative Loan Trust, | | | | | |
IO | | | | | |
2.18%, 3/20/46 | | 9,537 | | 292 | |
2.40%, 12/20/46 | | 23,488 | | 719 | |
2.51%, 12/20/35(e)(h) | | 10,323 | | 264 | |
2.54%, 12/20/35(e)(h) | | 13,936 | | 418 | |
2.56%, 2/25/37 | | 10,973 | | 281 | |
2.57%, 2/20/47 | | 13,948 | | 488 | |
2.86%, 3/20/47 | | 19,575 | | 636 | |
Greenpoint Mortgage Funding Trust, | | | | | |
IO | | | | | |
1.20%, 10/25/45 | | 6,674 | | 180 | |
1.30%, 8/25/45 | | 5,793 | | 127 | |
GS Mortgage Securities Corp., | | | | | |
IO | | | | | |
2.84%, 8/25/35(e)(h) | | 4,195 | | 60 | |
Harborview Mortgage Loan Trust, | | | | | |
IO | | | | | |
2.36%, 6/19/35(h) | | 6,928 | | 77 | |
2.59%, 5/19/35(h) | | 9,301 | | 93 | |
2.93%, 3/19/37(h) | | 9,331 | | 217 | |
3.03%, 7/19/47(h) | | 16,388 | | 333 | |
PO | | | | | |
3/19/47 - 7/19/47 | | 17 | | 2 | |
| | | | | | | |
| The accompanying notes are an integral part of the financial statements. | 85 |
2008 Annual Report
September 30, 2008
Portfolio of Investments (cont’d)
Investment Grade Fixed Income Portfolio
| | Face | | | |
| | Amount | | Value | |
| | (000) | | (000) | |
Collateralized Mortgage Obligations — Non Agency Collateral Series (cont’d) | | | | | |
Indymac Index Mortgage Loan Trust, | | | | | |
IO | | | | | |
2.34%, 7/25/35(h) | | $ | 6,062 | | $ | 81 | |
| | | | 5,832 | |
Finance (7.8%) | | | | | |
Ace INA Holding, Inc., | | | | | |
5.60%, 5/15/15 | | 270 | | 256 | |
AIG SunAmerica Global Financing VI, | | | | | |
6.30%, 5/10/11(e) | | 1,040 | | 843 | |
American Express Credit Corp., | | | | | |
7.30%, 8/20/13(c) | | 560 | | 541 | |
American General Finance Corp., | | | | | |
4.63%, 9/1/10 | | 85 | | 51 | |
Bank of America Corp., | | | | | |
5.75%, 12/1/17 | | 895 | | 760 | |
Bank of New York Mellon Corp. (The), | | | | | |
4.50%, 4/1/13 | | 365 | | 342 | |
Bear Stearns Cos. LLC (The), | | | | | |
6.40%, 10/2/17 | | 730 | | 683 | |
7.25%, 2/1/18 | | 560 | | 540 | |
Berkshire Hathaway Finance Corp., | | | | | |
5.40%, 5/15/18(e) | | 730 | | 708 | |
Caterpillar Financial Services Corp., | | | | | |
4.90%, 8/15/13 | | 150 | | 142 | |
Catlin Insurance Co., Ltd., | | | | | |
7.25%,(e)(h)(o) | | 690 | | 308 | |
Chubb Corp., | | | | | |
5.75%, 5/15/18 | | 90 | | 84 | |
Citicorp, | | | | | |
6.38%, 11/15/08 | | 705 | | 706 | |
Citigroup, Inc., | | | | | |
5.88%, 5/29/37 | | 560 | | 389 | |
6.13%, 11/21/17 - 5/15/18 | | 845 | | 709 | |
Credit Suisse (NY), | | | | | |
6.00%, 2/15/18(c) | | 880 | | 768 | |
Credit Suisse USA, Inc., | | | | | |
5.13%, 8/15/15 | | 145 | | 129 | |
Farmers Exchange Capital, | | | | | |
7.05%, 7/15/28(e) | | 675 | | 540 | |
Farmers Insurance Exchange, | | | | | |
8.63%, 5/1/24(e) | | 725 | | 693 | |
General Electric Capital Corp., | | | | | |
5.63%, 5/1/18(c) | | 675 | | 572 | |
Goldman Sachs Group, Inc. (The), | | | | | |
6.15%, 4/1/18 | | 905 | | 754 | |
6.75%, 10/1/37 | | 875 | | 585 | |
HBOS plc, | | | | | |
6.75%, 5/21/18(e) | | 525 | | 441 | |
HSBC Finance Corp., | | | | | |
4.13%, 12/15/08 | | 450 | | 445 | |
6.38%, 10/15/11 | | 688 | | 682 | |
6.75%, 5/15/11 | | 365 | | 367 | |
Huntington National Bank (The), | | | | | |
4.38%, 1/15/10 | | 520 | | 491 | |
JPMorgan Chase & Co., | | | | | |
6.00%, 1/15/18 | | 615 | | 562 | |
Lehman Brothers Holdings, Inc., | | | | | |
5.75%, 1/3/17(b) | | 525 | | 3 | |
6.88%, 7/17/37(b) | | 1,210 | | 6 | |
Mantis Reef Ltd., | | | | | |
4.69%, 11/14/08(e) | | 1,100 | | 1,099 | |
Merrill Lynch Co., Inc., | | | | | |
6.88%, 4/25/18 | | 1,235 | | 1,094 | |
Metlife, Inc., | | | | | |
6.82%, 8/15/18 | | 360 | | 341 | |
Nationwide Building Society, | | | | | |
4.25%, 2/1/10(e) | | 1,065 | | 1,047 | |
NYSE Euronext, | | | | | |
4.80%, 6/28/13 | | 435 | | 415 | |
Platinum Underwriters Finance, Inc., | | | | | |
7.50%, 6/1/17 | | 550 | | 523 | |
Popular North America, Inc., | | | | | |
5.65%, 4/15/09 | | 455 | | 450 | |
ProLogis, | | | | | |
6.63%, 5/15/18(c) | | 110 | | 95 | |
Prudential Financial, Inc., | | | | | |
6.63%, 12/1/37 | | 365 | | 307 | |
Sovereign Bancorp, Inc., | | | | | |
3.44%, 3/23/10(h) | | 1,540 | | 1,093 | |
Travelers Cos., Inc. (The), | | | | | |
5.80%, 5/15/18 | | 275 | | 252 | |
Two-Rock Pass Through Trust, | | | | | |
3.74%,(e)(h)(o) | | 645 | | 14 | |
Unicredit Luxembourg Finance S.A., | | | | | |
2.85%, 10/24/08(e)(h) | | 1,520 | | 1,519 | |
Wachovia Capital Trust III, | | | | | |
5.80%,(h)(o) | | 940 | | 395 | |
Wachovia Corp., | | | | | |
5.50%, 5/1/13 | | 130 | | 108 | |
Wells Fargo & Co., | | | | | |
5.63%, 12/11/17 | | 855 | | 787 | |
Xlliac Global Funding, | | | | | |
4.80%, 8/10/10(e) | | 1,110 | | 1,067 | |
| | | | 24,706 | |
Industrials (12.1%) | | | | | |
America West Airlines, Inc., | | | | | |
7.10%, 4/2/21 | | 1,059 | | 869 | |
Amgen, Inc., | | | | | |
5.85%, 6/1/17 | | 435 | | 418 | |
ArcelorMittal, | | | | | |
6.13%, 6/1/18(e) | | 400 | | 355 | |
Archer-Daniels-Midland Co., | | | | | |
5.45%, 3/15/18 | | 460 | | 426 | |
AstraZeneca plc, | | | | | |
5.90%, 9/15/17 | | 360 | | 355 | |
| | | | | | | |
86 | The accompanying notes are an integral part of the financial statements. | |
| 2008 Annual Report |
| |
| September 30, 2008 |
Portfolio of Investments (cont’d)
Investment Grade Fixed Income Portfolio
| | Face | | | |
| | Amount | | Value | |
| | (000) | | (000) | |
Industrials (cont’d) | | | | | |
AT&T, Inc., | | | | | |
6.15%, 9/15/34 | | $ | 545 | | $ | 456 | |
6.30%, 1/15/38 | | 905 | | 752 | |
Baxter International, Inc., | | | | | |
4.63%, 3/15/15 | | 435 | | 418 | |
5.38%, 6/1/18 | | 140 | | 134 | |
Biogen Idec, Inc., | | | | | |
6.88%, 3/1/18 | | 435 | | 430 | |
Bristol-Myers Squibb Co., | | | | | |
5.45%, 5/1/18 | | 565 | | 535 | |
Brookfield Asset Management, Inc., | | | | | |
5.80%, 4/25/17 | | 340 | | 300 | |
7.13%, 6/15/12 | | 865 | | 866 | |
Burlington Northern Santa Fe Corp., | | | | | |
6.13%, 3/15/09 | | 540 | | 540 | |
Canadian National Railway Co., | | | | | |
5.55%, 5/15/18 | | 175 | | 173 | |
Comcast Cable Communications LLC, | | | | | |
7.13%, 6/15/13 | | 145 | | 147 | |
Comcast Corp., | | | | | |
5.70%, 5/15/18(c) | | 645 | | 564 | |
6.50%, 1/15/15 | | 150 | | 145 | |
ConAgra Foods, Inc., | | | | | |
7.00%, 10/1/28 | | 145 | | 140 | |
8.25%, 9/15/30 | | 365 | | 401 | |
ConocoPhillips, | | | | | |
5.20%, 5/15/18 | | 550 | | 514 | |
Consumers Energy Co., | | | | | |
4.80%, 2/17/09 | | 420 | | 420 | |
Cooper Industries, Inc., | | | | | |
5.25%, 11/15/12 | | 545 | | 552 | |
Covidien International Finance S.A., | | | | | |
6.00%, 10/15/17 | | 445 | | 440 | |
COX Communications, Inc., | | | | | |
6.25%, 6/1/18(e) | | 430 | | 400 | |
CVS Caremark Corp., | | | | | |
5.75%, 6/1/17 | | 225 | | 211 | |
CVS Pass-Through Trust, | | | | | |
6.04%, 12/10/28(e) | | 725 | | 652 | |
Daimler Finance North America LLC, | | | | | |
8.50%, 1/18/31 | | 430 | | 433 | |
Delhaize America, Inc., | | | | | |
9.00%, 4/15/31 | | 155 | | 163 | |
Dell, Inc., | | | | | |
5.65%, 4/15/18(e) | | 315 | | 290 | |
Deutsche Telekom International Finance B.V., | | | | | |
8.75%, 6/15/30 | | 290 | | 281 | |
Devon Financing Corp. UCL, | | | | | |
7.88%, 9/30/31 | | 305 | | 311 | |
Dr. Pepper Snapple Group, Inc., | | | | | |
6.82%, 5/1/18(e) | | 295 | | 285 | |
E.I. Du Pont de Nemours & Co., | | | | | |
6.00%, 7/15/18 | | 305 | | 298 | |
FBG Finance Ltd., | | | | | |
5.13%, 6/15/15(e) | | 585 | | 549 | |
France Telecom S.A., | | | | | |
8.50%, 3/1/31 | | 610 | | 664 | |
Gaz Capital S.A., | | | | | |
6.51%, 3/7/22(e) | | 110 | | 79 | |
General Electric Co., | | | | | |
5.25%, 12/6/17 | | 2,415 | | 2,117 | |
General Mills, Inc., | | | | | |
5.25%, 8/15/13 | | 140 | | 139 | |
GlaxoSmithKline Capital, Inc., | | | | | |
5.65%, 5/15/18 | | 525 | | 499 | |
Grupo Televisa S.A., | | | | | |
6.00%, 5/15/18(c) | | 285 | | 270 | |
GTL Trade Finance, Inc., | | | | | |
7.25%, 10/20/17(e)(c) | | 225 | | 216 | |
Harley-Davidson Funding Corp., | | | | | |
6.80%, 6/15/18(e) | | 310 | | 291 | |
Hewlett Packard Co., | | | | | |
5.50%, 3/1/18 | | 225 | | 212 | |
Home Depot, Inc., | | | | | |
2.94%, 12/16/09(h) | | 1,155 | | 1,087 | |
5.40%, 3/1/16 | | 400 | | 341 | |
Honeywell International, Inc., | | | | | |
5.30%, 3/1/18 | | 390 | | 368 | |
ICI Wilmington, Inc., | | | | | |
4.38%, 12/1/08 | | 505 | | 504 | |
John Deere Capital Corp., | | | | | |
5.75%, 9/10/18 | | 350 | | 326 | |
KLA-Tencor Corp., | | | | | |
6.90%, 5/1/18 | | 405 | | 377 | |
Koninklijke Philips Electronics N.V., | | | | | |
5.75%, 3/11/18 | | 705 | | 678 | |
Kraft Foods, Inc., | | | | | |
6.13%, 8/23/18 | | 500 | | 468 | |
Kroger Co. (The), | | | | | |
5.00%, 4/15/13 | | 230 | | 220 | |
6.40%, 8/15/17 | | 80 | | 77 | |
LG Electronics, Inc., | | | | | |
5.00%, 6/17/10(e) | | 360 | | 356 | |
Macy’s Retail Holdings, Inc., | | | | | |
6.30%, 4/1/09 | | 370 | | 367 | |
Marathon Oil Corp., | | | | | |
5.90%, 3/15/18 | | 295 | | 263 | |
6.00%, 10/1/17 | | 405 | | 364 | |
Medco Health Solutions, Inc., | | | | | |
7.13%, 3/15/18 | | 420 | | 426 | |
Monsanto Co., | | | | | |
5.13%, 4/15/18 | | 160 | | 152 | |
Oracle Corp., | | | | | |
5.75%, 4/15/18 | | 590 | | 549 | |
| | | | | | | |
| The accompanying notes are an integral part of the financial statements. | 87 |
2008 Annual Report
September 30, 2008
Portfolio of Investments (cont’d)
Investment Grade Fixed Income Portfolio
| | Face | | | |
| | Amount | | Value | |
| | (000) | | (000) | |
Industrials (cont’d) | | | | | |
Parker Hannifin Corp., | | | | | |
5.50%, 5/15/18 | | $ | 305 | | $ | 305 | |
Pearson Dollar Finance Two plc, | | | | | |
6.25%, 5/6/18(e)(c) | | 200 | | 192 | |
Petro-Canada, | | | | | |
6.05%, 5/15/18(c) | | 430 | | 376 | |
Philip Morris International, Inc., | | | | | |
5.65%, 5/16/18 | | 515 | | 477 | |
Questar Market Resources, Inc., | | | | | |
6.80%, 4/1/18 | | 460 | | 465 | |
Rio Tinto Finance USA Ltd., | | | | | |
6.50%, 7/15/18 | | 605 | | 573 | |
Starwood Hotels & Resorts Worldwide, Inc., | | | | | |
6.75%, 5/15/18 | | 310 | | 278 | |
Systems 2001 Asset Trust LLC, | | | | | |
6.66%, 9/15/13(e) | | 842 | | 853 | |
Telecom Italia Capital S.A., | | | | | |
4.00%, 1/15/10 | | 635 | | 617 | |
7.00%, 6/4/18 | | 445 | | 400 | |
Telefonica Europe B.V., | | | | | |
8.25%, 9/15/30 | | 720 | | 726 | |
Textron Financial Corp., | | | | | |
5.13%, 2/3/11 | | 750 | | 751 | |
Time Warner Cable, Inc., | | | | | |
6.75%, 7/1/18(c) | | 420 | | 393 | |
Time Warner, Inc., | | | | | |
5.88%, 11/15/16(c) | | 520 | | 458 | |
Tyco Electronics Group S.A., | | | | | |
5.95%, 1/15/14 | | 525 | | 517 | |
UnitedHealth Group, Inc., | | | | | |
6.00%, 2/15/18 | | 360 | | 326 | |
Valero Energy Corp., | | | | | |
3.50%, 4/1/09 | | 325 | | 323 | |
Verizon Communications, Inc., | | | | | |
5.50%, 2/15/18 | | 685 | | 607 | |
Viacom, Inc., | | | | | |
6.88%, 4/30/36 | | 645 | | 518 | |
Vivendi, | | | | | |
6.63%, 4/4/18 | | 595 | (e) | 574 | |
Vodafone Group plc, | | | | | |
5.63%, 2/27/17 | | 100 | | 89 | |
Walgreen Co., | | | | | |
4.88%, 8/1/13 | | 325 | | 325 | |
Wal-Mart Stores, Inc., | | | | | |
4.25%, 4/15/13 | | 595 | | 585 | |
Weatherford International Ltd., | | | | | |
6.00%, 3/15/18(c) | | 300 | | 270 | |
Wyeth, | | | | | |
5.45%, 4/1/17 | | 300 | | 290 | |
5.50%, 2/15/16 | | 115 | | 113 | |
Xerox Corp., | | | | | |
6.35%, 5/15/18 | | 420 | | 385 | |
XTO Energy, Inc., | | | | | |
5.50%, 6/15/18 | | 495 | | 438 | |
Yum! Brands, Inc., | | | | | |
8.88%, 4/15/11 | | 610 | | 658 | |
| | | | 38,515 | |
Mortgages — Other (3.9%) | | | | | |
American Home Mortgage Assets, | | | | | |
3.40%, 6/25/47(d)(h) | | 3,628 | | 1,959 | |
3.51%, 6/25/47(d)(h) | | 1,451 | | 214 | |
3.53%, 10/25/46(d)(h) | | 1,501 | | 270 | |
Banc of America Funding Corp., | | | | | |
3.54%, 9/20/35(d)(h) | | 689 | | 279 | |
California Federal Savings & Loan Association, | | | | | |
8.80%, 1/25/14(d) | | — | @ | — | @ |
Countrywide Alternative Loan Trust, | | | | | |
3.40%, 10/25/46(h) | | 2,633 | | 1,616 | |
3.40%, 11/25/46(d)(h) | | 1,791 | | 1,039 | |
3.48%, 7/25/46(h) | | 1,352 | | 541 | |
Deutsche ALT-A Securities NIM Trust, | | | | | |
6.75%, 2/25/47(e) | | 184 | | 172 | |
GSR Mortgage Loan Trust, | | | | | |
3.40%, 8/25/46(d)(h) | | 2,230 | | 1,672 | |
Harborview Mortgage Loan Trust, | | | | | |
3.23%, 1/25/47(d)(h) | | 1,360 | | 474 | |
3.32%, 7/19/45(d)(h) | | 485 | | 201 | |
Indymac Index Mortgage Loan Trust, | | | | | |
3.31%, 2/25/37(h) | | 2,381 | | 1,996 | |
3.59%, 10/25/36(d)(h) | | 1,269 | | 438 | |
Mastr Adjustable Rate Mortgages Trust, | | | | | |
3.46%, 4/25/46(d)(h) | | 1,363 | | 515 | |
Residential Accredit Loans, Inc., | | | | | |
3.44%, 5/25/46(c)(d)(h) | | 1,469 | | 426 | |
Ryland Acceptance Corp. IV, | | | | | |
6.65%, 7/1/11 | | 7 | | 7 | |
Structured Asset Mortgage Investments, Inc., | | | | | |
3.40%, 2/25/36(d)(h) | | 505 | | 268 | |
Washington Mutual Mortgage Pass | | | | | |
Through Certificates, | | | | | |
3.50%, 8/25/45(h) | | 25 | | 24 | |
Washington Mutual, Inc., | | | | | |
3.47%, 10/25/45(h) | | 101 | | 99 | |
3.56%, 6/25/46(d)(h) | | 525 | | 63 | |
| | | | 12,273 | |
Sovereign (0.5%) | | | | | |
Federative Republic of Brazil, | | | | | |
6.00%, 1/17/17(c) | | 1,350 | | 1,306 | |
Korea Railroad Corp., | | | | | |
5.38%, 5/15/13(e) | | 300 | | 282 | |
| | | | 1,588 | |
| | | | | | | |
88 | The accompanying notes are an integral part of the financial statements. | |
| 2008 Annual Report |
| |
| September 30, 2008 |
Portfolio of Investments (cont’d)
Investment Grade Fixed Income Portfolio
| | Face | | | |
| | Amount | | Value | |
| | (000) | | (000) | |
U.S. Treasury Securities (3.7%) | | | | | |
U.S. Treasury Bonds, | | | | | |
4.50%, 2/15/36(c) | | $ | 1,650 | | $ | 1,694 | |
5.38%, 2/15/31(c) | | 5,650 | | 6,422 | |
U.S. Treasury Bond STRIPS, | | | | | |
Zero Coupon, 5/15/21 | | 6,520 | | 3,663 | |
| | | | 11,779 | |
Utilities (3.0%) | | | | | |
Appalachian Power Co., | | | | | |
5.65%, 8/15/12 | | 255 | | 250 | |
Arizona Public Service Co., | | | | | |
5.80%, 6/30/14 | | 670 | | 620 | |
Carolina Power & Light Co., | | | | | |
5.13%, 9/15/13 | | 760 | | 760 | |
CenterPoint Energy Resources Corp., | | | | | |
6.25%, 2/1/37 | | 225 | | 179 | |
7.88%, 4/1/13 | | 135 | | 139 | |
Consolidated Natural Gas Co., | | | | | |
6.25%, 11/1/11 | | 355 | | 358 | |
Detroit Edison Co. (The), | | | | | |
6.13%, 10/1/10 | | 480 | | 493 | |
E.ON International Finance B.V., | | | | | |
5.80%, 4/30/18(e) | | 615 | | 589 | |
Entergy Gulf States, Inc., | | | | | |
3.21%, 12/1/09(h) | | 455 | | 451 | |
3.57%, 12/8/08(e)(h) | | 51 | | 51 | |
Equitable Resources, Inc., | | | | | |
6.50%, 4/1/18 | | 135 | | 129 | |
Israel Electric Corp. Ltd., | | | | | |
7.25%, 1/15/19(c)(e) | | 520 | | 522 | |
Kinder Morgan Energy Partners LP, | | | | | |
5.95%, 2/15/18 | | 345 | | 308 | |
NiSource Finance Corp., | | | | | |
3.38%, 11/23/09(h) | | 535 | | 522 | |
6.80%, 1/15/19 | | 265 | | 241 | |
Ohio Edison Co., | | | | | |
6.40%, 7/15/16 | | 465 | | 443 | |
Ohio Power Co., | | | | | |
6.00%, 6/1/16 | | 455 | | 435 | |
Peco Energy Co., | | | | | |
5.35%, 3/1/18 | | 355 | | 323 | |
Plains All American Pipeline LP/PAA | | | | | |
Finance Corp., | | | | | |
6.70%, 5/15/36 | | 630 | | 545 | |
PPL Energy Supply LLC, | | | | | |
6.30%, 7/15/13 | | 265 | | 258 | |
Public Service Co. of Colorado, | | | | | |
6.50%, 8/1/38 | | 255 | | 243 | |
Public Service Electric & Gas Co., | | | | | |
5.00%, 1/1/13 | | 580 | | 573 | |
Texas Eastern Transmission LP, | | | | | |
7.00%, 7/15/32 | | 425 | | 414 | |
Trans-Canada Pipelines Ltd., | | | | | |
6.50%, 8/15/18(c) | | 360 | | 350 | |
Union Electric Co., | | | | | |
6.70%, 2/1/19 | | 415 | | 401 | |
| | | | 9,597 | |
Total Fixed Income Securities (Cost $385,555) | | | | 358,201 | |
| | Shares | | | |
Short-Term Investments (22.5%) | | | | | |
Securities held as Collateral on Loaned Securities (7.1%) | | | | | |
Investment Company (6.4%) | | | | | |
Morgan Stanley Institutional Liquidity Money Market Portfolio — Institutional Class(p) | | 20,298,339 | | 20,298 | |
| | Face | | | |
| | Amount | | | |
| | (000) | | | |
Short-Term Debt (0.7%) | | | | | |
Bancaja, | | | | | |
2.96%, 11/12/08(h) | | $ | 433 | | 433 | |
Citigroup Global Markets, Inc., | | | | | |
1.00%, 10/1/08 | | 1,906 | | 1,906 | |
| | | | 2,339 | |
| | | | 22,637 | |
| | Shares | | | |
Investment Company (3.6%) | | | | | |
Morgan Stanley Institutional Liquidity Money Market Portfolio — Institutional Class(p) | | 11,328,762 | | 11,329 | |
| | Face | | | |
| | Amount | | | |
| | (000) | | | |
U.S. Government & Agency Securities (8.8%) | | | | | |
Federal Home Loan Bank, | | | | | |
2.05%, 10/15/08(t) | | $ | 3,000 | | 3,000 | |
2.12%, 10/10/08(t) | | 8,000 | | 7,999 | |
Federal Home Loan Mortgage Corp., | | | | | |
1.80%, 11/18/08(t) | | 10,000 | | 9,974 | |
2.25%, 11/10/08(t) | | 7,043 | | 7,028 | |
| | | | 28,001 | |
U.S. Treasury Securities (3.0%) | | | | | |
U.S. Treasury Bills, | | | | | |
0.17%, 10/9/08(c)(r)(j) | | 2,530 | | 2,530 | |
1.01%, 1/8/09(r) | | 7,000 | | 6,980 | |
| | | | 9,510 | |
Total Short-Term Investments (Cost $71,455) | | | | 71,477 | |
Total Investments (135.2%) (Cost $457,010) — including $23,030 of Securities Loaned | | | | 429,678 | |
Liabilities in Excess of Other Assets (-35.2%) | | | | (111,799 | ) |
Net Assets (100%) | | | | $ 317,879 | |
| | | | | | | |
| The accompanying notes are an integral part of the financial statements. | 89 |
2008 Annual Report
September 30, 2008
Portfolio of Investments (cont’d)
Investment Grade Fixed Income Portfolio
(b) | Issuer is in default. |
(c) | All or a portion of security on loan at September 30, 2008. |
(d) | Security was valued at fair value — At September 20, 2008, the Portfolio held $9,382,000 of fair valued securities, representing, 3.0% of net assets. |
(e) | 144A security — Certain conditions for public sale may exist. Unless otherwise noted, these securities are deemed to be liquid. |
(h) | Variable/Floating Rate Security — Interest rate changes on these instruments are based on changes in a designated rate. The rates shown are those in effect on September 30, 2008. |
(i) | Security is subject to delayed delivery. |
(j) | All or a portion of the security was pledged to cover margin requirements for futures contracts. |
(o) | Perpetual — Security does not have a predetermined maturity date. Rate for this security is fixed for a period of time then reverts to a floating rate. The interest shown is the rate in effect at September 30, 2008. |
(p) | See Note G within the Notes to Financial Statements regarding investment in Morgan Stanley Institutional Liquidity Money Market Portfolio — Institutional Class. |
(r) | Rate shown is the yield to maturity at September 30, 2008. |
(t) | Purchased on a discount basis. The interest rate shown has been adjusted to reflect a money market equivalent yield. |
@ | Face Amount/Value is less than $500. |
Inv Fl | Inverse Floating Rate — Interest rate fluctuates with an inverse relationship to an associated interest rate. Indicated rate is the effective rate at September 30, 2008. |
IO | Interest Only |
PAC | Planned Amortization Class |
PO | Principal Only |
REMIC | Real Estate Mortgage Investment Conduit |
STRIPS | Separate Trading of Registered Interest and Principal of Securities |
TBA | To Be Announced |
| |
Futures Contracts:
The Portfolio had the following futures contract(s) open at period end:
| | | | | | | | Net | |
| | | | | | | | Unrealized | |
| | Number | | | | | | Appreciation | |
| | of | | Value | | Expiration | | (Depreciation) | |
| | Contracts | | (000) | | Date | | (000) | |
Long: | | | | | | | | | |
U.S. Treasury | | | | | | | | | |
2 yr. Note | | 188 | | | $40,126 | | | Dec-08 | | | $ | 12 | | |
U.S. Treasury | | | | | | | | | | | | | |
Long Bond | | 177 | | | 20,740 | | | Dec-08 | | | (164 | ) | |
Short: | | | | | | | | | | | | | |
EuroDollar | | | | | | | | | | | | | |
90 Day | | 30 | | | 7,278 | | | Mar-09 | | | (16 | ) | |
EuroDollar | | | | | | | | | | | | | |
CME | | 31 | | | 7,482 | | | Dec-08 | | | (9 | ) | |
EuroDollar | | | | | | | | | | | | | |
CME | | 11 | | | 2,669 | | | Mar-09 | | | (39 | ) | |
EuroDollar | | | | | | | | | | | | | |
CME | | 49 | | | 11,878 | | | Jun-09 | | | (48 | ) | |
EuroDollar | | | | | | | | | | | | | |
CME | | 29 | | | 7,024 | | | Sep-09 | | | (11 | ) | |
EuroDollar | | | | | | | | | | | | | |
CME | | 22 | | | 5,311 | | | Dec-09 | | | (68 | ) | |
EuroDollar | | | | | | | | | | | | | |
CME | | 18 | | | 4,338 | | | Mar-10 | | | (52 | ) | |
EuroDollar | | | | | | | | | | | | | |
CME | | 37 | | | 8,894 | | | Jun-10 | | | (48 | ) | |
EuroDollar | | | | | | | | | | | | | |
CME | | 53 | | | 12,707 | | | Sep-10 | | | (34 | ) | |
EuroDollar | | | | | | | | | | | | | |
CME | | 2 | | | 478 | | | Dec-10 | | | (3 | ) | |
U.S. Treasury | | | | | | | | | | | | | |
5 yr. Note | | 167 | | | 18,743 | | | Dec-08 | | | (62 | ) | |
U.S. Treasury | | | | | | | | | | | | | |
10 yr. Note | | 158 | | | 18,111 | | | Dec-08 | | | 312 | | |
5 yr. Swap | | 20 | | | 2,170 | | | Dec-08 | | | (4 | ) | |
10 yr. Swap | | 381 | | | 42,612 | | | Dec-08 | | | 159 | | |
| | | | | | | | | | | $ | (75 | ) | |
CME — Chicago Mercantile Exchange
90 | The accompanying notes are an integral part of the financial statements. | |
| 2008 Annual Report |
| |
| September 30, 2008 |
Portfolio of Investments (cont’d)
Investment Grade Fixed Income Portfolio
Credit Default Swap Contracts
The Portfolio had the following credit default swap agreement(s) open at period end:
| | | | | | | | | | Unrealized | |
| | | | Notional | | | | | | Appreciation | |
| | Buy/Sell | | Amount | | Pay/Receive | | Termination | | (Depreciation) | |
Swap Counterparty and Reference Obligation | | Protection | | (000) | | Fixed Rate | | Date | | (000) | |
Bank of America | | | | | | | | | | | |
Carnival Corp., 6.65%, 1/15/28 | | Buy | | | $ | 330 | | | | 1.57 | % | | 3/20/18 | | | | $ | (6 | ) | |
Goodrich Corp., 7.63%, 12/15/12 | | Buy | | | 280 | | | | 0.82 | | | 3/20/18 | | | | (5 | ) | |
Textron Financial Corp., 5.13%, 2/3/11 | | Buy | | | 355 | | | | 0.80 | | | 3/20/18 | | | | 64 | | |
Citigroup | | | | | | | | | | | | | | | | | | |
Eaton Corp., 7.65%, 11/15/29 | | Buy | | | 155 | | | | 0.82 | | | 3/20/18 | | | | 4 | | |
Credit Suisse | | | | | | | | | | | | | | | | | | |
Arrow Electronics, Inc., 6.88%, 6/1/18 | | Buy | | | 315 | | | | 1.00 | | | 3/20/15 | | | | (6 | ) | |
Goldman Sachs | | | | | | | | | | | | | | | | | | |
AvalonBay Communities, Inc., 6.13%, 11/1/12 | | Buy | | | 280 | | | | 3.05 | | | 3/20/13 | | | | (10 | ) | |
Coca-Cola Enterprises, Inc., 6.13%, 8/15/11 | | Buy | | | 1,175 | | | | 0.59 | | | 3/20/13 | | | | (6 | ) | |
Dow Jones CDX North America Investment Grade Index, Series 10 | | Sell | | | 2,055 | | | | 1.55 | | | 6/20/13 | | | | (34 | ) | |
Dow Jones CDX North America Investment Grade Index, Series 9 | | Sell | | | 625 | | | | 0.60 | | | 12/20/12 | | | | (9 | ) | |
Dow Jones CDX North America Investment Grade Index, Series 9 | | Sell | | | 1,220 | | | | 0.80 | | | 12/20/17 | | | | (30 | ) | |
Eaton Corp., 7.65%, 11/15/29 | | Buy | | | 305 | | | | 0.97 | | | 3/20/18 | | | | 4 | | |
Goodrich Corp., 7.63%, 12/15/12 | | Buy | | | 385 | | | | 0.47 | | | 3/20/18 | | | | 3 | | |
Sealed Air Corp., 5.63%, 7/15/13 | | Buy | | | 205 | | | | 1.24 | | | 3/20/18 | | | | 8 | | |
JPMorgan Chase | | | | | | | | | | | | | | | | | | |
Dow Jones CDX North America Investment Grade Index, Series 9 | | Sell | | | 2,555 | | | | 0.60 | | | 12/20/12 | | | | (21 | ) | |
Nordstrom, Inc., 6.95%, 3/15/28 | | Buy | | | 350 | | | | 1.07 | | | 3/20/18 | | | | 12 | | |
Merrill Lynch | | | | | | | | | | | | | | | | | | |
Carnival Corp., 6.65%, 1/15/28 | | Buy | | | 225 | | | | 1.60 | | | 3/20/18 | | | | (4 | ) | |
UBS | | | | | | | | | | | | | | | | | | |
Martin Marietta Materials, Inc., 6.88%, 4/1/11 | | Buy | | | 185 | | | | 1.73 | | | 3/20/18 | | | | 3 | | |
Martin Marietta Materials, Inc., 6.88%, 4/1/11 | | Buy | | | 270 | | | | 1.78 | | | 3/20/13 | | | | 1 | | |
| | | | | | | | | | | | | | | | $ | (32 | ) | |
Interest Rate Swap Contracts
The Portfolio had the following interest rate swap agreement(s) open at period end:
| | | | | | | | | | | | Unrealized | |
| | | | | | | | | | Notional | | Appreciation | |
| | Floating Rate | | Pay/Receive | | Fixed | | Termination | | Amount | | (Depreciation) | |
Swap Counterparty | | Index | | Floating Rate | | Rate | | Date | | (000) | | (000) | |
Bank of America | | 3 Month LIBOR | | Pay | | | 4.20 | % | | 6/3/13 | | | $ | 5,500 | | | | $ | 105 | | |
| | 3 Month LIBOR | | Pay | | | 4.15 | | | 6/9/13 | | | 30,215 | | | | 506 | | |
| | 3 Month LIBOR | | Receive | | | 3.90 | | | 9/10/13 | | | 24,430 | | | | 145 | | |
| | 3 Month LIBOR | | Pay | | | 5.37 | | | 2/12/18 | | | 12,969 | | | | 215 | | |
| | 3 Month LIBOR | | Pay | | | 5.07 | | | 4/14/18 | | | 8,730 | | | | 43 | | |
| | 3 Month LIBOR | | Pay | | | 4.98 | | | 4/15/18 | | | 4,285 | | | | 8 | | |
| | 3 Month LIBOR | | Receive | | | 4.67 | | | 8/4/18 | | | 15,975 | | | | (305 | ) | |
| | 3 Month LIBOR | | Receive | | | 5.15 | | | 8/26/18 | | | 12,300 | | | | (84 | ) | |
| | 3 Month LIBOR | | Receive | | | 5.08 | | | 9/2/18 | | | 53,480 | | | | (232 | ) | |
| | 3 Month LIBOR | | Receive | | | 5.82 | | | 2/12/23 | | | 16,660 | | | | (355 | ) | |
| | 3 Month LIBOR | | Receive | | | 5.47 | | | 4/14/23 | | | 11,180 | | | | (126 | ) | |
| | 3 Month LIBOR | | Receive | | | 5.38 | | | 4/15/23 | | | 4,750 | | | | (41 | ) | |
| | 3 Month LIBOR | | Pay | | | 5.34 | | | 8/26/23 | | | 15,750 | | | | 117 | | |
| | 3 Month LIBOR | | Pay | | | 5.28 | | | 9/2/23 | | | 68,500 | | | | 391 | | |
Citigroup | | 3 Month LIBOR | | Pay | | | 3.77 | | | 4/24/13 | | | 17,900 | | | | 3 | | |
| | 3 Month LIBOR | | Pay | | | 5.33 | | | 5/22/17 | | | 12,800 | | | | 1,071 | | |
| | 3 Month LIBOR | | Pay | | | 5.37 | | | 5/23/17 | | �� | 12,800 | | | | 1,105 | | |
| | 3 Month LIBOR | | Pay | | | 5.34 | | | 5/24/17 | | | 11,000 | | | | 924 | | |
| | 3 Month LIBOR | | Pay | | | 5.24 | | | 9/27/17 | | | 8,000 | | | | 483 | | |
| | 3 Month LIBOR | | Receive | | | 5.29 | | | 9/28/17 | | | 9,000 | | | | (576 | ) | |
| | 3 Month LIBOR | | Receive | | | 5.00 | | | 11/13/17 | | | 3,000 | | | | (174 | ) | |
| | 3 Month LIBOR | | Receive | | | 4.73 | | | 12/27/17 | | | 6,725 | | | | (228 | ) | |
| | 3 Month LIBOR | | Pay | | | 4.47 | | | 1/10/18 | | | 6,000 | | | | 31 | | |
| The accompanying notes are an integral part of the financial statements. | 91 |
2008 Annual Report
September 30, 2008
Portfolio of Investments (cont’d)
Investment Grade Fixed Income Portfolio
Interest Rate Swap Contracts (cont’d)
The Portfolio had the following interest rate swap agreement(s) open at period end:
| | | | | | | | | | | | Unrealized | |
| | | | | | | | | | Notional | | Appreciation | |
| | Floating Rate | | Pay/Receive | | Fixed | | Termination | | Amount | | (Depreciation) | |
Swap Counterparty | | Index | | Floating Rate | | Rate | | Date | | (000) | | (000) | |
Deutsche Bank | | 3 Month LIBOR | | Pay | | | 5.39 | % | | 5/25/17 | | | $ | 28,700 | | | | $ | 2,520 | | |
| | 3 Month LIBOR | | Pay | | | 5.43 | | | 5/29/17 | | | 19,625 | | | | 1,782 | | |
Goldman Sachs | | 3 Month LIBOR | | Pay | | | 5.63 | | | 2/28/18 | | | 34,080 | | | | 885 | | |
| | 3 Month LIBOR | | Receive | | | 6.04 | | | 2/28/23 | | | 43,725 | | | | (1,205 | ) | |
JPMorgan Chase | | 3 Month LIBOR | | Pay | | | 4.07 | | | 5/16/13 | | | 21,510 | | | | 293 | | |
| | 3 Month LIBOR | | Pay | | | 4.27 | | | 6/2/13 | | | 8,915 | | | | 202 | | |
| | 3 Month LIBOR | | Pay | | | 5.37 | | | 5/23/17 | | | 5,800 | | | | 502 | | |
| | 3 Month LIBOR | | Pay | | | 5.34 | | | 5/24/17 | | | 2,650 | | | | 223 | | |
| | 3 Month LIBOR | | Pay | | | 5.45 | | | 5/29/17 | | | 19,625 | | | | 1,811 | | |
| | 3 Month LIBOR | | Pay | | | 5.44 | | | 8/20/17 | | | 3,700 | | | | 292 | | |
| | 3 Month LIBOR | | Pay | | | 5.09 | | | 9/11/17 | | | 11,300 | | | | 586 | | |
| | 3 Month LIBOR | | Receive | | | 5.23 | | | 9/27/17 | | | 8,300 | | | | (498 | ) | |
| | 3 Month LIBOR | | Receive | | | 5.30 | | | 9/28/17 | | | 9,000 | | | | (584 | ) | |
| | 3 Month LIBOR | | Pay | | | 5.25 | | | 10/11/17 | | | 8,500 | | | | 676 | | |
| | 3 Month LIBOR | | Receive | | | 5.01 | | | 11/13/17 | | | 5,000 | | | | (298 | ) | |
| | 3 Month LIBOR | | Receive | | | 4.24 | | | 1/22/18 | | | 5,350 | | | | 69 | | |
| | 3 Month LIBOR | | Receive | | | 4.52 | | | 2/19/18 | | | 5,500 | | | | (44 | ) | |
| | 3 Month LIBOR | | Receive | | | 4.62 | | | 2/22/18 | | | 6,700 | | | | (107 | ) | |
| | 3 Month LIBOR | | Receive | | | 4.41 | | | 5/1/18 | | | 33,000 | | | | (330 | ) | |
Merrill Lynch | | 3 Month LIBOR | | Pay | | | 5.00 | | | 4/15/18 | | | 5,715 | | | | 14 | | |
| | 3 Month LIBOR | | Receive | | | 5.40 | | | 4/16/23 | | | 6,670 | | | | (61 | ) | |
| | | | | | | | | | | | | | | | | $ | 9,754 | | |
LIBOR — London Inter Bank Offer Rate
Zero Coupon Swap Contracts
The Portfolio had the following zero coupon swap agreement(s) open at period end:
| | | | | | | | Unrealized | |
| | Notional | | | | | | Appreciation | |
| | Amount | | | | Termination | | (Depreciation) | |
Swap Counterparty | | (000) | | Receive | | Date | | (000) | |
JPMorgan Chase | | $3,665 | | 3 Month LIBOR | | 5/15/21 | | | $— | | |
| | | | | | | | | $— | | |
LIBOR — London Inter Bank Offer Rate
92 | The accompanying notes are an integral part of the financial statements. |
| 2008 Annual Report |
| |
| September 30, 2008 |
Investment Overview (unaudited)
Limited Duration Portfolio
The Limited Duration Portfolio seeks above-average total return over a market cycle of three to five years. The Portfolio invests primarily in U.S. government securities, investment grade corporate bonds and mortgage securities. The Portfolio seeks value in the fixed income market with only a limited sensitivity to changes in interest rates. The Portfolio will ordinarily seek to maintain an average duration similar to that of the Citigroup 1-3 Year Treasury/Government Sponsored Index, which generally ranges between zero and three years, although there is no minimum or maximum for any individual security. The Portfolio may invest in asset-backed securities and may use futures, options, forwards, CMOs, swaps, options on swaps and other derivatives. The Portfolio may also invest in securities of foreign issuers, including issuers located in emerging market countries. The securities in which the Portfolio may invest may be denominated in U.S. dollars or in currencies other than U.S. dollars.
Performance
For the fiscal year ended September 30, 2008, the Portfolio’s Class I had a total return based on net asset value and reinvestment of distributions per share of - -17.57%, net of fees. The Portfolio’s Class I underperformed against its benchmark Citigroup 1-3 Year Treasury/Government Sponsored Index (the “Index”) which returned 6.09%.
Factors Affecting Performance
• The financial markets were under pressure throughout the period amid disrupted credit markets, ongoing deterioration of the housing market, losses in the financial sector, and growing fears of recession.
• The third quarter of 2008, however, will most certainly go down as a defining moment in the history of the financial industry. Investor confidence plummeted and credit markets seized as several venerable financial institutions were forced into mergers or dissolved entirely in September, resulting in significant price erosion across all but the U.S. Treasury sector.
• The primary detractors from the Portfolio’s relative performance were holdings in non-agency mortgage securities and asset-backed securities as both sectors suffered price declines amid widening spreads and diminished liquidity during the period.
• The Portfolio held an overweight position in corporate credit, a sector not represented in the benchmark. This position, and holdings in financials in particular, also hindered performance as spreads across the corporate sector widened considerably.
• Yield-curve positioning, however, was beneficial to performance for the reporting year.
Management Strategies
• The Portfolio maintained an overweight to non-agency mortgage-backed securities. The specific non-agency issues held in the Portfolio are backed primarily by Alt-A borrowers (those who have relatively strong credit but are not considered “prime” borrowers) and are concentrated in the senior and middle tranches of the capital structure. Given our expectations that the housing market situation may take some time to work itself out and therefore, these securities would continue to add volatility, we began reducing the Portfolio’s exposure to non-agency mortgage-backed securities in the third quarter of 2008.
• The Portfolio’s allocation to asset-backed securities remained overweighted with the majority of holdings concentrated in high-quality, AAA rated securities.
• We maintained a neutral yield-curve positioning throughout the period.
93
2008 Annual Report
September 30, 2008
Investment Overview (cont’d)
Limited Duration Portfolio
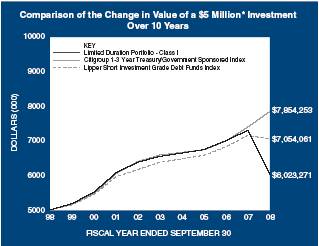
* Minimum Investment
In accordance with SEC regulations, the Portfolio’s performance shown assumes that all recurring fees (including management fees) were deducted and all dividends and distributions were reinvested. The performance of Class P shares will vary from the Class I shares based upon their different inception dates and will be negatively impacted by additional fees assessed to that class.
Performance Compared to the Citigroup 1-3 Year Treasury/Government Sponsored Index(1) and the Lipper Short Investment Grade Debt Funds Index(2)
| | Total Returns(3) | |
| | | | Average Annual | |
| | One | | Five | | Ten | | Since | |
| | Year | | Years | | Years | | Inception | (6) |
Portfolio – Class I (4) | | (17.57 | )% | (1.68 | )% | 1.88 | % | 3.49 | % |
Citigroup 1-3 Year Treasury/Government Sponsored Index | | 6.09 | | 3.56 | | 4.62 | | 5.25 | |
Lipper Short Investment Grade Debt Funds Index | | (1.44 | ) | 2.02 | | 3.50 | | 4.52 | |
Portfolio – Class P (5) | | (17.77 | ) | — | | — | | (17.68 | ) |
Citigroup 1-3 Year Treasury/Government Sponsored Index | | 6.09 | | — | | — | | 6.06 | |
Lipper Short Investment Grade Debt Funds Index | | (1.44 | ) | — | | — | | (1.44 | ) |
Performance data quoted represents past performance, which is no guarantee of future results, and current performance may be lower or higher than the figures shown. Performance assumes that all dividends and distributions, if any, were reinvested. For the most recent month-end performance figures, please visit www.morganstanley.com/msim. Investment returns and principal value will fluctuate so that Portfolio shares, when redeemed, may be worth more or less than their original cost. Total returns do not reflect the deduction of taxes that a shareholder would pay on Portfolio distributions or the redemption of Portfolio shares. Performance of share classes will vary due to differences in sales charges and expenses.
(1) | The Citigroup 1-3 Year Treasury/Government Sponsored Index is a fixed income market-value weighted index that includes all U.S. Treasury and U.S. agency securities with remaining maturities of at least one year and not longer than three years. The Index is unmanaged and its returns do not include any sales charges or fees. Such costs would lower performance. It is not possible to invest directly in an index. |
(2) | The Lipper Short Investment Grade Debt Funds Index is an equally weighted performance index of the largest qualifying funds (based on net assets) in the Lipper Short Investment Grade Debt Funds classification. The Index, which is adjusted for capital gains distributions and income dividends, is unmanaged and should not be considered an investment. There are currently 30 funds represented in this Index. As of the date of this report, the Portfolio was in the Lipper Short Investment Grade Debt Funds classification. |
(3) | Total returns for the Portfolio reflect expenses waived and/or reimbursed, if applicable, by the Adviser. Without such waivers and/or reimbursements, total returns would have been lower. Fee waivers and/or reimbursements are voluntary and the Adviser reserves the right to commence or terminate any waiver and/or reimbursement at any time. |
(4) | Commenced operations on March 31, 1992. |
(5) | Commenced operations on September 28, 2007. |
(6) | For comparative purposes, average annual since inception returns listed for the Indexes refer to the inception date or initial offering of the share class of the Portfolio, not the inception of the Indexes. |
| |
Portfolio Composition
| | Percentage of |
Classification | | Total Investments |
Asset Backed Corporates | | | 18.5 | % |
Mortgages – Other | | | 18.4 | |
Agency Fixed Rate Mortgages | | | 13.7 | |
Finance | | | 11.8 | |
Industrials | | | 10.9 | |
Agency Adjustable Rate Mortgages | | | 5.0 | |
Other* | | | 5.8 | |
Short-Term Investments | | | 15.9 | |
Total Investments | | | 100.0 | % |
* Industries and/or investment types which do not appear in the above table, as well as those which represent less than 5% of total investments, if applicable, are included in the category labeled “Other”.
94
| 2008 Annual Report |
| |
| September 30, 2008 |
Portfolio of Investments
Limited Duration Portfolio
| | Face | | | |
| | Amount | | Value | |
| | (000) | | (000) | |
Fixed Income Securities (83.9%) | | | | | |
Agency Adjustable Rate Mortgages (5.0%) | | | | | |
Federal Home Loan Mortgage Corp.,
Conventional Pools: | | | | | |
4.08%, 7/1/34 | | $ | 661 | | $ | 669 | |
4.36%, 10/1/33 | | 3,609 | | 3,608 | |
4.69%, 7/1/35 | | 4,408 | | 4,421 | |
Federal National Mortgage Association,
Conventional Pools: | | | | | |
4.26%, 6/1/34 | | 307 | | 309 | |
4.46%, 5/1/35 | | 4,850 | | 4,896 | |
4.57%, 7/1/34 | | 585 | | 588 | |
4.88%, 3/1/36 | | 4,477 | | 4,537 | |
5.33%, 5/1/35 | | 2,377 | | 2,471 | |
5.36%, 8/1/36 | | 4,563 | | 4,650 | |
5.67%, 4/1/35 | | 964 | | 971 | |
5.93%, 2/1/35 | | 476 | | 482 | |
Government National Mortgage Association,
Various Pools: | | | | | |
5.13%, 12/20/25 - 12/20/27 | | 100 | | 101 | |
5.38%, 1/20/25 - 1/20/28 | | 418 | | 423 | |
5.63%, 7/20/27 - 9/20/27 | | 101 | | 102 | |
| | | | 28,228 | |
Agency Fixed Rate Mortgages (13.7%) | | | | | |
Federal Home Loan Mortgage Corp.,
Conventional Pools: | | | | | |
5.13%, 11/17/17 | | 20,500 | | 21,164 | |
10.00%, 3/1/11 - 10/1/20 | | 74 | | 84 | |
11.00%, 5/1/20 | | 4 | | 5 | |
11.50%, 1/1/18 | | 8 | | 9 | |
Gold Pools: | | | | | |
6.50%, 9/1/19 - 11/1/29 | | 113 | | 117 | |
7.00%, 3/1/32 | | 2 | | 2 | |
7.50%, 11/1/19 - 11/1/32 | | 2,186 | | 2,369 | |
8.50%, 8/1/28 | | 35 | �� | 38 | |
10.00%, 10/1/21 | | 6 | | 7 | |
10.50%, 1/1/19 - 10/1/20 | | 10 | | 11 | |
11.50%, 8/1/10 | | 3 | | 3 | |
12.00%, 6/1/15 | | 17 | | 19 | |
Federal National Mortgage Association, | | | | | |
4.38%, 3/15/13 | | 42,000 | | 42,870 | |
Conventional Pools: | | | | | |
6.50%, 3/1/18 - 10/1/32 | | 2,567 | | 2,656 | |
7.00%, 5/1/26 - 12/1/34 | | 3,303 | | 3,471 | |
7.50%, 9/1/29 - 7/1/32 | | 3,203 | | 3,456 | |
8.00%, 12/1/29 - 8/1/31 | | 174 | | 188 | |
9.50%, 11/1/20 | | 20 | | 22 | |
10.00%, 8/1/16 - 9/1/16 | | 22 | | 25 | |
10.50%, 12/1/16 | | 8 | | 9 | |
11.00%, 7/1/20 | | 5 | | 5 | |
11.50%, 11/1/19 | | 18 | | 21 | |
12.50%, 2/1/15 | | 14 | | 16 | |
Government National Mortgage Association,
Various Pools: | | | | | |
9.00%, 11/15/16 - 1/15/17 | | 84 | | 92 | |
9.50%, 12/15/17 - 12/15/21 | | 167 | | 187 | |
10.00%, 11/15/09 - 7/15/22 | | 417 | | 475 | |
10.50%, 8/15/21 | | 22 | | 23 | |
11.00%, 1/15/10 - 1/15/21 | | 165 | | 187 | |
11.50%, 2/15/13 - 11/15/19 | | 97 | | 109 | |
| | | | 77,640 | |
Asset Backed Corporates (18.5%) | | | | | |
ACE Securities Corp., | | | | | |
5.91%, 9/25/33(h) | | 392 | | 166 | |
Ameriquest Mortgage Securities, Inc., | | | | | |
4.36%, 8/25/34(h) | | 2,190 | | 1,426 | |
Amortizing Residential Collateral Trust, | | | | | |
6.96%, 1/25/33(h) | | 109 | | 4 | |
Capital Auto Receivables Asset Trust, | | | | | |
2.55%, 7/15/10(h) | | 3,000 | | 2,969 | |
4.98%, 5/15/11 | | 7,161 | | 7,088 | |
5.02%, 9/15/11 | | 5,250 | | 5,187 | |
5.31%, 10/20/09(e) | | 2,249 | | 2,250 | |
5.38%, 7/15/10 | | 9,100 | | 9,101 | |
Capital One Auto Finance Trust, | | | | | |
5.07%, 7/15/11 | | 2,245 | | 2,188 | |
Caterpillar Financial Asset Trust, | | | | | |
5.57%, 5/25/10 | | 2,000 | | 2,007 | |
CIT Equipment Collateral, | | | | | |
5.07%, 2/20/10 | | 2,882 | | 2,885 | |
CNH Equipment Trust, | | | | | |
5.20%, 6/15/10 | | 1,274 | | 1,277 | |
5.40%, 10/17/11 | | 3,000 | | 2,990 | |
Countrywide Asset Backed Certificates, | | | | | |
4.37%, 10/25/35(h) | | 685 | | 683 | |
Credit Based Asset Servicing & Securitization LLC, | | | | | |
3.25%, 7/25/36(h) | | 998 | | 985 | |
DaimlerChrysler Auto Trust, | | | | | |
5.00%, 2/8/12 | | 8,825 | | 8,701 | |
Ford Credit Auto Owner Trust, | | | | | |
2.52%, 8/15/11(h) | | 5,700 | | 5,493 | |
5.05%, 3/15/10 | | 998 | | 999 | |
5.26%, 10/15/10 | | 4,456 | | 4,464 | |
5.40%, 8/15/11 | | 8,950 | | 8,851 | |
GE Equipment Small Ticket LLC, | | | | | |
4.88%, 10/22/09(e) | | 761 | | 761 | |
Harley-Davidson Motorcycle Trust, | | | | | |
3.56%, 2/15/12 | | 1,867 | | 1,768 | |
3.76%, 12/17/12 | | 5,218 | | 4,893 | |
4.07%, 2/15/12 | | 3,521 | | 3,504 | |
4.41%, 6/15/12 | | 3,870 | | 3,855 | |
Hertz Vehicle Financing LLC, | | | | | |
4.93%, 2/25/10(e) | | 3,792 | | 3,732 | |
| | | | | | | |
| The accompanying notes are an integral part of the financial statements. | 95 |
2008 Annual Report
September 30, 2008
Portfolio of Investments (cont’d)
Limited Duration Portfolio
| | Face | | | |
| | Amount | | Value | |
| | (000) | | (000) | |
Asset Backed Corporates (cont’d) | | | | | |
Honda Auto Receivables Owner Trust, | | | | | |
4.85%, 10/19/09 | | $ | 622 | | $ | 623 | |
Hyundai Auto Receivables Trust, | | | | | |
5.04%, 1/17/12 | | 4,000 | | 4,000 | |
National City Auto Receivables Trust, | | | | | |
2.88%, 5/15/11 | | 1,020 | | 1,020 | |
Nationstar Home Equity Loan Trust, | | | | | |
3.27%, 6/25/37(h) | | 3,382 | | 3,214 | |
New Century Home Equity Loan Trust, | | | | | |
4.46%, 8/25/35(g) | | 121 | | 120 | |
Nissan Auto Receivables Owner Trust, | | | | | |
5.03%, 5/16/11 | | 3,125 | | 3,119 | |
USAA Auto Owner Trust, | | | | | |
4.90%, 2/15/12 | | 4,900 | | 4,867 | |
| | | | 105,190 | |
Collateralized Mortgage Obligations — Agency Collateral Series (1.0%) | | | | | |
Federal Home Loan Mortgage Corp., | | | | | |
PAC REMIC | | | | | |
3.50%, 5/15/22 | | 121 | | 121 | |
REMIC | | | | | |
7.50%, 9/15/29 | | 3,171 | | 3,314 | |
Federal National Mortgage Association, | | | | | |
PAC REMIC | | | | | |
5.50%, 1/25/24 | | 451 | | 451 | |
6.50%, 6/25/35 | | 1,856 | | 1,923 | |
| | | | 5,809 | |
Collateralized Mortgage Obligations — Non Agency Collateral Series (1.1%) | | | | | |
Countrywide Alternative Loan Trust, | | | | | |
IO | | | | | |
2.18%, 3/20/46 | | 22,864 | | 700 | |
2.56%, 2/25/37 | | 18,580 | | 476 | |
Greenpoint Mortgage Funding Trust, | | | | | |
IO | | | | | |
1.20%, 10/25/45 | | 15,984 | | 432 | |
1.30%, 8/25/45 | | 12,203 | | 268 | |
GS Mortgage Securities Corp., | | | | | |
IO | | | | | |
2.84%, 8/25/35(e)(h) | | 11,587 | | 167 | |
Harborview Mortgage Loan Trust, | | | | | |
IO | | | | | |
2.36%, 6/19/35(h) | | 16,362 | | 181 | |
2.59%, 5/19/35(h) | | 18,279 | | 183 | |
2.88%, 1/19/36(h) | | 24,968 | | 382 | |
2.93%, 3/19/37(h) | | 22,448 | | 523 | |
2.97%, 1/19/36(h) | | 11,125 | | 257 | |
3.03%, 7/19/47(h) | | 39,877 | | 810 | |
PO | | | | | |
3/19/47 - 7/19/47 | | 42 | | 6 | |
Indymac Index Mortgage Loan Trust, | | | | | |
IO | | | | | |
2.34%, 7/25/35(h) | | 14,357 | | 193 | |
Washington Mutual, Inc., | | | | | |
IO | | | | | |
0.51%, 6/25/44 | | 7,075 | | 102 | |
0.54%, 7/25/44 | | 12,737 | | 135 | |
0.57%, 10/25/44 | | 17,948 | | 179 | |
0.91%, 3/25/47 | | 106,198 | | 1,195 | |
| | | | 6,189 | |
Finance (11.8%) | | | | | |
American General Finance Corp., | | | | | |
4.63%, 5/15/09 - 9/1/10 | | 1,485 | | 994 | |
Bank of America Corp., | | | | | |
4.88%, 9/15/12 | | 2,130 | | 1,970 | |
Bank of Scotland plc, | | | | | |
5.63%, 7/20/09(e) | | 5,400 | | 5,391 | |
Bank One Corp., | | | | | |
6.00%, 2/17/09 | | 664 | | 660 | |
Capital One Financial Corp., | | | | | |
3.10%, 9/10/09(h) | | 3,240 | | 3,023 | |
Citicorp, | | | | | |
6.38%, 11/15/08 | | 1,055 | | 1,056 | |
Citigroup, Inc., | | | | | |
3.63%, 2/9/09 | | 2,655 | | 2,599 | |
4.63%, 8/3/10 | | 1,120 | | 1,023 | |
5.30%, 10/17/12 | | 1,625 | | 1,448 | |
Credit Suisse USA, Inc., | | | | | |
6.13%, 11/15/11 | | 1,040 | | 1,024 | |
General Electric Capital Corp., | | | | | |
5.45%, 1/15/13 | | 6,200 | | 5,798 | |
Goldman Sachs Group, Inc. (The), | | | | | |
5.45%, 11/1/12 | | 2,775 | | 2,354 | |
6.88%, 1/15/11 | | 2,550 | | 2,439 | |
HSBC Finance Corp., | | | | | |
4.13%, 12/15/08 | | 760 | | 752 | |
5.88%, 2/1/09 | | 1,080 | | 1,069 | |
6.38%, 10/15/11 | | 285 | | 282 | |
6.75%, 5/15/11 | | 630 | | 634 | |
JPMorgan Chase & Co., | | | | | |
6.75%, 2/1/11 | | 2,600 | | 2,610 | |
Lehman Brothers Holdings, Inc., | | | | | |
Zero Coupon, 12/23/08(b) | | 2,130 | | 277 | |
Mantis Reef Ltd., | | | | | |
4.69%, 11/14/08(e) | | 2,350 | | 2,349 | |
Mellon Funding Corp., | | | | | |
6.40%, 5/14/11 | | 2,465 | | 2,445 | |
Metropolitan Life Global Funding I, | | | | | |
4.63%, 8/19/10(e) | | 4,310 | | 4,331 | |
Monumental Global Funding II, | | | | | |
4.38%, 7/30/09(e) | | 2,335 | | 2,305 | |
Popular North America, Inc., | | | | | |
5.65%, 4/15/09 | | 2,245 | | 2,218 | |
Pricoa Global Funding I, | | | | | |
3.90%, 12/15/08(e) | | 2,930 | | 2,918 | |
| | | | | | | |
96 | The accompanying notes are an integral part of the financial statements. | |
| 2008 Annual Report |
| |
| September 30, 2008 |
Portfolio of Investments (cont’d)
Limited Duration Portfolio
| | Face | | | |
| | Amount | | Value | |
| | (000) | | (000) | |
Finance (cont’d) | | | | | |
Principal Life Income Funding Trusts, | | | | | |
5.15%, 6/17/11 | | $ | 2,450 | | $ | 2,468 | |
Santander Central Hispano Issuance Ltd., | | | | | |
7.63%, 11/3/09 | | 3,900 | | 3,939 | |
Sovereign Bancorp, | | | | | |
3.44%, 3/23/10(h) | | 3,160 | | 2,244 | |
Wachovia Corp., | | | | | |
5.30%, 10/15/11 | | 2,100 | | 1,752 | |
Wells Fargo Bank N.A., | | | | | |
6.45%, 2/1/11 | | 2,380 | | 2,418 | |
Xlliac Global Funding, | | | | | |
4.80%, 8/10/10(e) | | 2,485 | | 2,390 | |
| | | | 67,180 | |
Industrials (10.9%) | | | | | |
Amgen, Inc., | | | | | |
4.00%, 11/18/09 | | 2,150 | | 2,130 | |
AT&T, Inc., | | | | | |
2.89%, 2/5/10(h) | | 3,145 | | 3,134 | |
5.30%, 11/15/10 | | 600 | | 610 | |
BAE Systems Holdings, Inc., | | | | | |
4.75%, 8/15/10(e) | | 2,200 | | 2,233 | |
BellSouth Corp., | | | | | |
6.00%, 10/15/11 | | 3,670 | | 3,680 | |
British Telecommunications plc, | | | | | |
8.13%, 12/15/10 | | 1,400 | | 1,464 | |
Brookfield Asset Management, Inc., | | | | | |
8.13%, 12/15/08 | | 2,555 | | 2,567 | |
Burlington Northern Santa Fe Corp., | | | | | |
6.13%, 3/15/09 | | 3,165 | | 3,165 | |
Comcast Cable Communications, Inc., | | | | | |
6.88%, 6/15/09 | | 1,110 | | 1,121 | |
Comcast Corp., | | | | | |
5.85%, 1/15/10 | | 900 | | 906 | |
ConocoPhillips, | | | | | |
8.75%, 5/25/10 | | 2,900 | | 3,116 | |
COX Communications, Inc., | | | | | |
4.63%, 1/15/10 | | 1,600 | | 1,577 | |
CVS Caremark Corp., | | | | | |
4.00%, 9/15/09 | | 2,710 | | 2,658 | |
DaimlerChrysler North America LLC, | | | | | |
3.25%, 3/13/09(h) | | 2,425 | | 2,415 | |
Deutsche Telekom International Finance B.V., | | | | | |
8.50%, 6/15/10 | | 2,245 | | 2,331 | |
FedEx Corp., | | | | | |
5.50%, 8/15/09 | | 2,100 | | 2,092 | |
France Telecom S.A., | | | | | |
7.75%, 3/1/11 | | 2,200 | | 2,310 | |
Honeywell International, Inc., | | | | | |
6.13%, 11/1/11 | | 2,175 | | 2,297 | |
Hospira, Inc., | | | | | |
4.24%, 3/30/10(h) | | 2,130 | | 2,069 | |
Kraft Foods, Inc., | | | | | |
4.00%, 10/1/08 | | 910 | | 910 | |
4.13%, 11/12/09 | | 2,560 | | 2,542 | |
Macy’s Retail Holdings, Inc., | | | | | |
6.30%, 4/1/09 | | 790 | | 783 | |
Oracle Corp., | | | | | |
5.00%, 1/15/11 | | 1,540 | | 1,577 | |
Safeway, Inc., | | | | | |
7.50%, 9/15/09 | | 1,585 | | 1,549 | |
Sealed Air Corp., | | | | | |
6.95%, 5/15/09(e) | | 440 | | 442 | |
Telecom Italia Capital S.A., | | | | | |
4.88%, 10/1/10 | | 2,400 | | 2,334 | |
Time Warner, Inc., | | | | | |
3.03%, 11/13/09(h) | | 3,310 | | 3,179 | |
Tyco Electronics Group S.A., | | | | | |
5.95%, 1/15/14 | | 1,350 | | 1,329 | |
UnitedHealth Group, Inc., | | | | | |
4.13%, 8/15/09 | | 1,065 | | 1,056 | |
Verizon Global Funding Corp., | | | | | |
7.25%, 12/1/10 | | 1,140 | | 1,187 | |
Viacom, Inc., | | | | | |
3.17%, 6/16/09(h) | | 1,270 | | 1,257 | |
5.75%, 4/30/11 | | 2,145 | | 2,085 | |
| | | | 62,105 | |
Mortgages — Other (18.4%) | | | | | |
American Home Mortgage Assets, | | | | | |
3.44%, 5/25/46(d)(h) | | 4,699 | | 1,691 | |
3.45%, 6/25/47(h) | | 7,732 | | 2,474 | |
3.47%, 10/25/46(d)(h) | | 7,171 | | 2,051 | |
3.51%, 6/25/47(d)(h) | | 3,016 | | 444 | |
3.53%, 10/25/46(d)(h) | | 3,044 | | 548 | |
American Home Mortgage Investment Trust, | | | | | |
4.34%, 2/25/44(h) | | 529 | | 429 | |
Banc of America Mortgage Securities, Inc., | | | | | |
4.37%, 1/25/35(h) | | 4,002 | | 3,650 | |
4.52%, 7/25/34(h) | | 636 | | 598 | |
Bear Stearns Mortgage Funding Trust, | | | | | |
3.39%, 10/25/36(d)(h) | | 5,665 | | 3,229 | |
Citigroup Mortgage Loan Trust, Inc., | | | | | |
3.91%, 8/25/34(h) | | 940 | | 855 | |
4.45%, 9/25/34(h) | | 1,747 | | 1,387 | |
Countrywide Alternative Loan Trust, | | | | | |
3.40%, 11/25/46(d)(h) | | 3,984 | | 2,310 | |
3.46%, 9/25/47(d)(h) | | 5,022 | | 2,716 | |
3.61%, 2/25/35 - 4/25/35(h) | | 7,587 | | 6,134 | |
3.71%, 5/25/35(h) | | 5,929 | | 5,049 | |
Countrywide Home Loan Mortgage | | | | | |
Pass Through Trust, | | | | | |
4.54%, 11/20/34(h) | | 2,296 | | 1,801 | |
| | | | | | | |
The accompanying notes are an integral part of the financial statements. | 97 |
2008 Annual Report | |
| |
September 30, 2008 | |
Portfolio of Investments (cont’d)
Limited Duration Portfolio
| | Face | | | |
| | Amount | | Value | |
| | (000) | | (000) | |
Mortgages — Other (cont’d) | | | | | |
Downey Savings & Loan Association | | | | | |
Mortgage Loan Trust, | | | | | |
3.33%, 8/19/45(d)(h) | | $ | 4,884 | | $ | 1,906 | |
3.40%, 10/19/45(d)(h) | | 4,957 | | 1,915 | |
First Horizon Alternative Mortgage Securities, | | | | | |
3.71%, 4/25/35(h) | | 6,268 | | 5,112 | |
6.00%, 2/25/37 | | 6,521 | | 5,954 | |
First Horizon Asset Securities, Inc., | | | | | |
3.97%, 6/25/34(h) | | 426 | | 390 | |
5.11%, 10/25/34(h) | | 1,061 | | 943 | |
Greenpoint Mortgage Funding Trust, | | | | | |
3.44%, 1/25/37(d)(h) | | 6,049 | | 1,996 | |
4.86%, 3/25/36(d)(h) | | 2,667 | | 1,694 | |
Harborview Mortgage Loan Trust, | | | | | |
3.23%, 1/25/47(d)(h) | | 5,289 | | 1,845 | |
3.27%, 11/19/36(d)(h) | | 6,999 | | 2,531 | |
3.39%, 2/19/36(d)(h) | | 4,035 | | 1,477 | |
3.79%, 6/20/35(d)(h)(l) | | 1,575 | | 394 | |
4.86%, 10/19/35 - 1/19/36(d)(h) | | 12,544 | | 7,260 | |
Indymac Index Mortgage Loan Trust, | | | | | |
3.96%, 7/25/34(d)(h)(l) | | 1,227 | | 307 | |
Lehman XS Net Interest Margin Notes, | | | | | |
6.50%, 4/28/46(d)(e) | | 38 | | 1 | |
Luminent Mortgage Trust, | | | | | |
3.46%, 5/25/36(d)(h) | | 3,289 | | 1,151 | |
Merrill Lynch Mortgage Investors, Inc., | | | | | |
4.79%, 7/25/34(h) | | 497 | | 466 | |
Residential Accredit Loans, Inc., | | | | | |
3.38%, 3/25/37(d)(h) | | 6,042 | | 1,686 | |
3.40%, 2/25/37(d)(h) | | 8,575 | | 2,412 | |
3.61%, 10/25/45(d)(h) | | 4,350 | | 1,477 | |
Structured Asset Mortgage Investments, Inc., | | | | | |
3.40%, 2/25/36(d)(h) | | 1,826 | | 968 | |
3.40%, 2/25/37(d)(h) | | 4,630 | | 1,574 | |
3.42%, 1/25/37(h) | | 5,871 | | 2,024 | |
3.52%, 2/25/36(h) | | 2,343 | | 970 | |
Washington Mutual Mortgage | | | | | |
Pass Through Certificates, | | | | | |
3.50%, 8/25/45(h) | | 49 | | 49 | |
Washington Mutual, Inc., | | | | | |
3.41%, 2/25/47(d)(h) | | 5,258 | | 1,436 | |
3.57%, 10/25/45(d)(h) | | 2,417 | | 978 | |
3.80%, 5/25/46(d)(h) | | 5,154 | | 2,165 | |
3.84%, 7/25/46(h) | | 5,682 | | 3,092 | |
3.86%, 8/25/46(d)(h) | | 7,884 | | 4,179 | |
Wells Fargo Mortgage Backed Securities Trust, | | | | | |
3.46%, 9/25/34(h) | | 867 | | 761 | |
4.17%, 6/25/35(h) | | 6,433 | | 5,644 | |
4.57%, 12/25/34(h) | | 4,857 | | 4,236 | |
6.32%, 7/25/34(h) | | 110 | | 102 | |
| | | | 104,461 | |
U.S. Treasury Security (0.5%) | | | | | |
U.S. Treasury Bond STRIPS, Zero Coupon, 5/15/21 | | 5,755 | | 3,233 | |
Utilities (3.0%) | | | | | |
Columbus Southern Power Co., | | | | | |
4.40%, 12/1/10 | | 1,750 | | 1,732 | |
Enbridge Energy Partners, LP, | | | | | |
4.00%, 1/15/09 | | 3,520 | | 3,495 | |
Enterprise Products Operating LP, | | | | | |
7.50%, 2/1/11 | | 1,455 | | 1,499 | |
Ohio Power Co., | | | | | |
2.97%, 4/5/10(h) | | 2,025 | | 1,987 | |
Pacific Gas & Electric Co., | | | | | |
3.60%, 3/1/09 | | 2,110 | | 2,093 | |
Public Service Co. of Colorado, | | | | | |
6.88%, 7/15/09 | | 870 | | 888 | |
Sempra Energy, | | | | | |
4.75%, 5/15/09 | | 3,025 | | 3,026 | |
Southwestern Public Service Co., | | | | | |
6.20%, 3/1/09 | | 2,260 | | 2,281 | |
| | | | 17,001 | |
Total Fixed Income Securities (Cost $591,965) | | | | 477,036 | |
| | Shares | | | |
Short-Term Investments (15.9%) | | | | | |
Investment Company (2.7%) | | | | | |
Morgan Stanley Institutional Liquidity | | | | | |
Money Market Portfolio — Institutional Class(p) | | 15,462,258 | | 15,462 | |
| | Face | | | |
| | Amount | | | |
| | (000) | | | |
U.S. Government & Agency Securities (7.0%) | | | | | |
Federal Home Loan Bank, | | | | | |
2.05%, 10/15/08(t) | | $ | 8,000 | | 7,998 | |
2.35%, 10/22/08(t) | | 9,500 | | 9,497 | |
Federal Home Loan Mortgage Corp., | | | | | |
2.10%, 10/20/08(t) | | 5,500 | | 5,499 | |
Federal National Mortgage Association, | | | | | |
2.36%, 11/10/08(t) | | 17,000 | | 16,964 | |
| | | | 39,958 | |
U.S. Treasury Securities (6.2%) | | | | | |
U.S. Treasury Bills, | | | | | |
0.17%, 10/9/08(r)(j) | | 2,415 | | 2,415 | |
0.25%, 10/30/08(r) | | 17,000 | | 16,994 | |
0.95%, 1/15/09(r)(j) | | 680 | | 678 | |
1.01%, 1/8/09(r) | | 15,000 | | 14,959 | |
| | | | 35,046 | |
Total Short-Term Investments (Cost $90,423) | | | | 90,466 | |
Total Investments (99.8%) (Cost $682,388) | | | | 567,502 | |
Other Assets in Excess of Liabilities (0.2%) | | | | 948 | |
Net Assets (100%) | | | | $ | 568,450 | |
98 | The accompanying notes are an integral part of the financial statements. |
| 2008 Annual Report |
| |
| September 30, 2008 |
Portfolio of Investments (cont’d)
Limited Duration Portfolio
(b) | | Issuer is in default. |
(d) | | Security was valued at fair value — At September 30, 2008, the Portfolio held $52,341,000 of fair valued securities, representing 9.2% of net assets. |
(e) | | 144A security — Certain conditions for public sale may exist. Unless otherwise noted, these securities are deemed to be liquid. |
(g) | | Step Bond — Coupon rate increases in increments to maturity. Rate disclosed is as of September 30, 2008. Maturity date disclosed is the ultimate maturity date. |
(h) | | Variable/Floating Rate Security — Interest rate changes on these instruments are based on changes in a designated rate. The rates shown are those in effect on September 30, 2008. |
(j) | | All or a portion of the security was pledged to cover margin requirements for futures contracts. |
(l) | | Security has been deemed illiquid — At September 30, 2008. |
(p) | | See Note G within the Notes to Financial Statements regarding investment in Morgan Stanley Institutional Liquidity Money Market Portfolio — Institutional Class. |
(r) | | Rate shown is the yield to maturity at September 30, 2008. |
(t) | | Purchased on a discount basis. The interest rate shown has been adjusted to reflect a money market equivalent yield. |
IO | | Interest Only |
PAC | | Planned Amortization Class |
PO | | Principal Only |
REMIC | | Real Estate Mortgage Investment Conduit |
STRIPS | | Separate Trading of Registered Interest and Principal of Securities |
The Portfolio had the following futures contract(s) open at period end:
| | | | | | | | Net | |
| | | | | | | | Unrealized | |
| | Number | | | | | | Appreciation | |
| | of | | Value | | Expiration | | (Depreciation) | |
| | Contracts | | (000) | | Date | | (000) | |
Long: | | | | | | | | | |
U.S. Treasury 10 yr. Note | | 436 | | $ 49,977 | | Dec-08 | | $ (468 | ) |
Short: | | | | | | | | | |
U.S. Treasury 2 yr. Note | | 1,047 | | 223,469 | | Dec-08 | | (1,381 | ) |
U.S. Treasury 5 yr. Note | | 434 | | 48,710 | | Dec-08 | | (224 | ) |
U.S. Treasury Long Bond | | 35 | | 4,101 | | Dec-08 | | 9 | |
5 yr. Swap | | 340 | | 36,890 | | Dec-08 | | 343 | |
10 yr. Swap | | 370 | | 41,382 | | Dec-08 | | | 565 | |
| | | | | | | | | $(1,156 | ) |
| | | | | | | | | | |
| | | | | | | | | | | |
The accompanying notes are an integral part of the financial statements. | 99 |
2008 Annual Report | |
| |
September 30, 2008 | |
Portfolio of Investments (cont’d)
Limited Duration Portfolio
Credit Default Swap Contracts |
The Portfolio had the following credit default swap agreement(s) open at period end:
| | | | | | | | | | Unrealized | |
| | | | Notional | | | | | | Appreciation | |
| | Buy/Sell | | Amount | | Pay/Receive | | Termination | | (Depreciation) | |
Swap Counterparty and Reference Obligation | | Protection | | (000) | | Fixed Rate | | Date | | (000) | |
Barclays Bank plc Dow Jones CDX North America Investment | | | | | | | | | | | |
Grade Index, Series 9 | | Buy | | $7,900 | | 0.60 | % | 12/20/12 | | $ (73 | ) | |
Goldman Sachs Dow Jones CDX North America Investment | | | | | | | | | | | | |
Grade Index, Series 8 | | Sell | | 8,000 | | 0.35 | | 6/20/12 | | | (293 | ) | |
| | | | | | | | | | | $(366 | ) | |
| | | | | | | | | | | | | |
| | | | | | | | | | | | | | |
Interest Rate Swap Contracts
The Portfolio had the following interest rate swap agreement(s)open at period end:
| | | | | | | | | | | | Unrealized | |
| | | | | | | | | | Notional | | Appreciation | |
| | Floating Rate | | Pay/Receive | | Fixed | | Termination | | Amount | | (Depreciation) | |
Swap Counterparty | | Index | | Floating Rate | | Rate | | Date | | (000) | | (000) | |
Bank of America | | 3 Month LIBOR | | Pay | | 4.21 | % | 6/3/13 | | $100,000 | | $1,976 | | |
| | 3 Month LIBOR | | Receive | | 5.38 | | 7/24/18 | | 21,236 | | (327 | ) | |
| | 3 Month LIBOR | | Pay | | 5.56 | | 2/19/18 | | 8,213 | | 193 | | |
| | 3 Month LIBOR | | Pay | | 5.07 | | 4/14/18 | | 6,410 | | 32 | | |
| | 3 Month LIBOR | | Pay | | 4.98 | | 4/15/18 | | 2,315 | | 4 | | |
| | 3 Month LIBOR | | Receive | | 6.00 | | 2/19/23 | | 10,678 | | (283 | ) | |
| | 3 Month LIBOR | | Receive | | 5.47 | | 4/14/23 | | 8,210 | | (92 | ) | |
| | 3 Month LIBOR | | Receive | | 5.38 | | 4/15/23 | | 2,350 | | (20 | ) | |
| | 3 Month LIBOR | | Pay | | 5.56 | | 7/24/23 | | 27,153 | | 367 | | |
Citigroup | | 3 Month LIBOR | | Pay | | 2.90 | | 2/28/10 | | 20,500 | | (78 | ) | |
Deutsche Bank | | 3 Month LIBOR | | Pay | | 4.55 | | 10/23/09 | | 21,200 | | 597 | | |
| | 3 Month LIBOR | | Pay | | 4.43 | | 11/8/09 | | 21,000 | | 560 | | |
| | 6 Month EUR LIBOR | | Receive | | 4.93 | | 7/1/18 | | 27,465 | | (333 | ) | |
| | 6 Month EUR LIBOR | | Pay | | 4.96 | | 7/24/18 | | 13,733 | | 182 | | |
| | 6 Month EUR LIBOR | | Pay | | 5.27 | | 7/2/23 | | 34,375 | | 511 | | |
| | 6 Month EUR LIBOR | | Receive | | 5.19 | | 7/24/23 | | 17,188 | | (200 | ) | |
Goldman Sachs | | 3 Month LIBOR | | Pay | | 5.07 | | 10/5/08 | | 11,000 | | 201 | | |
| | 3 Month LIBOR | | Pay | | 4.64 | | 9/11/09 | | 21,200 | | 329 | | |
| | 3 Month LIBOR | | Pay | | 5.63 | | 2/28/18 | | 22,335 | | 580 | | |
| | 3 Month LIBOR | | Receive | | 6.04 | | 2/28/23 | | 28,925 | | (797 | ) | |
JPMorgan Chase | | 3 Month LIBOR | | Pay | | 5.20 | | 10/13/08 | | 13,500 | | 256 | | |
| | 3 Month LIBOR | | Pay | | 4.96 | | 3/12/09 | | 21,500 | | 204 | | |
| | 3 Month LIBOR | | Pay | | 5.39 | | 6/6/09 | | 21,200 | | 654 | | |
| | 3 Month LIBOR | | Pay | | 5.49 | | 6/14/09 | | 21,300 | | 680 | | |
| | 3 Month LIBOR | | Pay | | 5.36 | | 6/28/09 | | 21,300 | | 612 | | |
| | 3 Month LIBOR | | Pay | | 5.33 | | 1/30/09 | | 10,700 | | 107 | | |
| | 3 Month LIBOR | | Pay | | 5.36 | | 7/13/09 | | 21,350 | | 451 | | |
| | 3 Month LIBOR | | Pay | | 5.08 | | 8/1/09 | | 22,000 | | 415 | | |
| | 3 Month LIBOR | | Pay | | 4.79 | | 9/20/09 | | 21,100 | | 346 | | |
| | 3 Month LIBOR | | Pay | | 4.78 | | 10/18/09 | | 21,000 | | 664 | | |
| | 3 Month LIBOR | | Pay | | 4.38 | | 10/29/09 | | 21,300 | | 548 | | |
| | 3 Month LIBOR | | Pay | | 4.14 | | 12/12/09 | | 21,000 | | 489 | | |
| | 3 Month LIBOR | | Pay | | 3.99 | | 12/14/09 | | 22,000 | | 465 | | |
| | 3 Month LIBOR | | Pay | | 2.79 | | 2/4/10 | | 20,500 | | (123 | ) | |
| | 3 Month LIBOR | | Pay | | 4.18 | | 6/9/13 | | 13,000 | | 239 | | |
Merrill Lynch | | 3 Month LIBOR | | Pay | | 5.00 | | 4/15/18 | | 3,085 | | 7 | | |
| | 3 Month LIBOR | | Receive | | 5.40 | | 4/16/23 | | 3,300 | | | (30 | ) | |
| | | | | | | | | | | | | $9,386 | | |
| | | | | | | | | | | | | |
| | | | | | | | | | | | | | | | |
EUR | | — Euro |
LIBOR | | — London Inter Bank Offer Rate |
100 | The accompanying notes are an integral part of the financial statements. |
| 2008 Annual Report |
| |
| September 30, 2008 |
Portfolio of Investments (cont’d)
Limited Duration Portfolio
Zero Coupon Swap Contracts |
The Portfolio had the following zero coupon swap agreement(s) open at period end:
| | | | | | | | Unrealized | |
| | Notional | | | | | | Appreciation | |
| | Amount | | | | Termination | | (Depreciation) | |
Swap Counterparty | | (000) | | Receive | | Date | | (000) | |
JPMorgan Chase | | | | | | | | | |
| | $3,235 | | 3 Month LIBOR | | 5/15/21 | | | $— | | |
| | | | | | | | | $— | | |
| | | | | | | | | |
LIBOR — London Inter Bank Offer Rate
The accompanying notes are an integral part of the financial statements. | 101 |
2008 Annual Report | |
| |
September 30, 2008 | |
Investment Overview (unaudited)
Long Duration Fixed Income Portfolio
The Long Duration Fixed Income Portfolio seeks an above-average total return over a market cycle of three to five years. The Portfolio invests primarily in a diversified mix of U.S. dollar-denominated investment grade fixed income securities, particularly U.S. government, corporate and mortgage securities. The securities in which the Portfolio invests carry an investment grade rating or, if unrated, are determined to be of a comparable quality by the Adviser, at the time of purchase and the Portfolio may continue to hold such securities in the event they are downgraded to below investment grade. The Portfolio will ordinarily seek to maintain an average duration of approximately ten or more years. Although there is no minimum or maximum maturity for any individual security, the Adviser actively manages the interest rate risk of the Portfolio within a range relative to its benchmark. The Portfolio may invest in TBAs. The Portfolio may invest in securities of foreign issuers, including issuers located in emerging market countries. The securities in which the Portfolio may invest also may be denominated in currencies other than U.S. dollars. The Portfolio may invest in asset-backed securities and may use futures, options, CMOs, swaps, options on swaps and other derivatives.
Performance
For the fiscal year ended September 30, 2008, the Portfolio’s Class I had a total return based on net asset value and reinvestment of distributions per share of 0.87%, net of fees. The Portfolio’s Class I outperformed against its benchmark the Lehman Brothers U.S. Long Government/Credit Index (the “Index”) which returned - -0.37%.
Factors Affecting Performance
· The financial markets were under pressure throughout the period amid disrupted credit markets, ongoing deterioration of the housing market, losses in the financial sector, and growing fears of recession.
· The third quarter of 2008, however, will most certainly go down as a defining moment in the history of the financial industry. Investor confidence plummeted and credit markets seized as several venerable financial institutions were forced into mergers or dissolved entirely in September, resulting in significant price erosion across all but the U.S. Treasury sector.
· We maintained an underweight to corporate credits for much of the period, which was additive to relative performance as credit spreads significantly widened, particularly in the financial sector.
· Yield-curve positioning was also beneficial to performance as it enabled the Portfolio to benefit from the steepening of the yield curve that occurred during the reporting year.
· A small position in agency mortgage-backed securities detracted from performance as prices in the sector declined amid widening spreads and diminished liquidity.
Management Strategies
· During 2007 and into the first quarter of 2008, we maintained an underweight allocation to corporate credits with an emphasis on high-quality names. In response to sharp spread widening later in the period, this position was brought to a neutral stance.
· With regard to yield-curve positioning, we underweighted longer-dated issues and overweighted intermediate-dated issues in the first half of 2008, a strategy that helped enhance returns as the spread between intermediate-and long-dated yields widened and the curve steepened. This trade was removed during the third quarter of the year and as a result, the Portfolio held a neutral duration, or interest-rate sensitivity, at the end of the period.
| 2008 Annual Report |
| |
| September 30, 2008 |
Investment Overview (cont’d)
Long Duration Fixed Income Portfolio
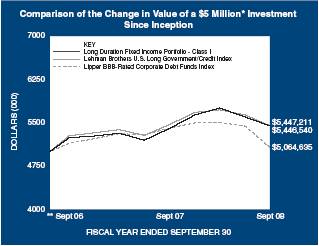
* | | Minimum Investment |
** | | Commenced operations on July 21, 2006. |
In accordance with SEC regulations, the Portfolio’s performance shown assumes that all recurring fees (including management fees) were deducted and all dividends and distributions were reinvested. The performance of Class shares P will vary from the Class I shares based upon their different inception dates and will be negatively impacted by additional fees assessed to that class.
Performance Compared to the Lehman Brothers U.S. Long Government/Credit Index(1) and Lipper BBB-Rated Corporate Debt Funds Index(2)
| | Total Returns(3) | |
| | | | Average Annual | |
| | One | | Since | |
| | Year | | Inception(5) | |
Portfolio – Class I (4) | | 0.87 | % | 3.98 | % |
Lehman Brothers U.S. Long Government/Credit Index | | (0.37 | ) | 3.97 | |
Lipper BBB-Rated Corporate Debt Funds Index | | (6.31 | ) | 0.84 | |
| | | | | |
Portfolio – Class P (4) | | 0.61 | | 3.71 | |
Lehman Brothers U.S. Long Government/Credit Index | | (0.37 | ) | 3.97 | |
Lipper BBB-Rated Corporate Debt Funds Index | | (6.31 | ) | 0.84 | |
| | | | | | | |
Performance data quoted represents past performance, which is no guarantee of future results, and current performance may be lower or higher than the figures shown. Performance assumes that all dividends and distributions, if any, were reinvested. For the most recent month-end performance figures, please visit www.morganstanley.com/msim. Investment return and principal value will fluctuate so that Portfolio shares, when redeemed, may be worth more or less than their original cost. Total returns do not reflect the deduction of taxes that a shareholder would pay on Portfolio distributions or the redemption of Portfolio shares. Performance of share classes will vary due to differences in sales charges and expenses.
(1) | | The Lehman Brothers U.S. Long Government/Credit Index tracks the securities in the long maturity range of the Lehman Brothers U.S. Government/Credit Index which tracks investment-grade (BBB-/Baa3) or higher publicly traded fixed-rate U.S. government, U.S. agency and corporate issues. The Index is unmanaged and its returns do not include any sales charges or fees. Such costs would lower performance. It is not possible to invest directly in an index. |
(2) | | The Lipper BBB-Rated Corporate Debt Funds Index is an equally weighted performance index of the largest qualifying funds (based on net assets) in the Lipper Corporate Debt Funds BBB-Rated classification. The Index, which is adjusted for capital gains distributions and income dividends, is unmanaged and should not be considered an investment. There are currently 30 funds represented in this Index. As of the date of this report, the Portfolio was in the Lipper BBB-Rated Corporate Debt Funds classification. |
(3) | | Total returns for the Portfolio reflect expenses waived and/or reimbursed, if applicable, by the Adviser. Without such waivers and/or reimbursements, total returns would have been lower. Fee waivers and/or reimbursements are voluntary and the Adviser reserves the right to commence or terminate any waiver and/or reimbursement at any time. |
(4) | | Commenced operations on July 21, 2006. |
(5) | | For comparative purposes, average annual since inception returns listed for the Indexes refer to the inception date or initial offering of the respective share class of the Portfolio, not the inception of the Indexes. |
Portfolio Composition
| | Percentage of | |
Classification | | Total Investments | |
U.S. Treasury Securities | | 28.4 | % |
Industrials | | 24.5 | |
Finance | | 10.4 | |
Agency Fixed Rate Mortgages | | 6.5 | |
Utilities | | 6.4 | |
Other* | | 3.2 | |
Short-Term Investments | | | 20.6 | |
Total Investments | | | 100.0 | % |
* Industries and/or investment types which do not appear in the above table, as well as those which represent less than 5% of total investments, if applicable, are included in the category labeled “Other”.
The accompanying notes are an integral part of the financial statements. | 103 |
2008 Annual Report | |
| |
September 30, 2008 | |
Portfolio of Investments
Long Duration Fixed Income Portfolio
| | Face | | | |
| | Amount | | Value | |
| | (000) | | (000) | |
Fixed Income Securities (78.9%) | | | | | |
Agency Fixed Rate Mortgages (6.5%) | | | | | |
Federal Home Loan Mortgage Corp., | | | | | |
Conventional Pools: | | | | | |
6.75%, 3/15/31 | | $ | 630 | | $ | 774 | |
Federal National Mortgage Association, | | | | | |
Conventional Pools: | | | | | |
6.63%, 11/15/30 | | 175 | | 212 | |
7.25%, 5/15/30 | | 645 | | 831 | |
| | | | 1,817 | |
Collateralized Mortgage Obligations — Agency Collateral Series (1.7%) | | | | | |
Federal National Mortgage Association, | | | | | |
REMIC | | | | | |
5.00%, 6/25/35 | | 195 | | 195 | |
Government National Mortgage Association, | | | | | |
3.79%, 8/20/30(h) | | 284 | | 284 | |
| | | | 479 | |
Finance (10.4%) | | | | | |
Abbey National plc, | | | | | |
7.95%, 10/26/29 | | 50 | | 48 | |
Aetna, Inc., | | | | | |
6.63%, 6/15/36 | | 40 | | 37 | |
AIG SunAmerica Global Financing X, | | | | | |
6.90%, 3/15/32(e) | | 17 | | 13 | |
Allstate Corp., | | | | | |
5.95%, 4/1/36 | | 50 | | 41 | |
Bank of America N.A., | | | | | |
6.00%, 10/15/36 | | 365 | | 305 | |
Bank One Corp., | | | | | |
8.00%, 4/29/27 | | 250 | | 241 | |
BB&T Corp., | | | | | |
5.25%, 11/1/19 | | 90 | | 69 | |
Bear Stearns Cos. LLC (The), | | | | | |
7.25%, 2/1/18 | | 150 | | 145 | |
Berkshire Hathaway Finance Corp., | | | | | |
5.40%, 5/15/18(e) | | 95 | | 92 | |
Chubb Corp., | | | | | |
6.50%, 5/15/38 | | 40 | | 36 | |
Citigroup, Inc., | | | | | |
5.85%, 12/11/34 | | 325 | | 224 | |
6.13%, 8/25/36 | | 100 | | 65 | |
Credit Suisse, New York, | | | | | |
6.00%, 2/15/18 | | 110 | | 96 | |
Farmers Exchange Capital, | | | | | |
7.05%, 7/15/28(e) | | 100 | | 80 | |
General Electric Capital Corp., | | | | | |
5.88%, 1/14/38 | | 255 | | 189 | |
6.75%, 3/15/32 | | 230 | | 192 | |
Goldman Sachs Group, Inc. (The), | | | | | |
6.13%, 2/15/33 | | 50 | | 36 | |
6.75%, 10/1/37 | | 300 | | 201 | |
HSBC Holdings plc, | | | | | |
6.50%, 5/2/36 | | 235 | | 195 | |
JPMorgan Chase & Co., | | | | | |
6.40%, 5/15/38 | | 15 | | 13 | |
Lehman Brothers Holdings, Inc., | | | | | |
6.88%, 7/17/37(b) | | 175 | | 1 | |
Merrill Lynch & Co., Inc., | | | | | |
6.11%, 1/29/37 | | 100 | | 70 | |
7.75%, 5/14/38 | | 100 | | 84 | |
MetLife, Inc., | | | | | |
5.70%, 6/15/35 | | 95 | | 75 | |
Nationwide Building Society, | | | | | |
4.25%, 2/1/10(e) | | 105 | | 103 | |
Platinum Underwriters Finance, Inc., | | | | | |
7.50%, 6/1/17 | | 15 | | 14 | |
Popular North America, Inc., | | | | | |
5.65%, 4/15/09 | | 50 | | 49 | |
Prudential Financial, Inc., | | | | | |
5.90%, 3/17/36 | | 30 | | 23 | |
6.63%, 12/1/37 | | 20 | | 17 | |
Sovereign Bancorp, | | | | | |
3.44%, 3/23/10(h) | | 105 | | 75 | |
Travelers Cos., Inc. (The), | | | | | |
5.80%, 5/15/18 | | 25 | | 23 | |
6.75%, 6/20/36 | | 25 | | 23 | |
WellPoint, Inc., | | | | | |
6.38%, 6/15/37 | | 25 | | 21 | |
| | | | 2,896 | |
Industrials (24.3%) | | | | | |
Alcan, Inc., | | | | | |
6.13%, 12/15/33 | | 25 | | 21 | |
Alcoa, Inc., | | | | | |
5.95%, 2/1/37 | | 50 | | 39 | |
Anadarko Petroleum Corp., | | | | | |
6.45%, 9/15/36 | | 50 | | 39 | |
Apache Corp., | | | | | |
6.00%, 1/15/37 | | 30 | | 25 | |
Archer-Daniels-Midland Co., | | | | | |
5.45%, 3/15/18 | | 5 | | 5 | |
Archer-Daniels-Midland Co., | | | | | |
6.45%, 1/15/38 | | 15 | | 14 | |
6.63%, 5/1/29 | | 35 | | 33 | |
Astrazeneca plc, | | | | | |
6.45%, 9/15/37 | | 85 | | 82 | |
AT&T Corp., | | | | | |
8.00%, 11/15/31 | | 410 | | 416 | |
AT&T, Inc., | | | | | |
6.40%, 5/15/38 | | 155 | | 130 | |
Baxter International, Inc., | | | | | |
6.25%, 12/1/37 | | 85 | | 81 | |
BellSouth Corp., | | | | | |
6.55%, 6/15/34 | | 80 | | 69 | |
Biogen Idec, Inc., | | | | | |
6.88%, 3/1/18 | | 70 | | 69 | |
| | | | | | | |
104 | The accompanying notes are an integral part of the financial statements. |
| 2008 Annual Report |
| |
| September 30, 2008 |
Portfolio of Investments (cont’d)
Long Duration Fixed Income Portfolio
| | Face | | | |
| | Amount | | Value | |
| | (000) | | (000) | |
Industrials (cont’d) | | | | | |
Boeing Co., | | | | | |
6.13%, 2/15/33 | | $ | 70 | | $ | 68 | |
Bristol-Myers Squibb Co., | | | | | |
5.88%, 11/15/36 | | 40 | | 35 | |
6.13%, 5/1/38 | | 45 | | 41 | |
BSKYB Finance UK plc, | | | | | |
6.50%, 10/15/35(e) | | 50 | | 45 | |
Burlington Northern Santa Fe Corp., | | | | | |
6.15%, 5/1/37 | | 50 | | 46 | |
Canadian Natural Resources Ltd., | | | | | |
6.25%, 3/15/38 | | 20 | | 15 | |
6.45%, 6/30/33 | | 40 | | 32 | |
Caterpillar, Inc., | | | | | |
6.05%, 8/15/36 | | 35 | | 32 | |
Coca-Cola Enterprises, Inc., | | | | | |
6.95%, 11/15/26 | | 70 | | 72 | |
Comcast Corp., | | | | | |
6.40%, 5/15/38 | | 60 | | 48 | |
6.45%, 3/15/37 | | 155 | | 126 | |
6.95%, 8/15/37 | | 95 | | 81 | |
ConAgra Foods, Inc., | | | | | |
8.25%, 9/15/30 | | 80 | | 88 | |
ConocoPhillips, | | | | | |
5.90%, 5/15/38 | | 100 | | 89 | |
ConocoPhillips Holding Co., | | | | | |
6.95%, 4/15/29 | | 105 | | 107 | |
Corning, Inc., | | | | | |
7.25%, 8/15/36 | | 20 | | 18 | |
CVS Pass-Through Trust, | | | | | |
6.04%, 12/10/28(e) | | 106 | | 95 | |
Daimler Finance North America LLC, | | | | | |
8.50%, 1/18/31 | | 135 | | 136 | |
Delhaize America, Inc., | | | | | |
9.00%, 4/15/31 | | 25 | | 26 | |
Dell, Inc., | | | | | |
6.50%, 4/15/38(e) | | 75 | | 66 | |
Deutsche Telekom International Finance B.V., | | | | | |
8.75%, 6/15/30 | | 60 | | 58 | |
Devon Financing Corp. UCL, | | | | | |
7.88%, 9/30/31 | | 60 | | 61 | |
Diageo Capital plc, | | | | | |
5.88%, 9/30/36 | | 30 | | 27 | |
Eli Lilly & Co., | | | | | |
5.55%, 3/15/37 | | 45 | | 41 | |
EnCana Corp., | | | | | |
6.50%, 2/1/38 | | 50 | | 40 | |
6.63%, 8/15/37 | | 30 | | 24 | |
France Telecom S.A., | | | | | |
8.50%, 3/1/31 | | 105 | | 114 | |
Gaz Capital S.A., | | | | | |
7.29%, 8/16/37(e) | | 100 | | 72 | |
GlaxoSmithKline Capital, Inc., | | | | | |
6.38%, 5/15/38 | | 115 | | 109 | |
Grupo Televisa S.A., | | | | | |
6.00%, 5/15/18 | | 100 | | 95 | |
GTL Trade Finance, Inc., | | | | | |
7.25%, 10/20/17(e) | | 100 | | 97 | |
Hess Corp., | | | | | |
7.13%, 3/15/33 | | 55 | | 48 | |
Hewlett-Packard Co., | | | | | |
5.50%, 3/1/18 | | 30 | | 28 | |
HJ Heinz Finance Co., | | | | | |
6.75%, 3/15/32 | | 30 | | 28 | |
Home Depot, Inc., | | | | | |
2.94%, 12/16/09(h) | | 40 | | 38 | |
Home Depot, Inc., | | | | | |
5.88%, 12/16/36 | | 70 | | 49 | |
Honeywell International, Inc., | | | | | |
5.30%, 3/1/18 | | 40 | | 38 | |
IBM Corp., | | | | | |
5.88%, 11/29/32 | | 60 | | 56 | |
JC Penney Corp., Inc., | | | | | |
7.40%, 4/1/37 | | 50 | | 42 | |
Kellogg Co., | | | | | |
7.45%, 4/1/31 | | 60 | | 66 | |
Koninklijke Philips Electronics NV, | | | | | |
6.88%, 3/11/38 | | 75 | | 75 | |
Kraft Foods, Inc., | | | | | |
6.88%, 1/26/39 | | 105 | | 95 | |
Kroger Co. (The), | | | | | |
6.90%, 4/15/38 | | 60 | | 56 | |
Lockheed Martin Corp., | | | | | |
6.15%, 9/1/36 | | 75 | | 72 | |
Lowe’s Cos, Inc., | | | | | |
6.65%, 9/15/37 | | 35 | | 34 | |
Macy’s Retail Holdings, Inc., | | | | | |
6.38%, 3/15/37 | | 40 | | 29 | |
Medco Health Solutions, Inc., | | | | | |
7.13%, 3/15/18 | | 55 | | 56 | |
Merck & Co., Inc., | | | | | |
5.75%, 11/15/36 | | 35 | | 33 | |
Monsanto Co., | | | | | |
5.88%, 4/15/38 | | 30 | | 27 | |
News America, Inc., | | | | | |
6.40%, 12/15/35 | | 135 | | 114 | |
Nexen, Inc., | | | | | |
6.40%, 5/15/37 | | 115 | | 91 | |
Norfolk Southern Corp., | | | | | |
7.05%, 5/1/37 | | 80 | | 83 | |
Northrop Grumman Space & Mission | | | | | |
System Corp., | | | | | |
7.75%, 6/1/29 | | 10 | | 11 | |
Northrop Grumman Systems Corp., | | | | | |
7.75%, 2/15/31 | | 65 | | 74 | |
| | | | | | | |
The accompanying notes are an integral part of the financial statements. | 105 |
2008 Annual Report | |
| |
September 30, 2008 | |
Portfolio of Investments (cont’d)
Long Duration Fixed Income Portfolio
| | Face
Amount
(000) | | Value
(000) | |
Industrials (cont’d) | | | | | |
Oracle Corp., | | | | | |
6.50%, 4/15/38 | | $ | 30 | | $ | 27 | |
Parker Hannifin Corp., | | | | | |
6.25%, 5/15/38 | | 50 | | 48 | |
Petro-Canada, | | | | | |
5.95%, 5/15/35 | | 55 | | 44 | |
6.80%, 5/15/38 | | 30 | | 24 | |
Philip Morris International, Inc., | | | | | |
6.38%, 5/16/38 | | 80 | | 71 | |
Procter & Gamble Co., | | | | | |
5.55%, 3/5/37 | | 75 | | 70 | |
Raytheon Co., | | | | | |
7.00%, 11/1/28 | | 35 | | 35 | |
Rio Tinto Finance USA Ltd., | | | | | |
7.13%, 7/15/28 | | 65 | | 62 | |
Schering-Plough Corp., | | | | | |
6.55%, 9/15/37 | | 80 | | 73 | |
Suncor Energy, Inc., | | | | | |
6.50%, 6/15/38 | | 25 | | 21 | |
Target Corp., | | | | | |
7.00%, 1/15/38 | | 100 | | 94 | |
Telecom Italia Capital S.A., | | | | | |
7.20%, 7/18/36 | | 125 | | 99 | |
Telefonica Europe B.V., | | | | | |
8.25%, 9/15/30 | | 130 | | 131 | |
Time Warner Cable, Inc., | | | | | |
6.55%, 5/1/37 | | 115 | | 93 | |
7.30%, 7/1/38 | | 60 | | 54 | |
Time Warner, Inc., | | | | | |
6.50%, 11/15/36 | | 75 | | 57 | |
7.70%, 5/1/32 | | 210 | | 183 | |
Union Pacific Corp., | | | | | |
6.25%, 5/1/34 | | 50 | | 44 | |
United Parcel Service, Inc., | | | | | |
6.20%, 1/15/38 | | 30 | | 28 | |
United Technologies Corp., | | | | | |
6.05%, 6/1/36 | | 115 | | 108 | |
UnitedHealth Group, Inc., | | | | | |
6.88%, 2/15/38 | | 50 | | 44 | |
Vale Overseas Ltd., | | | | | |
6.88%, 11/21/36 | | 45 | | 40 | |
Valero Energy Corp., | | | | | |
6.63%, 6/15/37 | | 100 | | 87 | |
Verizon Communications, Inc., | | | | | |
5.85%, 9/15/35 | | 135 | | 105 | |
6.40%, 2/15/38 | | 165 | | 138 | |
VF Corp., | | | | | |
6.45%, 11/1/37 | | 30 | | 25 | |
Viacom, Inc., | | | | | |
6.88%, 4/30/36 | | 140 | | 113 | |
Vivendi, | | | | | |
6.63%, 4/4/18(e) | | 80 | | 77 | |
Vodafone Group plc, | | | | | |
6.15%, 2/27/37 | | 110 | | 89 | |
Wal-Mart Stores, Inc., | | | | | |
5.25%, 9/1/35 | | 150 | | 121 | |
6.50%, 8/15/37 | | 60 | | 56 | |
Weatherford International Ltd., | | | | | |
6.50%, 8/1/36 | | 55 | | 48 | |
7.00%, 3/15/38 | | 35 | | 30 | |
Wyeth, | | | | | |
5.95%, 4/1/37 | | 85 | | 77 | |
6.50%, 2/1/34 | | 40 | | 40 | |
XTO Energy, Inc., | | | | | |
6.38%, 6/15/38 | | 55 | | 45 | |
6.75%, 8/1/37 | | 25 | | 22 | |
| | | | 6,793 | |
Sovereign (1.4%) | | | | | |
Federated Republic of Brazil, | | | | | |
8.25%, 1/20/34 | | 350 | | 397 | |
U.S. Treasury Securities (28.2%) | | | | | |
U.S. Treasury Bonds, | | | | | |
6.13%, 11/15/27 | | 500 | | 609 | |
6.38%, 8/15/27 | | 2,000 | | 2,494 | |
6.63%, 2/15/27 | | 3,500 | | 4,459 | |
U.S. Treasury Bond STRIPS, | | | | | |
Zero Coupon, 5/15/21 | | 570 | | 320 | |
| | | | 7,882 | |
Utilities (6.4%) | | | | | |
Alabama Power Co., | | | | | |
6.13%, 5/15/38 | | 80 | | 74 | |
Arizona Public Service Co., | | | | | |
5.50%, 9/1/35 | | 85 | | 60 | |
Carolina Power & Light Co., | | | | | |
6.13%, 9/15/33 | | 40 | | 37 | |
CenterPoint Energy Resources Corp., | | | | | |
6.25%, 2/1/37 | | 25 | | 20 | |
Columbus Southern Power Co., | | | | | |
6.60%, 3/1/33 | | 30 | | 27 | |
Consolidated Edison Co. of New York, Inc., | | | | | |
5.85%, 3/15/36 | | 40 | | 33 | |
Consumers Energy Co., | | | | | |
4.40%, 8/15/09 | | 55 | | 55 | |
5.65%, 4/15/20 | | 40 | | 36 | |
Detroit Edison Co., | | | | | |
6.35%, 10/15/32 | | 90 | | 82 | |
Duke Energy Ohio, Inc., | | | | | |
5.40%, 6/15/33 | | 45 | | 35 | |
E.ON International Finance BV, | | | | | |
6.65%, 4/30/38(e) | | 105 | | 103 | |
Enel Finance International S.A., | | | | | |
6.80%, 9/15/37(e) | | 100 | | 98 | |
Enterprise Products Operating LP, | | | | | |
6.65%, 10/15/34 | | 40 | | 34 | |
6.88%, 3/1/33 | | 70 | | 62 | |
| | | | | | | |
106 | The accompanying notes are an integral part of the financial statements. |
| 2008 Annual Report |
| |
| September 30, 2008 |
Portfolio of Investments (cont’d)
Long Duration Fixed Income Portfolio
| | Face
Amount
(000) | | Value
(000) | |
Utilities (cont’d) | | | | | |
Equitable Resources, Inc., | | | | | |
6.50%, 4/1/18 | | $ | 50 | | $ | 48 | |
Florida Power & Light Co., | | | | | |
5.63%, 4/1/34 | | 40 | | 36 | |
5.85%, 2/1/33 | | 35 | | 32 | |
Keyspan Corp., | | | | | |
5.80%, 4/1/35 | | 50 | | 38 | |
Kinder Morgan Energy Partners LP, | | | | | |
6.50%, 2/1/37 | | 65 | | 53 | |
6.95%, 1/15/38 | | 10 | | 9 | |
Northern States Power Co., | | | | | |
6.25%, 6/1/36 | | 35 | | 32 | |
Ohio Edison Co., | | | | | |
6.88%, 7/15/36 | | 95 | | 86 | |
Ohio Power Co., | | | | | |
6.60%, 2/15/33 | | 110 | | 99 | |
Pacific Gas & Electric Co., | | | | | |
6.05%, 3/1/34 | | 40 | | 35 | |
Pacificorp, | | | | | |
5.75%, 4/1/37 | | 40 | | 34 | |
6.25%, 10/15/37 | | 85 | | 77 | |
Plains All American Pipeline LP/PAA | | | | | |
Finance Corp., | | | | | |
6.70%, 5/15/36 | | 85 | | 72 | |
Public Service Co. of Colorado, | | | | | |
6.25%, 9/1/37 | | 75 | | 69 | |
Public Service Electric & Gas Co., | | | | | |
5.80%, 5/1/37 | | 65 | | 57 | |
Southern California Edison Co., | | | | | |
5.55%, 1/15/37 | | 60 | | 52 | |
Texas Eastern Transmission LP, | | | | | |
7.00%, 7/15/32 | | 45 | | 44 | |
TransCanada Pipelines Ltd., | | | | | |
6.20%, 10/15/37 | | 75 | | 65 | |
Virginia Electric and Power Co., | | | | | |
6.00%, 1/15/36 | | 95 | | 83 | |
| | | | 1,777 | |
Total Fixed Income Securities (Cost $23,388) | | | | 22,041 | |
| | Shares | | | |
Short-Term Investments (20.5%) | | | | | |
Investment Company (4.2%) | | | | | |
Morgan Stanley Institutional Liquidity Money Market Portfolio — Institutional Class(p) | | 1,175,386 | | 1,175 | |
| | Face | | | |
| | Amount | | | |
| | (000) | | | |
U.S. Government & Agency Securities (4.8%) | | | | | |
Federal Home Loan Mortgage Corp., | | | | | |
1.80%, 11/18/08(t) | | $ | 850 | | 848 | |
2.10%, 10/20/08(t) | | 500 | | 500 | |
| | | | 1,348 | |
U.S. Treasury Securities (11.5%) | | | | | |
U.S. Treasury Bills, | | | | | |
0.06%, 10/2/08(r) | | 500 | | 500 | |
0.17%, 10/9/08(r)(j) | | 110 | | 110 | |
0.70%, 12/4/08(r) | | 1,200 | | 1,198 | |
1.01%, 1/8/09(r) | | 1,400 | | 1,397 | |
| | | | 3,205 | |
Total Short-Term Investments (Cost $5,724) | | | | 5,728 | |
Total Investments (99.4%) (Cost $29,112) | | | | 27,769 | |
Other Assets in Excess of Liabilities (0.6%) | | | | 165 | |
Net Assets (100%) | | | | $ | 27,934 | |
(b) | Issuer is in default. |
(e) | 144A security — Certain conditions for public sale may exist. Unless otherwise noted, these securities are deemed to be liquid. |
(h) | Variable/Floating Rate Security — Interest rate changes on these instruments are based on changes in a designated rate. The rates shown are those in effect on September 30, 2008. |
(j) | All or a portion of the security was pledged to cover margin requirements for futures contracts. |
(p) | See Note G within the Notes to Financial Statements regarding investment in Morgan Stanley Institutional Liquidity Money Market Portfolio — Institutional Class. |
(r) | Rate shown is the yield to maturity at September 30, 2008. |
(t) | Purchased on a discount basis. The interest rate shown has been adjusted to reflect a money market equivalent yield. |
@ | Value is less than $500. |
REMIC | Real Estate Mortgage Investment Conduit |
STRIPS | Separate Trading of Registered Interest and Principal of Securities |
The Portfolio had the following futures contract(s) open at period end:
| | Number
of
Contracts | | Value
(000) | | Expiration
Date | | Net
Unrealized
Appreciation
(Depreciation)
(000) | |
Long: | | | | | | | | | |
U.S. Treasury 10 yr. Note | | 2 | | $ 229 | | | Dec-08 | | $ (4 | ) | |
U.S. Treasury Long Bond | | 31 | | 3,632 | | | Dec-08 | | (18 | ) | |
Short: | | | | | | | | | | | |
U.S. Treasury 2 yr. Note | | 9 | | 1,921 | | | Dec-08 | | — | @ | |
U.S. Treasury 5 yr. Note | | 2 | | 224 | | | Dec-08 | | — | @ | |
5 yr. Swap | | 6 | | 651 | | | Dec-08 | | 7 | | |
10 yr. Swap | | 52 | | 5,816 | | | Dec-08 | | | 27 | | |
| | | | | | | | | $ 12 | | |
| | | | | | | | | |
The accompanying notes are an integral part of the financial statements. | 107 |
2008 Annual Report | |
| |
September 30, 2008 | |
Portfolio of Investments (cont’d)
Long Duration Fixed Income Portfolio
Credit Default Swap Contracts |
The Portfolio had the following credit default swap agreement(s) open at period end:
Swap Counterparty and Reference Obligation | | Buy/Sell
Protection | | Notional
Amount
(000) | | Pay/Receive
Fixed Rate | | Termination
Date | | Unrealized
Appreciation
(Depreciation)
(000) | |
Bank of America | | | | | | | | | | | |
Carnival Corp., 6.65%, 1/15/28 | | Buy | | $ | 45 | | | 1.57 | % | | 3/20/18 | | $ (1 | ) | |
Goodrich Corp., 7.63%, 12/15/12 | | Buy | | 120 | | | 0.82 | | | 3/20/18 | | (2 | ) | |
Citigroup | | | | | | | | | | | | | | |
Eaton Corp., 7.65%, 11/15/29 | | Buy | | 20 | | | 0.82 | | | 3/20/18 | | 1 | | |
Goldman Sachs | | | | | | | | | | | | | | |
Coca-Cola Enterprises, Inc., 6.13%, 8/15/11 | | Buy | | 145 | | | 0.59 | | | 3/20/13 | | (1 | ) | |
Dow Jones CDX North America Investment Grade Index, Series 10 | | Sell | | 145 | | | 1.55 | | | 6/20/13 | | (2 | ) | |
Dow Jones CDX North America Investment Grade Index, Series 9 | | Sell | | 145 | | | 0.80 | | | 12/20/17 | | (4 | ) | |
Eaton Corp., 7.65%, 11/15/29 | | Buy | | 180 | | | 0.97 | | | 3/20/18 | | 3 | | |
Hartford Financial Services Group, Inc. (The), | | | | | | | | | | | | | | |
4.75%, 3/1/14 | | Buy | | 125 | | | 0.39 | | | 3/20/12 | | 13 | | |
Merrill Lynch | | | | | | | | | | | | | | |
Carnival Corp., 6.65%, 1/15/28 | | Buy | | 20 | | | 1.60 | | | 3/20/18 | | — | @ | |
UBS | | | | | | | | | | | | | | |
Martin Marietta Materials, Inc., 6.88%, 4/1/11 | | Buy | | 25 | | | 1.73 | | | 3/20/18 | | — | @ | |
Martin Marietta Materials, Inc., 6.88%, 4/1/11 | | Buy | | 35 | | | 1.73 | | | 3/20/18 | | | — | @ | |
| | | | | | | | | | | | $ | 7 | | |
| | | | | | | | | | | | |
| | | | | | | | | | | | | | | | | |
Interest Rate Swap Contracts
The Portfolio had the following interest rate swap agreement(s) open at period end:
Swap Counterparty | | Floating Rate
Index | | Pay/Receive
Floating Rate | | Fixed
Rate | | Termination
Date | | Notional
Amount
(000) | | Unrealized
Appreciation
(Depreciation)
(000) | |
Bank of America | | 3 Month LIBOR | | Pay | | 4.15% | | 6/9/13 | | | $2,035 | | | $ 34 | | |
| | 3 Month LIBOR | | Receive | | 3.90 | | 9/10/13 | | | 2,070 | | | 12 | | |
| | 3 Month LIBOR | | Pay | | 5.37 | | 2/12/18 | | | 548 | | | 9 | | |
| | 3 Month LIBOR | | Pay | | 5.07 | | 4/14/18 | | | 570 | | | 3 | | |
| | 3 Month LIBOR | | Pay | | 4.98 | | 4/15/18 | | | 1,235 | | | 2 | | |
| | 3 Month LIBOR | | Receive | | 5.38 | | 7/24/18 | | | 2,155 | | | (33 | ) | |
| | 3 Month LIBOR | | Receive | | 4.67 | | 8/4/18 | | | 1,500 | | | (29 | ) | |
| | 3 Month LIBOR | | Receive | | 5.82 | | 2/12/23 | | | 705 | | | (15 | ) | |
| | 3 Month LIBOR | | Receive | | 5.47 | | 4/14/23 | | | 730 | | | (8 | ) | |
| | 3 Month LIBOR | | Receive | | 5.38 | | 4/15/23 | | | 1,520 | | | (13 | ) | |
| | 3 Month LIBOR | | Pay | | 5.56 | | 7/24/23 | | | 2,768 | | | 37 | | |
Citigroup | | 3 Month LIBOR | | Pay | | 5.44 | | 5/29/17 | | | 1,875 | | | 172 | | |
| | 3 Month LIBOR | | Pay | | 5.46 | | 8/7/17 | | | 1,000 | | | 80 | | |
Deutsche Bank | | 3 Month LIBOR | | Pay | | 5.39 | | 5/25/17 | | | 2,925 | | | 257 | | |
| | 3 Month LIBOR | | Pay | | 5.45 | | 8/9/17 | | | 1,300 | | | 104 | | |
| | 6 Month EUR LIBOR | | Receive | | 4.93 | | 7/1/18 | | | 2,265 | | | (27 | ) | |
| | 6 Month EUR LIBOR | | Receive | | 4.86 | | 7/9/18 | | | 395 | | | (3 | ) | |
| | 6 Month EUR LIBOR | | Receive | | 4.86 | | 7/10/18 | | | 355 | | | (3 | ) | |
| | 6 Month EUR LIBOR | | Pay | | 4.96 | | 7/24/18 | | | 1,508 | | | 20 | | |
| | 6 Month EUR LIBOR | | Receive | | 4.68 | | 9/11/18 | | | 2,037 | | | — | | |
| | 6 Month EUR LIBOR | | Pay | | 4.71 | | 9/11/18 | | | 2,037 | | | 2 | | |
| | 3 Month LIBOR | | Receive | | 4.83 | | 9/11/18 | | | 2,703 | | | 13 | | |
| | 3 Month LIBOR | | Pay | | 4.86 | | 9/11/18 | | | 2,703 | | | — | | |
| | 6 Month EUR LIBOR | | Pay | | 5.27 | | 7/2/23 | | | 2,835 | | | 42 | | |
| | 6 Month EUR LIBOR | | Pay | | 5.24 | | 7/9/23 | | | 490 | | | 7 | | |
| | 6 Month EUR LIBOR | | Pay | | 5.24 | | 7/10/23 | | | 445 | | | 6 | | |
| | 6 Month EUR LIBOR | | Receive | | 5.19 | | 7/24/23 | | | 1,885 | | | (22 | ) | |
108 | The accompanying notes are an integral part of the financial statements. |
| 2008 Annual Report |
| |
| September 30, 2008 |
Portfolio of Investments (cont’d)
Long Duration Fixed Income Portfolio
Interest Rate Swap Contracts (cont’d)
The Portfolio had the following interest rate swap agreement(s) open at period end:
| | | | | | | | | | | | Unrealized | |
| | | | | | | | | | Notional | | Appreciation | |
| | Floating Rate | | Pay/Receive | | Fixed | | Termination | | Amount | | (Depreciation) | |
Swap Counterparty | | Index | | Floating Rate | | Rate | | Date | | (000) | | (000) | |
Goldman Sachs | | 3 Month LIBOR | | Pay | | 5.63 | | 2/28/18 | | | | $ | 1,945 | | | | $ | 51 | | |
| | 3 Month LIBOR | | Receive | | 6.04 | | 2/28/23 | | | | 2,495 | | | | (69 | ) | |
JPMorgan Chase | | 3 Month LIBOR | | Pay | | 4.07 | | 5/16/13 | | | | 1,155 | | | | 16 | | |
| | 3 Month LIBOR | | Pay | | 5.45 | | 5/29/17 | | | | 1,850 | | | | 171 | | |
| | 3 Month LIBOR | | Pay | | 5.09 | | 9/11/17 | | | | 1,450 | | | | 75 | | |
| | 3 Month LIBOR | | Receive | | 4.41 | | 5/1/18 | | | | 2,165 | | | | (22 | ) | |
| | 3 Month LIBOR | | Pay | | 5.42 | | 9/21/37 | | | | 1,000 | | | | 117 | | |
| | | | | | | | | | | | | $ | 986 | | |
EUR | — Euro |
LIBOR | — London Inter Bank Offer Rate |
Zero Coupon Swap Contracts
The Portfolio had the following zero coupon swap agreement(s) open at period end:
| | | | | | | | Unrealized | |
| | Notional | | | | | | Appreciation | |
| | Amount | | | | Termination | | (Depreciation) | |
Swap Counterparty | | (000) | | Receive | | Date | | (000) | |
JPMorgan Chase | | $ | 320 | | 3 Month LIBOR | | 5/15/21 | | | $ | — | | |
| | | | | | | | | $ | — | | |
| | | | | | | | | | | | | |
LIBOR — London Inter Bank Offer Rate
| The accompanying notes are an integral part of the financial statements. | 109 |
2008 Annual Report |
|
September 30, 2008 |
Investment Overview (unaudited)
Municipal Portfolio
The Municipal Portfolio seeks to realize above-average total return over a market cycle of three to five years, consistent with the conservation of capital and the realization of current income that is exempt from federal income tax. The Portfolio invests primarily in fixed income securities issued by local, state and regional governments that provide income that is exempt from federal income taxes (municipal securities). The Portfolio may purchase municipal securities that pay interest that is subject to the federal alternative minimum tax, and securities on which the interest payments are taxable. The Portfolio may invest in high yield municipal securities (commonly referred to as “junk bonds”). The Portfolio will ordinarily seek to maintain an average weighted maturity of between five and ten years, although there is no minimum or maximum maturity for any individual security. The Portfolio may use futures, options, forwards, CMOs, swaps, options on swaps and other derivatives. The Portfolio may invest in securities of foreign issuers, including issuers located in emerging market countries. The securities in which the Portfolio may invest may be denominated in U.S. dollars or in currencies other than U.S. dollars. The Portfolio may also invest in public bank loans made by banks or other financial institutions. These public bank loans may be rated investment grade or below investment grade.
Performance
For the fiscal year ended September 30, 2008, the Portfolio’s Class I had a total return based on net asset value and reinvestment of distributions per share of -5.24%, net of fees. The Portfolio’s Class I underperformed against its benchmarks the Lehman Brothers 5 Year Municipal Index, the Lehman Brothers 10 Year Municipal Index and the Blended Municipal Index (a 50%/50% blend of the Lehman Brothers 5 & 10 Year Municipal Indexes) which returned 3.72%, 0.55% and 2.13%, respectively.
Factors Affecting Performance
· The financial markets were under pressure throughout the period amid disrupted credit markets, ongoing deterioration of the housing market, losses in the financial sector, and growing fears of recession.
· The third quarter of 2008, however, will most certainly go down as a defining moment in the history of the financial industry. Investor confidence plummeted and credit markets seized as several venerable financial institutions were forced into mergers or dissolved entirely in September, resulting in significant price erosion across all the but U.S. Treasury sector.
· The Portfolio’s position in long-dated zero-coupon municipal bonds detracted from relative performance. During the period, longer-dated issues underperformed shorter-maturity issues as the municipal yield curve steepened while historic spread widening in zero-coupon issues led them to underperform their coupon-bearing counterparts.
· The Portfolio holds a small, opportunistic position in corporate credit which is concentrated in preferred securities. This position detracted significantly from performance, specifically in September, as the financial sector struggled and spreads across the corporate market widened. A small allocation to non-agency mortgage-backed securities also hindered performance.
· A focus on higher-quality municipal issues was additive to performance as the flight to quality that persisted throughout the period helped the higher-rated segment of the market to outpace the lower-rated segment.
· The Portfolio’s neutral yield-curve positioning also benefited performance as rates rose proportionately across the entire municipal yield curve during the period.
Management Strategies
· We maintained a higher credit-quality profile for the Portfolio throughout the reporting period, favoring issues within the higher-rated segment of the credit quality spectrum.
· The Portfolio was overweighted long-dated zero-coupon municipal bonds as well as the general obligation and school district sectors.
· Interest-rate positioning remained neutral throughout the period.
110
| 2008 Annual Report |
| |
| September 30, 2008 |
Investment Overview (cont’d)
Municipal Portfolio

* Minimum Investment
In accordance with SEC regulations, the Portfolio’s performance shown assumes that all recurring fees (including management fees) were deducted and all dividends and distributions were reinvested. The performance of Class P, Class H and Class L shares will vary from the Class I shares based upon their different inception dates and will be negatively impacted by additional fees assessed to those classes.
Performance Compared to the Lehman Brothers 5 Year Municipal Index(1), Lehman Brothers 10 Year Municipal Index(2), Blended Municipal Index(3) and the Lipper Intermediate Municipal Debt Funds Index(4)
| | Total Returns(5) | |
| | | | Average Annual | |
| | One | | Five | | Ten | | Since | |
| | Year | | Years | | Years | | Inception(10) | |
Portfolio – Class I (6) | | (5.24 | )% | | 2.22 | % | | 3.96 | % | | 5.39 | % | |
Lehman Brothers 5 Year Municipal Index | | 3.72 | | | 2.81 | | | 4.25 | | | 4.89 | | |
Lehman Brothers 10 Year Municipal Index | | 0.55 | | | 3.20 | | | 4.47 | | | 5.65 | | |
Blended Municipal Index | | 2.13 | | | 3.01 | | | 4.37 | | | 5.46 | | |
Lipper Intermediate Municipal Debt Funds Index | | (0.90 | ) | | 2.14 | | | 3.48 | | | 4.54 | | |
| | | | | | | | | | | | | |
Portfolio – Class P (7) | | (5.44 | ) | | — | | | — | | | (2.77 | ) | |
Lehman Brothers 5 Year Municipal Index | | 3.72 | | | — | | | — | | | 5.21 | | |
Lehman Brothers 10 Year Municipal Index | | 0.55 | | | — | | | — | | | 2.69 | | |
Blended Municipal Index | | 2.13 | | | — | | | — | | | 3.95 | | |
Lipper Intermediate Municipal Debt Funds Index | | (0.90 | ) | | — | | | — | | | 0.97 | | |
| | Total Returns(5) | |
| | | | Average Annual | |
| | | | | | | | Cumulative | |
| | One | | Five | | Ten | | Since | |
| | Year | | Years | | Years | | Inception(10) | |
Portfolio – Class H w/o sales charges (8) | | — | % | | — | % | | — | % | | (6.31 | )% | |
Portfolio – Class H with maximum 3.50% sales charges (8) | | — | | | — | | | — | | | (9.58 | ) | |
Lehman Brothers 5 Year Municipal Index | | — | | | — | | | — | | | 1.52 | | |
Lehman Brothers 10 Year Municipal Index | | — | | | — | | | — | | | (1.45 | ) | |
Blended Municipal Index | | — | | | — | | | — | | | 0.03 | | |
Lipper Intermediate Municipal Debt Funds Index | | — | | | — | | | — | | | (2.22 | ) | |
| | | | | | | | | | | | | |
Portfolio – Class L(9) | | — | | | — | | | — | | | (6.33 | ) | |
Lehman Brothers 5 Year Municipal Index | | — | | | — | | | — | | | 0.15 | | |
Lehman Brothers 10 Year Municipal Index | | — | | | — | | | — | | | (1.77 | ) | |
Blended Municipal Index | | — | | | — | | | — | | | (0.81 | ) | |
Lipper Intermediate Municipal Debt Funds Index | | — | | | — | | | — | | | (2.65 | ) | |
Performance data quoted represents past performance, which is no guarantee of future results, and current performance may be lower or higher than the figures shown. Performance assumes that all dividends and distributions, if any, were reinvested. For the most recent month-end performance figures, please visit www.morganstanley.com/msim. Investment returns and principal value will fluctuate so that Portfolio shares, when redeemed, may be worth more or less than their original cost. Total returns do not reflect the deduction of taxes that a shareholder would pay on Portfolio distributions or the redemption of Portfolio shares. Performance of share classes will vary due to differences in sales charges and expenses.
(1) | | The Lehman Brothers 5 Year Municipal Index is a market capitalization weighted index of investment-grade (BBB-/Baa3) or higher municipal bonds with maturities of four to six years. To be included in the Index, bonds must have an outstanding par value of at least $5 million and be issued as part of a transaction of at least $50 million. The bonds must be at least one year from their maturity date. Remarketed issues, taxable municipal bonds, bonds with floating rates, and derivatives, are excluded from the Index. The Index is unmanaged and its returns do not include any sales charges or fees. Such costs would lower performance. It is not possible to invest directly in an index. |
(2) | | The Lehman Brothers 10 Year Municipal Index is market capitalization-weighted index of investment-grade (BBB-/Baa3) or higher municipal bonds with maturities of eight to twelve years. To be included in the Index, bonds must have an outstanding par value of at least $5 million and be issued as part of a transaction of at least $50 million. The bonds must be at least one year from their maturity date. Remarketed issues, taxable municipal bonds, bonds with floating rates, and derivatives, are excluded from the Index. The Index is unmanaged and its returns do not include any sales charges or fees. Such costs would lower performance. It is not possible to invest directly in an index. |
(3) | | The Blended Municipal Index is an unmanaged index comprised of the Lehman Brothers Long Municipal Index from 10/1/92 to 3/31/96 and 50% Lehman Brothers 10 Year Municipal Index and 50% Lehman Brothers 5 Year Municipal Index thereafter. |
(4) | | The Lipper Intermediate Municipal Debt Funds Index is an equally weighted performance index of the largest qualifying funds (based on net assets) in the Lipper Intermediate Municipal Debt Funds classification. The Index, which is adjusted for capital gains distributions and income dividends, is unmanaged and should not be considered an investment. There are currently 30 funds represented in this Index. As of the date of this report, the Portfolio was in the Lipper Intermediate Municipal Debt Funds classification. |
(5) | | Total returns for the Portfolio reflect expenses waived and/or reimbursed, if applicable, by the Adviser. Without such waivers and/or reimbursements, total returns would have been lower. Fee waivers and/or reimbursements are voluntary and the |
111
2008 Annual Report |
|
September 30, 2008 |
Investment Overview (cont’d)
Municipal Portfolio
Adviser reserves the right to commence or terminate any waiver and/or reimbursement at any time. Returns for periods less than one year are not annualized.
(6) | Commenced operations on October 1, 1992. |
(7) | Commenced operations on June 20, 2007. |
(8) | Commenced operations on January 2, 2008. |
(9) | Commenced operations on June 16, 2008. |
(10) | For comparative purposes, average annual and cumulative since inception returns listed for the Indexes refer to the inception date or initial offering of the share class of the Portfolio, not the inception of the Indexes. |
Portfolio Composition
| | Percentage of | |
Classification | | Total Investments | |
Municipal Bonds | | | 92.8 | % | |
Other* | | | 3.7 | | |
Short-Term Investments | | | 3.5 | | |
Total Investments | | | 100.0 | % | |
* Industries and/or investment types which do not appear in the above table, as well as those which represent less than 5% of total investments, if applicable, are included in the category labeled “Other”.
112
| 2008 Annual Report |
| |
| September 30, 2008 |
Portfolio of Investments
Municipal Portfolio
| | Face | | | |
| | Amount | | Value | |
| | (000) | | (000) | |
Fixed Income Securities (93.8%) | | | | | |
Collateralized Mortgage Obligations — Agency Collateral Series (0.1%) | | | | | |
Federal Home Loan Mortgage Corp., | | | | | |
IO PAC REMIC | | | | | |
6.00%, 4/15/32 | | $ | 1,035 | | $ | 86 | |
IO REMIC | | | | | |
6.50%, 3/15/33 | | 447 | | 87 | |
Federal National Mortgage Association, | | | | | |
Inv Fl IO REMIC | | | | | |
5.79%, 3/25/23 | | 408 | | 45 | |
6.00%, 5/25/33 | | 1,103 | | 209 | |
IO | | | | | |
6.50%, 6/1/31 | | 297 | | 80 | |
7.00%, 4/1/32 | | 103 | | 28 | |
IO REMIC | | | | | |
1.42%, 3/25/36 | | 10,267 | | 154 | |
6.00%, 6/25/33 - 8/25/35 | | 3,816 | | 907 | |
6.50%, 5/25/33 | | 900 | | 181 | |
7.00%, 4/25/33 | | 412 | | 77 | |
Government National Mortgage Association, | | | | | |
Inv Fl IO | | | | | |
5.46%, 12/16/25 | | 273 | | 34 | |
5.51%, 5/16/32 | | 173 | | 18 | |
6.06%, 4/16/19 - 12/16/19 | | 625 | | 71 | |
| | | | 1,977 | |
Collateralized Mortgage Obligations — Non Agency Collateral Series (0.5%) | | | | | |
Bear Stearns Structured Products, Inc., | | | | | |
IO | | | | | |
0.01%, 1/27/37(d)(e)(l) | | 38,561 | | 4 | |
0.02%, 6/26/36(d)(e)(l) | | 69,153 | | 7 | |
0.16%, 1/27/37(d)(e)(l) | | 71,884 | | 7 | |
0.18%, 1/27/37(d)(e)(l) | | 49,113 | | 5 | |
1.22%, 5/25/37(d)(e)(l) | | 77,514 | | 8 | |
Countrywide Alternative Loan Trust, | | | | | |
IO | | | | | |
0.18%, 5/25/47(d)(e)(l) | | 16,364 | | 2 | |
0.41%, 2/25/47(d)(l) | | 34,471 | | 3 | |
2.18%, 3/20/46 | | 10,729 | | 328 | |
2.40%, 12/20/46 | | 29,107 | | 891 | |
2.51%, 12/20/35(e)(h) | | 10,879 | | 279 | |
2.54%, 12/20/35(e)(h) | | 14,674 | | 440 | |
2.56%, 2/25/37 | | 11,850 | | 303 | |
2.86%, 3/20/47 | | 27,444 | | 892 | |
3.06%, 8/25/46(h) | | 9,351 | | 396 | |
Countrywide Home Loan Mortgage Pass Through Trust, | | | | | |
IO | | | | | |
0.51%, 10/25/34(h) | | 6,063 | | 43 | |
Greenpoint Mortgage Funding Trust, | | | | | |
IO | | | | | |
1.13%, 6/25/45 | | 7,562 | | 216 | |
1.30%, 8/25/45 | | 6,771 | | 149 | |
Harborview Mortgage Loan Trust, | | | | | |
IO | | | | | |
2.36%, 6/19/35(h) | | 7,437 | | 82 | |
2.59%, 5/19/35(h) | | 9,700 | | 97 | |
2.93%, 3/19/37(h) | | 10,114 | | 235 | |
3.03%, 7/19/47(h) | | 18,038 | | 366 | |
PO | | | | | |
3/19/47 - 7/19/47 | | 19 | | 3 | |
Harborview NIM Corp., | | | | | |
IO | | | | | |
1.52%, 12/15/36(d)(l) | | 1,686 | | — | @ |
Indymac Index Mortgage Loan Trust, | | | | | |
IO | | | | | |
2.34%, 7/25/35(h) | | 9,372 | | 126 | |
Residential Accredit Loans, Inc., | | | | | |
IO | | | | | |
0.68%, 3/25/47(d)(h)(l) | | 23,355 | | 2 | |
0.76%, 5/25/47(d)(h)(l) | | 55,562 | | 6 | |
1.22%, 8/25/47(d)(l) | | 137,830 | | 14 | |
Washington Mutual, Inc., | | | | | |
IO | | | | | |
0.40%, 4/25/45 | | 64,407 | | 644 | |
| | | | 5,548 | |
Industrials (0.1%) | | | | | |
Echostar DBS Corp., | | | | | |
6.38%, 10/1/11 | | 580 | | 535 | |
6.63%, 10/1/14 | | 20 | | 16 | |
Pilgrim’s Pride Corp., | | | | | |
7.63%, 5/1/15 | | 730 | | 456 | |
| | | | 1,007 | |
Mortgages — Other (0.4%) | | | | | |
Countrywide Alternative Loan Trust, | | | | | |
3.47%, 3/20/47(d)(h) | | 1,956 | | 425 | |
3.49%, 12/20/46(d)(h) | | 2,848 | | 611 | |
3.71%, 6/25/47(h) | | 3,111 | | 605 | |
Countrywide Home Loan Mortgage Pass ThroughTrust, | | | | | |
2.85%, 4/25/46(d)(h) | | 1,575 | | 360 | |
Deutsche ALT-A Securities, Inc. Alternate Loan Trust, | | | | | |
3.69%, 2/25/47(d)(h) | | 2,178 | | 431 | |
Washington Mutual Mortgage Pass Through Certificates, | | | | | |
3.46%, 1/25/47(d)(h) | | 2,171 | | 413 | |
Washington Mutual, Inc., | | | | | |
2.75%, 7/25/46(d)(h) | | 2,721 | | 605 | |
3.51%, 10/25/46(d)(h) | | 2,715 | | 566 | |
| | | | 4,016 | |
| | | | | | | |
| The accompanying notes are an integral part of the financial statements. | 113 |
2008 Annual Report |
|
September 30, 2008 |
Portfolio of Investments (cont’d)
Municipal Portfolio
| | Face | | | |
| | Amount | | Value | |
| | (000) | | (000) | |
Municipal Bonds (92.7%) | | | | | |
Alameda County, CA, Joint Powers Authority, Lease, Revenue Bonds (FSA), | | | | | |
5.00%, 12/1/26 - 12/1/27 | | $ | 5,250 | | $ | 5,023 | |
Alameda Unified School District General Obligation Bonds (FSA), | | | | | |
Zero Coupon, 8/1/33 | | 9,915 | | 2,293 | |
Alamo Community College District, TX, General Obligation Bonds (FSA), | | | | | |
5.00%, 2/15/13 - 2/15/14 | | 4,880 | | 5,161 | |
Alaska Railroad Corp., Revenue Bonds (FGIC), | | | | | |
5.00%, 8/1/15 | | 2,680 | | 2,806 | |
Aldine Independent School District, General Obligation Bonds (PSFG), | | | | | |
5.00%, 2/15/13 | | 3,040 | | 3,223 | |
Allegheny County, PA, Hospital Development Authority, Revenue bonds, University of Pittsburgh Medical Center, Series A, | | | | | |
5.00%, 9/1/18 | | 3,000 | | 2,921 | |
Allegheny County, PA, Industrial Development Authority, Revenue Bonds, | | | | | |
4.75%, 12/1/32 | | 525 | | 514 | |
Alvord, CA, Unified School District, 2007 Election, General Obligation Bonds (FSA), | | | | | |
5.00%, 8/1/24 - 8/1/25 | | 4,370 | | 4,255 | |
Amarillo, TX, General Obligation Bonds (MBIA), | | | | | |
5.00%, 5/15/13 | | 1,020 | | 1,080 | |
Arizona State Transportation Board, Highway, Revenue Bonds, | | | | | |
5.00%, 7/1/25 - 7/1/28 | | 6,675 | | 6,483 | |
Arizona State, Series A, COP (FSA), | | | | | |
5.00%, 9/1/26 | | 5,900 | | 5,496 | |
Austin, TX, Convention Enterprises, Inc., Revenue Bonds, | | | | | |
6.70%, 1/1/28 | | 400 | | 433 | |
Badger TOB Asset Securitization Corp., WI, Revenue Bonds, | | | | | |
6.13%, 6/1/27 | | 1,000 | | 1,006 | |
Berks County, PA, General Obligation Bonds (FGIC), | | | | | |
Zero Coupon, 5/15/19 - 11/15/20 | | 2,250 | | 1,244 | |
Blount County, TN, Public Building Authority, Local Government, Revenue Bonds (AGC), | | | | | |
5.00%, 6/1/25 - 6/1/28 | | 2,025 | | 1,944 | |
Brandon School District, MI, General Obligation Bonds (FSA; Q-SBLF), | | | | | |
5.00%, 5/1/16 - 5/1/19 | | 4,230 | | 4,348 | |
Brazos, TX, Harbor Industrial Development Corp., Environmental Facilities, Dow Chemical Project, Revenue Bonds, | | | | | |
5.90%, 5/1/38 (h) | | 2,695 | | 2,387 | |
Brownsville, TX, Utility System, Revenue Bonds (FSA), | | | | | |
5.00%, 9/1/23 - 9/1/26 | | 12,140 | | 11,666 | |
Brunswick County, NC, General Obligation Bonds (FGIC), | | | | | |
5.00%, 5/1/17 | | 1,700 | | 1,750 | |
Buckeye Tobacco Settlement Financing Authority, Revenue Bonds, | | | | | |
5.38%, 6/1/24 | | 10,630 | | 9,128 | |
California State Department of Water Resources, Central Valley Project, Revenue Bonds, | | | | | |
5.00%, 12/1/26 - 12/1/27 | | 5,480 | | 5,362 | |
California State Department of Water Resources, Power Supply, Revenue Bonds, | | | | | |
5.00%, 5/1/22 | | 4,800 | | 4,721 | |
California State Public Works Board, Revenue Bonds, | | | | | |
5.25%, 6/1/13 | | 1,150 | | 1,212 | |
5.50%, 6/1/15 | | 1,275 | | 1,357 | |
California State, General Obligation Bonds, | | | | | |
5.25%, 2/1/14 | | 1,375 | | 1,455 | |
Camden, AL, Industrial Development Board, Revenue Bonds, | | | | | |
6.13%, 12/1/24 | | 625 | | 691 | |
Carbon County, PA, Industrial Development Authority, Revenue Bonds, | | | | | |
6.65%, 5/1/10 | | 135 | | 137 | |
Carrollton, TX, General Obligation Bonds (FSA), | | | | | |
5.13%, 8/15/16 | | 1,470 | | 1,523 | |
Center Township, PA, Sewer Authority, Revenue Bonds (MBIA), | | | | | |
Zero Coupon, 4/15/17 | | 615 | | 418 | |
Chandler, AZ, Industrial Development Authority, Revenue Bonds, | | | | | |
4.38%, 12/1/35(h) | | 1,400 | | 1,444 | |
Chattanooga, TN, Electric, Revenue Bonds, | | | | | |
5.00%, 9/1/24 - 9/1/25 | | 6,975 | | 6,808 | |
Chelsea, MA, Lease Revenue Bonds, Series B, SAVRS (FSA), | | | | | |
3.12%, 6/13/23(h) | | 4,750 | | 4,750 | |
Cherokee County, GA, School Systems, General Obligation Bonds (MBIA), | | | | | |
5.00%, 8/1/13 | | 1,000 | | 1,069 | |
Chicago, IL, Board of Education, General Obligation Bonds (FSA), | | | | | |
5.00%, 12/1/17 | | 1,010 | | 1,046 | |
Chicago, IL, Board of Education, General Obligation Bonds, | | | | | |
5.25%, 12/1/26 | | 10,400 | | 10,196 | |
Chicago, IL, General Obligation Bonds (FGIC), | | | | | |
Zero Coupon, 1/1/19 | | 4,000 | | 2,330 | |
Chicago, IL, Transit Authority, Revenue Bonds (AGC), | | | | | |
5.25%, 6/1/23 - 6/1/24 | | 6,165 | | 6,067 | |
Children’s Trust Fund, Revenue Bonds, | | | | | |
5.38%, 5/15/33 | | 1,760 | | 1,526 | |
5.75%, 7/1/20 | | 445 | | 460 | |
Citizens Property Insurance Corp., FL, Revenue Bonds (MBIA), | | | | | |
5.00%, 3/1/12 | | 3,000 | | 3,041 | |
City of Houston, TX, General Obligation Bonds (MBIA), | | | | | |
5.00%, 3/1/16 | | 1,000 | | 1,048 | |
| | | | | | | |
114 | The accompanying notes are an integral part of the financial statements. | |
| 2008 Annual Report |
| |
| September 30, 2008 |
Portfolio of Investments (cont’d)
Municipal Portfolio
| | Face | | | |
| | Amount | | Value | |
| | (000) | | (000) | |
Municipal Bonds (cont’d) | | | | | |
City of Memphis, TN, General Obligation Bonds (AGC), | | | | | |
4.50%, 4/1/26 - 4/1/27 | | $ | 5,835 | | $ | 5,216 | |
City of New York, NY, General Obligation Bonds, | | | | | |
5.25%, 8/15/26 | | 8,100 | | 7,853 | |
City of Seattle, WA, Revenue Bonds, | | | | | |
5.00%, 2/1/18 - 2/1/19 | | 4,890 | | 4,947 | |
City of Tallahassee, FL, Revenue Bonds (MBIA), | | | | | |
5.00%, 10/1/11 | | 2,470 | | 2,599 | |
Clark County, WA, School District No. 114, | | | | | |
Evergreen, General Obligation Bonds (FSA), | | | | | |
5.00%, 6/1/13 | | 2,500 | | 2,646 | |
Clark County, WA, School District No. 117, Camas, General Obligation Bonds (FSA), | | | | | |
5.00%, 12/1/13 | | 1,500 | | 1,592 | |
Clay County, MO, Public School District No. 53, Liberty School Building, General Obligation Bonds, | | | | | |
5.00%, 3/1/24 | | 2,025 | | 1,976 | |
Clear Creek, TX, Independent School District (PSFG), | | | | | |
5.65%, 2/15/19 | | 35 | | 36 | |
Cleveland, OH, Income Tax, Bridges & Roadways, Revenue Bonds (AGC), | | | | | |
5.00%, 10/1/25 | | 1,555 | | 1,491 | |
Cleveland, OH, Waterworks, Revenue Bonds, | | | | | |
5.00%, 1/1/17 | | 3,250 | | 3,368 | |
Coachella Valley, Unified School District, CA, General Obligation Bonds (FGIC), | | | | | |
Zero Coupon, 8/1/30 | | 1,000 | | 258 | |
Colorado E470 Public Highway Authority, Revenue Bonds (MBIA), | | | | | |
Zero Coupon, 9/1/29 | | 18,900 | | 4,771 | |
Colorado Educational & Cultural Facilities Authority, Revenue Bonds (MBIA), | | | | | |
4.38%, 3/1/14 | | 1,400 | | 1,409 | |
4.50%, 3/1/15 | | 1,600 | | 1,609 | |
4.60%, 3/1/16 | | 1,000 | | 1,004 | |
Colorado Health Facilities Authority, Revenue Bonds, | | | | | |
Zero Coupon, 7/15/20 | | 1,000 | | 549 | |
Colorado Health Facilities Authority, Revenue Bonds (FSA), | | | | | |
4.75%, 9/1/25 | | 2,305 | | 2,081 | |
Commerce, CA, Energy Authority, Revenue Bonds (MBIA), | | | | | |
5.25%, 7/1/09 | | 1,355 | | 1,376 | |
Commonwealth of Pennsylvania, General Obligation Bonds, | | | | | |
5.00%, 8/1/18 | | 17,720 | | 18,471 | |
Connecticut State Health & Educational Facility, Revenue Bonds (MBIA), | | | | | |
5.00%, 7/1/23 - 7/1/24 | | 5,550 | | 5,315 | |
Cook County, IL, School District, General Obligation Bonds (MBIA), | | | | | |
Zero Coupon, 12/1/22 | | 4,125 | | 1,775 | |
Council Rock, PA, School District, General Obligation Bonds (MBIA), | | | | | |
5.00%, 11/15/19 | | 1,285 | | 1,361 | |
County of Bexar, TX, General Obligation Bonds (FSA), | | | | | |
5.00%, 6/15/12 - 6/15/14 | | 2,640 | | 2,793 | |
County of Miami-Dade, FL, Revenue Bonds (FGIC), | | | | | |
5.00%, 8/1/11 - 8/1/13 | | 15,480 | | 16,115 | |
County of Monroe, FL, Infrastructure Sales Surtax, Revenue Bonds (MBIA), | | | | | |
5.00%, 4/1/18 | | 2,445 | | 2,490 | |
County of Osceola, FL, Revenue Bonds (AMBAC), | | | | | |
5.00%, 10/1/12 - 10/1/13 | | 5,070 | | 5,297 | |
County of Riverside, CA, COP (AMBAC), | | | | | |
5.00%, 11/1/14 | | 3,500 | | 3,713 | |
County of St. Lucie, FL, Transportation Revenue Bonds (AMBAC), | | | | | |
5.00%, 8/1/13 | | 1,000 | | 1,049 | |
Cowlitz County, WA, Public Utility District No. 1 (FGIC), | | | | | |
5.00%, 9/1/11 | | 2,445 | | 2,526 | |
Cranberry Township, PA, General Obligation Bonds (FGIC), | | | | | |
4.80%, 12/1/18 | | 1,310 | | 1,322 | |
Crandall, TX, Independent School District, General Obligation Bonds (PSFG), | | | | | |
Zero Coupon, 8/15/19 - 8/15/21 | | 4,315 | | 2,301 | |
Crisp County Development Authority, Revenue Bonds, | | | | | |
5.55%, 2/1/15 | | 200 | | 196 | |
Crown Point, IN, Multi-School Building Corp., Revenue Bonds (MBIA), | | | | | |
Zero Coupon, 1/15/24 | | 5,200 | | 2,153 | |
Cypress-Fairbanks, TX, Independent School District, General Obligation Bonds (PSFG), | | | | | |
4.80%, 2/15/19 | | 1,650 | | 1,691 | |
Dallas County, TX, Community College District, General Obligation Bonds, | | | | | |
5.00%, 2/15/25 - 2/15/28 | | 6,990 | | 6,755 | |
Dallas, TX, Area Rapid Transit, Revenue Bonds (AMBAC), | | | | | |
5.00%, 12/1/11 | | 1,915 | | 2,025 | |
Dallas, TX, Water & Sewer Systems (AMBAC), | | | | | |
5.00%, 10/1/13 | | 10,000 | | 10,593 | |
Dallas, TX, Waterworks & Sewer Systems, Revenue Bonds (AMBAC), | | | | | |
5.00%, 10/1/12 | | 5,000 | | 5,285 | |
De Kalb County, IL, Community School District No. 428, General Obligation Bonds (FSA), | | | | | |
5.00%, 1/1/24 - 1/1/25 | | 4,275 | | 4,118 | |
Delta County, MI, Economic Development Corp., Revenue Bonds, | | | | | |
6.25%, 4/15/27 | | 450 | | 489 | |
Denton, TX, Independent School District, General Obligation Bonds (PSFG), | | | | | |
5.00%, 8/15/12 | | 1,905 | | 2,021 | |
| | | | | | | |
| The accompanying notes are an integral part of the financial statements. | 115 |
2008 Annual Report |
|
September 30, 2008 |
Portfolio of Investments (cont’d)
Municipal Portfolio
| | Face | | | |
| | Amount | | Value | |
| | (000) | | (000) | |
Municipal Bonds (cont’d) | | | | | |
Denton, TX, Utility System, | | | | | |
Revenue Bonds (AMBAC), | | | | | |
5.00%, 12/1/16 | | $ | 1,865 | | $ | 1,953 | |
Detroit, MI, Sewer Disposal, | | | | | |
Revenues Bonds (BHAC; FGIC), | | | | | |
5.25%, 7/1/28 | | 11,750 | | 11,302 | |
5.50%, 7/1/26 | | 475 | | 467 | |
Detroit, MI, Water Supply System, Second Lien, | | | | | |
Revenue Bonds (BHAC; FGIC), | | | | | |
5.50%, 7/1/25 | | 3,490 | | 3,441 | |
5.75%, 7/1/26 | | 8,735 | | 8,851 | |
Director of the State of Nevada Department of | | | | | |
Business & Industry, Revenue Bonds, | | | | | |
5.63%, 12/1/26(h) | | 1,100 | | 988 | |
District of Columbia Water & Sewer Authority, | | | | | |
Public Utility, Revenue Bonds (AGC), | | | | | |
5.00%, 10/1/26 - 10/1/27 | | 4,860 | | 4,620 | |
District of Columbia, General Obligation | | | | | |
Bonds (FSA), | | | | | |
5.00%, 6/1/16 - 6/1/19 | | 11,480 | | 11,726 | |
Dover, PA, Area School District, | | | | | |
General Obligation Bonds (FGIC), | | | | | |
5.00%, 4/1/16 | | 1,000 | | 1,021 | |
Duncanville, TX, Independent School District, | | | | | |
General Obligation Bonds (PSFG), | | | | | |
Zero Coupon, 2/15/22 | | 4,000 | | 1,918 | |
Eagle, IN, Union Middle School Building, | | | | | |
Revenue Bonds (AMBAC), | | | | | |
4.90%, 7/5/16 | | 1,000 | | 1,016 | |
5.00%, 7/5/17 | | 1,500 | | 1,521 | |
Eanes, TX, Independent School District, | | | | | |
General Obligation Bonds (PSFG), | | | | | |
4.80%, 8/1/19 | | 1,365 | | 1,370 | |
Edgewood, TX, Independent School District (PSFG), | | | | | |
4.75%, 8/15/16 | | 1,310 | | 1,374 | |
4.85%, 8/15/17 | | 880 | | 888 | |
Elizabeth Forward, PA, School District (MBIA), | | | | | |
Zero Coupon, 9/1/11 | | 1,250 | | 1,125 | |
Erie County, NY, Industrial Development Agency, | | | | | |
Revenue Bonds (FSA), | | | | | |
5.00%, 5/1/14 - 5/1/15 | | 5,925 | | 6,274 | |
Essex County, NJ, Utility Authority, | | | | | |
Revenue Bonds (FSA), | | | | | |
4.80%, 4/1/14 | | 1,005 | | 1,011 | |
Eureka, CA, Union School District, | | | | | |
General Obligation Bonds (MBIA), | | | | | |
Zero Coupon, 8/1/28 - 8/1/30 | | 5,090 | | 1,439 | |
Everett, WA, Water & Sewer, | | | | | |
Revenue Bonds (MBIA), | | | | | |
5.00%, 7/1/13 | | 1,630 | | 1,726 | |
Florida Municipal Loan Council, | | | | | |
Revenue Bonds (MBIA), | | | | | |
5.00%, 10/1/11 - 10/1/13 | | 3,850 | | 4,022 | |
Florida State Board of Education, | | | | | |
General Obligation Bonds, | | | | | |
5.00%, 6/1/26 - 6/1/27 | | 5,370 | | 5,154 | |
Florida State Mid-Bay Bridge Authority, | | | | | |
Revenue Bonds (AGC), | | | | | |
5.00%, 10/1/22 | | 4,225 | | 4,044 | |
Fontana, CA, Unified School District, | | | | | |
General Obligation Bonds (FSA), | | | | | |
Zero Coupon, 8/1/30 - 8/1/32 | | 20,050 | | 5,158 | |
Fort Wayne Hospital Authority, IN, | | | | | |
Revenue Bonds (MBIA), | | | | | |
4.70%, 11/15/11 | | 1,100 | | 1,124 | |
Friendswood, TX, Independent School District, | | | | | |
General Obligation Bonds (PSFG), | | | | | |
5.00%, 2/15/23 - 2/15/24 | | 3,660 | | 3,543 | |
Frisco, TX, Independent School District, | | | | | |
General Obligation Bonds (PSFG), | | | | | |
Zero Coupon, 8/15/20 - 8/15/22 | | 6,260 | | 3,140 | |
Geneva, IL, Industrial Development, | | | | | |
Revenue Bonds (FSA), | | | | | |
4.80%, 5/1/19 | | 1,705 | | 1,704 | |
Georgetown County, SC, Pollution Control | | | | | |
Facility, Revenue Bonds, | | | | | |
5.13%, 2/1/12 | | 725 | | 709 | |
Gilliam County, OR, Solid Waste Disposal, | | | | | |
Revenue Bonds, | | | | | |
4.88%, 7/1/38 | | 1,400 | | 1,347 | |
Girard Area, PA, School District, | | | | | |
General Obligation Bonds (FGIC), | | | | | |
Zero Coupon, 10/1/18 - 10/1/19 | | 950 | | 556 | |
Grand Prairie, TX, Independent School District, | | | | | |
General Obligation Bonds (PSFG), | | | | | |
Zero Coupon, 2/15/14 | | 2,240 | | 1,802 | |
Grapevine, TX, Certificates of Obligation, | | | | | |
General Obligation Bonds (FGIC), | | | | | |
5.75%, 8/15/17 | | 1,000 | | 1,058 | |
Greenville, MI, Public Schools, | | | | | |
General Obligation Bonds (FSA; Q-SBLF), | | | | | |
5.00%, 5/1/16 - 5/1/18 | | 2,645 | | 2,740 | |
Greenwood Fifty School Facilities, Inc., SC, | | | | | |
Installment Purchase, Revenue Bonds (AGC), | | | | | |
5.00%, 12/1/11 | | 1,000 | | 1,049 | |
Gulf Coast Waste Disposal Authority, TX, | | | | | |
Revenue Bonds, | | | | | |
4.55%, 4/1/12 | | 830 | | 793 | |
Hampton Roads, VA, Sanitation District, | | | | | |
Wastewater, Revenue Bonds, | | | | | |
5.00%, 4/1/27 - 4/1/28 | | 5,910 | | 5,697 | |
Harris County, TX, Health Facilities | | | | | |
Development Corp., Thermal Utilities, | | | | | |
Revenue Bonds (AGC), | | | | | |
5.25%, 11/15/24 - 11/15/25 | | 7,480 | | 7,258 | |
Harvey County, KS, Unified School District | | | | | |
No. 373 Newton Refunding & | | | | | |
Improvement (MBIA), | | | | | |
5.00%, 9/1/19 | | 2,630 | | 2,630 | |
Hawaii State, COP, General Obligation | | | | | |
Bonds (AMBAC), | | | | | |
4.80%, 5/1/12 | | 1,275 | | 1,289 | |
Hennepin County, MN, Sales Tax, Revenue Bonds, | | | | | |
5.00%, 12/15/23 - 12/15/26 | | 4,300 | | 4,230 | |
| | | | | | | |
116 | The accompanying notes are an integral part of the financial statements. | |
| 2008 Annual Report |
| |
| September 30, 2008 |
Portfolio of Investments (cont’d)
Municipal Portfolio
| | Face | | | |
| | Amount | | Value | |
| | (000) | | (000) | |
Municipal Bonds (cont’d) | | | | | |
Honolulu, HI, City & County, Wastewater System, | | | | | |
Revenue Bonds (FSA), | | | | | |
5.00%, 7/1/24 - 7/1/26 | | $ | 6,545 | | $ | 6,293 | |
Houston, TX, Community College System, | | | | | |
Revenue Bonds (AMBAC), | | | | | |
4.00%, 4/15/11 - 4/15/12 | | 2,865 | | 2,930 | |
Houston, TX, Community College System, | | | | | |
Revenue Bonds (FSA), | | | | | |
5.00%, 4/15/23 - 4/15/25 | | 5,475 | | 5,248 | |
Houston, TX, General Obligation Bonds (MBIA), | | | | | |
5.00%, 3/1/12 | | 3,400 | | 3,583 | |
Houston, TX, Hotel Occupancy, | | | | | |
Revenue Bonds (FSA; AMBAC), | | | | | |
Zero Coupon, 9/1/25 - 9/1/26 | | 14,175 | | 4,924 | |
Houston, TX, Independent School District, | | | | | |
General Obligation Bonds (PSFG), | | | | | |
5.00%, 2/15/13 - 2/15/28 | | 13,745 | | 13,662 | |
Houston, TX, Utility System, | | | | | |
Revenue Bonds (FGIC), | | | | | |
5.00%, 11/15/13 | | 1,000 | | 1,049 | |
Houston, TX, Water & Sewer System, | | | | | |
Revenue Bonds (FSA), | | | | | |
Zero Coupon, 12/1/25 | | 12,350 | | 4,700 | |
Humble, TX, Independent School District, | | | | | |
General Obligation Bonds (AGC), | | | | | |
5.00%, 2/15/27 - 2/15/28 | | 5,355 | | 5,090 | |
Idaho Housing & Finance Association, Grant — | | | | | |
Revenue Anticipation — Federal Highway | | | | | |
Trust, Revenue Bonds (AGC), | | | | | |
5.25%, 7/15/25 - 7/15/26 | | 8,450 | | 8,471 | |
Illinois Development Finance Authority, | | | | | |
Revenue Bonds (FGIC), | | | | | |
Zero Coupon, 12/1/09 | | 2,000 | | 1,923 | |
Illinois Finance Authority, Edward Hospital, | | | | | |
Revenue Bonds (AMBAC), | | | | | |
6.00%, 2/1/23 - 2/1/26 | | 2,455 | | 2,451 | |
Illinois Finance Authority, Gas Supply, | | | | | |
Revenue Bonds, | | | | | |
3.75%, 2/1/33(h) | | 5,150 | | 5,038 | |
Illinois Health Facilities Authority, | | | | | |
Revenue Bonds (MBIA), | | | | | |
5.00%, 11/15/12 | | 1,000 | | 1,011 | |
Illinois Health Facilities Authority, | | | | | |
Revenue Bonds, SAVRS (AMBAC), | | | | | |
3.12%, 8/16/24(h) | | 11,750 | | 11,750 | |
Illinois Municipal Electric Agency, | | | | | |
Revenue Bonds (FGIC), | | | | | |
5.00%, 2/1/13 - 2/1/15 | | 2,065 | | 2,143 | |
Indiana Port Commission, Revenue Bonds, | | | | | |
4.10%, 5/1/12 | | 3,450 | | 3,452 | |
Indiana State Development Finance Authority, | | | | | |
Revenue Bonds, | | | | | |
4.70%, 10/1/31(h) | | 100 | | 90 | |
Indiana Transportation Finance Authority, | | | | | |
Highway Revenue Bonds (AMBAC), | | | | | |
Zero Coupon, 12/1/16 | | 1,695 | | 1,144 | |
Indio, CA, Redevelopment Agency, Tax Allocation, | | | | | |
5.00%, 8/15/24 | | 1,470 | | 1,350 | |
5.13%, 8/15/25 | | 2,015 | | 1,862 | |
Intermountain Power Agency, UT, Power Supply, | | | | | |
Revenue Bonds, | | | | | |
Zero Coupon, 7/1/17 | | 1,750 | | 1,165 | |
Iowa Finance Authority, Private University, | | | | | |
Revenue Bonds (CIFG), | | | | | |
5.00%, 4/1/13 | | 1,210 | | 1,236 | |
Iredell County, NC, Iredell County | | | | | |
School Project, COP (FSA), | | | | | |
5.13%, 6/1/27 | | 1,650 | | 1,582 | |
Irving, TX, Independent School District, | | | | | |
General Obligation Bonds (PSFG), | | | | | |
Zero Coupon, 2/15/13 | | 1,945 | | 1,647 | |
Judson, TX, Independent School District, | | | | | |
General Obligation Bonds (PSFG), | | | | | |
5.00%, 2/1/13 | | 1,000 | | 1,057 | |
Kane & De Kalb Counties, IL, | | | | | |
Community Unit School District, | | | | | |
General Obligation Bonds (AMBAC), | | | | | |
Zero Coupon, 12/1/09 | | 725 | | 700 | |
Kendall & Kane Counties, IL, Community School | | | | | |
District No. 115, Yorkville, | | | | | |
General Obligation Bonds (AGC), | | | | | |
5.00%, 2/1/27 - 2/1/28 | | 13,070 | | 12,429 | |
Kendall, Kane & Will Counties, IL, | | | | | |
Community School District No. 308, | | | | | |
General Obligation Bonds (FSA), | | | | | |
Zero Coupon, 2/1/23 - 2/1/27 | | 20,770 | | 8,649 | |
Kentucky Asset Liability Commission, KY, | | | | | |
Revenue Bonds (MBIA), | | | | | |
5.00%, 9/1/14 | | 1,800 | | 1,907 | |
Kentucky State Property & Buildings Commission, | | | | | |
Revenue Bonds (FSA), | | | | | |
5.00%, 11/1/25 | | 1,225 | | 1,176 | |
Kentucky Turnpike Authority, KY, Revenue Bonds, | | | | | |
5.00%, 7/1/24 | | 6,650 | | 6,431 | |
King County, WA, General Obligation Bonds, | | | | | |
5.00%, 1/1/18 | | 2,500 | | 2,565 | |
King County, WA, General Obligation Bonds (MBIA), | | | | | |
5.00%, 12/1/19 | | 1,075 | | 1,087 | |
King County, WA, School District No. 414 Lake | | | | | |
Washington (FSA), | | | | | |
5.00%, 12/1/16 - 12/1/19 | | 15,680 | | 16,216 | |
Klein, TX, Independent School District, | | | | | |
General Obligation Bonds (PSFG), | | | | | |
5.00%, 8/1/27 | | 3,955 | | 3,778 | |
Lake County, IL, | | | | | |
Community Consolidated School District, | | | | | |
General Obligation Bonds (FGIC), | | | | | |
Zero Coupon, 12/1/19 - 12/1/21 | | 12,775 | | 6,519 | |
Lakeview, MI, Public School District, | | | | | |
General Obligation Bonds (Q-SBLF), | | | | | |
5.00%, 5/1/16 | | 1,060 | | 1,115 | |
| | | | | | | |
| The accompanying notes are an integral part of the financial statements. | 117 |
2008 Annual Report |
|
September 30, 2008 |
Portfolio of Investments (cont’d)
Municipal Portfolio
| | Face | | | |
| | Amount | | Value | |
| | (000) | | (000) | |
Municipal Bonds (cont’d) | | | | | |
Lamar, TX, Consolidated | | | | | |
Independent School District, | | | | | |
General Obligation Bonds (PSFG), | | | | | |
5.00%, 2/15/12 | | $ | 1,000 | | $ | 1,056 | |
Lansing, MI, Board of Water & Light, | | | | | |
Revenue Bonds, | | | | | |
5.00%, 7/1/24 - 7/1/26 | | 4,920 | | 4,713 | |
Las Vegas, NV, Water District, | | | | | |
General Obligation Bonds, | | | | | |
5.00%, 6/1/18 | | 4,695 | | 4,798 | |
Lexington County, SC, Revenue Bonds, | | | | | |
5.00%, 11/1/16 | | 165 | | 162 | |
Lone Star College System, TX, | | | | | |
General Obligation Bonds, | | | | | |
5.25%, 8/15/24 - 8/15/25 | | 7,730 | | 7,624 | |
Long Beach, CA, Community College District, | | | | | |
General Obligation Bonds (FGIC), | | | | | |
Zero Coupon, 5/1/14 | | 2,465 | | 1,934 | |
Long Island, NY, Power Authority Electric System, | | | | | |
Revenue Bonds (FSA), | | | | | |
Zero Coupon, 6/1/16 | | 3,700 | | 2,639 | |
Louisiana Correctional Facilities Corp., LA, | | | | | |
Revenue Bonds (AMBAC), | | | | | |
5.00%, 9/1/12 | | 1,230 | | 1,287 | |
Louisiana Local Government Environmental | | | | | |
Facilities, Community Development Authority, | | | | | |
Revenue Bonds, Bossier City Public | | | | | |
Improvement Projects (AMBAC), | | | | | |
5.00%, 11/1/13 | | 1,320 | | 1,384 | |
5.00%, 11/1/15(e) | | 1,200 | | 1,261 | |
Louisiana Offshore Terminal Authority, LA, | | | | | |
Revenue Bonds, | | | | | |
4.30%, 10/1/37(h) | | 2,600 | | 2,658 | |
Lubbock, TX, General Obligation Bonds (FSA), | | | | | |
5.00%, 2/15/14 | | 1,355 | | 1,433 | |
Madera, CA, Unified School District, | | | | | |
General Obligation Bonds (FGIC), | | | | | |
Zero Coupon, 8/1/26 - 8/1/28 | | 7,000 | | 2,241 | |
Madison & Jersey Counties, IL, Unit School | | | | | |
District, General Obligation Bonds (FSA), | | | | | |
Zero Coupon, 12/1/20 | | 2,900 | | 1,522 | |
Maricopa County, AZ, Pollution Control, | | | | | |
2.90%, 6/1/35(h) | | 1,600 | | 1,595 | |
4.00%, 1/1/38(h) | | 350 | | 348 | |
Maryland State Department of Transportation, | | | | | |
Construction Transportation, Revenue Bonds, | | | | | |
5.00%, 2/15/18 | | 5,100 | | 5,358 | |
Maryland State Economic Development Corp., | | | | | |
Revenue Bonds, | | | | | |
7.50%, 12/1/14 | | 350 | | 373 | |
Massachusetts State Development | | | | | |
Financing Agency, Resource Recovery, | | | | | |
Waste Management, Inc. Project, | | | | | |
Revenue Bonds, | | | | | |
6.90%, 12/1/29(h) | | 250 | | 255 | |
Massachusetts State Health & Educational | | | | | |
Facilities Authority, Revenue Bonds (AMBAC), | | | | | |
4.80%, 7/1/12 | | 1,665 | | 1,684 | |
Maury County, TN, Industrial Development Board, | | | | | |
Solid Waste Disposal, Revenue Bonds, | | | | | |
6.30%, 8/1/18 | | 1,075 | | 1,135 | |
Memphis-Shelby County, TN, Airport Authority | | | | | |
Special Facilities, Revenue Bonds, Federal | | | | | |
Express Corp., | | | | | |
5.00%, 9/1/09 | | 850 | | 858 | |
Memphis-Shelby Sports Authority, Inc., Revenue | | | | | |
Bonds, Memphis Arena Project (MBIA), | | | | | |
5.00%, 11/1/13 | | 1,410 | | 1,469 | |
Merced City, CA, School District, | | | | | |
General Obligation Bonds (MBIA), | | | | | |
Zero Coupon, 8/1/28 - 8/1/29 | | 4,665 | | 1,368 | |
Merrillville, IN, Multi School Building Corp., | | | | | |
Revenue Bonds, | | | | | |
5.00%, 1/15/17 - 7/15/17 | | 2,545 | | 2,577 | |
Metropolitan Pier & Exposition Authority, IL, | | | | | |
Dedicated State Tax, Revenue Bonds (MBIA), | | | | | |
Zero Coupon, 6/15/20 - 12/15/23 | | 5,175 | | 2,560 | |
Miami-Dade County School Board, FL, COP, | | | | | |
General Obligation Bonds (FGIC), | | | | | |
5.00%, 5/1/11 - 5/1/13 | | 15,005 | | 15,595 | |
Michigan City, IN, Area-Wide School | | | | | |
Building Corp., Revenue Bonds (FGIC), | | | | | |
Zero Coupon, 1/15/17 - 1/15/20 | | 6,750 | | 4,070 | |
Michigan State Strategic Fund, | | | | | |
Michigan House of Representatives Facilities, | | | | | |
Revenue Bonds (AGC), | | | | | |
5.25%, 10/15/23 | | 1,485 | | 1,447 | |
Michigan State Strategic Fund, Solid | | | | | |
Waste Management Project, | | | | | |
Revenue Bonds (GTY AGMT), | | | | | |
4.63%, 12/1/12 | | 275 | | 259 | |
Milwaukee, WI, Sewer, Revenue Bonds (AMBAC), | | | | | |
4.88%, 6/1/19 | | 2,070 | | 2,075 | |
Monmouth County, NJ, Improvement Authority, | | | | | |
Revenue Bonds (AMBAC), | | | | | |
5.00%, 12/1/16 - 12/1/17 | | 3,010 | | 3,147 | |
Montour, PA, School District, General Obligation | | | | | |
Bonds (MBIA), | | | | | |
Zero Coupon, 1/1/13 | | 300 | | 254 | |
Morton Grove, IL, General Obligation Bonds (FGIC), | | | | | |
4.50%, 12/1/13 | | 1,480 | | 1,482 | |
Mount San Antonio, CA, | | | | | |
Community College District, | | | | | |
General Obligation Bonds (MBIA), | | | | | |
Zero Coupon, 8/1/16 - 8/1/17 | | 27,555 | | 18,620 | |
Murrieta Valley, CA, Unified School District, | | | | | |
Public Financing Authority, | | | | | |
General Obligation Bonds (FSA), | | | | | |
Zero Coupon, 9/1/24 - 9/1/30 | | 15,100 | | 4,439 | |
Nebraska Public Power District, | | | | | |
Revenue Bonds (FSA), | | | | | |
5.00%, 1/1/13 | | 2,000 | | 2,111 | |
| | | | | | | |
118 | The accompanying notes are an integral part of the financial statements. | |
| 2008 Annual Report |
| |
| September 30, 2008 |
Portfolio of Investments (cont’d)
Municipal Portfolio
| | Face | | | |
| | Amount | | Value | |
| | (000) | | (000) | |
Municipal Bonds (cont’d) | | | | | |
New Jersey Economic Development Authority, Revenue Bonds, | | | | | |
Zero Coupon, 4/1/12 | | $ | 625 | | $ | 553 | |
New Jersey Health Care Facilities Financing Authority, AHS Hospital Corp., Revenue Bonds, | | | | | |
5.00%, 7/1/27 | | 1,690 | | 1,530 | |
New Jersey State Educational Facilities Authority, Rowan University, Revenue Bonds (AGC), | | | | | |
5.00%, 7/1/27 | | 2,405 | | 2,334 | |
New Mexico Finance Authority, Revenue Bonds (MBIA), | | | | | |
5.00%, 6/15/12 - 6/15/15 | | 7,115 | | 7,509 | |
New Mexico Finance Authority, Revenue Bonds, | | | | | |
5.00%, 6/1/25 - 6/1/27 | | 5,115 | | 4,908 | |
New Orleans, LA, Audubon Commission, General Obligation Bonds (FSA), | | | | | |
5.00%, 10/1/13 | | 1,695 | | 1,788 | |
New York City, NY, General Obligation Bonds, | | | | | |
5.00%, 4/1/27 | | 2,775 | | 2,600 | |
New York City, NY, Industrial Development Agency, Revenue Bonds (FSA), | | | | | |
6.00%, 11/1/15 | | 1,360 | | 1,374 | |
New York City, NY, Municipal Power Water Finance Authority, Revenue Bonds, | | | | | |
5.00%, 6/15/29 | | 1,905 | | 1,811 | |
New York Power Authority, Revenue Bonds (MBIA), | | | | | |
5.00%, 11/15/14 - 11/15/15 | | 11,360 | | 12,085 | |
New York State Dormitory Authority, Revenue Bonds, Nonstructured Supported Debt, Memorial Sloan-Kettering, Revenue Bonds, | | | | | |
5.00%, 7/1/26 | | 11,750 | | 11,217 | |
Noblesville, IN, High School Building Corp., Revenue Bonds (AMBAC), | | | | | |
Zero Coupon, 2/15/19 | | 1,850 | | 1,071 | |
5.00%, 1/10/12 - 7/10/13 | | 4,880 | | 5,166 | |
North Carolina Infrastructure Finance Corp., COP (FSA), | | | | | |
5.00%, 5/1/12 - 5/1/13 | | 12,115 | | 12,799 | |
North Carolina Infrastructure Finance Corp., COP (AMBAC), | | | | | |
5.00%, 6/1/15 | | 3,750 | | 3,933 | |
North Carolina Municipal Power Agency, Electric Revenue Bonds, | | | | | |
6.63%, 1/1/10 | | 850 | | 884 | |
North Side, IN, High School Building Corp., Revenue Bonds (FSA), | | | | | |
5.25%, 7/15/13 | | 2,910 | | 3,143 | |
North Slope Borough, AK, General Obligation Bonds (MBIA), | | | | | |
Zero Coupon, 6/30/12 | | 2,900 | | 2,500 | |
North Texas Tollway Authority, Revenue Bonds (AGC), | | | | | |
Zero Coupon, 1/1/34 - 1/1/36 | | 41,900 | | 7,585 | |
Northwest Allen County, Middle School Building Corp. (FSA), | | | | | |
5.00%, 7/15/16 - 7/15/19 | | 4,595 | | 4,672 | |
Norwalk-LA Mirada, CA, Unified School District, General Obligation Bonds (FGIC), | | | | | |
Zero Coupon, 8/1/25 | | 8,900 | | 3,210 | |
Ohio State, Solid Waste, Revenue Bonds, | | | | | |
4.25%, 4/1/33(h) | | 700 | | 623 | |
Okemos, MI, Public School District, General Obligation Bonds (MBIA; Q-SBLF), | | | | | |
Zero Coupon, 5/1/15 | | 900 | | 669 | |
Ouachita Parish, LA, West Ouachita Parish School District, Revenue Bonds (MBIA), | | | | | |
4.70%, 9/1/14 | | 1,020 | | 1,041 | |
Pajaro Valley, CA, Unified School District, COP, General Obligation Bonds (FSA), | | | | | |
Zero Coupon, 8/1/27 | | 2,220 | | 748 | |
Palm Beach County School Board, FL, COP, General Obligation Bonds (MBIA), | | | | | |
5.00%, 8/1/12 - 8/1/13 | | 7,280 | | 7,574 | |
Palm Beach County School Board, FL, COP, General Obligation Bonds (FGIC), | | | | | |
5.00%, 8/1/11 - 8/1/12 | | 7,770 | | 8,063 | |
Palomar Pomerado Health (MBIA), | | | | | |
Zero Coupon, 8/1/16 - 8/1/19 | | 11,170 | | 6,908 | |
Pearland, TX, Independent School District, General Obligation Bonds (PSFG), | | | | | |
4.88%, 2/15/19 | | 1,425 | | 1,503 | |
Penn Hills Municipality, PA, General Obligation Bonds, | | | | | |
Zero Coupon, 6/1/12 - 12/1/13 | | 2,115 | | 1,771 | |
Pennsylvania Convention Center Authority, Revenue Bonds (FGIC), | | | | | |
6.70%, 9/1/16 | | 500 | | 564 | |
Pennsylvania State Financing Authority, Aliquippa School District, Revenue Bonds, | | | | | |
Zero Coupon, 6/1/12 | | 685 | | 589 | |
Pennsylvania State Higher Educational Facilities Authority, University Sciences Philadelphia, Revenue Bonds (AGC), | | | | | |
5.00%, 11/1/25 - 11/1/27 | | 7,795 | | 7,416 | |
Pennsylvania State Public School Building
Authority, Marple Newtown School District
Project, Revenue Bonds (MBIA), | | | | | |
4.60%, 3/1/15 | | 1,065 | | 1,109 | |
4.70%, 3/1/16 | | 715 | | 747 | |
Pennsylvania State Turnpike Commission, Oil Franchise Tax, Revenue Bonds (MBIA), | | | | | |
5.00%, 12/1/27 - 12/1/29 | | 5,075 | | 4,824 | |
Pennsylvania State Turnpike Commission, Revenue Bonds (AGC), | | | | | |
5.00%, 6/1/23 - 6/1/24 | | 3,000 | | 2,912 | |
Pennsylvania State University, Revenue Bonds, | | | | | |
5.00%, 8/15/24 - 8/15/26 | | 5,325 | | 5,140 | |
| | | | | | | |
The accompanying notes are an integral part of the financial statements. | 119 |
2008 Annual Report
September 30, 2008
Portfolio of Investments (cont’d)
Municipal Portfolio
| | Face | | | |
| | Amount | | Value | |
| | (000) | | (000) | |
Municipal Bonds (cont’d) | | | | | |
Philadelphia, PA, Authority for Industrial Development (FSA), | | | | | |
5.00%, 2/15/15 | | $ | 2,150 | | $ | 2,243 | |
Philadelphia, PA, Authority for Industrial Development (FGIC), | | | | | |
5.00%, 10/1/11 - 10/1/13 | | 18,040 | | 18,499 | |
Philadelphia, PA, Water & Wastewater, Revenue Bonds (AMBAC), | | | | | |
5.00%, 8/1/12 - 8/1/13 | | 6,005 | | 6,257 | |
Piedmont Municipal Power Agency, Electric, Revenue Bonds (AGC), | | | | | |
5.00%, 1/1/25 | | 1,945 | | 1,827 | |
Piedmont, SC, Municipal Power Agency, Revenue Bonds (AMBAC), | | | | | |
Zero Coupon, 1/1/31 - 1/1/32 | | 22,300 | | 5,186 | |
Pittsburgh, PA, Stadium Authority Lease, Revenue Bonds, | | | | | |
6.50%, 4/1/11 | | 80 | | 84 | |
Pittsburgh, PA, Urban Redevelopment Authority, Revenue Bonds (FGIC), | | | | | |
Zero Coupon, 9/1/26 | | 10,000 | | 3,278 | |
Pittsburgh, PA, Water & Sewer Authority, Water & Sewer System, Revenue Bonds (FSA), | | | | | |
5.00%, 9/1/13 | | 1,000 | | 1,055 | |
Redding, CA, Electric System, COP, Revenue Bonds (FSA), | | | | | |
5.00%, 6/1/24 - 6/1/26 | | 8,575 | | 8,267 | |
Regional Transportation District, CO, COP (AMBAC), | | | | | |
5.00%, 12/1/12 - 12/1/13 | | 14,085 | | 14,697 | |
Rescue Union School District, CA, General Obligation Bonds (MBIA), | | | | | |
Zero Coupon, 9/1/27 | | 2,000 | | 638 | |
Richland County, SC, Revenue Bonds, | | | | | |
6.10%, 4/1/23 | | 725 | | 653 | |
Rincon Valley, CA, Union School District, General Obligation Bonds (FGIC), | | | | | |
Zero Coupon, 8/1/32 - 8/1/35 | | 9,675 | | 2,041 | |
Riverside, CA, Electric Revenue Bonds (MBIA), | | | | | |
5.00%, 10/1/11 | | 1,730 | | 1,817 | |
Robinson Township, PA, Municipal Authority, Revenue Bonds, | | | | | |
6.90%, 5/15/18 | | 40 | | 45 | |
Saginaw, MI, Hospital Financing Authority, Revenue Bonds (MBIA), | | | | | |
5.38%, 7/1/19 | | 1,265 | | 1,276 | |
Sam Rayburn, TX, Municipal Power Agency, Revenue Bonds, | | | | | |
6.00%, 10/1/21 | | 650 | | 637 | |
San Antonio County, TX, Parking System, Revenue Bonds (AMBAC), | | | | | |
5.50%, 8/15/17 | | 700 | | 716 | |
San Diego County, CA, Water Authority, COP, Revenue Bonds (FSA), | | | | | |
5.00%, 5/1/27 - 5/1/28 | | 5,795 | | 5,603 | |
Sanger, TX, Independent School District, General Obligation Bonds (PSFG), | | | | | |
Zero Coupon, 2/15/19 - 2/15/22 | | 4,265 | | 2,250 | |
Santa Ana, CA, Unified School District, General Obligation Bonds (FGIC), | | | | | |
Zero Coupon, 8/1/19 - 8/1/20 | | 5,475 | | 2,951 | |
Scranton-Lackawanna, PA, Health & Welfare Authority, Revenue Bonds, | | | | | |
6.63%, 7/1/09 | | 15 | | 15 | |
Seminole County, FL, School Board, COP (AMBAC), | | | | | |
5.00%, 7/1/11 - 7/1/12 | | 6,750 | | 7,032 | |
Spokane County, WA, General Obligation Bonds (MBIA), | | | | | |
5.00%, 12/1/11 | | 1,000 | | 1,056 | |
Spooner, WI, Area School District (AGC), | | | | | |
4.75%, 10/1/24 | | 1,000 | | 931 | |
Spring, TX, Independent School District, General Obligation Bonds (PSFG), | | | | | |
5.00%, 8/15/19 | | 1,760 | | 1,778 | |
State of Mississippi, General Obligation Bonds, | | | | | |
5.00%, 12/1/15 - 12/1/17 | | 19,705 | | 20,894 | |
State of Nevada, General Obligation Bonds (FGIC), | | | | | |
5.00%, 12/1/11 - 12/1/13 | | 13,360 | | 14,118 | |
State of North Carolina, Revenue Bonds (MBIA), | | | | | |
5.00%, 3/1/13 | | 5,120 | | 5,422 | |
State of Texas, Transportation Communication — Mobility Fund, General Obligation Bonds, | | | | | |
5.00%, 4/1/18 | | 4,000 | | 4,171 | |
State of Wisconsin, WI, Revenue Bonds, | | | | | |
5.00%, 7/1/24 - 7/1/25 | | 10,045 | | 9,677 | |
Steel Valley, PA, Allegheny County School District, General Obligation Bonds, | | | | | |
Zero Coupon, 11/1/11 - 11/1/17 | | 1,820 | | 1,454 | |
Tallahassee Blueprint 2000 Intergovernmental Agency, Revenue Bonds (MBIA), | | | | | |
5.00%, 10/1/13 - 10/1/14 | | 3,105 | | 3,269 | |
Texas State Turnpike Authority, Revenue Bonds (AMBAC), | | | | | |
Zero Coupon, 8/15/18 | | 5,700 | | 3,237 | |
Texas State University System, TX, Revenue Bonds, | | | | | |
5.25%, 3/15/24 - 3/15/25 | | 3,735 | | 3,661 | |
Tobacco Securitization Authority of Northern California, Asset Backed Revenue Bonds, Series A-1, | | | | | |
4.75%, 6/1/23 | | 5,640 | | 4,803 | |
Tobacco Settlement Authority of Washington, Asset Backed Revenue Bonds, | | | | | |
6.50%, 6/1/26 | | 860 | | 817 | |
Tobacco Settlement Financing Corp., LA, Asset Backed Revenue Bonds, | | | | | |
5.50%, 5/15/30 | | 1,350 | | 1,190 | |
Tobacco Settlement Financing Corp., RI, Asset Backed Revenue Bonds, | | | | | |
6.00%, 6/1/23 | | 1,525 | | 1,436 | |
| | | | | | | |
120 | The accompanying notes are an integral part of the financial statements. |
| 2008 Annual Report |
| |
| September 30, 2008 |
Portfolio of Investments (cont’d)
Municipal Portfolio
| | Face | | | |
| | Amount | | Value | |
| | (000) | | (000) | |
Municipal Bonds (cont’d) | | | | | |
Toledo-Lucas County, OH, Port Authority, Revenue Bonds, | | | | | |
6.45%, 12/15/21 | | $ | 900 | | $ | 891 | |
Traverse City, MI, Public Schools (FSA), | | | | | |
5.00%, 5/1/16 - 5/1/19 | | 7,840 | | 8,083 | |
Triborough Bridge & Tunnel Authority, NY, Revenue Bonds, | | | | | |
4.75%, 11/15/29 | | 2,770 | | 2,515 | |
Union Elementary School District, CA, General Obligation Bonds (MBIA), | | | | | |
Zero Coupon, 9/1/27 - 9/1/28 | | 8,000 | | 2,623 | |
University of Arkansas, Revenue Bonds (FSA), | | | | | |
4.90%, 12/1/19 | | 2,315 | | 2,446 | |
University of Cincinnati, OH, Revenue Bonds (MBIA), | | | | | |
5.00%, 6/1/19 | | 3,475 | | 3,517 | |
University of Utah, COP, General Obligation Bonds (AMBAC), | | | | | |
5.00%, 12/1/11 - 12/1/13 | | 4,040 | | 4,275 | |
Upper Darby Township, PA, General Obligation Bonds (AMBAC), | | | | | |
Zero Coupon, 7/15/11 | | 525 | | 475 | |
Utah County, UT, Environmental Improvement, Revenue Bonds, | | | | | |
5.05%, 11/1/17 | | 170 | | 168 | |
Victor Elementary School District, CA, General Obligation Bonds (FGIC), | | | | | |
Zero Coupon, 2/1/30 | | 2,100 | | 550 | |
Virginia State Peninsula Regional Jail Authority, Regional Jail Facilities, Revenue Bonds (MBIA), | | | | | |
5.00%, 10/1/12 - 10/1/13 | | 2,705 | | 2,839 | |
Warren, MI, Consolidated School District, General Obligation Bonds (Q-SBLF), | | | | | |
4.15%, 5/1/14 | | 1,000 | | 1,015 | |
Washington State Health Care Facilities Authority, Revenue Bonds (AMBAC), | | | | | |
5.13%, 11/15/11 | | 1,000 | | 1,012 | |
Washington State Health Care Facilities, (Children’s Hospital), Revenue Bonds (FSA), | | | | | |
4.70%, 10/1/11 | | 1,075 | | 1,086 | |
Washington State Health Care Facilities, (Providence Health), Revenue Bonds (FSA), | | | | | |
5.25%, 10/1/33 | | 3,000 | | 2,825 | |
Washington State Motor Vehicle Fuel Facilities, General Obligation Bonds (AMBAC), | | | | | |
Zero Coupon, 6/1/14 - 6/1/16 | | 8,160 | | 6,123 | |
Washington State Recreational Facilities, General Obligation Bonds (FGIC), | | | | | |
Zero Coupon, 1/1/17 | | 6,900 | | 4,646 | |
Washoe County, NV, General Obligation Bonds (FSA), | | | | | |
Zero Coupon, 7/1/18 | | 4,235 | | 2,634 | |
Washoe County, NV, School District, School Improvement, General Obligation Bonds, | | | | | |
4.75%, 6/1/26 | | 1,405 | | 1,283 | |
5.00%, 6/1/28 | | 2,250 | | 2,129 | |
Wayne State University, MI, Revenue Bonds (FSA), | | | | | |
5.00%, 11/15/30 | | 6,130 | | 5,733 | |
West Basin, CA, Municipal Water District, COP (AGC), | | | | | |
5.00%, 8/1/24 - 8/1/25 | | 3,340 | | 3,203 | |
West Contra Costa, CA, Unified School District, General Obligation Bonds (FGIC), | | | | | |
Zero Coupon, 8/1/25 - 8/1/27 | | 23,200 | | 7,554 | |
West Ottawa Public School District, MI, General Obligation Bonds (Q-SBLF), | | | | | |
5.00%, 5/1/21 | | 850 | | 906 | |
West Virginia School Building Authority (FGIC), | | | | | |
5.00%, 7/1/12 | | 4,300 | | 4,494 | |
West Virginia University, Revenue Bonds (AMBAC), | | | | | |
Zero Coupon, 4/1/22 - 4/1/24 | | 2,000 | | 864 | |
Westfield High School Building Corp., IN, Revenue Bonds (FSA), | | | | | |
5.00%, 1/10/13 | | 1,285 | | 1,354 | |
Will County, IL, Community High School District No. 210, Lincoln Way School Building, General Obligation Bonds (FGIC), | | | | | |
5.00%, 1/1/11 | | 1,155 | | 1,204 | |
William S. Hart Union High School District, CA, General Obligation Bonds (FSA), | | | | | |
Zero Coupon, 9/1/21 - 9/1/28 | | 18,290 | | 8,189 | |
Winnebago County, IL, School District, General Obligation Bonds (FSA), | | | | | |
Zero Coupon, 1/1/14 | | 3,600 | | 2,898 | |
Wisconsin State Health & Educational Facilities Authority, Revenue Bonds (AMBAC), | | | | | |
5.63%, 2/15/12 | | 1,000 | | 1,060 | |
Yosemite, CA, Community College District, General Obligation Bonds (FSA), | | | | | |
Zero Coupon, 8/1/22 - 8/1/25 | | 11,455 | | 4,772 | |
Ypsilanti, MI, School District, General Obligation Bonds (FGIC; Q-SBLF), | | | | | |
4.70%, 5/1/12 | | 1,115 | | 1,124 | |
| | | | 1,067,093 | |
Total Fixed Income Securities (Cost $1,158,200) | | | | 1,079,641 | |
| | Shares | | | |
Preferred Stocks (2.6%) | | | | | |
Finance (2.6%) | | | | | |
ABN AMRO North America Capital Funding Trust I, 6.97%(e)(h) | | 5,875 | | 3,872 | |
Citigroup. Inc., 8.13% | | 121,000 | | 1,997 | |
Federal Home Loan Mortgage Corp., 4.68%(h) | | 19,000 | | 55 | |
Federal Home Loan Mortgage Corp., 5.16%(h) | | 89,800 | | 135 | |
Goldman Sachs Group, Inc. (The), 4.00%(h) | | 121,000 | | 1,512 | |
H.J. Heinz Finance Co., 8.00%(a)(e) | | 30 | | 2,910 | |
International Lease Finance Corp., 4.70% | | 31 | | 2,945 | |
JPMorgan Chase & Co., 7.90% | | 2,675,000 | | 2,258 | |
Lehman Brothers Holdings, Inc. 7.95%(b) | | 103,500 | | 6 | |
Merrill Lynch & Co., Inc., 8.63% | | 116,000 | | 2,203 | |
Pitney Bowes International Holdings, Inc., 4.87% | | 34 | | 3,298 | |
| | | | | | | |
The accompanying notes are an integral part of the financial statements. | 121 |
2008 Annual Report
September 30, 2008
Portfolio of Investments (cont’d)
Municipal Portfolio
| | | | Value | |
| | Shares | | (000) | |
Finance (cont’d) | | | | | |
US Bancorp, 3.50% | | 178,000 | | $ 2,670 | |
US Bancorp, 7.86% | | 97,400 | | 2,441 | |
Wachovia Corp., 7.98%(h) | | 2,565,000 | | 1,073 | |
Wells Fargo Capital XIII, 7.70%(h) | | 3,010,000 | | 2,627 | |
Total Preferred Stocks (Cost $45,774) | | | | 30,002 | |
Short-Term Investments (3.5%) | | | | | |
Investment Companies (3.5%) | | | | | |
Dreyfus Tax-Exempt Cash Management Fund | | 11,862,242 | | 11,862 | |
Morgan Stanley Institutional Liquidity
Tax-Exempt Portfolio —
Institutional Class(p) | | 28,620,213 | | 28,620 | |
| | | | 40,482 | |
Total Short-Term Investments (Cost $40,482) | | | | 40,482 | |
Total Investments (99.9%) (Cost $1,244,456) | | | | 1,150,125 | |
Other Assets in Excess of Liabilities (0.1%) | | | | 938 | |
Net Assets (100%) | | | | $1,151,063 | |
(a) | Non-income producing security. |
(b) | Issuer is in default. |
(d) | Security was valued at fair value — At September 30, 2008, the Portfolio held $3,469,000 of fair valued securities, representing 0.3% of net assets. |
(e) | 144A security — Certain conditions for public sale may exist. Unless otherwise noted, these securities are deemed to be liquid. |
(h) | Variable/Floating Rate Security — Interest rate changes on these instruments are based on changes in a designated rate. The rates shown are those in effect on September 30, 2008. |
(l) | Security has been deemed illiquid — At September 30, 2008. |
(p) | See Note G within the Notes to Financial Statements regarding investment in Morgan Stanley Institutional Liquidity Tax-Exempt Portfolio — Institutional Class. |
@ | Value is less than $500. |
AGC | Assured Guaranty Corp. |
AMBAC | Ambac Assurance Corp. |
BHAC | Berkshire Hathaway Assurance Corp. |
CIFG | CDC IXIS Financial Guarantee |
COP | Certificate of Participation |
GTY AGMT | Guaranty Agreement |
FGIC | Financial Guaranty Insurance Co. |
FSA | Financial Security Assurance Inc. |
Inv Fl | Inverse Floating Rate — Interest rate fluctuates with an inverse relationship to an associated interest rate. Indicated rate is the effective rate at September 30, 2008. |
IO | Interest Only |
MBIA | MBIA Insurance Corp. |
PAC | Planned Amortization Class |
PO | Principal Only |
PSFG | Permanent School Fund Guaranteed |
Q-SBLF | Qualified State Bond Loan Fund |
REMIC | Real Estate Mortgage Investment Conduit |
SAVRS | Select Auction Variable Rate Securities |
Futures Contracts:
The Portfolio had the following futures contract(s) open at period end:
| | Number
of
Contracts | | Value
(000) | | Expiration
Date | | Net
Unrealized
Appreciation
(Depreciation)
(000) | |
Long: | | | | | | |
U.S. Treasury 10 yr. Note | | 608 | | $ 69,692 | | Dec-08 | | $(1,384 | ) |
5yr. Swap | | 3,814 | | 413,819 | | Dec-08 | | (1,387 | ) |
Short: | | | | | | | | | |
U.S. Treasury 2 yr. Note | | 397 | | 84,735 | | Dec-08 | | (82 | ) |
U.S. Treasury 5 yr. Note | | 184 | | 20,651 | | Dec-08 | | 147 | |
U.S. Treasury Long Bond | | 637 | | 74,638 | | Dec-08 | | 734 | |
10 yr. Swap | | 3,080 | | 344,479 | | Dec-08 | | | 1,664 | |
| | | | | | | | | $ (308 | ) |
| | | | | | | | | | | | | |
122 | The accompanying notes are an integral part of the financial statements. |
| 2008 Annual Report |
| |
| September 30, 2008 |
Portfolio of Investments (cont’d)
Municipal Portfolio
Credit Default Swap Contracts
The Portfolio had the following credit default swap agreement(s) open at period end:
| | Buy/Sell | | Notional
Amount | | Pay/Receive | | Termination | | Unrealized
Appreciation
(Depreciation) | |
Swap Counterparty and Reference Obligation | | Protection | | (000) | | Fixed Rate | | Date | | (000) | |
JPMorgan Chase | | | | | | | | | | |
General Motors Acceptance Corp., 6.88%, 8/28/12 | | Sell | | $1,000 | | 4.15% | | 12/20/10 | | | $(529 | ) |
| | | | | | | | | | | | | |
Interest Rate Swap Contracts
The Portfolio had the following interest rate swap agreement(s) open at period end:
| | | | | | | | | | | | Unrealized | |
| | | | | | | | | | Notional | | Appreciation | |
| | Floating Rate | | Pay/Receive | | Fixed | | Termination | | Amount | | (Depreciation) | |
Swap Counterparty | | Index | | Floating Rate | | Rate | | Date | | (000) | | (000) | |
Bank of America | | 3 Month LIBOR | | Pay | | 5.37 | % | 2/12/18 | | $ 14,352 | | $ 237 | |
| | 3 Month LIBOR | | Receive | | 5.38 | | 7/24/18 | | 81,308 | | (1,253 | ) |
| | 3 Month LIBOR | | Pay | | 5.07 | | 4/14/18 | | 20,295 | | 101 | |
| | 3 Month LIBOR | | Pay | | 4.98 | | 4/15/18 | | 24,955 | | 44 | |
| | 3 Month LIBOR | | Receive | | 5.82 | | 2/12/23 | | 18,433 | | (393 | ) |
| | 3 Month LIBOR | | Receive | | 5.47 | | 4/14/23 | | 25,980 | | (292 | ) |
| | 3 Month LIBOR | | Receive | | 5.38 | | 4/15/23 | | 30,215 | | (262 | ) |
| | 3 Month LIBOR | | Pay | | 5.56 | | 7/24/23 | | 104,601 | | 1,413 | |
Deutsche Bank | | 6 Month EUR LIBOR | | Receive | | 4.93 | | 7/1/18 | | 64,610 | | (784 | ) |
| | 6 Month EUR LIBOR | | Receive | | 4.86 | | 7/9/18 | | 35,210 | | (299 | ) |
| | 6 Month EUR LIBOR | | Receive | | 4.86 | | 7/10/18 | | 31,960 | | (270 | ) |
| | 6 Month EUR LIBOR | | Pay | | 4.96 | | 7/24/18 | | 65,890 | | 873 | |
| | 6 Month EUR LIBOR | | Pay | | 5.27 | | 7/12/23 | | 80,945 | | 1,202 | |
| | 6 Month EUR LIBOR | | Pay | | 5.24 | | 7/9/23 | | 44,160 | | 604 | |
| | 6 Month EUR LIBOR | | Pay | | 5.24 | | 7/10/23 | | 40,135 | | 551 | |
| | 6 Month EUR LIBOR | | Receive | | 5.19 | | 7/24/23 | | 82,620 | | (962 | ) |
Goldman Sachs | | 3 Month LIBOR | | Pay | | 5.63 | | 2/28/18 | | 69,280 | | 1,799 | |
| | 3 Month LIBOR | | Receive | | 6.04 | | 2/28/23 | | 88,885 | | (2,450 | ) |
JPMorgan Chase | | 3 Month LIBOR | | Receive | | 5.62 | | 5/11/27 | | 84,000 | | (3,825 | ) |
Merrill Lynch | | 3 Month LIBOR | | Pay | | 5.00 | | 4/15/18 | | 33,295 | | 81 | |
| | 3 Month LIBOR | | Receive | | 5.40 | | 4/16/23 | | 42,445 | | | (387 | ) |
| | | | | | | | | | | | | $(4,272 | ) |
| | | | | | | | | | | | | | | | |
EUR | — Euro |
LIBOR | — London Inter Bank Offer Rate |
The accompanying notes are an integral part of the financial statements. | 123 |
2008 Annual Report
September 30, 2008
Statements of Assets and Liabilities
| | | | Mid Cap | | U.S. Mid Cap | | U.S. Small Cap |
| | Balanced | | Growth | | Value | | Value |
| | Portfolio | | Portfolio | | Portfolio | | Portfolio |
| | (000) | | (000) | | (000) | | (000) |
Assets: | | | | | | | | |
Investments in Securities of Unaffiliated Issuers, at Cost: | | $ 52,506 | | $ 3,201,516 | | $ 144,525 | | $ 702,150 | |
Investment in Securities of Affiliated Issuers, at Cost: | | 33,767 | | 79,591 | | 6,068 | | 38,246 | |
Total Investments in Securities, at Cost: | | 86,273 | | 3,281,107 | | 150,593 | | 740,396 | |
Foreign Currency, at Cost: | | 105 | | — | @ | — | | — | |
Investments in Securities of Unaffiliated Issuers, at Value: | | 42,567 | | 2,748,499 | | 126,233 | | 689,170 | |
Investment in Securities of Affiliated Issuers, at Value: | | 33,198 | | 79,591 | | 6,068 | | 38,246 | |
Total Investments in Securities, at Value: | | 75,765 | | 2,828,090 | | 132,301 | | 727,416 | |
Foreign Currency, at Value: | | 100 | | — | @ | — | | — | |
Cash | | — | | — | | 25 | | — | |
Due from Broker | | 1,296 | | — | | — | | — | |
Receivable for Portfolio Shares Sold | | 2 | | 16,109 | | 13 | | 209 | |
Receivable for Investments Sold | | 907 | | 17,452 | | 7,825 | | 3,873 | |
Unrealized Appreciation on Foreign Currency Exchange Contracts | | 83 | | — | | — | | — | |
Receivable from Affiliates | | 15 | | 14 | | 2 | | 11 | |
Dividends Receivable | | 112 | | 556 | | 147 | | 541 | |
Interest Receivable | | 38 | | — | | — | | — | |
Other Assets | | 2 | | 183 | | 2 | | 12 | |
Total Assets | | 78,320 | | 2,862,404 | | 140,315 | | 732,062 | |
Liabilities: | | | | | | | | | |
Unrealized Depreciation on Foreign Currency Exchange Contracts | | 72 | | — | | — | | — | |
Payable for Investments Purchased | | 472 | | 6,860 | | 1,617 | | 6,220 | |
Bank Overdraft | | 168 | | — | | — | | — | |
Payable for Portfolio Shares Redeemed | | 61 | | 3,869 | | 3,080 | | 2,399 | |
Payable for Investment Advisory Fees | | 109 | | 4,124 | | 267 | | 1,303 | |
Payable for Administration Fees | | 5 | | 203 | | 10 | | 51 | |
Payable for Custodian Fees | | 17 | | 72 | | 6 | | 11 | |
Payable for Shareholder Servicing Fees — Investment Class | | 1 | | — | | — | @ | — | |
Payable for Shareholder Servicing Fees — Class P | | 7 | | 276 | | 6 | | 16 | |
Payable for Sub Transfer Agency Fees — Class I | | — | | 145 | | 16 | | 4 | |
Payable for Sub Transfer Agency Fees — Class P | | — | | 112 | | 3 | | — | @ |
Payable for Trustees’ Fees and Expenses | | 7 | | 22 | | 19 | | 15 | |
Other Liabilities | | 63 | | 270 | | 33 | | 118 | |
Total Liabilities | | 982 | | 15,953 | | 5,057 | | 10,137 | |
Net Assets | | $ 77,338 | | $ 2,846,451 | | $ 135,258 | | $ 721,925 | |
Net Assets Consist Of: | | | | | | | | | |
Paid-in Capital | | $ 90,995 | | $ 3,777,639 | | $ 295,865 | | $ 719,248 | |
Undistributed (Distributions in Excess of) Net Investment Income | | 2,451 | | (545 | ) | 1,002 | | 1,470 | |
Accumulated Net Realized Gain (Loss) | | (5,212 | ) | (477,626 | ) | (143,317 | ) | 14,187 | |
Unrealized Appreciation (Depreciation) on: | | | | | | | | | |
Investments | | (10,508 | ) | (453,017 | ) | (18,292 | ) | (12,980 | ) |
Foreign Currency Exchange Contracts and Translations | | 8 | | — | @ | — | | — | |
Futures Contracts | | (396 | ) | — | | — | | — | |
Net Assets | | $ 77,338 | | $ 2,846,451 | | $ 135,258 | | $ 721,925 | |
| | | | | | | | | | |
124 | The accompanying notes are an integral part of the financial statements. |
| 2008 Annual Report |
| |
| September 30, 2008 |
Statements of Assets and Liabilities (cont’d)
| | | | Mid Cap | | U.S. Mid Cap | | U.S. Small Cap | |
| | Balanced | | Growth | | Value | | Value | |
| | Portfolio | | Portfolio | | Portfolio | | Portfolio | |
| | (000) | | (000) | | (000) | | (000) | |
CLASS I: | | | | | | | |
Net Assets | | $ | 40,799 | | $ | 1,609,506 | | $ | 107,988 | | $ | 651,226 | |
Shares Outstanding (unlimited number of shares authorized, no par value) (not in 000) | | 3,438,583 | | 67,088,738 | | 3,730,615 | | 30,733,597 | |
Net Asset Value, Offering and Redemption Price Per Share | | $ | 11.87 | | $ | 23.99 | | $ | 28.95 | | $ | 21.19 | |
INVESTMENT CLASS: | | | | | | | | | |
Net Assets | | $ | 4,141 | | $ | — | | $ | 4,080 | | $ | — | |
Shares Outstanding (unlimited number of shares authorized, no par value) (not in 000) | | 349,538 | | — | | 141,829 | | — | |
Net Asset Value, Offering and Redemption Price Per Share | | $ | 11.85 | | $ | — | | $ | 28.77 | | $ | — | |
CLASS P: | | | | | | | | | |
Net Assets | | $ | 32,398 | | $ | 1,236,945 | | $ | 23,190 | | $ | 70,699 | |
Shares Outstanding (unlimited number of shares authorized, no par value) (not in 000) | | 2,736,225 | | 53,017,997 | | 809,433 | | 3,358,398 | |
Net Asset Value, Offering and Redemption Price Per Share | | $ | 11.84 | | $ | 23.33 | | $ | 28.65 | | $ | 21.05 | |
| | | | | | | | | | | | | | | |
@ Amount is less than $500.
The accompanying notes are an integral part of the financial statements. | 125 |
2008 Annual Report
September 30, 2008
Statements of Assets and Liabilities
| | | | Core Fixed | | Core Plus Fixed | | | |
| | Value | | Income | | Income | | High Yield | |
| | Portfolio | | Portfolio | | Portfolio | | Portfolio | |
| | (000) | | (000) | | (000) | | (000) | |
Assets: | | | | | | | | |
Investments in Securities of Unaffiliated Issuers, at Cost: | | $ | 192,713 | | $ | 251,388 | | $ | 1,999,860 | | $ | 157,234 | |
Investment in Securities of Affiliated Issuers, at Cost: | | 9,810 | | 16,165 | | 80,153 | | 16,636 | |
Total Investments in Securities, at Cost: | | 202,523 | | 267,553 | | 2,080,013 | | 173,870 | |
Foreign Currency, at Cost: | | — | | — | | — | | 21 | |
Investments in Securities of Unaffiliated Issuers, at
Value:(1) | | 180,910 | | 231,522 | | 1,720,261 | | 105,648 | |
Investment in Securities of Affiliated Issuers, at Value: | | 9,810 | | 16,165 | | 80,153 | | 16,636 | |
Total Investments in Securities, at Value: | | 190,720 | | 247,687 | | 1,800,414 | | 122,284 | |
Foreign Currency, at Value: | | — | | — | | — | | 20 | |
Receivable for Portfolio Shares Sold | | 67 | | 25 | | 52 | | 21 | |
Unrealized Appreciation on Swap Agreements | | — | | 9,488 | | 78,449 | | 99 | |
Receivable for Delayed Delivery Commitments† | | — | | 15,473 | | 204,157 | | — | |
Receivable for Investments Sold | | 2,176 | | 4,475 | | 948,039 | | — | @ |
Unrealized Appreciation on Foreign Currency Exchange Contracts | | — | | — | | — | | 297 | |
Receivable from Affiliates | | 1 | | 5 | | 25 | | — | @ |
Dividends Receivable | | 354 | | 35 | | 258 | | 6 | |
Interest Receivable | | — | | 1,470 | | 13,880 | | 2,718 | |
Other Assets | | 112 | | 6 | | 41 | | 2 | |
Total Assets | | 193,430 | | 278,664 | | 3,045,315 | | 125,447 | |
Liabilities: | | | | | | | | | |
Collateral on Securities Loaned, at Value: | | 8,809 | | 10,138 | | 77,230 | | 15,685 | |
Due to Broker | | — | | 5,579 | | 41,269 | | 655 | |
Payable for Delayed Delivery Commitments | | — | | 67,461 | | 530,923 | | 20 | |
Payable for Investments Purchased | | 479 | | 4,297 | | 900,488 | | — | |
Bank Overdraft | | — | | 90 | | 1,360 | | 218 | |
Unrealized Depreciation on Swap Agreements | | — | | 3,403 | | 41,172 | | 557 | |
Payable for Portfolio Shares Redeemed | | 20 | | 630 | | 17,831 | | 253 | |
Payable for Investment Advisory Fees | | 254 | | 150 | | 1,578 | | 129 | |
Payable for Administration Fees | | 13 | | 13 | | 110 | | 8 | |
Payable for Custodian Fees | | 6 | | 7 | | 41 | | 6 | |
Payable for Shareholder Servicing Fees — Investment Class | | — | | — | | 16 | | — | |
Payable for Shareholder Servicing Fees — Class P | | 22 | | — | @ | 21 | | 1 | |
Payable for Sub Transfer Agency Fees — Class I | | 8 | | — | | — | | — | |
Payable for Sub Transfer Agency Fees — Class P | | 8 | | — | | — | | — | |
Payable for Trustees’ Fees and Expenses | | 22 | | 4 | | 75 | | 18 | |
Payable for Lehman Brothers Closed Swap Transactions | | — | | 39 | | 1,281 | | 999 | |
Other Liabilities | | 59 | | 61 | | 201 | | 67 | |
Total Liabilities | | 9,700 | | 91,872 | | 1,613,596 | | 18,616 | |
Net Assets | | $ | 183,730 | | $ | 186,792 | | $ | 1,431,719 | | $ | 106,831 | |
Net Assets Consist Of: | | | | | | | | | |
Paid-in Capital | | $ | 211,249 | | $ | 228,574 | | $ | 1,941,505 | | $ | 672,129 | |
Undistributed Net Investment Income | | 1,755 | | 4,775 | | 41,455 | | 2,804 | |
Accumulated Net Realized Loss | | (17,471 | ) | (33,005 | ) | (308,532 | ) | (516,349 | ) |
Unrealized Appreciation (Depreciation) on: | | | | | | | | | |
Investments | | (11,803 | ) | (19,866 | ) | (279,599 | ) | (51,586 | ) |
Foreign Currency Exchange Contracts and Translations | | — | | — | | (270 | ) | 291 | |
Futures Contracts | | — | | 229 | | (117 | ) | — | |
Swap Agreements | | — | | 6,085 | | 37,277 | | (458 | ) |
Net Assets | | $ | 183,730 | | $ | 186,792 | | $ | 1,431,719 | | $ | 106,831 | |
| | | | | | | | | | | | | | |
126 | The accompanying notes are an integral part of the financial statements. |
| 2008 Annual Report |
| |
| September 30, 2008 |
Statements of Assets and Liabilities (cont’d)
| | | | Core Fixed | | Core Plus Fixed | | | |
| | Value | | Income | | Income | | High Yield | |
| | Portfolio | | Portfolio | | Portfolio | | Portfolio | |
| | (000) | | (000) | | (000) | | (000) | |
CLASS I: | | | | | | | | |
Net Assets | | $ | 80,633 | | $ | 186,305 | | $ | 1,210,286 | | $ | 104,032 | |
Shares Outstanding (unlimited number of shares authorized, no par value) (not in 000) | | 6,144,412 | | 20,304,232 | | 128,614,571 | | 12,323,668 | |
Net Asset Value, Offering and Redemption Price Per Share | | $ | 13.12 | | $ | 9.18 | | $ | 9.41 | | $ | 8.44 | |
INVESTMENT CLASS: | | | | | | | | | |
Net Assets | | $ | — | | $ | — | | $ | 123,610 | | $ | — | |
Shares Outstanding (unlimited number of shares authorized, no par value) (not in 000) | | — | | — | | 13,142,117 | | — | |
Net Asset Value, Offering and Redemption Price Per Share | | $ | — | | $ | — | | $ | 9.41 | | $ | — | |
CLASS P: | | | | | | | | | |
Net Assets | | $ | 103,097 | | $ | 487 | | $ | 97,823 | | $ | 2,799 | |
Shares Outstanding (unlimited number of shares authorized, no par value) (not in 000) | | 7,866,490 | | 53,454 | | 10,411,799 | | 330,022 | |
Net Asset Value, Offering and Redemption Price Per Share | | $ | 13.11 | | $ | 9.12 | | $ | 9.40 | | $ | 8.48 | |
(1) Including: | | | | | | | | | |
Securities on Loan, at Value: | | $ | 7,754 | | $ | 10,265 | | $ | 119,803 | | $ | 15,129 | |
| | | | | | | | | | | | | | |
@ | Amount is less than $500. |
† | Receivable for Delayed Delivery Commitments balance for Core Fixed Income and Core Plus Fixed Income Portfolios include approximately $14,000 and $117,000 of exposure to Lehman Brothers as of September 30, 2008, respectively. Due to the uncertain nature surrounding the collectability of these receivables, these balances have been written down from their original amounts. |
The accompanying notes are an integral part of the financial statements. | 127 |
2008 Annual Report | |
| |
September 30, 2008 | |
Statements of Assets and Liabilities
| | | | | | Investment | | | |
| | Intermediate | | International | | Grade Fixed | | Limited | |
| | Duration | | Fixed Income | | Income | | Duration | |
| | Portfolio | | Portfolio | | Portfolio | | Portfolio | |
| | (000) | | (000) | | (000) | | (000) | |
Assets: | | | | | | | | | |
Investments in Securities of Unaffiliated Issuers, at Cost: | | $ | 140,453 | | $ | 175,936 | | $ | 425,383 | | $ | 666,926 | |
Investment in Securities of Affiliated Issuers, at Cost: | | 6,028 | | 7,498 | | 31,627 | | 15,462 | |
Total Investments in Securities, at Cost: | | 146,481 | | 183,434 | | 457,010 | | 682,388 | |
Foreign Currency, at Cost: | | — | | 231 | | — | | — | @ |
Investments in Securities of Unaffiliated Issuers, at Value:(1) | | 129,994 | | 177,412 | | 398,051 | | 552,040 | |
Investment in Securities of Affiliated Issuers, at Value: | | 6,028 | | 7,498 | | 31,627 | | 15,462 | |
Total Investments in Securities, at Value: | | 136,022 | | 184,910 | | 429,678 | | 567,502 | |
Foreign Currency, at Value: | | — | | 232 | | — | | — | @ |
Cash | | 1 | | — | | — | | — | |
Due from Broker | | — | | 1,931 | | — | | — | |
Receivable for Portfolio Shares Sold | | — | | 31 | | 4 | | 257 | |
Unrealized Appreciation on Swap Agreements | | 4,341 | | — | | 15,101 | | 11,669 | |
Receivable for Delayed Delivery Commitments† | | — | | — | | 25,644 | | — | |
Receivable for Investments Sold | | 2,111 | | 753 | | 8,241 | | 10,161 | |
Unrealized Appreciation on Foreign Currency Exchange Contracts | | — | | 2,352 | | — | | — | |
Receivable from Affiliates | | 4 | | 1 | | 9 | | 12 | |
Dividends Receivable | | 30 | | 11 | | 57 | | 110 | |
Interest Receivable | | 1,033 | | 2,352 | | 2,627 | | 3,830 | |
Other Assets | | 1 | | 3 | | 8 | | 23 | |
Total Assets | | 143,543 | | 192,576 | | 481,369 | | 593,564 | |
Liabilities: | | | | | | | | | |
Collateral on Securities Loaned, at Value: | | — | | — | | 22,637 | | — | |
Unrealized Depreciation on Foreign Currency Exchange Contracts | | — | | 2,876 | | — | | — | |
Due to Broker | | 3,603 | | — | | 8,621 | | 6,633 | |
Payable for Delayed Delivery Commitments | | — | | — | | 117,313 | | — | |
Payable for Investments Purchased | | 3,105 | | 2,022 | | 7,363 | | 12,857 | |
Bank Overdraft | | — | | 41 | | 157 | | 276 | |
Unrealized Depreciation on Swap Agreements | | 964 | | — | | 5,379 | | 2,649 | |
Payable for Portfolio Shares Redeemed | | — | | 536 | | 1,493 | | 2,021 | |
Payable for Investment Advisory Fees | | 131 | | 190 | | 341 | | 496 | |
Payable for Administration Fees | | 9 | | 13 | | 22 | | 39 | |
Payable for Custodian Fees | | 4 | | 16 | | 9 | | 9 | |
Payable for Shareholder Servicing Fees — Investment Class | | 17 | | — | | — | | — | |
Payable for Shareholder Servicing Fees — Class P | | — | | — | @ | — | @ | — | @ |
Payable for Shareholder Servicing Fees — Class H | | — | | — | @ | — | @ | — | |
Payable for Distribution and Shareholder Servicing Fees — Class L | | — | | — | @ | — | @ | — | |
Payable for Sub Transfer Agency Fees — Class I | | — | @ | — | | 4 | | — | @ |
Payable for Sub Transfer Agency Fees — Class P | | — | | — | | — | @ | — | |
Payable for Transfer Agency Fees — Class H | | — | | 1 | | — | | — | |
Payable for Transfer Agency Fees — Class L | | — | | — | @ | — | | — | |
Payable for Trustees’ Fees and Expenses | | 1 | | 1 | | 12 | | 3 | |
Payable for Lehman Brothers Closed Swap Transactions | | 51 | | — | | 63 | | — | |
Other Liabilities | | 36 | | 63 | | 76 | | 131 | |
Total Liabilities | | 7,921 | | 5,759 | | 163,490 | | 25,114 | |
Net Assets | | $ | 135,622 | | $ | 186,817 | | $ | 317,879 | | $ | 568,450 | |
Net Assets Consist Of: | | | | | | | | | |
Paid-in Capital | | $ | 161,372 | | $ | 179,575 | | $ | 381,109 | | $ | 799,740 | |
Undistributed Net Investment Income | | 462 | | 6,453 | | 7,838 | | 8,912 | |
Accumulated Net Realized Loss | | (19,541 | ) | (143 | ) | (53,383 | ) | (133,180 | ) |
Unrealized Appreciation (Depreciation) on: | | | | | | | | | |
Investments | | (10,459 | ) | 1,476 | | (27,332 | ) | (114,886 | ) |
Foreign Currency Exchange Contracts and Translations | | — | | (614 | ) | — | | — | |
Futures Contracts | | 411 | | 70 | | (75 | ) | (1,156 | ) |
Swap Agreements | | 3,377 | | — | | 9,722 | | 9,020 | |
Net Assets | | $ | 135,622 | | $ | 186,817 | | $ | 317,879 | | $ | 568,450 | |
128 | The accompanying notes are an integral part of the financial statements. |
| 2008 Annual Report |
| |
| September 30, 2008 |
Statements of Assets and Liabilities (cont’d)
| | | | | | Investment | | | |
| | Intermediate | | International | | Grade Fixed | | Limited | |
| | Duration | | Fixed Income | | Income | | Duration | |
| | Portfolio | | Portfolio | | Portfolio | | Portfolio | |
| | (000) | | (000) | | (000) | | (000) | |
CLASS I: | | | | | | | | | |
Net Assets | | $ | 3,476 | | $ | 185,413 | | $ | 316,894 | | $ | 568,156 | |
Shares Outstanding (unlimited number of shares authorized, no par value) (not in 000) | | 389,089 | | 17,589,425 | | 32,961,696 | | 71,019,648 | |
Net Asset Value, Offering and Redemption Price Per Share | | $ | 8.93 | | $ | 10.54 | | $ | 9.61 | | $ | 8.00 | |
INVESTMENT CLASS: | | | | | | | | | |
Net Assets | | $ | 132,146 | | $ | — | | $ | — | | $ | — | |
Shares Outstanding (unlimited number of shares authorized, no par value) (not in 000) | | 14,851,166 | | — | | — | | — | |
Net Asset Value, Offering and Redemption Price Per Share | | $ | 8.90 | | $ | — | | $ | — | | $ | — | |
CLASS P: | | | | | | | | | |
Net Assets | | $ | — | | $ | 1,174 | | $ | 842 | | $ | 294 | |
Shares Outstanding (unlimited number of shares authorized, no par value) (not in 000) | | — | | 110,325 | | 87,636 | | 36,771 | |
Net Asset Value, Offering and Redemption Price Per Share | | $ | — | | $ | 10.64 | | $ | 9.60 | | $ | 8.00 | |
CLASS H: | | | | | | | | | |
Net Assets | | $ | — | | $ | 120 | | $ | 85 | | $ | — | |
Shares Outstanding (unlimited number of shares authorized, no par value) (not in 000) | | — | | 11,372 | | 8,969 | | — | |
Net Asset Value and Redemption Price Per Share | | $ | — | | $ | 10.55 | | $ | 9.53 | | $ | — | |
Maximum Sales Load | | — | | 3.50 | % | 3.50 | % | — | |
Maximum Sales Charge | | $ | — | | $ | 0.38 | | $ | 0.35 | | $ | — | |
Maximum Offering Price Per Share | | $ | — | | $ | 10.93 | | $ | 9.88 | | $ | — | |
CLASS L: | | | | | | | | | |
Net Assets | | $ | — | | $ | 110 | | $ | 58 | | $ | — | |
Shares Outstanding (unlimited number of shares authorized, no par value) (not in 000) | | — | | 10,373 | | 6,034 | | — | |
Net Asset Value, Offering and Redemption Price Per Share | | $ | — | | $ | 10.62 | | $ | 9.63 | | $ | — | |
(1) Including: | | | | | | | | | |
Securities on Loan, at Value: | | $ | — | | $ | — | | $ | 23,030 | | $ | — | |
@ | | Amount is less than $500. |
† | | Receivable for Delayed Delivery Commitments balance for Investment Grade Fixed Income Portfolio include approximately $22,000 of exposure to Lehman Brothers as of September 30, 2008. Due to the uncertain nature surrounding the collectability of this receivable, this balance has been written down from its original amount. |
The accompanying notes are an integral part of the financial statements. | 129 |
2008 Annual Report | |
| |
September 30, 2008 | |
Statements of Assets and Liabilities
| | Long Duration | | |
| | Fixed Income | Municipal | |
| | Portfolio | Portfolio | |
| | (000) | (000) | |
Assets: | | | | | |
Investments in Securities of Unaffiliated Issuers, at Cost: | | $ 27,937 | | $ 1,215,836 | |
Investment in Securities of Affiliated Issuers, at Cost: | | 1,175 | | 28,620 | |
Total Investments in Securities, at Cost: | | 29,112 | | 1,244,456 | |
Foreign Currency, at Cost: | | — | @ | — | |
Investments in Securities of Unaffiliated Issuers, at Value:(1) | | 26,594 | | 1,121,505 | |
Investment in Securities of Affiliated Issuers, at Value: | | 1,175 | | 28,620 | |
Total Investments in Securities, at Value: | | 27,769 | | 1,150,125 | |
Foreign Currency, at Value: | | — | @ | — | |
Cash | | — | @ | — | |
Receivable for Portfolio Shares Sold | | — | | 249 | |
Unrealized Appreciation on Swap Agreements | | 1,247 | | 6,905 | |
Due from Broker | | — | | 2,675 | |
Receivable for Investments Sold | | 14,622 | | 24,443 | |
Receivable from Affiliates | | 1 | | 21 | |
Dividends Receivable | | 6 | | 492 | |
Interest Receivable | | 324 | | 13,850 | |
Other Assets | | — | @ | 18 | |
Total Assets | | 43,969 | | 1,198,778 | |
Liabilities: | | | | | |
Due to Broker | | 796 | | — | |
Payable for Investments Purchased | | 14,945 | | 29,434 | |
Bank Overdraft | | — | | 630 | |
Unrealized Depreciation on Swap Agreements | | 254 | | 11,706 | |
Payable for Portfolio Shares Redeemed | | — | | 3,357 | |
Payable for Investment Advisory Fees | | 6 | | 1,138 | |
Payable for Administration Fees | | 2 | | 80 | |
Payable for Custodian Fees | | 3 | | 16 | |
Payable for Shareholder Servicing Fees — Class P | | — | @ | 11 | |
Payable for Shareholder Servicing Fees — Class H | | — | | 2 | |
Payable for Distribution and Shareholder Servicing Fees — Class L | | — | | 7 | |
Payable for Sub Transfer Agency Fees — Class I | | — | | 9 | |
Payable for Sub Transfer Agency Fees — Class P | | — | | — | @ |
Payable for Transfer Agency Fees — Class H | | — | | 1 | |
Payable for Transfer Agency Fees — Class L | | — | | — | @ |
Payable for Trustees’ Fees and Expenses | | — | | — | |
Payable for Lehman Brothers Closed Swap Transactions | | — | | 1,226 | |
Other Liabilities | | 29 | | 98 | |
Total Liabilities | | 16,035 | | 47,715 | |
Net Assets | | $ 27,934 | | $ 1,151,063 | |
Net Assets Consist Of: | | | | | |
Paid-in Capital | | $ 28,111 | | $ 1,243,154 | |
Undistributed Net Investment Income | | 560 | | 9,112 | |
Accumulated Net Realized Loss | | (399 | ) | (1,763 | ) |
Unrealized Appreciation (Depreciation) on: | | | | | |
Investments | | (1,343 | ) | (94,331 | ) |
Futures Contracts | | 12 | | (308 | ) |
Swap Agreements | | 993 | | (4,801 | ) |
Net Assets | | $ 27,934 | | $ 1,151,063 | |
130 | The accompanying notes are an integral part of the financial statements. |
| 2008 Annual Report |
| |
| September 30, 2008 |
Statements of Assets and Liabilities (cont’d)
| | Long Duration | | |
| | Fixed Income | Municipal | |
| | Portfolio | Portfolio | |
| | (000) | (000) | |
CLASS I: | | | | | |
Net Assets | | $ | 27,438 | | | $ | 1,073,173 | |
Shares Outstanding (unlimited number of shares authorized, no par value) (not in 000) | | 2,762,808 | | | 92,687,504 | |
Net Asset Value, Offering and Redemption Price Per Share | | $ | 9.93 | | | $ | 11.58 | |
CLASS P: | | | | | | |
Net Assets | | $ | 496 | | | $ | 51,780 | |
Shares Outstanding (unlimited number of shares authorized, no par value) (not in 000) | | 50,000 | | | 4,471,592 | |
Net Asset Value, Offering and Redemption Price Per Share | | $ | 9.92 | | | $ | 11.58 | |
CLASS H: | | | | | | |
Net Assets | | $ | — | | | $ | 8,593 | |
Shares Outstanding (unlimited number of shares authorized, no par value) (not in 000) | | — | | | 742,032 | |
Net Asset Value and Redemption Price Per Share | | $ | — | | | $ | 11.58 | |
Maximum Sales Load | | — | | | 3.50 | % |
Maximum Sales Charge | | $ | — | | | $ | 0.42 | |
Maximum Offering Price Per Share | | $ | — | | | $ | 12.00 | |
CLASS L: | | | | | | |
Net Assets | | $ | — | | | $ | 17,517 | |
Shares Outstanding (unlimited number of shares authorized, no par value) (not in 000) | | — | | | 1,516,956 | |
Net Asset Value, Offering and Redemption Price Per Share | | $ | — | | | $ | 11.55 | |
@ Amount is less than $500.
The accompanying notes are an integral part of the financial statements. | 131 |
2008 Annual Report | |
| |
September 30, 2008 | |
Statements of Operations
For the Year Ended September 30, 2008
| | | | Mid Cap | | U.S. Mid | | U.S. Small | | | |
| | Balanced | | Growth | | Cap Value | | Cap Value | | Value | |
| | Portfolio | | Portfolio | | Portfolio | | Portfolio | | Portfolio | |
| | (000 | ) | (000) | | (000) | | (000) | | (000) | |
Investment Income: | | | | | | | | | | | |
Dividends from Securities of Unaffiliated Issuers | | $ | 2,502 | | $ | 24,445 | | $ | 2,601 | | $ | 6,926 | | $ | 8,840 | |
Dividends from Securities of Affiliated Issuers | | 2,922 | | 3,150 | | 203 | | 1,747 | | 254 | |
Interest from Securities of Unaffiliated Issuers | | 3,947 | | 53 | | 1 | | 6 | | 54 | |
Less: Foreign Taxes Withheld | | (26 | ) | (527 | ) | — | | — | | — | |
Total Investment Income | | 9,345 | | 27,121 | | 2,805 | | 8,679 | | 9,148 | |
Expenses: | | | | | | | | | | | |
Investment Advisory Fees (Note B) | | 1,300 | | 16,955 | | 1,162 | | 5,332 | | 1,662 | |
Administration Fees (Note C) | | 231 | | 2,712 | | 129 | | 647 | | 266 | |
Custodian Fees (Note F) | | 54 | | 236 | | 15 | | 32 | | 15 | |
Professional Fees | | 51 | | 103 | | 32 | | 43 | | 44 | |
Shareholder Reporting Fees | | 113 | | 790 | | 24 | | 322 | | 88 | |
Shareholder Servicing Fees — Investment Class (Note D) | | 7 | | — | | 5 | | — | | 48 | |
Shareholder Servicing Fees — Class P (Note D) | | 86 | | 3,782 | | 62 | | 160 | | 356 | |
Sub Transfer Agency Fees — Class I | | 23 | | 145 | | 20 | | 4 | | 9 | |
Sub Transfer Agency Fees — Class P | | 5 | | 216 | | 3 | | 5 | | 23 | |
Transfer Agency Fees (Note E) | | 14 | | 60 | | 17 | | 17 | | 18 | |
Trustees’ Fees and Expenses | | 5 | | 51 | | 1 | | 12 | | 4 | |
Registration Fees | | 37 | | 153 | | 40 | | 56 | | 47 | |
Other Expenses | | 24 | | 69 | | 10 | | 24 | | 16 | |
Total Expenses | | 1,950 | | 25,272 | | 1,520 | | 6,654 | | 2,596 | |
Rebate from Morgan Stanley Affiliated Cash Sweep (Note G) | | (142 | ) | (89 | ) | (6 | ) | (52 | ) | (8 | ) |
Voluntary Waiver of Sub Transfer Agent Fees — Class I | | (23 | ) | — | | (4 | ) | — | | — | |
Voluntary Waiver of Sub Transfer Agent Fees — Class P | | (5 | ) | (104 | ) | — | | (5 | ) | (15 | ) |
Expense Offset (Note F) | | (2 | ) | (16 | ) | — | @ | (1 | ) | (1 | ) |
Net Expenses | | 1,778 | | 25,063 | | 1,510 | | 6,596 | | 2,572 | |
Net Investment Income | | 7,567 | | 2,058 | | 1,295 | | 2,083 | | 6,576 | |
Realized Gain (Loss): | | | | | | | | | | | |
Investments Sold from Unaffiliated Issuers | | 29,970 | | (8,859 | ) | (4,132 | ) | 28,949 | | (14,133 | ) |
Investments Sold from Affiliated Issuers | | (3,414 | ) | — | | — | | — | | — | |
Capital Gain Distribution from Underlying Fund | | 2,050 | | — | | — | | — | | — | |
Foreign Currency Transactions | | 825 | | (497 | ) | — | | — | | — | |
Options Written | | (5 | ) | — | | — | | — | | — | |
Futures Contracts | | (10,790 | ) | — | | — | | — | | — | |
Swap Agreements | | 1,391 | | — | | — | | — | | — | |
Net Realized Gain (Loss) | | 20,027 | | (9,356 | ) | (4,132 | ) | 28,949 | | (14,133 | ) |
Change in Unrealized Appreciation (Depreciation): | | | | | | | | | | | |
Investments | | (64,701 | ) | (1,110,194 | ) | (33,749 | ) | (155,284 | ) | (79,819 | ) |
Foreign Currency Exchange Contracts and Translations | | (60 | ) | (2 | ) | — | | — | | — | |
Futures Contracts | | (907 | ) | — | | — | | — | | — | |
Swap Agreements | | (492 | ) | — | | — | | — | | — | |
Net Change in Unrealized Appreciation (Depreciation) | | (66,160 | ) | (1,110,196 | ) | (33,749 | ) | (155,284 | ) | (79,819 | ) |
Total Net Realized Loss and Change in Unrealized Appreciation (Depreciation) | | (46,133 | ) | (1,119,552 | ) | (37,881 | ) | (126,335 | ) | (93,952 | ) |
Net Decrease in Net Assets Resulting from Operations | | $(38,566 | ) | $(1,117,494 | ) | $(36,586 | ) | $(124,252 | ) | $(87,376 | ) |
| | | | | | | | | | | | | | | | |
@ Amount is less than $500.
132 | The accompanying notes are an integral part of the financial statements. |
| 2008 Annual Report |
| |
| September 30, 2008 |
Statements of Operations
For the Year Ended September 30, 2008
| | | | Core Plus | | | | | | International | |
| | Core Fixed | | Fixed | | | | Intermediate | | Fixed | |
| | Income | | Income | | High Yield | | Duration | | Income | |
| | Portfolio | | Portfolio | | Portfolio | | Portfolio | | Portfolio | |
| | (000 | ) | (000) | | (000 | ) | (000 | ) | (000 | ) |
Investment Income: | | | | | | | | | | | |
Dividends from Securities of Unaffiliated Issuers | | $ 22 | | $ 485 | | $ 7 | | $ 5 | | $ — | |
Dividends from Securities of Affiliated Issuers | | 872 | | 4,744 | | 240 | | 825 | | 234 | |
Interest from Securities of Unaffiliated Issuers | | 15,193 | | 149,782 | | 14,352 | | 6,357 | | 7,468 | |
Less: Foreign Taxes Withheld | | (90 | ) | (2 | ) | (16 | ) | (25 | ) | — | |
Total Investment Income | | 15,997 | | 155,009 | | 14,583 | | 7,162 | | 7,702 | |
Expenses: | | | | | | | | | | | |
Investment Advisory Fees (Note B) | | 1,071 | | 7,826 | | 643 | | 549 | | 814 | |
Administration Fees (Note C) | | 229 | | 1,888 | | 123 | | 117 | | 173 | |
Custodian Fees (Note F) | | 22 | | 175 | | 20 | | 12 | | 41 | |
Professional Fees | | 46 | | 115 | | 48 | | 40 | | 77 | |
Shareholder Reporting Fees | | 98 | | 399 | | 161 | | 11 | | 102 | |
Shareholder Servicing Fees — Investment Class (Note D) | | — | | 215 | | — | | 214 | | — | |
Shareholder Servicing Fees — Class P (Note D) | | 29 | | 318 | | 12 | | — | @ | 3 | |
Shareholder Servicing Fees — Class H (Note D) | | — | | — | | — | | — | | — | @ |
Distribution and Shareholder Servicing Fees — Class L (Note D) | | — | | — | | — | | — | | — | @ |
Sub Transfer Agency Fees — Class I | | 1 | | 39 | | 2 | | — | @ | 8 | |
Sub Transfer Agency Fees — Class P | | 1 | | 6 | | 1 | | — | | — | |
Transfer Agency Fees (Note E) | | 9 | | 31 | | 15 | | 10 | | 12 | |
Transfer Agency Fees — Class H (Note E) | | — | | — | | — | | — | | 2 | |
Transfer Agency Fees — Class L (Note E) | | — | | — | | — | | — | | — | @ |
Trustees’ Fees and Expenses | | 6 | | 31 | | 1 | | 2 | | 3 | |
Registration Fees | | 39 | | 83 | | 32 | | 28 | | 73 | |
Other Expenses | | 25 | | 119 | | 13 | | 14 | | 19 | |
Total Expenses | | 1,576 | | 11,245 | | 1,071 | | 997 | | 1,327 | |
Voluntary Waiver of Investment Advisory Fees (Note B) | | (115 | ) | — | | — | | — | | — | |
Rebate from Morgan Stanley Affiliated Cash Sweep (Note G) | | (25 | ) | (134 | ) | (4 | ) | (23 | ) | (7 | ) |
Voluntary Waiver of Sub Transfer Agent Fees — Class I | | (1 | ) | (39 | ) | (2 | ) | — | @ | (8 | ) |
Voluntary Waiver of Sub Transfer Agent Fees — Class P | | (1 | ) | (6 | ) | (1 | ) | — | | — | |
Expense Offset (Note F) | | (3 | ) | (28 | ) | (6 | ) | (2 | ) | (1 | ) |
Net Expenses | | 1,431 | | 11,038 | | 1,058 | | 972 | | 1,311 | |
Net Investment Income | | 14,566 | | 143,971 | | 13,525 | | 6,190 | | 6,391 | |
Realized Gain (Loss): | | | | | | | | | | | |
Investments Sold | | (29,539 | ) | (224,716 | ) | (15,508 | ) | (13,322 | ) | (45 | ) |
Foreign Currency Transactions | | — | | 11 | | (1,285 | ) | — | | 11,816 | |
Options Written | | (71 | ) | (609 | ) | — | | (43 | ) | — | |
Futures Contracts | | (1,709 | ) | (5,894 | ) | (2,564 | ) | 1,996 | | (161 | ) |
Swap Agreements | | 931 | | 8,442 | | 3,852 | | 269 | | — | |
Net Realized Gain (Loss) | | (30,388 | ) | (222,766 | ) | (15,505 | ) | (11,100 | ) | 11,610 | |
Change in Unrealized Appreciation (Depreciation): | | | | | | | | | | | |
Investments | | (15,514 | ) | (228,355 | ) | (14,516 | ) | (8,784 | ) | (7,394 | ) |
Foreign Currency Exchange Contracts and Translations | | — | | 827 | | 412 | | — | | (1,772 | ) |
Futures Contracts | | (685 | ) | (10,494 | ) | (177 | ) | (11 | ) | 94 | |
Swap Agreements | | 4,034 | | 20,619 | | (1,034 | ) | 2,661 | | — | |
Net Change in Unrealized Appreciation (Depreciation) | | (12,165 | ) | (217,403 | ) | (15,315 | ) | (6,134 | ) | (9,072 | ) |
Total Net Realized Gain (Loss) and Change in Unrealized Appreciation (Depreciation) | | (42,553 | ) | (440,169 | ) | (30,820 | ) | (17,234 | ) | 2,538 | |
Net Increase (Decrease) in Net Assets Resulting from Operations | | $(27,987 | ) | $(296,198 | ) | $(17,295 | ) | $(11,044 | ) | $ 8,929 | |
| | | | | | | | | | | | | | |
@ Amount is less than $500.
The accompanying notes are an integral part of the financial statements. | 133 |
2008 Annual Report | |
| |
September 30, 2008 | |
Statements of Operations
For the Year Ended September 30, 2008
| | Investment | | | | | | | |
| | Grade Fixed | | Limited | | Long Duration | | | |
| | Income | | Duration | | Fixed Income | | Municipal | |
| | Portfolio | | Portfolio | | Portfolio | | Portfolio | |
| | (000) | | (000) | | (000) | | (000) | |
Investment Income: | | | | | | | | | |
Dividends from Securities of Unaffiliated Issuers | | $ 54 | | $ 542 | | $ — | | $ 4,701 | |
Dividends from Securities of Affiliated Issuers | | 1,035 | | 1,806 | | 133 | | 1,267 | |
Interest from Securities of Unaffiliated Issuers | | 25,095 | | 47,825 | | 1,267 | | 52,695 | |
Less: Foreign Taxes Withheld | | (1 | ) | — | | — | | — | |
Total Investment Income | | 26,183 | | 50,173 | | 1,400 | | 58,663 | |
Expenses: | | | | | | | | | |
Investment Advisory Fees (Note B) | | 1,725 | | 2,667 | | 107 | | 4,156 | |
Administration Fees (Note C) | | 368 | | 712 | | 23 | | 887 | |
Custodian Fees (Note F) | | 28 | | 43 | | 7 | | 75 | |
Professional Fees | | 105 | | 74 | | 40 | | 165 | |
Shareholder Reporting Fees | | 64 | | 293 | | — | @ | 118 | |
Shareholder Servicing Fees — Class P (Note D) | | 2 | | 1 | | 1 | | 80 | |
Shareholder Servicing Fees — Class H (Note D) | | — | @ | — | | — | | 10 | |
Distribution and Shareholder Servicing Fees — Class L (Note D) | | — | @ | — | | — | | 14 | |
Sub Transfer Agency Fees — Class I | | 4 | | — | @ | — | | 40 | |
Sub Transfer Agency Fees — Class P | | — | @ | — | | — | | 2 | |
Transfer Agency Fees (Note E) | | 15 | | 10 | | 6 | | 19 | |
Transfer Agency Fees — Class H (Note E) | | 2 | | — | | — | | 2 | |
Transfer Agency Fees — Class L (Note E) | | — | @ | — | | — | | — | @ |
Trustees’ Fees and Expenses | | 7 | | 15 | | 1 | | 17 | |
Registration Fees | | 66 | | — | | 29 | | 130 | |
Other Expenses | | 29 | | 43 | | 6 | | 42 | |
Total Expenses | | 2,415 | | 3,858 | | 220 | | 5,757 | |
Voluntary Waiver of Investment Advisory Fees (Note B) | | — | | — | | (76 | ) | (45 | ) |
Voluntary Waiver of Shareholder Servicing Fees — Class P Shares (Note D) | | — | @ | — | @ | — | @ | — | @ |
Rebate from Morgan Stanley Affiliated Cash Sweep (Note G) | | (31 | ) | (54 | ) | (4 | ) | (64 | ) |
Voluntary Waiver of Sub Transfer Agent Fees — Class I | | — | | — | @ | — | | (30 | ) |
Voluntary Waiver of Sub Transfer Agent Fees — Class P | | — | @ | — | | — | | (2 | ) |
Expense Offset (Note F) | | (8 | ) | (7 | ) | — | @ | (34 | ) |
Net Expenses | | 2,376 | | 3,797 | | 140 | | 5,582 | |
Net Investment Income | | 23,807 | | 46,376 | | 1,260 | | 53,081 | |
Realized Gain (Loss): | | | | | | | | | |
Investments Sold | | (46,910 | ) | (111,667 | ) | 364 | | (809 | ) |
Foreign Currency Transactions | | — | | 32 | | 27 | | — | |
Options Written | | (118 | ) | (124 | ) | — | | — | |
Futures Contracts | | (2,388 | ) | 4,175 | | (640 | ) | (4,802 | ) |
Swap Agreements | | 1,942 | | (260 | ) | 55 | | 249 | |
Net Realized Loss | | (47,474 | ) | (107,844 | ) | (194 | ) | (5,362 | ) |
Change in Unrealized Appreciation (Depreciation): | | | | | | | | | |
Investments | | (22,096 | ) | (98,098 | ) | (1,723 | ) | (111,618 | ) |
Futures Contracts | | (1,331 | ) | (2,463 | ) | (8 | ) | 3,584 | |
Swap Agreements | | 6,357 | | 6,296 | | 764 | | (8,742 | ) |
Net Change in Unrealized Appreciation (Depreciation) | | (17,070 | ) | (94,265 | ) | (967 | ) | (116,776 | ) |
Total Net Realized Loss and Change in | | | | | | | | | |
Unrealized Appreciation (Depreciation) | | (64,544 | ) | (202,109 | ) | (1,161 | ) | (122,138 | ) |
Net Increase (Decrease) in Net Assets Resulting from Operations | | $(40,737 | ) | $(155,733 | ) | $ 99 | | $ (69,057 | ) |
| | | | | | | | | | | |
@ Amount is less than $500.
134 | The accompanying notes are an integral part of the financial statements. |
| 2008 Annual Report |
| |
| September 30, 2008 |
Statements of Changes in Net Assets
| | Balanced | | Mid Cap Growth | |
| | Portfolio | | Portfolio | |
| | Year Ended | | Year Ended | | Year Ended | | Year Ended | |
| | September 30, | | September 30, | | September 30, | | September 30, | |
| | 2008 | | 2007 | | 2008 | | 2007 | |
| | (000) | | (000) | | (000) | | (000) | |
Increase (Decrease) in Net Assets | | | | | | | | | |
Operations: | | | | | | | | | |
Net Investment Income | | $ | 7,567 | | $ | 7,323 | | $ | 2,058 | | $ | 11,060 | |
Net Realized Gain (Loss) | | 20,027 | | 21,721 | | (9,356 | ) | 321,805 | |
Net Change in Unrealized Appreciation (Depreciation) | | (66,160 | ) | 24,512 | | (1,110,196 | ) | 402,601 | |
Net Increase (Decrease) in Net Assets Resulting from Operations | | (38,566 | ) | 53,556 | | (1,117,494 | ) | 735,466 | |
Distributions from and/or in Excess of: | | | | | | | | | |
Class I: | | | | | | | | | |
Net Investment Income | | (7,923 | ) | (5,256 | ) | (8,685 | ) | (4,826 | ) |
Investment Class: | | | | | | | | | |
Net Investment Income | | (120 | ) | (79 | ) | — | | — | |
Class P: | | | | | | | | | |
Net Investment Income | | (785 | ) | (570 | ) | (4,529 | ) | (2,109 | ) |
Total Distributions | | (8,828 | ) | (5,905 | ) | (13,214 | ) | (6,935 | ) |
Capital Share Transactions:(1) | | | | | | | | | |
Class I: | | | | | | | | | |
Subscribed | | 62,569 | | 77,419 | | 944,048 | | 481,835 | |
Distributions Reinvested | | 7,917 | | 5,249 | | 8,283 | | 4,628 | |
Redeemed | | (301,521 | ) | (70,685 | ) | (359,381 | ) | (215,062 | ) |
Investment Class: | | | | | | | | | |
Subscribed | | 237 | | 227 | | — | | — | |
Distributions Reinvested | | 120 | | 79 | | — | | — | |
Redeemed | | (345 | ) | — | | — | | — | |
Redemption Fees | | — | @ | — | @ | — | | — | |
Class P: | | | | | | | | | |
Subscribed | | 11,649 | | 3,482 | | 786,756 | | 530,183 | |
Distributions Reinvested | | 785 | | 570 | | 4,487 | | 2,084 | |
Redeemed | | (3,852 | ) | (14,546 | ) | (574,536 | ) | (386,812 | ) |
Net Increase (Decrease) in Net Assets Resulting from Capital Share Transactions | | (222,441 | ) | 1,795 | | 809,657 | | 416,856 | |
Redemption Fees | | 1 | | — | @ | 80 | | 29 | |
Total Increase (Decrease) in Net Assets | | (269,834 | ) | 49,446 | | (320,971 | ) | 1,145,416 | |
Net Assets: | | | | | | | | | |
Beginning of Period | | 347,172 | | 297,726 | | 3,167,422 | | 2,022,006 | |
End of Period | | $ | 77,338 | | $ | 347,172 | | $ | 2,846,451 | | $ | 3,167,422 | |
Undistributed (Distributions in Excess of) Net Investment Income Included in End of Period Net Assets | | $ | 2,451 | | $ | 2,365 | | $ | (545 | ) | $ | 8,678 | |
(1) Capital Share Transactions: | | | | | | | | | |
Class I: | | | | | | | | | |
Shares Subscribed | | 4,277 | | 5,641 | | 29,998 | | 16,515 | |
Shares Issued on Distributions Reinvested | | 560 | | 396 | | 250 | | 170 | |
Shares Redeemed | | (22,555 | ) | (5,202 | ) | (12,070 | ) | (7,503 | ) |
Net Increase (Decrease) in Class I Shares Outstanding | | (17,718 | ) | 835 | | 18,178 | | 9,182 | |
Investment Class: | | | | | | | | | |
Shares Subscribed | | 17 | | 17 | | — | | — | |
Shares Issued on Distributions Reinvested | | 9 | | 6 | | — | | — | |
Shares Redeemed | | (24 | ) | — | | — | | — | |
Net Increase in Investment Class Shares Outstanding | | 2 | | 23 | | — | | — | |
Class P: | | | | | | | | | |
Shares Subscribed | | 835 | | 257 | | 26,042 | | 18,457 | |
Shares Issued on Distributions Reinvested | | 56 | | 43 | | 139 | | 79 | |
Shares Redeemed | | (281 | ) | (1,098 | ) | (19,529 | ) | (13,766 | ) |
Net Increase (Decrease) in Class P Shares Outstanding | | 610 | | (798 | ) | 6,652 | | 4,770 | |
| | | | | | | | | | | | | | | | | |
@ Amount is less than $500.
The accompanying notes are an integral part of the financial statements. | 135 |
2008 Annual Report | |
| |
September 30, 2008 | |
Statements of Changes in Net Assets
| | U.S. Mid Cap Value | | U.S. Small Cap Value | |
| | Portfolio | | Portfolio | |
| | Year Ended | | Year Ended | | Year Ended | | Year Ended | |
| | September 30, | | September 30, | | September 30, | | September 30, | |
| | 2008 | | 2007 | | 2008 | | 2007 | |
| | (000) | | (000) | | (000) | | (000) | |
Increase (Decrease) in Net Assets | | | | | | | | | |
Operations: | | | | | | | | | |
Net Investment Income | | $ | 1,295 | | $ | 1,234 | | $ | 2,083 | | $ | 1,814 | |
Net Realized Gain (Loss) | | (4,132 | ) | 33,277 | | 28,949 | | 97,626 | |
Net Change in Unrealized Appreciation (Depreciation) | | (33,749 | ) | 762 | | (155,284 | ) | 46,261 | |
Net Increase (Decrease) in Net Assets Resulting from Operations | | (36,586 | ) | 35,273 | | (124,252 | ) | 145,701 | |
Distributions from and/or in Excess of: | | | | | | | | | |
Class I: | | | | | | | | | |
Net Investment Income | | (1,056 | ) | (909 | ) | (1,818 | ) | (2,134 | ) |
Net Realized Gain | | — | | — | | (92,501 | ) | (78,066 | ) |
Investment Class: | | | | | | | | | |
Net Investment Income | | (23 | ) | (15 | ) | — | | — | |
Class P: | | | | | | | | | |
Net Investment Income | | (146 | ) | (68 | ) | (2 | ) | (17 | ) |
Net Realized Gain | | — | | — | | (6,696 | ) | (2,990 | ) |
Total Distributions | | (1,225 | ) | (992 | ) | (101,017 | ) | (83,207 | ) |
Capital Share Transactions:(1) | | | | | | | | | |
Class I: | | | | | | | | | |
Subscribed | | 25,109 | | 31,116 | | 149,786 | | 96,672 | |
Distributions Reinvested | | 1,041 | | 871 | | 94,108 | | 79,964 | |
Redeemed | | (39,009 | ) | (28,642 | ) | (193,860 | ) | (142,380 | ) |
Investment Class: | | | | | | | | | |
Subscribed | | 2,646 | | 781 | | — | | — | |
Distributions Reinvested | | 23 | | 14 | | — | | — | |
Redeemed | | (1,394 | ) | (420 | ) | — | | — | |
Class P: | | | | | | | | | |
Subscribed | | 24,231 | | 6,308 | | 42,779 | | 35,582 | |
Distributions Reinvested | | 145 | | 67 | | 6,698 | | 3,006 | |
Redeemed | | (12,645 | ) | (5,194 | ) | (22,044 | ) | (8,277 | ) |
Net Increase in Net Assets Resulting from Capital Share Transactions | | 147 | | 4,901 | | 77,467 | | 64,567 | |
Redemption Fees | | 2 | | 1 | | 14 | | 16 | |
Total Increase (Decrease) in Net Assets | | (37,662 | ) | 39,183 | | (147,788 | ) | 127,077 | |
Net Assets: | | | | | | | | | |
Beginning of Period | | 172,920 | | 133,737 | | 869,713 | | 742,636 | |
End of Period | | $ | 135,258 | | $ | 172,920 | | $ | 721,925 | | $ | 869,713 | |
Undistributed Net Investment Income Included in End of Period Net Assets | | $ | 1,002 | | $ | 932 | | $ | 1,470 | | $ | 1,241 | |
(1) Capital Share Transactions: | | | | | | | | | |
Class I: | | | | | | | | | |
Shares Subscribed | | 755 | | 917 | | 6,411 | | 3,507 | |
Shares Issued on Distributions Reinvested | | 30 | | 27 | | 4,050 | | 3,048 | |
Shares Redeemed | | (1,212 | ) | (842 | ) | (8,471 | ) | (5,128 | ) |
Net Increase (Decrease) in Class I Shares Outstanding | | (427 | ) | 102 | | 1,990 | | 1,427 | |
Investment Class: | | | | | | | | | |
Shares Subscribed | | 84 | | 23 | | — | | — | |
Shares Issued on Distributions Reinvested | | 1 | | 1 | | — | | — | |
Shares Redeemed | | (44 | ) | (12 | ) | — | | — | |
Net Increase in Investment Class Shares Outstanding | | 41 | | 12 | | — | | — | |
Class P: | | | | | | | | | |
Shares Subscribed | | 726 | | 186 | | 1,885 | | 1,294 | |
Shares Issued on Distributions Reinvested | | 4 | | 2 | | 290 | | 115 | |
Shares Redeemed | | (408 | ) | (155 | ) | (940 | ) | (298 | ) |
Net Increase in Class P Shares Outstanding | | 322 | | 33 | | 1,235 | | 1,111 | |
| | | | | | | | | | | | | | | | | |
@ Amount is less than $500.
136 | The accompanying notes are an integral part of the financial statements. |
| 2008 Annual Report |
| |
| September 30, 2008 |
Statements of Changes in Net Assets
| | Value | Core Fixed Income |
| | Portfolio | Portfolio |
| | Year Ended | Year Ended | Year Ended | Year Ended |
| | September 30, | September 30, | September 30, | September 30, |
| | 2008 | 2007 | 2008 | 2007 |
| | (000) | (000) | (000) | (000) |
Increase (Decrease) in Net Assets | | | | | | | | | |
Operations: | | | | | | | | | |
Net Investment Income | | $ 6,576 | | $ 10,653 | | $ 14,566 | | $ 15,105 | |
Net Realized Gain (Loss) | | (14,133 | ) | 30,107 | | (30,388 | ) | 1,740 | |
Net Change in Unrealized Appreciation (Depreciation) | | (79,819 | ) | 20,120 | | (12,165 | ) | (2,198 | ) |
Net Increase (Decrease) in Net Assets Resulting from Operations | | (87,376 | ) | 60,880 | | (27,987 | ) | 14,647 | |
Distributions from and/or in Excess of: | | | | | | | | | |
Class I: | | | | | | | | | |
Net Investment Income | | (4,307 | ) | (6,009 | ) | (14,096 | ) | (14,770 | ) |
Net Realized Gain | | (15,671 | ) | (28,754 | ) | — | | — | |
Investment Class: | | | | | | | | | |
Net Investment Income | | (765 | ) | (1,395 | ) | — | | — | |
Net Realized Gain | | (4,055 | ) | (7,060 | ) | — | | — | |
Class P: | | | | | | | | | |
Net Investment Income | | (3,036 | ) | (3,507 | ) | (603 | ) | (485 | ) |
Net Realized Gain | | (10,869 | ) | (18,579 | ) | — | | — | |
Total Distributions | | (38,703 | ) | (65,304 | ) | (14,699 | ) | (15,255 | ) |
Capital Share Transactions:(1) | | | | | | | | | |
Class I: | | | | | | | | | |
Subscribed | | 12,981 | | 52,456 | | 28,354 | | 41,762 | |
Distributions Reinvested | | 19,766 | | 29,227 | | 14,079 | | 14,751 | |
Redeemed | | (176,831 | ) | (101,463 | ) | (123,370 | ) | (47,805 | ) |
Investment Class: | | | | | | | | | |
Subscribed | | 1,552 | | 21,832 | | — | | — | |
Distributions Reinvested | | 4,820 | | 8,455 | | — | | — | |
Redeemed | | (74,700 | ) | (12,859 | ) | — | | — | |
Class P: | | | | | | | | | |
Subscribed | | 17,105 | | 28,458 | | 6,287 | | 4,246 | |
Distributions Reinvested | | 13,896 | | 21,997 | | 603 | | 485 | |
Redeemed | | (77,024 | ) | (36,838 | ) | (16,391 | ) | (2,725 | ) |
Net Increase (Decrease) in Net Assets Resulting from Capital Share Transactions | | (258,435 | ) | 11,265 | | (90,438 | ) | 10,714 | |
Redemption Fees | | 16 | | 4 | | — | @ | 1 | |
Total Increase (Decrease) in Net Assets | | (384,498 | ) | 6,845 | | (133,124 | ) | 10,107 | |
Net Assets: | | | | | | | | | |
Beginning of Period | | 568,228 | | 561,383 | | 319,916 | | 309,809 | |
End of Period | | $ 183,730 | | $ 568,228 | | $ 186,792 | | $319,916 | |
Undistributed Net Investment Income Included in End of Period Net Assets | | $ 1,755 | | $ 3,298 | | $ 4,775 | | $ 3,412 | |
(1) Capital Share Transactions: | | | | | | | | | |
Class I: | | | | | | | | | |
Shares Subscribed | | 815 | | 2,850 | | 2,699 | | 3,916 | |
Shares Issued on Distributions Reinvested | | 1,234 | | 1,636 | | 1,367 | | 1,388 | |
Shares Redeemed | | (11,372 | ) | (5,481 | ) | (12,372 | ) | (4,477 | ) |
Net Increase (Decrease) in Class I Shares Outstanding | | (9,323 | ) | (995 | ) | (8,306 | ) | 827 | |
Investment Class: | | | | | | | | | |
Shares Subscribed | | 93 | | 1,167 | | — | | — | |
Shares Issued on Distributions Reinvested | | 297 | | 472 | | — | | — | |
Shares Redeemed | | (4,877 | ) | (701 | ) | — | | — | |
Net Increase (Decrease) in Investment Class Shares Outstanding | | (4,487 | ) | 938 | | — | | — | |
Class P: | | | | | | | | | |
Shares Subscribed | | 1,133 | | 1,535 | | 603 | | 400 | |
Shares Issued on Distributions Reinvested | | 872 | | 1,232 | | 59 | | 46 | |
Shares Redeemed | | (4,975 | ) | (1,998 | ) | (1,711 | ) | (257 | ) |
Net Increase (Decrease) in Class P Shares Outstanding | | (2,970 | ) | 769 | | (1,049 | ) | 189 | |
@ Amount is less than $500.
| The accompanying notes are an integral part of the financial statements. | 137 |
2008 Annual Report
September 30, 2008
Statements of Changes in Net Assets
| | Core Plus Fixed Income | High Yield |
| | Portfolio | Portfolio |
| | Year Ended | | Year Ended | | Year Ended | | Year Ended |
| | September 30, | | September 30, | | September 30, | | September 30, |
| | 2008 | | 2007 | | 2008 | | 2007 |
| | (000) | | (000) | | (000) | | (000) |
Increase (Decrease) in Net Assets | | | | | | | | | |
Operations: | | | | | | | | | |
Net Investment Income | | $ | 143,971 | | $ | 134,127 | | $ | 13,525 | | $ | 16,021 | |
Net Realized Gain (Loss) | | (222,766 | ) | 26,876 | | (15,505 | ) | 3,429 | |
Net Change in Unrealized Appreciation (Depreciation) | | (217,403 | ) | (39,195 | ) | (15,315 | ) | (3,562 | ) |
Net Increase (Decrease) in Net Assets Resulting from Operations | | (296,198 | ) | 121,808 | | (17,295 | ) | 15,888 | |
Distributions from and/or in Excess of: | | | | | | | | | |
Class I: | | | | | | | | | |
Net Investment Income | | (108,380 | ) | (133,961 | ) | (13,934 | ) | (16,292 | ) |
Investment Class: | | | | | | | | | |
Net Investment Income | | (7,053 | ) | (7,932 | ) | — | | — | |
Class P: | | | | | | | | | |
Net Investment Income | | (6,154 | ) | (6,885 | ) | (389 | ) | (336 | ) |
Total Distributions | | (121,587 | ) | (148,778 | ) | (14,323 | ) | (16,628 | ) |
Capital Share Transactions†:(1) | | | | | | | | | |
Class I: | | | | | | | | | |
Subscribed | | 247,491 | | 438,720 | | 10,234 | | 20,986 | |
Distributions Reinvested | | 103,414 | | 122,810 | | 13,876 | | 15,674 | |
Redeemed | | (1,139,399 | ) | (484,513 | ) | (83,129 | ) | (68,050 | ) |
Investment Class**: | | | | | | | | | |
Subscribed | | — | @ | 11,086 | | — | @ | — | |
Distributions Reinvested | | 7,027 | | 7,922 | | — | | — | |
Redeemed | | (7,661 | ) | (9,737 | ) | — | | (897 | ) |
Class P: | | | | | | | | | |
Subscribed | | 22,045 | | 28,336 | | 4,522 | | 9,539 | |
Distributions Reinvested | | 6,132 | | 6,837 | | 363 | | 289 | |
Redeemed | | (45,010 | ) | (22,769 | ) | (10,375 | ) | (5,294 | ) |
Net Increase (Decrease) in Net Assets Resulting from Capital Share Transactions | | (805,961 | ) | 98,692 | | (64,509 | ) | (27,753 | ) |
Redemption Fees | | 18 | | — | @ | 1 | | 1 | |
Total Increase (Decrease) in Net Assets | | (1,223,728 | ) | 71,722 | | (96,126 | ) | (28,492 | ) |
Net Assets: | | | | | | | | | |
Beginning of Period | | 2,655,447 | | 2,583,725 | | 202,957 | | 231,449 | |
End of Period | | $ | 1,431,719 | | $ | 2,655,447 | | $ | 106,831 | | $ | 202,957 | |
Undistributed Net Investment Income Included in End of Period Net Assets | | $ | 41,455 | | $ | 7,928 | | $ | 2,804 | | $ | 4,499 | |
(1) Capital Share Transactions†: | | | | | | | | | |
Class I: | | | | | | | | | |
Shares Subscribed | | 22,376 | | 38,659 | | 1,019 | | 1,969 | |
Shares Issued on Distributions Reinvested | | 9,636 | | 10,875 | | 1,402 | | 1,496 | |
Shares Redeemed | | (111,118 | ) | (42,714 | ) | (8,460 | ) | (6,427 | ) |
Net Increase (Decrease) in Class I Shares Outstanding | | (79,106 | ) | 6,820 | | (6,039 | ) | (2,962 | ) |
Investment Class**: | | | | | | | | | |
Shares Subscribed | | — | @ | 965 | | — | | — | |
Shares Issued on Distributions Reinvested | | 658 | | 701 | | — | | — | |
Shares Redeemed | | (742 | ) | (858 | ) | — | | (83 | ) |
Net Increase (Decrease) in Investment Class Shares Outstanding | | (84 | ) | 808 | | — | | (83 | ) |
Class P: | | | | | | | | | |
Shares Subscribed | | 1,980 | | 2,496 | | 465 | | 906 | |
Shares Issued on Distributions Reinvested | | 572 | | 606 | | 37 | | 28 | |
Shares Redeemed | | (4,243 | ) | (2,011 | ) | (1,023 | ) | (495 | ) |
Net Increase (Decrease) in Class P Shares Outstanding | | (1,691 | ) | 1,091 | | (521 | ) | 439 | |
| | | | | | | | | | | | | | | | |
@ Amount is less than $500.
** On October 3, 2006, the Investment Class for the High Yield Portfolio was fully liquidated, however, this Class is still active.
† Capital share transactions prior to November 13, 2006 for the High Yield Portfolio have been restated to reflect the effect of a reverse stock split as described in the Notes to Financial Statements.
138 | The accompanying notes are an integral part of the financial statements. | |
| 2008 Annual Report |
| |
| September 30, 2008 |
Statements of Changes in Net Assets
| | Intermediate Duration | International Fixed Income |
| | Portfolio | Portfolio |
| | Year Ended | Year Ended | Year Ended | Year Ended |
| | September 30, | September 30, | September 30, | September 30, |
| | 2008 | 2007 | 2008 | 2007 |
| | (000) | (000) | (000) | (000) |
Increase (Decrease) in Net Assets | | | | | | | | | |
Operations: | | | | | | | | | |
Net Investment Income | | $ | 6,190 | | $ | 6,711 | | $ | 6,391 | | $ | 5,442 | |
Net Realized Gain (Loss) | | (11,100 | ) | 261 | | 11,610 | | 3,296 | |
Net Change in Unrealized Appreciation (Depreciation) | | (6,134 | ) | (19 | ) | (9,072 | ) | 8,895 | |
Net Increase (Decrease) in Net Assets Resulting from Operations | | (11,044 | ) | 6,953 | | 8,929 | | 17,633 | |
Distributions from and/or in Excess of: | | | | | | | | | |
Class I: | | | | | | | | | |
Net Investment Income | | (205 | ) | (404 | ) | (15,384 | ) | (4,284 | ) |
Net Realized Gain | | — | | — | | (293 | ) | (929 | ) |
Investment Class: | | | | | | | | | |
Net Investment Income | | (7,161 | ) | (6,675 | ) | — | | — | |
Class P: | | | | | | | | | |
Net Investment Income | | (1 | ) | — | | (85 | ) | — | |
Net Realized Gain | | — | | — | | (1 | ) | — | |
Class H: | | | | | | | | | |
Net Investment Income | | — | | — | | — | @ | — | |
Class L: | | | | | | | | | |
Net Investment Income | | — | | — | | — | | — | |
Total Distributions | | (7,367 | ) | (7,079 | ) | (15,763 | ) | (5,213 | ) |
Capital Share Transactions:(1) | | | | | | | | | |
Class I: | | | | | | | | | |
Subscribed | | — | @ | 32 | | 41,091 | | 49,671 | |
Distributions Reinvested | | 199 | | 344 | | 15,330 | | 4,988 | |
Redeemed | | (3,252 | ) | (2,166 | ) | (77,616 | ) | (49,334 | ) |
Investment Class: | | | | | | | | | |
Subscribed | | — | @ | 10,912 | | — | | — | |
Distributions Reinvested | | 7,161 | | 6,675 | | — | | — | |
Redeemed | | (2,829 | ) | (7,938 | ) | — | | — | |
Class P#: | | | | | | | | | |
Subscribed | | 1 | | 118 | | 42 | | 1,224 | |
Distributions Reinvested | | 1 | | — | | 87 | | — | |
Redeemed | | (120 | ) | — | | (150 | ) | — | |
Class H##: | | | | | | | | | |
Subscribed | | — | | — | | 124 | | — | |
Distributions Reinvested | | — | | — | | — | | — | |
Redeemed | | — | | — | | — | | — | |
Class L##: | | | | | | | | | |
Subscribed | | — | | — | | 115 | | — | |
Distributions Reinvested | | — | | — | | — | | — | |
Redeemed | | — | | — | | — | | — | |
Net Increase (Decrease) in Net Assets Resulting from Capital Share Transactions | | 1,161 | | 7,977 | | (20,977 | ) | 6,549 | |
Redemption Fees | | — | | — | | — | @ | — | |
Total Increase (Decrease) in Net Assets | | (17,250 | ) | 7,851 | | (27,811 | ) | 18,969 | |
Net Assets: | | | | | | | | | |
Beginning of Period | | 152,872 | | 145,021 | | 214,628 | | 195,659 | |
End of Period | | $ | 135,622 | | $ | 152,872 | | $ | 186,817 | | $ | 214,628 | |
Undistributed Net Investment Income Included in End of Period Net Assets | | $ | 462 | | $ | 931 | | $ | 6,453 | | $ | 3,878 | |
| The accompanying notes are an integral part of the financial statements. | 139 |
2008 Annual Report
September 30, 2008
Statements of Changes in Net Assets (cont’d)
| | Intermediate Duration | International Fixed Income |
| | Portfolio | Portfolio |
| | Year Ended | Year Ended | Year Ended | Year Ended |
| | September 30, | September 30, | September 30, | September 30, |
| | 2008 | 2007 | 2008 | 2007 |
| | (000) | (000) | (000) | (000) |
(1) Capital Share Transactions: | | | | | | | | | |
Class I: | | | | | | | | | |
Shares Subscribed | | — | | 3 | | 3,700 | | 4,809 | |
Shares Issued on Distributions Reinvested | | 20 | | 34 | | 1,452 | | 483 | |
Shares Redeemed | | (321 | ) | (214 | ) | (7,013 | ) | (4,752 | ) |
Net Increase (Decrease) in Class I Shares Outstanding | | (301 | ) | (177 | ) | (1,861 | ) | 540 | |
Investment Class: | | | | | | | | | |
Shares Subscribed | | — | | 1,086 | | — | | — | |
Shares Issued on Distributions Reinvested | | 730 | | 664 | | — | | — | |
Shares Redeemed | | (281 | ) | (791 | ) | — | | — | |
Net Increase in Investment Class Shares Outstanding | | 449 | | 959 | | — | | — | |
Class P#: | | | | | | | | | |
Shares Subscribed | | — | @ | 12 | | 4 | | 112 | |
Shares Issued on Distributions Reinvested | | — | @ | — | | 8 | | — | |
Shares Redeemed | | (12 | ) | — | | (13 | ) | — | |
Net Increase (Decrease) in Class P Shares Outstanding | | (12 | ) | 12 | | (1 | ) | 112 | |
Class H##: | | | | | | | | | |
Shares Subscribed | | — | | — | | 11 | | — | |
Shares Issued on Distributions Reinvested | | — | | — | | — | | — | |
Shares Redeemed | | — | | — | | — | | — | |
Net Increase in Class H Shares Outstanding | | — | | — | | 11 | | — | |
Class L##: | | | | | | | | | |
Shares Subscribed | | — | | — | | 10 | | — | |
Shares Issued on Distributions Reinvested | | — | | — | | — | | — | |
Shares Redeemed | | — | | — | | — | | — | |
Net Increase in Class L Shares Outstanding | | — | | — | | 10 | | — | |
@ Amount is less than $500.
# The Intermediate Duration and International Fixed Income Portfolios’ Class P commenced operations on September 28, 2007.
## The International Fixed Income Portfolio’s Class H and Class L commenced operations on January 2, 2008 and June 16, 2008, respectively.
140 | The accompanying notes are an integral part of the financial statements. | |
| 2008 Annual Report |
| |
| September 30, 2008 |
Statements of Changes in Net Assets
| | Investment Grade Fixed Income | Limited Duration |
| | Portfolio | Portfolio |
| | Year Ended | Year Ended | Year Ended | Year Ended |
| | September 30, | September 30, | September 30, | September 30, |
| | 2008 | 2007 | 2008 | 2007 |
| | (000) | (000) | (000) | (000) |
Increase (Decrease) in Net Assets | | | | | | | | | |
Operations: | | | | | | | | | |
Net Investment Income | | $ | 23,807 | | $ | 24,583 | | $ | 46,376 | | $ | 52,817 | |
Net Realized Gain (Loss) | | (47,474 | ) | 2,731 | | (107,844 | ) | (2,961 | ) |
Net Change in Unrealized Appreciation (Depreciation) | | (17,070 | ) | (2,620 | ) | (94,265 | ) | (5,270 | ) |
Net Increase (Decrease) in Net Assets Resulting from Operations | | (40,737 | ) | 24,694 | | (155,733 | ) | 44,586 | |
Distributions from and/or in Excess of: | | | | | | | | | |
Class I: | | | | | | | | | |
Net Investment Income | | (22,826 | ) | (27,708 | ) | (47,902 | ) | (54,837 | ) |
Class P: | | | | | | | | | |
Net Investment Income | | (49 | ) | (36 | ) | (29 | ) | — | |
Class H: | | | | | | | | | |
Net Investment Income | | (1 | ) | — | | — | | — | |
Class L: | | | | | | | | | |
Net Investment Income | | — | @ | — | | — | | — | |
Total Distributions | | (22,876 | ) | (27,744 | ) | (47,931 | ) | (54,837 | ) |
Capital Share Transactions:(1) | | | | | | | | | |
Class I: | | | | | | | | | |
Subscribed | | 57,714 | | 107,207 | | 81,328 | | 133,490 | |
Distributions Reinvested | | 22,282 | | 26,867 | | 47,900 | | 54,830 | |
Redeemed | | (219,149 | ) | (137,208 | ) | (415,668 | ) | (197,885 | ) |
Class P#: | | | | | | | | | |
Subscribed | | 56 | | 560 | | 150 | | 1,020 | |
Distributions Reinvested | | 48 | | 34 | | 29 | | — | @ |
Redeemed | | (300 | ) | (190 | ) | (796 | ) | — | @ |
Class H##: | | | | | | | | | |
Subscribed | | 100 | | — | | — | | — | |
Distributions Reinvested | | — | | — | | — | | — | |
Redeemed | | — | | — | | — | | — | |
Class L##: | | | | | | | | | |
Subscribed | | 130 | | — | | — | | — | |
Distributions Reinvested | | — | | — | | — | | — | |
Redeemed | | (70 | ) | — | | — | | — | |
Net Decrease in Net Assets Resulting from Capital Share Transactions | | (139,189 | ) | (2,730 | ) | (287,057 | ) | (8,545 | ) |
Redemption Fees | | — | @ | 3 | | — | | — | @ |
Total Decrease in Net Assets | | (202,802 | ) | (5,777 | ) | (490,721 | ) | (18,796 | ) |
Net Assets: | | | | | | | | | |
Beginning of Period | | 520,681 | | 526,458 | | 1,059,171 | | 1,077,967 | |
End of Period | | $ | 317,879 | | $ | 520,681 | | $ | 568,450 | | $ | 1,059,171 | |
Undistributed Net Investment Income Included in End of Period Net Assets | | $ | 7,838 | | $ | 4,881 | | $ | 8,912 | | $ | 5,916 | |
| The accompanying notes are an integral part of the financial statements. | 141 |
2008 Annual Report
September 30, 2008
Statements of Changes in Net Assets (cont’d)
| | Investment Grade Fixed Income | Limited Duration |
| | Portfolio | Portfolio |
| | Year Ended | Year Ended | Year Ended | Year Ended |
| | September 30, | September 30, | September 30, | September 30, |
| | 2008 | 2007 | 2008 | 2007 |
| | (000) | (000) | (000) | (000) |
(1) Capital Share Transactions: | | | | | | | | | |
Class I: | | | | | | | | | |
Shares Subscribed | | 5,286 | | 9,721 | | 8,491 | | 12,988 | |
Shares Issued on Distributions Reinvested | | 2,089 | | 2,443 | | 5,048 | | 5,344 | |
Shares Redeemed | | (21,023 | ) | (12,398 | ) | (45,862 | ) | (19,255 | ) |
Net Decrease in Class I Shares Outstanding | | (13,648 | ) | (234 | ) | (32,323 | ) | (923 | ) |
Class P#: | | | | | | | | | |
Shares Subscribed | | 5 | | 50 | | 15 | | 100 | |
Shares Issued on Distributions Reinvested | | 5 | | 3 | | 3 | | — | |
Shares Redeemed | | (28 | ) | (17 | ) | (81 | ) | — | |
Net Increase (Decrease) in Class P Shares Outstanding | | (18 | ) | 36 | | (63 | ) | 100 | |
Class H##: | | | | | | | | | |
Shares Subscribed | | 9 | | — | | — | | — | |
Shares Issued on Distributions Reinvested | | — | | — | | — | | — | |
Shares Redeemed | | — | | — | | — | | — | |
Net Increase in Class H Shares Outstanding | | 9 | | — | | — | | — | |
Class L##: | | | | | | | | | |
Shares Subscribed | | 13 | | — | | — | | — | |
Shares Issued on Distributions Reinvested | | — | | — | | — | | — | |
Shares Redeemed | | (7 | ) | — | | — | | — | |
Net Increase in Class L Shares Outstanding | | 6 | | — | | — | | — | |
@ Amount is less than $500.
# The Limited Duration Portfolios’ Class P commenced operations on September 28, 2007.
## The Investment Grade Fixed Income Portfolio’s Class H and Class L commenced operations on January 2, 2008 and June 16, 2008, respectively.
142 | The accompanying notes are an integral part of the financial statements. | |
| 2008 Annual Report |
| |
| September 30, 2008 |
Statements of Changes in Net Assets
| | Long Duration Fixed Income | Municipal |
| | Portfolio | Portfolio |
| | Year Ended | Year Ended | Year Ended | Year Ended |
| | September 30, | September 30, | September 30, | September 30, |
| | 2008 | 2007 | 2008 | 2007 |
| | (000) | (000) | (000) | (000) |
Increase (Decrease) in Net Assets | | | | | | | | | |
Operations: | | | | | | | | | |
Net Investment Income | | $ | 1,260 | | $ | 1,215 | | $ | 53,081 | | $ | 29,606 | |
Net Realized Gain (Loss) | | (194 | ) | (104 | ) | (5,362 | ) | 14,019 | |
Net Change in Unrealized Appreciation (Depreciation) | | (967 | ) | (349 | ) | (116,776 | ) | (13,378 | ) |
Net Increase (Decrease) in Net Assets Resulting from Operations | | 99 | | 762 | | (69,057 | ) | 30,247 | |
Distributions from and/or in Excess of: | | | | | | | | | |
Class I: | | | | | | | | | |
Net Investment Income | | (1,274 | ) | (1,050 | ) | (46,060 | ) | (31,533 | ) |
Net Realized Gain | | — | | (79 | ) | (3,409 | ) | — | |
Class P: | | | | | | | | | |
Net Investment Income | | (23 | ) | (20 | ) | (1,249 | ) | — | @ |
Net Realized Gain | | — | | (1 | ) | (36 | ) | — | |
Class H: | | | | | | | | | |
Net Investment Income | | — | | — | | (156 | ) | — | |
Class L: | | | | | | | | | |
Net Investment Income | | — | | — | | (81 | ) | — | |
Total Distributions | | (1,297 | ) | (1,150 | ) | (50,991 | ) | (31,533 | ) |
Capital Share Transactions:(1) | | | | | | | | | |
Class I: | | | | | | | | | |
Subscribed | | 3,251 | | — | @ | 578,258 | | 387,749 | |
Distributions Reinvested | | 68 | | — | | 48,142 | | 30,637 | |
Redeemed | | — | | — | @ | (376,573 | ) | (142,622 | ) |
Class P#: | | | | | | | | | |
Subscribed | | — | | — | | 55,162 | | 9,935 | |
Distributions Reinvested | | — | | — | @ | 1,262 | | — | @ |
Redeemed | | — | | — | @ | (9,699 | ) | — | @ |
Class H#: | | | | | | | | | |
Subscribed | | — | | — | | 10,981 | | — | |
Distributions Reinvested | | — | | — | | 151 | | — | |
Redeemed | | — | | — | | (1,787 | ) | — | |
Class L#: | | | | | | | | | |
Subscribed | | — | | — | | 19,269 | | — | |
Distributions Reinvested | | — | | — | | 81 | | — | |
Redeemed | | — | | — | | (715 | ) | — | |
Net Increase in Net Assets Resulting from Capital Share Transactions | | 3,319 | | — | | 324,532 | | 285,699 | |
Redemption Fees | | — | | — | | 1 | | 3 | |
Total Increase (Decrease) in Net Assets | | 2,121 | | (388 | ) | 204,485 | | 284,416 | |
Net Assets: | | | | | | | | | |
Beginning of Period | | 25,813 | | 26,201 | | 946,578 | | 662,162 | |
End of Period | | $ | 27,934 | | $ | 25,813 | | $ | 1,151,063 | | $ | 946,578 | |
Undistributed Net Investment Income Included in End of Period Net Assets | | $ | 560 | | $ | 367 | | $ | 9,112 | | $ | 3,448 | |
| The accompanying notes are an integral part of the financial statements. | 143 |
2008 Annual Report
September 30, 2008
Statements of Changes in Net Assets (cont’d)
| | Long Duration Fixed Income | Municipal |
| | Portfolio | Portfolio |
| | Year Ended | Year Ended | Year Ended | Year Ended |
| | September 30, | September 30, | September 30, | September 30, |
| | 2008 | 2007 | 2008 | 2007 |
| | (000) | (000) | (000) | (000) |
(1) Capital Share Transactions: | | | | | | | | | |
Class I: | | | | | | | | | |
Shares Subscribed | | 306 | | — | @ | 45,938 | | 30,350 | |
Shares Issued on Distributions Reinvested | | 7 | | — | | 3,835 | | 2,397 | |
Shares Redeemed | | — | | — | @ | (30,168 | ) | (11,154 | ) |
Net Increase in Class I Shares Outstanding | | 313 | | — | @ | 19,605 | | 21,593 | |
Class P#: | | | | | | | | | |
Shares Subscribed | | — | | — | | 4,377 | | 776 | |
Shares Issued on Distributions Reinvested | | — | | — | | 101 | | — | @ |
Shares Redeemed | | — | | — | | (782 | ) | — | @ |
Net Increase in Class P Shares Outstanding | | — | | — | | 3,696 | | 776 | |
Class H#: | | | | | | | | | |
Shares Subscribed | | — | | — | | 873 | | — | |
Shares Issued on Distributions Reinvested | | — | | — | | 12 | | — | |
Shares Redeemed | | — | | — | | (143 | ) | — | |
Net Increase in Class H Shares Outstanding | | — | | — | | 742 | | — | |
Class L#: | | | | | | | | | |
Shares Subscribed | | — | | — | | 1,570 | | — | |
Shares Issued on Distributions Reinvested | | — | | — | | 7 | | — | |
Shares Redeemed | | — | | — | | (60 | ) | — | |
Net Increase in Class L Shares Outstanding | | — | | — | | 1,517 | | — | |
@ Amount is less than $500.
# The Municipal Portfolio’s Class P, Class H and Class L commenced operations on June 20, 2007, January 2, 2008 and June 16, 2008, respectively.
144 | The accompanying notes are an integral part of the financial statements. |
| 2008 Annual Report |
| |
| September 30, 2008 |
Financial Highlights
Balanced Portfolio
| | | Class I |
| | | Year Ended September 30, |
Selected Per Share Data and Ratios | | | 2008 | | 2007 | | 2006 | | 2005 | | 2004 | |
Net Asset Value, Beginning of Period | | $ 14.69 | | $ 12.63 | | $ 11.95 | | $ 10.90 | | $ 10.15 | |
Income (Loss) from Investment Operations: | | | | | | | | | | | |
Net Investment Income† | | 0.38 | | 0.32 | | 0.25 | | 0.24 | | 0.18 | |
Net Realized and Unrealized Gain (Loss) on Investments | | (2.84 | ) | 2.00 | | 0.72 | | 1.09 | | 0.78 | |
Total from Investment Operations | | (2.46 | ) | 2.32 | | 0.97 | | 1.33 | | 0.96 | |
Distributions from and/or in Excess of: | | | | | | | | | | | |
Net Investment Income | | (0.36 | ) | (0.26 | ) | (0.29 | ) | (0.28 | ) | (0.21 | ) |
Total Distributions | | (0.36 | ) | (0.26 | ) | (0.29 | ) | (0.28 | ) | (0.21 | ) |
Redemption Fees | | 0.00 | ‡ | 0.00 | ‡ | 0.00 | ‡ | — | | — | |
Net Asset Value, End of Period | | $ 11.87 | | $ 14.69 | | $ 12.63 | | $ 11.95 | | $ 10.90 | |
Total Return++ | | (17.02 | )% | 18.57 | % | 8.21 | % | 12.33 | % | 9.49 | % |
Ratios and Supplemental Data: | | | | | | | | | | | |
Net Assets, End of Period (Thousands) | | $40,799 | | $310,886 | | $256,754 | | $236,730 | | $203,889 | |
Ratio of Expenses to Average Net Assets (1) | | 0.57 | %+ | 0.61 | %+ | 0.60 | % | 0.62 | % | 0.62 | % |
Ratio of Net Investment Income to Average Net Assets (1) | | 2.66 | %+ | 2.35 | %+ | 2.02 | % | 2.11 | % | 1.67 | % |
Portfolio Turnover Rate | | 148 | % | 60 | % | 71 | % | 111 | % | 208 | % |
(1) Supplemental Information on the Ratios to Average Net Assets: | | | | | | | | | | | |
Ratios Before Expense Limitation: | | | | | | | | | | | |
Expenses to Average Net Assets | | 0.58 | %+ | N/A | | N/A | | N/A | | N/A | |
Net Investment Income to Average Net Assets | | 2.65 | %+ | N/A | | N/A | | N/A | | N/A | |
| | | Investment Class |
| | | Year Ended September 30, |
Selected Per Share Data and Ratios | | | 2008 | | 2007 | | 2006 | | 2005 | | 2004 | |
Net Asset Value, Beginning of Period | | $ 14.67 | | $ 12.61 | | $ 11.93 | | $ 10.89 | | $ 10.13 | |
Income (Loss) from Investment Operations: | | | | | | | | | | | |
Net Investment Income† | | 0.35 | | 0.30 | | 0.23 | | 0.22 | | 0.17 | |
Net Realized and Unrealized Gain (Loss) on Investments | | (2.83 | ) | 2.00 | | 0.72 | | 1.08 | | 0.78 | |
Total from Investment Operations | | (2.48 | ) | 2.30 | | 0.95 | | 1.30 | | 0.95 | |
Distributions from and/or in Excess of: | | | | | | | | | | | |
Net Investment Income | | (0.34 | ) | (0.24 | ) | (0.27 | ) | (0.26 | ) | (0.19 | ) |
Total Distributions | | (0.34 | ) | (0.24 | ) | (0.27 | ) | (0.26 | ) | (0.19 | ) |
Redemption Fees | | 0.00 | ‡ | 0.00 | ‡ | 0.00 | ‡ | — | | — | |
Net Asset Value, End of Period | | $ 11.85 | | $ 14.67 | | $ 12.61 | | $ 11.93 | | $ 10.89 | |
Total Return++ | | (17.17 | )% | 18.43 | % | 8.07 | % | 12.09 | % | 9.43 | % |
Ratios and Supplemental Data: | | | | | | | | | | | |
Net Assets, End of Period (Thousands) | | $ 4,141 | | $ 5,103 | | $ 4,102 | | $ 3,706 | | $ 3,117 | |
Ratio of Expenses to Average Net Assets | | 0.79 | %+ | 0.76 | %+ | 0.75 | % | 0.77 | % | 0.77 | % |
Ratio of Net Investment Income to Average Net Assets | | 2.50 | %+ | 2.21 | %+ | 1.87 | % | 1.95 | % | 1.59 | % |
Portfolio Turnover Rate | | 148 | % | 60 | % | 71 | % | 111 | % | 208 | % |
† | Per share amount is based on average shares outstanding. |
‡ | Amount is less than $0.005 per share. |
++ | Calculated based on the net asset value as of the last business day of the period. |
+ | Reflects rebate of certain Portfolio expenses in connection with the investments in Morgan Stanley Institutional Liquidity Money Market Portfolio — Institutional Class during the period. As a result of such rebate, the expenses as a percentage of its net assets were effected by approximately 0.05% and less than 0.005% for the years ended September 30, 2008 and September 30, 2007, respectively. |
| The accompanying notes are an integral part of the financial statements. | 145 |
2008 Annual Report | |
| |
September 30, 2008 | |
Financial Highlights
Balanced Portfolio
| | | Class P |
| | | Year Ended September 30, |
Selected Per Share Data and Ratios | | | 2008 | | 2007 | | 2006 | | 2005 | | 2004 | |
Net Asset Value, Beginning of Period | | $ 14.66 | | $ 12.61 | | $ 11.93 | | $ 10.88 | | $ 10.13 | |
Income (Loss) from Investment Operations: | | | | | | | | | | | |
Net Investment Income† | | 0.32 | | 0.29 | | 0.22 | | 0.22 | | 0.15 | |
Net Realized and Unrealized Gain (Loss) on Investments | | (2.81 | ) | 1.98 | | 0.72 | | 1.08 | | 0.78 | |
Total from Investment Operations | | (2.49 | ) | 2.27 | | 0.94 | | 1.30 | | 0.93 | |
Distributions from and/or in Excess of: | | | | | | | | | | | |
Net Investment Income | | (0.33 | ) | (0.22 | ) | (0.26 | ) | (0.25 | ) | (0.18 | ) |
Total Distributions | | (0.33 | ) | (0.22 | ) | (0.26 | ) | (0.25 | ) | (0.18 | ) |
Redemption Fees | | 0.00 | ‡ | 0.00 | ‡ | 0.00 | ‡ | — | | — | |
Net Asset Value, End of Period | | $ 11.84 | | $ 14.66 | | $ 12.61 | | $ 11.93 | | $ 10.88 | |
Total Return++ | | (17.26 | )% | 18.23 | % | 7.96 | % | 12.05 | % | 9.27 | % |
Ratios and Supplemental Data: | | | | | | | | | | | |
Net Assets, End of Period (Thousands) | | $32,398 | | $31,183 | | $36,870 | | $37,863 | | $57,322 | |
Ratio of Expenses to Average Net Assets (1) | | 0.90 | %+ | 0.87 | %+ | 0.85 | % | 0.87 | % | 0.87 | % |
Ratio of Net Investment Income to Average Net Assets (1) | | 2.35 | %+ | 2.11 | %+ | 1.77 | % | 1.90 | % | 1.42 | % |
Portfolio Turnover Rate | | 148 | % | 60 | % | 71 | % | 111 | % | 208 | % |
(1) Supplemental Information on the Ratios to Average Net Assets: | | | | | | | | | | | |
Ratios Before Expense Limitation: | | | | | | | | | | | |
Expenses to Average Net Assets | | 0.91 | %+ | N/A | | N/A | | N/A | | N/A | |
Net Investment Income to Average Net Assets | | 2.34 | %+ | N/A | | N/A | | N/A | | N/A | |
† | Per share amount is based on average shares outstanding. |
‡ | Amount is less than $0.005 per share. |
++ | Calculated based on the net asset value as of the last business day of the period. |
+ | Reflects rebate of certain Portfolio expenses in connection with the investments in Morgan Stanley Institutional Liquidity Money Market Portfolio — Institutional Class during the period. As a result of such rebate, the expenses as a percentage of its net assets were effected by approximately 0.06% and less than 0.005% for the years ended September 30, 2008 and September 30, 2007, respectively. |
146 | The accompanying notes are an integral part of the financial statements. | |
| 2008 Annual Report |
| |
| September 30, 2008 |
Financial Highlights
Mid Cap Growth Portfolio
| | Class I |
| | Year Ended September 30, |
Selected Per Share Data and Ratios | | 2008 | | 2007 | | 2006 | | 2005 | | 2004 | |
Net Asset Value, Beginning of Period | | $ 33.68 | | $ 25.21 | | $ 23.54 | | $ 18.52 | | $ 15.42 | |
Income (Loss) from Investment Operations: | | | | | | | | | | | |
Net Investment Income (Loss)† | | 0.05 | ^ | 0.17 | | 0.09 | | (0.03 | ) | (0.04 | ) |
Net Realized and Unrealized Gain (Loss) on Investments | | (9.58 | ) | 8.42 | | 1.58 | | 5.05 | | 3.14 | |
Total from Investment Operations | | (9.53 | ) | 8.59 | | 1.67 | | 5.02 | | 3.10 | |
Distributions from and/or in Excess of: | | | | | | | | | | | |
Net Investment Income | | (0.16 | ) | (0.12 | ) | — | | — | | — | |
Total Distributions | | (0.16 | ) | (0.12 | ) | — | | — | | — | |
Redemption Fees | | 0.00 | ‡ | 0.00 | ‡ | 0.00 | ‡ | — | | — | |
Net Asset Value, End of Period | | $ 23.99 | | $ 33.68 | | $ 25.21 | | $ 23.54 | | $ 18.52 | |
Total Return++ | | (28.42 | )%^ | 34.24 | % | 7.05 | %^^ | 27.11 | % | 20.10 | % |
Ratios and Supplemental Data: | | | | | | | | | | | |
Net Assets, End of Period (Thousands) | | $1,609,506 | | $1,647,326 | | $1,001,395 | | $755,313 | | $589,479 | |
Ratio of Expenses to Average Net Assets | | 0.63 | %+ | 0.63 | %+ | 0.63 | % | 0.62 | % | 0.63 | % |
Ratio of Net Investment Income (Loss) to Average Net Assets | | 0.17 | %+ | 0.57 | %+ | 0.37 | % | (0.12 | )% | (0.23 | )% |
Portfolio Turnover Rate | | 37 | % | 64 | % | 65 | % | 115 | % | 147 | % |
| | | | | | | | | | | |
| | Class P |
| | Year Ended September 30, |
Selected Per Share Data and Ratios | | 2008 | | 2007 | | 2006 | | 2005 | | 2004 | |
Net Asset Value, Beginning of Period | | $ 32.78 | | $ 24.54 | | $ 22.97 | | $ 18.12 | | $ 15.13 | |
Income (Loss) from Investment Operations: | | | | | | | | | | | |
Net Investment Income (Loss)† | | (0.02 | )^ | 0.09 | | 0.03 | | (0.08 | ) | (0.08 | ) |
Net Realized and Unrealized Gain (Loss) on Investments | | (9.34 | ) | 8.20 | | 1.54 | | 4.93 | | 3.07 | |
Total from Investment Operations | | (9.36 | ) | 8.29 | | 1.57 | | 4.85 | | 2.99 | |
Distributions from and/or in Excess of: | | | | | | | | | | | |
Net Investment Income | | (0.09 | ) | (0.05 | ) | — | | — | | — | |
Total Distributions | | (0.09 | ) | (0.05 | ) | — | | — | | — | |
Redemption Fees | | 0.00 | ‡ | 0.00 | ‡ | 0.00 | ‡ | — | | — | |
Net Asset Value, End of Period | | $ 23.33 | | $ 32.78 | | $ 24.54 | | $ 22.97 | | $ 18.12 | |
Total Return++ | | (28.59 | )%^ | 33.89 | % | 6.79 | %^^ | 26.77 | % | 19.76 | % |
Ratios and Supplemental Data: | | | | | | | | | | | |
Net Assets, End of Period (Thousands) | | $1,236,945 | | $1,520,096 | | $1,020,611 | | $936,566 | | $728,058 | |
Ratio of Expenses to Average Net Assets (1) | | 0.88 | %+ | 0.88 | %+ | 0.88 | % | 0.87 | % | 0.88 | % |
Ratio of Net Investment Income (Loss) to Average Net Assets (1) | | (0.07 | )%+ | 0.31 | %+ | 0.10 | % | (0.37 | )% | (0.48 | )% |
Portfolio Turnover Rate | | 37 | % | 64 | % | 65 | % | 115 | % | 147 | % |
(1) Supplemental Information on the Ratios to Average Net Assets: | | | | | | | | | | | |
Ratios Before Expense Limitation: | | | | | | | | | | | |
Expenses to Average Net Assets | | 0.89 | %+ | N/A | | N/A | | N/A | | N/A | |
Net Investment Loss to Average Net Assets | | (0.08 | )%+ | N/A | | N/A | | N/A | | N/A | |
† | Per share amount is based on average shares outstanding. |
‡ | Amount is less than $0.005 per share. |
++ | Calculated based on the net asset value as of the last business day of the period. |
^ | During the year, the Portfolio received a regulatory settlement from an unaffiliated third party, which had an impact of less than $0.005 for Class I and Class P on net investment income per share and less than 0.005% on total returns for Class I and Class P. (See Note M within the Notes to Financial Statements) |
^^ | The Adviser fully reimbursed the Portfolio for losses incurred resulting from the disposal of investments in violation of restrictions. The impact of this reimbursement is not reflected in the total return shown above. With this reimbursement, the total return for Class I and Class P would have been 7.09% and 6.84%, respectively. |
+ | Reflects rebate of certain Portfolio expenses in connection with the investments in Morgan Stanley Institutional Liquidity Money Market Portfolio — Institutional Class during the period. As a result of such rebate, the expenses as a percentage of its net assets were effected by less than 0.005%. |
| The accompanying notes are an integral part of the financial statements. | 147 |
2008 Annual Report |
|
September 30, 2008 |
Financial Highlights
U.S. Mid Cap Value Portfolio
| | Class I |
| | Year Ended September 30, |
Selected Per Share Data and Ratios | | 2008 | | 2007 | | 2006 | | 2005 | | 2004 | |
Net Asset Value, Beginning of Period | | $ 36.46 | | $ 29.09 | | $ 25.65 | | $ 21.13 | | $ 18.07 | |
Income (Loss) from Investment Operations: | | | | | | | | | | | |
Net Investment Income† | | 0.28 | | 0.27 | | 0.20 | | 0.11 | | 0.12 | |
Net Realized and Unrealized Gain (Loss) on Investments | | (7.54 | ) | 7.32 | | 3.44 | | 4.50 | | 2.99 | |
Total from Investment Operations | | (7.26 | ) | 7.59 | | 3.64 | | 4.61 | | 3.11 | |
Distributions from and/or in Excess of: | | | | | | | | | | | |
Net Investment Income | | (0.25 | ) | (0.22 | ) | (0.20 | ) | (0.09 | ) | (0.05 | ) |
Total Distributions | | (0.25 | ) | (0.22 | ) | (0.20 | ) | (0.09 | ) | (0.05 | ) |
Redemption Fees | | 0.00 | ‡ | 0.00 | ‡ | 0.00 | ‡ | — | | — | |
Net Asset Value, End of Period | | $ 28.95 | | $ 36.46 | | $ 29.09 | | $ 25.65 | | $ 21.13 | |
Total Return++ | | (20.07 | )% | 26.19 | % | 14.27 | % | 21.86 | % | 17.23 | % |
Ratios and Supplemental Data: | | | | | | | | | | | |
Net Assets, End of Period (Thousands) | | $107,988 | | $151,610 | | $118,005 | | $128,084 | | $246,694 | |
Ratio of Expenses to Average Net Assets (1) | | 0.89 | %+ | 0.89 | %+ | 0.90 | % | 0.87 | % | 0.90 | % |
Ratio of Net Investment Income to Average Net Assets (1) | | 0.84 | %+ | 0.80 | %+ | 0.74 | % | 0.49 | % | 0.57 | % |
Portfolio Turnover Rate | | 64 | % | 87 | % | 66 | % | 72 | % | 146 | % |
(1) Supplemental Information on the Ratios to Average Net Assets: | | | | | | | | | | | |
Ratios Before Expense Limitation: | | | | | | | | | | | |
Expenses to Average Net Assets | | 0.89 | %+ | N/A | | N/A | | N/A | | N/A | |
Net Investment Income to Average Net Assets | | 0.84 | %+ | N/A | | N/A | | N/A | | N/A | |
| | Investment Class |
| | Year Ended September 30, |
Selected Per Share Data and Ratios | | 2008 | | 2007 | | 2006 | | 2005 | | 2004 | |
Net Asset Value, Beginning of Period | | $ 36.27 | | $ 28.94 | | $ 25.51 | | $ 21.00 | | $ 17.95 | |
Income (Loss) from Investment Operations: | | | | | | | | | | | |
Net Investment Income† | | 0.24 | | 0.22 | | 0.13 | | 0.08 | | 0.08 | |
Net Realized and Unrealized Gain (Loss) on Investments | | (7.50 | ) | 7.27 | | 3.46 | | 4.47 | | 2.99 | |
Total from Investment Operations | | (7.26 | ) | 7.49 | | 3.59 | | 4.55 | | 3.07 | |
Distributions from and/or in Excess of: | | | | | | | | | | | |
Net Investment Income | | (0.24 | ) | (0.16 | ) | (0.16 | ) | (0.04 | ) | (0.02 | ) |
Total Distributions | | (0.24 | ) | (0.16 | ) | (0.16 | ) | (0.04 | ) | (0.02 | ) |
Redemption Fees | | 0.00 | ‡ | 0.00 | ‡ | 0.00 | ‡ | — | | — | |
Net Asset Value, End of Period | | $ 28.77 | | $ 36.27 | | $ 28.94 | | $ 25.51 | | $ 21.00 | |
Total Return++ | | (20.18 | )% | 26.01 | % | 14.10 | % | 21.67 | % | 17.09 | % |
Ratios and Supplemental Data: | | | | | | | | | | | |
Net Assets, End of Period (Thousands) | | $ 4,080 | | $ 3,649 | | $ 2,588 | | $ 5,611 | | $ 8,886 | |
Ratio of Expenses to Average Net Assets | | 1.03 | %+ | 1.04 | %+ | 1.05 | % | 1.02 | % | 1.05 | % |
Ratio of Net Investment Income to Average Net Assets | | 0.73 | %+ | 0.66 | %+ | 0.50 | % | 0.33 | % | 0.42 | % |
Portfolio Turnover Rate | | 64 | % | 87 | % | 66 | % | 72 | % | 146 | % |
† | Per share amount is based on average shares outstanding. |
‡ | Amount is less than $0.005 per share. |
++ | Calculated based on the net asset value as of the last business day of the period. |
+ | Reflects rebate of certain Portfolio expenses in connection with the investments in Morgan Stanley Institutional Liquidity Money Market Portfolio — Institutional Class during the period. As a result of such rebate, the expenses as a percentage of its net assets were effected by less than 0.005%. |
148 | The accompanying notes are an integral part of the financial statements. | |
| 2008 Annual Report |
| |
| September 30, 2008 |
Financial Highlights
U.S. Mid Cap Value Portfolio
| | Class P |
| | Year Ended September 30, |
Selected Per Share Data and Ratios | | 2008 | | 2007 | | 2006 | | 2005 | | 2004 | |
Net Asset Value, Beginning of Period | | $ 36.26 | | $ 28.94 | | $ 25.48 | | $ 20.99 | | $ 17.95 | |
Income (Loss) from Investment Operations: | | | | | | | | | | | |
Net Investment Income† | | 0.20 | | 0.19 | | 0.13 | | 0.04 | | 0.07 | |
Net Realized and Unrealized Gain (Loss) on Investments | | (7.61 | ) | 7.28 | | 3.43 | | 4.47 | | 2.97 | |
Total from Investment Operations | | (7.41 | ) | 7.47 | | 3.56 | | 4.51 | | 3.04 | |
Distributions from and/or in Excess of: | | | | | | | | | | | |
Net Investment Income | | (0.20 | ) | (0.15 | ) | (0.10 | ) | (0.02 | ) | 0.00 | ‡ |
Total Distributions | | (0.20 | ) | (0.15 | ) | (0.10 | ) | (0.02 | ) | 0.00 | ‡ |
Redemption Fees | | 0.00 | ‡ | 0.00 | ‡ | 0.00 | ‡ | — | | — | |
Net Asset Value, End of Period | | $ 28.65 | | $ 36.26 | | $ 28.94 | | $ 25.48 | | $ 20.99 | |
Total Return++ | | (20.29 | )% | 25.87 | % | 14.02 | % | 21.52 | % | 16.95 | % |
Ratios and Supplemental Data: | | | | | | | | | | | |
Net Assets, End of Period (Thousands) | | $23,190 | | $17,661 | | $13,144 | | $25,943 | | $55,340 | |
Ratio of Expenses to Average Net Assets | | 1.15 | %+ | 1.14 | %+ | 1.15 | % | 1.12 | % | 1.15 | % |
Ratio of Net Investment Income to Average Net Assets | | 0.61 | %+ | 0.56 | %+ | 0.48 | % | 0.18 | % | 0.32 | % |
Portfolio Turnover Rate | | 64 | % | 87 | % | 66 | % | 72 | % | 146 | % |
† | Per share amount is based on average shares outstanding. |
‡ | Amount is less than $0.005 per share. |
++ | Calculated based on the net asset value as of the last business day of the period. |
+ | Reflects rebate of certain Portfolio expenses in connection with the investments in Morgan Stanley Institutional Liquidity Money Market Portfolio — Institutional Class during the period. As a result of such rebate, the expenses as a percentage of its net assets were effected by less than 0.005%. |
The accompanying notes are an integral part of the financial statements. | 149 |
2008 Annual Report | |
| |
September 30, 2008 | |
Financial Highlights
U.S. Small Cap Value Portfolio
| | Class I |
| | Year Ended September 30, |
Selected Per Share Data and Ratios | | 2008 | | 2007 | | 2006 | | 2005 | | 2004 | |
Net Asset Value, Beginning of Period | | $ 28.19 | | $ 26.22 | | $ 24.41 | | $ 22.26 | | $ 18.19 | |
Income (Loss) from Investment Operations: | | | | | | | | | | | |
Net Investment Income† | | 0.06 | | 0.06 | | 0.09 | | 0.30 | | 0.04 | |
Net Realized and Unrealized Gain (Loss) on Investments | | (3.82 | ) | 4.89 | | 3.04 | | 3.93 | | 4.06 | |
Total from Investment Operations | | (3.76 | ) | 4.95 | | 3.13 | | 4.23 | | 4.10 | |
Distributions from and/or in Excess of: | | | | | | | | | | | |
Net Investment Income | | (0.06 | ) | (0.08 | ) | (0.17 | ) | (0.01 | ) | (0.03 | ) |
Net Realized Gain | | (3.18 | ) | (2.90 | ) | (1.15 | ) | (2.07 | ) | — | |
Total Distributions | | (3.24 | ) | (2.98 | ) | (1.32 | ) | (2.08 | ) | (0.03 | ) |
Redemption Fees | | 0.00 | ‡ | 0.00 | ‡ | 0.00 | ‡ | — | | — | |
Net Asset Value, End of Period | | $ 21.19 | | $ 28.19 | | $ 26.22 | | $ 24.41 | | $ 22.26 | |
Total Return++ | | (14.34 | )% | 19.74 | % | 13.42 | % | 19.83 | % | 22.57 | % |
Ratios and Supplemental Data: | | | | | | | | | | | |
Net Assets, End of Period (Thousands) | | $651,226 | | $810,194 | | $716,208 | | $355,671 | | $382,898 | |
Ratio of Expenses to Average Net Assets | | 0.80 | %+ | 0.84 | %+ | 0.81 | % | 0.82 | % | 0.90 | % |
Ratio of Net Investment Income to Average Net Assets | | 0.28 | %+ | 0.23 | %+ | 0.35 | % | 1.29 | % | 0.18 | % |
Portfolio Turnover Rate | | 56 | % | 46 | % | 51 | % | 61 | % | 104 | % |
| | Class P |
| | Year Ended September 30, |
Selected Per Share Data and Ratios | | 2008 | | 2007 | | 2006 | | 2005 | | 2004 | |
Net Asset Value, Beginning of Period | | $ 28.03 | | $ 26.09 | | $ 24.29 | | $ 22.20 | | $ 18.16 | |
Income (Loss) from Investment Operations: | | | | | | | | | | | |
Net Investment Income (Loss)† | | 0.01 | | 0.00 | ‡ | 0.02 | | 0.24 | | (0.02 | ) |
Net Realized and Unrealized Gain (Loss) on Investments | | (3.81 | ) | 4.86 | | 3.04 | | 3.92 | | 4.06 | |
Total from Investment Operations | | (3.80 | ) | 4.86 | | 3.06 | | 4.16 | | 4.04 | |
Distributions from and/or in Excess of: | | | | | | | | | | | |
Net Investment Income | | (0.00 | )‡ | (0.02 | ) | (0.11 | ) | — | | — | |
Net Realized Gain | | (3.18 | ) | (2.90 | ) | (1.15 | ) | (2.07 | ) | — | |
Total Distributions | | (3.18 | ) | (2.92 | ) | (1.26 | ) | (2.07 | ) | — | |
Redemption Fees | | 0.00 | ‡ | 0.00 | ‡ | 0.00 | ‡ | — | | — | |
Net Asset Value, End of Period | | $ 21.05 | | $ 28.03 | | $ 26.09 | | $ 24.29 | | $ 22.20 | |
Total Return++ | | (14.58 | )% | 19.45 | % | 13.13 | % | 19.49 | % | 22.30 | % |
Ratios and Supplemental Data: | | | | | | | | | | | |
Net Assets, End of Period (Thousands) | | $ 70,699 | | $ 59,519 | | $ 26,428 | | $ 25,860 | | $ 22,530 | |
Ratio of Expenses to Average Net Assets (1) | | 1.05 | %+ | 1.09 | %+ | 1.06 | % | 1.07 | % | 1.15 | % |
Ratio of Net Investment Income (Loss) to Average Net Assets (1) | | 0.02 | %+ | (0.01 | )%+ | 0.08 | % | 1.06 | % | (0.07 | )% |
Portfolio Turnover Rate | | 56 | % | 46 | % | 51 | % | 61 | % | 104 | % |
(1) Supplemental Information on the Ratios to Average Net Assets: | | | | | | | | | | | |
Ratios Before Expense Limitation: | | | | | | | | | | | |
Expenses to Average Net Assets | | 1.06 | %+ | N/A | | N/A | | N/A | | N/A | |
Net Investment Income to Average Net Assets | | 0.02 | %+ | N/A | | N/A | | N/A | | N/A | |
† | Per share amount is based on average shares outstanding. |
‡ | Amount is less than $0.005 per share. |
++ | Calculated based on the net asset value as of the last business day of the period. |
+ | Reflects rebate of certain Portfolio expenses in connection with the investments in Morgan Stanley Institutional Liquidity Money Market Portfolio — Institutional Class during the period. As a result of such rebate, the expenses as a percentage of its net assets were effected by approximately 0.01% and less than 0.005% for the years ended September 30, 2008 and September 30, 2007, respectively. |
150 | The accompanying notes are an integral part of the financial statements. |
| 2008 Annual Report |
| |
| September 30, 2008 |
Financial Highlights
Value Portfolio
| | Class I |
| | Year Ended September 30, |
Selected Per Share Data and Ratios | | 2008 | | 2007 | | 2006 | | 2005 | | 2004 | |
Net Asset Value, Beginning of Period | | $ 18.46 | | $ 18.67 | | $ 17.89 | | $ 16.44 | | $ 13.64 | |
Income (Loss) from Investment Operations: | | | | | | | | | | | |
Net Investment Income† | | 0.33 | ^ | 0.35 | | 0.37 | | 0.33 | | 0.27 | |
Net Realized and Unrealized Gain (Loss) on Investments | | (4.26 | ) | 1.60 | | 2.11 | | 1.40 | | 2.79 | |
Total from Investment Operations | | (3.93 | ) | 1.95 | | 2.48 | | 1.73 | | 3.06 | |
Distributions from and/or in Excess of: | | | | | | | | | | | |
Net Investment Income | | (0.35 | ) | (0.37 | ) | (0.38 | ) | (0.28 | ) | (0.26 | ) |
Net Realized Gain | | (1.06 | ) | (1.79 | ) | (1.32 | ) | — | | — | |
Total Distributions | | (1.41 | ) | (2.16 | ) | (1.70 | ) | (0.28 | ) | (0.26 | ) |
Redemption Fees | | 0.00 | ‡ | 0.00 | ‡ | 0.00 | ‡ | — | | — | |
Net Asset Value, End of Period | | $ 13.12 | | $ 18.46 | | $ 18.67 | | $ 17.89 | | $ 16.44 | |
Total Return++ | | (22.51 | )%^ | 10.95 | % | 14.68 | % | 10.55 | % | 22.56 | % |
Ratios and Supplemental Data: | | | | | | | | | | | |
Net Assets, End of Period (Thousands) | | $ 80,633 | | $ 285,533 | | $ 307,331 | | $ 293,426 | | $ 275,494 | |
Ratio of Expenses to Average Net Assets | | 0.65 | %+ | 0.63 | %+ | 0.65 | % | 0.60 | % | 0.63 | % |
Ratio of Net Investment Income to Average Net Assets | | 2.09 | %+ | 1.90 | %+ | 2.07 | % | 1.88 | % | 1.75 | % |
Portfolio Turnover Rate | | 13 | % | 28 | % | 26 | % | 38 | % | 95 | % |
| | Class P |
| | Year Ended September 30, |
Selected Per Share Data and Ratios | | 2008 | | 2007 | | 2006 | | 2005 | | 2004 | |
Net Asset Value, Beginning of Period | | $ 18.43 | | $ 18.64 | | $ 17.86 | | $ 16.42 | | $ 13.62 | |
Income (Loss) from Investment Operations: | | | | | | | | | | | |
Net Investment Income† | | 0.29 | ^ | 0.31 | | 0.33 | | 0.29 | | 0.23 | |
Net Realized and Unrealized Gain (Loss) on Investments | | (4.24 | ) | 1.60 | | 2.10 | | 1.38 | | 2.79 | |
Total from Investment Operations | | (3.95 | ) | 1.91 | | 2.43 | | 1.67 | | 3.02 | |
Distributions from and/or in Excess of: | | | | | | | | | | | |
Net Investment Income | | (0.31 | ) | (0.33 | ) | (0.33 | ) | (0.23 | ) | (0.22 | ) |
Net Realized Gain | | (1.06 | ) | (1.79 | ) | (1.32 | ) | — | | — | |
Total Distributions | | (1.37 | ) | (2.12 | ) | (1.65 | ) | (0.23 | ) | (0.22 | ) |
Redemption Fees | | 0.00 | ‡ | 0.00 | ‡ | 0.00 | ‡ | — | | — | |
Net Asset Value, End of Period | | $ 13.11 | | $ 18.43 | | $ 18.64 | | $ 17.86 | | $ 16.42 | |
Total Return++ | | (22.65 | )%^ | 10.69 | % | 14.38 | % | 10.24 | % | 22.28 | % |
Ratios and Supplemental Data: | | | | | | | | | | | |
Net Assets, End of Period (Thousands) | | $103,097 | | $199,754 | | $187,718 | | $1,113,274 | | $943,182 | |
Ratio of Expenses to Average Net Assets (1) | | 0.90 | %+ | 0.88 | %+ | 0.87 | % | 0.85 | % | 0.88 | % |
Ratio of Net Investment Income to Average Net Assets (1) | | 1.88 | %+ | 1.65 | %+ | 1.84 | % | 1.63 | % | 1.50 | % |
Portfolio Turnover Rate | | 13 | % | 28 | % | 26 | % | 38 | % | 95 | % |
(1) Supplemental Information on the Ratios to Average Net Assets: | | | | | | | | | | | |
Ratios Before Expense Limitation: | | | | | | | | | | | |
Expenses to Average Net Assets | | 0.91 | %+ | N/A | | N/A | | N/A | | N/A | |
Net Investment Income to Average Net Assets | | 1.87 | %+ | N/A | | N/A | | N/A | | N/A | |
† | Per share amount is based on average shares outstanding. |
‡ | Amount is less than $0.005 per share. |
++ | Calculated based on the net asset value as of the last business day of the period. |
^ | During the year, the Portfolio received a regulatory settlement from an unaffiliated third party, which had an impact of less than $0.005 for Class I and $0.01 for Class P on net investment income per share and an impact of 0.02% on total returns for Class I and Class P. (See Note M within the Notes to Financial Statements) |
+ | Reflects rebate of certain Portfolio expenses in connection with the investments in Morgan Stanley Institutional Liquidity Government Portfolio — Institutional Class during the period. As a result of such rebate, the expenses as a percentage of its net assets were effected by less than 0.005%. |
The accompanying notes are an integral part of the financial statements. | 151 |
2008 Annual Report | |
| |
September 30, 2008 | |
Financial Highlights
Core Fixed Income Portfolio
| | Class I |
| | Year Ended September 30, |
Selected Per Share Data and Ratios | | 2008 | | 2007 | | 2006 | | 2005 | | 2004 | |
Net Asset Value, Beginning of Period | | $ 10.77 | | $ 10.80 | | $ 11.09 | | $ 11.26 | | $ 11.26 | |
Income (Loss) from Investment Operations: | | | | | | | | | | | |
Net Investment Income† | | 0.53 | | 0.52 | | 0.40 | | 0.40 | | 0.33 | |
Net Realized and Unrealized Gain (Loss) on Investments | | (1.60 | ) | (0.02 | ) | 0.00 | ‡ | 0.07 | | 0.14 | |
Total from Investment Operations | | (1.07 | ) | 0.50 | | 0.40 | | 0.47 | | 0.47 | |
Distributions from and/or in Excess of: | | | | | | | | | | | |
Net Investment Income | | (0.52 | ) | (0.53 | ) | (0.57 | ) | (0.45 | ) | (0.47 | ) |
Net Realized Gain | | — | | — | | (0.12 | ) | (0.19 | ) | — | |
Total Distributions | | (0.52 | ) | (0.53 | ) | (0.69 | ) | (0.64 | ) | (0.47 | ) |
Redemption Fees | | 0.00 | ‡ | 0.00 | ‡ | 0.00 | ‡ | — | | — | |
Net Asset Value, End of Period | | $ 9.18 | | $ 10.77 | | $ 10.80 | | $ 11.09 | | $ 11.26 | |
Total Return++ | | (10.40 | )% | 4.76 | % | 3.79 | % | 4.35 | % | 4.33 | % |
Ratios and Supplemental Data: | | | | | | | | | | | |
Net Assets, End of Period (Thousands) | | $186,305 | | $308,111 | | $299,997 | | $220,350 | | $226,555 | |
Ratio of Expenses to Average Net Assets (1) | | 0.49 | %+ | 0.49 | %+ | 0.50 | % | 0.50 | % | 0.50 | % |
Ratio of Net Investment Income to Average Net Assets (1) | | 5.11 | %+ | 4.83 | %+ | 3.71 | % | 3.62 | % | 2.94 | % |
Portfolio Turnover Rate | | 306 | % | 107 | % | 139 | % | 236 | % | 371 | % |
(1) Supplemental Information on the Ratios to Average Net Assets: | | | | | | | | | | | |
Ratios Before Expense Limitation: | | | | | | | | | | | |
Expenses to Average Net Assets | | 0.53 | %+ | 0.54 | %+ | 0.56 | % | 0.53 | % | 0.52 | % |
Net Investment Income to Average Net Assets | | 5.07 | %+ | 4.78 | %+ | 3.65 | % | 3.59 | % | 2.92 | % |
| | Class P |
| | Year Ended September 30, |
Selected Per Share Data and Ratios | | 2008 | | 2007 | | 2006 | | 2005 | | 2004 | |
Net Asset Value, Beginning of Period | | $ 10.71 | | $ 10.74 | | $ 11.03 | | $ 11.21 | | $ 11.22 | |
Income (Loss) from Investment Operations: | | | | | | | | | | | |
Net Investment Income† | | 0.50 | | 0.49 | | 0.37 | | 0.37 | | 0.30 | |
Net Realized and Unrealized Gain (Loss) on Investments | | (1.60 | ) | (0.02 | ) | 0.01 | | 0.06 | | 0.14 | |
Total from Investment Operations | | (1.10 | ) | 0.47 | | 0.38 | | 0.43 | | 0.44 | |
Distributions from and/or in Excess of: | | | | | | | | | | | |
Net Investment Income | | (0.49 | ) | (0.50 | ) | (0.55 | ) | (0.42 | ) | (0.45 | ) |
Net Realized Gain | | — | | — | | (0.12 | ) | (0.19 | ) | (0.00 | )‡ |
Total Distributions | | (0.49 | ) | (0.50 | ) | (0.67 | ) | (0.61 | ) | (0.45 | ) |
Redemption Fees | | 0.00 | ‡ | 0.00 | ‡ | 0.00 | ‡ | — | | — | |
Net Asset Value, End of Period | | $ 9.12 | | $ 10.71 | | $ 10.74 | | $ 11.03 | | $ 11.21 | |
Total Return++ | | (10.68 | )% | 4.53 | % | 3.55 | % | 4.01 | % | 4.12 | % |
Ratios and Supplemental Data: | | | | | | | | | | | |
Net Assets, End of Period (Thousands) | | $ 487 | | $ 11,805 | | $ 9,812 | | $ 9,954 | | $ 9,564 | |
Ratio of Expenses to Average Net Assets (1) | | 0.74 | %+ | 0.74 | %+ | 0.75 | % | 0.75 | % | 0.75 | % |
Ratio of Net Investment Income to Average Net Assets (1) | | 4.87 | %+ | 4.58 | %+ | 3.43 | % | 3.37 | % | 2.69 | % |
Portfolio Turnover Rate | | 306 | % | 107 | % | 139 | % | 236 | % | 371 | % |
(1) Supplemental Information on the Ratios to Average Net Assets: | | | | | | | | | | | |
Ratios Before Expense Limitation: | | | | | | | | | | | |
Expenses to Average Net Assets | | 0.78 | %+ | 0.79 | %+ | 0.81 | % | 0.78 | % | 0.77 | % |
Net Investment Income to Average Net Assets | | 4.84 | %+ | 4.54 | %+ | 3.37 | % | 3.34 | % | 2.67 | % |
† | Per share amount is based on average shares outstanding. |
‡ | Amount is less than $0.005 per share. |
++ | Calculated based on the net asset value as of the last business day of the period. |
+ | Reflects rebate of certain Portfolio expenses in connection with the investments in Morgan Stanley Institutional Liquidity Money Market Portfolio — Institutional Class during the period. As a result of such rebate, the expenses as a percentage of its net assets were effected by approximately 0.01% for both years. |
152 | The accompanying notes are an integral part of the financial statements. |
| 2008 Annual Report |
| |
| September 30, 2008 |
Financial Highlights
Core Plus Fixed Income Portfolio
| | Class I | |
| | Year Ended September 30, | |
Selected Per Share Data and Ratios | | 2008 | | 2007 | | 2006 | | 2005 | | 2004 | |
Net Asset Value, Beginning of Period | | $ | 11.40 | | $ | 11.52 | | $ | 11.69 | | $ | 11.69 | | $ | 11.71 | |
Income (Loss) from Investment Operations: | | | | | | | | | | | |
Net Investment Income† | | 0.66 | | 0.58 | | 0.48 | | 0.47 | | 0.38 | |
Net Realized and Unrealized Gain (Loss) on Investments | | (2.10 | ) | (0.05 | ) | (0.02 | ) | 0.08 | | 0.17 | |
Total from Investment Operations | | (1.44 | ) | 0.53 | | 0.46 | | 0.55 | | 0.55 | |
Distributions from and/or in Excess of: | | | | | | | | | | | |
Net Investment Income | | (0.55 | ) | (0.65 | ) | (0.63 | ) | (0.55 | ) | (0.57 | ) |
Total Distributions | | (0.55 | ) | (0.65 | ) | (0.63 | ) | (0.55 | ) | (0.57 | ) |
Redemption Fees | | 0.00 | ‡ | 0.00 | ‡ | 0.00 | ‡ | — | | — | |
Net Asset Value, End of Period | | $ | 9.41 | | $ | 11.40 | | $ | 11.52 | | $ | 11.69 | | $ | 11.69 | |
Total Return++ | | (13.07 | )% | 4.77 | % | 4.13 | % | 4.84 | % | 4.80 | % |
Ratios and Supplemental Data: | | | | | | | | | | | |
Net Assets, End of Period (Thousands) | | $ | 1,210,286 | | $ | 2,367,043 | | $ | 2,314,052 | | $ | 2,102,609 | | $ | 2,120,149 | |
Ratio of Expenses to Average Net Assets (1) | | 0.45 | %+ | 0.44 | %+ | 0.44 | % | 0.45 | % | 0.50 | % |
Ratio of Net Investment Income to Average Net Assets (1) | | 6.13 | %+ | 5.10 | %+ | 4.24 | % | 4.04 | % | 3.29 | % |
Portfolio Turnover Rate | | 320 | % | 139 | % | 142 | % | 180 | % | 334 | % |
(1) Supplemental Information on the Ratios to Average Net Assets: | | | | | | | | | | | |
Ratios Before Expense Limitation: | | | | | | | | | | | |
Expenses to Average Net Assets | | 0.45 | %+ | N/A | | N/A | | N/A | | N/A | |
Net Investment Income to Average Net Assets | | 6.13 | %+ | N/A | | N/A | | N/A | | N/A | |
| | Investment Class | |
| | Year Ended September 30, | |
Selected Per Share Data and Ratios | | 2008 | | 2007 | | 2006 | | 2005 | | 2004 | |
Net Asset Value, Beginning of Period | | $ | 11.39 | | $ | 11.52 | | $ | 11.68 | | $ | 11.69 | | $ | 11.71 | |
Income (Loss) from Investment Operations: | | | | | | | | | | | |
Net Investment Income† | | 0.64 | | 0.56 | | 0.45 | | 0.45 | | 0.36 | |
Net Realized and Unrealized Gain (Loss) on Investments | | (2.09 | ) | (0.06 | ) | (0.00 | )‡ | 0.07 | | 0.17 | |
Total from Investment Operations | | (1.45 | ) | 0.50 | | 0.45 | | 0.52 | | 0.53 | |
Distributions from and/or in Excess of: | | | | | | | | | | | |
Net Investment Income | | (0.53 | ) | (0.63 | ) | (0.61 | ) | (0.53 | ) | (0.55 | ) |
Total Distributions | | (0.53 | ) | (0.63 | ) | (0.61 | ) | (0.53 | ) | (0.55 | ) |
Redemption Fees | | 0.00 | ‡ | 0.00 | ‡ | 0.00 | ‡ | — | | — | |
Net Asset Value, End of Period | | $ | 9.41 | | $ | 11.39 | | $ | 11.52 | | $ | 11.68 | | $ | 11.69 | |
Total Return++ | | (13.12 | )% | 4.52 | % | 4.04 | % | 4.61 | % | 4.73 | % |
Ratios and Supplemental Data: | | | | | | | | | | | |
Net Assets, End of Period (Thousands) | | $ | 123,610 | | $ | 150,671 | | $ | 142,990 | | $ | 310,592 | | $ | 146,146 | |
Ratio of Expenses to Average Net Assets | | 0.60 | %+ | 0.59 | %+ | 0.59 | % | 0.60 | % | 0.65 | % |
Ratio of Net Investment Income to Average Net Assets | | 5.97 | %+ | 4.97 | %+ | 3.96 | % | 3.89 | % | 3.14 | % |
Portfolio Turnover Rate | | 320 | % | 139 | % | 142 | % | 180 | % | 334 | % |
† | Per share amount is based on average shares outstanding. |
‡ | Amount is less than $0.005 per share. |
++ | Calculated based on the net asset value as of the last business day of the period. |
+ | Reflects rebate of certain Portfolio expenses in connection with the investments in Morgan Stanley Institutional Liquidity Money Market Portfolio — Institutional Class during the period. As a result of such rebate, the expenses as a percentage of its net assets were effected by approximately 0.01% and less than 0.005% for the years ended September 30, 2008 and September 30, 2007, respectively. |
| The accompanying notes are an integral part of the financial statements. | 153 |
2008 Annual Report | |
| |
September 30, 2008 | |
Financial Highlights
Core Plus Fixed Income Portfolio
| | | Class P | |
| | | Year Ended September 30, | |
Selected Per Share Data and Ratios | | | 2008 | | 2007 | | 2006 | | 2005 | | 2004 | |
Net Asset Value, Beginning of Period | | $ 11.38 | | $ 11.50 | | $ 11.67 | | $ 11.68 | | $ 11.70 | |
Income (Loss) from Investment Operations: | | | | | | | | | | | |
Net Investment Income† | | 0.63 | | 0.55 | | 0.46 | | 0.44 | | 0.35 | |
Net Realized and Unrealized Gain (Loss) on Investments | | (2.09 | ) | (0.05 | ) | (0.03 | ) | 0.07 | | 0.17 | |
Total from Investment Operations | | (1.46 | ) | 0.50 | | 0.43 | | 0.51 | | 0.52 | |
Distributions from and/or in Excess of: | | | | | | | | | | | |
Net Investment Income | | (0.52 | ) | (0.62 | ) | (0.60 | ) | (0.52 | ) | (0.54 | ) |
Total Distributions | | (0.52 | ) | (0.62 | ) | (0.60 | ) | (0.52 | ) | (0.54 | ) |
Redemption Fees | | 0.00 | ‡ | 0.00 | ‡ | 0.00 | ‡ | — | | — | |
Net Asset Value, End of Period | | $ 9.40 | | $ 11.38 | | $ 11.50 | | $ 11.67 | | $ 11.68 | |
Total Return++ | | (13.23 | )% | 4.42 | % | 3.97 | % | 4.49 | % | 4.57 | % |
Ratios and Supplemental Data: | | | | | | | | | | | |
Net Assets, End of Period (Thousands) | | $97,823 | | $137,733 | | $126,683 | | $112,716 | | $114,841 | |
Ratio of Expenses to Average Net Assets (1) | | 0.70 | %+ | 0.69 | %+ | 0.69 | % | 0.70 | % | 0.75 | % |
Ratio of Net Investment Income to Average Net Assets (1) | | 5.87 | %+ | 4.84 | %+ | 4.00 | % | 3.79 | % | 3.04 | % |
Portfolio Turnover Rate | | 320 | % | 139 | % | 142 | % | 180 | % | 334 | % |
(1) Supplemental Information on the Ratios to Average Net Assets: | | | | | | | | | | | |
Ratios Before Expense Limitation: | | | | | | | | | | | |
Expenses to Average Net Assets | | 0.70 | %+ | N/A | | N/A | | N/A | | N/A | |
Net Investment Income to Average Net Assets | | 5.87 | %+ | N/A | | N/A | | N/A | | N/A | |
† | Per share amount is based on average shares outstanding. |
‡ | Amount is less than $0.005 per share. |
++ | Calculated based on the net asset value as of the last business day of the period. |
+ | Reflects rebate of certain Portfolio expenses in connection with the investments in Morgan Stanley Institutional Liquidity Money Market Portfolio — Institutional Class during the period. As a result of such rebate, the expenses as a percentage of its net assets were effected by approximately 0.01% and less than 0.005% for the years ended September 30, 2008 and September 30, 2007, respectively. |
154 | The accompanying notes are an integral part of the financial statements. |
| 2008 Annual Report |
| |
| September 30, 2008 |
Financial Highlights
High Yield Portfolio
| | Class I^^ | |
| | Year Ended September 30, | |
Selected Per Share Data and Ratios | | 2008 | | 2007 | | 2006 | | 2005 | | 2004 | |
Net Asset Value, Beginning of Period | | $ | 10.56 | | $ | 10.60 | | $ | 10.80 | | $ | 11.18 | | $ | 10.60 | |
Income (Loss) from Investment Operations: | | | | | | | | | | | |
Net Investment Income† | | 0.87 | | 0.79 | | 0.76 | | 0.80 | | 0.84 | |
Net Realized and Unrealized Gain (Loss) on Investments | | (2.14 | ) | (0.11 | ) | (0.16 | ) | (0.30 | ) | 0.40 | |
Total from Investment Operations | | (1.27 | ) | 0.68 | | 0.60 | | 0.50 | | 1.24 | |
Distributions from and/or in Excess of: | | | | | | | | | | | |
Net Investment Income | | (0.85 | ) | (0.72 | ) | (0.80 | ) | (0.88 | ) | (0.66 | ) |
Total Distributions | | (0.85 | ) | (0.72 | ) | (0.80 | ) | (0.88 | ) | (0.66 | ) |
Redemption Fees | | 0.00 | ‡ | 0.00 | ‡ | 0.00‡ | | — | | — | |
Net Asset Value, End of Period | | $ | 8.44 | | $ | 10.56 | | $ | 10.60 | | $ | 10.80 | | $ | 11.18 | |
Total Return++ | | (12.95 | )% | 7.38 | % | 6.03 | % | 4.63 | % | 12.11 | % |
Ratios and Supplemental Data: | | | | | | | | | | | |
Net Assets, End of Period (Thousands) | | $ | 104,032 | | $ | 193,934 | | $ | 226,162 | | $ | 195,880 | | $ | 314,440 | |
Ratio of Expenses to Average Net Assets (1) | | 0.68 | %+ | 0.68 | %+ | 0.61 | % | 0.62 | % | 0.61 | % |
Ratio of Net Investment Income to Average Net Assets (1) | | 8.84 | %+ | 7.51 | %+ | 7.23 | % | 7.37 | % | 7.70 | % |
Portfolio Turnover Rate | | 28 | % | 40 | % | 58 | % | 55 | % | 89 | % |
(1) Supplemental Information on the Ratios to Average Net Assets: | | | | | | | | | | | |
Ratios Before Expense Limitation: | | | | | | | | | | | |
Expenses to Average Net Assets | | 0.69 | %+ | N/A | | N/A | | N/A | | N/A | |
Net Investment Income to Average Net Assets | | 8.83 | %+ | N/A | | N/A | | N/A | | N/A | |
| | Class P^^ | |
| | Year Ended September 30, | |
Selected Per Share Data and Ratios | | 2008 | | 2007 | | 2006 | | 2005 | | 2004 | |
Net Asset Value, Beginning of Period | | $ | 10.60 | | $ | 10.64 | | $ | 10.84 | | $ | 11.20 | | $ | 10.62 | |
Income (Loss) from Investment Operations: | | | | | | | | | | | |
Net Investment Income† | | 0.85 | | 0.78 | | 0.74 | | 0.78 | | 0.80 | |
Net Realized and Unrealized Gain (Loss) on Investments | | (2.15 | ) | (0.12 | ) | (0.18 | ) | (0.28 | ) | 0.42 | |
Total from Investment Operations | | (1.30 | ) | 0.66 | | 0.56 | | 0.50 | | 1.22 | |
Distributions from and/or in Excess of: | | | | | | | | | | | |
Net Investment Income | | (0.82 | ) | (0.70 | ) | (0.76 | ) | (0.86 | ) | (0.64 | ) |
Total Distributions | | (0.82 | ) | (0.70 | ) | (0.76 | ) | (0.86 | ) | (0.64 | ) |
Redemption Fees | | 0.00 | ‡ | 0.00 | ‡ | 0.00‡ | | — | | — | |
Net Asset Value, End of Period | | $ | 8.48 | | $ | 10.60 | | $ | 10.64 | | $ | 10.84 | | $ | 11.20 | |
Total Return++ | | (13.17 | )% | 7.26 | % | 5.51 | % | 4.52 | % | 11.86 | % |
Ratios and Supplemental Data: | | | | | | | | | | | |
Net Assets, End of Period (Thousands) | | $ | 2,799 | | $ | 9,023 | | $ | 4,391 | | $ | 6,349 | | $ | 17,923 | |
Ratio of Expenses to Average Net Assets (1) | | 0.93 | %+ | 0.93 | %+ | 0.86 | % | 0.87 | % | 0.86 | % |
Ratio of Net Investment Income to Average Net Assets (1) | | 8.56 | %+ | 7.31 | %+ | 7.00 | % | 7.11 | % | 7.45 | % |
Portfolio Turnover Rate | | 28 | % | 40 | % | 58 | % | 55 | % | 89 | % |
(1) Supplemental Information on the Ratios to Average Net Assets: | | | | | | | | | | | |
Ratios Before Expense Limitation: | | | | | | | | | | | |
Expenses to Average Net Assets | | 0.95 | %+ | N/A | | N/A | | N/A | | N/A | |
Net Investment Income to Average Net Assets | | 8.54 | %+ | N/A | | N/A | | N/A | | N/A | |
^^ | On November 13, 2006, the Portfolio effected a reverse stock split as described in the Notes to Financial Statements. Per share data prior to this date has been restated to give effect to the reverse stock split. |
† | Per share amount is based on average shares outstanding. |
‡ | Amount is less than $0.005 per share. |
++ | Calculated based on the net asset value as of the last business day of the period. |
+ | Reflects rebate of certain Portfolio expenses in connection with the investments in Morgan Stanley Institutional Liquidity Money Market Portfolio — Institutional Class during the period. As a result of such rebate, the expenses as a percentage of its net assets were effected by less than 0.005%. |
The accompanying notes are an integral part of the financial statements. | 155 |
2008 Annual Report | |
| |
September 30, 2008 | |
Financial Highlights
Intermediate Duration Portfolio
| | Class I | |
| | Year Ended September 30, | |
Selected Per Share Data and Ratios | | 2008 | | 2007 | | 2006 | | 2005 | | 2004 | |
Net Asset Value, Beginning of Period | | $ | 10.16 | | $ | 10.17 | | $ | 10.22 | | $ | 10.40 | | $ | 10.49 | |
Income (Loss) from Investment Operations: | | | | | | | | | | | |
Net Investment Income† | | 0.43 | | 0.48 | | 0.42 | | 0.37 | | 0.32 | |
Net Realized and Unrealized Gain (Loss) on Investments | | (1.15 | ) | 0.01 | | (0.08 | ) | (0.16 | ) | (0.01 | ) |
Total from Investment Operations | | (0.72 | ) | 0.49 | | 0.34 | | 0.21 | | 0.31 | |
Distributions from and/or in Excess of: | | | | | | | | | | | |
Net Investment Income | | (0.51 | ) | (0.50 | ) | (0.39 | ) | (0.36 | ) | (0.40 | ) |
Net Realized Gain | | — | | — | | — | | (0.03 | ) | — | |
Total Distributions | | (0.51 | ) | (0.50 | ) | (0.39 | ) | (0.39 | ) | (0.40 | ) |
Net Asset Value, End of Period | | $ | 8.93 | | $ | 10.16 | | $ | 10.17 | | $ | 10.22 | | $ | 10.40 | |
Total Return++ | | (7.29 | )% | 4.87 | % | 3.33 | % | 2.22 | % | 3.06 | % |
Ratios and Supplemental Data: | | | | | | | | | | | |
Net Assets, End of Period (Thousands) | | $ | 3,476 | | $ | 7,015 | | $ | 8,823 | | $ | 9,393 | | $ | 18,828 | |
Ratio of Expenses to Average Net Assets (1) | | 0.52 | %+ | 0.54 | %+ | 0.50 | % | 0.50 | % | 0.53 | % |
Ratio of Net Investment Income to Average Net Assets (1) | | 4.36 | %+ | 4.71 | %+ | 4.20 | % | 3.59 | % | 3.07 | % |
Portfolio Turnover Rate | | 61 | % | 89 | % | 70 | % | 146 | % | 211 | % |
(1) Supplemental Information on the Ratios to Average Net Assets: | | | | | | | | | | | |
Ratios Before Expense Limitation: | | | | | | | | | | | |
Expenses to Average Net Assets | | 0.52 | %+ | N/A | | N/A | | N/A | | N/A | |
Net Investment Income to Average Net Assets | | 4.36 | %+ | N/A | | N/A | | N/A | | N/A | |
| | Investment Class | |
| | Year Ended September 30, | |
Selected Per Share Data and Ratios | | 2008 | | 2007 | | 2006 | | 2005 | | 2004 | |
Net Asset Value, Beginning of Period | | $ | 10.12 | | $ | 10.13 | | $ | 10.19 | | $ | 10.37 | | $ | 10.46 | |
Income (Loss) from Investment Operations: | | | | | | | | | | | |
Net Investment Income† | | 0.41 | | 0.46 | | 0.39 | | 0.33 | | 0.30 | |
Net Realized and Unrealized Gain (Loss) on Investments | | (1.14 | ) | 0.02 | | (0.07 | ) | (0.13 | ) | (0.01 | ) |
Total from Investment Operations | | (0.73 | ) | 0.48 | | 0.32 | | 0.20 | | 0.29 | |
Distributions from and/or in Excess of: | | | | | | | | | | | |
Net Investment Income | | (0.49 | ) | (0.49 | ) | (0.38 | ) | (0.35 | ) | (0.38 | ) |
Net Realized Gain | | — | | — | | — | | (0.03 | ) | — | |
Total Distributions | | (0.49 | ) | (0.49 | ) | (0.38 | ) | (0.38 | ) | (0.38 | ) |
Net Asset Value, End of Period | | $ | 8.90 | | $ | 10.12 | | $ | 10.13 | | $ | 10.19 | | $ | 10.37 | |
Total Return++ | | (7.54 | )% | 4.84 | % | 3.19 | % | 1.99 | % | 2.86 | % |
Ratios and Supplemental Data: | | | | | | | | | | | |
Net Assets, End of Period (Thousands) | | $ | 132,146 | | $ | 145,739 | | $ | 136,198 | | $ | 304,844 | | $ | 138,813 | |
Ratio of Expenses to Average Net Assets | | 0.67 | %+ | 0.69 | %+ | 0.65 | % | 0.65 | % | 0.68 | % |
Ratio of Net Investment Income to Average Net Assets | | 4.23 | %+ | 4.58 | %+ | 3.87 | % | 3.22 | % | 2.92 | % |
Portfolio Turnover Rate | | 61 | % | 89 | % | 70 | % | 146 | % | 211 | % |
† | Per share amount is based on average shares outstanding. |
++ | Calculated based on the net asset value as of the last business day of the period. |
+ | Reflects rebate of certain Portfolio expenses in connection with the investments in Morgan Stanley Institutional Liquidity Money Market Portfolio — Institutional Class during the period. As a result of such rebate, the expenses as a percentage of its net assets were effected by approximately 0.02% for the year ended September 30, 2008 and less than 0.005% and approximately 0.01% for the years September 30, 2007, for Class I and Investment Class, respectively. |
156 | The accompanying notes are an integral part of the financial statements. |
| 2008 Annual Report |
| |
| September 30, 2008 |
Financial Highlights
International Fixed Income Portfolio
| | Class I | |
| | Year Ended September 30, | |
Selected Per Share Data and Ratios | | 2008 | | 2007 | | 2006 | | 2005 | | 2004 | |
Net Asset Value, Beginning of Period | | $ | 10.97 | | $ | 10.35 | | $ | 10.81 | | $ | 11.24 | | $ | 11.92 | |
Income (Loss) from Investment Operations: | | | | | | | | | | | |
Net Investment Income† | | 0.33 | | 0.28 | | 0.21 | | 0.25 | | 0.28 | |
Net Realized and Unrealized Gain (Loss) on Investments | | 0.05 | | 0.61 | | (0.11 | ) | 0.01 | | 0.63 | |
Total from Investment Operations | | 0.38 | | 0.89 | | 0.10 | | 0.26 | | 0.91 | |
Distributions from and/or in Excess of: | | | | | | | | | | | |
Net Investment Income | | (0.79 | ) | (0.22 | ) | (0.51 | ) | (0.69 | ) | (1.59 | ) |
Net Realized Gain | | (0.02 | ) | (0.05 | ) | (0.05 | ) | — | | — | |
Total Distributions | | (0.81 | ) | (0.27 | ) | (0.56 | ) | (0.69 | ) | (1.59 | ) |
Redemption Fees | | 0.00 | ‡ | — | | — | | — | | — | |
Net Asset Value, End of Period | | $ | 10.54 | | $ | 10.97 | | $ | 10.35 | | $ | 10.81 | | $ | 11.24 | |
Total Return++ | | 3.50 | % | 8.76 | % | 1.12 | % | 1.81 | % | 7.95 | % |
Ratios and Supplemental Data: | | | | | | | | | | | |
Net Assets, End of Period (Thousands) | | $ | 185,413 | | $ | 213,392 | | $ | 195,659 | | $ | 157,911 | | $ | 154,111 | |
Ratio of Expenses to Average Net Assets (1) | | 0.60 | %+ | 0.60 | %+ | 0.60 | % | 0.55 | % | 0.56 | % |
Ratio of Net Investment Income to Average Net Assets (1) | | 2.95 | %+ | 2.66 | %+ | 2.02 | % | 2.17 | % | 2.52 | % |
Portfolio Turnover Rate | | 74 | % | 82 | % | 69 | % | 38 | % | 15 | % |
(1) Supplemental Information on the Ratios to Average Net Assets: | | | | | | | | | | | |
Ratios Before Expense Limitation: | | | | | | | | | | | |
Expenses to Average Net Assets | | 0.61 | %+ | N/A | | N/A | | N/A | | N/A | |
Net Investment Income to Average Net Assets | | 2.94 | %+ | N/A | | N/A | | N/A | | N/A | |
| | Class P |
| | Year Ended | | Period from |
| | September 30, | | September 28, 2007^ to |
Selected Per Share Data and Ratios | | 2008 | | September 30, 2007 |
Net Asset Value, Beginning of Period | | $11.08 | | | $10.97 | |
Income (Loss) from Investment Operations: | | | | | | |
Net Investment Income† | | 0.30 | | | 0.00 | ‡ |
Net Realized and Unrealized Gain on Investments | | 0.05 | | | 0.11 | |
Total from Investment Operations | | 0.35 | | | 0.11 | |
Distributions from and/or in Excess of: | | | | | | |
Net Investment Income | | (0.77 | ) | | — | |
Net Realized Gain | | (0.02 | ) | | — | |
Total Distributions | | (0.79 | ) | | — | |
Redemption Fees | | 0.00 | ‡ | | — | |
Net Asset Value, End of Period | | $10.64 | | | $11.08 | |
Total Return++ | | 4.31 | % | | — | |
Ratios and Supplemental Data: | | | | | | |
Net Assets, End of Period (Thousands) | | $1,174 | | | $1,236 | |
Ratio of Expenses to Average Net Assets | | 0.85 | %+ | | 1.45 | %*+ |
Ratio of Net Investment Income to Average Net Assets | | 2.67 | %+ | | 1.39 | %*+ |
Portfolio Turnover Rate | | 74 | % | | 82 | %# |
^ | Commencement of Operations |
† | Per share amount is based on average shares outstanding. |
‡ | Amount is less than $0.005 per share. |
++ | Calculated based on the net asset value as of the last business day of the period. |
+ | Reflects rebate of certain Portfolio expenses in connection with the investments in Morgan Stanley Institutional Liquidity Money Market Portfolio — Institutional Class during the period. As a result of such rebate, the expenses as a percentage of its net assets were effected by less than 0.005% for the year ended September 30, 2008 and less than 0.005% and approximately 0.03% for the year ended September 30, 2007 for Class I and Class P, respectively. |
# | Not Annualized |
* | Annualized |
| | | | | | | | | | | | | | | | | | | | | | | |
The accompanying notes are an integral part of the financial statements. | 157 |
2008 Annual Report
September 30, 2008
Financial Highlights
International Fixed Income Portfolio
| | Class H |
| | Period from |
| | January 2, 2008^ |
Selected Per Share Data and Ratios | | to September 30, 2008 |
Net Asset Value, Beginning of Period | | $ | 10.89 | |
Income (Loss) from Investment Operations: | | | |
Net Investment Income† | | 0.07 | |
Net Realized and Unrealized Loss on Investments | | (0.36 | ) |
Total from Investment Operations | | (0.29 | ) |
Distributions from and/or in Excess of: | | | |
Net Investment Income | | (0.05 | ) |
Total Distributions | | (0.05 | ) |
Net Asset Value, End of Period | | $ | 10.55 | |
Total Return++ | | (2.70 | )%# |
Ratios and Supplemental Data: | | | |
Net Assets, End of Period (Thousands) | | $ | 120 | |
Ratio of Expenses to Average Net Assets | | 2.69 | %*+ |
Ratio of Net Investment Income to Average Net Assets | | 0.88 | %*+ |
Portfolio Turnover Rate | | 74 | %# |
| | Class L |
| | Period from |
| | June 16, 2008^ |
Selected Per Share Data and Ratios | | to September 30, 2008 |
Net Asset Value, Beginning of Period | | $ | 10.94 | |
Income (Loss) from Investment Operations: | | | |
Net Investment Income† | | 0.07 | |
Net Realized and Unrealized Loss on Investments | | (0.39 | ) |
Total from Investment Operations | | (0.32 | ) |
Net Asset Value, End of Period | | $ | 10.62 | |
Total Return++ | | (2.93 | )%# |
Ratios and Supplemental Data: | | | |
Net Assets, End of Period (Thousands) | | $ | 110 | |
Ratio of Expenses to Average Net Assets | | 1.16 | %*+ |
Ratio of Net Investment Income to Average Net Assets | | 2.29 | %*+ |
Portfolio Turnover Rate | | 74 | %# |
| | | | | |
^ Commencement of Operations
† Per share amount is based on average shares outstanding.
++ Calculated based on the net asset value which does not reflect sales charges, if applicable, as of the last business day of the period.
# Not Annualized
* Annualized
+ Reflects rebate of certain Portfolio expenses in connection with the investments in Morgan Stanley Institutional Liquidity Money Market Portfolio — Institutional Class during the period. As a result of such rebate, the expenses as a percentage of its net assets were effected by less than 0.005%.
158 | The accompanying notes are an integral part of the financial statements. |
| 2008 Annual Report |
| |
| September 30, 2008 |
Financial Highlights
Investment Grade Fixed Income Portfolio
| | | Class I |
| | | Year Ended September 30, |
Selected Per Share Data and Ratios | | | 2008 | | 2007 | | 2006 | | 2005 | | 2004 | |
Net Asset Value, Beginning of Period | | $ 11.15 | | $ 11.22 | | $ 11.42 | | $ 11.57 | | $ 11.54 | |
Income (Loss) from Investment Operations: | | | | | | | | | | | |
Net Investment Income† | | 0.55 | | 0.52 | | 0.41 | | 0.42 | | 0.34 | |
Net Realized and Unrealized Gain (Loss) on Investments | | (1.57 | ) | 0.01 | | (0.00 | )‡ | 0.06 | | 0.14 | |
Total from Investment Operations | | (1.02 | ) | 0.53 | | 0.41 | | 0.48 | | 0.48 | |
Distributions from and/or in Excess of: | | | | | | | | | | | |
Net Investment Income | | (0.52 | ) | (0.60 | ) | (0.56 | ) | (0.49 | ) | (0.45 | ) |
Net Realized Gain | | — | | — | | (0.05 | ) | (0.14 | ) | — | |
Total Distributions | | (0.52 | ) | (0.60 | ) | (0.61 | ) | (0.63 | ) | (0.45 | ) |
Redemption Fees | | 0.00 | ‡ | 0.00 | ‡ | 0.00 | ‡ | — | | — | |
Net Asset Value, End of Period | | $9.61 | | $ 11.15 | | $ 11.22 | | $ 11.42 | | $ 11.57 | |
Total Return++ | | (9.37 | )% | 4.82 | % | 3.65 | % | 4.39 | % | 4.36 | % |
Ratios and Supplemental Data: | | | | | | | | | | | |
Net Assets, End of Period (Thousands) | | $316,894 | | $519,504 | | $525,680 | | $499,534 | | $527,837 | |
Ratio of Expenses to Average Net Assets | | 0.52 | %+ | 0.50 | %+ | 0.50 | % | 0.50 | % | 0.50 | % |
Ratio of Net Investment Income to Average Net Assets | | 5.18 | %+ | 4.74 | %+ | 3.66 | % | 3.67 | % | 2.94 | % |
Portfolio Turnover Rate | | 325 | % | 124 | % | 154 | % | 240 | % | 332 | % |
| | | Class P |
| | | Year Ended September 30, |
Selected Per Share Data and Ratios | | | 2008 | | 2007 | | 2006 | | 2005 | | 2004 | |
Net Asset Value, Beginning of Period | | $ 11.14 | | $ 11.21 | | $ 11.42 | | $ 11.56 | | $ 11.53 | |
Income (Loss) from Investment Operations: | | | | | | | | | | | |
Net Investment Income† | | 0.53 | | 0.51 | | 0.39 | | 0.41 | | 0.32 | |
Net Realized and Unrealized Gain (Loss) on Investments | | (1.57 | ) | 0.00 | ‡ | (0.01 | ) | 0.06 | | 0.14 | |
Total from Investment Operations | | (1.04 | ) | 0.51 | | 0.38 | | 0.47 | | 0.46 | |
Distributions from and/or in Excess of: | | | | | | | | | | | |
Net Investment Income | | (0.50 | ) | (0.58 | ) | (0.54 | ) | (0.47 | ) | (0.43 | ) |
Net Realized Gain | | — | | — | | (0.05 | ) | (0.14 | ) | — | |
Total Distributions | | (0.50 | ) | (0.58 | ) | (0.59 | ) | (0.61 | ) | (0.43 | ) |
Redemption Fees | | 0.00 | ‡ | 0.00 | ‡ | 0.00 | ‡ | — | | — | |
Net Asset Value, End of Period | | $ 9.60 | | $ 11.14 | | $ 11.21 | | $ 11.42 | | $ 11.56 | |
Total Return++ | | (9.60 | )% | 4.56 | % | 3.59 | % | 4.23 | % | 4.10 | % |
Ratios and Supplemental Data: | | | | | | | | | | | |
Net Assets, End of Period (Thousands) | | $ 842 | | $ 1,177 | | $778 | | $ 1,190 | | $ 1,400 | |
Ratio of Expenses to Average Net Assets (1) | | 0.67 | %+ | 0.65 | %+ | 0.65 | % | 0.65 | % | 0.65 | % |
Ratio of Net Investment Income to Average Net Assets (1) | | 5.01 | %+ | 4.59 | %+ | 3.46 | % | 3.55 | % | 2.79 | % |
Portfolio Turnover Rate | | 325 | % | 124 | % | 154 | % | 240 | % | 332 | % |
(1) Supplemental Information on the Ratios to Average Net Assets: | | | | | | | | | | | |
Ratios Before Expense Limitation: | | | | | | | | | | | |
Expenses to Average Net Assets | | 0.77 | %+ | 0.75 | %+ | 0.75 | % | 0.75 | % | 0.75 | % |
Net Investment Income to Average Net Assets | | 4.91 | %+ | 4.49 | %+ | 3.36 | % | 3.45 | % | 2.69 | % |
† Per share amount is based on average shares outstanding.
‡ Amount is less than $0.005 per share.
++ Calculated based on the net asset value as of the last business day of the period.
+ Reflects rebate of certain Portfolio expenses in connection with the investments in Morgan Stanley Institutional Liquidity Money Market Portfolio — Institutional Class during the period. As a result of such rebate, the expenses as a percentage of its net assets were effected by approximately 0.01% and less than 0.005% for the years ended September 30, 2008 and September 30, 2007, respectively.
The accompanying notes are an integral part of the financial statements. | 159 |
2008 Annual Report
September 30, 2008
Financial Highlights
Investment Grade Fixed Income Portfolio
| | Class H |
| | Period from |
| | January 2, 2008^ |
Selected Per Share Data and Ratios | | to September 30, 2008 |
Net Asset Value, Beginning of Period | | $ | 11.15 | |
Income (Loss) from Investment Operations: | | | |
Net Investment Income† | | 0.21 | |
Net Realized and Unrealized Loss on Investments | | (1.68 | ) |
Total from Investment Operations | | (1.47 | ) |
Distributions from and/or in Excess of: | | | |
Net Investment Income | | (0.15 | ) |
Total Distributions | | (0.15 | ) |
Net Asset Value, End of Period | | $ | 9.53 | |
Total Return++ | | (13.21 | )%# |
Ratios and Supplemental Data: | | | |
Net Assets, End of Period (Thousands) | | $ | 85 | |
Ratio of Expenses to Average Net Assets | | 2.98 | %*+ |
Ratio of Net Investment Income to Average Net Assets | | 2.71 | %*+ |
Portfolio Turnover Rate | | 325 | %# |
| | Class L |
| | Period from |
| | June 16, 2008^ |
Selected Per Share Data and Ratios | | to September 30, 2008 |
Net Asset Value, Beginning of Period | | $ | 10.12 | |
Income (Loss) from Investment Operations: | | | |
Net Investment Income† | | 0.12 | |
Net Realized and Unrealized Loss on Investments | | (0.60 | ) |
Total from Investment Operations | | (0.48 | ) |
Distributions from and/or in Excess of: | | | |
Net Investment Income | | (0.01 | ) |
Total Distributions | | (0.01 | ) |
Net Asset Value, End of Period | | $ | 9.63 | |
Total Return++ | | (4.73 | )%# |
Ratios and Supplemental Data: | | | |
Net Assets, End of Period (Thousands) | | $ | 58 | |
Ratio of Expenses to Average Net Assets | | 1.15 | %*+ |
Ratio of Net Investment Income to Average Net Assets | | 4.34 | %*+ |
Portfolio Turnover Rate | | 325 | %# |
| | | | | | |
^ Commencement of Operations
† Per share amount is based on average shares outstanding.
++ Calculated based on the net asset value which does not reflect sales charges, if applicable, as of the last business day of the period.
# Not Annualized
* Annualized
+ Reflects rebate of certain Portfolio expenses in connection with the investments in Morgan Stanley Institutional Liquidity Money Market Portfolio — Institutional Class during the period. As a result of such rebate, the expenses as a percentage of its net assets were effected by approximately 0.01%.
160 | The accompanying notes are an integral part of the financial statements. |
| 2008 Annual Report |
| |
| September 30, 2008 |
Financial Highlights
Limited Duration Portfolio
| | | Class I |
| | | Year Ended September 30, |
Selected Per Share Data and Ratios | | | 2008 | | 2007 | | 2006 | | 2005 | | 2004 | |
Net Asset Value, Beginning of Period | | $ 10.24 | | $ 10.34 | | $ 10.34 | | $ 10.50 | | $ 10.65 | |
Income (Loss) from Investment Operations: | | | | | | | | | | | |
Net Investment Income† | | 0.49 | | 0.51 | | 0.41 | | 0.30 | | 0.25 | |
Net Realized and Unrealized Loss on Investments | | (2.22 | ) | (0.08 | ) | (0.02 | ) | (0.15 | ) | (0.10 | ) |
Total from Investment Operations | | (1.73 | ) | 0.43 | | 0.39 | | 0.15 | | 0.15 | |
Distributions from and/or in Excess of: | | | | | | | | | | | |
Net Investment Income | | (0.51 | ) | (0.53 | ) | (0.39 | ) | (0.31 | ) | (0.28 | ) |
Net Realized Gain | | — | | — | | — | | — | | (0.02 | ) |
Total Distributions | | (0.51 | ) | (0.53 | ) | (0.39 | ) | (0.31 | ) | (0.30 | ) |
Redemption Fees | | — | | 0.00 | ‡ | — | | — | | — | |
Net Asset Value, End of Period | | $ 8.00 | | $ 10.24 | | $ 10.34 | | $ 10.34 | | $ 10.50 | |
Total Return++ | | (17.57 | )% | 4.26 | % | 3.88 | % | 1.44 | % | 1.47 | % |
Ratios and Supplemental Data: | | | | | | | | | | | |
Net Assets, End of Period (Thousands) | | $568,156 | | $1,058,151 | | $1,077,967 | | $1,069,956 | | $957,367 | |
Ratio of Expenses to Average Net Assets (1) | | 0.43 | %+ | 0.45 | %+ | 0.42 | % | 0.42 | % | 0.42 | % |
Ratio of Net Investment Income to Average Net Assets (1) | | 5.22 | %+ | 4.94 | %+ | 3.96 | % | 2.92 | % | 2.36 | % |
Portfolio Turnover Rate | | 20 | % | 56 | % | 64 | % | 66 | % | 135 | % |
(1) Supplemental Information on the Ratios to Average Net Assets: | | | | | | | | | | | |
Ratios Before Expense Limitation: | | | | | | | | | | | |
Expenses to Average Net Assets | | 0.43 | %+ | N/A | | N/A | | N/A | | N/A | |
Net Investment Income to Average Net Assets | | 5.22 | %+ | N/A | | N/A | | N/A | | N/A | |
† Per share amount is based on average shares outstanding.
‡ Amount is less than $0.005 per share.
++ Calculated based on the net asset value as of the last business day of the period.
+ Reflects rebate of certain Portfolio expenses in connection with the investments in Morgan Stanley Institutional Liquidity Money Market Portfolio — Institutional Class during the period. As a result of such rebate, the expenses as a percentage of its net assets were effected by approximately 0.01% and less than 0.005% for the years ended September 30, 2008 and September 30, 2007, respectively.
The accompanying notes are an integral part of the financial statements. | 161 |
2008 Annual Report
September 30, 2008
Financial Highlights
Limited Duration Portfolio
| | Class P |
| | Year Ended | | Period from |
| | September 30, | | September 28, 2007^ to |
Selected Per Share Data and Ratios | | 2008 | | September 30, 2007 |
Net Asset Value, Beginning of Period | | $ | 10.24 | | $ | 10.24 | |
Income (Loss) from Investment Operations: | | | | | |
Net Investment Income† | | 0.47 | | 0.00 | ‡ |
Net Realized and Unrealized Loss on Investments | | (2.23 | ) | (0.00 | )‡ |
Total from Investment Operations | | (1.76 | ) | 0.00 | ‡ |
Distributions from and/or in Excess of: | | | | | |
Net Investment Income | | (0.48 | ) | — | |
Total Distributions | | (0.48 | ) | — | |
Redemption Fees | | — | | 0.00 | ‡ |
Net Asset Value, End of Period | | $ | 8.00 | | $ | 10.24 | |
Total Return++ | | (17.77 | )% | — | |
Ratios and Supplemental Data: | | | | | |
Net Assets, End of Period (Thousands) | | $ | 294 | | $ | 1,020 | |
Ratio of Expenses to Average Net Assets | | 0.68 | %+ | 0.59 | %*+ |
Ratio of Net Investment Income to Average Net Assets | | 4.95 | %+ | 5.38 | %*+ |
Portfolio Turnover Rate | | 20 | % | 56 | %# |
| | | | | | | | |
^ Commencement of Operations
† Per share amount is based on average shares outstanding.
‡ Amount is less than $0.005 per share.
++ Calculated based on the net asset value as of the last business day of the period.
# Not Annualized
+ Reflects rebate of certain Portfolio expenses in connection with the investments in Morgan Stanley Institutional Liquidity Money Market Portfolio — Institutional Class during the period. As a result of such rebate, the expenses as a percentage of its net assets were effected by approximately 0.01% and 0.06% for the year ended September 30, 2008 and for the period ended September 30, 2007, respectively.
* Annualized
162 | The accompanying notes are an integral part of the financial statements. |
| 2008 Annual Report |
| |
| September 30, 2008 |
Financial Highlights
Long Duration Fixed Income Portfolio
| | Class I |
| | | | | | Period from |
| | Year Ended September 30, | | | July 21, 2006^ to |
Selected Per Share Data and Ratios | | 2008 | | | 2007 | | | September 30, 2006 |
Net Asset Value, Beginning of Period | | $ 10.33 | | | $ 10.48 | | | $ 10.00 | |
Income (Loss) from Investment Operations: | | | | | | | | | |
Net Investment Income† | | 0.46 | | | 0.49 | | | 0.09 | |
Net Realized and Unrealized Gain (Loss) on Investments | | (0.37 | ) | | (0.18 | ) | | 0.39 | |
Total from Investment Operations | | 0.09 | | | 0.31 | | | 0.48 | |
Distributions from and/or in Excess of: | | | | | | | | | |
Net Investment Income | | (0.49 | ) | | (0.43 | ) | | — | |
Net Realized Gain | | — | | | (0.03 | ) | | — | |
Total Distributions | | (0.49 | ) | | (0.46 | ) | | — | |
Net Asset Value, End of Period | | $ 9.93 | | | $ 10.33 | | | $ 10.48 | |
Total Return++ | | 0.87 | % | | 3.06 | % | | 4.80 | %# |
Ratios and Supplemental Data: | | | | | | | | | |
Net Assets, End of Period (Thousands) | | $27,438 | | | $25,297 | | | $25,677 | |
Ratio of Expenses to Average Net Assets (1) | | 0.49 | %+ | | 0.50 | %+ | | 0.50 | %* |
Ratio of Net Investment Income to Average Net Assets (1) | | 4.44 | %+ | | 4.73 | %+ | | 4.66 | %* |
Portfolio Turnover Rate | | 63 | % | | 49 | % | | 7 | %# |
(1) Supplemental Information on the Ratios to Average Net Assets: | | | | | | | | | |
Ratios Before Expense Limitation: | | | | | | | | | |
Expenses to Average Net Assets | | 0.75 | %+ | | 0.94 | %+ | | 1.52 | %* |
Net Investment Income to Average Net Assets | | 4.18 | %+ | | 4.29 | %+ | | 3.64 | %* |
| | |
| | Class P |
| | | | | | Period from |
| | Year Ended September 30, | | | July 21, 2006^ to |
Selected Per Share Data and Ratios | | 2008 | | | 2007 | | | September 30, 2006 |
Net Asset Value, Beginning of Period | | $ 10.32 | | | $ 10.48 | | | $ 10.00 | |
Income (Loss) from Investment Operations: | | | | | | | | | |
Net Investment Income† | | 0.44 | | | 0.46 | | | 0.09 | |
Net Realized and Unrealized Gain (Loss) on Investments | | (0.37 | ) | | (0.19 | ) | | 0.39 | |
Total from Investment Operations | | 0.07 | | | 0.27 | | | 0.48 | |
Distributions from and/or in Excess of: | | | | | | | | | |
Net Investment Income | | (0.47 | ) | | (0.40 | ) | | — | |
Net Realized Gain | | — | | | (0.03 | ) | | — | |
Total Distributions | | (0.47 | ) | | (0.43 | ) | | — | |
Net Asset Value, End of Period | | $ 9.92 | | | $ 10.32 | | | $ 10.48 | |
Total Return++ | | 0.61 | % | | 2.72 | % | | 4.80 | %# |
Ratios and Supplemental Data: | | | | | | | | | |
Net Assets, End of Period (Thousands) | | $ 496 | | | $ 516 | | | $ 524 | |
Ratio of Expenses to Average Net Assets (1) | | 0.74 | %+ | | 0.75 | %+ | | 0.75 | %* |
Ratio of Net Investment Income to Average Net Assets (1) | | 4.18 | %+ | | 4.48 | %+ | | 4.40 | %* |
Portfolio Turnover Rate | | 63 | % | | 49 | % | | 7 | %# |
(1) Supplemental Information on the Ratios to Average Net Assets: | | | | | | | | | |
Ratios Before Expense Limitation: | | | | | | | | | |
Expenses to Average Net Assets | | 1.00 | %+ | | 1.19 | %+ | | 1.77 | %* |
Net Investment Income to Average Net Assets | | 3.92 | %+ | | 4.04 | %+ | | 3.39 | %* |
^ | Commencement of Operations |
† | Per share amount is based on average shares outstanding. |
++ | Calculated based on the net asset value as of the last business day of the period. |
# | Not Annualized |
+ | Reflects rebate of certain Portfolio expenses in connection with the investments in Morgan Stanley Institutional Liquidity Money Market Portfolio — Institutional Class during the period. As a result of such rebate, the expenses as a percentage of its net assets were effected by approximately 0.01% and less than 0.005% for the years ended September 30, 2008 and September 30, 2007, respectively. |
* | Annualized |
| | | | | | | | | | |
The accompanying notes are an integral part of the financial statements. | 163 |
2008 Annual Report | |
| |
September 30, 2008 | |
Financial Highlights
Municipal Portfolio
| | Class I | |
| | Year Ended September 30, | |
Selected Per Share Data and Ratios | | 2008 | | 2007 | | 2006 | | 2005 | | 2004 | |
Net Asset Value, Beginning of Period | | $ 12.82 | | $ 12.86 | | $ 12.66 | | $ 12.66 | | $ 12.53 | |
Income (Loss) from Investment Operations: | | | | | | | | | | | |
Net Investment Income† | | 0.60 | | 0.49 | | 0.39 | | 0.40 | | 0.38 | |
Net Realized and Unrealized Gain (Loss) on Investments | | (1.24 | ) | (0.01 | ) | 0.29 | | 0.02 | | 0.14 | |
Total from Investment Operations | | (0.64 | ) | 0.48 | | 0.68 | | 0.42 | | 0.52 | |
Distributions from and/or in Excess of: | | | | | | | | | | | |
Net Investment Income | | (0.55 | ) | (0.52 | ) | (0.48 | ) | (0.42 | ) | (0.39 | ) |
Net Realized Gain | | (0.05 | ) | — | | — | | — | | — | |
Total Distributions | | (0.60 | ) | (0.52 | ) | (0.48 | ) | (0.42 | ) | (0.39 | ) |
Redemption Fees | | 0.00 | ‡ | 0.00 | ‡ | 0.00 | ‡ | — | | — | |
Net Asset Value, End of Period | | $ 11.58 | | $ 12.82 | | $ 12.86 | | $ 12.66 | | $ 12.66 | |
Total Return++ | | (5.24 | )% | 3.76 | % | 5.53 | % | 3.38 | % | 4.02 | % |
Ratios and Supplemental Data: | | | | | | | | | | | |
Net Assets, End of Period (Thousands) | | $1,073,173 | | $936,633 | | $662,162 | | $509,039 | | $368,686 | |
Ratio of Expenses to Average Net Assets (1) | | 0.49 | %+ | 0.50 | %+ | 0.49 | % | 0.50 | % | 0.50 | % |
Ratio of Net Investment Income to Average Net Assets (1) | | 4.80 | %+ | 3.80 | %+ | 3.09 | % | 3.12 | % | 3.01 | % |
Portfolio Turnover Rate | | 43 | % | 29 | % | 43 | % | 34 | % | 105 | % |
(1) Supplemental Information on the Ratios to Average Net Assets: | | | | | | | | | | | |
Ratios Before Expense Limitation: | | | | | | | | | | | |
Expenses to Average Net Assets | | 0.50 | %+ | N/A | | N/A | | N/A | | 0.51 | % |
Net Investment Income to Average Net Assets | | 4.79 | %+ | N/A | | N/A | | N/A | | 3.00 | % |
† | Per share amount is based on average shares outstanding. |
‡ | Amount is less than $0.005 per share. |
++ | Calculated based on the net asset value as of the last business day of the period. |
# | Not Annualized |
+ | Reflects rebate of certain Portfolio expenses in connection with the investments in Morgan Stanley Institutional Liquidity Tax-Exempt Portfolio — Institutional Class during the period. As a result of such rebate, the expenses as a percentage of its net assets were effected by approximately 0.01% and less than 0.005% for the years ended September 30, 2008 and September 30, 2007, respectively. |
| | | | | | | | | | | | |
164 | The accompanying notes are an integral part of the financial statements. |
| 2008 Annual Report |
| |
| September 30, 2008 |
Financial Highlights
Municipal Portfolio
| | Class P |
| | Year Ended | | Period from |
| | September 30, | | June 20, 2007^ to |
Selected Per Share Data and Ratios | | 2008 | | September 30, 2007 |
Net Asset Value, Beginning of Period | | $ 12.82 | | | $12.69 | |
Income (Loss) from Investment Operations: | | | | | | |
Net Investment Income† | | 0.57 | | | 0.24 | |
Net Realized and Unrealized Gain (Loss) on Investments | | (1.24 | ) | | 0.02 | |
Total from Investment Operations | | (0.67 | ) | | 0.26 | |
Distributions from and/or in Excess of: | | | | | | |
Net Investment Income | | (0.52 | ) | | (0.13 | ) |
Net Realized Gain | | (0.05 | ) | | — | |
Total Distributions | | (0.57 | ) | | (0.13 | ) |
Redemption Fees | | — | | | 0.00 | ‡ |
Net Asset Value, End of Period | | $ 11.58 | | | $12.82 | |
Total Return++ | | (5.44 | )% | | 2.02 | %# |
Ratios and Supplemental Data: | | | | | | |
Net Assets, End of Period (Thousands) | | $51,780 | | | $9,945 | |
Ratio of Expenses to Average Net Assets (1) | | 0.74 | %+ | | 0.73 | %*+ |
Ratio of Net Investment Income to Average Net Assets (1) | | 4.58 | %+ | | 6.66 | %*+ |
Portfolio Turnover Rate | | 43 | % | | 29 | %# |
(1) Supplemental Information on the Ratios to Average Net Assets: | | | | | | |
Ratios Before Expense Limitation: | | | | | | |
Expenses to Average Net Assets | | 0.76 | %+ | | 0.99 | %*+ |
Net Investment Income to Average Net Assets | | 4.56 | %+ | | 6.41 | %*+ |
^ | Commencement of Operations |
† | Per share amount is based on average shares outstanding. |
‡ | Amount is less than $0.005 per share. |
++ | Calculated based on the net asset value as of the last business day of the period. |
# | Not Annualized |
+ | Reflects rebate of certain Portfolio expenses in connection with the investments in Morgan Stanley Institutional Liquidity Tax-Exempt Portfolio — Institutional Class during the period. As a result of such rebate, the expenses as a percentage of its net assets were effected by approximately 0.01% and 0.02% for the year ended September 30, 2008 and for the period ended September 30, 2007, respectively. |
* | Annualized |
| | | | | | | |
The accompanying notes are an integral part of the financial statements. | 165 |
2008 Annual Report | |
| |
September 30, 2008 | |
Financial Highlights
Municipal Portfolio
| | Class H |
| | Period from |
| | January 2, 2008^ |
Selected Per Share Data and Ratios | | to September 30, 2008 |
Net Asset Value, Beginning of Period | | $ 12.70 | |
Income (Loss) from Investment Operations: | | | |
Net Investment Income† | | 0.42 | |
Net Realized and Unrealized Loss on Investments | | (1.20 | ) |
Total from Investment Operations | | (0.78 | ) |
Distributions from and/or in Excess of: | | | |
Net Investment Income | | (0.34 | ) |
Total Distributions | | (0.34 | ) |
Redemption Fees | | 0.00 | ‡ |
Net Asset Value, End of Period | | $ 11.58 | |
Total Return++ | | (6.31 | )%# |
Ratios and Supplemental Data: | | | |
Net Assets, End of Period (Thousands) | | $ 8,593 | |
Ratio of Expenses to Average Net Assets (1) | | 0.80 | %*+ |
Ratio of Net Investment Income to Average Net Assets (1) | | 4.56 | %*+ |
Portfolio Turnover Rate | | 43 | %# |
(1) Supplemental Information on the Ratios to Average Net Assets: | | | |
Ratios Before Expense Limitation: | | | |
Expenses to Average Net Assets | | 0.79 | %*+ |
Net Investment Income to Average Net Assets | | 4.55 | %*+ |
| | Class L |
| | Period from |
| | June 16, 2008^ |
Selected Per Share Data and Ratios | | to September 30, 2008 |
Net Asset Value, Beginning of Period | | $ 12.45 | |
Income (Loss) from Investment Operations: | | | |
Net Investment Income† | | 0.13 | |
Net Realized and Unrealized Loss on Investments | | (0.91 | ) |
Total from Investment Operations | | (0.78 | ) |
Distributions from and/or in Excess of: | | | |
Net Investment Income | | (0.12 | ) |
Total Distributions | | (0.12 | ) |
Redemption Fees | | 0.00 | ‡ |
Net Asset Value, End of Period | | $ 11.55 | |
Total Return++ | | (6.33 | )%# |
Ratios and Supplemental Data: | | | |
Net Assets, End of Period (Thousands) | | $17,517 | |
Ratio of Expenses to Average Net Assets (1) | | 0.97 | %*+ |
Ratio of Net Investment Income to Average Net Assets (1) | | 3.92 | %*+ |
Portfolio Turnover Rate | | 43 | %# |
(1) Supplemental Information on the Ratios to Average Net Assets: | | | |
Ratios Before Expense Limitation: | | | |
Expenses to Average Net Assets | | 0.98 | %*+ |
Net Investment Income to Average Net Assets | | 3.91 | %*+ |
^ | Commencement of Operations |
† | Per share amount is based on average shares outstanding. |
‡ | Amount is less than $0.005 per share. |
++ | Calculated based on the net asset value which does not reflect sales charges, if applicable, as of the last business day of the period. |
# | Not Annualized |
* | Annualized |
+ | Reflects rebate of certain Portfolio expenses in connection with the investments in Morgan Stanley Institutional Liquidity Tax-Exempt Portfolio — Institutional Class during the period. As a result of such rebate, the expenses as a percentage of its net assets were effected by approximately 0.01%. |
| | | | |
166 | The accompanying notes are an integral part of the financial statements. |
| 2008 Annual Report |
| |
| September 30, 2008 |
Notes to Financial Statements
Morgan Stanley Institutional Fund Trust (“MSIFT” or the “Fund”) is registered under the Investment Company Act of 1940, as amended (the “1940 Act”), as an open-end management investment company. The Fund is comprised of eighteen active portfolios. The accompanying financial statements and financial highlights are those of the Balanced, Mid Cap Growth, U.S. Mid Cap Value, U.S. Small Cap Value, Value, Core Fixed Income, Core Plus Fixed Income, High Yield, Intermediate Duration, International Fixed Income, Investment Grade Fixed Income, Limited Duration, Long Duration Fixed Income and Municipal Portfolios, all of which except the International Fixed Income Portfolio are considered diversified for purposes of the 1940 Act (each referred to as a “Portfolio”). The financial statements of the remaining portfolios of the Fund are presented separately.
The Fund offers up to five different classes of shares for certain Portfolios — Class I shares, Investment Class shares, Class P shares, Class H shares and Class L shares. Effective January 2, 2008, Institutional Class shares and Adviser Class shares of the Portfolios were renamed Class I shares and Class P shares, respectively. Effective January 2, 2008, Class H shares commenced operations for the International Fixed Income, Investment Grade Fixed Income and Municipal Portfolios. Effective June 16, 2008, Class L shares commenced operations for the International Fixed Income, Investment Grade Fixed Income and Municipal Portfolio. Each class of shares has identical voting rights (except shareholders of each Class have exclusive voting rights regarding any matter relating solely to that particular Class of shares), dividend, liquidation and other rights, except each class bears different shareholder service fees as described in Note D.
A. Significant Accounting Policies. The following significant accounting policies are in conformity with U.S. generally accepted accounting principles. Such policies are consistently followed by the Fund in the preparation of the financial statements. U.S. generally accepted accounting principles may require management to make estimates and assumptions that affect the reported amounts and disclosures in the financial statements. Actual results may differ from those estimates.
1. Security Valuation: Bonds and other fixed income securities may be valued according to the broadest and most representative market. In addition, bonds and other fixed income securities may be valued on the basis of prices provided by a pricing service. The prices provided by a pricing service take into account broker dealer market price quotations for institutional size trading in similar groups of securities, security quality, maturity, coupon and other security characteristics as well as any developments related to the specific securities. Debt securities purchased with remaining maturities of 60 days or less are valued at amortized cost, if it approximates market value. Equity securities listed on a U.S. exchange are valued at the latest quoted sales price on the valuation date. Equity securities listed or traded on NASDAQ, for which market quotations are available, are valued at the NASDAQ Official Closing Price. Securities listed on a foreign exchange are valued at their closing price, except as noted below. Unlisted and listed equity securities not traded on the valuation date, for which market quotations are readily available, are valued at the mean between the current bid and asked prices obtained from reputable brokers.
All other securities and investments for which market values are not readily available, including restricted securities, and those securities for which it is inappropriate to determine prices in accordance with the aforementioned procedures, are valued at fair value as determined in good faith under procedures adopted by the Board of Trustees (the “Trustees”), although the actual calculations may be done by others. Factors considered in making this determination may include, but are not limited to, information obtained by contacting the issuer, analysts, or the appropriate stock exchange (for exchange-traded securities), analysis of the issuer’s financial statements or other available documents and, if necessary, available information concerning other securities in similar circumstances.
Most foreign markets close before the New York Stock Exchange (NYSE). Occasionally, developments that could affect the closing prices of securities and other assets may occur between the times at which valuations of such securities are determined (that is, close of the foreign market on which the securities trade) and the close of business on the NYSE. If these developments are expected to materially affect the value of the securities, the valuations may be adjusted to reflect the estimated fair value as of the close of the NYSE, as determined in good faith under procedures established by the Trustees.
2. Futures: Financial futures contracts (secured by cash and securities deposited with brokers as “initial margin”) are valued based upon their quoted daily settlement prices; changes in initial settlement value (represented by cash paid to or received from brokers as “variation margin”) are accounted for as unrealized appreciation (depreciation). When futures contracts are closed, the difference between the opening value at the date of purchase and the value at closing is recorded as realized gain (loss) in the Statements of Operations. “Due from (to) Broker” includes initial margin and variation margin, as stated in the Statements of Assets and Liabilities.
167
2008 Annual Report | |
| |
September 30, 2008 | |
Notes to Financial Statements (cont’d)
Futures contracts may be used by each Portfolio in order to hedge against unfavorable changes in the value of securities or to attempt to realize profits from the value of the related securities.
Futures contracts involve market risk that may exceed the amounts recognized in the Statements of Assets and Liabilities. Risks arise from the possible movements in the prices of securities relating to these instruments. The change in value of futures contracts primarily corresponds with the value of their related securities, but may not precisely correlate with the change in value of such securities. In addition, there is the risk that a Portfolio may not be able to enter into a closing transaction because of an illiquid secondary market.
3. Securities Sold Short: Each Portfolio may sell securities short. A short sale is a transaction in which the Portfolio sells securities it may or may not own, but has borrowed, in anticipation of a decline in the market price of the securities. The Portfolio is obligated to replace the borrowed securities at their market price at the time of replacement. The Portfolio may have to pay a premium to borrow the securities as well as pay any dividends or interest payable on the securities until they are replaced. The Portfolio’s obligation to replace the securities borrowed in connection with a short sale will generally be secured by collateral deposited with the broker that consists of cash, U.S. government securities or other liquid high grade debt obligations. In addition, the Portfolio will either place in a segregated account with its custodian or denote on its custody records an amount of cash, U.S. government securities or other liquid high grade debt obligations equal to the difference, if any, between (1) the market value of the securities sold at the time they were sold short and (2) any cash, U.S. government securities or other liquid high grade debt obligations deposited as collateral with the broker in connection with the short sale (not including the proceeds of the short sale). Short sales by the Portfolios involve certain risks and special considerations. Possible losses from short sales differ from losses that could be incurred from a purchase of a security because losses from short sales may be unlimited, whereas losses from purchases cannot exceed the total amount invested.
4. Swap Agreements: Each Portfolio (other than the Mid Cap Growth Portfolio) may enter into swap agreements to exchange the interest rate on, or return generated by, one nominal instrument for the return generated by another nominal instrument. Cash collateral for swap agreements, if applicable, is deposited with the broker serving as counterparty to the agreement, and is included in “Due from (to) Broker” on the Statements of Assets and Liabilities. The following summarizes swaps entered into by the Portfolios:
Credit Default Swaps: Credit default swaps involve commitments to pay a fixed rate in exchange for payment if a credit event affecting a third party (the referenced company) occurs. Credit events may include a failure to pay interest, bankruptcy, or restructuring. The Portfolio accrues for interim payments on swap contracts on a daily basis, with the net amount recorded within unrealized appreciation (depreciation) of swap contracts on the Statements of Assets and Liabilities. Once interim payments are settled in cash, the net amount is recorded within realized gain (loss) on swaps on the Statements of Operations. Credit default swaps are marked-to-market daily based upon quotations from market makers and the change, if any, is recorded as unrealized appreciation or depreciation in the Statements of Operations.
Interest Rate Swaps: Interest rate swaps involve the exchange of commitments to pay and receive interest based on a notional principal amount. The Portfolio accrues for interim payments on swap contracts on a daily basis, with the net amount recorded within unrealized appreciation (depreciation) of swap contracts on the Statements of Assets and Liabilities. Once interim payments are settled in cash, the net amount is recorded within realized gain (loss) on swaps on the Statements of Operations. In a zero-coupon interest rate swap, payments only occur at maturity, at which time one counterparty pays the total compounded fixed rate over the life of the swap and the other pays the total compounded floating rate that would have been earned had a series of LIBOR investments been rolled over through the life of the swap. The Portfolio amortizes its interest payment obligation over the life of the swap. The amortized portion of this payment is recorded within realized gain (loss) on the Statements of Operations. The unamortized portion of this payment is included in “Due from (to) Broker” on the Statements of Assets and Liabilities. Interest rate swaps are marked-to-market daily based upon quotations from market makers and the change, if any, is recorded as unrealized appreciation or depreciation in the Statements of Operations.
Total Return Swaps: Total return swaps involve commitments to pay interest in exchange for a market-linked return based on a notional amount. To the extent the total return of the security or index underlying the transaction exceeds or falls short of the offsetting interest rate obligation, the Portfolio will receive a payment from or make a payment to the counterparty, respectively. Total return swaps are marked-to-market daily based upon quotations from market makers and the change, if any, is
168
| 2008 Annual Report |
| |
| September 30, 2008 |
Notes to Financial Statements (cont’d)
recorded as unrealized appreciation or depreciation in the Statements of Operations. Periodic payments received or made at the end of each measurement period, but prior to termination, are recorded as realized gains (losses) in the Statements of Operations.
Realized gains (losses) on maturity or termination of swaps are presented in the Statements of Operations. Because there is no organized market for these swap agreements, the unrealized gain (loss) reported in the Statements of Assets and Liabilities may differ from that which would be realized in the event the Portfolio terminated its position in the agreement. Risks may arise upon entering into these agreements from the potential inability of the counterparties to meet the terms of the agreements and are generally limited to the amount of net interest payments to be received, if any, at the date of default. Risks also arise from potential losses from adverse market movements and such losses could exceed the related amounts shown in the Statements of Assets and Liabilities.
5. Structured Investments: Certain Portfolios may invest in structured investments whose values are linked either directly or inversely to changes in foreign currencies, interest rates, commodities, indices, equity securities or other underlying instruments. A Portfolio uses these securities to increase or decrease its exposure to different underlying instruments and to gain exposure to markets that might be difficult to invest in through conventional securities. Structured investments may be more volatile than their underlying instruments, but any loss is limited to the amount of the original investment.
6. Delayed Delivery Commitments: Each Portfolio may purchase or sell securities on a when-issued or forward commitment basis. Payment and delivery may take place a month or more after the date of the transaction. The price of the underlying securities and the date when the securities will be delivered and paid for are fixed at the time the transaction is negotiated. Liquid securities or cash is designated in an amount at least equal to these commitments. Securities held for this purpose cannot be sold while this strategy is outstanding, unless replaced with other assets. As a result, there is a possibility that as designated assets reach certain levels, a Portfolio may lose some flexibility in managing its investments, responding to shareholder redemption requests, or meeting other current obligations. Such transactions may give rise to a form of leverage. This can cause a Portfolio to be more volatile than if it had not been leveraged, as leverage tends to exaggerate the effect of any increase or decrease in the value of the Portfolio’s securities.
7. Foreign Currency Translation and Foreign Currency Exchange Contracts: The books and records of the Fund are maintained in U.S. dollars. Foreign currency amounts are translated into U.S. dollars at the bid prices of such currencies against U.S. dollars quoted by a bank. Net realized gains (losses) on foreign currency transactions represent net foreign exchange gains (losses) from foreign currency exchange contracts, disposition of foreign currencies, currency gains (losses) realized between the trade and settlement dates on securities transactions, and the difference between the amount of investment income and foreign withholding taxes recorded on a Portfolio’s books and the U.S. dollar equivalent of amounts actually received or paid.
A foreign currency exchange contract is an agreement between two parties to buy or sell currency at a set price on a future date. Each Portfolio (except the Core Fixed Income and Long Duration Fixed Income Portfolios) may enter into foreign currency exchange contracts to protect securities and related receivables and payables against future changes in foreign exchange rates and, in certain situations, to gain exposure to foreign currencies. Certain Portfolios may also enter into cross currency hedges which involve the sale of one currency against the positive exposure to a different currency. Cross currency hedges may be used for hedging purposes or to establish an active exposure to the exchange rate between any two currencies. Fluctuations in the value of such contracts are recorded as unrealized appreciation or depreciation; realized gains (losses), which are disclosed in the Statements of Operations, include net gains (losses) on contracts which have been terminated by settlements. Risks may arise upon entering into these contracts from the potential inability of counterparties to meet the terms of their contracts and are generally limited to the amount of unrealized gain on the contract, if any, at the date of default. Risks may also arise from unanticipated movements in the value of the foreign currency relative to the U.S. dollar.
Certain Portfolios’ net assets include foreign denominated securities and currency. The net assets of these Portfolios are presented at the foreign exchange rates and market values at the close of the period. The Portfolios do not isolate that portion of the results of operations arising as a result of changes in the foreign exchange rates from the fluctuations arising from changes in the market prices of the securities held at period end. Similarly, the Portfolios do not isolate the effect of changes in foreign exchange rates from the fluctuations arising from changes in the market prices of securities sold during the period. Accordingly, the components of realized and unrealized
169
2008 Annual Report | |
| |
September 30, 2008 | |
Notes to Financial Statements (cont’d)
foreign currency gains (losses) representing foreign exchange changes on investments is included in the reported net realized and unrealized gains (losses) on investment transactions and balances. Changes in currency exchange rates will affect the value of and investment income from such securities and currency.
Foreign security and currency transactions may involve certain considerations and risks not typically associated with those of U.S. dollar denominated transactions as a result of, among other factors, the possibly lower level of governmental supervision, relative currency valuation fluctuation, regulation of foreign securities markets and the possibility of political or economic instability.
8. Purchased and Written Options: Certain Portfolios may write covered call and put options on portfolio securities and other financial instruments. Premiums are received and are recorded as liabilities. The liabilities are subsequently adjusted to reflect the current value of the options written. Premiums received from writing options which expire are treated as realized gains. Premiums received from writing options which are exercised or are closed are added to or offset against the proceeds or amount paid on the transaction to determine the net realized gain (loss). By writing a covered call option, a Portfolio, in exchange for the premium, foregoes the opportunity for capital appreciation above the exercise price should the market price of the underlying security increase. By writing a put option, a Portfolio, in exchange for the premium, accepts the risk of having to purchase a security at an exercise price that is above the current market price.
Certain Portfolios may purchase call and put options on their portfolio securities or other financial instruments. Each Portfolio may purchase call options to protect against an increase in the price of the security or financial instrument it anticipates purchasing. Each Portfolio may purchase put options on securities which it holds or other financial instruments to protect against a decline in the value of the security or financial instrument or to close out covered written put positions. Risks may arise from an imperfect correlation between the change in market value of the securities held by the Portfolio and the prices of options relating to the securities purchased or sold by the Portfolio and from the possible lack of a liquid secondary market for an option. The maximum exposure to loss for any purchased option is limited to the premium initially paid for the option.
Options written for the year ended September 30, 2008 were as follows:
| | | | Total | |
| | Total | | Premiums | |
| | Number of | | Received | |
Portfolio | | Contracts | | (000) | |
Balanced | | | | | |
Options Outstanding — October 1, 2007 | | | — | | | $ | — | |
Options Written | | | 44 | | | 22 | |
Closing Purchase Transactions | | | (44 | ) | | (22 | ) |
Options Outstanding — September 30, 2008 | | | — | | | $ | — | |
Core Fixed Income | | | | | | | |
Options Outstanding — October 1, 2007 | | | — | | | $ | — | |
Options Written | | | 529 | | | 263 | |
Closing Purchase Transactions | | | (529 | ) | | (263 | ) |
Options Outstanding — September 30, 2008 | | | — | | | $ | — | |
Core Plus Fixed Income | | | | | | | |
Options Outstanding — October 1, 2007 | | | — | | | $ | — | |
Options Written | | | 4,408 | | | 2,204 | |
Closing Purchase Transactions | | | (4,408 | ) | | (2,204 | ) |
Options Outstanding — September 30, 2008 | | | — | | | $ | — | |
Intermediate Duration | | | | | | | |
Options Outstanding — October 1, 2007 | | | — | | | $ | — | |
Options Written | | | 279 | | | 139 | |
Closing Purchase Transactions | | | (279 | ) | | (139 | ) |
Options Outstanding — September 30, 2008 | | | — | | | $ | — | |
Investment Grade Fixed Income | | | | | | | |
Options Outstanding — October 1, 2007 | | | — | | | $ | — | |
Options Written | | | 842 | | | 419 | |
Closing Purchase Transactions | | | (842 | ) | | (419 | ) |
Options Outstanding — September 30, 2008 | | | — | | | $ | — | |
Limited Duration | | | | | | | |
Options Outstanding — October 1, 2007 | | | — | | | $ | — | |
Options Written | | | 814 | | | 407 | |
Closing Purchase Transactions | | | (814 | ) | | (407 | ) |
Options Outstanding — September 30, 2008 | | | — | | | $ | — | |
Long Duration Fixed Income | | | | | | | |
Options Outstanding — October 1, 2007 | | | — | | | $ | — | |
Options Written | | | 56 | | | 28 | |
Closing Purchase Transactions | | | (56 | ) | | (28 | ) |
Options Outstanding — September 30, 2008 | | | — | | | $ | — | |
9. | Redemption Fees: Shares of the Balanced, Mid Cap Growth, U.S. Mid Cap Value, Value, Core Fixed Income, Core Plus Fixed Income, Intermediate Duration, Investment Grade Fixed Income, Limited Duration, Long Duration Fixed Income and Municipal Portfolios redeemed within seven days (30 days with respect to the U.S. Small Cap Value, High Yield and International Fixed Income Portfolios) of purchase may be subject to a 2% redemption fee, payable to the Portfolio. The redemption fee is designed to protect each Portfolio and its shareholders from the effects of short-term trading. These fees, if any, are included on the Statements of Changes in Net Assets. |
170
| 2008 Annual Report |
| |
| September 30, 2008 |
Notes to Financial Statements (cont’d)
10. New Accounting Pronouncements: In September 2006, Statement of Financial Accounting Standards No. 157, Fair Value Measurements (“SFAS 157”), was issued and is effective for fiscal years beginning after November 15, 2007. SFAS 157 defines fair value, establishes a framework for measuring fair value and expands disclosures about fair value measurements. As of September 30, 2008, the Adviser does not believe the adoption of SFAS 157 will impact the amounts reported in the financial statements, however, additional disclosures will be required about the inputs used to develop the measurements of fair value and the effect of certain measurements reported in the Statements of Operations for a fiscal period.
On March 19, 2008, Financial Accounting Standards Board released Statement of Financial Accounting Standards No. 161, “Disclosures about Derivative Instruments and Hedging Activities” (“SFAS 161”). SFAS 161 requires qualitative disclosures about objectives and strategies for using derivatives, quantitative disclosures about fair value amounts of and gains and losses on derivative instruments, and disclosures about credit-risk-related contingent features in derivative agreements. The application of SFAS 161 is required for fiscal years and interim beginning after November 15, 2008. At this time, management is evaluating the implications of SFAS 161 and its impact on the financial statements has not yet been determined.
11. Other: Security transactions are accounted for on the date the securities are purchased or sold. Costs used in determining realized gains (losses) on the sale of investment securities are those of specific securities sold.
Discounts and premiums on securities purchased are accreted/amortized over their respective lives. Most expenses of the Fund can be directly attributed to a particular Portfolio. Expenses which cannot be directly attributed are apportioned among the Portfolios on the basis of their relative net assets. Income, expenses (other than class specific expenses) and realized and unrealized gains (losses) are allocated to each class of shares based upon their relative net assets.
B. Investment Advisory Fees. Morgan Stanley Investment Management Inc. (the “Adviser” or “MS Investment Management”), a wholly-owned subsidiary of Morgan Stanley, performs investment advisory services at a fee calculated by applying a quarterly rate based on the annual percentage rate listed below, to each Portfolio’s average daily net assets for the quarter.
| | Average Daily | | Advisory |
Portfolio | | Net Assets | | Fee |
Balanced | | | | 0.450 | % |
Mid Cap Growth | | | | 0.500 | |
U.S. Mid Cap Value | | first $1 billion | | 0.720 | |
| | over $1 billion | | 0.650 | |
U.S. Small Cap Value | | first $500 million | | 0.670 | |
| | next $500 million | | 0.645 | |
| | over $1 billion | | 0.620 | |
Value | | first $1 billion | | 0.500 | |
| | next $1 billion | | 0.450 | |
| | next $1 billion | | 0.400 | |
| | over $3 billion | | 0.350 | |
Core Fixed Income | | | | 0.375 | |
Core Plus Fixed Income | | first $1 billion | | 0.375 | |
| | over $1 billion | | 0.300 | |
High Yield | | first $500 million | | 0.420 | |
| | next $250 million | | 0.345 | |
| | next $250 million | | 0.295 | |
| | next $1 billion | | 0.270 | |
| | next $1 billion | | 0.245 | |
| | over $3 billion | | 0.220 | |
Intermediate Duration | | | | 0.375 | |
International Fixed Income | | | | 0.375 | |
Investment Grade Fixed Income | | | | 0.375 | |
Limited Duration | | | | 0.300 | |
Long Duration Fixed Income | | | | 0.375 | |
Municipal | | | | 0.375 | |
With respect to certain portfolios, the Adviser has voluntarily agreed to reduce the fees payable to it and, if necessary, reimburse the Portfolios for certain expenses, after giving effect to custody fee offsets, so that annual operating expenses will not exceed voluntary expense limitations established for each class of shares as presented in the table below.
| | Voluntary Expense Limitations |
| | | | Investment | | | |
| | Class I | Class | Class P | Class H | Class L |
Core Fixed Income | | 0.500 | % | 0.500 | % | 0.750 | % | — | % | — | % |
Long Duration Fixed Income | | 0.500 | | — | | 0.750 | | — | | — | |
Municipal | | 0.500 | | — | | 0.750 | | 0.750 | * | 1.000 | * |
* Excluding transfer agency fee.
Fee waivers and/or expense reimbursements are voluntary and may be commenced or terminated at any time. For the year ended September 30, 2008, the Portfolios had advisory fees waived and/or certain expenses reimbursed as follows:
| | Advisory Fees | |
| | Waived and/or | |
| | Reimbursed | |
Portfolio | | (000) | |
Core Fixed Income | | $115 | |
Long Duration Fixed Income | | 76 | |
Municipal | | 45 | |
Morgan Stanley Investment Management Limited (“MSIM Limited”) serves as Sub-Adviser to the International Fixed Income Portfolio. MSIM Limited is a wholly-owned subsidiary of Morgan Stanley. Under an Amended and Restated Sub-Advisory Agreement with the Adviser, MSIM Limited, subject to the control and supervision of the Fund, its officers, Trustees and the Adviser, and in accordance with the investment
171
2008 Annual Report | |
| |
September 30, 2008 | |
Notes to Financial Statements (cont’d)
objectives, policies and restrictions of the Portfolio, makes certain day-to-day investment decisions for the Portfolio and places certain of the Portfolio’s purchase and sales orders. The Adviser pays MSIM Limited on a monthly basis a portion of the net advisory fees the Adviser receives from the Portfolio.
C. Administration Fees. MS Investment Management (the “Administrator”) also provides the Fund with administration services pursuant to an administration agreement for an annual fee, accrued daily and paid monthly, of 0.08% of each Portfolio’s average daily net assets.
Under an agreement between the Administrator and JPMorgan Investor Services Co. (“JPMIS”), a corporate affiliate of JPMorgan Chase Bank, N.A., JPMIS provides certain administrative services to the Fund. For such services, the Administrator pays JPMIS a portion of the fee the Administrator receives from the Fund.
D. Distribution and Shareholder Servicing Fees. Morgan Stanley Distribution, Inc. (“MSDI” or the “Distributor”), a wholly-owned subsidiary of the Adviser, serves as the distributor for the Fund.
Pursuant to a Shareholder Service Plan, each Portfolio may pay the Distributor a shareholder servicing fee, accrued daily and paid monthly, at an annual rate of up to 0.15% of the Portfolio’s average daily net assets attributable to Investment Class shares. Pursuant to separate Shareholder Service Plans, each Portfolio may pay to the Distributor and other affiliated and unaffiliated broker-dealers, financial institutions and/or intermediaries a service fee, accrued daily and paid monthly, at an annual rate of up to 0.25% of the Portfolio’s average daily net assets attributable to Class P and Class H shares, respectively. The shareholder servicing fee is used to support the expenses associated with servicing and maintaining accounts. The Distributor has voluntarily agreed to waive 0.10% of the 0.25% shareholder servicing fee it is entitled to receive from the Class P shares’ average daily net assets for the Investment Grade Fixed Income Portfolio.
In addition, the Fund has adopted a Distribution and Shareholder Services Plan with respect to Class L shares pursuant to Rule 12b-1 under the 1940 Act. Under the Distribution and Shareholder Services Plan, each applicable Portfolio pays the Distributor a distribution fee, accrued daily and paid monthly, at an annual rate of 0.25% and a shareholder service fee, accrued daily and paid monthly, at an annual rate of 0.25% of the Portfolio’s average daily net assets attributable to Class L shares.
The distribution and shareholder servicing fees are used to support the expenses associated with servicing and maintaining accounts. The Distributor may compensate other parties for providing shareholder support services to investors who purchase Investment Class, Class P, Class H and Class L shares.
E. Dividend Disbursing and Transfer Agent. Effective June 9, 2008, the Fund’s dividend disbursing and transfer agent is Morgan Stanley Services Company Inc. (“Morgan Stanley Services”). Pursuant to a Transfer Agency Agreement, the Fund pays Morgan Stanley Services a fee generally based on the number of classes, accounts and transactions relating to the Portfolios of the Fund. Prior to June 9, 2008, JPMorgan Investor Services Company provided disbursing and transfer agency services for the Fund.
F. Custodian Fee. JPMorgan Chase Bank, N.A. (the “Custodian”) serves as Custodian for the Fund in accordance with a custodian agreement. The Custodian holds cash, securities, and other assets of the Fund as required by the 1940 Act.
The Fund has entered into an arrangement with its Custodian whereby credits realized on uninvested cash balances were used to offset a portion of each applicable Portfolio’s expenses. These custodian credits are shown as “Expense Offset” on the Statements of Operations.
G. Portfolio Investment Activity.
1. Security Transactions: For the year ended September 30, 2008, purchases and sales of investment securities other than long-term U.S. government securities and short-term investments were:
| | Purchases | | Sales | |
Portfolio | | (000) | | (000) | |
Balanced | | $ 313,637 | | $ 519,669 | |
Mid Cap Growth | | 2,058,722 | | 1,221,981 | |
U.S. Mid Cap Value | | 98,959 | | 104,236 | |
U.S. Small Cap Value | | 430,333 | | 436,922 | |
Value | | 41,838 | | 318,180 | |
Core Fixed Income | | 927,047 | | 995,806 | |
Core Plus Fixed Income | | 8,548,576 | | 9,069,178 | |
High Yield | | 37,961 | | 96,507 | |
Intermediate Duration | | 45,848 | | 62,466 | |
International Fixed Income | | 149,935 | | 176,829 | |
Investment Grade Fixed Income | | 1,576,087 | | 1,688,399 | |
Limited Duration | | 163,725 | | 471,303 | |
Long Duration Fixed Income | | 9,180 | | 3,094 | |
Municipal | | 712,537 | | 449,516 | |
For the year ended September 30, 2008, purchases and sales of long-term U.S. government securities were:
| | Purchases | | Sales | |
Portfolio | | (000) | | (000) | |
Balanced | | $ 6,281 | | $ 27,216 | |
Core Fixed Income | | 27,194 | | 48,645 | |
Core Plus Fixed Income | | 170,561 | | 388,107 | |
High Yield | | 2,228 | | 2,258 | |
Intermediate Duration | | 19,780 | | 19,070 | |
International Fixed Income | | 1,485 | | 1,499 | |
Investment Grade Fixed Income | | 38,203 | | 74,671 | |
Limited Duration | | 3,263 | | 11,759 | |
Long Duration Fixed Income | | 4,893 | | 11,805 | |
172
| 2008 Annual Report |
| |
| September 30, 2008 |
Notes to Financial Statements (cont’d)
2. Transactions with Affiliates: The Portfolios invest in the Institutional Class of portfolios within the Morgan Stanley Institutional Liquidity Funds (the “Liquidity Funds”), an open-end management investment company managed by the Adviser, both directly, and/or as a portion of the securities held as collateral on loaned securities. A summary of the Portfolio’s transactions in the shares of the Liquidity Funds during the year ended September 30, 2008 is set forth below:
| | Market Value | | Purchases | | Sales | | Dividend | | Market Value | |
| | September 30, 2007 | | at Cost | | Proceeds | | Income | | September 30, 2008 | |
Portfolio | | (000) | | (000) | | (000) | | (000) | | (000) | |
Balanced | | $ 48,557 | | $ 330,821 | | $ 346,180 | | $2,889 | | $33,198 | |
Mid Cap Growth | | 166,488 | | 1,189,782 | | 1,276,679 | | 3,150 | | 79,591 | |
U.S. Mid Cap Value | | 4,405 | | 84,419 | | 82,756 | | 203 | | 6,068 | |
U.S. Small Cap Value | | 47,310 | | 266,536 | | 275,600 | | 1,747 | | 38,246 | |
Value | | 10,961 | | 164,229 | | 165,380 | | 254 | | 9,810 | |
Core Fixed Income | | 32,976 | | 218,135 | | 234,946 | | 872 | | 16,165 | |
Core Plus Fixed Income | | 230,945 | | 1,564,707 | | 1,715,499 | | 4,744 | | 80,153 | |
High Yield | | 10,943 | | 127,316 | | 121,623 | | 240 | | 16,636 | |
Intermediate Duration | | 27,993 | | 93,239 | | 115,204 | | 825 | | 6,028 | |
International Fixed Income | | 5,845 | | 105,362 | | 103,709 | | 234 | | 7,498 | |
Investment Grade Fixed Income | | 31,654 | | 294,802 | | 294,829 | | 1,035 | | 31,627 | |
Limited Duration | | 65,597 | | 373,138 | | 423,272 | | 1,806 | | 15,462 | |
Long Duration Fixed Income | | 1,103 | | 28,890 | | 28,818 | | 133 | | 1,175 | |
Municipal | | 12,492 | | 714,677 | | 698,549 | | 1,267 | | 28,620 | |
Investment Advisory fees paid by the Portfolios are reduced by an amount equal to their pro-rata share of the advisory and administration fees paid by the Liquidity Funds (“Rebate”). For the year ended September 30, 2008, advisory fees paid were reduced as follows:
| | Rebate | |
Portfolio | | (000) | |
Balanced | | $142 | |
Mid Cap Growth | | 89 | |
U.S. Mid Cap Value | | 6 | |
U.S. Small Cap Value | | 52 | |
Value | | 8 | |
Core Fixed Income | | 25 | |
Core Plus Fixed Income | | 134 | |
High Yield | | 4 | |
Intermediate Duration | | 23 | |
International Fixed Income | | 7 | |
Investment Grade Fixed Income | | 31 | |
Limited Duration | | 54 | |
Long Duration Fixed Income | | 4 | |
Municipal | | 64 | |
The Balanced Portfolio invests in Morgan Stanley Institutional Fund, Inc. Emerging Markets Portfolio — Class I, an open-end management investment company advised by an affiliate of the Adviser. The Morgan Stanley Institutional Fund, Inc. Emerging Market Portfolio — Class I was acquired at a cost of $1,751,467. During the year ended September 30, 2008, the Portfolio had purchased 394,114 shares and sold 335,480 shares of the investment for a realized loss of $3,413,791.
A summary of the Balanced Portfolio’s transactions in shares of the affiliated issuer during the year ended September 30, 2008 is as follows:
Market Value | | | | | | | | Market Value | |
September 30, | | Purchases | | Sales | | Dividend | | September 30, | |
2007 | | at Cost | | Proceeds | | Income | | 2008 | |
(000) | | (000) | | (000) | | (000) | | (000) | |
$ — | | $14,460 | | $9,294 | | $2,083 | | $1,182 | |
During the year ended September 30, 2008, the following Portfolios paid brokerage commissions to Morgan Stanley & Co., an affiliated broker/dealer:
| | Broker | |
| | Commissions | |
Portfolio | | (000) | |
Balanced | | $ 5 | |
Mid Cap Growth | | 141 | |
U.S. Mid Cap Value | | 17 | |
U.S. Small Cap Value | | 2 | |
Value | | 1 | |
H. Securities Lending. Certain Portfolios may lend securities to qualified financial institutions, such as broker-dealers, to earn additional income. Any increase or decrease in the fair value of the securities loaned that might occur and any interest earned or dividends declared on those securities during the term of the loan would remain in the Portfolio. Portfolios that lend securities receive cash or securities as collateral in an amount equal to or exceeding 100% of the current fair value of the loaned securities. The collateral is marked to market daily, by the securities lending agent, to ensure that a minimum of 100% collateral coverage is maintained.
173
2008 Annual Report | |
| |
September 30, 2008 | |
Notes to Financial Statements (cont’d)
Based on pre-established guidelines, the securities lending agent invests any cash collateral that is received in an affiliated money market portfolio and high-quality short-term investments. Securities lending income is generated from the earnings on the invested collateral and borrowing fees, less any rebates owed to the borrowers and compensation to the lending agent, and is included in the Portfolios’ Statements of Operations in affiliated dividend income and interest income. Risks in securities lending transactions are that a borrower may not provide additional collateral when required or return the securities when due, and that the value of the short-term investments will be less than the amount of cash collateral plus any rebate that is required to be returned to the borrower.
The value of loaned securities and related collateral outstanding at September 30, 2008 are as follows:
| | Value of | | | |
| | Loaned | | Value of | |
| | Securities | | Collateral | |
Portfolio | | (000) | | (000) | |
Value | | $ 7,754 | | $ 8,809 | |
Core Fixed Income | | 10,265 | | 10,444 | |
Core Plus Fixed Income | | 119,803 | | 122,532 | |
High Yield | | 15,129 | | 15,685 | |
Investment Grade Fixed Income | | 23,030 | | 23,902 | |
The following Portfolios had income from securities lending (after rebates to borrowers and fee paid to securities lending agent):
| | Net Interest | |
| | Earned by | |
| | Portfolio | |
Portfolio | | (000) | |
Balanced | | $ 29 | |
Value | | 70 | |
Core Fixed Income | | 111 | |
Core Plus Fixed Income | | 499 | |
High Yield | | 186 | |
Investment Grade Fixed Income | | 98 | |
I. Federal Income Taxes. It is each Portfolio’s intention to qualify as a regulated investment company and distribute all of its taxable and tax-exempt income. Accordingly, no provision for Federal income taxes is required in the financial statements.
Dividend income and distributions to shareholders are recorded on the ex-dividend date. Interest income is recognized on the accrual basis. Dividends from net investment income, if any, are declared and paid quarterly except for those of the Intermediate Duration, Limited Duration and Municipal Portfolios which are declared and paid monthly and those of the Mid Cap Growth, U.S. Mid Cap Value and U.S. Small Cap Value Portfolios which are declared and paid annually. Net realized capital gains, if any, are distributed at least annually.
A Portfolio may be subject to taxes imposed by countries in which it invests. Such taxes are generally based on income and/or capital gains earned or repatriated. Taxes are accrued based on net investment income, net realized gains and net unrealized appreciation as income and/or capital gains are earned. Taxes may also be based on the movement of foreign currency and are accrued based on the value of investments denominated in such currency.
The Portfolios adopted the provisions of the FASB Interpretation number 48 Accounting for Uncertainty in Income Taxes (the “Interpretation”), on March 31, 2008.
For the year ended September 30, 2008, the Portfolios did not have any liabilities for any unrecognized tax benefits. The Portfolios recognize interest and penalties, if any, related to unrecognized tax benefits as income tax expense in the Statement of Operations. During the year, the Portfolios did not incur any interest or penalties.
Each of the tax years in the four year period ended September 30, 2008, remains subject to examination by the Internal Revenue Service and state taxing authorities. The adoption of FIN 48 had no impact on the operations of the Portfolios for the year ended September 30, 2008.
The tax character of the Municipal Portfolio’s ordinary income distributions include tax exempt as well as taxable components. The undistributed ordinary income for the Municipal Portfolio includes tax exempt as well as taxable components.
The tax character for distributions paid may differ from the character of distributions shown on the Statements of Changes in Net Assets due to short-term capital gains being treated as ordinary income for tax purposes. The tax character of distributions paid during fiscal 2008 and 2007 were as follows:
| | 2008
Distributions
Paid From: | | 2007
Distributions
Paid From: | |
| | Ordinary
Income | | Tax-
Exempt
Income | | Long-term
Capital
Gain | | Ordinary
Income | | Tax-
Exempt
Income | | Long-term
Capital
Gain | |
Portfolio | | (000) | | (000) | | (000) | | (000) | | (000) | | (000) | |
Balanced | | $ 8,828 | | $ — | | $ — | | $ 5,905 | | $ — | | $ — | |
Mid Cap Growth | | 13,214 | | — | | — | | 6,935 | | — | | — | |
U.S. Mid Cap Value | | 1,225 | | — | | — | | 992 | | — | | — | |
U.S. Small Cap Value | | 33,262 | | — | | 67,755 | | 19,628 | | — | | 63,579 | |
Value | | 11,180 | | — | | 27,523 | | 16,197 | | — | | 49,107 | |
Core Fixed Income | | 14,699 | | — | | — | | 15,255 | | — | | — | |
Core Plus Fixed Income | | 121,587 | | — | | — | | 148,778 | | — | | — | |
High Yield | | 14,323 | | — | | — | | 16,628 | | — | | — | |
Intermediate Duration | | 7,367 | | — | | — | | 7,079 | | — | | — | |
International Fixed Income | | 15,749 | | — | | 14 | | 5,213 | | — | | — | |
Investment Grade Fixed Income | | 22,876 | | — | | — | | 27,744 | | — | | — | |
Limited Duration | | 47,931 | | — | | — | | 54,837 | | — | | — | |
Long Duration Fixed Income | | 1,297 | | — | | — | | 1,102 | | — | | 48 | |
Municipal | | 14,461 | | 35,112 | | 1,418 | | 25,018 | | 6,515 | | — | |
174
| 2008 Annual Report |
| |
| September 30, 2008 |
Notes to Financial Statements (cont’d)
The amount and character of income and gains to be distributed are determined in accordance with income tax regulations which may differ from U.S. generally accepted accounting principles. The book/tax differences are either considered temporary or permanent in nature.
Temporary differences are generally due to differing book and tax treatments in the timing of the recognition of gains (losses) on securities, options, swaps, forwards and futures, including Post October losses.
Permanent differences, primarily due to differing treatments of gains (losses) related to REIT adjustments, foreign currency transactions, foreign futures transactions, basis adjustments for swap transactions, as of adjustment for current year interest only/hybrid overaccrual, paydown adjustments, capital gains dividends reclass, basis adjustments for bifurcation and in-kind redemptions in the following reclassifications among the Portfolios’ components of net assets at September 30, 2008:
| | Accumulated | | | | | |
| | Undistributed | | | | | |
| | (Distribution in | | | | | |
| | Excess of) Net | | Accumulated | | | |
| | Investment | | Net Realized | | Paid-in | |
| | Income (Loss) | | Gain (Loss) | | Capital | |
Portfolio | | (000) | | (000) | | (000) | |
Balanced | | $ 1,347 | | $ (1,188 | ) | $ (159 | ) |
Mid Cap Growth | | 1,933 | | 633 | | (2,566 | ) |
U.S. Mid Cap Value | | — | | — | | — | |
U.S. Small Cap Value | | (34 | ) | 16 | | 18 | |
Value | | (11 | ) | 120 | | (109 | ) |
Core Fixed Income | | 1,496 | | (113 | ) | (1,383 | ) |
Core Plus Fixed Income | | 11,143 | | (2,068 | ) | (9,075 | ) |
High Yield | | (897 | ) | 16,427 | | (15,530 | ) |
Intermediate Duration | | 708 | | (332 | ) | (376 | ) |
International Fixed Income | | 11,653 | | (11,653 | ) | — | |
Investment Grade Fixed Income | | 2,026 | | 194 | | (2,220 | ) |
Limited Duration | | 4,551 | | 112 | | (4,663 | ) |
Long Duration Fixed Income | | 230 | | (111 | ) | (119 | ) |
Municipal | | 129 | | (128 | ) | (1 | ) |
At September 30, 2008, the components of distributable earnings on a tax basis were as follows:
| | Undistributed | | Tax- | | Undistributed | |
| | Ordinary | | Exempt | | Long-term | |
| | Income | | Income | | Capital Gain | |
Portfolio | | (000) | | (000) | | (000) | |
Balanced | | $ 2,475 | | $ — | | $ — | |
Mid Cap Growth | | — | | — | | — | |
U.S. Mid Cap Value | | 1,033 | | — | | — | |
U.S. Small Cap Value | | 6,483 | | — | | 20,446 | |
Value | | 1,759 | | — | | — | |
Core Fixed Income | | 4,776 | | — | | — | |
Core Plus Fixed Income | | 40,760 | | — | | — | |
High Yield | | 2,786 | | — | | — | |
Intermediate Duration | | 468 | | — | | — | |
International Fixed Income | | 6,114 | | — | | — | |
Investment Grade Fixed Income | | 7,837 | | — | | — | |
Limited Duration | | 8,577 | | — | | — | |
Long Duration Fixed Income | | 570 | | — | | — | |
Municipal | | 1,188 | | 6,498 | | — | |
At September 30, 2008, cost, unrealized appreciation, unrealized depreciation, and net unrealized appreciation (depreciation) for U.S. Federal income tax purposes of the investments of each of the Portfolios were:
| | | | | | | | Net | |
| | | | | | | | Appreciation | |
| | Cost | | Appreciation | | Depreciation | | (Depreciation) | |
Portfolio | | (000) | | (000) | | (000) | | (000) | |
Balanced | | $ 87,278 | | $ 1,306 | | $ (12,819 | ) | $ (11,513 | ) |
Mid Cap Growth | | 3,281,693 | | 302,726 | | (756,329 | ) | (453,603 | ) |
U.S. Mid Cap Value | | 150,730 | | 3,524 | | (21,953 | ) | (18,429 | ) |
U.S. Small Cap Value | | 751,672 | | 74,291 | | (98,547 | ) | (24,256 | ) |
Value | | 206,437 | | 13,970 | | (29,687 | ) | (15,717 | ) |
Core Fixed Income | | 267,553 | | 1,250 | | (21,116 | ) | (19,866 | ) |
Core Plus Fixed Income | | 2,081,091 | | 12,868 | | (293,545 | ) | (280,677 | ) |
High Yield | | 173,876 | | 260 | | (51,852 | ) | (51,592 | ) |
Intermediate Duration | | 146,490 | | 585 | | (11,053 | ) | (10,468 | ) |
International Fixed Income | | 183,480 | | 7,300 | | (5,870 | ) | 1,430 | |
Investment Grade Fixed Income | | 457,078 | | 2,214 | | (29,614 | ) | (27,400 | ) |
Limited Duration | | 682,388 | | 1,120 | | (116,006 | ) | (114,886 | ) |
Long Duration Fixed Income | | 29,112 | | 715 | | (2,058 | ) | (1,343 | ) |
Municipal | | 1,244,456 | | 8,597 | | (102,928 | ) | (94,331 | ) |
At September 30, 2008, the following Portfolios had available for Federal income tax purposes unused capital losses, which will expire on the indicated dates:
| | Expiration Date September 30, (000) | |
Portfolio | | 2009 | | 2010 | | 2011 | | 2012 | |
Balanced | | $ — | | $ — | | $ 4,612 | | $ — | |
Mid Cap Growth | | — | | 128,863 | | 303,325 | | — | |
U.S. Mid Cap Value | | — | | — | | 135,789 | | — | |
Core Fixed Income | | — | | — | | — | | — | |
Core Plus Fixed Income | | — | | — | | 36,930 | | — | |
High Yield | | 30,657 | | 21,005 | | 183,778 | | 205,458 | |
Intermediate Duration | | — | | — | | — | | — | |
Investment Grade Fixed Income | | — | | — | | — | | — | |
Limited Duration | | — | | — | | — | | — | |
Long Duration Fixed Income | | — | | — | | — | | — | |
| | Expiration Date September 30, (000) | |
Portfolio | | 2013 | | 2014 | | 2015 | | 2016 | | Total | |
Balanced | | $ — | | $ — | | $ — | | $ — | | $ 4,612 | |
Mid Cap Growth | | — | | — | | — | | — | | 432,188 | |
U.S. Mid Cap Value | | — | | — | | — | | — | | 135,789 | |
Core Fixed Income | | — | | 489 | | — | | 1,081 | | 1,570 | |
Core Plus Fixed Income | | — | | 7,135 | | 15,680 | | 5,336 | | 65,081 | |
High Yield | | 11,840 | | 874 | | 737 | | — | | 454,349 | |
Intermediate Duration | | 673 | | 1,559 | | 5,324 | | 123 | | 7,679 | |
Investment Grade Fixed Income | | — | | 607 | | 12 | | 3,511 | | 4,130 | |
Limited Duration | | 8,253 | | 8,229 | | 7,068 | | 265 | | 23,815 | |
Long Duration Fixed Income | | — | | — | | — | | 58,260 | | 58,260 | |
In addition to the $454,349,000 in unused capital losses attributed to the High Yield Portfolio in the table above, approximately $50,506,000 has been brought forward as a result of the Portfolio’s merger with the MSIF Inc. High Yield II Portfolio. The utilization of the capital loss carryforward in subsequent years may be limited pursuant to sections 382 and 383 of the
175
2008 Annual Report | |
| |
September 30, 2008 | |
Notes to Financial Statements (cont’d)
Internal Revenue Code. This acquired capital loss carryforward is expected to expire between 2008-2015.
To the extent that capital loss carryforwards are used to offset any future capital gains realized during the carryforward period as provided by U.S. Federal income tax regulations, no capital gains tax liability will be incurred by a portfolio for gains realized and not distributed. To the extent that capital gains are offset, such gains will not be distributed to the shareholders.
During the year ended September 30, 2008, the following Portfolios utilized capital loss carryforwards for U.S. Federal income tax purposes of approximately:
| | Capital Loss | |
| | Carryforward | |
| | Utilized | |
Portfolio | | (000) | |
Balanced | | $16,887 | |
Mid Cap Growth | | 36,597 | |
U.S. Mid Cap Value | | 3,390 | |
Net capital and currency losses incurred after October 31, and within the taxable year are deemed to arise on the first day of the Portfolio’s next taxable year. For the year ended September 30, 2008, the Portfolio deferred to October 1, 2008 for U.S. Federal income tax purposes, post-October capital and currency losses as indicated:
| | Post-October | |
| | Capital | | Currency | |
| | Losses | | Losses | |
Portfolio | | (000) | | (000) | |
Mid Cap Growth | | $ 44,852 | | $ 498 | |
U.S. Mid Cap Value | | 7,390 | | — | |
Value | | 13,449 | | — | |
Core Fixed Income | | 30,572 | | — | |
Core Plus Fixed Income | | 235,273 | | — | |
High Yield | | 15,035 | | — | |
Intermediate Duration | | 11,356 | | — | |
International Fixed Income | | 97 | | — | |
Investment Grade Fixed Income | | 47,623 | | — | |
Limited Duration | | 110,221 | | — | |
Long Duration Fixed Income | | 24 | | — | |
Municipal | | 1,998 | | — | |
J. Contractual Obligations. The Fund enters into contracts that contain a variety of indemnifications. The Fund’s maximum exposure under these arrangements is unknown. However, the Fund has not had prior claims or losses pursuant to these contracts and expects the risk of loss to be remote.
K. Other (unaudited). The High Yield Portfolio’s net assets are substantially comprised of high yield fixed income securities. The financial condition of an issuer of these securities and general economic and industry specific conditions may affect an issuer’s ability to make payments of income and principal on these securities and ultimately impact their valuation.
A portion of the securities of the Municipal Portfolio are insured by certain companies specializing in the insurance of municipal debt obligations. At September 30, 2008, approximately 69.7% of the net assets of the Municipal Portfolio are covered by such insurance. Listed below are the insurers that insure obligations constituting more than 10% of the Portfolio’s net assets:
| | % of Portfolio’s | |
Insurers | | Net Assets | |
FSA | | 18.8 | % |
MBIA | | 12.5 | |
FGIC | | 12.1 | |
AMBAC | | 10.8 | |
At September 30, 2008, certain Portfolios had otherwise unaffiliated record owners of 10% or greater. Investment activities of these shareholders could have a material impact on these Portfolios.
These Portfolios and the aggregate percentage of such owners were as follows:
| | Percentage of Ownership | |
| | | | Investment | | | | | | | |
Portfolio | | Class I | | Class | | Class P | | Class H | | Class L | |
Balanced | | 55.1 | % | 98.6 | % | 77.2 | % | — | % | — | % |
Mid Cap Growth | | 32.9 | | — | | 63.7 | | — | | — | |
U.S. Mid Cap Value | | 52.7 | | 92.9 | | 68.2 | | — | | — | |
U.S. Small Cap Value | | 16.3 | | — | | 59.0 | | — | | — | |
Value | | 71.5 | | — | | 93.3 | | — | | — | |
Core Fixed Income | | — | | — | | — | | — | | — | |
Core Plus Fixed Income | | 37.8 | | 99.9 | | 92.4 | | — | | — | |
High Yield | | — | | — | | 68.2 | | — | | — | |
Intermediate Duration | | 89.5 | | 100.0 | | — | | — | | — | |
International Fixed Income | | 11.0 | | — | | — | | — | | — | |
Investment Grade Fixed Income | | 29.0 | | — | | — | | — | | — | |
Long Duration Fixed Income | | 11.3 | | — | | — | | — | | — | |
Municipal | | 36.9 | | — | | 18.5 | | — | | — | |
L. Reverse Stock Split. After the close of business on November 10, 2006, High Yield Portfolio effected a 1 for 2 reverse stock split for the shares of the Portfolio. All transactions in capital stock and per share data prior to November 13, 2006 have been restated to give effect to the reverse stock split. The reverse stock split had no impact on the overall value of a shareholder’s investment in the Portfolio.
M. Regulatory Settlement Proceeds. The Mid Cap Growth and Value Portfolios received approximately $137,000 and $109,000, respectively, from an unaffiliated third party in settlement of administrative proceedings involving findings by the SEC of market timing and/or late trading of mutual funds. The settlement is recorded as an increase to paid-in capital in the accompanying financial statements.
N. Subsequent Event. On October 20, 2008, the Board of Trustees approved the liquidation of the High Yield Portfolio. The High Yield Portfolio is expected to liquidate during the fourth quarter of 2008. The shares of the High Yield Portfolio are no longer being offered to new investors.
Subsequent to September 30, 2008, conditions in the worldwide debt and equity markets have deteriorated significantly. These conditions have had a negative effect on the market value of the Portfolios’ investments since September 30, 2008.
176
| 2008 Annual Report |
| |
| September 30, 2008 |
Report of Independent Registered Public Accounting Firm
To the Board of Trustees and Shareholders of
Morgan Stanley Institutional Fund Trust:
We have audited the accompanying statements of assets and liabilities of Balanced Portfolio, Mid Cap Growth Portfolio, U.S. Mid Cap Value Portfolio, U.S. Small Cap Value Portfolio, Value Portfolio, Core Fixed Income Portfolio, Core Plus Fixed Income Portfolio, High Yield Portfolio, Intermediate Duration Portfolio, International Fixed Income Portfolio, Investment Grade Fixed Income Portfolio, Limited Duration Portfolio, Long Duration Fixed Income Portfolio, and Municipal Portfolio (the “Funds”) (fourteen of the portfolios constituting Morgan Stanley Institutional Fund Trust), including the portfolios of investments, as of September 30, 2008, and the related statements of operations for the year then ended, the statements of changes in net assets for each of the two years in the period then ended, and the financial highlights for each of the periods indicated therein. These financial statements and financial highlights are the responsibility of the Funds’ management. Our responsibility is to express an opinion on these financial statements and financial highlights based on our audits.
We conducted our audits in accordance with the standards of the Public Company Accounting Oversight Board (United States). Those standards require that we plan and perform the audit to obtain reasonable assurance about whether the financial statements and financial highlights are free of material misstatement. We were not engaged to perform an audit of the Funds’ internal control over financial reporting. Our audits included consideration of internal control over financial reporting as a basis for designing audit procedures that are appropriate in the circumstances, but not for the purpose of expressing an opinion on the effectiveness of the Funds’ internal control over financial reporting. Accordingly, we express no such opinion. An audit also includes examining, on a test basis, evidence supporting the amounts and disclosures in the financial statements and financial highlights, assessing the accounting principles used and significant estimates made by management, and evaluating the overall financial statement presentation. Our procedures included confirmation of securities owned as of September 30, 2008, by correspondence with the custodian and brokers or by other appropriate auditing procedures where replies from brokers were not received. We believe that our audits provide a reasonable basis for our opinion.
In our opinion, the financial statements and financial highlights referred to above present fairly, in all material respects, the financial position of the aforementioned fourteen Funds of Morgan Stanley Institutional Fund Trust at September 30, 2008, the results of their operations for the year then ended, the changes in their net assets for each of the two years in the period then ended, and the financial highlights for each of the periods indicated therein, in conformity with U.S. generally accepted accounting principles.

Boston, Massachusetts
November 21, 2008
177
2008 Annual Report | |
| |
September 30, 2008 | |
Federal Income Tax Information: (unaudited)
For Federal income tax purposes, the following information is furnished with respect to the distributions paid by each applicable Portfolio during the taxable year ended September 30, 2008.
For corporate shareholders, the following percentages of dividends paid by each Portfolio qualified for the dividends received deduction. Additionally, the following percentages of each Portfolio’s dividends was attributable to qualifying U.S. Government obligations. (Please consult your tax advisor to determine if any portion of the dividends you received is exempt from state income tax.):
| | Div. Received | | Qualifying U.S. | |
Portfolio | | Deduction % | | Govt. Income % | |
Balanced | | 49.5 | % | 12.7 | % |
Mid Cap Growth | | 100.0 | | — | |
U.S. Mid Cap Value | | 100.0 | | — | |
U.S. Small Cap Value | | 18.9 | | — | |
Value | | 93.1 | | — | |
Core Fixed Income | | — | | 15.9 | |
Core Plus Fixed Income | | — | | 12.5 | |
High Yield | | — | | — | |
Intermediate Duration | | — | | 15.9 | |
Investment Grade Fixed Income | | — | | 13.8 | |
Limited Duration | | — | | 10.9 | |
Long Duration Fixed Income | | — | | 43.0 | |
Municipal | | 39.7 | | — | |
Each of the applicable Portfolios designated the following percentages of its income dividends as tax-exempt income dividends:
Portfolio | | Percentage | |
Municipal | | 73.9 | % |
Each of the applicable Portfolios designated and paid the following amounts as a long-term capital gain distribution:
| | Amount | |
Portfolio | | (000) | |
U.S. Small Cap Value | | $67,755 | |
Value | | 27,523 | |
International Fixed Income | | 14 | |
Municipal | | 1,417 | |
For Federal income tax purposes, the following information is furnished with respect to the earnings of each applicable Portfolio for the taxable year ended September 30, 2008.
When distributed, certain earnings may be subject to a maximum tax rate of 15% as provided for the Jobs and Growth Tax Relief Reconciliation Act of 2003. Each of the applicable Portfolios designated up to the following maximum amounts as taxable at this lower rate:
| | Amount | |
Portfolio | | (000) | |
Balanced | | $ 3,565 | |
Mid Cap Growth | | 13,214 | |
U.S. Mid Cap Value | | 1,225 | |
U.S. Small Cap Value | | 5,475 | |
Value | | 9,957 | |
Municipal | | 1,717 | |
In January, each applicable Portfolio provides tax information to shareholders for the preceding calendar year.
178
| 2008 Annual Report |
| |
| September 30, 2008 |
U.S. Privacy Policy (unaudited)
AN IMPORTANT NOTICE CONCERNING OUR U.S. PRIVACY POLICY
Morgan Stanley Institutional Fund Trust (collectively, the “Fund”) is required by federal law to provide you with a copy of their Privacy Policy (the “Policy”) annually.
This Policy applies to individual clients who are current and former advisory clients of certain Morgan Stanley Investment Management’s U.S. investment advisers and to current and former individual investors in the Fund. This Policy is not applicable to partnerships, corporations, trusts or other non-individual clients or account holders, nor is this Policy applicable to individuals who are either beneficiaries of a trust for which we serve as trustee or participants in an employee benefit plan administered or advised by us. This Policy is, however, applicable to individuals who select us to be a custodian of securities or assets in individual retirement accounts, 401(k) accounts, or accounts subject to the Uniform Gifts to Minors Act.
Please note that we may amend this Policy at any time, and will inform you of any changes to this Policy as required by law.
WE RESPECT YOUR PRIVACY
We appreciate that you have provided us with your personal financial information and understand your concerns about safeguarding such information. We strive to maintain the privacy of such information while we help you achieve your financial objectives.
This Policy describes what nonpublic personal information we collect about you, how we collect it, when we may share it with others, and how others may use it. It discusses the steps you may take to limit our sharing of information about you with affiliated Morgan Stanley companies (“other Morgan Stanley companies”), including but not limited to our global financial services affiliates that are part of our integrated securities and investment management business, and our credit services affiliates. It also discloses how you may limit our affiliates’ use of shared information for marketing purposes.
Throughout this Policy, we refer to the nonpublic information that personally identifies you or your accounts as “personal information.”
1. WHAT PERSONAL INFORMATION DO WE COLLECT ABOUT YOU?
To better serve you and manage our business, it is important that we collect and maintain accurate information about you. We obtain this information from applications and other forms you submit to us, from your dealings with us, from consumer reporting agencies and from third parties and other sources. For example:
· We collect information such as your name, address, e-mail address, phone number and account title.
· We may obtain information about account balances, your use of account(s) and the types of products and services you prefer to receive from us through your dealings and transactions with us and other sources.
· We may obtain information about your creditworthiness and credit history from consumer reporting agencies.
· We may collect background information from and through third-party vendors to verify representations you have made and to comply with various regulatory requirements.
2. WHEN DO WE DISCLOSE PERSONAL INFORMATION WE COLLECT ABOUT YOU?
To provide you with the products and services you request, to better serve you, to manage our business and as otherwise required or permitted by law, we may disclose personal information we collect about you to other Morgan Stanley companies and to nonaffiliated third parties.
a. Information we disclose to other Morgan Stanley companies:
In order to manage your account(s) effectively, including servicing and processing your transactions, to let you know about products and services offered by us and other Morgan Stanley companies, to manage our business, and as otherwise required or permitted by law, we may disclose personal information to other Morgan Stanley companies. Offers for products and services from other Morgan Stanley companies are developed under conditions designed to safeguard your personal information.
179
2008 Annual Report | |
| |
September 30, 2008 | |
U.S. Privacy Policy (cont’d)
b. Information we discloses to third parties:
We do not disclose personal information that we collect about you to nonaffiliated third parties except to enable them to provide marketing services on our behalf, to perform joint marketing agreements with other financial institutions, and as otherwise required or permitted by law. For example, some instances where we may disclose information about you to third parties include: for servicing and processing transactions, to offer our own products and services, to protect against fraud, for institutional risk control, to respond to judicial process or to perform services on our behalf.
Morgan Stanley recognizes that your relationship with your Financial Advisor is important. If your Financial Advisor’s affiliation with Morgan Stanley ends and he/she joins a nonaffiliated securities broker-dealer with which Morgan Stanley has entered into an agreement limiting the use of information, Morgan Stanley will permit your Financial Advisor to retain certain of your contact information, limited to your name, address, e-mail address, phone number and account title.
When we share personal information with a nonaffiliated third party, they are required to limit their use of personal information to the particular purpose for which it was shared and they are not allowed to share personal information with others except to fulfill that limited purpose.
3. HOW DO WE PROTECT THE SECURITY AND CONFIDENTIALITY OF PERSONAL INFORMATION WE COLLECT ABOUT YOU?
We maintain physical, electronic and procedural security measures to help safeguard the personal information we collect about you. We have internal policies governing the proper handling of client information. Third parties that provide support or marketing services on our behalf may also receive personal information, and we require them to adhere to confidentiality standards with respect to such information.
4. HOW CAN YOU LIMIT THE SHARING OF CERTAIN TYPES OF PERSONAL INFORMATION WITH OTHER MORGAN STANLEY COMPANIES?
We respect your privacy and offer you choices as to whether we share with other Morgan Stanley companies personal information that was collected to determine your eligibility for products and services you request (“eligibility information”). Please note that, even if you direct us not to share eligibility information with other Morgan Stanley companies (“opt-out”), we may still share personal information, including eligibility information, with those companies in circumstances excluded from the opt-out under applicable law, such as to process transactions or to service your account. We may also share certain other types of personal information with other Morgan Stanley companies—such as your name, address, telephone number, e-mail address and account number(s), and information about your transactions and experiences with us.
5. HOW CAN YOU LIMIT THE USE OF CERTAIN TYPES OF PERSONAL INFORMATION BY OTHER MORGAN STANLEY COMPANIES FOR MARKETING?
You may limit other Morgan Stanley companies from marketing their products or services to you based on your personal information that they receive from other Morgan Stanley companies. This information includes your income, assets and account history. Your choice to limit marketing offers from other Morgan Stanley companies will apply until you tell us to change your choice.
180
| 2008 Annual Report |
| |
| September 30, 2008 |
U.S. Privacy Policy (cont’d)
If you wish to opt-out of sharing and to limit marketing offers, you may do so by:
· Calling us at (800) 548-7786
Monday–Friday between 8 a.m. and 5 p.m. (ET)
· Writing to us at the following address:
Morgan Stanley Institutional Fund Trust
c/o Morgan Stanley Services Company, Inc.
PO Box 219804
Kansas City, MO 64121-9804
If you choose to write to us, your written request should include your name, address, telephone number and account number(s) to which the opt-out applies and should not be sent with any other correspondence. In order to process your request, we require that the request be provided by you directly and not through a third party.
If you have previously notified us about your privacy preferences, it is not necessary to do so again unless you decide to change your preferences. Your opt-out preference will remain in effect with respect to this Policy (as it may be amended) until you notify us otherwise in writing. If you have a joint account, your direction for us not to share this information with other Morgan Stanley companies and for those Morgan Stanley companies not to use your personal information for marketing will be applied to all account holders on that account.
Please understand that if you opt-out, you and any joint account holders may not receive information about Morgan Stanley products and services that could help you manage your financial resources and achieve your investment objectives.
If you hold more than one account with Morgan Stanley, you may receive multiple privacy policies from us, and would need to follow the directions stated in each particular policy for each account you have with us.
SPECIAL NOTICE TO RESIDENTS OF VERMONT
This section supplements our Policy with respect to our individual clients who have a Vermont address and supersedes anything to the contrary in the above Policy with respect to those clients only.
The State of Vermont requires financial institutions to obtain your consent prior to sharing personal information that they collect about you with affiliated companies and nonaffiliated third parties other than in certain limited circumstances. Except as permitted by law, we will not share personal information we collect about you with nonaffiliated third parties or other Morgan Stanley companies unless you provide us with your written consent to share such information (“opt-in”).
If you wish to receive offers for investment products and services offered by or through other Morgan Stanley companies, please notify us in writing at the following address:
Morgan Stanley Institutional Fund Trust
c/o Morgan Stanley Services Company, Inc.
PO Box 219804
Kansas City, MO 64121-9804
Your authorization should include your name, address, telephone number and account number(s) to which the opt-in applies and should not be sent with any other correspondence. In order to process your authorization, we require that the authorization be provided by you directly and not through a third-party.
© 2008 Morgan Stanley Institutional Fund Trust.
181
2008 Annual Report | |
| |
September 30, 2008 | |
Trustee and Officer Information (unaudited)
Independent Trustees:
Name, Age and Address of
Independent Trustee | | Position(s) Held
with Registrant | | Length of
Time Served* | | Principal Occupation(s) During Past 5 Years | | Number of
Portfolios in
Fund Complex
Overseen by
Independent
Trustee** | | Other Directorships Held by Trustees |
Frank L. Bowman (63)
c/o Kramer Levin Naftalis &
Frankel LLP
Counsel to the Independent
Trustees
1177 Avenue of the Americas
New York, NY 10036 | | Trustee | | Since
August
2006 | | President and Chief Executive Officer, Nuclear Energy Institute (policy organization) (since February 2005); Director or Trustee of various Retail Funds and Institutional Funds (since August 2006); Chairperson of the Insurance Sub-Committee of the Insurance, Valuation and Compliance Committee (since February 2007); formerly, variously, Admiral in the U.S. Navy, Director of Naval Nuclear Propulsion Program and Deputy Administrator — Naval Reactors in the National Nuclear Security Administration at the U.S. Department of Energy (1996-2004). Honorary Knight Commander of the Most Excellent Order of the British Empire. | | 180 | | Director of the National Energy Foundation, the U.S. Energy Association, the American Council for Capital Formation and the Armed Services YMCA of the USA. |
| | | | | | | | | | |
Michael Bozic (67)
c/o Kramer Levin Naftalis &
Frankel LLP
Counsel to the Independent
Directors
1177 Avenue of the Americas
New York, NY 10036 | | Trustee | | Since
April
1994 | | Private Investor; Chairperson of the Insurance, Valuation and Compliance Committee (since October 2006); Director or Trustee of the Retail Funds (since April 1994) and Institutional Funds (since July 2003); formerly, Chairperson of the Insurance Committee (July 2006-September 2006), Vice Chairman of Kmart Corporation (December 1998-October 2000), Chairman and Chief Executive Officer of Levitz Furniture Corporation (November 1995-November 1998) and President and Chief Executive Officer of Hills Department Stores (May 1991-July 1995); variously Chairman, Chief Executive Officer, President and Chief Operating Officer (1987-1991) of the Sears Merchandise Group of Sears Roebuck & Co. | | 182 | | Director of various business organizations. |
| | | | | | | | | | |
Kathleen A. Dennis (55)
c/o Kramer Levin Naftalis &
Frankel LLP
Counsel to the Independent
Directors
1177 Avenue of the Americas
New York, NY 10036 | | Trustee | | Since
August
2006 | | President, Cedarwood Associates (mutual fund and investment management) (since July 2006); Chairperson of the Money Market and Alternatives Sub- Committee of the Investment Committee (since October 2006) and Director or Trustee of various Retail Funds and Institutional Funds (since August 2006); formerly, Senior Managing Director of Victory Capital Management (1993-2006). | | 180 | | Director of various non-profit organizations. |
| | | | | | | | | | |
Dr. Manuel H. Johnson (59)
c/o Johnson Smick
Group, Inc.
888 16th Street, N.W.
Suite 740
Washington, D.C. 20006 | | Trustee | | Since
July
1991 | | Senior Partner, Johnson Smick International, Inc. (consulting firm); Chairperson of the Investment Committee (since October 2006) and Director or Trustee of the Retail Funds (since July 1991) and Institutional Funds (since July 2003); Co-Chairman and a founder of the Group of Seven Council (G7C) (international economic commission); formerly, Chairperson of the Audit Committee (July 1991- September 2006); Vice Chairman of the Board of Governors of the Federal Reserve System and Assistant Secretary of the U.S. Treasury. | | 182 | | Director of NVR, Inc. (home construction); Director of Evergreen Energy. |
| | | | | | | | | | |
Joseph J. Kearns (66)
c/o Kearns & Associates
LLC
PMB754
23852 Pacific Coast
Highway
Malibu, CA 90265 | | Trustee | | Since
August
1994 | | President, Kearns & Associates LLC (investment consulting); Chairperson of the Audit Committee (since October 2006) and Director or Trustee of the Retail Funds (since July 2003) and the Institutional Funds (since August 1994); formerly Deputy Chairperson of the Audit Committee (July 2003-September 2006) and Chairperson of the Audit Committee of the Institutional Funds (October 2001-July 2003); CFO of the J. Paul Getty Trust. | | 183 | | Director of Electro Rent Corporation (equipment leasing) and The Ford Family Foundation. |
182
| 2008 Annual Report |
| |
| September 30, 2008 |
Trustee and Officer Information (cont’d)
Independent Trustees: (cont’d)
Name, Age and Address of
Independent Trustee | | Position(s) Held
with Registrant | | Length of
Time Served* | | Principal Occupation(s) During Past 5 Years | | Number of
Portfolios in
Fund Complex
Overseen by
Independent
Trustee** | | Other Directorships Held by Trustees |
Michael F. Klein (49)
c/o Kramer Levin Naftalis & Frankel LLP
Counsel to the Independent
Directors
1177 Avenue of the Americas
New York, NY 10036 | | Trustee | | Since
August
2006 | | Managing Director, Aetos Capital, LLC (since March 2000) and Co-President, Aetos Alternatives Management, LLC (since January 2004); Chairperson of the Fixed Income Sub-Committee of the Investment Committee (since October 2006) and Director or Trustee of various Retail Funds and Institutional Funds (since August 2006); formerly, Managing Director, Morgan Stanley & Co., Inc. and Morgan Stanley Dean Witter Investment Management, President, Morgan Stanley Institutional Funds (June 1998-March 2000) and Principal, Morgan Stanley & Co., Inc. and Morgan Stanley Dean Witter Investment Management (August 1997- December 1999). | | 180 | | Director of certain investment funds managed or sponsored by Aetos Capital LLC; Director of Sanitized AG and Sanitized Marketing AG (specialty chemicals). |
| | | | | | | | | | |
Michael E. Nugent (72)
c/o Triumph Capital, L.P.
445 Park Avenue
New York, NY 10022 | | Chairperson of
the Board and
Trustee | | Chairperson
of the Boards
since July
2006 and
Trustee since
July 1991 | | General Partner of Triumph Capital, L.P. (private investment partnership); Chairman of the Boards of the Retail Funds and Institutional Funds (since July 2006); Director or Trustee of the Retail Funds (since July 1991) and Institutional Funds (since July 2001); formerly, Chairperson of the Insurance Committee (until July 2006). | | 182 | | None. |
| | | | | | | | | | |
W. Allen Reed (61)
c/o Kramer Levin Naftalis & Frankel LLP
Counsel to the Independent
Directors
1177 Avenue of the Americas
New York, NY 10036 | | Trustee | | Since
August
2006 | | Chairperson of the Equity Sub-Committee of the Investment Committee (since October 2006) and Director or Trustee of various Retail and Institutional Funds (since August 2006); formerly, President and CEO of General Motors Asset Management; Chairman and Chief Executive Officer of the GM Trust Bank and Corporate Vice President of General Motors Corporation (July 1994-December 2005). | | 180 | | Director of Temple-Inland Industries (packaging and forest products); Director of Legg Mason, Inc. and Director of the Auburn University Foundation. |
| | | | | | | | | | |
Fergus Reid (76)
c/o Lumelite Plastics Corporation
85 Charles Coleman Blvd.
Pawling, NY 12564 | | Trustee | | Since
June
1992 | | Chairman of Lumelite Plastics Corporation; Chairperson of the Governance Committee and Director or Trustee of the Retail Funds (since July 2003) and Institutional Funds (since June 1992). | | 183 | | Trustee and Director of certain investment companies in the JPMorgan Funds complex managed by JPMorgan Investment Management Inc. |
183
2008 Annual Report | |
| |
September 30, 2008 | |
Trustee and Officer Information (cont’d)
Interested Trustees:
Name, Age and Address of
Interested Trustee | | Position(s)
Held with
Registrant | | Term of Office
and Length of
Time Served* | | Principal Occupation(s) During Past 5 Years | | Number of
Portfolios in
Fund Complex
Overseen by
Independent
Trustee** | | Other Directorships Held by
Interested Trustees |
James F. Higgins (60)
c/o Morgan Stanley Trust
Harborside Financial Center
Plaza Two
Jersey City, NJ 07311 | | Trustee | | Since
June
2000 | | Director or Trustee of the Retail Funds (since June 2000) and Institutional Funds (since July 2003); Senior Advisor of Morgan Stanley (since August 2000) | | 181 | | Director of AXA Financial, Inc. and The Equitable Life Assurance Society of the United States (financial services). |
* This is the earliest date the Trustees began serving the Retail Funds or Institutional Funds. Each Trustee serves an indefinite term, until his or her successor is elected.
** The Fund Complex includes all funds advised by Morgan Stanley Investments LP (“MSI”) that have an investment advisor that is an affiliated entity of MSI (including but not limited to, Morgan Stanley Investment Management Inc. (“MSIM”), Morgan Stanley Investment Advisors Inc. (“MSIA”) and Morgan Stanley AIP GP LP). The Retail Funds are those funds advised by MSIA. The Institutional Funds are certain U.S. registered funds advised by MSI, MSIM and Morgan Stanley AIP GP LP.
Additional information about the Fund’s Trustees can be found in the Fund’s Statement of Additional Information (SAI). The SAI may be obtained without charge upon request, by calling the Fund at 1-800-548-7786. You may also retrieve this information on-line at the Securities and Exchange Commission’s website at “http://www.sec.gov”. To aid you in obtaining this information on-line., the Fund’s Central Index Key (CIK) number is 0000741375 and the SAI is found within form type 485BPOS.
184
| 2008 Annual Report |
| |
| September 30, 2008 |
Trustee and Officer Information (cont’d)
Executive Officers:
Name, Age and Address of Executive Officer | | Position(s)
Held with
Registrant | | Term of Office
and Length of
Time Served* | | Principal Occupation(s) During Past 5 Years |
Randy Takian (34)
Morgan Stanley Investment Management Inc.
522 Fifth Avenue
New York, NY 10036 | | President and
Principal
Executive
Officer | | Since
September
2008 | | President and Principal Executive Officer (since September 2008) of funds in the Fund Complex; President and Chief Executive Officer of Morgan Stanley Services Company Inc. (since September 2008). President of Morgan Stanley Investment Advisors Inc. (since July 2008). Head of the Retail and Intermediary business within Morgan Stanley Investment Management (since July 2008). Head of Liquidity and Bank Trust business (since July 2008) and the Latin American franchise (since July 2008) at Morgan Stanley Investment Management. Managing Director, Director and/or Officer of the Adviser and various entities affiliated with the Adviser. Formerly, Head of Strategy and Product Development for the Alternatives Group and Senior Loan Investment Management. Formerly with Bank of America (July 1996-March 2006), most recently as Head of the Strategy, Mergers and Acquisitions team for Global Wealth and Investment Management. |
| | | | | | |
Kevin Klingert (46)
Morgan Stanley Investment Management Inc.
522 Fifth Avenue
New York, NY 10036 | | Vice President | | Since June
2008 | | Chief Operating Officer of the Global Fixed Income Group of the Adviser and Morgan Stanley Investment Advisors Inc. (since March 2008). Head of Global Liquidity Portfolio Management and co-Head of Liquidity Credit Research of Morgan Stanley Investment Management (since December 2007). Managing Director of the Adviser and Morgan Stanley Investment Advisors Inc. (since December 2007). Previously, Managing Director on the Management Committee and head of Municipal Portfolio Management and Liquidity at BlackRock (October 1991 to January 2007). |
| | | | | | |
Dennis F. Shea (55)
Morgan Stanley Investment Management Inc.
522 Fifth Avenue
New York, NY 10036 | | Vice President | | Since February
2006 | | Managing Director and (since February 2006) Chief Investment Officer—Global Equity of Morgan Stanley Investment Management; Vice President of the Retail Funds and Institutional Funds (since February 2006). Formerly, Managing Director and Director of Global Equity Research at Morgan Stanley. |
| | | | | | |
Amy R. Doberman (46)
Morgan Stanley Investment Management Inc.
522 Fifth Avenue
New York, NY 10036 | | Vice President | | Since July
2004 | | Managing Director and General Counsel, U.S. Investment Management of Morgan Stanley Investment Management (since July 2004); Vice President of the Retail Funds and Institutional Funds (since July 2004); Vice President of the Van Kampen Funds (since August 2004); Secretary (since February 2006) and Managing Director (since July 2004) of the Adviser and various entities affiliated with the Adviser. Formerly, Managing Director and General Counsel—Americas, UBS Global Asset Management (July 2000-July 2004). |
| | | | | | |
Carsten Otto (44)
Morgan Stanley Investment Management Inc.
522 Fifth Avenue
New York, NY 10036 | | Chief
Compliance
Officer | | Since October
2004 | | Managing Director and Global Head of Compliance for Morgan Stanley Investment Management (since April 2007) and Chief Compliance Officer of the Retail Funds and Institutional Funds (since October 2004). Formerly, U.S. Director of Compliance (October 2004-April 2007) and Assistant Secretary and Assistant General Counsel of the Retail Funds. |
| | | | | | |
Stefanie V. Chang Yu (41)
Morgan Stanley Investment Management Inc. 522 Fifth Avenue
New York, NY 10036 | | Vice President | | Since
December
1997 | | Managing Director of the Adviser and various entities affiliated with the Adviser; Vice President of the Retail Funds (since July 2002) and Institutional Funds (since December 1997). Formerly, Secretary of various entities affiliated with the Adviser. |
| | | | | | |
Mary E. Mullin (41)
Morgan Stanley Investment Management Inc.
522 Fifth Avenue
New York, NY 10036 | | Secretary | | Since June
1999 | | Executive Director of the Adviser and various entities affiliated with the Adviser; Secretary of the Retail Funds (since July 2003) and Institutional Funds (since June 1999). |
| | | | | | |
James W. Garrett (39)
Morgan Stanley Investment Management Inc.
522 Fifth Avenue
New York, NY 10036 | | Treasurer and
Chief Financial
Officer | | Treasurer
since
February 2002
and Chief
Financial
Officer since
July 2003 | | Head of Global Fund Administration; Managing Director of the Adviser and various entities affiliated with the Adviser; Treasurer and Chief Financial Officer of the Institutional Funds. |
* This is the earliest date the Officer began serving the Retail Funds or Institutional Funds. Each Officer serves an indefinite term, until his or her successor is elected.
185
2008 Annual Report | |
| |
September 30, 2008 | |
Investment Adviser and Administrator
Morgan Stanley Investment Management Inc.
522 Fifth Avenue
New York, NY 10036
Distributor
Morgan Stanley Distribution, Inc.
One Tower Bridge Road
100 Front Street, Suite 1100
West Conshohocken, PA 19428-2899
Dividend Disbursing and Transfer Agent
Morgan Stanley Services Company, Inc.
P.O. Box 219804
Kansas City, MO 64121-9804
Custodian
JPMorgan Chase Bank, N.A.
270 Park Avenue
New York, NY 10017
Legal Counsel
Clifford Chance US LLP
31 West 52nd Street
New York, NY 10019-6131
Independent Registered Public Accounting Firm
Ernst & Young LLP
200 Clarendon Street
Boston, MA 02116-5072
Reporting to Shareholders
Each Morgan Stanley Fund provides a complete schedule of portfolio holdings in its semi-annual and annual reports within 60 days of the end of the Fund’s second and fourth fiscal quarters. The semi-annual reports and the annual reports are filed electronically with the Securities and Exchange Commission (SEC) on Form N-CSRS and Form N-CSR, respectively. Morgan Stanley also delivers the semi-annual and annual reports to Fund shareholders and makes these reports available on its public website, www.morganstanley.com. Each Morgan Stanley Fund also files a complete schedule of portfolio holdings with the SEC for the Fund’s first and third fiscal quarters on Form N-Q. Morgan Stanley does not deliver the reports for the first and third fiscal quarters to shareholders, nor are the reports posted to the Morgan Stanley public website. You may, however, obtain the Form N-Q filings (as well as the Form N-CSR and N-CSRS filings) by accessing the SEC’s website, www.sec.gov. You may also review and copy them at the SEC’s public reference room in Washington, DC. Information on the operation of the SEC’s Public Reference Room may be obtained by calling the SEC at 1(800) SEC-0330. You can also request copies of these materials, upon payment of a duplicating fee, by electronic request at the SEC’s email address (publicinfo@sec.gov) or by writing the Public Reference section of the SEC, Washington, DC 20549-0102.
Proxy Voting Policies and Procedures and Proxy Voting Record
You may obtain a copy of the Fund’s Proxy Voting Policy and Procedures and information regarding how the Fund voted proxies relating to portfolio securities during the most recent twelve-month period ended June 30, without charge, upon request, by calling 1(800) 548-7786 or by visiting our website at www.morganstanley.com. This information is also available on the SEC’s website at www.sec.gov.
This report is authorized for distribution only when preceded or accompanied by a prospectus of the Morgan Stanley Institutional Fund Trust which describes in detail each Investment Portfolio’s investment policies, risks, fees and expenses. Please read the prospectus carefully before you invest or send money. For additional information, including information regarding the investments comprising the Portfolio, please visit our website at www.morganstanley.com or call 1(800) 548-7786.
186
Printed in U.S.A.
This Report has been prepared for shareholders and may be distributed
to others only if preceded or accompanied by a current prospectus.
Morgan Stanley Investment Management Inc.
522 Fifth Avenue
New York, NY 10036
Investment Adviser: (610) 940-5000 · MSIF Trust (800) 548-7786
© 2008 Morgan Stanley

| IFEQFIANN 9/08 IU08-05729P-Y09/08 |
Item 2. Code of Ethics.
(a) The Fund has adopted a code of ethics (the “Code of Ethics”) that applies to its principal executive officer, principal financial officer, principal accounting officer or controller, or persons performing similar functions, regardless of whether these individuals are employed by the Fund or a third party.
(b) No information need be disclosed pursuant to this paragraph.
(c) Not applicable.
(d) Not applicable.
(e) Not applicable.
(f)
(1) The Fund’s Code of Ethics is attached hereto as Exhibit 12 A.
(2) Not applicable.
(3) Not applicable.
Item 3. Audit Committee Financial Expert.
The Fund’s Board of Trustees has determined that Joseph J. Kearns, an “independent” Trustee, is an “audit committee financial expert” serving on its audit committee. Under applicable securities laws, a person who is determined to be an audit committee financial expert will not be deemed an “expert” for any purpose, including without limitation for the purposes of Section 11 of the Securities Act of 1933, as a result of being designated or identified as an audit committee financial expert. The designation or identification of a person as an audit committee financial expert does not impose on such person any duties, obligations, or liabilities that are greater than the duties, obligations, and liabilities imposed on such person as a member of the audit committee and Board of Trustees in the absence of such designation or identification.
Item 4. Principal Accountant Fees and Services.
(a)(b)(c)(d) and (g). Based on fees billed for the periods shown:
2008
| | Registrant | | Covered Entities(1) | |
Audit Fees | | $ | 589,150 | | N/A | |
| | | | | |
Non-Audit Fees | | | | | |
Audit-Related Fees | | $ | — | | $ | 742,276 | (2) |
Tax Fees | | $ | 66,670 | (3) | $ | 99,522 | (4) |
All Other Fees | | $ | — | | $ | 205,436 | (5) |
Total Non-Audit Fees | | $ | 66,670 | | $ | 1,047,234 | |
| | | | | |
Total | | $ | 655,820 | | $ | 1,047,234 | |
2007
| | Registrant | | Covered Entities(1) | |
Audit Fees | | $ | 555,250 | | N/A | |
| | | | | |
Non-Audit Fees | | | | | |
Audit-Related Fees | | $ | — | | $ | 781,800 | (2) |
Tax Fees | | $ | 57,600 | (3) | $ | 59,185 | (4) |
All Other Fees | | $ | — | | $ | 74,100 | (5) |
Total Non-Audit Fees | | $ | 57,600 | | $ | 915,085 | |
| | | | | |
Total | | $ | 612,850 | | $ | 915,085 | |
N/A- Not applicable, as not required by Item 4.
(1) Covered Entities include the Adviser (excluding sub-advisors) and any entity controlling, controlled by or under common control with the Adviser that provides ongoing services to the Registrant.
(2) Audit-Related Fees represent assurance and related services provided that are reasonably related to the performance of the audit of the financial statements of the Covered Entities and funds advised by the Adviser or its affiliates, specifically attestation services provided in connection with a SAS 70 Report and advisory consulting work.
(3) Tax Fees represent tax advice and compliance services provided in connection with the review of the Registrant’s tax returns.
(4) Tax Fees represent tax advice services provided to Covered Entities, including research and identification of PFIC entities.
(5) All Other Fees represent attestation services provided in connection with performance presentation standards and a compliance review project performed.
(e)(1) The audit committee’s pre-approval policies and procedures are as follows:
APPENDIX A
AUDIT COMMITTEE
AUDIT AND NON-AUDIT SERVICES
PRE-APPROVAL POLICY AND PROCEDURES
OF THE
MORGAN STANLEY RETAIL AND INSTITUTIONAL FUNDS
AS ADOPTED AND AMENDED JULY 23, 2004,(1)
1. Statement of Principles
The Audit Committee of the Board is required to review and, in its sole discretion, pre-approve all Covered Services to be provided by the Independent Auditors to the Fund and Covered Entities in order to assure that services performed by the Independent Auditors do not impair the auditor’s independence from the Fund.
The SEC has issued rules specifying the types of services that an independent auditor may not provide to its audit client, as well as the audit committee’s administration of the engagement of the independent auditor. The SEC’s rules establish two different approaches to pre-approving services, which the SEC considers to be equally valid. Proposed services either: may be pre-approved without consideration of specific case-by-case services by the Audit Committee (“general pre-approval”); or require the specific pre-approval of the Audit Committee or its delegate (“specific pre-approval”). The Audit Committee believes that the combination of these two approaches in this Policy will result in an effective and efficient procedure to pre-approve services performed by the Independent Auditors. As set forth in this Policy, unless a type of service has received general pre-approval, it will require specific pre-approval by the Audit Committee (or by any member of the Audit Committee to which pre-approval authority has been delegated) if it is to be provided by the Independent Auditors. Any proposed services exceeding pre-approved cost levels or budgeted amounts will also require specific pre-approval by the Audit Committee.
The appendices to this Policy describe the Audit, Audit-related, Tax and All Other services that have the general pre-approval of the Audit Committee. The term of any general pre-approval is 12 months from the date of pre-approval, unless the Audit Committee considers and provides a different period and states otherwise. The Audit Committee will annually review and pre-approve the services that may be provided by the Independent Auditors without obtaining specific pre-approval from the Audit Committee. The Audit Committee will add to or subtract from the list of general pre-approved services from time to time, based on subsequent determinations.
(1) This Audit Committee Audit and Non-Audit Services Pre-Approval Policy and Procedures (the “Policy”), adopted as of the date above, supersedes and replaces all prior versions that may have been adopted from time to time.
The purpose of this Policy is to set forth the policy and procedures by which the Audit Committee intends to fulfill its responsibilities. It does not delegate the Audit Committee’s responsibilities to pre-approve services performed by the Independent Auditors to management.
The Fund’s Independent Auditors have reviewed this Policy and believes that implementation of the Policy will not adversely affect the Independent Auditors’ independence.
2. Delegation
As provided in the Act and the SEC’s rules, the Audit Committee may delegate either type of pre-approval authority to one or more of its members. The member to whom such authority is delegated must report, for informational purposes only, any pre-approval decisions to the Audit Committee at its next scheduled meeting.
3. Audit Services
The annual Audit services engagement terms and fees are subject to the specific pre-approval of the Audit Committee. Audit services include the annual financial statement audit and other procedures required to be performed by the Independent Auditors to be able to form an opinion on the Fund’s financial statements. These other procedures include information systems and procedural reviews and testing performed in order to understand and place reliance on the systems of internal control, and consultations relating to the audit. The Audit Committee will approve, if necessary, any changes in terms, conditions and fees resulting from changes in audit scope, Fund structure or other items.
In addition to the annual Audit services engagement approved by the Audit Committee, the Audit Committee may grant general pre-approval to other Audit services, which are those services that only the Independent Auditors reasonably can provide. Other Audit services may include statutory audits and services associated with SEC registration statements (on Forms N-1A, N-2, N-3, N-4, etc.), periodic reports and other documents filed with the SEC or other documents issued in connection with securities offerings.
The Audit Committee has pre-approved the Audit services in Appendix B.1. All other Audit services not listed in Appendix B.1 must be specifically pre-approved by the Audit Committee (or by any member of the Audit Committee to which pre-approval has been delegated).
4. Audit-related Services
Audit-related services are assurance and related services that are reasonably related to the performance of the audit or review of the Fund’s financial statements and, to the extent they are Covered Services, the Covered Entities or that are traditionally performed by the Independent Auditors. Because the Audit Committee believes that the provision of Audit-related services does not impair the independence of the auditor and is consistent with the SEC’s rules on auditor independence, the Audit Committee may grant general pre-approval to Audit-related services. Audit-related services include, among others, accounting consultations related to accounting, financial reporting or disclosure matters
not classified as “Audit services”; assistance with understanding and implementing new accounting and financial reporting guidance from rulemaking authorities; agreed-upon or expanded audit procedures related to accounting and/or billing records required to respond to or comply with financial, accounting or regulatory reporting matters; and assistance with internal control reporting requirements under Forms N-SAR and/or N-CSR.
The Audit Committee has pre-approved the Audit-related services in Appendix B.2. All other Audit-related services not listed in Appendix B.2 must be specifically pre-approved by the Audit Committee (or by any member of the Audit Committee to which pre-approval has been delegated).
5. Tax Services
The Audit Committee believes that the Independent Auditors can provide Tax services to the Fund and, to the extent they are Covered Services, the Covered Entities, such as tax compliance, tax planning and tax advice without impairing the auditor’s independence, and the SEC has stated that the Independent Auditors may provide such services.
Pursuant to the preceding paragraph, the Audit Committee has pre-approved the Tax Services in Appendix B.3. All Tax services in Appendix B.3 must be specifically pre-approved by the Audit Committee (or by any member of the Audit Committee to which pre-approval has been delegated).
6. All Other Services
The Audit Committee believes, based on the SEC’s rules prohibiting the Independent Auditors from providing specific non-audit services, that other types of non-audit services are permitted. Accordingly, the Audit Committee believes it may grant general pre-approval to those permissible non-audit services classified as All Other services that it believes are routine and recurring services, would not impair the independence of the auditor and are consistent with the SEC’s rules on auditor independence.
The Audit Committee has pre-approved the All Other services in Appendix B.4. Permissible All Other services not listed in Appendix B.4 must be specifically pre-approved by the Audit Committee (or by any member of the Audit Committee to which pre-approval has been delegated).
7. Pre-Approval Fee Levels or Budgeted Amounts
Pre-approval fee levels or budgeted amounts for all services to be provided by the Independent Auditors will be established annually by the Audit Committee. Any proposed services exceeding these levels or amounts will require specific pre-approval by the Audit Committee. The Audit Committee is mindful of the overall relationship of fees for audit and non-audit services in determining whether to pre-approve any such services.
8. Procedures
All requests or applications for services to be provided by the Independent Auditors that do not require specific approval by the Audit Committee will be submitted to the Fund’s Chief Financial Officer and must include a detailed description of the services to be
rendered. The Fund’s Chief Financial Officer will determine whether such services are included within the list of services that have received the general pre-approval of the Audit Committee. The Audit Committee will be informed on a timely basis of any such services rendered by the Independent Auditors. Requests or applications to provide services that require specific approval by the Audit Committee will be submitted to the Audit Committee by both the Independent Auditors and the Fund’s Chief Financial Officer, and must include a joint statement as to whether, in their view, the request or application is consistent with the SEC’s rules on auditor independence.
The Audit Committee has designated the Fund’s Chief Financial Officer to monitor the performance of all services provided by the Independent Auditors and to determine whether such services are in compliance with this Policy. The Fund’s Chief Financial Officer will report to the Audit Committee on a periodic basis on the results of its monitoring. Both the Fund’s Chief Financial Officer and management will immediately report to the chairman of the Audit Committee any breach of this Policy that comes to the attention of the Fund’s Chief Financial Officer or any member of management.
9. Additional Requirements
The Audit Committee has determined to take additional measures on an annual basis to meet its responsibility to oversee the work of the Independent Auditors and to assure the auditor’s independence from the Fund, such as reviewing a formal written statement from the Independent Auditors delineating all relationships between the Independent Auditors and the Fund, consistent with Independence Standards Board No. 1, and discussing with the Independent Auditors its methods and procedures for ensuring independence.
10. Covered Entities
Covered Entities include the Fund’s investment adviser(s) and any entity controlling, controlled by or under common control with the Fund’s investment adviser(s) that provides ongoing services to the Fund(s). Beginning with non-audit service contracts entered into on or after May 6, 2003, the Fund’s audit committee must pre-approve non-audit services provided not only to the Fund but also to the Covered Entities if the engagements relate directly to the operations and financial reporting of the Fund. This list of Covered Entities would include:
Morgan Stanley Retail Funds
Morgan Stanley Investment Advisors Inc.
Morgan Stanley & Co. Incorporated
Morgan Stanley DW Inc.
Morgan Stanley Investment Management Inc.
Morgan Stanley Investment Management Limited
Morgan Stanley Investment Management Private Limited
Morgan Stanley Asset & Investment Trust Management Co., Limited
Morgan Stanley Investment Management Company
Van Kampen Asset Management
Morgan Stanley Services Company, Inc.
Morgan Stanley Distributors Inc.
Morgan Stanley Trust FSB
Morgan Stanley Institutional Funds
Morgan Stanley Investment Management Inc.
Morgan Stanley Investment Advisors Inc.
Morgan Stanley Investment Management Limited
Morgan Stanley Investment Management Private Limited
Morgan Stanley Asset & Investment Trust Management Co., Limited
Morgan Stanley Investment Management Company
Morgan Stanley & Co. Incorporated
Morgan Stanley Distribution, Inc.
Morgan Stanley AIP GP LP
Morgan Stanley Alternative Investment Partners LP
(e)(2) Beginning with non-audit service contracts entered into on or after May 6, 2003, the audit committee also is required to pre-approve services to Covered Entities to the extent that the services are determined to have a direct impact on the operations or financial reporting of the Registrant. 100% of such services were pre-approved by the audit committee pursuant to the Audit Committee’s pre-approval policies and procedures (attached hereto).
(f) Not applicable.
(g) See table above.
(h) The audit committee of the Board of Trustees has considered whether the provision of services other than audit services performed by the auditors to the Registrant and Covered Entities is compatible with maintaining the auditors’ independence in performing audit services.
Item 5. Audit Committee of Listed Registrants.
(a) The Fund has a separately-designated standing audit committee established in accordance with Section 3(a)(58)(A) of the Exchange Act whose members are: Frank Joseph Kearns, Michael Nugent and Allen Reed.
(b) Not applicable.
Item 6. Schedule of Investments
Refer to Item 1.
Item 7. Disclosure of Proxy Voting Policies and Procedures for Closed-End Management Investment Companies.
Applicable only to reports filed by closed-end funds.
Item 8. Portfolio Managers of Closed-End Management Investment Companies
Applicable only to reports filed by closed-end funds.
Item 9. Closed-End Fund Repurchases
Applicable only to reports filed by closed-end funds.
Item 10. Submission of Matters to a Vote of Security Holders
Not applicable.
Item 11. Controls and Procedures
(a) The Fund’s principal executive officer and principal financial officer have concluded that the Fund’s disclosure controls and procedures are sufficient to ensure that information required to be disclosed by the Fund in this Form N-CSR was recorded, processed, summarized and reported within the time periods specified in the Securities and Exchange Commission’s rules and forms, based upon such officers’ evaluation of these controls and procedures as of a date within 90 days of the filing date of the report.
(b) There were no changes in the registrant’s internal control over financial reporting that occurred during the second fiscal quarter of the period covered by this report that has materially affected, or is reasonably likely to materially affect, the registrant’s internal control over financial reporting.
Item 12. Exhibits
(a) The Code of Ethics for Principal Executive and Senior Financial Officers is attached hereto.
(b) A separate certification for each principal executive officer and principal financial officer of the registrant are attached hereto as part of EX-99.CERT.
SIGNATURES
Pursuant to the requirements of the Securities Exchange Act of 1934 and the Investment company Act of 1940, the registrants has duly caused this report to be signed on its behalf by the undersigned, thereunto duly autorized.
(Registrant) Morgan Stanley Institutional Fund Trust
By: | /s/ Randy Takian | |
Name: | Randy Takian |
Title: | Principal Executive Officer |
Date: | November 18, 2008 |
Pursuant to the requirements of the Securities Exchange Act of 1934 and the Investment Company Act of 1940, this report has been signed by the following persons on behalf of the registrant and in the capacities and on the dates indicated.
By: | /s/ Randy Takian | |
Name: | Randy Takian |
Title: | Principal Executive Officer |
Date: | November 18, 2008 |
| |
By: | /s/ James W. Garrett | |
Name: | James W. Garrett |
Title: | Principal Financial Officer |
Date: | November 18, 2008 |