UNITED STATES
SECURITIES AND EXCHANGE COMMISSION
Washington, D.C. 20549
FORM N-CSR
CERTIFIED SHAREHOLDER REPORT OF REGISTERED
MANAGEMENT INVESTMENT COMPANIES
Investment Company Act file number | 811-03980 |
|
Morgan Stanley Institutional Funds Trust |
(Exact name of registrant as specified in charter) |
|
522 Fifth Avenue, New York, New York | | 10036 |
(Address of principal executive offices) | | (Zip code) |
|
Sara Furber
522 Fifth Avenue, New York, New York 10036 |
(Name and address of agent for service) |
|
Registrant’s telephone number, including area code: | 212-296-6990 | |
|
Date of fiscal year end: | September 30, 2010 | |
|
Date of reporting period: | September 30, 2010 | |
| | | | | | | | |
Item 1 - Report to Shareholders
INVESTMENT MANAGEMENT

Morgan Stanley
Institutional Fund Trust
Balanced Portfolio
Balanced Portfolio
Equity Portfolio
Mid Cap Growth Portfolio
Fixed Income Portfolios
Core Fixed Income Portfolio
Core Plus Fixed Income Portfolio
Intermediate Duration Portfolio
Investment Grade Fixed Income Portfolio
Limited Duration Portfolio
Long Duration Fixed Income Portfolio
Annual
Report
September 30, 2010

(This Page has been left blank intentionally.)
2010 Annual Report
September 30, 2010
Table of Contents
| Shareholders' Letter | | | 2 | | |
|
| Investment Advisory Agreement Approval | | | 3 | | |
|
| Expense Examples | | | 5 | | |
|
| Investment Overviews & Portfolios of Investments | |
|
| Balanced Portfolio: | |
|
| Balanced | | | 6 | | |
|
| Equity Portfolio: | |
|
| Mid Cap Growth | | | 21 | | |
|
| Fixed Income Portfolios: | |
|
| Core Fixed Income | | | 26 | | |
|
| Core Plus Fixed Income | | | 36 | | |
|
| Intermediate Duration | | | 48 | | |
|
| Investment Grade Fixed Income | | | 55 | | |
|
| Limited Duration | | | 65 | | |
|
| Long Duration Fixed Income | | | 72 | | |
|
| Statements of Assets and Liabilities | | | 80 | | |
|
| Statements of Operations | | | 84 | | |
|
| Statements of Changes in Net Assets | | | 86 | | |
|
| Financial Highlights | | | 91 | | |
|
| Notes to Financial Statements | | | 111 | | |
|
Report of Independent Registered
Public Accounting Firm | | | 122 | | |
|
| Federal Income Tax Information | | | 123 | | |
|
| U.S. Privacy Policy | | | 124 | | |
|
| Trustee and Officer Information | | | 127 | | |
|
This report is authorized for distribution only when preceded or accompanied by prospectuses of the Morgan Stanley Institutional Fund Trust. To receive a prospectus and/or SAI, which contains more complete information such as investment objectives, charges, expenses, policies for voting proxies, risk considerations, and describes in detail each of the Portfolio's investment policies to the prospective investor, please call toll free 1-(800) 548-7786. Please read the prospectuses carefully before you invest or send money.
Additionally, you can access portfolio information including performance, characteristics, and investment team commentary through Morgan Stanley Investment Management's website: www.morganstanley.com/im.
Market forecasts provided in this report may not necessarily come to pass. There is no guarantee that any sectors mentioned will continue to perform as discussed herein or that securities in such sectors will be held by the Portfolio in the future. There is no assurance that a Portfolio will achieve its investment objective. Portfolios are subject to market risk, which is the possibility that market values of securities owned by the Portfolio will decline and, therefore, the value of the Portfolio's shares may be less than what you paid for them. Accordingly, you can lose money investing in Portfolios. Please see the prospectus for more complete information on investment risks.
1
2010 Annual Report
September 30, 2010
Shareholders' Letter
Dear Shareholders:
We are pleased to present to you the Morgan Stanley Institutional Fund Trust's (the "Fund") Annual Report for the year ended September 30, 2010. Our Fund currently offers 8 portfolios providing investors with domestic equity and fixed-income products. The Fund's portfolios, together with the portfolios of the Morgan Stanley Institutional Fund, Inc., provide investors with a means to help them meet specific investment needs and to allocate their investments among equities and fixed income.
Sincerely,

Sara Furber
President and Principal Executive Officer
October 2010
2
2010 Annual Report
September 30, 2010
Investment Advisory Agreement Approval
Nature, Extent and Quality of Services
The Board reviewed and considered the nature and extent of the investment advisory services provided by the Adviser (as defined herein) under the advisory agreement, including portfolio management, investment research and equity and fixed income securities trading. The Board also reviewed and considered the nature and extent of the non-advisory, administrative services provided by the Adviser under the administration agreement, including accounting, clerical, bookkeeping, compliance, business management and planning, and the provision of supplies, office space and utilities at the Adviser's expense. (The advisory and administration agreements together are referred to as the "Management Agreement.") The Board also compared the nature of the services provided by the Adviser with similar services provided by non-affiliated advisers as reported to the Board by Lipper, Inc. ("Lipper").
The Board reviewed and considered the qualifications of the portfolio managers, the senior administrative managers and other key personnel of the Adviser who provide the advisory and administrative services to the Portfolios. The Board determined that the Adviser's portfolio managers and key personnel are well qualified by education and/or training and experience to perform the services in an efficient and professional manner. The Board concluded that the nature and extent of the advisory and administrative services provided were necessary and appropriate for the conduct of the business and investment activities of the Portfolios and supported its decision to approve the Management Agreement.
Performance, Fees and Expenses of the Portfolios
The Board reviewed the performance, fees and expenses of the Portfolios compared to their peers, as determined by Lipper, and to appropriate benchmarks where applicable. The Board discussed with the Adviser the performance goals and the actual results achieved in managing the Portfolios. When considering a fund's performance, the Board and the Adviser place emphasis on trends and longer-term returns (focusing on one-year, three-year and five-year performance, or since inception, as of December 31, 2009, as applicable). When a fund underperforms its benchmark and/or its peer group average, the Board and the Adviser discuss the causes of such underperformance and, where necessary, they discuss specific changes to investment strategy or investment personnel.
Performance
The Board noted that the performance of the Core Plus Fixed Income, Core Fixed Income, Investment Grade Fixed Income and Limited Duration Portfolios were below the peer group averages for the one-, three- and five-year periods.
The Board noted that the performance of the Mid Cap Growth Portfolio was better than its peer group average for the one-, three- and five-year periods.
The Board noted that the performance of the Long Duration Fixed Income Portfolio was below the peer group average for the one-year period but better than its peer group average for the three-year period and since the end of July, 2006, the inception of the Portfolio.
The Board noted that the performance of the Balanced Portfolio was better than its peer group average for the three- and five-year periods but below its peer group average for the one-year period.
Performance Conclusions
With respect to the Core Plus Fixed Income, Core Fixed Income, Investment Grade Fixed Income and Limited Duration Portfolios, after discussion, the Board concluded that performance was acceptable.
With respect to the Balanced, Mid Cap Growth and Long Duration Fixed Income Portfolios, after discussion, the Board concluded that performance was competitive with the peer group averages.
Fees and Expense
The Board members discussed with the Adviser the level of the advisory and administration fees (together, the "management fee") for the Portfolios relative to comparable funds advised by the Adviser and compared to their peers as determined by Lipper. In addition to the management fee, the Board also reviewed the Portfolios' total expense ratios.
The Board noted that the management fees and total expense ratios for the Balanced, Mid Cap Growth, Core Plus Fixed Income, Investment Grade Fixed Income, Limited Duration and Long Duration Fixed Income Portfolios were lower than the peer group averages.
3
2010 Annual Report
September 30, 2010
Investment Advisory Agreement Approval (cont'd)
The Board noted for the Core Fixed Income Portfolio, that while the management fee was higher but close to its peer group average, the total expense ratio was lower than its peer group average.
Fee and Expense Conclusions
With respect to the Balanced, Mid Cap Growth, Core Plus Fixed Income, Core Fixed Income, Investment Grade Fixed Income, Limited Duration and Long Duration Fixed Income Portfolios, after discussion, the Board concluded that the management fees and total expense ratios were competitive with the peer group averages.
Economies of Scale
The Board considered the size and growth prospects of the Portfolios and how that relates to the Portfolios' total expense ratios and particularly the Portfolios' management fee rates (which, for all the Portfolios except Core Plus Fixed Income Portfolio do not include breakpoints). In conjunction with its review of the Adviser's profitability, the Board discussed with the Adviser how a change in assets can affect the efficiency or effectiveness of managing the Portfolios and whether the management fee level is appropriate relative to current and projected asset levels and/or whether the management fee structure reflects economies of scale as asset levels change. The Board has determined that its review of the actual and potential economies of scale of each Portfolio supports its decision to approve the Management Agreement.
Profitability of the Adviser and Affiliates
The Board considered information concerning the costs incurred and profits realized by the Adviser and its affiliates during the last year from their relationship with the Portfolios and during the last two years from their relationship with the Morgan Stanley Fund Complex and reviewed with the Adviser the cost allocation methodology used to determine the profitability of the Adviser and affiliates. The Board has determined that its review of the analysis of the Adviser's expenses and profitability supports its decision to approve the Management Agreement.
Other Benefits of the Relationship
The Board considered other benefits to the Adviser and its affiliates derived from their relationship with the Portfolios and other funds advised by the Adviser. These benefits may include, among other things, "float" benefits derived from handling of checks for purchases and sales, research received by the Adviser generated from commission dollars spent on funds' portfolio trading and fees for distribution and/or shareholder servicing. The Board reviewed with the Adviser each of these arrangements and the reasonableness of the Adviser's costs relative to the services performed. The Board has determined that its review of the other benefits received by the Adviser or its affiliates supports its decision to approve the Management Agreement.
Resources of the Adviser and Historical Relationship Between the Portfolios and the Adviser
The Board considered whether the Adviser is financially sound and has the resources necessary to perform its obligations under the Management Agreement. The Board also reviewed and considered the historical relationship between the Portfolios and the Adviser, including the organizational structure of the Adviser, the policies and procedures formulated and adopted by the Adviser for managing the Portfolios' operations and the Board's confidence in the competence and integrity of the senior managers and key personnel of the Adviser. The Board concluded that the Adviser has the financial resources necessary to fulfill its obligations under the Management Agreement and that it is beneficial for the Portfolios to continue their relationship with the Adviser.
Other Factors and Current Trends
The Board considered the controls and procedures adopted and implemented by the Adviser and monitored by the Fund's Chief Compliance Officer and concluded that the conduct of business by the Adviser indicates a good faith effort on its part to adhere to high ethical standards in the conduct of the Fund's business.
General Conclusion
After considering and weighing all of the above factors, the Board concluded that it would be in the best interest of each Portfolio and its shareholders to approve renewal of the Management Agreement for another year. In reaching this conclusion the Board did not give particular weight to any single factor referenced above. The Board considered these factors over the course of numerous meetings, some of which were in executive session with only the Independent Board members and their counsel present. It is possible that individual Board members may have weighed these factors differently in reaching their individual decisions to approve the Management Agreement.
4
2010 Annual Report
September 30, 2010
Expense Examples (unaudited)
Expense Examples
As a shareholder of the Portfolio, you may incur two types of costs: (1) transactional costs, including sales charge (loads) on purchase payments, if applicable; and (2) ongoing costs, including management fees, distribution and shareholder servicing fees (in the case of Investment Class, Class P, Class H and Class L); and other Portfolio expenses. These examples are intended to help you understand your ongoing costs (in dollars) of investing in the Portfolio and to compare these costs with the ongoing costs of investing in other mutual funds.
The examples are based on an investment of $1,000 invested at the beginning of the six-month period ended September 30, 2010 and held for the entire six-month period.
Actual Expenses
The table below provides information about actual account values and actual expenses. You may use the information in this table, together with the amount you invested, to estimate the expenses that you paid over the period. Simply divide your account value by $1,000 (for example, an $8,600 account value divided by $1,000 = 8.6), then multiply the result by the number in the table under the heading entitled "Actual Expenses Paid During Period" to estimate the expenses you paid on your account during this period.
Please note that "Actual Expenses Paid During Period" are grossed up to reflect Portfolio expenses prior to the effect of Expense Offset (See Note F in the Notes to Financial Statements). Therefore, the annualized net expense ratios may differ from the ratio of expenses to average net assets shown in the Financial Highlights.
Hypothetical Example for Comparison Purposes
The table below provides information about hypothetical account values and hypothetical expenses based on the Portfolio's actual expense ratio and an assumed rate of return of 5% per year before expenses, which is not the Portfolio's actual return. The hypothetical account values and expenses may not be used to estimate the actual ending account balance or expenses you paid for the period. You may use this information to compare the ongoing costs of investing in the Portfolio and other funds. To do so, compare this 5% hypothetical example with the 5% hypothetical examples that appear in the shareholder reports of the other funds.
Please note that the expenses shown in the table are meant to highlight your ongoing costs only and do not reflect any transactional costs, such as sales charges (loads, if applicable). Therefore, the hypothetical account values and hypothetical expenses are useful in comparing ongoing costs only, and will not help you determine the relative total costs of owning different funds. In addition, if these transactional costs were included, your costs would have been higher.
| Portfolio | | Beginning
Account
Value
4/1/10 | | Actual Ending
Account
Value
9/30/10 | | Hypothetical
Ending Account
Value | | Actual
Expenses
Paid
During
Period* | | Hypothetical
Expenses Paid
During Period* | | Net
Expense
Ratio
During
Period** | |
| Balanced Class I | | $ | 1,000.00 | | | $ | 1,024.60 | | | $ | 1,020.71 | | | $ | 4.42 | | | $ | 4.41 | | | | 0.87 | % | |
| Balanced Investment Class | | | 1,000.00 | | | | 1,023.00 | | | | 1,019.95 | | | | 5.17 | | | | 5.16 | | | | 1.02 | | |
| Balanced Class P | | | 1,000.00 | | | | 1,023.30 | | | | 1,019.45 | | | | 5.68 | | | | 5.67 | | | | 1.12 | | |
| Mid Cap Growth Class I | | | 1,000.00 | | | | 1,118.60 | | | | 1,021.51 | | | | 3.77 | | | | 3.60 | | | | 0.71 | | |
| Mid Cap Growth Class P | | | 1,000.00 | | | | 1,117.60 | | | | 1,020.26 | | | | 5.10 | | | | 4.86 | | | | 0.96 | | |
| Core Fixed Income Class I | | | 1,000.00 | | | | 1,058.30 | | | | 1,022.56 | | | | 2.58 | | | | 2.54 | | | | 0.50 | | |
| Core Fixed Income Class P | | | 1,000.00 | | | | 1,057.80 | | | | 1,021.31 | | | | 3.87 | | | | 3.80 | | | | 0.75 | | |
| Core Plus Fixed Income Class I | | | 1,000.00 | | | | 1,066.10 | | | | 1,022.46 | | | | 2.69 | | | | 2.64 | | | | 0.52 | | |
| Core Plus Fixed Income Investment Class | | | 1,000.00 | | | | 1,066.40 | | | | 1,021.71 | | | | 3.47 | | | | 3.40 | | | | 0.67 | | |
| Core Plus Fixed Income Class P | | | 1,000.00 | | | | 1,065.80 | | | | 1,021.16 | | | | 4.04 | | | | 3.95 | | | | 0.78 | | |
| Intermediate Duration Class I | | | 1,000.00 | | | | 1,055.50 | | | | 1,022.26 | | | | 2.89 | | | | 2.84 | | | | 0.56 | | |
| Intermediate Duration Investment Class | | | 1,000.00 | | | | 1,052.80 | | | | 1,021.51 | | | | 3.65 | | | | 3.60 | | | | 0.71 | | |
| Investment Grade Fixed Income Class I | | | 1,000.00 | | | | 1,057.50 | | | | 1,020.76 | | | | 4.44 | | | | 4.36 | | | | 0.86 | | |
| Investment Grade Fixed Income Class P | | | 1,000.00 | | | | 1,056.80 | | | | 1,019.45 | | | | 5.77 | | | | 5.67 | | | | 1.12 | | |
| Investment Grade Fixed Income Class H | | | 1,000.00 | | | | 1,056.30 | | | | 1,019.40 | | | | 5.82 | | | | 5.72 | | | | 1.13 | | |
| Investment Grade Fixed Income Class L | | | 1,000.00 | | | | 1,056.10 | | | | 1,018.25 | | | | 7.01 | | | | 6.88 | | | | 1.36 | | |
| Limited Duration Class I | | | 1,000.00 | | | | 1,022.30 | | | | 1,021.81 | | | | 3.30 | | | | 3.29 | | | | 0.65 | | |
| Limited Duration Class P | | | 1,000.00 | | | | 1,022.30 | | | | 1,020.61 | | | | 4.51 | | | | 4.51 | | | | 0.89 | | |
| Long Duration Fixed Income Class I | | | 1,000.00 | | | | 1,142.00 | | | | 1,022.56 | | | | 2.68 | | | | 2.54 | | | | 0.50 | | |
| Long Duration Fixed income Class P | | | 1,000.00 | | | | 1,140.80 | | | | 1,021.31 | | | | 4.02 | | | | 3.80 | | | | 0.75 | | |
* Expenses are calculated using each Portfolio Class' annualized net expense ratio (as disclosed), multiplied by the average account value over the period, and multiplied by 183/365 (to reflect the most recent one-half year period).
** Annualized.
5
2010 Annual Report
September 30, 2010
Investment Overview (unaudited)
Balanced Portfolio
Performance
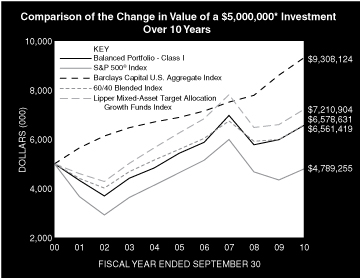
For the fiscal year ended September 30, 2010, the Portfolio's Class I had a total return based on net asset value and reinvestment of distributions per share of 9.77%, net of fees. The Portfolio's Class I underperformed against the S&P 500® Index which returned 10.16%, outperformed against the Barclays Capital U.S. Aggregate Index which returned 8.16% and underperformed against the 60/40 Blended Index (the "Blended Index"), a blend of 60% S&P 500® Index and 40% Barclays Capital U.S. Aggregate Index which returned 9.82%.
Factors Affecting Performance
• During the fourth quarter of 2009, global financial markets continued their climb higher, despite unemployment's rise to 10% in the U.S. and the default of government-owned Dubai World. While shaken, investor sentiment remained positive through the end of 2009, as global economic data surprised to the upside. At the start of 2010, global equity markets began to stumble over rapidly deteriorating fiscal conditions within peripheral European countries. However, equity markets bounced back in the second half of the first quarter, as Greece announced austerity plans and talks between Greece, the European Union, and the International Monetary Fund (IMF) were positive. Just as conditions in Europe appeared to be improving, however, concerns over sovereign debt reemerged in the second quarter of 2010, causing the equity market to fall. Sovereign debt credit default swap spreads for these troubled nations soared to new highs during the quarter, with Greece spiking above 11% and Portugal rising past 4.5%. Amidst these developments, the European Union and the IMF announced a $1 trillion emergency funding package in an effort to quell market fears. Although concerns over a double-dip recession remained, European bank stress test results in the third quarter of 2010 signaled that the worst of the European debt crisis had passed, prompting an equity rally. However, sentiment quickly reversed as global economic data began to disappoint. As the quarter came to a close, the expectation of additional quantitative easing from the U.S. Federal Reserve caused the S&P 500® Index to rally 8.8% in the month of September, ending the quarter up 11.3%.
• Regarding the Portfolio's overall performance relative to the Index, an overweight position in global equities positively influenced returns as equity markets continued the rally that began in March 2009.
• Within U.S. equities, sector selection was beneficial to performance. The Portfolio's overweight positions to consumer discretionary and information technology at the end of 2009 contributed to performance as cyclical stocks led the market higher. In addition, as sovereign debt concerns in Europe dragged the market lower in the second quarter of 2010, an underweight position to financials added to relative performance versus the Index.
• Within currencies, tactical allocations to the Canadian dollar and Australian dollar added to returns. These commodity-linked currencies outperformed recently as commodity prices rose off their lows.
• Security selection within U.S. core fixed income positively affected relative returns. Overweight positions to the credit and mortgage sectors added to performance as 10-year Treasury yields fell to 2.5%.
• However, the Portfolio's tactical underweight to fixed income during the year detracted from performance. Underperformance was primarily due to an underweight position in the first half of 2010. During this period, yields on spread products fell significantly, resulting in their outperformance versus global equities.
• Within currencies, tactical weightings to the U.S. dollar detracted from performance for the year. An underweight to the U.S. dollar during the beginning of 2010 dampened returns, as investors sought safety in the U.S. during the European sovereign debt crisis, though these losses were partly offset by gains from the same positioning in the third quarter of 2010.
Management Strategies
• Given the current market environment, we believe that the U.S. dollar will continue to devalue as nations enter a "race to the bottom" in global currencies. As such, we believe emerging market equities are likely to benefit. Looking ahead, we expect interest rates to remain low as growth
6
2010 Annual Report
September 30, 2010
Investment Overview (unaudited) (cont'd)
Balanced Portfolio
comparisons become more challenging over the next 12 months. That said, we believe investors will flock toward investments that offer both yield and growth. Companies, currencies, and sovereigns that are 1) showing rising returns, 2) returning cash to investors, and 3) exhibiting the potential for steady growth are likely to enjoy substantial re-rating in the quarters and years ahead, in our opinion. Against this backdrop, the Portfolio holds an overweight position to equities and an underweight position in fixed income as of the new the fiscal year begins.
• Within equities, the Portfolio maintains overweight positions in U.S. and emerging market equities. We believe U.S. equities should continue to benefit from the expectation of quantitative easing in the near-term, while emerging markets should benefit from investors looking for growth potential above that offered in developed nations. Within Asia, the Portfolio maintains an overweight position to Hong Kong equities against an underweight to Singapore equities. In our estimation, Hong Kong is currently inexpensive relative to Singapore on both a price-to-earnings and price-to-book value basis. In addition, Singapore's industrial production has recently fallen substantially from its highs, while Hong Kong's industrial production has continued to improve.
• Within U.S. equities, we maintain a relative value trade of overweight utilities and underweight the S&P 500® Index. We believe higher-yielding securities should continue to outperform due to the uncertainty in the market. We also intend to initiate a pair trade of overweight U.S. diversified financials and underweight European banks. The performance of European banks is likely to be hampered in the near-term as investors digest increasing speculation that more banks will need government aid or will need to raise cash in the market.
• Within fixed income, we continue view spread products favorably, as additional quantitative easing should place downward pressure on yields and spreads should narrow.
* Minimum Investment
In accordance with SEC regulations, the Portfolio's performance shown assumes that all recurring fees (including management fees) were deducted and all dividends and distributions were reinvested. The performance of Investment Class and Class P shares will vary from the Class I shares based upon their different inception dates and will be negatively impacted by additional fees assessed to those classes.
Performance Compared to the S&P 500® Index(1), the Barclays Capital U.S. Aggregate Index(2), 60/40 Blended Index(3), the Lipper Mixed-Asset Target Allocation Growth Funds Index(4)
| | | Total Returns(5) | |
| | | | | Average Annual | |
| | | One
Year | | Five
Years | | Ten
Years | | Since
Inception(9) | |
Portfolio — Class I
w/o sales charges(6) | | | 9.77 | % | | | 3.87 | % | | | 2.75 | % | | | 7.23 | % | |
| S&P 500® Index | | | 10.16 | | | | 0.64 | | | | –0.43 | | | | 7.65 | | |
Barclays Capital U.S. Aggregate
Index | | | 8.16 | | | | 6.20 | | | | 6.41 | | | | 6.55 | | |
| 60/40 Blended Index | | | 9.82 | | | | 3.32 | | | | 2.78 | | | | 7.62 | | |
Lipper Mixed-Asset Target
Allocation Growth Funds Index | | | 9.41 | | | | 2.87 | | | | 3.73 | | | | 7.35 | | |
Portfolio — Investment Class
w/o sales charges(7) | | | 9.62 | | | | 3.72 | | | | 2.57 | | | | 5.63 | | |
| S&P 500® Index | | | 10.16 | | | | 0.64 | | | | –0.43 | | | | 4.98 | | |
Barclays Capital U.S. Aggregate
Index | | | 8.16 | | | | 6.20 | | | | 6.41 | | | | 6.58 | | |
| 60/40 Blended Index | | | 9.82 | | | | 3.32 | | | | 2.78 | | | | 6.14 | | |
Lipper Mixed-Asset Target
Allocation Growth Funds Index | | | 9.41 | | | | 2.87 | | | | 3.73 | | | | 5.85 | | |
7
2010 Annual Report
September 30, 2010
Investment Overview (unaudited) (cont'd)
Balanced Portfolio
| | | Total Returns(5) | |
| | | | | Average Annual | |
| | | One
Year | | Five
Years | | Ten
Years | | Since
Inception(9) | |
Portfolio — Class P
w/o sales charges(8) | | | 9.52 | % | | | 3.59 | % | | | 2.49 | % | | | 5.72 | % | |
| S&P 500® Index | | | 10.16 | | | | 0.64 | | | | –0.43 | | | | 5.37 | | |
Barclays Capital U.S. Aggregate
Index | | | 8.16 | | | | 6.20 | | | | 6.41 | | | | 6.42 | | |
| 60/40 Blended Index | | | 9.82 | | | | 3.32 | | | | 2.78 | | | | 6.30 | | |
Lipper Mixed-Asset Target
Allocation Growth Funds Index | | | 9.41 | | | | 2.87 | | | | 3.73 | | | | 6.00 | | |
Performance data quoted represents past performance, which is no guarantee of future results, and current performance may be lower or higher than the figures shown. Performance assumes that all dividends and distributions, if any, were reinvested. For the most recent month-end performance figures, please visit www.morganstanley.com/im. Investment returns and principal value will fluctuate so that Portfolio shares, when redeemed, may be worth more or less than their original cost. Total returns do not reflect the deduction of taxes that a shareholder would pay on Portfolio distributions or the redemption of Portfolio shares. Performance of share classes will vary due to differences in sales charges and expenses.
(1) The Standard & Poor's 500® Index (S&P 500®) measures the performance of the large cap segment of the U.S. equities market, covering approximately 75% of the U.S. equities market. The Index includes 500 leading companies in leading industries of the U.S. economy. The Index is unmanaged and its returns do not include any sales charges or fees. Such costs would lower performance. It is not possible to invest directly in an index.
(2) The Barclays Capital U.S. Aggregate Index tracks the performance of all U.S. government agency and Treasury securities, investment-grade corporate debt securities, agency mortgage-backed securities, asset-backed securities and commercial mortgage-backed securities. The Index is unmanaged and its returns do not include any sales charges or fees. Such costs would lower performance. It is not possible to invest directly in an index.
(3) The 60/40 Blended Index is comprised of 60% S&P 500® Index and 40% Barclays Capital U.S. Aggregate Index.
(4) The Lipper Mixed-Asset Target Allocation Growth Funds Index is an equally-weighted performance index of the largest qualifying funds (based on net assets) in the Lipper Mixed-Asset Target Allocation Growth Funds classification. The Index, which is adjusted for capital gains distributions and income dividends, is unmanaged and should not be considered an investment. There are currently 30 funds represented in this Index. As of the date of this report, the Portfolio was in the Lipper Mixed-Asset Target Allocation Growth Funds classification.
(5) Total returns for the Portfolio reflect expenses waived and/or reimbursed, if applicable, by the Adviser. Without such waivers and/or reimbursements, total returns would have been lower. Fee waivers and/or reimbursements are voluntary and the Adviser reserves the right to commence or terminate any waiver and/or reimbursement at any time.
(6) Commenced operations on December 31, 1992.
(7) Commenced operations on April 3, 1997.
(8) Commenced operations on November 1, 1996.
(9) For comparative purposes, average annual since inception returns listed for the Indexes refer to the inception date or initial offering of the respective share class of the Portfolio, not the inception of the Indexes.
Portfolio Composition*
| Classification | | Percentage of
Total Investments | |
| Common Stocks | | | 51.0 | % | |
| Fixed Income Securities | | | 37.0 | | |
| Short-Term Investments | | | 11.8 | | |
| Other** | | | 0.2 | | |
| Total Investments | | | 100.0 | % | |
* Percentages indicated are based upon total investments (excluding Securities held as collateral on Loaned Securities) as of September 30, 2010.
** Investment types representing less than 5% of total investments.
8
2010 Annual Report
September 30, 2010
Portfolio of Investments
Balanced Portfolio
| | | Face
Amount
(000) | | Value
(000) | |
| Fixed Income Securities (38.4%) | |
| Agency Adjustable Rate Mortgages (0.3%) | |
| Federal Home Loan Mortgage Corp., | |
| Conventional Pools: | |
| 6.04%, 2/1/37 | | $ | 31 | | | $ | 32 | | |
| Federal National Mortgage Association, | |
| Conventional Pools: | |
| 2.61%, 5/1/35 | | | 75 | | | | 79 | | |
| 5.74%, 3/1/38 | | | 23 | | | | 25 | | |
| | | | 136 | | |
| Agency Bond — Banking (FDIC Guaranteed) (1.0%) | |
| Ally Financial, Inc. | |
| 2.20%, 12/19/12 | | | 450 | | | | 465 | | |
| Agency Fixed Rate Mortgages (11.3%) | |
| Federal Home Loan Mortgage Corp., | |
| Gold Pools: | |
| 5.00%, 10/1/35 | | | 463 | | | | 489 | | |
| 6.00%, 8/1/38 | | | 27 | | | | 29 | | |
| 7.50%, 5/1/35 | | | 20 | | | | 23 | | |
| 8.00%, 8/1/32 | | | 20 | | | | 23 | | |
| 8.50%, 8/1/31 | | | 21 | | | | 24 | | |
| October TBA: | |
| 4.50%, 10/25/40 (a) | | | 145 | | | | 151 | | |
| Federal National Mortgage Association, | |
| Conventional Pools: | |
| 5.00%, 9/1/39 (a) | | | 164 | | | | 173 | | |
| 5.50%, 11/1/35 - 8/1/38 | | | 1,035 | | | | 1,106 | | |
| 6.00%, 4/1/38 - 12/1/38 | | | 621 | | | | 671 | | |
| 6.50%, 10/1/38 - 2/1/39 | | | 398 | | | | 438 | | |
| 7.50%, 8/1/37 | | | 40 | | | | 46 | | |
| 8.00%, 4/1/33 | | | 20 | | | | 23 | | |
| 8.50%, 10/1/32 | | | 20 | | | | 23 | | |
| November TBA: | |
| 4.50%, 11/25/40 (a) | | | 550 | | | | 572 | | |
| October TBA: | | | | | | | | | |
| 4.00%, 10/25/25 (a) | | | 85 | | | | 89 | | |
| Government National Mortgage Association, | |
| November TBA: | |
| 4.00%, 11/25/40 (a) | | | 750 | | | | 773 | | |
| 4.50%, 11/25/40 (a) | | | 270 | | | | 283 | | |
| Various Pools: | |
| 4.50%, 5/15/40 | | | 163 | | | | 172 | | |
| | | | 5,108 | | |
| Asset-Backed Securities (0.2%) | |
| Brazos Student Finance Corp. | |
| 1.19%, 6/25/35 (b) | | | 14 | | | | 14 | | |
| Westlake Automobile Receivables Trust | |
| 5.00%, 5/15/15 (c) | | | 75 | | | | 75 | | |
| | | | 89 | | |
| Collateralized Mortgage Obligations — Agency Collateral Series (0.3%) | |
| Federal Home Loan Mortgage Corp., | |
| IO STRIPS | |
| 7.49%, 5/15/36 (b) | | | 309 | | | | 50 | | |
| | | Face
Amount
(000) | | Value
(000) | |
| Federal National Mortgage Association, | |
| IO REMIC | |
| 5.00%, 8/25/37 | | $ | 166 | | | $ | 15 | | |
| 6.44%, 2/25/24 (b) | | | 185 | | | | 21 | | |
| Goverment National Mortgage Association, | |
| IO STRIPS | |
| 5.79%, 9/20/40 (a) | | | 300 | | | | 46 | | |
| | | | 132 | | |
| Commercial Mortgage Backed Securities (1.3%) | |
| Citigroup Commercial Mortgage Trust, (Note G) | |
| 5.89%, 12/10/49 (b) | | | 100 | | | | 107 | | |
| 5.92%, 3/15/49 (b) | | | 25 | | | | 28 | | |
| 6.29%, 12/10/49 (b) | | | 50 | | | | 54 | | |
| Commercial Mortgage Pass Through Certificates | |
| 6.01%, 12/10/49 (b) | | | 50 | | | | 55 | | |
| Greenwich Capital Commercial Funding Corp. | |
| 5.44%, 3/10/39 | | | 40 | | | | 42 | | |
| Goldman Sachs Mortgage Securities Corp. II | |
| 5.55%, 4/10/38 (b) | | | 40 | | | | 43 | | |
JP Morgan Chase Commercial Mortgage
Securities Corp. | |
| 5.34%, 5/15/47 | | | 50 | | | | 52 | | |
| Lehman Brothers-UBS Commercial Mortgage Trust, | |
| 5.16%, 2/15/31 | | | 80 | | | | 87 | | |
| 5.37%, 9/15/39 | | | 100 | | | | 109 | | |
| | | | 577 | | |
| Corporate Bonds (11.3%) | |
| Finance (6.5%) | |
| Abbey National Treasury Services PLC | |
| 3.88%, 11/10/14 (c) | | | 100 | | | | 102 | | |
| Aflac, Inc. | |
| 3.45%, 8/15/15 (d) | | | 20 | | | | 21 | | |
| American Express Co. | |
| 8.13%, 5/20/19 | | | 105 | | | | 136 | | |
| Bank of America Corp., | |
| 5.63%, 7/1/20 | | | 35 | | | | 37 | | |
| 5.65%, 5/1/18 | | | 115 | | | | 122 | | |
| Barclays Bank PLC | |
| 6.75%, 5/22/19 | | | 150 | | | | 179 | | |
| BioMed Realty LP | |
| 6.13%, 4/15/20 (c) | | | 25 | | | | 27 | | |
| Boston Properties LP | |
| 5.88%, 10/15/19 | | | 25 | | | | 28 | | |
| Brookfield Asset Management, Inc. | |
| 5.80%, 4/25/17 | | | 35 | | | | 37 | | |
| Capital One Financial Corp. | |
| 6.75%, 9/15/17 (d) | | | 75 | | | | 90 | | |
| Citigroup, Inc., (Note G) | |
| 6.13%, 5/15/18 | | | 100 | | | | 109 | | |
| 8.50%, 5/22/19 | | | 25 | | | | 31 | | |
| Commonwealth Bank of Australia | |
| 5.00%, 10/15/19 (c)(d) | | | 40 | | | | 43 | | |
The accompanying notes are an integral part of the financial statements.
9
2010 Annual Report
September 30, 2010
Portfolio of Investments (cont'd)
Balanced Portfolio
| | | Face
Amount
(000) | | Value
(000) | |
| Finance (cont'd) | |
| Credit Agricole SA | |
| 3.50%, 4/13/15 (c) | | $ | 100 | | | $ | 103 | | |
| Credit Suisse AG | |
| 5.40%, 1/14/20 | | | 85 | | | | 91 | | |
| Duke Realty LP | |
| 6.75%, 3/15/20 (d) | | | 50 | | | | 56 | | |
| General Electric Capital Corp., | |
| 5.88%, 1/14/38 | | | 100 | | | | 102 | | |
| 6.00%, 8/7/19 (d) | | | 25 | | | | 28 | | |
| Goldman Sachs Group, Inc. (The), | |
| 6.15%, 4/1/18 | | | 115 | | | | 128 | | |
| 7.50%, 2/15/19 | | | 25 | | | | 30 | | |
| Hartford Financial Services Group, Inc. | |
| 5.50%, 3/30/20 | | | 35 | | | | 36 | | |
| Health Care REIT, Inc. | |
| 6.13%, 4/15/20 | | | 25 | | | | 27 | | |
| HSBC Bank PLC | |
| 3.50%, 6/28/15 (c) | | | 100 | | | | 105 | | |
| JPMorgan Chase & Co., | |
| 4.95%, 3/25/20 | | | 25 | | | | 27 | | |
| 6.30%, 4/23/19 | | | 75 | | | | 87 | | |
| Lloyds TSB Bank PLC | |
| 5.80%, 1/13/20 (c) | | | 100 | | | | 105 | | |
| Macquarie Group Ltd. | |
| 6.00%, 1/14/20 (c)(d) | | | 45 | | | | 47 | | |
| MetLife, Inc. | |
| 7.72%, 2/15/19 (d) | | | 35 | | | | 45 | | |
| NASDAQ OMX Group, Inc. (The) | |
| 5.55%, 1/15/20 | | | 50 | | | | 53 | | |
| Pacific LifeCorp | |
| 6.00%, 2/10/20 (c) | | | 25 | | | | 27 | | |
| PNC Funding Corp. | |
| 6.70%, 6/10/19 | | | 50 | | | | 59 | | |
| Prudential Financial, Inc. | |
| 7.38%, 6/15/19 | | | 70 | | | | 85 | | |
| Regions Financial Corp. | |
| 5.75%, 6/15/15 (d) | | | 40 | | | | 41 | | |
| Reinsurance Group of America, Inc. | |
| 6.45%, 11/15/19 | | | 50 | | | | 56 | | |
| Standard Chartered PLC | |
| 3.85%, 4/27/15 (c) | | | 100 | | | | 104 | | |
| UnitedHealth Group, Inc. | |
| 6.63%, 11/15/37 | | | 90 | | | | 105 | | |
US Central Federal Credit Union (U.S.
Government Guaranteed) | |
| 1.90%, 10/19/12 (d) | | | 250 | | | | 257 | | |
WEA Finance LLC/WT Finance Australia
Property Ltd. | |
| 6.75%, 9/2/19 (c) | | | 50 | | | | 59 | | |
| Wells Fargo & Co. | |
| 5.63%, 12/11/17 | | | 70 | | | | 80 | | |
| Westpac Banking Corp. | |
| 3.00%, 8/4/15 (d) | | | 35 | | | | 36 | | |
| | | | 2,941 | | |
| | | Face
Amount
(000) | | Value
(000) | |
| Industrials (4.1%) | |
| Anadarko Petroleum Corp. | |
| 6.95%, 6/15/19 (d) | | $ | 20 | | | $ | 22 | | |
| ArcelorMittal | |
| 9.85%, 6/1/19 (d) | | | 25 | | | | 32 | | |
| AT&T, Inc. | |
| 6.30%, 1/15/38 | | | 80 | | | | 91 | | |
| AutoNation, Inc. | |
| 6.75%, 4/15/18 (d) | | | 50 | | | | 52 | | |
| Comcast Corp. | |
| 5.70%, 5/15/18 | | | 110 | | | | 126 | | |
| CVS Caremark Corp. | |
| 6.60%, 3/15/19 (d) | | | 80 | | | | 97 | | |
| Darden Restaurants, Inc. | |
| 6.20%, 10/15/17 | | | 50 | | | | 59 | | |
| Delhaize America, Inc. | |
| 9.00%, 4/15/31 | | | 65 | | | | 92 | | |
| DirecTV Holdings LLC/DirecTV Financing Co., Inc. | |
| 5.88%, 10/1/19 | | | 35 | | | | 40 | | |
| DISH DBS Corp. | |
| 7.13%, 2/1/16 | | | 35 | | | | 37 | | |
| Frontier Communications Corp. | |
| 8.50%, 4/15/20 | | | 55 | | | | 61 | | |
| Hess Corp. | |
| 6.00%, 1/15/40 | | | 35 | | | | 39 | | |
| Home Depot, Inc. | |
| 5.88%, 12/16/36 (d) | | | 30 | | | | 32 | | |
| JC Penney Co., Inc. | |
| 5.65%, 6/1/20 (d) | | | 10 | | | | 10 | | |
| JC Penney Corp., Inc. | |
| 6.38%, 10/15/36 | | | 28 | | | | 27 | | |
| Kohl's Corp. | |
| 6.88%, 12/15/37 | | | 30 | | | | 37 | | |
| Kraft Foods, Inc. | |
| 7.00%, 8/11/37 | | | 80 | | | | 99 | | |
| Lafarge SA | |
| 5.50%, 7/9/15 (c) | | | 80 | | | | 84 | | |
| Mosaic Co. (The) | |
| 7.63%, 12/1/16 (c) | | | 75 | | | | 81 | | |
| NBC Universal, Inc. | |
| 5.15%, 4/30/20 (c) | | | 55 | | | | 60 | | |
| News America, Inc. | |
| 7.85%, 3/1/39 | | | 60 | | | | 77 | | |
| Omnicom Group, Inc. | |
| 4.45%, 8/15/20 | | | 45 | | | | 46 | | |
| Petrobras International Finance Co. | |
| 5.75%, 1/20/20 (d) | | | 90 | | | | 100 | | |
| QEP Resources, Inc. | |
| 6.88%, 3/1/21 | | | 15 | | | | 16 | | |
| Qwest Corp. | |
| 6.50%, 6/1/17 | | | 30 | | | | 33 | | |
| Rio Tinto Finance USA Ltd. | |
| 9.00%, 5/1/19 (d) | | | 60 | | | | 84 | | |
The accompanying notes are an integral part of the financial statements.
10
2010 Annual Report
September 30, 2010
Portfolio of Investments (cont'd)
Balanced Portfolio
| | | Face
Amount
(000) | | Value
(000) | |
| Industrials (cont'd) | |
| Southern Copper Corp., | |
| 5.38%, 4/16/20 (d) | | $ | 15 | | | $ | 16 | | |
| 6.75%, 4/16/40 | | | 15 | | | | 17 | | |
| Telecom Italia Capital SA | |
| 7.18%, 6/18/19 (d) | | | 40 | | | | 47 | | |
| Time Warner Cable, Inc. | |
| 8.25%, 4/1/19 | | | 25 | | | | 32 | | |
| Verizon Communications, Inc. | |
| 8.95%, 3/1/39 | | | 115 | | | | 169 | | |
| Weatherford International Ltd. | |
| 9.63%, 3/1/19 (d) | | | 35 | | | | 46 | | |
| Xerox Corp. | |
| 5.63%, 12/15/19 | | | 20 | | | | 22 | | |
| | | | 1,883 | | |
| Utilities (0.7%) | |
| EDF SA | |
| 4.60%, 1/27/20 (c)(d) | | | 25 | | | | 27 | | |
| Energy Transfer Partners LP | |
| 9.00%, 4/15/19 | �� | | 25 | | | | 32 | | |
| Enterprise Products Operating LLC | |
| 5.20%, 9/1/20 (d) | | | 50 | | | | 54 | | |
| EQT Corp. | |
| 8.13%, 6/1/19 | | | 25 | | | | 31 | | |
| Exelon Generation Co. LLC | |
| 6.25%, 10/1/39 | | | 75 | | | | 81 | | |
| FirstEnergy Solutions Corp. | |
| 6.05%, 8/15/21 | | | 40 | | | | 43 | | |
| Plains All American Pipeline LP/PAA Finance Corp. | |
| 8.75%, 5/1/19 (d) | | | 30 | | | | 38 | | |
| | | | 306 | | |
| | | | 5,130 | | |
| Mortgages — Other (1.4%) | |
| Banc of America Alternative Loan Trust | |
| 5.25%, 1/25/21 | | | 108 | | | | 105 | | |
Countrywide Home Loan Mortgage Pass
Through Trust | |
| 6.00%, 8/25/37 | | | 105 | | | | 85 | | |
| First Horizon Alternative Mortgage Securities, | |
| 5.00%, 11/25/20 | | | 64 | | | | 65 | | |
| 6.25%, 8/25/36 | | | 49 | | | | 39 | | |
| GMAC Mortgage Corp. Loan Trust, | |
| 4.25%, 7/25/40 (c) | | | 123 | | | | 126 | | |
| 5.75%, 4/25/36 | | | 38 | | | | 36 | | |
| JP Morgan Mortgage Trust | |
| 6.00%, 6/25/37 | | | 47 | | | | 41 | | |
| Lehman Mortgage Trust | |
| 5.50%, 2/25/36 | | | 50 | | | | 44 | | |
| Structured Adjustable Rate Mortgage Loan Trust | |
| 2.65%, 1/25/35 (b) | | | 54 | | | | 42 | | |
| WaMu Mortgage Pass Through Certificates | |
| 2.77%, 9/25/35 (b) | | | 50 | | | | 43 | | |
| | | | 626 | | |
| | | Face
Amount
(000) | | Value
(000) | |
| Municipal Bonds (0.5%) | |
| Chicago Transit Authority | |
| 6.20%, 12/1/40 | | $ | 20 | | | $ | 20 | | |
| City of Chicago | |
| 6.40%, 1/1/40 | | | 10 | | | | 11 | | |
| City of New York | |
| 5.97%, 3/1/36 | | | 15 | | | | 16 | | |
Illinois State Toll Highway Authority, Highway
Revenue, Build America Bonds | |
| 6.18%, 1/1/34 | | | 50 | | | | 54 | | |
| Municipal Electric Authority of Georgia, | |
| 6.64%, 4/1/57 | | | 20 | | | | 22 | | |
| 6.66%, 4/1/57 | | | 30 | | | | 32 | | |
| New York City Transitional Finance Authority | |
| 5.27%, 5/1/27 | | | 15 | | | | 16 | | |
| State of California, General Obligation Bonds | |
| 5.95%, 4/1/16 | | | 40 | | | | 44 | | |
| | | | 215 | | |
| U.S. Agency Securities (1.3%) | |
| Federal Home Loan Mortgage Corp., | |
| 2.50%, 1/7/14 | | | 400 | | | | 420 | | |
| 4.88%, 6/13/18 | | | 150 | | | | 177 | | |
| | | | 597 | | |
| U.S. Treasury Securities (9.5%) | |
| U.S. Treasury Bonds, | |
| 4.38%, 11/15/39 | | | 300 | | | | 337 | | |
| 4.63%, 2/15/40 (d) | | | 120 | | | | 140 | | |
| 6.88%, 8/15/25 | | | 30 | | | | 43 | | |
| 7.50%, 11/15/24 | | | 510 | | | | 773 | | |
| U.S. Treasury Notes, | |
| 1.75%, 7/31/15 (d) | | | 400 | | | | 410 | | |
| 2.63%, 12/31/14 | | | 800 | | | | 852 | | |
| 3.00%, 8/31/16 - 9/30/16 | | | 350 | | | | 378 | | |
| 3.25%, 12/31/16 | | | 500 | | | | 546 | | |
| 3.38%, 11/15/19 | | | 50 | | | | 54 | | |
| 3.63%, 8/15/19 | | | 690 | | | | 759 | | |
| | | | 4,292 | | |
| Total Fixed Income Securities (Cost $16,388) | | | 17,367 | | |
| | | Shares | | | |
| Common Stocks (52.9%) | |
| Aerospace & Defense (1.3%) | |
| Boeing Co. (The) (d) | | | 1,096 | | | | 73 | | |
| General Dynamics Corp. | | | 655 | | | | 41 | | |
| Goodrich Corp. | | | 149 | | | | 11 | | |
| Honeywell International, Inc. | | | 1,193 | | | | 52 | | |
| ITT Corp. (d) | | | 398 | | | | 19 | | |
| L-3 Communications Holdings, Inc. | | | 300 | | | | 22 | | |
| Lockheed Martin Corp. | | | 350 | | | | 25 | | |
| Northrop Grumman Corp. (d) | | | 1,700 | | | | 103 | | |
| Precision Castparts Corp. (d) | | | 249 | | | | 32 | | |
| Raytheon Co. (d) | | | 2,050 | | | | 94 | | |
| Rockwell Collins, Inc. (d) | | | 298 | | | | 17 | | |
| United Technologies Corp. | | | 1,392 | | | | 99 | | |
| | | | 588 | | |
The accompanying notes are an integral part of the financial statements.
11
2010 Annual Report
September 30, 2010
Portfolio of Investments (cont'd)
Balanced Portfolio
| | | Shares | | Value
(000) | |
| Air Freight & Logistics (0.4%) | |
| C.H. Robinson Worldwide, Inc. | | | 200 | | | $ | 14 | | |
| Expeditors International of Washington, Inc. (d) | | | 100 | | | | 5 | | |
| FedEx Corp. (d) | | | 600 | | | | 51 | | |
| United Parcel Service, Inc., Class B | | | 1,596 | | | | 106 | | |
| | | | 176 | | |
| Airlines (0.1%) | |
| Southwest Airlines Co. | | | 1,700 | | | | 22 | | |
| Auto Components (0.1%) | |
| Johnson Controls, Inc. (d) | | | 1,700 | | | | 52 | | |
| Automobiles (0.2%) | |
| Ford Motor Co. (e) | | | 7,702 | | | | 94 | | |
| Motors Liquidation Co. (d)(e) | | | 2,200 | | | | 1 | | |
| | | | 95 | | |
| Beverages (1.4%) | |
| Coca-Cola Co. (The) | | | 2,774 | | | | 162 | | |
| PepsiCo, Inc. (d) | | | 7,201 | | | | 479 | | |
| | | | 641 | | |
| Biotechnology (0.4%) | |
| Amgen, Inc. (e) | | | 1,197 | | | | 66 | | |
| Biogen Idec, Inc. (d)(e) | | | 348 | | | | 19 | | |
| Celgene Corp. (d)(e) | | | 497 | | | | 29 | | |
| Genzyme Corp. (d)(e) | | | 633 | | | | 45 | | |
| Gilead Sciences, Inc. (d)(e) | | | 944 | | | | 33 | | |
| | | | 192 | | |
| Capital Markets (0.9%) | |
| Ameriprise Financial, Inc. (d) | | | 573 | | | | 27 | | |
| Bank of New York Mellon Corp. (The) | | | 1,700 | | | | 45 | | |
| Charles Schwab Corp. (The) | | | 1,660 | | | | 23 | | |
| Franklin Resources, Inc. (d) | | | 873 | | | | 93 | | |
| Goldman Sachs Group, Inc. (The) (d) | | | 756 | | | | 109 | | |
| Invesco Ltd. (d) | | | 1,536 | | | | 33 | | |
| Northern Trust Corp. | | | 420 | | | | 20 | | |
| State Street Corp. | | | 700 | | | | 26 | | |
| T. Rowe Price Group, Inc. (d) | | | 348 | | | | 18 | | |
| | | | 394 | | |
| Chemicals (0.8%) | |
| Air Products & Chemicals, Inc. (d) | | | 449 | | | | 37 | | |
| Dow Chemical Co. (The) (d) | | | 1,700 | | | | 47 | | |
| Ecolab, Inc. | | | 447 | | | | 22 | | |
| EI du Pont de Nemours & Co. (d) | | | 3,742 | | | | 167 | | |
| Monsanto Co. (d) | | | 669 | | | | 32 | | |
| PPG Industries, Inc. (d) | | | 449 | | | | 33 | | |
| Praxair, Inc. | | | 398 | | | | 36 | | |
| | | | 374 | | |
| Commercial Banks (1.3%) | |
| BB&T Corp. (d) | | | 1,700 | | | | 41 | | |
| Fifth Third Bancorp (d) | | | 2,200 | | | | 27 | | |
| KeyCorp (d) | | | 1,100 | | | | 9 | | |
| M&T Bank Corp. (d) | | | 200 | | | | 16 | | |
| PNC Financial Services Group, Inc. | | | 1,500 | | | | 78 | | |
| Regions Financial Corp. (d) | | | 2,800 | | | | 20 | | |
| | | Shares | | Value
(000) | |
| SunTrust Banks, Inc. (d) | | | 700 | | | $ | 18 | | |
| US Bancorp | | | 5,700 | | | | 123 | | |
| Wells Fargo & Co. | | | 10,100 | | | | 254 | | |
| | | | 586 | | |
| Commercial Services & Supplies (0.3%) | |
| Republic Services, Inc. (d) | | | 746 | | | | 23 | | |
| Waste Management, Inc. (d) | | | 3,400 | | | | 121 | | |
| | | | 144 | | |
| Communications Equipment (1.2%) | |
| Cisco Systems, Inc. (e) | | | 17,671 | | | | 387 | | |
| Juniper Networks, Inc. (d)(e) | | | 795 | | | | 24 | | |
| Motorola, Inc. (d)(e) | | | 1,000 | | | | 8 | | |
| QUALCOMM, Inc. | | | 2,187 | | | | 99 | | |
| | | | 518 | | |
| Computers & Peripherals (2.2%) | |
| Apple, Inc. (e) | | | 1,099 | | | | 312 | | |
| Dell, Inc. (d)(e) | | | 800 | | | | 10 | | |
| EMC Corp. (d)(e) | | | 2,784 | | | | 56 | | |
| Hewlett-Packard Co. | | | 7,945 | | | | 334 | | |
| NetApp, Inc. (d)(e) | | | 497 | | | | 25 | | |
| SanDisk Corp. (e) | | | 100 | | | | 4 | | |
| Western Digital Corp. (e) | | | 8,447 | | | | 240 | | |
| | | | 981 | | |
| Construction & Engineering (0.0%) | |
| Fluor Corp. (d) | | | 200 | | | | 10 | | |
| Consumer Finance (0.5%) | |
| American Express Co. (d) | | | 4,164 | | | | 175 | | |
| Capital One Financial Corp. | | | 600 | | | | 24 | | |
| Discover Financial Services (d) | | | 300 | | | | 5 | | |
| | | | 204 | | |
| Distributors (0.2%) | |
| Genuine Parts Co. (d) | | | 1,900 | | | | 85 | | |
| Diversified Financial Services (1.4%) | |
| Bank of America Corp. | | | 13,178 | | | | 173 | | |
| Citigroup, Inc. (Note G) (e) | | | 29,300 | | | | 114 | | |
| CME Group, Inc. (d) | | | 91 | | | | 24 | | |
| IntercontinentalExchange, Inc. (e) | | | 50 | | | | 5 | | |
| JPMorgan Chase & Co. (d) | | | 8,000 | | | | 305 | | |
| Moody's Corp. (d) | | | 100 | | | | 2 | | |
| NYSE Euronext | | | 100 | | | | 3 | | |
| | | | 626 | | |
| Diversified Telecommunication Services (1.3%) | |
| AT&T, Inc. | | | 8,767 | | | | 251 | | |
| Frontier Communications Corp. (d) | | | 1,584 | | | | 13 | | |
| Verizon Communications, Inc. (d) | | | 10,200 | | | | 332 | | |
| | | | 596 | | |
| Electric Utilities (1.3%) | |
| Allegheny Energy, Inc. (d) | | | 300 | | | | 7 | | |
| American Electric Power Co., Inc. | | | 1,400 | | | | 51 | | |
| DPL, Inc. (d) | | | 414 | | | | 11 | | |
| Duke Energy Corp. (d) | | | 3,728 | | | | 66 | | |
The accompanying notes are an integral part of the financial statements.
12
2010 Annual Report
September 30, 2010
Portfolio of Investments (cont'd)
Balanced Portfolio
| | | Shares | | Value
(000) | |
| Electric Utilities (cont'd) | |
| Edison International (d) | | | 1,372 | | | $ | 47 | | |
| Entergy Corp. | | | 424 | | | | 32 | | |
| Exelon Corp. (d) | | | 2,342 | | | | 100 | | |
| FirstEnergy Corp. (d) | | | 700 | | | | 27 | | |
| FPL Group, Inc. (d) | | | 1,100 | | | | 60 | | |
| Great Plains Energy, Inc. (d) | | | 610 | | | | 11 | | |
| IDACORP, Inc. | | | 273 | | | | 10 | | |
| ITC Holdings Corp. | | | 155 | | | | 10 | | |
| Pepco Holdings, Inc. (d) | | | 300 | | | | 5 | | |
| PPL Corp. (d) | | | 1,100 | | | | 30 | | |
| Progress Energy, Inc. (d) | | | 700 | | | | 31 | | |
| Southern Co. | | | 2,200 | | | | 82 | | |
| Unisource Energy Corp. | | | 378 | | | | 13 | | |
| | | | 593 | | |
| Electrical Equipment (0.7%) | |
| Emerson Electric Co. | | | 5,969 | | | | 314 | | |
| Electronic Equipment, Instruments & Components (0.6%) | |
| Agilent Technologies, Inc. (d)(e) | | | 200 | | | | 7 | | |
| Amphenol Corp., Class A (d) | | | 398 | | | | 19 | | |
| Corning, Inc. (d) | | | 14,287 | | | | 261 | | |
| | | | 287 | | |
| Energy Equipment & Services (0.9%) | |
| Baker Hughes, Inc. | | | 298 | | | | 13 | | |
| Cameron International Corp. (d)(e) | | | 497 | | | | 21 | | |
| Halliburton Co. | | | 5,736 | | | | 190 | | |
| National Oilwell Varco, Inc. | | | 845 | | | | 37 | | |
| Schlumberger Ltd. | | | 2,237 | | | | 138 | | |
| | | | 399 | | |
| Food & Staples Retailing (1.2%) | |
| Costco Wholesale Corp. (d) | | | 900 | | | | 58 | | |
| CVS Caremark Corp. (d) | | | 2,800 | | | | 88 | | |
| Kroger Co. (The) | | | 1,100 | | | | 24 | | |
| Safeway, Inc. (d) | | | 1,100 | | | | 23 | | |
| Sysco Corp. | | | 1,600 | | | | 46 | | |
| Wal-Mart Stores, Inc. | | | 4,400 | | | | 236 | | |
| Walgreen Co. | | | 1,468 | | | | 49 | | |
| | | | 524 | | |
| Food Products (1.0%) | |
| Archer-Daniels-Midland Co. (d) | | | 4,702 | | | | 150 | | |
| Campbell Soup Co. (d) | | | 2,800 | | | | 100 | | |
| ConAgra Foods, Inc. | | | 811 | | | | 18 | | |
| General Mills, Inc. | | | 968 | | | | 35 | | |
| H.J. Heinz Co. | | | 592 | | | | 28 | | |
| Kellogg Co. (d) | | | 532 | | | | 27 | | |
| Kraft Foods, Inc., Class A (d) | | | 2,948 | | | | 91 | | |
| Sara Lee Corp. | | | 1,078 | | | | 15 | | |
| | | | 464 | | |
| Gas Utilities (0.0%) | |
| Chesapeake Utilities Corp. (d) | | | 287 | | | | 10 | | |
| | | Shares | | Value
(000) | |
| Health Care Equipment & Supplies (0.5%) | |
| Baxter International, Inc. (d) | | | 922 | | | $ | 44 | | |
| Becton Dickinson and Co. (d) | | | 349 | | | | 26 | | |
| Boston Scientific Corp. (e) | | | 3,200 | | | | 20 | | |
| Covidien PLC | | | 100 | | | | 4 | | |
| Hospira, Inc. (d)(e) | | | 249 | | | | 14 | | |
| Intuitive Surgical, Inc. (d)(e) | | | 36 | | | | 10 | | |
| Medtronic, Inc. | | | 1,292 | | | | 43 | | |
| St. Jude Medical, Inc. (d)(e) | | | 398 | | | | 16 | | |
| Stryker Corp. (d) | | | 547 | | | | 27 | | |
| Zimmer Holdings, Inc. (d)(e) | | | 348 | | | | 18 | | |
| | | | 222 | | |
| Health Care Providers & Services (0.7%) | |
| Aetna, Inc. (d) | | | 900 | | | | 28 | | |
| AmerisourceBergen Corp. | | | 600 | | | | 18 | | |
| Cardinal Health, Inc. | | | 700 | | | | 23 | | |
| CIGNA Corp. (d) | | | 398 | | | | 14 | | |
| Express Scripts, Inc. (d)(e) | | | 746 | | | | 36 | | |
| Laboratory Corp. of America Holdings (d)(e) | | | 149 | | | | 12 | | |
| McKesson Corp. | | | 500 | | | | 31 | | |
| Medco Health Solutions, Inc. (d)(e) | | | 547 | | | | 29 | | |
| UnitedHealth Group, Inc. | | | 2,105 | | | | 74 | | |
| WellPoint, Inc. (e) | | | 900 | | | | 51 | | |
| | | | 316 | | |
| Hotels, Restaurants & Leisure (0.8%) | |
| Carnival Corp. | | | 200 | | | | 8 | | |
| Marriott International, Inc., Class A (d) | | | 100 | | | | 4 | | |
| McDonald's Corp. (d) | | | 2,019 | | | | 150 | | |
| Starbucks Corp. (d) | | | 1,298 | | | | 33 | | |
| Starwood Hotels & Resorts Worldwide, Inc. (d) | | | 447 | | | | 23 | | |
| Yum! Brands, Inc. (d) | | | 2,996 | | | | 138 | | |
| | | | 356 | | |
| Household Durables (0.1%) | |
| D.R. Horton, Inc. (d) | | | 900 | | | | 10 | | |
| Fortune Brands, Inc. (d) | | | 200 | | | | 10 | | |
| Harman International Industries, Inc. (d)(e) | | | 100 | | | | 3 | | |
| Leggett & Platt, Inc. (d) | | | 400 | | | | 9 | | |
| Lennar Corp., Class A (d) | | | 400 | | | | 6 | | |
| Newell Rubbermaid, Inc. | | | 300 | | | | 6 | | |
| Pulte Group, Inc. (d)(e) | | | 792 | | | | 7 | | |
| Whirlpool Corp. (d) | | | 100 | | | | 8 | | |
| | | | 59 | | |
| Household Products (0.9%) | |
| Colgate-Palmolive Co. | | | 543 | | | | 42 | | |
| Kimberly-Clark Corp. (d) | | | 761 | | | | 50 | | |
| Procter & Gamble Co. (The) | | | 5,261 | | | | 315 | | |
| | | | 407 | | |
| Independent Power Producers & Energy Traders (0.1%) | |
| AES Corp. (The) (d)(e) | | | 2,500 | | | | 29 | | |
| Constellation Energy Group, Inc. | | | 413 | | | | 13 | | |
| | | | 42 | | |
The accompanying notes are an integral part of the financial statements.
13
2010 Annual Report
September 30, 2010
Portfolio of Investments (cont'd)
Balanced Portfolio
| | | Shares | | Value
(000) | |
| Industrial Conglomerates (0.9%) | |
| 3M Co. | | | 1,023 | | | $ | 89 | | |
| General Electric Co. | | | 20,100 | | | | 327 | | |
| Textron, Inc. (d) | | | 500 | | | | 10 | | |
| | | | 426 | | |
| Information Technology Services (1.3%) | |
| Automatic Data Processing, Inc. (d) | | | 2,948 | | | | 124 | | |
| Cognizant Technology Solutions Corp., Class A (e) | | | 447 | | | | 29 | | |
| Fidelity National Information Services, Inc. | | | 100 | | | | 3 | | |
| International Business Machines Corp. (d) | | | 2,390 | | | | 320 | | |
| Mastercard, Inc., Class A (d) | | | 140 | | | | 31 | | |
| Paychex, Inc. (d) | | | 300 | | | | 8 | | |
| Visa, Inc., Class A (d) | | | 520 | | | | 39 | | |
| Western Union Co. (The) (d) | | | 1,342 | | | | 24 | | |
| | | | 578 | | |
| Insurance (1.9%) | |
| Aflac, Inc. | | | 2,198 | | | | 114 | | |
| Allstate Corp. (The) (d) | | | 1,300 | | | | 41 | | |
| AON Corp. (d) | | | 500 | | | | 20 | | |
| Berkshire Hathaway, Inc., Class B (d)(e) | | | 2,394 | | | | 198 | | |
| Chubb Corp. | | | 2,600 | | | | 148 | | |
| Hartford Financial Services Group, Inc. (d) | | | 900 | | | | 21 | | |
| Loews Corp. | | | 1,100 | | | | 42 | | |
| Marsh & McLennan Cos., Inc. | | | 1,100 | | | | 26 | | |
| MetLife, Inc. | | | 1,700 | | | | 65 | | |
| Progressive Corp. (The) | | | 1,200 | | | | 25 | | |
| Prudential Financial, Inc. (d) | | | 1,848 | | | | 100 | | |
| Travelers Cos., Inc. (The) (d) | | | 900 | | | | 47 | | |
| | | | 847 | | |
| Internet & Catalog Retail (0.6%) | |
| Amazon.com, Inc. (e) | | | 396 | | | | 62 | | |
| Expedia, Inc. (d) | | | 7,449 | | | | 210 | | |
| Priceline.com, Inc. (d)(e) | | | 50 | | | | 18 | | �� |
| | | | 290 | | |
| Internet Software & Services (0.9%) | |
| eBay, Inc. (d)(e) | | | 1,421 | | | | 35 | | |
| Google, Inc., Class A (e) | | | 717 | | | | 377 | | |
| Yahoo!, Inc. (d)(e) | | | 1,095 | | | | 15 | | |
| | | | 427 | | |
| Leisure Equipment & Products (0.1%) | |
| Eastman Kodak Co. (d)(e) | | | 700 | | | | 3 | | |
| Hasbro, Inc. (d) | | | 200 | | | | 9 | | |
| Mattel, Inc. | | | 500 | | | | 12 | | |
| | | | 24 | | |
| Life Sciences Tools & Services (0.1%) | |
| Life Technologies Corp. (d)(e) | | | 348 | | | | 16 | | |
| Thermo Fisher Scientific, Inc. (d)(e) | | | 764 | | | | 37 | | |
| | | | 53 | | |
| Machinery (1.0%) | |
| Caterpillar, Inc. (d) | | | 2,244 | | | | 177 | | |
| Cummins, Inc. (d) | | | 556 | | | | 50 | | |
| | | Shares | | Value
(000) | |
| Danaher Corp. (d) | | | 596 | | | $ | 24 | | |
| Deere & Co. (d) | | | 717 | | | | 50 | | |
| Eaton Corp. | | | 300 | | | | 25 | | |
| Illinois Tool Works, Inc. (d) | | | 695 | | | | 33 | | |
| Ingersoll-Rand plc (d) | | | 900 | | | | 32 | | |
| PACCAR, Inc. (d) | | | 955 | | | | 46 | | |
| Parker Hannifin Corp. | | | 350 | | | | 24 | | |
| Snap-On, Inc. (d) | | | 100 | | | | 5 | | |
| | | | 466 | | |
| Media (1.3%) | |
| CBS Corp., Class B (d) | | | 1,275 | | | | 20 | | |
| Comcast Corp., Class A | | | 6,000 | | | | 109 | | |
| DIRECTV, Class A (d)(e) | | | 1,044 | | | | 43 | | |
| McGraw-Hill Cos., Inc. (The) (d) | | | 362 | | | | 12 | | |
| News Corp., Class A (d) | | | 4,204 | | | | 55 | | |
| Omnicom Group, Inc. (d) | | | 645 | | | | 25 | | |
| Time Warner Cable, Inc. | | | 760 | | | | 41 | | |
| Time Warner, Inc. | | | 2,433 | | | | 75 | | |
| Viacom, Inc., Class B | | | 845 | | | | 31 | | |
| Walt Disney Co. (The) (d) | | | 5,200 | | | | 172 | | |
| | | | 583 | | |
| Metals & Mining (1.2%) | |
| Alcoa, Inc. (d) | | | 12,000 | | | | 145 | | |
| Cliffs Natural Resources, Inc. (d) | | | 1,700 | | | | 109 | | |
| Freeport-McMoRan Copper & Gold, Inc. (d) | | | 2,646 | | | | 226 | | |
| Newmont Mining Corp. (d) | | | 646 | | | | 40 | | |
| Nucor Corp. (d) | | | 519 | | | | 20 | | |
| | | | 540 | | |
| Multi-Utilities (1.4%) | |
| Ameren Corp. | | | 455 | | | | 13 | | |
| Avista Corp. (d) | | | 566 | | | | 12 | | |
| CenterPoint Energy, Inc. | | | 7,300 | | | | 115 | | |
| CH Energy Group, Inc. | | | 290 | | | | 13 | | |
| Consolidated Edison, Inc. (d) | | | 700 | | | | 34 | | |
| Dominion Resources, Inc. (d) | | | 2,000 | | | | 87 | | |
| DTE Energy Co. | | | 365 | | | | 17 | | |
| Integrys Energy Group, Inc. (d) | | | 1,900 | | | | 99 | | |
| National Grid PLC ADR (United Kingdom) | | | 288 | | | | 12 | | |
| NiSource, Inc. (d) | | | 100 | | | | 2 | | |
| PG&E Corp. | | | 1,321 | | | | 60 | | |
| Public Service Enterprise Group, Inc. | | | 1,781 | | | | 59 | | |
| SCANA Corp. | | | 320 | | | | 13 | | |
| Sempra Energy (d) | | | 920 | | | | 49 | | |
| TECO Energy, Inc. (d) | | | 719 | | | | 12 | | |
| Wisconsin Energy Corp. | | | 100 | | | | 6 | | |
| Xcel Energy, Inc. (d) | | | 1,400 | | | | 32 | | |
| | | | 635 | | |
| Multiline Retail (1.4%) | |
| Family Dollar Stores, Inc. (d) | | | 5,900 | | | | 261 | | |
| JC Penney Co., Inc. (d) | | | 1,700 | | | | 46 | | |
| Kohl's Corp. (e) | | | 4,048 | | | | 213 | | |
The accompanying notes are an integral part of the financial statements.
14
2010 Annual Report
September 30, 2010
Portfolio of Investments (cont'd)
Balanced Portfolio
| | | Shares | | Value
(000) | |
| Multiline Retail (cont'd) | |
| Macy's, Inc. (d) | | | 1,100 | | | $ | 25 | | |
| Nordstrom, Inc. (d) | | | 199 | | | | 8 | | |
| Target Corp. | | | 1,400 | | | | 75 | | |
| | | | 628 | | |
| Office Electronics (0.0%) | |
| Xerox Corp. (d) | | | 800 | | | | 8 | | |
| Oil, Gas & Consumable Fuels (4.3%) | |
| Anadarko Petroleum Corp. (d) | | | 646 | | | | 37 | | |
| Apache Corp. | | | 497 | | | | 49 | | |
| Chesapeake Energy Corp. (d) | | | 900 | | | | 20 | | |
| Chevron Corp. (d) | | | 4,300 | | | | 348 | | |
| ConocoPhillips | | | 4,300 | | | | 247 | | |
| Consol Energy, Inc. (d) | | | 199 | | | | 7 | | |
| Devon Energy Corp. | | | 660 | | | | 43 | | |
| El Paso Corp. (d) | | | 900 | | | | 11 | | |
| EOG Resources, Inc. (d) | | | 348 | | | | 32 | | |
| Exxon Mobil Corp. | | | 6,456 | | | | 399 | | |
| Hess Corp. | | | 500 | | | | 30 | | |
| Marathon Oil Corp. | | | 4,300 | | | | 142 | | |
| Murphy Oil Corp. | | | 300 | | | | 19 | | |
| Noble Energy, Inc. (d) | | | 2,599 | | | | 195 | | |
| Occidental Petroleum Corp. | | | 1,094 | | | | 86 | | |
| Peabody Energy Corp. (d) | | | 3,298 | | | | 162 | | |
| Range Resources Corp. (d) | | | 122 | | | | 5 | | |
| Southwestern Energy Co. (e) | | | 547 | | | | 18 | | |
| Spectra Energy Corp. | | | 1,400 | | | | 32 | | |
| Valero Energy Corp. | | | 1,000 | | | | 17 | | |
| Williams Cos., Inc. (The) | | | 1,000 | | | | 19 | | |
| | | | 1,918 | | |
| Paper & Forest Products (0.1%) | |
| International Paper Co. (d) | | | 721 | | | | 16 | | |
| Weyerhaeuser Co. (d) | | | 733 | | | | 11 | | |
| | | | 27 | | |
| Personal Products (0.8%) | |
| Avon Products, Inc. (d) | | | 11,891 | | | | 382 | | |
| Pharmaceuticals (4.4%) | |
| Abbott Laboratories | | | 8,618 | | | | 450 | | |
| Allergan, Inc. | | | 2,541 | | | | 169 | | |
| Bristol-Myers Squibb Co. | | | 5,649 | | | | 153 | | |
| Eli Lilly & Co. (d) | | | 1,543 | | | | 56 | | |
| Forest Laboratories, Inc. (d)(e) | | | 700 | | | | 22 | | |
| Johnson & Johnson | | | 5,858 | | | | 363 | | |
| Merck & Co., Inc. | | | 3,798 | | | | 140 | | |
| Pfizer, Inc. | | | 11,020 | | | | 189 | | |
| Teva Pharmaceutical Industries Ltd. ADR (Israel) | | | 4,500 | | | | 238 | | |
| Watson Pharmaceuticals, Inc. (e) | | | 4,400 | | | | 186 | | |
| | | | 1,966 | | |
| Real Estate Investment Trusts (REITs) (0.6%) | |
| Boston Properties, Inc. REIT (d) | | | 140 | | | | 12 | | |
| Equity Residential REIT (d) | | | 217 | | | | 10 | | |
| HCP, Inc. REIT | | | 447 | | | | 16 | | |
| | | Shares | | Value
(000) | |
| Health Care, Inc. REIT (d) | | | 2,000 | | | $ | 95 | | |
| Plum Creek Timber Co., Inc. REIT (d) | | | 2,200 | | | | 78 | | |
| Public Storage REIT (d) | | | 47 | | | | 4 | | |
| Simon Property Group, Inc. REIT (d) | | | 450 | | | | 42 | | |
| Vornado Realty Trust REIT | | | 144 | | | | 12 | | |
| | | | 269 | | |
| Road & Rail (1.1%) | |
| CSX Corp. (d) | | | 5,098 | | | | 282 | | |
| Norfolk Southern Corp. | | | 2,799 | | | | 167 | | |
| Union Pacific Corp. (d) | | | 748 | | | | 61 | | |
| | | | 510 | | |
| Semiconductors & Semiconductor Equipment (2.8%) | |
| Applied Materials, Inc. (d) | | | 18,979 | | | | 222 | | |
| Broadcom Corp., Class A (d) | | | 8,011 | | | | 284 | | |
| Intel Corp. | | | 26,801 | | | | 515 | | |
| MEMC Electronic Materials, Inc. (d)(e) | | | 400 | | | | 5 | | |
| Nvidia Corp. (d)(e) | | | 13,800 | | | | 161 | | |
| Texas Instruments, Inc. | | | 2,340 | | | | 63 | | |
| | | | 1,250 | | |
| Software (1.2%) | |
| Adobe Systems, Inc. (d)(e) | | | 993 | | | | 26 | | |
| Citrix Systems, Inc. (e) | | | 348 | | | | 24 | | |
| Intuit, Inc. (e) | | | 447 | | | | 19 | | |
| Microsoft Corp. | | | 12,846 | | | | 315 | | |
| Oracle Corp. | | | 4,623 | | | | 124 | | |
| Salesforce.com, Inc. (d)(e) | | | 249 | | | | 28 | | |
| Symantec Corp. (e) | | | 895 | | | | 13 | | |
| | | | 549 | | |
| Specialty Retail (1.2%) | |
| AutoZone, Inc. (e) | | | 50 | | | | 11 | | |
| Bed Bath & Beyond, Inc. (d)(e) | | | 298 | | | | 13 | | |
| Best Buy Co., Inc. (d) | | | 5,098 | | | | 208 | | |
| CarMax, Inc. (d)(e) | | | 249 | | | | 7 | | |
| GameStop Corp., Class A (d)(e) | | | 200 | | | | 4 | | |
| Gap, Inc. (The) (d) | | | 998 | | | | 19 | | |
| Home Depot, Inc. (d) | | | 4,400 | | | | 139 | | |
| Lowe's Cos., Inc. (d) | | | 2,900 | | | | 65 | | |
| Ltd. Brands, Inc. (d) | | | 149 | | | | 4 | | |
| O'Reilly Automotive, Inc. (e) | | | 149 | | | | 8 | | |
| Ross Stores, Inc. (d) | | | 149 | | | | 8 | | |
| Staples, Inc. (d) | | | 1,347 | | | | 28 | | |
| Tiffany & Co. (d) | | | 149 | | | | 7 | | |
| TJX Cos., Inc. (d) | | | 447 | | | | 20 | | |
| Urban Outfitters, Inc. (d)(e) | | | 149 | | | | 5 | | |
| | | | 546 | | |
| Textiles, Apparel & Luxury Goods (0.2%) | |
| Coach, Inc. (d) | | | 696 | | | | 30 | | |
| NIKE, Inc., Class B (d) | | | 580 | | | | 46 | | |
| Polo Ralph Lauren Corp. (d) | | | 100 | | | | 9 | | |
| VF Corp. (d) | | | 100 | | | | 8 | | |
| | | | 93 | | |
The accompanying notes are an integral part of the financial statements.
15
2010 Annual Report
September 30, 2010
Portfolio of Investments (cont'd)
Balanced Portfolio
| | | Shares | | Value
(000) | |
| Thrifts & Mortgage Finance (0.0%) | |
| Hudson City Bancorp, Inc. (d) | | | 1,300 | | | $ | 16 | | |
| Tobacco (1.2%) | |
| Altria Group, Inc. (d) | | | 3,232 | | | | 77 | | |
| Philip Morris International, Inc. | | | 7,546 | | | | 423 | | |
| Reynolds American, Inc. | | | 400 | | | | 24 | | |
| | | | 524 | | |
| Wireless Telecommunication Services (0.1%) | |
| American Tower Corp., Class A (e) | | | 497 | | | | 26 | | |
| Sprint Nextel Corp. (d)(e) | | | 5,000 | | | | 23 | | |
| | | | 49 | | |
| Total Common Stocks (Cost $23,078) | | | 23,881 | | |
| Convertible Preferred Stocks (0.2%) | |
| Alternative Energy (0.2%) | |
| Better Place LLC (Cost $84) (e)(f)(g) | | | 27,888 | | | | 84 | | |
| Investment Company (0.0%) | |
| iShares MSCI EMU Index Fund (Cost $9) | | | 200 | | | | 7 | | |
| Short-Term Investments (37.3%) | |
| Securities held as Collateral on Loaned Securities (25.1%) | |
| Investment Company (22.0%) | |
Morgan Stanley Institutional
Liquidity Funds — Money Market
Portfolio — Institutional Class (Note G) | | | 9,927,927 | | | | 9,928 | | |
| | | Face
Amount
(000) | | | |
| Repurchase Agreements (3.1%) | |
Bank of America Securities, LLC, (0.32%, dated
9/30/10, due 10/1/10; proceeds $654;
fully collateralized by a U.S. Government
Agency at the date of this Portfolio of
Investments as follows: Federal National
Mortgage Association; 4.50% due 9/1/40;
valued at $667) | | $ | 654 | | | | 654 | | |
Barclays Capital, Inc., (0.25%, dated 9/30/10,
due 10/1/10; proceeds $744; fully
collateralized by a U.S. Treasury Security at
the date of this Portfolio of Investments as
follows: U.S. Treasury Bond; 8.50% due
2/15/20; valued at $758) | | | 743 | | | | 743 | | |
| | | | 1,397 | | |
Total Securities held as Collateral on
Loaned Securities (Cost $11,325) | | | 11,325 | | |
| | | Shares | | | |
| Investment Company (7.3%) | |
Morgan Stanley Institutional
Liquidity Funds — Money Market
Portfolio — Institutional Class (Note G) | | | 3,295,107 | | | | 3,295 | | |
| | | Face
Amount
(000) | | Value
(000) | |
| U.S. Treasury Securities (4.9%) | |
| U.S. Treasury Bills, | |
| 0.13%, 11/18/10 (d)(h) | | $ | 725 | | | $ | 725 | | |
| 0.14%, 11/4/10 (h) | | | 525 | | | | 525 | | |
| 0.15%, 11/4/10 (h) | | | 525 | | | | 525 | | |
| 0.20%, 10/28/10 (h)(i) | | | 50 | | | | 50 | | |
| 0.25%, 2/10/11 (h) | | | 400 | | | | 399 | | |
| | | | 2,224 | | |
| Total Short-Term Investments (Cost $16,844) | | | 16,844 | | |
Total Investments (128.8%) (Cost $56,403)
Including $12,632 of Securities Loaned | | | 58,183 | | |
| Liabilities in Excess of Other Assets (-28.8%) | | | (13,013 | ) | |
| Net Assets (100.0%) | | $ | 45,170 | | |
(a) Security is subject to delayed delivery.
(b) Variable/Floating Rate Security — Interest rate changes on these instruments are based on changes in a designated base rate. The rates shown are those in effect on September 30, 2010.
(c) 144A security — Certain conditions for public sale may exist. Unless otherwise noted, these securities are deemed to be liquid.
(d) All or a portion of security on loan at September 30, 2010.
(e) Non-income producing security.
(f) Security has been deemed illiquid at September 30, 2010.
(g) At September 30, 2010, the Portfolio held approximately $84,000 of fair valued securities, representing 0.2% of net assets. These securities have been fair valued as determined in good faith under procedures established by and under the general supervision of the Portfolio's Trustees.
(h) Rate shown is the yield to maturity at September 30, 2010.
(i) All or a portion of the security was pledged to cover margin requirements for futures contracts.
ADR American Depositary Receipt
IO Interest Only
REIT Real Estate Investment Trust
REMIC Real Estate Mortgage Investment Conduit
STRIPS Separate Trading of Registered Interest and Principal of Securities
TBA To Be Announced
The accompanying notes are an integral part of the financial statements.
16
2010 Annual Report
September 30, 2010
Portfolio of Investments (cont'd)
Balanced Portfolio
Foreign Currency Exchange Contracts Information
The Portfolio had the following foreign currency exchange contract(s) open at period end:
| Counterparty | | Currency to
Deliver
(000) | | Value
(000) | | Settlement
Date | | In Exchange
For
(000) | | Value
(000) | | Net Unrealized
Appreciation
(Depreciation)
(000) | |
| Bank of America N.A. | | CAD | 11 | | | $ | 11 | | | 10/21/10 | | USD | 11 | | | $ | 11 | | | $ | — | @ | |
| Deutsche Bank AG London | | AUD | 747 | | | | 721 | | | 10/21/10 | | USD | 700 | | | | 700 | | | | (21 | ) | |
| Deutsche Bank AG London | | EUR | 101 | | | | 138 | | | 10/21/10 | | USD | 132 | | | | 132 | | | | (6 | ) | |
| Deutsche Bank AG London | | JPY | 1,071 | | | | 13 | | | 10/21/10 | | USD | 13 | | | | 13 | | | | — | @ | |
| Deutsche Bank AG London | | JPY | 7,759 | | | | 93 | | | 10/21/10 | | USD | 91 | | | | 91 | | | | (2 | ) | |
| Deutsche Bank AG London | | USD | 114 | | | | 114 | | | 10/21/10 | | EUR | 86 | | | | 117 | | | | 3 | | |
| Deutsche Bank AG London | | USD | 358 | | | | 358 | | | 10/21/10 | | EUR | 262 | | | | 358 | | | | — | @ | |
| Deutsche Bank AG London | | USD | 325 | | | | 325 | | | 10/21/10 | | EUR | 239 | | | | 325 | | | | — | @ | |
| Deutsche Bank AG London | | USD | 104 | | | | 104 | | | 10/21/10 | | JPY | 8,830 | | | | 106 | | | | 2 | | |
| JPMorgan Chase Bank N.A. | | USD | 3 | | | | 3 | | | 10/21/10 | | SEK | 18 | | | | 3 | | | | — | @ | |
| State Street Bank and Trust Company | | SEK | 26 | | | | 4 | | | 10/21/10 | | USD | 4 | | | | 4 | | | | — | @ | |
| UBS AG | | AUD | 483 | | | | 466 | | | 10/21/10 | | USD | 460 | | | | 460 | | | | (6 | ) | |
| UBS AG | | CHF | 452 | | | | 460 | | | 10/21/10 | | USD | 454 | | | | 454 | | | | (6 | ) | |
| UBS AG | | CHF | 61 | | | | 62 | | | 10/21/10 | | USD | 61 | | | | 61 | | | | (1 | ) | |
| UBS AG | | CHF | 334 | | | | 340 | | | 10/21/10 | | USD | 340 | | | | 340 | | | | — | @ | |
| UBS AG | | GBP | 227 | | | | 356 | | | 10/21/10 | | USD | 351 | | | | 351 | | | | (5 | ) | |
| UBS AG | | USD | 1,153 | | | | 1,153 | | | 10/21/10 | | AUD | 1,232 | | | | 1,188 | | | | 35 | | |
| UBS AG | | USD | 50 | | | | 50 | | | 10/21/10 | | CHF | 50 | | | | 51 | | | | 1 | | |
| UBS AG | | USD | 466 | | | | 466 | | | 10/21/10 | | CHF | 460 | | | | 468 | | | | 2 | | |
| | | | | | | $ | 5,237 | | | | | | | | | $ | 5,233 | | | $ | (4 | ) | |
@ Value is less than $500.
AUD — Australian Dollar
CAD — Canadian Dollar
CHF — Swiss Franc
EUR — Euro
GBP — British Pound
JPY — Japanese Yen
SEK — Swedish Krona
USD — United States Dollar
Futures Contracts
The Portfolio had the following futures contract(s) open at period end:
| | | Number
of
Contracts | | Value
(000) | | Expiration
Date | | Net Unrealized
Appreciation
(Depreciation)
(000) | |
| Long: | |
| CAC 40 Index | | | 2 | | | $ | 101 | | | Oct-10 | | $ | (1 | ) | |
| FTSE 100 Index | | | 5 | | | | 434 | | | Dec-10 | | | (1 | ) | |
| Hang Seng Index | | | 3 | | | | 432 | | | Oct-10 | | | (1 | ) | |
| KOSPI 200 Index | | | 4 | | | | 428 | | | Dec-10 | | | 20 | | |
| S&P 500 Emini Index | | | 64 | | | | 3,638 | | | Dec-10 | | | 60 | | |
U.S. Treasury
10 yr. Note | | | 1 | | | | 126 | | | Dec-10 | | | 2 | | |
U.S. Treasury
2 yr. Note | | | 15 | | | | 3,292 | | | Dec-10 | | | 2 | | |
U.S. Treasury
5 yr. Note | | | 13 | | | | 1,571 | | | Dec-10 | | | 12 | | |
Futures Contracts (cont'd)
| | | Number
of
Contracts | | Value
(000) | | Expiration
Date | | Net Unrealized
Appreciation
(Depreciation)
(000) | |
| Short: | |
| MSCI Taiwan | | | 16 | | | $ | 465 | | | Oct-10 | | $ | (5 | ) | |
| OMX 30 Index | | | 30 | | | | 484 | | | Oct-10 | | | (2 | ) | |
SGX MSCI
Singapore Index | | | 8 | | | | 443 | | | Oct-10 | | | 3 | | |
U.S. Treasury
10 yr. Note | | | 17 | | | | 2,143 | | | Dec-10 | | | (11 | ) | |
U.S. Treasury
2 yr. Note | | | 2 | | | | 439 | | | Dec-10 | | | (1 | ) | |
U.S. Treasury
30 yr. Bond | | | 3 | | | | 401 | | | Dec-10 | | | (5 | ) | |
| | | | | | | | | | | | | $ | 72 | | |
The accompanying notes are an integral part of the financial statements.
17
2010 Annual Report
September 30, 2010
Portfolio of Investments (cont'd)
Balanced Portfolio
Interest Rate Swap Agreements
The Portfolio had the following interest rate swap agreement(s) open at period end:
| Swap Counterparty | | Floating Rate
Index | | Pay/Receive
Floating Rate | | Fixed Rate | | Termination
Date | | Notional
Amount
(000) | | Net Unrealized
Appreciation
(Depreciation)
(000) | |
| Credit Suisse | | 3 Month LIBOR | | Receive | | | 2.63 | % | | 3/11/15 | | $ | 1,170 | | | $ | (67 | ) | |
| Credit Suisse | | 3 Month LIBOR | | Receive | | | 2.18 | | | 9/8/15 | | CAD | 517 | | | | (2 | ) | |
| Credit Suisse | | 3 Month LIBOR | | Receive | | | 2.21 | | | 9/8/15 | | | 372 | | | | (2 | ) | |
| Credit Suisse | | 3 Month LIBOR | | Pay | | | 4.07 | | | 9/8/20 | | | 604 | | | | 4 | | |
| Credit Suisse | | 3 Month LIBOR | | Pay | | | 4.12 | | | 9/8/20 | | | 435 | | | | 4 | | |
| | | | | | | | | | | | | | | | | $ | (63 | ) | |
Zero Coupon Swap Agreements
The Portfolio had the following zero coupon swap agreement(s) open at period end:
| Swap Counterparty | | Notional
Amount
(000) | | Floating
Rate Index | | Pay/Receive
Floating Rate | | Termination
Date | | Unrealized
Appreciation
(Depreciation)
(000) | |
| Deutsche Bank | | $ | 235 | | | 3 Month LIBOR | | Receive | | 11/15/20 | | $ | (21 | ) | |
| JPMorgan Chase | | | 341 | | | 3 Month LIBOR | | Receive | | 11/15/22 | | | (47 | ) | |
| | | | | | | | | | | $ | (68 | ) | |
LIBOR London Interbank Offered Rate
Fair Value Measurement Information:
The following is a summary of the inputs used to value the Portfolio's net assets as of September 30, 2010. (See Note A-7 to the financial statements for further information regarding fair value measurement.)
| Investment Type | | Level 1
Quoted
prices
(000) | | Level 2
Other
significant
observable
inputs
(000) | | Level 3
Significant
unobservable
inputs
(000) | | Total
(000) | |
| Assets: | |
| Fixed Income Securities | |
Agency Adjustable
Rate Mortgages | | $ | — | | | $ | 136 | | | $ | — | | | $ | 136 | | |
Agency Bond — Banking
(FDIC Guaranteed) | | | — | | | | 465 | | | | — | | | | 465 | | |
Agency Fixed Rate
Mortgages | | | — | | | | 5,108 | | | | — | | | | 5,108 | | |
| Asset-Backed Securities | | | — | | | | 89 | | | | — | | | | 89 | | |
Collateralized Mortgage
Obligations — Agency
Collateral Series | | | — | | | | 132 | | | | — | | | | 132 | | |
Commercial Mortgage
Backed Securities | | | — | | | | 577 | | | | — | | | | 577 | | |
| Corporate Bonds | | | — | | | | 5,130 | | | | — | | | | 5,130 | | |
| Mortgages — Other | | | — | | | | 626 | | | | — | | | | 626 | | |
| Municipal Bonds | | | — | | | | 215 | | | | — | | | | 215 | | |
Fair Value Measurement Information: (cont'd)
| Investment Type | | Level 1
Quoted
prices
(000) | | Level 2
Other
significant
observable
inputs
(000) | | Level 3
Significant
unobservable
inputs
(000) | | Total
(000) | |
Fixed Income
Securities (cont'd) | |
| U.S. Agency Securities | | $ | — | | | $ | 597 | | | $ | — | | | $ | 597 | | |
| U.S. Treasury Securities | | | — | | | | 4,292 | | | | — | | | | 4,292 | | |
Total Fixed Income
Securities | | | — | | | | 17,367 | | | | — | | | | 17,367 | | |
| Common Stocks | |
| Aerospace & Defense | | | 588 | | | | — | | | | — | | | | 588 | | |
| Air Freight & Logistics | | | 176 | | | | — | | | | — | | | | 176 | | |
| Airlines | | | 22 | | | | — | | | | — | | | | 22 | | |
| Auto Components | | | 52 | | | | — | | | | — | | | | 52 | | |
| Automobiles | | | 95 | | | | — | | | | — | | | | 95 | | |
| Beverages | | | 641 | | | | — | | | | — | | | | 641 | | |
| Biotechnology | | | 192 | | | | — | | | | — | | | | 192 | | |
| Capital Markets | | | 394 | | | | — | | | | — | | | | 394 | | |
| Chemicals | | | 374 | | | | — | | | | — | | | | 374 | | |
| Commercial Banks | | | 586 | | | | — | | | | — | | | | 586 | | |
Commercial
Services & Supplies | | | 144 | | | | — | | | | — | | | | 144 | | |
Communications
Equipment | | | 518 | | | | — | | | | — | | | | 518 | | |
The accompanying notes are an integral part of the financial statements.
18
2010 Annual Report
September 30, 2010
Portfolio of Investments (cont'd)
Balanced Portfolio
Fair Value Measurement Information: (cont'd)
| Investment Type | | Level 1
Quoted
prices
(000) | | Level 2
Other
significant
observable
inputs
(000) | | Level 3
Significant
unobservable
inputs
(000) | | Total
(000) | |
| Common Stocks (cont'd) | |
Computers &
Peripherals | | $ | 981 | | | $ | — | | | $ | — | | | $ | 981 | | |
Construction &
Engineering | | | 10 | | | | — | | | | — | | | | 10 | | |
| Consumer Finance | | | 204 | | | | — | | | | — | | | | 204 | | |
| Distributors | | | 85 | | | | — | | | | — | | | | 85 | | |
Diversified Financial
Services | | | 626 | | | | — | | | | — | | | | 626 | | |
Diversified
Telecommunication
Services | | | 596 | | | | — | | | | — | | | | 596 | | |
| Electric Utilities | | | 593 | | | | — | | | | — | | | | 593 | | |
| Electrical Equipment | | | 314 | | | | — | | | | — | | | | 314 | | |
Electronic Equipment,
Instruments &
Components | | | 287 | | | | — | | | | — | | | | 287 | | |
Energy Equipment &
Services | | | 399 | | | | — | | | | — | | | | 399 | | |
| Food & Staples Retailing | | | 524 | | | | — | | | | — | | | | 524 | | |
| Food Products | | | 464 | | | | — | | | | — | | | | 464 | | |
| Gas Utilities | | | 10 | | | | — | | | | — | | | | 10 | | |
Health Care
Equipment & Supplies | | | 222 | | | | — | | | | — | | | | 222 | | |
Health Care Providers &
Services | | | 316 | | | | — | | | | — | | | | 316 | | |
Hotels, Restaurants &
Leisure | | | 356 | | | | — | | | | — | | | | 356 | | |
| Household Durables | | | 59 | | | | — | | | | — | | | | 59 | | |
| Household Products | | | 407 | | | | — | | | | — | | | | 407 | | |
Independent Power
Producers & Energy
Traders | | | 42 | | | | — | | | | — | | | | 42 | | |
| Industrial Conglomerates | | | 426 | | | | — | | | | — | | | | 426 | | |
Information Technology
Services | | | 578 | | | | — | | | | — | | | | 578 | | |
| Insurance | | | 847 | | | | — | | | | — | | | | 847 | | |
Internet & Catalog
Retail | | | 290 | | | | — | | | | — | | | | 290 | | |
Internet Software &
Services | | | 427 | | | | — | | | | — | | | | 427 | | |
Leisure Equipment &
Products | | | 24 | | | | — | | | | — | | | | 24 | | |
Life Sciences
Tools & Services | | | 53 | | | | — | | | | — | | | | 53 | | |
| Machinery | | | 466 | | | | — | | | | — | | | | 466 | | |
| Media | | | 583 | | | | — | | | | — | | | | 583 | | |
| Metals & Mining | | | 540 | | | | — | | | | — | | | | 540 | | |
| Multi-Utilities | | | 635 | | | | — | | | | — | | | | 635 | | |
| Multiline Retail | | | 628 | | | | — | | | | — | | | | 628 | | |
| Office Electronics | | | 8 | | | | — | | | | — | | | | 8 | | |
Oil, Gas &
Consumable Fuels | | | 1,918 | | | | — | | | | — | | | | 1,918 | | |
| Paper & Forest Products | | | 27 | | | | — | | | | — | | | | 27 | | |
| Personal Products | | | 382 | | | | — | | | | — | | | | 382 | | |
| Pharmaceuticals | | | 1,966 | | | | — | | | | — | | | | 1,966 | | |
Fair Value Measurement Information: (cont'd)
| Investment Type | | Level 1
Quoted
prices
(000) | | Level 2
Other
significant
observable
inputs
(000) | | Level 3
Significant
unobservable
inputs
(000) | | Total
(000) | |
| Common Stocks (cont'd) | |
Real Estate Investment
Trusts (REITs) | | $ | 269 | | | $ | — | | | $ | — | | | $ | 269 | | |
| Road & Rail | | | 510 | | | | — | | | | — | | | | 510 | | |
Semiconductors &
Semiconductor
Equipment | | | 1,250 | | | | — | | | | — | | | | 1,250 | | |
| Software | | | 549 | | | | — | | | | — | | | | 549 | | |
| Specialty Retail | | | 546 | | | | — | | | | — | | | | 546 | | |
Textiles, Apparel &
Luxury Goods | | | 93 | | | | — | | | | — | | | | 93 | | |
Thrifts & Mortgage
Finance | | | 16 | | | | — | | | | — | | | | 16 | | |
| Tobacco | | | 524 | | | | — | | | | — | | | | 524 | | |
Wireless
Telecommunication
Services | | | 49 | | | | — | | | | — | | | | 49 | | |
| Total Common Stocks | | | 23,881 | | | | — | | | | — | | | | 23,881 | | |
Convertible Preferred
Stocks | | | — | | | | — | | | | 84 | | | | 84 | | |
| Investment Company | | | 7 | | | | — | | | | — | | | | 7 | | |
| Short-Term Investments | |
| Investment Company | | | 13,223 | | | | — | | | | — | | | | 13,223 | | |
| Repurchase Agreements | | | — | | | | 1,397 | | | | — | | | | 1,397 | | |
| U.S. Treasury Securities | | | — | | | | 2,224 | | | | — | | | | 2,224 | | |
Total Short-Term
Investments | | | 13,223 | | | | 3,621 | | | | — | | | | 16,844 | | |
Foreign Currency
Exchange Contract | | | — | | | | 43 | | | | — | | | | 43 | | |
| Futures Contracts | | | 99 | | | | — | | | | — | | | | 99 | | |
Interest Rate Swap
Agreements | | | — | | | | 8 | | | | — | | | | 8 | | |
| Total Assets | | | 37,210 | | | | 21,039 | | | | 84 | | | | 58,333 | | |
| Liabilities: | |
Foreign Currency
Exchange Contracts | | | — | | | | 47 | | | | — | | | | 47 | | |
| Futures Contracts | | | 27 | | | | — | | | | — | | | | 27 | | |
Interest Rate Swap
Agreements | | | — | | | | 71 | | | | — | | | | 71 | | |
Zero Coupon Swap
Agreements | | | — | | | | 68 | | | | — | | | | 68 | | |
| Total Liabilities | | | 27 | | | | 186 | | | | — | | | | 213 | | |
| Total | | $ | 37,183 | | | $ | 20,853 | | | $ | 84 | | | $ | 58,120 | | |
The accompanying notes are an integral part of the financial statements.
19
2010 Annual Report
September 30, 2010
Portfolio of Investments (cont'd)
Balanced Portfolio
Fair Value Measurement Information: (cont'd)
The following is a reconciliation of investments in which significant unobservable inputs (Level 3) were used in determining fair value:
| | | Convertible
Preferred
Stocks
(000) | | Fixed Income
Securities
(000) | |
| Balance as of 9/30/09 | | $ | — | | | $ | — | @ | |
| Accrued discounts/premiums | | | — | | | | — | | |
| Realized gain (loss) | | | — | | | | (— | )@ | |
Change in unrealized
appreciation (depreciation) | | | — | | | | — | @ | |
| Net purchases (sales) | | | 84 | | | | (— | )@ | |
| Transfers in to Level 3 | | | — | | | | — | | |
| Transfers out of Level 3 | | | — | | | | — | | |
| Balance as of 9/30/10 | | $ | 84 | | | $ | — | | |
The amount of total gains (losses)
for the period included in earnings
attributable to the change in
unrealized gains (losses) relating
to assets and liabilities still held
at Level 3 at 9/30/10. | | $ | — | | | $ | — | | |
@ Value is less than $500
The accompanying notes are an integral part of the financial statements.
20
2010 Annual Report
September 30, 2010
Investment Overview (unaudited)
Mid Cap Growth Portfolio
Performance
For the fiscal year ended September 30, 2010, the Portfolio's Class I had a total return based on net asset value and reinvestment of distributions per share of 24.58%, net of fees. The Portfolio's Class I outperformed against its benchmark the Russell Midcap® Growth Index (the "Index") which returned 18.27%.
Factors Affecting Performance
• The year ended September 30, 2010 was characterized by renewed concerns about the global economy's recovery. Continued weakness in jobs and real estate data in the U.S. and a potential sovereign debt crisis in several peripheral European countries ignited fears of a double-dip recession in the developed world. Investors fled risky assets for gold and Treasury securities, causing higher levels of volatility and more muted returns in the U.S. equity market than had been seen in 2009. However, in the final months of the period, investor sentiment shifted again. Stocks rallied strongly in September on expectations of additional quantitative easing by the Federal Reserve.
• The Portfolio's relative performance was driven by positive results from stock selection and an overweight in the consumer discretionary sector, where exposure to the casinos and gambling industry led performance.
• Stock selection in technology also contributed, although an underweight in the sector modestly detracted from relative gains. The computer services software and systems industry was the chief performance driver.
• Both stock selection and an underweight in utilities were advantageous to relative performance. Within the sector, the telecommunications industry was the most additive.
• However, both stock selection and an overweight in financial services were detrimental to relative performance, with underperformance primarily in the diversified financial services industry.
• Stock selection in energy was another area of weakness, despite the benefit of an overweight there. Within the sector, natural gas producers were the main detractors.
• Finally, stock selection in health care was disadvantageous to relative performance, while an underweight in the sector did slightly help. Relative returns were dampened by the medical equipment industry.
Management Strategies
• As a team, we believe having a market outlook can be an anchor. Rather, our focus is on assessing company prospects over three to five years, and owning a portfolio of high-quality companies with diverse business drivers not tied to a particular market environment.
• As we enter the final quarter of 2010, we remain optimistic. We have seen a lot of volatility in the marketplace this year, and there has been and continues to be little visibility from both a top-down and a bottom-up perspective. We maintain our focus on identifying high-quality companies with sustainable competitive advantages that are not linked to a specific macro economic forecast. With our long-term view and an eye toward capitalizing on compelling opportunities within the marketplace, we continue to seek to upgrade the Portfolio.
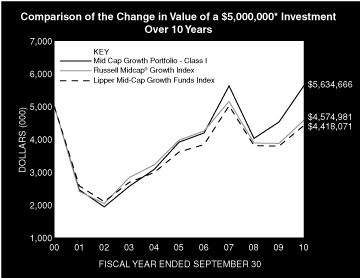
* Minimum Investment
In accordance with SEC regulations, the Portfolio's performance shown assumes that all recurring fees (including management fees) were deducted and all dividends and distributions were reinvested. The performance of Class P shares will vary from the Class I shares based upon their different inception dates and will be negatively impacted by additional fees assessed to that class.
21
2010 Annual Report
September 30, 2010
Investment Overview (unaudited) (cont'd)
Mid Cap Growth Portfolio
Performance Compared to the Russell Midcap® Growth Index(1) and the Lipper Mid-Cap Growth Funds Index(2)
| | | Total Returns(3) | |
| | | | | Average Annual | |
| | | One
Year | | Five
Years | | Ten
Years | | Since
Inception(6) | |
Portfolio — Class I
w/o sales charges(4) | | | 24.58 | % | | | 7.57 | % | | | 1.20 | % | | | 13.20 | % | |
| Russell Midcap® Growth Index | | | 18.27 | | | | 2.86 | | | | –0.88 | | | | 9.30 | | |
| Lipper Mid-Cap Growth Funds Index | | | 16.52 | | | | 4.12 | | | | –1.23 | | | | 9.08 | | |
Portfolio — Class P
w/o sales charges(5) | | | 24.32 | | | | 7.30 | | | | 0.95 | | | | 9.98 | | |
| Russell Midcap® Growth Index | | | 18.27 | | | | 2.86 | | | | –0.88 | | | | 5.95 | | |
| Lipper Mid-Cap Growth Funds Index | | | 16.52 | | | | 4.12 | | | | –1.23 | | | | 5.29 | | |
Performance data quoted represents past performance, which is no guarantee of future results, and current performance may be lower or higher than the figures shown. Performance assumes that all dividends and distributions, if any, were reinvested. For the most recent month-end performance figures, please visit www.morganstanley.com/im. Investment returns and principal value will fluctuate so that Portfolio shares, when redeemed, may be worth more or less than their original cost. Total returns do not reflect the deduction of taxes that a shareholder would pay on Portfolio distributions or the redemption of Portfolio shares. Performance of share classes will vary due to differences in sales charges and expenses.
(1) The Russell Midcap® Growth Index measures the performance of the mid-cap growth segment of the U.S. equity universe. It includes those Russell Midcap® Index companies with higher price-to-book ratios and higher forecasted growth values. The Russell Midcap® Index is a subset of the Russell 1000® Index and includes approximately 800 of the smallest securities in the Russell 1000® Index, which in turn consists of approximately 1,000 of the largest U.S. securities based on a combination of market capitalization and current index membership. The Index is unmanaged and its returns do not include any sales charges or fees. Such costs would lower performance. It is not possible to invest directly in an index.
(2) The Lipper Mid-Cap Growth Funds Index is an equally weighted performance index of the largest qualifying funds (based on net assets) in the Lipper Mid-Cap Growth Funds classification. The index, which is adjusted for capital gains distributions and income dividends, is unmanaged and should not be considered an investment. There are currently 30 funds represented in this Index. As of the date of this report, the Portfolio was in the Lipper Mid-Cap Growth Funds classification.
(3) Total returns for the Portfolio reflect expenses waived and/or reimbursed, if applicable, by the Adviser. Without such waivers and/or reimbursements, total returns would have been lower. Fee waivers and/or reimbursements are voluntary and the Adviser reserves the right to commence or terminate any waiver and/or reimbursement at any time.
(4) Commenced operations on March 30, 1990.
(5) Commenced operations on January 31, 1997.
(6) For comparative purposes, average annual since inception returns listed for the Indexes refer to the inception date or initial offering of the respective share class of the Portfolio, not the inception of the Indexes.
Portfolio Composition
| Classification | | Percentage of
Total Investments | |
| Consumer Discretionary | | | 29.4 | % | |
| Technology | | | 17.7 | | |
| Producer Durables | | | 13.1 | | |
| Health Care | | | 11.6 | | |
| Financial Services | | | 10.4 | | |
| Short-Term Investments | | | 6.3 | | |
| Materials & Processing | | | 6.0 | | |
| Other* | | | 5.5 | | |
| Total Investments | | | 100.0 | % | |
* Industries and/or investment types representing less than 5% of total investments.
22
2010 Annual Report
September 30, 2010
Portfolio of Investments
Mid Cap Growth Portfolio
| | | Shares | | Value
(000) | |
| Common Stocks (97.8%) | |
| Consumer Discretionary (30.9%) | |
| Chipotle Mexican Grill, Inc. (a) | | | 155,211 | | | $ | 26,696 | | |
| Ctrip.com International Ltd. ADR (China) (a) | | | 3,709,435 | | | | 177,126 | | |
| Discovery Communications, Inc., Class C (a) | | | 1,509,861 | | | | 57,662 | | |
| Dollar Tree, Inc. (a) | | | 317,894 | | | | 15,500 | | |
| Edenred (France) (a) | | | 6,646,209 | | | | 131,648 | | |
| Factset Research Systems, Inc. | | | 112,778 | | | | 9,150 | | |
| Fastenal Co. | | | 1,449,170 | | | | 77,081 | | |
| Gafisa SA ADR (Brazil) | | | 3,333,564 | | | | 51,637 | | |
| Groupe Aeroplan, Inc. (Canada) | | | 4,445,887 | | | | 54,618 | | |
| Las Vegas Sands Corp. (a) | | | 4,759,514 | | | | 165,869 | | |
| Li & Fung Ltd. (Hong Kong) | | | 28,524,900 | | | | 160,476 | | |
| Morningstar, Inc. (a) | | | 1,570,682 | | | | 69,990 | | |
| Naspers Ltd., Class N (South Africa) | | | 1,773,181 | | | | 86,697 | | |
| Natura Cosmeticos SA (Brazil) | | | 26,400 | | | | 710 | | |
| NetFlix, Inc. (a) | | | 873,863 | | | | 141,706 | | |
| NVR, Inc. (a) | | | 84,889 | | | | 54,968 | | |
| Priceline.com, Inc. (a) | | | 521,802 | | | | 181,764 | | |
| Sears Holdings Corp. (a) | | | 442,512 | | | | 31,923 | | |
| Strayer Education, Inc. | | | 273,342 | | | | 47,698 | | |
| Wynn Resorts Ltd. | | | 1,730,024 | | | | 150,114 | | |
| | | | 1,693,033 | | |
| Consumer Staples (1.0%) | |
| Coca-Cola Enterprises, Inc. | | | 1,802,265 | | | | 55,870 | | |
| Energy (4.1%) | |
| Petrohawk Energy Corp. (a) | | | 1,181,650 | | | | 19,072 | | |
| Range Resources Corp. | | | 2,085,668 | | | | 79,527 | | |
| Ultra Petroleum Corp. (a) | | | 3,033,951 | | | | 127,365 | | |
| | | | 225,964 | | |
| Financial Services (11.0%) | |
| Calamos Asset Management, Inc., Class A | | | 1,147,705 | | | | 13,199 | | |
| CIT Group, Inc. (a) | | | 1,241,182 | | | | 50,665 | | |
| Greenhill & Co., Inc. | | | 1,093,252 | | | | 86,717 | | |
| IntercontinentalExchange, Inc. (a) | | | 575,633 | | | | 60,280 | | |
| Moody's Corp. | | | 934,585 | | | | 23,346 | | |
| MSCI, Inc., Class A (a) | | | 3,674,394 | | | | 122,027 | | |
| Redecard SA (Brazil) | | | 4,681,687 | | | | 72,632 | | |
| T. Rowe Price Group, Inc. | | | 1,095,717 | | | | 54,857 | | |
| Verisk Analytics, Inc., Class A (a) | | | 4,165,638 | | | | 116,679 | | |
| | | | 600,402 | | |
| Health Care (12.2%) | |
| Gen-Probe, Inc. (a) | | | 1,763,468 | | | | 85,458 | | |
| IDEXX Laboratories, Inc. (a) | | | 1,158,577 | | | | 71,508 | | |
| Illumina, Inc. (a) | | | 2,994,051 | | | | 147,307 | | |
| Intuitive Surgical, Inc. (a) | | | 185,435 | | | | 52,615 | | |
| Ironwood Pharmaceuticals, Inc. (a) | | | 2,182,528 | | | | 22,218 | | |
| Mead Johnson Nutrition Co. | | | 2,325,381 | | | | 132,338 | | |
| Stericycle, Inc. (a) | | | 1,173,360 | | | | 81,525 | | |
| Techne Corp. | | | 1,203,957 | | | | 74,320 | | |
| | | | 667,289 | | |
| | | Shares | | Value
(000) | |
| Materials & Processing (6.3%) | |
| Intrepid Potash, Inc. (a) | | | 1,933,651 | | | $ | 50,410 | | |
| Lynas Corp. Ltd. (Australia) (a) | | | 22,849,996 | | | | 30,147 | | |
| Martin Marietta Materials, Inc. | | | 904,905 | | | | 69,651 | | |
| Rockwood Holdings, Inc. (a) | | | 2,094,996 | | | | 65,929 | | |
| Schindler Holding AG (Switzerland) | | | 1,047,790 | | | | 112,387 | | |
| Texas Industries, Inc. | | | 566,369 | | | | 17,852 | | |
| | | | 346,376 | | |
| Producer Durables (13.7%) | |
| C.H. Robinson Worldwide, Inc. | | | 1,198,266 | | | | 83,783 | | |
| Corporate Executive Board Co. (The) | | | 1,280,963 | | | | 40,427 | | |
| Covanta Holding Corp. | | | 4,646,407 | | | | 73,181 | | |
| Expeditors International of Washington, Inc. | | | 2,485,913 | | | | 114,924 | | |
| Gartner, Inc. (a) | | | 2,619,914 | | | | 77,130 | | |
| Intertek Group PLC (United Kingdom) | | | 4,370,849 | | | | 125,651 | | |
| Leucadia National Corp. (a) | | | 3,443,981 | | | | 81,347 | | |
| Nalco Holding Co. | | | 2,942,409 | | | | 74,178 | | |
New Oriental Education & Technology
Group, Inc. ADR (China) (a) | | | 819,791 | | | | 79,995 | | |
| | | | 750,616 | | |
| Technology (18.6%) | |
| Akamai Technologies, Inc. (a) | | | 1,648,223 | | | | 82,708 | | |
| Alibaba.com Ltd. (China) (a) | | | 32,064,000 | | | | 66,782 | | |
| ARM Holdings PLC ADR (United Kingdom) | | | 2,848,270 | | | | 53,434 | | |
| Autodesk, Inc. (a) | | | 2,065,356 | | | | 66,029 | | |
| Citrix Systems, Inc. (a) | | | 555,822 | | | | 37,929 | | |
| IHS, Inc., Class A (a) | | | 1,008,587 | | | | 68,584 | | |
| Millicom International Cellular SA (Guatemala) | | | 516,878 | | | | 49,595 | | |
| Red Hat, Inc. (a) | | | 2,404,632 | | | | 98,590 | | |
| Rovi Corp. (a) | | | 1,127,125 | | | | 56,818 | | |
| Salesforce.com, Inc. (a) | | | 1,476,261 | | | | 165,046 | | |
| Solera Holdings, Inc. | | | 2,758,298 | | | | 121,806 | | |
| Teradata Corp. (a) | | | 3,928,101 | | | | 151,468 | | |
| | | | 1,018,789 | | |
| Total Common Stocks (Cost $4,554,251) | | | 5,358,339 | | |
| Convertible Preferred Stocks (0.6%) | |
| Alternative Energy (0.4%) | |
| Better Place LLC (a)(b)(c) | | | 7,507,951 | | | | 22,524 | | |
| Health Care (0.2%) | |
| Ironwood Pharmaceuticals, Inc. (a) | | | 1,331,207 | | | | 13,552 | | |
| Total Convertible Preferred Stocks (Cost $38,498) | | | 36,076 | | |
| Short-Term Investment (6.6%) | |
| Investment Company (6.6%) | |
Morgan Stanley Institutional
Liquidity Funds — Money Market
Portfolio — Institutional Class (Note G)
(Cost $359,619) | | | 359,618,924 | | | | 359,619 | | |
| Total Investments (105.0%) (Cost $4,952,368) | | | 5,754,034 | | |
| Liabilities in Excess of Other Assets (-5.0%) | | | (276,476 | ) | |
| Net Assets (100.0%) | | $ | 5,477,558 | | |
The accompanying notes are an integral part of the financial statements.
23
2010 Annual Report
September 30, 2010
Portfolio of Investments (cont'd)
Mid Cap Growth Portfolio
(a) Non-income producing security.
(b) Security has been deemed illiquid at September 30, 2010.
(c) At September 30, 2010, the Portfolio held approximately $22,524,000 of fair valued securities, representing 0.4% of net assets. These securities have been fair valued as determined in good faith under procedures established by and under the general supervision of the Portfolio's Trustees.
ADR American Depositary Receipt
Foreign Currency Exchange Contracts Information
The Portfolio had the following foreign currency exchange contract(s) open at period end:
| Counterparty | | Currency to
Deliver
(000) | | Value
(000) | | Settlement
Date | | In Exchange
For
(000) | | Value
(000) | | Net Unrealized
Appreciation
(Depreciation)
(000) | |
| Credit Suisse London Branch | | USD | 1,873 | | | $ | 1,873 | | | 10/4/10 | | CAD | 1,926 | | | $ | 1,872 | | | $ | (1 | ) | |
| Mellon Bank | | USD | 9,253 | | | | 9,253 | | | 10/4/10 | | EUR | 6,788 | | | | 9,254 | | | | 1 | | |
| State Street Bank and Trust Co. | | BRL | 513 | | | | 303 | | | 10/4/10 | | USD | 303 | | | | 303 | | | | — | @ | |
| State Street Bank and Trust Co. | | HKD | 56,386 | | | | 7,267 | | | 10/4/10 | | USD | 7,268 | | | | 7,268 | | | | 1 | | |
| State Street Bank and Trust Co. | | USD | 721 | | | | 721 | | | 10/4/10 | | BRL | 1,219 | | | | 721 | | | | — | @ | |
| State Street Bank and Trust Co. | | USD | 9 | | | | 9 | | | 10/4/10 | | BRL | 14 | | | | 9 | | | | — | @ | |
| Credit Suisse London Branch | | USD | 2,313 | | | | 2,313 | | | 10/5/10 | | HKD | 17,951 | | | | 2,314 | | | | 1 | | |
| Royal Bank of Scotland PLC | | USD | 3,658 | | | | 3,658 | | | 10/5/10 | | GBP | 2,328 | | | | 3,656 | | | | (2 | ) | |
| State Street Bank and Trust Co. | | USD | 3,728 | | | | 3,728 | | | 10/5/10 | | CHF | 3,659 | | | | 3,724 | | | | (4 | ) | |
| State Street Bank and Trust Co. | | USD | 5,420 | | | | 5,420 | | | 10/5/10 | | EUR | 3,978 | | | | 5,423 | | | | 3 | | |
| UBS AG | | HKD | 65,167 | | | | 8,399 | | | 10/5/10 | | USD | 8,397 | | | | 8,397 | | | | (2 | ) | |
| UBS AG | | USD | 213 | | | | 213 | | | 10/5/10 | | CHF | 209 | | | | 213 | | | | — | @ | |
| UBS AG | | USD | 786 | | | | 786 | | | 10/5/10 | | GBP | 501 | | | | 786 | | | | — | @ | |
| UBS AG | | USD | 1,054 | | | | 1,054 | | | 10/6/10 | | AUD | 1,087 | | | | 1,050 | | | | (4 | ) | |
| UBS AG | | USD | 3,000 | | | | 3,000 | | | 10/7/10 | | ZAR | 20,935 | | | | 3,003 | | | | 3 | | |
| | | | | | | $ | 47,997 | | | | | | | | | $ | 47,993 | | | $ | (4 | ) | |
@ — Value is less than $500.
AUD — Australian Dollar
BRL — Brazilian Real
CAD — Canadian Dollar
CHF — Swiss Franc
EUR — Euro
GBP — British Pound
HKD — Hong Kong Dollar
USD — United States Dollar
ZAR — South African Rand
Fair Value Measurement Information:
The following is a summary of the inputs used to value the Portfolio's net assets as of September 30, 2010. (See Note A-7 to the financial statements for further information regarding fair value measurement.)
| Investment Type | | Level 1
Quoted
prices
(000) | | Level 2
Other
significant
observable
inputs
(000) | | Level 3
Significant
unobservable
inputs
(000) | | Total
(000) | |
| Assets: | |
| Common Stocks | |
| Consumer Discretionary | | $ | 1,693,033 | | | $ | — | | | $ | — | | | $ | 1,693,033 | | |
| Consumer Staples | | | 55,870 | | | | — | | | | — | | | | 55,870 | | |
| Energy | | | 225,964 | | | | — | | | | — | | | | 225,964 | | |
Fair Value Measurement Information: (cont'd)
| Investment Type | | Level 1
Quoted
prices
(000) | | Level 2
Other
significant
observable
inputs
(000) | | Level 3
Significant
unobservable
inputs
(000) | | Total
(000) | |
| Common Stocks (cont'd) | |
| Financial Services | | $ | 600,402 | | | $ | — | | | $ | — | | | $ | 600,402 | | |
| Health Care | | | 667,289 | | | | — | | | | — | | | | 667,289 | | |
| Materials & Processing | | | 346,376 | | | | — | | | | — | | | | 346,376 | | |
| Producer Durables | | | 750,616 | | | | — | | | | — | | | | 750,616 | | |
| Technology | | | 1,018,789 | | | | — | | | | — | | | | 1,018,789 | | |
Total Common
Stocks | | | 5,358,339 | | | | — | | | | — | | | | 5,358,339 | | |
The accompanying notes are an integral part of the financial statements.
24
2010 Annual Report
September 30, 2010
Portfolio of Investments (cont'd)
Mid Cap Growth Portfolio
Fair Value Measurement Information: (cont'd)
| Investment Type | | Level 1
Quoted
prices
(000) | | Level 2
Other
significant
observable
inputs
(000) | |
Level 3
Significant
unobservable
inputs
(000) | | Total
(000) | |
Convertible
Preferred Stocks | | $ | 13,552 | | | $ | — | | | $ | 22,524 | | | $ | 36,076 | | |
| Short-Term Investment | |
| Investment Company | | | 359,619 | | | | — | | | | — | | | | 359,619 | | |
Foreign Currency
Exchange Contracts | | | — | | | | 9 | | | | — | | | | 9 | | |
| Total Assets | | | 5,731,510 | | | | 9 | | | | 22,524 | | | | 5,754,043 | | |
| Liabilities: | |
Foreign Currency
Exchange Contracts | | | — | | | | 13 | | | | — | | | | 13 | | |
| Total | | $ | 5,731,510 | | | $ | (4 | ) | | $ | 22,524 | | | $ | 5,754,030 | | |
Fair Value Measurement Information: (cont'd)
The following is a reconciliation of investments in which significant unobservable inputs (Level 3) were used in determining value:
| | | Convertible
Preferred
Stocks
(000) | |
| Balance as of 9/30/09 | | $ | 15,974 | | |
| Accrued discounts/premiums | | | — | | |
| Realized gain (loss) | | | — | | |
| Change in unrealized appreciation (depreciation) | | | (2,422 | ) | |
| Net purchases (sales) | | | 22,524 | | |
| Transfers in for Level 3 | | | — | | |
| Transfers out of Level 3 | | | (13,552 | ) | |
| Balance as of 9/30/10 | | $ | 22,524 | | |
The amount of total gains (losses) for the period
included in earnings attributable to the change
in unrealized gains (losses) relating to assets
and liabilities still held at Level 3 at 9/30/10. | | $ | — | | |
The accompanying notes are an integral part of the financial statements.
25
2010 Annual Report
September 30, 2010
Investment Overview (unaudited)
Core Fixed Income Portfolio
Performance
For the fiscal year ended September 30, 2010, the Portfolio's Class I had a total return based on net asset value and reinvestment of distributions per share of 8.57%, net of fees. The Portfolio's Class I outperformed against its benchmark the Barclays Capital U.S. Aggregate Index (the "Index") which returned 8.16%.
Factors Affecting Performance
• During much of the 12-month period, global sentiment was fragile and financial markets were volatile. Government bonds in most developed countries continued to be regarded as "safe haven" assets relative to sectors with greater credit risk. However, the debt of governments on the periphery of Europe continued to underperform those in other developed markets as investors fretted about their fiscal problems. Outside of these trouble spots, declining government bond yields in the rest of Europe and North America appeared to indicate a general reduction in investors' expectations for economic growth and inflation in those markets, while policy makers in emerging markets continued to adjust monetary policy to recognize economic strength.
• Amidst continued weakness in economic indicators, the Federal Open Market Committee (the "Fed") kept the federal funds target rate in the range of zero to 0.25%. The labor market continued to languish, with the unemployment rate at its highest level in many years, albeit declining in recent months. On the housing front, data remained dim, with some pockets of improvement.
• Investment-grade corporate debt posted positive returns during the period (as measured by the Barclays Capital U.S. Corporate Index), and among sectors, financials outpaced industrials and utilities. In mid-2010, the U.S. credit market was negatively affected by the European sovereign debt crisis. However, the outlook for the investment grade corporate debt sector remains favorable in our view — especially in industrials with strong balance sheets, sufficient liquidity, improving revenue growth and free cash flow.
• The agency mortgage-backed security (MBS) sector performed well during the period. The Fed's support of the agency MBS market ended in March; as expected, the Fed absorbed most of the supply of new MBS during the program's life, though the market remained stable after the withdrawal of the Fed's support. The MBS market also benefited from a lack of refinancing activity. Despite lower rates, refinancing applications did not pick up significantly during the period as tighter credit underwriting standards and lower home values stood in the way for most homeowners.
• The U.S. Treasury yield curve flattened during the period, with yields on 2-, 5-, 10-, and 30-year Treasuries declining by 44, 94, 71, and 31 basis points, respectively.
• The Portfolio's allocation to investment-grade credit was the main driver of performance. Within the corporate sector, overweights in the banking, food and beverage, insurance, and media sectors were additive to relative returns as significant spread tightening in these sectors led to their strong performance.
• Additionally, interest-rate positions contributed to performance. Throughout the period, we employed tactical strategies involving interest rate swaps that were designed to take advantage of anomalies across the swap curve. Similar to the Treasury curve, the swap curve shows the relationship of various maturities of swaps and their yields.
• The Portfolio's mortgage strategy bolstered performance. Earlier in the period, the Portfolio gained from our focus on bonds with coupons in the 4% to 5.5% range, which benefited strongly from the Fed's MBS purchase program. A move to higher coupon issues (those with coupons of 5.5% and above) was also favorable as prepayments remained low due to homeowner credit impairment, erosion of home equity, and tighter credit standards. Our decision to favor 30-year MBS over the 15-year sector was beneficial as longer-maturity issues outperformed during the period.
• An overweight to Build America Bonds detracted slightly from relative performance as the sector underperformed other taxable sectors.
26
2010 Annual Report
September 30, 2010
Investment Overview (unaudited) (cont'd)
Core Fixed Income Portfolio
Management Strategies
• The Portfolio began the period with an overweight to the MBS sector, and a focus within the sector on bonds with coupons in the 4% to 5.5% range, given our expectations for this portion of the MBS market to outperform as a result of the Fed's MBS purchase program. As MBS prices rose and the Fed's MBS purchase program came to an end, we took profits and moved from an overweight in mortgage spread duration (a measure of risk exposure to a non-Treasury sector) to a neutral weighting. We also shifted the Portfolio's focus to higher-coupon issues.
• Throughout the period, the Portfolio was positioned with an overweight to investment-grade credit. We have a favorable view of the corporate debt sector and therefore we continue to maintain an overweight to this sector.
• With regard to interest rate strategy, the Portfolio was positioned to benefit from an anticipated flattening (or, reduction in the difference of yield spreads) between the two- and five-year segments of the yield curve. Once this flattening occurred in the third quarter of 2010, we took profits and unwound the position.

* Minimum Investment
In accordance with SEC regulations, the Portfolio's performance shown assumes that all recurring fees (including management fees) were deducted and all dividends and distributions were reinvested. The performance of Class P shares will vary from the Class I shares based upon their different inception dates and will be negatively impacted by additional fees assessed to those classes.
Performance Compared to the Barclays Capital U.S. Aggregate Index(1) and the Lipper Intermediate Investment Grade Debt Funds Index(2)
| | | Total Returns(3) | |
| | | | | Average Annual | |
| | | One
Year | | Five
Years | | Ten
Years | | Since
Inception(6) | |
Portfolio — Class I
w/o sales charges(4) | | | 8.57 | % | | | 3.15 | % | | | 5.02 | % | | | 7.13 | % | |
Barclays Capital U.S.
Aggregate Index | | | 8.16 | | | | 6.20 | | | | 6.41 | | | | 7.67 | | |
Lipper Intermediate Investment
Grade Debt Funds Index | | | 11.33 | | | | 5.75 | | | | 6.08 | | | | N/A | | |
Portfolio — Class P
w/o sales charges(5) | | | 8.47 | | | | 2.92 | | | | 4.77 | | | | 4.56 | | |
Barclays Capital U.S.
Aggregate Index | | | 8.16 | | | | 6.20 | | | | 6.41 | | | | 6.20 | | |
Lipper Intermediate Investment
Grade Debt Funds Index | | | 11.33 | | | | 5.75 | | | | 6.08 | | | | 5.84 | | |
Performance data quoted represents past performance, which is no guarantee of future results, and current performance may be lower or higher than the figures shown. Performance assumes that all dividends and distributions, if any, were reinvested. For the most recent month-end performance figures, please visit www.morganstanley.com/im. Investment returns and principal value will fluctuate so that Portfolio shares, when redeemed, may be worth more or less than their original cost. Total returns do not reflect the deduction of taxes that a shareholder would pay on Portfolio distributions or the redemption of Portfolio shares. Performance of share classes will vary due to differences in sales charges and expenses.
(1) The Barclays Capital U.S. Aggregate Index tracks the performance of all U.S. government agency and Treasury securities, investment-grade corporate debt securities, agency mortgage-backed securities, asset-backed securities and commercial mortgage-backed securities. The Index is unmanaged and its returns do not include any sales charges or fees. Such costs would lower performance. It is not possible to invest directly in an index.
(2) The Lipper Intermediate Investment Grade Debt Funds Index is an equally weighted performance index of the largest qualifying funds (based on net assets) in the Lipper Intermediate Investment Grade Debt Funds classification. The Index, which is adjusted for capital gains distributions and income dividends, is unmanaged and should not be considered an investment. There are currently 30 funds represented in this Index. As of the date of this report, the Portfolio was in the Lipper Intermediate Investment Grade Debt Funds classification.
(3) Total returns for the Portfolio reflect expenses waived and/or reimbursed, if applicable, by the Adviser. Without such waivers and/or reimbursements, total returns would have been lower. Fee waivers and/or reimbursements are voluntary and the Adviser reserves the right to commence or terminate any waiver and/or reimbursement at any time.
(4) Commenced operations on September 29, 1987.
(5) Commenced operations on March 1, 1999.
(6) For comparative purposes, average annual since inception returns listed for the Indexes refer to the inception date or initial offering of the respective share class of the Portfolio, not the inception of the Indexes.
27
2010 Annual Report
September 30, 2010
Investment Overview (unaudited) (cont'd)
Core Fixed Income Portfolio
Portfolio Composition*
| Classification | | Percentage of
Total Investments | |
| Agency Fixed Rate Mortgages | | | 25.9 | % | |
| U.S. Treasury Securities | | | 20.6 | | |
| Other** | | | 15.5 | | |
| Finance | | | 14.7 | | |
| Short-Term Investments | | | 11.8 | | |
| Industrials | | | 11.5 | | |
| Total Investments | | | 100.0 | % | |
* Percentages indicated are based upon total investments (excluding Securities held as collateral on Loaned Securities) as of September 30, 2010.
** Industries and/or investment types representing less than 5% of total investments.
28
2010 Annual Report
September 30, 2010
Portfolio of Investments
Core Fixed Income Portfolio
| | | Face
Amount
(000) | | Value
(000) | |
| Fixed Income Securities (98.8%) | |
| Agency Adjustable Rate Mortgages (1.9%) | |
| Federal Home Loan Mortgage Corp., | |
| Conventional Pools: | |
| 5.52%, 5/1/37 | | $ | 297 | | | $ | 316 | | |
| 5.92%, 12/1/36 | | | 215 | | | | 228 | | |
| 6.04%, 2/1/37 | | | 122 | | | | 130 | | |
| Federal National Mortgage Association, | |
| Conventional Pools: | |
| 2.60%, 7/1/35 | | | 210 | | | | 220 | | |
| 5.74%, 3/1/38 | | | 116 | | | | 124 | | |
| Government National Mortgage Association, | |
| Various Pools: | |
| 3.38%, 2/20/25 - 6/20/25 | | | 322 | | | | 332 | | |
| 3.63%, 8/20/25 - 9/20/27 | | | 67 | | | | 69 | | |
| | | | 1,419 | | |
| Agency Bond — Banking (FDIC Guaranteed) (2.9%) | |
| Ally Financial, Inc. | |
| 2.20%, 12/19/12 (a) | | | 2,140 | | | | 2,213 | | |
| Agency Fixed Rate Mortgages (29.0%) | |
| Federal Home Loan Mortgage Corp., | |
| Gold Pools: | |
| 5.00%, 10/1/35 | | | 1,483 | | | | 1,568 | | |
| 6.00%, 5/1/37 - 8/1/37 | | | 462 | | | | 497 | | |
| 6.50%, 4/1/29 | | | 52 | | | | 58 | | |
| 7.50%, 5/1/35 | | | 81 | | | | 93 | | |
| 8.00%, 8/1/32 | | | 39 | | | | 45 | | |
| 8.50%, 8/1/31 | | | 62 | | | | 73 | | |
| October TBA: | |
| 4.50%, 10/25/40 (b) | | | 425 | | | | 442 | | |
| Federal National Mortgage Association, | |
| Conventional Pools: | |
| 5.00%, 3/1/39 | | | 1,413 | | | | 1,498 | | |
| 5.50%, 4/1/34 - 8/1/38 | | | 4,616 | | | | 4,928 | | |
| 6.00%, 12/1/36 - 12/1/38 | | | 2,307 | | | | 2,484 | | |
| 6.03%, 10/25/40 | | | 175 | | | | 196 | | |
| 6.50%, 7/1/29 - 2/1/39 | | | 1,663 | | | | 1,839 | | |
| 7.00%, 10/1/31 - 12/1/31 | | | 5 | | | | 5 | | |
| 7.50%, 8/1/37 | | | 140 | | | | 160 | | |
| 8.00%, 4/1/33 | | | 101 | | | | 117 | | |
| 8.50%, 10/1/32 | | | 99 | | | | 116 | | |
| November TBA: | |
| 4.50%, 11/25/40 (b) | | | 2,075 | | | | 2,157 | | |
| October TBA: | |
| 4.00%, 10/25/25 (b) | | | 375 | | | | 392 | | |
| Government National Mortgage Association, | |
| November TBA: | |
| 4.00%, 11/25/40 (b) | | | 2,800 | | | | 2,887 | | |
| 4.50%, 11/25/40 (b) | | | 1,570 | | | | 1,649 | | |
| Various Pools: | |
| 4.50%, 5/15/40 | | | 777 | | | | 819 | | |
| | | | 22,023 | | |
| | | Face
Amount
(000) | | Value
(000) | |
| Asset-Backed Securities (1.3%) | |
| Ally Master Owner Trust | |
| 2.88%, 4/15/15 (c) | | $ | 225 | | | $ | 232 | | |
| ARI Fleet Lease Trust | |
| 1.71%, 8/15/18 (c)(d) | | | 118 | | | | 118 | | |
| Brazos Student Finance Corp. | |
| 1.19%, 6/25/35 (d) | | | 73 | | | | 73 | | |
| Chesapeake Funding LLC | |
| 2.26%, 12/15/20 (c)(d) | | | 175 | | | | 176 | | |
| GE Dealer Floorplan Master Note Trust | |
| 1.81%, 10/20/14 (c)(d) | | | 225 | | | | 229 | | |
| Missouri Higher Education Loan Authority | |
| 1.17%, 8/27/29 (d) | | | 122 | | | | 122 | | |
| | | | 950 | | |
| Collateralized Mortgage Obligations — Agency Collateral Series (0.7%) | |
| Federal Home Loan Mortgage Corp., | |
| IO STRIPS | |
| 7.49%, 5/15/36 (d) | | | 1,324 | | | | 213 | | |
| 8.00%, 1/1/28 | | | 28 | | | | 6 | | |
| Federal National Mortgage Association, | |
| IO REMIC | |
| 6.44%, 2/25/24 (d) | | | 800 | | | | 89 | | |
| Goverment National Mortgage Association, | |
| IO STRIPS | |
| 5.79%, 9/20/40 (b) | | | 1,500 | | | | 230 | | |
| | | | 538 | | |
| Commercial Mortgage Backed Securities (3.0%) | |
| Bear Stearns Commercial Mortgage Securities | |
| 5.47%, 1/12/45 (d) | | | 325 | | | | 356 | | |
| Citigroup Commercial Mortgage Trust, (Note G) | |
| 5.43%, 10/15/49 | | | 200 | | | | 216 | | |
| 5.89%, 12/10/49 (d) | | | 402 | | | | 431 | | |
| Commercial Mortgage Pass-Through Certificates | |
| 6.01%, 12/10/49 (d) | | | 350 | | | | 382 | | |
| Greenwich Capital Commercial Funding Corp. | |
| 5.44%, 3/10/39 | | | 100 | | | | 106 | | |
| GS Mortgage Securities Corp. II | |
| 5.55%, 4/10/38 (d) | | | 100 | | | | 108 | | |
| LB-UBS Commercial Mortgage Trust, | |
| 5.16%, 2/15/31 | | | 325 | | | | 354 | | |
| 5.37%, 9/15/39 | | | 300 | | | | 327 | | |
| | | | 2,280 | | |
| Corporate Bonds (32.9%) | |
| Finance (16.4%) | |
| Abbey National Treasury Services PLC | |
| 3.88%, 11/10/14 (c) | | | 140 | | | | 143 | | |
| Aegon N.V. | |
| 4.63%, 12/1/15 | | | 175 | | | | 186 | | |
| AIG SunAmerica Global Financing VI | |
| 6.30%, 5/10/11 (c) | | | 365 | | | | 374 | | |
| American Express Co. | |
| 8.13%, 5/20/19 (a) | | | 240 | | | | 311 | | |
The accompanying notes are an integral part of the financial statements.
29
2010 Annual Report
September 30, 2010
Portfolio of Investments (cont'd)
Core Fixed Income Portfolio
| | | Face
Amount
(000) | | Value
(000) | |
| Finance (cont'd) | |
| Bank of America Corp. | |
| 5.75%, 12/1/17 (a) | | $ | 685 | | | $ | 734 | | |
| Barclays Bank PLC | |
| 6.75%, 5/22/19 (a) | | | 220 | | | | 262 | | |
| Bear Stearns Cos. LLC (The), | |
| 6.40%, 10/2/17 | | | 25 | | | | 29 | | |
| 7.25%, 2/1/18 (a) | | | 170 | | | | 207 | | |
| Boston Properties LP | |
| 5.88%, 10/15/19 (a) | | | 50 | | | | 56 | | |
| Brookfield Asset Management, Inc., | |
| 5.80%, 4/25/17 | | | 115 | | | | 121 | | |
| 7.13%, 6/15/12 | | | 60 | | | | 65 | | |
| Capital One Financial Corp. | |
| 6.75%, 9/15/17 (a) | | | 200 | | | | 241 | | |
| Catlin Insurance Co., Ltd. | |
| 7.25%, (c)(d)(g) | | | 155 | | | | 127 | | |
| Citigroup, Inc., (Note G) | |
| 5.88%, 5/29/37 | | | 150 | | | | 150 | | |
| 6.13%, 11/21/17 - 5/15/18 | | | 195 | | | | 213 | | |
| 8.50%, 5/22/19 | | | 240 | | | | 297 | | |
| Credit Agricole SA | |
| 3.50%, 4/13/15 (c) | | | 290 | | | | 299 | | |
| Credit Suisse AG | |
| 5.40%, 1/14/20 (a) | | | 135 | | | | 144 | | |
| Credit Suisse, New York, | |
| 5.30%, 8/13/19 | | | 170 | | | | 189 | | |
| 6.00%, 2/15/18 (a) | | | 60 | | | | 66 | | |
| Duke Realty LP | |
| 6.75%, 3/15/20 (a) | | | 150 | | | | 168 | | |
| General Electric Capital Corp. | |
| 6.00%, 8/7/19 (a) | | | 670 | | | | 755 | | |
| Goldman Sachs Group, Inc. (The), | |
| 6.15%, 4/1/18 (a) | | | 480 | | | | 533 | | |
| 7.50%, 2/15/19 | | | 110 | | | | 131 | | |
| Hartford Financial Services Group, Inc. | |
| 5.50%, 3/30/20 | | | 175 | | | | 178 | | |
| HBOS PLC | |
| 6.75%, 5/21/18 (c) | | | 340 | | | | 342 | | |
| HSBC Bank PLC | |
| 3.50%, 6/28/15 (c) | | | 140 | | | | 147 | | |
| ING Bank | |
| 3.00%, 9/1/15 (a)(c) | | | 115 | | | | 115 | | |
| Intesa Sanpaolo SpA | |
| 3.63%, 8/12/15 (c) | | | 100 | | | | 101 | | |
| JPMorgan Chase & Co., | |
| 3.40%, 6/24/15 (a) | | | 40 | | | | 42 | | |
| 4.95%, 3/25/20 | | | 50 | | | | 53 | | |
| 6.00%, 1/15/18 | | | 95 | | | | 109 | | |
| 6.30%, 4/23/19 | | | 75 | | | | 87 | | |
| MetLife, Inc. | |
| 7.72%, 2/15/19 (a) | | | 150 | | | | 191 | | |
| | | Face
Amount
(000) | | Value
(000) | |
| NASDAQ OMX Group, Inc. (The) | |
| 5.55%, 1/15/20 | | $ | 170 | | | $ | 181 | | |
| Nationwide Building Society | |
| 6.25%, 2/25/20 (c) | | | 345 | | | | 381 | | |
| Pacific LifeCorp | |
| 6.00%, 2/10/20 (c) | | | 125 | | | | 135 | | |
| Platinum Underwriters Finance, Inc. | |
| 7.50%, 6/1/17 | | | 120 | | | | 133 | | |
| PNC Funding Corp. | |
| 6.70%, 6/10/19 | | | 125 | | | | 148 | | |
| Principal Financial Group, Inc. | |
| 8.88%, 5/15/19 | | | 100 | | | | 132 | | |
| Prudential Financial, Inc., | |
| 4.75%, 9/17/15 (a) | | | 80 | | | | 87 | | |
| 7.38%, 6/15/19 | | | 170 | | | | 207 | | |
| Reinsurance Group of America, Inc. | |
| 6.45%, 11/15/19 | | | 135 | | | | 150 | | |
| Royal Bank of Scotland PLC (The) | |
| 4.88%, 3/16/15 (a) | | | 295 | | | | 311 | | |
| Santander US Debt SA Unipersonal | |
| 3.72%, 1/20/15 (a)(c) | | | 200 | | | | 203 | | |
| Simon Property Group LP | |
| 5.65%, 2/1/20 (a) | | | 25 | | | | 28 | | |
| Societe Generale | |
| 3.10%, 9/14/15 (a)(c) | | | 115 | | | | 116 | | |
| Standard Chartered Bank | |
| 6.40%, 9/26/17 (c) | | | 100 | | | | 112 | | |
| Standard Chartered PLC | |
| 3.85%, 4/27/15 (c) | | | 100 | | | | 104 | | |
| Svenska Handelsbanken AB | |
| 5.13%, 3/30/20 (c) | | | 175 | | | | 192 | | |
| UBS AG | |
| 5.88%, 12/20/17 (a) | | | 135 | | | | 153 | | |
| UnitedHealth Group, Inc. | |
| 6.63%, 11/15/37 (a) | | | 195 | | | | 228 | | |
| US Bank NA | |
| 3.78%, 4/29/20 (a)(d) | | | 250 | | | | 261 | | |
US Central Federal Credit Union (U.S.
Government Guaranteed) | |
| 1.90%, 10/19/12 (a) | | | 940 | | | | 965 | | |
WEA Finance LLC/WT Finance Australia
Property Ltd. | |
| 6.75%, 9/2/19 (c) | | | 200 | | | | 237 | | |
| WellPoint, Inc. | |
| 6.38%, 6/15/37 | | | 285 | | | | 319 | | |
| Wells Fargo & Co. | |
| 5.63%, 12/11/17 (a) | | | 305 | | | | 348 | | |
| Westpac Banking Corp. | |
| 3.00%, 8/4/15 | | | 145 | | | | 148 | | |
| | | | 12,445 | | |
| Industrials (12.8%) | |
| Agilent Technologies, Inc. | |
| 5.50%, 9/14/15 | | | 120 | | | | 135 | | |
The accompanying notes are an integral part of the financial statements.
30
2010 Annual Report
September 30, 2010
Portfolio of Investments (cont'd)
Core Fixed Income Portfolio
| | | Face
Amount
(000) | | Value
(000) | |
| Industrials (cont'd) | |
| Altria Group, Inc., | |
| 4.13%, 9/11/15 (a) | | $ | 50 | | | $ | 54 | | |
| 9.25%, 8/6/19 | | | 125 | | | | 168 | | |
| Anglo American Capital PLC | |
| 9.38%, 4/8/19 (a)(c) | | | 200 | | | | 270 | | |
| Anheuser-Busch InBev Worldwide, Inc. | |
| 7.20%, 1/15/14 (c) | | | 205 | | | | 239 | | |
| ArcelorMittal | |
| 9.85%, 6/1/19 (a) | | | 100 | | | | 129 | | |
| AT&T, Inc., | |
| 6.15%, 9/15/34 | | | 200 | | | | 220 | | |
| 6.30%, 1/15/38 | | | 150 | | | | 170 | | |
| BAT International Finance PLC | |
| 9.50%, 11/15/18 (c) | | | 165 | | | | 225 | | |
| Bunge Ltd. Finance Corp. | |
| 8.50%, 6/15/19 | | | 85 | | | | 103 | | |
| Comcast Corp., | |
| 5.15%, 3/1/20 (a) | | | 75 | | | | 82 | | |
| 5.70%, 5/15/18 | | | 100 | | | | 115 | | |
| ConAgra Foods, Inc. | |
| 8.25%, 9/15/30 | | | 140 | | | | 190 | | |
| Corning, Inc., | |
| 6.63%, 5/15/19 | | | 30 | | | | 36 | | |
| 7.25%, 8/15/36 | | | 50 | | | | 60 | | |
| COX Communications, Inc. | |
| 8.38%, 3/1/39 (a)(c) | | | 25 | | | | 34 | | |
| CVS Pass-Through Trust | |
| 6.04%, 12/10/28 | | | 350 | | | | 371 | | |
| Daimler Finance North America LLC, | |
| 7.30%, 1/15/12 | | | 95 | | | | 102 | | |
| 8.50%, 1/18/31 (a) | | | 55 | | | | 76 | | |
| Darden Restaurants, Inc. | |
| 6.20%, 10/15/17 | | | 205 | | | | 240 | | |
| Delhaize America, Inc. | |
| 9.00%, 4/15/31 | | | 75 | | | | 106 | | |
| Deutsche Telekom International Finance BV | |
| 8.75%, 6/15/30 | | | 65 | | | | 91 | | |
DirecTV Holdings LLC/DirecTV
Financing Co., Inc. | |
| 5.88%, 10/1/19 | | | 150 | | | | 171 | | |
| Genzyme Corp. | |
| 3.63%, 6/15/15 (c) | | | 115 | | | | 122 | | |
| Grupo Bimbo SAB de CV | |
| 4.88%, 6/30/20 (a)(c) | | | 100 | | | | 105 | | |
| Harley-Davidson Funding Corp. | |
| 6.80%, 6/15/18 (c) | | | 160 | | | | 174 | | |
| Hess Corp. | |
| 6.00%, 1/15/40 | | | 175 | | | | 193 | | |
| Holcim US Finance Sarl & Cie SCS | |
| 6.00%, 12/30/19 (c) | | | 85 | | | | 93 | | |
| Home Depot, Inc. | |
| 5.88%, 12/16/36 | | | 190 | | | | 203 | | |
| | | Face
Amount
(000) | | Value
(000) | |
| KLA-Tencor Corp. | |
| 6.90%, 5/1/18 | | $ | 145 | | | $ | 167 | | |
| Kraft Foods, Inc. | |
| 5.38%, 2/10/20 (a) | | | 315 | | | | 353 | | |
| L-3 Communications Corp. | |
| 4.75%, 7/15/20 (a) | | | 165 | | | | 173 | | |
| Mosaic Co. (The) | |
| 7.63%, 12/1/16 (c) | | | 225 | | | | 244 | | |
| NBC Universal, Inc. | |
| 5.15%, 4/30/20 (c) | | | 140 | | | | 151 | | |
| News America, Inc. | |
| 7.85%, 3/1/39 | | | 205 | | | | 263 | | |
| Nissan Motor Acceptance Corp. | |
| 4.50%, 1/30/15 (c) | | | 75 | | | | 80 | | |
| Omnicom Group, Inc. | |
| 4.45%, 8/15/20 | | | 115 | | | | 118 | | |
| Petrobras International Finance Co. | |
| 5.75%, 1/20/20 | | | 175 | | | | 195 | | |
| Potash Corp. of Saskatchewan, Inc. | |
| 5.88%, 12/1/36 | | | 110 | | | | 115 | | |
| Quest Diagnostics, Inc. | |
| 6.95%, 7/1/37 | | | 200 | | | | 230 | | |
| Rio Tinto Finance USA Ltd. | |
| 9.00%, 5/1/19 (a) | | | 250 | | | | 349 | | |
| Ryder System, Inc. | |
| 7.20%, 9/1/15 | | | 65 | | | | 77 | | |
| Southern Copper Corp., | |
| 5.38%, 4/16/20 (a) | | | 40 | | | | 43 | | |
| 6.75%, 4/16/40 (a) | | | 65 | | | | 71 | | |
| Telecom Italia Capital SA | |
| 7.00%, 6/4/18 (a) | | | 170 | | | | 196 | | |
| Telefonica Europe BV | |
| 8.25%, 9/15/30 (a) | | | 195 | | | | 258 | | |
Teva Pharmaceutical Finance II BV/Teva
Pharmaceutical Finance III LLC | |
| 3.00%, 6/15/15 | | | 155 | | | | 162 | | |
| Time Warner Cable, Inc., | |
| 6.75%, 6/15/39 (a) | | | 40 | | | | 46 | | |
| 8.75%, 2/14/19 (a) | | | 110 | | | | 145 | | |
| Time Warner, Inc., | |
| 4.70%, 1/15/21 (a) | | | 100 | | | | 106 | | |
| 5.88%, 11/15/16 | | | 75 | | | | 87 | | |
| 7.70%, 5/1/32 (a) | | | 10 | | | | 13 | | |
| Tyco Electronics Group SA | |
| 5.95%, 1/15/14 | | | 490 | | | | 546 | | |
| Vale Overseas Ltd., | |
| 5.63%, 9/15/19 (a) | | | 110 | | | | 122 | | |
| 6.88%, 11/10/39 | | | 20 | | | | 23 | | |
| Verizon Communications, Inc. | |
| 8.95%, 3/1/39 | | | 145 | | | | 213 | | |
| Viacom, Inc. | |
| 6.88%, 4/30/36 | | | 165 | | | | 194 | | |
| Vivendi SA | |
| 6.63%, 4/4/18 (c) | | | 120 | | | | 139 | | |
The accompanying notes are an integral part of the financial statements.
31
2010 Annual Report
September 30, 2010
Portfolio of Investments (cont'd)
Core Fixed Income Portfolio
| | | Face
Amount
(000) | | Value
(000) | |
| Industrials (cont'd) | |
| Weatherford International Ltd. | |
| 9.63%, 3/1/19 (a) | | $ | 165 | | | $ | 216 | | |
| Woolworths Ltd. | |
| 4.00%, 9/22/20 (c) | | | 125 | | | | 128 | | |
| WPP Finance UK | |
| 8.00%, 9/15/14 | | | 100 | | | | 119 | | |
| Xerox Corp. | |
| 5.63%, 12/15/19 | | | 40 | | | | 45 | | |
| Yum! Brands, Inc. | |
| 3.88%, 11/1/20 | | | 95 | | | | 95 | | |
| | | | 9,759 | | |
| Utilities (3.7%) | |
| CenterPoint Energy Resources Corp. | |
| 6.25%, 2/1/37 | | | 135 | | | | 153 | | |
| EDF SA | |
| 4.60%, 1/27/20 (a)(c) | | | 80 | | | | 87 | | |
| Enel Finance International SA | |
| 5.13%, 10/7/19 (a)(c) | | | 275 | | | | 292 | | |
| Energy Transfer Partners LP | |
| 9.00%, 4/15/19 | | | 125 | | | | 160 | | |
| Enterprise Products Operating LLC, | |
| 5.25%, 1/31/20 (a) | | | 50 | | | | 54 | | |
| 6.50%, 1/31/19 | | | 160 | | | | 187 | | |
| Exelon Generation Co. LLC | |
| 6.25%, 10/1/39 (a) | | | 315 | | | | 339 | | |
| FirstEnergy Solutions Corp. | |
| 6.05%, 8/15/21 (a) | | | 225 | | | | 241 | | |
| Iberdrola Finance Ireland Ltd. | |
| 5.00%, 9/11/19 (c) | | | 175 | | | | 175 | | |
| Kinder Morgan Energy Partners LP | |
| 5.95%, 2/15/18 | | | 285 | | | | 322 | | |
| Nisource Finance Corp., | |
| 6.13%, 3/1/22 (a) | | | 100 | | | | 114 | | |
| 6.80%, 1/15/19 | | | 170 | | | | 202 | | |
Plains All American Pipeline LP/PAA
Finance Corp., | |
| 6.70%, 5/15/36 | | | 160 | | | | 175 | | |
| 8.75%, 5/1/19 (a) | | | 65 | | | | 83 | | |
| PPL Energy Supply LLC, | |
| 6.30%, 7/15/13 | | | 165 | | | | 184 | | |
| 6.50%, 5/1/18 (a) | | | 20 | | | | 23 | | |
| | | | 2,791 | | |
| | | | 24,995 | | |
| Mortgages — Other (0.0%) | |
| Gemsco Mortgage Pass-Through Certificates | |
| 8.70%, 11/25/10 (e)(f) | | | — | @ | | | — | @ | |
| Municipal Bonds (1.2%) | |
| Chicago Transit Authority | |
| 6.20%, 12/1/40 | | | 100 | | | | 102 | | |
| City of Chicago | |
| 6.40%, 1/1/40 | | | 40 | | | | 43 | | |
| | | Face
Amount
(000) | | Value
(000) | |
| City of New York | |
| 5.97%, 3/1/36 | | $ | 85 | | | $ | 92 | | |
Illinois State Toll Highway Authority, Highway
Revenue, Build America Bonds | |
| 6.18%, 1/1/34 | | | 130 | | | | 139 | | |
| Municipal Electric Authority of Georgia, | |
| 6.64%, 4/1/57 | | | 90 | | | | 97 | | |
| 6.66%, 4/1/57 | | | 155 | | | | 164 | | |
| New York City Transitional Finance Authority | |
| 5.27%, 5/1/27 | | | 80 | | | | 87 | | |
| State of California, General Obligation Bonds | |
| 5.95%, 4/1/16 | | | 175 | | | | 193 | | |
| | | | 917 | | |
| Sovereign (0.8%) | |
| Bermuda Government International Bond | |
| 5.60%, 7/20/20 (c) | | | 100 | | | | 109 | | |
| Export - Import Bank of Korea | |
| 4.13%, 9/9/15 | | | 100 | | | | 105 | | |
| Federative Republic of Brazil | |
| 6.00%, 1/17/17 | | | 190 | | | | 222 | | |
| Korea Development Bank | |
| 4.38%, 8/10/15 (a) | | | 130 | | | | 138 | | |
| | | | 574 | | |
| U.S. Agency Securities (2.0%) | |
| Federal Home Loan Mortgage Corp. | |
| 4.88%, 6/13/18 | | | 600 | | | | 706 | | |
| Federal National Mortgage Association, | |
| 1.25%, 8/20/13 | | | 300 | | | | 304 | | |
| 6.63%, 11/15/30 | | | 385 | | | | 531 | | |
| | | | 1,541 | | |
| U.S. Treasury Securities (23.1%) | |
| U.S. Treasury Bonds, | |
| 4.25%, 5/15/39 (a) | | | 1,820 | | | | 2,001 | | |
| 5.50%, 8/15/28 | | | 1,500 | | | | 1,946 | | |
| 7.50%, 11/15/24 | | | 2,900 | | | | 4,396 | | |
| U.S. Treasury Notes, | |
| 1.75%, 7/31/15 (a) | | | 3,500 | | | | 3,585 | | |
| 2.25%, 1/31/15 (a) | | | 675 | | | | 708 | | |
| 2.50%, 4/30/15 (a) | | | 500 | | | | 530 | | |
| 2.63%, 12/31/14 | | | 1,555 | | | | 1,657 | | |
| 2.75%, 2/15/19 (a) | | | 505 | | | | 524 | | |
| 3.63%, 2/15/20 (a) | | | 1,950 | | | | 2,139 | | |
| | | | 17,486 | | |
| Total Fixed Income Securities (Cost $70,591) | | | 74,936 | | |
| | | Shares | | | |
| Short-Term Investments (31.6%) | |
| Securities held as Collateral on Loaned Securities (18.5%) | |
| Investment Company (16.2%) | |
Morgan Stanley Institutional
Liquidity Funds — Money Market
Portfolio — Institutional Class (Note G) | | | 12,269,058 | | | | 12,269 | | |
The accompanying notes are an integral part of the financial statements.
32
2010 Annual Report
September 30, 2010
Portfolio of Investments (cont'd)
Core Fixed Income Portfolio
| | | Face
Amount
(000) | | Value
(000) | |
| Repurchase Agreements (2.3%) | |
Bank of America Securities, LLC, (0.32%, dated
9/30/10, due 10/1/10; proceeds $808;
fully collateralized by a U.S. Government
Agency at the date of this Portfolio of
Investments as follows: Federal National
Mortgage Association; 4.5% due 9/1/40;
valued at $824) | | $ | 808 | | | $ | 808 | | |
Barclays Capital, Inc., (0.25%, dated 9/30/10,
due 10/1/10; proceeds $919; fully
collateralized by a U.S. Treasury Security at
the date of this Portfolio of Investments as
follows: U.S. Treasury Bond; 8.5% due
2/15/20; valued at $937) | | | 919 | | | | 919 | | |
| | | | 1,727 | | |
Total Securities held as Collateral on
Loaned Securities (Cost $13,996) | | | 13,996 | | |
| | | Shares | | | |
| Investment Company (1.8%) | |
Morgan Stanley Institutional
Liquidity Funds — Money Market
Portfolio — Institutional Class (See Note G) | | | 1,398,753 | | | | 1,399 | | |
| | | Face
Amount
(000) | | | |
| U.S. Treasury Securities (11.3%) | |
| U.S. Treasury Bills, | |
| 0.12%, 11/12/10 (a)(h) | | $ | 3,000 | | | | 3,000 | | |
| 0.13%, 10/28/10 (h)(i)(j) | | | 250 | | | | 250 | | |
| 0.15%, 10/28/10 (h)(i)(j) | | | 550 | | | | 550 | | |
| 0.20%, 10/28/10 (h)(i)(j) | | | 783 | | | | 783 | | |
| 0.25%, 2/10/11 (h) | | | 4,000 | | | | 3,996 | | |
| | | | 8,579 | | |
| Total Short-Term Investments (Cost $23,974) | | | 23,974 | | |
Total Investments (130.4%) (Cost $94,565)
Including $18,568 of Securities Loaned | | | 98,910 | | |
| Liabilities in Excess of Other Assets (-30.4%) | | | (23,050 | ) | |
| Net Assets (100.0%) | | $ | 75,860 | | |
(a) All or a portion of this security was on loan at September 30, 2010.
(b) Security is subject to delayed delivery.
(c) 144A security — Certain conditions for public sale may exist. Unless otherwise noted, these securities are deemed to be liquid.
(d) Variable/Floating Rate Security — Interest rate changes on these instruments are based on changes in a designated base rate. The rates shown are those in effect on September 30, 2010.
(e) At September 30, 2010, the Portfolio held less than $500 of fair valued securities, representing less than 0.5% of net assets. These securities have been fair valued as determined in good faith under procedures established by and under the general supervision of the Portfolio's Trustees.
(f) Security has been deemed illiquid at September 30, 2010.
(g) Perpetual — Security does not have a predetermined maturity date. Rate for this security is fixed for a period of time then reverts to a floating rate. The interest shown is the rate in effect at September 30, 2010.
(h) Rate shown is the yield to maturity at September 30, 2010.
(i) All or a portion of the security was pledged to cover margin requirements for futures contracts.
(j) All or a portion of the security was pledged as collateral for swap agreements.
@ Face Amount/Value is less than $500.
IO Interest Only
REMIC Real Estate Mortgage Investment Conduit
STRIPS Separate Trading of Registered Interest and Principal of Securities
TBA To Be Announced
Futures Contracts
The Portfolio had the following futures contract(s) open at period end:
| | | Number
of
Contracts | | Value
(000) | | Expiration
Date | | Net Unrealized
Appreciation
(Depreciation)
(000) | |
| Long: | |
U.S. Treasury
2 yr. Note | | | 8 | | | $ | 1,756 | | | Dec-10 | | $ | — | @ | |
U.S. Treasury
5 yr. Note | | | 61 | | | | 7,373 | | | Dec-10 | | | 56 | | |
| Short: | |
U.S. Treasury
10 yr. Note | | | (54 | ) | | | (6,807 | ) | | Dec-10 | | | (33 | ) | |
U.S. Treasury
30 yr. Bond | | | (31 | ) | | | (4,145 | ) | | Dec-10 | | | 2 | | |
| | | | | | | | | | | | | $ | 25 | | |
The accompanying notes are an integral part of the financial statements.
33
2010 Annual Report
September 30, 2010
Portfolio of Investments (cont'd)
Core Fixed Income Portfolio
Credit Default Swap Agreements
The Portfolio had the following credit default swap agreement(s) open at period end:
| Swap Counterparty and Reference Obligation | | Buy/Sell
Protection | | Notional
Amount
(000) | | Pay/Receive
Fixed Rate | | Termination
Date | | Upfront
Payment
Paid
(000) | | Unrealized
Appreciation
(Depreciation)
(000) | | Credit
Rating of
Reference
Obligation† | |
Bank of America
Tyco Electronics Ltd., 6.00%, 10/1/12 | | Buy | | $ | 395 | | | | 5.00 | % | | | 6/20/14 | | | $ | 12 | | | $ | (49 | ) | | BBB | |
† Credit Rating as issued by Standard and Poor's.
Interest Rate Swap Agreements
The Portfolio had the following interest rate swap agreement(s) open at period end:
| Swap Counterparty | | Floating Rate
Index | | Pay/Receive
Floating Rate | | Fixed Rate | | Termination
Date | | Notional
Amount
(000) | | Unrealized
Appreciation
(Depreciation)
(000) | |
| Credit Suisse | | | 3 Month LIBOR | | | Receive | | | 2.63 | % | | | 3/11/15 | | | $ | 5,908 | | | $ | (339 | ) | |
Zero Coupon Swap Agreements
The Portfolio had the following zero coupon swap agreement(s) open at period end:
| Swap Counterparty | | Notional
Amount
(000) | | Floating
Rate Index | | Pay/Receive
Floating Rate | | Termination
Date | | Net Unrealized
Appreciation
(Depreciation)
(000) | |
| Barclays Capital | | $ | 2,380 | | | 3 Month LIBOR | | Receive | | 11/15/19 | | $ | (298 | ) | |
| Barclays Capital | | | 2,380 | | | 3 Month LIBOR | | Pay | | 11/15/19 | | | 93 | | |
| JPMorgan Chase | | | 5,350 | | | 3 Month LIBOR | | Receive | | 11/15/21 | | | (657 | ) | |
| | | | | | | | | | | | | $ | (862 | ) | |
LIBOR London Interbank Offered Rate
Fair Value Measurement Information:
The following is a summary of the inputs used to value the Portfolio's net assets as of September 30, 2010. (See Note A-7 to the financial statements for further information regarding fair value measurement.)
| Investment Type | | Level 1
Quoted
prices
(000) | | Level 2
Other
significant
observable
inputs
(000) | | Level 3
Significant
unobservable
inputs
(000) | | Total
(000) | |
| Assets: | |
| Fixed Income Securities | |
Agency
Adjustable Rate
Mortgages | | $ | — | | | $ | 1,419 | | | $ | — | | | $ | 1,419 | | |
Agency Bond —
Banking (FDIC
Guaranteed) | | | — | | | | 2,213 | | | | — | | | | 2,213 | | |
Agency Fixed Rate
Mortgages | | | — | | | | 22,023 | | | | — | | | | 22,023 | | |
Fair Value Measurement Information: (cont'd)
| Investment Type | | Level 1
Quoted
prices
(000) | | Level 2
Other
significant
observable
inputs
(000) | | Level 3
Significant
unobservable
inputs
(000) | | Total
(000) | |
| Fixed Income Securities (cont'd) | |
Asset-Backed
Securities | | $ | — | | | $ | 950 | | | $ | — | | | $ | 950 | | |
Collateralized Mortgage
Obligations —
Agency Collateral
Series | | | — | | | | 538 | | | | — | | | | 538 | | |
Commercial Mortgage
Backed Securities | | | — | | | | 2,280 | | | | — | | | | 2,280 | | |
| Corporate Bonds | | | — | | | | 24,995 | | | | — | | | | 24,995 | | |
| Mortgage — Other | | | — | | | | — | | | | — | @ | | | — | @ | |
| Municipal Bonds | | | — | | | | 917 | | | | — | | | | 917 | | |
| Sovereign | | | — | | | | 574 | | | | — | | | | 574 | | |
U.S. Agency
Securities | | | — | | | | 1,541 | | | | — | | | | 1,541 | | |
The accompanying notes are an integral part of the financial statements.
34
2010 Annual Report
September 30, 2010
Portfolio of Investments (cont'd)
Core Fixed Income Portfolio
Fair Value Measurement Information: (cont'd)
| Investment Type | | Level 1
Quoted
prices
(000) | | Level 2
Other
significant
observable
inputs
(000) | | Level 3
Significant
unobservable
inputs
(000) | | Total
(000) | |
| Fixed Income Securities (cont'd) | |
U.S. Treasury
Securities | | $ | — | | | $ | 17,486 | | | $ | — | | | $ | 17,486 | | |
Total Fixed Income
Securities | | | — | | | | 74,936 | | | | — | @ | | | 74,936 | | |
Short-Term
Investments | |
Investment
Company | | | 13,668 | | | | — | | | | — | | | | 13,668 | | |
Repurchase
Agreements | | | — | | | | 1,727 | | | | — | | | | 1,727 | | |
U.S. Treasury
Securities | | | — | | | | 8,579 | | | | — | | | | 8,579 | | |
Total Short-Term
Investments | | | 13,668 | | | | 10,306 | | | | — | | | | 23,974 | | |
| Futures Contracts | | | 58 | | | | — | | | | — | | | | 58 | | |
Zero Coupon Swap
Agreements | | | — | | | | 93 | | | | — | | | | 93 | | |
| Total Assets | | | 13,726 | | | | 85,335 | | | | — | @ | | | 99,061 | | |
| Liabilities: | |
| Futures Contracts | | | 33 | | | | — | | | | — | | | | 33 | | |
Credit Default Swap
Agreement | | | — | | | | 49 | | | | — | | | | 49 | | |
Interest Rate Swap
Agreement | | | — | | | | 339 | | | | — | | | | 339 | | |
Zero Coupon Swap
Agreements | | | — | | | | 955 | | | | — | | | | 955 | | |
| Total Liabilities | | | 33 | | | | 1,343 | | | | — | | | | 1,376 | | |
| Total | | $ | 13,693 | | | $ | 83,992 | | | $ | — | @ | | $ | 97,685 | | |
Fair Value Measurement Information: (cont'd)
The following is a reconciliation of investments in which significant unobservable inputs (Level 3) were used in determining fair value:
| | | Fixed Income
Securities
(000) | |
| Balance as of 9/30/09 | | $ | — | @ | |
| Accrued discounts/premiums | | | — | | |
| Realized gain (loss) | | | 1 | | |
| Change in unrealized appreciation (depreciation) | | | — | @ | |
| Net purchases (sales) | | | (1 | ) | |
| Transfers in for Level 3 | | | — | | |
| Transfers out of Level 3 | | | — | | |
| Balance as of 9/30/10 | | $ | — | @ | |
The amount of total gains (losses) for the period
included in earnings attributable to the change
in unrealized gains (losses) relating to assets
and liabilities still held at Level 3 at 9/30/10. | | $ | — | @ | |
@ Value is less than $500
The accompanying notes are an integral part of the financial statements.
35
2010 Annual Report
September 30, 2010
Investment Overview (unaudited)
Core Plus Fixed Income Portfolio
Performance
For the fiscal year ended September 30, 2010, the Portfolio's Class I had a total return based on net asset value and reinvestment of distributions per share of 10.02%, net of fees. The Portfolio's Class I outperformed against its benchmark the Barclays Capital U.S. Aggregate Index (the "Index") which returned 8.16%.
Factors Affecting Performance
• During much of the 12-month period, global sentiment was fragile and financial markets were volatile. Government bonds in most developed countries continued to be regarded as "safe haven" assets relative to sectors with greater credit risk. However, the debt of governments on the periphery of Europe continued to underperform those in other developed markets as investors fretted about their fiscal problems. Outside of these trouble spots, declining government bond yields in the rest of Europe and North America appeared to indicate a general reduction in investors' expectations for economic growth and inflation in those markets, while policy makers in emerging markets continued to adjust monetary policy to recognize economic strength.
• Amidst continued weakness in economic indicators, the Federal Open Market Committee (the "Fed") kept the federal funds target rate in the range of zero to 0.25%. The labor market continued to languish, with the unemployment rate at its highest level in many years, albeit declining in recent months. On the housing front, data remained dim, with some pockets of improvement.
• Investment-grade corporate debt posted positive returns during the period (as measured by the Barclays Capital U.S. Corporate Index), and among sectors, financials outpaced industrials and utilities. In mid-2010, the U.S. credit market was negatively affected by the European sovereign debt crisis. However, the outlook for the investment grade corporate debt sector remains favorable in our view — especially in industrials with strong balance sheets, sufficient liquidity, improving revenue growth and free cash flow.
• The agency mortgage-backed security (MBS) sector performed well during the period. The Fed's support of the agency MBS market ended in March; as expected, the Fed absorbed most of the supply of new MBS during the program's life, though the market remained stable after the withdrawal of the Fed's support. The MBS market also benefited from a lack of refinancing activity. Despite lower rates, refinancing applications did not pick up significantly during the period as tighter credit underwriting standards and lower home values stood in the way for most homeowners.
• The U.S. Treasury yield curve flattened during the period, with yields on 2-, 5-, 10-, and 30-year Treasuries declining by 44, 94, 71, and 31 basis points, respectively.
• The Portfolio's mortgage strategy bolstered performance. Earlier in the period, the Portfolio gained from our focus on bonds with coupons in the 4% to 5.5% range, which benefited strongly from the Fed's MBS purchase program. A move to higher coupon issues (those with coupons of 5.5% and above) was also favorable as prepayments remained low due to homeowner credit impairment, erosion of home equity, and tighter credit standards. Our decision to favor 30-year MBS over the 15-year sector was beneficial as longer-maturity issues outperformed during the period.
• The Portfolio's allocation to investment-grade credit was the main driver of performance. Within the corporate sector, overweights in the banking, food and beverage, insurance, and media sectors were additive to relative returns as significant spread tightening in these sectors led to their strong performance.
• Positions in high yield securities as well as a tactical allocation to non-agency mortgage securities, benefited performance. These sectors are not represented in the Index.
• Additionally, interest-rate positions contributed to performance. Throughout the period, we employed tactical strategies involving interest rate swaps that were designed to take advantage of anomalies across the swap curve. Similar to the Treasury curve, the swap curve shows the relationship of various maturities of swaps and their yields.
• An overweight to Build America Bonds detracted slightly from relative performance as the sector underperformed other taxable sectors.
36
2010 Annual Report
September 30, 2010
Investment Overview (unaudited) (cont'd)
Core Plus Fixed Income Portfolio
Management Strategies
• The Portfolio began the period with an overweight to the MBS sector, and a focus within the sector on bonds with coupons in the 4% to 5.5% range, given our expectations for this portion of the MBS market to outperform as a result of the Fed's MBS purchase program. As MBS prices rose and the Fed's MBS purchase program came to an end, we took profits and moved from an overweight in mortgage spread duration (a measure of risk exposure to a non-Treasury sector) to a neutral weighting. We also shifted the Portfolio's focus to higher-coupon issues.
• Throughout the period, the Portfolio was positioned with an overweight to investment-grade credit. We have a favorable view of the corporate debt sector and therefore we continue to maintain an overweight to this sector.
• With regard to interest rate strategy, the Portfolio was positioned to benefit from an anticipated flattening (or, reduction in the difference of yield spreads) between the two- and five-year segments of the yield curve. Once this flattening occurred in the third quarter of 2010, we took profits and unwound the position.
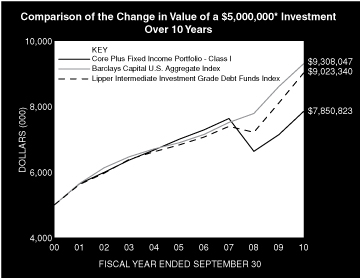
* Minimum Investment
In accordance with SEC regulations, the Portfolio's performance shown assumes that all recurring fees (including management fees) were deducted and all dividends and distributions were reinvested. The performance of Investment Class and Class P shares will vary from the Class I shares based upon their different inception dates and will be negatively impacted by additional fees assessed to those classes.
Performance Compared to the Barclays Capital U.S. Aggregate Index(1) and the Lipper Intermediate Investment Grade Debt Funds Index(2)
| | | Total Returns(3) | |
| | | | | Average Annual | |
| | | One
Year | | Five
Years | | Ten
Years | | Since
Inception(7) | |
Portfolio — Class I
w/o sales charges(4) | | | 10.02 | % | | | 2.33 | % | | | 4.62 | % | | | 7.78 | % | |
Barclays Capital U.S.
Aggregate Index | | | 8.16 | | | | 6.20 | | | | 6.41 | | | | 8.19 | | |
Lipper Intermediate Investment
Grade Debt Funds Index | | | 11.33 | | | | 5.75 | | | | 6.08 | | | | N/A | | |
Portfolio — Investment Class
w/o sales charges(5) | | | 9.86 | | | | 2.19 | | | | 4.46 | | | | 4.96 | | |
Barclays Capital U.S.
Aggregate Index | | | 8.16 | | | | 6.20 | | | | 6.41 | | | | 6.49 | | |
Lipper Intermediate Investment
Grade Debt Funds Index | | | 11.33 | | | | 5.75 | | | | 6.08 | | | | 6.06 | | |
Portfolio — Class P
w/o sales charges(6) | | | 9.73 | | | | 2.09 | | | | 4.35 | | | | 4.72 | | |
Barclays Capital U.S.
Aggregate Index | | | 8.16 | | | | 6.20 | | | | 6.41 | | | | 6.38 | | |
Lipper Intermediate Investment
Grade Debt Funds Index | | | 11.33 | | | | 5.75 | | | | 6.08 | | | | 5.96 | | |
Performance data quoted represents past performance, which is no guarantee of future results, and current performance may be lower or higher than the figures shown. Performance assumes that all dividends and distributions, if any, were reinvested. For the most recent month-end performance figures, please visit www.morganstanley.com/im. Investment returns and principal value will fluctuate so that Portfolio shares, when redeemed, may be worth more or less than their original cost. Total returns do not reflect the deduction of taxes that a shareholder would pay on Portfolio distributions or the redemption of Portfolio shares. Performance of share classes will vary due to differences in sales charges and expenses.
(1) The Barclays Capital U.S. Aggregate Index tracks the performance of all U.S. government agency and Treasury securities, investment-grade corporate debt securities, agency mortgage-backed securities, asset-backed securities and commercial mortgage-backed securities. The Index is unmanaged and its returns do not include any sales charges or fees. Such costs would lower performance. It is not possible to invest directly in an index.
(2) The Lipper Intermediate Investment Grade Debt Funds Index is an equally weighted performance index of the largest qualifying funds (based on net assets) in the Lipper Intermediate Investment Grade Debt Funds classification. The Index, which is adjusted for capital gains distributions and income dividends, is unmanaged and should not be considered an investment. There are currently 30 funds represented in this Index. As of the date of this report, the Portfolio was in the Lipper Intermediate Investment Grade Debt Funds classification.
(3) Total returns for the Portfolio reflect expenses waived and/or reimbursed, if applicable, by the Adviser. Without such waivers and/or reimbursements, total returns would have been lower. Fee waivers and/or reimbursements are voluntary and the Adviser reserves the right to commence or terminate any waiver and/or reimbursement at any time.
(4) Commenced operations on November 14, 1984.
(5) Commenced operations on October 15, 1996.
(6) Commenced operations on November 7, 1996.
(7) For comparative purposes, average annual since inception returns listed for the Indexes refer to the inception date or initial offering of the respective share class of the Portfolio, not the inception of the Indexes.
37
2010 Annual Report
September 30, 2010
Investment Overview (unaudited) (cont'd)
Core Plus Fixed Income Portfolio
Portfolio Composition*
| Classification | | Percentage of
Total Investments | |
| Agency Fixed Rate Mortgages | | | 27.2 | % | |
| Other** | | | 21.9 | | |
| Finance | | | 16.6 | | |
| Industrials | | | 15.4 | | |
| U.S. Treasury Securities | | | 10.2 | | |
| Short-Term Investments | | | 8.7 | | |
| Total Investments | | | 100.0 | % | |
* Percentages indicated are based upon total investments (excluding Securities held as collateral on Loaned Securities) as of September 30, 2010.
** Industries and/or investment types representing less than 5% of total investments.
38
2010 Annual Report
September 30, 2010
Portfolio of Investments
Core Plus Fixed Income Portfolio
| | | Face
Amount
(000) | | Value
(000) | |
| Fixed Income Securities (99.8%) | |
| Agency Adjustable Rate Mortgages (1.9%) | |
| Federal Home Loan Mortgage Corp., | |
| Conventional Pools: | |
| 5.52%, 5/1/37 | | $ | 2,347 | | | $ | 2,503 | | |
| 6.04%, 2/1/37 | | | 616 | | | | 653 | | |
| Federal National Mortgage Association, | |
| Conventional Pools: | |
| 2.61%, 5/1/35 | | | 2,376 | | | | 2,488 | | |
| 5.74%, 3/1/38 | | | 744 | | | | 790 | | |
| Government National Mortgage Association, | |
| Various Pools: | |
| 3.13%, 10/20/25 - 11/20/25 | | | 48 | | | | 49 | | |
| 3.38%, 1/20/25 - 2/20/28 | | | 3,427 | | | | 3,540 | | |
| 3.63%, 7/20/25 - 9/20/27 | | | 325 | | | | 337 | | |
| | | | 10,360 | | |
| Agency Bond — Banking (FDIC Guaranteed) (2.8%) | |
| Ally Financial, Inc. | |
| 2.20%, 12/19/12 (a) | | | 14,401 | | | | 14,895 | | |
| Agency Fixed Rate Mortgages (29.8%) | |
| Federal Home Loan Mortgage Corp., | |
| Conventional Pools: | |
| 11.25%, 10/1/11 | | | 2 | | | | 2 | | |
| 11.75%, 4/1/19 | | | 1 | | | | 1 | | |
| 12.00%, 2/1/15 | | | 1 | | | | 1 | | |
| 13.00%, 6/1/19 | | | 1 | | | | 1 | | |
| Gold Pools: | |
| 5.00%, 10/1/35 | | | 557 | | | | 589 | | |
| 5.50%, 12/1/36 - 5/1/37 | | | 16,948 | | | | 18,005 | | |
| 6.00%, 2/1/32 - 8/1/38 | | | 5,515 | | | | 5,919 | | |
| 6.50%, 3/1/16 - 8/1/33 | | | 618 | | | | 684 | | |
| 7.00%, 6/1/28 - 11/1/31 | | | 174 | | | | 197 | | |
| 7.50%, 5/1/16 - 5/1/35 | | | 605 | | | | 686 | | |
| 8.00%, 8/1/32 | | | 271 | | | | 313 | | |
| 8.50%, 8/1/31 | | | 346 | | | | 407 | | |
| October TBA: | |
| 4.50%, 10/25/40 (b) | | | 6,725 | | | | 6,995 | | |
| Federal National Mortgage Association, | |
| Conventional Pools: | |
| 4.50%, 7/1/40 | | | 5,140 | | | | 5,361 | | |
| 5.00%, 5/1/36 - 4/1/39 | | | 20,785 | | | | 22,080 | | |
| 5.50%, 6/1/35 - 2/1/38 | | | 13,130 | | | | 14,035 | | |
| 6.00%, 10/1/31 - 12/1/38 | | | 14,051 | | | | 15,154 | | |
| 6.50%, 11/1/23 - 10/1/38 | | | 12,828 | | | | 14,214 | | |
| 7.00%, 11/1/13 - 1/1/34 | | | 1,102 | | | | 1,245 | | |
| 7.50%, 8/1/37 | | | 874 | | | | 998 | | |
| 8.00%, 2/1/12 - 4/1/33 | | | 683 | | | | 792 | | |
| 8.50%, 1/1/15 - 10/1/32 | | | 625 | | | | 727 | | |
| 9.50%, 4/1/30 | | | 1,028 | | | | 1,206 | | |
| 11.25%, 8/1/13 | | | 2 | | | | 2 | | |
| 12.00%, 11/1/15 | | | 36 | | | | 43 | | |
| 12.50%, 9/1/15 | | | 8 | | | | 9 | | |
| November TBA: | |
| 4.50%, 11/25/40 (b) | | | 9,875 | | | | 10,264 | | |
| | | Face
Amount
(000) | | Value
(000) | |
| October TBA: | |
| 4.00%, 10/25/25 (b) | | $ | 2,600 | | | $ | 2,715 | | |
| Government National Mortgage Association, | |
| November TBA: | |
| 4.00%, 11/25/40 (b) | | | 19,145 | | | | 19,737 | | |
| 4.50%, 11/25/40 (b) | | | 3,575 | | | | 3,754 | | |
| 5.50%, 11/25/40 (b) | | | 1,275 | | | | 1,369 | | |
| Various Pools: | |
| 4.50%, 5/15/40 - 6/15/40 | | | 9,232 | | | | 9,733 | | |
| 5.79%, 9/20/40 | | | 10,400 | | | | 1,592 | | |
| | | | 158,830 | | |
| Asset-Backed Securities (2.0%) | |
| Ally Master Owner Trust, | |
| 2.88%, 4/15/15 (c) | | | 1,496 | | | | 1,545 | | |
| 3.47%, 4/15/15 (c) | | | 578 | | | | 591 | | |
| ARI Fleet Lease Trust | |
| 1.71%, 8/15/18 (c)(d) | | | 767 | | | | 767 | | |
| Brazos Student Finance Corp. | |
| 1.19%, 6/25/35 (d) | | | 474 | | | | 474 | | |
| Chesapeake Funding LLC | |
| 2.26%, 12/15/20 (c)(d) | | | 995 | | | | 1,004 | | |
| Contimortgage Home Equity Trust | |
| 8.10%, 8/15/25 | | | 46 | | | | 43 | | |
| Ford Credit Floorplan Master Owner Trust | |
| 1.96%, 2/15/17 (c)(d) | | | 2,237 | | | | 2,329 | | |
| GE Dealer Floorplan Master Note Trust | |
| 1.81%, 10/20/14 (c)(d) | | | 1,319 | | | | 1,342 | | |
| Mid-State Trust | |
| 8.33%, 4/1/30 | | | 45 | | | | 46 | | |
| Missouri Higher Education Loan Authority | |
| 1.17%, 8/27/29 (d) | | | 824 | | | | 824 | | |
| Westlake Automobile Receivables Trust | |
| 5.00%, 5/15/15 (c) | | | 1,950 | | | | 1,962 | | |
| | | | 10,927 | | |
| Collateralized Mortgage Obligations — Agency Collateral Series (1.0%) | |
| Federal Home Loan Mortgage Corp., | |
| IO STRIPS | |
| 7.49%, 5/15/36 (d) | | | 9,006 | | | | 1,449 | | |
| 7.50%, 12/1/29 | | | 121 | | | | 32 | | |
| 8.00%, 1/1/28 - 6/1/31 | | | 945 | | | | 229 | | |
| PAC REMIC | |
| 9.50%, 4/15/20 | | | 2 | | | | 2 | | |
| 10.00%, 6/15/20 | | | 2 | | | | 2 | | |
| Federal National Mortgage Association, | |
| Inv Fl REMIC | |
| 62.82%, 9/25/20 (d) | | | 16 | | | | 36 | | |
| IO PAC REMIC | |
| 8.00%, 9/18/27 | | | 524 | | | | 123 | | |
| IO REMIC | |
| 5.00%, 8/25/37 | | | 4,967 | | | | 461 | | |
| 6.00%, 7/25/33 | | | 1,240 | | | | 230 | | |
| 6.44%, 2/25/24 (d) | | | 5,232 | | | | 585 | | |
| IO STRIPS | |
| 6.50%, 9/1/29 - 12/1/29 | | | 2,365 | | | | 447 | | |
The accompanying notes are an integral part of the financial statements.
39
2010 Annual Report
September 30, 2010
Portfolio of Investments (cont'd)
Core Plus Fixed Income Portfolio
| | | Face
Amount
(000) | | Value
(000) | |
| Collateralized Mortgage Obligations — Agency Collateral Series (cont'd) | |
| 8.00%, 4/1/24 - 6/1/30 | | $ | 1,771 | | | $ | 420 | | |
| 8.50%, 10/1/25 | | | 171 | | | | 35 | | |
| 9.00%, 11/1/26 | | | 158 | | | | 44 | | |
| REMIC | |
| 7.00%, 9/25/32 | | | 1,173 | | | | 1,365 | | |
| | | | 5,460 | | |
| Commercial Mortgage Backed Securities (3.5%) | |
| Banc of America Commercial Mortgage, Inc. | |
| 5.93%, 2/10/51 (d) | | | 2,842 | | | | 3,062 | | |
| Bear Stearns Commercial Mortgage Securities | |
| 5.47%, 1/12/45 (d) | | | 1,526 | | | | 1,673 | | |
| Citigroup Commercial Mortgage Trust, (Note G) | |
| 5.43%, 10/15/49 | | | 1,028 | | | | 1,113 | | |
| 5.89%, 12/10/49 (d) | | | 1,895 | | | | 2,033 | | |
| 5.92%, 3/15/49 (d) | | | 1,344 | | | | 1,489 | | |
| Commercial Mortgage Pass-Through Certificates | |
| 6.01%, 12/10/49 (d) | | | 2,045 | | | | 2,230 | | |
| Greenwich Capital Commercial Funding Corp. | |
| 5.44%, 3/10/39 | | | 1,618 | | | | 1,708 | | |
| GS Mortgage Securities Corp. II | |
| 5.55%, 4/10/38 (d) | | | 1,381 | | | | 1,489 | | |
| LB-UBS Commercial Mortgage Trust, | |
| 5.16%, 2/15/31 | | | 2,099 | | | | 2,286 | | |
| 5.37%, 9/15/39 | | | 1,363 | | | | 1,485 | | |
| | | | 18,568 | | |
| Corporate Bonds (38.9%) | |
| Finance (18.2%) | |
| Abbey National Treasury Services PLC | |
| 3.88%, 11/10/14 (c) | | | 869 | | | | 890 | | |
| Aegon N.V. | |
| 4.63%, 12/1/15 | | | 830 | | | | 883 | | |
| Aflac, Inc. | |
| 3.45%, 8/15/15 | | | 645 | | | | 670 | | |
| AIG SunAmerica Global Financing VI | |
| 6.30%, 5/10/11 (c) | | | 1,919 | | | | 1,967 | | |
| American Express Co. | |
| 8.13%, 5/20/19 | | | 488 | | | | 631 | | |
| American Express Credit Corp. | |
| 7.30%, 8/20/13 | | | 1,072 | | | | 1,233 | | |
| Bank of America Corp., | |
| 5.63%, 7/1/20 | | | 790 | | | | 836 | | |
| 5.75%, 12/1/17 | | | 2,090 | | | | 2,238 | | |
| Barclays Bank PLC | |
| 6.75%, 5/22/19 | | | 1,544 | | | | 1,838 | | |
| Bear Stearns Cos. LLC (The), | |
| 5.55%, 1/22/17 | | | 715 | | | | 781 | | |
| 7.25%, 2/1/18 | | | 1,375 | | | | 1,677 | | |
| BioMed Realty LP | |
| 6.13%, 4/15/20 (c) | | | 555 | | | | 605 | | |
| Boston Properties LP | |
| 5.88%, 10/15/19 | | | 500 | | | | 560 | | |
| | | Face
Amount
(000) | | Value
(000) | |
| Brookfield Asset Management, Inc. | |
| 5.80%, 4/25/17 | | $ | 1,086 | | | $ | 1,144 | | |
| Capital One Bank, (USA) NA | |
| 8.80%, 7/15/19 | | | 1,110 | | | | 1,421 | | |
| Catlin Insurance Co., Ltd. | |
| 7.25%, (c)(d)(e) | | | 1,045 | | | | 857 | | |
| Citigroup, Inc., (Note G) | |
| 5.88%, 5/29/37 | | | 1,089 | | | | 1,087 | | |
| 8.50%, 5/22/19 | | | 2,639 | | | | 3,268 | | |
| Credit Agricole SA | |
| 3.50%, 4/13/15 (c) | | | 1,945 | | | | 2,008 | | |
| Credit Suisse AG | |
| 5.40%, 1/14/20 | | | 2,265 | | | | 2,421 | | |
| Credit Suisse, New York | |
| 6.00%, 2/15/18 | | | 369 | | | | 408 | | |
| Digital Reality Trust LP | |
| 4.50%, 7/15/15 (c) | | | 1,535 | | | | 1,586 | | |
| Discover Bank/Greenwood | |
| 7.00%, 4/15/20 | | | 1,620 | | | | 1,765 | | |
| Duke Realty LP | |
| 6.75%, 3/15/20 (a) | | | 1,050 | | | | 1,175 | | |
| Farmers Insurance Exchange | |
| 8.63%, 5/1/24 (c) | | | 1,695 | | | | 1,968 | | |
| General Electric Capital Corp. | |
| 6.00%, 8/7/19 | | | 5,009 | | | | 5,646 | | |
| Goldman Sachs Group, Inc. (The), | |
| 6.15%, 4/1/18 (a) | | | 3,685 | | | | 4,094 | | |
| 7.50%, 2/15/19 | | | 295 | | | | 352 | | |
| Hartford Financial Services Group, Inc. | |
| 5.50%, 3/30/20 | | | 1,155 | | | | 1,177 | | |
| HBOS PLC | |
| 6.75%, 5/21/18 (c) | | | 1,758 | | | | 1,769 | | |
| Health Care REIT, Inc. | |
| 6.13%, 4/15/20 | | | 830 | | | | 890 | | |
| HSBC Bank PLC | |
| 3.50%, 6/28/15 (c) | | | 1,520 | | | | 1,596 | | |
| HSBC Bank USA NA | |
| 4.88%, 8/24/20 | | | 745 | | | | 779 | | |
| ING Bank | |
| 3.00%, 9/1/15 (a)(c) | | | 820 | | | | 820 | | |
| Intesa Sanpaolo SpA | |
| 3.63%, 8/12/15 (c) | | | 1,055 | | | | 1,069 | | |
| JPMorgan Chase & Co., | |
| 3.40%, 6/24/15 | | | 570 | | | | 592 | | |
| 4.95%, 3/25/20 | | | 560 | | | | 598 | | |
| KeyCorp | |
| 6.50%, 5/14/13 (a) | | | 1,315 | | | | 1,442 | | |
| Lloyds TSB Bank PLC | |
| 5.80%, 1/13/20 (c) | | | 575 | | | | 603 | | |
| Macquarie Group Ltd. | |
| 6.00%, 1/14/20 (a)(c) | | | 1,665 | | | | 1,744 | | |
| Merrill Lynch & Co., Inc. | |
| 6.88%, 4/25/18 | | | 1,818 | | | | 2,042 | | |
The accompanying notes are an integral part of the financial statements.
40
2010 Annual Report
September 30, 2010
Portfolio of Investments (cont'd)
Core Plus Fixed Income Portfolio
| | | Face
Amount
(000) | | Value
(000) | |
| Finance (cont'd) | |
| MetLife, Inc. | |
| 7.72%, 2/15/19 | | $ | 1,050 | | | $ | 1,339 | | |
| NASDAQ OMX Group, Inc. (The) | |
| 5.55%, 1/15/20 | | | 1,110 | | | | 1,182 | | |
| Nationwide Building Society | |
| 6.25%, 2/25/20 (c) | | | 2,265 | | | | 2,498 | | |
| Pacific LifeCorp | |
| 6.00%, 2/10/20 (c) | | | 845 | | | | 913 | | |
| Platinum Underwriters Finance, Inc. | |
| 7.50%, 6/1/17 | | | 791 | | | | 875 | | |
| PNC Funding Corp. | |
| 6.70%, 6/10/19 | | | 805 | | | | 954 | | |
| Principal Financial Group, Inc. | |
| 8.88%, 5/15/19 (a) | | | 658 | | | | 867 | | |
| Prudential Financial, Inc., | |
| 4.75%, 9/17/15 (a) | | | 781 | | | | 846 | | |
| 7.38%, 6/15/19 | | | 950 | | | | 1,159 | | |
| Regions Financial Corp. | |
| 5.75%, 6/15/15 (a) | | | 1,390 | | | | 1,415 | | |
| Reinsurance Group of America, Inc. | |
| 6.45%, 11/15/19 | | | 824 | | | | 915 | | |
| Royal Bank of Scotland PLC (The) | |
| 4.88%, 3/16/15 | | | 1,955 | | | | 2,059 | | |
| Santander US Debt SA Unipersonal | |
| 3.72%, 1/20/15 (c) | | | 1,200 | | | | 1,219 | | |
| SLM Corp. | |
| 5.00%, 10/1/13 | | | 855 | | | | 838 | | |
| Societe Generale | |
| 3.10%, 9/14/15 (a)(c) | | | 815 | | | | 821 | | |
| Standard Chartered Bank | |
| 6.40%, 9/26/17 (c) | | | 790 | | | | 884 | | |
| Standard Chartered PLC | |
| 3.85%, 4/27/15 (c) | | | 820 | | | | 856 | | |
| Svenska Handelsbanken AB | |
| 5.13%, 3/30/20 (c) | | | 1,125 | | | | 1,232 | | |
| UBS AG, | |
| 4.88%, 8/4/20 (a) | | | 250 | | | | 264 | | |
| 5.88%, 12/20/17 | | | 650 | | | | 737 | | |
| UBS AG/Stamford CT | |
| 3.88%, 1/15/15 (a) | | | 595 | | | | 622 | | |
| UnitedHealth Group, Inc. | |
| 6.63%, 11/15/37 | | | 1,345 | | | | 1,573 | | |
US Central Federal Credit Union (U.S.
Government Guaranteed) | |
| 1.90%, 10/19/12 (a) | | | 5,828 | | | | 5,981 | | |
| Vornado Realty LP | |
| 4.25%, 4/1/15 | | | 840 | | | | 870 | | |
WEA Finance LLC/WT Finance Australia
Property Ltd. | |
| 6.75%, 9/2/19 (c) | | | 1,126 | | | | 1,336 | | |
| WellPoint, Inc. | |
| 6.38%, 6/15/37 | | | 1,985 | | | | 2,222 | | |
| | | Face
Amount
(000) | | Value
(000) | |
| Wells Fargo & Co. | |
| 5.63%, 12/11/17 | | $ | 2,093 | | | $ | 2,388 | | |
| Westpac Banking Corp. | |
| 3.00%, 8/4/15 | | | 1,085 | | | | 1,109 | | |
| | | | 97,104 | | |
| Industrials (16.8%) | |
| Agilent Technologies, Inc. | |
| 5.50%, 9/14/15 | | | 329 | | | | 370 | | |
| Altria Group, Inc., | |
| 4.13%, 9/11/15 | | | 525 | | | | 564 | | |
| 9.25%, 8/6/19 | | | 687 | | | | 922 | | |
| Anadarko Petroleum Corp. | |
| 6.95%, 6/15/19 (a) | | | 595 | | | | 665 | | |
| Anglo American Capital PLC | |
| 9.38%, 4/8/19 (c) | | | 1,100 | | | | 1,486 | | |
| Anheuser-Busch InBev Worldwide, Inc., | |
| 5.38%, 11/15/14 (c) | | | 175 | | | | 197 | | |
| 7.20%, 1/15/14 (c) | | | 1,046 | | | | 1,220 | | |
| ArcelorMittal | |
| 9.85%, 6/1/19 (a) | | | 666 | | | | 857 | | |
| AT&T Corp. | |
| 8.00%, 11/15/31 | | | 33 | | | | 44 | | |
| AT&T, Inc., | |
| 5.35%, 9/1/40 (c) | | | 1,069 | | | | 1,078 | | |
| 6.15%, 9/15/34 | | | 1,365 | | | | 1,499 | | |
| AutoNation, Inc. | |
| 6.75%, 4/15/18 (a) | | | 480 | | | | 494 | | |
| BAT International Finance PLC | |
| 9.50%, 11/15/18 (c) | | | 930 | | | | 1,266 | | |
| Bombardier, Inc., | |
| 7.50%, 3/15/18 (c) | | | 290 | | | | 313 | | |
| 7.75%, 3/15/20 (c) | | | 575 | | | | 624 | | |
| Boston Scientific Corp. | |
| 6.00%, 1/15/20 (a) | | | 1,685 | | | | 1,800 | | |
| Bunge Ltd. Finance Corp. | |
| 8.50%, 6/15/19 (a) | | | 566 | | | | 685 | | |
| CBS Corp. | |
| 8.88%, 5/15/19 (a) | | | 500 | | | | 653 | | |
| CenturyTel, Inc. | |
| 6.15%, 9/15/19 | | | 325 | | | | 333 | | |
| Comcast Corp., | |
| 5.15%, 3/1/20 (a) | | | 555 | | | | 608 | | |
| 5.70%, 5/15/18 | | | 623 | | | | 714 | | |
| ConAgra Foods, Inc., | |
| 7.00%, 10/1/28 | | | 150 | | | | 181 | | |
| 8.25%, 9/15/30 | | | 945 | | | | 1,279 | | |
| Constellation Brands, Inc. | |
| 7.25%, 9/1/16 (a) | | | 370 | | | | 396 | | |
| Cooper US, Inc. | |
| 5.25%, 11/15/12 | | | 846 | | | | 919 | | |
| Corning, Inc. | |
| 7.25%, 8/15/36 | | | 345 | | | | 416 | | |
The accompanying notes are an integral part of the financial statements.
41
2010 Annual Report
September 30, 2010
Portfolio of Investments (cont'd)
Core Plus Fixed Income Portfolio
| | | Face
Amount
(000) | | Value
(000) | |
| Industrials (cont'd) | |
| COX Communications, Inc. | |
| 8.38%, 3/1/39 (c) | | $ | 164 | | | $ | 221 | | |
| CRH America, Inc. | |
| 6.00%, 9/30/16 | | | 1,155 | | | | 1,295 | | |
| CSC Holdings LLC | |
| 7.63%, 7/15/18 (a) | | | 855 | | | | 926 | | |
| CVS Pass-Through Trust | |
| 6.04%, 12/10/28 | | | 1,958 | | | | 2,077 | | |
| Daimler Finance North America LLC, | |
| 7.30%, 1/15/12 | | | 622 | | | | 669 | | |
| 8.50%, 1/18/31 (a) | | | 224 | | | | 309 | | |
| Darden Restaurants, Inc. | |
| 6.20%, 10/15/17 | | | 1,445 | | | | 1,694 | | |
| Delhaize America, Inc. | |
| 9.00%, 4/15/31 | | | 802 | | | | 1,137 | | |
| Deutsche Telekom International Finance BV | |
| 8.75%, 6/15/30 | | | 435 | | | | 611 | | |
DirecTV Holdings LLC/DirecTV
Financing Co., Inc., | |
| 5.88%, 10/1/19 | | | 483 | | | | 549 | | |
| 7.63%, 5/15/16 | | | 332 | | | | 371 | | |
| DISH DBS Corp. | |
| 7.13%, 2/1/16 | | | 580 | | | | 613 | | |
| Expedia, Inc. | |
| 5.95%, 8/15/20 (c) | | | 765 | | | | 777 | | |
| FBG Finance Ltd. | |
| 5.13%, 6/15/15 (c) | | | 354 | | | | 391 | | |
| Freeport-McMoRan Copper & Gold, Inc. | |
| 8.38%, 4/1/17 | | | 190 | | | | 212 | | |
| Frontier Communications Corp. | |
| 8.50%, 4/15/20 | | | 1,750 | | | | 1,940 | | |
| Gaz Capital SA for Gazprom | |
| 6.51%, 3/7/22 (c) | | | 340 | | | | 363 | | |
| Genzyme Corp. | |
| 3.63%, 6/15/15 (c) | | | 755 | | | | 802 | | |
| Georgia-Pacific LLC | |
| 8.25%, 5/1/16 (c) | | | 295 | | | | 329 | | |
| Grupo Bimbo SAB de CV | |
| 4.88%, 6/30/20 (a)(c) | | | 735 | | | | 771 | | |
| Harley-Davidson Funding Corp. | |
| 6.80%, 6/15/18 (c) | | | 940 | | | | 1,024 | | |
| HCA, Inc. | |
| 8.50%, 4/15/19 | | | 600 | | | | 672 | | |
| Holcim US Finance Sarl & Cie SCS | |
| 6.00%, 12/30/19 (c) | | | 483 | | | | 528 | | |
| Home Depot, Inc. | |
| 5.88%, 12/16/36 | | | 1,228 | | | | 1,314 | | |
| Hyatt Hotels Corp. | |
| 6.88%, 8/15/19 (c) | | | 545 | | | | 607 | | |
| Ingram Micro, Inc. | |
| 5.25%, 9/1/17 | | | 815 | | | | 845 | | |
| | | Face
Amount
(000) | | Value
(000) | |
| Intelsat Subsidiary Holding Co. SA | |
| 8.50%, 1/15/13 | | $ | 800 | | | $ | 813 | | |
| International Paper Co., | |
| 7.30%, 11/15/39 (a) | | | 685 | | | | 769 | | |
| 7.95%, 6/15/18 | | | 795 | | | | 966 | | |
| JC Penney Co., Inc. | |
| 5.65%, 6/1/20 (a) | | | 310 | | | | 317 | | |
| JC Penney Corp., Inc. | |
| 6.38%, 10/15/36 | | | 647 | | | | 628 | | |
| KLA-Tencor Corp. | |
| 6.90%, 5/1/18 | | | 789 | | | | 906 | | |
| Kraft Foods, Inc., | |
| 5.38%, 2/10/20 | | | 1,925 | | | | 2,154 | | |
| 6.75%, 2/19/14 | | | 30 | | | | 35 | | |
| 7.00%, 8/11/37 | | | 170 | | | | 209 | | |
| Lafarge SA | |
| 5.50%, 7/9/15 (c) | | | 765 | | | | 805 | | |
| Life Technologies Corp. | |
| 6.00%, 3/1/20 | | | 780 | | | | 885 | | |
| MGM Resorts International | |
| 13.00%, 11/15/13 (a) | | | 845 | | | | 997 | | |
| Mosaic Co. (The) | |
| 7.63%, 12/1/16 (c) | | | 1,500 | | | | 1,627 | | |
| NBC Universal, Inc. | |
| 5.15%, 4/30/20 (c) | | | 915 | | | | 990 | | |
| News America, Inc. | |
| 7.85%, 3/1/39 | | | 1,292 | | | | 1,655 | | |
| Nissan Motor Acceptance Corp. | |
| 4.50%, 1/30/15 (c) | | | 485 | | | | 516 | | |
| Omnicom Group, Inc. | |
| 4.45%, 8/15/20 | | | 785 | | | | 809 | | |
| Petrobras International Finance Co. | |
| 5.75%, 1/20/20 | | | 1,085 | | | | 1,207 | | |
| Pioneer Natural Resources Co. | |
| 6.65%, 3/15/17 | | | 405 | | | | 434 | | |
| QEP Resources, Inc. | |
| 6.88%, 3/1/21 | | | 385 | | | | 419 | | |
| Quest Diagnostics, Inc. | |
| 6.95%, 7/1/37 | | | 1,380 | | | | 1,589 | | |
| QVC, Inc. | |
| 7.13%, 4/15/17 (c) | | | 940 | | | | 978 | | |
| Qwest Corp., | |
| 6.50%, 6/1/17 | | | 570 | | | | 626 | | |
| 6.88%, 9/15/33 | | | 630 | | | | 625 | | |
| 8.38%, 5/1/16 | | | 400 | | | | 475 | | |
| Rio Tinto Finance USA Ltd. | |
| 9.00%, 5/1/19 | | | 1,654 | | | | 2,312 | | |
| Ryder System, Inc., | |
| 5.85%, 11/1/16 | | | 400 | | | | 450 | | |
| 7.20%, 9/1/15 | | | 440 | | | | 519 | | |
| Sable International Finance Ltd. | |
| 7.75%, 2/15/17 (c) | | | 1,255 | | | | 1,330 | | |
The accompanying notes are an integral part of the financial statements.
42
2010 Annual Report
September 30, 2010
Portfolio of Investments (cont'd)
Core Plus Fixed Income Portfolio
| | | Face
Amount
(000) | | Value
(000) | |
| Industrials (cont'd) | |
| SBA Telecommunications, Inc. | |
| 8.25%, 8/15/19 | | $ | 685 | | | $ | 757 | | |
| Southern Copper Corp., | |
| 5.38%, 4/16/20 (a) | | | 285 | | | | 303 | | |
| 6.75%, 4/16/40 | | | 420 | | | | 461 | | |
| Systems 2001 Asset Trust LLC | |
| 6.66%, 9/15/13 (c) | | | 1,325 | | | | 1,462 | | |
| Teck Resources Ltd. | |
| 10.25%, 5/15/16 | | | 1,050 | | | | 1,277 | | |
| Telecom Italia Capital SA, | |
| 7.00%, 6/4/18 | | | 1,183 | | | | 1,361 | | |
| 7.18%, 6/18/19 | | | 5 | | | | 6 | | |
| Telefonica Europe BV | |
| 8.25%, 9/15/30 (a) | | | 1,201 | | | | 1,587 | | |
| Time Warner Cable, Inc., | |
| 6.75%, 6/15/39 (a) | | | 380 | | | | 440 | | |
| 8.75%, 2/14/19 | | | 635 | | | | 840 | | |
| Time Warner, Inc., | |
| 4.70%, 1/15/21 | | | 685 | | | | 727 | | |
| 4.88%, 3/15/20 | | | 260 | | | | 283 | | |
| 5.88%, 11/15/16 | | | 170 | | | | 198 | | |
| 7.70%, 5/1/32 | | | 171 | | | | 214 | | |
| Tyco Electronics Group SA | |
| 5.95%, 1/15/14 | | | 1,658 | | | | 1,849 | | |
| Vale Overseas Ltd., | |
| 5.63%, 9/15/19 | | | 694 | | | | 769 | | |
| 6.88%, 11/10/39 | | | 104 | | | | 120 | | |
| Verizon Communications, Inc., | |
| 6.35%, 4/1/19 | | | 680 | | | | 831 | | |
| 8.95%, 3/1/39 | | | 550 | | | | 809 | | |
| Viacom, Inc. | |
| 6.88%, 4/30/36 | | | 934 | | | | 1,100 | | |
| Vivendi SA | |
| 6.63%, 4/4/18 (c) | | | 758 | | | | 881 | | |
| Warner Chilcott Co. LLC | |
| 7.75%, 9/15/18 (c) | | | 800 | | | | 826 | | |
| Weatherford International Ltd. | |
| 9.63%, 3/1/19 (a) | | | 1,130 | | | | 1,476 | | |
| Woolworths Ltd. | |
| 4.00%, 9/22/20 (c) | | | 850 | | | | 868 | | |
| WPP Finance UK | |
| 8.00%, 9/15/14 | | | 864 | | | | 1,031 | | |
| Wynn Las Vegas LLC | |
| 7.75%, 8/15/20 (c) | | | 1,305 | | | | 1,383 | | |
| Xerox Corp., | |
| 5.63%, 12/15/19 | | | 265 | | | | 297 | | |
| 6.35%, 5/15/18 (a) | | | 227 | | | | 264 | | |
| Yum! Brands, Inc. | |
| 3.88%, 11/1/20 | | | 640 | | | | 641 | | |
| | | | 89,736 | | |
| | | Face
Amount
(000) | | Value
(000) | |
| Utilities (3.9%) | |
| CenterPoint Energy Resources Corp. | |
| 6.25%, 2/1/37 | | $ | 712 | | | $ | 806 | | |
| CMS Energy Corp. | |
| 6.25%, 2/1/20 | | | 1,645 | | | | 1,740 | | |
| Colorado Interstate Gas Co. | |
| 6.80%, 11/15/15 | | | 149 | | | | 176 | | |
| EDF SA | |
| 4.60%, 1/27/20 (c) | | | 550 | | | | 600 | | |
| El Paso Corp. | |
| 8.25%, 2/15/16 | | | 650 | | | | 726 | | |
| Enel Finance International SA | |
| 5.13%, 10/7/19 (c) | | | 1,810 | | | | 1,923 | | |
| Energy Transfer Partners LP | |
| 9.00%, 4/15/19 | | | 875 | | | | 1,123 | | |
| Enterprise Products Operating LLC, | |
| 5.20%, 9/1/20 | | | 1,095 | | | | 1,188 | | |
| 5.25%, 1/31/20 | | | 280 | | | | 304 | | |
| EQT Corp. | |
| 8.13%, 6/1/19 | | | 400 | | | | 497 | | |
| Exelon Generation Co. LLC | |
| 6.25%, 10/1/39 | | | 2,100 | | | | 2,259 | | |
| FirstEnergy Solutions Corp. | |
| 6.05%, 8/15/21 | | | 1,379 | | | | 1,476 | | |
| Iberdrola Finance Ireland Ltd. | |
| 5.00%, 9/11/19 (c) | | | 1,125 | | | | 1,126 | | |
| Kinder Morgan Finance Co. ULC | |
| 5.70%, 1/5/16 | | | 1,545 | | | | 1,601 | | |
| Nisource Finance Corp., | |
| 6.13%, 3/1/22 (a) | | | 695 | | | | 789 | | |
| 6.80%, 1/15/19 | | | 880 | | | | 1,045 | | |
| NRG Energy, Inc. | |
| 8.50%, 6/15/19 | | | 665 | | | | 704 | | |
Plains All American Pipeline LP/PAA
Finance Corp. | |
| 6.70%, 5/15/36 | | | 1,079 | | | | 1,182 | | |
| PPL Energy Supply LLC, | |
| 6.30%, 7/15/13 | | | 870 | | | | 969 | | |
| 6.50%, 5/1/18 (a) | | | 300 | | | | 348 | | |
| | | | 20,582 | | |
| | | | 207,422 | | |
| Mortgages — Other (4.0%) | |
| American Express Co., | |
| 9.63%, 12/1/12 (f)(g) | | | 5 | | | | — | @ | |
| Banc of America Alternative Loan Trust | |
| 5.25%, 1/25/21 | | | 2,943 | | | | 2,854 | | |
| Banc of America Mortgage Securities, Inc. | |
| 1.16%, 1/25/36 (d) | | | — | @ | | | — | @ | |
Countrywide Home Loan Mortgage Pass
Through Trust | |
| 6.00%, 8/25/37 | | | 3,458 | | | | 2,816 | | |
| FDIC Structured Sale Guaranteed Notes | |
| 0.81%, 2/25/48 (c)(d) | | | 1,704 | | | | 1,709 | | |
The accompanying notes are an integral part of the financial statements.
43
2010 Annual Report
September 30, 2010
Portfolio of Investments (cont'd)
Core Plus Fixed Income Portfolio
| | | Face
Amount
(000) | | Value
(000) | |
| Mortgages — Other (cont'd) | |
| First Horizon Alternative Mortgage Securities, | |
| 5.00%, 11/25/20 | | $ | 1,646 | | | $ | 1,692 | | |
| 6.25%, 8/25/36 | | | 1,557 | | | | 1,229 | | |
| GMAC Mortgage Corp. Loan Trust, | |
| 4.25%, 7/25/40 (c) | | | 3,628 | | | | 3,705 | | |
| 5.75%, 4/25/36 | | | 919 | | | | 880 | | |
| GS Mortgage Securities Corp. | |
| 7.50%, 9/25/36 (c)(d) | | | 1,805 | | | | 1,601 | | |
| JP Morgan Mortgage Trust | |
| 6.00%, 6/25/37 | | | 869 | | | | 760 | | |
| Lehman Mortgage Trust | |
| 5.50%, 2/25/36 | | | 1,767 | | | | 1,552 | | |
| Mastr Adjustable Rate Mortgages Trust | |
| 1.31%, 4/25/46 (d) | | | 2,269 | | | | 102 | | |
| Structured Adjustable Rate Mortgage Loan Trust, | |
| 0.56%, 9/25/34 (d) | | | 456 | | | | 351 | | |
| 2.65%, 1/25/35 (d) | | | 1,462 | | | | 1,133 | | |
| WaMu Mortgage Pass Through Certificates | |
| 2.77%, 9/25/35 (d) | | | 1,008 | | | | 864 | | |
| | | | 21,248 | | |
| Municipal Bonds (1.2%) | |
| Chicago Transit Authority | |
| 6.20%, 12/1/40 | | | 665 | | | | 678 | | |
| City of Chicago | |
| 6.40%, 1/1/40 | | | 255 | | | | 273 | | |
| City of New York | |
| 5.97%, 3/1/36 | | | 545 | | | | 590 | | |
Illinois State Toll Highway Authority, Highway
Revenue, Build America Bonds | |
| 6.18%, 1/1/34 | | | 877 | | | | 939 | | |
| Municipal Electric Authority of Georgia, | |
| 6.64%, 4/1/57 | | | 563 | | | | 607 | | |
| 6.66%, 4/1/57 | | | 1,076 | | | | 1,135 | | |
| New York City Transitional Finance Authority | |
| 5.27%, 5/1/27 | | | 540 | | | | 588 | | |
| State of California, General Obligation Bonds | |
| 5.95%, 4/1/16 | | | 1,230 | | | | 1,359 | | |
| | | | 6,169 | | |
| Sovereign (1.0%) | |
| Bermuda Government International Bond | |
| 5.60%, 7/20/20 (c) | | | 775 | | | | 839 | | |
| Export - Import Bank of Korea | |
| 4.13%, 9/9/15 | | | 600 | | | | 632 | | |
| Federative Republic of Brazil | |
| 6.00%, 1/17/17 | | | 1,796 | | | | 2,101 | | |
| Korea Development Bank | |
| 4.38%, 8/10/15 (a) | | | 875 | | | | 929 | | |
| State of Qatar | |
| 4.00%, 1/20/15 (c) | | | 645 | | | | 684 | | |
| | | | 5,185 | | |
| | | Face
Amount
(000) | | Value
(000) | |
| U.S. Agency Securities (2.5%) | |
| Federal Home Loan Mortgage Corp., | |
| 3.00%, 7/28/14 (a) | | $ | 6,519 | | | $ | 6,978 | | |
| 4.88%, 6/13/18 | | | 379 | | | | 446 | | |
| 5.13%, 11/17/17 | | | 2,726 | | | | 3,240 | | |
| 6.75%, 3/15/31 | | | 1,185 | | | | 1,663 | | |
| Federal National Mortgage Association | |
| 5.38%, 6/12/17 | | | 1,085 | | | | 1,306 | | |
| | | | 13,633 | | |
| U.S. Treasury Securities (11.2%) | |
| U.S. Treasury Bonds, | |
| 4.25%, 5/15/39 (a) | | | 7,704 | | | | 8,471 | | |
| 4.38%, 11/15/39 | | | 3,600 | | | | 4,039 | | |
| 4.63%, 2/15/40 (a) | | | 2,963 | | | | 3,463 | | |
| 7.50%, 11/15/24 | | | 15,800 | | | | 23,954 | | |
| U.S. Treasury Notes, | |
| 2.75%, 2/15/19 (a) | | | 2,000 | | | | 2,075 | | |
| 3.00%, 9/30/16 (a) | | | 2,989 | | | | 3,224 | | |
| 3.63%, 8/15/19 | | | 10,000 | | | | 10,999 | | |
| 4.75%, 8/15/17 | | | 2,803 | | | | 3,328 | | |
| | | | 59,553 | | |
| Total Fixed Income Securities (Cost $506,595) | | | 532,250 | | |
| | | Shares | | | |
| Short-Term Investments (14.3%) | |
| Securities held as Collateral on Loaned Securities (4.7%) | |
| Investment Company (4.1%) | |
Morgan Stanley Institutional
Liquidity Funds — Money Market
Portfolio — Institutional Class (Note G) | | | 22,100,802 | | | | 22,101 | | |
| | | Face
Amount
(000) | | | |
| Repurchase Agreements (0.6%) | |
Bank of America Securities, LLC, (0.32%, dated
9/30/10, due 10/1/10; proceeds $1,455;
fully collateralized by a U.S. Government
Agency at the date of this Portfolio of
Investments as follows: Federal National
Mortgage Association; 4.5% due 9/1/40;
valued at $1,484) | | $ | 1,455 | | | | 1,455 | | |
Barclays Capital, Inc., (0.25%, dated 9/30/10,
due 10/1/10; proceeds $1,655; fully
collateralized by a U.S. Treasury Security at
the date of this Portfolio of Investments as
follows: U.S. Treasury Bond; 8.5% due
2/15/20; valued at $1,688) | | | 1,655 | | | | 1,655 | | |
| | | | 3,110 | | |
Total Securities held as Collateral on
Loaned Securities (Cost $25,211) | | | 25,211 | | |
| | | Shares | | | |
| Investment Company (1.3%) | |
Morgan Stanley Institutional
Liquidity Funds — Money Market
Portfolio — Institutional Class (Note G) | | | 6,916,271 | | | | 6,916 | | |
The accompanying notes are an integral part of the financial statements.
44
2010 Annual Report
September 30, 2010
Portfolio of Investments (cont'd)
Core Plus Fixed Income Portfolio
| | | Face
Amount
(000) | | Value
(000) | |
| U.S. Treasury Securities (8.3%) | |
| U.S. Treasury Bills, | |
| 0.17%, 10/28/10 (h)(i)(j) | | $ | 255 | | | $ | 255 | | |
| 0.18%, 10/28/10 (h)(i)(j) | | | 310 | | | | 310 | | |
| 0.19%, 1/13/11 (a)(h) | | | 11,500 | | | | 11,494 | | |
| 0.19%, 10/28/10 (h)(i)(j) | | | 1,496 | | | | 1,496 | | |
| 0.19%, 10/28/10 (h)(i)(j) | | | 390 | | | | 390 | | |
| 0.20%, 10/28/10 (h)(i)(j) | | | 7,434 | | | | 7,433 | | |
| 0.22%, 10/28/10 (h)(i)(j) | | | 1,590 | | | | 1,590 | | |
| 0.25%, 2/10/11 (h) | | | 21,169 | | | | 21,149 | | |
| | | | 44,117 | | |
| Total Short-Term Investments (Cost $76,244) | | | 76,244 | | |
Total Investments (114.1%) (Cost $582,839)
Including $34,018 of Securities Loaned | | | 608,494 | | |
| Liabilities in Excess of Other Assets (-14.1%) | | | (75,117 | ) | |
| Net Assets (100.0%) | | $ | 533,377 | | |
(a) All or a portion of this security was on loan at September 30, 2010.
(b) Security is subject to delayed delivery.
(c) 144A security — Certain conditions for public sale may exist. Unless otherwise noted, these securities are deemed to be liquid.
(d) Variable/Floating Rate Security — Interest rate changes on these instruments are based on changes in a designated base rate. The rates shown are those in effect on September 30, 2010.
(e) Perpetual — Security does not have a predetermined maturity date. Rate for this security is fixed for a period of time then reverts to a floating rate. The interest shown is the rate in effect at September 30, 2010.
(f) At September 30, 2010, the Portfolio held less than $500 of fair valued securities, representing less than 0.01% of net assets. These securities have been fair valued as determined in good faith under procedures established by and under the general supervision of the Portfolio's Trustees.
(g) Security has been deemed illiquid at September 30, 2010.
(h) Rate shown is the yield to maturity at September 30, 2010.
(i) All or a portion of the security was pledged to cover margin requirements for futures contracts.
(j) All or a portion of the security was pledged as collateral for swap agreements.
@ Face Amount/Value is less than $500.
Inv FI Inverse Floating Rate — Interest rate fluctuates with an inverse relationship to an associated interest rate. Indicated rate is the effective rate at September 30, 2010.
IO Interest Only
PAC Planned Amortization Class
REIT Real Estate Investment Trust
REMIC Real Estate Mortgage Investment Conduit
STRIPS Separate Trading of Registered Interest and Principal of Securities
TBA To Be Announced
Futures Contracts:
The Portfolio had the following futures contract(s) open at period end:
| | | Number
of
Contracts | | Value
(000) | | Expiration
Date | | Net Unrealized
Appreciation
(Depreciation)
(000) | |
| Long: | |
U.S. Treasury
5 yr. Note | | | 582 | | | $ | 70,345 | | | Dec-10 | | $ | 567 | | |
| Short: | |
U.S. Treasury
2 yr. Note | | | 3 | | | | 658 | | | Dec-10 | | | (1 | ) | |
U.S. Treasury
10 yr. Note | | | 485 | | | | 61,133 | | | Dec-10 | | | (336 | ) | |
U.S. Treasury
30 yr. Bond | | | 89 | | | | 11,901 | | | Dec-10 | | | 38 | | |
| | | | | | | | | | | | | $ | 268 | | |
The accompanying notes are an integral part of the financial statements.
45
2010 Annual Report
September 30, 2010
Portfolio of Investments (cont'd)
Core Plus Fixed Income Portfolio
Credit Default Swap Agreements
The Portfolio had the following credit default swap agreement(s) open at period end:
| Swap Counterparty and Reference Obligation | | Buy/Sell
Protection | | Notional
Amount
(000) | | Pay/Receive
Fixed | | Termination
Date | | Upfront
Payment
Paid
(000) | | Unrealized
Appreciation
(Depreciation)
(000) | | Credit
Rating of
Reference
Obligation† | |
Bank of America
Tyco Electronics Ltd., 6.00%, 10/1/12 | | Buy | | $ | 2,115 | | | | 5.00 | % | | | 6/20/14 | | | $ | 65 | | | $ | (263 | ) | | BBB | |
† Credit Rating as issued by Standard and Poor's.
Interest Rate Swap Agreements
The Portfolio had the following interest rate swap agreement(s) open at period end:
| Swap Counterparty | | Floating Rate
Index | | Pay/Receive
Floating Rate | | Fixed Rate | | Termination
Date | | Notional
Amount
(000) | | Net Unrealized
Appreciation
(Depreciation)
(000) | |
| Credit Suisse | | 3 Month LIBOR | | Receive | | | 2.63 | % | | 3/11/15 | | $ | 35,600 | | | $ | (2,044 | ) | |
| Credit Suisse | | 3 Month LIBOR | | Receive | | | 2.18 | | | 9/8/15 | | CAD | 15,536 | | | | (56 | ) | |
| Credit Suisse | | 3 Month LIBOR | | Receive | | | 2.21 | | | 9/8/15 | | | 11,200 | | | | (55 | ) | |
| Credit Suisse | | 3 Month LIBOR | | Pay | | | 4.07 | | | 9/8/20 | | | 18,197 | | | | 126 | | |
| Credit Suisse | | 3 Month LIBOR | | Pay | | | 4.12 | | | 9/8/20 | | | 13,120 | | | | 121 | | |
| | | | | | | | | | | | | | | | | $ | (1,908 | ) | |
CAD — Canadian Dollar
Zero Coupon Swap Agreements
The Portfolio had the following zero coupon swap agreement(s) open at period end:
| Swap Counterparty | | Notional
Amount
(000) | | Floating
Rate Index | | Pay/Receive
Floating Rate | | Termination
Date | | Unrealized
Appreciation
(Depreciation)
(000) | |
| Barclays Capital | | $ | 12,410 | | | 3 Month LIBOR | | Receive | | 11/15/19 | | $ | (1,553 | ) | |
| Barclays Capital | | | 16,800 | | | 3 Month LIBOR | | Receive | | 11/15/21 | | | (2,136 | ) | |
| | | | | | | | | | | $ | (3,689 | ) | |
LIBOR London Interbank Offered Rate
Fair Value Measurement Information:
The following is a summary of the inputs used to value the Portfolio's net assets as of September 30, 2010. (See Note A-7 to the financial statements for further information regarding fair value measurement.)
| Investment Type | | Level 1
Quoted
prices
(000) | | Level 2
Other
significant
observable
inputs
(000) | | Level 3
Significant
unobservable
inputs
(000) | | Total
(000) | |
| Assets: | |
| Fixed Income Securities | |
Agency
Adjustable Rate
Mortgages | | $ | — | | | $ | 10,360 | | | $ | — | | | $ | 10,360 | | |
Agency Bond —
Banking (FDIC
Guaranteed) | | | — | | | | 14,895 | | | | — | | | | 14,895 | | |
Fair Value Measurement Information: (cont'd)
| Investment Type | | Level 1
Quoted
prices
(000) | | Level 2
Other
significant
observable
inputs
(000) | | Level 3
Significant
unobservable
inputs
(000) | | Total
(000) | |
| Fixed Income Securities (cont'd) | |
Agency Fixed Rate
Mortgages | | $ | — | | | $ | 158,830 | | | $ | — | | | $ | 158,830 | | |
Asset-Backed
Securities | | | — | | | | 10,927 | | | | — | | | | 10,927 | | |
Collateralized Mortgage
Obligations —
Agency Collateral
Series | | | — | | | | 5,460 | | | | — | | | | 5,460 | | |
Commercial Mortgage
Backed Securities | | | — | | | | 18,568 | | | | — | | | | 18,568 | | |
The accompanying notes are an integral part of the financial statements.
46
2010 Annual Report
September 30, 2010
Portfolio of Investments (cont'd)
Core Plus Fixed Income Portfolio
Fair Value Measurement Information: (cont'd)
| Investment Type | | Level 1
Quoted
prices
(000) | | Level 2
Other
significant
observable
inputs
(000) | | Level 3
Significant
unobservable
inputs
(000) | | Total
(000) | |
| Fixed Income Securities (cont'd) | |
| Corporate Bonds | | $ | — | | | $ | 207,422 | | | $ | — | | | $ | 207,422 | | |
| Mortgages — Other | | | — | | | | 21,248 | | | | — | @ | | | 21,248 | | |
| Municipal Bonds | | | — | | | | 6,169 | | | | — | | | | 6,169 | | |
| Sovereign | | | — | | | | 5,185 | | | | — | | | | 5,185 | | |
U.S. Agency
Securities | | | — | | | | 13,633 | | | | — | | | | 13,633 | | |
U.S. Treasury
Securities | | | — | | | | 59,553 | | | | — | | | | 59,553 | | |
Total Fixed Income
Securities | | | — | | | | 532,250 | | | | — | @ | | | 532,250 | | |
Short-Term
Investments | |
Investment
Company | | | 29,017 | | | | — | | | | — | | | | 29,017 | | |
Repurchase
Agreements | | | — | | | | 3,110 | | | | — | | | | 3,110 | | |
U.S. Treasury
Securities | | | — | | | | 44,117 | | | | — | | | | 44,117 | | |
Total Short-Term
Investments | | | 29,017 | | | | 47,227 | | | | — | | | | 76,244 | | |
| Futures Contracts | | | 605 | | | | — | | | | — | | | | 605 | | |
Interest Rate Swap
Agreements | | | — | | | | 247 | | | | — | | | | 247 | | |
| Total Assets | | | 29,622 | | | | 579,724 | | | | — | @ | | | 609,346 | | |
| Liabilities: | |
| Futures Contracts | | | 337 | | | | — | | | | — | | | | 337 | | |
Credit Default Swap
Agreement | | | — | | | | 263 | | | | — | | | | 263 | | |
Interest Rate Swap
Agreements | | | — | | | | 2,155 | | | | — | | | | 2,155 | | |
Zero Coupon Swap
Agreements | | | — | | | | 3,689 | | | | — | | | | 3,689 | | |
| Total Liabilities | | | 337 | | | | 6,107 | | | | — | | | | 6,444 | | |
| Total | | $ | 29,285 | | | $ | 573,617 | | | $ | — | @ | | $ | 602,902 | | |
Fair Value Measurement Information: (cont'd)
The following is a reconciliation of investments in which significant unobservable inputs (Level 3) were used in determining value:
| | | Fixed Income
Securities
(000) | |
| Balance as of 9/30/09 | | $ | 2 | | |
| Accrued discounts/premiums | | | — | | |
| Realized gain (loss) | | | 355 | | |
| Change in unrealized appreciation (depreciation) | | | 30 | | |
| Net purchases (sales) | | | (387 | ) | |
| Transfers in for Level 3 | | | — | | |
| Transfers out of Level 3 | | | — | | |
| Balance as of 9/30/10 | | $ | — | @ | |
The amount of total gains (losses) for the period
included in earnings attributable to the change
in unrealized gains (losses) relating to assets
and liabilities still held at Level 3 at 9/30/10. | | $ | 11 | | |
@ Valued at less than $500
The accompanying notes are an integral part of the financial statements.
47
2010 Annual Report
September 30, 2010
Investment Overview (unaudited)
Intermediate Duration Portfolio
Performance
For the fiscal year ended September 30, 2010, the Portfolio's Class I had a total return based on net asset value and reinvestment of distributions per share of 7.92%, net of fees. The Portfolio's Class I outperformed against its benchmark the Barclays Capital Intermediate U.S. Government/Credit Index (the "Index") which returned 7.77%.
Factors Affecting Performance
• During much of the 12-month period, global sentiment was fragile and financial markets were volatile. Government bonds in most developed countries continued to be regarded as "safe haven" assets relative to sectors with greater credit risk. However, the debt of governments on the periphery of Europe continued to underperform those in other developed markets as investors fretted about their fiscal problems. Outside of these trouble spots, declining government bond yields in the rest of Europe and North America appeared to indicate a general reduction in investors' expectations for economic growth and inflation in those markets, while policy makers in emerging markets continued to adjust monetary policy to recognize economic strength.
• Amidst continued weakness in economic indicators, the Federal Open Market Committee (the "Fed") kept the federal funds target rate in the range of zero to 0.25%. The labor market has continued to languish, with the unemployment rate at its highest level in many years, albeit declining in recent months. On the housing front, data remain dim, with some pockets of improvement.
• Investment-grade corporate debt posted positive returns during the period (as measured by the Barclays Capital U.S. Corporate Index), and among sectors, financials outpaced industrials and utilities. In mid-2010, the U.S. credit market was negatively affected by the European sovereign debt crisis. However, the outlook for debt in the investment grade corporate remains favorable in our view — especially in industrials with strong balance sheets, sufficient liquidity, improving revenue growth and free cash flow; and in financials, namely larger banks with improving asset bases and capital structures.
• The U.S. Treasury yield curve flattened during the period, with yields on 2-, 5-, 10-, and 30-year Treasuries declining by 44, 94, 71, and 31 basis points, respectively.
• The Portfolio's allocation to investment-grade credit was beneficial to performance. Within the corporate sector, overweights in the banking, food and beverage, insurance, and media sectors were additive to relative returns as significant spread tightening in these sectors led to their strong performance.
• Additionally, interest-rate positions contributed to performance. Throughout the period, we employed tactical strategies involving interest rate swaps that were designed to take advantage of anomalies across the swap curve. Similar to the Treasury curve, the swap curve shows the relationship of various maturities of swaps and their yields.
• However, an underweight to the two-year part of the yield curve detracted from performance as two-year yields tightened to historic lows.
• An overweight to Build America Bonds also hampered relative performance as the sector underperformed other taxable sectors.
Management Strategies
• Throughout this period, the Portfolio has been positioned with an overweight to investment-grade credit. We have a favorable view of the corporate debt sector and therefore continue to maintain an overweight to this sector.
• During the second half of the period, the Portfolio was positioned to benefit from an anticipated flattening (or, reduction in the difference of yield spreads) between the two- and five-year segments of the yield curve. Once this flattening occurred in the third quarter of 2010, we took profits and unwound the position.
48
2010 Annual Report
September 30, 2010
Investment Overview (unaudited) (cont'd)
Intermediate Duration Portfolio
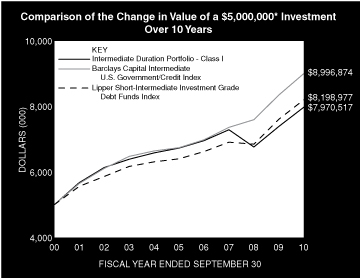
* Minimum Investment
In accordance with SEC regulations, the Portfolio's performance shown assumes that all recurring fees (including management fees) were deducted and all dividends and distributions were reinvested. The performance of Investment Class shares will vary from the Class I shares based upon their different inception dates and will be negatively impacted by additional fees assessed to that class.
Performance Compared to the Barclays Capital Intermediate U.S. Government/Credit Index(1) and the Lipper Short-Intermediate Investment Grade Debt Funds Index(2)
| | | Total Returns(3) | |
| | | | | Average Annual | |
| | | One
Year | | Five
Years | | Ten
Years | | Since
Inception(6) | |
Portfolio — Class I
w/o sales charges(4) | | | 7.92 | % | | | 3.46 | % | | | 4.77 | % | | | 5.56 | % | |
Barclays Capital Intermediate
U.S. Government/Credit Index | | | 7.77 | | | | 5.95 | | | | 6.05 | | | | 6.39 | | |
Lipper Short-Intermediate Investment
Grade Debt Funds Index | | | 7.83 | | | | 5.08 | | | | 5.07 | | | | 6.46 | | |
Portfolio — Investment Class
w/o sales charges(5) | | | 7.68 | | | | 3.30 | | | | 4.61 | | | | 4.79 | | |
Barclays Capital Intermediate
U.S. Government/Credit Index | | | 7.77 | | | | 5.95 | | | | 6.05 | | | | 6.11 | | |
Lipper Short-Intermediate Investment
Grade Debt Funds Index | | | 7.83 | | | | 5.08 | | | | 5.07 | | | | 6.14 | | |
Performance data quoted represents past performance, which is no guarantee of future results, and current performance may be lower or higher than the figures shown. Performance assumes that all dividends and distributions, if any, were reinvested. For the most recent month-end performance figures, please visit www.morganstanley.com/im. Investment returns and principal value will fluctuate so that Portfolio shares, when redeemed, may be worth more or less than their original cost. Total returns do not reflect the deduction of taxes that a shareholder would pay on Portfolio distributions or the redemption of Portfolio shares. Performance of share classes will vary due to differences in sales charges and expenses.
(1) The Barclays Capital Intermediate U.S. Government/Credit Index is a fixed income market capitalization-weighted index of investment-grade (BBB-/Baa3) or higher publicly-traded fixed-rate U.S. government, U.S. agency, and corporate issues with remaining maturities of at least one year and not longer than ten years. To be included in the Index, bonds must have an outstanding par value of at least $250 million. Non-dollar denominated and convertible bonds are excluded from the Index. The Index is unmanaged and its returns do not include any sales charges or fees. Such costs would lower performance. It is not possible to invest directly in an index.
(2) The Lipper Short-Intermediate Investment Grade Debt Funds Index is an equally weighted performance index of the largest qualifying funds (based on net assets) in the Lipper Short-Intermediate Investment Grade Debt Funds classification. The Index, which is adjusted for capital gains distributions and income dividends, is unmanaged and should not be considered an investment. There are currently 30 funds represented in this Index. As of the date of this report, the Portfolio was in the Lipper Short-Intermediate Investment Grade Debt Funds classification.
(3) Total returns for the Portfolio reflect expenses waived and/or reimbursed, if applicable, by the Adviser. Without such waivers and/or reimbursements, total returns would have been lower. Fee waivers and/or reimbursements are voluntary and the Adviser reserves the right to commence or terminate any waiver and/or reimbursement at any time.
(4) Commenced operations on October 3, 1994.
(5) Commenced operations on August 16, 1999.
(6) For comparative purposes, average annual since inception returns listed for the Indexes refer to the inception date or initial offering of the respective share class of the Portfolio, not the inception of the Indexes.
Portfolio Composition
| Classification | | Percentage of
Total Investments | |
| U.S. Treasury Securities | | | 44.0 | % | |
| Finance | | | 18.9 | | |
| Industrials | | | 13.7 | | |
| Agency Bonds — Banking (FDIC Guaranteed) | | | 9.2 | | |
| U.S. Agency Securities | | | 5.3 | | |
| Other* | | | 5.3 | | |
| Short-Term Investments | | | 3.6 | | |
| Total Investments | | | 100.0 | % | |
* Industries and/or investment types representing less than 5% of total investments.
49
2010 Annual Report
September 30, 2010
Portfolio of Investments
Intermediate Duration Portfolio
| | | Face
Amount
(000) | | Value
(000) | |
| Fixed Income Securities (97.6%) | |
| Agency Bonds — Banking (FDIC Guaranteed) (9.3%) | |
| Ally Financial, Inc. | |
| 2.20%, 12/19/12 | | $ | 4,280 | | | $ | 4,427 | | |
| General Electric Capital Corp. | |
| 2.63%, 12/28/12 | | | 4,000 | | | | 4,173 | | |
| | | | 8,600 | | |
| Agency Fixed Rate Mortgages (0.2%) | |
| Federal National Mortgage Association, | |
| Conventional Pools: | |
| 6.50%, 7/1/30 - 5/1/33 | | | 170 | | | | 190 | | |
| 7.00%, 11/1/32 | | | 3 | | | | 3 | | |
| Government National Mortgage Association, | |
| Various Pools: | |
| 9.50%, 11/15/16 - 1/15/19 | | | 38 | | | | 39 | | |
| | | | 232 | | |
| Asset-Backed Security (0.2%) | |
| ARI Fleet Lease Trust | |
| 1.71%, 8/15/18 (a)(b) | | | 151 | | | | 151 | | |
| Collateralized Mortgage Obligations — Agency Collateral Series (0.0%) | |
| Federal Home Loan Mortgage Corp., | |
| IO REMIC | |
| 7.00%, 2/15/32 | | | 45 | | | | 9 | | |
| IO STRIPS | |
| 6.50%, 8/1/28 | | | 163 | | | | 27 | | |
| | | | 36 | | |
| Corporate Bonds (36.1%) | |
| Finance (19.2%) | |
| Abbey National Treasury Services PLC | |
| 3.88%, 11/10/14 (b) | | | 250 | | | | 256 | | |
| Aegon N.V. | |
| 4.63%, 12/1/15 | | | 200 | | | | 213 | | |
| AIG SunAmerica Global Financing VI | |
| 6.30%, 5/10/11 (b) | | | 295 | | | | 302 | | |
| American Express Co. | |
| 8.13%, 5/20/19 | | | 385 | | | | 498 | | |
American Express Credit Corp.,
Series C | |
| 7.30%, 8/20/13 | | | 100 | | | | 115 | | |
| Bank of America Corp., | |
| 5.65%, 5/1/18 | | | 120 | | | | 127 | | |
| 5.75%, 12/1/17 | | | 270 | | | | 289 | | |
| Barclays Bank PLC | |
| 6.75%, 5/22/19 | | | 430 | | | | 512 | | |
| Bear Stearns Cos. LLC (The), | |
| 6.40%, 10/2/17 | | | 375 | | | | 437 | | |
| 7.25%, 2/1/18 | | | 355 | | | | 433 | | |
| Boston Properties LP | |
| 5.63%, 11/15/20 | | | 280 | | | | 308 | | |
| Brookfield Asset Management, Inc., | |
| 5.80%, 4/25/17 | | | 30 | | | | 32 | | |
| 7.13%, 6/15/12 | | | 220 | | | | 237 | | |
| | | Face
Amount
(000) | | Value
(000) | |
| Capital One Bank, (USA) NA | |
| 8.80%, 7/15/19 | | $ | 275 | | | $ | 352 | | |
| Catlin Insurance Co., Ltd. | |
| 7.25%, (a)(b)(c) | | | 150 | | | | 123 | | |
| Citigroup, Inc., (Note G) | |
| 6.13%, 11/21/17 | | | 685 | | | | 749 | | |
| 8.50%, 5/22/19 | | | 175 | | | | 217 | | |
| Commonwealth Bank of Australia | |
| 5.00%, 10/15/19 (b) | | | 335 | | | | 364 | | |
| Credit Agricole SA | |
| 3.50%, 4/13/15 (b) | | | 355 | | | | 366 | | |
| Credit Suisse AG | |
| 5.40%, 1/14/20 | | | 595 | | | | 636 | | |
| Credit Suisse, New York | |
| 6.00%, 2/15/18 | | | 105 | | | | 116 | | |
| Duke Realty LP | |
| 6.75%, 3/15/20 | | | 200 | | | | 224 | | |
| General Electric Capital Corp., | |
| 5.63%, 5/1/18 | | | 350 | | | | 389 | | |
| 6.00%, 8/7/19 | | | 775 | | | | 874 | | |
| Goldman Sachs Group, Inc. (The), | |
| 6.15%, 4/1/18 | | | 240 | | | | 267 | | |
| 6.25%, 9/1/17 | | | 500 | | | | 561 | | |
| 7.50%, 2/15/19 | | | 115 | | | | 137 | | |
| Hartford Financial Services Group, Inc. | |
| 5.50%, 3/30/20 | | | 210 | | | | 214 | | |
| HBOS PLC | |
| 6.75%, 5/21/18 (b) | | | 320 | | | | 322 | | |
| HSBC Finance Corp., | |
| 5.50%, 1/19/16 | | | 230 | | | | 253 | | |
| ING Bank | |
| 3.00%, 9/1/15 (b) | | | 140 | | | | 140 | | |
| Intesa Sanpaolo SpA | |
| 3.63%, 8/12/15 (b) | | | 130 | | | | 132 | | |
| JPMorgan Chase & Co. | |
| 4.95%, 3/25/20 | | | 140 | | | | 150 | | |
| Lloyds TSB Bank PLC | |
| 5.80%, 1/13/20 (b) | | | 120 | | | | 126 | | |
| Merrill Lynch & Co., Inc. | |
| 6.88%, 4/25/18 | | | 725 | | | | 814 | | |
| MetLife, Inc. | |
| 7.72%, 2/15/19 | | | 225 | | | | 287 | | |
| NASDAQ OMX Group, Inc. (The) | |
| 5.55%, 1/15/20 | | | 210 | | | | 224 | | |
| Nationwide Building Society | |
| 6.25%, 2/25/20 (b) | | | 300 | | | | 331 | | |
| Pacific LifeCorp | |
| 6.00%, 2/10/20 (b) | | | 175 | | | | 189 | | |
| PNC Funding Corp., | |
| 5.13%, 2/8/20 | | | 215 | | | | 233 | | |
| 6.70%, 6/10/19 | | | 235 | | | | 278 | | |
The accompanying notes are an integral part of the financial statements.
50
2010 Annual Report
September 30, 2010
Portfolio of Investments (cont'd)
Intermediate Duration Portfolio
| | | Face
Amount
(000) | | Value
(000) | |
| Finance (cont'd) | |
| Principal Financial Group, Inc., | |
| 8.88%, 5/15/19 | | $ | 190 | | | $ | 250 | | |
| Prudential Financial, Inc., | |
| 4.75%, 9/17/15 | | | 280 | | | | 303 | | |
| 7.38%, 6/15/19 | | | 90 | | | | 110 | | |
| Reinsurance Group of America, Inc., | |
| 6.45%, 11/15/19 | | | 175 | | | | 194 | | |
| Royal Bank of Scotland PLC (The) | |
| 4.88%, 3/16/15 | | | 360 | | | | 379 | | |
| Societe Generale | |
| 3.10%, 9/14/15 (b) | | | 135 | | | | 136 | | |
| Standard Chartered Bank | |
| 6.40%, 9/26/17 (b) | | | 100 | | | | 112 | | |
| Standard Chartered PLC | |
| 3.85%, 4/27/15 (b) | | | 200 | | | | 209 | | |
| UBS AG | |
| 5.88%, 12/20/17 | | | 200 | | | | 227 | | |
US Central Federal Credit Union (U.S.
Government Guaranteed) | |
| 1.90%, 10/19/12 | | | 1,270 | | | | 1,303 | | |
| Vornado Realty LP | |
| 4.25%, 4/1/15 | | | 155 | | | | 161 | | |
WEA Finance LLC/WT Finance Australia
Property Ltd. | |
| 6.75%, 9/2/19 (b) | | | 225 | | | | 267 | | |
| WellPoint, Inc. | |
| 6.38%, 6/15/37 | | | 185 | | | | 207 | | |
| Wells Fargo & Co. | |
| 5.63%, 12/11/17 | | | 675 | | | | 770 | | |
| Westpac Banking Corp. | |
| 3.00%, 8/4/15 | | | 190 | | | | 194 | | |
| | | | 17,649 | | |
| Industrials (13.9%) | |
| Agilent Technologies, Inc. | |
| 5.50%, 9/14/15 | | | 180 | | | | 203 | | |
| Altria Group, Inc., | |
| 4.13%, 9/11/15 | | | 150 | | | | 161 | | |
| 9.25%, 8/6/19 | | | 125 | | | | 168 | | |
| Anglo American Capital PLC | |
| 9.38%, 4/8/19 (b) | | | 225 | | | | 304 | | |
| ArcelorMittal, | |
| 7.00%, 10/15/39 | | | 40 | | | | 41 | | |
| 9.85%, 6/1/19 | | | 125 | | | | 161 | | |
| AT&T, Inc. | |
| 5.80%, 2/15/19 | | | 350 | | | | 418 | | |
| BAT International Finance PLC | |
| 9.50%, 11/15/18 (b) | | | 200 | | | | 272 | | |
| Bunge Ltd. Finance Corp. | |
| 8.50%, 6/15/19 | | | 110 | | | | 133 | | |
| Comcast Corp. | |
| 5.70%, 5/15/18 | | | 395 | | | | 453 | | |
| | | Face
Amount
(000) | | Value
(000) | |
| ConAgra Foods, Inc. | |
| 7.00%, 4/15/19 | | $ | 170 | | | $ | 212 | | |
| Cooper US, Inc. | |
| 5.25%, 11/15/12 | | | 195 | | | | 212 | | |
| Corning, Inc., | |
| 6.63%, 5/15/19 | | | 45 | | | | 55 | | |
| 7.25%, 8/15/36 | | | 75 | | | | 90 | | |
| CVS Pass-Through Trust, | |
| 6.04%, 12/10/28 | | | 216 | | | | 229 | | |
| 8.35%, 7/10/31 (b) | | | 181 | | | | 225 | | |
| Daimler Finance North America LLC | |
| 7.30%, 1/15/12 | | | 230 | | | | 247 | | |
| Delhaize Group SA | |
| 6.50%, 6/15/17 | | | 175 | | | | 209 | | |
| DirecTV Holdings LLC / DirecTV Financing Co., Inc. | |
| 5.88%, 10/1/19 | | | 200 | | | | 227 | | |
| FBG Finance Ltd. | |
| 5.13%, 6/15/15 (b) | | | 75 | | | | 83 | | |
| Freeport-McMoRan Copper & Gold, Inc. | |
| 8.38%, 4/1/17 | | | 40 | | | | 45 | | |
| Genzyme Corp. | |
| 3.63%, 6/15/15 (b) | | | 140 | | | | 149 | | |
| Grupo Bimbo SAB de CV | |
| 4.88%, 6/30/20 (b) | | | 135 | | | | 142 | | |
| Harley-Davidson Funding Corp. | |
| 6.80%, 6/15/18 (b) | | | 220 | | | | 240 | | |
| Holcim US Finance Sarl & Cie SCS | |
| 6.00%, 12/30/19 (b) | | | 115 | | | | 126 | | |
| Home Depot, Inc. | |
| 5.88%, 12/16/36 | | | 280 | | | | 300 | | |
| International Paper Co. | |
| 7.95%, 6/15/18 | | | 195 | | | | 237 | | |
| KLA-Tencor Corp. | |
| 6.90%, 5/1/18 | | | 170 | | | | 195 | | |
| Kraft Foods, Inc. | |
| 5.38%, 2/10/20 | | | 500 | | | | 560 | | |
| L-3 Communications Corp. | |
| 4.75%, 7/15/20 | | | 200 | | | | 210 | | |
| Medco Health Solutions, Inc. | |
| 7.13%, 3/15/18 | | | 155 | | | | 191 | | |
| Mosaic Co. (The) | |
| 7.63%, 12/1/16 (b) | | | 275 | | | | 298 | | |
| NBC Universal, Inc. | |
| 5.15%, 4/30/20 (b) | | | 165 | | | | 179 | | |
| News America, Inc. | |
| 6.90%, 3/1/19 | | | 200 | | | | 245 | | |
| Nissan Motor Acceptance Corp. | |
| 4.50%, 1/30/15 (b) | | | 90 | | | | 96 | | |
Novant Health, Inc.,
Series 09a | |
| 5.85%, 11/1/19 | | | 250 | | | | 280 | | |
| Omnicom Group, Inc. | |
| 4.45%, 8/15/20 | | | 150 | | | | 155 | | |
The accompanying notes are an integral part of the financial statements.
51
2010 Annual Report
September 30, 2010
Portfolio of Investments (cont'd)
Intermediate Duration Portfolio
| | | Face
Amount
(000) | | Value
(000) | |
| Industrials (cont'd) | |
| Petrobras International Finance Co. | |
| 5.75%, 1/20/20 | | $ | 235 | | | $ | 261 | | |
| Quest Diagnostics, Inc. | |
| 6.95%, 7/1/37 | | | 225 | | | | 259 | | |
| Rio Tinto Finance USA Ltd. | |
| 9.00%, 5/1/19 | | | 355 | | | | 496 | | |
| Ryder System, Inc., | |
| 5.85%, 11/1/16 | | | 80 | | | | 90 | | |
| 7.20%, 9/1/15 | | | 80 | | | | 94 | | |
| Southern Copper Corp., | |
| 5.38%, 4/16/20 | | | 55 | | | | 59 | | |
| 6.75%, 4/16/40 | | | 80 | | | | 88 | | |
| Systems 2001 Asset Trust LLC | |
| 6.66%, 9/15/13 (b) | | | 157 | | | | 173 | | |
| Telecom Italia Capital SA, | |
| 7.00%, 6/4/18 | | | 180 | | | | 207 | | |
| 7.18%, 6/18/19 | | | 60 | | | | 71 | | |
| Telefonica Europe BV | |
| 8.25%, 9/15/30 | | | 250 | | | | 330 | | |
Teva Pharmaceutical Finance II BV/
Teva Pharmaceutical Finance III LLC | |
| 3.00%, 6/15/15 | | | 195 | | | | 204 | | |
| Time Warner Cable, Inc., | |
| 6.75%, 6/15/39 | | | 45 | | | | 52 | | |
| 8.75%, 2/14/19 | | | 180 | | | | 238 | | |
| Time Warner, Inc., | |
| 4.70%, 1/15/21 | | | 130 | | | | 138 | | |
| 5.88%, 11/15/16 | | | 110 | | | | 128 | | |
| Vale Overseas Ltd., | |
| 5.63%, 9/15/19 | | | 160 | | | | 177 | | |
| 6.88%, 11/10/39 | | | 15 | | | | 17 | | |
| Verizon Communications, Inc. | |
| 6.35%, 4/1/19 | | | 500 | | | | 611 | | |
| Viacom, Inc. | |
| 5.63%, 9/15/19 | | | 205 | | | | 234 | | |
| Vivendi SA | |
| 6.63%, 4/4/18 (b) | | | 175 | | | | 203 | | |
| Weatherford International Ltd. | |
| 9.63%, 3/1/19 | | | 200 | | | | 261 | | |
| Woolworths Ltd. | |
| 4.00%, 9/22/20 (b) | | | 145 | | | | 148 | | |
| WPP Finance UK | |
| 8.00%, 9/15/14 | | | 200 | | | | 239 | | |
| Xerox Corp., | |
| 5.63%, 12/15/19 | | | 30 | | | | 34 | | |
| 6.35%, 5/15/18 | | | 70 | | | | 81 | | |
| Yum! Brands, Inc. | |
| 3.88%, 11/1/20 | | | 110 | | | | 110 | | |
| | | | 12,754 | | |
| Utilities (3.0%) | |
| Columbus Southern Power Co. | |
| 4.40%, 12/1/10 | | | 100 | | | | 101 | | |
| | | Face
Amount
(000) | | Value
(000) | |
| Enel Finance International SA | |
| 5.13%, 10/7/19 (b) | | $ | 300 | | | $ | 319 | | |
| Energy Transfer Partners LP | |
| 9.00%, 4/15/19 | | | 150 | | | | 193 | | |
Enterprise Products Operating LLC,
Series O | |
| 9.75%, 1/31/14 | | | 275 | | | | 337 | | |
| FirstEnergy Solutions Corp. | |
| 6.05%, 8/15/21 | | | 205 | | | | 219 | | |
| Iberdrola Finance Ireland Ltd. | |
| 5.00%, 9/11/19 (b) | | | 200 | | | | 200 | | |
| Kinder Morgan Energy Partners LP | |
| 5.95%, 2/15/18 | | | 200 | | | | 226 | | |
| Nisource Finance Corp. | |
| 6.80%, 1/15/19 | | | 185 | | | | 220 | | |
| Plains All American Pipeline LP/PAA Finance Corp. | |
| 8.75%, 5/1/19 | | | 175 | | | | 222 | | |
| PPL Energy Supply LLC, | |
| 6.30%, 7/15/13 | | | 145 | | | | 161 | | |
| 6.50%, 5/1/18 | | | 180 | | | | 209 | | |
| Spectra Energy Capital LLC | |
| 8.00%, 10/1/19 | | | 300 | | | | 380 | | |
| | | | 2,787 | | |
| | | | 33,190 | | |
| Municipal Bonds (1.1%) | |
| Chicago Transit Authority | |
| 6.20%, 12/1/40 | | | 110 | | | | 112 | | |
| City of Chicago | |
| 6.40%, 1/1/40 | | | 45 | | | | 48 | | |
| City of New York | |
| 5.97%, 3/1/36 | | | 130 | | | | 141 | | |
| Municipal Electric Authority of Georgia, | |
| 6.64%, 4/1/57 | | | 105 | | | | 113 | | |
| 6.66%, 4/1/57 | | | 195 | | | | 206 | | |
| New York City Transitional Finance Authority | |
| 5.27%, 5/1/27 | | | 100 | | | | 109 | | |
| State of California, General Obligation Bonds | |
| 5.95%, 4/1/16 | | | 230 | | | | 254 | | |
| | | | 983 | | |
| Sovereign (0.7%) | |
| Bermuda Government International Bond | |
| 5.60%, 7/20/20 (b) | | | 145 | | | | 157 | | |
| Export - Import Bank of Korea | |
| 4.13%, 9/9/15 | | | 100 | | | | 105 | | |
| Federative Republic of Brazil | |
| 6.00%, 1/17/17 | | | 185 | | | | 217 | | |
| Korea Development Bank | |
| 4.38%, 8/10/15 | | | 200 | | | | 212 | | |
| | | | 691 | | |
| U.S. Agency Securities (5.4%) | |
| Federal Home Loan Bank | |
| 5.00%, 11/17/17 | | | 760 | | | | 902 | | |
The accompanying notes are an integral part of the financial statements.
52
2010 Annual Report
September 30, 2010
Portfolio of Investments (cont'd)
Intermediate Duration Portfolio
| | | Face
Amount
(000) | | Value
(000) | |
| U.S. Agency Securities (cont'd) | |
| Federal Home Loan Mortgage Corp. | |
| 5.50%, 8/23/17 | | $ | 2,000 | | | $ | 2,420 | | |
| Federal National Mortgage Association | |
| 4.38%, 10/15/15 | | | 1,440 | | | | 1,635 | | |
| | | | 4,957 | | |
| U.S. Treasury Securities (44.6%) | |
| U.S. Treasury Bonds, | |
| 4.38%, 11/15/39 | | | 690 | | | | 774 | | |
| 6.88%, 8/15/25 | | | 700 | | | | 1,017 | | |
| 7.50%, 11/15/24 | | | 3,640 | | | | 5,519 | | |
| U.S. Treasury Notes, | |
| 1.50%, 12/31/13 | | | 5,545 | | | | 5,684 | | |
| 1.75%, 1/31/14 - 7/31/15 | | | 4,110 | | | | 4,226 | | |
| 2.25%, 1/31/15 | | | 3,500 | | | | 3,673 | | |
| 2.63%, 7/31/14 - 12/31/14 | | | 6,852 | | | | 7,296 | | |
| 3.00%, 2/28/17 | | | 1,330 | | | | 1,431 | | |
| 3.63%, 8/15/19 - 2/15/20 | | | 10,400 | | | | 11,418 | | |
| | | | 41,038 | | |
| Total Fixed Income Securities (Cost $83,713) | | | 89,878 | | |
| | | Shares | | | |
| Short-Term Investments (3.7%) | |
| Investment Company (0.3%) | |
Morgan Stanley Institutional
Liquidity Funds — Money Market
Portfolio — Institutional Class (Note G) | | | 259,942 | | | | 260 | | |
| | | Face
Amount
(000) | | | |
| U.S. Treasury Securities (3.4%) | |
| U.S. Treasury Bills, | |
| 0.13%, 10/28/10 (d)(e)(f) | | $ | 520 | | | | 520 | | |
| 0.14%, 10/14/10 (d) | | | 1,000 | | | | 1,000 | | |
| 0.14%, 10/28/10 (d)(e)(f) | | | 540 | | | | 540 | | |
| 0.18%, 10/28/10 (d)(e)(f) | | | 50 | | | | 50 | | |
| 0.19%, 10/28/10 (d)(e)(f) | | | 50 | | | | 50 | | |
| 0.20%, 10/28/10 (d)(e)(f) | | | 958 | | | | 958 | | |
| | | | 3,118 | | |
| Total Short-Term Investments (Cost $3,378) | | | 3,378 | | |
| Total Investments (101.3%) (Cost $87,091) | | | 93,256 | | |
| Liabilities in Excess of Other Assets (-1.3%) | | | (1,239 | ) | |
| Net Assets (100.0%) | | $ | 92,017 | | |
(a) Variable/Floating Rate Security — Interest rate changes on these instruments are based on changes in a designated base rate. The rates shown are those in effect on September 30, 2010.
(b) 144A security — Certain conditions for public sale may exist. Unless otherwise noted, these securities are deemed to be liquid.
(c) Perpetual — Security does not have a predetermined maturity date. Rate for this security is fixed for a period of time then reverts to a floating rate. The interest shown is the rate in effect at September 30, 2010.
(d) Rate shown is the yield to maturity at September 30, 2010.
(e) All or a portion of the security was pledged as collateral for swap agreements.
(f) All or a portion of the security was pledged to cover margin requirements for futures contracts.
IO Interest Only
REMIC Real Estate Mortgage Investment Conduit
STRIPS Separate Trading of Registered Interest and Principal of Securities
Futures Contracts
The Portfolio had the following futures contract(s) open at period end:
| | | Number
of
Contracts | | Value
(000) | | Expiration
Date | | Net Unrealized
Appreciation
(Depreciation)
(000) | |
| Long: | |
U.S. Treasury
2 yr. Note | | | 48 | | | $ | 10,535 | | | Dec-10 | | $ | 2 | | |
U.S. Treasury
5 yr. Note | | | 70 | | | | 8,461 | | | Dec-10 | | | 64 | | |
| Short: | |
U.S. Treasury
10 yr. Note | | | (99 | ) | | | (12,479 | ) | | Dec-10 | | | (82 | ) | |
U.S. Treasury
30 yr. Bond | | | (55 | ) | | | (7,354 | ) | | Dec-10 | | | 27 | | |
| | | | | | | | | | | | | $ | 11 | | |
The accompanying notes are an integral part of the financial statements.
53
2010 Annual Report
September 30, 2010
Portfolio of Investments (cont'd)
Intermediate Duration Portfolio
Interest Rate Swap Agreements
The Portfolio had the following interest rate swap agreement(s) open at period end:
| Swap Counterparty | | Floating Rate
Index | | Pay/Receive
Floating Rate | | Fixed Rate | | Termination
Date | | Notional
Amount
(000) | | Unrealized
Appreciation
(Depreciation)
(000) | |
| Credit Suisse | | | 3 Month LIBOR | | | Receive | | | 2.63 | % | | | 3/11/15 | | | $ | 7,230 | | | $ | (415 | ) | |
Zero Coupon Swap Agreements
The Portfolio had the following zero coupon swap agreement(s) open at period end:
| Swap Counterparty | | Notional
Amount
(000) | | Floating
Rate Index | | Pay/Receive
Floating Rate | | Termination
Date | | Net Unrealized
Appreciation
(Depreciation)
(000) | |
| Barclays Capital | | $ | 2,960 | | | 3 Month LIBOR | | Receive | | 11/15/19 | | $ | (605 | ) | |
| Barclays Capital | | | 4,835 | | | 3 Month LIBOR | | Pay | | 11/15/19 | | | 189 | | |
| Deutsche Bank | | | 1,934 | | | 3 Month LIBOR | | Receive | | 11/15/21 | | | (379 | ) | |
| JPMorgan Chase | | | 1,354 | | | 3 Month LIBOR | | Receive | | 11/15/19 | | | (258 | ) | |
| JPMorgan Chase | | | 557 | | | 3 Month LIBOR | | Receive | | 11/15/21 | | | (123 | ) | |
| JPMorgan Chase | | | 215 | | | 3 Month LIBOR | | Receive | | 11/14/22 | | | (52 | ) | |
| | | | | | | | | | | | | $ | (1,228 | ) | |
LIBOR London Interbank Offered Rate
Fair Value Measurement Information:
The following is a summary of the inputs used to value the Portfolio's net assets as of September 30, 2010. (See Notes A-7 to the financial statements for further information regarding fair value measurement.)
| Investment Type | | Level 1
Quoted
prices
(000) | | Level 2
Other
significant
observable
inputs
(000) | | Level 3
Significant
unobservable
inputs
(000) | | Total
(000) | |
| Assets: | |
| Fixed Income Securities | |
Agency Bonds —
Banking (FDIC
Guaranteed) | | $ | — | | | $ | 8,600 | | | $ | — | | | $ | 8,600 | | |
Agency Fixed Rate
Mortgages | | | — | | | | 232 | | | | — | | | | 232 | | |
| Asset-Backed Securities | | | — | | | | 151 | | | | — | | | | 151 | | |
Collateralized Mortgage
Obligations -Agency | |
| Collateral Series | | | — | | | | 36 | | | | — | | | | 36 | | |
| Corporate Bonds | | | — | | | | 33,190 | | | | — | | | | 33,190 | | |
| Municipal Bonds | | | — | | | | 983 | | | | — | | | | 983 | | |
| Sovereign | | | — | | | | 691 | | | | — | | | | 691 | | |
| U.S. Agency Securities | | | — | | | | 4,957 | | | | — | | | | 4,957 | | |
| U.S. Treasury Securities | | | — | | | | 41,038 | | | | — | | | | 41,038 | | |
Total Fixed Income
Securities | | | — | | | | 89,878 | | | | — | | | | 89,878 | | |
Fair Value Measurement Information: (cont'd)
| Investment Type | | Level 1
Quoted
prices
(000) | | Level 2
Other
significant
observable
inputs
(000) | | Level 3
Significant
unobservable
inputs
(000) | | Total
(000) | |
Short-Term
Investments | |
| Investment Company | | $ | 260 | | | $ | — | | | $ | — | | | $ | 260 | | |
| U.S. Treasury Securities | | | — | | | | 3,118 | | | | — | | | | 3,118 | | |
Total Short-Term
Investments | | | 260 | | | | 3,118 | | | | — | | | | 3,378 | | |
| Futures Contracts | | | 93 | | | | — | | | | — | | | | 93 | | |
Zero Coupon Swap
Agreements | | | — | | | | 189 | | | | — | | | | 189 | | |
| Total Assets | | | 353 | | | | 93,185 | | | | — | | | | 93,538 | | |
| Liabilities: | |
| Futures Contracts | | | 82 | | | | — | | | | — | | | | 82 | | |
Interest Rate Swap
Agreements | | | — | | | | 415 | | | | — | | | | 415 | | |
Zero Coupon Swap
Agreements | | | — | | | | 1,417 | | | | — | | | | 1,417 | | |
| Total Liabilities | | | 82 | | | | 1,832 | | | | — | | | | 1,914 | | |
| Total | | $ | 271 | | | $ | 91,353 | | | $ | — | | | $ | 91,624 | | |
The accompanying notes are an integral part of the financial statements.
54
2010 Annual Report
September 30, 2010
Investment Overview (unaudited)
Investment Grade Fixed Income Portfolio
Performance
For the fiscal year ended September 30, 2010, the Portfolio's Class I had a total return based on net asset value and reinvestment of distributions per share of 8.65%, net of fees. The Portfolio's Class I outperformed against its benchmark the Barclays Capital U.S. Aggregate Index (the "Index") which returned 8.16%.
Factors Affecting Performance
• During much of the 12-month period, global sentiment was fragile and financial markets were volatile. Government bonds in most developed countries continued to be regarded as "safe haven" assets relative to sectors with greater credit risk. However, the debt of governments on the periphery of Europe continued to underperform those in other developed markets as investors fretted about their fiscal problems. Outside of these trouble spots, declining government bond yields in the rest of Europe and North America appeared to indicate a general reduction in investors' expectations for economic growth and inflation in those markets, while policy makers in emerging markets continued to adjust monetary policy to recognize economic strength.
• Amidst continued weakness in economic indicators, the Federal Open Market Committee (the "Fed") kept the federal funds target rate in the range of zero to 0.25%. The labor market continued to languish, with the unemployment rate at its highest level in many years, albeit declining in recent months. On the housing front, data remained dim, with some pockets of improvement.
• Investment-grade corporate debt posted positive returns during the period (as measured by the Barclays Capital Corporate Index), and among sectors, financials outpaced industrials and utilities. In mid-2010, the U.S. credit market was negatively affected by the European sovereign debt crisis. However, the outlook for the investment grade corporate debt sector remains favorable in our view — especially in industrials with strong balance sheets, sufficient liquidity, improving revenue growth and free cash flow.
• The agency mortgage-backed security (MBS) sector performed well during the period. The Fed's support of the agency MBS market ended in March; as expected, the Fed absorbed most of the supply of new MBS during the program's life, though the market remained stable after the withdrawal of the Fed's support. The MBS market also benefited from a lack of refinancing activity. Despite lower rates, refinancing applications did not pick up significantly during the period as tighter credit underwriting standards and lower home values stood in the way for most homeowners.
• The U.S. Treasury yield curve flattened during the period, with yields on 2-, 5-, 10-, and 30-year Treasuries declining by 44, 94, 71, and 31 basis points, respectively.
• The Portfolio's mortgage strategy bolstered performance. Earlier in the period, the Portfolio gained from our focus on bonds with coupons in the 4% to 5.5% range, which benefited strongly from the Fed's MBS purchase program. A move to higher coupon issues (those with coupons of 5.5% and above) was also favorable as prepayments remained low due to homeowner credit impairment, erosion of home equity, and tighter credit standards. Our decision to favor 30-year MBS over the 15-year sector was beneficial as longer-maturity issues outperformed during the period.
• The Portfolio's allocation to investment-grade credit was the main driver of performance. Within the corporate sector, overweights in the banking, food and beverage, insurance, and media sectors were additive to relative returns as significant spread tightening in these sectors led to their strong performance.
• Additionally, interest-rate positions contributed to performance. Throughout the period, we employed tactical strategies involving interest rate swaps that were designed to take advantage of anomalies across the swap curve. Similar to the Treasury curve, the swap curve shows the relationship of various maturities of swaps and their yields.
• An overweight to Build America Bonds detracted slightly from relative performance as the sector underperformed other taxable sectors.
Management Strategies
• The Portfolio began the period with an overweight to the MBS sector, and a focus within the sector on bonds with coupons in the 4% to 5.5% range, given our expectations for this portion of the MBS market to outperform as a result of the Fed's MBS purchase program. As MBS prices rose and the Fed's MBS purchase program came to an end, we took
55
2010 Annual Report
September 30, 2010
Investment Overview (unaudited) (cont'd)
Investment Grade Fixed Income Portfolio
profits and moved from an overweight in mortgage spread duration (a measure of risk exposure to a non-Treasury sector) to a neutral weighting. We also shifted the Portfolio's focus to higher-coupon issues.
• Throughout the period, the Portfolio was positioned with an overweight to investment-grade credit. We have a favorable view of the corporate debt sector and therefore we continue to maintain an overweight to this sector.
• With regard to interest rate strategy, the Portfolio was positioned to benefit from an anticipated flattening (or, reduction in the difference of yield spreads) between the two- and five-year segments of the yield curve. Once this flattening occurred in the third quarter of 2010, we took profits and unwound the position.
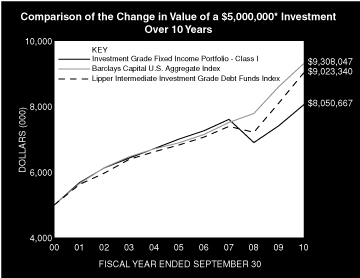
* Minimum Investment
In accordance with SEC regulations, the Portfolio's performance shown assumes that all recurring fees (including management fees) were deducted and all dividends and distributions were reinvested. The performance of Class P, Class H, and Class L shares will vary from the Class I shares based upon their different inception dates and will be negatively impacted by additional fees assessed to those classes.
Performance Compared to the Barclays Capital U.S. Aggregate Index(1) and the Lipper Intermediate Investment Grade Debt Funds Index(2)
| | | Total Returns(3) | |
| | | | | Average Annual | |
| | | One
Year | | Five
Years | | Ten
Years | | Since
Inception(8) | |
Portfolio — Class I
w/o sales charges(4) | | | 8.65 | % | | | 2.83 | % | | | 4.88 | % | | | 6.70 | % | |
Barclays Capital
U.S. Aggregate Index | | | 8.16 | | | | 6.20 | | | | 6.41 | | | | 7.24 | | |
Lipper Intermediate Investment
Grade Debt Funds Index | | | 11.33 | | | | 5.75 | | | | 6.08 | | | | 6.74 | | |
| | | Total Returns(3) | |
| | | | | Average Annual | |
| | | One
Year | | Five
Years | | Ten
Years | | Since
Inception(8) | |
Portfolio — Class P
w/o sales charges(5) | | | 8.50 | % | | | 2.68 | % | | | — | | | | 3.71 | % | |
Barclays Capital
U.S. Aggregate Index | | | 8.16 | | | | 6.20 | | | | — | | | | 5.90 | | |
Lipper Intermediate Investment
Grade Debt Funds Index | | | 11.33 | | | | 5.75 | | | | — | | | | 5.61 | | |
Portfolio — Class H
w/o sales charges(6) | | | 8.39 | | | | — | | | | — | | | | 0.31 | | |
Portfolio — Class H with maximum
3.50% sales charges(6) | | | 4.63 | | | | — | | | | — | | | | –0.97 | | |
Barclays Capital U.S.
Aggregate Index | | | 8.16 | | | | — | | | | — | | | | 6.73 | | |
Lipper Intermediate Investment
Grade Debt Funds Index | | | 11.33 | | | | — | | | | — | | | | 6.48 | | |
Portfolio — Class L
w/o sales charges(7) | | | 8.15 | | | | — | | | | — | | | | 4.39 | | |
Barclays Capital U.S.
Aggregate Index | | | 8.16 | | | | — | | | | — | | | | 8.46 | | |
Lipper Intermediate Investment
Grade Debt Funds Index | | | 11.33 | | | | — | | | | — | | | | 8.95 | | |
Performance data quoted represents past performance, which is no guarantee of future results, and current performance may be lower or higher than the figures shown. Performance assumes that all dividends and distributions, if any, were reinvested. For the most recent month-end performance figures, please visit www.morganstanley.com/im. Investment returns and principal value will fluctuate so that Portfolio shares, when redeemed, may be worth more or less than their original cost. Total returns do not reflect the deduction of taxes that a shareholder would pay on Portfolio distributions or the redemption of Portfolio shares. Performance of share classes will vary due to differences in sales charges and expenses.
(1) The Barclays Capital U.S. Aggregate Index tracks the performance of all U.S. government agency and Treasury securities, investment-grade corporate debt securities, agency mortgage-backed securities, asset-backed securities and commercial mortgage-backed securities. The Index is unmanaged and its returns do not include any sales charges or fees. Such costs would lower performance. It is not possible to invest directly in an index.
(2) The Lipper Intermediate Investment Grade Debt Funds Index is an equally weighted performance index of the largest qualifying funds (based on net assets) in the Lipper Intermediate Investment Grade Debt Funds classification. The Index, which is adjusted for capital gains distributions and income dividends, is unmanaged and should not be considered an investment. There are currently 30 funds represented in this Index. As of the date of this report, the Portfolio was in the Lipper Intermediate Investment Grade Debt Funds classification.
(3) Total returns for the Portfolio reflect expenses waived and/or reimbursed, if applicable, by the Adviser and Distributor. Without such waivers and/or reimbursements, total returns would have been lower. Fee waivers and/or reimbursements are voluntary and the Adviser and Distributor reserve the right to commence or terminate any waiver and/or reimbursement at any time.
(4) Commenced operations on August 31, 1990.
(5) Commenced operations on May 20, 2002.
(6) Commenced operations on January 2, 2008.
(7) Commenced operations on June 16, 2008.
(8) For comparative purposes, average annual listed for the Indexes refer to the inception date or initial offering of the respective share class of the Portfolio, not the inception of the Indexes.
56
2010 Annual Report
September 30, 2010
Investment Overview (unaudited) (cont'd)
Investment Grade Fixed Income Portfolio
Portfolio Composition*
| Classification | | Percentage of
Total Investments | |
| Agency Fixed Rate Mortgages | | | 26.9 | % | |
| U.S. Treasury Securities | | | 17.3 | | |
| Other** | | | 16.9 | | |
| Finance | | | 16.1 | | |
| Industrials | | | 11.5 | | |
| Short-Term Investments | | | 11.3 | | |
| Total Investments | | | 100.0 | % | |
* Percentages indicated are based upon total investments (excluding Securities held as collateral on Loaned Securities) as of September 30, 2010.
** Industries and/or investment types representing less than 5% of total investments.
57
2010 Annual Report
September 30, 2010
Portfolio of Investments
Investment Grade Fixed Income Portfolio
| | | Face
Amount
(000) | | Value
(000) | |
| Fixed Income Securities (99.1%) | |
| Agency Adjustable Rate Mortgages (2.3%) | |
| Federal Home Loan Mortgage Corp., | |
| Conventional Pools: | |
| 5.52%, 5/1/37 | | $ | 386 | | | $ | 411 | | |
| 5.92%, 12/1/36 | | | 280 | | | | 298 | | |
| 6.04%, 2/1/37 | | | 132 | | | | 140 | | |
| Federal National Mortgage Association, | |
| Conventional Pools: | |
| 2.60%, 7/1/35 | | | 238 | | | | 249 | | |
| 5.74%, 3/1/38 | | | 95 | | | | 101 | | |
| Government National Mortgage Association, | |
| Various Pools: | |
| 3.13%, 11/20/25 | | | 55 | | | | 56 | | |
| 3.38%, 2/20/25 - 2/20/28 | | | 654 | | | | 677 | | |
| 3.63%, 7/20/25 | | | 7 | | | | 7 | | |
| | | | 1,939 | | |
| Agency Fixed Rate Mortgages (30.0%) | |
| Federal Home Loan Mortgage Corp., | |
| Gold Pools: | |
| 5.00%, 10/1/35 - 6/1/40 | | | 1,136 | | | | 1,200 | | |
| 6.00%, 2/1/32 - 8/1/38 | | | 2,611 | | | | 2,806 | | |
| 6.50%, 7/1/25 - 3/1/32 | | | 136 | | | | 151 | | |
| 7.50%, 5/1/16 - 5/1/35 | | | 192 | | | | 214 | | |
| 8.00%, 8/1/32 | | | 53 | | | | 62 | | |
| 8.50%, 8/1/31 | | | 56 | | | | 66 | | |
| October TBA: | |
| 4.50%, 10/25/40 (a) | | | 475 | | | | 494 | | |
| Federal National Mortgage Association, | |
| Conventional Pools: | |
| 5.00%, 3/1/39 | | | 2,241 | | | | 2,376 | | |
| 5.50%, 1/1/36 - 8/1/38 | | | 5,213 | | | | 5,575 | | |
| 6.00%, 10/1/31 - 7/1/37 | | | 814 | | | | 877 | | |
| 6.03%, 10/25/40 | | | 200 | | | | 223 | | |
| 6.50%, 6/1/26 - 2/1/39 | | | 1,908 | | | | 2,104 | | |
| 7.00%, 10/1/28 - 6/1/32 | | | 101 | | | | 114 | | |
| 7.50%, 8/1/37 | | | 150 | | | | 171 | | |
| 8.00%, 2/1/12 - 4/1/33 | | | 119 | | | | 136 | | |
| 8.50%, 10/1/32 | | | 108 | | | | 126 | | |
| 11.25%, 8/1/13 | | | 5 | | | | 5 | | |
| November TBA: | |
| 4.50%, 11/25/40 (a) | | | 2,825 | | | | 2,936 | | |
| October TBA: | |
| 4.00%, 10/25/25 (a) | | | 425 | | | | 444 | | |
| Government National Mortgage Association, | |
| November TBA: | |
| 4.00%, 11/25/40 (a) | | | 3,225 | | | | 3,325 | | |
| 4.50%, 11/25/40 (a) | | | 1,325 | | | | 1,391 | | |
| Various Pools: | |
| 4.50%, 5/15/40 | | | 851 | | | | 897 | | |
| | | | 25,693 | | |
| | | Face
Amount
(000) | | Value
(000) | |
| Asset-Backed Securities (1.3%) | |
| Ally Master Owner Trust | |
| 2.88%, 4/15/15 (b) | | $ | 250 | | | $ | 258 | | |
| ARI Fleet Lease Trust | |
| 1.71%, 8/15/18 (b)(c) | | | 134 | | | | 134 | | |
| Brazos Student Finance Corp. | |
| 1.19%, 6/25/35 (c) | | | 82 | | | | 82 | | |
| Chesapeake Funding LLC | |
| 2.26%, 12/15/20 (b)(c) | | | 175 | | | | 176 | | |
| GE Dealer Floorplan Master Note Trust | |
| 1.81%, 10/20/14 (b)(c) | | | 225 | | | | 229 | | |
| Missouri Higher Education Loan Authority | |
| 1.17%, 8/27/29 (c) | | | 146 | | | | 146 | | |
| Residential Asset Securities Corp. | |
| 0.37%, 4/25/37 (c) | | | 61 | | | | 60 | | |
| | | | 1,085 | | |
| Collateralized Mortgage Obligations — Agency Collateral Series (1.0%) | |
| Federal Home Loan Mortgage Corp., | |
| IO STRIPS | |
| 7.49%, 5/15/36 (c) | | | 1,457 | | | | 234 | | |
| 8.00%, 1/1/28 | | | 38 | | | | 9 | | |
| PAC REMIC | |
| 10.00%, 6/15/20 | | | 4 | | | | 5 | | |
| Federal National Mortgage Association, | |
| IO REMIC | |
| 6.44%, 2/25/24 (c) | | | 862 | | | | 96 | | |
| REMIC | |
| 7.00%, 9/25/32 | | | 233 | | | | 271 | | |
| Goverment National Mortgage Association, | |
| IO STRIPS | |
| 5.79%, 9/20/40 (a) | | | 1,700 | | | | 260 | | |
| | | | 875 | | |
| Commercial Mortgage Backed Securities (3.5%) | |
| Citigroup Commercial Mortgage Trust, (Note G) | |
| 5.43%, 10/15/49 | | | 340 | | | | 368 | | |
| 5.89%, 12/10/49 (c) | | | 456 | | | | 489 | | |
| 5.92%, 3/15/49 (c) | | | 493 | | | | 546 | | |
| Greenwich Capital Commercial Funding Corp. | |
| 5.44%, 3/10/39 | | | 320 | | | | 338 | | |
| GS Mortgage Securities Corp. II | |
| 5.55%, 4/10/38 (c) | | | 230 | | | | 248 | | |
| LB-UBS Commercial Mortgage Trust, | |
| 5.16%, 2/15/31 | | | 554 | | | | 603 | | |
| 5.37%, 9/15/39 | | | 400 | | | | 436 | | |
| | | | 3,028 | | |
| Corporate Bonds (34.6%) | |
| Finance (17.9%) | |
| Abbey National Treasury Services PLC | |
| 3.88%, 11/10/14 (b) | | | 146 | | | | 150 | | |
| Aegon N.V. | |
| 4.63%, 12/1/15 (d) | | | 200 | | | | 213 | | |
The accompanying notes are an integral part of the financial statements.
58
2010 Annual Report
September 30, 2010
Portfolio of Investments (cont'd)
Investment Grade Fixed Income Portfolio
| | | Face
Amount
(000) | | Value
(000) | |
| Finance (cont'd) | |
| AIG SunAmerica Global Financing VI | |
| 6.30%, 5/10/11 (b) | | $ | 323 | | | $ | 331 | | |
| American Express Co. | |
| 8.13%, 5/20/19 | | | 187 | | | | 242 | | |
| American Express Credit Corp. | |
| 7.30%, 8/20/13 (d) | | | 68 | | | | 78 | | |
| Bank of America Corp., | |
| 5.63%, 7/1/20 (d) | | | 260 | | | | 275 | | |
| 5.75%, 12/1/17 | | | 465 | | | | 498 | | |
| Barclays Bank PLC | |
| 6.75%, 5/22/19 (d) | | | 296 | | | | 352 | | |
| Bear Stearns Cos. LLC (The) | |
| 6.40%, 10/2/17 | | | 395 | | | | 461 | | |
| Boston Properties LP | |
| 5.88%, 10/15/19 (d) | | | 50 | | | | 56 | | |
| Brookfield Asset Management, Inc., | |
| 5.80%, 4/25/17 | | | 129 | | | | 136 | | |
| 7.13%, 6/15/12 | | | 230 | | | | 247 | | |
| Capital One Bank, USA NA | |
| 8.80%, 7/15/19 | | | 285 | | | | 365 | | |
| Catlin Insurance Co., Ltd. | |
| 7.25%, (b)(c)(e) | | | 170 | | | | 139 | | |
| Citigroup, Inc., (Note G) | |
| 6.13%, 11/21/17 | | | 390 | | | | 427 | | |
| 8.50%, 5/22/19 | | | 261 | | | | 323 | | |
| Commonwealth Bank of Australia | |
| 5.00%, 10/15/19 (b)(d) | | | 167 | | | | 181 | | |
| Credit Agricole SA | |
| 3.50%, 4/13/15 (b) | | | 320 | | | | 330 | | |
| Credit Suisse AG | |
| 5.40%, 1/14/20 (d) | | | 175 | | | | 187 | | |
| Credit Suisse, New York, | |
| 5.30%, 8/13/19 | | | 190 | | | | 211 | | |
| 6.00%, 2/15/18 | | | 61 | | | | 67 | | |
| Duke Realty LP | |
| 6.75%, 3/15/20 (d) | | | 175 | | | | 196 | | |
| Farmers Exchange Capital | |
| 7.05%, 7/15/28 (b) | | | 425 | | | | 421 | | |
| General Electric Capital Corp., | |
| 5.63%, 5/1/18 (d) | | | 410 | | | | 456 | | |
| 6.00%, 8/7/19 (d) | | | 361 | | | | 407 | | |
| Goldman Sachs Group, Inc. (The), | |
| 6.15%, 4/1/18 (d) | | | 550 | | | | 611 | | |
| 7.50%, 2/15/19 | | | 120 | | | | 143 | | |
| Hartford Financial Services Group, Inc. | |
| 5.50%, 3/30/20 (d) | | | 200 | | | | 204 | | |
| HBOS PLC | |
| 6.75%, 5/21/18 (b) | | | 357 | | | | 359 | | |
| ING Bank NV | |
| 3.00%, 9/1/15 (b)(d) | | | 130 | | | | 130 | | |
| Intesa Sanpaolo SpA | |
| 3.63%, 8/12/15 (b) | | | 110 | | | | 111 | | |
| | | Face
Amount
(000) | | Value
(000) | |
| JPMorgan Chase & Co., | |
| 3.40%, 6/24/15 (d) | | $ | 65 | | | $ | 68 | | |
| 4.95%, 3/25/20 | | | 70 | | | | 75 | | |
| Merrill Lynch & Co., Inc. | |
| 6.88%, 4/25/18 | | | 67 | | | | 75 | | |
| MetLife, Inc. | |
| 7.72%, 2/15/19 (d) | | | 163 | | | | 208 | | |
| NASDAQ OMX Group, Inc. (The) | |
| 5.55%, 1/15/20 | | | 190 | | | | 202 | | |
| Nationwide Building Society | |
| 6.25%, 2/25/20 (b) | | | 385 | | | | 425 | | |
| Pacific LifeCorp | |
| 6.00%, 2/10/20 (b) | | | 150 | | | | 162 | | |
| Platinum Underwriters Finance, Inc. | |
| 7.50%, 6/1/17 | | | 134 | | | | 148 | | |
| PNC Funding Corp., | |
| 5.13%, 2/8/20 | | | 180 | | | | 195 | | |
| 6.70%, 6/10/19 | | | 150 | | | | 178 | | |
| Principal Financial Group, Inc. | |
| 8.88%, 5/15/19 (d) | | | 167 | | | | 220 | | |
| Prudential Financial, Inc., | |
| 4.75%, 9/17/15 (d) | | | 194 | | | | 210 | | |
| 7.38%, 6/15/19 | | | 100 | | | | 122 | | |
| Rabobank Nederland N.V. | |
| 4.75%, 1/15/20 (b) | | | 365 | | | | 400 | | |
| Reinsurance Group of America, Inc. | |
| 6.45%, 11/15/19 | | | 136 | | | | 151 | | |
| Royal Bank of Scotland PLC (The) | |
| 4.88%, 3/16/15 (d) | | | 325 | | | | 342 | | |
| Santander US Debt SA Unipersonal | |
| 3.72%, 1/20/15 (b)(d) | | | 200 | | | | 203 | | |
| Simon Property Group LP | |
| 5.65%, 2/1/20 | | | 25 | | | | 28 | | |
| Societe Generale | |
| 3.10%, 9/14/15 (b)(d) | | | 130 | | | | 131 | | |
| Standard Chartered Bank | |
| 6.40%, 9/26/17 (b) | | | 100 | | | | 112 | | |
| Standard Chartered PLC | |
| 3.85%, 4/27/15 (b) | | | 200 | | | | 209 | | |
| Svenska Handelsbanken AB | |
| 5.13%, 3/30/20 (b)(d) | | | 185 | | | | 203 | | |
| UBS AG/Stamford CT | |
| 3.88%, 1/15/15 (d) | | | 255 | | | | 266 | | |
| UnitedHealth Group, Inc. | |
| 6.63%, 11/15/37 | | | 225 | | | | 263 | | |
| US Bank NA | |
| 3.78%, 4/29/20 (c)(d) | | | 275 | | | | 287 | | |
US Central Federal Credit Union (U.S.
Government Guaranteed) | |
| 1.90%, 10/19/12 (d) | | | 986 | | | | 1,012 | | |
WEA Finance LLC/WT Finance Australia
Property Ltd. | |
| 6.75%, 9/2/19 (b) | | | 204 | | | | 242 | | |
The accompanying notes are an integral part of the financial statements.
59
2010 Annual Report
September 30, 2010
Portfolio of Investments (cont'd)
Investment Grade Fixed Income Portfolio
| | | Face
Amount
(000) | | Value
(000) | |
| Finance (cont'd) | |
| WellPoint, Inc. | |
| 6.38%, 6/15/37 | | $ | 325 | | | $ | 364 | | |
| Wells Fargo & Co. | |
| 5.63%, 12/11/17 | | | 342 | | | | 390 | | |
| Westpac Banking Corp. | |
| 3.00%, 8/4/15 | | | 165 | | | | 169 | | |
| | | | 15,367 | | |
| Industrials (12.9%) | |
| Agilent Technologies, Inc. | |
| 5.50%, 9/14/15 | | | 126 | | | | 142 | | |
| Altria Group, Inc., | |
| 4.13%, 9/11/15 (d) | | | 115 | | | | 123 | | |
| 9.25%, 8/6/19 (d) | | | 88 | | | | 118 | | |
| Anglo American Capital PLC | |
| 9.38%, 4/8/19 (b)(d) | | | 210 | | | | 284 | | |
| Anheuser-Busch InBev Worldwide, Inc. | |
| 7.20%, 1/15/14 (b) | | | 184 | | | | 215 | | |
| ArcelorMittal | |
| 9.85%, 6/1/19 (d) | | | 109 | | | | 140 | | |
| AT&T, Inc., | |
| 6.30%, 1/15/38 (d) | | | 320 | | | | 363 | | |
| 6.55%, 2/15/39 (d) | | | 100 | | | | 117 | | |
| BAT International Finance PLC | |
| 9.50%, 11/15/18 (b) | | | 190 | | | | 259 | | |
| Bunge Ltd. Finance Corp. | |
| 8.50%, 6/15/19 | | | 99 | | | | 120 | | |
| Comcast Corp., | |
| 5.15%, 3/1/20 (d) | | | 110 | | | | 120 | | |
| 5.70%, 5/15/18 | | | 207 | | | | 237 | | |
| Cooper US, Inc. | |
| 5.25%, 11/15/12 (d) | | | 139 | | | | 151 | | |
| Corning, Inc. | |
| 7.25%, 8/15/36 | | | 90 | | | | 109 | | |
| COX Communications, Inc. | |
| 8.38%, 3/1/39 (b)(d) | | | 36 | | | | 48 | | |
| CSX Corp. | |
| 6.15%, 5/1/37 (d) | | | 90 | | | | 103 | | |
| CVS Pass-Through Trust, | |
| 6.04%, 12/10/28 | | | 203 | | | | 216 | | |
| 8.35%, 7/10/31 (b) | | | 147 | | | | 183 | | |
| Daimler Finance North America LLC, | |
| 7.30%, 1/15/12 (d) | | | 163 | | | | 175 | | |
| 8.50%, 1/18/31 (d) | | | 71 | | | | 98 | | |
| Darden Restaurants, Inc. | |
| 6.20%, 10/15/17 | | | 235 | | | | 275 | | |
DirecTV Holdings LLC/DirecTV
Financing Co., Inc., | |
| 5.88%, 10/1/19 | | | 122 | | | | 139 | | |
| 7.63%, 5/15/16 | | | 18 | | | | 20 | | |
| FBG Finance Ltd. | |
| 5.13%, 6/15/15 (b) | | | 71 | | | | 78 | | |
| | | Face
Amount
(000) | | Value
(000) | |
| Genzyme Corp. | |
| 3.63%, 6/15/15 (b) | | $ | 125 | | | $ | 133 | | |
| Grupo Bimbo SAB de CV | |
| 4.88%, 6/30/20 (b)(d) | | | 125 | | | | 131 | | |
| Harley-Davidson Funding Corp. | |
| 6.80%, 6/15/18 (b) | | | 170 | | | | 185 | | |
| Holcim US Finance Sarl & Cie SCS | |
| 6.00%, 12/30/19 (b) | | | 82 | | | | 90 | | |
| Home Depot, Inc. | |
| 5.88%, 12/16/36 (d) | | | 197 | | | | 211 | | |
| KLA-Tencor Corp. | |
| 6.90%, 5/1/18 | | | 116 | | | | 133 | | |
| Kraft Foods, Inc. | |
| 5.38%, 2/10/20 (d) | | | 350 | | | | 392 | | |
| L-3 Communications Corp. | |
| 4.75%, 7/15/20 (d) | | | 180 | | | | 189 | | |
| Medco Health Solutions, Inc. | |
| 7.13%, 3/15/18 | | | 138 | | | | 170 | | |
| Mosaic Co. (The) | |
| 7.63%, 12/1/16 (b) | | | 245 | | | | 266 | | |
| NBC Universal, Inc. | |
| 5.15%, 4/30/20 (b) | | | 150 | | | | 162 | | |
| News America, Inc. | |
| 7.85%, 3/1/39 | | | 218 | | | | 279 | | |
| Nissan Motor Acceptance Corp. | |
| 4.50%, 1/30/15 (b) | | | 85 | | | | 90 | | |
| Omnicom Group, Inc. | |
| 4.45%, 8/15/20 | | | 130 | | | | 134 | | |
| Petrobras International Finance Co. | |
| 5.75%, 1/20/20 (d) | | | 180 | | | | 200 | | |
| Potash Corp. of Saskatchewan, Inc. | |
| 5.88%, 12/1/36 | | | 75 | | | | 78 | | |
| Quest Diagnostics, Inc. | |
| 6.95%, 7/1/37 | | | 230 | | | | 265 | | |
| Rio Tinto Finance USA Ltd. | |
| 9.00%, 5/1/19 (d) | | | 286 | | | | 400 | | |
| Ryder System, Inc., | |
| 5.85%, 11/1/16 | | | 65 | | | | 73 | | |
| 7.20%, 9/1/15 | | | 70 | | | | 82 | | |
| Southern Copper Corp., | |
| 5.38%, 4/16/20 | | | 45 | | | | 48 | | |
| 6.75%, 4/16/40 (d) | | | 70 | | | | 77 | | |
| Systems 2001 Asset Trust LLC | |
| 6.66%, 9/15/13 (b) | | | 282 | | | | 311 | | |
| Telecom Italia Capital SA, | |
| 7.00%, 6/4/18 | | | 112 | | | | 129 | | |
| 7.18%, 6/18/19 (d) | | | 84 | | | | 99 | | |
| Telefonica Europe BV | |
| 8.25%, 9/15/30 (d) | | | 184 | | | | 243 | | |
Teva Pharmaceutical Finance II BV/Teva
Pharmaceutical Finance III LLC | |
| 3.00%, 6/15/15 | | | 170 | | | | 178 | | |
The accompanying notes are an integral part of the financial statements.
60
2010 Annual Report
September 30, 2010
Portfolio of Investments (cont'd)
Investment Grade Fixed Income Portfolio
| | | Face
Amount
(000) | | Value
(000) | |
| Industrials (cont'd) | |
| Time Warner Cable, Inc., | |
| 6.75%, 6/15/39 (d) | | $ | 80 | | | $ | 93 | | |
| 8.25%, 4/1/19 | | | 89 | | | | 115 | | |
| Time Warner, Inc. | |
| 7.70%, 5/1/32 (d) | | | 184 | | | | 231 | | |
| Tyco Electronics Group SA | |
| 5.95%, 1/15/14 | | | 357 | | | | 398 | | |
| Vale Overseas Ltd., | |
| 5.63%, 9/15/19 (d) | | | 116 | | | | 128 | | |
| 6.88%, 11/10/39 | | | 21 | | | | 24 | | |
| Verizon Communications, Inc. | |
| 6.35%, 4/1/19 (d) | | | 354 | | | | 433 | | |
| Viacom, Inc. | |
| 6.88%, 4/30/36 | | | 126 | | | | 148 | | |
| Vivendi SA | |
| 6.63%, 4/4/18 (b) | | | 102 | | | | 119 | | |
| Weatherford International Ltd. | |
| 9.63%, 3/1/19 (d) | | | 185 | | | | 242 | | |
| Woolworths Ltd. | |
| 4.00%, 9/22/20 (b) | | | 140 | | | | 143 | | |
| WPP Finance UK | |
| 8.00%, 9/15/14 | | | 136 | | | | 162 | | |
| Xerox Corp., | |
| 5.63%, 12/15/19 | | | 40 | | | | 45 | | |
| 6.35%, 5/15/18 (d) | | | 43 | | | | 50 | | |
| Yum! Brands, Inc. | |
| 5.30%, 9/15/19 | | | 105 | | | | 117 | | |
| | | | 11,029 | | |
| Utilities (3.8%) | |
| CenterPoint Energy Resources Corp. | |
| 6.25%, 2/1/37 | | | 153 | | | | 173 | | |
| EDF SA | |
| 4.60%, 1/27/20 (b)(d) | | | 90 | | | | 98 | | |
| Enel Finance International SA | |
| 5.13%, 10/7/19 (b) | | | 300 | | | | 319 | | |
| Energy Transfer Partners LP | |
| 9.00%, 4/15/19 | | | 150 | | | | 193 | | |
| Enterprise Products Operating LLC | |
| 6.50%, 1/31/19 | | | 269 | | | | 314 | | |
| Exelon Generation Co. LLC | |
| 6.25%, 10/1/39 (d) | | | 350 | | | | 376 | | |
| FirstEnergy Solutions Corp. | |
| 6.05%, 8/15/21 | | | 221 | | | | 237 | | |
| Iberdrola Finance Ireland Ltd. | |
| 5.00%, 9/11/19 (b) | | | 175 | | | | 175 | | |
| Kinder Morgan Energy Partners LP | |
| 5.95%, 2/15/18 | | | 450 | | | | 509 | | |
| Nisource Finance Corp., | |
| 6.13%, 3/1/22 (d) | | | 100 | | | | 113 | | |
| 6.80%, 1/15/19 | | | 180 | | | | 214 | | |
| | | Face
Amount
(000) | | Value
(000) | |
| Plains All American Pipeline LP / PAA Finance Corp. | |
| 6.70%, 5/15/36 (d) | | $ | 306 | | | $ | 335 | | |
| PPL Energy Supply LLC | |
| 6.30%, 7/15/13 | | | 180 | | | | 201 | | |
| | | | 3,257 | | |
| | | | 29,653 | | |
| Municipal Bonds (1.3%) | |
| Chicago Transit Authority | |
| 6.20%, 12/1/40 | | | 110 | | | | 112 | | |
| City of Chicago | |
| 6.40%, 1/1/40 | | | 40 | | | | 43 | | |
| City of New York | |
| 5.97%, 3/1/36 | | | 95 | | | | 103 | | |
| Illinois State Toll Highway Authority | |
| 6.18%, 1/1/34 | | | 231 | | | | 248 | | |
| Municipal Electric Authority of Georgia, | |
| 6.64%, 4/1/57 | | | 95 | | | | 102 | | |
| 6.66%, 4/1/57 | | | 175 | | | | 185 | | |
| New York City Transitional Finance Authority | |
| 5.27%, 5/1/27 | | | 90 | | | | 98 | | |
| State of California, General Obligation Bonds | |
| 5.95%, 4/1/16 | | | 195 | | | | 215 | | |
| | | | 1,106 | | |
| Sovereign (0.8%) | |
| Bermuda Government International Bond | |
| 5.60%, 7/20/20 (b) | | | 125 | | | | 135 | | |
| Export - Import Bank of Korea | |
| 4.13%, 9/9/15 | | | 100 | | | | 105 | | |
| Federative Republic of Brazil | |
| 6.00%, 1/17/17 | | | 289 | | | | 338 | | |
| Korea Development Bank | |
| 4.38%, 8/10/15 (d) | | | 140 | | | | 149 | | |
| | | | 727 | | |
| U.S. Agency Securities (4.9%) | |
| Federal Home Loan Mortgage Corp., | |
| 2.88%, 2/9/15 | | | 300 | | | | 320 | | |
| 4.88%, 6/13/18 | | | 1,360 | | | | 1,600 | | |
| Federal National Mortgage Association, | |
| 1.25%, 8/20/13 | | | 800 | | | | 810 | | |
| 2.50%, 5/15/14 | | | 1,360 | | | | 1,429 | | |
| | | | 4,159 | | |
| U.S. Treasury Securities (19.4%) | |
| U.S. Treasury Bonds, | |
| 4.38%, 11/15/39 | | | 1,810 | | | | 2,031 | | |
| 4.63%, 2/15/40 (d) | | | 550 | | | | 643 | | |
| 7.50%, 11/15/24 | | | 2,775 | | | | 4,207 | | |
| U.S. Treasury Notes, | |
| 1.75%, 3/31/14 | | | 1,000 | | | | 1,033 | | |
| 2.25%, 1/31/15 | | | 1,070 | | | | 1,123 | | |
| 2.63%, 12/31/14 | | | 1,180 | | | | 1,257 | | |
| 3.00%, 9/30/16 (d) | | | 1,156 | | | | 1,247 | | |
The accompanying notes are an integral part of the financial statements.
61
2010 Annual Report
September 30, 2010
Portfolio of Investments (cont'd)
Investment Grade Fixed Income Portfolio
| | | Face
Amount
(000) | | Value
(000) | |
| U.S. Treasury Securities (cont'd) | |
| 3.25%, 12/31/16 | | $ | 1,500 | | | $ | 1,637 | | |
| 3.63%, 8/15/19 | | | 3,110 | | | | 3,420 | | |
| | | | 16,598 | | |
| Total Fixed Income Securities (Cost $79,459) | | | 84,863 | | |
| | | Shares | | | |
| Short-Term Investments (24.3%) | |
| Securities held as Collateral on Loaned Securities (11.7%) | |
| Investment Company (10.2%) | |
Morgan Stanley Institutional
Liquidity Funds — Money Market
Portfolio — Institutional Class (Note G) | | | 8,764,058 | | | | 8,764 | | |
| | | Face
Amount
(000) | | | |
| Repurchase Agreements (1.5%) | |
Bank of America Securities, LLC, (0.32%, dated
9/30/10, due 10/1/10; proceeds $577;
fully collateralized by U.S. Government
Agency at the date of this Portfolio of
Investments as follows: Federal National
Mortgage Association; 4.50% due 9/1/40;
valued at $589) | | $ | 577 | | | | 577 | | |
Barclays Capital, Inc., (0.25%, dated 9/30/10,
due 10/1/10; proceeds $657; fully
collateralized by a U.S. Treasury Security at
the date of this Portfolio of Investments as
follows: U.S. Treasury Bond; 8.50% due
2/15/20; valued at $670) | | | 657 | | | | 657 | | |
| | | | 1,234 | | |
Total Securities held as Collateral on
Loaned Securities (Cost $9,998) | | | 9,998 | | |
| | | Shares | | | |
| Investment Company (2.3%) | |
Morgan Stanley Institutional
Liquidity Funds — Money Market
Portfolio — Institutional Class (Note G) | | | 1,990,144 | | | | 1,990 | | |
| | | Face
Amount
(000) | | | |
| U.S. Treasury Securities (10.3%) | |
| U.S. Treasury Bills, | |
| 0.13%, 10/28/10 (f)(g)(h) | | $ | 790 | | | | 790 | | |
| 0.19%, 1/13/11 (d)(f) | | | 3,000 | | | | 2,998 | | |
| 0.20%, 10/28/10 (f)(g)(h) | | | 535 | | | | 535 | | |
| 0.25%, 2/10/11 (f) | | | 4,500 | | | | 4,496 | | |
| | | | 8,819 | | |
| Total Short-Term Investments (Cost $20,807) | | | 20,807 | | |
Total Investments (123.4%) (Cost $100,266)
Including $14,083 of Securities Loaned | | | 105,670 | | |
| Liabilities in Excess of Other Assets (-23.4%) | | | (20,065 | ) | |
| Net Assets (100.0%) | | $ | 85,605 | | |
(a) Security is subject to delayed delivery.
(b) 144A security — Certain conditions for public sale may exist. Unless otherwise noted, these securities are deemed to be liquid.
(c) Variable/Floating Rate Security — Interest rate changes on these instruments are based on changes in a designated base rate. The rates shown are those in effect on September 30, 2010.
(d) All or a portion of security on loan at September 30, 2010.
(e) Perpetual — Security does not have a predetermined maturity date. Rate for this security is fixed for a period of time then reverts to a floating rate. The interest shown is the rate in effect at September 30, 2010.
(f) Rate shown is the yield to maturity at September 30, 2010.
(g) All or a portion of the security was pledged as collateral for swap agreements.
(h) All or a portion of the security was pledged to cover margin requirements for futures contracts.
IO Interest Only
PAC Planned Amortization Class
REMIC Real Estate Mortgage Investment Conduit
STRIPS Separate Trading of Registered Interest and Principal of Securities
Futures Contracts
The Portfolio had the following futures contract(s) open at period end:
| | | Number
of
Contracts | | Value
(000) | | Expiration
Date | | Net Unrealized
Appreciation
(Depreciation)
(000) | |
| Long: | |
U.S. Treasury
2 yr. Note | | | 22 | | | $ | 4,829 | | | Dec-10 | | $ | 1 | | |
U.S. Treasury
5 yr. Note | | | 72 | | | | 8,702 | | | Dec-10 | | | 66 | | |
| Short: | |
U.S. Treasury
10 yr. Note | | | (97 | ) | | | (12,227 | ) | | Dec-10 | | | (64 | ) | |
U.S. Treasury
30 yr. Bond | | | (14 | ) | | | (1,872 | ) | | Dec-10 | | | 7 | | |
| | | | | | | | | | | | | $ | 10 | | |
The accompanying notes are an integral part of the financial statements.
62
2010 Annual Report
September 30, 2010
Portfolio of Investments (cont'd)
Investment Grade Fixed Income Portfolio
Credit Default Swap Agreements
The Portfolio had the following credit default swap agreement(s) open at period end:
| Swap Counterparty and Reference Obligation | | Buy/Sell
Protection | | Notional
Amount
(000) | | Pay/Receive
Fixed Rate | | Termination
Date | | Upfront
Payment
Paid
(000) | | Unrealized
Appreciation
(Depreciation)
(000) | | Credit
Rating of
Reference
Obligation† | |
Bank of America
Tyco Electronics Ltd., 6.00%, 10/1/12 | | Buy | | $ | 425 | | | | 5.00 | % | | | 6/20/14 | | | $ | 13 | | | $ | (53 | ) | | BBB | |
† Credit Rating as issued by Standard and Poor's.
Interest Rate Swap Agreements
The Portfolio had the following interest rate swap agreement(s) open at period end:
| Swap Counterparty | | Floating Rate
Index | | Pay/Receive
Floating Rate | | Fixed Rate | | Termination
Date | | Notional
Amount
(000) | | Unrealized
Appreciation
(Depreciation)
(000) | |
| Credit Suisse | | | 3 Month LIBOR | | | Receive | | | 2.63 | % | | | 3/11/15 | | | $ | 6,468 | | | $ | (371 | ) | |
Zero Coupon Swap Agreements
The Portfolio had the following zero coupon swap agreement(s) open at period end:
| Swap Counterparty | | Notional
Amount
(000) | | Floating
Rate Index | | Pay/Receive
Floating Rate | | Termination
Date | | Unrealized
Appreciation
(Depreciation)
(000) | |
| Barclays Capital | | $ | 2,605 | | | 3 Month LIBOR | | Receive | | 11/15/19 | | $ | (533 | ) | |
| JP Morgan Chase | | | 686 | | | 3 Month LIBOR | | Receive | | 5/15/21 | | | (160 | ) | |
| | | | | | | | | | | $ | (693 | ) | |
LIBOR London Interbank Offered Rate
Fair Value Measurement Information:
The following is a summary of the inputs used to value the Portfolio's net assets as of September 30, 2010. (See Note A-7 to the financial statements for further information regarding fair value measurement.)
| Investment Type | | Level 1
Quoted
prices
(000) | | Level 2
Other
significant
observable
inputs
(000) | | Level 3
Significant
unobservable
inputs
(000) | | Total
(000) | |
| Assets: | |
Fixed Income
Securities | |
Agency Adjustable
Rate Mortgages | | $ | — | | | $ | 1,939 | | | $ | — | | | $ | 1,939 | | |
Agency Fixed Rate
Mortgages | | | — | | | | 25,693 | | | | — | | | | 25,693 | | |
| Asset-Backed Securities | | | — | | | | 1,085 | | | | — | | | | 1,085 | | |
Collateralized Mortgage
Obligations — Agency
Collateral Series | | | — | | | | 875 | | | | — | | | | 875 | | |
Commercial Mortgage
Backed Securities | | | — | | | | 3,028 | | | | — | | | | 3,028 | | |
| Corporate Bonds | | | — | | | | 29,653 | | | | — | | | | 29,653 | | |
| Municipal Bonds | | | — | | | | 1,106 | | | | — | | | | 1,106 | | |
| Sovereign | | | — | | | | 727 | | | | — | | | | 727 | | |
| U.S. Agency Securities | | | — | | | | 4,159 | | | | — | | | | 4,159 | | |
| U.S. Treasury Securities | | | — | | | | 16,598 | | | | — | | | | 16,598 | | |
Total Fixed Income
Securities | | | — | | | | 84,863 | | | | — | | | | 84,863 | | |
Fair Value Measurement Information: (cont'd)
| Investment Type | | Level 1
Quoted
prices
(000) | | Level 2
Other
significant
observable
inputs
(000) | | Level 3
Significant
unobservable
inputs
(000) | | Total
(000) | |
| Futures Contracts | | | 74 | | | | — | | | | — | | | | 74 | | |
| Short-Term Investments | |
| Investment Company | | | 10,754 | | | | — | | | | — | | | | 10,754 | | |
| Repurchase Agreements | | | — | | | | 1,234 | | | | — | | | | 1,234 | | |
| U.S. Treasury Securities | | | — | | | | 8,819 | | | | — | | | | 8,819 | | |
Total Short-Term
Investments | | | 10,754 | | | | 10,053 | | | | — | | | | 20,807 | | |
| Total Assets | | | 10,828 | | | | 94,916 | | | | — | | | | 105,744 | | |
| Liabilities: | |
| Futures Contracts | | | 64 | | | | — | | | | — | | | | 64 | | |
Credit Default Swap
Agreements | | | — | | | | 53 | | | | — | | | | 53 | | |
Interest Rate Swap
Agreements | | | — | | | | 371 | | | | — | | | | 371 | | |
Zero Coupon Swap
Agreements | | | — | | | | 693 | | | | — | | | | 693 | | |
| Total Liabilities | | | 64 | | | | 1,117 | | | | — | | | | 1,181 | | |
| Total | | $ | 10,764 | | | $ | 93,799 | | | $ | — | | | $ | 104,563 | | |
The accompanying notes are an integral part of the financial statements.
63
2010 Annual Report
September 30, 2010
Portfolio of Investments (cont'd)
Investment Grade Fixed Income Portfolio
Fair Value Measurement Information: (cont'd)
The following is a reconciliation of investments in which significant unobservable inputs (Level 3) were used in determining value:
| | | Fixed Income
Securities
(000) | |
| Balance as of 9/30/09 | | $ | — | @ | |
| Accrued discounts/premiums | | | — | | |
| Realized gain (loss) | | | — | @ | |
| Change in unrealized appreciation (depreciation) | | | — | @ | |
| Net purchases (sales) | | | (— | )@ | |
| Transfers in for Level 3 | | | — | | |
| Transfers out of Level 3 | | | — | | |
| Balance as of 9/30/10 | | $ | — | | |
The amount of total gains (losses) for the period
included in earnings attributable to the change
in unrealized gains (losses) relating to assets
and liabilities still held at Level 3 at 9/30/10. | | $ | — | | |
@ Value is less than $500
The accompanying notes are an integral part of the financial statements.
64
2010 Annual Report
September 30, 2010
Investment Overview (unaudited)
Limited Duration Portfolio
Performance
For the fiscal year ended September 30, 2010, the Portfolio's Class I had a total return based on net asset value and reinvestment of distributions per share of 3.74%, net of fees. The Portfolio's Class I outperformed against its benchmark Citigroup 1-3 Year Treasury/Government Sponsored Index (the "Index") which returned 2.52%.
Factors Affecting Performance
• During much of the 12-month period, global sentiment was fragile and financial markets were volatile. Government bonds in most developed countries continued to be regarded as "safe haven" assets relative to sectors with greater credit risk. However, the debt of governments on the periphery of Europe continued to underperform those in other developed markets as investors continued to be concerned about their fiscal problems. Outside of these trouble spots, declining government bond yields in the rest of Europe and North America appeared to indicate a general reduction in investors' expectations for economic growth and inflation in those markets, while policy makers in emerging markets continued to adjust monetary policy to recognize economic strength.
• Amidst continued weakness in economic indicators, the Federal Open Market Committee (the "Fed") kept the federal funds target rate in the range of zero to 0.25%. The labor market has continued to languish, with the unemployment rate at its highest level in many years, albeit declining in recent months. On the housing front, data remain dim, with some pockets of improvement.
• Investment-grade corporate debt posted positive returns during the period (as measured by the Barclays Capital U.S. Corporate Index), and among sectors, financials outpaced industrials and utilities. In mid-2010, the U.S. credit market was negatively affected by the European sovereign debt crisis. However, the balance of supply and demand for debt in the investment grade corporate debt sector remains favorable in our view — especially in industrials with strong balance sheets, sufficient liquidity, improving revenue growth and free cash flow; and in financials, namely larger banks with improving asset bases and capital structures.
• The agency mortgage-backed security (MBS) sector performed well during the period. Despite lower rates, refinancing applications did not pick up significantly during the period as tighter credit underwriting standards and lower home values stood in the way for most homeowners.
• The U.S. Treasury yield curve flattened during the period, with yields on 2-, 5-, 10-, and 30-year Treasuries declining by 44, 94, 71, and 31 basis points, respectively.
• The Portfolio's position in investment-grade credit was beneficial to relative performance as short maturity credit spreads narrowed during the quarter. Within the corporate sector, the Portfolio's overweight to selected financial credits and non-financial names contributed to the Portfolio's outperformance.
• Additionally, some interest-rate positions contributed to performance. Throughout the period, we employed tactical strategies involving interest rate swaps that were designed to take advantage of anomalies our analysis identified across the swap curve. Similar to the Treasury curve, the swap curve shows the relationship of various maturities of swaps and their yields. These positions supported returns. We also positioned the portfolio to benefit from a flattening (or, a reduction in the difference between yields) in the two- to five-year section of the Treasury yield curve. This position was beneficial to performance.
• However, a duration underweight to the two-year sector of the yield curve detracted from performance as interest rates continued to tighten to historic lows.
Management Strategies
• Throughout the period, the Portfolio was positioned with an overweight to high-quality corporate bonds. While we adjusted exposure to individual names and sectors during the past12 months, as of the end of the period we continued to maintain an overweight position to the financial sector and selected non-financial names.
• The Portfolio also had an allocation to the asset-backed security (ABS) sector. Within the sector, the Portfolio held high-quality credit card, auto and equipment securities.
• During the second half of the period, the Portfolio was positioned to benefit from an anticipated
65
2010 Annual Report
September 30, 2010
Investment Overview (unaudited) (cont'd)
Limited Duration Portfolio
flattening (or, reduction in the difference of yield spreads) between the two- and five-year segments of the yield curve. Once this flattening occurred in the third quarter of 2010, we took profits and unwound the position.
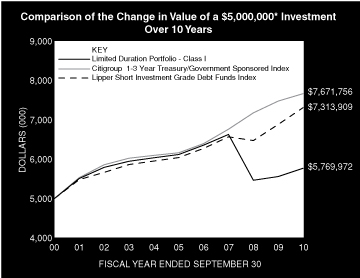
* Minimum Investment
In accordance with SEC regulations, the Portfolio's performance shown assumes that all recurring fees (including management fees) were deducted and all dividends and distributions were reinvested. The performance of Class P shares will vary from the Class I shares based upon their different inception dates and will be negatively impacted by additional fees assessed to that class.
Performance Compared to the Citigroup 1-3 Year Treasury/Government Sponsored Index(1) and the Lipper Short Investment Grade Debt Funds Index(2)
| | | Total Returns(3) | |
| | | | | Average Annual | |
| | | One
Year | | Five
Years | | Ten
Years | | Since
Inception(6) | |
Portfolio — Class I
w/o sales charges(4) | | | 3.74 | % | | | –1.18 | % | | | 1.44 | % | | | 3.41 | % | |
Citigroup 1-3 Year
Treasury/Government
Sponsored Index | | | 2.52 | | | | 4.48 | | | | 4.37 | | | | 5.05 | | |
Lipper Short Investment
Grade Debt Funds Index | | | 6.15 | | | | 3.89 | | | | 3.88 | | | | 4.71 | | |
Portfolio — Class P
w/o sales charges(5) | | | 3.48 | | | | — | | | | — | | | | –4.75 | | |
Citigroup 1-3 Year
Treasury/Government
Sponsored Index | | | 2.52 | | | | — | | | | — | | | | 4.26 | | |
Lipper Short Investment
Grade Debt Funds Index | | | 6.15 | | | | 3.89 | | | | 3.88 | | | | 3.62 | | |
Performance data quoted represents past performance, which is no guarantee of future results, and current performance may be lower or higher than the figures shown. Performance assumes that all dividends and distributions, if any, were reinvested. For the most recent month-end performance figures, please visit www.morganstanley.com/im. Investment returns and principal value will fluctuate so that Portfolio shares, when redeemed, may be worth more or less than their original cost. Total returns do not reflect the deduction of taxes that a shareholder would pay on Portfolio distributions or the redemption of Portfolio shares. Performance of share classes will vary due to differences in sales charges and expenses.
(1) The Citigroup 1-3 Year Treasury/Government Sponsored Index is a fixed income market-value weighted index that includes all U.S. Treasury and U.S. agency securities with remaining maturities of at least one year and not longer than three years. The Index is unmanaged and its returns do not include any sales charges or fees. Such costs would lower performance. It is not possible to invest directly in an index.
(2) The Lipper Short Investment Grade Debt Funds Index is an equally weighted performance index of the largest qualifying funds (based on net assets) in the Lipper Short Investment Grade Debt Funds classification. The Index, which is adjusted for capital gains distributions and income dividends, is unmanaged and should not be considered an investment. There are currently 30 funds represented in this Index. As of the date of this report, the Portfolio was in the Lipper Short Investment Grade Debt Funds classification.
(3) Total returns for the Portfolio reflect expenses waived and/or reimbursed, if applicable, by the Adviser. Without such waivers and/or reimbursements, total returns would have been lower. Fee waivers and/or reimbursements are voluntary and the Adviser reserves the right to commence or terminate any waiver and/or reimbursement at any time.
(4) Commenced operations on March 31, 1992.
(5) Commenced operations on September 28, 2007.
(6) For comparative purposes, average annual since inception returns listed for the Indexes refer to the inception date or initial offering of the share class of the Portfolio, not the inception of the Indexes.
Portfolio Composition
| Classification | | Percentage of
Total Investments | |
| Finance | | | 28.8 | % | |
| Asset-Backed Securities | | | 21.4 | | |
| Industrials | | | 19.8 | | |
| U.S. Treasury Securities | | | 8.9 | | |
| Other* | | | 7.3 | | |
| Non-U.S. Government — Guaranteed | | | 5.5 | | |
| Utilities | | | 5.3 | | |
| Short-Term Investments | | | 3.0 | | |
| Total Investments | | | 100.0 | % | |
* Industries and/or investment types representing less than 5% of total investments.
66
2010 Annual Report
September 30, 2010
Portfolio of Investments
Limited Duration Portfolio
| | | Face
Amount
(000) | | Value
(000) | |
| Fixed Income Securities (98.7%) | |
| Agency Adjustable Rate Mortgages (1.1%) | |
| Federal Home Loan Mortgage Corp., | |
| Conventional Pools: | |
| 5.52%, 1/1/38 | | $ | 429 | | | $ | 458 | | |
| 6.04%, 2/1/37 | | | 407 | | | | 432 | | |
| Federal National Mortgage Association, | |
| Conventional Pools: | |
| 2.61%, 5/1/35 | | | 1,035 | | | | 1,083 | | |
| 5.74%, 3/1/38 | | | 233 | | | | 248 | | |
| | | | 2,221 | | |
| Agency Bond — Banking (FDIC Guaranteed) (1.1%) | |
| FDIC Structured Sale Guaranteed Notes | |
| Zero Coupon, 10/25/11 (a)(b) | | | 2,300 | | | | 2,284 | | |
| Agency Fixed Rate Mortgages (0.9%) | |
| Federal Home Loan Mortgage Corp., | |
| Gold Pools: | |
| 6.50%, 9/1/19 - 11/1/29 | | | 21 | | | | 23 | | |
| 7.50%, 11/1/19 | | | 3 | | | | 3 | | |
| 12.00%, 6/1/15 | | | 10 | | | | 10 | | |
| Federal National Mortgage Association, | |
| Conventional Pools: | |
| 6.50%, 3/1/18 - 10/1/32 | | | 1,497 | | | | 1,670 | | |
| 7.00%, 7/1/29 - 12/1/33 | | | 75 | | | | 85 | | |
| Government National Mortgage Association, | |
| Various Pools: | |
| 9.00%, 11/15/16 - 12/15/16 | | | 53 | | | | 59 | | |
| | | | 1,850 | | |
| Asset-Backed Securities (21.8%) | |
| Ally Auto Receivables Trust | |
| 1.45%, 5/15/14 | | | 1,325 | | | | 1,339 | | |
| Ally Master Owner Trust, | |
| 2.01%, 1/15/15 (a)(b) | | | 275 | | | | 281 | | |
| 2.88%, 4/15/15 (a) | | | 650 | | | | 671 | | |
| American Express Credit Account Master Trust, | |
| 0.51%, 11/16/15 (b) | | | 1,200 | | | | 1,201 | | |
| 1.51%, 3/15/17 (b) | | | 2,325 | | | | 2,416 | | |
| ARI Fleet Lease Trust | |
| 1.71%, 8/15/18 (a)(b) | | | 655 | | | | 655 | | |
| Bank of America Auto Trust, | |
| 1.70%, 12/15/11 (a) | | | 397 | | | | 397 | | |
| 2.13%, 9/15/13 (a) | | | 1,600 | | | | 1,620 | | |
| BMW Floorplan Master Owner Trust | |
| 1.41%, 9/15/14 (a)(b) | | | 2,600 | | | | 2,634 | | |
| Capital One Multi-Asset Execution Trust | |
| 0.34%, 9/15/15 (b) | | | 1,355 | | | | 1,347 | | |
| Chase Issuance Trust | |
| 1.81%, 4/15/14 (b) | | | 1,600 | | | | 1,635 | | |
| Chesapeake Funding LLC | |
| 2.26%, 12/15/20 (a)(b) | | | 1,026 | | | | 1,035 | | |
| Citibank Credit Card Issuance Trust (Note G) | |
| 2.25%, 12/23/14 | | | 1,950 | | | | 2,007 | | |
| | | Face
Amount
(000) | | Value
(000) | |
| CNH Equipment Trust | |
| 1.54%, 7/15/14 | | $ | 2,175 | | | $ | 2,202 | | |
| Discover Card Master Trust | |
| 1.56%, 12/15/14 (b) | | | 3,000 | | | | 3,050 | | |
| Ford Credit Floorplan Master Owner Trust, | |
| 1.81%, 9/15/14 (b) | | | 2,600 | | | | 2,645 | | |
| 4.20%, 2/15/17 (a) | | | 1,150 | | | | 1,251 | | |
| GE Capital Credit Card Master Note Trust | |
| 2.36%, 4/15/15 (b) | | | 3,850 | | | | 3,947 | | |
| GE Equipment Midticket LLC | |
| 0.94%, 7/14/14 (a) | | | 1,200 | | | | 1,200 | | |
| Harley-Davidson Motorcycle Trust, | |
| 1.74%, 9/15/13 | | | 1,200 | | | | 1,210 | | |
| 1.87%, 2/15/14 | | | 1,400 | | | | 1,415 | | |
| Huntington Auto Trust | |
| 3.94%, 6/17/13 (a) | | | 2,177 | | | | 2,216 | | |
| MMAF Equipment Finance LLC | |
| 2.37%, 11/15/13 (a) | | | 1,350 | | | | 1,370 | | |
| MMCA Automobile Trust | |
| 1.39%, 1/15/14 (a) | | | 1,650 | | | | 1,659 | | |
| Navistar Financial Corp. Owner Trust | |
| 1.47%, 10/18/12 (a) | | | 2,225 | | | | 2,234 | | |
| Nissan Master Owner Trust Receivables | |
| 1.41%, 1/15/15 (a)(b) | | | 625 | | | | 635 | | |
| Volvo Financial Equipment LLC | |
| 1.06%, 6/15/12 (a) | | | 2,225 | | | | 2,230 | | |
| Wheels SPV LLC | |
| 1.81%, 3/15/18 (a)(b) | | | 978 | | | | 985 | | |
| | | | 45,487 | | |
| Collateralized Mortgage Obligations — Agency Collateral Series (1.3%) | |
Federal Home Loan Mortgage Corp.,
REMIC | |
| 7.50%, 9/15/29 | | | 2,287 | | | | 2,680 | | |
| Commercial Mortgage Backed Securities (1.1%) | |
| Bear Stearns Commercial Mortgage Securities | |
| 5.20%, 1/12/41 (b) | | | 690 | | | | 748 | | |
| LB-UBS Commercial Mortgage Trust | |
| 4.37%, 3/15/36 | | | 720 | | | | 751 | | |
| Wachovia Bank Commercial Mortgage Trust | |
| 5.48%, 7/15/41 (b) | | | 665 | | | | 725 | | |
| | | | 2,224 | | |
| Corporate Bonds (55.1%) | |
| Finance (29.2%) | |
| Abbey National Treasury Services PLC | |
| 3.88%, 11/10/14 (a) | | | 1,850 | | | | 1,895 | | |
| Aflac, Inc. | |
| 3.45%, 8/15/15 | | | 325 | | | | 338 | | |
| American Express Co. | |
| 7.25%, 5/20/14 | | | 1,680 | | | | 1,972 | | |
| ANZ National Int'l Ltd. | |
| 2.38%, 12/21/12 (a) | | | 1,105 | | | | 1,121 | | |
| Bank One Corp. | |
| 5.25%, 1/30/13 | | | 1,450 | | | | 1,564 | | |
The accompanying notes are an integral part of the financial statements.
67
2010 Annual Report
September 30, 2010
Portfolio of Investments (cont'd)
Limited Duration Portfolio
| | | Face
Amount
(000) | | Value
(000) | |
| Finance (cont'd) | |
| Barclays Bank PLC | |
| 2.50%, 1/23/13 | | $ | 1,030 | | | $ | 1,053 | | |
| Canadian Imperial Bank of Commerce | |
| 1.45%, 9/13/13 | | | 1,130 | | | | 1,138 | | |
| Capital One Financial Corp. | |
| 5.70%, 9/15/11 | | | 1,300 | | | | 1,355 | | |
| Cie de Financement Foncier | |
| 1.63%, 7/23/12 (a) | | | 1,100 | | | | 1,105 | | |
| Citigroup, Inc. (Note G) | |
| 6.50%, 8/19/13 | | | 1,830 | | | | 2,023 | | |
| Commonwealth Bank of Australia | |
| 2.75%, 10/15/12 (a) | | | 2,400 | | | | 2,472 | | |
| Credit Suisse | |
| 5.50%, 5/1/14 | | | 840 | | | | 942 | | |
| Credit Suisse USA, Inc. | |
| 6.13%, 11/15/11 | | | 1,040 | | | | 1,101 | | |
| Deutsche Bank AG | |
| 2.38%, 1/11/13 | | | 1,105 | | | | 1,131 | | |
| General Electric Capital Corp. | |
| 5.45%, 1/15/13 | | | 3,455 | | | | 3,760 | | |
| Goldman Sachs Group, Inc. (The), | |
| 5.25%, 10/15/13 | | | 1,315 | | | | 1,430 | | |
| 5.45%, 11/1/12 | | | 440 | | | | 475 | | |
| 6.88%, 1/15/11 | | | 610 | | | | 621 | | |
| HSBC Finance Corp., | |
| 6.38%, 10/15/11 | | | 285 | | | | 300 | | |
| 6.75%, 5/15/11 | | | 630 | | | | 652 | | |
| 7.00%, 5/15/12 | | | 700 | | | | 757 | | |
| Intesa Sanpaolo SpA | |
| 3.63%, 8/12/15 (a) | | | 550 | | | | 557 | | |
| JPMorgan Chase & Co., | |
| 3.40%, 6/24/15 | | | 995 | | | | 1,034 | | |
| 5.38%, 10/1/12 | | | 1,920 | | | | 2,078 | | |
| KeyCorp | |
| 6.50%, 5/14/13 | | | 660 | | | | 724 | | |
| Macquarie Group Ltd. | |
| 7.30%, 8/1/14 (a) | | | 720 | | | | 815 | | |
| MBNA Corp. | |
| 6.13%, 3/1/13 | | | 610 | | | | 661 | | |
| Merrill Lynch & Co., Inc. | |
| 6.15%, 4/25/13 | | | 1,500 | | | | 1,640 | | |
| MetLife, Inc. | |
| 2.38%, 2/6/14 | | | 1,875 | | | | 1,896 | | |
| Monumental Global Funding III | |
| 5.25%, 1/15/14 (a) | | | 1,115 | | | | 1,203 | | |
| Nationwide Building Society | |
| 4.65%, 2/25/15 (a) | | | 840 | | | | 890 | | |
| Nissan Motor Acceptance Corp. | |
| 3.25%, 1/30/13 (a) | | | 90 | | | | 93 | | |
| Nordea Bank AB | |
| 2.50%, 11/13/12 (a) | | | 1,135 | | | | 1,162 | | |
| | | Face
Amount
(000) | | Value
(000) | |
| Northern Trust Corp. | |
| 5.50%, 8/15/13 | | $ | 1,060 | | | $ | 1,193 | | |
| Principal Financial Group, Inc. | |
| 7.88%, 5/15/14 | | | 816 | | | | 968 | | |
| Prudential Financial, Inc. | |
| 3.63%, 9/17/12 | | | 1,090 | | | | 1,133 | | |
| Royal Bank of Scotland PLC (The), | |
| 2.63%, 5/11/12 (a) | | | 8,250 | | | | 8,477 | | |
| 4.88%, 3/16/15 | | | 1,205 | | | | 1,269 | | |
| Societe Generale | |
| 3.10%, 9/14/15 (a) | | | 320 | | | | 322 | | |
| Standard Chartered PLC | |
| 3.85%, 4/27/15 (a) | | | 940 | | | | 982 | | |
| Svenska Handelsbanken AB | |
| 2.88%, 9/14/12 (a) | | | 1,060 | | | | 1,091 | | |
| TD Ameritrade Holding Corp. | |
| 2.95%, 12/1/12 | | | 1,200 | | | | 1,234 | | |
| UBS AG/Stamford CT | |
| 3.88%, 1/15/15 | | | 1,140 | | | | 1,191 | | |
| UnitedHealth Group, Inc. | |
| 5.25%, 3/15/11 | | | 655 | | | | 668 | | |
| Wells Fargo & Co. | |
| 3.75%, 10/1/14 | | | 2,365 | | | | 2,508 | | |
| | | | 60,994 | | |
| Industrials (20.1%) | |
| Agilent Technologies, Inc. | |
| 4.45%, 9/14/12 | | | 1,325 | | | | 1,395 | | |
| Altria Group, Inc. | |
| 7.75%, 2/6/14 | | | 1,120 | | | | 1,323 | | |
| Amphenol Corp. | |
| 4.75%, 11/15/14 | | | 460 | | | | 500 | | |
| Anglo American Capital plc | |
| 9.38%, 4/8/14 (a) | | | 1,100 | | | | 1,355 | | |
| Anheuser-Busch InBev Worldwide, Inc., | |
| 2.50%, 3/26/13 (a) | | | 375 | | | | 385 | | |
| 5.38%, 11/15/14 (a) | | | 785 | | | | 882 | | |
| ArcelorMittal | |
| 9.00%, 2/15/15 | | | 610 | | | | 737 | | |
| AT&T, Inc. | |
| 4.95%, 1/15/13 | | | 2,510 | | | | 2,729 | | |
| Bacardi Ltd. | |
| 7.45%, 4/1/14 (a) | | | 835 | | | | 988 | | |
| Biogen Idec, Inc. | |
| 6.00%, 3/1/13 | | | 1,040 | | | | 1,140 | | |
| BP Capital Markets PLC | |
| 5.25%, 11/7/13 | | | 440 | | | | 480 | | |
| British Telecommunications PLC | |
| 9.38%, 12/15/10 | | | 1,400 | | | | 1,422 | | |
| Bunge Ltd. Finance Corp. | |
| 5.35%, 4/15/14 | | | 830 | | | | 887 | | |
| COX Communications, Inc. | |
| 4.63%, 6/1/13 | | | 690 | | | | 745 | | |
The accompanying notes are an integral part of the financial statements.
68
2010 Annual Report
September 30, 2010
Portfolio of Investments (cont'd)
Limited Duration Portfolio
| | | Face
Amount
(000) | | Value
(000) | |
| Industrials (cont'd) | |
| CVS Caremark Corp. | |
| 5.75%, 8/15/11 | | $ | 635 | | | $ | 662 | | |
| Daimler Finance North America LLC | |
| 7.30%, 1/15/12 | | | 1,290 | | | | 1,388 | | |
| Delhaize Group S.A. | |
| 5.88%, 2/1/14 | | | 1,025 | | | | 1,158 | | |
| Devon Financing Corp. ULC | |
| 6.88%, 9/30/11 | | | 1,400 | | | | 1,481 | | |
| DirecTV Holdings LLC/DirecTV Financing Co., Inc. | |
| 4.75%, 10/1/14 | | | 695 | | | | 760 | | |
| Dow Chemical Co. (The) | |
| 5.90%, 2/15/15 | | | 1,105 | | | | 1,233 | | |
| EOG Co. of Canada | |
| 7.00%, 12/1/11 (a) | | | 1,325 | | | | 1,416 | | |
| Fiserv, Inc. | |
| 6.13%, 11/20/12 | | | 1,370 | | | | 1,496 | | |
| Harley-Davidson Funding Corp. | |
| 5.25%, 12/15/12 (a) | | | 820 | | | | 864 | | |
| Kraft Foods, Inc. | |
| 6.75%, 2/19/14 | | | 1,245 | | | | 1,449 | | |
| Kroger Co. (The) | |
| 7.50%, 1/15/14 | | | 725 | | | | 857 | | |
| Marriott International, Inc. | |
| 4.63%, 6/15/12 | | | 1,300 | | | | 1,361 | | |
| Medco Health Solutions, Inc. | |
| 7.25%, 8/15/13 | | | 1,115 | | | | 1,289 | | |
| NBC Universal, Inc. | |
| 2.10%, 4/1/14 (a)(c) | | | 835 | | | | 840 | | |
| Nexen, Inc. | |
| 5.05%, 11/20/13 | | | 660 | | | | 719 | | |
| Potash Corp. of Saskatchewan, Inc. | |
| 5.25%, 5/15/14 | | | 1,105 | | | | 1,228 | | |
| Rio Tinto Finance USA Ltd. | |
| 5.88%, 7/15/13 | | | 1,065 | | | | 1,188 | | |
| Ryder System, Inc. | |
| 6.00%, 3/1/13 | | | 660 | | | | 714 | | |
| Telecom Italia Capital S.A., | |
| 4.88%, 10/1/10 | | | 110 | | | | 110 | | |
| 5.25%, 11/15/13 | | | 1,055 | | | | 1,134 | | |
| Thermo Fisher Scientific, Inc. | |
| 3.25%, 11/20/14 | | | 690 | | | | 729 | | |
| Time Warner Cable, Inc. | |
| 8.25%, 2/14/14 | | | 700 | | | | 836 | | |
| Viacom, Inc. | |
| 4.38%, 9/15/14 | | | 1,100 | | | | 1,195 | | |
| Vodafone Group PLC | |
| 5.00%, 12/16/13 | | | 1,060 | | | | 1,166 | | |
| Xerox Corp. | |
| 8.25%, 5/15/14 | | | 670 | | | | 804 | | |
| Yum! Brands, Inc. | |
| 8.88%, 4/15/11 | | | 850 | | | | 885 | | |
| | | | 41,930 | | |
| | | Face
Amount
(000) | | Value
(000) | |
| Multimedia (0.4%) | |
| News America, Inc. | |
| 5.30%, 12/15/14 | | $ | 755 | | | $ | 853 | | |
| Utilities (5.4%) | |
| Columbus Southern Power Co. | |
| 4.40%, 12/1/10 | | | 1,250 | | | | 1,256 | | |
| Dominion Resources, Inc. | |
| 5.70%, 9/17/12 | | | 1,275 | | | | 1,391 | | |
| EDF S.A. | |
| 5.50%, 1/26/14 (a) | | | 1,105 | | | | 1,248 | | |
| Enel Finance International S.A. | |
| 3.88%, 10/7/14 (a) | | | 1,115 | | | | 1,169 | | |
| Enterprise Products Operating LLC | |
| 7.50%, 2/1/11 | | | 1,455 | | | | 1,485 | | |
| FirstEnergy Solutions Corp. | |
| 4.80%, 2/15/15 | | | 755 | | | | 812 | | |
| FPL Group Capital, Inc. | |
| 5.35%, 6/15/13 | | | 825 | | | | 904 | | |
| Plains All American Pipeline L.P./PAA Finance Corp. | |
| 4.25%, 9/1/12 | | | 1,140 | | | | 1,190 | | |
| PPL Energy Supply LLC | |
| 6.30%, 7/15/13 | | | 675 | | | | 752 | | |
| Spectra Energy Capital LLC | |
| 5.90%, 9/15/13 | | | 965 | | | | 1,075 | | |
| | | | 11,282 | | |
| | | | 115,059 | | |
| Mortgage — Other (0.4%) | |
| FDIC Structured Sale Guaranteed Notes | |
| 0.81%, 2/25/48 (a)(b) | | | 852 | | | | 854 | | |
| Non-U.S. Government — Guaranteed (5.6%) | |
| Commonwealth Bank of Australia | |
| 2.50%, 12/10/12 (a) | | | 2,300 | | | | 2,392 | | |
| Swedbank AB | |
| 2.90%, 1/14/13 (a) | | | 5,900 | | | | 6,132 | | |
| Westpac Securities NZ Ltd. | |
| 2.50%, 5/25/12 (a) | | | 3,020 | | | | 3,092 | | |
| | | | 11,616 | | |
| Sovereign (1.2%) | |
| Kingdom of Denmark | |
| 2.75%, 11/15/11 | | | 2,448 | | | | 2,513 | | |
| U.S. Treasury Securities (9.1%) | |
| U.S. Treasury Bonds, | |
| 4.38%, 11/15/39 | | | 180 | | | | 202 | | |
| 7.50%, 11/15/24 | | | 7,580 | | | | 11,492 | | |
| U.S. Treasury Notes, | |
| 2.25%, 1/31/15 | | | 5,300 | | | | 5,563 | | |
| 3.63%, 2/15/20 | | | 1,500 | | | | 1,645 | | |
| | | | 18,902 | | |
| Total Fixed Income Securities (Cost $199,051) | | | 205,690 | | |
The accompanying notes are an integral part of the financial statements.
69
2010 Annual Report
September 30, 2010
Portfolio of Investments (cont'd)
Limited Duration Portfolio
| | | Shares | | Value
(000) | |
| Short-Term Investments (3.0%) | |
| Investment Company (1.3%) | |
Morgan Stanley Institutional
Liquidity Funds — Money Market
Portfolio — Institutional Class (Note G) | | | 2,777,895 | | | $ | 2,778 | | |
| | | Face
Amount
(000) | | | |
| U.S. Treasury Securities (1.7%) | |
| U.S. Treasury Bills, | |
| 0.13%, 10/28/10 (d)(e)(f) | | $ | 550 | | | | 550 | | |
| 0.14%, 10/28/10 (d)(e)(f) | | | 877 | | | | 877 | | |
| 0.17%, 10/28/10 (d)(e)(f) | | | 290 | | | | 290 | | |
| 0.20%, 10/28/10 (d)(e)(f) | | | 1,490 | | | | 1,489 | | |
| 0.21%, 10/28/10 (d)(e)(f) | | | 50 | | | | 50 | | |
| 0.22%, 10/28/10 (d)(e)(f) | | | 390 | | | | 390 | | |
| | | | 3,646 | | |
| Total Short-Term Investments (Cost $6,424) | | | 6,424 | | |
| Total Investments (101.7%) (Cost $205,475) | | | 212,114 | | |
| Liabilities in Excess of Other Assets (-1.7%) | | | (3,454 | ) | |
| Net Assets (100.0%) | | $ | 208,660 | | |
(a) 144A security — Certain conditions for public sale may exist. Unless otherwise noted, these securities are deemed to be liquid.
(b) Variable/Floating Rate Security — Interest rate changes on these instruments are based on changes in a designated base rate. The rates shown are those in effect on September 30, 2010.
(c) When-issued security.
(d) Rate shown is the yield to maturity at September 30, 2010.
(e) All or a portion of the security was pledged to cover margin requirements for futures contracts.
(f) All or a portion of the security was pledged as collateral for swap agreements.
REMIC Real Estate Mortgage Investment Conduit
Futures Contracts
The Portfolio had the following futures contract(s) open at period end:
| | | Number
of
Contracts | | Value
(000) | | Expiration
Date | | Net Unrealized
Appreciation
(Depreciation)
(000) | |
| Long: | |
U.S. Treasury
10 yr. Note | | | 67 | | | $ | 8,445 | | | Dec-10 | | $ | 54 | | |
| Short: | |
U.S. Treasury
2 yr. Note | | | 59 | | | | 12,949 | | | Dec-10 | | | (26 | ) | |
U.S. Treasury
5yr. Note | | | 88 | | | | 10,636 | | | Dec-10 | | | 5 | | |
U.S. Treasury
30 yr. Bond | | | 12 | | | | 1,605 | | | Dec-10 | | | 6 | | |
| | | | | | | | | | | | | $ | 39 | | |
Interest Rate Swap Agreements
The Portfolio had the following interest rate swap agreement(s) open at period end:
| Swap Counterparty | | Floating Rate
Index | | Pay/Receive
Floating Rate | | Fixed Rate | | Termination
Date | | Notional
Amount
(000) | | Unrealized
Appreciation
(Depreciation)
(000) | |
| Bank of America, N.A. | | | 3 Month LIBOR | | | Receive | | | 2.625 | % | | | 3/11/15 | | | $ | 14,911 | | | $ | (856 | ) | |
Zero Coupon Swap Agreements
The Portfolio had the following zero coupon swap agreement(s) open at period end:
| Swap Counterparty | | Notional
Amount
(000) | | Floating
Rate Index | | Pay/Receive
Floating Rate | | Termination
Date | | Net Unrealized
Appreciation
(Depreciation)
(000) | |
| Barclays Capital | | $ | 3,918 | | | 3 Month LIBOR | | Receive | | 11/15/19 | | $ | (801 | ) | |
| Deutsche Bank | | | 7,050 | | | 3 Month LIBOR | | Pay | | 11/15/21 | | | 260 | | |
| Deutsche Bank | | | 4,009 | | | 3 Month LIBOR | | Receive | | 11/15/21 | | | (786 | ) | |
| JPMorgan Chase | | | 186 | | | 3 Month LIBOR | | Receive | | 11/15/19 | | | (35 | ) | |
| JPMorgan Chase | | | 4,419 | | | 3 Month LIBOR | | Receive | | 11/15/20 | | | (997 | ) | |
| | | | | | | | | | | | | $ | (2,359 | ) | |
LIBOR London Interbank Offered Rate
The accompanying notes are an integral part of the financial statements.
70
2010 Annual Report
September 30, 2010
Portfolio of Investments (cont'd)
Limited Duration Portfolio
Fair Value Measurement Information:
The following is a summary of the inputs used to value the Portfolio's net assets as of September 30, 2010. (See Note A-7 to the financial statements for further information regarding fair value measurement.)
| Investment Type | | Level 1
Quoted
prices
(000) | | Level 2
Other
significant
observable
inputs
(000) | | Level 3
Significant
unobservable
inputs
(000) | | Total
(000) | |
| Assets: | |
Fixed Income
Securities | |
Agency Adjustable
Rate Mortgages | | $ | — | | | $ | 2,221 | | | $ | — | | | $ | 2,221 | | |
Agency Bond —
Banking (FDIC
Guaranteed) | | | — | | | | 2,284 | | | | — | | | | 2,284 | | |
Agency Fixed Rate
Mortgages | | | — | | | | 1,850 | | | | — | | | | 1,850 | | |
Asset-Backed
Securities | | | — | | | | 45,487 | | | | — | | | | 45,487 | | |
Collateralized
Mortgage
Obligations —
Agency
Collateral Series | | | — | | | | 2,680 | | | | — | | | | 2,680 | | |
Commercial
Mortgage
Backed
Securities | | | — | | | | 2,224 | | | | — | | | | 2,224 | | |
| Corporate Bonds | | | — | | | | 115,059 | | | | — | | | | 115,059 | | |
| Mortgage — Other | | | — | | | | 854 | | | | — | | | | 854 | | |
Non-U.S.
Government —
Guaranteed | | | — | | | | 11,616 | | | | — | | | | 11,616 | | |
| Sovereign | | | — | | | | 2,513 | | | | — | | | | 2,513 | | |
U.S. Treasury
Securities | | | — | | | | 18,902 | | | | — | | | | 18,902 | | |
Total Fixed Income
Securities | | | — | | | | 205,690 | | | | — | | | | 205,690 | | |
Fair Value Measurement Information: (cont'd)
| Investment Type | | Level 1
Quoted
prices
(000) | | Level 2
Other
significant
observable
inputs
(000) | | Level 3
Significant
unobservable
inputs
(000) | | Total
(000) | |
Short-Term
Investments | |
Investment
Company | | $ | 2,778 | | | $ | — | | | $ | — | | | $ | 2,778 | | |
U.S. Treasury
Securities | | | — | | | | 3,646 | | | | — | | | | 3,646 | | |
Total Short-Term
Investments | | | 2,778 | | | | 3,646 | | | | — | | | | 6,424 | | |
| Futures Contracts | | | 65 | | | | — | | | | — | | | | 65 | | |
Zero Coupon Swap
Agreement | | | — | | | | 260 | | | | — | | | | 260 | | |
| Total Assets | | | 2,843 | | | | 209,596 | | | | — | | | | 212,439 | | |
| Liabilities: | |
| Futures Contracts | | | 26 | | | | — | | | | — | | | | 26 | | |
Interest Rate Swap
Agreements | | | — | | | | 856 | | | | — | | | | 856 | | |
Zero Coupon Swap
Agreements | | | — | | | | 2,619 | | | | — | | | | 2,619 | | |
| Total Liabilities | | | 26 | | | | 3,475 | | | | — | | | | 3,501 | | |
| Total | | $ | 2,817 | | | $ | 206,121 | | | $ | — | | | $ | 208,938 | | |
The accompanying notes are an integral part of the financial statements.
71
2010 Annual Report
September 30, 2010
Investment Overview (unaudited)
Long Duration Fixed Income Portfolio
Performance
For the fiscal year ended September 30, 2010, the Portfolio's Class I had a total return based on net asset value and reinvestment of distributions per share of 13.09%, net of fees. The Portfolio's Class I underperformed against its benchmark the Barclays Capital U.S. Long Government/Credit Index (the "Index") which returned 13.61%.
Factors Affecting Performance
• During much of the 12-month period, global sentiment was fragile and financial markets were volatile. Government bonds in most developed countries continued to be regarded as "safe haven" assets relative to sectors with greater credit risk. However, the debt of governments on the periphery of Europe continued to underperform those in other developed markets as investors fretted about their fiscal problems. Outside of these trouble spots, declining government bond yields in the rest of Europe and North America appeared to indicate a general reduction in investors' expectations for economic growth and inflation in those markets, while policy makers in emerging markets continued to adjust monetary policy to recognize economic strength.
• Amidst continued weakness in economic indicators, the Federal Open Market Committee (the "Fed") kept the federal funds target rate in the range of zero to 0.25%. The labor market has continued to languish, with the unemployment rate at its highest level in many years, albeit declining in recent months. On the housing front, data remain dim, with some pockets of improvement.
• Investment-grade corporate debt posted positive returns during the period (as measured by the Barclays Capital U.S. Corporate Index), and among sectors, financials outpaced industrials and utilities. In mid-2010, the U.S. credit market was negatively affected by the European sovereign debt crisis. However, the outlook for the investment grade corporate debt sector remains favorable in our view — especially in industrials with strong balance sheets, sufficient liquidity, improving revenue growth and free cash flow
• The U.S. Treasury yield curve flattened during the period, with yields on 2-, 5-, 10-, and 30-year Treasuries declining by 44, 94, 71, and 31 basis points, respectively.
• An overweight to Build America Bonds detracted from relative performance as the sector underperformed other taxable sectors.
• Interest-rate positions contributed to performance. Throughout the period, we employed tactical strategies involving interest rate swaps that were designed to take advantage of anomalies across the swap curve. Similar to the Treasury curve, the swap curve shows the relationship of various maturities of swaps and their yields.
Management Strategies
• Throughout the period, the Portfolio was positioned with an overweight to investment-grade credit. We have a favorable view of the corporate debt sector and therefore we continue to maintain an overweight to this sector.
• With regard to interest rate strategy, the Portfolio was positioned to benefit from an anticipated flattening (or, reduction in the difference of yield spreads) between the two- and five-year segments of the curve. Once this flattening occurred in the third quarter of 2010, we took profits and unwound the trade.

* Minimum Investment
** Commenced operations on July 21, 2006.
In accordance with SEC regulations, the Portfolio's performance shown assumes that all recurring fees (including management fees) were deducted and all dividends and distributions were reinvested. The performance of Class P shares will vary from the Class I shares based upon being negatively impacted by additional fees assessed to that class.
72
2010 Annual Report
September 30, 2010
Investment Overview (unaudited) (cont'd)
Long Duration Fixed Income Portfolio
Performance Compared to the Barclays Capital U.S. Long Government/Credit Index(1) and Lipper Corporate Debt Funds BBB-Rated Index(2)
| | | Total Returns(3) | |
| | | | | Average Annual | |
| | | One
Year | | Five
Years | | Ten
Years | | Since
Inception(5) | |
Portfolio — Class I
w/o sales charges(4) | | | 13.09 | % | | | — | | | | — | | | | 10.24 | % | |
Barclays Capital U.S.
Long Government/Credit Index | | | 13.61 | | | | — | | | | — | | | | 9.53 | | |
Lipper Corporate Debt
Funds BBB-Rated Index | | | 13.40 | | | | — | | | | — | | | | 6.93 | | |
Portfolio — Class P
w/o sales charges(4) | | | 12.81 | | | | — | | | | — | | | | 9.97 | | |
Barclays Capital U.S.
Long Government/Credit Index | | | 13.61 | | | | — | | | | — | | | | 9.53 | | |
Lipper Corporate Debt
Funds BBB-Rated Index | | | 13.40 | | | | — | | | | — | | | | 6.93 | | |
Performance data quoted represents past performance, which is no guarantee of future results, and current performance may be lower or higher than the figures shown. Performance assumes that all dividends and distributions, if any, were reinvested. For the most recent month-end performance figures, please visit www.morganstanley.com/im. Investment return and principal value will fluctuate so that Portfolio shares, when redeemed, may be worth more or less than their original cost. Total returns do not reflect the deduction of taxes that a shareholder would pay on Portfolio distributions or the redemption of Portfolio shares. Performance of share classes will vary due to differences in sales charges and expenses.
(1) The Barclays Capital U.S. Long Government/Credit Index tracks the securities in the long maturity range of the Barclays Capital U.S. Government/Credit Index which tracks investment-grade (BBB-/Baa3) or higher publicly traded fixed-rate U.S. government, U.S. agency, and corporate issues. The Index is unmanaged and its returns do not include any sales charges or fees. Such costs would lower performance. It is not possible to invest directly in an index.
(2) The Lipper Corporate Debt Funds BBB-Rated Index is an equally weighted performance index of the largest qualifying funds (based on net assets) in the Lipper Corporate Debt Funds BBB-Rated classification. The Index, which is adjusted for capital gains distributions and income dividends, is unmanaged and should not be considered an investment. There are currently 30 funds represented in this Index. As of the date of this report, the Portfolio was in the Lipper Corporate Debt Funds BBB-Rated classification.
(3) Total returns for the Portfolio reflect expenses waived and/or reimbursed, if applicable, by the Adviser. Without such waivers and/or reimbursements, total returns would have been lower. Fee waivers and/or reimbursements are voluntary and the Adviser reserves the right to commence or terminate any waiver and/or reimbursement at any time.
(4) Commenced operations on July 21, 2006.
(5) For comparative purposes, average annual since inception returns listed for the Indexes refer to the inception date or initial offering of the respective share class of the Portfolio, not the inception of the Indexes.
Portfolio Composition
| Classification | | Percentage of
Total Investments | |
| U.S. Treasury Securities | | | 35.7 | % | |
| Industrials | | | 28.1 | | |
| Finance | | | 12.6 | | |
| Utilities | | | 8.8 | | |
| Other* | | | 6.5 | | |
| Municipal Bonds | | | 6.4 | | |
| Short-Term Investments | | | 1.9 | | |
| Total Investments | | | 100.0 | % | |
* Industries and/or investment types representing less than 5% of total investments.
73
2010 Annual Report
September 30, 2010
Portfolio of Investments
Long Duration Fixed Income Portfolio
| | | Face
Amount
(000) | | Value
(000) | |
| Fixed Income Securities (98.1%) | |
| Corporate Bonds (49.5%) | |
| Finance (12.6%) | |
| ACE INA Holdings, Inc. | |
| 6.70%, 5/15/36 | | $ | 40 | | | $ | 49 | | |
| Aetna, Inc. | |
| 6.63%, 6/15/36 | | | 40 | | | | 46 | | |
| Aflac, Inc. | |
| 6.90%, 12/17/39 | | | 75 | | | | 83 | | |
| AIG SunAmerica Global Financing X | |
| 6.90%, 3/15/32 (a) | | | 17 | | | | 18 | | |
| Allstate Corp. (The), | |
| 5.95%, 4/1/36 | | | 65 | | | | 71 | | |
| 6.13%, 12/15/32 | | | 30 | | | | 33 | | |
| American Express Co. | |
| 8.13%, 5/20/19 | | | 55 | | | | 71 | | |
| Barclays Bank PLC | |
| 5.13%, 1/8/20 | | | 100 | | | | 108 | | |
| Bear Stearns Cos. LLC (The) | |
| 7.25%, 2/1/18 | | | 45 | | | | 55 | | |
| Chubb Corp. | |
| 6.50%, 5/15/38 | | | 60 | | | | 74 | | |
| Citigroup, Inc., (Note G) | |
| 5.85%, 12/11/34 | | | 225 | | | | 227 | | |
| 6.88%, 3/5/38 | | | 45 | | | | 50 | | |
| 8.13%, 7/15/39 | | | 100 | | | | 127 | | |
| Credit Suisse USA, Inc. | |
| 7.13%, 7/15/32 | | | 50 | | | | 64 | | |
| Farmers Exchange Capital | |
| 7.05%, 7/15/28 (a) | | | 100 | | | | 99 | | |
| General Electric Capital Corp., | |
| 5.88%, 1/14/38 | | | 405 | | | | 413 | | |
| 6.15%, 8/7/37 | | | 5 | | | | 5 | | |
| 6.75%, 3/15/32 | | | 100 | | | | 112 | | |
| Goldman Sachs Group, Inc. (The) | |
| 6.75%, 10/1/37 | | | 360 | | | | 375 | | |
| Hartford Financial Services Group, Inc. | |
| 6.63%, 3/30/40 | | | 75 | | | | 76 | | |
| HSBC Holdings PLC | |
| 6.50%, 5/2/36 | | | 235 | | | | 263 | | |
| JPMorgan Chase & Co. | |
| 6.40%, 5/15/38 | | | 175 | | | | 210 | | |
| JPMorgan Chase Capital XXVII | |
| 7.00%, 11/1/39 | | | 110 | | | | 113 | | |
| Lincoln National Corp. | |
| 6.30%, 10/9/37 | | | 20 | | | | 21 | | |
| Lloyds TSB Bank PLC | |
| 5.80%, 1/13/20 (a) | | | 100 | | | | 105 | | |
| Merrill Lynch & Co., Inc. | |
| 7.75%, 5/14/38 | | | 175 | | | | 204 | | |
| MetLife, Inc., | |
| 5.70%, 6/15/35 | | | 95 | | | | 101 | | |
| 10.75%, 8/1/69 | | | 30 | | | | 39 | | |
| | | Face
Amount
(000) | | Value
(000) | |
| Nationwide Building Society | |
| 6.25%, 2/25/20 (a) | | $ | 100 | | | $ | 110 | | |
| Principal Financial Group, Inc. | |
| 6.05%, 10/15/36 | | | 70 | | | | 73 | | |
| Protective Life Corp. | |
| 8.45%, 10/15/39 | | | 50 | | | | 55 | | |
| Prudential Financial, Inc., | |
| 5.90%, 3/17/36 | | | 30 | | | | 31 | | |
| 6.63%, 12/1/37 - 6/21/40 | | | 80 | | | | 91 | | |
| UnitedHealth Group, Inc., | |
| 5.80%, 3/15/36 | | | 80 | | | | 84 | | |
| 6.63%, 11/15/37 | | | 75 | | | | 88 | | |
| 6.88%, 2/15/38 | | | 50 | | | | 60 | | |
| Wachovia Corp. | |
| 5.50%, 8/1/35 | | | 175 | | | | 170 | | |
| WellPoint, Inc., | |
| 5.95%, 12/15/34 | | | 15 | | | | 16 | | |
| 6.38%, 6/15/37 | | | 160 | | | | 179 | | |
| | | | 4,169 | | |
| Industrials (28.1%) | |
| Agrium, Inc. | |
| 7.13%, 5/23/36 | | | 105 | | | | 128 | | |
| Alcoa, Inc. | |
| 5.95%, 2/1/37 | | | 125 | | | | 115 | | |
| Altria Group, Inc., | |
| 9.95%, 11/10/38 | | | 45 | | | | 65 | | |
| 10.20%, 2/6/39 | | | 80 | | | | 119 | | |
| Anadarko Petroleum Corp. | |
| 6.20%, 3/15/40 | | | 100 | | | | 98 | | |
| Anheuser-Busch InBev Worldwide, Inc., | |
| 8.00%, 11/15/39 (a) | | | 40 | | | | 57 | | |
| 8.20%, 1/15/39 (a) | | | 85 | | | | 122 | | |
| ArcelorMittal | |
| 7.00%, 10/15/39 | | | 60 | | | | 62 | | |
| AT&T Corp. | |
| 8.00%, 11/15/31 | | | 13 | | | | 17 | | |
| AT&T, Inc., | |
| 5.35%, 9/1/40 (a) | | | 429 | | | | 433 | | |
| 6.30%, 1/15/38 | | | 30 | | | | 34 | | |
| BellSouth Corp. | |
| 6.55%, 6/15/34 | | | 80 | | | | 90 | | |
| Browning-Ferris Industries, Inc. | |
| 7.40%, 9/15/35 | | | 50 | | | | 62 | | |
| BSKYB Finance UK PLC | |
| 6.50%, 10/15/35 (a) | | | 50 | | | | 57 | | |
| Bunge Ltd. Finance Corp. | |
| 8.50%, 6/15/19 | | | 40 | | | | 48 | | |
| Burlington Northern Santa Fe LLC | |
| 6.15%, 5/1/37 | | | 55 | | | | 63 | | |
| CBS Corp. | |
| 7.88%, 7/30/30 | | | 35 | | | | 42 | | |
The accompanying notes are an integral part of the financial statements.
74
2010 Annual Report
September 30, 2010
Portfolio of Investments (cont'd)
Long Duration Fixed Income Portfolio
| | | Face
Amount
(000) | | Value
(000) | |
| Industrials (cont'd) | |
| Comcast Corp., | |
| 6.40%, 5/15/38 | | $ | 160 | | | $ | 178 | | |
| 6.45%, 3/15/37 | | | 10 | | | | 11 | | |
| 6.95%, 8/15/37 | | | 100 | | | | 118 | | |
| ConAgra Foods, Inc., | |
| 7.00%, 10/1/28 | | | 20 | | | | 24 | | |
| 8.25%, 9/15/30 | | | 80 | | | | 108 | | |
| Corning, Inc. | |
| 7.25%, 8/15/36 | | | 50 | | | | 60 | | |
| COX Communications, Inc. | |
| 8.38%, 3/1/39 (a) | | | 20 | | | | 27 | | |
| CSX Corp. | |
| 6.15%, 5/1/37 | | | 60 | | | | 69 | | |
| CVS Caremark Corp. | |
| 6.13%, 9/15/39 | | | 65 | | | | 72 | | |
| CVS Pass-Through Trust, | |
| 6.04%, 12/10/28 | | | 100 | | | | 106 | | |
| 8.35%, 7/10/31 (a) | | | 29 | | | | 37 | | |
| Daimler Finance North America LLC | |
| 8.50%, 1/18/31 | | | 65 | | | | 90 | | |
| Darden Restaurants, Inc. | |
| 6.80%, 10/15/37 | | | 50 | | | | 58 | | |
| Delhaize America, Inc. | |
| 9.00%, 4/15/31 | | | 60 | | | | 85 | | |
| Deutsche Telekom International Finance BV | |
| 8.75%, 6/15/30 | | | 85 | | | | 119 | | |
| DIRECTV Holdings LLC | |
| 6.35%, 3/15/40 | | | 40 | | | | 43 | | |
| Dr Pepper Snapple Group, Inc. | |
| 7.45%, 5/1/38 | | | 75 | | | | 101 | | |
| EnCana Corp., | |
| 6.50%, 2/1/38 | | | 20 | | | | 23 | | |
| 6.63%, 8/15/37 | | | 45 | | | | 53 | | |
| H.J. Heinz Finance Co. | |
| 6.75%, 3/15/32 | | | 45 | | | | 54 | | |
| Harley-Davidson Funding Corp. | |
| 6.80%, 6/15/18 (a) | | | 60 | | | | 65 | | |
| Hess Corp. | |
| 7.13%, 3/15/33 | | | 55 | | | | 68 | | |
| Holcim Capital Corp. Ltd. | |
| 6.88%, 9/29/39 (a) | | | 100 | | | | 112 | | |
| Home Depot, Inc. | |
| 5.88%, 12/16/36 | | | 120 | | | | 128 | | |
| International Business Machines Corp., | |
| 5.60%, 11/30/39 | | | 110 | | | | 127 | | |
| 5.88%, 11/29/32 | | | 60 | | | | 71 | | |
| International Paper Co. | |
| 7.30%, 11/15/39 | | | 95 | | | | 107 | | |
| JC Penney Corp., Inc. | |
| 7.40%, 4/1/37 | | | 50 | | | | 51 | | |
| KLA-Tencor Corp. | |
| 6.90%, 5/1/18 | | | 45 | | | | 52 | | |
| | | Face
Amount
(000) | | Value
(000) | |
| Kohl's Corp. | |
| 6.88%, 12/15/37 | | $ | 55 | | | $ | 68 | | |
| Koninklijke KPN NV | |
| 8.38%, 10/1/30 | | | 25 | | | | 35 | | |
| Koninklijke Philips Electronics NV | |
| 6.88%, 3/11/38 | | | 70 | | | | 89 | | |
| Kraft Foods, Inc. | |
| 6.88%, 1/26/39 | | | 155 | | | | 189 | | |
| Kroger Co. (The) | |
| 6.90%, 4/15/38 | | | 80 | | | | 99 | | |
| Lorillard Tobacco Co. | |
| 8.13%, 5/1/40 | | | 45 | | | | 48 | | |
| Lowe's Cos., Inc. | |
| 6.65%, 9/15/37 | | | 45 | | | | 56 | | |
| Marathon Oil Corp. | |
| 6.60%, 10/1/37 | | | 30 | | | | 36 | | |
| Meccanica Holdings USA | |
| 6.25%, 1/15/40 (a) | | | 100 | | | | 100 | | |
| NBC Universal, Inc. | |
| 6.40%, 4/30/40 (a) | | | 45 | | | | 49 | | |
| Newmont Mining Corp. | |
| 6.25%, 10/1/39 | | | 95 | | | | 109 | | |
| News America, Inc., | |
| 6.40%, 12/15/35 | | | 160 | | | | 178 | | |
| 6.65%, 11/15/37 | | | 15 | | | | 17 | | |
| 7.85%, 3/1/39 | | | 40 | | | | 51 | | |
| Nexen, Inc. | |
| 7.50%, 7/30/39 | | | 125 | | | | 154 | | |
| Nokia Oyj | |
| 6.63%, 5/15/39 | | | 85 | | | | 97 | | |
| Norfolk Southern Corp. | |
| 7.05%, 5/1/37 | | | 80 | | | | 103 | | |
| Petro-Canada, | |
| 5.95%, 5/15/35 | | | 55 | | | | 59 | | |
| 6.80%, 5/15/38 | | | 100 | | | | 119 | | |
| Petrobras International Finance Co. - Pifco | |
| 6.88%, 1/20/40 | | | 95 | | | | 109 | | |
| Pfizer, Inc. | |
| 7.20%, 3/15/39 | | | 70 | | | | 96 | | |
| Philip Morris International, Inc. | |
| 6.38%, 5/16/38 | | | 90 | | | | 111 | | |
| Potash Corp. of Saskatchewan, Inc. | |
| 5.88%, 12/1/36 | | | 85 | | | | 89 | | |
| Quest Diagnostics, Inc., | |
| 5.75%, 1/30/40 | | | 30 | | | | 30 | | |
| 6.95%, 7/1/37 | | | 80 | | | | 92 | | |
| Qwest Corp. | |
| 6.88%, 9/15/33 | | | 40 | | | | 40 | | |
| Ralcorp Holdings, Inc. | |
| 6.63%, 8/15/39 | | | 90 | | | | 98 | | |
| Rio Tinto Alcan, Inc. | |
| 6.13%, 12/15/33 | | | 25 | | | | 29 | | |
| Rio Tinto Finance USA Ltd. | |
| 7.13%, 7/15/28 | | | 100 | | | | 127 | | |
The accompanying notes are an integral part of the financial statements.
75
2010 Annual Report
September 30, 2010
Portfolio of Investments (cont'd)
Long Duration Fixed Income Portfolio
| | | Face
Amount
(000) | | Value
(000) | |
| Industrials (cont'd) | |
| Southern Copper Corp. | |
| 6.75%, 4/16/40 | | $ | 45 | | | $ | 49 | | |
| Talisman Energy, Inc. | |
| 6.25%, 2/1/38 | | | 45 | | | | 50 | | |
| Target Corp. | |
| 7.00%, 1/15/38 | | | 100 | | | | 129 | | |
| Telecom Italia Capital SA | |
| 7.20%, 7/18/36 | | | 185 | | | | 200 | | |
| Telefonica Europe BV | |
| 8.25%, 9/15/30 | | | 115 | | | | 152 | | |
| Teva Pharmaceutical Finance Co. LLC | |
| 6.15%, 2/1/36 | | | 25 | | | | 30 | | |
| Time Warner Cable, Inc., | |
| 6.55%, 5/1/37 | | | 85 | | | | 96 | | |
| 6.75%, 6/15/39 | | | 75 | | | | 87 | | |
| Time Warner, Inc. | |
| 7.70%, 5/1/32 | | | 240 | | | | 301 | | |
| Transocean, Inc. | |
| 6.80%, 3/15/38 | | | 80 | | | | 82 | | |
| TRW, Inc. DEB | |
| 7.75%, 6/1/29 | | | 10 | | | | 13 | | |
| Union Pacific Corp. | |
| 6.25%, 5/1/34 | | | 115 | | | | 132 | | |
| Vale Overseas Ltd., | |
| 6.88%, 11/21/36 - 11/10/39 | | | 100 | | | | 115 | | |
| Valero Energy Corp., | |
| 6.63%, 6/15/37 | | | 65 | | | | 66 | | |
| 9.38%, 3/15/19 | | | 40 | | | | 51 | | |
| Verizon Communications, Inc., | |
| 5.85%, 9/15/35 | | | 230 | | | | 249 | | |
| 8.95%, 3/1/39 | | | 115 | | | | 169 | | |
| VF Corp. | |
| 6.45%, 11/1/37 | | | 45 | | | | 55 | | |
| Viacom, Inc. | |
| 6.88%, 4/30/36 | | | 110 | | | | 130 | | |
| Vivendi SA | |
| 6.63%, 4/4/18 (a) | | | 40 | | | | 47 | | |
| Vodafone Group PLC | |
| 6.15%, 2/27/37 | | | 45 | | | | 53 | | |
| Wal-Mart Stores, Inc., | |
| 5.25%, 9/1/35 | | | 100 | | | | 107 | | |
| 6.50%, 8/15/37 | | | 35 | | | | 44 | | |
| Waste Management, Inc. | |
| 6.13%, 11/30/39 | | | 95 | | | | 106 | | |
| Weatherford International Ltd., | |
| 7.00%, 3/15/38 | | | 80 | | | | 85 | | |
| 9.63%, 3/1/19 | | | 35 | | | | 46 | | |
| Williams Cos., Inc. (The) | |
| 7.75%, 6/15/31 | | | 123 | | | | 141 | | |
| Wyeth | |
| 5.95%, 4/1/37 | | | 35 | | | | 41 | | |
| | | Face
Amount
(000) | | Value
(000) | |
| Xerox Corp. | |
| 5.63%, 12/15/19 | | $ | 20 | | | $ | 22 | | |
| Yum! Brands, Inc. | |
| 6.88%, 11/15/37 | | | 75 | | | | 90 | | |
| | | | 9,244 | | |
| Utilities (8.8%) | |
| CenterPoint Energy Resources Corp. | |
| 6.25%, 2/1/37 | | | 25 | | | | 28 | | |
| Columbus Southern Power Co. | |
| 6.60%, 3/1/33 | | | 30 | | | | 37 | | |
| Constellation Energy Group, Inc. | |
| 7.60%, 4/1/32 | | | 75 | | | | 92 | | |
| Consumers Energy Co. | |
| 5.65%, 4/15/20 | | | 40 | | | | 47 | | |
| Detroit Edison Co. (The) | |
| 6.35%, 10/15/32 | | | 90 | | | | 107 | | |
| E.ON International Finance BV | |
| 6.65%, 4/30/38 (a) | | | 25 | | | | 32 | | |
| EDF SA | |
| 5.60%, 1/27/40 (a) | | | 30 | | | | 33 | | |
| Enbridge Energy Partners LP | |
| 7.50%, 4/15/38 | | | 50 | | | | 63 | | |
| ENEL Finance International SA | |
| 6.00%, 10/7/39 (a) | | | 100 | | | | 104 | | |
| Energy Transfer Partners LP, | |
| 7.50%, 7/1/38 | | | 60 | | | | 71 | | |
| 9.00%, 4/15/19 | | | 40 | | | | 51 | | |
| Entergy Louisiana LLC | |
| 5.40%, 11/1/24 | | | 50 | | | | 58 | | |
| Enterprise Products Operating LLC, | |
| 6.65%, 10/15/34 | | | 30 | | | | 34 | | |
| 6.88%, 3/1/33 | | | 95 | | | | 108 | | |
| Exelon Generation Co. LLC | |
| 6.25%, 10/1/39 | | | 140 | | | | 151 | | |
| FirstEnergy Solutions Corp. | |
| 6.80%, 8/15/39 | | | 180 | | | | 182 | | |
| Georgia Power Co. | |
| 5.40%, 6/1/40 | | | 115 | | | | 125 | | |
| Kinder Morgan Energy Partners LP, | |
| 6.50%, 2/1/37 | | | 65 | | | | 70 | | |
| 6.95%, 1/15/38 | | | 120 | | | | 137 | | |
| 7.30%, 8/15/33 | | | 5 | | | | 6 | | |
| Nevada Power Co. | |
| 6.65%, 4/1/36 | | | 125 | | | | 150 | | |
| Nisource Finance Corp. | |
| 6.13%, 3/1/22 | | | 85 | | | | 97 | | |
| Ohio Edison Co. | |
| 6.88%, 7/15/36 | | | 65 | | | | 76 | | |
| Ohio Power Co. | |
| 6.60%, 2/15/33 | | | 110 | | | | 128 | | |
| Oncor Electric Delivery Co. LLC | |
| 7.50%, 9/1/38 | | | 25 | | | | 33 | | |
| Oneok Partners LP | |
| 6.85%, 10/15/37 | | | 75 | | | | 87 | | |
The accompanying notes are an integral part of the financial statements.
76
2010 Annual Report
September 30, 2010
Portfolio of Investments (cont'd)
Long Duration Fixed Income Portfolio
| | | Face
Amount
(000) | | Value
(000) | |
| Utilities (cont'd) | |
| Plains All American Pipeline LP/PAA Finance Corp., | |
| 6.65%, 1/15/37 | | $ | 40 | | | $ | 44 | | |
| 6.70%, 5/15/36 | | | 75 | | | | 82 | | |
| PPL Electric Utilities Corp. | |
| 6.45%, 8/15/37 | | | 30 | | | | 37 | | |
| Sempra Energy | |
| 6.00%, 10/15/39 | | | 125 | | | | 142 | | |
| Spectra Energy Capital LLC | |
| 7.50%, 9/15/38 | | | 45 | | | | 55 | | |
| Tennessee Gas Pipeline Co. | |
| 7.00%, 10/15/28 | | | 125 | | | | 137 | | |
| Texas Eastern Transmission LP | |
| 7.00%, 7/15/32 | | | 55 | | | | 70 | | |
| TransCanada PipeLines Ltd. | |
| 7.63%, 1/15/39 | | | 125 | | | | 167 | | |
| Williams Partners LP | |
| 6.30%, 4/15/40 | | | 50 | | | | 55 | | |
| | | | 2,896 | | |
| | | | 16,309 | | |
| Municipal Bonds (6.4%) | |
| American Municipal Power-Ohio Inc, | |
| 6.05%, 2/15/43 | | | 55 | | | | 58 | | |
| 6.45%, 2/15/44 | | | 60 | | | | 63 | | |
| Bay Area Toll Authority | |
| 6.26%, 4/1/49 | | | 125 | | | | 139 | | |
| Chicago Board of Education | |
| 6.14%, 12/1/39 | | | 50 | | | | 51 | | |
| Chicago Transit Authority | |
| 6.20%, 12/1/40 | | | 130 | | | | 132 | | |
| City of New York | |
| 5.97%, 3/1/36 | | | 120 | | | | 130 | | |
| County of Clark | |
| 6.82%, 7/1/45 | | | 105 | | | | 119 | | |
| County of Cook | |
| 6.23%, 11/15/34 | | | 45 | | | | 47 | | |
| District of Columbia | |
| 5.59%, 12/1/34 | | | 65 | | | | 71 | | |
Illinois State Toll Highway Authority, Highway
Revenue, Build America Bonds | |
| 6.18%, 1/1/34 | | | 70 | | | | 75 | | |
| Indianapolis Local Public Improvement Bond Bank | |
| 6.12%, 1/15/40 | | | 35 | | | | 40 | | |
| Los Angeles Unified School District/CA | |
| 6.76%, 7/1/34 | | | 45 | | | | 51 | | |
| Metropolitan Transportation Authority | |
| 6.67%, 11/15/39 | | | 140 | | | | 150 | | |
| Municipal Electric Authority of Georgia, | |
| 6.64%, 4/1/57 | | | 65 | | | | 70 | | |
| 6.66%, 4/1/57 | | | 110 | | | | 116 | | |
| New Jersey Transportation Trust Fund Authority | |
| 6.56%, 12/15/40 | | | 115 | | | | 131 | | |
| | | Face
Amount
(000) | | Value
(000) | |
| New York City Municipal Water Finance Authority | |
| 5.72%, 6/15/42 | | $ | 30 | | | $ | 33 | | |
| New York City Transitional Finance Authority | |
| 5.27%, 5/1/27 | | | 120 | | | | 131 | | |
| North Texas Tollway Authority | |
| 6.72%, 1/1/49 | | | 90 | | | | 99 | | |
| San Diego County Water Authority | |
| 6.14%, 5/1/49 | | | 25 | | | | 28 | | |
San Francisco City & County Public Utilities
Commission | |
| 6.00%, 11/1/40 | | | 55 | | | | 58 | | |
| State of California | |
| 7.55%, 4/1/39 | | | 160 | | | | 175 | | |
| State of Illinois | |
| 6.63%, 2/1/35 | | | 50 | | | | 50 | | |
| State of Washington | |
| 5.09%, 8/1/33 | | | 90 | | | | 96 | | |
| | | | 2,113 | | |
| Sovereign (3.2%) | |
| Federative Republic of Brazil | |
| 8.25%, 1/20/34 | | | 280 | | | | 409 | | |
| Italian Republic | |
| 5.38%, 6/15/33 | | | 55 | | | | 56 | | |
| Province of Quebec Canada | |
| 7.50%, 9/15/29 | | | 117 | | | | 171 | | |
| Republic of Panama, | |
| 8.88%, 9/30/27 | | | 44 | | | | 64 | | |
| 9.38%, 4/1/29 | | | 43 | | | | 65 | | |
| Republic of Peru | |
| 8.75%, 11/21/33 | | | 65 | | | | 97 | | |
| United Mexican States | |
| 6.05%, 1/11/40 | | | 165 | | | | 190 | | |
| | | | 1,052 | | |
| U.S. Agency Securities (3.3%) | |
| Federal Home Loan Mortgage Corp., | |
| 6.25%, 7/15/32 | | | 160 | | | | 215 | | |
| 6.75%, 3/15/31 | | | 500 | | | | 702 | | |
| Federal National Mortgage Association | |
| 7.25%, 5/15/30 | | | 100 | | | | 146 | | |
| | | | 1,063 | | |
| U.S. Treasury Securities (35.7%) | |
| U.S. Treasury Bonds, | |
| 4.25%, 5/15/39 | | | 250 | | | | 275 | | |
| 4.38%, 11/15/39 | | | 3,740 | | | | 4,196 | | |
| 4.63%, 2/15/40 | | | 200 | | | | 234 | | |
| 6.13%, 11/15/27 | | | 1,170 | | | | 1,616 | | |
| 6.63%, 2/15/27 | | | 1,400 | | | | 2,021 | | |
| 6.75%, 8/15/26 | | | 100 | | | | 145 | | |
| 6.88%, 8/15/25 | | | 230 | | | | 334 | | |
| 7.13%, 2/15/23 | | | 239 | | | | 345 | | |
| 7.50%, 11/15/24 | | | 835 | | | | 1,266 | | |
| 7.63%, 11/15/22 | | | 395 | | | | 590 | | |
The accompanying notes are an integral part of the financial statements.
77
2010 Annual Report
September 30, 2010
Portfolio of Investments (cont'd)
Long Duration Fixed Income Portfolio
| | | Face
Amount
(000) | | Value
(000) | |
| U.S. Treasury Securities (cont'd) | |
| U.S. Treasury Notes, | |
| 3.13%, 4/30/17 | | $ | 200 | | | $ | 216 | | |
| 3.63%, 2/15/20 | | | 480 | | | | 527 | | |
| | | | 11,765 | | |
| Total Fixed Income Securities (Cost $28,673) | | | 32,302 | | |
| | | Shares | | | |
| Short-Term Investments (1.9%) | |
| Investment Company (1.0%) | |
Morgan Stanley Institutional
Liquidity Funds — Money Market
Portfolio — Institutional Class (Note G) | | | 323,248 | | | | 323 | | |
| | | Face
Amount
(000) | | | |
| U.S. Treasury Security (0.9%) | |
| U.S. Treasury Bill | |
| 0.20%, 10/28/10 (b)(c)(d) | | $ | 300 | | | | 300 | | |
| Total Short-Term Investments (Cost $623) | | | 623 | | |
| Total Investments (100.0%) (Cost $29,296) | | | 32,925 | | |
| Other Assets in Excess of Liabilities (0.0%) | | | 15 | | |
| Net Assets (100.0%) | | $ | 32,940 | | |
(a) 144A security — Certain conditions for public sale may exist. Unless otherwise noted, these securities are deemed to be liquid.
(b) Rate shown is the yield to maturity at September 30, 2010.
(c) All or a portion of the security was pledged to cover margin requirements for futures contracts.
(d) All or a portion of the security was pledged as collateral for swap agreements.
Futures Contracts
The Portfolio had the following futures contract(s) open at period end:
| | | Number
of
Contracts | | Value
(000) | | Expiration
Date | | Net Unrealized
Appreciation
(Depreciation)
(000) | |
| Long: | |
U.S. Treasury
10 yr. Note | | | 5 | | | $ | 630 | | | Dec-10 | | $ | 4 | | |
U.S. Treasury
30 yr. Bond | | | 13 | | | | 1,739 | | | Dec-10 | | | (15 | ) | |
U.S. Treasury
5 yr. Note | | | 13 | | | | 1,571 | | | Dec-10 | | | 12 | | |
| Short: | |
U.S. Treasury
2 yr. Note | | | (24 | ) | | | (5,268 | ) | | Dec-10 | | | (11 | ) | |
| | | | | | | | | | | | | $ | (10 | ) | |
Interest Rate Swap Agreements
The Portfolio had the following interest rate swap agreement(s) open at period end:
| Swap Counterparty | | Floating Rate
Index | | Pay/Receive
Floating Rate | | Fixed Rate | | Termination
Date | | Notional
Amount
(000) | | Net Unrealized
Appreciation
(Depreciation)
(000) | |
| Credit Suisse | | 3 Month LIBOR | | Receive | | | 2.63 | % | | 3/11/15 | | $ | 2,020 | | | $ | (116 | ) | |
| Credit Suisse | | 3 Month LIBOR | | Receive | | | 2.18 | | | 9/8/15 | | CAD | 953 | | | | (4 | ) | |
| Credit Suisse | | 3 Month LIBOR | | Receive | | | 2.21 | | | 9/8/15 | | | 686 | | | | (3 | ) | |
| Credit Suisse | | 3 Month LIBOR | | Pay | | | 4.07 | | | 9/8/20 | | | 1,115 | | | | 8 | | |
| Credit Suisse | | 3 Month LIBOR | | Pay | | | 4.12 | | | 9/8/20 | | | 804 | | | | 7 | | |
| | | | | | | | | | | | | | | | | $ | (108 | ) | |
CAD — Canadian Dollar
Zero Coupon Swap Agreements
The Portfolio had the following zero coupon swap agreement(s) open at period end:
| Swap Counterparty | | Notional
Amount
(000) | | Floating
Rate Index | | Pay/Receive
Floating Rate | | Termination
Date | | Net Unrealized
Appreciation
(Depreciation)
(000) | |
| Barclays Capital | | $ | 609 | | | 3 Month LIBOR | | Receive | | 11/15/19 | | $ | (125 | ) | |
| Barclays Capital | | | 995 | | | 3 Month LIBOR | | Pay | | 11/15/19 | | | 39 | | |
| Deutsche Bank | | | 370 | | | 3 Month LIBOR | | Receive | | 11/15/21 | | | (72 | ) | |
| JPMorgan Chase | | | 276 | | | 3 Month LIBOR | | Receive | | 11/15/19 | | | (53 | ) | |
| JPMorgan Chase | | | 256 | | | 3 Month LIBOR | | Receive | | 11/15/21 | | | (56 | ) | |
| | | | | | | | | | | | | $ | (267 | ) | |
LIBOR London Interbank Offered Rate
The accompanying notes are an integral part of the financial statements.
78
2010 Annual Report
September 30, 2010
Portfolio of Investments (cont'd)
Long Duration Fixed Income Portfolio
Fair Value Measurement Information:
The following is a summary of the inputs used to value the Portfolio's net assets as of September 30, 2010. (See Note A-7 to the financial statements for further information regarding fair value measurement.)
| Investment Type | | Level 1
Quoted
prices
(000) | | Level 2
Other
significant
observable
inputs
(000) | | Level 3
Significant
unobservable
inputs
(000) | | Total
(000) | |
| Assets: | |
Fixed Income
Securities | |
| Corporate Bonds | | $ | — | | | $ | 16,309 | | | $ | — | | | $ | 16,309 | | |
| Municipal Bonds | | | — | | | | 2,113 | | | | — | | | | 2,113 | | |
| Sovereign | | | — | | | | 1,052 | | | | — | | | | 1,052 | | |
| U.S. Agency Securities | | | — | | | | 1,063 | | | | — | | | | 1,063 | | |
| U.S. Treasury Securities | | | — | | | | 11,765 | | | | — | | | | 11,765 | | |
Total Fixed Income
Securities | | | — | | | | 32,302 | | | | — | | | | 32,302 | | |
Short-Term
Investments | |
| Investment Company | | | 323 | | | | — | | | | — | | | | 323 | | |
| U.S. Treasury Security | | | — | | | | 300 | | | | — | | | | 300 | | |
Total Short-Term
Investments | | | 323 | | | | 300 | | | | — | | | | 623 | | |
| Futures Contracts | | | 16 | | | | — | | | | — | | | | 16 | | |
Interest Rate Swap
Agreements | | | — | | | | 15 | | | | — | | | | 15 | | |
Zero Coupon Swap
Agreement | | | — | | | | 39 | | | | — | | | | 39 | | |
| Total Assets | | | 339 | | | | 32,656 | | | | — | | | | 32,995 | | |
| Liabilities: | |
| Futures Contracts | | | 26 | | | | — | | | | — | | | | 26 | | |
Interest Rate Swap
Agreements | | | — | | | | 123 | | | | — | | | | 123 | | |
Zero Coupon Swap
Agreements | | | — | | | | 306 | | | | — | | | | 306 | | |
| Total Liabilities | | | 26 | | | | 429 | | | | — | | | | 455 | | |
| Total | | $ | 313 | | | $ | 32,227 | | | $ | — | | | $ | 32,540 | | |
The accompanying notes are an integral part of the financial statements.
79
2010 Annual Report
September 30, 2010
Statements of Assets and Liabilities
| | | Balanced
Portfolio
(000) | | Mid Cap Growth
Portfolio
(000) | | Core Fixed
Income
Portfolio
(000) | | Core Plus Fixed
Income
Portfolio
(000) | |
| Assets: | |
| Investments in Securities of Unaffiliated Issuers, at Cost | | $ | 42,783 | | | $ | 4,592,749 | | | $ | 80,897 | | | $ | 546,669 | | |
| Investments in Securities of Affiliated Issuers, at Cost | | | 13,620 | | | | 359,619 | | | | 13,668 | | | | 36,170 | | |
| Total Investments in Securities, at Cost | | | 56,403 | | | | 4,952,368 | | | | 94,565 | | | | 582,839 | | |
| Foreign Currency, at Cost | | | 3 | | | | 1,014 | | | | — | | | | — | @ | |
| Investments in Securities of Unaffiliated Issuers, at Value(1) | | | 44,517 | | | | 5,394,415 | | | | 85,242 | | | | 570,487 | | |
| Investments in Securities of Affiliated Issuers, at Value | | | 13,666 | | | | 359,619 | | | | 13,668 | | | | 38,007 | | |
| Total Investments in Securities, at Value | | | 58,183 | | | | 5,754,034 | | | | 98,910 | | | | 608,494 | | |
| Foreign Currency, at Value | | | 5 | | | | 1,020 | | | | — | | | | — | @ | |
| Cash | | | 4 | | | | — | | | | — | | | | 649 | | |
| Receivable for Investments Sold | | | — | | | | 35,474 | | | | — | | | | — | | |
| Receivable for Delayed Delivery Commitments | | | 1,421 | | | | — | | | | 5,345 | | | | 23,408 | | |
| Receivable for Portfolio Shares Sold | | | — | | | | 9,137 | | | | 2 | | | | 328 | | |
| Interest Receivable | | | 149 | | | | — | | | | 655 | | | | 4,982 | | |
| Dividends Receivable | | | 29 | | | | 1,286 | | | | — | | | | — | | |
| Due from Broker | | | 505 | | | | — | | | | 7 | | | | 75 | | |
| Swap Agreements, at Value | | | 8 | | | | — | | | | 93 | | | | 247 | | |
| Tax Reclaim Receivable | | | 1 | | | | 183 | | | | — | @ | | | 2 | | |
| Receivable from Affiliates | | | 4 | | | | 43 | | | | 18 | | | | 115 | | |
| Unrealized Appreciation on Foreign Currency Exchange Contracts | | | 43 | | | | 9 | | | | — | | | | — | | |
| Other Assets | | | — | @ | | | 67 | | | | 8 | | | | 13 | | |
| Total Assets | | | 60,352 | | | | 5,801,253 | | | | 105,038 | | | | 638,313 | | |
| Liabilities: | |
| Collateral on Securities Loaned, at Value | | | 11,325 | | | | — | | | | 13,996 | | | | 25,211 | | |
| Payable for Investments Purchased | | | 222 | | | | 307,104 | | | | 429 | | | | 3,221 | | |
| Payable for Delayed Delivery Commitments | | | 3,295 | | | | — | | | | 12,875 | | | | 68,206 | | |
| Payable for Portfolio Shares Redeemed | | | 1 | | | | 7,655 | | | | 169 | | | | 76 | | |
| Swap Agreements, at Value | | | 139 | | | | — | | | | 1,343 | | | | 6,107 | | |
| Payable for Investment Advisory Fees | | | 50 | | | | 6,033 | | | | 14 | | | | 502 | | |
| Premium Received on Open Swap Contracts | | | 17 | | | | — | | | | 275 | | | | 1,299 | | |
| Payable for Sub Transfer Agency Fees | | | 10 | | | | 1,468 | | | | — | | | | 15 | | |
| Payable for Shareholder Servicing Fees — Class P | | | 4 | | | | 481 | | | | — | @ | | | 1 | | |
| Payable for Administration Fees | | | 3 | | | | 338 | | | | 5 | | | | 35 | | |
| Payable for Professional Fees | | | 42 | | | | 54 | | | | 39 | | | | 76 | | |
| Payable for Trustees' Fees and Expenses | | | 7 | | | | 51 | | | | 4 | | | | 79 | | |
| Payable for Custodian Fees | | | 7 | | | | 53 | | | | 2 | | | | 6 | | |
| Unrealized Depreciation on Foreign Currency Exchange Contracts | | | 47 | | | | 13 | | | | — | | | | — | | |
| Payable for Transfer Agent Fees | | | 4 | | | | 17 | | | | 1 | | | | 5 | | |
| Payable for Shareholder Servicing Fees — Investment Class | | | 1 | | | | — | | | | — | | | | 11 | | |
| Other Liabilities | | | 8 | | | | 428 | | | | 26 | | | | 86 | | |
| Total Liabilities | | | 15,182 | | | | 323,695 | | | | 29,178 | | | | 104,936 | | |
| Net Assets | | $ | 45,170 | | | $ | 5,477,558 | | | $ | 75,860 | | | $ | 533,377 | | |
| Net Assets Consist Of: | |
| Paid-in-Capital | | $ | 57,047 | | | $ | 5,009,511 | | | $ | 113,382 | | | $ | 1,031,610 | | |
| Undistributed Net Investment Income | | | 353 | | | | 10,899 | | | | 528 | | | | 5,908 | | |
| Accumulated Net Realized Loss | | | (13,950 | ) | | | (344,521 | ) | | | (41,170 | ) | | | (524,204 | ) | |
| Unrealized Appreciation (Depreciation) on: | |
| Investments | | | 1,734 | | | | 801,666 | | | | 4,043 | | | | 23,818 | | |
| Investments in Affiliates | | | 46 | | | | — | | | | 302 | | | | 1,837 | | |
| Futures Contracts | | | 72 | | | | — | | | | 25 | | | | 268 | | |
| Swap Agreements | | | (131 | ) | | | — | | | | (1,250 | ) | | | (5,860 | ) | |
| Foreign Currency Exchange Contracts | | | (4 | ) | | | (4 | ) | | | — | | | | — | | |
| Foreign Currency Translations | | | 3 | | | | 7 | | | | — | | | | — | @ | |
| Net Assets | | $ | 45,170 | | | $ | 5,477,558 | | | $ | 75,860 | | | $ | 533,377 | | |
The accompanying notes are an integral part of the financial statements.
80
2010 Annual Report
September 30, 2010
Statements of Assets and Liabilities (cont'd)
| | | Balanced
Portfolio
(000) | | Mid Cap Growth
Portfolio
(000) | | Core Fixed
Income
Portfolio
(000) | | Core Plus Fixed
Income
Portfolio
(000) | |
| CLASS I: | |
| Net Assets | | $ | 22,706 | | | $ | 3,012,006 | | | $ | 75,651 | | | $ | 434,657 | | |
Shares Outstanding (unlimited number of shares authorized, no par value)
(not in 000) | | | 1,808,622 | | | | 89,703,417 | | | | 7,592,596 | | | | 43,635,433 | | |
| Net Asset Value, Offering and Redemption Price Per Share | | $ | 12.55 | | | $ | 33.58 | | | $ | 9.96 | | | $ | 9.96 | | |
| INVESTMENT CLASS: | |
| Net Assets | | $ | 5,295 | | | $ | — | | | $ | — | | | $ | 92,988 | | |
Shares Outstanding (unlimited number of shares authorized, no par value)
(not in 000's) | | | 422,403 | | | | — | | | | — | | | | 9,339,639 | | |
| Net Asset Value, Offering and Redemption Price Per Share | | $ | 12.53 | | | $ | — | | | $ | — | | | $ | 9.96 | | |
| CLASS P: | |
| Net Assets | | $ | 17,169 | | | $ | 2,465,552 | | | $ | 209 | | | $ | 5,732 | | |
Shares Outstanding (unlimited number of shares authorized, no par value)
(not in 000) | | | 1,371,043 | | | | 75,842,997 | | | | 20,896 | | | | 574,735 | | |
| Net Asset Value, Offering and Redemption Price Per Share | | $ | 12.52 | | | $ | 32.51 | | | $ | 10.01 | | | $ | 9.97 | | |
(1) Including:
Securities on Loan, at Value: | | $ | 12,632 | | | $ | — | | | $ | 18,568 | | | $ | 34,018 | | |
@ Amount is less than $500.
The accompanying notes are an integral part of the financial statements.
81
2010 Annual Report
September 30, 2010
Statements of Assets and Liabilities
| | | Intermediate
Duration
Portfolio
(000) | | Investment
Grade Fixed
Income
Portfolio
(000) | | Limited
Duration
Portfolio
(000) | | Long Duration
Fixed Income
Portfolio
(000) | |
| Assets: | |
| Investments in Securities of Unaffiliated Issuers, at Cost | | $ | 85,953 | | | $ | 87,885 | | | $ | 198,800 | | | $ | 28,607 | | |
| Investments in Securities of Affiliated Issuers, at Cost | | | 1,138 | | | | 12,381 | | | | 6,675 | | | | 689 | | |
| Total Investments in Securities, at Cost | | | 87,091 | | | | 100,266 | | | | 205,475 | | | | 29,296 | | |
| Investments in Securities of Unaffiliated Issuers, at Value(1) | | | 92,030 | | | | 92,763 | | | | 205,306 | | | | 32,198 | | |
| Investments in Securities of Affiliated Issuers, at Value | | | 1,226 | | | | 12,907 | | | | 6,808 | | | | 727 | | |
| Total Investments in Securities, at Value | | | 93,256 | | | | 105,670 | | | | 212,114 | | | | 32,925 | | |
| Cash | | | 45 | | | | — | | | | — | | | | 40 | | |
| Receivable for Delayed Delivery Commitments | | | — | | | | 6,410 | | | | — | | | | — | | |
| Interest Receivable | | | 861 | | | | 764 | | | | 1,736 | | | | 467 | | |
| Swap Agreements, at Value | | | 189 | | | | — | | | | 260 | | | | 54 | | |
| Receivable from Affiliates | | | 21 | | | | 23 | | | | 158 | | | | 6 | | |
| Due from Broker | | | 14 | | | | 14 | | | | — | | | | — | | |
| Receivable for Portfolio Shares Sold | | | — | | | | — | | | | 16 | | | | — | | |
| Tax Reclaim Receivable | | | — | @ | | | 1 | | | | 5 | | | | — | @ | |
| Due from Adviser | | | — | | | | — | | | | — | | | | 4 | | |
| Other Assets | | | 1 | | | | 1 | | | | 4 | | | | 4 | | |
| Total Assets | | | 94,387 | | | | 112,883 | | | | 214,293 | | | | 33,500 | | |
| Liabilities: | |
| Collateral on Securities Loaned, at Value | | | — | | | | 9,998 | | | | — | | | | — | | |
| Payable for Delayed Delivery Commitments | | | — | | | | 14,999 | | | | — | | | | — | | |
| Swap Agreements, at Value | | | 1,832 | | | | 1,117 | | | | 3,475 | | | | 429 | | |
| Premium Received on Open Swap Contracts | | | 379 | | | | 252 | | | | 732 | | | | 83 | | |
| Payable for Investments Purchased | | | — | | | | 488 | | | | 835 | | | | — | | |
| Payable for Portfolio Shares Redeemed | | | — | | | | 213 | | | | 155 | | | | — | | |
| Payable for Investment Advisory Fees | | | 90 | | | | 82 | | | | 163 | | | | — | | |
| Payable for Sub Transfer Agency Fees | | | — | @ | | | 49 | | | | 125 | | | | — | @ | |
| Payable for Professional Fees | | | 33 | | | | 39 | | | | 37 | | | | 38 | | |
| Payable for Administration Fees | | | 6 | | | | 6 | | | | 14 | | | | 2 | | |
| Payable for Trustees' Fees and Expenses | | | 2 | | | | 13 | | | | 6 | | | | — | @ | |
| Due to Brokers | | | — | | | | — | | | | 16 | | | | 1 | | |
| Payable for Shareholder Servicing Fees — Investment Class | | | 11 | | | | — | | | | — | | | | — | | |
| Payable for Custodian Fees | | | 1 | | | | 2 | | | | 2 | | | | 1 | | |
| Payable for Transfer Agent Fees | | | 1 | | | | 2 | | | | 1 | | | | 1 | | |
| Payable for Distribution and Shareholder Servicing Fees — Class L | | | — | | | | 2 | | | | — | | | | — | | |
| Bank Overdraft | | | — | | | | — | | | | — | @ | | | — | | |
| Payable for Shareholder Servicing Fees — Class P | | | — | | | | — | @ | | | — | @ | | | — | @ | |
| Payable for Shareholder Servicing Fees — Class H | | | — | | | | — | @ | | | — | | | | — | | |
| Other Liabilities | | | 15 | | | | 16 | | | | 72 | | | | 5 | | |
| Total Liabilities | | | 2,370 | | | | 27,278 | | | | 5,633 | | | | 560 | | |
| Net Assets | | $ | 92,017 | | | $ | 85,605 | | | $ | 208,660 | | | $ | 32,940 | | |
| Net Assets Consist Of: | |
| Paid-in-Capital | | $ | 104,643 | | | $ | 145,362 | | | $ | 463,611 | | | $ | 28,144 | | |
| Undistributed (Distributions in Excess of) Net Investment Income | | | (2 | ) | | | 527 | | | | (13 | ) | | | 295 | | |
| Accumulated Net Realized Gain (Loss) | | | (17,157 | ) | | | (64,581 | ) | | | (258,401 | ) | | | 1,257 | | |
| Unrealized Appreciation (Depreciation) on: | |
| Investments | | | 6,077 | | | | 4,878 | | | | 6,506 | | | | 3,591 | | |
| Investments in Affiliates | | | 88 | | | | 526 | | | | 133 | | | | 38 | | |
| Futures Contracts | | | 11 | | | | 10 | | | | 39 | | | | (10 | ) | |
| Swap Agreements | | | (1,643 | ) | | | (1,117 | ) | | | (3,215 | ) | | | (375 | ) | |
| Foreign Currency Translations | | | — | | | | — | | | | — | | | | — | @ | |
| Net Assets | | $ | 92,017 | | | $ | 85,605 | | | $ | 208,660 | | | $ | 32,940 | | |
The accompanying notes are an integral part of the financial statements.
82
2010 Annual Report
September 30, 2010
Statements of Assets and Liabilities (cont'd)
| | |
Intermediate
Duration
Portfolio
(000) | | Investment
Grade Fixed
Income
Portfolio
(000) | |
Limited
Duration
Portfolio
(000) | |
Long Duration
Fixed Income
Portfolio
(000) | |
| CLASS I: | |
| Net Assets | | $ | 135 | | | $ | 79,337 | | | $ | 208,608 | | | $ | 32,354 | | |
Shares Outstanding (unlimited number of shares authorized, no par value)
(not in 000) | | | 13,577 | | | | 7,803,522 | | | | 26,778,284 | | | | 2,757,852 | | |
| Net Asset Value, Offering and Redemption Price Per Share | | $ | 9.94 | | | $ | 10.17 | | | $ | 7.79 | | | $ | 11.73 | | |
| INVESTMENT CLASS: | |
| Net Assets | | $ | 91,882 | | | $ | — | | | $ | — | | | $ | — | | |
Shares Outstanding (unlimited number of shares authorized, no par value)
(not in 000's) | | | 9,287,704 | | | | — | | | | — | | | | — | | |
| Net Asset Value, Offering and Redemption Price Per Share | | $ | 9.89 | | | $ | — | | | $ | — | | | $ | — | | |
| CLASS P: | |
| Net Assets | | $ | — | | | $ | 590 | | | $ | 52 | | | $ | 586 | | |
Shares Outstanding (unlimited number of shares authorized, no par value)
(not in 000) | | | — | | | | 58,110 | | | | 6,713 | | | | 50,000 | | |
| Net Asset Value, Offering and Redemption Price Per Share | | $ | — | | | $ | 10.16 | | | $ | 7.79 | | | $ | 11.72 | | |
| CLASS H: | |
| Net Assets | | $ | — | | | $ | 170 | | | $ | — | | | $ | — | | |
Shares Outstanding (unlimited number of shares authorized, no par value)
(not in 000) | | | — | | | | 16,707 | | | | — | | | | — | | |
| Net Asset Value, Redemption Price Per Share | | $ | — | | | $ | 10.16 | | | $ | — | | | $ | — | | |
| Maximum Sales Load | | | — | | | | 3.50 | % | | | — | | | | — | | |
| Maximum Sales Charge | | $ | — | | | $ | 0.37 | | | $ | — | | | $ | — | | |
| Maximum Offering Price Per Share | | $ | — | | | $ | 10.53 | | | $ | — | | | $ | — | | |
| CLASS L: | |
| Net Assets | | $ | — | | | $ | 5,508 | | | $ | — | | | $ | — | | |
Shares Outstanding (unlimited number of shares authorized, no par value)
(not in 000) | | | — | | | | 542,451 | | | | — | | | | — | | |
| Net Asset Value, Offering and Redemption Price Per Share | | $ | — | | | $ | 10.15 | | | $ | — | | | $ | — | | |
(1) Including:
Securities on Loan, at Value: | | $ | — | | | $ | 14,083 | | | $ | — | | | $ | — | | |
@ Amount is less than $500.
The accompanying notes are an integral part of the financial statements.
83
2010 Annual Report
September 30, 2010
Statements of Operations
For the Year Ended September 30, 2010
| | | Balanced
Portfolio
(000) | | Mid Cap
Growth
Portfolio
(000) | | Core Fixed
Income
Portfolio
(000) | | Core Plus
Fixed Income
Portfolio
(000) | |
| Investment Income: | |
| Dividends from Securities of Unaffiliated Issuers | | $ | 641 | | | $ | 46,496 | | | $ | — | | | $ | 2 | | |
| Dividends from Securities of Affiliated Issuers | | | 19 | | | | 369 | | | | 28 | | | | 262 | | |
| Interest from Securities of Unaffiliated Issuers | | | 634 | | | | — | | | | 3,287 | | | | 32,450 | | |
| Interest from Securities of Affiliated Issuers | | | 17 | | | | — | | | | 81 | | | | 829 | | |
| Less: Foreign Taxes Withheld | | | (2 | ) | | | (1,502 | ) | | | (1 | ) | | | (22 | ) | |
| Total Investment Income | | | 1,309 | | | | 45,363 | | | | 3,395 | | | | 33,521 | | |
| Expenses: | |
| Investment Advisory Fees (Note B) | | | 226 | | | | 21,333 | | | | 312 | | | | 3,111 | | |
| Shareholder Servicing Fees — Class P (Note D) | | | 44 | | | | 4,767 | | | | 1 | | | | 15 | | |
| Administration Fees (Note C) | | | 40 | | | | 3,413 | | | | 67 | | | | 663 | | |
| Sub Transfer Agency Fees | | | 22 | | | | 3,043 | | | | 30 | | | | 77 | | |
| Shareholder Reporting Fees | | | 16 | | | | 856 | | | | 31 | | | | 136 | | |
| Professional Fees | | | 42 | | | | 132 | | | | 39 | | | | 85 | | |
| Registration Fees | | | 35 | | | | 160 | | | | 33 | | | | 51 | | |
| Shareholder Servicing Fees — Investment Class (Note D) | | | 8 | | | | — | | | | — | | | | 155 | | |
| Custodian Fees (Note F) | | | 31 | | | | 209 | | | | 13 | | | | 37 | | |
| Transfer Agency Fees (Note E) | | | 17 | | | | 117 | | | | 9 | | | | 32 | | |
| Trustees' Fees and Expenses | | | 2 | | | | 103 | | | | 3 | | | | 28 | | |
| Pricing Fees | | | 9 | | | | 11 | | | | 9 | | | | 21 | | |
| Other Expenses | | | 7 | | | | 102 | | | | 10 | | | | 50 | | |
| Expenses Before Non Operating Expenses | | | 499 | | | | 34,246 | | | | 557 | | | | 4,461 | | |
| Bank Overdraft Expense | | | — | @ | | | — | | | | — | | | | 1 | | |
| Total Expenses | | | 499 | | | | 34,246 | | | | 557 | | | | 4,462 | | |
| Voluntary Waiver of Investment Advisory Fees (Note B) | | | — | | | | — | | | | (140 | ) | | | — | | |
| Rebate from Morgan Stanley Affiliate (Note G) | | | (5 | ) | | | (257 | ) | | | (4 | ) | | | (46 | ) | |
| Net Expenses | | | 494 | | | | 33,989 | | | | 413 | | | | 4,416 | | |
| Net Investment Income | | | 815 | | | | 11,374 | | | | 2,982 | | | | 29,105 | | |
| Realized Gain (Loss): | |
| Investments Sold | | | (2,155 | ) | | | 188,622 | | | | 3,272 | | | | 35,840 | | |
| Investments in Affiliates | | | (348 | ) | | | — | | | | 15 | | | | 1,365 | | |
| Foreign Currency Exchange Contracts | | | 174 | | | | (504 | ) | | | — | | | | 1 | | |
| Foreign Currency Transactions | | | (14 | ) | | | 86 | | | | — | | | | (3 | ) | |
| Futures Contracts | | | 99 | | | | — | | | | 302 | | | | 6,155 | | |
| Swap Agreements | | | (44 | ) | | | — | | | | (578 | ) | | | (5,691 | ) | |
| Net Realized Gain (Loss) | | | (2,288 | ) | | | 188,204 | | | | 3,011 | | | | 37,667 | | |
| Change in Unrealized Appreciation (Depreciation): | |
| Investments | | | 6,711 | | | | 777,425 | | | | 1,223 | | | | 6,639 | | |
| Investments in Affiliates | | | 46 | | | | — | | | | 302 | | | | 1,837 | | |
| Foreign Currency Exchange Contracts | | | (68 | ) | | | (4 | ) | | | — | | | | — | | |
| Foreign Currency Translations | | | 1 | | | | 7 | | | | — | | | | — | @ | |
| Futures Contracts | | | 48 | | | | — | | | | (7 | ) | | | (598 | ) | |
| Swap Agreements | | | (150 | ) | | | — | | | | (764 | ) | | | (2,565 | ) | |
| Net Change in Unrealized Appreciation (Depreciation) | | | 6,588 | | | | 777,428 | | | | 754 | | | | 5,313 | | |
Total Net Realized Gain (Loss) and Change in Unrealized
Appreciation (Depreciation) | | | 4,300 | | | | 965,632 | | | | 3,765 | | | | 42,980 | | |
| Net Increase in Net Assets Resulting from Operations | | $ | 5,115 | | | $ | 977,006 | | | $ | 6,747 | | | $ | 72,085 | | |
@ Amount is less than $500.
The accompanying notes are an integral part of the financial statements.
84
2010 Annual Report
September 30, 2010
Statements of Operations
For the Year Ended September 30, 2010
| | | Intermediate
Duration
Portfolio
(000) | | Investment
Grade Fixed
Income
Portfolio
(000) | | Limited
Duration
Portfolio
(000) | | Long Duration
Fixed Income
Portfolio
(000) | |
| Investment Income: | |
| Dividends from Securities of Affiliated Issuers | | $ | 4 | | | $ | 26 | | | $ | 8 | | | $ | 1 | | |
| Interest from Securities of Unaffiliated Issuers | | | 3,558 | | | | 3,847 | | | | 6,838 | | | | 1,651 | | |
| Interest from Securities of Affiliated Issuers | | | 79 | | | | 125 | | | | 138 | | | | 26 | | |
| Less: Foreign Taxes Withheld | | | (1 | ) | | | (1 | ) | | | (3 | ) | | | — | | |
| Total Investment Income | | | 3,640 | | | | 3,997 | | | | 6,981 | | | | 1,678 | | |
| Expenses: | |
| Investment Advisory Fees (Note B) | | | 395 | | | | 364 | | | | 711 | | | | 115 | | |
| Administration Fees (Note C) | | | 84 | | | | 78 | | | | 190 | | | | 24 | | |
| Sub Transfer Agency Fees | | | — | @ | | | 108 | | | | 190 | | | | — | @ | |
| Registration Fees | | | 33 | | | | 60 | | | | 36 | | | | 32 | | |
| Shareholder Servicing Fees — Investment Class (Note D) | | | 158 | | | | — | | | | — | | | | — | | |
| Professional Fees | | | 33 | | | | 36 | | | | 38 | | | | 38 | | |
| Shareholder Reporting Fees | | | 17 | | | | 26 | | | | 78 | | | | 3 | | |
| Transfer Agency Fees (Note E) | | | 7 | | | | 33 | | | | 10 | | | | 7 | | |
| Custodian Fees (Note F) | | | 9 | | | | 13 | | | | 12 | | | | 8 | | |
| Pricing Fees | | | 7 | | | | 9 | | | | 8 | | | | 9 | | |
| Shareholder Servicing Fees — Class P (Note D) | | | — | | | | 1 | | | | — | @ | | | 1 | | |
| Distribution and Shareholder Servicing Fees — Class L (Note D) | | | — | | | | 28 | | | | — | | | | — | | |
| Trustees' Fees and Expenses | | | 4 | | | | 4 | | | | 7 | | | | 2 | | |
| Shareholder Servicing Fees — Class H (Note D) | | | — | | | | — | @ | | | — | | | | — | | |
| Other Expenses | | | 9 | | | | 11 | | | | 16 | | | | 3 | | |
| Expenses Before Non Operating Expenses | | | 756 | | | | 771 | | | | 1,296 | | | | 242 | | |
| Bank Overdraft Expense | | | — | @ | | | 1 | | | | — | | | | — | | |
| Total Expenses | | | 756 | | | | 772 | | | | 1,296 | | | | 242 | | |
| Voluntary Waiver of Investment Advisory Fees (Note B) | | | — | | | | — | | | | — | | | | (89 | ) | |
| Voluntary Waiver of Shareholder Servicing Fees — Class P (Note D) | | | — | | | | (1 | ) | | | — | | | | — | | |
| Rebate from Morgan Stanley Affiliate (Note G) | | | (3 | ) | | | (5 | ) | | | (6 | ) | | | — | @ | |
| Net Expenses | | | 753 | | | | 766 | | | | 1,290 | | | | 153 | | |
| Net Investment Income | | | 2,887 | | | | 3,231 | | | | 5,691 | | | | 1,525 | | |
| Realized Gain (Loss): | |
| Investments Sold | | | 4,130 | | | | 4,372 | | | | 5,880 | | | | 1,321 | | |
| Investments in Affiliates | | | 75 | | | | 127 | | | | 160 | | | | 3 | | |
| Foreign Currency Exchange Contracts | | | — | | | | — | | | | — | | | | — | @ | |
| Foreign Currency Transactions | | | — | | | | — | | | | — | @ | | | — | @ | |
| Futures Contracts | | | (377 | ) | | | 500 | | | | (615 | ) | | | 479 | | |
| Swap Agreements | | | (323 | ) | | | (644 | ) | | | (826 | ) | | | (195 | ) | |
| Net Realized Gain | | | 3,505 | | | | 4,355 | | | | 4,599 | | | | 1,608 | | |
| Change in Unrealized Appreciation (Depreciation): | |
| Investments | | | 2,249 | | | | 527 | | | | (207 | ) | | | 908 | | |
| Investments in Affiliates | | | 88 | | | | 526 | | | | 133 | | | | 38 | | |
| Foreign Currency Translations | | | — | | | | — | | | | — | | | | — | @ | |
| Futures Contracts | | | (7 | ) | | | (158 | ) | | | 191 | | | | (33 | ) | |
| Swap Agreements | | | (975 | ) | | | (663 | ) | | | (1,815 | ) | | | (238 | ) | |
| Net Change in Unrealized Appreciation (Depreciation) | | | 1,355 | | | | 232 | | | | (1,698 | ) | | | 675 | | |
Total Net Realized Gain (Loss) and Change in Unrealized
Appreciation (Depreciation) | | | 4,860 | | | | 4,587 | | | | 2,901 | | | | 2,283 | | |
| Net Increase in Net Assets Resulting from Operations | | $ | 7,747 | | | $ | 7,818 | | | $ | 8,592 | | | $ | 3,808 | | |
@ Amount is less than $500.
The accompanying notes are an integral part of the financial statements.
85
2010 Annual Report
September 30, 2010
Statements of Changes in Net Assets
| | | Balanced
Portfolio | | Mid Cap Growth
Portfolio | |
| | | Year Ended
September 30,
2010
(000) | | Year Ended
September 30,
2009
(000) | | Year Ended
September 30,
2010
(000) | | Year Ended
September 30,
2009
(000) | |
| Increase (Decrease) in Net Assets: | |
| Operations: | |
| Net Investment Income | | $ | 815 | | | $ | 895 | | | $ | 11,374 | | | $ | 907 | | |
| Net Realized Gain (Loss) | | | (2,288 | ) | | | (6,075 | ) | | | 188,204 | | | | (57,337 | ) | |
| Net Change in Unrealized Appreciation (Depreciation) | | | 6,588 | | | | 6,028 | | | | 777,428 | | | | 477,258 | | |
| Net Increase in Net Assets Resulting from Operations | | | 5,115 | | | | 848 | | | | 977,006 | | | | 420,828 | | |
| Distributions from and/or in Excess of: | |
| Class I: | |
| Net Investment Income | | | (537 | ) | | | (1,893 | ) | | | (492 | ) | | | — | | |
| Investment Class: | |
| Net Investment Income | | | (85 | ) | | | (189 | ) | | | — | | | | — | | |
| Class P: | |
| Net Investment Income | | | (296 | ) | | | (1,105 | ) | | | — | | | | — | | |
| Total Distributions | | | (918 | ) | | | (3,187 | ) | | | (492 | ) | | | — | | |
| Capital Share Transactions:(1) | |
| Class I: | |
| Subscribed | | | 481 | | | | 6,036 | | | | 889,304 | | | | 518,584 | | |
| Distributions Reinvested | | | 537 | | | | 1,891 | | | | 472 | | | | — | | |
| Redeemed | | | (26,425 | ) | | | (3,599 | ) | | | (420,200 | ) | | | (346,494 | ) | |
| Investment Class: | |
| Subscribed | | | 294 | | | | 316 | | | | — | | | | — | | |
| Distributions Reinvested | | | 85 | | | | 189 | | | | — | | | | — | | |
| Redeemed | | | (105 | ) | | | — | | | | — | | | | — | | |
| Class P: | |
| Subscribed | | | 1,623 | | | | 1,945 | | | | 1,024,930 | | | | 629,880 | | |
| Distributions Reinvested | | | 295 | | | | 1,105 | | | | — | | | | — | | |
| Redeemed | | | (4,318 | ) | | | (14,376 | ) | | | (566,573 | ) | | | (496,259 | ) | |
| Net Increase (Decrease) in Net Assets Resulting from Capital Share Transactions | | | (27,533 | ) | | | (6,493 | ) | | | 927,933 | | | | 305,711 | | |
| Redemption Fees | | | — | | | | — | @ | | | — | | | | 121 | | |
| Total Increase (Decrease) in Net Assets | | | (23,336 | ) | | | (8,832 | ) | | | 1,904,447 | | | | 726,660 | | |
| Net Assets: | |
| Beginning of Period | | | 68,506 | | | | 77,338 | | | | 3,573,111 | | | | 2,846,451 | | |
| End of Period | | $ | 45,170 | | | $ | 68,506 | | | $ | 5,477,558 | | | $ | 3,573,111 | | |
| Undistributed Net Investment Income Included in End of Period Net Assets | | $ | 353 | | | $ | 287 | | | $ | 10,899 | | | $ | 435 | | |
| (1) Capital Share Transactions: | |
| Class I: | |
| Shares Subscribed | | | 40 | | | | 640 | | | | 29,554 | | | | 25,689 | | |
| Shares Issued on Distributions Reinvested | | | 45 | | | | 187 | | | | 17 | | | | — | | |
| Shares Redeemed | | | (2,184 | ) | | | (359 | ) | | | (14,261 | ) | | | (18,385 | ) | |
| Net Increase (Decrease) in Class I Shares Outstanding | | | (2,099 | ) | | | 468 | | | | 15,310 | | | | 7,304 | | |
| Investment Class: | |
| Shares Subscribed | | | 25 | | | | 30 | | | | — | | | | — | | |
| Shares Issued on Distributions Reinvested | | | 7 | | | | 19 | | | | — | | | | — | | |
| Shares Redeemed | | | (8 | ) | | | — | | | | — | | | | — | | |
| Net Increase in Investment Class Shares Outstanding | | | 24 | | | | 49 | | | | — | | | | — | | |
| Class P: | |
| Shares Subscribed | | | 134 | | | | 192 | | | | 35,479 | | | | 33,966 | | |
| Shares Issued on Distributions Reinvested | | | 25 | | | | 109 | | | | — | | | | — | | |
| Shares Redeemed | | | (360 | ) | | | (1,465 | ) | | | (19,574 | ) | | | (27,045 | ) | |
| Net Increase (Decrease) in Class P Shares Outstanding | | | (201 | ) | | | (1,164 | ) | | | 15,905 | | | | 6,921 | | |
@ Amount is less than $500.
The accompanying notes are an integral part of the financial statements.
86
2010 Annual Report
September 30, 2010
Statements of Changes in Net Assets
| | | Core Fixed Income
Portfolio | | Core Plus Fixed Income
Portfolio | |
| | | Year Ended
September 30,
2010
(000) | | Year Ended
September 30,
2009
(000) | | Year Ended
September 30,
2010
(000) | | Year Ended
September 30,
2009
(000) | |
| Increase (Decrease) in Net Assets: | |
| Operations: | |
| Net Investment Income | | $ | 2,982 | | | $ | 4,426 | | | $ | 29,105 | | | $ | 48,496 | | |
| Net Realized Gain (Loss) | | | 3,011 | | | | (10,956 | ) | | | 37,667 | | | | (242,307 | ) | |
| Net Change in Unrealized Appreciation (Depreciation) | | | 754 | | | | 15,918 | | | | 5,313 | | | | 257,459 | | |
| Net Increase in Net Assets Resulting from Operations | | | 6,747 | | | | 9,388 | | | | 72,085 | | | | 63,648 | | |
| Distributions from and/or in Excess of: | |
| Class I: | |
| Net Investment Income | | | (2,890 | ) | | | (8,961 | ) | | | (26,942 | ) | | | (72,875 | ) | |
| Investment Class: | |
| Net Investment Income | | | — | | | | — | | | | (3,836 | ) | | | (8,618 | ) | |
| Class P: | |
| Net Investment Income | | | (6 | ) | | | (18 | ) | | | (197 | ) | | | (5,514 | ) | |
| Total Distributions | | | (2,896 | ) | | | (8,979 | ) | | | (30,975 | ) | | | (87,007 | ) | |
| Capital Share Transactions:(1) | |
| Class I: | |
| Subscribed | | | 5,258 | | | | 7,793 | | | | 124,974 | | | | 67,837 | | |
| Distributions Reinvested | | | 2,881 | | | | 8,941 | | | | 26,764 | | | | 70,268 | | |
| Redeemed | | | (30,097 | ) | | | (109,677 | ) | | | (549,999 | ) | | | (531,332 | ) | |
| Investment Class: | |
| Subscribed | | | — | | | | — | | | | 26 | | | | — | | |
| Distributions Reinvested | | | — | | | | — | | | | — | | | | 5,818 | | |
| Redeemed | | | — | | | | — | | | | (27,291 | ) | | | (14,500 | ) | |
| Class P: | |
| Subscribed | | | — | | | | 22 | | | | 779 | | | | 2,388 | | |
| Distributions Reinvested | | | 6 | | | | 18 | | | | 196 | | | | 5,502 | | |
| Redeemed | | | (21 | ) | | | (317 | ) | | | (2,028 | ) | | | (95,502 | ) | |
| Net Decrease in Net Assets Resulting from Capital Share Transactions | | | (21,973 | ) | | | (93,220 | ) | | | (426,579 | ) | | | (489,521 | ) | |
| Redemption Fees | | | — | | | | 1 | | | | — | | | | 7 | | |
| Total Decrease in Net Assets | | | (18,122 | ) | | | (92,810 | ) | | | (385,469 | ) | | | (512,873 | ) | |
| Net Assets: | |
| Beginning of Period | | | 93,982 | | | | 186,792 | | | | 918,846 | | | | 1,431,719 | | |
| End of Period | | $ | 75,860 | | | $ | 93,982 | | | $ | 533,377 | | | $ | 918,846 | | |
| Undistributed Net Investment Income Included in End of Period Net Assets | | $ | 528 | | | $ | 845 | | | $ | 5,908 | | | $ | 7,467 | | |
| (1) Capital Share Transactions: | |
| Class I: | |
| Shares Subscribed | | | 548 | | | | 862 | | | | 13,192 | | | | 7,486 | | |
| Shares Issued on Distributions Reinvested | | | 303 | | | | 998 | | | | 2,836 | | | | 7,871 | | |
| Shares Redeemed | | | (3,142 | ) | | | (12,281 | ) | | | (57,130 | ) | | | (59,234 | ) | |
| Net Decrease in Class I Shares Outstanding | | | (2,291 | ) | | | (10,421 | ) | | | (41,102 | ) | | | (43,877 | ) | |
| Investment Class: | |
| Shares Subscribed | | | — | | | | — | | | | — | @@ | | | — | | |
| Shares Issued on Distributions Reinvested | | | — | | | | — | | | | — | | | | 667 | | |
| Shares Redeemed | | | — | | | | — | | | | (2,839 | ) | | | (1,630 | ) | |
| Net Decrease in Investment Class Shares Outstanding | | | — | | | | — | | | | (2,839 | ) | | | (963 | ) | |
| Class P: | |
| Shares Subscribed | | | — | | | | 2 | | | | 80 | | | | 274 | | |
| Shares Issued on Distributions Reinvested | | | 1 | | | | 2 | | | | 21 | | | | 618 | | |
| Shares Redeemed | | | (2 | ) | | | (35 | ) | | | (212 | ) | | | (10,619 | ) | |
| Net Decrease in Class P Shares Outstanding | | | (1 | ) | | | (31 | ) | | | (111 | ) | | | (9,727 | ) | |
@@ Amount is less than 500 shares.
The accompanying notes are an integral part of the financial statements.
87
2010 Annual Report
September 30, 2010
Statements of Changes in Net Assets
| | | Intermediate Duration
Portfolio | | Investment Grade Fixed Income
Portfolio | |
| | | Year Ended
September 30,
2010
(000) | | Year Ended
September 30,
2009
(000) | | Year Ended
September 30,
2010
(000) | | Year Ended
September 30,
2009
(000) | |
| Increase (Decrease) in Net Assets: | |
| Operations: | |
| Net Investment Income | | $ | 2,887 | | | $ | 3,223 | | | $ | 3,231 | | | $ | 7,519 | | |
| Net Realized Gain (Loss) | | | 3,505 | | | | (809 | ) | | | 4,355 | | | | (14,703 | ) | |
| Net Change in Unrealized Appreciation (Depreciation) | | | 1,355 | | | | 9,849 | | | | 232 | | | | 21,750 | | |
| Net Increase in Net Assets Resulting from Operations | | | 7,747 | | | | 12,263 | | | | 7,818 | | | | 14,566 | | |
| Distributions from and/or in Excess of: | |
| Class I: | |
| Net Investment Income | | | (4 | ) | | | (75 | ) | | | (3,953 | ) | | | (14,637 | ) | |
| Investment Class: | |
| Net Investment Income | | | (2,980 | ) | | | (3,906 | ) | | | — | | | | — | | |
| Class P: | |
| Net Investment Income | | | — | | | | — | | | | (24 | ) | | | (37 | ) | |
| Class H: | |
| Net Investment Income | | | — | | | | — | | | | (6 | ) | | | (6 | ) | |
| Class L: | |
| Net Investment Income | | | — | | | | — | | | | (200 | ) | | | (48 | ) | |
| Total Distributions | | | (2,984 | ) | | | (3,981 | ) | | | (4,183 | ) | | | (14,728 | ) | |
| Capital Share Transactions:(1) | |
| Class I: | |
| Subscribed | | | 8 | | | | 24 | | | | 6,110 | | | | 63,348 | | |
| Distributions Reinvested | | | 4 | | | | 74 | | | | 3,815 | | | | 14,421 | | |
| Redeemed | | | (15 | ) | | | (3,505 | ) | | | (74,847 | ) | | | (253,405 | ) | |
| Investment Class: | |
| Subscribed | | | 33 | | | | — | | | | — | | | | — | | |
| Distributions Reinvested | | | — | | | | 1,642 | | | | — | | | | — | | |
| Redeemed | | | (52,415 | ) | | | (2,500 | ) | | | — | | | | — | | |
| Class P: | |
| Subscribed | | | — | | | | — | | | | — | @ | | | — | | |
| Distributions Reinvested | | | — | | | | — | | | | 23 | | | | 36 | | |
| Redeemed | | | — | | | | — | | | | (69 | ) | | | (268 | ) | |
| Class H: | |
| Subscribed | | | — | | | | — | | | | — | @ | | | 69 | | |
| Distributions Reinvested | | | — | | | | — | | | | 3 | | | | 2 | | |
| Redeemed | | | — | | | | — | | | | (2 | ) | | | (2 | ) | |
| Class L: | |
| Subscribed | | | — | | | | — | | | | 1,986 | | | | 5,401 | | |
| Distributions Reinvested | | | — | | | | — | | | | 194 | | | | 47 | | |
| Redeemed | | | — | | | | — | | | | (2,065 | ) | | | (545 | ) | |
| Net Decrease in Net Assets Resulting from Capital Share Transactions | | | (52,385 | ) | | | (4,265 | ) | | | (64,852 | ) | | | (170,896 | ) | |
| Redemption Fees | | | — | | | | — | | | | — | | | | 1 | | |
| Total Increase (Decrease) in Net Assets | | | (47,622 | ) | | | 4,017 | | | | (61,217 | ) | | | (171,057 | ) | |
| Net Assets: | |
| Beginning of Period | | | 139,639 | | | | 135,622 | | | | 146,822 | | | | 317,879 | | |
| End of Period | | $ | 92,017 | | | $ | 139,639 | | | $ | 85,605 | | | $ | 146,822 | | |
Undistributed (Distributions in Excess of) Net Investment Income Included in
End of Period Net Assets | | $ | (2 | ) | | $ | 443 | | | $ | 527 | | | $ | 1,774 | | |
@ Amount is less than $500.
The accompanying notes are an integral part of the financial statements.
88
2010 Annual Report
September 30, 2010
Statements of Changes in Net Assets (cont'd)
| | | Intermediate Duration
Portfolio | | Investment Grade Fixed Income
Portfolio | |
| | | Year Ended
September 30,
2010
(000) | | Year Ended
September 30,
2009
(000) | | Year Ended
September 30,
2010
(000) | | Year Ended
September 30,
2009
(000) | |
| (1) Capital Share Transactions: | |
| Class I: | |
| Shares Subscribed | | | 1 | | | | 3 | | | | 622 | | | | 6,858 | | |
| Shares Issued on Distributions Reinvested | | | — | @@ | | | 8 | | | | 392 | | | | 1,545 | | |
| Shares Redeemed | | | (2 | ) | | | (386 | ) | | | (7,658 | ) | | | (26,918 | ) | |
| Net Decrease in Class I Shares Outstanding | | | (1 | ) | | | (375 | ) | | | (6,644 | ) | | | (18,515 | ) | |
| Investment Class: | |
| Shares Subscribed | | | — | @@ | | | — | | | | — | | | | — | | |
| Shares Issued on Distributions Reinvested | | | — | | | | 186 | | | | — | | | | — | | |
| Shares Redeemed | | | (5,481 | ) | | | (268 | ) | | | — | | | | — | | |
| Net Decrease in Investment Class Shares Outstanding | | | (5,481 | ) | | | (82 | ) | | | — | | | | — | | |
| Class P: | |
| Shares Subscribed | | | — | | | | — | | | | — | @@ | | | — | | |
| Shares Issued on Distributions Reinvested | | | — | | | | — | | | | 2 | | | | 4 | | |
| Shares Redeemed | | | — | | | | — | | | | (7 | ) | | | (29 | ) | |
| Net Decrease in Class P Shares Outstanding | | | — | | | | — | | | | (5 | ) | | | (25 | ) | |
| Class H: | |
| Shares Subscribed | | | — | | | | — | | | | — | @@ | | | 8 | | |
| Shares Issued on Distributions Reinvested | | | — | | | | — | | | | — | @@ | | | — | @@ | |
| Shares Redeemed | | | — | | | | — | | | | — | @@ | | | — | @@ | |
| Net Increase (Decrease) in Class H Shares Outstanding | | | — | | | | — | | | | — | @@ | | | 8 | | |
| Class L: | |
| Shares Subscribed | | | — | | | | — | | | | 202 | | | | 575 | | |
| Shares Issued on Distributions Reinvested | | | — | | | | — | | | | 20 | | | | 5 | | |
| Shares Redeemed | | | — | | | | — | | | | (210 | ) | | | (56 | ) | |
| Net Increase in Class L Shares Outstanding | | | — | | | | — | | | | 12 | | | | 524 | | |
@@ Amount is less than 500 shares.
The accompanying notes are an integral part of the financial statements.
89
2010 Annual Report
September 30, 2010
Statements of Changes in Net Assets
| | | Limited Duration
Portfolio | | Long Duration Fixed Income
Portfolio | |
| | | Year Ended
September 30,
2010
(000) | | Year Ended
September 30,
2009
(000) | | Year Ended
September 30,
2010
(000) | | Year Ended
September 30,
2009
(000) | |
| Increase (Decrease) in Net Assets: | |
| Operations: | |
| Net Investment Income | | $ | 5,691 | | | $ | 11,086 | | | $ | 1,525 | | | $ | 1,351 | | |
| Net Realized Gain (Loss) | | | 4,599 | | | | (127,427 | ) | | | 1,608 | | | | 1,655 | | |
| Net Change in Unrealized Appreciation (Depreciation) | | | (1,698 | ) | | | 112,183 | | | | 675 | | | | 2,907 | | |
| Net Increase (Decrease) in Net Assets Resulting from Operations | | | 8,592 | | | | (4,158 | ) | | | 3,808 | | | | 5,913 | | |
| Distributions from and/or in Excess of: | |
| Class I: | |
| Net Investment Income | | | (5,286 | ) | | | (22,797 | ) | | | (1,518 | ) | | | (1,536 | ) | |
| Net Realized Gain | | | — | | | | — | | | | (1,612 | ) | | | — | | |
| Paid-in-Capital | | | (161 | ) | | | — | | | | — | | | | — | | |
| Class P: | |
| Net Investment Income | | | (2 | ) | | | (10 | ) | | | (26 | ) | | | (27 | ) | |
| Net Realized Gain | | | — | | | | — | | | | (30 | ) | | | — | | |
| Paid-in-Capital | | | — | @ | | | — | | | | — | | | | — | | |
| Total Distributions | | | (5,449 | ) | | | (22,807 | ) | | | (3,186 | ) | | | (1,563 | ) | |
| Capital Share Transactions:(1) | |
| Class I: | |
| Subscribed | | | 13,427 | | | | 13,007 | | | | 7 | | | | 193 | | |
| Distributions Reinvested | | | 5,446 | | | | 22,796 | | | | 326 | | | | 153 | | |
| Redeemed | | | (76,202 | ) | | | (314,216 | ) | | | — | | | | (645 | ) | |
| Class P: | |
| Subscribed | | | — | | | | 77 | | | | — | | | | — | | |
| Distributions Reinvested | | | 2 | | | | 10 | | | | — | | | | — | | |
| Redeemed | | | (119 | ) | | | (200 | ) | | | — | | | | — | | |
| Net Increase (Decrease) in Net Assets Resulting from Capital Share Transactions | | | (57,446 | ) | | | (278,526 | ) | | | 333 | | | | (299 | ) | |
| Redemption Fees | | | — | | | | 4 | | | | — | | | | — | | |
| Total Increase (Decrease) in Net Assets | | | (54,303 | ) | | | (305,487 | ) | | | 955 | | | | 4,051 | | |
| Net Assets: | |
| Beginning of Period | | | 262,963 | | | | 568,450 | | | | 31,985 | | | | 27,934 | | |
| End of Period | | $ | 208,660 | | | $ | 262,963 | | | $ | 32,940 | | | $ | 31,985 | | |
Undistributed (Distributions in Excess of) Net Investment Income Included in
End of Period Net Assets | | $ | (13 | ) | | $ | 310 | | | $ | 295 | | | $ | 511 | | |
| (1) Capital Share Transactions: | |
| Class I: | |
| Shares Subscribed | | | 1,742 | | | | 1,692 | | | | — | @ | | | 18 | | |
| Shares Issued on Distributions Reinvested | | | 708 | | | | 3,013 | | | | 30 | | | | 14 | | |
| Shares Redeemed | | | (9,893 | ) | | | (41,504 | ) | | | — | | | | (68 | ) | |
| Net Increase (Decrease) in Class I Shares Outstanding | | | (7,443 | ) | | | (36,799 | ) | | | 30 | | | | (36 | ) | |
| Class P: | |
| Shares Subscribed | | | — | | | | 10 | | | | — | | | | — | | |
| Shares Issued on Distributions Reinvested | | | — | @@ | | | 1 | | | | — | | | | — | | |
| Shares Redeemed | | | (16 | ) | | | (26 | ) | | | — | | | | — | | |
| Net Decrease in Class P Shares Outstanding | | | (16 | ) | | | (15 | ) | | | — | | | | — | | |
@ Amount is less than $500.
@@ Amount is less than 500 shares.
The accompanying notes are an integral part of the financial statements.
90
2010 Annual Report
September 30, 2010
Financial Highlights
Balanced Portfolio
| | | Class I | |
| | | Year Ended September 30, | |
| Selected Per Share Data and Ratios | | 2010 | | 2009 | | 2008 | | 2007 | | 2006 | |
| Net Asset Value, Beginning of Period | | $ | 11.66 | | | $ | 11.87 | | | $ | 14.69 | | | $ | 12.63 | | | $ | 11.95 | | |
| Income (Loss) from Investment Operations: | |
| Net Investment Income† | | | 0.21 | | | | 0.16 | | | | 0.38 | | | | 0.32 | | | | 0.25 | | |
| Net Realized and Unrealized Gain (Loss) on Investments | | | 0.91 | | | | 0.17 | | | | (2.84 | ) | | | 2.00 | | | | 0.72 | | |
| Total from Investment Operations | | | 1.12 | | | | 0.33 | | | | (2.46 | ) | | | 2.32 | | | | 0.97 | | |
| Distributions from and/or in Excess of: | |
| Net Investment Income | | | (0.23 | ) | | | (0.54 | ) | | | (0.36 | ) | | | (0.26 | ) | | | (0.29 | ) | |
| Redemption Fees | | | — | | | | 0.00 | ‡ | | | 0.00 | ‡ | | | 0.00 | ‡ | | | 0.00 | ‡ | |
| Net Asset Value, End of Period | | $ | 12.55 | | | $ | 11.66 | | | $ | 11.87 | | | $ | 14.69 | | | $ | 12.63 | | |
| Total Return++ | | | 9.77 | % | | | 3.45 | %** | | | (17.02 | )% | | | 18.57 | % | | | 8.21 | % | |
| Ratios and Supplemental Data: | |
| Net Assets, End of Period (Thousands) | | $ | 22,706 | | | $ | 45,567 | | | $ | 40,799 | | | $ | 310,886 | | | $ | 256,754 | | |
| Ratio of Expenses to Average Net Assets (1) | | | 0.89 | %+(2) | | | 0.67 | %+ | | | 0.57 | %+ | | | 0.61 | %+ | | | 0.60 | % | |
| Ratio of Net Investment Income to Average Net Assets (1) | | | 1.73 | %+(2) | | | 1.56 | %+ | | | 2.66 | %+ | | | 2.35 | %+ | | | 2.02 | % | |
| Ratio of Rebate from Morgan Stanley Affiliates to Average Net Assets | | | 0.01 | % | | | 0.04 | % | | | 0.05 | % | | | 0.00 | %§ | | | N/A | | |
| Portfolio Turnover Rate | | | 176 | % | | | 171 | % | | | 148 | % | | | 60 | % | | | 71 | % | |
| (1) Supplemental Information on the Ratios to Average Net Assets: | |
| Ratios Before Expense Limitation: | |
| Expenses to Average Net Assets | | | N/A | | | | N/A | | | | 0.58 | %+ | | | N/A | | | | N/A | | |
| Net Investment Income to Average Net Assets | | | N/A | | | | N/A | | | | 2.65 | %+ | | | N/A | | | | N/A | | |
† Per share amount is based on average shares outstanding.
‡ Amount is less than $0.005 per share.
++ Calculated based on the net asset value as of the last business day of the period.
** Performance was positively impacted by approximately 0.79% due to the receipt of proceeds from the settlements of class action suits involving primarily two of the Portfolio's past holdings. This was a one-time settlement, and as a result, the impact on the NAV and consequently the performance will not likely be repeated in the future. Had these settlements not occurred, the total return for Class I shares would have been approximately 2.66%.
+ The Ratios of Expenses and Net Investment Income reflect the rebate of certain Portfolio expenses in connection with the investments in Morgan Stanley affiliates during the period. The effect of the rebate on the ratios is disclosed in the above table as "Ratio of Rebate from Morgan Stanley Affiliates to Average Net Assets".
§ Amount is less than 0.005%.
(2) Reflects overall Portfolio ratios for investment income and non-class specific expenses.
The accompanying notes are an integral part of the financial statements.
91
2010 Annual Report
September 30, 2010
Financial Highlights
Balanced Portfolio
| | | Investment Class | |
| | | Year Ended September 30, | |
| Selected Per Share Data and Ratios | | 2010 | | 2009 | | 2008 | | 2007 | | 2006 | |
| Net Asset Value, Beginning of Period | | $ | 11.64 | | | $ | 11.85 | | | $ | 14.67 | | | $ | 12.61 | | | $ | 11.93 | | |
| Income (Loss) from Investment Operations: | |
| Net Investment Income† | | | 0.19 | | | | 0.14 | | | | 0.35 | | | | 0.30 | | | | 0.23 | | |
| Net Realized and Unrealized Gain (Loss) on Investments | | | 0.91 | | | | 0.17 | | | | (2.83 | ) | | | 2.00 | | | | 0.72 | | |
| Total from Investment Operations | | | 1.10 | | | | 0.31 | | | | (2.48 | ) | | | 2.30 | | | | 0.95 | | |
| Distributions from and/or in Excess of: | |
| Net Investment Income | | | (0.21 | ) | | | (0.52 | ) | | | (0.34 | ) | | | (0.24 | ) | | | (0.27 | ) | |
| Redemption Fees | | | — | | | | 0.00 | ‡ | | | 0.00 | ‡ | | | 0.00 | ‡ | | | 0.00 | ‡ | |
| Net Asset Value, End of Period | | $ | 12.53 | | | $ | 11.64 | | | $ | 11.85 | | | $ | 14.67 | | | $ | 12.61 | | |
| Total Return++ | | | 9.62 | % | | | 3.30 | %** | | | (17.17 | )% | | | 18.43 | % | | | 8.07 | % | |
| Ratios and Supplemental Data: | |
| Net Assets, End of Period (Thousands) | | $ | 5,295 | | | $ | 4,649 | | | $ | 4,141 | | | $ | 5,103 | | | $ | 4,102 | | |
| Ratio of Expenses to Average Net Assets | | | 1.04 | %+(1) | | | 0.87 | %+ | | | 0.79 | %+ | | | 0.76 | %+ | | | 0.75 | % | |
| Ratio of Net Investment Income to Average Net Assets | | | 1.58 | %+(1) | | | 1.35 | %+ | | | 2.50 | %+ | | | 2.21 | %+ | | | 1.87 | % | |
| Ratio of Rebate from Morgan Stanley Affiliates to Average Net Assets | | | 0.01 | % | | | 0.04 | % | | | 0.05 | % | | | 0.00 | %§ | | | N/A | | |
| Portfolio Turnover Rate | | | 176 | % | | | 171 | % | | | 148 | % | | | 60 | % | | | 71 | % | |
† Per share amount is based on average shares outstanding.
‡ Amount is less than $0.005 per share.
++ Calculated based on the net asset value as of the last business day of the period.
** Performance was positively impacted by approximately 0.80% due to the receipt of proceeds from the settlements of class action suits involving primarily two of the Portfolio's past holdings. This was a one-time settlement, and as a result, the impact on the NAV and consequently the performance will not likely be repeated in the future. Had these settlements not occurred, the total return for Investment Class shares would have been approximately 2.50%.
+ The Ratios of Expenses and Net Investment Income reflect the rebate of certain Portfolio expenses in connection with the investments in Morgan Stanley affiliates during the period. The effect of the rebate on the ratios is disclosed in the above table as "Ratio of Rebate from Morgan Stanley Affiliates to Average Net Assets".
§ Amount is less than 0.005%.
(1) Reflects overall Portfolio ratios for investment income and non-class specific expenses.
The accompanying notes are an integral part of the financial statements.
92
2010 Annual Report
September 30, 2010
Financial Highlights
Balanced Portfolio
| | | Class P | |
| | | Year Ended September 30, | |
| Selected Per Share Data and Ratios | | 2010 | | 2009 | | 2008 | | 2007 | | 2006 | |
| Net Asset Value, Beginning of Period | | $ | 11.63 | | | $ | 11.84 | | | $ | 14.66 | | | $ | 12.61 | | | $ | 11.93 | | |
| Income (Loss) from Investment Operations: | |
| Net Investment Income† | | | 0.18 | | | | 0.13 | | | | 0.32 | | | | 0.29 | | | | 0.22 | | |
| Net Realized and Unrealized Gain (Loss) on Investments | | | 0.91 | | | | 0.17 | | | | (2.81 | ) | | | 1.98 | | | | 0.72 | | |
| Total from Investment Operations | | | 1.09 | | | | 0.30 | | | | (2.49 | ) | | | 2.27 | | | | 0.94 | | |
| Distributions from and/or in Excess of: | |
| Net Investment Income | | | (0.20 | ) | | | (0.51 | ) | | | (0.33 | ) | | | (0.22 | ) | | | (0.26 | ) | |
| Redemption Fees | | | — | | | | 0.00 | ‡ | | | 0.00 | ‡ | | | 0.00 | ‡ | | | 0.00 | ‡ | |
| Net Asset Value, End of Period | | $ | 12.52 | | | $ | 11.63 | | | $ | 11.84 | | | $ | 14.66 | | | $ | 12.61 | | |
| Total Return++ | | | 9.52 | % | | | 3.15 | %** | | | (17.26 | )% | | | 18.23 | % | | | 7.96 | % | |
| Ratios and Supplemental Data: | |
| Net Assets, End of Period (Thousands) | | $ | 17,169 | | | $ | 18,290 | | | $ | 32,398 | | | $ | 31,183 | | | $ | 36,870 | | |
| Ratio of Expenses to Average Net Assets (1) | | | 1.14 | %+(2) | | | 1.03 | %+ | | | 0.90 | %+ | | | 0.87 | %+ | | | 0.85 | % | |
| Ratio of Net Investment Income to Average Net Assets (1) | | | 1.48 | %+(2) | | | 1.27 | %+ | | | 2.35 | %+ | | | 2.11 | %+ | | | 1.77 | % | |
| Ratio of Rebate from Morgan Stanley Affiliates to Average Net Assets | | | 0.01 | % | | | 0.04 | % | | | 0.06 | % | | | 0.00 | %§ | | | N/A | | |
| Portfolio Turnover Rate | | | 176 | % | | | 171 | % | | | 148 | % | | | 60 | % | | | 71 | % | |
| (1) Supplemental Information on the Ratios to Average Net Assets: | |
| Ratios Before Expense Limitation: | |
| Expenses to Average Net Assets | | | N/A | | | | 1.08 | %+ | | | 0.91 | %+ | | | N/A | | | | N/A | | |
| Net Investment Income to Average Net Assets | | | N/A | | | | 1.22 | %+ | | | 2.34 | %+ | | | N/A | | | | N/A | | |
† Per share amount is based on average shares outstanding.
‡ Amount is less than $0.005 per share.
++ Calculated based on the net asset value as of the last business day of the period.
** Performance was positively impacted by approximately 0.80% due to the receipt of proceeds from the settlements of class action suits involving primarily two of the Portfolio's past holdings. This was a one-time settlement, and as a result, the impact on the NAV and consequently the performance will not likely be repeated in the future. Had these settlements not occurred, the total return for Class P shares would have been approximately 2.35%.
+ The Ratios of Expenses and Net Investment Income reflect the rebate of certain Portfolio expenses in connection with the investments in Morgan Stanley affiliates during the period. The effect of the rebate on the ratios is disclosed in the above table as "Ratio of Rebate from Morgan Stanley Affiliates to Average Net Assets".
§ Amount is less than 0.005%.
(2) Reflects overall Portfolio ratios for investment income and non-class specific expenses.
The accompanying notes are an integral part of the financial statements.
93
2010 Annual Report
September 30, 2010
Financial Highlights
Mid Cap Growth Portfolio
| | | Class I | |
| | | Year Ended September 30, | |
| Selected Per Share Data and Ratios | | 2010 | | 2009 | | 2008 | | 2007 | | 2006 | |
| Net Asset Value, Beginning of Period | | $ | 26.96 | | | $ | 23.99 | | | $ | 33.68 | | | $ | 25.21 | | | $ | 23.54 | | |
| Income (Loss) from Investment Operations: | |
| Net Investment Income† | | | 0.11 | | | | 0.03 | | | | 0.05 | ^ | | | 0.17 | | | | 0.09 | | |
| Net Realized and Unrealized Gain (Loss) on Investments | | | 6.52 | | | | 2.94 | | | | (9.58 | ) | | | 8.42 | | | | 1.58 | | |
| Total from Investment Operations | | | 6.63 | | | | 2.97 | | | | (9.53 | ) | | | 8.59 | | | | 1.67 | | |
| Distributions from and/or in Excess of: | |
| Net Investment Income | | | (0.01 | ) | | | — | | | | (0.16 | ) | | | (0.12 | ) | | | — | | |
| Redemption Fees | | | — | | | | 0.00 | ‡ | | | 0.00 | ‡ | | | 0.00 | ‡ | | | 0.00 | ‡ | |
| Net Asset Value, End of Period | | $ | 33.58 | | | $ | 26.96 | | | $ | 23.99 | | | $ | 33.68 | | | $ | 25.21 | | |
| Total Return++ | | | 24.58 | % | | | 12.38 | %** | | | (28.42 | )%^ | | | 34.24 | % | | | 7.05 | %¥ | |
| Ratios and Supplemental Data: | |
| Net Assets, End of Period (Thousands) | | $ | 3,012,006 | | | $ | 2,005,809 | | | $ | 1,609,506 | | | $ | 1,647,326 | | | $ | 1,001,395 | | |
| Ratio of Expenses to Average Net Assets | | | 0.68 | %+(1) | | | 0.69 | %+ | | | 0.63 | %+ | | | 0.63 | %+ | | | 0.63 | % | |
| Ratio of Net Investment Income to Average Net Assets | | | 0.38 | %+(1) | | | 0.16 | %+ | | | 0.17 | %+ | | | 0.57 | %+ | | | 0.37 | % | |
| Ratio of Rebate from Morgan Stanley Affiliates to Average Net Assets | | | 0.01 | % | | | 0.01 | % | | | 0.00 | %§ | | | 0.00 | %§ | | | N/A | | |
| Portfolio Turnover Rate | | | 23 | % | | | 27 | % | | | 37 | % | | | 64 | % | | | 65 | % | |
† Per share amount is based on average shares outstanding.
^ During the year, the Portfolio received a regulatory settlement from an unaffiliated third party, which had an impact of less than $0.005 on net investment income per share and less than 0.005% on total returns for Class I.
‡ Amount is less than $0.005 per share.
++ Calculated based on the net asset value as of the last business day of the period.
** Performance was positively impacted by approximately 0.04% due to the receipt of proceeds from the settlements of class action suits involving primarily two of the Portfolio's past holdings. This was a one-time settlement, and as a result, the impact on the NAV and consequently the performance will not likely be repeated in the future. Had these settlements not occurred, the total return for Class I shares would have been approximately 12.34%.
¥ The Adviser fully reimbursed the Portfolio for losses incurred resulting from the disposal of investments in violation of restrictions. The impact of this reimbursement is not reflected in the total return shown above. With this reimbursement, the total return for Class I would have been 7.09%.
+ The Ratios of Expenses and Net Investment Income reflect the rebate of certain Portfolio expenses in connection with the investments in Morgan Stanley affiliates during the period. The effect of the rebate on the ratios is disclosed in the above table as "Ratio of Rebate from Morgan Stanley Affiliates to Average Net Assets".
§ Amount is less than 0.005%.
(1) Reflects overall Portfolio ratios for investment income and non-class specific expenses.
The accompanying notes are an integral part of the financial statements.
94
2010 Annual Report
September 30, 2010
Financial Highlights
Mid Cap Growth Portfolio
| | | Class P | |
| | | Year Ended September 30, | |
| Selected Per Share Data and Ratios | | 2010 | | 2009 | | 2008 | | 2007 | | 2006 | |
| Net Asset Value, Beginning of Period | | $ | 26.15 | | | $ | 23.33 | | | $ | 32.78 | | | $ | 24.54 | | | $ | 22.97 | | |
| Income (Loss) from Investment Operations: | |
| Net Investment Income (Loss)† | | | 0.04 | | | | (0.02 | ) | | | (0.02 | )^ | | | 0.09 | | | | 0.03 | | |
| Net Realized and Unrealized Gain (Loss) on Investments | | | 6.32 | | | | 2.84 | | | | (9.34 | ) | | | 8.20 | | | | 1.54 | | |
| Total from Investment Operations | | | 6.36 | | | | 2.82 | | | | (9.36 | ) | | | 8.29 | | | | 1.57 | | |
| Distributions from and/or in Excess of: | |
| Net Investment Income | | | — | | | | — | | | | (0.09 | ) | | | (0.05 | ) | | | — | | |
| Redemption Fees | | | — | | | | 0.00 | ‡ | | | 0.00 | ‡ | | | 0.00 | ‡ | | | 0.00 | ‡ | |
| Net Asset Value, End of Period | | $ | 32.51 | | | $ | 26.15 | | | $ | 23.33 | | | $ | 32.78 | | | $ | 24.54 | | |
| Total Return++ | | | 24.32 | % | | | 12.04 | %** | | | (28.59 | )%^ | | | 33.89 | % | | | 6.79 | %¥ | |
| Ratios and Supplemental Data: | |
| Net Assets, End of Period (Thousands) | | $ | 2,465,552 | | | $ | 1,567,302 | | | $ | 1,236,945 | | | $ | 1,520,096 | | | $ | 1,020,611 | | |
| Ratio of Expenses to Average Net Assets (1) | | | 0.93 | %+(2) | | | 0.96 | %+ | | | 0.88 | %+ | | | 0.88 | %+ | | | 0.88 | % | |
| Ratio of Net Investment Income (Loss) to Average Net Assets (1) | | | 0.13 | %+(2) | | | (0.11 | )%+ | | | (0.07 | )%+ | | | 0.31 | %+ | | | 0.10 | % | |
| Ratio of Rebate from Morgan Stanley Affiliates to Average Net Assets | | | 0.01 | % | | | 0.01 | % | | | 0.00 | %§ | | | 0.00 | %§ | | | N/A | | |
| Portfolio Turnover Rate | | | 23 | % | | | 27 | % | | | 37 | % | | | 64 | % | | | 65 | % | |
| (1) Supplemental Information on the Ratios to Average Net Assets: | |
| Ratios Before Expense Limitation: | |
| Expenses to Average Net Assets | | | N/A | | | | N/A | | | | 0.89 | %+ | | | N/A | | | | N/A | | |
| Net Investment Loss to Average Net Assets | | | N/A | | | | N/A | | | | (0.08 | )%+ | | | N/A | | | | N/A | | |
† Per share amount is based on average shares outstanding.
^ During the year, the Portfolio received a regulatory settlement from an unaffiliated third party, which had an impact of less than $0.005 on net investment income per share and less than 0.005% on total returns for Class P.
‡ Amount is less than $0.005 per share.
++ Calculated based on the net asset value as of the last business day of the period.
** Performance was positively impacted by approximately 0.04% due to the receipt of proceeds from the settlements of class action suits involving primarily two of the Portfolio's past holdings. This was a one-time settlement, and as a result, the impact on the NAV and consequently the performance will not likely be repeated in the future. Had these settlements not occurred, the total return for Class P shares would have been approximately 12.00%.
¥ The Adviser fully reimbursed the Portfolio for losses incurred resulting from the disposal of investments in violation of restrictions. The impact of this reimbursement is not reflected in the total return shown above. With this reimbursement, the total return for Class P would have been 6.84%.
+ The Ratios of Expenses and Net Investment Income reflect the rebate of certain Portfolio expenses in connection with the investments in Morgan Stanley affiliates during the period. The effect of the rebate on the ratios is disclosed in the above table as "Ratio of Rebate from Morgan Stanley Affiliates to Average Net Assets".
§ Amount is less than 0.005%.
(2) Reflects overall Portfolio ratios for investment income and non-class specific expenses.
The accompanying notes are an integral part of the financial statements.
95
2010 Annual Report
September 30, 2010
Financial Highlights
Core Fixed Income Portfolio
| | | Class I | |
| | | Year Ended September 30, | |
| Selected Per Share Data and Ratios | | 2010 | | 2009 | | 2008 | | 2007 | | 2006 | |
| Net Asset Value, Beginning of Period | | $ | 9.49 | | | $ | 9.18 | | | $ | 10.77 | | | $ | 10.80 | | | $ | 11.09 | | |
| Income (Loss) from Investment Operations: | |
| Net Investment Income† | | | 0.34 | | | | 0.34 | | | | 0.53 | | | | 0.52 | | | | 0.40 | | |
| Net Realized and Unrealized Gain (Loss) on Investments | | | 0.45 | | | | 0.57 | | | | (1.60 | ) | | | (0.02 | ) | | | 0.00 | ‡ | |
| Total from Investment Operations | | | 0.79 | | | | 0.91 | | | | (1.07 | ) | | | 0.50 | | | | 0.40 | | |
| Distributions from and/or in Excess of: | |
| Net Investment Income | | | (0.32 | ) | | | (0.60 | ) | | | (0.52 | ) | | | (0.53 | ) | | | (0.57 | ) | |
| Net Realized Gain | | | — | | | | — | | | | — | | | | — | | | | (0.12 | ) | |
| Total Distributions | | | (0.32 | ) | | | (0.60 | ) | | | (0.52 | ) | | | (0.53 | ) | | | (0.69 | ) | |
| Redemption Fees | | | — | | | | 0.00 | ‡ | | | 0.00 | ‡ | | | 0.00 | ‡ | | | 0.00 | ‡ | |
| Net Asset Value, End of Period | | $ | 9.96 | | | $ | 9.49 | | | $ | 9.18 | | | $ | 10.77 | | | $ | 10.80 | | |
| Total Return++ | | | 8.57 | % | | | 10.41 | % | | | (10.40 | )% | | | 4.76 | % | | | 3.79 | % | |
| Ratios and Supplemental Data: | |
| Net Assets, End of Period (Thousands) | | $ | 75,651 | | | $ | 93,768 | | | $ | 186,305 | | | $ | 308,111 | | | $ | 299,997 | | |
| Ratio of Expenses to Average Net Assets (1) | | | 0.50 | %+(2) | | | 0.50 | %+ | | | 0.49 | %+ | | | 0.49 | %+ | | | 0.50 | % | |
| Ratio of Net Investment Income to Average Net Assets (1) | | | 3.58 | %+(2) | | | 3.73 | %+ | | | 5.11 | %+ | | | 4.83 | %+ | | | 3.71 | % | |
| Ratio of Rebate from Morgan Stanley Affiliates to Average Net Assets | | | 0.00 | %§ | | | 0.01 | % | | | 0.01 | % | | | 0.01 | % | | | N/A | | |
| Portfolio Turnover Rate | | | 261 | % | | | 437 | % | | | 306 | % | | | 107 | % | | | 139 | % | |
| (1) Supplemental Information on the Ratios to Average Net Assets: | |
| Ratios Before Expense Limitation: | |
| Expenses to Average Net Assets | | | 0.67 | %+(2) | | | 0.61 | %+ | | | 0.53 | %+ | | | 0.54 | %+ | | | 0.56 | % | |
| Net Investment Income to Average Net Assets | | | 3.41 | %+(2) | | | 3.62 | %+ | | | 5.07 | %+ | | | 4.78 | %+ | | | 3.65 | % | |
† Per share amount is based on average shares outstanding.
‡ Amount is less than $0.005 per share.
++ Calculated based on the net asset value as of the last business day of the period.
+ The Ratios of Expenses and Net Investment Income reflect the rebate of certain Portfolio expenses in connection with the investments in Morgan Stanley affiliates during the period. The effect of the rebate on the ratios is disclosed in the above table as "Ratio of Rebate from Morgan Stanley Affiliates to Average Net Assets".
§ Amount is less than 0.005%.
(2) Reflects overall Portfolio ratios for investment income and non-class specific expenses.
The accompanying notes are an integral part of the financial statements.
96
2010 Annual Report
September 30, 2010
Financial Highlights
Core Fixed Income Portfolio
| | | Class P | |
| | | Year Ended September 30, | |
| Selected Per Share Data and Ratios | | 2010 | | 2009 | | 2008 | | 2007 | | 2006 | |
| Net Asset Value, Beginning of Period | | $ | 9.53 | | | $ | 9.12 | | | $ | 10.71 | | | $ | 10.74 | | | $ | 11.03 | | |
| Income (Loss) from Investment Operations: | |
| Net Investment Income† | | | 0.32 | | | | 0.31 | | | | 0.50 | | | | 0.49 | | | | 0.37 | | |
| Net Realized and Unrealized Gain (Loss) on Investments | | | 0.46 | | | | 0.58 | | | | (1.60 | ) | | | (0.02 | ) | | | 0.01 | | |
| Total from Investment Operations | | | 0.78 | | | | 0.89 | | | | (1.10 | ) | | | 0.47 | | | | 0.38 | | |
| Distributions from and/or in Excess of: | |
| Net Investment Income | | | (0.30 | ) | | | (0.48 | ) | | | (0.49 | ) | | | (0.50 | ) | | | (0.55 | ) | |
| Net Realized Gain | | | — | | | | — | | | | — | | | | — | | | | (0.12 | ) | |
| Total Distributions | | | (0.30 | ) | | | (0.48 | ) | | | (0.49 | ) | | | (0.50 | ) | | | (0.67 | ) | |
| Redemption Fees | | | — | | | | 0.00 | ‡ | | | 0.00 | ‡ | | | 0.00 | ‡ | | | 0.00 | ‡ | |
| Net Asset Value, End of Period | | $ | 10.01 | | | $ | 9.53 | | | $ | 9.12 | | | $ | 10.71 | | | $ | 10.74 | | |
| Total Return++ | | | 8.47 | % | | | 10.10 | % | | | (10.68 | )% | | | 4.53 | % | | | 3.55 | % | |
| Ratios and Supplemental Data: | |
| Net Assets, End of Period (Thousands) | | $ | 209 | | | $ | 214 | | | $ | 487 | | | $ | 11,805 | | | $ | 9,812 | | |
| Ratio of Expenses to Average Net Assets (1) | | | 0.75 | %+(2) | | | 0.75 | %+ | | | 0.74 | %+ | | | 0.74 | %+ | | | 0.75 | % | |
| Ratio of Net Investment Income to Average Net Assets (1) | | | 3.33 | %+(2) | | | 3.48 | %+ | | | 4.87 | %+ | | | 4.58 | %+ | | | 3.43 | % | |
| Ratio of Rebate from Morgan Stanley Affiliates to Average Net Assets | | | 0.00 | %§ | | | 0.01 | % | | | 0.01 | % | | | 0.01 | % | | | N/A | | |
| Portfolio Turnover Rate | | | 261 | % | | | 437 | % | | | 306 | % | | | 107 | % | | | 139 | % | |
| (1) Supplemental Information on the Ratios to Average Net Assets: | |
| Ratios Before Expense Limitation: | |
| Expenses to Average Net Assets | | | 0.92 | %+(2) | | | 0.86 | %+ | | | 0.78 | %+ | | | 0.79 | %+ | | | 0.81 | % | |
| Net Investment Income to Average Net Assets | | | 3.16 | %+(2) | | | 3.37 | %+ | | | 4.84 | %+ | | | 4.54 | %+ | | | 3.37 | % | |
† Per share amount is based on average shares outstanding.
‡ Amount is less than $0.005 per share.
++ Calculated based on the net asset value as of the last business day of the period.
+ The Ratios of Expenses and Net Investment Income reflect the rebate of certain Portfolio expenses in connection with the investments in Morgan Stanley affiliates during the period. The effect of the rebate on the ratios is disclosed in the above table as "Ratio of Rebate from Morgan Stanley Affiliates to Average Net Assets".
§ Amount is less than 0.005%.
(2) Reflects overall Portfolio ratios for investment income and non-class specific expenses.
The accompanying notes are an integral part of the financial statements.
97
2010 Annual Report
September 30, 2010
Financial Highlights
Core Plus Fixed Income Portfolio
| | | Class I | |
| | | Year Ended September 30, | |
| Selected Per Share Data and Ratios | | 2010 | | 2009 | | 2008 | | 2007 | | 2006 | |
| Net Asset Value, Beginning of Period | | $ | 9.41 | | | $ | 9.41 | | | $ | 11.40 | | | $ | 11.52 | | | $ | 11.69 | | |
| Income (Loss) from Investment Operations: | |
| Net Investment Income† | | | 0.34 | | | | 0.41 | | | | 0.66 | | | | 0.58 | | | | 0.48 | | |
| Net Realized and Unrealized Gain (Loss) on Investments | | | 0.57 | | | | 0.27 | | | | (2.10 | ) | | | (0.05 | ) | | | (0.02 | ) | |
| Total from Investment Operations | | | 0.91 | | | | 0.68 | | | | (1.44 | ) | | | 0.53 | | | | 0.46 | | |
| Distributions from and/or in Excess of: | |
| Net Investment Income | | | (0.36 | ) | | | (0.68 | ) | | | (0.55 | ) | | | (0.65 | ) | | | (0.63 | ) | |
| Redemption Fees | | | — | | | | 0.00 | ‡ | | | 0.00 | ‡ | | | 0.00 | ‡ | | | 0.00 | ‡ | |
| Net Asset Value, End of Period | | $ | 9.96 | | | $ | 9.41 | | | $ | 9.41 | | | $ | 11.40 | | | $ | 11.52 | | |
| Total Return++ | | | 10.02 | % | | | 7.56 | % | | | (13.07 | )% | | | 4.77 | % | | | 4.13 | % | |
| Ratios and Supplemental Data: | |
| Net Assets, End of Period (Thousands) | | $ | 434,657 | | | $ | 797,788 | | | $ | 1,210,286 | | | $ | 2,367,043 | | | $ | 2,314,052 | | |
| Ratio of Expenses to Average Net Assets (1) | | | 0.51 | %+(2) | | | 0.49 | %+ | | | 0.45 | %+ | | | 0.44 | %+ | | | 0.44 | % | |
| Ratio of Net Investment Income to Average Net Assets (1) | | | 3.53 | %+(2) | | | 4.56 | %+ | | | 6.13 | %+ | | | 5.10 | %+ | | | 4.24 | % | |
| Ratio of Rebate from Morgan Stanley Affiliates to Average Net Assets | | | 0.01 | % | | | 0.00 | %§ | | | 0.01 | % | | | 0.00 | %§ | | | N/A | | |
| Portfolio Turnover Rate | | | 270 | % | | | 402 | % | | | 320 | % | | | 139 | % | | | 142 | % | |
| (1) Supplemental Information on the Ratios to Average Net Assets: | |
| Ratios Before Expense Limitation: | |
| Expenses to Average Net Assets | | | N/A | | | | 0.50 | %+ | | | 0.45 | %+ | | | N/A | | | | N/A | | |
| Net Investment Income to Average Net Assets | | | N/A | | | | 4.55 | %+ | | | 6.13 | %+ | | | N/A | | | | N/A | | |
† Per share amount is based on average shares outstanding.
‡ Amount is less than $0.005 per share.
++ Calculated based on the net asset value as of the last business day of the period.
+ The Ratios of Expenses and Net Investment Income reflect the rebate of certain Portfolio expenses in connection with the investments in Morgan Stanley affiliates during the period. The effect of the rebate on the ratios is disclosed in the above table as "Ratio of Rebate from Morgan Stanley Affiliates to Average Net Assets".
§ Amount is less than 0.005%.
(2) Reflects overall Portfolio ratios for investment income and non-class specific expenses.
The accompanying notes are an integral part of the financial statements.
98
2010 Annual Report
September 30, 2010
Financial Highlights
Core Plus Fixed Income Portfolio
| | | Investment Class | |
| | | Year Ended September 30, | |
| Selected Per Share Data and Ratios | | 2010 | | 2009 | | 2008 | | 2007 | | 2006 | |
| Net Asset Value, Beginning of Period | | $ | 9.41 | | | $ | 9.41 | | | $ | 11.39 | | | $ | 11.52 | | | $ | 11.68 | | |
| Income (Loss) from Investment Operations: | |
| Net Investment Income† | | | 0.32 | | | | 0.39 | | | | 0.64 | | | | 0.56 | | | | 0.45 | | |
| Net Realized and Unrealized Gain (Loss) on Investments | | | 0.57 | | | | 0.27 | | | | (2.09 | ) | | | (0.06 | ) | | | 0.00 | ‡ | |
| Total from Investment Operations | | | 0.89 | | | | 0.66 | | | | (1.45 | ) | | | 0.50 | | | | 0.45 | | |
| Distributions from and/or in Excess of: | |
| Net Investment Income | | | (0.34 | ) | | | (0.66 | ) | | | (0.53 | ) | | | (0.63 | ) | | | (0.61 | ) | |
| Redemption Fees | | | — | | | | 0.00 | ‡ | | | 0.00 | ‡ | | | 0.00 | ‡ | | | 0.00 | ‡ | |
| Net Asset Value, End of Period | | $ | 9.96 | | | $ | 9.41 | | | $ | 9.41 | | | $ | 11.39 | | | $ | 11.52 | | |
| Total Return++ | | | 9.86 | % | | | 7.40 | % | | | (13.12 | )% | | | 4.52 | % | | | 4.04 | % | |
| Ratios and Supplemental Data: | |
| Net Assets, End of Period (Thousands) | | $ | 92,988 | | | $ | 114,616 | | | $ | 123,610 | | | $ | 150,671 | | | $ | 142,990 | | |
| Ratio of Expenses to Average Net Assets | | | 0.66 | %+(1) | | | 0.65 | %+ | | | 0.60 | %+ | | | 0.59 | %+ | | | 0.59 | % | |
| Ratio of Net Investment Income to Average Net Assets | | | 3.38 | %+(1) | | | 4.31 | %+ | | | 5.97 | %+ | | | 4.97 | %+ | | | 3.96 | % | |
| Ratio of Rebate from Morgan Stanley Affiliates to Average Net Assets | | | 0.01 | % | | | 0.00 | %§ | | | 0.01 | % | | | 0.00 | %§ | | | N/A | | |
| Portfolio Turnover Rate | | | 270 | % | | | 402 | % | | | 320 | % | | | 139 | % | | | 142 | % | |
† Per share amount is based on average shares outstanding.
‡ Amount is less than $0.005 per share.
++ Calculated based on the net asset value as of the last business day of the period.
+ The Ratios of Expenses and Net Investment Income reflect the rebate of certain Portfolio expenses in connection with the investments in Morgan Stanley affiliates during the period. The effect of the rebate on the ratios is disclosed in the above table as "Ratio of Rebate from Morgan Stanley Affiliates to Average Net Assets".
§ Amount is less than 0.005%.
(1) Reflects overall Portfolio ratios for investment income and non-class specific expenses.
The accompanying notes are an integral part of the financial statements.
99
2010 Annual Report
September 30, 2010
Financial Highlights
Core Plus Fixed Income Portfolio
| | | Class P | |
| | | Year Ended September 30, | |
| Selected Per Share Data and Ratios | | 2010 | | 2009 | | 2008 | | 2007 | | 2006 | |
| Net Asset Value, Beginning of Period | | $ | 9.40 | | | $ | 9.40 | | | $ | 11.38 | | | $ | 11.50 | | | $ | 11.67 | | |
| Income (Loss) from Investment Operations: | |
| Net Investment Income† | | | 0.31 | | | | 0.41 | | | | 0.63 | | | | 0.55 | | | | 0.46 | | |
| Net Realized and Unrealized Gain (Loss) on Investments | | | 0.57 | | | | 0.24 | | | | (2.09 | ) | | | (0.05 | ) | | | (0.03 | ) | |
| Total from Investment Operations | | | 0.88 | | | | 0.65 | | | | (1.46 | ) | | | 0.50 | | | | 0.43 | | |
| Distributions from and/or in Excess of: | |
| Net Investment Income | | | (0.31 | ) | | | (0.65 | ) | | | (0.52 | ) | | | (0.62 | ) | | | (0.60 | ) | |
| Redemption Fees | | | — | | | | 0.00 | ‡ | | | 0.00 | ‡ | | | 0.00 | ‡ | | | 0.00 | ‡ | |
| Net Asset Value, End of Period | | $ | 9.97 | | | $ | 9.40 | | | $ | 9.40 | | | $ | 11.38 | | | $ | 11.50 | | |
| Total Return++ | | | 9.73 | % | | | 7.26 | % | | | (13.23 | )% | | | 4.42 | % | | | 3.97 | % | |
| Ratios and Supplemental Data: | |
| Net Assets, End of Period (Thousands) | | $ | 5,732 | | | $ | 6,442 | | | $ | 97,823 | | | $ | 137,733 | | | $ | 126,683 | | |
| Ratio of Expenses to Average Net Assets (1) | | | 0.76 | %+(2) | | | 0.73 | %+ | | | 0.70 | %+ | | | 0.69 | %+ | | | 0.69 | % | |
| Ratio of Net Investment Income to Average Net Assets (1) | | | 3.28 | %+(2) | | | 4.56 | %+ | | | 5.87 | %+ | | | 4.84 | %+ | | | 4.00 | % | |
| Ratio of Rebate from Morgan Stanley Affiliates to Average Net Assets | | | 0.01 | % | | | 0.00 | %§ | | | 0.01 | % | | | 0.00 | %§ | | | N/A | | |
| Portfolio Turnover Rate | | | 270 | % | | | 402 | % | | | 320 | % | | | 139 | % | | | 142 | % | |
| (1) Supplemental Information on the Ratios to Average Net Assets: | |
| Ratios Before Expense Limitation: | |
| Expenses to Average Net Assets | | | N/A | | | | N/A | | | | 0.70 | %+ | | | N/A | | | | N/A | | |
| Net Investment Income to Average Net Assets | | | N/A | | | | N/A | | | | 5.87 | %+ | | | N/A | | | | N/A | | |
† Per share amount is based on average shares outstanding.
‡ Amount is less than $0.005 per share.
++ Calculated based on the net asset value as of the last business day of the period.
+ The Ratios of Expenses and Net Investment Income reflect the rebate of certain Portfolio expenses in connection with the investments in Morgan Stanley affiliates during the period. The effect of the rebate on the ratios is disclosed in the above table as "Ratio of Rebate from Morgan Stanley Affiliates to Average Net Assets".
§ Amount is less than 0.005%.
(2) Reflects overall Portfolio ratios for investment income and non-class specific expenses.
The accompanying notes are an integral part of the financial statements.
100
2010 Annual Report
September 30, 2010
Financial Highlights
Intermediate Duration Portfolio
| | | Class I | |
| | | Year Ended September 30, | |
| Selected Per Share Data and Ratios | | 2010 | | 2009 | | 2008 | | 2007 | | 2006 | |
| Net Asset Value, Beginning of Period | | $ | 9.48 | | | $ | 8.93 | | | $ | 10.16 | | | $ | 10.17 | | | $ | 10.22 | | |
| Income (Loss) from Investment Operations: | |
| Net Investment Income† | | | 0.28 | | | | 0.23 | | | | 0.43 | | | | 0.48 | | | | 0.42 | | |
| Net Realized and Unrealized Gain (Loss) on Investments | | | 0.46 | | | | 0.59 | | | | (1.15 | ) | | | 0.01 | | | | (0.08 | ) | |
| Total from Investment Operations | | | 0.74 | | | | 0.82 | | | | (0.72 | ) | | | 0.49 | | | | 0.34 | | |
| Distributions from and/or in Excess of: | |
| Net Investment Income | | | (0.28 | ) | | | (0.27 | ) | | | (0.51 | ) | | | (0.50 | ) | | | (0.39 | ) | |
| Net Asset Value, End of Period | | $ | 9.94 | | | $ | 9.48 | | | $ | 8.93 | | | $ | 10.16 | | | $ | 10.17 | | |
| Total Return++ | | | 7.92 | % | | | 9.31 | % | | | (7.29 | )% | | | 4.87 | % | | | 3.33 | % | |
| Ratios and Supplemental Data: | |
| Net Assets, End of Period (Thousands) | | $ | 135 | | | $ | 131 | | | $ | 3,476 | | | $ | 7,015 | | | $ | 8,823 | | |
| Ratio of Expenses to Average Net Assets (1) | | | 0.57 | %+(2) | | | 0.55 | %+ | | | 0.52 | %+ | | | 0.54 | %+ | | | 0.50 | % | |
| Ratio of Net Investment Income to Average Net Assets (1) | | | 2.88 | %+(2) | | | 2.53 | %+ | | | 4.36 | %+ | | | 4.71 | %+ | | | 4.20 | % | |
| Ratio of Rebate from Morgan Stanley Affiliates to Average Net Assets | | | 0.00 | %§ | | | 0.00 | %§ | | | 0.02 | % | | | 0.00 | %§ | | | N/A | | |
| Portfolio Turnover Rate | | | 103 | % | | | 188 | % | | | 61 | % | | | 89 | % | | | 70 | % | |
| (1) Supplemental Information on the Ratios to Average Net Assets: | |
| Ratios Before Expense Limitation: | |
| Expenses to Average Net Assets | | | N/A | | | | N/A | | | | 0.52 | %+ | | | N/A | | | | N/A | | |
| Net Investment Income to Average Net Assets | | | N/A | | | | N/A | | | | 4.36 | %+ | | | N/A | | | | N/A | | |
† Per share amount is based on average shares outstanding.
++ Calculated based on the net asset value as of the last business day of the period.
+ The Ratios of Expenses and Net Investment Income reflect the rebate of certain Portfolio expenses in connection with the investments in Morgan Stanley affiliates during the period. The effect of the rebate on the ratios is disclosed in the above table as "Ratio of Rebate from Morgan Stanley Affiliates to Average Net Assets".
§ Amount is less than 0.005%.
(2) Reflects overall Portfolio ratios for investment income and non-class specific expenses.
The accompanying notes are an integral part of the financial statements.
101
2010 Annual Report
September 30, 2010
Financial Highlights
Intermediate Duration Portfolio
| | | Investment Class | |
| | | Year Ended September 30, | |
| Selected Per Share Data and Ratios | | 2010 | | 2009 | | 2008 | | 2007 | | 2006 | |
| Net Asset Value, Beginning of Period | | $ | 9.45 | | | $ | 8.90 | | | $ | 10.12 | | | $ | 10.13 | | | $ | 10.19 | | |
| Income (Loss) from Investment Operations: | |
| Net Investment Income† | | | 0.26 | | | | 0.21 | | | | 0.41 | | | | 0.46 | | | | 0.39 | | |
| Net Realized and Unrealized Gain (Loss) on Investments | | | 0.44 | | | | 0.60 | | | | (1.14 | ) | | | 0.02 | | | | (0.07 | ) | |
| Total from Investment Operations | | | 0.70 | | | | 0.81 | | | | (0.73 | ) | | | 0.48 | | | | 0.32 | | |
| Distributions from and/or in Excess of: | |
| Net Investment Income | | | (0.26 | ) | | | (0.26 | ) | | | (0.49 | ) | | | (0.49 | ) | | | (0.38 | ) | |
| Net Asset Value, End of Period | | $ | 9.89 | | | $ | 9.45 | | | $ | 8.90 | | | $ | 10.12 | | | $ | 10.13 | | |
| Total Return++ | | | 7.68 | % | | | 9.19 | % | | | (7.54 | )% | | | 4.84 | % | | | 3.19 | % | |
| Ratios and Supplemental Data: | |
| Net Assets, End of Period (Thousands) | | $ | 91,882 | | | $ | 139,508 | | | $ | 132,146 | | | $ | 145,739 | | | $ | 136,198 | | |
| Ratio of Expenses to Average Net Assets | | | 0.72 | %+(1) | | | 0.70 | %+ | | | 0.67 | %+ | | | 0.69 | %+ | | | 0.65 | % | |
| Ratio of Net Investment Income to Average Net Assets | | | 2.73 | %+(1) | | | 2.34 | %+ | | | 4.23 | %+ | | | 4.58 | %+ | | | 3.87 | % | |
| Ratio of Rebate from Morgan Stanley Affiliates to Average Net Assets | | | 0.00 | %§ | | | 0.00 | %§ | | | 0.02 | % | | | 0.01 | % | | | N/A | | |
| Portfolio Turnover Rate | | | 103 | % | | | 188 | % | | | 61 | % | | | 89 | % | | | 70 | % | |
† Per share amount is based on average shares outstanding.
++ Calculated based on the net asset value as of the last business day of the period.
+ The Ratios of Expenses and Net Investment Income reflect the rebate of certain Portfolio expenses in connection with the investments in Morgan Stanley affiliates during the period. The effect of the rebate on the ratios is disclosed in the above table as "Ratio of Rebate from Morgan Stanley Affiliates to Average Net Assets".
§ Amount is less than 0.005%.
(1) Reflects overall Portfolio ratios for investment income and non-class specific expenses.
The accompanying notes are an integral part of the financial statements.
102
2010 Annual Report
September 30, 2010
Financial Highlights
Investment Grade Fixed Income Portfolio
| | | Class I | |
| | | Year Ended September 30, | |
| Selected Per Share Data and Ratios | | 2010 | | 2009 | | 2008 | | 2007 | | 2006 | |
| Net Asset Value, Beginning of Period | | $ | 9.75 | | | $ | 9.61 | | | $ | 11.15 | | | $ | 11.22 | | | $ | 11.42 | | |
| Income (Loss) from Investment Operations: | |
| Net Investment Income† | | | 0.33 | | | | 0.31 | | | | 0.55 | | | | 0.52 | | | | 0.41 | | |
| Net Realized and Unrealized Gain (Loss) on Investments | | | 0.49 | | | | 0.38 | | | | (1.57 | ) | | | 0.01 | | | | (0.00 | )‡ | |
| Total from Investment Operations | | | 0.82 | | | | 0.69 | | | | (1.02 | ) | | | 0.53 | | | | 0.41 | | |
| Distributions from and/or in Excess of: | |
| Net Investment Income | | | (0.40 | ) | | | (0.55 | ) | | | (0.52 | ) | | | (0.60 | ) | | | (0.56 | ) | |
| Net Realized Gain | | | — | | | | — | | | | — | | | | — | | | | (0.05 | ) | |
| Total Distributions | | | (0.40 | ) | | | (0.55 | ) | | | (0.52 | ) | | | (0.60 | ) | | | (0.61 | ) | |
| Redemption Fees | | | — | | | | 0.00 | ‡ | | | 0.00 | ‡ | | | 0.00 | ‡ | | | 0.00 | ‡ | |
| Net Asset Value, End of Period | | $ | 10.17 | | | $ | 9.75 | | | $ | 9.61 | | | $ | 11.15 | | | $ | 11.22 | | |
| Total Return++ | | | 8.65 | % | | | 7.46 | % | | | (9.37 | )% | | | 4.82 | % | | | 3.65 | % | |
| Ratios and Supplemental Data: | |
| Net Assets, End of Period (Thousands) | | $ | 79,337 | | | $ | 140,890 | | | $ | 316,894 | | | $ | 519,504 | | | $ | 525,680 | | |
| Ratio of Expenses to Average Net Assets | | | 0.76 | %+(1) | | | 0.56 | %+ | | | 0.52 | %+ | | | 0.50 | %+ | | | 0.50 | % | |
| Ratio of Net Investment Income to Average Net Assets | | | 3.36 | %+(1) | | | 3.30 | %+ | | | 5.18 | %+ | | | 4.74 | %+ | | | 3.66 | % | |
| Ratio of Rebate from Morgan Stanley Affiliates to Average Net Assets | | | 0.00 | %§ | | | 0.01 | % | | | 0.01 | % | | | 0.00 | %§ | | | N/A | | |
| Portfolio Turnover Rate | | | 277 | % | | | 545 | % | | | 325 | % | | | 124 | % | | | 154 | % | |
† Per share amount is based on average shares outstanding.
‡ Amount is less than $0.005 per share.
++ Calculated based on the net asset value as of the last business day of the period.
+ The Ratios of Expenses and Net Investment Income reflect the rebate of certain Portfolio expenses in connection with the investments in Morgan Stanley affiliates during the period. The effect of the rebate on the ratios is disclosed in the above table as "Ratio of Rebate from Morgan Stanley Affiliates to Average Net Assets".
§ Amount is less than 0.005%.
(1) Reflects overall Portfolio ratios for investment income and non-class specific expenses.
The accompanying notes are an integral part of the financial statements.
103
2010 Annual Report
September 30, 2010
Financial Highlights
Investment Grade Fixed Income Portfolio
| | | Class P | |
| | | Year Ended September 30, | |
| Selected Per Share Data and Ratios | | 2010 | | 2009 | | 2008 | | 2007 | | 2006 | |
| Net Asset Value, Beginning of Period | | $ | 9.74 | | | $ | 9.60 | | | $ | 11.14 | | | $ | 11.21 | | | $ | 11.42 | | |
| Income (Loss) from Investment Operations: | |
| Net Investment Income† | | | 0.31 | | | | 0.30 | | | | 0.53 | | | | 0.51 | | | | 0.39 | | |
| Net Realized and Unrealized Gain (Loss) on Investments | | | 0.49 | | | | 0.38 | | | | (1.57 | ) | | | 0.00 | ‡ | | | (0.01 | ) | |
| Total from Investment Operations | | | 0.80 | | | | 0.68 | | | | (1.04 | ) | | | 0.51 | | | | 0.38 | | |
| Distributions from and/or in Excess of: | |
| Net Investment Income | | | (0.38 | ) | | | (0.54 | ) | | | (0.50 | ) | | | (0.58 | ) | | | (0.54 | ) | |
| Net Realized Gain | | | — | | | | — | | | | — | | | | — | | | | (0.05 | ) | |
| Total Distributions | | | (0.38 | ) | | | (0.54 | ) | | | (0.50 | ) | | | (0.58 | ) | | | (0.59 | ) | |
| Redemption Fees | | | — | | | | 0.00 | ‡ | | | 0.00 | ‡ | | | 0.00 | ‡ | | | 0.00 | ‡ | |
| Net Asset Value, End of Period | | $ | 10.16 | | | $ | 9.74 | | | $ | 9.60 | | | $ | 11.14 | | | $ | 11.21 | | |
| Total Return++ | | | 8.50 | % | | | 7.44 | % | | | (9.60 | )% | | | 4.56 | % | | | 3.59 | % | |
| Ratios and Supplemental Data: | |
| Net Assets, End of Period (Thousands) | | $ | 590 | | | $ | 611 | | | $ | 842 | | | $ | 1,177 | | | $ | 778 | | |
| Ratio of Expenses to Average Net Assets (1) | | | 0.91 | %+(2) | | | 0.69 | %+ | | | 0.67 | %+ | | | 0.65 | %+ | | | 0.65 | % | |
| Ratio of Net Investment Income to Average Net Assets (1) | | | 3.21 | %+(2) | | | 3.19 | %+ | | | 5.01 | %+ | | | 4.59 | %+ | | | 3.46 | % | |
| Ratio of Rebate from Morgan Stanley Affiliates to Average Net Assets | | | 0.00 | %§ | | | 0.01 | % | | | 0.01 | % | | | 0.00 | %§ | | | N/A | | |
| Portfolio Turnover Rate | | | 277 | % | | | 545 | % | | | 325 | % | | | 124 | % | | | 154 | % | |
| (1) Supplemental Information on the Ratios to Average Net Assets: | |
| Ratios Before Expense Limitation: | |
| Expenses to Average Net Assets | | | 1.01 | %+(2) | | | 0.79 | %+ | | | 0.77 | %+ | | | 0.75 | %+ | | | 0.75 | % | |
| Net Investment Income to Average Net Assets | | | 3.11 | %+(2) | | | 3.09 | %+ | | | 4.91 | %+ | | | 4.49 | %+ | | | 3.36 | % | |
† Per share amount is based on average shares outstanding.
‡ Amount is less than $0.005 per share.
++ Calculated based on the net asset value as of the last business day of the period.
+ The Ratios of Expenses and Net Investment Income reflect the rebate of certain Portfolio expenses in connection with the investments in Morgan Stanley affiliates during the period. The effect of the rebate on the ratios is disclosed in the above table as "Ratio of Rebate from Morgan Stanley Affiliates to Average Net Assets".
§ Amount is less than 0.005%.
(2) Reflects overall Portfolio ratios for investment income and non-class specific expenses.
The accompanying notes are an integral part of the financial statements.
104
2010 Annual Report
September 30, 2010
Financial Highlights
Investment Grade Fixed Income Portfolio
| | | Class H | |
| | | Year Ended September 30, | | Period from
January 2, 2008^ to | |
| Selected Per Share Data and Ratios | | 2010 | | 2009 | | September 30, 2008 | |
| Net Asset Value, Beginning of Period | | $ | 9.74 | | | $ | 9.53 | | | $ | 11.15 | | |
| Income (Loss) from Investment Operations: | |
| Net Investment Income† | | | 0.31 | | | | 0.28 | | | | 0.21 | | |
| Net Realized and Unrealized Gain (Loss) on Investments | | | 0.48 | | | | 0.39 | | | | (1.68 | ) | |
| Total from Investment Operations | | | 0.79 | | | | 0.67 | | | | (1.47 | ) | |
| Distributions from and/or in Excess of: | |
| Net Investment Income | | | (0.37 | ) | | | (0.46 | ) | | | (0.15 | ) | |
| Redemption Fees | | | — | | | | 0.00 | ‡ | | | — | | |
| Net Asset Value, End of Period | | $ | 10.16 | | | $ | 9.74 | | | $ | 9.53 | | |
| Total Return++ | | | 8.39 | % | | | 7.21 | % | | | (13.21 | )%# | |
| Ratios and Supplemental Data: | |
| Net Assets, End of Period (Thousands) | | $ | 170 | | | $ | 162 | | | $ | 85 | | |
| Ratio of Expenses to Average Net Assets | | | 1.01 | %+(1) | | | 0.81 | %+ | | | 2.98 | %*+ | |
| Ratio of Net Investment Income to Average Net Assets | | | 3.11 | %+(1) | | | 2.94 | %+ | | | 2.71 | %*+ | |
| Ratio of Rebate from Morgan Stanley Affiliates to Average Net Assets | | | 0.00 | %§ | | | 0.01 | % | | | 0.01 | %* | |
| Portfolio Turnover Rate | | | 277 | % | | | 545 | % | | | 325 | %# | |
^ Commencement of Operations.
† Per share amount is based on average shares outstanding.
‡ Amount is less than $0.005 per share.
++ Calculated based on the net asset value which does not reflect sales charges, if applicable, as of the last business day of the period.
# Not Annualized.
+ The Ratios of Expenses and Net Investment Income reflect the rebate of certain Portfolio expenses in connection with the investments in Morgan Stanley affiliates during the period. The effect of the rebate on the ratios is disclosed in the above table as "Ratio of Rebate from Morgan Stanley Affiliates to Average Net Assets".
* Annualized.
§ Amount is less than 0.005%.
(1) Reflects overall Portfolio ratios for investment income and non-class specific expenses.
The accompanying notes are an integral part of the financial statements.
105
2010 Annual Report
September 30, 2010
Financial Highlights
Investment Grade Fixed Income Portfolio
| | | Class L | |
| | | Year Ended September 30, | | Period from
June 16, 2008^ to | |
| Selected Per Share Data and Ratios | | 2010 | | 2009 | | September 30, 2008 | |
| Net Asset Value, Beginning of Period | | $ | 9.74 | | | $ | 9.63 | | | $ | 10.12 | | |
| Income (Loss) from Investment Operations: | |
| Net Investment Income† | | | 0.28 | | | | 0.24 | | | | 0.12 | | |
| Net Realized and Unrealized Gain (Loss) on Investments | | | 0.48 | | | | 0.41 | | | | (0.60 | ) | |
| Total from Investment Operations | | | 0.76 | | | | 0.65 | | | | (0.48 | ) | |
| Distributions from and/or in Excess of: | |
| Net Investment Income | | | (0.35 | ) | | | (0.54 | ) | | | (0.01 | ) | |
| Redemption Fees | | | — | | | | 0.00 | ‡ | | | — | | |
| Net Asset Value, End of Period | | $ | 10.15 | | | $ | 9.74 | | | $ | 9.63 | | |
| Total Return++ | | | 8.15 | % | | | 7.08 | % | | | (4.73 | )%# | |
| Ratios and Supplemental Data: | |
| Net Assets, End of Period (Thousands) | | $ | 5,508 | | | $ | 5,159 | | | $ | 58 | | |
| Ratio of Expenses to Average Net Assets | | | 1.26 | %+(1) | | | 1.06 | %+ | | | 1.15 | %*+ | |
| Ratio of Net Investment Income to Average Net Assets | | | 2.86 | %+(1) | | | 2.58 | %+ | | | 4.34 | %*+ | |
| Ratio of Rebate from Morgan Stanley Affiliates to Average Net Assets | | | 0.00 | %§ | | | 0.01 | % | | | 0.01 | %* | |
| Portfolio Turnover Rate | | | 277 | % | | | 545 | % | | | 325 | %# | |
^ Commencement of Operations.
† Per share amount is based on average shares outstanding.
‡ Amount is less than $0.005 per share.
++ Calculated based on the net asset value as of the last business day of the period.
# Not Annualized.
+ The Ratios of Expenses and Net Investment Income reflect the rebate of certain Portfolio expenses in connection with the investments in Morgan Stanley affiliates during the period. The effect of the rebate on the ratios is disclosed in the above table as "Ratio of Rebate from Morgan Stanley Affiliates to Average Net Assets".
* Annualized.
§ Amount is less than 0.005%.
(1) Reflects overall Portfolio ratios for investment income and non-class specific expenses.
The accompanying notes are an integral part of the financial statements.
106
2010 Annual Report
September 30, 2010
Financial Highlights
Limited Duration Portfolio
| | | Class I | |
| | | Year Ended September 30, | |
| Selected Per Share Data and Ratios | | 2010 | | 2009 | | 2008 | | 2007 | | 2006 | |
| Net Asset Value, Beginning of Period | | $ | 7.68 | | | $ | 8.00 | | | $ | 10.24 | | | $ | 10.34 | | | $ | 10.34 | | |
| Income (Loss) from Investment Operations: | |
| Net Investment Income† | | | 0.18 | | | | 0.24 | | | | 0.49 | | | | 0.51 | | | | 0.41 | | |
| Net Realized and Unrealized Gain (Loss) on Investments | | | 0.10 | | | | (0.12 | ) | | | (2.22 | ) | | | (0.08 | ) | | | (0.02 | ) | |
| Total from Investment Operations | | | 0.28 | | | | 0.12 | | | | (1.73 | ) | | | 0.43 | | | | 0.39 | | |
| Distributions from and/or in Excess of: | |
| Net Investment Income | | | (0.16 | ) | | | (0.44 | ) | | | (0.51 | ) | | | (0.53 | ) | | | (0.39 | ) | |
| Paid-in-Capital | | | (0.01 | ) | | | — | | | | — | | | | — | | | | — | | |
| Total Distributions | | | (0.17 | ) | | | (0.44 | ) | | | (0.51 | ) | | | (0.53 | ) | | | (0.39 | ) | |
| Redemption Fees | | | — | | | | 0.00 | ‡ | | | — | | | | 0.00 | ‡ | | | — | | |
| Net Asset Value, End of Period | | $ | 7.79 | | | $ | 7.68 | | | $ | 8.00 | | | $ | 10.24 | | | $ | 10.34 | | |
| Total Return++ | | | 3.74 | % | | | 1.77 | % | | | (17.57 | )% | | | 4.26 | % | | | 3.88 | % | |
| Ratios and Supplemental Data: | |
| Net Assets, End of Period (Thousands) | | $ | 208,608 | | | $ | 262,794 | | | $ | 568,156 | | | $ | 1,058,151 | | | $ | 1,077,967 | | |
| Ratio of Expenses to Average Net Assets (1) | | | 0.55 | %+(2) | | | 0.45 | %+ | | | 0.43 | %+ | | | 0.45 | %+ | | | 0.42 | % | |
| Ratio of Net Investment Income to Average Net Assets (1) | | | 2.39 | %+(2) | | | 3.16 | %+ | | | 5.22 | %+ | | | 4.94 | %+ | | | 3.96 | % | |
| Ratio of Rebate from Morgan Stanley Affiliates to Average Net Assets | | | 0.00 | %§ | | | 0.00 | %§ | | | 0.01 | % | | | 0.00 | %§ | | | N/A | | |
| Portfolio Turnover Rate | | | 95 | % | | | 110 | % | | | 20 | % | | | 56 | % | | | 64 | % | |
| (1) Supplemental Information on the Ratios to Average Net Assets: | |
| Ratios Before Expense Limitation: | |
| Expenses to Average Net Assets | | | N/A | | | | N/A | | | | 0.43 | %+ | | | N/A | | | | N/A | | |
| Net Investment Income to Average Net Assets | | | N/A | | | | N/A | | | | 5.22 | %+ | | | N/A | | | | N/A | | |
† Per share amount is based on average shares outstanding.
‡ Amount is less than $0.005 per share.
++ Calculated based on the net asset value as of the last business day of the period.
+ The Ratios of Expenses and Net Investment Income reflect the rebate of certain Portfolio expenses in connection with the investments in Morgan Stanley affiliates during the period. The effect of the rebate on the ratios is disclosed in the above table as "Ratio of Rebate from Morgan Stanley Affiliates to Average Net Assets".
§ Amount is less than 0.005%.
(2) Reflects overall Portfolio ratios for investment income and non-class specific expenses.
The accompanying notes are an integral part of the financial statements.
107
2010 Annual Report
September 30, 2010
Financial Highlights
Limited Duration Portfolio
| | | Class P | |
| | | Year Ended September 30, | | Period from
September 28,
2007^ to
September 30, | |
| Selected Per Share Data and Ratios | | 2010 | | 2009 | | 2008 | | 2007 | |
| Net Asset Value, Beginning of Period | | $ | 7.68 | | | $ | 8.00 | | | $ | 10.24 | | | $ | 10.24 | | |
| Income (Loss) from Investment Operations: | |
| Net Investment Income† | | | 0.17 | | | | 0.22 | | | | 0.47 | | | | 0.00 | ‡ | |
| Net Realized and Unrealized Gain (Loss) on Investments | | | 0.09 | | | | (0.12 | ) | | | (2.23 | ) | | | (0.00 | )‡ | |
| Total from Investment Operations | | | 0.26 | | | | 0.10 | | | | (1.76 | ) | | | 0.00 | ‡ | |
| Distributions from and/or in Excess of: | |
| Net Investment Income | | | (0.15 | ) | | | (0.42 | ) | | | (0.48 | ) | | | — | | |
| Paid-in-Capital | | | ‡ | | | | — | | | | — | | | | — | | |
| Total Distributions | | | (0.15 | ) | | | (0.42 | ) | | | (0.48 | ) | | | — | | |
| Redemption Fees | | | — | | | | 0.00 | ‡ | | | — | | | | 0.00 | ‡ | |
| Net Asset Value, End of Period | | $ | 7.79 | | | $ | 7.68 | | | $ | 8.00 | | | $ | 10.24 | | |
| Total Return++ | | | 3.48 | % | | | 1.52 | % | | | (17.77 | )% | | | — | | |
| Ratios and Supplemental Data: | |
| Net Assets, End of Period (Thousands) | | $ | 52 | | | $ | 169 | | | $ | 294 | | | $ | 1,020 | | |
| Ratio of Expenses to Average Net Assets | | | 0.80 | %+(1) | | | 0.70 | %+ | | | 0.68 | %+ | | | 0.59 | %+* | |
| Ratio of Net Investment Income to Average Net Assets | | | 2.14 | %+(1) | | | 2.87 | %+ | | | 4.95 | %+ | | | 5.38 | %+* | |
| Ratio of Rebate from Morgan Stanley Affiliates to Average Net Assets | | | 0.00 | %§ | | | 0.00 | %§ | | | 0.01 | % | | | 0.06 | %* | |
| Portfolio Turnover Rate | | | 95 | % | | | 110 | % | | | 20 | % | | | 56 | %# | |
^ Commencement of Operations.
† Per share amount is based on average shares outstanding.
‡ Amount is less than $0.005 per share.
++ Calculated based on the net asset value as of the last business day of the period.
+ The Ratios of Expenses and Net Investment Income reflect the rebate of certain Portfolio expenses in connection with the investments in Morgan Stanley affiliates during the period. The effect of the rebate on the ratios is disclosed in the above table as "Ratio of Rebate from Morgan Stanley Affiliates to Average Net Assets".
* Annualized.
§ Amount is less than 0.005%.
# Not Annualized.
(1) Reflects overall Portfolio ratios for investment income and non-class specific expenses.
The accompanying notes are an integral part of the financial statements.
108
2010 Annual Report
September 30, 2010
Financial Highlights
Long Duration Fixed Income Portfolio
| | | Class I | |
| | | Year Ended September 30, | | Period from
July 21,
2006^ to
September 30, | |
| Selected Per Share Data and Ratios | | 2010 | | 2009 | | 2008 | | 2007 | | 2006 | |
| Net Asset Value, Beginning of Period | | $ | 11.52 | | | $ | 9.93 | | | $ | 10.33 | | | $ | 10.48 | | | $ | 10.00 | | |
| Income (Loss) from Investment Operations: | |
| Net Investment Income† | | | 0.55 | | | | 0.49 | | | | 0.46 | | | | 0.49 | | | | 0.09 | | |
| Net Realized and Unrealized Gain (Loss) on Investments | | | 0.80 | | | | 1.66 | | | | (0.37 | ) | | | (0.18 | ) | | | 0.39 | | |
| Total from Investment Operations | | | 1.35 | | | | 2.15 | | | | 0.09 | | | | 0.31 | | | | 0.48 | | |
| Distributions from and/or in Excess of: | |
| Net Investment Income | | | (0.55 | ) | | | (0.56 | ) | | | (0.49 | ) | | | (0.43 | ) | | | — | | |
| Net Realized Gain | | | (0.59 | ) | | | — | | | | — | | | | (0.03 | ) | | | — | | |
| Total Distributions | | | (1.14 | ) | | | (0.56 | ) | | | (0.49 | ) | | | (0.46 | ) | | | — | | |
| Net Asset Value, End of Period | | $ | 11.73 | | | $ | 11.52 | | | $ | 9.93 | | | $ | 10.33 | | | $ | 10.48 | | |
| Total Return++ | | | 13.09 | % | | | 22.19 | % | | | 0.87 | % | | | 3.06 | % | | | 4.80 | %# | |
| Ratios and Supplemental Data: | |
| Net Assets, End of Period (Thousands) | | $ | 32,354 | | | $ | 31,410 | | | $ | 27,438 | | | $ | 25,297 | | | $ | 25,677 | | |
| Ratio of Expenses to Average Net Assets (1) | | | 0.50 | %+(2) | | | 0.50 | %+ | | | 0.49 | %+ | | | 0.50 | %+ | | | 0.50 | %* | |
| Ratio of Net Investment Income to Average Net Assets (1) | | | 4.98 | %+(2) | | | 4.68 | %+ | | | 4.44 | %+ | | | 4.73 | %+ | | | 4.66 | %* | |
| Ratio of Rebate from Morgan Stanley Affiliates to Average Net Assets | | | 0.00 | %§ | | | 0.00 | %§ | | | 0.01 | % | | | 0.00 | %§ | | | N/A | | |
| Portfolio Turnover Rate | | | 90 | % | | | 80 | % | | | 63 | % | | | 49 | % | | | 7 | %# | |
| (1) Supplemental Information on the Ratios to Average Net Assets: | |
| Ratios Before Expense Limitation: | |
| Expenses to Average Net Assets | | | 0.79 | %+(2) | | | 0.80 | %+ | | | 0.75 | %+ | | | 0.94 | %+ | | | 1.52 | %* | |
| Net Investment Income to Average Net Assets | | | 4.69 | %+(2) | | | 4.38 | %+ | | | 4.18 | %+ | | | 4.29 | %+ | | | 3.64 | %* | |
^ Commencement of Operations.
† Per share amount is based on average shares outstanding.
++ Calculated based on the net asset value as of the last business day of the period.
# Not Annualized.
+ The Ratios of Expenses and Net Investment Income reflect the rebate of certain Portfolio expenses in connection with the investments in Morgan Stanley affiliates during the period. The effect of the rebate on the ratios is disclosed in the above table as "Ratio of Rebate from Morgan Stanley Affiliates to Average Net Assets".
* Annualized.
§ Amount is less than 0.005%.
(2) Reflects overall Portfolio ratios for investment income and non-class specific expenses.
The accompanying notes are an integral part of the financial statements.
109
2010 Annual Report
September 30, 2010
Financial Highlights
Long Duration Fixed Income Portfolio
| | | Class P | |
| | | Year Ended September 30, | | Period from
July 21,
2006^ to
September 30, | |
| Selected Per Share Data and Ratios | | 2010 | | 2009 | | 2008 | | 2007 | | 2006 | |
| Net Asset Value, Beginning of Period | | $ | 11.51 | | | $ | 9.92 | | | $ | 10.32 | | | $ | 10.48 | | | $ | 10.00 | | |
| Income (Loss) from Investment Operations: | |
| Net Investment Income† | | | 0.51 | | | | 0.46 | | | | 0.44 | | | | 0.46 | | | | 0.09 | | |
| Net Realized and Unrealized Gain (Loss) on Investments | | | 0.82 | | | | 1.67 | | | | (0.37 | ) | | | (0.19 | ) | | | 0.39 | | |
| Total from Investment Operations | | | 1.33 | | | | 2.13 | | | | 0.07 | | | | 0.27 | | | | 0.48 | | |
| Distributions from and/or in Excess of: | |
| Net Investment Income | | | (0.53 | ) | | | (0.54 | ) | | | (0.47 | ) | | | (0.40 | ) | | | — | | |
| Net Realized Gain | | | (0.59 | ) | | | — | | | | — | | | | (0.03 | ) | | | — | | |
| Total Distributions | | | (1.12 | ) | | | (0.54 | ) | | | (0.47 | ) | | | (0.43 | ) | | | — | | |
| Net Asset Value, End of Period | | $ | 11.72 | | | $ | 11.51 | | | $ | 9.92 | | | $ | 10.32 | | | $ | 10.48 | | |
| Total Return++ | | | 12.81 | % | | | 21.91 | % | | | 0.61 | % | | | 2.72 | % | | | 4.80 | %# | |
| Ratios and Supplemental Data: | |
| Net Assets, End of Period (Thousands) | | $ | 586 | | | $ | 575 | | | $ | 496 | | | $ | 516 | | | $ | 524 | | |
| Ratio of Expenses to Average Net Assets (1) | | | 0.75 | %+(2) | | | 0.75 | %+ | | | 0.74 | %+ | | | 0.75 | %+ | | | 0.75 | %* | |
| Ratio of Net Investment Income to Average Net Assets (1) | | | 4.73 | %+(2) | | | 4.43 | %+ | | | 4.18 | %+ | | | 4.48 | %+ | | | 4.40 | %* | |
| Ratio of Rebate from Morgan Stanley Affiliates to Average Net Assets | | | 0.00 | %§ | | | 0.00 | %§ | | | 0.01 | % | | | 0.00 | %§ | | | N/A | | |
| Portfolio Turnover Rate | | | 90 | % | | | 80 | % | | | 63 | % | | | 49 | % | | | 7 | %# | |
| (1) Supplemental Information on the Ratios to Average Net Assets: | |
| Ratios Before Expense Limitation: | |
| Expenses to Average Net Assets | | | 1.04 | %+(2) | | | 1.05 | %+ | | | 1.00 | %+ | | | 1.19 | %+ | | | 1.77 | %* | |
| Net Investment Income to Average Net Assets | | | 4.44 | %+(2) | | | 4.13 | %+ | | | 3.92 | %+ | | | 4.04 | %+ | | | 3.39 | %* | |
^ Commencement of Operations.
† Per share amount is based on average shares outstanding.
# Not Annualized.
++ Calculated based on the net asset value as of the last business day of the period.
+ The Ratios of Expenses and Net Investment Income reflect the rebate of certain Portfolio expenses in connection with the investments in Morgan Stanley affiliates during the period. The effect of the rebate on the ratios is disclosed in the above table as "Ratio of Rebate from Morgan Stanley Affiliates to Average Net Assets".
* Annualized.
§ Amount is less than 0.005%.
(2) Reflects overall Portfolio ratios for investment income and non-class specific expenses.
The accompanying notes are an integral part of the financial statements.
110
2010 Annual Report
September 30, 2010
Notes to Financial Statements
Morgan Stanley Institutional Fund Trust ("MSIFT" or the "Fund") is registered under the Investment Company Act of 1940, as amended (the "1940 Act"), as an open-end management investment company. The Fund is comprised of eight separate, active portfolios (individually referred to as a "Portfolio", collectively as the "Portfolios"). All Portfolios are considered diversified for purposes of the 1940 Act.
The Board of Trustees of the Fund approved a Plan of Liquidation and Dissolution with respect to the International Fixed Income Portfolio. On June 25, 2010, the Portfolio liquidated.
The Fund offers up to five different classes of shares for certain Portfolios — Class I shares, Investment Class shares, Class P shares, Class H shares and Class L shares. Each class of shares has identical voting rights (except shareholders of each Class have exclusive voting rights regarding any matter relating solely to that particular Class of shares), dividend, liquidation and other rights, except each class bears different shareholder service fees as described in Note D.
A. Significant Accounting Policies: The following significant accounting policies are in conformity with U.S. generally accepted accounting principles. Such policies are consistently followed by the Portfolio in the preparation of its financial statements. U.S. generally accepted accounting principles may require management to make estimates and assumptions that affect the reported amounts and disclosures in the financial statements. Actual results may differ from those estimates.
1. Security Valuation: Bonds and other fixed income securities may be valued according to the broadest and most representative market. In addition, bonds and other fixed income securities may be valued on the basis of prices provided by a pricing service. The prices provided by a pricing service take into account broker dealer market price quotations for institutional size trading in similar groups of securities, security quality, maturity, coupon and other security characteristics as well as any developments related to the specific securities. Short-term debt securities purchased with remaining maturities of 60 days or less are valued at amortized cost, unless the Board of Trustees (the "Trustees") determines such valuation does not reflect the securities' market value, in which case these securities will be valued at their fair value as d etermined by the Trustees. Equity securities listed on a U.S. exchange are valued at the latest quoted sales price on the valuation date. Equity securities listed or traded on NASDAQ, for which market quotations are available, are valued at the NASDAQ Official Closing Price. Securities listed on a foreign exchange are valued at their closing price, except as noted below. Unlisted and listed equity securities not traded on the valuation date, for which market quotations are readily available, are valued at the mean between the current bid and asked prices obtained from reputable brokers.
All other securities and investments for which market values are not readily available, including restricted securities, and those securities for which it is inappropriate to determine prices in accordance with the aforementioned procedures, are valued at fair value as determined in good faith under procedures adopted by the Trustees, although the actual calculations may be done by others. Factors considered in making this determination may include, but are not limited to, information obtained by contacting the issuer, analysts, or the appropriate stock exchange (for exchange-traded securities), analysis of the issuer's financial statements or other available documents and, if necessary, available information concerning other securities in similar circumstances.
Most foreign markets close before the New York Stock Exchange (NYSE). Occasionally, developments that could affect the closing prices of securities and other assets may occur between the times at which valuations of such securities are determined (that is, close of the foreign market on which the securities trade) and the close of business on the NYSE. If these developments are expected to materially affect the value of the securities, the valuations may be adjusted to reflect the estimated fair value as of the close of the NYSE, as determined in good faith under procedures established by the Trustees.
2. Foreign Currency Translation: The books and records of the Portfolios are maintained in U.S. dollars. Foreign currency amounts are translated into U.S. dollars at the bid prices of such currencies against U.S. dollars quoted by a bank. Net realized gains (losses) on foreign currency transactions represent net foreign exchange gains (losses) from foreign currency exchange contracts, disposition of foreign currencies, currency gains (losses) realized between the trade and settlement dates on securities transactions, and the difference between the amount of investment income and foreign withholding taxes recorded on the Portfolio's books and the U.S. dollar equivalent amounts actually received or paid.
Certain Portfolios' net assets include foreign denominated securities and currency. The net assets of these Portfolios are presented at the foreign exchange rates and market values at the close of the period. The Portfolios do not isolate that portion of the results of operations arising as a result of changes in the foreign exchange rates from the fluctuations arising from changes in the market prices of the securities held at period end. Similarly, the Portfolios do not isolate the effect of changes in foreign exchange rates from the fluctuations arising from changes in the market prices of securities sold during the period. Accordingly, the components of realized and unrealized foreign currency gains (losses) representing foreign exchange changes on investments is included in the reported net realized and
111
2010 Annual Report
September 30, 2010
Notes to Financial Statements (cont'd)
unrealized gains (losses) on investment transactions and balances. Changes in currency exchange rates will affect the value of and investment income from such securities and currency.
Foreign security and currency transactions may involve certain considerations and risks not typically associated with those of U.S. dollar denominated transactions as a result of, among other factors, fluctuations of exchange rates in relation to the U.S. dollar, the possibility of lower levels of governmental supervision and regulation of foreign securities markets and the possibility of political or economic instability.
3. Derivatives: Certain Portfolios may use derivative instruments for a variety of purposes, including hedging, risk management, portfolio management or to earn income. Derivatives are financial instruments whose value is based on the value of another underlying asset, interest rate, index or financial instrument. A derivative instrument often has risks similar to its underlying instrument and may have additional risks, including imperfect correlation between the value of the derivative and the underlying instrument, risks of default by the other party to certain transactions, magnification of losses incurred due to changes in the market value of the securities, instruments, indices or interest rates to which they relate, and risks that the transactions may not be liquid. The use of derivatives involves risks that are different from, and po ssibly greater than, the risks associated with other portfolio investments. Derivatives may involve the use of highly specialized instruments that require investment techniques and risk analyses different from those associated with other portfolio investments. All of a Portfolio's holdings, including derivative instruments, are marked to market each day with the change in value reflected in unrealized appreciation (depreciation). Upon disposition, a realized gain or loss is generally recognized.
Certain derivative transactions may give rise to a form of leverage. Leverage associated with derivative transactions may cause the Portfolios to liquidate portfolio positions when it may not be advantageous to do so to satisfy its obligations or to meet earmarking or segregation requirements, pursuant to applicable SEC rules and regulations, or may cause the Portfolios to be more volatile than if the Portfolios had not been leveraged. Although the Investment Adviser and/or Sub-Advisor seek to use derivatives to further the Portfolios' investment objectives, there is no assurance that the use of derivatives will achieve this result.
Following is a description of the derivative instruments and techniques that each Portfolio may use and their associated risks:
Futures. In respect to futures, a Portfolio is subject to equity risk, interest rate risk and foreign currency exchange risk in the normal course of pursuing its investment objectives. A futures contract is a standardized agreement between two parties to buy or sell a specific quantity of an underlying instrument at a specific price at a specific future time. The value of a futures contract tends to increase and decrease in tandem with the value of the underlying instrument. Futures contracts are bilateral agreements, with both the purchaser and the seller equally obligated to complete the transaction. Depending on the terms of the particular contract, futures contracts are settled through either physical delivery of the underlying instrument on the settlement date or by payment of a cash settlement amount on the settlement date. During the period the futures contract is open, payments are received from or made to the broker based upon changes in the value of the contract (the variation margin). The risk of loss associated with a futures contract is in excess of the variation margin reflected as part of "Due from (to) Brokers" on the Statements of Assets and Liabilities. A decision as to whether, when and how to use futures involves the exercise of skill and judgment and even a well conceived futures transaction may be unsuccessful because of market behavior or unexpected events. In addition to the derivatives risks discussed above, the prices of futures can be highly volatile, using futures can lower total return, and the potential loss from futures can exceed a Portfolio's initial investment in such contracts.
Swaps. In respect to swaps, a Portfolio is subject to equity risk, interest rate risk and credit risk in the normal course of pursuing its investment objectives. A swap agreement is an agreement between two parties pursuant to which the parties exchange payments at specified dates on the basis of a specified notional amount, with the payments calculated by reference to specified securities, indexes, reference rates, currencies or other instruments. Most swap agreements provide that when the period payment dates for both parties are the same, the payments are made on a net basis (i.e., the two payment streams are netted out, with only the net amount paid by one party to the other). A Portfolio's obligations or rights under a swap agreement entered into on a net basis will generally be equal only to the net amount to be paid or received under the agreem ent, based on the relative values of the positions held by each counterparty. In a zero-coupon interest rate swap, payment only occurs at maturity, at which time one counterparty pays the total compounded fixed rate over the life
112
2010 Annual Report
September 30, 2010
Notes to Financial Statements (cont'd)
of the swap and the other pays the total compounded floating rate that would have been earned had a series of floating rate investments been rolled over through the life of the swap. Swap agreements are not entered into or traded on exchanges and there is no central clearing or guaranty function for swaps. Therefore, swaps are subject to credit risk or the risk of default or non-performance by the counterparty. Swaps could result in losses if interest rate or foreign currency exchange rates or credit quality changes are not correctly anticipated by a Portfolio or if the reference index, security or investments do not perform as expected. When a Portfolio has an unrealized loss on a swap agreement, the Portfolio has instructed the custodian to pledge cash or liquid securities as collateral with a value approximately equal to the amount of the unrealized loss. Collateral pledges are monitored and subsequently adjusted if and when the swap valuations fluctuate. Cash collateral is included with "Due from (to) Brokers" on the Statements of Assets and Liabilities. Cash collateral has been offset against open swap agreements under the provisions of Financial Accounting Standards Board ("FASB") Accounting Standards CodificationTM ("ASC") "Balance Sheet" (ASC 210). Offsetting of Amounts Related to Certain Contracts an interpretation of ASC 210-20 and are included within "Swap Agreements, at value" on the Statements of Assets and Liabilities. For cash collateral received, a Portfolio pays a monthly fee to the counterparty based on the effective rate for Federal Funds. This fee, when paid, is included within realized gain (loss) on swap agreements on the Statements of Operations.
The Portfolios adopted the provisions of the FASB ASC 815-10, "Derivatives and Hedging" ("ASC 815-10") and ASC 460-10, "Guarantees" ("ASC 460-10"): An Amendment of FASB ASC 815 and ASC 460, effective December 31, 2008. ASC 815-10 and ASC 460-10 require the seller of credit derivatives to provide additional disclosure about its credit derivatives. The Portfolio's use of swaps may include those based on the credit of an underlying security and commonly referred to as credit default swaps. Where a Portfolio is the buyer of a credit default swap agreement, it would be entitled to receive the par (or other agreed-upon) value of a referenced debt obligation from the counterparty to the agreement only in the event of a default by a third party on the debt obligation. If no default occurs, a Portfolio would have paid to the counterparty a periodic stream of payments over the term of the agreement and received no benefit from the agreeme nt. When a Portfolio is the seller of a credit default swap agreement, it receives the stream of payments but is obligated to pay upon default of the referenced debt obligation. The current credit rating of each individual issuer is listed in the table following the Portfolio of Investments and serves as an indicator of the current status of the payment/performance risk of the credit derivative. Alternatively, for credit default swaps on an index of credits, the quoted market prices and current values serve as an indicator of the current status of the payment/performance risk of the credit derivative. Generally, lower credit ratings and increasing market values, in absolute terms, represent a deterioration of the credit and a greater likelihood of an adverse credit event of the issuer.
Upfront payments received or paid by a Portfolio will be reflected as an asset or liability on the Statements of Assets and Liabilities.
Foreign Currency Forward Contracts. In connection with its investments in foreign securities, a Portfolio also may enter into contracts with banks, brokers or dealers to purchase or sell securities or foreign currencies at a future date ("forward contracts"). A foreign currency forward contract is a negotiated agreement between the contracting parties to exchange a specified amount of currency at a specified future time at a specified rate. The rate can be higher or lower than the spot rate between the currencies that are the subject of the contract. Forward foreign currency exchange contracts may be used to protect against uncertainty in the level of future foreign currency exchange rates or to gain or modify exposure to a particular currency. In addition, a Portfolio may use cross currency hedging or proxy hedging with respect to currencies in which a Portfolio has or expects to have portfolio or currency exposure. Cross currency hedges involve the sale of one currency against the positive exposure to a different currency and may be used for hedging purposes or to establish an active exposure to the exchange rate between any two currencies. A currency exchange contract is marked-to-market daily and the change in market value is recorded by a Portfolio as unrealized gain (loss). A Portfolio records realized gains (losses) when the contract is closed equal to the difference between the value of the contract at the time it was opened and the value at the time it was closed. Hedging a Portfolio's currency risks involves the risk of mismatching a Portfolio's objectives under a forward or futures contract with the value of securities denominated in a particular currency. Furthermore, such transactions reduce or preclude the opportunity for gain if the value of the currency should move in the direction opposite to the position taken. There is an additional ri sk to the effect that currency contracts create exposure to currencies in which a Portfolio's securities are not denominated. Unanticipated changes in currency prices may result in poorer overall performance for a Portfolio than if it had not entered into such contracts.
113
2010 Annual Report
September 30, 2010
Notes to Financial Statements (cont'd)
FASB ASC 815, "Derivatives and Hedging: Overall" ("ASC 815") is intended to improve financial reporting about derivative instruments by requiring enhanced disclosures to enable investors to better understand how and why the Portfolios use derivative instruments, how these derivative instruments are accounted for and their effects each Portfolio's financial position and results of operations.
The following table sets forth the fair value of each Portfolio's derivative contracts by primary risk exposure as of September 30, 2010.
| Primary Risk Exposure | | Statements of
Assets and
Liabilities | | Foreign
Currency
Exchange
Contracts
(000) | | Futures
Contracts
(000)(a) | | Swap
Agreements
(000) | |
| Balanced: | |
Foreign Currency
Contracts Risk | | Receivables | | $ | 43 | | | $ | — | | | $ | — | | |
| Equity Risk | | Receivables | | | — | | | | 83 | | | | — | | |
| Interest Rate Risk | | Receivables | | | | | | | 16 | | | | 8 | | |
| Total Receivables | | | | $ | 43 | | | $ | 99 | | | $ | 8 | | |
Foreign Currency
Contracts Risk | | Payables | | | 47 | | | | — | | | | — | | |
| Equity Risk | | Payables | | | — | | | | 10 | | | | — | | |
| Interest Rate Risk | | Payables | | | — | | | | 17 | | | | 139 | | |
| Total Payables | | | | $ | 47 | | | $ | 27 | | | $ | 139 | | |
| Mid Cap Growth: | |
Foreign Currency
Contracts Risk | | Receivables | | $ | 9 | | | $ | — | | | $ | — | | |
Foreign Currency
Contracts Risk | | Payables | | $ | 13 | | | $ | — | | | $ | — | | |
| Core Fixed Income: | |
| Interest Rate Risk | | Receivables | | $ | — | | | $ | 58 | | | $ | 93 | | |
| Credit Risk | | Payables | | | — | | | | — | | | | 49 | | |
| Interest Rate Risk | | Payables | | | — | | | | 33 | | | | 1,294 | | |
| Total Payables | | | | $ | — | | | $ | 33 | | | $ | 1,343 | | |
| Core Plus Fixed Income: | |
| Interest Rate Risk | | Receivables | | $ | — | | | $ | 605 | | | $ | 247 | | |
| Credit Risk | | Payables | | | — | | | | — | | | | 263 | | |
| Interest Rate Risk | | Payables | | | — | | | | 337 | | | | 5,844 | | |
| Total Payables | | | | $ | — | | | $ | 337 | | | $ | 6,107 | | |
| Intermediate Duration: | |
| Interest Rate Risk | | Receivables | | $ | — | | | $ | 93 | | | $ | 189 | | |
| Interest Rate Risk | | Payables | | $ | — | | | $ | 82 | | | $ | 1,832 | | |
| Investment Grade Fixed Income: | |
| Interest Rate Risk | | Receivables | | $ | — | | | $ | 74 | | | $ | — | | |
| Credit Risk | | Payables | | | — | | | | — | | | | 53 | | |
| Interest Rate Risk | | Payables | | | — | | | | 64 | | | | 1,064 | | |
| Total Payables | | | | $ | — | | | $ | 64 | | | $ | 1,117 | | |
| Limited Duration: | |
| Interest Rate Risk | | Receivables | | $ | — | | | $ | 65 | | | $ | 260 | | |
| Interest Rate Risk | | Payables | | $ | — | | | $ | 26 | | | $ | 3,475 | | |
| Long Duration Fixed Income: | |
| Interest Rate Risk | | Receivables | | $ | — | | | $ | 16 | | | $ | 54 | | |
| Interest Rate Risk | | Payables | | $ | — | | | $ | 26 | | | $ | 429 | | |
(a) This amount represents the cumulative appreciation (depreciation) of futures contracts as reported in the Portfolio of Investments. The Statements of Assets and Liabilities only reflect the current day variation margin, receivable/payable to brokers.
The following tables set forth by primary risk exposure the Portfolio's realized gains (losses) and change in unrealized appreciation (depreciation) by type of derivative contract for the year ended September 30, 2010 in accordance with ASC 815.
| Realized Gain (Loss) | |
| Portfolio | | Primary Risk
Exposure | | Derivative
Type | | Value
(000) | |
| Balanced Foreign Currency | | Foreign Currency
Contracts Risk | | Exchange Contracts | | $ | 174 | | |
| | | Equity Risk | | Futures Contracts | | | 33 | | |
| | | Interest Rate Risk | | Futures Contracts | | | 66 | | |
| | | Interest Rate Risk | | Swap Agreements | | | (44 | ) | |
| Total | | | | | | $ | 229 | | |
| Change in Unrealized Appreciation (Depreciation) | |
| Portfolio | | Primary Risk
Exposure | | Derivative
Type | | Value
(000) | |
| Balanced Foreign Currency Foreign Currency | |
Contracts Risk | | Exchange Contracts | | $ | (68 | ) | |
| | | Equity Risk | | Futures Contracts | | | 40 | | |
| | | Interest Rate Risk | | Futures Contracts | | | 8 | | |
| | | Interest Rate Risk | | Swap Agreements | | | (150 | ) | |
| Total | | | | | | $ | (170 | ) | |
| Realized Gain (Loss) | |
| Portfolio | | Primary Risk
Exposure | | Derivative
Type | | Value
(000) | |
| Mid Cap Growth Foreign Currency | | Foreign Currency
Contracts Risk | | Exchange Contracts | | $ | (504 | ) | |
| Change in Unrealized Appreciation (Depreciation) | |
| Portfolio | | Primary Risk
Exposure | | Derivative
Type | | Value
(000) | |
| Mid Cap Growth Foreign Currency | | Foreign Currency
Contracts Risk | | Exchange Contracts | | $ | (4 | ) | |
| Realized Gain (Loss) | |
| Portfolio | | Primary Risk
Exposure | | Derivative
Type | | Value
(000) | |
| Core Fixed Income | | Interest Rate Risk | | Futures Contracts | | $ | 302 | | |
| | | Interest Rate Risk | | Swap Agreements | | | (578 | ) | |
| Total | | | | | | $ | (276 | ) | |
| Change in Unrealized Appreciation (Depreciation) | |
| Portfolio | | Primary Risk
Exposure | | Derivative
Type | | Value
(000) | |
| Core Fixed Income | | Interest Rate Risk | | Futures Contracts | | $ | (7 | ) | |
| | | Credit Risk | | Swap Agreements | | | 7 | | |
| | | Interest Rate Risk | | Swap Agreements | | | (771 | ) | |
| Total | | | | | | $ | (771 | ) | |
| Realized Gain (Loss) | |
| Portfolio | | Primary Risk
Exposure | | Derivative
Type | | Value
(000) | |
| Core Plus Fixed Income | | Equity Risk | | Futures Contracts | | $ | 6,155 | | |
| | | Interest Rate Risk | | Swap Agreements | | | (5,691 | ) | |
| Total | | | | | | $ | 464 | | |
| Change in Unrealized Appreciation (Depreciation) | |
| Portfolio | | Primary Risk
Exposure | | Derivative
Type | | Value
(000) | |
| Core Plus Fixed Income | | Interest Rate Risk | | Futures Contracts | | $ | (598 | ) | |
| | | Credit Risk | | Swap Agreements | | | 39 | | |
| | | Interest Rate Risk | | Swap Agreements | | | (2,604 | ) | |
| Total | | | | | | $ | (3,163 | ) | |
114
2010 Annual Report
September 30, 2010
Notes to Financial Statements (cont'd)
| Realized Gain (Loss) | |
| Portfolio | | Primary Risk
Exposure | | Derivative
Type | | Value
(000) | |
| Intermediate Duration | | Interest Rate Risk | | Futures Contracts | | $ | (377 | ) | |
| | | Interest Rate Risk | | Swap Agreements | | | (323 | ) | |
| Total | | | | | | $ | (700 | ) | |
| Change in Unrealized Appreciation (Depreciation) | |
| Portfolio | | Primary Risk
Exposure | | Derivative
Type | | Value
(000) | |
| Intermediate Duration | | Interest Rate Risk | | Futures Contracts | | $ | (7 | ) | |
| | | Interest Rate Risk | | Swap Agreements | | | (975 | ) | |
| Total | | | | | | $ | (982 | ) | |
| Realized Gain (Loss) | |
| Portfolio | | Primary Risk
Exposure | | Derivative
Type | | Value
(000) | |
Investment Grade
Fixed Income | | Interest Rate Risk | | Futures Contracts | | $ | 500 | | |
| | | Interest Rate Risk | | Swap Agreements | | | (644 | ) | |
| Total | | | | | | $ | (144 | ) | |
| Change in Unrealized Appreciation (Depreciation) | |
| Portfolio | | Primary Risk
Exposure | | Derivative
Type | | Value
(000) | |
Investment Grade
Fixed Income | | Interest Rate Risk | | Futures Contracts | | $ | (158 | ) | |
| | | Credit Risk | | Swap Agreements | | | 8 | | |
| | | Interest Rate Risk | | Swap Agreements | | | (671 | ) | |
| Total | | | | | | $ | (821 | ) | |
| Realized Gain (Loss) | |
| Portfolio | | Primary Risk
Exposure | | Derivative
Type | | Value
(000) | |
| Limited Duration | | Interest Rate Risk | | Futures Contracts | | $ | (615 | ) | |
| | | Interest Rate Risk | | Swap Agreements | | | (826 | ) | |
| Total | | | | | | $ | (1,441 | ) | |
| Change in Unrealized Appreciation (Depreciation) | |
| Portfolio | | Primary Risk
Exposure | | Derivative
Type | | Value
(000) | |
| Limited Duration Foreign Currency | | Foreign Currency
Contracts Risk | | Exchange Contracts | | $ | 191 | | |
| | | Interest Rate Risk | | Swap Agreements | | | (1,815 | ) | |
| Total | | | | | | $ | (1,624 | ) | |
| Realized Gain (Loss) | |
| Portfolio | | Primary Risk
Exposure | | Derivative
Type | | Value
(000) | |
Long Duration Foreign Currency Foreign Currency
Fixed Income | | Contracts Risk | | Exchange Contracts | | $ | — | @ | |
| | | Interest Rate Risk | | Futures Contracts | | | 479 | | |
| | | Interest Rate Risk | | Swap Agreements | | | (195 | ) | |
| Total | | | | | | $ | 284 | | |
| Change in Unrealized Appreciation (Depreciation) | |
| Portfolio | | Primary Risk
Exposure | | Derivative
Type | | Value
(000) | |
Long Duration
Fixed Income | | Interest Rate Risk | | Futures Contracts | | $ | (33 | ) | |
| | | Interest Rate Risk | | Swap Agreements | | | (238 | ) | |
| Total | | | | | | $ | (271 | ) | |
@ Amount is less that $500.
All open derivative positions at period end are reflected on each respective Portfolio's Portfolio of Investments and the volume of these open positions relative to the net assets of each respective Portfolio is generally representative of open positions throughout the reporting period.
4. When-Issued/Delayed Delivery Securities: Each Portfolio may purchase or sell when-issued and delayed delivery securities. Securities purchased on a when-issued or delayed delivery basis are purchased for delivery beyond the normal settlement date at a stated price and yield, and no income accrues to the Portfolio on such securities prior to delivery. Payment and delivery for when-issued and delayed delivery securities can take place up to 120 days after the date of the transaction. When a Portfolio enters into a purchase transaction on a when-issued or delayed delivery basis, it establishes either a segregated account in which it maintains liquid assets in an amount at least equal in value to the Portfolio's commitments to purchase such securities or designates such assets as segregated on a Portfolio's records. Purchasing securities on a when-issued or delayed delivery basis may involve a risk that the market price at the time of delivery may be lower than the agreed upon purchase price, in which case there could be an unrealized loss at the time of delivery. Purchasing investments on a when-issued or delayed delivery basis may be considered a form of leverage which may increase the impact that gains (losses) may have on the Portfolio.
5. Repurchase Agreements: The Portfolios may enter into repurchase agreements under which a Portfolio lends excess cash and takes possession of securities with an agreement that the counterparty will repurchase such securities. In connection with transactions in repurchase agreements, a bank as custodian for the Portfolio takes possession of the underlying securities which are held as collateral, with a market value at least equal to the amount of the repurchase transaction, including principal and accrued interest. To the extent that any repurchase transaction exceeds one business day, the value of the collateral is marked-to-market on a daily basis to determine the adequacy of the collateral. In the event of default on the obligation to repurchase, the Portfolio has the right to liquidate the collateral and apply the proceeds in satisfact ion of the obligation. In the event of default or bankruptcy by the counterparty to the agreement, realization and/or retention of the collateral or proceeds may be subject to legal proceedings. The Portfolio, along with other affiliated investment companies, may utilize a joint trading account for the purpose of entering into repurchase agreements.
6. Redemption Fees: The redemption fee is designed to protect each Portfolio and its shareholders from the effects of short-term trading. These fees, if any, are included on the Statements of Changes in Net Assets. Prior to January 31, 2009, shares of the Balanced, Mid Cap
115
2010 Annual Report
September 30, 2010
Notes to Financial Statements (cont'd)
Growth, Core Fixed Income, Core Plus Fixed Income, Intermediate Duration, Investment Grade Fixed Income, Limited Duration and Long Duration Fixed Income Portfolios redeemed within seven days of purchase may be subject to a 2% redemption fee, payable to the Portfolio.
7. Fair Value Measurement: In accordance with FASB ASC 820 "Fair Value Measurements and Disclosure" ("ASC 820"), fair value is defined as the price that the Portfolios would receive to sell an investment or pay to transfer a liability in a timely transaction with an independent buyer in the principal market, or in the absence of a principal market the most advantageous market for the investment or liability. ASC 820 establishes a three-tier hierarchy to distinguish between (1) inputs that reflect the assumptions market participants would use in valuing an asset or liability developed based on market data obtained from sources independent of the reporting entity (observable inputs) and (2) inputs that reflect the reporting entity's own assumptions about the assumptions market participants would use in valuing an asset or liability developed based on the best information available in the circumstances (unobservable inputs) and to establish classification of fair value measurements for disclosure purposes. Various inputs are used in determining the value of the Portfolios' investments. The inputs are summarized in the three broad levels listed below.
• Level 1 – quoted prices in active markets for identical securities
• Level 2 – other significant observable inputs (including quoted prices for similar investments, interest rates, prepayment speeds, credit risk, etc.)
• Level 3 – significant unobservable inputs (including each Portfolio's own assumptions in determining the fair value of investments)
The inputs or methodology used for valuing securities are not necessarily an indication of the risk associated with investing in those securities.
On January 21, 2010, the Financial Accounting Standards Board issued Accounting Standards Update ("ASU") 2010-06. The ASU amends Accounting Standards Codification 820 to add new requirements for disclosures about transfers into and out of Levels 1 and 2 and separate disclosures about purchases, sales, issuances, and settlements relating to Level 3 measurements. It also clarifies existing fair value disclosures about the level of disaggregation and about inputs and valuation techniques in Level 2 and Level 3 fair value measurements. The application of ASU 2010-06 is required for fiscal years and interim periods beginning after December 15, 2009, except for disclosures about purchases, sales, issuances, and settlements relating to level 3 measurements, which are required for fiscal years beginning after December 15, 2010 and for interim periods within those fiscal years. The impact of this new guidance on the Fund's financial stat ements, if any, is currently being assessed by the Fund's management.
8. Indemnifications: The Fund enters into contracts that contain a variety of indemnifications. The Fund's maximum exposure under these arrangements is unknown. However, the Fund has not had prior claims or losses pursuant to these contracts and expects the risk of loss to be remote.
9. Other: Security transactions are accounted for on the date the securities are purchased or sold for financial reporting purposes. Realized gains (losses) on the sale of investment securities are determined on the specific identified cost basis. Dividend income and distributions are recorded on the ex-dividend date (except for certain foreign dividends which may be recorded as soon as the Fund is informed of such dividends) net of applicable withholding taxes. Interest income is recognized on the accrual basis except where collection is in doubt.
Discounts and premiums on securities purchased are amortized according to the effective yield method over their respective lives. Most expenses of the Fund can be directly attributed to a particular Portfolio. Expenses which cannot be directly attributed are apportioned among the Portfolios based upon relative net assets or other appropriate measures. Income, expenses (other than class specific expenses) and realized and unrealized gains or losses are allocated to each class of shares based upon their relative net assets.
B. Investment Advisory Fees: Morgan Stanley Investment Management Inc. (the "U.S. Adviser" or "MS Investment Management") a wholly-owned subsidiary of Morgan Stanley, performs investment advisory services at a fee calculated by applying a quarterly rate based on the annual percentage rate listed below, to each Portfolio's average daily net assets for the quarter.
| Portfolio | | Average Daily
Net Assets | | Advisory
Fee | |
| Balanced | | | | | 0.450 | % | |
| Mid Cap Growth | | | | | 0.500 | | |
| Core Fixed Income | | | | | 0.375 | | |
| Core Plus Fixed Income | | first $1 billion | | | 0.375 | | |
| | | over $1 billion | | | 0.300 | | |
| Intermediate Duration | | | | | 0.375 | | |
| Investment Grade Fixed Income | | | | | 0.375 | | |
| Limited Duration | | | | | 0.300 | | |
| Long Duration Fixed Income | | | | | 0.375 | | |
With respect to certain portfolios, the Adviser has voluntarily agreed to reduce the fees payable to it and, if necessary, reimburse the Portfolio for certain expenses, after giving effect to
116
2010 Annual Report
September 30, 2010
Notes to Financial Statements (cont'd)
custody fee offsets, so that annual operating expenses will not exceed voluntary expense limitations established for each class of shares as presented in the table below.
| | | Voluntary Expense Limitations | |
| Portfolio | | Class
I | | Investment
Class | | Class
P | |
| Core Fixed Income | | | 0.50 | % | | | 0.50 | % | | | 0.75 | % | |
| Long Duration Fixed Income | | | 0.50 | | | | — | | | | 0.75 | | |
Fee waivers and/or expense reimbursements are voluntary and may be commenced or terminated at any time. For the year ended September 30, 2010, the Portfolios had advisory fees waived and/or certain expenses reimbursed as follows:
| Portfolio | | Advisory Fees
Waived and/or
Reimbursed
(000) | |
| Core Fixed Income | | $ | 140 | | |
| Long Duration Fixed Income | | | 89 | | |
C. Administration Fees: MS Investment Management (the "Administrator") also provides the Fund with administrative services pursuant to an administration agreement for an annual fee, accrued daily and paid monthly, of 0.08% of each Portfolio's average daily net assets.
Under an agreement between the Administrator and State Street Bank and Trust Company ("State Street"), State Street provides certain administrative services to the Fund. For such services, the Administrator pays State Street a portion of the fee the Administrator receives from the Fund. Prior to May 3, 2010, JPMorgan Investor Services Co. ("JPMIS") provided certain administrative services to the Fund. For such services, the Administrator paid JPMIS a portion of the fee the administrator received from the Fund.
D. Distribution and Shareholder Servicing Fees: Morgan Stanley Distribution, Inc. ("MSDI" or the "Distributor"), a wholly-owned subsidiary of the Adviser, serves as the distributor of the Fund.
Pursuant to a Shareholder Service Plan, each Portfolio may pay the Distributor a shareholder servicing fee, accrued daily and paid monthly, at an annual rate of up to 0.15% of the Portfolio's average daily net assets attributable to Investment Class shares. Pursuant to separate Shareholder Service Plans, each Portfolio may pay to the Distributor and other affiliated and unaffiliated broker-dealers, financial institutions and/or intermediaries a service fee, accrued daily and paid monthly, at an annual rate of up to 0.25% of the Portfolio's average daily net assets attributable to Class P and Class H shares, respectively. The shareholder servicing fee is used to support the expenses associated with servicing and maintaining accounts. The Distributor has voluntarily agreed to waive 0.10% of the 0.25% shareholder servicing fee it is entitled to receive from the Class P shares' average daily net assets for the Investment Grade Fixed Income Portfolio.
In addition, the Fund has adopted a Distribution and Shareholder Services Plan with respect to Class L shares pursuant to Rule 12b-1 under the 1940 Act. Under the Distribution and Shareholder Services Plan, each applicable Portfolio pays the Distributor a distribution fee, accrued daily and paid monthly, at an annual rate of 0.25% and a shareholder service fee, accrued daily and paid monthly, at an annual rate of 0.25% of the Portfolio's average daily net assets attributable to Class L shares.
The distribution and shareholder servicing fees are used to support the expenses associated with servicing and maintaining accounts. The Distributor may compensate other parties for providing shareholder support services to investors who purchase Class P, Class H and Class L shares.
E. Dividend Disbursing and Transfer Agent: The Fund's dividend disbursing and transfer agent is Morgan Stanley Services Company Inc. ("Morgan Stanley Services"). Pursuant to a transfer agency agreement, the Fund pays Morgan Stanley Services a fee generally based on the number of classes, accounts and transactions relating to the Portfolios of the Fund.
F. Custodian Fees: State Street Bank and Trust Company (the "Custodian") serves as Custodian for the Fund in accordance with a custodian agreement. The Custodian holds cash, securities, and other assets of the Fund as required by the 1940 Act.
The Fund has entered into an arrangement with its Custodian whereby credits realized on uninvested cash balances were used to offset a portion of each Portfolio's expenses. If applicable, these custodian credits are shown as "Expense Offset" in the Statements of Operations.
Prior to May 3, 2010, JPMorgan Chase Bank, N.A. served as custodian for the Fund in accordance with the custodian agreement.
G. Portfolio Investment Activity:
1. Security Transactions: During the year ended September 30, 2010, purchases and sales of investment securities, other than long-term U.S. Government securities and short-term investments, were:
| Portfolio | | Purchases
(000) | | Sales
(000) | |
| Balanced | | $ | 38,471 | | | $ | 57,469 | | |
| Mid Cap Growth | | | 2,046,292 | | | | 941,576 | | |
| Core Fixed Income | | | 19,311 | | | | 28,947 | | |
| Core Plus Fixed Income | | | 344,965 | | | | 334,353 | | |
| Intermediate Duration | | | 24,783 | | | | 49,075 | | |
| Investment Grade Fixed Income | | | 24,318 | | | | 51,994 | | |
| Limited Duration | | | 124,717 | | | | 185,168 | | |
| Long Duration Fixed Income | | | 7,565 | | | | 7,747 | | |
117
2010 Annual Report
September 30, 2010
Notes to Financial Statements (cont'd)
During the year ended September 30, 2010, purchases and sales of long-term U.S. government securities were:
| Portfolio | | Purchases
(000) | | Sales
(000) | |
| Balanced | | $ | 43,755 | | | $ | 49,491 | | |
| Core Fixed Income | | | 194,032 | | | | 206,270 | | |
| Core Plus Fixed Income | | | 1,813,680 | | | | 1,942,127 | | |
| Intermediate Duration | | | 83,138 | | | | 110,795 | | |
| Investment Grade Fixed Income | | | 243,889 | | | | 279,103 | | |
| Limited Duration | | | 97,503 | | | | 96,796 | | |
| Long Duration Fixed Income | | | 19,587 | | | | 20,462 | | |
2. Transactions with Affiliates: The Portfolios invest in the Institutional Class of portfolios within the Morgan Stanley Institutional Liquidity Funds (the "Liquidity Funds"), an open-end management investment company managed by the Adviser, both directly, and as a portion of the securities held as collateral on loaned securities. A summary of the Portfolio's transactions in shares of the Liquidity Funds during the year ended September 30, 2010 were as follows:
| Portfolio | | Market Value
September 30,
2009
(000) | | Purchases
at Cost
(000) | | Sales
Proceeds
(000) | | Dividend
Income
(000) | | Market Value
September 30,
2010
(000) | |
| Balanced | | $ | 9,292 | | | $ | 36,166 | | | $ | 32,235 | | | $ | 8 | | | $ | 13,223 | | |
| Mid Cap Growth | | | 248,144 | | | | 1,293,306 | | | | 1,181,831 | | | | 369 | | | | 359,619 | | |
| Core Fixed Income | | | 14,933 | | | | 62,735 | | | | 64,000 | | | | 6 | | | | 13,668 | | |
Core Plus Fixed
Income | | | 175,901 | | | | 599,389 | | | | 746,273 | | | | 56 | | | | 29,017 | | |
Intermediate
Duration | | | 2,193 | | | | 74,325 | | | | 76,258 | | | | 4 | | | | 260 | | |
Investment Grade
Fixed Income | | | 4,539 | | | | 73,787 | | | | 67,572 | | | | 7 | | | | 10,754 | | |
| Limited Duration | | | — | | | | 130,665 | | | | 127,887 | | | | 8 | | | | 2,778 | | |
Long Duration
Fixed Income | | | 605 | | | | 10,349 | | | | 10,631 | | | | 1 | | | | 323 | | |
Investment Advisory fees paid by the Portfolios are reduced by an amount equal to its pro-rata share of the advisory and administration fees paid by the Portfolios due to its investment in the Liquidity Funds ("Rebate"). For the year ended September 30, 2010, advisory fees paid were reduced as follows:
| Portfolio | | Rebate
(000) | |
| Balanced | | $ | 5 | | |
| Mid Cap Growth | | | 257 | | |
| Core Fixed Income | | | 4 | | |
| Core Plus Fixed Income | | | 46 | | |
| Intermediate Duration | | | 3 | | |
| Investment Grade Fixed Income | | | 5 | | |
| Limited Duration | | | 6 | | |
| Long Duration Fixed Income | | | — | @ | |
@ Amount is less than $500.
For the year ended September 30, 2010, the following Portfolios had transactions with Citigroup, Inc. and its affiliated brokers/dealers, which are affiliates of the Investment Adviser, Distributor and Administrator:
| Portfolio | | Market
Value
September 30,
2009
(000) | | Purchases
at Cost
(000) | | Sales
Proceeds
(000) | | Realized
Gain/Loss
(000) | | Interest
Income
(000) | | Market
Value
September 30,
2010
(000) | |
| Balanced | | $ | 242 | | | $ | 287 | | | $ | 110 | | | $ | (348 | ) | | $ | 17 | | | $ | 443 | | |
Core Fixed
Income | | | 1,377 | | | | 117 | | | | 377 | | | | 15 | | | | 81 | | | | 1,307 | | |
Core Plus
Fixed
Income | | | 14,437 | | | | 2,219 | | | | 9,433 | | | | 1,365 | | | | 829 | | | | 8,990 | | |
Intermediate
Duration | | | 1,729 | | | | — | | | | 882 | | | | 75 | | | | 79 | | | | 966 | | |
Investment
Grade Fixed
Income | | | 2,740 | | | | 88 | | | | 994 | | | | 127 | | | | 125 | | | | 2,153 | | |
Limited
Duration | | | 4,040 | | | | 1,972 | | | | 4,080 | | | | 160 | | | | 148 | | | | 4,030 | | |
Long Duration
Fixed
Income | | | 391 | | | | 11 | | | | 52 | | | | 3 | | | | 26 | | | | 404 | | |
During the year ended September 30, 2010, the following Portfolios paid brokerage commissions to Morgan Stanley & Co., Inc., an affiliated broker/dealer:
| Portfolio | | Broker
Commissions
(000) | |
| Balanced | | $ | — | @ | |
| Mid Cap Growth | | | 15 | | |
@ Amount is less than $500.
During the year ended September 30, 2010, the following Portfolios paid brokerage commissions to Citigroup, Inc., an affiliated broker/dealer:
| Portfolio | | Broker
Commissions
(000) | |
| Balanced | | $ | — | @ | |
| Mid Cap Growth | | | 31 | | |
@ Amount is less than $500.
H. Securities Lending: Certain Portfolios may lend securities to qualified financial institutions, such as broker-dealers, to earn additional income. Any increase or decrease in the fair value of the securities loaned that might occur and any interest earned or dividends declared on those securities during the term of the loan would remain in the Portfolio. Portfolios that lend securities receive cash or securities as collateral in an amount equal to or exceeding 100% of the current fair value of the loaned securities. The collateral is marked to market daily, by the securities lending agent, to ensure that a minimum of 100% collateral coverage is maintained.
Based on pre-established guidelines, the securities lending agent invests any cash collateral that is received in an affiliated money market portfolio and repurchase agreements backed by
118
2010 Annual Report
September 30, 2010
Notes to Financial Statements (cont'd)
the U.S. Treasury and Agency securities. Securities lending income is generated from the earnings on the invested collateral and borrowing fees, less any rebates owed to the borrowers and compensation to the lending agent, and is included in the Portfolios' Statements of Operations in affiliated dividend income and interest income. Risks in securities lending transactions are that a borrower may not provide additional collateral when required or return the securities when due, and that the value of the short-term investments will be less than the amount of cash collateral plus any rebate that is required to be returned to the borrower.
The value of the loaned securities and related collateral outstanding at September 30, 2010 were as follows:
| Portfolio | | Value of Loaned
Securities
(000) | | Value of
Collateral*
(000) | |
| Balanced | | $ | 12,632 | | | $ | 12,958 | | |
| Core Fixed Income | | | 18,568 | | | | 18,948 | | |
| Core Plus Fixed Income | | | 34,018 | | | | 34,711 | | |
| Investment Grade Fixed Income | | | 14,083 | | | | 14,380 | | |
* Included in these amounts are approximately $1,633,000, $4,952,000, $9,500,000, and $4,382,000 for the Balanced, Core Fixed Income, Core Plus Fixed Income and Investment Grade Fixed Income Portfolios, respectively, which was received in the form of short-term pooled securities, which the Portfolios cannot sell or repledge and accordingly are not reflected in the Portfolios of Investments.
The following Portfolios had income from securities lending (after rebates to borrowers and fees paid to securities lending agent), included within Dividend Income on the Statements of Operations, as follows:
| Portfolio | | Net Interest
Earned by
Portfolio
(000) | |
| Balanced | | $ | 11 | | |
| Core Fixed Income | | | 22 | | |
| Core Plus Fixed Income | | | 206 | | |
| Investment Grade Fixed Income | | | 19 | | |
I. Federal Income Taxes: It is each Portfolio's intention to continue to qualify as a regulated investment company and distribute all of its taxable and tax-exempt income. Accordingly, no provision for Federal income taxes is required in the financial statements.
Dividend income and distributions to shareholders are recorded on the ex-dividend date. Interest income is recognized on the accrual basis. Dividends from net investment income, if any, are declared and paid quarterly except for those of the Intermediate Duration and Limited Duration Portfolios, which are declared and paid monthly and those of Mid Cap Growth Portfolio, which are declared and paid annually. Net realized capital gains, if any, are distributed at least annually.
A Portfolio may be subject to taxes imposed by countries which it invests. Such taxes are generally based on income and/or capital gains earned or repatriated. Taxes are accrued based on net investment income, net realized gains and net unrealized appreciation as such income and/or gains are earned. Taxes may also be based on transactions in foreign currency and are accrued based on the value of investments denominated in such currency.
FASB ASC 740-10 "Income Taxes — Overall" sets forth a minimum threshold for financial statement recognition of the benefit of a tax position taken or expected to be taken in a tax return. Management has concluded there are no significant uncertain tax positions that would require recognition in the financial statements. If applicable, the Portfolios recognize interest accrued related to unrecognized tax benefits in "Interest Expense" and penalties in "Other" expenses on the Statements of Operations. The Portfolios file tax returns with the U.S. Internal Revenue Service, New York and various states. Generally, each of the tax years in the four year period ended September 30, 2010, remains subject to examination by taxing authorities.
The tax character of distributions paid may differ from the character of distributions shown on the Statements of Changes in Net Assets due to short-term capital gains being treated as ordinary income for tax purposes. The tax character of distributions paid during fiscal 2010 and 2009 were as follows:
| | | 2010
Distributions
Paid From: | | 2009
Distributions
Paid From: | |
| Portfolio | | Ordinary
Income
(000) | | Long-term
Capital Gain
(000) | | Paid-in
Capital
(000) | | Ordinary
Income
(000) | | Long-term
Capital Gain
(000) | | Paid-in
Capital
(000) | |
| Balanced | | $ | 918 | | | $ | — | | | $ | — | | | $ | 3,187 | | | $ | — | | | $ | — | | |
| Mid Cap Growth | | | 492 | | | | — | | | | — | | | | — | | | | — | | | | — | | |
| Core Fixed Income | | | 2,896 | | | | — | | | | — | | | | 8,979 | | | | — | | | | — | | |
Core Plus
Fixed Income | | | 30,975 | | | | — | | | | — | | | | 87,007 | | | | — | | | | — | | |
Intermediate
Duration | | | 2,984 | | | | — | | | | — | | | | 3,981 | | | | — | | | | — | | |
Investment Grade
Fixed Income | | | 4,183 | | | | — | | | | — | | | | 14,728 | | | | — | | | | — | | |
| Limited Duration | | | 5,288 | | | | — | | | | 161 | | | | 22,807 | | | | — | | | | — | | |
Long Duration
Fixed Income | | | 1,544 | | | | 1,642 | | | | — | | | | 1,563 | | | | — | | | | — | | |
The amount and character of income and gains to be distributed are determined in accordance with income tax regulations which may differ from U.S. generally accepted accounting principles. These book/tax differences are either considered temporary or permanent in nature.
Temporary differences are generally due to differing book and tax treatments in the timing of the recognition of gains (losses) on securities, options, swaps, forwards and futures, including Post October losses.
119
2010 Annual Report
September 30, 2010
Notes to Financial Statements (cont'd)
Permanent differences, primarily due to differing treatments of gains (losses) related to foreign currency transactions, foreign futures transactions, basis adjustments for swap transactions, in-kind redemptions, basis adjustments for return of capital sold and paydown adjustments, resulted in the following reclassifications among the components of net assets at September 30, 2010:
| Portfolio | | Accumulated
Undistributed
(Distributions
in Excess of) Net
Investment
Income (Loss)
(000) | | Accumulated
Net Realized
Gain (Loss)
(000) | | Paid-in
Capital
(000) | |
| Balanced | | $ | 169 | | | $ | (150 | ) | | $ | (19 | ) | |
| Mid Cap Growth | | | (418 | ) | | | 418 | | | | — | @ | |
| Core Fixed Income | | | (403 | ) | | | 429 | | | | (26 | ) | |
| Core Plus Fixed Income | | | 311 | | | | (6,253 | ) | | | 5,942 | | |
| Intermediate Duration | | | (348 | ) | | | 462 | | | | (114 | ) | |
| Investment Grade Fixed Income | | | (295 | ) | | | 336 | | | | (41 | ) | |
| Limited Duration | | | (726 | ) | | | 764 | | | | (38 | ) | |
| Long Duration Fixed Income | | | (197 | ) | | | 205 | | | | (8 | ) | |
@ Less than $500.
At September 30, 2010, the components of distributable earnings on a tax basis were as follows:
| Portfolio | | Undistributed
Ordinary
Income
(000) | | Undistributed
Long-term
Capital Gain
(000) | |
| Balanced | | $ | 352 | | | $ | — | | |
| Mid Cap Growth | | | 12,433 | | | | — | | |
| Core Fixed Income | | | 483 | | | | — | | |
| Core Plus Fixed Income | | | 5,708 | | | | — | | |
| Investment Grade Fixed Income | | | 489 | | | | — | | |
| Long Duration Fixed Income | | | 979 | | | | 838 | | |
At September 30, 2010, cost, unrealized appreciation, unrealized depreciation, and net unrealized appreciation(depreciation) for U.S. Federal income tax purposes of the investments of each of the Portfolios were:
| Portfolio | | Cost
(000) | | Appreciation
(000) | | Depreciation
(000) | | Net
Appreciation
(Depreciation)
(000) | |
| Balanced | | $ | 56,956 | | | $ | 2,026 | | | $ | (799 | ) | | $ | 1,227 | | |
| Mid Cap Growth | | | 4,953,856 | | | | 1,185,033 | | | | (384,855 | ) | | | 800,178 | | |
| Core Fixed Income | | | 94,594 | | | | 4,769 | | | | (453 | ) | | | 4,316 | | |
Core Plus Fixed
Income | | | 583,837 | | | | 34,447 | | | | (9,790 | ) | | | 24,657 | | |
| Intermediate Duration | | | 87,101 | | | | 6,222 | | | | (67 | ) | | | 6,155 | | |
Investment Grade
Fixed Income | | | 100,287 | | | | 5,501 | | | | (118 | ) | | | 5,383 | | |
| Limited Duration | | | 205,475 | | | | 6,658 | | | | (19 | ) | | | 6,639 | | |
Long Duration Fixed
Income | | | 29,301 | | | | 3,640 | | | | (16 | ) | | | 3,624 | | |
At September 30, 2010, the following Portfolios had for Federal income tax purposes unused capital losses, which will expire on the indicated dates:
| | | Expiration Date September 30, (000) | |
| Portfolio | | 2011 | | 2012 | | 2013 | | 2014 | |
| Balanced | | $ | 4,609 | | | $ | — | | | $ | — | | | $ | — | | |
| Mid Cap Growth | | | 273,884 | | | | — | | | | — | | | | — | | |
| Core Fixed Income | | | — | | | | — | | | | — | | | | 489 | | |
| Core Plus Fixed Income | | | 36,930 | | | | — | | | | — | | | | 7,135 | | |
| Investment Grade Fixed Income | | | — | | | | — | | | | — | | | | 607 | | |
| Limited Duration | | | — | | | | — | | | | 8,253 | | | | 8,229 | | |
| | | Expiration Date September 30, (000) | |
| Portfolio | | 2015 | | 2016 | | 2017 | | 2018 | | Total | |
| Balanced | | $ | — | | | $ | — | | | $ | 3,501 | | | $ | 2,442 | | | $ | 10,552 | | |
| Mid Cap Growth | | | — | | | | — | | | | 70,636 | | | | — | | | | 344,520 | | |
| Core Fixed Income | | | — | | | | 1,081 | | | | 35,829 | | | | 3,288 | | | | 40,687 | | |
| Core Plus Fixed Income | | | 15,680 | | | | 5,336 | | | | 254,264 | | | | 202,592 | | | | 521,937 | | |
| Intermediate Duration | | | 3,699 | | | | 124 | | | | 12,431 | | | | — | | | | 16,254 | | |
| Investment Grade Fixed Income | | | 12 | | | | 3,511 | | | | 51,893 | | | | 8,351 | | | | 64,374 | | |
| Limited Duration | | | 7,068 | | | | 265 | | | | 200,864 | | | | 33,049 | | | | 257,728 | | |
To the extent that capital loss carryforwards are used to offset any future capital gains realized during the carryforward period as provided by U.S. Federal income tax regulations, no capital gains tax liability will be incurred by the Portfolio for gains realized and not distributed. To the extent that capital gains are offset, such gains will not be distributed to the shareholders. During the year ended September 30, 2010, the following Portfolios utilized capital loss carryforwards for U.S. Federal income tax purposes of approximately:
| Portfolio | | Captial Loss
Carryfoward
Utilized
(000) | |
| Mid Cap Growth | | $ | 158,304 | | |
| Intermediate Duration | | | 3,857 | | |
Net capital and currency losses incurred after October 31and within the taxable year are deemed to arise on the first day of the Portfolio's next taxable year. For the year ended September 30, 2010, the Portfolio deferred to October 1, 2010 for U.S. Federal income tax purposes, post-October capital and currency losses as indicated:
| | | Post-October | |
| Portfolio | | Captial
Losses
(000) | | Currency
Losses
(000) | |
| Balanced | | $ | 2,758 | | | $ | — | | |
For the year ended September 30, 2010, Core Plus Fixed Income realized gains from in-kind redemptions of approximately $6,467,000. The gains are not taxable income to the Portfolio.
J. Other: At September 30, 2010, certain Portfolios had otherwise unaffiliated record owners of 10% or greater. Investment activities of these shareholders could have a material impact on these Portfolios.
120
2010 Annual Report
September 30, 2010
Notes to Financial Statements (cont'd)
These Portfolios and the aggregate percentage of such owners were as follows (unaudited):
| | | Percentage of Ownership | |
| Portfolio | | Class
I | | Investment
Class | | Class
P | |
| Balanced | | | 25.0 | % | | | 98.7 | % | | | 95.4 | % | |
| Mid Cap Growth | | | 42.4 | | | | — | | | | 70.0 | | |
| Core Plus Fixed Income | | | 40.4 | | | | 99.9 | | | | 32.1 | | |
| Intermediate Duration | | | 29.1 | | | | 100.0 | | | | — | | |
| Long Duration Fixed Income | | | 11.0 | | | | — | | | | — | | |
K. Subsequent Event: The Board of Trustees of the Fund approved a Plan of Liquidation with respect to the Intermediate Duration Portfolio ("Portfolio"), a series of the Fund. Pursuant to the Plan of Liquidation, substantially all of the assets of the Portfolio were liquidated, known liabilities of the Portfolio were satisfied, the remaining proceeds were distributed to the Portfolio's shareholders, and all of the issued and outstanding shares of the Portfolio were redeemed. The Portfolio liquidated on October 15, 2010.
121
2010 Annual Report
September 30, 2010
Report of Independent Registered Public Accounting Firm
To the Board of Trustees and Shareholders of
Morgan Stanley Institutional Fund Trust:
We have audited the accompanying statements of assets and liabilities of Balanced Portfolio, Mid Cap Growth Portfolio, Core Fixed Income Portfolio, Core Plus Fixed Income Portfolio, Intermediate Duration Portfolio, Investment Grade Fixed Income Portfolio, Limited Duration Portfolio, and Long Duration Fixed Income Portfolio (the "Funds") (eight of the portfolios constituting Morgan Stanley Institutional Fund Trust), including the portfolios of investments, as of September 30, 2010, and the related statements of operations for the year then ended, the statements of changes in net assets for each of the two years in the period then ended, and the financial highlights for each of the periods indicated therein. These financial statements and financial highlights are the responsibility of the Funds' management. Our responsibility is to express an opinion on these financial statements and financial highlights based on our audits.
We conducted our audits in accordance with the standards of the Public Company Accounting Oversight Board (United States). Those standards require that we plan and perform the audit to obtain reasonable assurance about whether the financial statements and financial highlights are free of material misstatement. We were not engaged to perform an audit of the Funds' internal control over financial reporting. Our audits included consideration of internal control over financial reporting as a basis for designing audit procedures that are appropriate in the circumstances, but not for the purpose of expressing an opinion on the effectiveness of the Funds' internal control over financial reporting. Accordingly, we express no such opinion. An audit also includes examining, on a test basis, evidence supporting the amounts and disclosures in the financial statements and financial highlights, assessing the accounting principles used and sig nificant estimates made by management, and evaluating the overall financial statement presentation. Our procedures included confirmation of securities owned as of September 30, 2010, by correspondence with the custodian and brokers or by other appropriate auditing procedures where replies from brokers were not received. We believe that our audits provide a reasonable basis for our opinion.
In our opinion, the financial statements and financial highlights referred to above present fairly, in all material respects, the financial position of the aforementioned eight Funds of Morgan Stanley Institutional Fund Trust at September 30, 2010, the results of their operations for the year then ended, the changes in their net assets for each of the two years in the period then ended, and the financial highlights for each of the periods indicated therein, in conformity with U.S. generally accepted accounting principles.

Boston, Massachusetts
November 23, 2010
122
2010 Annual Report
September 30, 2010 (unaudited)
Federal Income Tax Information
For Federal income tax purposes, the following information is furnished with respect to the distributions paid by each applicable Portfolio during the taxable year ended September 30, 2010.
For corporate shareholders, the percentages of dividends paid by the following Portfolios qualified for the dividends received deduction. (Please consult your tax advisor to determine if any portion of the dividends you received is exempt from state income tax.):
| Portfolio | | Div. Received
Deduction % | |
| Balanced | | | 55.1 | % | |
| Mid Cap Growth | | | 100.0 | | |
The following Portfolio designated and paid the following amounts as a long-term capital gain distribution:
| Portfolio | | Amount
(000) | |
| Long Duration Fixed Income | | $ | 1,641 | | |
For Federal income tax purposes, the following information is furnished with respect to the earnings of each applicable Portfolio for the taxable year ended September 30, 2010.
When distributed, certain earnings may be subject to a maximum tax rate of 15% as provided for the Jobs and Growth Tax Relief Reconciliation Act of 2003. Each of the applicable Portfolios designated up to the following maximum amounts as taxable at this lower rate:
| Portfolio | | Amount
(000) | |
| Balanced | | $ | 519 | | |
| Mid Cap Growth | | | 36,865 | | |
In January, each applicable Portfolio provides tax information to shareholders for the preceding calendar year.
123
2010 Annual Report
September 30, 2010 (unaudited)
U.S. Privacy Policy
AN IMPORTANT NOTICE CONCERNING OUR U.S. PRIVACY POLICY (UNAUDITED)
Morgan Stanley Institutional Fund Trust (collectively, the "Fund") is required by federal law to provide you with a copy of our privacy policy ("Policy") annually.
This Policy applies to current and former individual clients of Morgan Stanley Distributors Inc., as well as current and former individual investors in Morgan Stanley mutual funds and related companies.
This Policy is not applicable to partnerships, corporations, trusts or other non-individual clients or account holders, nor is this Policy applicable to individuals who are either beneficiaries of a trust for which we serve as trustee or participants in an employee benefit plan administered or advised by us. This Policy is, however, applicable to individuals who select us to be a custodian of securities or assets in individual retirement accounts, 401(k) accounts, 529 Educational Savings Accounts, accounts subject to the Uniform Gifts to Minors Act, or similar accounts. We may amend this Policy at any time, and will inform you of any changes to this Policy as required by law.
WE RESPECT YOUR PRIVACY
We appreciate that you have provided us with your personal financial information and understand your concerns about safeguarding such information. We strive to maintain the privacy of such information while we help you achieve your financial objectives. This Policy describes what non-public personal information we collect about you, how we collect it, when we may share it with others, and how others may use it. It discusses the steps you may take to limit our sharing of information about you with affiliated Morgan Stanley companies ("affiliated companies"). It also discloses how you may limit our affiliates' use of shared information for marketing purposes. Throughout this Policy, we refer to the non-public information that personally identifies you or your accounts as "personal information."
1. WHAT PERSONAL INFORMATION DO WE COLLECT ABOUT YOU?
To better serve you and manage our business, it is important that we collect and maintain accurate information about you. We obtain this information from applications and other forms you submit to us, from your dealings with us, from consumer reporting agencies, from our websites and from third parties and other sources.
For example:
• We collect information such as your name, address, e-mail address, telephone/fax numbers, assets, income and investment objectives through application forms you submit to us.
• We may obtain information about account balances, your use of account(s) and the types of products and services you prefer to receive from us through your dealings and transactions with us and other sources.
• We may obtain information about your creditworthiness and credit history from consumer reporting agencies.
• We may collect background information from and through third-party vendors to verify representations you have made and to comply with various regulatory requirements.
• If you interact with us through our public and private Web sites, we may collect information that you provide directly through online communications (such as an e-mail address). We may also collect information about your Internet service provider, your domain name, your computer's operating system and Web browser, your use of our Web sites and your product and service preferences, through the use of "cookies." "Cookies" recognize your computer each time you return to one of our sites, and help to improve our sites' content and personalize your experience on our sites by, for example, suggesting offerings that may interest you. Please consult the Terms of Use of these sites for more details on our use of cookies.
2. WHEN DO WE DISCLOSE PERSONAL INFORMATION WE COLLECT ABOUT YOU?
To provide you with the products and services you request, to better serve you, to manage our business and as otherwise required or permitted by law, we may disclose personal information we collect about you to other affiliated companies and to non-affiliated third parties.
124
2010 Annual Report
September 30, 2010 (unaudited)
U.S. Privacy Policy (cont'd)
a. Information we disclose to our affiliated companies.
In order to manage your account(s) effectively, including servicing and processing your transactions, to let you know about products and services offered by us and affiliated companies, to manage our business, and as otherwise required or permitted by law, we may disclose personal information about you to other affiliated companies. Offers for products and services from affiliated companies are developed under conditions designed to safeguard your personal information.
b. Information we disclose to third parties.
We do not disclose personal information that we collect about you to non-affiliated third parties except to enable them to provide marketing services on our behalf, to perform joint marketing agreements with other financial institutions, and as otherwise required or permitted by law. For example, some instances where we may disclose information about you to third parties include: for servicing and processing transactions, to offer our own products and services, to protect against fraud, for institutional risk control, to respond to judicial process or to perform services on our behalf. When we share personal information with a non-affiliated third party, they are required to limit their use of personal information about you to the particular purpose for which it was shared and they are not allowed to share personal information about you with others except to fulfill that limited purpose or as may be required by law.
3. HOW DO WE PROTECT THE SECURITY AND CONFIDENTIALITY OF PERSONAL INFORMATION WE COLLECT ABOUT YOU?
We maintain physical, electronic and procedural security measures to help safeguard the personal information we collect about you. We have internal policies governing the proper handling of client information. Third parties that provide support or marketing services on our behalf may also receive personal information about you, and we require them to adhere to confidentiality standards with respect to such information.
4. HOW CAN YOU LIMIT OUR SHARING OF CERTAIN PERSONAL INFORMATION ABOUT YOU WITH OUR AFFILIATED COMPANIES FOR ELIGIBILITY DETERMINATION?
We respect your privacy and offer you choices as to whether we share with our affiliated companies personal information that was collected to determine your eligibility for products and services such as credit reports and other information that you have provided to us or that we may obtain from third parties ("eligibility information"). Please note that, even if you direct us not to share certain eligibility information with our affiliated companies, we may still share your personal information, including eligibility information, with those companies under circumstances that are permitted under applicable law, such as to process transactions or to service your account. We may also share certain other types of personal information with affiliated companies — such as your name, address, telephone number, e-mail address and account number(s), and information about your transactions and experiences with us.
5. HOW CAN YOU LIMIT THE USE OF CERTAIN PERSONAL INFORMATION ABOUT YOU BY OUR AFFILIATED COMPANIES FOR MARKETING?
You may limit our affiliated companies from using certain personal information about you that we may share with them for marketing their products or services to you. This information includes our transactions and other experiences with you such as your assets and account history. Please note that, even if you choose to limit our affiliated companies from using certain personal information about you that we may share with them for marketing their products and services to you, we may still share such personal information about you with them, including our transactions and experiences with you, for other purposes as permitted under applicable law.
125
2010 Annual Report
September 30, 2010 (unaudited)
U.S. Privacy Policy (cont'd)
6. HOW CAN YOU SEND US AN OPT-OUT INSTRUCTION?
If you wish to limit our sharing of certain personal information about you with our affiliated companies for "eligibility purposes" and for our affiliated companies' use in marketing products and services to you as described in this notice, you may do so by:
• Calling us at (800) 869-6397
Monday–Friday between 8a.m. and 8p.m. (EST)
• Writing to us at the following address:
Morgan Stanley Privacy Department
Harborside Financial Center, Plaza Two, 3rd Floor
Jersey City, NJ 07311
If you choose to write to us, your written request should include: your name, address, telephone number and account number(s) to which the opt-out applies and should not be sent with any other correspondence. In order to process your request, we require that the request be provided by you directly and not through a third party. Once you have informed us about your privacy preferences, your opt-out preference will remain in effect with respect to this Policy (as it may be amended) until you notify us otherwise. If you are a joint account owner, we will accept instructions from any one of you and apply those instructions to the entire account. Please allow approximately 30 days from our receipt of your opt-out for your instructions to become effective.
Please understand that if you opt-out, you and any joint account holders may not receive certain Morgan Stanley or our affiliated companies' products and services that could help you manage your financial resources and achieve your investment objectives.
If you have more than one account with us or our affiliates, you may receive multiple privacy policies from us, and would need to follow the directions stated in each particular policy for each account you have with us.
SPECIAL NOTICE TO RESIDENTS OF VERMONT
This section supplements our Policy with respect to our individual clients who have a Vermont address and supersedes anything to the contrary in the above Policy with respect to those clients only.
The State of Vermont requires financial institutions to obtain your consent prior to sharing personal information that they collect about you with affiliated companies and non-affiliated third parties other than in certain limited circumstances. Except as permitted by law, we will not share personal information we collect about you with non-affiliated third parties or other affiliated companies unless you provide us with your written consent to share such information ("opt-in").
If you wish to receive offers for investment products and services offered by or through other affiliated companies, please notify us in writing at the following address:
Morgan Stanley Privacy Department
Harborside Financial Center, Plaza Two, 3rd Floor
Jersey City, NJ 07311
Your authorization should include: your name, address, telephone number and account number(s) to which the opt-in applies and should not be sent with any other correspondence. In order to process your authorization, we require that the authorization be provided by you directly and not through a third-party.
126
2010 Annual Report
September 30, 2010 (unaudited)
Trustee and Officer Information
Independent Trustees:
Name, Age and Address of
Independent Director | | Position(s)
Held with
Registrant | | Length of Time
Served* | | Principal Occupation(s) During Past 5 Years | | Number of
Portfolios in
Fund Complex
Overseen by
Independent
Trustee** | | Other Directorships
Held by Independent
Trustees†† | |
Frank L. Bowman (65)
c/o Kramer Levin Naftalis &
Frankel LLP
Counsel to the Independent Trustees
1177 Avenue of the Americas New York, NY 10036 | | Trustee | | Since
August
2006 | | President, Strategic Decisions, LLC (consulting) (since February 2009); Director or Trustee of various Retail Funds and Institutional Funds (since August 2006); Chairperson of the Insurance Sub-Committee of the Compliance and Insurance Committee (since February 2007); served as President and Chief Executive Officer of the Nuclear Energy Institute (policy organization) through November 2008; retired as Admiral, U.S. Navy in January 2005 after serving over 8 years as Director of the Naval Nuclear Propulsion Program and Deputy Administrator—Naval Reactors in the National Nuclear Security Administration at the U.S. Department of Energy (1996-2004); Served as Chief of Naval Personnel (July 1994-September 1994); Knighted as Honorary Knight Commander of the Most Excellent Order of the British Empire; Awarded the Officer de l'Orde National du Mérite by the French Government. | | | 98 | | | Director of Armed Services YMCA of the USA; member, BP America External Advisory Council (energy); member, National Academy of Engineers. | |
|
Michael Bozic (69)
c/o Kramer Levin Naftalis & Frankel LLP
Counsel to the Independent Trustees
1177 Avenue of the Americas New York, NY 10036 | | Trustee | | Since
April
1994 | | Private Investor; Chairperson of the Compliance and Insurance Committee (since October 2006); Director or Trustee of the Retail Funds (since April 1994) and Institutional Funds (since July 2003); formerly, Chairperson of the Insurance Committee (July 2006-September 2006), Vice Chairman of Kmart Corporation (December 1998-October 2000), Chairman and Chief Executive Officer of Levitz Furniture Corporation (November 1995-November 1998) and President and Chief Executive Officer of Hills Department Stores (May 1991-July 1995); variously Chairman, Chief Executive Officer, President and Chief Operating Officer (1987-1991) of the Sears Merchandise Group of Sears Roebuck & Co. | | | 100 | | | Director of various business organizations. | |
|
Kathleen A. Dennis (57)
c/o Kramer Levin Naftalis & Frankel LLP
Counsel to the Independent Trustees
1177 Avenue of the Americas New York, NY 10036 | | Trustee | | Since
August
2006 | | President, Cedarwood Associates (mutual fund and investment management consulting) (since July 2006); Chairperson of the Money Market and Alternatives Sub-Committee of the Investment Committee (since October 2006) and Director or Trustee of various Retail Funds and Institutional Funds (since August 2006); formerly, Senior Managing Director of Victory Capital Management (1993-2006). | | | 98 | | | Director of various non-profit organizations. | |
|
Dr. Manuel H. Johnson (61)
c/o Johnson Smick
Group, Inc.
888 16th Street, N.W. Suite 740
Washington, D.C. 20006 | | Trustee | | Since
July
1991 | | Senior Partner, Johnson Smick International, Inc. (consulting firm); Chairperson of the Investment Committee (since October 2006) and Director or Trustee of the Retail Funds (since July 1991) and Institutional Funds (since July 2003); Co-Chairman and a founder of the Group of Seven Council (G7C) (international economic commission); formerly, Chairperson of the Audit Committee (July 1991-September 2006); Vice Chairman of the Board of Governors of the Federal Reserve System and Assistant Secretary of the U.S. Treasury. | | | 100 | | | Director of NVR, Inc. (home construction); Director of Evergreen Energy; Director of Greenwich Capital Holdings. | |
|
Joseph J. Kearns (68)
c/o Kearns & Associates LLC PMB754
23852 Pacific Coast Highway Malibu, CA 90265 | | Trustee | | Since
August
1994 | | President, Kearns & Associates LLC (investment consulting); Chairperson of the Audit Committee (since October 2006) and Director or Trustee of the Retail Funds (since July 2003) and Institutional Funds (since August 1994); formerly Deputy Chairperson of the Audit Committee (July 2003-September 2006) and Chairperson of the Audit Committee of the Institutional Funds (October 2001-July 2003) and since August 1994 for certain predecessor Funds; CFO of the J. Paul Getty Trust. | | | 101 | | | Director of Electro Rent Corporation (equipment leasing) and The Ford Family Foundation. | |
|
127
2010 Annual Report
September 30, 2010 (unaudited)
Trustee and Officer Information (cont'd)
Independent Trustees: (cont'd)
Name, Age and Address of
Independent Director | | Position(s)
Held with
Registrant | | Length of Time
Served* | | Principal Occupation(s) During Past 5 Years | | Number of
Portfolios in
Fund Complex
Overseen by
Independent
Trustee** | | Other Directorships
Held by Independent
Trustees†† | |
Michael F. Klein (51)
c/o Kramer Levin Naftalis & Frankel LLP
Counsel to the
Independent Trustees
1177 Avenue of the Americas New York, NY 10036 | | Trustee | | Since
August
2006 | | Chief Operating Officer and Managing Director, Aetos Capital, LLC (since March 2000) and Co-President, Aetos Alternatives Management, LLC (since January 2004); Chairperson of the Fixed Income Sub-Committee of the Investment Committee (since October 2006) and Director or Trustee of various Retail Funds and Institutional Funds (since August 2006); formerly, Managing Director, Morgan Stanley & Co., Inc. and Morgan Stanley Dean Witter Investment Management, President, Morgan Stanley Institutional Funds (June 1998-March 2000) and Principal, Morgan Stanley & Co., Inc. and Morgan Stanley Dean Witter Investment Management (August 1997-December 1999). | | | 98 | | | Director of certain investment funds managed or sponsored by Aetos Capital LLC. Director of Sanitized AG and Sanitized Marketing AG (specialty chemicals). | |
|
Michael E. Nugent (74)
c/o Triumph Capital, L.P.
445 Park Avenue
New York, NY 10022 | | Chairperson of the
Board and Trustee | | Chairperson of the Boards since July 2006 and Director since July 1991 | | General Partner, Triumph Capital, L.P. (private investment partnership); Chairperson of the Boards of the Retail Funds and Institutional Funds (since July 2006); Director or Trustee of the Retail Funds (since July 1991) and Institutional Funds (since July 2001); formerly, Chairperson of the Insurance Committee (until July 2006). | | | 100 | | | None. | |
|
W. Allen Reed (63)
c/o Kramer Levin Naftalis & Frankel LLP
Counsel to the
Independent Trustees
1177 Avenue of the Americas New York, NY 10036 | | Trustee | | Since
August
2006 | | Chairperson of the Equity Sub-Committee of the Investment Committee (since October 2006) and Director or Trustee of various Retail and Institutional Funds (since August 2006); formerly, President and CEO of General Motors Asset Management; Chairman and Chief Executive Officer of the GM Trust Bank and Corporate Vice President of General Motors Corporation (July 1994-December 2005). | | | 98 | | | Director of Temple-Inland Industries (packaging and forest products), Director of Legg Mason, Inc. and Director of the Auburn University Foundation; formerly, Director of iShares, Inc. (2001-2006). | |
|
Fergus Reid (78)
c/o Joe Pietryka, Inc.
85 Charles Coleman Blvd. Pawling, NY 12564 | | Trustee | | Since
June
1992 | | Chairman, Joe Pietryka, Inc.; Chairperson of the Governance Committee and Director or Trustee of the Retail Funds (since July 2003) and Institutional Funds (since June 1992). | | | 101 | | | Trustee and Director of certain investment companies in the JPMorgan Funds complex managed by
JP Morgan Investment Management Inc. | |
|
128
2010 Annual Report
September 30, 2010 (unaudited)
Trustee and Officer Information (cont'd)
Interested Trustee:
Name, Age and Address of
Interested Trustee | | Position(s) Held
with Registrant | | Term of Office
and Length of
Time Served* | | Principal Occupation(s) During Past 5 Years | | Number of
Portfolios in
Fund Complex
Overseen by
Interested
Trustee** | | Other Directorships
Held by Interested
Trustee†† | |
James F. Higgins (62)
c/o Morgan Stanley Services Company Inc.
Harborside Financial Center
Plaza Two
Jersey City, NJ 07311 | | Trustee | | Since
June
2000 | | Director or Trustee of the Retail Funds (since June 2000) and Institutional Funds (since July 2003); Senior Advisor of Morgan Stanley (since August 2000). | | | 99 | | | Director of AXA Financial, Inc. and The Equitable Life Assurance Society of the United States (financial services). | |
|
* This is the earliest date the Trustee began serving the Retail Funds or Institutional Funds. Each Trustee serves an indefinite term, until his or her successor is elected.
†† This includes any directorships at public companies and registered investment companies held by the Trustee at any time during the past five years.
** The Fund Complex includes all funds advised by Morgan Stanley Investment Management (as of October 31, 2010) that have an investment advisor that is an affiliated entity of MSIM (including but not limited to, Morgan Stanley Investment Advisors Inc. ("MSIA") and Morgan Stanley AIP GP LP). The Retail Funds are those funds advised by MSIA. The Institutional Funds are certain U.S. registered funds advised by MSIM and Morgan Stanley AIP GP LP.
129
2010 Annual Report
September 30, 2010 (unaudited)
Trustee and Officer Information (cont'd)
Executive Officers:
| Name, Age and Address of Executive Officer | | Position(s) Held
with
Registrant | | Term of Office
and Length of
Time Served* | | Principal Occupation(s) During Past 5 Years | |
Sara Furber (35)
522 Fifth Avenue
New York, NY 10036 | | President and Principal Executive Officer — Equity and Fixed Income Funds | | Since
September
2010 | | President and Principal Executive Officer (since September 2010) of the Equity and Fixed Income Funds in the Fund Complex; Managing Director and Director of the Adviser and various entities affiliated with the Adviser (since July 2010). Formerly, Chief Operating Officer for Global Corporate and Investment Banking at Bank of America Merrill Lynch (January 2009 to April 2010); Head of Merrill Lynch & Co. Investor Relations (July 2007 to December 2008); with senior roles in Strategy and Business Development as well as within Merrill Lynch's Global Credit & Commitments organization prior to July 2007. | |
|
Mary Ann Picciotto (37)
c/o Morgan Stanley Services
Company Inc.
Harborside Financial Center
Plaza Two
Jersey City, NJ 07311 | | Chief Compliance Officer | | Since
May
2010 | | Executive Director of the Adviser and various entities affiliated with the Adviser; Chief Compliance Officer of the Retail Funds and Institutional Funds (since May 2010); Chief Compliance Officer of the Adviser and Morgan Stanley Investment Advisors Inc. (since April 2007). | |
|
Stefanie V. Chang Yu (43)
522 Fifth Avenue
New York, NY 10036 | | Vice President | | Since
December
1997 | | Managing Director of the Adviser and various entities affiliated with the Adviser; Vice President of the Retail Funds (since July 2002) and Institutional Funds (since December 1997). Formerly, Secretary of the Adviser and various entities affiliated with the Adviser. | |
|
Mary E. Mullin (43)
522 Fifth Avenue
New York, NY 10036 | | Secretary | | Since
June
1999 | | Executive Director of the Adviser and various entities affiliated with the Adviser; Secretary of the Retail Funds (since July 2003) and Institutional Funds (since June 1999). | |
|
Francis J. Smith (45)
c/o Morgan Stanley Services
Company Inc.
Harborside Financial Center
Plaza Two
Jersey City, NJ 07311 | | Treasurer and Principal Financial Officer | | Treasurer since July 2003 and Principal Financial Officer since September 2002 | | Executive Director of the Adviser and various entities affiliated with the Adviser; Treasurer and Principal Financial Officer of the Retail Funds (since July 2003) and Institutional Funds (since March 2010). | |
|
* This is the earliest date the Officer began serving the Retail Funds or Institutional Funds. Each Officer serves an indefinite term, until his or her successor is elected.
130
Investment Adviser and Administrator
Morgan Stanley Investment Management Inc.
522 Fifth Avenue
New York, NY 10036
Distributor
Morgan Stanley Distribution, Inc.
100 Front Street, Suite 400
West Conshohocken, PA 19428-2899
Dividend Disbursing and Transfer Agent
Morgan Stanley Services Company Inc.
P.O. Box 219804
Kansas City, MO 64121-9804
Custodian
State Street Bank and Trust Company
One Lincoln Street
Boston, MA 02111-2101
Legal Counsel
Dechert LLP
1095 Avenue of the Americas
New York, New York 10036
Independent Registered Public Accounting Firm
Ernst & Young LLP
200 Clarendon Street
Boston, MA 02116-5072
Reporting to Shareholders
Each Morgan Stanley Fund provides a complete schedule of portfolio holdings in its semi-annual and annual reports within 60 days of the end of the Fund's second and fourth fiscal quarters. The semi-annual reports and the annual reports are filed electronically with the Securities and Exchange Commission (SEC) on Form N-CSRS and Form N-CSR, respectively. Morgan Stanley also delivers the semi-annual and annual reports to Fund shareholders and makes these reports available on its public website, www.morganstanley.com/im. Each Morgan Stanley Fund also files a complete schedule of portfolio holdings with the SEC for the Fund's first and third fiscal quarters on Form N-Q. Morgan Stanley does not deliver the reports for the first and third fiscal quarters to shareholders nor are the reports posted to the Morgan Stanley public website. You may, however, obtain the Form N-Q filings (as well as the Form N-CSR and N-CSRS filings) by access ing the SEC's website, www.sec.gov. You may also review and copy them at the SEC's public reference room in Washington, DC. Information on the operation of the SEC's Public Reference Room may be obtained by calling the SEC toll free at 1-(800) SEC-0330. You can also request copies of these materials, upon payment of a duplicating fee, by electronic request at the SEC's email address (publicinfo@sec.gov) or by writing the Public Reference section of the SEC, Washington, DC 20549-0102.
Proxy Voting Policies and Procedures and Proxy Voting Record
You may obtain a copy of the Fund's Proxy Voting Policy and Procedures and information regarding how the Fund voted proxies relating to portfolio securities during the most recent twelve-month period ended June 30, without charge, upon request, by calling toll free 1-(800) 548-7786 or by visiting our website at www.morganstanley.com/im. This information is also available on the SEC's website at www.sec.gov.
This report is authorized for distribution only when preceded or accompanied by a prospectus of the Morgan Stanley Institutional Fund Trust which describes in detail each Investment Portfolio's investment policies, risks, fees and expenses. Please read the prospectus carefully before you invest or send money. For additional information, including information regarding the investments comprising the Portfolio, please visit our website at www.morganstanley.com/im or call toll free 1-(800) 548-7786.
131
(This Page has been left blank intentionally.)
Printed in U.S.A.
This Report has been prepared for shareholders and may be distributed to others only if preceded or accompanied by a current prospectus.
Morgan Stanley Investment Management Inc.
522 Fifth Avenue
New York, NY 10036
© 2010 Morgan Stanley

IFEQFIANN
IU10-03514P-Y09/10
Item 2. Code of Ethics.
(a) The Fund has adopted a code of ethics (the “Code of Ethics”) that applies to its principal executive officer, principal financial officer, principal accounting officer or controller, or persons performing similar functions, regardless of whether these individuals are employed by the Fund or a third party.
(b) No information need be disclosed pursuant to this paragraph.
(c) Not applicable.
(d) Not applicable.
(e) Not applicable.
(f)
(1) The Fund’s Code of Ethics is attached hereto as Exhibit 12 A.
(2) Not applicable.
(3) Not applicable.
Item 3. Audit Committee Financial Expert.
The Fund’s Board of Trustees has determined that Joseph J. Kearns, an “independent” Trustee, is an “audit committee financial expert” serving on its audit committee. Under applicable securities laws, a person who is determined to be an audit committee financial expert will not be deemed an “expert” for any purpose, including without limitation for the purposes of Section 11 of the Securities Act of 1933, as a result of being designated or identified as an audit committee financial expert. The designation or identification of a person as an audit committee financial expert does not impose on such person any duties, obligations, or liabilities that are greater than the duties, obligations, and liabilities imposed on such person as a member of the audit committee and Board of Trustees in the absence of such designation or identification
Item 4. Principal Accountant Fees and Services.
(a)(b)(c)(d) and (g). Based on fees billed for the periods shown:
2010
| | Registrant | | Covered Entities(1) | |
Audit Fees | | $ | 275,900 | | N/A | |
| | | | | |
Non-Audit Fees | | | | | |
Audit-Related Fees | | $ | | (2) | $ | | (2) |
Tax Fees | | $ | 26,970 | (3) | $ | 199,783 | (4) |
All Other Fees | | $ | | | $ | 154,883 | |
Total Non-Audit Fees | | $ | 26,970 | | $ | 354,666 | |
| | | | | |
Total | | $ | 302,870 | | $ | 354,666 | |
2009
| | Registrant | | Covered Entities(1) | |
Audit Fees | | $ | 453,550 | | N/A | |
| | | | | |
Non-Audit Fees | | | | | |
Audit-Related Fees | | $ | | (2) | $ | | (2) |
Tax Fees | | $ | 62,750 | (3) | $ | 109,924 | (4) |
All Other Fees | | $ | — | | $ | 143,725 | (5) |
Total Non-Audit Fees | | $ | 62,750 | | $ | 253,649 | |
| | | | | |
Total | | $ | 516,300 | | $ | 253,649 | |
N/A- Not applicable, as not required by Item 4.
(1) Covered Entities include the Adviser (excluding sub-advisors) and any entity controlling, controlled by or under common control with the Adviser that provides ongoing services to the Registrant.
(2) Audit-Related Fees represent assurance and related services provided that are reasonably related to the performance of the audit of the financial statements of the Covered Entities’ and funds advised by the Adviser or its affiliates, specifically data verification and agreed-upon procedures related to asset securitizations and agreed-upon procedures engagements.
(3) Tax Fees represent tax compliance, tax planning and tax advice services provided in connection with the preparation and review of the Registrant’s tax returns.
(4) Tax Fees represent tax compliance, tax planning and tax advice services provided in connection with the review of Covered Entities’ tax returns.
(5) All other fees represent project management for future business applications and improving business and operational processes.
(e)(1) The audit committee’s pre-approval policies and procedures are as follows:
APPENDIX A
AUDIT COMMITTEE
AUDIT AND NON-AUDIT SERVICES
PRE-APPROVAL POLICY AND PROCEDURES
OF THE
MORGAN STANLEY RETAIL AND INSTITUTIONAL FUNDS
AS ADOPTED AND AMENDED JULY 23, 2004,(1)
1. Statement of Principles
The Audit Committee of the Board is required to review and, in its sole discretion, pre-approve all Covered Services to be provided by the Independent Auditors to the Fund and Covered Entities in order to assure that services performed by the Independent Auditors do not impair the auditor’s independence from the Fund.
The SEC has issued rules specifying the types of services that an independent auditor may not provide to its audit client, as well as the audit committee’s administration of the engagement of the independent auditor. The SEC’s rules establish two different approaches to pre-approving services, which the SEC considers to be equally valid. Proposed services either: may be pre-approved without consideration of specific case-by-case services by the Audit Committee (“general pre-approval”); or require the specific pre-approval of the Audit Committee or its delegate (“specific pre-approval”). The Audit Committee believes that the combination of these two approaches in this Policy will result in an effective and efficient procedure to pre-approve services performed by the Independent Auditors. As set forth in this Policy, unless a type of service has received general pre-approval, it will require specific pre-approval by the Audit Committee (or by any member of the Audit Committee to which pre-approval authority has been delegated) if it is to be provided by the Independent Auditors. Any proposed services exceeding pre-approved cost levels or budgeted amounts will also require specific pre-approval by the Audit Committee.
The appendices to this Policy describe the Audit, Audit-related, Tax and All Other services that have the general pre-approval of the Audit Committee. The term of any general pre-approval is 12 months from the date of pre-approval, unless the Audit Committee considers and provides a different period and states otherwise. The Audit Committee will annually review and pre-approve the services that may be provided by the Independent Auditors without obtaining specific pre-approval from the Audit Committee. The Audit Committee will add to or subtract from the list of general pre-approved services from time to time, based on subsequent determinations.
(1) This Audit Committee Audit and Non-Audit Services Pre-Approval Policy and Procedures (the “Policy”), adopted as of the date above, supersedes and replaces all prior versions that may have been adopted from time to time.
The purpose of this Policy is to set forth the policy and procedures by which the Audit Committee intends to fulfill its responsibilities. It does not delegate the Audit Committee’s responsibilities to pre-approve services performed by the Independent Auditors to management.
The Fund’s Independent Auditors have reviewed this Policy and believes that implementation of the Policy will not adversely affect the Independent Auditors’ independence.
2. Delegation
As provided in the Act and the SEC’s rules, the Audit Committee may delegate either type of pre-approval authority to one or more of its members. The member to whom such authority is delegated must report, for informational purposes only, any pre-approval decisions to the Audit Committee at its next scheduled meeting.
3. Audit Services
The annual Audit services engagement terms and fees are subject to the specific pre-approval of the Audit Committee. Audit services include the annual financial statement audit and other procedures required to be performed by the Independent Auditors to be able to form an opinion on the Fund’s financial statements. These other procedures include information systems and procedural reviews and testing performed in order to understand and place reliance on the systems of internal control, and consultations relating to the audit. The Audit Committee will approve, if necessary, any changes in terms, conditions and fees resulting from changes in audit scope, Fund structure or other items.
In addition to the annual Audit services engagement approved by the Audit Committee, the Audit Committee may grant general pre-approval to other Audit services, which are those services that only the Independent Auditors reasonably can provide. Other Audit services may include statutory audits and services associated with SEC registration statements (on Forms N-1A, N-2, N-3, N-4, etc.), periodic reports and other documents filed with the SEC or other documents issued in connection with securities offerings.
The Audit Committee has pre-approved the Audit services in Appendix B.1. All other Audit services not listed in Appendix B.1 must be specifically pre-approved by the Audit Committee (or by any member of the Audit Committee to which pre-approval has been delegated).
4. Audit-related Services
Audit-related services are assurance and related services that are reasonably related to the performance of the audit or review of the Fund’s financial statements and, to the extent they are Covered Services, the Covered Entities or that are traditionally performed by the Independent Auditors. Because the Audit Committee believes that the provision of Audit-related services does not impair the independence of the auditor and is consistent with the SEC’s rules on auditor independence, the Audit Committee may grant general pre-approval to Audit-related services. Audit-related services include, among others, accounting consultations related to accounting, financial reporting or disclosure matters
not classified as “Audit services”; assistance with understanding and implementing new accounting and financial reporting guidance from rulemaking authorities; agreed-upon or expanded audit procedures related to accounting and/or billing records required to respond to or comply with financial, accounting or regulatory reporting matters; and assistance with internal control reporting requirements under Forms N-SAR and/or N-CSR.
The Audit Committee has pre-approved the Audit-related services in Appendix B.2. All other Audit-related services not listed in Appendix B.2 must be specifically pre-approved by the Audit Committee (or by any member of the Audit Committee to which pre-approval has been delegated).
5. Tax Services
The Audit Committee believes that the Independent Auditors can provide Tax services to the Fund and, to the extent they are Covered Services, the Covered Entities, such as tax compliance, tax planning and tax advice without impairing the auditor’s independence, and the SEC has stated that the Independent Auditors may provide such services.
Pursuant to the preceding paragraph, the Audit Committee has pre-approved the Tax Services in Appendix B.3. All Tax services in Appendix B.3 must be specifically pre-approved by the Audit Committee (or by any member of the Audit Committee to which pre-approval has been delegated).
6. All Other Services
The Audit Committee believes, based on the SEC’s rules prohibiting the Independent Auditors from providing specific non-audit services, that other types of non-audit services are permitted. Accordingly, the Audit Committee believes it may grant general pre-approval to those permissible non-audit services classified as All Other services that it believes are routine and recurring services, would not impair the independence of the auditor and are consistent with the SEC’s rules on auditor independence.
The Audit Committee has pre-approved the All Other services in Appendix B.4. Permissible All Other services not listed in Appendix B.4 must be specifically pre-approved by the Audit Committee (or by any member of the Audit Committee to which pre-approval has been delegated).
7. Pre-Approval Fee Levels or Budgeted Amounts
Pre-approval fee levels or budgeted amounts for all services to be provided by the Independent Auditors will be established annually by the Audit Committee. Any proposed services exceeding these levels or amounts will require specific pre-approval by the Audit Committee. The Audit Committee is mindful of the overall relationship of fees for audit and non-audit services in determining whether to pre-approve any such services.
8. Procedures
All requests or applications for services to be provided by the Independent Auditors that do not require specific approval by the Audit Committee will be submitted to the Fund’s Chief Financial Officer and must include a detailed description of the services to be
rendered. The Fund’s Chief Financial Officer will determine whether such services are included within the list of services that have received the general pre-approval of the Audit Committee. The Audit Committee will be informed on a timely basis of any such services rendered by the Independent Auditors. Requests or applications to provide services that require specific approval by the Audit Committee will be submitted to the Audit Committee by both the Independent Auditors and the Fund’s Chief Financial Officer, and must include a joint statement as to whether, in their view, the request or application is consistent with the SEC’s rules on auditor independence.
The Audit Committee has designated the Fund’s Chief Financial Officer to monitor the performance of all services provided by the Independent Auditors and to determine whether such services are in compliance with this Policy. The Fund’s Chief Financial Officer will report to the Audit Committee on a periodic basis on the results of its monitoring. Both the Fund’s Chief Financial Officer and management will immediately report to the chairman of the Audit Committee any breach of this Policy that comes to the attention of the Fund’s Chief Financial Officer or any member of management.
9. Additional Requirements
The Audit Committee has determined to take additional measures on an annual basis to meet its responsibility to oversee the work of the Independent Auditors and to assure the auditor’s independence from the Fund, such as reviewing a formal written statement from the Independent Auditors delineating all relationships between the Independent Auditors and the Fund, consistent with Independence Standards Board No. 1, and discussing with the Independent Auditors its methods and procedures for ensuring independence.
10. Covered Entities
Covered Entities include the Fund’s investment adviser(s) and any entity controlling, controlled by or under common control with the Fund’s investment adviser(s) that provides ongoing services to the Fund(s). Beginning with non-audit service contracts entered into on or after May 6, 2003, the Fund’s audit committee must pre-approve non-audit services provided not only to the Fund but also to the Covered Entities if the engagements relate directly to the operations and financial reporting of the Fund. This list of Covered Entities would include:
Morgan Stanley Retail Funds
Morgan Stanley Investment Advisors Inc.
Morgan Stanley & Co. Incorporated
Morgan Stanley DW Inc.
Morgan Stanley Investment Management Inc.
Morgan Stanley Investment Management Limited
Morgan Stanley Investment Management Private Limited
Morgan Stanley Asset & Investment Trust Management Co., Limited
Morgan Stanley Investment Management Company
Morgan Stanley Services Company, Inc.
Morgan Stanley Distributors Inc.
Morgan Stanley Trust FSB
Morgan Stanley Institutional Funds
Morgan Stanley Investment Management Inc.
Morgan Stanley Investment Advisors Inc.
Morgan Stanley Investment Management Limited
Morgan Stanley Investment Management Private Limited
Morgan Stanley Asset & Investment Trust Management Co., Limited
Morgan Stanley Investment Management Company
Morgan Stanley & Co. Incorporated
Morgan Stanley Distribution, Inc.
Morgan Stanley AIP GP LP
Morgan Stanley Alternative Investment Partners LP
(e)(2) Beginning with non-audit service contracts entered into on or after May 6, 2003, the audit committee also is required to pre-approve services to Covered Entities to the extent that the services are determined to have a direct impact on the operations or financial reporting of the Registrant. 100% of such services were pre-approved by the audit committee pursuant to the Audit Committee’s pre-approval policies and procedures (attached hereto).
(f) Not applicable.
(g) See table above.
(h) The audit committee of the Board of Trustees has considered whether the provision of services other than audit services performed by the auditors to the Registrant and Covered Entities is compatible with maintaining the auditors’ independence in performing audit services.
Item 5. Audit Committee of Listed Registrants.
(a) The Fund has a separately-designated standing audit committee established in accordance with Section 3(a)(58)(A) of the Exchange Act whose members are: Joseph Kearns, Michael Nugent and Allen Reed.
(b) Not applicable.
Item 6. Schedule of Investments
(a) Refer to Item 1.
(b) Not applicable.
Item 7. Disclosure of Proxy Voting Policies and Procedures for Closed-End Management Investment Companies.
Applicable only to reports filed by closed-end funds.
Item 8. Portfolio Managers of Closed-End Management Investment Companies
Applicable only to reports filed by closed-end funds.
Item 9. Closed-End Fund Repurchases
Applicable only to reports filed by closed-end funds.
Item 10. Submission of Matters to a Vote of Security Holders
Not applicable.
Item 11. Controls and Procedures
(a) The Fund’s principal executive officer and principal financial officer have concluded that the Fund’s disclosure controls and procedures are sufficient to ensure that information required to be disclosed by the Fund in this Form N-CSR was recorded, processed, summarized and reported within the time periods specified in the Securities and Exchange Commission’s rules and forms, based upon such officers’ evaluation of these controls and procedures as of a date within 90 days of the filing date of the report.
(b) There were no changes in the registrant’s internal control over financial reporting that occurred during the second fiscal quarter of the period covered by this report that has materially affected, or is reasonably likely to materially affect, the registrant’s internal control over financial reporting.
Item 12. Exhibits
(a) The Code of Ethics for Principal Executive and Senior Financial Officers is attached hereto.
(b) A separate certification for each principal executive officer and principal financial officer of the registrant are attached hereto as part of EX-99.CERT.
SIGNATURES
Pursuant to the requirements of the Securities Exchange Act of 1934 and the Investment Company Act of 1940, the registrant has duly caused this report to be signed on its behalf by the undersigned, thereunto duly authorized.
Morgan Stanley Institutional Funds Trust
/s/ Sara Furber | |
Sara Furber | |
Principal Executive Officer | |
November 16, 2010 | |
Pursuant to the requirements of the Securities Exchange Act of 1934 and the Investment Company Act of 1940, this report has been signed by the following persons on behalf of the registrant and in the capacities and on the dates indicated.
/s/ Sara Furber | |
Sara Furber | |
Principal Executive Officer | |
November 16, 2010 | |
| |
/s/ Francis Smith | |
Francis Smith | |
Principal Financial Officer | |
November 16, 2010 | |