UNITED STATES
SECURITIES AND EXCHANGE COMMISSION
Washington, D.C. 20549
FORM N-CSR
CERTIFIED SHAREHOLDER REPORT OF REGISTERED
MANAGEMENT INVESTMENT COMPANIES
Investment Company Act file number | 811-03980 |
|
Morgan Stanley Institutional Fund Trust |
(Exact name of registrant as specified in charter) |
|
522 Fifth Avenue, New York, New York | | 10036 |
(Address of principal executive offices) | | (Zip code) |
|
Arthur Lev 522 Fifth Avenue, New York, New York 10036 |
(Name and address of agent for service) |
|
Registrant’s telephone number, including area code: | 201-830-8894 | |
|
Date of fiscal year end: | September 30, 2012 | |
|
Date of reporting period: | September 30, 2012 | |
| | | | | | | | |
Item 1 - Report to Shareholders

Morgan Stanley
Institutional Fund Trust
Global Strategist Portfolio
(formerly Balanced Portfolio)
Annual
Report
September 30, 2012


Morgan Stanley Institutional Fund Trust
Annual Report — September 30, 2012
Shareholders' Letter | | | 2 | | |
Expense Example | | | 3 | | |
Investment Advisory Agreement Approval | | | 4 | | |
Investment Overview | | | 6 | | |
Portfolio of Investments | | | 9 | | |
Statement of Assets and Liabilities | | | 22 | | |
Statement of Operations | | | 24 | | |
Statements of Changes in Net Assets | | | 25 | | |
Financial Highlights | | | 27 | | |
Notes to Financial Statements | | | 31 | | |
Report of Independent Registered Public Accounting Firm | | | 42 | | |
Federal Tax Notice | | | 43 | | |
U.S. Privacy Policy | | | 44 | | |
Trustee and Officer Information | | | 47 | | |
This report is authorized for distribution only when preceded or accompanied by prospectuses of the Morgan Stanley Institutional Fund Trust. To receive a prospectus and/or SAI, which contains more complete information such as investment objectives, charges, expenses, policies for voting proxies, risk considerations, and describes in detail each of the Portfolio's investment policies to the prospective investor, please call toll free 1-(800) 548-7786. Please read the prospectuses carefully before you invest or send money.
Additionally, you can access portfolio information including performance, characteristics, and investment team commentary through Morgan Stanley Investment Management's website: www.morganstanley.com/im.
Market forecasts provided in this report may not necessarily come to pass. There is no guarantee that any sectors mentioned will continue to perform as discussed herein or that securities in such sectors will be held by the Portfolio in the future. There is no assurance that a Portfolio will achieve its investment objective. Portfolios are subject to market risk, which is the possibility that market values of securities owned by the Portfolio will decline and, therefore, the value of the Portfolio's shares may be less than what you paid for them. Accordingly, you can lose money investing in Portfolios. Please see the prospectus for more complete information on investment risks.
1
Morgan Stanley Institutional Fund Trust
Annual Report — September 30, 2012
Shareholders' Letter (unaudited)
Dear Shareholders:
We are pleased to provide this Annual report, in which you will learn how your investment in Global Strategist Portfolio performed during the latest twelve-month period.
Morgan Stanley Investment Management is a client-centric, investor-led organization. Our global presence, intellectual capital, and breadth of products and services enable us to partner with investors to meet the evolving challenges of today's financial markets. We aim to deliver superior investment service and to empower our clients to make the informed decisions that help them reach their investment goals.
As always, we thank you for selecting Morgan Stanley Investment Management, and look forward to working with you in the months and years ahead.
Sincerely,

Arthur Lev
President and Principal Executive Officer
October 2012
2
Morgan Stanley Institutional Fund Trust
Annual Report — September 30, 2012
Expense Example (unaudited)
Global Strategist Portfolio
As a shareholder of the Portfolio, you may incur two types of costs: (1) transactional costs, including sales charge (loads) on purchase payments; and (2) ongoing costs, including advisory fees, administration fees, distribution and shareholder servicing fees; and other Portfolio expenses. This example is intended to help you understand your ongoing costs (in dollars) of investing in the Portfolio and to compare these costs with the ongoing costs of investing in other mutual funds.
This example is based on an investment of $1,000 invested at the beginning of the six-month period ended September 30, 2012 and held for the entire six-month period.
Actual Expenses
The table below provides information about actual account values and actual expenses. You may use the information in this table, together with the amount you invested, to estimate the expenses that you paid over the period. Simply divide your account value by $1,000 (for example, an $8,600 account value divided by $1,000 = 8.6), then multiply the result by the number in the table under the heading entitled "Actual Expenses Paid During Period" to estimate the expenses you paid on your account during this period.
Please note that "Actual Expenses Paid During Period" are grossed up to reflect Portfolio expenses prior to the effect of Expense Offset (See Note F in the Notes to Financial Statements). Therefore, the annualized net expense ratios may differ from the ratio of expenses to average net assets shown in the Financial Highlights.
Hypothetical Example for Comparison Purposes
The table below provides information about hypothetical account values and hypothetical expenses based on the Portfolio's actual expense ratio and an assumed rate of return of 5% per year before expenses, which is not the Portfolio's actual return. The hypothetical account values and expenses may not be used to estimate the actual ending account balance or expenses you paid for the period. You may use this information to compare the ongoing costs of investing in the Portfolio and other funds. To do so, compare this 5% hypothetical example with the 5% hypothetical examples that appear in the shareholder reports of the other funds.
Please note that the expenses shown in the table are meant to highlight your ongoing costs only and do not reflect any transactional costs, such as sales charges (loads, if applicable). Therefore, the hypothetical account values and hypothetical expenses are useful in comparing ongoing costs only, and will not help you determine the relative total costs of owning different funds. In addition, if these transactional costs were included, your costs would have been higher.
| | | Beginning
Account
Value
4/1/12 | | Actual Ending
Account
Value
9/30/12 | | Hypothetical
Ending Account
Value | | Actual
Expenses
Paid
During
Period | | Hypothetical
Expenses Paid
During Period | | Net
Expense
Ratio
During
Period** | |
Global Strategist Portfolio Class I | | $ | 1,000.00 | | | $ | 1,054.00 | | | $ | 1,017.00 | | | $ | 8.22 | * | | $ | 8.07 | * | | | 1.60 | % | |
Global Strategist Portfolio Class P | | | 1,000.00 | | | | 1,052.90 | | | | 1,015.75 | | | | 9.49 | * | | | 9.32 | * | | | 1.85 | | |
Global Strategist Portfolio Class H | | | 1,000.00 | | | | 1,055.20 | | | | 1,013.09 | | | | 8.17 | + | | | 8.00 | + | | | 1.89 | | |
Global Strategist Portfolio Class L | | | 1,000.00 | | | | 1,053.00 | | | | 1,010.98 | | | | 10.32 | + | | | 10.11 | + | | | 2.39 | | |
* Expenses are calculated using each Portfolio Class' annualized net expense ratio (as disclosed), multiplied by the average account value over the period, and multiplied by 183/366 (to reflect the most recent one-half year period).
** Annualized.
+ Expenses are calculated using each Portfolio Class' annualized net expense ratio (as disclosed), multiplied by the average account value over the period, and multiplied by 154/366 (to reflect the actual days in the period).
3
Morgan Stanley Institutional Fund Trust
Annual Report — September 30, 2012
Investment Advisory Agreement Approval (unaudited)
Nature, Extent and Quality of Services
The Board reviewed and considered the nature and extent of the investment advisory services provided by the Adviser (as defined herein) under the advisory agreement, including portfolio management, investment research and equity and fixed income securities trading. The Board also reviewed and considered the nature and extent of the non-advisory, administrative services provided by the Adviser under the administration agreement, including accounting, clerical, bookkeeping, compliance, business management and planning, and the provision of supplies, office space and utilities at the Adviser's expense. (The advisory and administration agreements together are referred to as the "Management Agreement.") The Board also compared the nature of the services provided by the Adviser with similar services provided by non-affiliated advisers as reported to the Board by Lipper, Inc. ("Lipper").
The Board reviewed and considered the qualifications of the portfolio managers, the senior administrative managers and other key personnel of the Adviser who provide the advisory and administrative services to the Portfolio. The Board determined that the Adviser's portfolio managers and key personnel are well qualified by education and/or training and experience to perform the services in an efficient and professional manner. The Board concluded that the nature and extent of the advisory and administrative services provided were necessary and appropriate for the conduct of the business and investment activities of the Portfolio and supported its decision to approve the Management Agreement.
Performance, Fees and Expenses of the Portfolio
The Board reviewed the performance, fees and expenses of the Portfolio compared to its peers, as determined by Lipper, and to appropriate benchmarks where applicable. The Board discussed with the Adviser the performance goals and the actual results achieved in managing the Portfolio. When considering a fund's performance, the Board and the Adviser place emphasis on trends and longer-term returns (focusing on one-year, three-year and five-year performance, as of December 31, 2011, or since inception, as applicable). When a fund underperforms its benchmark and/or its peer group average, they discuss the causes of such underperformance and, where necessary, they discuss specific changes to investment strategy or investment personnel. The Board noted that the Portfolio's performance was better than its peer group average for the one-, three- and five-year periods. The Board discussed with the Adviser the level of the advisory and administration fees (together, the "management fee") for this Portfolio relative to comparable funds and/or other accounts advised by the Adviser and/or compared to its peers as determined by Lipper. In addition to the management fee, the Board also reviewed the Portfolio's total expense ratio. The Board noted that the Portfolio's management fee was lower than its peer group average and the total expense ratio was higher than its peer group average. After discussion, the Board concluded that the Portfolio's (i) performance was competitive with its peer group average; (ii) management fee was competitive with its peer group average; and (iii) total expense ratio was acceptable given the quality and nature of the services provided.
Economies of Scale
The Board considered the size and growth prospects of the Portfolio and how that relates to the Portfolio's total expense ratio and particularly the Portfolio's management fee rate which does not include breakpoints. In conjunction with its review of the Adviser's profitability, the Board discussed with the Adviser how a change in assets can affect the efficiency or effectiveness of managing the Portfolio and whether the management fee level is appropriate relative to current and projected asset levels and/or whether the management fee structure reflects economies of scale as asset levels change. The Board has determined that its review of the actual and potential economies of scale of the Portfolio supports its decision to approve the Management Agreement.
Profitability of the Adviser and Affiliates
The Board considered information concerning the costs incurred and profits realized by the Adviser and its affiliates during the last year from their relationship with the Portfolio and during the last two years from their relationship with the Morgan Stanley Fund Complex and reviewed with the Adviser the cost allocation methodology used to determine the profitability of the Adviser and affiliates. The Board has determined that its review of the analysis of the Adviser's expenses and profitability supports its decision to approve the Management Agreement.
4
Morgan Stanley Institutional Fund Trust
Annual Report — September 30, 2012
Investment Advisory Agreement Approval (unaudited) (cont'd)
Other Benefits of the Relationship
The Board considered other benefits to the Adviser and its affiliates derived from their relationship with the Portfolio and other funds advised by the Adviser. These benefits may include, among other things, "float" benefits derived from handling of checks for purchases and sales, research received by the Adviser generated from commission dollars spent on funds' portfolio trading and fees for distribution and/or shareholder servicing. The Board reviewed with the Adviser each of these arrangements and the reasonableness of the Adviser's costs relative to the services performed. The Board has determined that its review of the other benefits received by the Adviser or its affiliates supports its decision to approve the Management Agreement.
Resources of the Adviser and Historical Relationship Between the Portfolio and the Adviser
The Board considered whether the Adviser is financially sound and has the resources necessary to perform its obligations under the Management Agreement. The Board also reviewed and considered the historical relationship between the Portfolio and the Adviser, including the organizational structure of the Adviser, the policies and procedures formulated and adopted by the Adviser for managing the Portfolio's operations and the Board's confidence in the competence and integrity of the senior managers and key personnel of the Adviser. The Board concluded that the Adviser has the financial resources necessary to fulfill its obligations under the Management Agreement and that it is beneficial for the Portfolio to continue its relationship with the Adviser.
Other Factors and Current Trends
The Board considered the controls and procedures adopted and implemented by the Adviser and monitored by the Fund's Chief Compliance Officer and concluded that the conduct of business by the Adviser indicates a good faith effort on its part to adhere to high ethical standards in the conduct of the Fund's business.
General Conclusion
After considering and weighing all of the above factors, the Board concluded that it would be in the best interest of the Portfolio and its shareholders to approve renewal of the Management Agreement for another year. In reaching this conclusion the Board did not give particular weight to any single factor referenced above. The Board considered these factors over the course of numerous meetings, some of which were in executive session with only the independent Board members and their counsel present. It is possible that individual Board members may have weighed these factors differently in reaching their individual decisions to approve the Management Agreement.
5
Morgan Stanley Institutional Fund Trust
Annual Report — September 30, 2012
Investment Overview (unaudited)
Global Strategist Portfolio
Performance
For the fiscal year ended September 30, 2012, the Portfolio's Class I had a total return based on net asset value and reinvestment of distributions per share of 23.66%, net of fees. The Portfolio's Class I outperformed against the MSCI All Country World Index (the "Index"), which returned 20.98%, the Barclays Capital U.S. Aggregate Index, which returned 5.16%, and the 60/40 Blended Index (the "Blended Index"), a blend of 60% S&P 500® Index and 40% Barclays Capital U.S. Aggregate Index, which returned 19.94%, and underperformed against the S&P 500® Index, which returned 30.20%.
Factors Affecting Performance
• Risk markets rebounded in the fourth quarter of 2011 and the first quarter of 2012, aided by better economic data in the U.S. and the introduction of a three-year long-term refinancing operation (LTRO) in the eurozone, which dramatically reduced the risk of a bank funding crisis and helped lower sovereign yields for Italy and Spain. However, this rally lost steam in the second quarter of 2012, as markets succumbed to the weakening trend in global economic growth, a rise in eurozone risk premia and the recognition that an adequate policy response may not be forthcoming. In the U.S., economic activity was hurt by payback from an unseasonably warm winter and tighter financial conditions owing to tensions in Europe, with the deterioration accelerating notably in June. In the emerging world, the dominant focus was the slowdown in Chinese growth. Expectations of a second quarter trough in activity data were sorely disappointed, as fixed asset investment growth slowed to its lowest level in near a decade at 20.1% year-over-year in May. Policymakers came to the rescue in the third quarter, with the Federal Reserve embarking on an open-ended quantitative easing program and the European Central Bank (ECB) introducing an asset purchase program of its own, focused primarily on Spain and Italy. This verbal easing helped extend the global risk rally through the end of September, even as the trend in macro data failed to meaningfully improve over the course of the quarter.
• Regarding the Portfolio's overall performance relative to the Blended Index, an overweight position in global equities and underweight position in fixed income positively impacted returns as equities sharply rebounded from depressed levels,
while U.S. Treasury yields traded in a range for the large part of the 12-month period.
• Within U.S. equities, an overweight allocation to homebuilders contributed to performance as U.S. housing fundamentals showed material signs of improvement, boosting related stocks in the process. However, an overweight to U.S. semiconductors and underweight to U.S. real estate investment trusts (REITs) detracted from performance, as global investors shunned cyclical sectors in favor of more defensive, higher yielding positions.
• Security selection within fixed income negatively impacted performance. Underweight positions in U.S. government bonds detracted from performance as 10-year Treasury yields fell to historic lows of 1.39%.
• However, other positions performed more favorably. Within U.S. equities, an allocation to high dividend-paying equities added to relative performance as investors found their yields attractive in an otherwise low yielding environment.
• Within currencies, tactical underweights to the euro and Australian dollar added to performance. The euro largely depreciated on the back of greater tension in sovereign bond markets, while the Australian dollar weakened due to falling commodity prices and expectations for aggressive Reserve Bank of Australia easing.
Management Strategies
• Heading into the fourth quarter of 2012, we remain cautiously optimistic on global risk assets. This view had been reflected in the Portfolio through an overweight position in equities and underweight in G3 government bonds. We recently downgraded our view on equities to neutral but have maintained our cautious stance on G3 bonds.
• Two factors drove this shift: a neutralization of previously favorable valuations and sentiment, as well as a weakening of economic activity to stall speed. At the global equity market's low in early June, equity valuations in many regions had returned to near March 2009 levels with European Monetary Union (EMU) equities trading at 8.5 times 12-month forward earnings, emerging markets at 9.0 times and even the U.S. trading at only 11.5 times. Four months, a 15% rally in global equities and many earnings downgrades later, stocks are much closer to our estimates of fair value, with the U.S. at 13.2 times,
6
Morgan Stanley Institutional Fund Trust
Annual Report — September 30, 2012
Investment Overview (unaudited) (cont'd)
Global Strategist Portfolio
EMU recently at 10.6 times and emerging markets at 10.2 times. We maintain conservative estimates primarily because we expect further downgrades to earnings over the coming months.
• Recent data point to subpar U.S. growth at 1.5% to 2.0%, EMU mired in recession and China in hard landing, all likely to remain at such a pace through the first quarter of 2013. As a result, global economic growth has slowed to stall speed (i.e. below 2.0%). This is concerning as studies have shown that upon reaching stall speed, growth often descends into recessionary territory. Already, current economic activity levels imply that global earnings growth will likely slip from -5% to -10% from current analyst expectations of +8% globally. Any further slippage in gross domestic product (GDP) growth could cause earnings to fall even further to -15%, a miss too big for markets to digest.
• However, from a long-term asset allocation standpoint, we believe equities continue to look appealing relative to other assets classes, especially developed government bonds. Handicapping the potential near-term risks, we intend to maintain a neutral to moderate overweight position in global equities and an underweight position in developed fixed income.

* Minimum Investment
In accordance with SEC regulations, the Portfolio's performance shown assumes that all recurring fees (including management fees) were deducted and all dividends and distributions were reinvested. The performance of Class P, Class H and Class L shares will vary from the Class I shares based upon their different inception dates and will be negatively impacted by additional fees assessed to those classes.
Performance Compared to the Morgan Stanley Capital International All Country World Index(1), the S&P 500® Index(2), the Barclays Capital U.S. Aggregate Index(3), the 60/40 Blended Index(4), and the Lipper Mixed-Asset Target Allocation Growth Funds Index(5)
| | | Period Ended September 30, 2012
Total Returns(6) | |
| | | | Average Annual | |
| | One
Year | | Five
Years | | Ten
Years | | Since
Inception(10) | |
Portfolio — Class I Shares
w/o sales charges(7) | | | 23.66 | % | | | 3.33 | % | | | 8.31 | % | | | 7.68 | % | |
MSCI All Country World Index | | | 20.98 | | | | –2.07 | | | | 8.61 | | | | 7.12 | | |
S&P 500® Index | | | 30.20 | | | | 1.05 | | | | 8.01 | | | | 8.35 | | |
Barclays Capital U.S. Aggregate Index | | | 5.16 | | | | 6.53 | | | | 5.32 | | | | 6.41 | | |
60/40 Blended Index | | | 19.94 | | | | 3.88 | | | | 7.35 | | | | 8.00 | | |
Lipper Mixed-Asset Target
Allocation Growth Funds Index | | | 20.23 | | | | 1.99 | | | | 7.24 | | | | 7.55 | | |
Portfolio — Class P Shares
w/o sales charges(8) | | | 23.33 | | | | 3.05 | | | | 8.02 | | | | 6.43 | | |
MSCI All Country World Index | | | 20.98 | | | | –2.07 | | | | 8.61 | | | | 4.99 | | |
S&P 500® Index | | | 30.20 | | | | 1.05 | | | | 8.01 | | | | 6.51 | | |
Barclays Capital U.S. Aggregate Index | | | 5.16 | | | | 6.53 | | | | 5.32 | | | | 6.27 | | |
60/40 Blended Index | | | 19.94 | | | | 3.88 | | | | 7.35 | | | | 6.92 | | |
Lipper Mixed-Asset Target Allocation
Growth Funds Index | | | 20.23 | | | | 1.99 | | | | 7.24 | | | | 6.41 | | |
Portfolio — Class H Shares
w/o sales charges(9) | | | — | | | | — | | | | — | | | | 5.52 | | |
Portfolio — Class H Shares
with maximum 4.75%
sales charges(9) | | | — | | | | — | | | | — | | | | 0.50 | | |
MSCI All Country World Index | | | — | | | | — | | | | — | | | | 1.85 | | |
S&P 500® Index | | | — | | | | — | | | | — | | | | 3.68 | | |
Barclays Capital U.S. Aggregate Index | | | — | | | | — | | | | — | | | | 2.63 | | |
60/40 Blended Index | | | — | | | | — | | | | — | | | | 3.30 | | |
Lipper Mixed-Asset Target Allocation
Growth Funds Index | | | — | | | | — | | | | — | | | | 2.60 | | |
Portfolio — Class L Shares
w/o sales charges(9) | | | — | | | | — | | | | — | | | | 5.30 | | |
MSCI All Country World Index | | | — | | | | — | | | | — | | | | 1.85 | | |
S&P 500® Index | | | — | | | | — | | | | — | | | | 3.68 | | |
Barclays Capital U.S. Aggregate Index | | | — | | | | — | | | | — | | | | 2.63 | | |
60/40 Blended Index | | | — | | | | — | | | | — | | | | 3.30 | | |
Lipper Mixed-Asset Target Allocation
Growth Funds Index | | | — | | | | — | | | | — | | | | 2.60 | | |
Performance data quoted represents past performance, which is no guarantee of future results, and current performance may be lower or higher than the figures shown. Performance assumes that all dividends and distributions, if any, were reinvested. Returns for periods less than one year are not annualized. For the most recent month-end performance figures, please visit www.morganstanley.com/im. Investment returns and principal value will fluctuate so that Portfolio shares, when redeemed, may be worth more or less than their original cost. Total returns do not reflect the deduction of taxes that a shareholder would pay on Portfolio distributions or the redemption of Portfolio shares. Performance of share classes will vary due to differences in sales charges and expenses.
(1) The Morgan Stanley Capital International (MSCI) All Country World Index (ACWI) is a free float-adjusted market capitalization weighted index designed to measure
7
Morgan Stanley Institutional Fund Trust
Annual Report — September 30, 2012
Investment Overview (unaudited) (cont'd)
Global Strategist Portfolio
the equity market performance of developed and emerging markets. The term "free float" represents the portion of shares outstanding that are deemed to be available for purchase in the public equity markets by investors. The performance of the Index is listed in U.S. dollars and assumes reinvestment of net dividends. "Net dividends" reflects a reduction in dividends after taking into account withholding of taxes by any foreign countries represented in the Index. Returns, including periods prior to January 1, 2001, are calculated using the return data of the MSCI All Country World Index (gross dividends) through December 31, 2000 and the return data of the MSCI All Country World Index (net dividends) after December 31, 2000. The Index is unmanaged and its returns do not include any sales charges or fees. Such costs would lower performance. It is not possible to invest directly in an index. The Portfolio's primary benchmark was changed in July 2012 to the MSCI All Country World Index to more accurately reflect the Portfolio's investible universe.
(2) The Standard & Poor's 500® Index (S&P 500®) measures the performance of the large cap segment of the U.S. equities market, covering approximately 75% of the U.S. equities market. The Index includes 500 leading companies in leading industries of the U.S. economy. The Index is unmanaged and its returns do not include any sales charges or fees. Such costs would lower performance. It is not possible to invest directly in an index.
(3) The Barclays Capital U.S. Aggregate Index tracks the performance of all U.S. government agency and Treasury securities, investment-grade corporate debt securities, agency mortgage-backed securities, asset-backed securities and commercial mortgage-backed securities. The Index is unmanaged and its returns do not include any sales charges or fees. Such costs would lower performance. It is not possible to invest directly in an index.
(4) The 60/40 Blended Index is comprised of 60% S&P 500® Index and 40% Barclays Capital U.S. Aggregate Index.
(5) The Lipper Mixed-Asset Target Allocation Growth Funds Index is an equally-weighted performance index of the largest qualifying funds (based on net assets) in the Lipper Mixed-Asset Target Allocation Growth Funds classification. The Index, which is adjusted for capital gains distributions and income dividends, is unmanaged and should not be considered an investment. There are currently 30 fund represented in this Index. As of the date of this report, the Portfolio was in the Lipper Mixed-Asset Target Allocation Growth Funds classification.
(6) Total returns for the Portfolio reflect expenses waived and/or reimbursed, if applicable, by the Adviser. Without such waivers and/or reimbursements, total returns would have been lower. The fee waivers and/or expense reimbursements will continue for at least two years or until such time as the Fund's Board of Trustees acts to discontinue all or a portion of such waivers and/or reimbursements when it deems such action is appropriate.
(7) Commenced operations on December 31, 1992.
(8) Commenced operations on November 1, 1996.
(9) Commenced operations on April 27, 2012.
(10) For comparative purposes, average annual since inception returns listed for the Indexes refer to the inception date or initial offering of the respective share class of the Portfolio, not the inception of the Indexes.
Portfolio Composition*
Classification | | Percentage of
Total Investments | |
Common Stocks | | | 44.1 | % | |
Fixed Income Securities | | | 42.7 | | |
Short-Term Investments | | | 10.4 | | |
Commodity Linked Security | | | 1.5 | | |
Other** | | | 1.3 | | |
Total Investments | | | 100.0 | %*** | |
* Percentages indicated are based upon total investments (excluding Securities held as Collateral on Loaned Securities) as of September 30, 2012.
** Industries and/or investment types representing less than 5% of total investments.
*** Does not include open foreign currency exchange contracts with net unrealized appreciation of approximately $3,000. Does not include open long/short futures contracts with an underlying face amount of approximately $26,384,000 and net unrealized depreciation of approximately $215,000. Does not include open swap agreements with net unrealized appreciation of approximately $63,000.
8
Morgan Stanley Institutional Fund Trust
Annual Report — September 30, 2012
Portfolio of Investments
Global Strategist Portfolio
| | | Face
Amount
(000) | | Value
(000) | |
Fixed Income Securities (42.4%) | |
Agency Adjustable Rate Mortgage (0.1%) | |
United States (0.1%) | |
Federal National Mortgage Association, | |
Conventional Pool | |
| 2.32%, 5/1/35 (Cost $57) | | $ | 55 | | | $ | 59 | | |
Agency Fixed Rate Mortgages (4.9%) | |
United States (4.9%) | |
Federal Home Loan Mortgage Corporation, | |
Gold Pools: | |
4.00%, 12/1/41 | | | 80 | | | | 87 | | |
4.50%, 6/1/39 | | | 399 | | | | 429 | | |
7.50%, 5/1/35 | | | 15 | | | | 18 | | |
October TBA: | |
3.00%, 10/1/27 (a) | | | 150 | | | | 158 | | |
Federal National Mortgage Association, | |
Conventional Pools: | |
4.00%, 11/1/41 | | | 60 | | | | 65 | | |
5.50%, 5/1/37 - 8/1/38 | | | 346 | | | | 387 | | |
6.00%, 1/1/38 | | | 64 | | | | 71 | | |
7.50%, 8/1/37 | | | 28 | | | | 35 | | |
Government National Mortgage Association, | |
October TBA: | |
3.50%, 10/15/42 (a) | | | 185 | | | | 202 | | |
4.00%, 10/15/42 (a) | | | 525 | | | | 579 | | |
Various Pools: | |
4.50%, 4/15/39 - 8/15/39 | | | 125 | | | | 138 | | |
Total Agency Fixed Rate Mortgages (Cost $2,136) | | | 2,169 | | |
Asset-Backed Securities (0.3%) | |
United States (0.3%) | |
Santander Drive Auto Receivables Trust, | |
3.06%, 11/15/17 | | | 50 | | | | 51 | | |
U-Haul S Fleet LLC, | |
4.90%, 10/25/23 (b) | | | 75 | | | | 81 | | |
Total Asset-Backed Securities (Cost $125) | | | 132 | | |
Collateralized Mortgage Obligations — Agency Collateral Series (1.1%) | |
United States (1.1%) | |
Federal Home Loan Mortgage Corporation, | |
2.79%, 1/25/22 | | | 75 | | | | 80 | | |
2.97%, 10/25/21 | | | 90 | | | | 98 | | |
IO | |
0.83%, 1/25/21 (c) | | | 691 | | | | 28 | | |
IO PAC REMIC | |
6.25%, 6/15/40 (c) | | | 436 | | | | 85 | | |
IO REMIC | |
5.83%, 4/15/39 (c) | | | 208 | | | | 50 | | |
Federal National Mortgage Association, | |
IO REMIC | |
5.00%, 8/25/37 | | | 56 | | | | 2 | | |
6.38%, 9/25/38 (c) | | | 183 | | | | 38 | | |
| | | Face
Amount
(000) | | Value
(000) | |
Government National Mortgage Association, | |
IO | |
6.36%, 6/20/40 (c) | | $ | 120 | | | $ | 20 | | |
6.38%, 4/16/41 (c) | | | 284 | | | | 64 | | |
Total Collateralized Mortgage Obligations — Agency
Collateral Series (Cost $393) | | | 465 | | |
Commercial Mortgage Backed Securities (0.6%) | |
United States (0.6%) | |
Citigroup Commercial Mortgage Trust (See Note G), | |
6.26%, 12/10/49 (c) | | | 50 | | | | 60 | | |
JP Morgan Chase Commercial Mortgage Securities Corp., | |
4.17%, 8/15/46 | | | 70 | | | | 81 | | |
4.39%, 7/15/46 (b) | | | 100 | | | | 114 | | |
Total Commercial Mortgage Backed Securities
(Cost $220) | | | 255 | | |
Corporate Bonds (6.5%) | |
Australia (0.3%) | |
Macquarie Bank Ltd., | |
3.30%, 7/17/14 (b)(d) | | | 42 | | | | 44 | | |
6.63%, 4/7/21 (b) | | | 25 | | | | 27 | | |
Macquarie Group Ltd., | |
6.00%, 1/14/20 (b) | | | 25 | | | | 27 | | |
Wesfarmers Ltd., | |
2.98%, 5/18/16 (b) | | | 50 | | | | 52 | | |
| | | | 150 | | |
Canada (0.2%) | |
Barrick Gold Corp., | |
3.85%, 4/1/22 | | | 65 | | | | 68 | | |
France (0.3%) | |
BNP Paribas SA, | |
5.00%, 1/15/21 | | | 40 | | | | 44 | | |
Credit Agricole SA, | |
5.88%, 6/11/19 | | EUR | 50 | | | | 68 | | |
| | | | 112 | | |
Israel (0.1%) | |
Teva Pharmaceutical Finance IV BV, | |
3.65%, 11/10/21 | | $ | 60 | | | | 65 | | |
Italy (0.4%) | |
Finmeccanica Finance SA, | |
8.13%, 12/3/13 | | EUR | 50 | | | | 69 | | |
Telecom Italia Finance SA, | |
7.75%, 1/24/33 | | | 30 | | | | 41 | | |
UniCredit SpA, | |
4.38%, 2/10/14 | | | 50 | | | | 66 | | |
| | | | 176 | | |
Japan (0.1%) | |
Nippon Telegraph & Telephone Corp., | |
1.40%, 7/18/17 | | $ | 25 | | | | 25 | | |
Luxembourg (0.1%) | |
ArcelorMittal, | |
10.10%, 6/1/19 | | | 25 | | | | 29 | | |
The accompanying notes are an integral part of the financial statements.
9
Morgan Stanley Institutional Fund Trust
Annual Report — September 30, 2012
Portfolio of Investments (cont'd)
Global Strategist Portfolio
| | | Face
Amount
(000) | | Value
(000) | |
Spain (0.2%) | |
Gas Natural Capital Markets SA, | |
4.13%, 1/26/18 | | EUR | 50 | | | $ | 62 | | |
Santander Holdings USA, Inc., | |
4.63%, 4/19/16 | | $ | 10 | | | | 10 | | |
| | | | 72 | | |
Switzerland (0.1%) | |
ABB Treasury Center USA, Inc., | |
2.50%, 6/15/16 (b) | | | 55 | | | | 58 | | |
United Kingdom (1.2%) | |
Abbey National Treasury Services PLC, | |
3.63%, 10/14/16 | | EUR | 75 | | | | 105 | | |
MTN | |
3.88%, 11/10/14 (b) | | $ | 100 | | | | 102 | | |
Diageo Capital PLC, | |
1.50%, 5/11/17 | | | 15 | | | | 15 | | |
HSBC Holdings PLC, | |
4.00%, 3/30/22 | | | 45 | | | | 48 | | |
6.00%, 6/10/19 | | EUR | 50 | | | | 74 | | |
Imperial Tobacco Finance PLC, | |
8.38%, 2/17/16 | | | 50 | | | | 79 | | |
Standard Chartered PLC, | |
3.85%, 4/27/15 (b) | | $ | 100 | | | | 106 | | |
| | | | 529 | | |
United States (3.5%) | |
Altria Group, Inc., | |
2.85%, 8/9/22 | | | 25 | | | | 25 | | |
Bank of America Corp., | |
5.63%, 7/1/20 | | | 15 | | | | 17 | | |
Boston Properties LP, | |
3.85%, 2/1/23 | | | 25 | | | | 26 | | |
Citigroup, Inc. (See Note G), | |
6.13%, 5/15/18 | | | 31 | | | | 37 | | |
CNA Financial Corp., | |
5.75%, 8/15/21 | | | 45 | | | | 52 | | |
Comcast Corp., | |
5.70%, 5/15/18 | | | 30 | | | | 37 | | |
CRH America, Inc., | |
6.00%, 9/30/16 | | | 40 | | | | 45 | | |
Darden Restaurants, Inc., | |
6.20%, 10/15/17 | | | 50 | | | | 58 | | |
DirecTV Holdings LLC/DirecTV Financing Co., Inc., | |
3.80%, 3/15/22 | | | 25 | | | | 26 | | |
Ford Motor Credit Co., LLC, | |
4.21%, 4/15/16 | | | 200 | | | | 212 | | |
General Electric Capital Corp., | |
3.15%, 9/7/22 | | | 100 | | | | 101 | | |
Genworth Financial, Inc., | |
7.20%, 2/15/21 | | | 30 | | | | 31 | | |
Gilead Sciences, Inc., | |
4.50%, 4/1/21 | | | 40 | | | | 46 | | |
| | | Face
Amount
(000) | | Value
(000) | |
Goldman Sachs Group, Inc. (The), | |
5.75%, 1/24/22 | | $ | 80 | | | $ | 92 | | |
Harley-Davidson Funding Corp., | |
6.80%, 6/15/18 (b) | | | 30 | | | | 37 | | |
Hartford Financial Services Group, Inc., | |
5.50%, 3/30/20 | | | 25 | | | | 28 | | |
Hewlett-Packard Co., | |
4.65%, 12/9/21 | | | 50 | | | | 52 | | |
JPMorgan Chase & Co., | |
3.15%, 7/5/16 | | | 60 | | | | 64 | | |
4.63%, 5/10/21 | | | 25 | | | | 28 | | |
Life Technologies Corp., | |
6.00%, 3/1/20 | | | 40 | | | | 48 | | |
Merrill Lynch & Co., Inc., | |
6.88%, 4/25/18 | | | 40 | | | | 48 | | |
Murphy Oil Corp., | |
4.00%, 6/1/22 | | | 25 | | | | 27 | | |
Nationwide Financial Services, | |
5.38%, 3/25/21 (b) | | | 25 | | | | 27 | | |
Omnicom Group, Inc., | |
3.63%, 5/1/22 | | | 25 | | | | 27 | | |
Pacific LifeCorp, | |
6.00%, 2/10/20 (b) | | | 25 | | | | 28 | | |
Phillips 66, | |
4.30%, 4/1/22 (b) | | | 25 | | | | 27 | | |
Plains All American Pipeline LP/PAA Finance Corp., | |
8.75%, 5/1/19 | | | 30 | | | | 40 | | |
PPL WEM Holdings PLC, | |
3.90%, 5/1/16 (b) | | | 40 | | | | 42 | | |
Prudential Financial, Inc., | |
7.38%, 6/15/19 | | | 50 | | | | 63 | | |
Santander Holdings USA, Inc., | |
3.00%, 9/24/15 | | | 10 | | | | 10 | | |
Sonoco Products Co., | |
5.75%, 11/1/40 | | | 40 | | | | 47 | | |
Verizon Communications, Inc., | |
8.95%, 3/1/39 | | | 45 | | | | 79 | | |
Watson Pharmaceuticals, | |
3.25%, 10/1/22 | | | 10 | | | | 10 | | |
4.63%, 10/1/42 | | | 10 | | | | 10 | | |
WellPoint, Inc., | |
3.30%, 1/15/23 | | | 25 | | | | 25 | | |
| | | | 1,572 | | |
Total Corporate Bonds (Cost $2,646) | | | 2,856 | | |
Mortgages — Other (1.1%) | |
United States (1.1%) | |
Banc of America Alternative Loan Trust, | |
5.86%, 10/25/36 | | | 63 | | | | 48 | | |
5.91%, 10/25/36 (c) | | | 120 | | | | 92 | | |
6.00%, 4/25/36 | | | 59 | | | | 60 | | |
Chaseflex Trust, | |
6.00%, 2/25/37 | | | 62 | | | | 48 | | |
The accompanying notes are an integral part of the financial statements.
10
Morgan Stanley Institutional Fund Trust
Annual Report — September 30, 2012
Portfolio of Investments (cont'd)
Global Strategist Portfolio
| | | Face
Amount
(000) | | Value
(000) | |
Mortgages — Other (cont'd) | |
First Horizon Alternative Mortgage Securities, | |
6.25%, 8/25/36 | | $ | 37 | | | $ | 30 | | |
GSR Mortgage Loan Trust, | |
5.75%, 1/25/37 | | | 71 | | | | 71 | | |
Lehman Mortgage Trust, | |
5.50%, 11/25/35 | | | 34 | | | | 34 | | |
6.50%, 9/25/37 | | | 82 | | | | 68 | | |
RALI Trust, | |
0.72%, 3/25/35 (c) | | | 53 | | | | 33 | | |
Total Mortgages — Other (Cost $461) | | | 484 | | |
Sovereign (22.1%) | |
Australia (0.7%) | |
Australia Government Bond, | |
5.25%, 3/15/19 | | AUD | 270 | | | | 323 | | |
Brazil (0.2%) | |
Brazilian Government International Bond, | |
4.88%, 1/22/21 (d) | | $ | 90 | | | | 108 | | |
Canada (1.1%) | |
Canadian Government Bond, | |
4.25%, 6/1/18 | | CAD | 400 | | | | 471 | | |
Denmark (0.1%) | |
Denmark Government Bond, | |
4.00%, 11/15/19 | | DKK | 200 | | | | 42 | | |
France (0.7%) | |
France Government Bond OAT, | |
3.25%, 10/25/21 | | EUR | 75 | | | | 106 | | |
4.00%, 4/25/18 | | | 100 | | | | 149 | | |
French Treasury Note BTAN, | |
3.00%, 7/12/14 | | | 35 | | | | 47 | | |
| | | | 302 | | |
Germany (2.8%) | |
Bundesobligation, | |
2.75%, 4/8/16 | | | 300 | | | | 420 | | |
Bundesrepublik Deutschland, | |
1.75%, 7/4/22 | | | 300 | | | | 398 | | |
4.25%, 7/4/39 | | | 230 | | | | 417 | | |
| | | | 1,235 | | |
Italy (1.1%) | |
Italy Buoni Poliennali Del Tesoro, | |
3.00%, 6/15/15 | | | 150 | | | | 193 | | |
4.00%, 9/1/20 | | | 115 | | | | 142 | | |
4.50%, 2/1/18 | | | 100 | | | | 132 | | |
| | | | 467 | | |
Japan (4.7%) | |
Japan Government Ten Year Bond, | |
1.10%, 6/20/21 | | JPY | 35,000 | | | | 466 | | |
1.30%, 12/20/13 | | | 20,000 | | | | 260 | | |
1.70%, 6/20/18 | | | 20,000 | | | | 277 | | |
1.90%, 6/20/16 | | | 35,000 | | | | 478 | | |
| | | Face
Amount
(000) | | Value
(000) | |
Japan Government Thirty Year Bond, | |
1.70%, 6/20/33 | | JPY | 45,000 | | | $ | 580 | | |
| | | | 2,061 | | |
Mexico (0.6%) | |
Mexican Bonos, | |
10.00%, 12/5/24 | | MXN | 1,900 | | | | 208 | | |
Petroleos Mexicanos, | |
4.88%, 1/24/22 | | $ | 70 | | | | 79 | | |
| | | | 287 | | |
Netherlands (0.3%) | |
Netherlands Government Bond, | |
4.00%, 7/15/19 (b) | | EUR | 100 | | | | 152 | | |
Norway (0.1%) | |
Norway Government Bond, | |
6.50%, 5/15/13 | | NOK | 250 | | | | 45 | | |
Poland (0.6%) | |
Poland Government Bond, | |
5.25%, 10/25/17 | | PLN | 500 | | | | 164 | | |
Poland Government International Bond, | |
5.00%, 3/23/22 | | $ | 70 | | | | 81 | | |
| | | | 245 | | |
South Africa (0.1%) | |
South Africa Government Bond, | |
7.25%, 1/15/20 | | ZAR | 500 | | | | 63 | | |
Spain (6.4%) | |
Spain Government Bond, | |
4.75%, 7/30/14 | | EUR | 2,150 | | | | 2,829 | | |
Supernational (0.7%) | |
European Investment Bank, | |
2.15%, 1/18/27 | | JPY | 12,000 | | | | 166 | | |
European Union, | |
3.25%, 4/4/18 | | EUR | 100 | | | | 144 | | |
| | | | 310 | | |
Sweden (0.2%) | |
Sweden Government Bond, | |
4.25%, 3/12/19 | | SEK | 450 | | | | 82 | | |
United Kingdom (1.7%) | |
United Kingdom Gilt, | |
4.00%, 3/7/22 | | GBP | 160 | | | | 315 | | |
4.25%, 9/7/39 | | | 230 | | | | 457 | | |
| | | | 772 | | |
Total Sovereign (Cost $9,492) | | | 9,794 | | |
U.S. Agency Securities (1.3%) | |
United States (1.3%) | |
Federal National Mortgage Association, | |
1.25%, 9/28/16 | | $ | 350 | | | | 360 | | |
5.38%, 6/12/17 | | | 170 | | | | 206 | | |
Total U.S. Agency Securities (Cost $546) | | | 566 | | |
The accompanying notes are an integral part of the financial statements.
11
Morgan Stanley Institutional Fund Trust
Annual Report — September 30, 2012
Portfolio of Investments (cont'd)
Global Strategist Portfolio
| | | Face
Amount
(000) | | Value
(000) | |
U.S. Treasury Securities (4.4%) | |
United States (4.4%) | |
U.S. Treasury Bond, | |
3.88%, 8/15/40 | | $ | 270 | | | $ | 330 | | |
U.S. Treasury Notes, | |
0.75%, 6/15/14 | | | 450 | | | | 454 | | |
1.75%, 3/31/14 | | | 155 | | | | 158 | | |
2.25%, 1/31/15 | | | 580 | | | | 607 | | |
3.00%, 9/30/16 | | | 300 | | | | 330 | | |
3.63%, 8/15/19 | | | 50 | | | | 59 | | |
Total U.S. Treasury Securities (Cost $1,913) | | | 1,938 | | |
Total Fixed Income Securities (Cost $17,989) | | | 18,718 | | |
| | | Shares | | | |
Common Stocks (43.7%) | |
Australia (1.4%) | |
AGL Energy Ltd. | | | 498 | | | | 8 | | |
Amcor Ltd. | | | 1,417 | | | | 11 | | |
AMP Ltd. | | | 2,727 | | | | 12 | | |
Australia & New Zealand Banking Group Ltd. | | | 2,163 | | | | 55 | | |
BHP Billiton Ltd. | | | 2,936 | | | | 101 | | |
Brambles Ltd. | | | 2,064 | | | | 15 | | |
Coca-Cola Amatil Ltd. | | | 80 | | | | 1 | | |
Commonwealth Bank of Australia | | | 1,107 | | | | 64 | | |
CSL Ltd. | | | 423 | | | | 20 | | |
Macquarie Group Ltd. | | | 265 | | | | 8 | | |
National Australia Bank Ltd. | | | 1,416 | | | | 37 | | |
Newcrest Mining Ltd. | | | 588 | | | | 18 | | |
Orica Ltd. | | | 341 | | | | 9 | | |
Origin Energy Ltd. | | | 958 | | | | 11 | | |
QBE Insurance Group Ltd. | | | 933 | | | | 13 | | |
Rio Tinto Ltd. | | | 363 | | | | 20 | | |
Santos Ltd. | | | 861 | | | | 10 | | |
Stockland REIT | | | 5,155 | | | | 18 | | |
Suncorp Group Ltd. | | | 1,112 | | | | 11 | | |
Telstra Corp., Ltd. | | | 3,618 | | | | 15 | | |
Transurban Group | | | 2,325 | | | | 14 | | |
Wesfarmers Ltd. | | | 742 | | | | 26 | | |
Westfield Group REIT | | | 2,224 | | | | 23 | | |
Westfield Retail Trust REIT | | | 3,300 | | | | 10 | | |
Westpac Banking Corp. | | | 2,008 | | | | 52 | | |
Woodside Petroleum Ltd. | | | 484 | | | | 17 | | |
Woolworths Ltd. | | | 991 | | | | 30 | | |
| | | | 629 | | |
Canada (2.5%) | |
Agnico-Eagle Mines Ltd. | | | 200 | | | | 10 | | |
Agrium, Inc. | | | 200 | | | | 21 | | |
Bank of Montreal | | | 600 | | | | 35 | | |
Bank of Nova Scotia (d) | | | 1,000 | | | | 55 | | |
Barrick Gold Corp. (d) | | | 1,100 | | | | 46 | | |
BCE, Inc. (d) | | | 700 | | | | 31 | | |
Brookfield Asset Management, Inc., Class A | | | 700 | | | | 24 | | |
Cameco Corp. | | | 500 | | | | 10 | | |
| | | Shares | | Value
(000) | |
Canadian Imperial Bank of Commerce (d) | | | 500 | | | $ | 39 | | |
Canadian National Railway Co. (d) | | | 400 | | | | 35 | | |
Canadian Natural Resources Ltd. | | | 1,100 | | | | 34 | | |
Canadian Oil Sands Ltd. (d) | | | 600 | | | | 13 | | |
Canadian Pacific Railway Ltd. (d) | | | 200 | | | | 17 | | |
Cenovus Energy, Inc. (d) | | | 800 | | | | 28 | | |
Crescent Point Energy Corp. (d) | | | 300 | | | | 13 | | |
Eldorado Gold Corp. | | | 700 | | | | 11 | | |
Enbridge, Inc. | | | 900 | | | | 35 | | |
Encana Corp. | | | 800 | | | | 18 | | |
First Quantum Minerals Ltd. | | | 700 | | | | 15 | | |
Goldcorp, Inc. | | | 800 | | | | 37 | | |
Husky Energy, Inc. (d) | | | 300 | | | | 8 | | |
Imperial Oil Ltd. (d) | | | 200 | | | | 9 | | |
Intact Financial Corp. | | | 200 | | | | 12 | | |
Kinross Gold Corp. | | | 1,400 | | | | 14 | | |
Magna International, Inc. (d) | | | 300 | | | | 13 | | |
Manulife Financial Corp. (d) | | | 2,500 | | | | 30 | | |
National Bank of Canada (d) | | | 200 | | | | 15 | | |
Nexen, Inc. | | | 600 | | | | 15 | | |
Pembina Pipeline Corp. (d) | | | 500 | | | | 14 | | |
Potash Corp. of Saskatchewan, Inc. | | | 900 | | | | 39 | | |
Power Corp. of Canada (d) | | | 600 | | | | 15 | | |
Rogers Communications, Inc. (d) | | | 400 | | | | 16 | | |
Royal Bank of Canada (d) | | | 1,500 | | | | 86 | | |
Shaw Communications, Inc. (d) | | | 400 | | | | 8 | | |
Shoppers Drug Mart Corp. (d) | | | 300 | | | | 12 | | |
Silver Wheaton Corp. | | | 400 | | | | 16 | | |
Sun Life Financial, Inc. | | | 800 | | | | 19 | | |
Suncor Energy, Inc. | | | 1,500 | | | | 49 | | |
Talisman Energy, Inc. | | | 1,200 | | | | 16 | | |
Teck Resources Ltd. | | | 600 | | | | 18 | | |
Thomson Reuters Corp. (d) | | | 400 | | | | 12 | | |
Tim Hortons, Inc. (d) | | | 300 | | | | 16 | | |
Toronto-Dominion Bank (The) (d) | | | 900 | | | | 75 | | |
TransCanada Corp. (d) | | | 700 | | | | 32 | | |
Valeant Pharmaceuticals International, Inc. (e) | | | 300 | | | | 17 | | |
Yamana Gold, Inc. (d) | | | 800 | | | | 15 | | |
| | | | 1,118 | | |
Denmark (0.3%) | |
AP Moller - Maersk A/S | | | 1 | | | | 7 | | |
AP Moller - Maersk A/S Series B | | | 1 | | | | 7 | | |
Carlsberg A/S | | | 98 | | | | 9 | | |
Coloplast A/S | | | 24 | | | | 5 | | |
Danske Bank A/S (e) | | | 608 | | | | 11 | | |
DSV A/S | | | 187 | | | | 4 | | |
Novo Nordisk A/S Series B | | | 384 | | | | 61 | | |
Novozymes A/S Series B | | | 241 | | | | 6 | | |
TDC A/S | | | 537 | | | | 4 | | |
| | | | 114 | | |
The accompanying notes are an integral part of the financial statements.
12
Morgan Stanley Institutional Fund Trust
Annual Report — September 30, 2012
Portfolio of Investments (cont'd)
Global Strategist Portfolio
| | | Shares | | Value
(000) | |
Germany (1.6%) | |
Adidas AG | | | 242 | | | $ | 20 | | |
Allianz SE (Registered) | | | 410 | | | | 49 | | |
BASF SE | | | 831 | | | | 70 | | |
Bayer AG (Registered) | | | 694 | | | | 60 | | |
Bayerische Motoren Werke AG | | | 359 | | | | 26 | | |
Continental AG | | | 100 | | | | 10 | | |
Daimler AG (Registered) | | | 810 | | | | 39 | | |
Deutsche Bank AG (Registered) | | | 964 | | | | 38 | | |
Deutsche Boerse AG | | | 210 | | | | 12 | | |
Deutsche Post AG (Registered) | | | 757 | | | | 15 | | |
Deutsche Telekom AG (Registered) | | | 2,312 | | | | 28 | | |
E.ON AG | | | 1,468 | | | | 35 | | |
Fresenius Medical Care AG & Co., KGaA | | | 222 | | | | 16 | | |
Fresenius SE & Co., KGaA | | | 128 | | | | 15 | | |
Henkel AG & Co., KGaA | | | 152 | | | | 10 | | |
Infineon Technologies AG | | | 1,314 | | | | 8 | | |
K&S AG (Registered) | | | 206 | | | | 10 | | |
Linde AG | | | 245 | | | | 42 | | |
Muenchener Rueckversicherungs AG (Registered) | | | 166 | | | | 26 | | |
Porsche Automobil Holding SE (Preference) | | | 141 | | | | 8 | | |
RWE AG | | | 408 | | | | 18 | | |
SAP AG | | | 869 | | | | 62 | | |
Siemens AG (Registered) | | | 751 | | | | 75 | | |
Volkswagen AG (Preference) | | | 144 | | | | 26 | | |
| | | | 718 | | |
Japan (4.6%) | |
Aeon Co., Ltd. | | | 1,000 | | | | 11 | | |
Aisin Seiki Co., Ltd. (d) | | | 300 | | | | 9 | | |
Ajinomoto Co., Inc. | | | 1,000 | | | | 16 | | |
Asahi Glass Co., Ltd. (d) | | | 2,000 | | | | 13 | | |
Asahi Group Holdings Ltd. | | | 600 | | | | 15 | | |
Asahi Kasei Corp. (d) | | | 3,000 | | | | 15 | | |
Astellas Pharma, Inc. (d) | | | 600 | | | | 30 | | |
Bridgestone Corp. | | | 900 | | | | 21 | | |
Canon, Inc. (d) | | | 1,200 | | | | 38 | | |
Central Japan Railway Co. (d) | | | 200 | | | | 18 | | |
Chubu Electric Power Co., Inc. (d) | | | 900 | | | | 12 | | |
Dai-ichi Life Insurance Co., Ltd. (The) (d) | | | 14 | | | | 16 | | |
Daiichi Sankyo Co., Ltd. (d) | | | 500 | | | | 8 | | |
Daikin Industries Ltd. (d) | | | 500 | | | | 13 | | |
Daito Trust Construction Co., Ltd. | | | 100 | | | | 10 | | |
Daiwa House Industry Co., Ltd. | | | 1,000 | | | | 14 | | |
Denso Corp. (d) | | | 700 | | | | 22 | | |
East Japan Railway Co. (d) | | | 600 | | | | 40 | | |
Eisai Co., Ltd. (d) | | | 300 | | | | 14 | | |
FANUC Corp. (d) | | | 200 | | | | 32 | | |
Fast Retailing Co., Ltd. | | | 100 | | | | 23 | | |
FUJIFILM Holdings Corp. (d) | | | 800 | | | | 13 | | |
Fujitsu Ltd. (d) | | | 3,000 | | | | 11 | | |
Hankyu Hanshin Holdings, Inc. | | | 3,000 | | | | 16 | | |
Hitachi Ltd. (d) | | | 5,000 | | | | 28 | | |
| | | Shares | | Value
(000) | |
Honda Motor Co., Ltd. (d) | | | 1,600 | | | $ | 49 | | |
Hoya Corp. (d) | | | 1,000 | | | | 22 | | |
Inpex Corp. (d) | | | 3 | | | | 18 | | |
Isuzu Motors Ltd. | | | 2,000 | | | | 10 | | |
ITOCHU Corp. (d) | | | 1,400 | | | | 14 | | |
Japan Tobacco, Inc. (d) | | | 1,000 | | | | 30 | | |
JFE Holdings, Inc. (d) | | | 800 | | | | 11 | | |
JX Holdings, Inc. (d) | | | 4,100 | | | | 22 | | |
Kansai Electric Power Co., Inc. (The) | | | 800 | | | | 6 | | |
Kao Corp. (d) | | | 800 | | | | 24 | | |
KDDI Corp. (d) | | | 300 | | | | 23 | | |
Keyence Corp. | | | 100 | | | | 26 | | |
Kintetsu Corp. (d) | | | 3,000 | | | | 12 | | |
Kirin Holdings Co., Ltd. | | | 1,000 | | | | 13 | | |
Komatsu Ltd. (d) | | | 1,100 | | | | 22 | | |
Kubota Corp. (d) | | | 2,000 | | | | 20 | | |
Kyocera Corp. (d) | | | 300 | | | | 26 | | |
LIXIL Group Corp. (d) | | | 500 | | | | 12 | | |
Marubeni Corp. (d) | | | 2,000 | | | | 13 | | |
Mitsubishi Chemical Holdings Corp. (d) | | | 2,500 | | | | 10 | | |
Mitsubishi Corp. (d) | | | 1,600 | | | | 29 | | |
Mitsubishi Electric Corp. (d) | | | 2,000 | | | | 15 | | |
Mitsubishi Estate Co., Ltd. | | | 1,000 | | | | 19 | | |
Mitsubishi Heavy Industries Ltd. (d) | | | 7,000 | | | | 30 | | |
Mitsui & Co., Ltd. (d) | | | 1,900 | | | | 27 | | |
Mitsui Fudosan Co., Ltd. | | | 1,000 | | | | 20 | | |
Mizuho Financial Group, Inc. (d) | | | 23,900 | | | | 39 | | |
MS&AD Insurance Group Holdings (d) | | | 800 | | | | 14 | | |
Murata Manufacturing Co., Ltd. (d) | | | 400 | | | | 21 | | |
Nidec Corp. (d) | | | 200 | | | | 15 | | |
Nikon Corp. (d) | | | 500 | | | | 14 | | |
Nintendo Co., Ltd. | | | 100 | | | | 13 | | |
Nippon Building Fund, Inc. REIT | | | 1 | | | | 11 | | |
Nippon Steel Sumitomo Metal Corp. (d) | | | 9,000 | | | | 18 | | |
Nippon Telegraph & Telephone Corp. | | | 500 | | | | 24 | | |
Nissan Motor Co., Ltd. (d) | | | 2,700 | | | | 23 | | |
Nitto Denko Corp. (d) | | | 300 | | | | 14 | | |
NKSJ Holdings, Inc. (d) | | | 600 | | | | 12 | | |
Nomura Holdings, Inc. (d) | | | 5,300 | | | | 19 | | |
NTT DoCoMo, Inc. (d) | | | 19 | | | | 31 | | |
Odakyu Electric Railway Co., Ltd. (d) | | | 2,000 | | | | 21 | | |
Oriental Land Co., Ltd. | | | 100 | | | | 13 | | |
ORIX Corp. (d) | | | 130 | | | | 13 | | |
Osaka Gas Co., Ltd. (d) | | | 4,000 | | | | 18 | | |
Otsuka Holdings Co., Ltd. (d) | | | 600 | | | | 19 | | |
Panasonic Corp. (d) | | | 2,700 | | | | 18 | | |
Rakuten, Inc. (d) | | | 1,100 | | | | 11 | | |
Resona Holdings, Inc. | | | 2,900 | | | | 12 | | |
Secom Co., Ltd. (d) | | | 300 | | | | 16 | | |
Seven & I Holdings Co., Ltd. | | | 1,300 | | | | 40 | | |
Shin-Etsu Chemical Co., Ltd. (d) | | | 700 | | | | 39 | | |
Shizuoka Bank Ltd. (The) (d) | | | 2,000 | | | | 20 | | |
SMC Corp. | | | 100 | | | | 16 | | |
The accompanying notes are an integral part of the financial statements.
13
Morgan Stanley Institutional Fund Trust
Annual Report — September 30, 2012
Portfolio of Investments (cont'd)
Global Strategist Portfolio
| | | Shares | | Value
(000) | |
Japan (cont'd) | |
Softbank Corp. (d) | | | 900 | | | $ | 36 | | |
Sony Corp. (d) | | | 1,300 | | | | 15 | | |
Sumitomo Corp. (d) | | | 1,600 | | | | 22 | | |
Sumitomo Electric Industries Ltd. (d) | | | 1,300 | | | | 14 | | |
Sumitomo Metal Mining Co., Ltd. | | | 1,000 | | | | 13 | | |
Sumitomo Mitsui Financial Group, Inc. (d) | | | 1,500 | | | | 47 | | |
Sumitomo Mitsui Trust Holdings, Inc. (d) | | | 6,000 | | | | 18 | | |
Sumitomo Realty & Development Co., Ltd. | | | 1,000 | | | | 27 | | |
Suzuki Motor Corp. (d) | | | 400 | | | | 8 | | |
Takeda Pharmaceutical Co., Ltd. (d) | | | 900 | | | | 41 | | |
Terumo Corp. (d) | | | 400 | | | | 17 | | |
Tokio Marine Holdings, Inc. (d) | | | 800 | | | | 20 | | |
Tokyo Electron Ltd. (d) | | | 200 | | | | 9 | | |
Tokyo Gas Co., Ltd. | | | 4,000 | | | | 22 | | |
Toray Industries, Inc. (d) | | | 3,000 | | | | 18 | | |
Toshiba Corp. (d) | | | 6,000 | | | | 19 | | |
Toyota Motor Corp. (d) | | | 2,800 | | | | 109 | | |
Unicharm Corp. (d) | | | 200 | | | | 11 | | |
West Japan Railway Co. (d) | | | 500 | | | | 21 | | |
Yamato Holdings Co., Ltd. (d) | | | 900 | | | | 14 | | |
| | | | 2,006 | | |
Netherlands (0.0%) | |
DE Master Blenders 1753 N.V. (e) | | | 878 | | | | 10 | | |
Norway (0.2%) | |
Aker Solutions ASA | | | 156 | | | | 3 | | |
DnB NOR ASA | | | 957 | | | | 12 | | |
Norsk Hydro ASA | | | 1,018 | | | | 5 | | |
Orkla ASA | | | 724 | | | | 6 | | |
Seadrill Ltd. | | | 328 | | | | 13 | | |
Statoil ASA | | | 1,065 | | | | 27 | | |
Subsea 7 SA | | | 267 | | | | 6 | | |
Telenor ASA | | | 689 | | | | 13 | | |
Yara International ASA | | | 176 | | | | 9 | | |
| | | | 94 | | |
South Africa (0.1%) | |
SABMiller PLC | | | 978 | | | | 43 | | |
Switzerland (1.9%) | |
ABB Ltd. (Registered) (e) | | | 2,347 | | | | 44 | | |
Cie Financiere Richemont SA | | | 649 | | | | 39 | | |
Credit Suisse Group AG (Registered) (e) | | | 1,141 | | | | 24 | | |
Geberit AG (Registered) (e) | | | 57 | | | | 12 | | |
Givaudan SA (Registered) (e) | | | 10 | | | | 9 | | |
Holcim Ltd. (Registered) (e) | | | 327 | | | | 21 | | |
Nestle SA (Registered) | | | 3,139 | | | | 198 | | |
Novartis AG (Registered) | | | 2,232 | | | | 137 | | |
Roche Holding AG (Genusschein) | | | 671 | | | | 125 | | |
SGS SA (Registered) | | | 7 | | | | 14 | | |
Swatch Group AG (The) | | | 44 | | | | 18 | | |
Swiss Re AG (e) | | | 400 | | | | 26 | | |
Swisscom AG (Registered) | | | 34 | | | | 14 | | |
Syngenta AG (Registered) | | | 100 | | | | 37 | | |
| | | Shares | | Value
(000) | |
Transocean Ltd. | | | 374 | | | $ | 17 | | |
UBS AG (Registered) (e) | | | 3,871 | | | | 47 | | |
Zurich Insurance Group AG (e) | | | 152 | | | | 38 | | |
| | | | 820 | | |
United Kingdom (3.4%) | |
Anglo American PLC | | | 1,012 | | | | 30 | | |
AstraZeneca PLC | | | 1,201 | | | | 57 | | |
BAE Systems PLC | | | 3,633 | | | | 19 | | |
Barclays PLC | | | 12,419 | | | | 43 | | |
BG Group PLC | | | 2,493 | | | | 50 | | |
BHP Billiton PLC | | | 1,673 | | | | 52 | | |
| BP PLC | | | 13,678 | | | | 97 | | |
British American Tobacco PLC | | | 1,293 | | | | 66 | | |
BT Group PLC | | | 10,606 | | | | 40 | | |
Centrica PLC | | | 3,608 | | | | 19 | | |
Compass Group PLC | | | 3,183 | | | | 35 | | |
Diageo PLC | | | 1,894 | | | | 53 | | |
Experian PLC | | | 1,333 | | | | 22 | | |
GlaxoSmithKline PLC | | | 3,270 | | | | 75 | | |
HSBC Holdings PLC | | | 14,639 | | | | 136 | | |
Imperial Tobacco Group PLC | | | 551 | | | | 20 | | |
Lloyds Banking Group PLC (e) | | | 21,362 | | | | 13 | | |
National Grid PLC | | | 4,711 | | | | 52 | | |
Pearson PLC | | | 1,218 | | | | 24 | | |
Prudential PLC | | | 2,967 | | | | 38 | | |
Reckitt Benckiser Group PLC | | | 570 | | | | 33 | | |
Rio Tinto PLC | | | 1,102 | | | | 51 | | |
Rolls-Royce Holdings PLC (e) | | | 1,965 | | | | 27 | | |
Royal Dutch Shell PLC, Class A | | | 2,426 | | | | 84 | | |
Royal Dutch Shell PLC, Class B | | | 1,712 | | | | 61 | | |
Shire PLC | | | 375 | | | | 11 | | |
SSE PLC | | | 875 | | | | 20 | | |
Standard Chartered PLC | | | 2,190 | | | | 50 | | |
Tesco PLC | | | 5,848 | | | | 31 | | |
Tullow Oil PLC | | | 718 | | | | 16 | | |
Unilever PLC | | | 1,123 | | | | 41 | | |
Vodafone Group PLC | | | 30,480 | | | | 87 | | |
WPP PLC | | | 1,848 | | | | 25 | | |
Xstrata PLC | | | 2,215 | | | | 34 | | |
| | | | 1,512 | | |
United States (27.7%) | |
3M Co. | | | 658 | | | | 61 | | |
Abbott Laboratories | | | 759 | | | | 52 | | |
Accenture PLC, Class A | | | 91 | | | | 6 | | |
Adobe Systems, Inc. (e) | | | 691 | | | | 22 | | |
Advanced Micro Devices, Inc. (d)(e) | | | 523 | | | | 2 | | |
AES Corp. (The) (e) | | | 1,093 | | | | 12 | | |
Aetna, Inc. (d) | | | 454 | | | | 18 | | |
Aflac, Inc. (d) | | | 301 | | | | 14 | | |
Agilent Technologies, Inc. | | | 59 | | | | 2 | | |
Air Products & Chemicals, Inc. | | | 101 | | | | 8 | | |
Alcoa, Inc. (d) | | | 699 | | | | 6 | | |
The accompanying notes are an integral part of the financial statements.
14
Morgan Stanley Institutional Fund Trust
Annual Report — September 30, 2012
Portfolio of Investments (cont'd)
Global Strategist Portfolio
| | | Shares | | Value
(000) | |
United States (cont'd) | |
Allegheny Technologies, Inc. | | | 111 | | | $ | 4 | | |
Allergan, Inc. | | | 499 | | | | 46 | | |
Allstate Corp. (The) | | | 643 | | | | 25 | | |
Altera Corp. (d) | | | 237 | | | | 8 | | |
Altria Group, Inc. | | | 1,952 | | | | 65 | | |
Amazon.com, Inc. (d)(e) | | | 273 | | | | 69 | | |
AMC Networks, Inc., Class A (e) | | | 21 | | | | 1 | | |
American Electric Power Co., Inc. (d) | | | 621 | | | | 27 | | |
American Express Co. | | | 704 | | | | 40 | | |
American Tower Corp. REIT | | | 542 | | | | 39 | | |
Ameriprise Financial, Inc. | | | 111 | | | | 6 | | |
AmerisourceBergen Corp. (d) | | | 476 | | | | 18 | | |
Amgen, Inc. | | | 734 | | | | 62 | | |
Amphenol Corp., Class A (d) | | | 206 | | | | 12 | | |
Anadarko Petroleum Corp. | | | 463 | | | | 32 | | |
Analog Devices, Inc. (d) | | | 183 | | | | 7 | | |
Aon PLC (d) | | | 200 | | | | 10 | | |
Apache Corp. | | | 549 | | | | 47 | | |
Apollo Group, Inc., Class A (d)(e) | | | 176 | | | | 5 | | |
Apple, Inc. | | | 1,014 | | | | 677 | | |
Applied Materials, Inc. (d) | | | 1,042 | | | | 12 | | |
Archer-Daniels-Midland Co. | | | 784 | | | | 21 | | |
AT&T, Inc. | | | 5,652 | | | | 213 | | |
Automatic Data Processing, Inc. | | | 464 | | | | 27 | | |
AutoZone, Inc. (d)(e) | | | 43 | | | | 16 | | |
AvalonBay Communities, Inc. REIT (d) | | | 43 | | | | 6 | | |
Avery Dennison Corp. (d) | | | 149 | | | | 5 | | |
Avon Products, Inc. (d) | | | 446 | | | | 7 | | |
Baker Hughes, Inc. | | | 477 | | | | 22 | | |
Ball Corp. | | | 154 | | | | 7 | | |
Bank of America Corp. | | | 13,584 | | | | 120 | | |
Bank of New York Mellon Corp. (The) | | | 1,438 | | | | 33 | | |
Baxter International, Inc. | | | 553 | | | | 33 | | |
BB&T Corp. (d) | | | 852 | | | | 28 | | |
Becton Dickinson and Co. (d) | | | 390 | | | | 31 | | |
Bed Bath & Beyond, Inc. (d)(e) | | | 207 | | | | 13 | | |
Berkshire Hathaway, Inc., Class B (e) | | | 754 | | | | 66 | | |
Best Buy Co., Inc. (d) | | | 187 | | | | 3 | | |
Biogen Idec, Inc. (e) | | | 238 | | | | 36 | | |
BlackRock, Inc. (d) | | | 34 | | | | 6 | | |
Boeing Co. (The) | | | 434 | | | | 30 | | |
Boston Properties, Inc. REIT (d) | | | 100 | | | | 11 | | |
Boston Scientific Corp. (e) | | | 1,574 | | | | 9 | | |
Bristol-Myers Squibb Co. (d) | | | 1,393 | | | | 47 | | |
Broadcom Corp., Class A (e) | | | 439 | | | | 15 | | |
Brown-Forman Corp., Class B (d) | | | 31 | | | | 2 | | |
C.H. Robinson Worldwide, Inc. (d) | | | 111 | | | | 6 | | |
Cablevision Systems Corp. (d) | | | 308 | | | | 5 | | |
Cameron International Corp. (e) | | | 563 | | | | 32 | | |
Campbell Soup Co. (d) | | | 222 | | | | 8 | | |
Capital One Financial Corp. | | | 637 | | | | 36 | | |
Cardinal Health, Inc. | | | 266 | | | | 10 | | |
| | | Shares | | Value
(000) | |
CarMax, Inc. (d)(e) | | | 269 | | | $ | 8 | | |
Carnival Corp. (d) | | | 492 | | | | 18 | | |
Catamaran Corp. (e) | | | 100 | | | | 10 | | |
Caterpillar, Inc. | | | 1,022 | | | | 88 | | |
CBRE Group, Inc., Class A (d)(e) | | | 462 | | | | 9 | | |
CBS Corp., Class B | | | 620 | | | | 23 | | |
Celgene Corp. (e) | | | 442 | | | | 34 | | |
CenterPoint Energy, Inc. (d) | | | 64 | | | | 1 | | |
CenturyLink, Inc. (d) | | | 761 | | | | 31 | | |
Cerner Corp. (d)(e) | | | 213 | | | | 16 | | |
CF Industries Holdings, Inc. | | | 40 | | | | 9 | | |
Charles Schwab Corp. (The) (d) | | | 497 | | | | 6 | | |
Chesapeake Energy Corp. (d) | | | 776 | | | | 15 | | |
Chevron Corp. | | | 1,034 | | | | 121 | | |
Chubb Corp. (The) | | | 284 | | | | 22 | | |
Cigna Corp. | | | 394 | | | | 19 | | |
Cintas Corp. (d) | | | 208 | | | | 9 | | |
Cisco Systems, Inc. | | | 5,229 | | | | 100 | | |
Citigroup, Inc. (See Note G) | | | 3,818 | | | | 125 | | |
Citrix Systems, Inc. (e) | | | 238 | | | | 18 | | |
Cliffs Natural Resources, Inc. (d) | | | 43 | | | | 2 | | |
CME Group, Inc. (d) | | | 211 | | | | 12 | | |
Coach, Inc. (d) | | | 434 | | | | 24 | | |
Coca-Cola Co. (The) | | | 3,224 | | | | 122 | | |
Coca-Cola Enterprises, Inc. (d) | | | 519 | | | | 16 | | |
Cognizant Technology Solutions Corp., Class A (e) | | | 246 | | | | 17 | | |
Colgate-Palmolive Co. | | | 558 | | | | 60 | | |
Comcast Corp., Class A | | | 3,245 | | | | 116 | | |
Comerica, Inc. (d) | | | 222 | | | | 7 | | |
ConAgra Foods, Inc. | | | 641 | | | | 18 | | |
ConocoPhillips (d) | | | 799 | | | | 46 | | |
CONSOL Energy, Inc. (d) | | | 603 | | | | 18 | | |
Consolidated Edison, Inc. (d) | | | 228 | | | | 14 | | |
Constellation Brands, Inc., Class A (e) | | | 433 | | | | 14 | | |
Corning, Inc. (d) | | | 1,828 | | | | 24 | | |
Costco Wholesale Corp. | | | 428 | | | | 43 | | |
CR Bard, Inc. (d) | | | 43 | | | | 4 | | |
CSX Corp. | | | 1,147 | | | | 24 | | |
Cummins, Inc. | | | 387 | | | | 36 | | |
CVS Caremark Corp. | | | 1,281 | | | | 62 | | |
D.R. Horton, Inc. (d) | | | 4,006 | | | | 83 | | |
Danaher Corp. (d) | | | 777 | | | | 43 | | |
Darden Restaurants, Inc. (d) | | | 42 | | | | 2 | | |
DaVita, Inc. (e) | | | 43 | | | | 4 | | |
Deere & Co. (d) | | | 490 | | | | 40 | | |
Dell, Inc. (d) | | | 1,449 | | | | 14 | | |
Denbury Resources, Inc. (d)(e) | | | 1,034 | | | | 17 | | |
Devon Energy Corp. | | | 548 | | | | 33 | | |
DeVry, Inc. (d) | | | 21 | | | | — | @ | |
Diamond Offshore Drilling, Inc. (d) | | | 43 | | | | 3 | | |
DIRECTV, Class A (e) | | | 881 | | | | 46 | | |
Discover Financial Services | | | 759 | | | | 30 | | |
Discovery Communications, Inc. (d)(e) | | | 197 | | | | 12 | | |
The accompanying notes are an integral part of the financial statements.
15
Morgan Stanley Institutional Fund Trust
Annual Report — September 30, 2012
Portfolio of Investments (cont'd)
Global Strategist Portfolio
| | | Shares | | Value
(000) | |
United States (cont'd) | |
Dominion Resources, Inc. (d) | | | 1,460 | | | $ | 77 | | |
Dow Chemical Co. (The) (d) | | | 781 | | | | 23 | | |
DTE Energy Co. | | | 64 | | | | 4 | | |
Duke Energy Corp. (d) | | | 644 | | | | 42 | | |
Dun & Bradstreet Corp. (The) (d) | | | 21 | | | | 2 | | |
Eagle Materials, Inc. (d) | | | 200 | | | | 9 | | |
Eastman Chemical Co. (d) | | | 111 | | | | 6 | | |
Eaton Corp. (d) | | | 222 | | | | 10 | | |
eBay, Inc. (e) | | | 1,180 | | | | 57 | | |
Ecolab, Inc. | | | 140 | | | | 9 | | |
Edison International | | | 583 | | | | 27 | | |
EI du Pont de Nemours & Co. (d) | | | 708 | | | | 36 | | |
Eli Lilly & Co. (d) | | | 632 | | | | 30 | | |
EMC Corp. (d)(e) | | | 2,257 | | | | 62 | | |
Emerson Electric Co. (d) | | | 558 | | | | 27 | | |
Engility Holdings, Inc. (d)(e) | | | 18 | | | | — | @ | |
EOG Resources, Inc. | | | 398 | | | | 45 | | |
Equifax, Inc. | | | 54 | | | | 3 | | |
Equity Residential REIT | | | 459 | | | | 26 | | |
Estee Lauder Cos., Inc. (The), Class A (d) | | | 78 | | | | 5 | | |
Exelis, Inc. | | | 327 | | | | 3 | | |
Exelon Corp. | | | 470 | | | | 17 | | |
Expedia, Inc. | | | 112 | | | | 6 | | |
Expeditors International of Washington, Inc. (d) | | | 111 | | | | 4 | | |
Express Scripts Holding Co. (e) | | | 883 | | | | 55 | | |
Exxon Mobil Corp. | | | 2,420 | | | | 221 | | |
Family Dollar Stores, Inc. | | | 111 | | | | 7 | | |
FedEx Corp. (d) | | | 222 | | | | 19 | | |
Fidelity National Information Services, Inc. | | | 111 | | | | 3 | | |
Fifth Third Bancorp (d) | | | 1,101 | | | | 17 | | |
First Solar, Inc. (d)(e) | | | 80 | | | | 2 | | |
FirstEnergy Corp. (d) | | | 217 | | | | 10 | | |
FMC Corp. | | | 153 | | | | 8 | | |
FMC Technologies, Inc. (e) | | | 604 | | | | 28 | | |
Ford Motor Co. (d) | | | 368 | | | | 4 | | |
Franklin Resources, Inc. (d) | | | 27 | | | | 3 | | |
Freeport-McMoRan Copper & Gold, Inc. | | | 709 | | | | 28 | | |
Frontier Communications Corp. (d) | | | 1,575 | | | | 8 | | |
Gannett Co., Inc. (d) | | | 333 | | | | 6 | | |
Gap, Inc. (The) | | | 574 | | | | 21 | | |
General Dynamics Corp. | | | 438 | | | | 29 | | |
General Electric Co. | | | 5,639 | | | | 128 | | |
General Mills, Inc. (d) | | | 793 | | | | 32 | | |
Genuine Parts Co. (d) | | | 111 | | | | 7 | | |
Gilead Sciences, Inc. (d)(e) | | | 721 | | | | 48 | | |
Goldman Sachs Group, Inc. (The) (d) | | | 756 | | | | 86 | | |
Google, Inc., Class A (e) | | | 271 | | | | 204 | | |
H&R Block, Inc. (d) | | | 573 | | | | 10 | | |
H.J. Heinz Co. (d) | | | 481 | | | | 27 | | |
Halliburton Co. (d) | | | 1,210 | | | | 41 | | |
Harman International Industries, Inc. (d) | | | 43 | | | | 2 | | |
Hartford Financial Services Group, Inc. (d) | | | 428 | | | | 8 | | |
| | | Shares | | Value
(000) | |
Hasbro, Inc. (d) | | | 176 | | | $ | 7 | | |
HCP, Inc. REIT | | | 470 | | | | 21 | | |
Health Care , Inc. REIT | | | 130 | | | | 8 | | |
Hershey Co. (The) | | | 111 | | | | 8 | | |
Hess Corp. | | | 57 | | | | 3 | | |
Hewlett-Packard Co. (d) | | | 2,235 | | | | 38 | | |
Hillshire Brands Co. (d) | | | 83 | | | | 2 | | |
Home Depot, Inc. | | | 1,131 | | | | 68 | | |
Honeywell International, Inc. | | | 1,202 | | | | 72 | | |
Hospira, Inc. (d)(e) | | | 567 | | | | 19 | | |
Host Hotels & Resorts, Inc. REIT (d) | | | 620 | | | | 10 | | |
Hudson City Bancorp, Inc. | | | 222 | | | | 2 | | |
Huntington Bancshares, Inc. | | | 1,000 | | | | 7 | | |
Huntington Ingalls Industries, Inc. (d)(e) | | | 59 | | | | 2 | | |
Illinois Tool Works, Inc. (d) | | | 652 | | | | 39 | | |
Intel Corp. (d) | | | 4,566 | | | | 104 | | |
International Business Machines Corp. | | | 1,205 | | | | 250 | | |
International Flavors & Fragrances, Inc. | | | 21 | | | | 1 | | |
International Game Technology (d) | | | 662 | | | | 9 | | |
International Paper Co. | | | 250 | | | | 9 | | |
Interpublic Group of Cos., Inc. (The) (d) | | | 483 | | | | 5 | | |
Intuit, Inc. (d) | | | 396 | | | | 23 | | |
Intuitive Surgical, Inc. (d)(e) | | | 39 | | | | 19 | | |
Invesco Ltd. | | | 433 | | | | 11 | | |
Iron Mountain, Inc. (d) | | | 118 | | | | 4 | | |
ITT Corp. (d) | | | 219 | | | | 4 | | |
Jabil Circuit, Inc. (d) | | | 222 | | | | 4 | | |
Jacobs Engineering Group, Inc. (d)(e) | | | 111 | | | | 4 | | |
Janus Capital Group, Inc. (d) | | | 111 | | | | 1 | | |
JC Penney Co., Inc. (d) | | | 222 | | | | 5 | | |
JM Smucker Co. (The) | | | 137 | | | | 12 | | |
Johnson & Johnson | | | 2,727 | | | | 188 | | |
JPMorgan Chase & Co. (d) | | | 5,153 | | | | 209 | | |
Juniper Networks, Inc. (d)(e) | | | 488 | | | | 8 | | |
KB Home (d) | | | 1,000 | | | | 14 | | |
Kellogg Co. | | | 291 | | | | 15 | | |
KeyCorp | | | 840 | | | | 7 | | |
Kimberly-Clark Corp. | | | 546 | | | | 47 | | |
Kimco Realty Corp. REIT (d) | | | 571 | | | | 12 | | |
KLA-Tencor Corp. (d) | | | 47 | | | | 2 | | |
Kohl's Corp. (d) | | | 217 | | | | 11 | | |
Kraft Foods, Inc., Class A | | | 1,727 | | | | 71 | | |
Kroger Co. (The) (d) | | | 624 | | | | 15 | | |
L-3 Communications Holdings, Inc. (d) | | | 111 | | | | 8 | | |
Laboratory Corp. of America Holdings (d)(e) | | | 92 | | | | 9 | | |
Legg Mason, Inc. (d) | | | 269 | | | | 7 | | |
Lennar Corp., Class A (d) | | | 2,300 | | | | 80 | | |
Leucadia National Corp. (d) | | | 26 | | | | 1 | | |
Lexmark International, Inc., Class A (d) | | | 111 | | | | 2 | | |
Life Technologies Corp. (d)(e) | | | 183 | | | | 9 | | |
Linear Technology Corp. | | | 228 | | | | 7 | | |
Lockheed Martin Corp. (d) | | | 180 | | | | 17 | | |
Loews Corp. | | | 586 | | | | 24 | | |
The accompanying notes are an integral part of the financial statements.
16
Morgan Stanley Institutional Fund Trust
Annual Report — September 30, 2012
Portfolio of Investments (cont'd)
Global Strategist Portfolio
| | | Shares | | Value
(000) | |
United States (cont'd) | |
Lorillard, Inc. (d) | | | 111 | | | $ | 13 | | |
Lowe's Cos., Inc. (d) | | | 871 | | | | 26 | | |
LSI Corp. (d)(e) | | | 534 | | | | 4 | | |
Ltd. Brands, Inc. (d) | | | 247 | | | | 12 | | |
M&T Bank Corp. (d) | | | 82 | | | | 8 | | |
Macy's, Inc. | | | 273 | | | | 10 | | |
Marathon Oil Corp. | | | 544 | | | | 16 | | |
Marathon Petroleum Corp. | | | 278 | | | | 15 | | |
Marriott International, Inc., Class A (d) | | | 242 | | | | 9 | | |
Marriott Vacations Worldwide Corp. (d)(e) | | | 34 | | | | 1 | | |
Marsh & McLennan Cos., Inc. | | | 586 | | | | 20 | | |
Masco Corp. (d) | | | 1,400 | | | | 21 | | |
Mastercard, Inc., Class A | | | 26 | | | | 12 | | |
Mattel, Inc. | | | 408 | | | | 14 | | |
McDonald's Corp. | | | 604 | | | | 55 | | |
McGraw-Hill Cos., Inc. (The) (d) | | | 394 | | | | 22 | | |
McKesson Corp. | | | 243 | | | | 21 | | |
MDC Holdings, Inc. (d) | | | 625 | | | | 24 | | |
Mead Johnson Nutrition Co. (d) | | | 249 | | | | 18 | | |
Medtronic, Inc. | | | 734 | | | | 32 | | |
Merck & Co., Inc. | | | 3,069 | | | | 138 | | |
Meritage Homes Corp. (e) | | | 400 | | | | 15 | | |
MetLife, Inc. (d) | | | 870 | | | | 30 | | |
MetroPCS Communications, Inc. (e) | | | 333 | | | | 4 | | |
Microchip Technology, Inc. | | | 161 | | | | 5 | | |
Micron Technology, Inc. (d)(e) | | | 753 | | | | 5 | | |
Microsoft Corp. | | | 6,774 | | | | 202 | | |
Mohawk Industries, Inc. (e) | | | 300 | | | | 24 | | |
Molex, Inc. (d) | | | 71 | | | | 2 | | |
Molson Coors Brewing Co. (d) | | | 222 | | | | 10 | | |
Monsanto Co. | | | 467 | | | | 43 | | |
Moody's Corp. (d) | | | 121 | | | | 5 | | |
Mosaic Co. (The) | | | 58 | | | | 3 | | |
Motorola Solutions, Inc. | | | 187 | | | | 9 | | |
Murphy Oil Corp. | | | 172 | | | | 9 | | |
NASDAQ OMX Group, Inc. (The) (d) | | | 40 | | | | 1 | | |
National Oilwell Varco, Inc. | | | 731 | | | | 59 | | |
NetApp, Inc. (e) | | | 441 | | | | 14 | | |
NetFlix, Inc. (d)(e) | | | 111 | | | | 6 | | |
Newfield Exploration Co. (e) | | | 197 | | | | 6 | | |
Newmont Mining Corp. | | | 270 | | | | 15 | | |
News Corp., Class A | | | 2,243 | | | | 55 | | |
NextEra Energy, Inc. (d) | | | 472 | | | | 33 | | |
NIKE, Inc., Class B | | | 227 | | | | 22 | | |
NiSource, Inc. | | | 64 | | | | 2 | | |
Noble Corp. (e) | | | 429 | | | | 15 | | |
Noble Energy, Inc. (d) | | | 174 | | | | 16 | | |
Nordstrom, Inc. (d) | | | 68 | | | | 4 | | |
Norfolk Southern Corp. | | | 222 | | | | 14 | | |
Northern Trust Corp. (d) | | | 33 | | | | 2 | | |
Northrop Grumman Corp. (d) | | | 136 | | | | 9 | | |
Nucor Corp. (d) | | | 97 | | | | 4 | | |
| | | Shares | | Value
(000) | |
NVIDIA Corp. (e) | | | 507 | | | $ | 7 | | |
NVR, Inc. (e) | | | 100 | | | | 84 | | |
NYSE Euronext | | | 257 | | | | 6 | | |
O'Reilly Automotive, Inc. (d)(e) | | | 38 | | | | 3 | | |
Occidental Petroleum Corp. | | | 854 | | | | 73 | | |
Omnicom Group, Inc. (d) | | | 263 | | | | 14 | | |
Oracle Corp. | | | 3,358 | | | | 106 | | |
Owens Corning (d)(e) | | | 500 | | | | 17 | | |
PACCAR, Inc. | | | 172 | | | | 7 | | |
Patterson Cos., Inc. | | | 176 | | | | 6 | | |
Paychex, Inc. (d) | | | 378 | | | | 13 | | |
Peabody Energy Corp. (d) | | | 612 | | | | 14 | | |
People's United Financial, Inc. (d) | | | 667 | | | | 8 | | |
Pepco Holdings, Inc. (d) | | | 94 | | | | 2 | | |
PepsiCo, Inc. | | | 1,183 | | | | 84 | | |
Pfizer, Inc. | | | 8,665 | | | | 215 | | |
PG&E Corp. | | | 583 | | | | 25 | | |
Philip Morris International, Inc. | | | 1,348 | | | | 121 | | |
Phillips 66 | | | 449 | | | | 21 | | |
Pioneer Natural Resources Co. (d) | | | 197 | | | | 21 | | |
Pitney Bowes, Inc. (d) | | | 254 | | | | 4 | | |
Plum Creek Timber Co., Inc. REIT (d) | | | 193 | | | | 8 | | |
PNC Financial Services Group, Inc. | | | 659 | | | | 42 | | |
PPG Industries, Inc. | | | 123 | | | | 14 | | |
PPL Corp. | | | 583 | | | | 17 | | |
Praxair, Inc. | | | 188 | | | | 20 | | |
Precision Castparts Corp. | | | 206 | | | | 34 | | |
Priceline.com, Inc. (d)(e) | | | 41 | | | | 25 | | |
Procter & Gamble Co. (The) | | | 3,241 | | | | 225 | | |
Progressive Corp. (The) (d) | | | 459 | | | | 10 | | |
ProLogis, Inc. REIT (d) | | | 593 | | | | 21 | | |
Prudential Financial, Inc. (d) | | | 200 | | | | 11 | | |
Public Service Enterprise Group, Inc. (d) | | | 621 | | | | 20 | | |
Public Storage REIT | | | 126 | | | | 18 | | |
Pulte Group, Inc. (d)(e) | | | 4,800 | | | | 74 | | |
Qualcomm, Inc. | | | 1,677 | | | | 105 | | |
Quest Diagnostics, Inc. (d) | | | 43 | | | | 3 | | |
Ralph Lauren Corp. (d) | | | 47 | | | | 7 | | |
Raytheon Co. (d) | | | 56 | | | | 3 | | |
Regions Financial Corp. | | | 1,891 | | | | 14 | | |
Republic Services, Inc. (d) | | | 273 | | | | 8 | | |
Reynolds American, Inc. (d) | | | 609 | | | | 26 | | |
Rockwell Collins, Inc. (d) | | | 194 | | | | 10 | | |
Ross Stores, Inc. (d) | | | 76 | | | | 5 | | |
RR Donnelley & Sons Co. (d) | | | 287 | | | | 3 | | |
Ryland Group, Inc. (The) (d) | | | 500 | | | | 15 | | |
Safeway, Inc. (d) | | | 524 | | | | 8 | | |
Salesforce.com, Inc. (d)(e) | | | 237 | | | | 36 | | |
SanDisk Corp. (e) | | | 178 | | | | 8 | | |
Schlumberger Ltd. | | | 2,330 | | | | 169 | | |
Scripps Networks Interactive, Inc., Class A (d) | | | 111 | | | | 7 | | |
Sempra Energy | | | 228 | | | | 15 | | |
Sherwin-Williams Co. (The) (d) | | | 21 | | | | 3 | | |
The accompanying notes are an integral part of the financial statements.
17
Morgan Stanley Institutional Fund Trust
Annual Report — September 30, 2012
Portfolio of Investments (cont'd)
Global Strategist Portfolio
| | | Shares | | Value
(000) | |
United States (cont'd) | |
Sigma-Aldrich Corp. (d) | | | 43 | | | $ | 3 | | |
Simon Property Group, Inc. REIT (d) | | | 447 | | | | 68 | | |
SLM Corp. | | | 271 | | | | 4 | | |
Southern Co. (The) (d) | | | 1,654 | | | | 76 | | |
Southwest Airlines Co. (d) | | | 778 | | | | 7 | | |
Southwestern Energy Co. (d)(e) | | | 756 | | | | 26 | | |
Spectra Energy Corp. | | | 604 | | | | 18 | | |
Sprint Nextel Corp. (d)(e) | | | 1,869 | | | | 10 | | |
St. Jude Medical, Inc. (d) | | | 510 | | | | 21 | | |
Standard Pacific Corp. (d)(e) | | | 4,418 | | | | 30 | | |
Stanley Black & Decker, Inc. | | | 43 | | | | 3 | | |
Staples, Inc. (d) | | | 579 | | | | 7 | | |
Starbucks Corp. (d) | | | 779 | | | | 40 | | |
Starwood Hotels & Resorts Worldwide, Inc. | | | 83 | | | | 5 | | |
State Street Corp. | | | 562 | | | | 24 | | |
Stericycle, Inc. (d)(e) | | | 21 | | | | 2 | | |
Stryker Corp. (d) | | | 422 | | | | 23 | | |
SunTrust Banks, Inc. (d) | | | 664 | | | | 19 | | |
Symantec Corp. (e) | | | 636 | | | | 11 | | |
Sysco Corp. (d) | | | 817 | | | | 26 | | |
T. Rowe Price Group, Inc. (d) | | | 72 | | | | 5 | | |
Target Corp. | | | 660 | | | | 42 | | |
Tenet Healthcare Corp. (e) | | | 924 | | | | 6 | | |
Texas Instruments, Inc. (d) | | | 1,158 | | | | 32 | | |
Textron, Inc. (d) | | | 433 | | | | 11 | | |
Thermo Fisher Scientific, Inc. | | | 564 | | | | 33 | | |
Tiffany & Co. | | | 38 | | | | 2 | | |
Time Warner Cable, Inc. (d) | | | 484 | | | | 46 | | |
Time Warner, Inc. (d) | | | 991 | | | | 45 | | |
TJX Cos., Inc. | | | 811 | | | | 36 | | |
Toll Brothers, Inc. (d)(e) | | | 2,000 | | | | 66 | | |
Travelers Cos., Inc. (The) (d) | | | 528 | | | | 36 | | |
TripAdvisor, Inc. (d)(e) | | | 112 | | | | 4 | | |
Tyco International Ltd. | | | 222 | | | | 12 | | |
Tyson Foods, Inc., Class A (d) | | | 444 | | | | 7 | | |
Union Pacific Corp. | | | 538 | | | | 64 | | |
United Parcel Service, Inc., Class B | | | 826 | | | | 59 | | |
United States Steel Corp. (d) | | | 111 | | | | 2 | | |
United Technologies Corp. | | | 1,177 | | | | 92 | | |
UnitedHealth Group, Inc. | | | 600 | | | | 33 | | |
US Bancorp | | | 2,235 | | | | 77 | | |
Valero Energy Corp. | | | 488 | | | | 15 | | |
Varian Medical Systems, Inc. (d)(e) | | | 176 | | | | 11 | | |
Ventas, Inc. REIT | | | 273 | | | | 17 | | |
Verizon Communications, Inc. | | | 2,524 | | | | 115 | | |
VF Corp. (d) | | | 21 | | | | 3 | | |
Viacom, Inc., Class B | | | 789 | | | | 42 | | |
Visa, Inc., Class A (d) | | | 494 | | | | 66 | | |
Vornado Realty Trust REIT | | | 131 | | | | 11 | | |
Wal-Mart Stores, Inc. | | | 1,952 | | | | 144 | | |
Walgreen Co. (d) | | | 387 | | | | 14 | | |
Walt Disney Co. (The) | | | 1,873 | | | | 98 | | |
| | | Shares | | Value
(000) | |
Waste Management, Inc. (d) | | | 777 | | | $ | 25 | | |
Watsco, Inc. (d) | | | 100 | | | | 8 | | |
WellPoint, Inc. (d) | | | 243 | | | | 14 | | |
Wells Fargo & Co. | | | 5,604 | | | | 194 | | |
Western Union Co. (The) (d) | | | 767 | | | | 14 | | |
Weyerhaeuser Co. REIT (d) | | | 586 | | | | 15 | | |
Whole Foods Market, Inc. (d) | | | 550 | | | | 54 | | |
Williams Cos., Inc. (The) | | | 632 | | | | 22 | | |
Wisconsin Energy Corp. | | | 383 | | | | 14 | | |
WPX Energy, Inc. (d)(e) | | | 251 | | | | 4 | | |
Wyndham Worldwide Corp. | | | 308 | | | | 16 | | |
Wynn Resorts Ltd. | | | 21 | | | | 2 | | |
Xcel Energy, Inc. | | | 621 | | | | 17 | | |
Xerox Corp. | | | 1,027 | | | | 8 | | |
Xilinx, Inc. (d) | | | 243 | | | | 8 | | |
Xylem, Inc. (d) | | | 427 | | | | 11 | | |
Yahoo!, Inc. (e) | | | 624 | | | | 10 | | |
Yum! Brands, Inc. | | | 460 | | | | 31 | | |
Zimmer Holdings, Inc. (d) | | | 224 | | | | 15 | | |
Zions Bancorporation (d) | | | 222 | | | | 5 | | |
| | | | 12,258 | | |
Total Common Stocks (Cost $18,599) | | | 19,322 | | |
Commodity Linked Security (1.5%) | |
United States (1.5%) | |
Deutsche Bank AG, S&P GSCI Gold Index —
Total Return, Zero Coupon,
10/15/13 (b) (Cost $640) | | | 640,000 | | | | 669 | | |
Convertible Preferred Stock (0.2%) | |
United States (0.2%) | |
Alternative Energy (0.2%) | |
Better Place, Inc. (e)(f)(g)
(acquisition cost — $84;
acquired 1/25/10) (Cost $84) | | | 33,466 | | | | 100 | | |
Investment Companies (1.0%) | |
United States (1.0%) | |
iShares MSCI EMU Index Fund | | | 200 | | | | 6 | | |
Morgan Stanley Institutional Fund, Inc. —
Emerging Markets Portfolio (See Note G) | | | 4,388 | | | | 109 | | |
Technology Select Sector SPDR Fund (d) | | | 11,100 | | | | 342 | | |
Total Investment Companies (Cost $426) | | | 457 | | |
| | | No. of
Rights | | | |
Rights (0.0%) | |
France (0.0%) | |
| Sanofi (France) (d)(e) (Cost $—) | | | 60 | | | | — | @ | |
| | | Shares | | | |
Short-Term Investments (23.7%) | |
Securities held as Collateral on Loaned Securities (13.4%) | |
Investment Company (10.0%) | |
Morgan Stanley Institutional Liquidity
Funds — Money Market Portfolio —
Institutional Class (See Note G) | | | 4,423,591 | | | | 4,424 | | |
The accompanying notes are an integral part of the financial statements.
18
Morgan Stanley Institutional Fund Trust
Annual Report — September 30, 2012
Portfolio of Investments (cont'd)
Global Strategist Portfolio
| | | Face
Amount
(000) | | Value
(000) | |
Repurchase Agreements (3.4%) | |
Barclays Capital, Inc., (0.15%,
dated 9/28/12, due 10/1/12; proceeds $468;
fully collateralized by a U.S. Government
Obligation; U.S. Treasury Note 0.75%
due 6/30/17; valued at $478) | | $ | 468 | | | $ | 468 | | |
Merrill Lynch & Co., Inc., (0.15%,
dated 9/28/12, due 10/1/12; proceeds $172;
fully collateralized by a U.S. Government
Obligation; U.S. Treasury Note 1.75%
due 5/15/22; valued at $176) | | | 172 | | | | 172 | | |
Merrill Lynch & Co., Inc., (0.22%,
dated 9/28/12, due 10/1/12; proceeds $887;
fully collateralized by a U.S. Government
Agency; Federal National Mortgage
Association 4.00% due 4/1/42;
valued at $905) | | | 887 | | | | 887 | | |
| | | | 1,527 | | |
Total Securities held as Collateral on Loaned
Securities (Cost $5,951) | | | 5,951 | | |
| | | Shares | | | |
Investment Company (10.3%) | |
Morgan Stanley Institutional Liquidity
Funds — Money Market Portfolio —
Institutional Class (See Note G)
(Cost $4,579) | | | 4,579,229 | | | | 4,579 | | |
Total Short-Term Investments (Cost $10,530) | | | 10,530 | | |
Total Investments (112.5%) (Cost $48,268)
Including $5,773 of Securities Loaned (h) | | | 49,796 | | |
Liabilities in Excess of Other Assets (-12.5%) | | | (5,531 | ) | |
Net Assets (100.0%) | | $ | 44,265 | | |
(a) Security is subject to delayed delivery.
(b) 144A security — Certain conditions for public sale may exist. Unless otherwise noted, these securities are deemed to be liquid.
(c) Variable/Floating Rate Security — Interest rate changes on these instruments are based on changes in a designated base rate. The rates shown are those in effect on September 30, 2012.
(d) All or a portion of this security was on loan at September 30, 2012.
(e) Non-income producing security.
(f) Security cannot be offered for public resale without first being registered under the Securities Act of 1933 and related rules ("restricted security"). Acquisition date represents the day on which an enforceable right to acquire such security is obtained and is presented along with related cost in the security description. The fund has registration rights for certain restricted securities. Any costs related to such registration are borne by the issuer. The aggregate value of restricted securities (excluding 144A holdings) at September 30, 2012 amounts to approximately $100,000 and represents 0.2% of net assets.
(g) At September 30, 2012, the Portfolio held fair valued securities valued at approximately $100,000, representing 0.2% of net assets. These securities have been fair valued as determined in good faith under procedures established by and under the general supervision of the Fund's Trustees.
(h) Securities are available for collateral in connection with securities purchased on a forward commitment basis, open foreign currency exchange contracts, futures contracts and swap agreements.
@ Value is less than $500.
BTAN Bons du Trésor à Intérets Annuels (Treasury Bill Annual Interest).
IO Interest Only.
MTN Medium Term Note.
OAT Obligations Assimilables du Trésor (French Treasury Obligation).
PAC Planned Amortization Class.
REIT Real Estate Investment Trust.
REMIC Real Estate Mortgage Investment Conduit.
SPDR Standard & Poor's Depository Receipt.
TBA To Be Announced.
Foreign Currency Exchange Contracts Information:
The Portfolio had the following foreign currency exchange contracts open at September 30, 2012:
Counterparty | | Currency to
Deliver
(000) | | Value
(000) | | Settlement
Date | | In Exchange
For
(000) | | Value
(000) | | Unrealized
Appreciation
(Depreciation)
(000) | |
Deutsche Bank AG London | | AUD | 948 | | | $ | 982 | | | 10/18/12 | | USD | 988 | | | $ | 988 | | | $ | 6 | | |
Deutsche Bank AG London | | CAD | 345 | | | | 351 | | | 10/18/12 | | USD | 354 | | | | 354 | | | | 3 | | |
Deutsche Bank AG London | | JPY | 63,255 | | | | 811 | | | 10/18/12 | | USD | 805 | | | | 805 | | | | (6 | ) | |
Deutsche Bank AG London | | USD | 2,134 | | | | 2,134 | | | 10/18/12 | | EUR | 1,634 | | | | 2,100 | | | | (34 | ) | |
Deutsche Bank AG London | | USD | 1,129 | | | | 1,129 | | | 10/18/12 | | GBP | 695 | | | | 1,122 | | | | (7 | ) | |
Deutsche Bank AG London | | USD | 494 | | | | 494 | | | 10/18/12 | | HKD | 3,832 | | | | 494 | | | | (— | @) | |
Goldman Sachs International | | EUR | 648 | | | | 834 | | | 10/18/12 | | USD | 847 | | | | 847 | | | | 13 | | |
Goldman Sachs International | | EUR | 155 | | | | 200 | | | 10/18/12 | | USD | 200 | | | | 200 | | | | — | @ | |
Goldman Sachs International | | USD | 102 | | | | 102 | | | 10/18/12 | | CAD | 99 | | | | 101 | | | | (1 | ) | |
Goldman Sachs International | | USD | 467 | | | | 467 | | | 10/18/12 | | EUR | 362 | | | | 465 | | | | (2 | ) | |
JPMorgan Chase Bank | | EUR | 1,877 | | | | 2,412 | | | 10/18/12 | | USD | 2,430 | | | | 2,430 | | | | 18 | | |
JPMorgan Chase Bank | | USD | 81 | | | | 81 | | | 10/18/12 | | NOK | 464 | | | | 81 | | | | (— | @) | |
JPMorgan Chase Bank | | USD | 268 | | | | 268 | | | 10/18/12 | | SEK | 1,759 | | | | 268 | | | | — | @ | |
Mellon Bank | | AUD | 2,065 | | | | 2,140 | | | 10/18/12 | | USD | 2,152 | | | | 2,152 | | | | 12 | | |
State Street Bank and Trust Co. | | CHF | 667 | | | | 710 | | | 10/18/12 | | USD | 719 | | | | 719 | | | | 9 | | |
State Street Bank and Trust Co. | | DKK | 660 | | | | 114 | | | 10/18/12 | | USD | 116 | | | | 116 | | | | 2 | | |
State Street Bank and Trust Co. | | NOK | 532 | | | | 93 | | | 10/18/12 | | USD | 93 | | | | 93 | | | | — | @ | |
State Street Bank and Trust Co. | | USD | 279 | | | | 279 | | | 10/18/12 | | EUR | 214 | | | | 275 | | | | (4 | ) | |
The accompanying notes are an integral part of the financial statements.
19
Morgan Stanley Institutional Fund Trust
Annual Report — September 30, 2012
Portfolio of Investments (cont'd)
Global Strategist Portfolio
Foreign Currency Exchange Contracts Information: (cont'd)
Counterparty | | Currency to
Deliver
(000) | | Value
(000) | | Settlement
Date | | In Exchange
For
(000) | | Value
(000) | | Unrealized
Appreciation
(Depreciation)
(000) | |
State Street Bank and Trust Co. | | USD | 177 | | | $ | 177 | | | 10/18/12 | | JPY | 13,943 | | | $ | 178 | | | $ | 1 | | |
State Street Bank and Trust Co. | | USD | 191 | | | | 191 | | | 10/18/12 | | SEK | 1,253 | | | | 191 | | | | — | @ | |
UBS AG | | EUR | 949 | | | | 1,219 | | | 10/18/12 | | USD | 1,239 | | | | 1,239 | | | | 20 | | |
UBS AG | | GBP | 56 | | | | 90 | | | 10/18/12 | | USD | 91 | | | | 91 | | | | 1 | | |
UBS AG | | USD | 1,267 | | | | 1,267 | | | 10/18/12 | | CHF | 1,175 | | | | 1,251 | | | | (16 | ) | |
UBS AG | | USD | 85 | | | | 85 | | | 10/18/12 | | JPY | 6,660 | | | | 86 | | | | 1 | | |
UBS AG | | USD | 292 | | | | 292 | | | 10/18/12 | | SEK | 1,917 | | | | 292 | | | | — | @ | |
Westpac Banking Corporation | | USD | 82 | | | | 82 | | | 10/23/12 | | JPY | 6,400 | | | | 82 | | | | (— | @) | |
JPMorgan Chase Bank | | MXN | 1,195 | | | | 93 | | | 10/31/12 | | USD | 92 | | | | 92 | | | | (1 | ) | |
JPMorgan Chase Bank | | PLN | 402 | | | | 125 | | | 10/31/12 | | USD | 129 | | | | 129 | | | | 4 | | |
JPMorgan Chase Bank | | USD | 140 | | | | 140 | | | 10/31/12 | | CAD | 137 | | | | 139 | | | | (1 | ) | |
JPMorgan Chase Bank | | USD | 175 | | | | 175 | | | 10/31/12 | | GBP | 108 | | | | 174 | | | | (1 | ) | |
JPMorgan Chase Bank | | USD | 12 | | | | 12 | | | 10/31/12 | | SEK | 77 | | | | 12 | | | | (— | @) | |
JPMorgan Chase Bank | | ZAR | 164 | | | | 20 | | | 10/31/12 | | USD | 20 | | | | 20 | | | | — | @ | |
UBS AG | | AUD | 66 | | | | 69 | | | 10/31/12 | | USD | 69 | | | | 69 | | | | — | @ | |
UBS AG | | USD | 19 | | | | 19 | | | 10/31/12 | | CZK | 357 | | | | 18 | | | | (1 | ) | |
UBS AG | | USD | 18 | | | | 18 | | | 10/31/12 | | DKK | 104 | | | | 18 | | | | (— | @) | |
UBS AG | | USD | 868 | | | | 868 | | | 10/31/12 | | EUR | 662 | | | | 851 | | | | (17 | ) | |
UBS AG | | USD | 65 | | | | 65 | | | 10/31/12 | | KRW | 73,519 | | | | 66 | | | | 1 | | |
UBS AG | | USD | 58 | | | | 58 | | | 10/31/12 | | NOK | 333 | | | | 58 | | | | (— | @) | |
UBS AG | | USD | 109 | | | | 109 | | | 10/31/12 | | SGD | 133 | | | | 108 | | | | (1 | ) | |
Wells Fargo Bank | | USD | 1,013 | | | | 1,013 | | | 10/31/12 | | JPY | 79,724 | | | | 1,022 | | | | 9 | | |
JPMorgan Chase Bank | | CNY | 8,029 | | | | 1,251 | | | 8/12/13 | | USD | 1,246 | | | | 1,246 | | | | (5 | ) | |
| | | | | $ | 21,039 | | | | | | | $ | 21,042 | | | $ | 3 | | |
Futures Contracts:
The Portfolio had the following futures contracts open at September 30, 2012:
| | | Number
of
Contracts | | Value
(000) | | Expiration
Date | | Unrealized
Appreciation
(Depreciation)
(000) | |
Long: | |
AEX Index (Netherlands) | | | 3 | | | $ | 251 | | | Oct-12 | | $ | (10 | ) | |
ASX Spi 200 Index (Australia) | | | 2 | | | | 228 | | | Dec-12 | | | 2 | | |
Australian 10 yr. Bond (Australia) | | | 10 | | | | 1,318 | | | Dec-12 | | | 20 | | |
CAC 40 Index (France) | | | 35 | | | | 1,511 | | | Oct-12 | | | (71 | ) | |
DAX Index (Germany) | | | 5 | | | | 1,165 | | | Dec-12 | | | (7 | ) | |
E-mini MSCI Emerging Market Index (United States) | | | 69 | | | | 3,429 | | | Dec-12 | | | (41 | ) | |
Euro STOXX 50 Index (Germany) | | | 26 | | | | 822 | | | Dec-12 | | | (36 | ) | |
FTSE 100 Index (United Kingdom) | | | 7 | | | | 646 | | | Dec-12 | | | (16 | ) | |
FTSE MIB Index (Italy) | | | 7 | | | | 678 | | | Dec-12 | | | (32 | ) | |
Hang Seng China Index (Hong Kong) | | | 2 | | | | 269 | | | Oct-12 | | | 2 | | |
IBEX 35 Index (Spain) | | | 8 | | | | 791 | | | Oct-12 | | | (33 | ) | |
NIKKEI 225 Index (Japan) | | | 11 | | | | 625 | | | Dec-12 | | | 16 | | |
OMX 30 (Sweden) | | | 19 | | | | 311 | | | Oct-12 | | | (9 | ) | |
S&P 500 E MINI Index (United States) | | | 13 | | | | 932 | | | Dec-12 | | | (1 | ) | |
SGX MSCI Singapore (Singapore) | | | 5 | | | | 287 | | | Oct-12 | | | (— | @) | |
TOPIX Index (Japan) | | | 2 | | | | 189 | | | Dec-12 | | | 5 | | |
U.S. Treasury 10 yr. Note (United States) | | | 3 | | | | 400 | | | Dec-12 | | | (— | @) | |
U.S. Treasury 2 yr. Note (United States) | | | 5 | | | | 1,103 | | | Dec-12 | | | 1 | | |
U.S. Treasury 5 yr. Note (United States) | | | 13 | | | | 1,620 | | | Dec-12 | | | 5 | | |
Short: | |
Copper High Grade Index (United States) | | | 4 | | | | (376 | ) | | Dec-12 | | | — | @ | |
German Euro Bond (Germany) | | | 12 | | | | (2,190 | ) | | Dec-12 | | | (2 | ) | |
U.S. Treasury 10 yr. Note (United States) | | | 8 | | | | (1,068 | ) | | Dec-12 | | | (6 | ) | |
U.S. Treasury 2 yr. Note (United States) | | | 28 | | | | (6,175 | ) | | Dec-12 | | | (2 | ) | |
| | | | | | | | | $ | (215 | ) | |
The accompanying notes are an integral part of the financial statements.
20
Morgan Stanley Institutional Fund Trust
Annual Report — September 30, 2012
Portfolio of Investments (cont'd)
Global Strategist Portfolio
Interest Rate Swap Agreements:
The Portfolio had the following interest rate swap agreements open at September 30, 2012:
Swap Counterparty | | Floating Rate
Index | | Pay/Receive
Floating Rate | | Fixed Rate | | Termination
Date | | Notional
Amount
(000) | | Unrealized
Appreciation
(Depreciation)
(000) | |
Barclays Capital | | 3 Month LIBOR | | Receive | | | 0.81 | % | | 9/24/17 | | $ | 330 | | | $ | (1 | ) | |
Credit Suisse | | 3 Month LIBOR | | Receive | | | 0.39 | | | 9/25/14 | | | 1,050 | | | | (1 | ) | |
Credit Suisse | | 3 Month LIBOR | | Receive | | | 0.82 | | | 9/13/17 | | | 500 | | | | (1 | ) | |
Deutsche Bank | | 3 Month LIBOR | | Receive | | | 0.82 | | | 7/24/17 | | | 817 | | | | (4 | ) | |
Goldman Sachs | | 3 Month CDOR | | Pay | | | 1.75 | | | 8/1/16 | | CAD | 1,660 | | | | 3 | | |
Goldman Sachs | | 3 Month LIBOR | | Receive | | | 0.83 | | | 8/3/16 | | $ | 1,620 | | | | (3 | ) | |
| | | | | | | | | | | | | $ | (7 | ) | |
Total Return Swap Agreements:
The Portfolio had the following total return swap agreements open at September 30, 2012:
Swap Counterparty | | Index | | Notional
Amount
(000) | | Floating
Rate | | Pay/Receive
Total Return
of Referenced
Index | | Maturity
Date | | Unrealized
Appreciation
(Depreciation)
(000) | |
Goldman Sachs
International | | Goldman Sachs
Custom Machinery Index | | $ | 196 | | | 1-Month USD-LIBOR-minus
0.47% | | Pay | | 5/13/13 | | $ | 2 | | |
Goldman Sachs
International | | Goldman Sachs
Custom Machinery Index | | | 619 | | | 1-Month USD-LIBOR-minus
0.47% | | Pay | | 5/13/13 | | | 6 | | |
Goldman Sachs
International | | Goldman Sachs
Custom Machinery Index | | | 93 | | | 1-Month USD-LIBOR-minus
0.47% | | Pay | | 5/13/13 | | | 1 | | |
Goldman Sachs
International | | Goldman Sachs
Custom Machinery Index | | | 95 | | | 1-Month USD-LIBOR-minus
0.47% | | Pay | | 5/13/13 | | | 1 | | |
Goldman Sachs
International | | Goldman Sachs
Custom Machinery Index | | | 205 | | | 1-Month USD-LIBOR-minus
0.47% | | Pay | | 5/13/13 | | | 2 | | |
Goldman Sachs
International | | Goldman Sachs
Custom Miners Index | | | 630 | | | 3-Month USD-LIBOR-minus
0.53% | | Pay | | 8/21/13 | | | 1 | | |
Goldman Sachs
International | | Goldman Sachs
Luxury Custom Basket Index | | | 432 | | | 3-Month USD-LIBOR-minus
0.55% | | Pay | | 5/29/13 | | | 25 | | |
Bank of America
NA | | Merrill Lynch Custom
Luxury Basket Index | | | 424 | | | 3-Month USD-LIBOR-minus
0.15% | | Pay | | 5/29/13 | | | 23 | | |
Bank of America
NA | | Merrill Lynch Custom
Luxury Basket Index | | | 432 | | | 3-Month USD-LIBOR-minus
0.15% | | Pay | | 5/29/13 | | | 23 | | |
JPMorgan
Chase | | MSCI Daily Total Return
Europe Net Food Beverage &
Tobacco Index | | | 570 | | | 3-Month USD-LIBOR-minus
0.22% | | Pay | | 8/26/13 | | | (6 | ) | |
JPMorgan
Chase | | MSCI Daily Total Return
Europe Net Household &
Personal Products Index | | | 60 | | | 3-Month USD-LIBOR-minus
0.39% | | Pay | | 8/26/13 | | | (1 | ) | |
JPMorgan
Chase | | MSCI Daily Total Return
Net Industrials Index | | | 630 | | | 3-Month USD-LIBOR-minus
0.45% | | Pay | | 8/26/13 | | | (7 | ) | |
| | | | | | | | | | | | | | | | | | | | | | | | | $ | 70 | | |
@ Value is less than $500.
CDOR Canadian Dealer Offered Rate.
LIBOR London Interbank Offered Rate.
AUD — Australian Dollar
CAD — Canadian Dollar
CHF — Swiss Franc
CNY — Chinese Yuan Renminbi
CZK — Czech Koruna
DKK — Danish Krone
EUR — Euro
GBP — British Pound
HKD — Hong Kong Dollar
JPY — Japanese Yen
KRW — South Korean Won
MXN — Mexican New Peso
NOK — Norwegian Krone
PLN — Polish Zloty
SEK — Swedish Krona
SGD — Singapore Dollar
USD — United States Dollar
ZAR — South African Rand
The accompanying notes are an integral part of the financial statements.
21
Morgan Stanley Institutional Fund Trust
Annual Report — September 30, 2012
Global Strategist Portfolio
Statement of Assets and Liabilities | | September 30, 2012
(000) | |
Assets: | |
Investments in Securities of Unaffiliated Issuers, at Value(1) (Cost $38,906) | | $ | 40,462 | | |
Investment in Securities of Affiliated Issuers, at Value (Cost $9,362) | | | 9,334 | | |
Total Investments in Securities, at Value (Cost $48,268) | | | 49,796 | | |
Cash | | | 7 | | |
Receivable for Variation Margin | | | 824 | | |
Receivable for Investments Sold | | | 688 | | |
Interest Receivable | | | 155 | | |
Unrealized Appreciation on Foreign Currency Exchange Contracts | | | 100 | | |
Unrealized Appreciation on Swap Agreements | | | 87 | | |
Dividends Receivable | | | 48 | | |
Receivable for Swap Agreements Termination | | | 17 | | |
Tax Reclaim Receivable | | | 2 | | |
Receivable from Affiliates | | | 2 | | |
Receivable for Portfolio Shares Sold | | | 1 | | |
Other Assets | | | 10 | | |
Total Assets | | | 51,737 | | |
Liabilities: | |
Collateral on Securities Loaned, at Value | | | 5,958 | | |
Payable for Investments Purchased | | | 1,222 | | |
Unrealized Depreciation on Foreign Currency Exchange Contracts | | | 97 | | |
Bank Overdraft | | | 49 | | |
Payable for Advisory Fees | | | 45 | | |
Unrealized Depreciation on Swap Agreements | | | 24 | | |
Payable for Professional Fees | | | 22 | | |
Payable for Custodian Fees | | | 13 | | |
Payable for Sub Transfer Agency Fees | | | 13 | | |
Payable for Trustees' Fees and Expenses | | | 7 | | |
Payable for Shareholder Services Fees — Class P | | | 4 | | |
Payable for Shareholder Services Fees — Class H | | | — | @ | |
Payable for Distribution and Shareholder Services Fees — Class L | | | — | @ | |
Payable for Administration Fees | | | 3 | | |
Payable for Transfer Agent Fees | | | 1 | | |
Other Liabilities | | | 14 | | |
Total Liabilities | | | 7,472 | | |
Net Assets | | $ | 44,265 | | |
Net Assets Consist Of: | |
Paid-in-Capital | | $ | 44,301 | | |
Undistributed Net Investment Income | | | 596 | | |
Accumulated Net Realized Loss | | | (2,014 | ) | |
Unrealized Appreciation (Depreciation) on: | |
Investments | | | 1,556 | | |
Investments in Affiliates | | | (28 | ) | |
Futures Contracts | | | (215 | ) | |
Swap Agreements | | | 63 | | |
Foreign Currency Exchange Contracts | | | 3 | | |
Foreign Currency Translations | | | 3 | | |
Net Assets | | $ | 44,265 | | |
The accompanying notes are an integral part of the financial statements.
22
Morgan Stanley Institutional Fund Trust
Annual Report — September 30, 2012
Global Strategist Portfolio
Statement of Assets and Liabilities | | September 30, 2012
(000) | |
CLASS I: | |
Net Assets | | $ | 23,756 | | |
| Shares Outstanding (unlimited number of shares authorized, no par value) (not in 000s) | | | 1,560,351 | | |
Net Asset Value, Offering and Redemption Price Per Share | | $ | 15.22 | | |
CLASS P: | |
Net Assets | | $ | 20,487 | | |
| Shares Outstanding (unlimited number of shares authorized, no par value) (not in 000s) | | | 1,349,507 | | |
Net Asset Value, Offering and Redemption Price Per Share | | $ | 15.18 | | |
CLASS H: | |
Net Assets | | $ | 11 | | |
| Shares Outstanding (unlimited number of shares authorized, no par value) (not in 000s) | | | 693 | | |
Net Asset Value, Redemption Price Per Share | | $ | 15.18 | | |
Maximum Sales Load | | | 4.75 | % | |
Maximum Sales Charge | | $ | 0.76 | | |
Maximum Offering Price Per Share | | $ | 15.94 | | |
CLASS L: | |
Net Assets | | $ | 11 | | |
| Shares Outstanding (unlimited number of shares authorized, no par value) (not in 000s) | | | 693 | | |
Net Asset Value, Offering and Redemption Price Per Share | | $ | 15.15 | | |
(1) Including:
Securities on Loan, at Value: | | $ | 5,773 | | |
@ Amount is less than $500.
The accompanying notes are an integral part of the financial statements.
23
Morgan Stanley Institutional Fund Trust
Annual Report — September 30, 2012
Global Strategist Portfolio
Statement of Operations | | Year Ended
September 30, 2012
(000) | |
Investment Income: | |
Interest from Securities of Unaffiliated Issuers (Net of $—@ Foreign Taxes Withheld) | | $ | 499 | | |
Dividends from Securities of Unaffiliated Issuers (Net of $3 of Foreign Taxes Withheld) | | | 452 | | |
Income from Securities Loaned — Net | | | 17 | | |
Dividends from Securities of Affiliated Issuers | | | 12 | | |
Interest from Securities of Affiliated Issuers | | | 11 | | |
Total Investment Income | | | 991 | | |
Expenses: | |
Advisory Fees (Note B) | | | 189 | | |
Custodian Fees (Note F) | | | 102 | | |
Professional Fees | | | 81 | | |
Registration Fees | | | 59 | | |
Pricing Fees | | | 52 | | |
Shareholder Services Fees — Class P (Note D) | | | 47 | | |
Shareholder Services Fees — Class H (Note D) | | | — | @ | |
Distribution and Shareholder Services Fees — Class L (Note D) | | | — | @ | |
Administration Fees (Note C) | | | 34 | | |
Transfer Agency Fees (Note E) | | | 23 | | |
Shareholder Reporting Fees | | | 23 | | |
Sub Transfer Agency Fees | | | 16 | | |
Trustees' Fees and Expenses | | | 2 | | |
Other Expenses | | | 9 | | |
Total Expenses | | | 637 | | |
Rebate from Morgan Stanley Affiliates (Note G) | | | (9 | ) | |
Expense Offset (Note F) | | | (— | @) | |
Net Expenses | | | 628 | | |
Net Investment Income | | | 363 | | |
Realized Gain (Loss): | |
Investments Sold | | | 2,334 | | |
Investments in Affiliates | | | (5 | ) | |
Foreign Currency Exchange Contracts | | | 487 | | |
Foreign Currency Transactions | | | (8 | ) | |
Futures Contracts | | | 2,213 | | |
Swap Agreements | | | (263 | ) | |
Net Realized Gain | | | 4,758 | | |
Change in Unrealized Appreciation (Depreciation): | |
Investments | | | 3,970 | | |
Investments in Affiliates | | | 91 | | |
Foreign Currency Exchange Contracts | | | (125 | ) | |
Foreign Currency Translations | | | 9 | | |
Futures Contracts | | | (143 | ) | |
Swap Agreements | | | 88 | | |
Net Change in Unrealized Appreciation (Depreciation) | | | 3,890 | | |
Net Realized Gain and Change in Unrealized Appreciation (Depreciation) | | | 8,648 | | |
Net Increase in Net Assets Resulting from Operations | | $ | 9,011 | | |
@ Amount is less than $500.
The accompanying notes are an integral part of the financial statements.
24
Morgan Stanley Institutional Fund Trust
Annual Report — September 30, 2012
Global Strategist Portfolio
Statements of Changes in Net Assets | | Year Ended
September 30, 2012
(000) | | Year Ended
September 30, 2011
(000) | |
Increase (Decrease) in Net Assets: | |
Operations: | |
Net Investment Income | | $ | 363 | | | $ | 589 | | |
Net Realized Gain | | | 4,758 | | | | 4,315 | | |
Net Change in Unrealized Appreciation (Depreciation) | | | 3,890 | | | | (4,228 | ) | |
Net Increase in Net Assets Resulting from Operations | | | 9,011 | | | | 676 | | |
Distributions from and/or in Excess of: | |
Class I: | |
Net Investment Income | | | (369 | ) | | | (410 | ) | |
Investment Class: | |
Net Investment Income | | | — | | | | (41 | )* | |
Class P: | |
Net Investment Income | | | (237 | ) | | | (234 | ) | |
Class H: | |
Net Investment Income | | | (— | @)** | | | — | | |
Class L: | |
Net Investment Income | | | (— | @)** | | | — | | |
Total Distributions | | | (606 | ) | | | (685 | ) | |
Capital Share Transactions:(1) | |
Class I: | |
Subscribed | | | 1,950 | | | | 1,198 | | |
Distributions Reinvested | | | 368 | | | | 406 | | |
Conversion from Investment Class | | | — | | | | 5,798 | | |
Redeemed | | | (8,510 | ) | | | (4,609 | ) | |
Investment Class: | |
Subscribed | | | — | | | | 168 | * | |
Distributions Reinvested | | | — | | | | 41 | * | |
Conversion to Class I | | | — | | | | (5,798 | ) | |
Redeemed | | | — | | | | (73 | )* | |
Class P: | |
Subscribed | | | 1,608 | | | | 1,375 | | |
Distributions Reinvested | | | 237 | | | | 234 | | |
Redeemed | | | (1,862 | ) | | | (1,852 | ) | |
Class H: | |
Subscribed | | | 10 | ** | | | — | | |
Class L: | |
Subscribed | | | 10 | ** | | | — | | |
Net Decrease in Net Assets Resulting from Capital Share Transactions | | | (6,189 | ) | | | (3,112 | ) | |
Total Increase (Decrease) in Net Assets | | | 2,216 | | | | (3,121 | ) | |
Net Assets: | |
Beginning of Period | | | 42,049 | | | | 45,170 | | |
End of Period (Including Undistributed Net Investment Income of $596 and $328) | | $ | 44,265 | | | $ | 42,049 | | |
The accompanying notes are an integral part of the financial statements.
25
Morgan Stanley Institutional Fund Trust
Annual Report — September 30, 2012
Global Strategist Portfolio
Statements of Changes in Net Assets | | Year Ended
September 30, 2012
(000) | | Year Ended
September 30, 2011
(000) | |
(1) Capital Share Transactions: | |
Class I: | |
Shares Subscribed | | | 135 | | | | 92 | | |
Shares Issued on Distributions Reinvested | | | 27 | | | | 30 | | |
Conversion from Investment Class | | | — | | | | 432 | | |
Shares Redeemed | | | (617 | ) | | | (348 | ) | |
Net Increase (Decrease) in Class I Shares Outstanding | | | (455 | ) | | | 206 | | |
Investment Class: | |
Shares Subscribed | | | — | | | | 13 | * | |
Shares Issued on Distributions Reinvested | | | — | | | | 3 | * | |
Conversion to Class I | | | — | | | | (433 | ) | |
Shares Redeemed | | | — | | | | (5 | )* | |
Net Decrease in Investment Class Shares Outstanding | | | — | | | | (422 | ) | |
Class P: | |
Shares Subscribed | | | 113 | | | | 104 | | |
Shares Issued on Distributions Reinvested | | | 18 | | | | 18 | | |
Shares Redeemed | | | (134 | ) | | | (141 | ) | |
Net Decrease in Class P Shares Outstanding | | | (3 | ) | | | (19 | ) | |
Class H: | |
Shares Subscribed | | | 1 | ** | | | — | | |
Class L: | |
Shares Subscribed | | | 1 | ** | | | — | | |
@ Amount is less than $500.
* For the period October 1, 2010 through March 22, 2011.
** For the period April 27, 2012 through September 30, 2012.
The accompanying notes are an integral part of the financial statements.
26
Morgan Stanley Institutional Fund Trust
Annual Report — September 30, 2012
Financial Highlights
Global Strategist Portfolio
| | | Class I | |
| | | Year Ended September 30, | |
Selected Per Share Data and Ratios | | 2012 | | 2011 | | 2010 | | 2009 | | 2008 | |
Net Asset Value, Beginning of Period | | $ | 12.50 | | | $ | 12.55 | | | $ | 11.66 | | | $ | 11.87 | | | $ | 14.69 | | |
Income (Loss) from Investment Operations: | |
Net Investment Income† | | | 0.14 | | | | 0.18 | | | | 0.21 | | | | 0.16 | | | | 0.38 | | |
Net Realized and Unrealized Gain (Loss) | | | 2.79 | | | | (0.02 | ) | | | 0.91 | | | | 0.17 | | | | (2.84 | ) | |
Total from Investment Operations | | | 2.93 | | | | 0.16 | | | | 1.12 | | | | 0.33 | | | | (2.46 | ) | |
Distributions from and/or in Excess of: | |
Net Investment Income | | | (0.21 | ) | | | (0.21 | ) | | | (0.23 | ) | | | (0.54 | ) | | | (0.36 | ) | |
Redemption Fees | | | — | | | | — | | | | — | | | | 0.00 | ‡ | | | 0.00 | ‡ | |
Net Asset Value, End of Period | | $ | 15.22 | | | $ | 12.50 | | | $ | 12.55 | | | $ | 11.66 | | | $ | 11.87 | | |
Total Return++ | | | 23.66 | % | | | 1.07 | % | | | 9.77 | % | | | 3.45 | %** | | | (17.02 | )% | |
Ratios and Supplemental Data: | |
Net Assets, End of Period (Thousands) | | $ | 23,756 | | | $ | 25,192 | | | $ | 22,706 | | | $ | 45,567 | | | $ | 40,799 | | |
Ratio of Expenses to Average Net Assets (1) | | | 1.37 | %+ | | | 1.30 | %+†† | | | 0.89 | %+†† | | | 0.67 | %+ | | | 0.57 | %+ | |
Ratio of Net Investment Income to Average Net Assets (1) | | | 1.01 | %+ | | | 1.35 | %+†† | | | 1.73 | %+†† | | | 1.56 | %+ | | | 2.66 | %+ | |
Ratio of Rebate from Morgan Stanley Affiliates to Average Net Assets | | | 0.02 | % | | | 0.01 | % | | | 0.01 | % | | | 0.04 | % | | | 0.05 | % | |
Portfolio Turnover Rate | | | 168 | % | | | 164 | % | | | 176 | % | | | 171 | % | | | 148 | % | |
(1) Supplemental Information on the Ratios to Average Net Assets: | |
Ratios Before Expense Limitation: | |
Expenses to Average Net Assets | | | N/A | | | | N/A | | | | N/A | | | | N/A | | | | 0.58 | %+ | |
Net Investment Income to Average Net Assets | | | N/A | | | | N/A | | | | N/A | | | | N/A | | | | 2.65 | %+ | |
† Per share amount is based on average shares outstanding.
‡ Amount is less than $0.005 per share.
++ Calculated based on the net asset value as of the last business day of the period.
** Performance was positively impacted by approximately 0.79% due to the receipt of proceeds from the settlements of class action suits involving primarily two of the Portfolio's past holdings. This was a one-time settlement, and as a result, the impact on the NAV and consequently the performance will not likely be repeated in the future. Had these settlements not occurred, the total return for Class I shares would have been approximately 2.66%.
+ The Ratios of Expenses and Net Investment Income reflect the rebate of certain Portfolio expenses in connection with the investments in Morgan Stanley affiliates during the period. The effect of the rebate on the ratios is disclosed in the above table as "Ratio of Rebate from Morgan Stanley Affiliates to Average Net Assets."
†† Reflects overall Portfolio ratios for investment income and non-class specific expenses.
The accompanying notes are an integral part of the financial statements.
27
Morgan Stanley Institutional Fund Trust
Annual Report — September 30, 2012
Financial Highlights
Global Strategist Portfolio
| | | Class P | |
| | | Year Ended September 30, | |
Selected Per Share Data and Ratios | | 2012 | | 2011 | | 2010 | | 2009 | | 2008 | |
Net Asset Value, Beginning of Period | | $ | 12.47 | | | $ | 12.52 | | | $ | 11.63 | | | $ | 11.84 | | | $ | 14.66 | | |
Income (Loss) from Investment Operations: | |
Net Investment Income† | | | 0.10 | | | | 0.15 | | | | 0.18 | | | | 0.13 | | | | 0.32 | | |
Net Realized and Unrealized Gain (Loss) | | | 2.79 | | | | (0.03 | ) | | | 0.91 | | | | 0.17 | | | | (2.81 | ) | |
Total from Investment Operations | | | 2.89 | | | | 0.12 | | | | 1.09 | | | | 0.30 | | | | (2.49 | ) | |
Distributions from and/or in Excess of: | |
Net Investment Income | | | (0.18 | ) | | | (0.17 | ) | | | (0.20 | ) | | | (0.51 | ) | | | (0.33 | ) | |
Redemption Fees | | | — | | | | — | | | | — | | | | 0.00 | ‡ | | | 0.00 | ‡ | |
Net Asset Value, End of Period | | $ | 15.18 | | | $ | 12.47 | | | $ | 12.52 | | | $ | 11.63 | | | $ | 11.84 | | |
Total Return++ | | | 23.33 | % | | | 0.83 | % | | | 9.52 | % | | | 3.15 | %** | | | (17.26 | )% | |
Ratios and Supplemental Data: | |
Net Assets, End of Period (Thousands) | | $ | 20,487 | | | $ | 16,857 | | | $ | 17,169 | | | $ | 18,290 | | | $ | 32,398 | | |
Ratio of Expenses to Average Net Assets (1) | | | 1.64 | %+ | | | 1.55 | %+†† | | | 1.14 | %+†† | | | 1.03 | %+ | | | 0.90 | %+ | |
Ratio of Net Investment Income to Average Net Assets (1) | | | 0.69 | %+ | | | 1.10 | %+†† | | | 1.48 | %+†† | | | 1.27 | %+ | | | 2.35 | %+ | |
Ratio of Rebate from Morgan Stanley Affiliates to Average Net Assets | | | 0.02 | % | | | 0.01 | % | | | 0.01 | % | | | 0.04 | % | | | 0.06 | % | |
Portfolio Turnover Rate | | | 168 | % | | | 164 | % | | | 176 | % | | | 171 | % | | | 148 | % | |
(1) Supplemental Information on the Ratios to Average Net Assets: | |
Ratios Before Expense Limitation: | |
Expenses to Average Net Assets | | | N/A | | | | N/A | | | | N/A | | | | 1.08 | %+ | | | 0.91 | %+ | |
Net Investment Income to Average Net Assets | | | N/A | | | | N/A | | | | N/A | | | | 1.22 | %+ | | | 2.34 | %+ | |
† Per share amount is based on average shares outstanding.
‡ Amount is less than $0.005 per share.
++ Calculated based on the net asset value as of the last business day of the period.
** Performance was positively impacted by approximately 0.80% due to the receipt of proceeds from the settlements of class action suits involving primarily two of the Portfolio's past holdings. This was a one-time settlement, and as a result, the impact on the NAV and consequently the performance will not likely be repeated in the future. Had these settlements not occurred, the total return for Class P shares would have been approximately 2.35%.
+ The Ratios of Expenses and Net Investment Income reflect the rebate of certain Portfolio expenses in connection with the investments in Morgan Stanley affiliates during the period. The effect of the rebate on the ratios is disclosed in the above table as "Ratio of Rebate from Morgan Stanley Affiliates to Average Net Assets."
†† Reflects overall Portfolio ratios for investment income and non-class specific expenses.
The accompanying notes are an integral part of the financial statements.
28
Morgan Stanley Institutional Fund Trust
Annual Report — September 30, 2012
Financial Highlights
Global Strategist Portfolio
| | | Class H | |
Selected Per Share Data and Ratios | | Period from
April 27, 2012^ to
September 30, 2012 | |
Net Asset Value, Beginning of Period | | $ | 14.42 | | |
Income from Investment Operations: | |
Net Investment Income† | | | 0.01 | | |
Net Realized and Unrealized Gain | | | 0.79 | | |
Total from Investment Operations | | | 0.80 | | |
Distribution from and/or in Excess of: | |
Net Investment Income | | | (0.04 | ) | |
Net Asset Value, End of Period | | $ | 15.18 | | |
Total Return++ | | | 5.52 | %# | |
Ratios and Supplemental Data: | |
Net Assets, End of Period (Thousands) | | $ | 11 | | |
Ratio of Expenses to Average Net Assets | | | 1.89 | %+* | |
Ratio of Net Investment Income to Average Net Assets | | | 0.21 | %+* | |
Rebate from Morgan Stanley Affiliates to Average Net Assets | | | 0.03 | %* | |
Portfolio Turnover Rate | | | 168 | %# | |
^ Commencement of Operations.
† Per share amount is based on average shares outstanding.
++ Calculated based on the net asset value which does not reflect sales charges, if applicable, as of the last business day of the period.
+ The Ratios of Expenses and Net Investment Income reflect the rebate of certain Portfolio expenses in connection with the investments in Morgan Stanley affiliates during the period. The effect of the rebate on the ratios is disclosed in the above table as "Ratio of Rebate from Morgan Stanley Affiliates to Average Net Assets."
# Not Annualized.
* Annualized.
The accompanying notes are an integral part of the financial statements.
29
Morgan Stanley Institutional Fund Trust
Annual Report — September 30, 2012
Financial Highlights
Global Strategist Portfolio
| | | Class L | |
Selected Per Share Data and Ratios | | Period from
April 27, 2012^ to
September 30, 2012 | |
Net Asset Value, Beginning of Period | | $ | 14.42 | | |
Income (Loss) from Investment Operations: | |
Net Investment Loss† | | | (0.02 | ) | |
Net Realized and Unrealized Gain | | | 0.78 | | |
Total from Investment Operations | | | 0.76 | | |
Distribution from and/or in Excess of: | |
Net Investment Income | | | (0.03 | ) | |
Net Asset Value, End of Period | | $ | 15.15 | | |
Total Return++ | | | 5.30 | %# | |
Ratios and Supplemental Data: | |
Net Assets, End of Period (Thousands) | | $ | 11 | | |
Ratio of Expenses Average Net Assets | | | 2.39 | %+* | |
Ratio of Net Investment Loss to Average Net Assets | | | (0.29 | )%+* | |
Ratio of Rebate from Morgan Stanley Affiliates to Average Net Assets | | | 0.03 | %* | |
Portfolio Turnover Rate | | | 168 | %# | |
^ Commencement of Operations.
† Per share amount is based on average shares outstanding.
++ Calculated based on the net asset value as of the last business day of the period.
+ The Ratios of Expenses and Net Investment Loss reflect the rebate of certain Portfolio expenses in connection with the investments in Morgan Stanley affiliates during the period. The effect of the rebate on the ratios is disclosed in the above table as "Ratio of Rebate from Morgan Stanley Affiliates to Average Net Assets."
# Not Annualized.
* Annualized.
The accompanying notes are an integral part of the financial statements.
30
Morgan Stanley Institutional Fund Trust
Annual Report — September 30, 2012
Notes to Financial Statements
Morgan Stanley Institutional Fund Trust ("MSIFT" or the "Fund") is registered under the Investment Company Act of 1940, as amended (the "Act"), as an open-end management investment company. The Fund is comprised of seven separate, active portfolios (individually referred to as a "Portfolio", collectively as the "Portfolios"). All Portfolios are considered diversified for purposes of the Act.
The accompanying financial statements relate to the Global Strategist Portfolio, formerly the "Balanced Portfolio". The Portfolio seeks above-average total return over a market cycle of three to five years. The Portfolio offers four classes of shares — Class I, Class P, Class H and Class L.
A. Significant Accounting Policies: The following significant accounting policies are in conformity with U.S. generally accepted accounting principles ("GAAP"). Such policies are consistently followed by the Fund in the preparation of its financial statements. GAAP may require management to make estimates and assumptions that affect the reported amounts and disclosures in the financial statements. Actual results may differ from those estimates.
1. Security Valuation: Bonds and other fixed income securities may be valued according to the broadest and most representative market. In addition, bonds and other fixed income securities may be valued on the basis of prices provided by a pricing service. The prices provided by a pricing service take into account broker-dealer market price quotations for institutional size trading in similar groups of securities, security quality, maturity, coupon and other security characteristics as well as any developments related to the specific securities. Short-term debt securities purchased with remaining maturities of 60 days or less are valued at amortized cost, unless the Board of Trustees (the "Trustees") determines such valuation does not reflect the securities' fair value, in which case these securities will be valued at their fair value as determined in good faith under procedures adopted by the Trustees. Equity securities listed on a U.S. exchange are valued at the latest quoted sales price on the valuation date. Equity securities listed or traded on NASDAQ, for which market quotations are available, are valued at the NASDAQ Official Closing Price. Securities listed on a foreign exchange are valued at their closing price, except as noted below. Unlisted and listed equity securities not traded on the valuation date, for which market quotations are readily available, are valued at the mean between the last reported bid and asked prices obtained from reputable brokers.
Under procedures approved by the Trustees, the Fund's adviser, Morgan Stanley Investment Management Inc. (the "Adviser"), has formed a Valuation Committee. The Valuation Committee provides administration and oversight of the Fund's valuation policies and procedures, which are reviewed at least annually by the Trustees. Among other things, these procedures allow the Fund to utilize independent pricing services, quotations from securities and financial instrument dealers, and other market sources to determine fair value.
The Fund has procedures to determine the fair value of securities and other financial instruments for which market prices are not readily available. Under these procedures, the Valuation Committee convenes on a regular and adhoc basis to review such securities and considers a number of factors, including valuation methodologies and significant unobservable valuation inputs, when arriving at fair value. The Valuation Committee may employ a market-based approach which may use related or comparable assets or liabilities, recent transactions, market multiples, book values, and other relevant information for the investment to determine the fair value of the investment. An income-based valuation approach may also be used in which the anticipated future cash flows of the investment are discounted to calculate fair value. Discounts may also be applied due to the nature or duration of any restrictions on the disposition of the investments. Due to the inherent uncertainty of valuations of such investments, the fair values may differ significantly from the values that would have been used had an active market existed. The Valuation Committee employs various methods for calibrating these valuation approaches including a regular review of valuation methodologies, key inputs and assumptions, transactional back-testing or disposition analysis, and reviews of any related market activity.
Most foreign markets close before the New York Stock Exchange ("NYSE"). Occasionally, developments that could affect the closing prices of securities and other assets may occur between the times at which valuations of such securities are determined (that is, close of the foreign market on which the securities trade) and the close of business on the NYSE. If these developments are expected to materially affect the value of the securities, the valuations may be adjusted to reflect the estimated fair value as of the close of the NYSE, as determined in good faith under procedures established by the Trustees.
31
Morgan Stanley Institutional Fund Trust
Annual Report — September 30, 2012
Notes to Financial Statements (cont'd)
2. Fair Value Measurement: Financial Accounting Standards Board ("FASB") Accounting Standards CodificationTM ("ASC") 820, "Fair Value Measurements and Disclosures" ("ASC 820"), defines fair value as the value that the Fund would receive to sell an investment or pay to transfer a liability in a timely transaction with an independent buyer in the principal market, or in the absence of a principal market the most advantageous market for the investment or liability. ASC 820 establishes a three-tier hierarchy to distinguish between (1) inputs that reflect the assumptions market participants would use in valuing an asset or liability developed based on market data obtained from sources independent of the reporting entity (observable inputs) and (2) inputs that reflect the reporting entity's own assumptions about the assumptions market participants would use in valuing an asset or liability developed based on the best information available in the circumstances (unobservable inputs) and to establish classification of fair value measurements for disclosure purposes. Various inputs are used in determining the value of the Fund's investments. The inputs are summarized in the three broad levels listed below.
• Level 1 – unadjusted quoted prices in active markets for identical investments
• Level 2 – other significant observable inputs (including quoted prices for similar investments, interest rates, prepayment speeds, credit risk, etc.)
• Level 3 – significant unobservable inputs including the Fund's own assumptions in determining the fair value of investments. Factors considered in making this determination may include, but are not limited to, information obtained by contacting the issuer, analysts, or the appropriate stock exchange (for exchange-traded securities), analysis of the issuer's financial statements or other available documents and, if necessary, available information concerning other securities in similar circumstances
The inputs or methodology used for valuing securities are not necessarily an indication of the risk associated with investing in those securities and the determination of the significance of a particular input to the fair value measurement in its entirety requires judgment and considers factors specific to each security.
The following is a summary of the inputs used to value the Portfolio's investments as of September 30, 2012.
Investment Type | | Level 1
Unadjusted
quoted
prices
(000) | | Level 2
Other
significant
observable
inputs
(000) | | Level 3
Significant
unobservable
inputs
(000) | | Total
(000) | |
Assets: | |
Fixed Income Securities | |
Agency Adjustable Rate
Mortgages | | $ | — | | | $ | 59 | | | $ | — | | | $ | 59 | | |
Agency Fixed Rate
Mortgages | | | — | | | | 2,169 | | | | — | | | | 2,169 | | |
Asset-Backed Securities | | | — | | | | 132 | | | | — | | | | 132 | | |
Collateralized Mortgage
Obligations — Agency
Collateral Series | | | — | | | | 465 | | | | — | | | | 465 | | |
Commercial Mortgage
Backed Securities | | | — | | | | 255 | | | | — | | | | 255 | | |
Corporate Bonds | | | — | | | | 2,856 | | | | — | | | | 2,856 | | |
Mortgages — Other | | | — | | | | 484 | | | | — | | | | 484 | | |
Sovereign | | | — | | | | 9,794 | | | | — | | | | 9,794 | | |
U.S. Agency Securities | | | — | | | | 566 | | | | — | | | | 566 | | |
U.S. Treasury Securities | | | — | | | | 1,938 | | | | — | | | | 1,938 | | |
Total Fixed Income
Securities | | | — | | | | 18,718 | | | | — | | | | 18,718 | | |
Common Stocks | |
Aerospace & Defense | | | 366 | | | | — | | | | — | | | | 366 | | |
Air Freight & Logistics | | | 117 | | | | — | | | | — | | | | 117 | | |
Airlines | | | 7 | | | | — | | | | — | | | | 7 | | |
Auto Components | | | 75 | | | | — | | | | — | | | | 75 | | |
Automobiles | | | 302 | | | | — | | | | — | | | | 302 | | |
Beverages | | | 392 | | | | — | | | | — | | | | 392 | | |
Biotechnology | | | 200 | | | | — | | | | — | | | | 200 | | |
Building Products | | | 88 | | | | — | | | | — | | | | 88 | | |
Capital Markets | | | 241 | | | | — | | | | — | | | | 241 | | |
Chemicals | | | 534 | | | | — | | | | — | | | | 534 | | |
Commercial Banks | | | 1,424 | | | | — | | | | — | | | | 1,424 | | |
Commercial Services &
Supplies | | | 91 | | | | — | | | | — | | | | 91 | | |
Communications
Equipment | | | 222 | | | | — | | | | — | | | | 222 | | |
Computers & Peripherals | | | 845 | | | | — | | | | — | | | | 845 | | |
Construction &
Engineering | | | 4 | | | | — | | | | — | | | | 4 | | |
Construction Materials | | | 30 | | | | — | | | | — | | | | 30 | | |
Consumer Finance | | | 110 | | | | — | | | | — | | | | 110 | | |
Containers & Packaging | | | 18 | | | | — | | | | — | | | | 18 | | |
Distributors | | | 7 | | | | — | | | | — | | | | 7 | | |
Diversified Consumer
Services | | | 15 | | | | — | | | | — | | | | 15 | | |
Diversified Financial
Services | | | 504 | | | | — | | | | — | | | | 504 | | |
Diversified
Telecommunication
Services | | | 536 | | | | — | | | | — | | | | 536 | | |
Electric Utilities | | | 324 | | | | — | | | | — | | | | 324 | | |
Electrical Equipment | | | 115 | | | | — | | | | — | | | | 115 | | |
Electronic Equipment,
Instruments &
Components | | | 178 | | | | — | | | | — | | | | 178 | | |
Energy Equipment &
Services | | | 408 | | | | — | | | | — | | | | 408 | | |
Food & Staples Retailing | | | 516 | | | | — | | | | — | | | | 516 | | |
Food Products | | | 494 | | | | — | | | | — | | | | 494 | | |
32
Morgan Stanley Institutional Fund Trust
Annual Report — September 30, 2012
Notes to Financial Statements (cont'd)
Investment Type | | Level 1
Unadjusted
quoted
prices
(000) | | Level 2
Other
significant
observable
inputs
(000) | | Level 3
Significant
unobservable
inputs
(000) | | Total
(000) | |
Common Stocks (cont'd) | |
Gas Utilities | | $ | 40 | | | $ | — | | | $ | — | | | $ | 40 | | |
Health Care Equipment &
Supplies | | | 220 | | | | — | | | | — | | | | 220 | | |
Health Care Providers &
Services | | | 257 | | | | — | | | | — | | | | 257 | | |
Health Care Technology | | | 16 | | | | — | | | | — | | | | 16 | | |
Hotels, Restaurants &
Leisure | | | 252 | | | | — | | | | — | | | | 252 | | |
Household Durables | | | 544 | | | | — | | | | — | | | | 544 | | |
Household Products | | | 386 | | | | — | | | | — | | | | 386 | | |
Independent Power
Producers & Energy
Traders | | | 12 | | | | — | | | | — | | | | 12 | | |
Industrial Conglomerates | | | 341 | | | | — | | | | — | | | | 341 | | |
Information Technology
Services | | | 408 | | | | — | | | | — | | | | 408 | | |
Insurance | | | 627 | | | | — | | | | — | | | | 627 | | |
Internet & Catalog Retail | | | 121 | | | | — | | | | — | | | | 121 | | |
Internet Software &
Services | | | 271 | | | | — | | | | — | | | | 271 | | |
Leisure Equipment &
Products | | | 35 | | | | — | | | | — | | | | 35 | | |
Life Sciences Tools &
Services | | | 44 | | | | — | | | | — | | | | 44 | | |
Machinery | | | 358 | | | | — | | | | — | | | | 358 | | |
Marine | | | 14 | | | | — | | | | — | | | | 14 | | |
Media | | | 612 | | | | — | | | | — | | | | 612 | | |
Metals & Mining | | | 596 | | | | — | | | | — | | | | 596 | | |
Multi-Utilities | | | 286 | | | | — | | | | — | | | | 286 | | |
Multi-line Retail | | | 79 | | | | — | | | | — | | | | 79 | | |
Office Electronics | | | 46 | | | | — | | | | — | | | | 46 | | |
Oil, Gas & Consumable
Fuels | | | 1,581 | | | | — | | | | — | | | | 1,581 | | |
Paper & Forest Products | | | 9 | | | | — | | | | — | | | | 9 | | |
Personal Products | | | 36 | | | | — | | | | — | | | | 36 | | |
Pharmaceuticals | | | 1,390 | | | | — | | | | — | | | | 1,390 | | |
Professional Services | | | 41 | | | | — | | | | — | | | | 41 | | |
Real Estate Investment
Trusts (REITs) | | | 353 | | | | — | | | | — | | | | 353 | | |
Real Estate
Management &
Development | | | 123 | | | | — | | | | — | | | | 123 | | |
Road & Rail | | | 270 | | | | — | | | | — | | | | 270 | | |
Semiconductors &
Semiconductor
Equipment | | | 237 | | | | — | | | | — | | | | 237 | | |
Software | | | 493 | | | | — | | | | — | | | | 493 | | |
Specialty Retail | | | 243 | | | | — | | | | — | | | | 243 | | |
Textiles, Apparel & Luxury
Goods | | | 133 | | | | — | | | | — | | | | 133 | | |
Thrifts & Mortgage
Finance | | | 10 | | | | — | | | | — | | | | 10 | | |
Tobacco | | | 341 | | | | — | | | | — | | | | 341 | | |
Trading Companies &
Distributors | | | 113 | | | | — | | | | — | | | | 113 | | |
Transportation
Infrastructure | | | 14 | | | | — | | | | — | | | | 14 | | |
Wireless
Telecommunication
Services | | | 207 | | | | — | | | | — | | | | 207 | | |
Total Common Stocks | | | 19,322 | | | | — | | | | — | | | | 19,322 | | |
Investment Type | | Level 1
Unadjusted
quoted
prices
(000) | | Level 2
Other
significant
observable
inputs
(000) | | Level 3
Significant
unobservable
inputs
(000) | | Total
(000) | |
Commodity Linked
Security | | $ | — | | | $ | 669 | | | $ | — | | | $ | 669 | | |
Convertible Preferred
Stock | | | — | | | | — | | | | 100 | | | | 100 | | |
Investment Companies | | | 457 | | | | — | | | | — | | | | 457 | | |
Rights | | | — | @ | | | — | | | | — | | | | — | @ | |
Short-Term Investments | |
Investment Company | | | 9,003 | | | | — | | | | — | | | | 9,003 | | |
Repurchase Agreements | | | — | | | | 1,527 | | | | — | | | | 1,527 | | |
Total Short-Term
Investments | | | 9,003 | | | | 1,527 | | | | — | | | | 10,530 | | |
Foreign Currency
Exchange Contracts | | | — | | | | 100 | | | | — | | | | 100 | | |
Futures Contracts | | | 51 | | | | — | | | | — | | | | 51 | | |
Interest Rate Swap
Agreements | | | — | | | | 3 | | | | — | | | | 3 | | |
Total Return Swap
Agreements | | | — | | | | 84 | | | | — | | | | 84 | | |
Total Assets | | | 28,833 | | | | 21,101 | | | | 100 | | | | 50,034 | | |
Liabilities: | |
Foreign Currency
Exchange Contracts | | | — | | | | (97 | ) | | | — | | | | (97 | ) | |
Futures Contracts | | | (266 | ) | | | — | | | | — | | | | (266 | ) | |
Interest Rate Swap
Agreements | | | — | | | | (10 | ) | | | — | | | | (10 | ) | |
Total Return Swap
Agreements | | | — | | | | (14 | ) | | | — | | | | (14 | ) | |
Total Liabilities | | | (266 | ) | | | (121 | ) | | | — | | | | (387 | ) | |
Total | | $ | 28,567 | | | $ | 20,980 | | | $ | 100 | | | $ | 49,647 | | |
@ Value is less than $500.
Transfers between investment levels may occur as the markets fluctuate and/or the availability of data used in an investment's valuation changes. The Portfolio recognizes transfers between the levels as of the end of the period. As of September 30, 2012, the Portfolio did not have any investments transfer between investment levels.
Following is a reconciliation of investments in which significant unobservable inputs (Level 3) were used in determining fair value.
| | | Convertible
Preferred Stock
(000) | |
Beginning Balance | | $ | 84 | | |
Purchases | | | — | | |
Sales | | | — | | |
Amortization of discount | | | — | | |
Transfers in | | | — | | |
Transfers out | | | — | | |
Change in unrealized appreciation (depreciation) | | | 16 | | |
Realized gains (losses) | | | — | | |
Ending Balance | | $ | 100 | | |
Net change in unrealized appreciation/depreciation from investments
still held as of September 30, 2012 | | $ | 16 | | |
33
Morgan Stanley Institutional Fund Trust
Annual Report — September 30, 2012
Notes to Financial Statements (cont'd)
The following table presents additional information about valuation techniques and inputs used for investments that are measured at fair value and categorized within Level 3 as of September 30, 2012.
| | | Fair Value at
September 30, 2012
(000) | | Valuation
Technique(s) | | Unobservable
Input | | Range | | Weighted
Average | | Impact to
Valuation from an
Increase in Input | |
Alternative Energy | |
| Convertible Preferred Stock | | $ | 100 | | | Discounted cash flow | | Weighted average
cost of capital | | | 22.5 | % | | | 27.5 | % | | | 25.0 | % | |
Decrease | |
| | | | | | | | | Perpetual growth rate | | | 2.5 | % | | | 3.5 | % | | | 3.0 | % | | Increase | |
| | | | | Market Comparable
Companies | | Enterprise Value/
Revenue | | | 3.0 | x | | | 3.6 | x | | | 3.3 | x | | Increase | |
| | | | | | | Discount for lack of
marketability | | | 15 | % | | | 15 | % | | | 15 | % | | Decrease | |
3. Foreign Currency Translation and Foreign Investments: The books and records of the Fund are maintained in U.S. dollars. Foreign currency amounts are translated into U.S. dollars at the mean of the bid and ask prices of such currencies against U.S. dollars last quoted by a major bank as follows:
– investments, other assets and liabilities at the prevailing rate of exchange on the valuation date;
– investment transactions and investment income at the prevailing rates of exchange on the dates of such transactions.
Although the net assets of the Fund are presented at the foreign exchange rates and market values at the close of the period, the Fund does not isolate that portion of the results of operations arising as a result of changes in the foreign exchange rates from the fluctuations arising from changes in the market prices of securities held at period end. Similarly, the Fund does not isolate the effect of changes in foreign exchange rates from the fluctuations arising from changes in the market prices of securities sold during the period. Accordingly, realized and unrealized foreign currency gains (losses) on investments in securities are included in the reported net realized and unrealized gains (losses) on investment transactions and balances. However, pursuant to U.S. Federal income tax regulations, gains and losses from certain foreign currency transactions and the foreign currency portion of gains and losses realized on sales and maturities of foreign denominated debt securities are treated as ordinary income for U.S. Federal income tax purposes.
Net realized gains (losses) on foreign currency transactions represent net foreign exchange gains (losses) from foreign currency exchange contracts, disposition of foreign currencies, currency gains (losses) realized between the trade and settlement dates on securities transactions, and the difference between the amount of investment income and foreign withholding taxes recorded on the Fund's books and the U.S. dollar equivalent amounts actually received or paid. Net unrealized currency gains (losses) from valuing foreign currency denominated assets and liabilities at period end exchange rates are reflected as a component of unrealized appreciation (depreciation) on the Statement of Assets and Liabilities. The change in unrealized currency gains (losses) on foreign currency translations for the period is reflected in the Statement of Operations.
Foreign security and currency transactions may involve certain considerations and risks not typically associated with those of U.S. dollar denominated transactions as a result of, among other factors, fluctuations of exchange rates in relation to the U.S. dollar, the possibility of lower levels of governmental supervision and regulation of foreign securities markets and the possibility of political or economic instability.
The net assets of the Portfolio include foreign denominated securities and currency. Changes in currency exchange rates will affect the U.S. Dollar value of and investment income from such securities. Further, at times the Portfolio's investments are concentrated in a limited number of countries and regions. This concentration may further increase the risk of the Portfolio.
34
Morgan Stanley Institutional Fund Trust
Annual Report — September 30, 2012
Notes to Financial Statements (cont'd)
Governmental approval for foreign investments may be required in advance of making an investment under certain circumstances in some countries, and the extent of foreign investments in domestic companies may be subject to limitation in other countries. Foreign ownership limitations also may be imposed by the charters of individual companies to prevent, among other concerns, violations of foreign investment limitations. As a result, an additional class of shares (identified as "Foreign" in the Portfolio of Investments) may be created and offered for investment. The "local" and "foreign shares" market values may differ. In the absence of trading of the foreign shares in such markets, the Fund values the foreign shares at the closing exchange price of the local shares. Such securities, if any, are identified as fair valued in the Portfolio of Investments.
4. Structured Investments: The Portfolio invested a portion of their assets in structured investments. A structured investment is a derivative security designed to offer a return linked to a particular underlying security, currency, commodity or market. Structured investments may come in various forms including notes, warrants and options to purchase securities. The Portfolio will typically use structured investments to gain exposure to a permitted underlying security, currency, commodity or market when direct access to a market is limited or inefficient from a tax or cost standpoint. Investments in structured investments involve risks including counterparty risk and market risk. Holders of structured investments bear risks of the underlying investment and are subject to counterparty risk because the Portfolio is relying on the creditworthiness of such counterparty and has no rights with respect to the underlying investment. Certain structured investments may be thinly traded or have a limited trading market and may have the effect of increasing the Portfolio's illiquidity to the extent that the Portfolio, at a particular time, may be unable to find qualified buyers for these securities.
5. Restricted Securities: The Portfolio invested in unregistered or otherwise restricted securities. The term "restricted securities" refers to securities that are unregistered or are held by control persons of the issuer and securities that are subject to contractual restrictions on their resale. As a result, restricted securities may be more difficult to value and the Portfolio may have difficulty disposing of such assets either in a timely manner or for a reasonable
price. In order to dispose of an unregistered security, the Portfolio, where it has contractual rights to do so, may have to cause such security to be registered. A considerable period may elapse between the time the decision is made to sell the security and the time the security is registered so that the Portfolio could sell it. Contractual restrictions on the resale of securities vary in length and scope and are generally the result of a negotiation between the issuer and acquirer of the securities. The Portfolio would, in either case, bear market risks during that period. Restricted Securities are identified in the Portfolio of Investments.
6. Derivatives: The Portfolio may, but is not required to, use derivative instruments for a variety of purposes, including hedging, risk management, portfolio management or to earn income. Derivatives are financial instruments whose value is based on the value of an underlying asset, interest rate, index or financial instrument. A derivative instrument often has risks similar to its underlying asset and may have additional risks, including imperfect correlation between the value of the derivative and the underlying asset, risks of default by the counterparty to certain transactions, magnification of losses incurred due to changes in the market value of the securities, instruments, indices or interest rates to which they relate, and risks that the transactions may not be liquid. The use of derivatives involves risks that are different from, and possibly greater than, the risks associated with other portfolio investments. Derivatives may involve the use of highly specialized instruments that require investment techniques and risk analyses different from those associated with other portfolio investments. All of the Portfolio's holdings, including derivative instruments, are marked-to-market each day with the change in value reflected in unrealized appreciation (depreciation). Upon disposition, a realized gain or loss is recognized.
Certain derivative transactions may give rise to a form of leverage. Leverage magnifies the potential for gain and risk for loss. Leverage associated with derivative transactions may cause the Portfolio to liquidate portfolio positions when it may not be advantageous to do so to satisfy its obligations or to meet earmarking or segregation requirements, pursuant to applicable Securities and Exchange Commission rules and regulations, or may cause the Portfolio to be more volatile than if the Portfolio had not been leveraged. Although the Adviser seeks to use derivatives to further the Portfolio's investment
35
Morgan Stanley Institutional Fund Trust
Annual Report — September 30, 2012
Notes to Financial Statements (cont'd)
objectives, there is no assurance that the use of derivatives will achieve this result.
Following is a description of the derivative instruments and techniques that the Portfolio used during the period and their associated risks:
Futures: A futures contract is a standardized agreement between two parties to buy or sell a specific quantity of an underlying instrument at a specific price at a specific future time. The value of a futures contract tends to increase and decrease in tandem with the value of the underlying instrument. Depending on the terms of the particular contract, futures contracts are settled through either physical delivery of the underlying instrument on the settlement date or by payment of a cash settlement amount on the settlement date. During the period the futures contract is open, payments are received from or made to the broker based upon changes in the value of the contract (the variation margin). A decision as to whether, when and how to use futures involves the exercise of skill and judgment and even a well conceived futures transaction may be unsuccessful because of market behavior or unexpected events. In addition to the derivatives risks discussed above, the prices of futures can be highly volatile, using futures can lower total return, and the potential loss from futures can exceed the Portfolio's initial investment in such contracts.
Swaps: An over-the-counter ("OTC") swap agreement is an agreement between two parties pursuant to which the parties exchange payments at specified dates on the basis of a specified notional amount, with the payments calculated by reference to specified securities, indexes, reference rates, currencies or other instruments. A small percentage of swap agreements are cleared through a central clearing house. Most swap agreements provide that when the period payment dates for both parties are the same, the payments are made on a net basis (i.e., the two payment streams are netted out, with only the net amount paid by one party to the other). The Portfolio's obligations or rights under a swap agreement entered into on a net basis will generally be equal only to the net amount to be paid or received under the agreement, based on the relative values of the positions held by each counterparty. Most swap agreements are not entered into or traded on exchanges and there is no central clearing or guaranty function for swaps. These OTC swaps are often subject to credit risk or
the risk of default or non-performance by the counterparty. Swaps could result in losses if interest rate or foreign currency exchange rates or credit quality changes are not correctly anticipated by the Portfolio or if the reference index, security or investments do not perform as expected.
When the Portfolio has an unrealized loss on a swap agreement, the Portfolio has instructed the custodian to pledge cash or liquid securities as collateral with a value approximately equal to the amount of the unrealized loss. Collateral pledges are monitored and subsequently adjusted if and when the swap valuations fluctuate. Cash collateral is included with "Due from (to) Broker" in the Statement of Assets and Liabilities. Cash collateral has been offset against open swap agreements under the provisions of FASB ASC 210 "Balance Sheet" ("ASC 210"). Offsetting of Amounts Related to Certain Contracts, an interpretation of ASC 210-20, are included within "Unrealized Appreciation (Depreciation) on Swap Agreements" in the Statement of Assets and Liabilities. For cash collateral received, the Portfolio pays a monthly fee to the counterparty based on the effective rate for Federal Funds. This fee, when paid, is included within realized gain (loss) on swap agreements in the Statement of Operations.
Foreign Currency Exchange Contracts: In connection with its investments in foreign securities, the Portfolio also entered into contracts with banks, brokers or dealers to purchase or sell securities or foreign currencies at a future date. A foreign currency exchange contract ("currency contracts") is a negotiated agreement between two parties to exchange specified amounts of two or more currencies at a specified future time at a specified rate. The rate specified by the currency contract can be higher or lower than the spot rate between the currencies that are the subject of the contract. Currency contracts may be used to protect against uncertainty in the level of future foreign currency exchange rates or to gain or modify exposure to a particular currency. In addition, the Portfolio may use cross currency hedging or proxy hedging with respect to currencies in which the Portfolio has or expects to have portfolio or currency exposure. Cross currency hedges involve the sale of one currency against the positive exposure to a different currency and may be used for hedging purposes or to establish an active exposure to the exchange rate between any two currencies. Hedging the Portfolio's currency risks involves the risk of mismatching the Portfolio's objectives
36
Morgan Stanley Institutional Fund Trust
Annual Report — September 30, 2012
Notes to Financial Statements (cont'd)
under a currency contract with the value of securities denominated in a particular currency. Furthermore, such transactions reduce or preclude the opportunity for gain if the value of the currency should move in the direction opposite to the position taken. There is an additional risk to the effect that currency contracts create exposure to currencies in which the Portfolio's securities are not denominated. Unanticipated changes in currency prices may result in poorer overall performance for the Portfolio than if it had not entered into such currency contracts. The use of currency contracts involves the risk of loss from the insolvency or bankruptcy of the counterparty to the contract or the failure of the counterparty to make payments or otherwise comply with the terms of the contract. A currency contract is marked-to-market daily and the change in market value is recorded by the Portfolio as unrealized gain or (loss). The Portfolio records realized gains (losses) when the currency contract is closed equal to the difference between the value of the currency contract at the time it was opened and the value at the time it was closed.
FASB ASC 815, "Derivatives and Hedging: Overall" ("ASC 815"), is intended to improve financial reporting about derivative instruments by requiring enhanced disclosures to enable investors to better understand how and why the Portfolio uses derivative instruments, how these derivative instruments are accounted for and their effects on the Portfolio's financial position and results of operations.
The following table sets forth the fair value of the Portfolio's derivative contracts by primary risk exposure as of September 30, 2012.
Primary Risk Exposure | | Statement of
Assets and
Liabilities | | Foreign
Currency
Exchange
Contracts
(000) | | Futures
Contracts
(000)(a) | | Swap
Agreements
(000) | |
Assets: | |
Currency Risk | | Receivables | | $ | 100 | | | $ | — | | | $ | — | | |
Equity Risk | | Receivables | | | — | | | | 25 | | | | 84 | | |
Commodity Risk | | Receivables | | | — | | | | — | @ | | | — | | |
Interest Rate Risk | | Receivables | | | — | | | | 26 | | | | 3 | | |
Total Receivables | | | | $ | 100 | | | $ | 51 | | | $ | 87 | | |
Liabilities: | |
Currency Risk | | Payables | | $ | 97 | | | $ | — | | | $ | — | | |
Equity Risk | | Payables | | | — | | | | 256 | | | | 14 | | |
Interest Rate Risk | | Payables | | | — | | | | 10 | | | | 10 | | |
Total Payables | | | | $ | 97 | | | $ | 266 | | | $ | 24 | | |
(a) This amount represents the cumulative appreciation (depreciation) of futures contracts as reported in the Portfolio of Investments. The Statement of Assets and Liabilities only reflects the current day's net variation margin.
The following tables set forth by primary risk exposure the Portfolio's realized gains (losses) and change in unrealized appreciation (depreciation) by type of derivative contract for the year ended September 30, 2012 in accordance with ASC 815.
Realized Gain (Loss) | |
Primary Risk Exposure | | Derivative Type | | Value
(000) | |
Currency Risk | | Foreign Currency
Exchange Contracts | | $ | 487 | | |
Equity Risk | | Futures Contracts | | | 2,218 | | |
Commodity Risk | | Futures Contracts | | | (5 | ) | |
Interest Rate Risk | | Futures Contracts | | | — | @ | |
Equity Risk | | Swap Agreements | | | 43 | | |
Interest Rate Risk | | Swap Agreements | | | (306 | ) | |
Total | | | | | | $ | 2,437 | | |
Change in Unrealized Appreciation (Depreciation) | |
Primary Risk Exposure | | Derivative Type | | Value
(000) | |
Currency Risk | | Foreign Currency
Exchange Contracts | | $ | (125 | ) | |
Equity Risk | | Futures Contracts | | | (176 | ) | |
Commodity Risk | | Futures Contracts | | | — | @ | |
Interest Rate Risk | | Futures Contracts | | | 33 | | |
Equity Risk | | Swap Agreements | | | 70 | | |
Interest Rate Risk | | Swap Agreements | | | 18 | | |
Total | | | | | | $ | (180 | ) | |
@ Amount is less than $500.
For the year ended September 30, 2012, the average monthly principal amount of foreign currency exchange contracts was approximately $10,389,000, the average monthly original value of futures contracts was approximately $14,654,000 and the average monthly notional amount of swap agreements was approximately $14,409,000.
7. Securities Lending: The Portfolio lends securities to qualified financial institutions, such as broker-dealers, to earn additional income. Any increase or decrease in the fair value of the securities loaned that might occur and any interest earned or dividends declared on those securities during the term of the loan would remain in the Portfolio. The Portfolio would receive cash or securities as collateral in an amount equal to or exceeding 100% of the current fair value of the loaned securities. The collateral is marked-to-market daily, by the securities lending agent, to ensure that a minimum of 100% collateral coverage is maintained.
Based on pre-established guidelines, the securities lending agent invests any cash collateral that is received in an affiliated money market portfolio and repurchase agreements. Securities lending income is generated from the earnings on the invested collateral and borrowing fees,
37
Morgan Stanley Institutional Fund Trust
Annual Report — September 30, 2012
Notes to Financial Statements (cont'd)
less any rebates owed to the borrowers and compensation to the lending agent, and is recorded as "Income from Securities Loaned-Net" in the Portfolio's Statement of Operations. Risks in securities lending transactions are that a borrower may not provide additional collateral when required or return the securities when due, and that the value of the short-term investments will be less than the amount of cash collateral plus any rebate that is required to be returned to the borrower.
The value of loaned securities and related collateral outstanding at September 30, 2012 were approximately $5,773,000 and $5,992,000, respectively. The Portfolio received cash collateral of approximately $5,958,000, of which, approximately $5,951,000 was subsequently invested in Repurchase Agreements and Morgan Stanley Institutional Liquidity Funds as reported in the Portfolio of Investments. At September 30, 2012, there was uninvested cash collateral of approximately $7,000, which is not reflected in the Portfolio of Investments. The remaining collateral of approximately $34,000 was received in the form of U.S. Government Agencies and Obligations, which the Portfolio cannot sell or repledge, and accordingly are not reflected in the Portfolio of Investments. The Portfolio has the right under the lending agreement to recover the securities from the borrower on demand.
8. When-Issued/Delayed Delivery Securities: The Portfolio purchases and sells when-issued and delayed delivery securities. Securities purchased on a when-issued or delayed delivery basis are purchased for delivery beyond the normal settlement date at a stated price and yield, and no income accrues to the Portfolio on such securities prior to delivery date. Payment and delivery for when-issued and delayed delivery securities can take place up to 120 days after the date of the transaction. When the Portfolio enters into a purchase transaction on a when-issued or delayed delivery basis, securities are available for collateral in an amount at least equal in value to the Portfolio's commitments to purchase such securities. Purchasing securities on a when-issued or delayed delivery basis may involve a risk that the market price at the time of delivery may be lower than the agreed upon purchase price, in which case there could be an unrealized loss at the time of delivery. Purchasing investments on a when-issued or delayed delivery basis may be considered a form of leverage which may increase the impact that gains (losses) may have on the Portfolio.
9. Indemnifications: The Fund enters into contracts that contain a variety of indemnifications. The Fund's maximum exposure under these arrangements is unknown. However, the Fund has not had prior claims or losses pursuant to these contracts and expects the risk of loss to be remote.
10. Other: Security transactions are accounted for on the date the securities are purchased or sold. Realized gains (losses) on the sale of investment securities are determined on the specific identified cost basis. Dividend income and distributions are recorded on the ex-dividend date (except for certain foreign dividends which may be recorded as soon as the Fund is informed of such dividends) net of applicable withholding taxes. Interest income is recognized on the accrual basis except where collection is in doubt. Discounts and premiums on securities purchased are amortized according to the effective yield method over their respective lives. Most expenses of the Fund can be directly attributed to a particular Portfolio. Expenses which cannot be directly attributed are apportioned among the Portfolios based upon relative net assets or other appropriate measures. Income, expenses (other than class specific expenses) and realized and unrealized gains or losses are allocated to each class of shares based upon their relative net assets.
B. Advisory Fees: The Adviser, a wholly-owned subsidiary of Morgan Stanley, provides the Portfolio with advisory services under the terms of an Investment Advisory Agreement, paid quarterly, at an annual rate of 0.45% of the average daily net assets of the Portfolio.
Effective October 29, 2012, the Adviser has agreed to reduce its advisory fee and/or reimburse the Portfolio so that total annual portfolio operating expenses, excluding certain investment related expenses, will not exceed 0.74% for Class I shares, 0.99% for Class P shares, 0.99% for Class H shares and 1.49% for Class L shares. The fee waivers and/or expense reimbursements will continue for at least two years or until such time as the Fund's Board of Trustees acts to discontinue all or a portion of such waivers and/or expense reimbursements when it deems that such action is appropriate.
C. Administration Fees: The Adviser also serves as Administrator to the Fund and provides administrative services pursuant to an Administration Agreement for an annual fee, accrued daily and paid monthly, of 0.08% of the Portfolio's average daily net assets. Under a Sub-Administration Agreement between the Administrator and State Street Bank and Trust Company ("State Street"), State Street provides certain
38
Morgan Stanley Institutional Fund Trust
Annual Report — September 30, 2012
Notes to Financial Statements (cont'd)
administrative services to the Fund. For such services, the Administrator pays State Street a portion of the fee the Administrator receives from the Fund.
D. Distribution and Shareholder Services Fees: Morgan Stanley Distribution, Inc. ("MSDI" or the "Distributor"), a wholly-owned subsidiary of the Adviser, and an indirect subsidiary of Morgan Stanley, serves as the Fund's Distributor of Portfolio shares pursuant to a Distribution agreement. The Fund has adopted Shareholder Services Plans with respect to Class P and Class H shares pursuant to Rule 12b-1 under the Act. Under the Shareholder Services Plans, the Portfolio pays the Distributor a shareholder services fee, accrued daily and paid monthly, at an annual rate of 0.25% of the Portfolio's average daily net assets attributable to Class P and Class H shares.
The Fund has adopted a Distribution and Shareholder Services Plan with respect to Class L shares pursuant to Rule 12b-1 under the Act. Under the Distribution and Shareholder Services Plan, the Portfolio pays the Distributor a distribution fee, accrued daily and paid monthly, at an annual rate of 0.50% and a shareholder service fee, accrued daily and paid monthly, at an annual rate of 0.25% of the Portfolio's average daily net assets attributable to Class L shares.
The distribution and shareholder services fees are used to support the expenses associated with servicing and maintaining accounts. The Distributor may compensate other parties for providing shareholder support services to investors who purchase Class P, Class H and Class L shares.
E. Dividend Disbursing and Transfer Agent: The Fund's dividend disbursing and transfer agent is Morgan Stanley Services Company Inc. ("Morgan Stanley Services"). Pursuant to a transfer agency agreement, the Fund pays Morgan Stanley Services a fee based on the number of classes, accounts and transactions relating to the Portfolios of the Fund.
F. Custodian Fees: State Street (the "Custodian") serves as Custodian for the Fund in accordance with a custodian agreement. The Custodian holds cash, securities, and other assets of the Fund as required by the Act. Custody fees are payable monthly based on assets held in custody, investment purchases and sales activity and account maintenance fees, plus reimbursement for certain out-of-pocket expenses.
The Fund has entered into an arrangement with its Custodian whereby credits realized on uninvested cash balances were used to offset a portion of the Portfolio's expenses. If applicable,
these custodian credits are shown as "Expense Offset" in the Statement of Operations.
G. Security Transactions and Transactions with Affiliates: For the year ended September 30, 2012, purchases and sales of investment securities for the Portfolio, other than long-term U.S. Government securities and short-term investments, were approximately $30,195,000 and $31,502,000, respectively. For the year ended September 30, 2012, purchases and sales of long-term U.S. Government securities were approximately $31,180,000 and $35,713,000, respectively.
The Portfolio invests in the Institutional Class of the Morgan Stanley Institutional Liquidity Funds — Money Market Portfolio (the "Liquidity Funds"), an open-end management investment company managed by the Adviser, both directly, and as a portion of the securities held as collateral on loaned securities. Advisory fees paid by the Portfolio are reduced by an amount equal to its pro-rata share of the advisory and administration fees paid by the Portfolio due to its investment in the Liquidity Funds. For the year ended September 30, 2012, advisory fees paid were reduced by approximately $8,000 relating to the Portfolio's investment in the Liquidity Funds.
A summary of the Portfolio's transactions in shares of the Liquidity Funds during the year ended September 30, 2012 is as follows:
Value
September 30,
2011
(000) | | Purchases
at Cost
(000) | | Sales
(000) | | Dividend
Income
(000) | | Value
September 30,
2012
(000) | |
| $ | 3,956 | | | $ | 41,907 | | | $ | 36,860 | | | $ | 10 | | | $ | 9,003 | | |
The Portfolio invests in Morgan Stanley Institutional Fund, Inc. — Emerging Markets Portfolio ("Emerging Markets Portfolio"), an open-end management investment company advised by an affiliate of the Adviser. Advisory fees paid by the Portfolio are reduced by an amount equal to its pro-rata share of the advisory and administration fees paid by the Emerging Markets Portfolio. For the year ended September 30, 2012, advisory fees paid were reduced by approximately $1,000 relating to the Portfolio's investment in the Emerging Markets Portfolio. The Emerging Markets Portfolio has a cost basis of approximately $120,000 at September 30, 2012.
A summary of the Portfolio's transactions in shares of the Emerging Markets Portfolio during the year ended September 30, 2012 is as follows:
Value
September 30,
2011
(000) | | Purchases
at Cost
(000) | | Sales
(000) | | Realized
Gain
(Loss)
(000) | | Dividend
Income
(000) | | Value
September 30,
2012
(000) | |
| $ | 93 | | | $ | 2 | | | $ | — | | | $ | — | | | $ | 2 | | | $ | 109 | | |
39
Morgan Stanley Institutional Fund Trust
Annual Report — September 30, 2012
Notes to Financial Statements (cont'd)
For the year ended September 30, 2012, the Portfolio had transactions with Citigroup, Inc., and its affiliated broker-dealers which may be deemed affiliates of the Adviser, Administrator and Distributor under Section 17 of the Act.
Value
September 30,
2011
(000) | | Purchases
at Cost
(000) | | Sales
(000) | | Realized
Loss
(000) | | Dividend/
Interest
Income
(000) | | Value
September 30,
2012
(000) | |
| $ | 451 | | | $ | 142 | | | $ | 445 | | | $ | (5 | ) | | $ | 11 | | | $ | 222 | | |
The Portfolio has an unfunded Deferred Compensation Plan (the "Compensation Plan"), which allows each independent Trustee to defer payment of all, or a portion, of the fees he or she receives for serving on the Board of Trustees. Each eligible Trustee generally may elect to have the deferred amounts credited with a return equal to the total return on one or more of the Morgan Stanley funds that are offered as investment options under the Compensation Plan. Appreciation/depreciation and distributions received from these investments are recorded with an offsetting increase/decrease in the deferred compensation obligation and do not affect the net asset value of the Portfolio.
H. Federal Income Taxes: It is the Portfolio's intention to continue to qualify as a regulated investment company and distribute all of its taxable and tax-exempt income. Accordingly, no provision for Federal income taxes is required in the financial statements.
Dividend income and distributions to shareholders are recorded on the ex-dividend date. Interest income is recognized on an accrual basis. Dividends from net investment income, if any, are declared and paid quarterly. Net realized capital gains, if any, are distributed at least annually.
The Portfolio may be subject to taxes imposed by countries in which it invests. Such taxes are generally based on income and/or capital gains earned or repatriated. Taxes are accrued based on net investment income, net realized gains and net unrealized appreciation as such income and/or gains are earned. Taxes may also be based on transactions in foreign currency and are accrued based on the value of investments denominated in such currency.
FASB ASC 740-10, Income Taxes — Overall, sets forth a minimum threshold for financial statement recognition of the benefit of a tax position taken or expected to be taken in a tax return. Management has concluded there are no significant uncertain tax positions that would require recognition in the financial statements. If applicable, the Portfolio recognizes interest accrued related to unrecognized tax benefits in "Interest
Expense" and penalties in "Other Expenses" in the Statement of Operations. The Portfolio files tax returns with the U.S. Internal Revenue Service, New York and various states. Each of the tax years in the four-year period ended September 30, 2012, remains subject to examination by taxing authorities.
The tax character of distributions paid may differ from the character of distributions shown in the Statements of Changes in Net Assets due to short-term capital gains being treated as ordinary income for tax purposes. The tax character of distributions paid during fiscal 2012 and 2011 was as follows:
2012
Distributions
Paid From:
Ordinary
Income
(000) | | 2011
Distributions
Paid From:
Ordinary
Income
(000) | |
| $ | 606 | | | $ | 685 | | |
The amount and character of income and gains to be distributed are determined in accordance with income tax regulations which may differ from GAAP. These book/tax differences are either considered temporary or permanent in nature.
Temporary differences are attributable to differing book and tax treatments for the timing of the recognition of gains (losses) on certain investment transactions and the timing of the deductibility of certain expenses.
Permanent differences, primarily due to differing treatments of gains (losses) related to foreign currency transactions, foreign futures transactions, basis adjustments for swap transactions, paydown adjustments and tax adjustments on passive foreign investment companies sold by the Portfolio, resulted in the following reclassifications among the components of net assets at September 30, 2012:
Accumulated
Undistributed
Net Investment
Income
(000) | | Accumulated
Net Realized
Loss
(000) | | Paid-in-
Capital
(000) | |
| $ | 511 | | | $ | (428 | ) | | $ | (83 | ) | |
At September 30, 2012, the components of distributable earnings for the Portfolio on a tax basis were as follows:
Undistributed
Ordinary
Income
(000) | | Undistributed
Long-Term
Capital Gain
(000) | |
| $ | 605 | | | | — | | |
At September 30, 2012, the aggregate cost for federal income tax purposes is approximately $48,510,000. The aggregate gross unrealized appreciation is approximately $2,342,000 and the aggregate gross unrealized depreciation is approximately
40
Morgan Stanley Institutional Fund Trust
Annual Report — September 30, 2012
Notes to Financial Statements (cont'd)
$1,056,000 resulting in net unrealized appreciation of approximately $1,286,000.
On December 22, 2010, the Regulated Investment Company Modernization Act of 2010 (the "Modernization Act") was signed into law. The Modernization Act modernizes several tax provisions related to Regulated Investment Companies ("RICs") and their shareholders. One key change made by the Modernization Act is that capital losses will generally retain their character as short-term or long-term and may be carried forward indefinitely to offset future gains. These losses are utilized before other capital loss carryforwards that expire. Generally, the Modernization Act is effective for taxable years beginning after December 22, 2010.
At September 30, 2012, the Portfolio had available for Federal income tax purposes unused capital losses, which will expire on the indicated date:
| Amount (000) | | Expiration | |
| $ | 1,809 | | | September 30, 2018 | |
To the extent that capital loss carryforwards are used to offset any future capital gains realized during the carryover period as provided by U.S. Federal income tax regulations, no capital gains tax liability will be incurred by the Portfolio for gains realized and not distributed. To the extent that capital gains are offset, such gains will not be distributed to the shareholders. During the year ended September 30, 2012, the Portfolio utilized capital loss carryforwards for U.S. Federal income tax purposes of approximately $4,133,000.
I. Accounting Pronouncement: In December 2011, FASB issued Accounting Standards Update ("ASU") 2011-11, Balance Sheet: Disclosures about Offsetting Assets and Liabilities. The pronouncement improves disclosures for recognized
financial and derivative instruments that are either offset on the balance sheet in accordance with the offsetting guidance in ASC 210-20-45 or ASC 815-10-45 or are subject to an enforceable master netting agreements or similar. The Fund will be required to disclose information about rights to offset and related arrangements (such as collateral agreements) in order to enable financial statement users to understand the effect of those rights and arrangements on its financial position as well as disclose the following (1) gross amounts; (2) amounts offset in the statement of financial position; (3) any other amounts that can be offset in the event of bankruptcy, insolvency or default of any of the parties (including cash and noncash financial collateral); and (4) the Fund's net exposure. The requirements are effective for annual reporting periods beginning on or after January 1, 2013, and must be applied retrospectively. At this time, the Fund's management is evaluating the implications of ASU 2011-11 and its impact, if any, on the financial statements.
J. Other (unaudited): At September 30, 2012, the Portfolio had otherwise unaffiliated record owners of 10% or greater. Investment activities of these shareholders could have a material impact on the Portfolio. The aggregate percentage of such owners was 57.2% and 96.8%, for Class I and Class P, respectively.
41
Morgan Stanley Institutional Fund Trust
Annual Report — September 30, 2012
Report of Independent Registered Public Accounting Firm
To the Shareholders and Board of Trustees of
Morgan Stanley Institutional Fund Trust —
Global Strategist Portfolio
We have audited the accompanying statement of assets and liabilities, including the portfolio of investments, of Global Strategist Portfolio (formerly Balanced Portfolio) (one of the portfolios constituting Morgan Stanley Institutional Fund Trust) (the "Portfolio") as of September 30, 2012, and the related statement of operations for the year then ended, the statements of changes in net assets for each of the two years in the period then ended, and the financial highlights for each of the periods indicated therein. These financial statements and financial highlights are the responsibility of the Portfolio's management. Our responsibility is to express an opinion on these financial statements and financial highlights based on our audits.
We conducted our audits in accordance with the standards of the Public Company Accounting Oversight Board (United States). Those standards require that we plan and perform the audit to obtain reasonable assurance about whether the financial statements and financial highlights are free of material misstatement. We were not engaged to perform an audit of the Portfolio's internal control over financial reporting. Our audits included consideration of internal control over financial reporting as a basis for designing audit procedures that are appropriate in the circumstances, but not for the purpose of expressing an opinion on the effectiveness of the Portfolio's internal control over financial reporting. Accordingly, we express no such opinion. An audit also includes examining, on a test basis, evidence supporting the amounts and disclosures in the financial statements and financial highlights, assessing the accounting principles used and significant estimates made by management, and evaluating the overall financial statement presentation. Our procedures included confirmation of securities owned as of September 30, 2012, by correspondence with the custodian and others or by other appropriate auditing procedures where replies from others were not received. We believe that our audits provide a reasonable basis for our opinion.
In our opinion, the financial statements and financial highlights referred to above present fairly, in all material respects, the financial position of Global Strategist Portfolio of Morgan Stanley Institutional Fund Trust at September 30, 2012, the results of its operations for the year then ended, the changes in its net assets for each of the two years in the period then ended, and the financial highlights for each of the periods indicated therein, in conformity with U.S. generally accepted accounting principles.

Boston, Massachusetts
November 27, 2012
42
Morgan Stanley Institutional Fund Trust
Annual Report — September 30, 2012
Federal Tax Notice (unaudited)
For Federal income tax purposes, the following information is furnished with respect to the distributions paid by the Portfolio during its taxable year ended September 30, 2012. For corporate shareholders, 47.04% of the dividends qualified for the dividends received deduction.
For Federal income tax purposes, the following information is furnished with respect to the Portfolio's earnings for its taxable year ended September 30, 2012. When distributed, certain earnings may be subject to a maximum tax rate of 15% as provided for by the Jobs and Growth Tax Relief Reconciliation Act of 2003. The Portfolio designated up to a maximum of $494,385 as taxable at this lower rate.
In January, the Portfolio provides tax information to shareholders for the preceding calendar year.
43
Morgan Stanley Institutional Fund Trust
Annual Report — September 30, 2012
U.S. Privacy Policy (unaudited)
AN IMPORTANT NOTICE CONCERNING OUR U.S. PRIVACY POLICY
This privacy notice describes the U.S. privacy policy of Morgan Stanley Distribution, Inc., and the Morgan Stanley family of mutual funds ("us", "our", "we").
We are required by federal law to provide you with notice of our U.S. privacy policy ("Policy"). This Policy applies to both our current and former clients unless we state otherwise and is intended for individual clients who purchase products or receive services from us for personal, family or household purposes. This Policy is not applicable to partnerships, corporations, trusts or other non-individual clients or account holders, nor is this Policy applicable to individuals who are either beneficiaries of a trust for which we serve as trustee or participants in an employee benefit plan administered or advised by us. This Policy is, however, applicable to individuals who select us to be a custodian of securities or assets in individual retirement accounts, 401(k) accounts, or accounts subject to the Uniform Gifts to Minors Act.
This notice sets out our business practices to protect your privacy; how we collect and share personal information about you; and how you can limit our sharing or certain uses by others of this information. We may amend this Policy at any time, and will inform you of any changes to our Policy as required by law.
WE RESPECT YOUR PRIVACY
We appreciate that you have provided us with your personal financial information and understand your concerns about your information. We strive to safeguard the information our clients entrust to us. Protecting the confidentiality and security of client information is an important part of how we conduct our business.
This notice describes what personal information we collect about you, how we collect it, when we may share it with others, and how certain others may use it. It discusses the steps you may take to limit our sharing of certain information about you with our affiliated companies, including, but not limited to our affiliated banking businesses, brokerage firms and credit service affiliates. It also discloses how you may limit our affiliates' use of shared information for marketing purposes.
Throughout this Policy, we refer to the nonpublic information that personally identifies you as "personal information." We also use the term "affiliated company" in this notice. An affiliated company is a company in our family of companies and includes companies with the Morgan Stanley name. These affiliated companies are financial institutions such as broker-dealers, banks, investment advisers and credit card issuers. We refer to any company that is not an affiliated company as a nonaffiliated third party. For purposes of Section 5 of this notice, and your ability to limit certain uses of personal information by our affiliates, this notice applies to the use of personal information by our affiliated companies.
1. WHAT PERSONAL INFORMATION DO WE COLLECT FROM YOU?
We may collect the following types of information about you: (i) information provided by you, including information from applications and other forms we receive from you, (ii) information about your transactions with us or our affiliates, (iii) information about your transactions with nonaffiliated third parties, (iv) information from consumer reporting agencies, (v) information obtained from our websites, and (vi) information obtained from other sources. For example:
• We collect information such as your name, address, e-mail address, telephone/fax numbers, assets, income and investment objectives through applications and other forms you submit to us.
• We may obtain information about account balances, your use of account(s) and the types of products and services you prefer to receive from us through your dealings and transactions with us and other sources.
• We may obtain information about your creditworthiness and credit history from consumer reporting agencies.
• We may collect background information from and through third-party vendors to verify representations you have made and to comply with various regulatory requirements.
2. WHEN DO WE DISCLOSE PERSONAL INFORMATION WE COLLECT ABOUT YOU?
We may disclose personal information we collect about you in each of the categories listed above to affiliated and nonaffiliated third parties.
44
Morgan Stanley Institutional Fund Trust
Annual Report — September 30, 2012
U.S. Privacy Policy (unaudited) (cont'd)
a. Information we disclose to affiliated companies.
We may disclose personal information that we collect about you to our affiliated companies to manage your account(s) effectively, to service and process your transactions, and to let you know about products and services offered by us and affiliated companies, to manage our business, and as otherwise required or permitted by law. Offers for products and services from affiliated companies are developed under conditions designed to safeguard your personal information.
b. Information we disclose to third parties.
We may disclose personal information that we collect about you to nonaffiliated third parties to provide marketing services on our behalf or to other financial institutions with whom we have joint marketing agreements. We may also disclose all of the information we collect to other nonaffiliated third parties for our everyday business purposes, such as to process transactions, maintain account(s), respond to court orders and legal investigations, report to credit bureaus, offer our own products and services, protect against fraud, for institutional risk control, to perform services on our behalf, and as otherwise required or permitted by law.
When we share personal information about you with a nonaffiliated third party, they are required to limit their use of personal information about you to the particular purpose for which it was shared and they are not allowed to share personal information about you with others except to fulfill that limited purpose or as may be permitted or required by law.
3. HOW DO WE PROTECT THE SECURITY AND CONFIDENTIALITY OF PERSONAL INFORMATION WE COLLECT ABOUT YOU?
We maintain physical, electronic and procedural security measures that comply with applicable law and regulations to help safeguard the personal information we collect about you. We have internal policies governing the proper handling of client information by employees. Third parties that provide support or marketing services on our behalf may also receive personal information about you, and we require them to adhere to appropriate security standards with respect to such information.
4. HOW CAN YOU LIMIT OUR SHARING CERTAIN PERSONAL INFORMATION ABOUT YOU WITH OUR AFFILIATED COMPANIES FOR ELIGIBILITY DETERMINATION?
By following the opt-out procedures in Section 6 below, you may limit the extent to which we share with our affiliated companies, personal information that was collected to determine your eligibility for products and services such as your credit reports and other information that you have provided to us or that we may obtain from third parties ("eligibility information"). Eligibility information does not include your identification information or personal information pertaining to our transactions or experiences with you. Please note that, even if you direct us not to share eligibility information with our affiliated companies, we may still share your personal information, including eligibility information, with our affiliated companies under circumstances that are permitted under applicable law, such as to process transactions or to service your account.
5. HOW CAN YOU LIMIT THE USE OF CERTAIN PERSONAL INFORMATION ABOUT YOU BY OUR AFFILIATED COMPANIES FOR MARKETING?
By following the opt-out instructions in Section 6 below, you may limit our affiliated companies from marketing their products or services to you based on personal information we disclose to them. This information may include, for example, your income and account history with us. Please note that, even if you choose to limit our affiliated companies from using personal information about you that we may share with them for marketing their products and services to you, our affiliated companies may use your personal information that they obtain from us to market to you in circumstances permitted by law, such as if the affiliated party has its own relationship with you.
45
Morgan Stanley Institutional Fund Trust
Annual Report — September 30, 2012
U.S. Privacy Policy (unaudited) (cont'd)
6. HOW CAN YOU SEND US AN OPT-OUT INSTRUCTION?
If you wish to limit our sharing of eligibility information about you with our affiliated companies, or our affiliated companies' use of personal information for marketing purposes, as described in this notice, you may do so by:
• Calling us at (800) 548-7786
Monday–Friday between 8a.m. and 5p.m. (EST)
• Writing to us at the following address:
Morgan Stanley Services Company Inc.
c/o Privacy Coordinator
201 Plaza Two, 3rd Floor
Jersey City, New Jersey 07311
If you choose to write to us, your request should include: your name, address, telephone number and account number(s) to which the opt-out applies and whether you are opting out with respect to sharing of eligibility information (Section 4 above), or information used for marketing (Section 5 above), or both. Written opt-out requests should not be sent with any other correspondence. In order to process your request, we require that the request be provided by you directly and not through a third party. Once you have informed us about your privacy preferences, your opt-out preference will remain in effect with respect to this Policy (as it may be amended) until you notify us otherwise. If you are a joint account owner, we will accept instructions from any one of you and apply those instructions to the entire account.
Please understand that if you limit our sharing or our affiliated companies' use of personal information, you and any joint account holder(s) may not receive information about our affiliated companies' products and services, including products or services that could help you manage your financial resources and achieve your investment objectives.
If you have more than one account or relationship with us, please specify the accounts to which you would like us to apply your privacy choices. If you have accounts or relationships with our affiliates, you may receive multiple privacy policies from them, and will need to separately notify those companies of your privacy choices for those accounts or relationships.
7. WHAT IF AN AFFILIATED COMPANY BECOMES A NONAFFILIATED THIRD PARTY?
If, at any time in the future, an affiliated company becomes a nonaffiliated third party, further disclosures of personal information made to the former affiliated company will be limited to those described in Section 2(b) above relating to nonaffiliated third parties. If you elected under Section 6 to limit disclosures we make to affiliated companies, or use of personal information by affiliated companies, your election will not apply to use by any former affiliated company of your personal information in their possession once it becomes a nonaffiliated third party.
SPECIAL NOTICE TO RESIDENTS OF VERMONT
The following section supplements our Policy with respect to our individual clients who have a Vermont address and supersedes anything to the contrary in the above Policy with respect to those clients only.
The State of Vermont requires financial institutions to obtain your consent prior to sharing personal information that they collect about you with nonaffiliated third parties, or eligibility information with affiliated companies, other than in certain limited circumstances. Except as permitted by law, we will not share personal information we collect about you with nonaffiliated third parties or eligibility information with affiliated companies, unless you provide us with your written consent to share such information.
SPECIAL NOTICE TO RESIDENTS OF CALIFORNIA
The following section supplements our Policy with respect to our individual clients who have a California address and supersedes anything to the contrary in the above Policy with respect to those clients only.
In response to a California law, if your account has a California home address, your personal information will not be disclosed to nonaffiliated third parties except as permitted by applicable California law, and we will limit sharing such personal information with our affiliates to comply with California privacy laws that apply to us.
46
Morgan Stanley Institutional Fund Trust
Annual Report — September 30, 2012
Trustee and Officer Information (unaudited)
Independent Trustees:
Name, Age and Address of
Independent Trustee | | Position(s)
Held with
Registrant | | Length of Time
Served* | | Principal Occupation(s) During Past 5 Years | | Number of
Portfolios in
Fund Complex
Overseen by
Independent
Trustee** | | Other Directorships
Held by Independent
Trustee*** | |
Frank L. Bowman (67)
c/o Kramer Levin Naftalis &
Frankel LLP
Counsel to the Independent
Trustees
1177 Avenue of the Americas
New York, NY 10036 | | Trustee | | Since
August
2006 | | President, Strategic Decisions, LLC (consulting) (since February 2009); Director or Trustee of various Morgan Stanley Funds (since August 2006); Chairperson of the Insurance Sub-Committee of the Compliance and Insurance Committee (since February 2007); served as President and Chief Executive Officer of the Nuclear Energy Institute (policy organization) (February 2005-November 2008); retired as Admiral, U.S. Navy after serving over 38 years on active duty including 8 years as Director of the Naval Nuclear Propulsion Program in the Department of the Navy and the U.S. Department of Energy (1996-2004); served as Chief of Naval Personnel (July 1994-September 1996); and on the Joint Staff as Director of Political Military Affairs (June 1992-July 1994); Knighted as Honorary Knight Commander of the Most Excellent Order of the British Empire; Awarded the Officer de l'Orde National du Mérite by the French Government; elected to the National Academy of Engineering (2009). | | | 102 | | | Director of BP p.l.c.; Director of Naval and Nuclear Technologies LLP; Director of the Armed Services YMCA of the USA and the Naval Submarine League; Director of the American Shipbuilding Suppliers Association; Member of the National Security Advisory Council of the Center for U.S. Global Engagement and a member of the CNA Military Advisory Board; Member of the American Lung Association's President's Council. | |
Michael Bozic (71)
c/o Kramer Levin Naftalis &
Frankel LLP
Counsel to the Independent
Trustees
1177 Avenue of the Americas
New York, NY 10036 | | Trustee | | Since
April
1994 | | Private investor; Chairperson of the Compliance and Insurance Committee (since October 2006); Director or Trustee of various Morgan Stanley Funds (since April 1994); formerly, Chairperson of the Insurance Committee (July 2006-September 2006); Vice Chairman of Kmart Corporation (December 1998-October 2000), Chairman and Chief Executive Officer of Levitz Furniture Corporation (November 1995-November 1998) and President and Chief Executive Officer of Hills Department Stores (May 1991-July 1995); variously Chairman, Chief Executive Officer, President and Chief Operating Officer (1987-1991) of the Sears Merchandise Group of Sears, Roebuck & Co. | | | 104 | | | Director of various business organizations. | |
Kathleen A. Dennis (59)
c/o Kramer Levin Naftalis &
Frankel LLP
Counsel to the Independent
Trustees
1177 Avenue of the Americas
New York, NY 10036 | | Trustee | | Since
August
2006 | | President, Cedarwood Associates (mutual fund and investment management consulting) (since July 2006); Chairperson of the Money Market and Alternatives Sub-Committee of the Investment Committee (since October 2006) and Director or Trustee of various Morgan Stanley Funds (since August 2006); formerly, Senior Managing Director of Victory Capital Management (1993-2006). | | | 102 | | | Director of various non-profit organizations. | |
Dr. Manuel H. Johnson (63)
c/o Johnson Smick
Group, Inc.
888 16th Street, N.W.
Suite 740
Washington, D.C. 20006 | | Trustee | | Since
July
1991 | | Senior Partner, Johnson Smick International, Inc. (consulting firm); Chairperson of the Investment Committee (since October 2006) and Director or Trustee of various Morgan Stanley Funds (since July 1991); Co-Chairman and a founder of the Group of Seven Council (G7C) (international economic commission); formerly, Chairperson of the Audit Committee (July 1991-September 2006), Vice Chairman of the Board of Governors of the Federal Reserve System and Assistant Secretary of the U.S. Treasury. | | | 104 | | | Director of NVR, Inc. (home construction). | |
Joseph J. Kearns (70)
c/o Kearns & Associates LLC
PMB754
22631 Pacific Coast Highway
Malibu, CA 90265 | | Trustee | | Since
August
1994 | | President, Kearns & Associates LLC (investment consulting); Chairperson of the Audit Committee (since October 2006) and Director or Trustee of various Morgan Stanley Funds (since August 1994); formerly, Deputy Chairperson of the Audit Committee (July 2003-September 2006) and Chairperson of the Audit Committee of various Morgan Stanley Funds (since August 1994); CFO of the J. Paul Getty Trust. | | | 105 | | | Director of Electro Rent Corporation (equipment leasing) and The Ford Family Foundation. | |
47
Morgan Stanley Institutional Fund Trust
Annual Report — September 30, 2012
Trustee and Officer Information (unaudited) (cont'd)
Independent Trustees: (cont'd)
Name, Age and Address of
Independent Trustee | | Position(s)
Held with
Registrant | | Length of Time
Served* | | Principal Occupation(s) During Past 5 Years | | Number of
Portfolios in
Fund Complex
Overseen by
Independent
Trustee** | | Other Directorships
Held by Independent
Trustee*** | |
Michael F. Klein (53)
c/o Kramer Levin Naftalis & Frankel LLP
Counsel to the
Independent Trustees
1177 Avenue of the Americas
New York, NY 10036 | | Trustee | | Since
August
2006 | | Managing Director, Aetos Capital, LLC (since March 2000) and Co-President, Aetos Alternatives Management, LLC (since January 2004); Chairperson of the Fixed Income Sub-Committee of the Investment Committee (since October 2006) and Director or Trustee of various Morgan Stanley Funds (since August 2006); formerly, Managing Director, Morgan Stanley & Co. Inc. and Morgan Stanley Dean Witter Investment Management, President, various Morgan Stanley Funds (June 1998-March 2000) and Principal, Morgan Stanley & Co. Inc. and Morgan Stanley Dean Witter Investment Management (August 1997-December 1999). | | | 102 | | | Director of certain investment funds managed or sponsored by Aetos Capital, LLC. Director of Sanitized AG and Sanitized Marketing AG (specialty chemicals). | |
Michael E. Nugent (76)
c/o Triumph Capital, L.P.
445 Park Avenue
New York, NY 10022 | | Chairperson
of the
Board and
Trustee | | Chairperson of
the Boards since
July 2006 and
Trustee since
July 1991 | | General Partner, Triumph Capital, L.P. (private investment partnership); Chairperson of the Boards of various Morgan Stanley Funds (since July 2006); Chairperson of the Closed-End Fund Committee (since June 2012) and Director or Trustee of various Morgan Stanley Funds (since July 1991); formerly, Chairperson of the Insurance Committee (until July 2006). | | | 104 | | | None. | |
W. Allen Reed (65)
c/o Kramer Levin Naftalis &
Frankel LLP
Counsel to the
Independent Trustees
1177 Avenue of the Americas
New York, NY 10036 | | Trustee | | Since
August
2006 | | Chairperson of the Equity Sub-Committee of the Investment Committee (since October 2006) and Director or Trustee of various Morgan Stanley Funds (since August 2006); formerly, President and CEO of General Motors Asset Management; Chairman and Chief Executive Officer of the GM Trust Bank and Corporate Vice President of General Motors Corporation (August 1994-December 2005). | | | 102 | | | Director of Temple-Inland Industries (packaging and forest products); Director of Legg Mason, Inc. and Director of the Auburn University Foundation. | |
Fergus Reid (80)
c/o Joe Pietryka, Inc.
85 Charles Colman Blvd.
Pawling, NY 12564 | | Trustee | | Since
June
1992 | | Chairman, Joe Pietryka, Inc.; Chairperson of the Governance Committee and Director or Trustee of various Morgan Stanley Funds (since June 1992). | | | 105 | | | Trustee and Director of certain investment companies in the JPMorgan Funds complex managed by JP Morgan Investment Management Inc. | |
48
Morgan Stanley Institutional Fund Trust
Annual Report — September 30, 2012
Trustee and Officer Information (unaudited) (cont'd)
Interested Trustee:
Name, Age and Address of
Interested Trustee | | Position(s) Held
with Registrant | | Length of Time
Served* | | Principal Occupation(s) During Past 5 Years | | Number of
Portfolios in
Fund Complex
Overseen by
Interested
Trustee** | | Other Directorships
Held by Interested
Trustee*** | |
James F. Higgins (64)
c/o Morgan Stanley Services Company Inc.
Harborside Financial Center
201 Plaza Two
Jersey City, NJ 07311 | | Trustee | | Since
June
2000 | | Director or Trustee of various Morgan Stanley Funds (since June 2000); Senior Advisor of Morgan Stanley (since August 2000). | | | 103 | | | Director of AXA Financial, Inc. and The Equitable Life Assurance Society of the United States (financial services). | |
* Each Trustee serves an indefinite term, until his or her successor is elected.
** The Fund Complex includes (as of December 31, 2011) all open-end and closed-end funds (including all of their portfolios) advised by Morgan Stanley Investment Management Inc. (the "Adviser") and any funds that have an adviser that is an affiliated person of the Adviser (including, but not limited to, Morgan Stanley AIP GP LP).
*** This includes any directorships at public companies and registered investment companies held by the Trustee at any time during the past five years.
49
Morgan Stanley Institutional Fund Trust
Annual Report — September 30, 2012
Trustee and Officer Information (unaudited) (cont'd)
Executive Officers:
Name, Age and Address of Executive Officer | | Position(s) Held
with
Registrant | | Length of Time
Served* | | Principal Occupation(s) During Past 5 Years | |
Arthur Lev (51)
522 Fifth Avenue
New York, NY 10036 | | President and Principal Executive Officer – Equity and Fixed Income Funds | | Since
June 2011 | | President and Principal Executive Officer (since June 2011) of the Equity and Fixed Income Funds in the Fund Complex; Head of the Long Only Business of Morgan Stanley Investment Management (since February 2011); Managing Director of the Adviser and various entities affiliated with the Adviser (since December 2006). Formerly, Chief Strategy Officer of Morgan Stanley Investment Management's Traditional Asset Management business (November 2010-February 2011); General Counsel of Morgan Stanley Investment Management (December 2006-October 2010); Partner and General Counsel of FrontPoint Partners LLC (July 2002-December 2006); Managing Director and General Counsel of Morgan Stanley Investment Management (May 2000-June 2002). | |
Mary Ann Picciotto (39)
c/o Morgan Stanley Services Company Inc.
Harborside Financial Center
201 Plaza Two
Jersey City, NJ 07311 | | Chief Compliance Officer | | Since
May 2010 | | Managing Director of the Adviser and various entities affiliated with the Adviser; Chief Compliance Officer of various Morgan Stanley Funds (since May 2010); Chief Compliance Officer of the Adviser (since April 2007). | |
Stefanie V. Chang Yu (45)
522 Fifth Avenue
New York, NY 10036 | | Vice President | | Since December 1997 | | Managing Director of the Adviser and various entities affiliated with the Adviser; Vice President of various Morgan Stanley Funds (since December 1997). | |
Francis J. Smith (47)
c/o Morgan Stanley Services Company Inc.
Harborside Financial Center
201 Plaza Two
Jersey City, NJ 07311 | | Treasurer and Principal Financial
Officer | | Treasurer since July 2003 and Principal Financial Officer since September 2002 | | Executive Director of the Adviser and various entities affiliated with the Adviser; Treasurer and Principal Financial Officer of various Morgan Stanley Funds (since July 2003). | |
Mary E. Mullin (45)
522 Fifth Avenue
New York, NY 10036 | | Secretary | | Since
June
1999 | | Executive Director of the Adviser and various entities affiliated with the Adviser; Secretary of various Morgan Stanley Funds (since June 1999). | |
* Each officer serves an indefinite term, until his or her successor is elected.?
50
Morgan Stanley Institutional Fund Trust
Annual Report — September 30, 2012
Adviser and Administrator
Morgan Stanley Investment Management Inc.
522 Fifth Avenue
New York, New York 10036
Distributor
Morgan Stanley Distribution, Inc.
522 Fifth Avenue
New York, New York 10036
Dividend Disbursing and Transfer Agent
Morgan Stanley Services Company Inc.
P.O. Box 219804
Kansas City, Missouri 64121
Custodian
State Street Bank and Trust Company
One Lincoln Street
Boston, Massachusetts 02111
Legal Counsel
Dechert LLP
1095 Avenue of the Americas
New York, New York 10036
Independent Registered Public Accounting Firm
Ernst & Young LLP
200 Clarendon Street
Boston, Massachusetts 02116
Reporting to Shareholders
Each Morgan Stanley fund provides a complete schedule of portfolio holdings in its semi-annual and annual reports within 60 days of the end of the fund's second and fourth fiscal quarters by filing the schedule electronically with the Securities and Exchange Commission (SEC). The semi-annual reports are filed on Form N-CSRS and the annual reports are filed on Form N-CSR. Morgan Stanley also delivers the semi-annual and annual reports to fund shareholders and makes these reports available on its public website, www.morganstanley.com/im. Each Morgan Stanley fund also files a complete schedule of portfolio holdings with the SEC for the fund's first and third fiscal quarters on Form N-Q. Morgan Stanley does not deliver the reports for the first and third fiscal quarters to shareholders, nor are the reports posted to the Morgan Stanley public website. You may, however, obtain the Form N-Q filings (as well as the Form N-CSR and N-CSRS filings) by accessing the SEC's website, www.sec.gov. You may also review and copy them at the SEC's Public Reference Room in Washington, DC. Information on the operation of the SEC's Public Reference Room may be obtained by calling the SEC toll free at 1-800-SEC-0330. You can also request copies of these materials, upon payment of a duplicating fee, by electronic request at the SEC's email address (publicinfo@sec.gov) or by writing the Public Reference Room of the SEC, Washington, DC 20549-0102.
Proxy Voting Policies and Procedures and Proxy Voting Record
You may obtain a copy of the Fund's Proxy Voting Policy and Procedures and information regarding how the Fund voted proxies relating to portfolio securities during the most recent twelve-month period ended June 30, without charge, upon request, by calling toll free 1-800-548-7786 or by visiting our website at www.morganstanley.com/im. This information is also available on the SEC's website at www.sec.gov.
This report is authorized for distribution only when preceded or accompanied by a prospectus of the Fund which describes in detail each Investment Portfolio's investment policies, risks, fees and expenses. Please read the prospectus carefully before you invest or send money. For additional information, including information regarding the investments comprising the Portfolio, please visit our website at www.morganstanley.com/im or call toll free 1-(800) 548-7786.
51
(This Page has been left blank intentionally.)
(This Page has been left blank intentionally.)
Printed in U.S.A.
This Report has been prepared for shareholders and may be distributed to others only if preceded or accompanied by a current prospectus.
Morgan Stanley Investment Management Inc.
522 Fifth Avenue
New York, New York 10036
© 2012 Morgan Stanley. Morgan Stanley Distribution, Inc.

IFTGSANN
IU12-02338P-Y09/12

Morgan Stanley
Institutional Fund Trust
Annual
Report
September 30, 2012


Morgan Stanley Institutional Fund Trust
Annual Report — September 30, 2012
Shareholders' Letter | | | 2 | | |
Expense Example | | | 3 | | |
Investment Advisory Agreement Approval | | | 4 | | |
Investment Overview | | | 6 | | |
Portfolio of Investments | | | 8 | | |
Statement of Assets and Liabilities | | | 10 | | |
Statement of Operations | | | 11 | | |
Statements of Changes in Net Assets | | | 12 | | |
Financial Highlights | | | 13 | | |
Notes to Financial Statements | | | 17 | | |
Report of Independent Registered Public Accounting Firm | | | 25 | | |
Federal Tax Notice | | | 26 | | |
U.S. Privacy Policy | | | 27 | | |
Trustee and Officer Information | | | 30 | | |
This report is authorized for distribution only when preceded or accompanied by prospectuses of the Morgan Stanley Institutional Fund Trust. To receive a prospectus and/or SAI, which contains more complete information such as investment objectives, charges, expenses, policies for voting proxies, risk considerations, and describes in detail each of the Portfolio's investment policies to the prospective investor, please call toll free 1-(800) 548-7786. Please read the prospectuses carefully before you invest or send money.
Additionally, you can access portfolio information including performance, characteristics, and investment team commentary through Morgan Stanley Investment Management's website: www.morganstanley.com/im.
Market forecasts provided in this report may not necessarily come to pass. There is no guarantee that any sectors mentioned will continue to perform as discussed herein or that securities in such sectors will be held by the Portfolio in the future. There is no assurance that a Portfolio will achieve its investment objective. Portfolios are subject to market risk, which is the possibility that market values of securities owned by the Portfolio will decline and, therefore, the value of the Portfolio's shares may be less than what you paid for them. Accordingly, you can lose money investing in Portfolios. Please see the prospectus for more complete information on investment risks.
1
Morgan Stanley Institutional Fund Trust
Annual Report — September 30, 2012
Shareholders' Letter (unaudited)
Dear Shareholders,
We are pleased to provide this Annual report, in which you will learn how your investment in Mid Cap Growth Portfolio performed during the latest twelve-month period.
Morgan Stanley Investment Management is a client-centric, investor-led organization. Our global presence, intellectual capital, and breadth of products and services enable us to partner with investors to meet the evolving challenges of today's financial markets. We aim to deliver superior investment service and to empower our clients to make the informed decisions that help them reach their investment goals.
As always, we thank you for selecting Morgan Stanley Investment Management, and look forward to working with you in the months and years ahead.
Sincerely,

Arthur Lev
President and Principal Executive Officer
October 2012
2
Morgan Stanley Institutional Fund Trust
Annual Report — September 30, 2012
Expense Example (unaudited)
Mid Cap Growth Portfolio
As a shareholder of the Portfolio, you may incur two types of costs: (1) transactional costs, including sales charge (loads) on purchase payments; and (2) ongoing costs, including advisory fees, administration fees, distribution and shareholder servicing fees; and other Portfolio expenses. This example is intended to help you understand your ongoing costs (in dollars) of investing in the Portfolio and to compare these costs with the ongoing costs of investing in other mutual funds.
This example is based on an investment of $1,000 invested at the beginning of the six-month period ended September 30, 2012 and held for the entire six-month period.
Actual Expenses
The table below provides information about actual account values and actual expenses. You may use the information in this table, together with the amount you invested, to estimate the expenses that you paid over the period. Simply divide your account value by $1,000 (for example, an $8,600 account value divided by $1,000 = 8.6), then multiply the result by the number in the table under the heading entitled "Actual Expenses Paid During Period" to estimate the expenses you paid on your account during this period.
Please note that "Actual Expenses Paid During Period" are grossed up to reflect Portfolio expenses prior to the effect of Expense Offset (See Note F in the Notes to Financial Statements). Therefore, the annualized net expense ratios may differ from the ratio of expenses to average net assets shown in the Financial Highlights.
Hypothetical Example for Comparison Purposes
The table below provides information about hypothetical account values and hypothetical expenses based on the Portfolio's actual expense ratio and an assumed rate of return of 5% per year before expenses, which is not the Portfolio's actual return. The hypothetical account values and expenses may not be used to estimate the actual ending account balance or expenses you paid for the period. You may use this information to compare the ongoing costs of investing in the Portfolio and other funds. To do so, compare this 5% hypothetical example with the 5% hypothetical examples that appear in the shareholder reports of the other funds.
Please note that the expenses shown in the table are meant to highlight your ongoing costs only and do not reflect any transactional costs, such as sales charges (loads, if applicable). Therefore, the hypothetical account values and hypothetical expenses are useful in comparing ongoing costs only, and will not help you determine the relative total costs of owning different funds. In addition, if these transactional costs were included, your costs would have been higher.
| | | Beginning
Account
Value
4/1/12 | | Actual Ending
Account
Value
9/30/12 | | Hypothetical
Ending Account
Value | | Actual
Expenses
Paid
During
Period | | Hypothetical
Expenses Paid
During Period | | Net
Expense
Ratio
During
Period** | |
Mid Cap Growth Portfolio Class I | | $ | 1,000.00 | | | $ | 912.40 | | | $ | 1,021.45 | | | $ | 3.39 | * | | $ | 3.59 | * | | | 0.71 | % | |
Mid Cap Growth Portfolio Class P | | | 1,000.00 | | | | 911.30 | | | | 1,020.20 | | | | 4.59 | * | | | 4.85 | * | | | 0.96 | | |
Mid Cap Growth Portfolio Class H | | | 1,000.00 | | | | 1,035.00 | | | | 1,012.04 | | | | 2.76 | + | | | 2.73 | + | | | 0.92 | | |
Mid Cap Growth Portfolio Class L | | | 1,000.00 | | | | 1,033.50 | | | | 1,010.33 | | | | 4.50 | + | | | 4.45 | + | | | 1.50 | | |
* Expenses are calculated using each Portfolio Class' annualized net expense ratio (as disclosed), multiplied by the average account value over the period, and multiplied by 183/366 (to reflect the most recent one-half year period).
** Annualized.
+ Expenses are calculated using each Portfolio Class' annualized net expense ratio (as disclosed), multiplied by the average account value over the period, and multiplied by 108/366 (to reflect the actual days in period).
3
Morgan Stanley Institutional Fund Trust
Annual Report — September 30, 2012
Investment Advisory Agreement Approval (unaudited)
Nature, Extent and Quality of Services
The Board reviewed and considered the nature and extent of the investment advisory services provided by the Adviser (as defined herein) under the advisory agreement, including portfolio management, investment research and equity and fixed income securities trading. The Board also reviewed and considered the nature and extent of the non-advisory, administrative services provided by the Adviser under the administration agreement, including accounting, clerical, bookkeeping, compliance, business management and planning, and the provision of supplies, office space and utilities at the Adviser's expense. (The advisory and administration agreements together are referred to as the "Management Agreement.") The Board also compared the nature of the services provided by the Adviser with similar services provided by non-affiliated advisers as reported to the Board by Lipper, Inc. ("Lipper").
The Board reviewed and considered the qualifications of the portfolio managers, the senior administrative managers and other key personnel of the Adviser who provide the advisory and administrative services to the Portfolio. The Board determined that the Adviser's portfolio managers and key personnel are well qualified by education and/or training and experience to perform the services in an efficient and professional manner. The Board concluded that the nature and extent of the advisory and administrative services provided were necessary and appropriate for the conduct of the business and investment activities of the Portfolio and supported its decision to approve the Management Agreement.
Performance, Fees and Expenses of the Portfolio
The Board reviewed the performance, fees and expenses of the Portfolio compared to its peers, as determined by Lipper, and to appropriate benchmarks where applicable. The Board discussed with the Adviser the performance goals and the actual results achieved in managing the Portfolio. When considering a fund's performance, the Board and the Adviser place emphasis on trends and longer-term returns (focusing on one-year, three-year and five-year performance, as of December 31, 2011, or since inception, as applicable). When a fund underperforms its benchmark and/or its peer group average, they discuss the causes of such underperformance and, where necessary, they discuss specific changes to investment strategy or investment personnel. The Board noted that the Portfolio's performance was below its peer group average for the one-year period but better than its peer group average for the three- and five-year periods. The Board discussed with the Adviser the level of the advisory and administration fees (together, the "management fee") for this Portfolio relative to comparable funds and/or other accounts advised by the Adviser and/or compared to its peers as determined by Lipper. In addition to the management fee, the Board also reviewed the Portfolio's total expense ratio. The Board noted that the Portfolio's management fee and total expense ratio were lower than its peer group average. After discussion, the Board concluded that (i) the Portfolio's performance was acceptable; and (ii) the Portfolio's management fee and total expense ratio were competitive with its peer group average.
Economies of Scale
The Board considered the size and growth prospects of the Portfolio and how that relates to the Portfolio's total expense ratio and particularly the Portfolio's management fee rate which does not include breakpoints. In conjunction with its review of the Adviser's profitability, the Board discussed with the Adviser how a change in assets can affect the efficiency or effectiveness of managing the Portfolio and whether the management fee level is appropriate relative to current and projected asset levels and/or whether the management fee structure reflects economies of scale as asset levels change. The Board has determined that its review of the actual and potential economies of scale of the Portfolio supports its decision to approve the Management Agreement.
Profitability of the Adviser and Affiliates
The Board considered information concerning the costs incurred and profits realized by the Adviser and its affiliates during the last year from their relationship with the Portfolio and during the last two years from their relationship with the Morgan Stanley Fund Complex and reviewed with the Adviser the cost allocation methodology used to determine the profitability of the Adviser and affiliates. The Board has determined that its review of the analysis of the Adviser's expenses and profitability supports its decision to approve the Management Agreement.
Other Benefits of the Relationship
The Board considered other benefits to the Adviser and its affiliates derived from their relationship with the Portfolio and other funds advised by the Adviser. These benefits may include, among other things, "float" benefits derived from handling of checks for purchases and sales, research received by the Adviser generated from commission dollars spent on funds' portfolio trading and fees
4
Morgan Stanley Institutional Fund Trust
Annual Report — September 30, 2012
Investment Advisory Agreement Approval (unaudited) (cont'd)
for distribution and/or shareholder servicing. The Board reviewed with the Adviser each of these arrangements and the reasonableness of the Adviser's costs relative to the services performed. The Board has determined that its review of the other benefits received by the Adviser or its affiliates supports its decision to approve the Management Agreement.
Resources of the Adviser and Historical Relationship Between the Portfolio and the Adviser
The Board considered whether the Adviser is financially sound and has the resources necessary to perform its obligations under the Management Agreement. The Board also reviewed and considered the historical relationship between the Portfolio and the Adviser, including the organizational structure of the Adviser, the policies and procedures formulated and adopted by the Adviser for managing the Portfolio's operations and the Board's confidence in the competence and integrity of the senior managers and key personnel of the Adviser. The Board concluded that the Adviser has the financial resources necessary to fulfill its obligations under the Management Agreement and that it is beneficial for the Portfolio to continue its relationship with the Adviser.
Other Factors and Current Trends
The Board considered the controls and procedures adopted and implemented by the Adviser and monitored by the Fund's Chief Compliance Officer and concluded that the conduct of business by the Adviser indicates a good faith effort on its part to adhere to high ethical standards in the conduct of the Fund's business.
General Conclusion
After considering and weighing all of the above factors, the Board concluded that it would be in the best interest of the Portfolio and its shareholders to approve renewal of the Management Agreement for another year. In reaching this conclusion the Board did not give particular weight to any single factor referenced above. The Board considered these factors over the course of numerous meetings, some of which were in executive session with only the independent Board members and their counsel present. It is possible that individual Board members may have weighed these factors differently in reaching their individual decisions to approve the Management Agreement.
5
Morgan Stanley Institutional Fund Trust
Annual Report — September 30, 2012
Investment Overview (unaudited)
Mid Cap Growth Portfolio
Performance
For the fiscal year ended September 30, 2012, the Portfolio's Class I had a total return based on net asset value and reinvestment of distributions per share of 10.91%, net of fees. The Portfolio's Class I underperformed against its benchmark the Russell Midcap® Growth Index (the "Index") which returned 26.69%.
Factors Affecting Performance
• Stock market performance in the year ended September 30, 2012 was influenced primarily by investor sentiment about the economy and policy actions from the Federal Reserve and other central banks around the world. Although the tone of economic data in the U.S. remained mixed in the first half of the period, investors were optimistic about globally coordinated monetary policy efforts intended to shore up confidence in Europe's ailing banks and a set of proposals from European Union leaders to address the debt crisis. However, in the spring, the equity market turned more volatile as the U.S. economy appeared to hit a soft patch, the pace of job growth slackened, and worries about Spain's solvency surfaced. Economic growth in Europe and China weakened as well. Although these risks persisted, investor sentiment turned more upbeat in July with a pledge by the European Central Bank (ECB) president to do "whatever it takes" to save the euro. Anticipation of another round of quantitative easing by the Fed also buoyed confidence. These expectations were fulfilled in September with the announcement of a new bond-buying program by the ECB and a third round of asset purchases by the Fed. While these measures helped stocks rally through the end of the period, it remains to be seen what effect, if any, they may have on economic conditions.
• The Portfolio underperformed the Index for the reporting period. The largest detractor on a relative basis was stock selection in the technology sector. Holdings in a social network games developer and an online deals service hurt performance the most.
• Stock selection in the consumer discretionary sector also dampened relative performance. Two holdings based in China, which were not represented in the Index — a private education provider and an online travel booking service — and a video streaming service were among the primary detractors.
• Another area of relative weakness was stock selection in materials and processing, which was led lower by holdings in two rare earths miners and a potash producer.
• Positive contributors to performance included stock selection in the utilities sector, although relative gains were somewhat offset by the negative effect of an overweight in the sector. Nearly all of the positive performance in the sector came from a position in a manager of infrastructure operations.
• An underweight in the consumer staples sector was additive as well, despite a slight drag on performance from stock selection there.
Management Strategies
• The Growth Team seeks high quality companies, which we define primarily as those with sustainable competitive advantages. We manage focused portfolios that are highly differentiated from the benchmark, with securities weighted on our assessment of the quality of the company and our conviction. Our longer-term focus has historically resulted in lower turnover than many of our peers. The value added or detracted in any period of time will typically result from stock selection, given our philosophy and process.
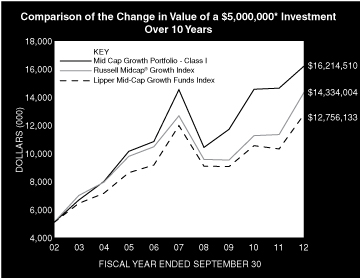
* Minimum Investment
In accordance with SEC regulations, the Portfolio's performance shown assumes that all recurring fees (including management fees) were deducted and all dividends and distributions were reinvested. The performance of Class P, Class H and Class L shares will vary from the Class I shares based upon their different inception dates and will be negatively impacted by additional fees assessed to those classes.
6
Morgan Stanley Institutional Fund Trust
Annual Report — September 30, 2012
Investment Overview (unaudited) (cont'd)
Mid Cap Growth Portfolio
Performance Compared to the Russell Midcap® Growth Index(1) and the Lipper Mid-Cap Growth Funds Index(2)
| | | Period Ended September 30, 2012
Total Returns(3) | |
| | | | | Average Annual | |
| | | One
Year | | Five
Years | | Ten
Years | | Since
Inception(7) | |
Portfolio — Class I Shares
w/o sales charges(4) | | | 10.91 | % | | | 2.23 | % | | | 12.48 | % | | | 12.50 | % | |
Russell Midcap® Growth Index | | | 26.69 | | | | 2.54 | | | | 11.11 | | | | 9.62 | | |
Lipper Mid-Cap Growth Funds Index | | | 24.04 | | | | 1.33 | | | | 9.82 | | | | 9.17 | | |
Portfolio — Class P Shares
w/o sales charges(5) | | | 10.62 | | | | 1.98 | | | | 12.21 | | | | 9.37 | | |
Russell Midcap® Growth Index | | | 26.69 | | | | 2.54 | | | | 11.11 | | | | 6.82 | | |
Lipper Mid-Cap Growth Funds Index | | | 24.04 | | | | 1.33 | | | | 9.82 | | | | 5.90 | | |
Portfolio — Class H Shares
w/o sales charges(6) | | | — | | | | — | | | | — | | | | 3.50 | | |
Portfolio — Class H Shares with
maximum 4.75% sales charges(6) | | | — | | | | — | | | | — | | | | -1.42 | | |
Russell Midcap® Growth Index | | | — | | | | — | | | | — | | | | 8.00 | | |
Lipper Mid-Cap Growth Funds Index | | | — | | | | — | | | | — | | | | 7.67 | | |
Portfolio — Class L Shares
w/o sales charges(6) | | | — | | | | — | | | | — | | | | 3.35 | | |
Russell Midcap® Growth Index | | | — | | | | — | | | | — | | | | 8.00 | | |
Lipper Mid-Cap Growth Funds Index | | | — | | | | — | | | | — | | | | 7.67 | | |
Performance data quoted represents past performance, which is no guarantee of future results, and current performance may be lower or higher than the figures shown. Performance assumes that all dividends and distributions, if any, were reinvested. Returns for periods less than one year are not annualized. For the most recent month-end performance figures, please visit www.morganstanley.com/im. Investment returns and principal value will fluctuate so that Portfolio shares, when redeemed, may be worth more or less than their original cost. Total returns do not reflect the deduction of taxes that a shareholder would pay on Portfolio distributions or the redemption of Portfolio shares. Performance of share classes will vary due to differences in sales charges and expenses.
(1) The Russell Midcap® Growth Index measures the performance of the mid-cap growth segment of the U.S. equity universe. It includes those Russell Midcap® Index companies with higher price-to-book ratios and higher forecasted growth values. The Russell Midcap® Index is a subset of the Russell 1000® Index and includes approximately 800 of the smallest securities in the Russell 1000® Index, which in turn consists of approximately 1,000 of the largest U.S. securities based on a combination of market capitalization and current index membership. The Index is unmanaged and its returns do not include any sales charges or fees. Such costs would lower performance. It is not possible to invest directly in an index.
(2) The Lipper Mid-Cap Growth Funds Index is an equally weighted performance index of the largest qualifying funds (based on net assets) in the Lipper Mid-Cap Growth Funds classification. The index, which is adjusted for capital gains distributions and income dividends, is unmanaged and should not be considered an investment. There are currently 30 funds represented in this Index. As of the date of this report, the Portfolio was in the Lipper Mid-Cap Growth Funds classification.
(3) Total returns for the Portfolio reflect expenses waived and/or reimbursed, if applicable, by the Adviser. Without such waivers and/or reimbursements, total returns would have been lower. The fee waivers and/or expense reimbursements will continue for at least one year or until such time as the Fund's Board of Trustees acts to discontinue all or a portion of such waivers and/or reimbursements when it deems such action is appropriate.
(4) Commenced operations on March 30, 1990.
(5) Commenced operations on January 31, 1997.
(6) Commenced operations on June 14, 2012.
(7) For comparative purposes, average annual since inception returns listed for the Indexes refer to the inception date or initial offering of the respective share class of the Portfolio, not the inception of the Indexes.
Portfolio Composition
| Classification | | Percentage of
Total Investments | |
Other* | | | 64.0 | % | |
Computer Services, Software & Systems | | | 15.9 | | |
Commercial Services | | | 8.7 | | |
Financial Data & Systems | | | 6.2 | | |
Biotechnology | | | 5.2 | | |
Total Investments | | | 100.0 | % | |
* Industries and/or investment types representing less than 5% of total investments.
7
Morgan Stanley Institutional Fund Trust
Annual Report — September 30, 2012
Portfolio of Investments
Mid Cap Growth Portfolio
| | | Shares | | Value
(000) | |
Common Stocks (98.7%) | |
Air Transport (1.8%) | |
Expeditors International of Washington, Inc. | | | 3,004,615 | | | $ | 109,248 | | |
Alternative Energy (3.4%) | |
Range Resources Corp. | | | 2,047,125 | | | | 143,032 | | |
Ultra Petroleum Corp. (a) | | | 2,977,886 | | | | 65,454 | | |
| | | | 208,486 | | |
Asset Management & Custodian (0.9%) | |
Greenhill & Co., Inc. | | | 1,073,048 | | | | 55,530 | | |
Automobiles (0.4%) | |
Tesla Motors, Inc. (a) | | | 857,658 | | | | 25,112 | | |
Beverage: Brewers & Distillers (2.5%) | |
DE Master Blenders 1753 N.V. (Netherlands) (a) | | | 12,410,768 | | | | 149,517 | | |
Biotechnology (5.2%) | |
IDEXX Laboratories, Inc. (a) | | | 1,280,698 | | | | 127,237 | | |
Illumina, Inc. (a) | | | 3,870,370 | | | | 186,552 | | |
| | | | 313,789 | | |
Cement (1.2%) | |
Martin Marietta Materials, Inc. | | | 888,183 | | | | 73,604 | | |
Chemicals: Diversified (2.7%) | |
Intrepid Potash, Inc. (a) | | | 3,116,709 | | | | 66,947 | | |
Rockwood Holdings, Inc. | | | 2,056,282 | | | | 95,823 | | |
| | | | 162,770 | | |
Commercial Services (8.8%) | |
Gartner, Inc. (a) | | | 3,147,901 | | | | 145,087 | | |
Intertek Group PLC (United Kingdom) | | | 3,990,123 | | | | 176,545 | | |
MercadoLibre, Inc. (Brazil) | | | 856,669 | | | | 70,718 | | |
Weight Watchers International, Inc. | | | 2,636,286 | | | | 139,196 | | |
| | | | 531,546 | | |
Communications Technology (3.9%) | |
Motorola Solutions, Inc. | | | 4,692,400 | | | | 237,201 | | |
Computer Services, Software & Systems (15.9%) | |
Akamai Technologies, Inc. (a) | | | 2,410,523 | | | | 92,227 | | |
Citrix Systems, Inc. (a) | | | 1,208,127 | | | | 92,506 | | |
IHS, Inc., Class A (a) | | | 1,247,365 | | | | 121,431 | | |
LinkedIn Corp., Class A (a) | | | 1,622,943 | | | | 195,402 | | |
Red Hat, Inc. (a) | | | 1,587,347 | | | | 90,384 | | |
Salesforce.com, Inc. (a) | | | 1,045,265 | | | | 159,601 | | |
SINA Corp. (China) (a) | | | 596,136 | | | | 38,558 | | |
Solera Holdings, Inc. | | | 3,068,047 | | | | 134,595 | | |
Zynga, Inc., Class A (a) | | | 14,028,493 | | | | 39,841 | | |
| | | | 964,545 | | |
Computer Technology (4.2%) | |
Dropbox, Inc. (a)(b)(c) (acquisition
cost — $32,283; acquired 5/1/12) | | | 3,567,608 | | | | 32,283 | | |
Yandex N.V., Class A (Russia) (a) | | | 6,056,854 | | | | 146,031 | | |
Youku Tudou, Inc. ADR (China) (a) | | | 4,145,832 | | | | 76,242 | | |
| | | | 254,556 | | |
Consumer Lending (1.7%) | |
IntercontinentalExchange, Inc. (a) | | | 776,648 | | | | 103,613 | | |
| | | Shares | | Value
(000) | |
Consumer Services: Miscellaneous (1.7%) | |
Qualicorp SA (Brazil) (a) | | | 10,808,545 | | | $ | 105,566 | | |
Diversified Media (3.7%) | |
Factset Research Systems, Inc. | | | 1,027,933 | | | | 99,113 | | |
McGraw-Hill Cos., Inc. (The) | | | 2,311,282 | | | | 126,173 | | |
| | | | 225,286 | | |
Diversified Retail (2.8%) | |
Fastenal Co. | | | 2,208,640 | | | | 94,950 | | |
Groupon, Inc. (a) | | | 15,020,860 | | | | 71,499 | | |
| | | | 166,449 | | |
Education Services (1.1%) | |
New Oriental Education & Technology Group,
Inc. ADR (China) | | | 3,808,860 | | | | 63,494 | | |
Electronic Components (1.6%) | |
Sensata Technologies Holding N.V. (a) | | | 3,213,232 | | | | 95,658 | | |
Financial Data & Systems (6.2%) | |
MSCI, Inc., Class A (a) | | | 5,067,356 | | | | 181,361 | | |
Verisk Analytics, Inc., Class A (a) | | | 4,088,659 | | | | 194,661 | | |
| | | | 376,022 | | |
Health Care Services (4.4%) | |
athenahealth, Inc. (a) | | | 1,427,309 | | | | 130,984 | | |
Stericycle, Inc. (a) | | | 1,521,674 | | | | 137,742 | | |
| | | | 268,726 | | |
Insurance: Property-Casualty (1.9%) | |
Progressive Corp. (The) | | | 5,541,916 | | | | 114,939 | | |
Media (0.6%) | |
Legend Pictures LLC Ltd. (a)(b)(c) (acquisition
cost — $36,896; acquired 3/8/12) | | | 34,510 | | | | 36,896 | | |
Medical & Dental Instruments & Supplies (1.5%) | |
Techne Corp. | | | 1,227,668 | | | | 88,318 | | |
Medical Equipment (3.4%) | |
Intuitive Surgical, Inc. (a) | | | 413,356 | | | | 204,872 | | |
Metals & Minerals: Diversified (0.8%) | |
Lynas Corp. Ltd. (Australia) (a) | | | 23,242,119 | | | | 19,046 | | |
Molycorp, Inc. (a) | | | 2,602,753 | | | | 29,932 | | |
| | | | 48,978 | | |
Pharmaceuticals (3.9%) | |
Ironwood Pharmaceuticals, Inc. (a) | | | 3,422,223 | | | | 43,736 | | |
Mead Johnson Nutrition Co. | | | 1,208,608 | | | | 88,567 | | |
Valeant Pharmaceuticals International, Inc.
(Canada) (a) | | | 1,858,863 | | | | 102,739 | | |
| | | | 235,042 | | |
Publishing (1.6%) | |
Morningstar, Inc. | | | 1,541,657 | | | | 96,569 | | |
Recreational Vehicles & Boats (3.5%) | |
Edenred (France) | | | 7,488,215 | | | | 210,401 | | |
Restaurants (1.3%) | |
Dunkin' Brands Group, Inc. | | | 2,756,896 | | | | 80,487 | | |
Scientific Instruments: Pollution Control (1.3%) | |
Covanta Holding Corp. | | | 4,560,544 | | | | 78,259 | | |
The accompanying notes are an integral part of the financial statements.
8
Morgan Stanley Institutional Fund Trust
Annual Report — September 30, 2012
Portfolio of Investments (cont'd)
Mid Cap Growth Portfolio
| | | Shares | | Value
(000) | |
Semiconductors & Components (0.8%) | |
First Solar, Inc. (a) | | | 2,153,446 | | | $ | 47,688 | | |
Utilities: Electrical (4.0%) | |
Brookfield Infrastructure Partners LP (Canada) | | | 6,734,143 | | | | 239,399 | | |
Total Common Stocks (Cost $5,441,125) | | | 5,972,566 | | |
Convertible Preferred Stocks (0.9%) | |
Alternative Energy (0.5%) | |
Better Place, Inc. (a)(b)(c) (acquisition
cost — $22,524; acquired 1/25/10) | | | 9,009,542 | | | | 27,028 | | |
Better Place, Inc. Series C (a)(b)(c) (acquisition
cost — $12,698; acquired 11/14/11) | | | 2,796,975 | | | | 8,391 | | |
| | | | 35,419 | | |
Computer Services, Software & Systems (0.2%) | |
Workday, Inc. (a)(b)(c) (acquisition
cost — $10,687; acquired 10/12/11) | | | 805,930 | | | | 15,313 | | |
Computer Technology (0.1%) | |
Dropbox, Inc. Series A (a)(b)(c) (acquisition
cost — $3,205; acquired 5/25/12) | | | 354,228 | | | | 3,205 | | |
Technology: Miscellaneous (0.1%) | |
Peixe Urbano, Inc. (Brazil) (a)(b)(c) (acquisition
cost — $17,874; acquired 12/2/11) | | | 542,936 | | | | 3,801 | | |
Total Convertible Preferred Stocks (Cost $66,988) | | | 57,738 | | |
Preferred Stock (0.2%) | |
Computer Services, Software & Systems (0.2%) | |
Palantir Technologies, Inc. Series G (a)(b)(c)
(acquisition cost — $11,200;
acquired 7/19/12) (Cost $11,200) | | | 3,660,035 | | | | 11,200 | | |
Short-Term Investment (0.6%) | |
Investment Company (0.6%) | |
Morgan Stanley Institutional Liquidity
Funds — Money Market Portfolio —
Institutional Class (See Note G)
(Cost $35,346) | | | 35,345,537 | | | | 35,346 | | |
Total Investments (100.4%) (Cost $5,554,659) | | | 6,076,850 | | |
Liabilities in Excess of Other Assets (-0.4%) | | | (25,299 | ) | |
Net Assets (100.0%) | | $ | 6,051,551 | | |
(a) Non-income producing security.
(b) At September 30, 2012, the Portfolio held fair valued securities valued at approximately $138,117,000, representing 2.3% of net assets. These securities have been fair valued as determined in good faith under procedures established by and under the general supervision of the Fund's Trustees.
(c) Security cannot be offered for public resale without first being registered under the Securities Act of 1933 and related rules ("restricted security"). Acquisition date represents the day on which an enforceable right to acquire such security is obtained and is presented along with related cost in the security description. The portfolio has registration rights for certain restricted securities. Any costs related to such registration are borne by the issuer. The aggregate value of restricted securities (excluding 144A holdings) at September 30, 2012 amounts to approximately $138,117,000 and represents 2.3% of net assets.
ADR American Depositary Receipt.
The accompanying notes are an integral part of the financial statements.
9
Morgan Stanley Institutional Fund Trust
Annual Report — September 30, 2012
Statement of Assets and Liabilities | | September 30, 2012
(000) | |
Assets: | |
Investments in Securities of Unaffiliated Issuers, at Value (Cost $5,519,313) | | $ | 6,041,504 | | |
Investment in Security of Affiliated Issuer, at Value (Cost $35,346) | | | 35,346 | | |
Total Investments in Securities, at Value (Cost $5,554,659) | | | 6,076,850 | | |
Cash | | | 1,066 | | |
Receivable for Investments Sold | | | 10,521 | | |
Receivable for Portfolio Shares Sold | | | 4,286 | | |
Dividends Receivable | | | 2,137 | | |
Tax Reclaim Receivable | | | 1,025 | | |
Receivable from Affiliate | | | 1 | | |
Other Assets | | | 177 | | |
Total Assets | | | 6,096,063 | | |
Liabilities: | |
Payable for Investments Purchased | | | 24,646 | | |
Payable for Advisory Fees | | | 7,700 | | |
Payable for Portfolio Shares Redeemed | | | 6,391 | | |
Payable for Sub Transfer Agency Fees | | | 4,287 | | |
Payable for Administration Fees | | | 403 | | |
Payable for Shareholder Services Fees — Class P | | | 379 | | |
Payable for Shareholder Services Fees — Class H | | | — | @ | |
Payable for Distribution and Shareholder Services Fees — Class L | | | — | @ | |
Payable for Custodian Fees | | | 102 | | |
Payable for Professional Fees | | | 49 | | |
Payable for Trustees' Fees and Expenses | | | 30 | | |
Payable for Transfer Agent Fees | | | 14 | | |
Other Liabilities | | | 511 | | |
Total Liabilities | | | 44,512 | | |
Net Assets | | $ | 6,051,551 | | |
Net Assets Consist Of: | |
Paid-in-Capital | | $ | 5,356,178 | | |
Accumulated Undistributed Net Investment Income | | | 6,211 | | |
Accumulated Undistributed Net Realized Gain | | | 166,999 | | |
Unrealized Appreciation (Depreciation) on: | |
Investments | | | 522,191 | | |
Foreign Currency Translations | | | (28 | ) | |
Net Assets | | $ | 6,051,551 | | |
CLASS I: | |
Net Assets | | $ | 4,219,528 | | |
| Shares Outstanding (unlimited number of shares authorized, no par value) (not in 000s) | | | 119,408,218 | | |
Net Asset Value, Offering and Redemption Price Per Share | | $ | 35.34 | | |
CLASS P: | |
Net Assets | | $ | 1,832,003 | | |
| Shares Outstanding (unlimited number of shares authorized, no par value) (not in 000s) | | | 53,840,020 | | |
Net Asset Value, Offering and Redemption Price Per Share | | $ | 34.03 | | |
CLASS H: | |
Net Assets | | $ | 10 | | |
| Shares Outstanding (unlimited number of shares authorized, no par value) (not in 000s) | | | 304 | | |
Net Asset Value, Redemption Price Per Share | | $ | 34.03 | | |
Maximum Sales Load | | | 4.75 | % | |
Maximum Sales Charge | | $ | 1.70 | | |
Maximum Offering Price Per Share | | $ | 35.73 | | |
CLASS L: | |
Net Assets | | $ | 10 | | |
| Shares Outstanding (unlimited number of shares authorized, no par value) (not in 000s) | | | 304 | | |
Net Asset Value, Offering and Redemption Price Per Share | | $ | 33.97 | | |
@ Amount is less than $500.
The accompanying notes are an integral part of the financial statements.
10
Morgan Stanley Institutional Fund Trust
Annual Report — September 30, 2012
Statement of Operations | | Year Ended
September 30, 2012
(000) | |
Investment Income: | |
Dividends from Securities of Unaffiliated Issuers (Net of $1,617 of Foreign Taxes Withheld) | | $ | 75,188 | | |
Dividends from Security of Affiliated Issuer | | | 254 | | |
Interest from Securities of Unaffiliated Issuers | | | — | @ | |
Total Investment Income | | | 75,442 | | |
Expenses: | |
Advisory Fees (Note B) | | | 32,479 | | |
Sub Transfer Agency Fees | | | 6,187 | | |
Shareholder Services Fees — Class P (Note D) | | | 5,328 | | |
Shareholder Services Fees — Class H (Note D) | | | — | @ | |
Distribution and Shareholder Services Fees — Class L (Note D) | | | — | @ | |
Administration Fees (Note C) | | | 5,197 | | |
Shareholder Reporting Fees | | | 830 | | |
Custodian Fees (Note F) | | | 626 | | |
Trustees' Fees and Expenses | | | 194 | | |
Registration Fees | | | 184 | | |
Transfer Agency Fees (Note E) | | | 145 | | |
Professional Fees | | | 42 | | |
Pricing Fees | | | 8 | | |
Other Expenses | | | 150 | | |
Total Expenses | | | 51,370 | | |
Rebate from Morgan Stanley Affiliate (Note G) | | | (252 | ) | |
Expense Offset (Note F) | | | (— | @) | |
Net Expenses | | | 51,118 | | |
Net Investment Income | | | 24,324 | | |
Realized Gain (Loss): | |
Investments Sold | | | 124,435 | | |
Foreign Currency Transactions | | | (572 | ) | |
Net Realized Gain | | | 123,863 | | |
Change in Unrealized Appreciation (Depreciation): | |
Investments | | | 484,258 | | |
Foreign Currency Translations | | | (24 | ) | |
Net Change in Unrealized Appreciation (Depreciation) | | | 484,234 | | |
Net Realized Gain and Change in Unrealized Appreciation (Depreciation) | | | 608,097 | | |
Net Increase in Net Assets Resulting from Operations | | $ | 632,421 | | |
@ Amount is less than $500.
The accompanying notes are an integral part of the financial statements.
11
Morgan Stanley Institutional Fund Trust
Annual Report — September 30, 2012
Statements of Changes in Net Assets | | Year Ended
September 30, 2012
(000) | | Year Ended
September 30, 2011
(000) | |
Increase (Decrease) in Net Assets: | |
Operations: | |
Net Investment Income (Loss) | | $ | 24,324 | | | $ | (2,342 | ) | |
Net Realized Gain | | | 123,863 | | | | 658,813 | | |
Net Change in Unrealized Appreciation (Depreciation) | | | 484,234 | | | | (763,740 | ) | |
Net Increase (Decrease) in Net Assets Resulting from Operations | | | 632,421 | | | | (107,269 | ) | |
Distributions from and/or in Excess of: | |
Class I: | |
Net Investment Income | | | — | | | | (9,653 | ) | |
Net Realized Gain | | | (211,942 | ) | | | — | | |
Class P: | |
Net Investment Income | | | — | | | | (2,780 | ) | |
Net Realized Gain | | | (135,932 | ) | | | — | | |
Total Distributions | | | (347,874 | ) | | | (12,433 | ) | |
Capital Share Transactions:(1) | |
Class I: | |
Subscribed | | | 931,545 | | | | 1,490,614 | | |
Distributions Reinvested | | | 199,699 | | | | 8,865 | | |
Redeemed | | | (903,032 | ) | | | (614,738 | ) | |
Class P: | |
Subscribed | | | 257,000 | | | | 1,017,179 | | |
Distributions Reinvested | | | 110,582 | | | | 2,751 | | |
Redeemed | | | (1,221,346 | ) | | | (869,991 | ) | |
Class H: | |
Subscribed | | | 10 | * | | | — | | |
Class L: | |
Subscribed | | | 10 | * | | | — | | |
Net Increase (Decrease) in Net Assets Resulting from Capital Share Transactions | | | (625,532 | ) | | | 1,034,680 | | |
Total Increase (Decrease) in Net Assets | | | (340,985 | ) | | | 914,978 | | |
Net Assets: | |
Beginning of Period | | | 6,392,536 | | | | 5,477,558 | | |
End of Period (Including Accumulated Undistributed (Distributions in Excess of)
Net Investment Income of $6,211 and $(908)) | | $ | 6,051,551 | | | $ | 6,392,536 | | |
(1) Capital Share Transactions: | |
Class I: | |
Shares Subscribed | | | 26,034 | | | | 38,900 | | |
Shares Issued on Distributions Reinvested | | | 6,154 | | | | 238 | | |
Shares Redeemed | | | (25,613 | ) | | | (16,008 | ) | |
Net Increase in Class I Shares Outstanding | | | 6,575 | | | | 23,130 | | |
Class P: | |
Shares Subscribed | | | 7,474 | | | | 27,862 | | |
Shares Issued on Distributions Reinvested | | | 3,531 | | | | 76 | | |
Shares Redeemed | | | (36,891 | ) | | | (24,055 | ) | |
Net Increase (Decrease) in Class P Shares Outstanding | | | (25,886 | ) | | | 3,883 | | |
Class H: | |
Shares Subscribed | | | — | @@* | | | — | | |
Class L: | |
Shares Subscribed | | | — | @@* | | | — | | |
@@ Amount is less than 500 shares.
* For the period June 14, 2012 through September 30, 2012.
The accompanying notes are an integral part of the financial statements.
12
Morgan Stanley Institutional Fund Trust
Annual Report — September 30, 2012
Financial Highlights
Mid Cap Growth Portfolio
| | | Class I | |
| | | Year Ended September 30, | |
Selected Per Share Data and Ratios | | 2012 | | 2011 | | 2010 | | 2009 | | 2008 | |
Net Asset Value, Beginning of Period | | $ | 33.65 | | | $ | 33.58 | | | $ | 26.96 | | | $ | 23.99 | | | $ | 33.68 | | |
Income (Loss) from Investment Operations: | |
Net Investment Income† | | | 0.17 | | | | 0.03 | | | | 0.11 | | | | 0.03 | | | | 0.05 | ^^ | |
Net Realized and Unrealized Gain (Loss) | | | 3.35 | | | | 0.14 | | | | 6.52 | | | | 2.94 | | | | (9.58 | ) | |
Total from Investment Operations | | | 3.52 | | | | 0.17 | | | | 6.63 | | | | 2.97 | | | | (9.53 | ) | |
Distributions from and/or in Excess of: | |
Net Investment Income | | | — | | | | (0.10 | ) | | | (0.01 | ) | | | — | | | | (0.16 | ) | |
Net Realized Gain | | | (1.83 | ) | | | — | | | | — | | | | — | | | | — | | |
Total Distributions | | | (1.83 | ) | | | (0.10 | ) | | | (0.01 | ) | | | — | | | | (0.16 | ) | |
Redemption Fees | | | — | | | | — | | | | — | | | | 0.00 | ‡ | | | 0.00 | ‡ | |
Net Asset Value, End of Period | | $ | 35.34 | | | $ | 33.65 | | | $ | 33.58 | | | $ | 26.96 | | | $ | 23.99 | | |
Total Return++ | | | 10.91 | % | | | 0.47 | % | | | 24.58 | % | | | 12.38 | %** | | | (28.42 | )%^^ | |
Ratios and Supplemental Data: | |
Net Assets, End of Period (Thousands) | | $ | 4,219,528 | | | $ | 3,797,139 | | | $ | 3,012,006 | | | $ | 2,005,809 | | | $ | 1,609,506 | | |
Ratio of Expenses to Average Net Assets | | | 0.71 | %+ | | | 0.69 | %+†† | | | 0.68 | %+†† | | | 0.69 | %+ | | | 0.63 | %+ | |
Ratio of Net Investment Income to Average Net Assets | | | 0.48 | %+ | | | 0.07 | %+†† | | | 0.38 | %+†† | | | 0.16 | %+ | | | 0.17 | %+ | |
Ratio of Rebate from Morgan Stanley Affiliates to Average Net Assets | | | 0.00 | %§ | | | 0.01 | % | | | 0.01 | % | | | 0.01 | % | | | 0.00 | %§ | |
Portfolio Turnover Rate | | | 26 | % | | | 35 | % | | | 23 | % | | | 27 | % | | | 37 | % | |
† Per share amount is based on average shares outstanding.
^^ During the year, the Portfolio received a regulatory settlement from an unaffiliated third party, which had an impact of less than $0.005 on net investment income per share and less than 0.005% on the total return for Class I.
‡ Amount is less than $0.005 per share.
++ Calculated based on the net asset value as of the last business day of the period.
** Performance was positively impacted by approximately 0.04% due to the receipt of proceeds from the settlements of class action suits involving primarily two of the Portfolio's past holdings. This was a one-time settlement, and as a result, the impact on the NAV and consequently the performance will not likely be repeated in the future. Had these settlements not occurred, the total return for Class I shares would have been approximately 12.34%.
+ The Ratios of Expenses and Net Investment Income reflect the rebate of certain Portfolio expenses in connection with the investments in Morgan Stanley affiliates during the period. The effect of the rebate on the ratios is disclosed in the above table as "Ratio of Rebate from Morgan Stanley Affiliates to Average Net Assets."
†† Reflects overall Portfolio ratios for investment income and non-class specific expenses.
§ Amount is less than 0.005%.
The accompanying notes are an integral part of the financial statements.
13
Morgan Stanley Institutional Fund Trust
Annual Report — September 30, 2012
Financial Highlights
Mid Cap Growth Portfolio
| | | Class P | |
| | | Year Ended September 30, | |
Selected Per Share Data and Ratios | | 2012 | | 2011 | | 2010 | | 2009 | | 2008 | |
Net Asset Value, Beginning of Period | | $ | 32.55 | | | $ | 32.51 | | | $ | 26.15 | | | $ | 23.33 | | | $ | 32.78 | | |
Income (Loss) from Investment Operations: | |
Net Investment Income (Loss)† | | | 0.06 | | | | (0.07 | ) | | | 0.04 | | | | (0.02 | ) | | | (0.02 | )^^ | |
Net Realized and Unrealized Gain (Loss) | | | 3.25 | | | | 0.15 | | | | 6.32 | | | | 2.84 | | | | (9.34 | ) | |
Total from Investment Operations | | | 3.31 | | | | 0.08 | | | | 6.36 | | | | 2.82 | | | | (9.36 | ) | |
Distributions from and/or in Excess of: | |
Net Investment Income | | | — | | | | (0.04 | ) | | | — | | | | — | | | | (0.09 | ) | |
Net Realized Gain | | | (1.83 | ) | | | — | | | | — | | | | — | | | | — | | |
Total Distributions | | | (1.83 | ) | | | (0.04 | ) | | | — | | | | — | | | | (0.09 | ) | |
Redemption Fees | | | — | | | | — | | | | — | | | | 0.00 | ‡ | | | 0.00 | ‡ | |
Net Asset Value, End of Period | | $ | 34.03 | | | $ | 32.55 | | | $ | 32.51 | | | $ | 26.15 | | | $ | 23.33 | | |
Total Return++ | | | 10.62 | % | | | 0.22 | % | | | 24.32 | % | | | 12.04 | %** | | | (28.59 | )%^^ | |
Ratios and Supplemental Data: | |
Net Assets, End of Period (Thousands) | | $ | 1,832,003 | | | $ | 2,595,397 | | | $ | 2,465,552 | | | $ | 1,567,302 | | | $ | 1,236,945 | | |
Ratio of Expenses to Average Net Assets (1) | | | 0.96 | %+ | | | 0.94 | %+†† | | | 0.93 | %+†† | | | 0.96 | %+ | | | 0.88 | %+ | |
Ratio of Net Investment Income (Loss) to Average Net Assets (1) | | | 0.17 | %+ | | | (0.18 | )%+†† | | | 0.13 | %+†† | | | (0.11 | )%+ | | | (0.07 | )%+ | |
Ratio of Rebate from Morgan Stanley Affiliates to Average Net Assets | | | 0.00 | %§ | | | 0.01 | % | | | 0.01 | % | | | 0.01 | % | | | 0.00 | %§ | |
Portfolio Turnover Rate | | | 26 | % | | | 35 | % | | | 23 | % | | | 27 | % | | | 37 | % | |
(1) Supplemental Information on the Ratios to Average Net Assets: | |
Ratios Before Expense Limitation: | |
Expenses to Average Net Assets | | | N/A | | | | N/A | | | | N/A | | | | N/A | | | | 0.89 | %+ | |
Net Investment Income to Average Net Assets | | | N/A | | | | N/A | | | | N/A | | | | N/A | | | | (0.08 | )%+ | |
† Per share amount is based on average shares outstanding.
^^ During the year, the Portfolio received a regulatory settlement from an unaffiliated third party, which had an impact of less than $0.005 on net investment income per share and less than 0.005% on total returns for Class P.
‡ Amount is less than $0.005 per share.
++ Calculated based on the net asset value as of the last business day of the period.
** Performance was positively impacted by approximately 0.04% due to the receipt of proceeds from the settlements of class action suits involving primarily two of the Portfolio's past holdings. This was a one-time settlement, and as a result, the impact on the NAV and consequently the performance will not likely be repeated in the future. Had these settlements not occurred, the total return for Class P shares would have been approximately 12.00%.
+ The Ratios of Expenses and Net Investment Income (Loss) reflect the rebate of certain Portfolio expenses in connection with the investments in Morgan Stanley affiliates during the period. The effect of the rebate on the ratios is disclosed in the above table as "Ratio of Rebate from Morgan Stanley Affiliates to Average Net Assets."
†† Reflects overall Portfolio ratios for investment income and non-class specific expenses.
§ Amount is less than 0.005%.
The accompanying notes are an integral part of the financial statements.
14
Morgan Stanley Institutional Fund Trust
Annual Report — September 30, 2012
Financial Highlights
Mid Cap Growth Portfolio
| | | Class H | |
Selected Per Share Data and Ratios | | Period from
June 14, 2012^ to
September 30, 2012 | |
Net Asset Value, Beginning of Period | | $ | 32.87 | | |
Income from Investment Operations: | |
Net Investment Income† | | | 0.10 | | |
Net Realized and Unrealized Gain | | | 1.06 | | |
Total from Investment Operations | | | 1.16 | | |
Net Asset Value, End of Period | | $ | 34.03 | | |
Total Return++ | | | 3.50 | %# | |
Ratios and Supplemental Data: | |
Net Assets, End of Period (Thousands) | | $ | 10 | | |
Ratio of Expenses to Average Net Assets | | | 0.92 | %+* | |
Ratio of Net Investment Income to Average Net Assets | | | 1.03 | %+* | |
Rebate from Morgan Stanley Affiliates to Average Net Assets | | | 0.00 | %§* | |
Portfolio Turnover Rate | | | 26 | %# | |
^ Commencement of Operations.
† Per share amount is based on average shares outstanding.
++ Calculated based on the net asset value which does not reflect sales charges, if applicable, as of the last business day of the period.
+ The Ratios of Expenses and Net Investment Income reflect the rebate of certain Portfolio expenses in connection with the investments in Morgan Stanley affiliates during the period. The effect of the rebate on the ratios is disclosed in the above table as "Ratio of Rebate from Morgan Stanley Affiliates to Average Net Assets."
§ Amount is less than 0.005%.
# Not Annualized.
* Annualized.
The accompanying notes are an integral part of the financial statements.
15
Morgan Stanley Institutional Fund Trust
Annual Report — September 30, 2012
Financial Highlights
Mid Cap Growth Portfolio
| | | Class L | |
Selected Per Share Data and Ratios | | Period from
June 14, 2012^ to
September 30, 2012 | |
Net Asset Value, Beginning of Period | | $ | 32.87 | | |
Income from Investment Operations: | |
Net Investment Income† | | | 0.05 | | |
Net Realized and Unrealized Gain | | | 1.05 | | |
Total from Investment Operations | | | 1.10 | | |
Net Asset Value, End of Period | | $ | 33.97 | | |
Total Return++ | | | 3.35 | %# | |
Ratios and Supplemental Data: | |
Net Assets, End of Period (Thousands) | | $ | 10 | | |
Ratio of Expenses to Average Net Assets | | | 1.50 | %+* | |
Ratio of Net Investment Income to Average Net Assets | | | 0.46 | %+* | |
Rebate from Morgan Stanley Affiliates to Average Net Assets | | | 0.00 | %§* | |
Portfolio Turnover Rate | | | 26 | %# | |
^ Commencement of Operations.
† Per share amount is based on average shares outstanding.
++ Calculated based on the net asset value as of the last business day of the period.
+ The Ratios of Expenses and Net Investment Income reflect the rebate of certain Portfolio expenses in connection with the investments in Morgan Stanley affiliates during the period. The effect of the rebate on the ratios is disclosed in the above table as "Ratio of Rebate from Morgan Stanley Affiliates to Average Net Assets."
§ Amount is less than 0.005%.
# Not Annualized.
* Annualized.
The accompanying notes are an integral part of the financial statements.
16
Morgan Stanley Institutional Fund Trust
Annual Report — September 30, 2012
Notes to Financial Statements
Morgan Stanley Institutional Fund Trust ("MSIFT'' or the "Fund'') is registered under the Investment Company Act of 1940, as amended (the "Act''), as an open-end management investment company. The Fund is comprised of seven separate, active portfolios (individually referred to as a "Portfolio", collectively as the "Portfolios"). All Portfolios are considered diversified for purposes of the Act.
The accompanying financial statements relate to the Mid Cap Growth Portfolio. The Portfolio seeks long-term capital growth. The Portfolio offers four classes of shares — Class I, Class P, Class H and Class L.
The Fund has suspended offering shares of the Mid Cap Growth Portfolio to new investors, with certain exceptions. The Fund will continue to offer shares of the Portfolio to existing shareholders. The Fund may recommence offering shares of the Portfolio to new investors in the future.
A. Significant Accounting Policies: The following significant accounting policies are in conformity with U.S. generally accepted accounting principles ("GAAP"). Such policies are consistently followed by the Fund in the preparation of its financial statements. GAAP may require management to make estimates and assumptions that affect the reported amounts and disclosures in the financial statements. Actual results may differ from those estimates.
1. Security Valuation: Equity securities listed on a U.S. exchange are valued at the latest quoted sales price on the valuation date. Equity securities listed or traded on NASDAQ, for which market quotations are available, are valued at the NASDAQ Official Closing Price. Securities listed on a foreign exchange are valued at their closing price, except as noted below. Unlisted and listed equity securities not traded on the valuation date, for which market quotations are readily available, are valued at the mean between the last reported bid and asked prices obtained from reputable brokers. Short-term debt securities purchased with remaining maturities of 60 days or less are valued at amortized cost, unless the Board of Trustees (the "Trustees") determines such valuation does not reflect the securities' fair value, in which case these securities will be valued at their fair value as determined in good faith under procedures adopted by the Trustees.
Under procedures approved by the Trustees, the Fund's Adviser, Morgan Stanley Investment Management Inc. (the "Adviser"), has formed a Valuation Committee. The Valuation Committee provides administration and
oversight of the Fund's valuation policies and procedures, which are reviewed at least annually by the Trustees. Among other things, these procedures allow the Fund to utilize independent pricing services, quotations from securities and financial instrument dealers, and other market sources to determine fair value.
The Fund has procedures to determine the fair value of securities and other financial instruments for which market prices are not readily available. Under these procedures, the Valuation Committee convenes on a regular and adhoc basis to review such securities and considers a number of factors, including valuation methodologies and significant unobservable valuation inputs, when arriving at fair value. The Valuation Committee may employ a market-based approach which may use related or comparable assets or liabilities, recent transactions, market multiples, book values, and other relevant information for the investment to determine the fair value of the investment. An income-based valuation approach may also be used in which the anticipated future cash flows of the investment are discounted to calculate fair value. Discounts may also be applied due to the nature or duration of any restrictions on the disposition of the investments. Due to the inherent uncertainty of valuations of such investments, the fair values may differ significantly from the values that would have been used had an active market existed. The Valuation Committee employs various methods for calibrating these valuation approaches including a regular review of valuation methodologies, key inputs and assumptions, transactional back-testing or disposition analysis, and reviews of any related market activity.
Most foreign markets close before the New York Stock Exchange ("NYSE"). Occasionally, developments that could affect the closing prices of securities and other assets may occur between the times at which valuations of such securities are determined (that is, close of the foreign market on which the securities trade) and the close of business on the NYSE. If these developments are expected to materially affect the value of the securities, the valuations may be adjusted to reflect the estimated fair value as of the close of the NYSE, as determined in good faith under procedures established by the Trustees.
2. Fair Value Measurement: Financial Accounting Standards Board ("FASB") Accounting Standards CodificationTM ("ASC") 820, "Fair Value Measurements and
17
Morgan Stanley Institutional Fund Trust
Annual Report — September 30, 2012
Notes to Financial Statements (cont'd)
Disclosures" ("ASC 820"), defines fair value as the value that the Fund would receive to sell an investment or pay to transfer a liability in a timely transaction with an independent buyer in the principal market, or in the absence of a principal market the most advantageous market for the investment or liability. ASC 820 establishes a three-tier hierarchy to distinguish between (1) inputs that reflect the assumptions market participants would use in valuing an asset or liability developed based on market data obtained from sources independent of the reporting entity (observable inputs) and (2) inputs that reflect the reporting entity's own assumptions about the assumptions market participants would use in valuing an asset or liability developed based on the best information available in the circumstances (unobservable inputs) and to establish classification of fair value measurements for disclosure purposes. Various inputs are used in determining the value of the Fund's investments. The inputs are summarized in the three broad levels listed below.
• Level 1 – unadjusted quoted prices in active markets for identical investments
• Level 2 – other significant observable inputs (including quoted prices for similar investments, interest rates, prepayment speeds, credit risk, etc.)
• Level 3 – significant unobservable inputs including the Fund's own assumptions in determining the fair value of investments. Factors considered in making this determination may include, but are not limited to, information obtained by contacting the issuer, analysts, or the appropriate stock exchange (for exchange-traded securities), analysis of the issuer's financial statements or other available documents and, if necessary, available information concerning other securities in similar circumstances
The inputs or methodology used for valuing securities are not necessarily an indication of the risk associated with investing in those securities and the determination of the significance of a particular input to the fair value measurement in its entirety requires judgment and considers factors specific to each security.
The following is a summary of the inputs used to value the Portfolio's investments as of September 30, 2012.
Investment Type | | Level 1
Unadjusted
quoted
prices
(000) | | Level 2
Other
significant
observable
inputs
(000) | | Level 3
Significant
unobservable
inputs
(000) | | Total
(000) | |
Assets: | |
Common Stocks | |
Air Transport | | $ | 109,248 | | | $ | — | | | $ | — | | | $ | 109,248 | | |
Alternative Energy | | | 208,486 | | | | — | | | | — | | | | 208,486 | | |
Asset Management &
Custodian | | | 55,530 | | | | — | | | | — | | | | 55,530 | | |
Automobiles | | | 25,112 | | | | — | | | | — | | | | 25,112 | | |
Beverage: Brewers &
Distillers | | | 149,517 | | | | — | | | | — | | | | 149,517 | | |
Biotechnology | | | 313,789 | | | | — | | | | — | | | | 313,789 | | |
Cement | | | 73,604 | | | | — | | | | — | | | | 73,604 | | |
Chemicals: Diversified | | | 162,770 | | | | — | | | | — | | | | 162,770 | | |
Commercial Services | | | 531,546 | | | | — | | | | — | | | | 531,546 | | |
Communications
Technology | | | 237,201 | | | | — | | | | — | | | | 237,201 | | |
Computer Services,
Software & Systems | | | 964,545 | | | | — | | | | — | | | | 964,545 | | |
Computer Technology | | | 222,273 | | | | — | | | | 32,283 | | | | 254,556 | | |
Consumer Lending | | | 103,613 | | | | — | | | | — | | | | 103,613 | | |
Consumer Services:
Miscellaneous | | | 105,566 | | | | — | | | | — | | | | 105,566 | | |
Diversified Media | | | 225,286 | | | | — | | | | — | | | | 225,286 | | |
Diversified Retail | | | 166,449 | | | | — | | | | — | | | | 166,449 | | |
Education Services | | | 63,494 | | | | — | | | | — | | | | 63,494 | | |
Electronic Components | | | 95,658 | | | | — | | | | — | | | | 95,658 | | |
Financial Data & Systems | | | 376,022 | | | | — | | | | — | | | | 376,022 | | |
Health Care Services | | | 268,726 | | | | — | | | | — | | | | 268,726 | | |
Insurance:
Property-Casualty | | | 114,939 | | | | — | | | | — | | | | 114,939 | | |
Media | | | — | | | | — | | | | 36,896 | | | | 36,896 | | |
Medical & Dental
Instruments &
Supplies | | | 88,318 | | | | — | | | | — | | | | 88,318 | | |
Medical Equipment | | | 204,872 | | | | — | | | | — | | | | 204,872 | | |
Metals & Minerals:
Diversified | | | 48,978 | | | | — | | | | — | | | | 48,978 | | |
Pharmaceuticals | | | 235,042 | | | | — | | | | — | | | | 235,042 | | |
Publishing | | | 96,569 | | | | — | | | | — | | | | 96,569 | | |
Recreational Vehicles &
Boats | | | 210,401 | | | | — | | | | — | | | | 210,401 | | |
Restaurants | | | 80,487 | | | | — | | | | — | | | | 80,487 | | |
Scientific Instruments:
Pollution Control | | | 78,259 | | | | — | | | | — | | | | 78,259 | | |
Semiconductors &
Components | | | 47,688 | | | | — | | | | — | | | | 47,688 | | |
Utilities: Electrical | | | 239,399 | | | | — | | | | — | | | | 239,399 | | |
Total Common Stocks | | | 5,903,387 | | | | — | | | | 69,179 | | | | 5,972,566 | | |
Convertible Preferred
Stocks | | | — | | | | — | | | | 57,738 | | | | 57,738 | | |
Preferred Stock | | | — | | | | — | | | | 11,200 | | | | 11,200 | | |
Short-Term Investment —
Investment Company | | | 35,346 | | | | — | | | | — | | | | 35,346 | | |
Total Assets | | $ | 5,938,733 | | | $ | — | | | $ | 138,117 | | | $ | 6,076,850 | | |
18
Morgan Stanley Institutional Fund Trust
Annual Report — September 30, 2012
Notes to Financial Statements (cont'd)
Transfers between investment levels may occur as the markets fluctuate and/or the availability of data used in an investment's valuation changes. The Portfolio recognizes transfers between the levels as of the end of the period. As of September 30, 2012, securities with a total value of approximately $405,992,000 transferred from Level 2 to Level 1. At September 30, 2011, the fair market value of certain securities were adjusted due to developments which occurred between the time of the close of the foreign markets on which they trade and the close of business on the NYSE which resulted in their Level 2 classification.
Following is a reconciliation of investments in which significant unobservable inputs (Level 3) were used in determining fair value.
| | | Common
Stocks
(000) | | Convertible
Preferred
Stocks
(000) | | Preferred
Stock
(000) | |
Beginning Balance | | $ | — | | | $ | 118,412 | | | $ | 47,566 | | |
Purchases | | | 69,179 | | | | 44,464 | | | | 11,200 | | |
Sales | | | — | | | | — | | | | — | | |
Amortization of discount | | | — | | | | — | | | | — | | |
Transfers in | | | — | | | | — | | | | — | | |
Transfers out | | | — | | | | — | | | | — | | |
Corporate Action | | | — | | | | (47,330 | ) | | | (47,566 | ) | |
Change in unrealized appreciation
(depreciation) | | | — | | | | (57,808 | ) | | | — | | |
Realized gains (losses) | | | — | | | | — | | | | — | | |
Ending Balance | | $ | 69,179 | | | $ | 57,738 | | | $ | 11,200 | | |
Net change in unrealized
appreciation/depreciation from
investments still held as of
September 30, 2012 | | $ | — | | | $ | (9,250 | ) | | $ | — | | |
The following table presents additional information about valuation techniques and inputs used for investments that are measured at fair value and categorized within Level 3 as of September 30, 2012.
| | | Fair Value at
September 30, 2012
(000) | |
Valuation
Technique(s) | |
Unobservable
Input | |
Range | |
Weighted
Average | | Impact to
Valuation from an
Increase in Input | |
| Alternative Energy | |
| Convertible Preferred Stocks | | $ | 35,419 | | | Discounted cash flow | | Weighted average
cost of capital | | | 22.5 | % | | | 27.5 | % | | | 25.0 | % | | Decrease | |
| | | | | | Perpetual growth rate | | | 2.5 | % | | | 3.5 | % | | | 3.0 | % | | Increase | |
| | | | Market Comparable
Companies | | Enterprise Value/
Revenue | | | 3.0 | x | | | 3.6 | x | | | 3.3 | x | | Increase | |
| | | | | | Discount for lack of
marketability | | | 15 | % | | | 15 | % | | | 15 | % | | Decrease | |
Computer Services,
Software & Systems | |
| Convertible Preferred Stock | | $ | 15,313 | | | Market Transaction | | Purchase Price
of Preferred | | $ | 19 | | | $ | 19 | | | $ | 19 | | | Increase | |
| | | | Market Comparable
Companies | | Enterprise Value/
Revenue | | | 6.4 | x | | | 14.8 | x | | | 9.4 | x | | Increase | |
| | | | | | Discount for lack of
marketability | | | 10 | % | | | 10 | % | | | 10 | % | | Decrease | |
| Preferred Stock | | $ | 11,200 | | | Discounted cash flow | | Weighted average
cost of capital | | | 15.0 | % | | | 19.0 | % | | | 17.0 | % | | Decrease | |
| | | | | | Perpetual growth rate | | | 2.0 | % | | | 3.0 | % | | | 2.5 | % | | Increase | |
| | | | Market Comparable
Companies | | Enterprise Value/
Revenue | | | 7.9 | x | | | 21.2 | x | | | 14.1 | x | | Increase | |
| | | | | | Discount for lack of
marketability | | | 15 | % | | | 15 | % | | | 15 | % | | Decrease | |
19
Morgan Stanley Institutional Fund Trust
Annual Report — September 30, 2012
Notes to Financial Statements (cont'd)
| | Fair Value at
September 30, 2012
(000) | |
Valuation
Technique(s) | |
Unobservable
Input | |
Range | |
Weighted
Average | | Impact to
Valuation from an
Increase in Input | |
Computer Technology | |
Common Stock | | $ | 32,283 | | | Discounted cash flow | | Weighted average
cost of capital | | | 16.0 | % | | | 20.0 | % | | | 18.0 | % | | Decrease | |
| | | | | | Perpetual growth rate | | | 2.0 | % | | | 3.0 | % | | | 2.5 | % | | Increase | |
Convertible Preferred Stock | | | 3,205 | | | Market Comparable
Companies | | Enterprise Value/
Revenue | | | 6.3 | x | | | 9.1 | x | | | 7.7 | x | | Increase | |
| | | | | | | Discount for lack of
marketability | | | 10 | % | | | 10 | % | | | 10 | % | | Decrease | |
Media | |
Common Stock | | $ | 36,896 | | | Discounted cash flow | | Weighted average
cost of capital | | | 15 | % | | | 18 | % | | | 16.5 | % | | Decrease | |
| | | | | | | Perpetual growth rate | | | 2.0 | % | | | 3.0 | % | | | 2.5 | % | | Increase | |
| | | | | Market Comparable
Companies | | Enterprise Value/
EBITDA | | | 10.8 | x | | | 12.0 | x | | | 11.4 | x | | Increase | |
| | | | | | | Discount for lack of
marketability | | | 10 | % | | | 10 | % | | | 10 | % | | Decrease | |
| | | | | | | Equity Value/
Net Income | | | 12.1 | x | | | 18.8 | x | | | 15.5 | x | | Increase | |
| | | | | | | Discount for lack of
marketability | | | 10 | % | | | 10 | % | | | 10 | % | | Decrease | |
Technology: Miscellaneous | |
Convertible Preferred Stock | | $ | 3,801 | | | Discounted cash flow | | Weighted average
cost of capital | | | 26.0 | % | | | 30.0 | % | | | 28.0 | % | | Decrease | |
| | | | | | | Perpetual growth rate | | | 5.0 | % | | | 6.0 | % | | | 5.5 | % | | Increase | |
| | | | | Market Comparable
Companies | | Enterprise Value/
Revenue | | | 1.3 | x | | | 2.4 | x | | | 2.2 | x | | Increase | |
| | | | | | | Discount for lack of
marketability | | | 10 | % | | | 10 | % | | | 10 | % | | Decrease | |
3. Foreign Currency Translation and Foreign Investments: The books and records of the Fund are maintained in U.S. dollars. Foreign currency amounts are translated into U.S. dollars at the mean of the bid and ask prices of such currencies against U.S. dollars last quoted by a major bank as follows:
– investments, other assets and liabilities at the prevailing rate of exchange on the valuation date;
– investment transactions and investment income at the prevailing rates of exchange on the dates of such transactions.
Although the net assets of the Fund are presented at the foreign exchange rates and market values at the close of the period, the Fund does not isolate that portion of the results of operations arising as a result of changes in the foreign exchange rates from the fluctuations arising from
changes in the market prices of securities held at period end. Similarly, the Fund does not isolate the effect of changes in foreign exchange rates from the fluctuations arising from changes in the market prices of securities sold during the period. Accordingly, realized and unrealized foreign currency gains (losses) on investments in securities are included in the reported net realized and unrealized gains (losses) on investment transactions and balances. However, pursuant to U.S. Federal income tax regulations, gains and losses from certain foreign currency transactions and the foreign currency portion of gains and losses realized on sales and maturities of foreign denominated debt securities are treated as ordinary income for U.S. Federal income tax purposes.
Net realized gains (losses) on foreign currency transactions represent net foreign exchange gains (losses) from foreign currency exchange contracts, disposition of
20
Morgan Stanley Institutional Fund Trust
Annual Report — September 30, 2012
Notes to Financial Statements (cont'd)
foreign currencies, currency gains (losses) realized between the trade and settlement dates on securities transactions, and the difference between the amount of investment income and foreign withholding taxes recorded on the Fund's books and the U.S. dollar equivalent amounts actually received or paid. Net unrealized currency gains (losses) from valuing foreign currency denominated assets and liabilities at period end exchange rates are reflected as a component of unrealized appreciation (depreciation) on the Statement of Assets and Liabilities. The change in unrealized currency gains (losses) on foreign currency translations for the period is reflected in the Statement of Operations.
Foreign security and currency transactions may involve certain considerations and risks not typically associated with those of U.S. dollar denominated transactions as a result of, among other factors, fluctuations of exchange rates in relation to the U.S. dollar, the possibility of lower levels of governmental supervision and regulation of foreign securities markets and the possibility of political or economic instability.
The net assets of the Portfolio include foreign denominated securities and currency. Changes in currency exchange rates will affect the U.S. Dollar value of and investment income from such securities. Further, at times the Portfolio's investments are concentrated in a limited number of countries and regions. This concentration may further increase the risk of the Portfolio.
Governmental approval for foreign investments may be required in advance of making an investment under certain circumstances in some countries, and the extent of foreign investments in domestic companies may be subject to limitation in other countries. Foreign ownership limitations also may be imposed by the charters of individual companies to prevent, among other concerns, violations of foreign investment limitations. As a result, an additional class of shares (identified as "Foreign" in the Portfolio of Investments) may be created and offered for investment. The "local" and "foreign shares" market values may differ. In the absence of trading of the foreign shares in such markets, the Fund values the foreign shares at the closing exchange price of the local shares. Such securities, if any, are identified as fair valued in the Portfolio of Investments.
4. Restricted Securities: The Portfolio invested in unregistered or otherwise restricted securities. The term "restricted securities" refers to securities that are unregistered or are held by control persons of the issuer and securities that are subject to contractual restrictions on their resale. As a result, restricted securities may be more difficult to value and the Portfolio may have difficulty disposing of such assets either in a timely manner or for a reasonable price. In order to dispose of an unregistered security, the Portfolio, where it has contractual rights to do so, may have to cause such security to be registered. A considerable period may elapse between the time the decision is made to sell the security and the time the security is registered so that the Portfolio could sell it. Contractual restrictions on the resale of securities vary in length and scope and are generally the result of a negotiation between the issuer and acquirer of the securities. The Portfolio would, in either case, bear market risks during that period. Restricted Securities are identified in the Portfolio of Investments.
5. Indemnifications: The Fund enters into contracts that contain a variety of indemnifications. The Fund's maximum exposure under these arrangements is unknown. However, the Fund has not had prior claims or losses pursuant to these contracts and expects the risk of loss to be remote.
6. Other: Security transactions are accounted for on the date the securities are purchased or sold. Realized gains (losses) on the sale of investment securities are determined on the specific identified cost basis. Dividend income and distributions are recorded on the ex-dividend date (except for certain foreign dividends which may be recorded as soon as the Fund is informed of such dividends) net of applicable withholding taxes. Interest income is recognized on the accrual basis except where collection is in doubt. Discounts and premiums on securities purchased are amortized according to the effective yield method over their respective lives. Most expenses of the Fund can be directly attributed to a particular Portfolio. Expenses which cannot be directly attributed are apportioned among the Portfolios based upon relative net assets or other appropriate measures. Income, expenses (other than class specific expenses) and realized and unrealized gains or losses are allocated to each class of shares based upon their relative net assets.
B. Advisory Fees: The Adviser, a wholly-owned subsidiary of Morgan Stanley, provides the Portfolio with advisory services under the terms of an Investment Advisory Agreement,
21
Morgan Stanley Institutional Fund Trust
Annual Report — September 30, 2012
Notes to Financial Statements (cont'd)
paid quarterly, at an annual rate of 0.50% of the average daily net assets of the Portfolio.
C. Administration Fees: The Adviser also serves as Administrator to the Fund and provides administrative services pursuant to an Administration Agreement for an annual fee, accrued daily and paid monthly, of 0.08% of the Portfolio's average daily net assets.
Under a Sub-Administration Agreement between the Administrator and State Street Bank and Trust Company ("State Street"), State Street provides certain administrative services to the Fund. For such services, the Administrator pays State Street a portion of the fee the Administrator receives from the Fund.
D. Distribution and Shareholder Services Fees: Morgan Stanley Distribution, Inc. ("MSDI" or the "Distributor"), a wholly-owned subsidiary of the Adviser, and an indirect subsidiary of Morgan Stanley, serves as the Fund's Distributor of Portfolio shares pursuant to a Distribution agreement. The Fund has adopted Shareholder Services Plans with respect to Class P and Class H shares pursuant to Rule 12b-1 under the Act. Under the Shareholder Services Plans, the Portfolio pays the Distributor a shareholder services fee, accrued daily and paid monthly, at an annual rate of 0.25% of the Portfolio's average daily net assets attributable to Class P and Class H shares.
The Fund has adopted a Distribution and Shareholder Services Plan with respect to Class L shares pursuant to Rule 12b-1 under the Act. Under the Distribution and Shareholder Services Plan, the Portfolio pays the Distributor a distribution fee, accrued daily and paid monthly, at an annual rate of 0.50% and a shareholder service fee, accrued daily and paid monthly, at an annual rate of 0.25% of the Portfolio's average daily net assets attributable to Class L shares.
The distribution and shareholder services fees are used to support the expenses associated with servicing and maintaining accounts. The Distributor may compensate other parties for providing shareholder support services to investors who purchase Class P, Class H and Class L shares.
E. Dividend Disbursing and Transfer Agent: The Fund's dividend disbursing and transfer agent is Morgan Stanley Services Company Inc. ("Morgan Stanley Services"). Pursuant to a transfer agency agreement, the Fund pays Morgan Stanley Services a fee based on the number of classes, accounts and transactions relating to the Portfolios of the Fund.
F. Custodian Fees: State Street (the "Custodian") serves as Custodian for the Fund in accordance with a custodian agreement. The Custodian holds cash, securities, and other assets of the Fund as required by the Act. Custody fees are payable monthly based on assets held in custody, investment purchases and sales activity and account maintenance fees, plus reimbursement for certain out-of-pocket expenses.
The Fund has entered into an arrangement with its Custodian whereby credits realized on uninvested cash balances were used to offset a portion of the Portfolio's expenses. If applicable, these custodian credits are shown as "Expense Offset" in the Statement of Operations.
G. Security Transactions and Transactions with Affiliates: For the year ended September 30, 2012, purchases and sales of investment securities for the Portfolio, other than long-term U.S. Government securities and short-term investments, were approximately $1,664,703,000 and $2,306,256,000, respectively. There were no purchases and sales of long-term U.S. Government securities for the year ended September 30, 2012.
The Portfolio invests in the Institutional Class of the Morgan Stanley Institutional Liquidity Funds — Money Market Portfolio (the "Liquidity Funds"), an open-end management investment company managed by the Adviser. Advisory fees paid by the Portfolio are reduced by an amount equal to its pro-rata share of the advisory and administration fees paid by the Portfolio due to its investment in the Liquidity Funds. For the year ended September 30, 2012, advisory fees paid were reduced by approximately $252,000 relating to the Portfolio's investment in the Liquidity Funds.
A summary of the Portfolio's transactions in shares of the Liquidity Funds during the year ended September 30, 2012 is as follows:
Value
September 30,
2011
(000) | | Purchases
at Cost
(000) | | Sales
(000) | | Dividend
Income
(000) | | Value
September 30,
2012
(000) | |
| $ | 280,754 | | | $ | 1,074,269 | | | $ | 1,319,677 | | | $ | 254 | | | $ | 35,346 | | |
During the year ended September 30, 2012, the Portfolio incurred approximately $43,000 in brokerage commissions with Citigroup, Inc., and its affiliated broker-dealers, which may be deemed affiliates of the Adviser, Administrator and Distributor under Section 17 of the Act, for portfolio transactions executed on behalf of the Portfolio.
During the year ended September 30, 2012, the Portfolio incurred approximately $29,000 in brokerage commissions with
22
Morgan Stanley Institutional Fund Trust
Annual Report — September 30, 2012
Notes to Financial Statements (cont'd)
Morgan Stanley & Co., LLC, an affiliate of the Adviser, Administrator and Distributor, for portfolio transactions executed on behalf of the Portfolio.
The Portfolio has an unfunded Deferred Compensation Plan (the "Compensation Plan"), which allows each independent Trustee to defer payment of all, or a portion, of the fees he or she receives for serving on the Board of Trustees. Each eligible Trustee generally may elect to have the deferred amounts credited with a return equal to the total return on one or more of the Morgan Stanley funds that are offered as investment options under the Compensation Plan. Appreciation/depreciation and distributions received from these investments are recorded with an offsetting increase/decrease in the deferred compensation obligation and do not affect the net asset value of the Portfolio.
H. Federal Income Taxes: It is the Portfolio's intention to continue to qualify as a regulated investment company and distribute all of its taxable and tax-exempt income. Accordingly, no provision for Federal income taxes is required in the financial statements.
Dividend income and distributions to shareholders are recorded on the ex-dividend date. Interest income is recognized on an accrual basis. Dividends from net investment income, if any, are declared and paid annually. Net realized capital gains, if any, are distributed at least annually.
The Portfolio may be subject to taxes imposed by countries in which it invests. Such taxes are generally based on income and/or capital gains earned or repatriated. Taxes are accrued based on net investment income, net realized gains and net unrealized appreciation as such income and/or gains are earned. Taxes may also be based on transactions in foreign currency and are accrued based on the value of investments denominated in such currency.
FASB ASC 740-10, Income Taxes — Overall, sets forth a minimum threshold for financial statement recognition of the benefit of a tax position taken or expected to be taken in a tax return. Management has concluded there are no significant uncertain tax positions that would require recognition in the financial statements. If applicable, the Portfolio recognizes interest accrued related to unrecognized tax benefits in "Interest Expense" and penalties in "Other Expenses" in the Statement of Operations. The Portfolio files tax returns with the U.S. Internal Revenue Service, New York and various states. Each of the tax years in the four-year period ended September 30, 2012, remains subject to examination by taxing authorities.
The tax character of distributions paid may differ from the character of distributions shown in the Statements of Changes in Net Assets due to short-term capital gains being treated as ordinary income for tax purposes. The tax character of distributions paid during fiscal 2012 and 2011 was as follows:
2012
Distributions
Paid From: | | 2011
Distributions
Paid From: | |
Ordinary
Income
(000) | | Long-Term
Capital Gain
(000) | | Ordinary
Income
(000) | | Long-Term
Capital Gain
(000) | |
| $ | 16,705 | | | $ | 331,169 | | | $ | 8,346 | | | $ | 4,087 | | |
The amount and character of income and gains to be distributed are determined in accordance with income tax regulations which may differ from GAAP. These book/tax differences are either considered temporary or permanent in nature.
Temporary differences are attributable to differing book and tax treatments for the timing of the recognition of gains (losses) on certain investment transactions and the timing of the deductibility of certain expenses.
Permanent differences, primarily due to differing treatments of gains (losses) related to foreign currency transactions, distribution redesignations, in-kind redemptions, basis adjustments for return of capital sold and tax adjustments on passive foreign investment companies and partnership investments held and sold by the Portfolio, resulted in the following reclassifications among the components of net assets at September 30, 2012:
Accumulated
Undistributed
Net Investment
Income
(000) | | Accumulated
Undistributed
Net Realized
Gain
(000) | | Paid-in-
Capital
(000) | |
| $ | (17,205 | ) | | $ | 76,295 | | | $ | (59,090 | ) | |
At September 30, 2012, the components of distributable earnings for the Portfolio on a tax basis were as follows:
Undistributed
Ordinary
Income
(000) | | Undistributed
Long-Term
Capital Gain
(000) | |
| $ | 6,308 | | | $ | 163,716 | | |
At September 30, 2012, the aggregate cost for federal income tax purposes is approximately $5,551,378,000. The aggregate gross unrealized appreciation is approximately $1,203,275,000 and the aggregate gross unrealized depreciation is approximately $677,804,000 resulting in net unrealized appreciation of approximately $525,471,000.
On December 22, 2010, the Regulated Investment Company Modernization Act of 2010 (the "Modernization Act") was signed into law. The Modernization Act modernizes several tax provisions related to Regulated Investment Companies
23
Morgan Stanley Institutional Fund Trust
Annual Report — September 30, 2012
Notes to Financial Statements (cont'd)
("RICs") and their shareholders. One key change made by the Modernization Act is that capital losses will generally retain their character as short-term or long-term and may be carried forward indefinitely to offset future gains. These losses are utilized before other capital loss carryforwards that expire. Generally, the Modernization Act is effective for taxable years beginning after December 22, 2010.
For the year ended September 30, 2012, the Portfolio realized losses from in-kind redemptions of approximately $59,735,000. These losses are not tax deductible to the Portfolio.
I. Other (unaudited): At September 30, 2012, the Portfolio had otherwise unaffiliated record owners of 10% or greater. Investment activities of these shareholders could have a material impact on the Portfolio. The aggregate percentage of such owners was 45.2% and 59.5%, for Class I and Class P shares, respectively.
J. Accounting Pronouncement: In December 2011, FASB issued Accounting Standards Update ("ASU") 2011-11, Balance Sheet: Disclosures about Offsetting Assets and Liabilities. The pronouncement improves disclosures for recognized financial and derivative instruments that are either offset on the balance sheet in accordance with the offsetting guidance in ASC 210-20-45 or ASC 815-10-45 or are subject to an enforceable master netting agreements or similar. The Fund will be required to disclose information about rights to offset and related arrangements (such as collateral agreements) in order to enable financial statement users to understand the effect of those rights and arrangements on its financial position as well as disclose the following (1) gross amounts; (2) amounts offset in the statement of financial position; (3) any other amounts that can be offset in the event of bankruptcy, insolvency or default of any of the parties (including cash and noncash financial collateral); and (4) the Fund's net exposure. The requirements are effective for annual reporting periods beginning on or after January 1, 2013, and must be applied retrospectively. At this time, the Fund's management is evaluating the implications of ASU 2011-11 and its impact, if any, on the financial statements.
24
Morgan Stanley Institutional Fund Trust
Annual Report — September 30, 2012
Report of Independent Registered Public Accounting Firm
To the Shareholders and Board of Trustees of
Morgan Stanley Institutional Fund Trust —
Mid Cap Growth Portfolio
We have audited the accompanying statement of assets and liabilities, including the portfolio of investments, of Mid Cap Growth Portfolio (one of the portfolios constituting Morgan Stanley Institutional Fund Trust) (the "Portfolio") as of September 30, 2012, and the related statement of operations for the year then ended, the statements of changes in net assets for each of the two years in the period then ended, and the financial highlights for each of the periods indicated therein. These financial statements and financial highlights are the responsibility of the Portfolio's management. Our responsibility is to express an opinion on these financial statements and financial highlights based on our audits.
We conducted our audits in accordance with the standards of the Public Company Accounting Oversight Board (United States). Those standards require that we plan and perform the audit to obtain reasonable assurance about whether the financial statements and financial highlights are free of material misstatement. We were not engaged to perform an audit of the Portfolio's internal control over financial reporting. Our audits included consideration of internal control over financial reporting as a basis for designing audit procedures that are appropriate in the circumstances, but not for the purpose of expressing an opinion on the effectiveness of the Portfolio's internal control over financial reporting. Accordingly, we express no such opinion. An audit also includes examining, on a test basis, evidence supporting the amounts and disclosures in the financial statements and financial highlights, assessing the accounting principles used and significant estimates made by management, and evaluating the overall financial statement presentation. Our procedures included confirmation of securities owned as of September 30, 2012, by correspondence with the custodian and others, or by other appropriate auditing procedures where replies from others were not received. We believe that our audits provide a reasonable basis for our opinion.
In our opinion, the financial statements and financial highlights referred to above present fairly, in all material respects, the financial position of Mid Cap Growth Portfolio of Morgan Stanley Institutional Fund Trust at September 30, 2012, the results of its operations for the year then ended, the changes in its net assets for each of the two years in the period then ended, and the financial highlights for each of the periods indicated therein, in conformity with U.S. generally accepted accounting principles.

Boston, Massachusetts
November 27, 2012
25
Morgan Stanley Institutional Fund Trust
Annual Report — September 30, 2012
Federal Tax Notice (unaudited)
For Federal income tax purposes, the following information is furnished with respect to the distributions paid by the Portfolio during its taxable year ended September 30, 2012. For corporate shareholders, 100% of the dividends qualified for the dividends received deduction.
The Portfolio designated and paid $331,169,267 as a long-term capital gain distribution.
For Federal income tax purposes, the following information is furnished with respect to the Portfolio's earnings for its taxable year ended September 30, 2012. When distributed, certain earnings may be subject to a maximum tax rate of 15% as provided for by the Jobs and Growth Tax Relief Reconciliation Act of 2003. The Portfolio designated up to a maximum of $41,021,319 as taxable at this lower rate.
In January, the Fund provides tax information to shareholders for the preceding calendar year.
26
Morgan Stanley Institutional Fund Trust
Annual Report — September 30, 2012
U.S. Privacy Policy (unaudited)
AN IMPORTANT NOTICE CONCERNING OUR U.S. PRIVACY POLICY
This privacy notice describes the U.S. privacy policy of Morgan Stanley Distribution, Inc., and the Morgan Stanley family of mutual funds ("us", "our", "we").
We are required by federal law to provide you with notice of our U.S. privacy policy ("Policy"). This Policy applies to both our current and former clients unless we state otherwise and is intended for individual clients who purchase products or receive services from us for personal, family or household purposes. This Policy is not applicable to partnerships, corporations, trusts or other non-individual clients or account holders, nor is this Policy applicable to individuals who are either beneficiaries of a trust for which we serve as trustee or participants in an employee benefit plan administered or advised by us. This Policy is, however, applicable to individuals who select us to be a custodian of securities or assets in individual retirement accounts, 401(k) accounts, or accounts subject to the Uniform Gifts to Minors Act.
This notice sets out our business practices to protect your privacy; how we collect and share personal information about you; and how you can limit our sharing or certain uses by others of this information. We may amend this Policy at any time, and will inform you of any changes to our Policy as required by law.
WE RESPECT YOUR PRIVACY
We appreciate that you have provided us with your personal financial information and understand your concerns about your information. We strive to safeguard the information our clients entrust to us. Protecting the confidentiality and security of client information is an important part of how we conduct our business.
This notice describes what personal information we collect about you, how we collect it, when we may share it with others, and how certain others may use it. It discusses the steps you may take to limit our sharing of certain information about you with our affiliated companies, including, but not limited to our affiliated banking businesses, brokerage firms and credit service affiliates. It also discloses how you may limit our affiliates' use of shared information for marketing purposes.
Throughout this Policy, we refer to the nonpublic information that personally identifies you as "personal information." We also use the term "affiliated company" in this notice. An affiliated company is a company in our family of companies and includes companies with the Morgan Stanley name. These affiliated companies are financial institutions such as broker-dealers, banks, investment advisers and credit card issuers. We refer to any company that is not an affiliated company as a nonaffiliated third party. For purposes of Section 5 of this notice, and your ability to limit certain uses of personal information by our affiliates, this notice applies to the use of personal information by our affiliated companies.
1. WHAT PERSONAL INFORMATION DO WE COLLECT FROM YOU?
We may collect the following types of information about you: (i) information provided by you, including information from applications and other forms we receive from you, (ii) information about your transactions with us or our affiliates, (iii) information about your transactions with nonaffiliated third parties, (iv) information from consumer reporting agencies, (v) information obtained from our websites, and (vi) information obtained from other sources. For example:
• We collect information such as your name, address, e-mail address, telephone/fax numbers, assets, income and investment objectives through applications and other forms you submit to us.
• We may obtain information about account balances, your use of account(s) and the types of products and services you prefer to receive from us through your dealings and transactions with us and other sources.
• We may obtain information about your creditworthiness and credit history from consumer reporting agencies.
• We may collect background information from and through third-party vendors to verify representations you have made and to comply with various regulatory requirements.
2. WHEN DO WE DISCLOSE PERSONAL INFORMATION WE COLLECT ABOUT YOU?
We may disclose personal information we collect about you in each of the categories listed above to affiliated and nonaffiliated third parties.
27
Morgan Stanley Institutional Fund Trust
Annual Report — September 30, 2012
U.S. Privacy Policy (unaudited) (cont'd)
a. Information we disclose to affiliated companies.
We may disclose personal information that we collect about you to our affiliated companies to manage your account(s) effectively, to service and process your transactions, and to let you know about products and services offered by us and affiliated companies, to manage our business, and as otherwise required or permitted by law. Offers for products and services from affiliated companies are developed under conditions designed to safeguard your personal information.
b. Information we disclose to third parties.
We may disclose personal information that we collect about you to nonaffiliated third parties to provide marketing services on our behalf or to other financial institutions with whom we have joint marketing agreements. We may also disclose all of the information we collect to other nonaffiliated third parties for our everyday business purposes, such as to process transactions, maintain account(s), respond to court orders and legal investigations, report to credit bureaus, offer our own products and services, protect against fraud, for institutional risk control, to perform services on our behalf, and as otherwise required or permitted by law.
When we share personal information about you with a nonaffiliated third party, they are required to limit their use of personal information about you to the particular purpose for which it was shared and they are not allowed to share personal information about you with others except to fulfill that limited purpose or as may be permitted or required by law.
3. HOW DO WE PROTECT THE SECURITY AND CONFIDENTIALITY OF PERSONAL INFORMATION WE COLLECT ABOUT YOU?
We maintain physical, electronic and procedural security measures that comply with applicable law and regulations to help safeguard the personal information we collect about you. We have internal policies governing the proper handling of client information by employees. Third parties that provide support or marketing services on our behalf may also receive personal information about you, and we require them to adhere to appropriate security standards with respect to such information.
4. HOW CAN YOU LIMIT OUR SHARING CERTAIN PERSONAL INFORMATION ABOUT YOU WITH OUR AFFILIATED COMPANIES FOR ELIGIBILITY DETERMINATION?
By following the opt-out procedures in Section 6 below, you may limit the extent to which we share with our affiliated companies, personal information that was collected to determine your eligibility for products and services such as your credit reports and other information that you have provided to us or that we may obtain from third parties ("eligibility information"). Eligibility information does not include your identification information or personal information pertaining to our transactions or experiences with you. Please note that, even if you direct us not to share eligibility information with our affiliated companies, we may still share your personal information, including eligibility information, with our affiliated companies under circumstances that are permitted under applicable law, such as to process transactions or to service your account.
5. HOW CAN YOU LIMIT THE USE OF CERTAIN PERSONAL INFORMATION ABOUT YOU BY OUR AFFILIATED COMPANIES FOR MARKETING?
By following the opt-out instructions in Section 6 below, you may limit our affiliated companies from marketing their products or services to you based on personal information we disclose to them. This information may include, for example, your income and account history with us. Please note that, even if you choose to limit our affiliated companies from using personal information about you that we may share with them for marketing their products and services to you, our affiliated companies may use your personal information that they obtain from us to market to you in circumstances permitted by law, such as if the affiliated party has its own relationship with you.
28
Morgan Stanley Institutional Fund Trust
Annual Report — September 30, 2012
U.S. Privacy Policy (unaudited) (cont'd)
6. HOW CAN YOU SEND US AN OPT-OUT INSTRUCTION?
If you wish to limit our sharing of eligibility information about you with our affiliated companies, or our affiliated companies' use of personal information for marketing purposes, as described in this notice, you may do so by:
• Calling us at (800) 548-7786
Monday–Friday between 8a.m. and 5p.m. (EST)
• Writing to us at the following address:
Morgan Stanley Services Company Inc.
c/o Privacy Coordinator
201 Plaza Two, 3rd Floor
Jersey City, New Jersey 07311
If you choose to write to us, your request should include: your name, address, telephone number and account number(s) to which the opt-out applies and whether you are opting out with respect to sharing of eligibility information (Section 4 above), or information used for marketing (Section 5 above), or both. Written opt-out requests should not be sent with any other correspondence. In order to process your request, we require that the request be provided by you directly and not through a third party. Once you have informed us about your privacy preferences, your opt-out preference will remain in effect with respect to this Policy (as it may be amended) until you notify us otherwise. If you are a joint account owner, we will accept instructions from any one of you and apply those instructions to the entire account.
Please understand that if you limit our sharing or our affiliated companies' use of personal information, you and any joint account holder(s) may not receive information about our affiliated companies' products and services, including products or services that could help you manage your financial resources and achieve your investment objectives.
If you have more than one account or relationship with us, please specify the accounts to which you would like us to apply your privacy choices. If you have accounts or relationships with our affiliates, you may receive multiple privacy policies from them, and will need to separately notify those companies of your privacy choices for those accounts or relationships.
7. WHAT IF AN AFFILIATED COMPANY BECOMES A NONAFFILIATED THIRD PARTY?
If, at any time in the future, an affiliated company becomes a nonaffiliated third party, further disclosures of personal information made to the former affiliated company will be limited to those described in Section 2(b) above relating to nonaffiliated third parties. If you elected under Section 6 to limit disclosures we make to affiliated companies, or use of personal information by affiliated companies, your election will not apply to use by any former affiliated company of your personal information in their possession once it becomes a nonaffiliated third party.
SPECIAL NOTICE TO RESIDENTS OF VERMONT
The following section supplements our Policy with respect to our individual clients who have a Vermont address and supersedes anything to the contrary in the above Policy with respect to those clients only.
The State of Vermont requires financial institutions to obtain your consent prior to sharing personal information that they collect about you with nonaffiliated third parties, or eligibility information with affiliated companies, other than in certain limited circumstances. Except as permitted by law, we will not share personal information we collect about you with nonaffiliated third parties or eligibility information with affiliated companies, unless you provide us with your written consent to share such information.
SPECIAL NOTICE TO RESIDENTS OF CALIFORNIA
The following section supplements our Policy with respect to our individual clients who have a California address and supersedes anything to the contrary in the above Policy with respect to those clients only.
In response to a California law, if your account has a California home address, your personal information will not be disclosed to nonaffiliated third parties except as permitted by applicable California law, and we will limit sharing such personal information with our affiliates to comply with California privacy laws that apply to us.
29
Morgan Stanley Institutional Fund Trust
Annual Report — September 30, 2012
Trustee and Officer Information (unaudited)
Independent Trustees:
Name, Age and Address of
Independent Trustee | | Position(s)
Held with
Registrant | | Length of Time
Served* | | Principal Occupation(s) During Past 5 Years | | Number of
Portfolios in
Fund Complex
Overseen by
Independent
Trustee** | | Other Directorships
Held by Independent
Trustee*** | |
Frank L. Bowman (67)
c/o Kramer Levin Naftalis &
Frankel LLP
Counsel to the Independent
Trustees
1177 Avenue of the Americas
New York, NY 10036 | | Trustee | | Since
August
2006 | | President, Strategic Decisions, LLC (consulting) (since February 2009); Director or Trustee of various Morgan Stanley Funds (since August 2006); Chairperson of the Insurance Sub-Committee of the Compliance and Insurance Committee (since February 2007); served as President and Chief Executive Officer of the Nuclear Energy Institute (policy organization) (February 2005-November 2008); retired as Admiral, U.S. Navy after serving over 38 years on active duty including 8 years as Director of the Naval Nuclear Propulsion Program in the Department of the Navy and the U.S. Department of Energy (1996-2004); served as Chief of Naval Personnel (July 1994-September 1996); and on the Joint Staff as Director of Political Military Affairs (June 1992-July 1994); Knighted as Honorary Knight Commander of the Most Excellent Order of the British Empire; Awarded the Officer de l'Orde National du Mérite by the French Government; elected to the National Academy of Engineering (2009). | | | 102 | | | Director of BP p.l.c.; Director of Naval and Nuclear Technologies LLP; Director of the Armed Services YMCA of the USA and the Naval Submarine League; Director of the American Shipbuilding Suppliers Association; Member of the National Security Advisory Council of the Center for U.S. Global Engagement and a member of the CNA Military Advisory Board; Member of the American Lung Association's President's Council. | |
Michael Bozic (71)
c/o Kramer Levin Naftalis &
Frankel LLP
Counsel to the Independent
Trustees
1177 Avenue of the Americas
New York, NY 10036 | | Trustee | | Since
April
1994 | | Private investor; Chairperson of the Compliance and Insurance Committee (since October 2006); Director or Trustee of various Morgan Stanley Funds (since April 1994); formerly, Chairperson of the Insurance Committee (July 2006-September 2006); Vice Chairman of Kmart Corporation (December 1998-October 2000), Chairman and Chief Executive Officer of Levitz Furniture Corporation (November 1995-November 1998) and President and Chief Executive Officer of Hills Department Stores (May 1991-July 1995); variously Chairman, Chief Executive Officer, President and Chief Operating Officer (1987-1991) of the Sears Merchandise Group of Sears, Roebuck & Co. | | | 104 | | | Director of various business organizations. | |
Kathleen A. Dennis (59)
c/o Kramer Levin Naftalis &
Frankel LLP
Counsel to the Independent
Trustees
1177 Avenue of the Americas
New York, NY 10036 | | Trustee | | Since
August
2006 | | President, Cedarwood Associates (mutual fund and investment management consulting) (since July 2006); Chairperson of the Money Market and Alternatives Sub-Committee of the Investment Committee (since October 2006) and Director or Trustee of various Morgan Stanley Funds (since August 2006); formerly, Senior Managing Director of Victory Capital Management (1993-2006). | | | 102 | | | Director of various non-profit organizations. | |
Dr. Manuel H. Johnson (63)
c/o Johnson Smick
Group, Inc.
888 16th Street, N.W.
Suite 740
Washington, D.C. 20006 | | Trustee | | Since
July
1991 | | Senior Partner, Johnson Smick International, Inc. (consulting firm); Chairperson of the Investment Committee (since October 2006) and Director or Trustee of various Morgan Stanley Funds (since July 1991); Co-Chairman and a founder of the Group of Seven Council (G7C) (international economic commission); formerly, Chairperson of the Audit Committee (July 1991-September 2006), Vice Chairman of the Board of Governors of the Federal Reserve System and Assistant Secretary of the U.S. Treasury. | | | 104 | | | Director of NVR, Inc. (home construction). | |
Joseph J. Kearns (70)
c/o Kearns & Associates LLC
PMB754
22631 Pacific Coast Highway
Malibu, CA 90265 | | Trustee | | Since
August
1994 | | President, Kearns & Associates LLC (investment consulting); Chairperson of the Audit Committee (since October 2006) and Director or Trustee of various Morgan Stanley Funds (since August 1994); formerly, Deputy Chairperson of the Audit Committee (July 2003-September 2006) and Chairperson of the Audit Committee of various Morgan Stanley Funds (since August 1994); CFO of the J. Paul Getty Trust. | | | 105 | | | Director of Electro Rent Corporation (equipment leasing) and The Ford Family Foundation. | |
30
Morgan Stanley Institutional Fund Trust
Annual Report — September 30, 2012
Trustee and Officer Information (unaudited) (cont'd)
Independent Trustees: (cont'd)
Name, Age and Address of
Independent Trustee | | Position(s)
Held with
Registrant | | Length of Time
Served* | | Principal Occupation(s) During Past 5 Years | | Number of
Portfolios in
Fund Complex
Overseen by
Independent
Trustee** | | Other Directorships
Held by Independent
Trustee*** | |
Michael F. Klein (53)
c/o Kramer Levin Naftalis & Frankel LLP
Counsel to the
Independent Trustees
1177 Avenue of the Americas
New York, NY 10036 | | Trustee | | Since
August
2006 | | Managing Director, Aetos Capital, LLC (since March 2000) and Co-President, Aetos Alternatives Management, LLC (since January 2004); Chairperson of the Fixed Income Sub-Committee of the Investment Committee (since October 2006) and Director or Trustee of various Morgan Stanley Funds (since August 2006); formerly, Managing Director, Morgan Stanley & Co. Inc. and Morgan Stanley Dean Witter Investment Management, President, various Morgan Stanley Funds (June 1998-March 2000) and Principal, Morgan Stanley & Co. Inc. and Morgan Stanley Dean Witter Investment Management (August 1997-December 1999). | | | 102 | | | Director of certain investment funds managed or sponsored by Aetos Capital, LLC. Director of Sanitized AG and Sanitized Marketing AG (specialty chemicals). | |
Michael E. Nugent (76)
c/o Triumph Capital, L.P.
445 Park Avenue
New York, NY 10022 | | Chairperson
of the
Board and
Trustee | | Chairperson of
the Boards since
July 2006 and
Trustee since
July 1991 | | General Partner, Triumph Capital, L.P. (private investment partnership); Chairperson of the Boards of various Morgan Stanley Funds (since July 2006); Chairperson of the Closed-End Fund Committee (since June 2012) and Director or Trustee of various Morgan Stanley Funds (since July 1991); formerly, Chairperson of the Insurance Committee (until July 2006). | | | 104 | | | None. | |
W. Allen Reed (65)
c/o Kramer Levin Naftalis &
Frankel LLP
Counsel to the
Independent Trustees
1177 Avenue of the Americas
New York, NY 10036 | | Trustee | | Since
August
2006 | | Chairperson of the Equity Sub-Committee of the Investment Committee (since October 2006) and Director or Trustee of various Morgan Stanley Funds (since August 2006); formerly, President and CEO of General Motors Asset Management; Chairman and Chief Executive Officer of the GM Trust Bank and Corporate Vice President of General Motors Corporation (August 1994-December 2005). | | | 102 | | | Director of Temple-Inland Industries (packaging and forest products); Director of Legg Mason, Inc. and Director of the Auburn University Foundation. | |
Fergus Reid (80)
c/o Joe Pietryka, Inc.
85 Charles Colman Blvd.
Pawling, NY 12564 | | Trustee | | Since
June
1992 | | Chairman, Joe Pietryka, Inc.; Chairperson of the Governance Committee and Director or Trustee of various Morgan Stanley Funds (since June 1992). | | | 105 | | | Trustee and Director of certain investment companies in the JPMorgan Funds complex managed by JP Morgan Investment Management Inc. | |
31
Morgan Stanley Institutional Fund Trust
Annual Report — September 30, 2012
Trustee and Officer Information (unaudited) (cont'd)
Interested Trustee:
Name, Age and Address of
Interested Trustee | | Position(s) Held
with Registrant | | Length of Time
Served* | | Principal Occupation(s) During Past 5 Years | | Number of
Portfolios in
Fund Complex
Overseen by
Interested
Trustee** | | Other Directorships
Held by Interested
Trustee*** | |
James F. Higgins (64)
c/o Morgan Stanley Services Company Inc.
Harborside Financial Center
201 Plaza Two
Jersey City, NJ 07311 | | Trustee | | Since
June
2000 | | Director or Trustee of various Morgan Stanley Funds (since June 2000); Senior Advisor of Morgan Stanley (since August 2000). | | | 103 | | | Director of AXA Financial, Inc. and The Equitable Life Assurance Society of the United States (financial services). | |
* Each Trustee serves an indefinite term, until his or her successor is elected.
** The Fund Complex includes (as of December 31, 2011) all open-end and closed-end funds (including all of their portfolios) advised by Morgan Stanley Investment Management Inc. (the "Adviser") and any funds that have an adviser that is an affiliated person of the Adviser (including, but not limited to, Morgan Stanley AIP GP LP).
*** This includes any directorships at public companies and registered investment companies held by the Trustee at any time during the past five years.
32
Morgan Stanley Institutional Fund Trust
Annual Report — September 30, 2012
Trustee and Officer Information (unaudited) (cont'd)
Executive Officers:
Name, Age and Address of Executive Officer | | Position(s) Held
with
Registrant | | Length of Time
Served* | | Principal Occupation(s) During Past 5 Years | |
Arthur Lev (51)
522 Fifth Avenue
New York, NY 10036 | | President and Principal Executive Officer – Equity and Fixed Income Funds | | Since
June 2011 | | President and Principal Executive Officer (since June 2011) of the Equity and Fixed Income Funds in the Fund Complex; Head of the Long Only Business of Morgan Stanley Investment Management (since February 2011); Managing Director of the Adviser and various entities affiliated with the Adviser (since December 2006). Formerly, Chief Strategy Officer of Morgan Stanley Investment Management's Traditional Asset Management business (November 2010-February 2011); General Counsel of Morgan Stanley Investment Management (December 2006-October 2010); Partner and General Counsel of FrontPoint Partners LLC (July 2002-December 2006); Managing Director and General Counsel of Morgan Stanley Investment Management (May 2000-June 2002). | |
Mary Ann Picciotto (39)
c/o Morgan Stanley Services Company Inc.
Harborside Financial Center
201 Plaza Two
Jersey City, NJ 07311 | | Chief Compliance Officer | | Since
May 2010 | | Managing Director of the Adviser and various entities affiliated with the Adviser; Chief Compliance Officer of various Morgan Stanley Funds (since May 2010); Chief Compliance Officer of the Adviser (since April 2007). | |
Stefanie V. Chang Yu (45)
522 Fifth Avenue
New York, NY 10036 | | Vice President | | Since December 1997 | | Managing Director of the Adviser and various entities affiliated with the Adviser; Vice President of various Morgan Stanley Funds (since December 1997). | |
Francis J. Smith (47)
c/o Morgan Stanley Services Company Inc.
Harborside Financial Center
201 Plaza Two
Jersey City, NJ 07311 | | Treasurer and Principal Financial
Officer | | Treasurer since July 2003 and Principal Financial Officer since September 2002 | | Executive Director of the Adviser and various entities affiliated with the Adviser; Treasurer and Principal Financial Officer of various Morgan Stanley Funds (since July 2003). | |
Mary E. Mullin (45)
522 Fifth Avenue
New York, NY 10036 | | Secretary | | Since
June
1999 | | Executive Director of the Adviser and various entities affiliated with the Adviser; Secretary of various Morgan Stanley Funds (since June 1999). | |
* Each officer serves an indefinite term, until his or her successor is elected.?
33
Morgan Stanley Institutional Fund Trust
Annual Report — September 30, 2012
Adviser and Administrator
Morgan Stanley Investment Management Inc.
522 Fifth Avenue
New York, New York 10036
Distributor
Morgan Stanley Distribution, Inc.
522 Fifth Avenue
New York, New York 10036
Dividend Disbursing and Transfer Agent
Morgan Stanley Services Company Inc.
P.O. Box 219804
Kansas City, Missouri 64121
Custodian
State Street Bank and Trust Company
One Lincoln Street
Boston, Massachusetts 02111
Legal Counsel
Dechert LLP
1095 Avenue of the Americas
New York, New York 10036
Independent Registered Public Accounting Firm
Ernst & Young LLP
200 Clarendon Street
Boston, Massachusetts 02116
Reporting to Shareholders
Each Morgan Stanley fund provides a complete schedule of portfolio holdings in its semi-annual and annual reports within 60 days of the end of the fund's second and fourth fiscal quarters by filing the schedule electronically with the Securities and Exchange Commission (SEC). The semi-annual reports are filed on Form N-CSRS and the annual reports are filed on Form N-CSR. Morgan Stanley also delivers the semi-annual and annual reports to fund shareholders and makes these reports available on its public website, www.morganstanley.com/im. Each Morgan Stanley fund also files a complete schedule of portfolio holdings with the SEC for the fund's first and third fiscal quarters on Form N-Q. Morgan Stanley does not deliver the reports for the first and third fiscal quarters to shareholders, nor are the reports posted to the Morgan Stanley public website. You may, however, obtain the Form N-Q filings (as well as the Form N-CSR and N-CSRS filings) by accessing the SEC's website, www.sec.gov. You may also review and copy them at the SEC's Public Reference Room in Washington, DC. Information on the operation of the SEC's Public Reference Room may be obtained by calling the SEC toll free at 1-800-SEC-0330. You can also request copies of these materials, upon payment of a duplicating fee, by electronic request at the SEC's email address (publicinfo@sec.gov) or by writing the Public Reference Room of the SEC, Washington, DC 20549-0102.
Proxy Voting Policies and Procedures and Proxy Voting Record
You may obtain a copy of the Fund's Proxy Voting Policy and Procedures and information regarding how the Fund voted proxies relating to portfolio securities during the most recent twelve-month period ended June 30, without charge, upon request, by calling toll free 1-800-548-7786 or by visiting our website at www.morganstanley.com/im. This information is also available on the SEC's website at www.sec.gov.
This report is authorized for distribution only when preceded or accompanied by a prospectus of the Fund which describes in detail each Investment Portfolio's investment policies, risks, fees and expenses. Please read the prospectus carefully before you invest or send money. For additional information, including information regarding the investments comprising the Portfolio, please visit our website at www.morganstanley.com/im or call toll free 1-(800) 548-7786.
34
(This Page has been left blank intentionally.)
(This Page has been left blank intentionally.)
Printed in U.S.A.
This Report has been prepared for shareholders and may be distributed to others only if preceded or accompanied by a current prospectus.
Morgan Stanley Investment Management Inc.
522 Fifth Avenue
New York, New York 10036
© 2012 Morgan Stanley. Morgan Stanley Distribution, Inc.

IFTMCGANN
IU12-02342P-Y09/12

Morgan Stanley
Institutional Fund Trust
Core Fixed Income Portfolio
Annual
Report
September 30, 2012


Morgan Stanley Institutional Fund Trust
Annual Report — September 30, 2012
Shareholders' Letter | | | 2 | | |
Expense Example | | | 3 | | |
Investment Advisory Agreement Approval | | | 4 | | |
Investment Overview | | | 6 | | |
Portfolio of Investments | | | 9 | | |
Statement of Assets and Liabilities | | | 15 | | |
Statement of Operations | | | 17 | | |
Statements of Changes in Net Assets | | | 18 | | |
Financial Highlights | | | 19 | | |
Notes to Financial Statements | | | 23 | | |
Report of Independent Registered Public Accounting Firm | | | 31 | | |
U.S. Privacy Policy | | | 32 | | |
Trustee and Officer Information | | | 35 | | |
This report is authorized for distribution only when preceded or accompanied by prospectuses of the Morgan Stanley Institutional Fund Trust. To receive a prospectus and/or SAI, which contains more complete information such as investment objectives, charges, expenses, policies for voting proxies, risk considerations, and describes in detail each of the Portfolio's investment policies to the prospective investor, please call toll free 1-(800) 548-7786. Please read the prospectuses carefully before you invest or send money.
Additionally, you can access portfolio information including performance, characteristics, and investment team commentary through Morgan Stanley Investment Management's website: www.morganstanley.com/im.
Market forecasts provided in this report may not necessarily come to pass. There is no guarantee that any sectors mentioned will continue to perform as discussed herein or that securities in such sectors will be held by the Portfolio in the future. There is no assurance that a Portfolio will achieve its investment objective. Portfolios are subject to market risk, which is the possibility that market values of securities owned by the Portfolio will decline and, therefore, the value of the Portfolio's shares may be less than what you paid for them. Accordingly, you can lose money investing in Portfolios. Please see the prospectus for more complete information on investment risks.
1
Morgan Stanley Institutional Fund Trust
Annual Report — September 30, 2012
Shareholders' Letter (unaudited)
Dear Shareholders,
We are pleased to provide this Annual report, in which you will learn how your investment in Core Fixed Income Portfolio performed during the latest twelve-month period.
Morgan Stanley Investment Management is a client-centric, investor-led organization. Our global presence, intellectual capital, and breadth of products and services enable us to partner with investors to meet the evolving challenges of today's financial markets. We aim to deliver superior investment service and to empower our clients to make the informed decisions that help them reach their investment goals.
As always, we thank you for selecting Morgan Stanley Investment Management, and look forward to working with you in the months and years ahead.
Sincerely,

Arthur Lev
President and Principal Executive Officer
October 2012
2
Morgan Stanley Institutional Fund Trust
Annual Report — September 30, 2012
Expense Example (unaudited)
Core Fixed Income Portfolio
As a shareholder of the Portfolio, you may incur two types of costs: (1) transactional costs, including sales charge (loads) on purchase payments; and (2) ongoing costs, including advisory fees, administration fees, distribution and shareholder servicing fees; and other Portfolio expenses. This example is intended to help you understand your ongoing costs (in dollars) of investing in the Portfolio and to compare these costs with the ongoing costs of investing in other mutual funds.
This example is based on an investment of $1,000 invested at the beginning of the six-month period ended September 30, 2012 and held for the entire six-month period.
Actual Expenses
The table below provides information about actual account values and actual expenses. You may use the information in this table, together with the amount you invested, to estimate the expenses that you paid over the period. Simply divide your account value by $1,000 (for example, an $8,600 account value divided by $1,000 = 8.6), then multiply the result by the number in the table under the heading entitled "Actual Expenses Paid During Period" to estimate the expenses you paid on your account during this period.
Please note that "Actual Expenses Paid During Period" are grossed up to reflect Portfolio expenses prior to the effect of Expense Offset (See Note F in the Notes to Financial Statements). Therefore, the annualized net expense ratios may differ from the ratio of expenses to average net assets shown in the Financial Highlights.
Hypothetical Example for Comparison Purposes
The table below provides information about hypothetical account values and hypothetical expenses based on the Portfolio's actual expense ratio and an assumed rate of return of 5% per year before expenses, which is not the Portfolio's actual return. The hypothetical account values and expenses may not be used to estimate the actual ending account balance or expenses you paid for the period. You may use this information to compare the ongoing costs of investing in the Portfolio and other funds. To do so, compare this 5% hypothetical example with the 5% hypothetical examples that appear in the shareholder reports of the other funds.
Please note that the expenses shown in the table are meant to highlight your ongoing costs only and do not reflect any transactional costs, such as sales charges (loads, if applicable). Therefore, the hypothetical account values and hypothetical expenses are useful in comparing ongoing costs only, and will not help you determine the relative total costs of owning different funds. In addition, if these transactional costs were included, your costs would have been higher.
| | | Beginning
Account
Value
4/1/12 | | Actual Ending
Account
Value
9/30/12 | | Hypothetical
Ending Account
Value | | Actual
Expenses
Paid
During
Period | | Hypothetical
Expenses Paid
During Period | | Net
Expense
Ratio
During
Period** | |
Core Fixed Income Portfolio Class I | | $ | 1,000.00 | | | $ | 1,045.60 | | | $ | 1,022.55 | | | $ | 2.51 | * | | $ | 2.48 | * | | | 0.49 | % | |
Core Fixed Income Portfolio Class P | | | 1,000.00 | | | | 1,044.40 | | | | 1,021.30 | | | | 3.78 | * | | | 3.74 | * | | | 0.74 | | |
Core Fixed Income Portfolio Class H | | | 1,000.00 | | | | 1,033.70 | | | | 1,017.92 | | | | 3.17 | + | | | 3.14 | + | | | 0.74 | | |
Core Fixed Income Portfolio Class L | | | 1,000.00 | | | | 1,032.30 | | | | 1,016.87 | | | | 4.23 | + | | | 4.20 | + | | | 0.99 | | |
* Expenses are calculated using each Portfolio Class' annualized net expense ratio (as disclosed), multiplied by the average account value over the period, and multiplied by 183/366 (to reflect the most recent one-half year period).
** Annualized.
+ Expenses are calculated using each Portfolio Class' annualized net expense ratio (as disclosed), multiplied by the average account value over the period, and multiplied by 154/366 (to reflect the actual days in period).
3
Morgan Stanley Institutional Fund Trust
Annual Report — September 30, 2012
Investment Advisory Agreement Approval (unaudited)
Nature, Extent and Quality of Services
The Board reviewed and considered the nature and extent of the investment advisory services provided by the Adviser (as defined herein) under the advisory agreement, including portfolio management, investment research and equity and fixed income securities trading. The Board also reviewed and considered the nature and extent of the non-advisory, administrative services provided by the Adviser under the administration agreement, including accounting, clerical, bookkeeping, compliance, business management and planning, and the provision of supplies, office space and utilities at the Adviser's expense. (The advisory and administration agreements together are referred to as the "Management Agreement.") The Board also compared the nature of the services provided by the Adviser with similar services provided by non-affiliated advisers as reported to the Board by Lipper, Inc. ("Lipper").
The Board reviewed and considered the qualifications of the portfolio managers, the senior administrative managers and other key personnel of the Adviser who provide the advisory and administrative services to the Portfolio. The Board determined that the Adviser's portfolio managers and key personnel are well qualified by education and/or training and experience to perform the services in an efficient and professional manner. The Board concluded that the nature and extent of the advisory and administrative services provided were necessary and appropriate for the conduct of the business and investment activities of the Portfolio and supported its decision to approve the Management Agreement.
Performance, Fees and Expenses of the Portfolio
The Board reviewed the performance, fees and expenses of the Portfolio compared to its peers, as determined by Lipper, and to appropriate benchmarks where applicable. The Board discussed with the Adviser the performance goals and the actual results achieved in managing the Portfolio. When considering a fund's performance, the Board and the Adviser place emphasis on trends and longer-term returns (focusing on one-year, three-year and five-year performance, as of December 31, 2011, or since inception, as applicable). When a fund underperforms its benchmark and/or its peer group average, they discuss the causes of such underperformance and, where necessary, they discuss specific changes to investment strategy or investment personnel. The Board noted that the Portfolio's performance was better than its peer group average for the one-year period but below its peer group average for the three- and five-year periods. The Board discussed with the Adviser the level of the advisory and administration fees (together, the "management fee") for this Portfolio relative to comparable funds and/or other accounts advised by the Adviser and/or compared to its peers as determined by Lipper. In addition to the management fee, the Board also reviewed the Portfolio's total expense ratio. The Board noted that the Portfolio's management fee and total expense ratio were lower than its peer group average. After discussion, the Board concluded that (i) the Portfolio's performance was acceptable; and (ii) the Portfolio's management fee and total expense ratio were competitive with its peer group average.
Economies of Scale
The Board considered the size and growth prospects of the Portfolio and how that relates to the Portfolio's total expense ratio and particularly the Portfolio's management fee rate which does not include breakpoints. In conjunction with its review of the Adviser's profitability, the Board discussed with the Adviser how a change in assets can affect the efficiency or effectiveness of managing the Portfolio and whether the management fee level is appropriate relative to current and projected asset levels and/or whether the management fee structure reflects economies of scale as asset levels change. The Board has determined that its review of the actual and potential economies of scale of the Portfolio supports its decision to approve the Management Agreement.
Profitability of the Adviser and Affiliates
The Board considered information concerning the costs incurred and profits realized by the Adviser and its affiliates during the last year from their relationship with the Portfolio and during the last two years from their relationship with the Morgan Stanley Fund Complex and reviewed with the Adviser the cost allocation methodology used to determine the profitability of the Adviser and affiliates. The Board has determined that its review of the analysis of the Adviser's expenses and profitability supports its decision to approve the Management Agreement.
Other Benefits of the Relationship
The Board considered other benefits to the Adviser and its affiliates derived from their relationship with the Portfolio and other funds advised by the Adviser. These benefits may include, among other things, "float" benefits derived from handling of checks for purchases and sales, research received by the Adviser generated from commission dollars spent on funds' portfolio trading and fees
4
Morgan Stanley Institutional Fund Trust
Annual Report — September 30, 2012
Investment Advisory Agreement Approval (unaudited) (cont'd)
for distribution and/or shareholder servicing. The Board reviewed with the Adviser each of these arrangements and the reasonableness of the Adviser's costs relative to the services performed. The Board has determined that its review of the other benefits received by the Adviser or its affiliates supports its decision to approve the Management Agreement.
Resources of the Adviser and Historical Relationship Between the Portfolio and the Adviser
The Board considered whether the Adviser is financially sound and has the resources necessary to perform its obligations under the Management Agreement. The Board also reviewed and considered the historical relationship between the Portfolio and the Adviser, including the organizational structure of the Adviser, the policies and procedures formulated and adopted by the Adviser for managing the Portfolio's operations and the Board's confidence in the competence and integrity of the senior managers and key personnel of the Adviser. The Board concluded that the Adviser has the financial resources necessary to fulfill its obligations under the Management Agreement and that it is beneficial for the Portfolio to continue its relationship with the Adviser.
Other Factors and Current Trends
The Board considered the controls and procedures adopted and implemented by the Adviser and monitored by the Fund's Chief Compliance Officer and concluded that the conduct of business by the Adviser indicates a good faith effort on its part to adhere to high ethical standards in the conduct of the Fund's business.
General Conclusion
After considering and weighing all of the above factors, the Board concluded that it would be in the best interest of the Portfolio and its shareholders to approve renewal of the Management Agreement for another year. In reaching this conclusion the Board did not give particular weight to any single factor referenced above. The Board considered these factors over the course of numerous meetings, some of which were in executive session with only the independent Board members and their counsel present. It is possible that individual Board members may have weighed these factors differently in reaching their individual decisions to approve the Management Agreement.
5
Morgan Stanley Institutional Fund Trust
Annual Report — September 30, 2012
Investment Overview (unaudited)
Core Fixed Income Portfolio
Performance
For the fiscal year ended September 30, 2012, the Portfolio's Class I had a total return based on net asset value and reinvestment of distributions per share of 7.83%, net of fees. The Portfolio's Class I outperformed against its benchmark the Barclays Capital U.S. Aggregate Index (the "Index"), which returned 5.16%.
Factors Affecting Performance
• Aggressive central bank policy actions to support economic growth and provide stability led to a huge rally in risky assets so far in 2012. The European Central Bank's (ECB) longer-term refinancing operation announced at the end of 2011 was successful and helped improve investor sentiment significantly. As problems in Spain and Italy came to the forefront again this year, the ECB committed to providing unlimited support to the countries' bond markets by launching the Outright Monetary Transactions program. This program is subject to conditionality and would be triggered only if countries request for help.
• Given the weaker-than-expected economic conditions in the U.S., the Federal Reserve Bank also enacted various easing policies during the course of the period. This included extending the timeline to keep the target federal funds rate on hold, buying longer-maturity Treasuries and selling short-term Treasuries to put downward pressure on longer-term interest rates, and another round of quantitative easing focused on mortgage purchases, until the unemployment rate falls to an acceptable level.
• The labor market in the U.S. showed improvement but unemployment remained high. The unemployment rate fell to 7.8% from 9% a year ago. However, a large part of that decline was due to a drop in the labor participation rate. Economic growth in the U.S. remained sluggish as gross domestic product (GDP) growth in the first half of the year was under 2%.
• After the sell-off in the second half of 2011, spread sectors had strong performance so far in 2012 (through September). Spreads on corporate debt spread have tightened significantly with the riskier sectors of the market posting the best performance. Investment-grade corporate spreads narrowed by almost 85 basis points led by the financials sector,
which tightened by about 150 basis points. Whilst the strong market rally has reduced the risk premium in the corporate credit market, we continue to believe that conditions could favor the asset class over the rest of the year.
• Mortgage-backed securities (MBS) performed very well over the period. The latest round of quantitative easing led to a substantial tightening in yield spreads of lower-coupon, fixed-rate MBS. Despite historically low mortgage rates, refinancing activity has been slower than it has been in the past under similar rate incentives, as many borrowers are unable to refinance due to tighter underwriting standards. However, with further quantitative easing, the expectation is that there will be an increase in mortgage refinancing. The U.S. housing market has started showing signs of stabilization. After many months of continuous declines, the headline home price index has turned positive on a year-over-year basis.
• Government bonds in major markets such as the U.S., Germany and the U.K. rallied significantly. The 10-year Treasury yield touched an all-time low of 1.43% in July. The decline in U.S. Treasury yields over the year was led by the intermediate part of the curve as 2-, 5-, 10- and 30-year rates fell by 2, 33, 29, and 9 basis points respectively.
• An overweight to the corporate sector, especially in financials, was one of the main drivers of positive performance as spreads tightened over the year.
• The Portfolio's positioning in the mortgage sector was the other large contributor to performance. In particular, an allocation to agency mortgage derivatives through interest-only (IO) and inverse interest-only (IIO) securities contributed significantly to returns.
• An underweight in the agency sector detracted slightly from performance.
Management Strategies
• Throughout the period, the Portfolio was positioned with an overweight to investment-grade credit as corporate bond valuations relative to fundamentals have been attractive. We took advantage of the strong rally in financials this year to trim some of the overweight in the sector.
6
Morgan Stanley Institutional Fund Trust
Annual Report — September 30, 2012
Investment Overview (unaudited) (cont'd)
Core Fixed Income Portfolio
• In terms of mortgage strategy, the Portfolio has had a position in IO and IIO securities. Prepayment speeds have been slow, which has been beneficial for this position. A number of factors, such as increased credit requirements and fees, have mitigated prepayments and presented hurdles for borrowers looking to refinance.
• The Portfolio also had an allocation to the commercial mortgage-backed securities sector, mainly in newly issued bonds that generally have stricter underwriting and more conservative underlying property valuations. Fundamentals in the sector have remained relatively stable, in our view.
• Given the current low yielding environment, being overweight spread product seems attractive as we believe the yield advantage could provide a large part of returns over the medium term.
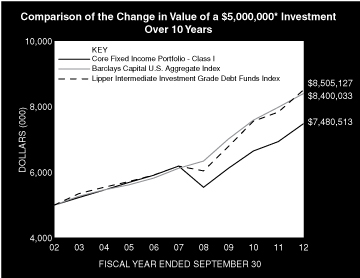
* Minimum Investment
In accordance with SEC regulations, the Portfolio's performance shown assumes that all recurring fees (including management fees) were deducted and all dividends and distributions were reinvested. The performance of Class P, Class H, and Class L shares will vary from the Class I shares based upon their different inception dates and will be negatively impacted by additional fees assessed to those classes.
Performance Compared to the Barclays Capital U.S. Aggregate Index(1) and the Lipper Intermediate Investment Grade Debt Funds Index(2)
| | | Period Ended September 30, 2012
Total Returns(3) | |
| | | | Average Annual | |
| | | One
Year | | Five
Years | | Ten
Years | | Since
Inception(7) | |
Portfolio — Class I Shares
w/o sales charges (4) | | | 7.83 | % | | | 3.86 | % | | | 4.11 | % | | | 7.05 | % | |
Barclays Capital U.S. Aggregate Index | | | 5.16 | | | | 6.53 | | | | 5.32 | | | | 7.47 | | |
Lipper Intermediate Investment Grade
Debt Funds Index | | | 8.52 | | | | 6.55 | | | | 5.46 | | | | — | | |
Portfolio — Class P Shares
w/o sales charges (5) | | | 7.55 | | | | 3.62 | | | | 3.86 | | | | 4.75 | | |
Barclays Capital U.S. Aggregate Index | | | 5.16 | | | | 6.53 | | | | 5.32 | | | | 6.05 | | |
Lipper Intermediate Investment Grade
Debt Funds Index | | | 8.52 | | | | 6.55 | | | | 5.46 | | | | 5.82 | | |
Portfolio — Class H Shares
w/o sales charges (6) | | | — | | | | — | | | | — | | | | 3.37 | | |
Portfolio — Class H Shares with
maximum 3.50% sales charges (6) | | | — | | | | — | | | | — | | | | –0.22 | | |
Barclays Capital U.S. Aggregate Index | | | — | | | | — | | | | — | | | | 2.63 | | |
Lipper Intermediate Investment Grade
Debt Funds Index | | | — | | | | — | | | | — | | | | 3.89 | | |
Portfolio — Class L Shares
w/o sales charges (6) | | | — | | | | — | | | | — | | | | 3.23 | | |
Barclays Capital U.S. Aggregate Index | | | — | | | | — | | | | — | | | | 2.63 | | |
Lipper Intermediate Investment Grade
Debt Funds Index | | | — | | | | — | | | | — | | | | 3.89 | | |
Performance data quoted represents past performance, which is no guarantee of future results, and current performance may be lower or higher than the figures shown. Performance assumes that all dividends and distributions, if any, were reinvested. Returns for periods less than one year are not annualized. For the most recent month-end performance figures, please visit www.morganstanley.com/im. Investment returns and principal value will fluctuate so that Portfolio shares, when redeemed, may be worth more or less than their original cost. Total returns do not reflect the deduction of taxes that a shareholder would pay on Portfolio distributions or the redemption of Portfolio shares. Performance of share classes will vary due to differences in sales charges and expenses.
(1) The Barclays Capital U.S. Aggregate Index tracks the performance of all U.S. government agency and Treasury securities, investment-grade corporate debt securities, agency mortgage-backed securities, asset-backed securities and commercial mortgage-backed securities. The Index is unmanaged and its returns do not include any sales charges or fees. Such costs would lower performance. It is not possible to invest directly in an index.
(2) The Lipper Intermediate Investment Grade Debt Funds Index is an equally weighted performance index of the largest qualifying funds (based on net assets) in the Lipper Intermediate Investment Grade Debt Funds classification. The Index, which is adjusted for capital gains distributions and income dividends, is unmanaged and should not be considered an investment. There are currently 30 funds represented in this Index. As of the date of this report, the Portfolio was in the Lipper Intermediate Investment Grade Debt Funds classification.
(3) Total returns for the Portfolio reflect expenses waived and/or reimbursed, if applicable, by the Adviser. Without such waivers and/or reimbursements, total
7
Morgan Stanley Institutional Fund Trust
Annual Report — September 30, 2012
Investment Overview (unaudited) (cont'd)
Core Fixed Income Portfolio
returns would have been lower. The fee waivers and/or expense reimbursements will continue for at least one year or until such time as the Fund's Board of Trustees acts to discontinue all or a portion of such waivers and/or reimbursements when it deems such action is appropriate.
(4) Commenced operations on September 29, 1987.
(5) Commenced operations on March 1, 1999.
(6) Commenced operations on April 27, 2012.
(7) For comparative purposes, average annual since inception returns listed for the Indexes refer to the inception date or initial offering of the respective share class of the Portfolio, not the inception of the Indexes.
Portfolio Composition*
Classification | | Percentage of
Total Investments | |
Agency Fixed Rate Mortgages | | | 24.6 | % | |
U.S. Treasury Securities | | | 16.1 | | |
Industrials | | | 15.3 | | |
Other** | | | 14.8 | | |
Short-Term Investments | | | 10.9 | | |
Finance | | | 10.7 | | |
Collateralized Mortgage Obligations — Agency
Collateral Series | | | 7.6 | | |
Total Investments | | | 100.0 | %*** | |
* Percentages indicated are based upon total investments (excluding Securities held as Collateral on Loaned Securities) as of September 30, 2012.
** Industries and/or investment types representing less than 5% of total investments.
*** Does not include open long/short futures contracts with an underlying face amount of approximately $21,500,000 and net unrealized depreciation of less than $500. Does not include open swap agreements with total unrealized depreciation of approximately $25,000.
8
Morgan Stanley Institutional Fund Trust
Annual Report — September 30, 2012
Portfolio of Investments
Core Fixed Income Portfolio
| | | Face
Amount
(000) | | Value
(000) | |
Fixed Income Securities (98.2%) | |
Agency Fixed Rate Mortgages (27.1%) | |
Federal Home Loan Mortgage Corporation, | |
Gold Pools: | |
3.50%, 8/1/42 | | $ | 230 | | | $ | 247 | | |
4.00%, 12/1/41 | | | 268 | | | | 288 | | |
5.00%, 10/1/35 | | | 733 | | | | 798 | | |
6.00%, 5/1/37 - 10/1/38 | | | 316 | | | | 348 | | |
7.50%, 5/1/35 | | | 59 | | | | 73 | | |
8.00%, 8/1/32 | | | 30 | | | | 38 | | |
8.50%, 8/1/31 | | | 48 | | | | 60 | | |
October TBA: | |
3.50%, 10/1/42 (a) | | | 2,105 | | | | 2,258 | | |
Federal National Mortgage Association, | |
Conventional Pools: | |
4.00%, 11/1/41 - 12/1/41 | | | 1,549 | | | | 1,673 | | |
4.50%, 8/1/40 - 8/1/41 | | | 1,983 | | | | 2,181 | | |
5.00%, 3/1/39 | | | 709 | | | | 791 | | |
5.50%, 4/1/34 - 2/1/38 | | | 1,652 | | | | 1,825 | | |
6.00%, 1/1/38 | | | 172 | | | | 190 | | |
6.50%, 7/1/29 - 2/1/33 | | | 322 | | | | 372 | | |
7.00%, 10/1/31 - 12/1/31 | | | 2 | | | | 2 | | |
7.50%, 8/1/37 | | | 99 | | | | 122 | | |
8.00%, 4/1/33 | | | 74 | | | | 92 | | |
8.50%, 10/1/32 | | | 72 | | | | 90 | | |
Government National Mortgage Association, | |
October TBA: | |
3.50%, 10/15/42 (a) | | | 1,305 | | | | 1,429 | | |
4.00%, 10/15/42 (a) | | | 1,935 | | | | 2,132 | | |
Various Pools: | |
4.50%, 4/15/39 - 8/15/39 | | | 509 | | | | 561 | | |
| | | | 15,570 | | |
Asset-Backed Securities (5.4%) | |
Ally Master Owner Trust | |
2.88%, 4/15/15 (b) | | | 225 | | | | 227 | | |
Brazos Higher Education Authority | |
1.30%, 7/25/29 (c) | | | 325 | | | | 328 | | |
CVS Pass-Through Trust | |
6.04%, 12/10/28 | | | 72 | | | | 84 | | |
Discover Card Master Trust | |
0.57%, 8/15/16 (c) | | | 300 | | | | 301 | | |
Enterprise Fleet Financing LLC, | |
1.43%, 10/20/16 (b) | | | 150 | | | | 150 | | |
1.62%, 5/20/17 (b) | | | 115 | | | | 116 | | |
Ford Credit Floorplan Master Owner Trust | |
2.12%, 2/15/16 | | | 175 | | | | 179 | | |
Great America Leasing Receivables | |
1.69%, 2/15/14 (b) | | | 282 | | | | 283 | | |
Louisiana Public Facilities Authority | |
1.35%, 4/26/27 (c) | | | 325 | | | | 329 | | |
Macquarie Equipment Funding Trust | |
1.21%, 9/20/13 (b) | | | 99 | | | | 99 | | |
| | | Face
Amount
(000) | | Value
(000) | |
Mercedes-Benz Auto Lease Trust | |
1.18%, 11/15/13 (b) | | $ | 238 | | | $ | 238 | | |
MMCA Auto Owner Trust 2011-A | |
1.22%, 1/15/15 (b) | | | 210 | | | | 210 | | |
North Carolina State Education
Assistance Authority | |
1.35%, 1/26/26 (c) | | | 225 | | | | 227 | | |
Panhandle-Plains Higher Education Authority, Inc. | |
1.31%, 7/1/24 (c) | | | 125 | | | | 127 | | |
Textainer Marine Containers Ltd. | |
4.70%, 6/15/26 (b) | | | 219 | | | | 230 | | |
| | | | 3,128 | | |
Collateralized Mortgage Obligations — Agency Collateral Series (8.4%) | |
Federal Home Loan Mortgage Corporation, | |
1.88%, 5/25/19 | | | 230 | | | | 239 | | |
2.09%, 3/25/19 | | | 159 | | | | 167 | | |
2.32%, 10/25/18 | | | 155 | | | | 165 | | |
2.70%, 5/25/18 | | | 335 | | | | 364 | | |
2.79%, 1/25/22 | | | 300 | | | | 320 | | |
2.97%, 10/25/21 | | | 300 | | | | 326 | | |
3.87%, 4/25/21 | | | 325 | | | | 374 | | |
IO | |
0.83%, 1/25/21 (c) | | | 2,272 | | | | 92 | | |
IO PAC REMIC | |
6.25%, 6/15/40 (c) | | | 1,829 | | | | 357 | | |
IO REMIC | |
5.83%, 4/15/39 (c) | | | 783 | | | | 189 | | |
IO STRIPS | |
8.00%, 1/1/28 | | | 20 | | | | 5 | | |
Federal National Mortgage Association, | |
3.76%, 6/25/21 | | | 110 | | | | 123 | | |
IO | |
6.17%, 9/25/20 (c) | | | 1,762 | | | | 454 | | |
IO REMIC | |
6.38%, 9/25/38 (c) | | | 588 | | | | 122 | | |
REMIC | |
9.14%, 10/25/41 (c)(d) | | | 194 | | | | 210 | | |
Government National Mortgage Association, | |
IO | |
0.85%, 8/20/58 (c) | | | 2,874 | | | | 107 | | |
1.37%, 4/16/53 (c) | | | 4,511 | | | | 356 | | |
5.00%, 2/16/41 | | | 164 | | | | 34 | | |
5.83%, 11/16/40 (c) | | | 1,108 | | | | 212 | | |
5.88%, 8/16/42 (c) | | | 824 | | | | 191 | | |
6.36%, 6/20/40 (c) | | | 810 | | | | 138 | | |
6.38%, 4/16/41 (c) | | | 1,137 | | | | 254 | | |
| | | | 4,799 | | |
Commercial Mortgage Backed Securities (3.1%) | |
GS Mortgage Securities Corp. II | |
3.71%, 8/10/44 | | | 240 | | | | 267 | | |
The accompanying notes are an integral part of the financial statements.
9
Morgan Stanley Institutional Fund Trust
Annual Report — September 30, 2012
Portfolio of Investments (cont'd)
Core Fixed Income Portfolio
| | | Face
Amount
(000) | | Value
(000) | |
Commercial Mortgage Backed Securities (cont'd) | |
JP Morgan Chase Commercial Mortgage
Securities Corp., | |
4.17%, 8/15/46 | | $ | 240 | | | $ | 277 | | |
4.39%, 7/15/46 (b) | | | 350 | | | | 398 | | |
UBS-Barclays Commercial Mortgage Trust | |
3.53%, 5/10/63 | | | 80 | | | | 87 | | |
Wells Fargo Commercial Mortgage Trust | |
2.92%, 10/15/45 | | | 100 | | | | 104 | | |
WF-RBS Commercial Mortgage Trust, | |
3.43%, 6/15/45 | | | 238 | | | | 257 | | |
4.87%, 2/15/44 (b)(c) | | | 315 | | | | 372 | | |
| | | | 1,762 | | |
Corporate Bonds (30.5%) | |
Finance (11.8%) | |
ABB Treasury Center USA, Inc. | |
2.50%, 6/15/16 (b)(e) | | | 175 | | | | 183 | | |
Abbey National Treasury Services PLC, | |
MTN | |
3.88%, 11/10/14 (b) | | | 140 | | | | 143 | | |
Aegon N.V. | |
4.63%, 12/1/15 (e) | | | 175 | | | | 192 | | |
AvalonBay Communities, Inc. | |
2.95%, 9/15/22 | | | 75 | | | | 75 | | |
Bank of America Corp., | |
Series L | |
5.65%, 5/1/18 | | | 225 | | | | 257 | | |
Barclays Bank PLC | |
6.05%, 12/4/17 (b) | | | 200 | | | | 216 | | |
Berkshire Hathaway, Inc. | |
3.75%, 8/15/21 (e) | | | 235 | | | | 258 | | |
BNP Paribas SA | |
5.00%, 1/15/21 (e) | | | 135 | | | | 150 | | |
Boston Properties LP, | |
3.85%, 2/1/23 | | | 100 | | | | 106 | | |
5.88%, 10/15/19 | | | 30 | | | | 36 | | |
Brookfield Asset Management, Inc. | |
5.80%, 4/25/17 | | | 65 | | | | 73 | | |
Cigna Corp., | |
2.75%, 11/15/16 | | | 70 | | | | 74 | | |
5.38%, 2/15/42 | | | 10 | | | | 11 | | |
Citigroup, Inc. (See Note G), | |
6.13%, 11/21/17 | | | 15 | | | | 18 | | |
6.13%, 5/15/18 (e) | | | 56 | | | | 66 | | |
8.50%, 5/22/19 (e) | | | 72 | | | | 95 | | |
Commonwealth Bank of Australia | |
1.90%, 9/18/17 (e) | | | 250 | | | | 251 | | |
Cooperatieve Centrale Raiffeisen-
Boerenleenbank BA | |
3.88%, 2/8/22 (e) | | | 75 | | | | 80 | | |
Coventry Health Care, Inc. | |
5.45%, 6/15/21 | | | 120 | | | | 141 | | |
| | | Face
Amount
(000) | | Value
(000) | |
Credit Agricole SA | |
3.00%, 10/1/17 (b)(f) | | $ | 200 | | | $ | 200 | | |
Credit Suisse, | |
5.40%, 1/14/20 (e) | | | 135 | | | | 148 | | |
6.00%, 2/15/18 | | | 60 | | | | 68 | | |
Dexus Diversified Trust/Dexus Office Trust | |
5.60%, 3/15/21 (b) | | | 100 | | | | 105 | | |
DNB Bank ASA | |
3.20%, 4/3/17 (b)(e) | | | 205 | | | | 214 | | |
General Electric Capital Corp., | |
5.30%, 2/11/21 | | | 110 | | | | 126 | | |
Series G | |
6.00%, 8/7/19 | | | 190 | | | | 231 | | |
Goldman Sachs Group, Inc. (The) | |
5.75%, 1/24/22 (e) | | | 285 | | | | 329 | | |
Hartford Financial Services Group, Inc. | |
5.50%, 3/30/20 | | | 110 | | | | 125 | | |
HSBC Holdings PLC | |
4.00%, 3/30/22 (e) | | | 170 | | | | 183 | | |
JPMorgan Chase & Co. | |
4.50%, 1/24/22 | | | 50 | | | | 56 | | |
MetLife, Inc. | |
7.72%, 2/15/19 | | | 60 | | | | 78 | | |
National Australia Bank Ltd. | |
2.75%, 3/9/17 | | | 250 | | | | 262 | | |
Nationwide Building Society | |
6.25%, 2/25/20 (b) | | | 145 | | | | 167 | | |
Nationwide Financial Services | |
5.38%, 3/25/21 (b) | | | 75 | | | | 80 | | |
Nordea Bank AB | |
4.88%, 5/13/21 (b)(e) | | | 200 | | | | 210 | | |
Pacific LifeCorp | |
6.00%, 2/10/20 (b) | | | 125 | | | | 139 | | |
Platinum Underwriters Finance, Inc., | |
Series B | |
7.50%, 6/1/17 (e) | | | 120 | | | | 132 | | |
Principal Financial Group, Inc. | |
8.88%, 5/15/19 | | | 100 | | | | 133 | | |
Prudential Financial, Inc. | |
7.38%, 6/15/19 (e) | | | 270 | | | | 342 | | |
Royal Bank of Scotland Group PLC | |
2.55%, 9/18/15 (e) | | | 120 | | | | 121 | | |
Societe Generale SA | |
5.20%, 4/15/21 (b)(e) | | | 200 | | | | 215 | | |
Standard Chartered Bank | |
6.40%, 9/26/17 (b) | | | 100 | | | | 115 | | |
Svenska Handelsbanken AB | |
2.88%, 4/4/17 | | | 250 | | | | 263 | | |
US Bancorp | |
2.95%, 7/15/22 | | | 125 | | | | 126 | | |
WellPoint, Inc. | |
3.30%, 1/15/23 (e) | | | 117 | | | | 119 | | |
The accompanying notes are an integral part of the financial statements.
10
Morgan Stanley Institutional Fund Trust
Annual Report — September 30, 2012
Portfolio of Investments (cont'd)
Core Fixed Income Portfolio
| | | Face
Amount
(000) | | Value
(000) | |
Finance (cont'd) | |
Wells Fargo & Co. | |
5.63%, 12/11/17 | | $ | 60 | | | $ | 72 | | |
| | | | 6,784 | | |
Industrials (16.9%) | |
Agilent Technologies, Inc. | |
5.50%, 9/14/15 (e) | | | 120 | | | | 135 | | |
Air Products & Chemicals, Inc. | |
2.00%, 8/2/16 (e) | | | 165 | | | | 172 | | |
Altria Group, Inc. | |
2.85%, 8/9/22 | | | 155 | | | | 155 | | |
America Movil SAB de CV | |
3.13%, 7/16/22 | | | 200 | | | | 207 | | |
American Honda Finance Corp. | |
2.13%, 2/28/17 (b)(e) | | | 200 | | | | 207 | | |
Amgen, Inc. | |
3.88%, 11/15/21 (e) | | | 75 | | | | 81 | | |
ArcelorMittal | |
10.10%, 6/1/19 (e) | | | 100 | | | | 115 | | |
AT&T, Inc., | |
5.35%, 9/1/40 | | | 25 | | | | 30 | | |
6.30%, 1/15/38 (e) | | | 170 | | | | 224 | | |
BAA Funding Ltd. | |
4.88%, 7/15/21 (b) | | | 170 | | | | 181 | | |
Bemis Co., Inc. | |
4.50%, 10/15/21 | | | 110 | | | | 121 | | |
Boeing Capital Corp. | |
2.13%, 8/15/16 | | | 175 | | | | 184 | | |
BP Capital Markets PLC | |
3.25%, 5/6/22 | | | 125 | | | | 133 | | |
Burlington Northern Santa Fe LLC | |
5.65%, 5/1/17 | | | 115 | | | | 138 | | |
Canadian Oil Sands Ltd. | |
7.75%, 5/15/19 (b) | | | 125 | | | | 158 | | |
CF Industries, Inc. | |
6.88%, 5/1/18 | | | 150 | | | | 183 | | |
Coca-Cola Co. (The) | |
1.65%, 3/14/18 | | | 150 | | | | 155 | | |
ConocoPhillips | |
6.50%, 2/1/39 | | | 25 | | | | 36 | | |
Covidien International Finance SA | |
3.20%, 6/15/22 (e) | | | 45 | | | | 48 | | |
CRH America, Inc. | |
6.00%, 9/30/16 | | | 135 | | | | 151 | | |
Daimler Finance North America LLC | |
8.50%, 1/18/31 (e) | | | 55 | | | | 87 | | |
Darden Restaurants, Inc. | |
6.20%, 10/15/17 | | | 205 | | | | 239 | | |
Deere & Co. | |
3.90%, 6/9/42 (e) | | | 50 | | | | 52 | | |
Delhaize Group SA | |
5.70%, 10/1/40 | | | 106 | | | | 95 | | |
| | | Face
Amount
(000) | | Value
(000) | |
Deutsche Telekom International Finance BV | |
8.75%, 6/15/30 (e) | | $ | 65 | | | $ | 98 | | |
Diageo Capital PLC | |
1.50%, 5/11/17 (e) | | | 60 | | | | 61 | | |
DirecTV Holdings LLC/DirecTV Financing Co., Inc. | |
3.80%, 3/15/22 | | | 200 | | | | 206 | | |
EOG Resources, Inc. | |
2.63%, 3/15/23 | | | 100 | | | | 101 | | |
Experian Finance PLC | |
2.38%, 6/15/17 (b) | | | 210 | | | | 213 | | |
Express Scripts Holding Co., | |
2.65%, 2/15/17 (b) | | | 110 | | | | 115 | | |
3.90%, 2/15/22 (b) | | | 50 | | | | 55 | | |
Fiserv, Inc. | |
3.13%, 6/15/16 | | | 80 | | | | 84 | | |
FMC Technologies, Inc. | |
3.45%, 10/1/22 | | | 55 | | | | 56 | | |
Ford Motor Credit Co., LLC | |
4.21%, 4/15/16 | | | 200 | | | | 212 | | |
Gap, Inc. (The) | |
5.95%, 4/12/21 (e) | | | 75 | | | | 84 | | |
Georgia-Pacific LLC | |
5.40%, 11/1/20 (b)(e) | | | 90 | | | | 106 | | |
Gilead Sciences, Inc. | |
4.50%, 4/1/21 (e) | | | 140 | | | | 161 | | |
Grupo Bimbo SAB de CV | |
4.88%, 6/30/20 (b) | | | 100 | | | | 112 | | |
Harley-Davidson Funding Corp. | |
6.80%, 6/15/18 (b) | | | 105 | | | | 130 | | |
Hess Corp. | |
6.00%, 1/15/40 | | | 175 | | | | 213 | | |
Hewlett-Packard Co. | |
4.65%, 12/9/21 (e) | | | 165 | | | | 172 | | |
Holcim US Finance Sarl & Cie SCS | |
6.00%, 12/30/19 (b)(e) | | | 85 | | | | 95 | | |
Kinross Gold Corp. | |
5.13%, 9/1/21 (e) | | | 115 | | | | 119 | | |
Kraft Foods Group, Inc. | |
5.38%, 2/10/20 (b) | | | 102 | | | | 121 | | |
Kraft Foods, Inc. | |
5.38%, 2/10/20 | | | 93 | | | | 112 | | |
L-3 Communications Corp. | |
4.75%, 7/15/20 (e) | | | 135 | | | | 149 | | |
LVMH Moet Hennessy Louis Vuitton SA | |
1.63%, 6/29/17 (b)(e) | | | 150 | | | | 151 | | |
Macy's Retail Holdings, Inc. | |
3.88%, 1/15/22 (e) | | | 105 | | | | 113 | | |
Marathon Petroleum Corp. | |
5.13%, 3/1/21 (e) | | | 120 | | | | 139 | | |
Motorola Solutions, Inc. | |
3.75%, 5/15/22 (e) | | | 100 | | | | 104 | | |
Murphy Oil Corp. | |
4.00%, 6/1/22 | | | 100 | | | | 106 | | |
The accompanying notes are an integral part of the financial statements.
11
Morgan Stanley Institutional Fund Trust
Annual Report — September 30, 2012
Portfolio of Investments (cont'd)
Core Fixed Income Portfolio
| | | Face
Amount
(000) | | Value
(000) | |
Industrials (cont'd) | |
NBC Universal Media LLC, | |
2.88%, 1/15/23 | | $ | 175 | | | $ | 175 | | |
5.95%, 4/1/41 (e) | | | 50 | | | | 61 | | |
Nippon Telegraph & Telephone Corp. | |
1.40%, 7/18/17 | | | 100 | | | | 102 | | |
PepsiCo, Inc. | |
2.75%, 3/5/22 (e) | | | 125 | | | | 130 | | |
Philip Morris International, Inc. | |
2.50%, 8/22/22 (e) | | | 130 | | | | 131 | | |
Phillips 66 | |
4.30%, 4/1/22 (b) | | | 100 | | | | 110 | | |
SABMiller Holdings, Inc. | |
3.75%, 1/15/22 (b) | | | 200 | | | | 218 | | |
Sanofi | |
4.00%, 3/29/21 (e) | | | 135 | | | | 155 | | |
Schneider Electric SA | |
2.95%, 9/27/22 (b) | | | 125 | | | | 126 | | |
Sonoco Products Co. | |
5.75%, 11/1/40 (e) | | | 100 | | | | 117 | | |
Syngenta Finance N.V. | |
3.13%, 3/28/22 | | | 130 | | | | 137 | | |
Telefonaktiebolaget LM Ericsson | |
4.13%, 5/15/22 | | | 75 | | | | 78 | | |
Teva Pharmaceutical Finance IV BV | |
3.65%, 11/10/21 (e) | | | 215 | | | | 234 | | |
Thermo Fisher Scientific, Inc. | |
3.15%, 1/15/23 | | | 105 | | | | 109 | | |
Time Warner Cable, Inc., | |
4.50%, 9/15/42 (e) | | | 50 | | | | 50 | | |
6.75%, 6/15/39 (e) | | | 40 | | | | 52 | | |
Time Warner, Inc. | |
4.90%, 6/15/42 (e) | | | 50 | | | | 55 | | |
United Technologies Corp. | |
4.50%, 6/1/42 | | | 40 | | | | 45 | | |
Vale Overseas Ltd. | |
5.63%, 9/15/19 | | | 85 | | | | 96 | | |
Verizon Communications, Inc. | |
8.95%, 3/1/39 (e) | | | 50 | | | | 87 | | |
VF Corp. | |
3.50%, 9/1/21 | | | 105 | | | | 113 | | |
Volkswagen International Finance N.V. | |
2.38%, 3/22/17 (b) | | | 115 | | | | 120 | | |
Waste Management, Inc. | |
2.90%, 9/15/22 | | | 75 | | | | 75 | | |
Watson Pharmaceuticals, | |
3.25%, 10/1/22 | | | 25 | | | | 25 | | |
4.63%, 10/1/42 | | | 10 | | | | 10 | | |
Wesfarmers Ltd. | |
2.98%, 5/18/16 (b)(e) | | | 85 | | | | 89 | | |
Westvaco Corp. | |
8.20%, 1/15/30 | | | 45 | | | | 60 | | |
| | | Face
Amount
(000) | | Value
(000) | |
Woolworths Ltd. | |
4.00%, 9/22/20 (b) | | $ | 125 | | | $ | 135 | | |
WPP Finance UK | |
8.00%, 9/15/14 | | | 100 | | | | 112 | | |
| | | | 9,682 | | |
Utilities (1.8%) | |
Enterprise Products Operating LLC, | |
5.25%, 1/31/20 | | | 50 | | | | 59 | | |
Series N | |
6.50%, 1/31/19 (e) | | | 160 | | | | 199 | | |
Exelon Generation Co., LLC | |
6.25%, 10/1/39 | | | 140 | | | | 163 | | |
Kinder Morgan Energy Partners LP | |
5.95%, 2/15/18 | | | 160 | | | | 193 | | |
Plains All American Pipeline LP/PAA
Finance Corp., | |
6.70%, 5/15/36 | | | 160 | | | | 205 | | |
8.75%, 5/1/19 | | | 65 | | | | 87 | | |
PPL WEM Holdings PLC | |
3.90%, 5/1/16 (b) | | | 150 | | | | 158 | | |
| | | | 1,064 | | |
| | | | 17,530 | | |
Municipal Bonds (1.2%) | |
City of Chicago, IL, | |
O'Hare International Airport Revenue | |
6.40%, 1/1/40 | | | 40 | | | | 52 | | |
City of New York, NY, | |
Series G-1 | |
5.97%, 3/1/36 | | | 85 | | | | 112 | | |
Illinois State Toll Highway Authority, | |
Highway Revenue, Build America Bonds | |
6.18%, 1/1/34 | | | 130 | | | | 167 | | |
Municipal Electric Authority of Georgia | |
6.66%, 4/1/57 | | | 155 | | | | 181 | | |
State of California, | |
General Obligation Bonds | |
5.95%, 4/1/16 | | | 175 | | | | 199 | | |
| | | | 711 | | |
Sovereign (2.4%) | |
Banco Nacional de Desenvolvimento,
Economico e Social | |
5.50%, 7/12/20 (b) | | | 150 | | | | 178 | | |
Brazilian Government International Bond | |
4.88%, 1/22/21 | | | 220 | | | | 264 | | |
Eskom Holdings SOC Ltd. | |
5.75%, 1/26/21 (b) | | | 200 | | | | 229 | | |
Mexico Government International Bond | |
3.63%, 3/15/22 | | | 200 | | | | 219 | | |
Petroleos Mexicanos | |
4.88%, 1/24/22 | | | 250 | | | | 283 | | |
The accompanying notes are an integral part of the financial statements.
12
Morgan Stanley Institutional Fund Trust
Annual Report — September 30, 2012
Portfolio of Investments (cont'd)
Core Fixed Income Portfolio
| | | Face
Amount
(000) | | Value
(000) | |
Sovereign (cont'd) | |
Russian Foreign Bond - Eurobond | |
3.25%, 4/4/17 (b) | | $ | 200 | | | $ | 211 | | |
| | | | 1,384 | | |
U.S. Agency Securities (2.3%) | |
Federal National Mortgage Association, | |
0.88%, 10/26/17 | | | 300 | | | | 302 | | |
5.38%, 6/12/17 | | | 700 | | | | 849 | | |
6.63%, 11/15/30 | | | 100 | | | | 154 | | |
| | | | 1,305 | | |
U.S. Treasury Securities (17.8%) | |
U.S. Treasury Bonds, | |
3.00%, 5/15/42 (e) | | | 150 | | | | 156 | | |
3.88%, 8/15/40 | | | 2,125 | | | | 2,596 | | |
5.25%, 11/15/28 | | | 730 | | | | 1,022 | | |
U.S. Treasury Notes, | |
1.25%, 10/31/15 (e) | | | 2,165 | | | | 2,226 | | |
1.75%, 3/31/14 | | | 2,000 | | | | 2,046 | | |
2.25%, 3/31/16 (e) | | | 2,025 | | | | 2,157 | | |
| | | | 10,203 | | |
Total Fixed Income Securities (Cost $53,314) | | | 56,392 | | |
| | | Shares | | | |
Short-Term Investments (28.4%) | |
Securities held as Collateral on Loaned Securities (16.3%) | |
Investment Company (12.1%) | |
Morgan Stanley Institutional
Liquidity Funds — Money Market
Portfolio — Institutional Class (See Note G) | | | 6,942,381 | | | | 6,942 | | |
| | | Face
Amount
(000) | | | |
Repurchase Agreements (4.2%) | |
Barclays Capital, Inc., (0.15%, dated 9/28/12,
due 10/1/12; proceeds $735; fully
collateralized by a U.S. Government Obligation;
U.S. Treasury Note 0.75% due 6/30/17;
valued at $749) | | $ | 735 | | | | 735 | | |
Merrill Lynch & Co., Inc., (0.15%, dated 9/28/12,
due 10/1/12; proceeds $271; fully
collateralized by a U.S. Government Obligation;
U.S. Treasury Note 1.75% due 5/15/22;
valued at $276) | | | 271 | | | | 271 | | |
Merrill Lynch & Co., Inc., (0.22%, dated 9/28/12,
due 10/1/12; proceeds $1,392; fully
collateralized by a U.S. Government Agency;
Federal National Mortgage Association
4.00% due 4/1/42; valued at $1,420) | | | 1,392 | | | | 1,392 | | |
| | | | 2,398 | | |
Total Securities held as Collateral on
Loaned Securities (Cost $9,340) | | | 9,340 | | |
| | |
Shares | |
Value
(000) | |
Investment Company (4.6%) | |
Morgan Stanley Institutional
Liquidity Funds — Money Market
Portfolio — Institutional Class (See Note G)
(Cost $2,618) | | | 2,618,020 | | | $ | 2,618 | | |
| | | Face
Amount
(000) | | | |
U.S. Treasury Securities (7.5%) | |
U.S. Treasury Bills, | |
0.11%, 10/4/12 (e)(g) | | $ | 1,000 | | | | 1,000 | | |
0.13%, 12/27/12 (g) | | | 1,470 | | | | 1,469 | | |
0.13%, 11/29/12 - 12/13/12 (e)(g) | | | 1,780 | | | | 1,780 | | |
0.13%, 2/21/13 (g)(h) | | | 50 | | | | 50 | | |
| | | | 4,299 | | |
Total Short-Term Investments (Cost $16,257) | | | 16,257 | | |
Total Investments (126.6%) (Cost $69,571)
Including $11,769 of Securities Loaned (i) | | | 72,649 | | |
Liabilities in Excess of Other Assets (-26.6%) | | | (15,286 | ) | |
Net Assets (100.0%) | | $ | 57,363 | | |
(a) Security is subject to delayed delivery.
(b) 144A security — Certain conditions for public sale may exist. Unless otherwise noted, these securities are deemed to be liquid.
(c) Variable/Floating Rate Security — Interest rate changes on these instruments are based on changes in a designated base rate. The rates shown are those in effect on September 30, 2012.
(d) Inverse Floating Rate Security — Interest rate fluctuates with an inverse relationship to an associated interest rate. Indicated rate is the effective rate at September 30, 2012.
(e) All or a portion of this security was on loan at September 30, 2012.
(f) When-issued security.
(g) Rate shown is the yield to maturity at September 30, 2012.
(h) All or a portion of the security was pledged to cover margin requirements for futures contracts.
(i) Securities are available for collateral in connection with purchase of when-issued securities, securities purchased on a forward commitment basis, open futures contracts and swap agreements.
IO Interest Only.
MTN Medium Term Note.
PAC Planned Amortization Class.
REMIC Real Estate Mortgage Investment Conduit.
STRIPS Separate Trading of Registered Interest and Principal of Securities.
TBA To Be Announced.
The accompanying notes are an integral part of the financial statements.
13
Morgan Stanley Institutional Fund Trust
Annual Report — September 30, 2012
Portfolio of Investments (cont'd)
Core Fixed Income Portfolio
Futures Contracts:
The Portfolio had the following futures contracts open at September 30, 2012:
| | | Number
of
Contracts | | Value
(000) | | Expiration
Date | | Unrealized
Appreciation
(Depreciation)
(000) | |
Long: | |
U.S. Treasury 5 yr. Note | | | 80 | | | $ | 9,971 | | | Dec-12 | | $ | 31 | | |
U.S. Treasury 2 yr. Note | | | 24 | | | | 5,293 | | | Dec-12 | | | 3 | | |
Short: | |
U.S. Treasury 30 yr. Bond | | | 6 | | | | (896 | ) | | Dec-12 | | | (7 | ) | |
U.S. Treasury 10 yr. Note | | | 40 | | | | (5,340 | ) | | Dec-12 | | | (27 | ) | |
| | | | | | | | | $ | (— | @) | |
Interest Rate Swap Agreements:
The Portfolio had the following interest rate swap agreements open at September 30, 2012:
Swap Counterparty | | Floating Rate
Index | | Pay/Receive
Floating Rate | | Fixed Rate | | Termination
Date | | Notional
Amount
(000) | | Unrealized
(Depreciation)
(000) | |
Barclays Capital | | 3 Month LIBOR | | Receive | | | 0.81 | % | | 9/24/17 | | $ | 1,180 | | | $ | (3 | ) | |
Credit Suisse | | 3 Month LIBOR | | Receive | | | 0.39 | | | 9/25/14 | | | 3,700 | | | | (3 | ) | |
Credit Suisse | | 3 Month LIBOR | | Receive | | | 0.82 | | | 9/13/17 | | | 1,770 | | | | (5 | ) | |
Deutsche Bank | | 3 Month LIBOR | | Receive | | | 0.82 | | | 7/24/17 | | | 3,026 | | | | (14 | ) | |
| | | | | | | | | | | | | | | $ | (25 | ) | |
@ Value is less than $500.
LIBOR London Interbank Offered Rate.
The accompanying notes are an integral part of the financial statements.
14
Morgan Stanley Institutional Fund Trust
Annual Report — September 30, 2012
Core Fixed Income Portfolio
Statement of Assets and Liabilities | | September 30, 2012
(000) | |
Assets: | |
Investments in Securities of Unaffiliated Issuers, at Value(1) (Cost $59,861) | | $ | 62,910 | | |
Investment in Securities of Affiliated Issuers, at Value (Cost $9,710) | | | 9,739 | | |
Total Investments in Securities, at Value (Cost $69,571) | | | 72,649 | | |
Cash | | | 10 | | |
Interest Receivable | | | 383 | | |
Receivable for Investments Sold | | | 88 | | |
Due from Adviser | | | 53 | | |
Receivable for Variation Margin | | | 5 | | |
Receivable for Portfolio Shares Sold | | | 5 | | |
Receivable from Affiliates | | | 4 | | |
Tax Reclaim Receivable | | | 1 | | |
Other Assets | | | 14 | | |
Total Assets | | | 73,212 | | |
Liabilities: | |
Collateral on Securities Loaned, at Value | | | 9,350 | | |
Payable for Investments Purchased | | | 6,165 | | |
Payable for Portfolio Shares Redeemed | | | 189 | | |
Payable for Sub Transfer Agency Fees | | | 60 | | |
Payable for Professional Fees | | | 33 | | |
Unrealized Depreciation on Swap Agreements | | | 25 | | |
Payable for Custodian Fees | | | 6 | | |
Payable for Administration Fees | | | 4 | | |
Payable for Trustees' Fees and Expenses | | | 4 | | |
Payable for Transfer Agent Fees | | | 1 | | |
Payable for Shareholder Services Fees — Class P | | | — | @ | |
Payable for Shareholder Services Fees — Class H | | | — | @ | |
Payable for Distribution and Shareholder Services Fees — Class L | | | — | @ | |
Other Liabilities | | | 12 | | |
Total Liabilities | | | 15,849 | | |
Net Assets | | $ | 57,363 | | |
Net Assets Consist Of: | |
Paid-in-Capital | | $ | 91,727 | | |
Undistributed Net Investment Income | | | 768 | | |
Accumulated Net Realized Loss | | | (38,185 | ) | |
Unrealized Appreciation (Depreciation) on: | |
Investments | | | 3,049 | | |
Investments in Affiliates | | | 29 | | |
Futures Contracts | | | (— | @) | |
Swap Agreements | | | (25 | ) | |
Net Assets | | $ | 57,363 | | |
The accompanying notes are an integral part of the financial statements.
15
Morgan Stanley Institutional Fund Trust
Annual Report — September 30, 2012
Core Fixed Income Portfolio
Statement of Assets and Liabilities | | September 30, 2012
(000) | |
CLASS I: | |
Net Assets | | $ | 57,013 | | |
| Shares Outstanding (unlimited number of shares authorized, no par value) (not in 000s) | | | 5,430,243 | | |
Net Asset Value, Offering and Redemption Price Per Share | | $ | 10.50 | | |
CLASS P: | |
Net Assets | | $ | 330 | | |
| Shares Outstanding (unlimited number of shares authorized, no par value) (not in 000s) | | | 31,235 | | |
Net Asset Value, Offering and Redemption Price Per Share | | $ | 10.56 | | |
CLASS H: | |
Net Assets | | $ | 10 | | |
| Shares Outstanding (unlimited number of shares authorized, no par value) (not in 000s) | | | 972 | | |
Net Asset Value, Redemption Price Per Share | | $ | 10.56 | | |
Maximum Sales Load | | | 3.50 | % | |
Maximum Sales Charge | | $ | 0.38 | | |
Maximum Offering Price Per Share | | $ | 10.94 | | |
CLASS L: | |
Net Assets | | $ | 10 | | |
| Shares Outstanding (unlimited number of shares authorized, no par value) (not in 000s) | | | 972 | | |
Net Asset Value, Offering and Redemption Price Per Share | | $ | 10.55 | | |
(1) Including:
Securities on Loan, at Value: | | $ | 11,769 | | |
@ Amount is less than $500.
The accompanying notes are an integral part of the financial statements.
16
Morgan Stanley Institutional Fund Trust
Annual Report — September 30, 2012
Core Fixed Income Portfolio
Statement of Operations | | Year Ended
September 30, 2012
(000) | |
Investment Income: | |
Interest from Securities of Unaffiliated Issuers (Net of $—@ Foreign Taxes Withheld) | | $ | 1,961 | | |
Interest from Securities of Affiliated Issuers | | | 19 | | |
Income from Securities Loaned — Net | | | 12 | | |
Dividends from Security of Affiliated Issuer | | | 5 | | |
Total Investment Income | | | 1,997 | | |
Expenses: | |
Advisory Fees (Note B) | | | 227 | | |
Sub Transfer Agency Fees | | | 79 | | |
Professional Fees | | | 72 | | |
Registration Fees | | | 53 | | |
Administration Fees (Note C) | | | 49 | | |
Custodian Fees (Note F) | | | 33 | | |
Pricing Fees | | | 30 | | |
Shareholder Reporting Fees | | | 21 | | |
Transfer Agency Fees (Note E) | | | 10 | | |
Trustees' Fees and Expenses | | | 3 | | |
Shareholder Services Fees — Class P (Note D) | | | — | @ | |
Shareholder Services Fees — Class H (Note D) | | | — | @ | |
Distribution and Shareholder Services Fees — Class L (Note D) | | | — | @ | |
Other Expenses | | | 13 | | |
Total Expenses | | | 590 | | |
Waiver of Advisory Fees (Note B) | | | (227 | ) | |
Expenses Reimbursed by Adviser (Note B) | | | (59 | ) | |
Rebate from Morgan Stanley Affiliate (Note G) | | | (5 | ) | |
Expense Offset (Note F) | | | (— | @) | |
Net Expenses | | | 299 | | |
Net Investment Income | | | 1,698 | | |
Realized Gain (Loss): | |
Investments Sold | | | 1,952 | | |
Investments in Affiliates | | | 49 | | |
Futures Contracts | | | (240 | ) | |
Swap Agreements | | | (283 | ) | |
Net Realized Gain | | | 1,478 | | |
Change in Unrealized Appreciation (Depreciation): | |
Investments | | | 1,108 | | |
Investments in Affiliates | | | (4 | ) | |
Futures Contracts | | | 71 | | |
Swap Agreements | | | 181 | | |
Net Change in Unrealized Appreciation (Depreciation) | | | 1,356 | | |
Net Realized Gain and Change in Unrealized Appreciation (Depreciation) | | | 2,834 | | |
Net Increase in Net Assets Resulting from Operations | | $ | 4,532 | | |
@ Amount is less than $500.
The accompanying notes are an integral part of the financial statements.
17
Morgan Stanley Institutional Fund Trust
Annual Report — September 30, 2012
Core Fixed Income Portfolio
Statements of Changes in Net Assets | | Year Ended
September 30, 2012
(000) | | Year Ended
September 30, 2011
(000) | |
Increase (Decrease) in Net Assets: | |
Operations: | |
Net Investment Income | | $ | 1,698 | | | $ | 2,374 | | |
Net Realized Gain | | | 1,478 | | | | 1,877 | | |
Net Change in Unrealized Appreciation (Depreciation) | | | 1,356 | | | | (1,423 | ) | |
Net Increase in Net Assets Resulting from Operations | | | 4,532 | | | | 2,828 | | |
Distributions from and/or in Excess of: | |
Class I: | |
Net Investment Income | | | (2,115 | ) | | | (2,131 | ) | |
Class P: | |
Net Investment Income | | | (3 | ) | | | (4 | ) | |
Class H: | |
Net Investment Income | | | (— | @)* | | | — | | |
Class L: | |
Net Investment Income | | | (— | @)* | | | — | | |
Total Distributions | | | (2,118 | ) | | | (2,135 | ) | |
Capital Share Transactions:(1) | |
Class I: | |
Subscribed | | | 1,368 | | | | 2,966 | | |
Distributions Reinvested | | | 2,115 | | | | 2,131 | | |
Redeemed | | | (12,743 | ) | | | (17,577 | ) | |
Class P: | |
Subscribed | | | 304 | | | | 6 | | |
Distributions Reinvested | | | 3 | | | | 4 | | |
Redeemed | | | (28 | ) | | | (173 | ) | |
Class H: | |
Subscribed | | | 10 | * | | | — | | |
Class L: | |
Subscribed | | | 10 | * | | | — | | |
Net Decrease in Net Assets Resulting from Capital Share Transactions | | | (8,961 | ) | | | (12,643 | ) | |
Total Decrease in Net Assets | | | (6,547 | ) | | | (11,950 | ) | |
Net Assets: | |
Beginning of Period | | | 63,910 | | | | 75,860 | | |
End of Period (Including Undistributed Net Investment Income of $768 and $976) | | $ | 57,363 | | | $ | 63,910 | | |
(1) Capital Share Transactions: | |
Class I: | |
Shares Subscribed | | | 134 | | | | 302 | | |
Shares Issued on Distributions Reinvested | | | 210 | | | | 217 | | |
Shares Redeemed | | | (1,248 | ) | | | (1,778 | ) | |
Net Decrease in Class I Shares Outstanding | | | (904 | ) | | | (1,259 | ) | |
Class P: | |
Shares Subscribed | | | 30 | | | | 1 | | |
Shares Issued on Distributions Reinvested | | | — | @@ | | | — | @@ | |
Shares Redeemed | | | (3 | ) | | | (18 | ) | |
Net Increase (Decrease) in Class P Shares Outstanding | | | 27 | | | | (17 | ) | |
Class H: | |
Shares Subscribed | | | 1 | * | | | — | | |
Class L: | |
Shares Subscribed | | | 1 | * | | | — | | |
@ Amount is less than $500.
@@ Amount is less than 500 shares.
* For the period April 27, 2012 through September 30, 2012.
The accompanying notes are an integral part of the financial statements.
18
Morgan Stanley Institutional Fund Trust
Annual Report — September 30, 2012
Financial Highlights
Core Fixed Income Portfolio
| | | Class I | |
| | | Year Ended September 30, | |
Selected Per Share Data and Ratios | | 2012 | | 2011 | | 2010 | | 2009 | | 2008 | |
Net Asset Value, Beginning of Period | | $ | 10.08 | | | $ | 9.96 | | | $ | 9.49 | | | $ | 9.18 | | | $ | 10.77 | | |
Income (Loss) from Investment Operations: | |
Net Investment Income† | | | 0.29 | | | | 0.34 | | | | 0.34 | | | | 0.34 | | | | 0.53 | | |
Net Realized and Unrealized Gain (Loss) | | | 0.48 | | | | 0.08 | | | | 0.45 | | | | 0.57 | | | | (1.60 | ) | |
Total from Investment Operations | | | 0.77 | | | | 0.42 | | | | 0.79 | | | | 0.91 | | | | (1.07 | ) | |
Distributions from and/or in Excess of: | |
Net Investment Income | | | (0.35 | ) | | | (0.30 | ) | | | (0.32 | ) | | | (0.60 | ) | | | (0.52 | ) | |
Redemption Fees | | | — | | | | — | | | | — | | | | 0.00 | ‡ | | | 0.00 | ‡ | |
Net Asset Value, End of Period | | $ | 10.50 | | | $ | 10.08 | | | $ | 9.96 | | | $ | 9.49 | | | $ | 9.18 | | |
Total Return++ | | | 7.83 | % | | | 4.34 | % | | | 8.57 | % | | | 10.41 | % | | | (10.40 | )% | |
Ratios and Supplemental Data: | |
Net Assets, End of Period (Thousands) | | $ | 57,013 | | | $ | 63,866 | | | $ | 75,651 | | | $ | 93,768 | | | $ | 186,305 | | |
Ratio of Expenses to Average Net Assets (1) | | | 0.49 | %+ | | | 0.50 | %+†† | | | 0.50 | %+†† | | | 0.50 | %+ | | | 0.49 | %+ | |
Ratio of Net Investment Income to Average Net Assets (1) | | | 2.80 | %+ | | | 3.43 | %+†† | | | 3.58 | %+†† | | | 3.73 | %+ | | | 5.11 | %+ | |
Ratio of Rebate from Morgan Stanley Affiliates to Average Net Assets | | | 0.01 | % | | | 0.00 | %§ | | | 0.00 | %§ | | | 0.01 | % | | | 0.01 | % | |
Portfolio Turnover Rate | | | 216 | % | | | 234 | % | | | 261 | % | | | 437 | % | | | 306 | % | |
(1) Supplemental Information on the Ratios to Average Net Assets: | |
Ratios Before Expense Limitation: | |
Expenses to Average Net Assets | | | 0.97 | % | | | 0.99 | %†† | | | 0.67 | %+†† | | | 0.61 | %+ | | | 0.53 | %+ | |
Net Investment Income to Average Net Assets | | | 2.32 | % | | | 2.94 | %†† | | | 3.41 | %+†† | | | 3.62 | %+ | | | 5.07 | %+ | |
† Per share amount is based on average shares outstanding.
‡ Amount is less than $0.005 per share.
++ Calculated based on the net asset value as of the last business day of the period.
+ The Ratios of Expenses and Net Investment Income reflect the rebate of certain Portfolio expenses in connection with the investments in Morgan Stanley affiliates during the period. The effect of the rebate on the ratios is disclosed in the above table as "Ratio of Rebate from Morgan Stanley Affiliates to Average Net Assets."
†† Reflects overall Portfolio ratios for investment income and non-class specific expenses.
§ Amount is less than 0.005%.
The accompanying notes are an integral part of the financial statements.
19
Morgan Stanley Institutional Fund Trust
Annual Report — September 30, 2012
Financial Highlights
Core Fixed Income Portfolio
| | | Class P | |
| | | Year Ended September 30, | |
Selected Per Share Data and Ratios | | 2012 | | 2011 | | 2010 | | 2009 | | 2008 | |
Net Asset Value, Beginning of Period | | $ | 10.14 | | | $ | 10.01 | | | $ | 9.53 | | | $ | 9.12 | | | $ | 10.71 | | |
Income (Loss) from Investment Operations: | |
Net Investment Income† | | | 0.23 | | | | 0.31 | | | | 0.32 | | | | 0.31 | | | | 0.50 | | |
Net Realized and Unrealized Gain (Loss) | | | 0.52 | | | | 0.09 | | | | 0.46 | | | | 0.58 | | | | (1.60 | ) | |
Total from Investment Operations | | | 0.75 | | | | 0.40 | | | | 0.78 | | | | 0.89 | | | | (1.10 | ) | |
Distributions from and/or in Excess of: | |
Net Investment Income | | | (0.33 | ) | | | (0.27 | ) | | | (0.30 | ) | | | (0.48 | ) | | | (0.49 | ) | |
Redemption Fees | | | — | | | | — | | | | — | | | | 0.00 | ‡ | | | 0.00 | ‡ | |
Net Asset Value, End of Period | | $ | 10.56 | | | $ | 10.14 | | | $ | 10.01 | | | $ | 9.53 | | | $ | 9.12 | | |
Total Return++ | | | 7.55 | % | | | 4.11 | % | | | 8.47 | % | | | 10.10 | % | | | (10.68 | )% | |
Ratios and Supplemental Data: | |
Net Assets, End of Period (Thousands) | | $ | 330 | | | $ | 44 | | | $ | 209 | | | $ | 214 | | | $ | 487 | | |
Ratio of Expenses to Average Net Assets (1) | | | 0.74 | %+ | | | 0.75 | %+†† | | | 0.75 | %+†† | | | 0.75 | %+ | | | 0.74 | %+ | |
Ratio of Net Investment Income to Average Net Assets (1) | | | 2.25 | %+ | | | 3.18 | %+†† | | | 3.33 | %+†† | | | 3.48 | %+ | | | 4.87 | %+ | |
Ratio of Rebate from Morgan Stanley Affiliates to Average Net Assets | | | 0.01 | % | | | 0.00 | %§ | | | 0.00 | %§ | | | 0.01 | % | | | 0.01 | % | |
Portfolio Turnover Rate | | | 216 | % | | | 234 | % | | | 261 | % | | | 437 | % | | | 306 | % | |
(1) Supplemental Information on the Ratios to Average Net Assets: | |
Ratios Before Expense Limitation: | |
Expenses to Average Net Assets | | | 1.33 | % | | | 1.24 | %†† | | | 0.92 | %+†† | | | 0.86 | %+ | | | 0.78 | %+ | |
Net Investment Income to Average Net Assets | | | 1.66 | % | | | 2.69 | %†† | | | 3.16 | %+†† | | | 3.37 | %+ | | | 4.84 | %+ | |
† Per share amount is based on average shares outstanding.
‡ Amount is less than $0.005 per share.
++ Calculated based on the net asset value as of the last business day of the period.
+ The Ratios of Expenses and Net Investment Income reflect the rebate of certain Portfolio expenses in connection with the investments in Morgan Stanley affiliates during the period. The effect of the rebate on the ratios is disclosed in the above table as "Ratio of Rebate from Morgan Stanley Affiliates to Average Net Assets."
†† Reflects overall Portfolio ratios for investment income and non-class specific expenses.
§ Amount is less than 0.005%.
The accompanying notes are an integral part of the financial statements.
20
Morgan Stanley Institutional Fund Trust
Annual Report — September 30, 2012
Financial Highlights
Core Fixed Income Portfolio
| | | Class H | |
Selected Per Share Data and Ratios | | Period from
April 27, 2012^ to
September 30, 2012 | |
Net Asset Value, Beginning of Period | | $ | 10.29 | | |
Income from Investment Operations: | |
Net Investment Income† | | | 0.07 | | |
Net Realized and Unrealized Gain | | | 0.28 | | |
Total from Investment Operations | | | 0.35 | | |
Distributions from and/or in Excess of: | |
Net Investment Income | | | (0.08 | ) | |
Net Asset Value, End of Period | | $ | 10.56 | | |
Total Return++ | | | 3.37 | %# | |
Ratios and Supplemental Data: | |
Net Assets, End of Period (Thousands) | | $ | 10 | | |
Ratio of Expenses to Average Net Assets (1) | | | 0.74 | %+* | |
Ratio of Net Investment Income to Average Net Assets (1) | | | 1.68 | %+* | |
Rebate from Morgan Stanley Affiliates to Average Net Assets | | | 0.01 | %* | |
Portfolio Turnover Rate | | | 216 | %# | |
(1) Supplemental Information on the Ratios to Average Net Assets: | |
Ratios Before Expense Limitation: | |
Expense to Average Net Assets | | | 1.37 | %* | |
Net Investment Income to Average Net Assets | | | 1.05 | %* | |
^ Commencement of Operations.
† Per share amount is based on average shares outstanding.
++ Calculated based on the net asset value which does not reflect sales charges, if applicable, as of the last business day of the period.
+ The Ratios of Expenses and Net Investment Income reflect the rebate of certain Portfolio expenses in connection with the investments in Morgan Stanley affiliates during the period. The effect of the rebate on the ratios is disclosed in the above table as "Ratio of Rebate from Morgan Stanley Affiliates to Average Net Assets."
# Not Annualized.
* Annualized.
The accompanying notes are an integral part of the financial statements.
21
Morgan Stanley Institutional Fund Trust
Annual Report — September 30, 2012
Financial Highlights
Core Fixed Income Portfolio
| | | Class L | |
Selected Per Share Data and Ratios | | Period from
April 27, 2012^ to
September 30, 2012 | |
Net Asset Value, Beginning of Period | | $ | 10.29 | | |
Income from Investment Operations: | |
Net Investment Income† | | | 0.06 | | |
Net Realized and Unrealized Gain | | | 0.27 | | |
Total from Investment Operations | | | 0.33 | | |
Distributions from and/or in Excess of: | |
Net Investment Income | | | (0.07 | ) | |
Net Asset Value, End of Period | | $ | 10.55 | | |
Total Return++ | | | 3.23 | %# | |
Ratios and Supplemental Data: | |
Net Assets, End of Period (Thousands) | | $ | 10 | | |
Ratio of Expenses to Average Net Assets (1) | | | 0.99 | %+* | |
Ratio of Net Investment Income to Average Net Assets (1) | | | 1.45 | %+* | |
Rebate from Morgan Stanley Affiliates to Average Net Assets | | | 0.01 | %* | |
Portfolio Turnover Rate | | | 216 | %# | |
(1) Supplemental Information on the Ratios to Average Net Assets: | |
Ratios Before Expense Limitation: | |
Expense to Average Net Assets | | | 1.58 | %* | |
Net Investment Income to Average Net Assets | | | 0.86 | %* | |
^ Commencement of Operations.
† Per share amount is based on average shares outstanding.
++ Calculated based on the net asset value as of the last business day of the period.
+ The Ratios of Expenses and Net Investment Income reflect the rebate of certain Portfolio expenses in connection with the investments in Morgan Stanley affiliates during the period. The effect of the rebate on the ratios is disclosed in the above table as "Ratio of Rebate from Morgan Stanley Affiliates to Average Net Assets."
# Not Annualized.
* Annualized.
The accompanying notes are an integral part of the financial statements.
22
Morgan Stanley Institutional Fund Trust
Annual Report — September 30, 2012
Notes to Financial Statements
Morgan Stanley Institutional Fund Trust ("MSIFT" or the "Fund") is registered under the Investment Company Act of 1940, as amended (the "Act"), as an open-end management investment company. The Fund is comprised of seven separate, active portfolios (individually referred to as a "Portfolio", collectively as the "Portfolios"). All Portfolios are considered diversified for purposes of the Act.
The accompanying financial statements relate to the Core Fixed Income Portfolio. The Portfolio seeks above-average total return over a market cycle of three to five years. The Portfolio offers four classes of shares — Class I, Class P, Class H and Class L.
A. Significant Accounting Policies: The following significant accounting policies are in conformity with U.S. generally accepted accounting principles ("GAAP"). Such policies are consistently followed by the Fund in the preparation of its financial statements. GAAP may require management to make estimates and assumptions that affect the reported amounts and disclosures in the financial statements. Actual results may differ from those estimates.
1. Security Valuation: Bonds and other fixed income securities may be valued according to the broadest and most representative market. In addition, bonds and other fixed income securities may be valued on the basis of prices provided by a pricing service. The prices provided by a pricing service take into account broker-dealer market price quotations for institutional size trading in similar groups of securities, security quality, maturity, coupon and other security characteristics as well as any developments related to the specific securities. Short-term debt securities purchased with remaining maturities of 60 days or less are valued at amortized cost, unless the Board of Trustees (the "Trustees") determines such valuation does not reflect the securities' fair value, in which case these securities will be valued at their fair value as determined in good faith under procedures adopted by the Trustees. Equity securities listed on a U.S. exchange are valued at the latest quoted sales price on the valuation date. Equity securities listed or traded on NASDAQ, for which market quotations are available, are valued at the NASDAQ Official Closing Price. Securities listed on a foreign exchange are valued at their closing price, except as noted below. Unlisted and listed equity securities not traded on the valuation date, for which market quotations are readily available, are valued at the mean between the last reported bid and asked prices obtained from reputable brokers.
Under procedures approved by the Trustees, the Fund's adviser, Morgan Stanley Investment Management Inc. (the "Adviser"), has formed a Valuation Committee. The Valuation Committee provides administration and oversight of the Fund's valuation policies and procedures, which are reviewed at least annually by the Trustees. Among other things, these procedures allow the Fund to utilize independent pricing services, quotations from securities and financial instrument dealers, and other market sources to determine fair value.
The Fund has procedures to determine the fair value of securities and other financial instruments for which market prices are not readily available. Under these procedures, the Valuation Committee convenes on a regular and adhoc basis to review such securities and considers a number of factors, including valuation methodologies and significant unobservable valuation inputs, when arriving at fair value. The Valuation Committee may employ a market-based approach which may use related or comparable assets or liabilities, recent transactions, market multiples, book values, and other relevant information for the investment to determine the fair value of the investment. An income-based valuation approach may also be used in which the anticipated future cash flows of the investment are discounted to calculate fair value. Discounts may also be applied due to the nature or duration of any restrictions on the disposition of the investments. Due to the inherent uncertainty of valuations of such investments, the fair values may differ significantly from the values that would have been used had an active market existed. The Valuation Committee employs various methods for calibrating these valuation approaches including a regular review of valuation methodologies, key inputs and assumptions, transactional back-testing or disposition analysis, and reviews of any related market activity.
Most foreign markets close before the New York Stock Exchange ("NYSE"). Occasionally, developments that could affect the closing prices of securities and other assets may occur between the times at which valuations of such securities are determined (that is, close of the foreign market on which the securities trade) and the close of business on the NYSE. If these developments are expected to materially affect the value of the securities, the valuations may be adjusted to reflect the estimated fair
23
Morgan Stanley Institutional Fund Trust
Annual Report — September 30, 2012
Notes to Financial Statements (cont'd)
value as of the close of the NYSE, as determined in good faith under procedures established by the Trustees.
2. Fair Value Measurement: Financial Accounting Standards Board ("FASB") Accounting Standards CodificationTM ("ASC") 820, "Fair Value Measurements and Disclosures" ("ASC 820"), defines fair value as the value that the Fund would receive to sell an investment or pay to transfer a liability in a timely transaction with an independent buyer in the principal market, or in the absence of a principal market the most advantageous market for the investment or liability. ASC 820 establishes a three-tier hierarchy to distinguish between (1) inputs that reflect the assumptions market participants would use in valuing an asset or liability developed based on market data obtained from sources independent of the reporting entity (observable inputs) and (2) inputs that reflect the reporting entity's own assumptions about the assumptions market participants would use in valuing an asset or liability developed based on the best information available in the circumstances (unobservable inputs) and to establish classification of fair value measurements for disclosure purposes. Various inputs are used in determining the value of the Fund's investments. The inputs are summarized in the three broad levels listed below.
• Level 1 – unadjusted quoted prices in active markets for identical investments
• Level 2 – other significant observable inputs (including quoted prices for similar investments, interest rates, prepayment speeds, credit risk, etc.)
• Level 3 – significant unobservable inputs including the Fund's own assumptions in determining the fair value of investments. Factors considered in making this determination may include, but are not limited to, information obtained by contacting the issuer, analysts, or the appropriate stock exchange (for exchange-traded securities), analysis of the issuer's financial statements or other available documents and, if necessary, available information concerning other securities in similar circumstances
The inputs or methodology used for valuing securities are not necessarily an indication of the risk associated
with investing in those securities and the determination of the significance of a particular input to the fair value measurement in its entirety requires judgment and considers factors specific to each security.
The following is a summary of the inputs used to value the Portfolio's investments as of September 30, 2012.
Investment Type | | Level 1
Unadjusted
quoted
prices
(000) | | Level 2
Other
significant
observable
inputs
(000) | | Level 3
Significant
unobservable
inputs
(000) | | Total
(000) | |
Assets: | |
Fixed Income Securities | |
Agency Fixed Rate
Mortgages | | $ | — | | | $ | 15,570 | | | $ | — | | | $ | 15,570 | | |
Asset-Backed Securities | | | — | | | | 3,128 | | | | — | | | | 3,128 | | |
Collateralized Mortgage
Obligations — Agency
Collateral Series | | | — | | | | 4,799 | | | | — | | | | 4,799 | | |
Commercial Mortgage
Backed Securities | | | — | | | | 1,762 | | | | — | | | | 1,762 | | |
Corporate Bonds | | | — | | | | 17,530 | | | | — | | | | 17,530 | | |
Municipal Bonds | | | — | | | | 711 | | | | — | | | | 711 | | |
Sovereign | | | — | | | | 1,384 | | | | — | | | | 1,384 | | |
U.S. Agency Securities | | | — | | | | 1,305 | | | | — | | | | 1,305 | | |
U.S. Treasury Securities | | | — | | | | 10,203 | | | | — | | | | 10,203 | | |
Total Fixed Income
Securities | | | — | | | | 56,392 | | | | — | | | | 56,392 | | |
Short-Term Investments | |
Investment Company | | | 9,560 | | | | — | | | | — | | | | 9,560 | | |
Repurchase Agreements | | | — | | | | 2,398 | | | | — | | | | 2,398 | | |
U.S. Treasury Securities | | | — | | | | 4,299 | | | | — | | | | 4,299 | | |
Total Short-Term
Investments | | | 9,560 | | | | 6,697 | | | | — | | | | 16,257 | | |
Futures Contracts | | | 34 | | | | — | | | | — | | | | 34 | | |
Total Assets | | | 9,594 | | | | 63,089 | | | | — | | | | 72,683 | | |
Liabilities: | |
Futures Contracts | | | (34 | ) | | | — | | | | — | | | | (34 | ) | |
Interest Rate Swap
Agreements | | | — | | | | (25 | ) | | | — | | | | (25 | ) | |
Total Liabilities | | | (34 | ) | | | (25 | ) | | | — | | | | (59 | ) | |
Total | | $ | 9,560 | | | $ | 63,064 | | | $ | — | | | $ | 72,624 | | |
Transfers between investment levels may occur as the markets fluctuate and/or the availability of data used in an investment's valuation changes. The Portfolio recognizes transfers between the levels as of the end of the period. As of September 30, 2012, the Portfolio did not have any investments transfer between investment levels.
3. Derivatives: The Portfolio may, but is not required to, use derivative instruments for a variety of purposes, including hedging, risk management, portfolio management or to earn income. Derivatives are financial instruments whose value is based on the value of an underlying asset,
24
Morgan Stanley Institutional Fund Trust
Annual Report — September 30, 2012
Notes to Financial Statements (cont'd)
interest rate, index or financial instrument. A derivative instrument often has risks similar to its underlying asset and may have additional risks, including imperfect correlation between the value of the derivative and the underlying asset, risks of default by the counterparty to certain transactions, magnification of losses incurred due to changes in the market value of the securities, instruments, indices or interest rates to which they relate, and risks that the transactions may not be liquid. The use of derivatives involves risks that are different from, and possibly greater than, the risks associated with other portfolio investments. Derivatives may involve the use of highly specialized instruments that require investment techniques and risk analyses different from those associated with other portfolio investments. All of the Portfolio's holdings, including derivative instruments, are marked-to-market each day with the change in value reflected in unrealized appreciation (depreciation). Upon disposition, a realized gain or loss is recognized.
Certain derivative transactions may give rise to a form of leverage. Leverage magnifies the potential for gain and risk for loss. Leverage associated with derivative transactions may cause the Portfolio to liquidate portfolio positions when it may not be advantageous to do so to satisfy its obligations or to meet earmarking or segregation requirements, pursuant to applicable Securities and Exchange Commission rules and regulations, or may cause the Portfolio to be more volatile than if the Portfolio had not been leveraged. Although the Adviser seeks to use derivatives to further the Portfolio's investment objectives, there is no assurance that the use of derivatives will achieve this result.
Following is a description of the derivative instruments and techniques that the Portfolio used during the period and their associated risks:
Futures: A futures contract is a standardized agreement between two parties to buy or sell a specific quantity of an underlying instrument at a specific price at a specific future time. The value of a futures contract tends to increase and decrease in tandem with the value of the underlying instrument. Depending on the terms of the particular contract, futures contracts are settled through either physical delivery of the underlying instrument on the settlement date or by payment of a cash settlement amount on the settlement date. During the period the
futures contract is open, payments are received from or made to the broker based upon changes in the value of the contract (the variation margin). A decision as to whether, when and how to use futures involves the exercise of skill and judgment and even a well conceived futures transaction may be unsuccessful because of market behavior or unexpected events. In addition to the derivatives risks discussed above, the prices of futures can be highly volatile, using futures can lower total return, and the potential loss from futures can exceed the Portfolio's initial investment in such contracts.
Swaps: An over-the-counter ("OTC") swap agreement is an agreement between two parties pursuant to which the parties exchange payments at specified dates on the basis of a specified notional amount, with the payments calculated by reference to specified securities, indexes, reference rates, currencies or other instruments. A small percentage of swap agreements are cleared through a central clearing house. Most swap agreements provide that when the period payment dates for both parties are the same, the payments are made on a net basis (i.e., the two payment streams are netted out, with only the net amount paid by one party to the other). The Portfolio's obligations or rights under a swap agreement entered into on a net basis will generally be equal only to the net amount to be paid or received under the agreement, based on the relative values of the positions held by each counterparty. In a zero coupon interest rate swap, payment only occurs at maturity, at which time one counterparty pays the total compounded fixed rate over the life of the swap and the other pays the total compounded floating rate that would have been earned had a series of floating rate investments been rolled over through the life of the swap. Most swap agreements are not entered into or traded on exchanges and there is no central clearing or guaranty function for swaps. These OTC swaps are often subject to credit risk or the risk of default or non-performance by the counterparty. Swaps could result in losses if interest rate or foreign currency exchange rates or credit quality changes are not correctly anticipated by the Portfolio or if the reference index, security or investments do not perform as expected.
When the Portfolio has an unrealized loss on a swap agreement, the Portfolio has instructed the custodian to pledge cash or liquid securities as collateral with a value
25
Morgan Stanley Institutional Fund Trust
Annual Report — September 30, 2012
Notes to Financial Statements (cont'd)
approximately equal to the amount of the unrealized loss. Collateral pledges are monitored and subsequently adjusted if and when the swap valuations fluctuate. Cash collateral is included with "Due from (to) Broker" in the Statement of Assets and Liabilities. Cash collateral has been offset against open swap agreements under the provisions of FASB ASC 210 "Balance Sheet" ("ASC 210"). Offsetting of Amounts Related to Certain Contracts, an interpretation of ASC 210-20, are included within "Unrealized Appreciation (Depreciation) on Swap Agreements" in the Statement of Assets and Liabilities. For cash collateral received, the Portfolio pays a monthly fee to the counterparty based on the effective rate for Federal Funds. This fee, when paid, is included within realized gain (loss) on swap agreements in the Statement of Operations.
FASB ASC 815, "Derivatives and Hedging: Overall" ("ASC 815"), is intended to improve financial reporting about derivative instruments by requiring enhanced disclosures to enable investors to better understand how and why the Portfolio uses derivative instruments, how these derivative instruments are accounted for and their effects on the Portfolio's financial position and results of operations.
The following table sets forth the fair value of the Portfolio's derivative contracts by primary risk exposure as of September 30, 2012.
Primary Risk Exposure | | Statement of
Assets and
Liabilities | | Futures
Contracts
(000)(a) | | Swap
Agreements
(000) | |
Assets: | |
Interest Rate Risk | | Receivables | | $ | 34 | | | $ | — | | |
Liabilities: | |
Interest Rate Risk | | Payables | | $ | 34 | | | $ | 25 | | |
(a) This amount represents the cumulative appreciation (depreciation) of futures contracts as reported in the Portfolio of Investments. The Statement of Assets and Liabilities only reflects the current day's net variation margin.
The following tables set forth by primary risk exposure the Portfolio's realized gains (losses) and change in unrealized appreciation (depreciation) by type of derivative contract for the year ended September 30, 2012 in accordance with ASC 815.
Realized Gain (Loss) | |
Primary Risk Exposure | | Derivative Type | | Value
(000) | |
Interest Rate Risk | | Futures Contracts | | $ | (240 | ) | |
Interest Rate Risk | | Swap Agreements | | | (283 | ) | |
Total | | | | | | $ | (523 | ) | |
Change in Unrealized Appreciation (Depreciation) | |
Primary Risk Exposure | | Derivative Type | | Value
(000) | |
Interest Rate Risk | | Futures Contracts | | $ | 71 | | |
Interest Rate Risk | | Swap Agreements | | | 181 | | |
Total | | | | | | $ | 252 | | |
For the year ended September 30, 2012, the average monthly original value of futures contracts was approximately $13,128,000 and the average monthly notional amount of swap agreements was approximately $3,775,000.
4. Securities Lending: The Portfolio lends securities to qualified financial institutions, such as broker-dealers, to earn additional income. Any increase or decrease in the fair value of the securities loaned that might occur and any interest earned or dividends declared on those securities during the term of the loan would remain in the Portfolio. The Portfolio would receive cash or securities as collateral in an amount equal to or exceeding 100% of the current fair value of the loaned securities. The collateral is marked-to-market daily, by the securities lending agent, to ensure that a minimum of 100% collateral coverage is maintained.
Based on pre-established guidelines, the securities lending agent invests any cash collateral that is received in an affiliated money market portfolio and repurchase agreements. Securities lending income is generated from the earnings on the invested collateral and borrowing fees, less any rebates owed to the borrowers and compensation to the lending agent, and is recorded as "Income from Securities Loaned-Net" in the Portfolio's Statement of Operations. Risks in securities lending transactions are that a borrower may not provide additional collateral when required or return the securities when due, and that the value of the short-term investments will be less than the amount of cash collateral plus any rebate that is required to be returned to the borrower.
The value of loaned securities and related collateral outstanding at September 30, 2012 were approximately $11,769,000 and $12,009,000, respectively. The Portfolio
26
Morgan Stanley Institutional Fund Trust
Annual Report — September 30, 2012
Notes to Financial Statements (cont'd)
received cash collateral of approximately $9,350,000, of which, approximately $9,340,000 was subsequently invested in Repurchase Agreements and Morgan Stanley Institutional Liquidity Funds as reported in the Portfolio of Investments. At September 30, 2012, there was uninvested cash collateral of approximately $10,000, which is not reflected in the Portfolio of Investments. The remaining collateral of approximately $2,659,000 was received in the form of U.S. Government Obligations, which the Portfolio cannot sell or repledge, and accordingly are not reflected in the Portfolio of Investments. The Portfolio has the right under the lending agreement to recover the securities from the borrower on demand.
5. When-Issued/Delayed Delivery Securities: The Portfolio purchases and sells when-issued and delayed delivery securities. Securities purchased on a when-issued or delayed delivery basis are purchased for delivery beyond the normal settlement date at a stated price and yield, and no income accrues to the Portfolio on such securities prior to delivery date. Payment and delivery for when-issued and delayed delivery securities can take place up to 120 days after the date of the transaction. When the Portfolio enters into a purchase transaction on a when-issued or delayed delivery basis, securities are available for collateral in an amount at least equal in value to the Portfolio's commitments to purchase such securities. Purchasing securities on a when-issued or delayed delivery basis may involve a risk that the market price at the time of delivery may be lower than the agreed upon purchase price, in which case there could be an unrealized loss at the time of delivery. Purchasing investments on a when-issued or delayed delivery basis may be considered a form of leverage which may increase the impact that gains (losses) may have on the Portfolio.
6. Indemnifications: The Fund enters into contracts that contain a variety of indemnifications. The Fund's maximum exposure under these arrangements is unknown. However, the Fund has not had prior claims or losses pursuant to these contracts and expects the risk of loss to be remote.
7. Other: Security transactions are accounted for on the date the securities are purchased or sold. Realized gains (losses) on the sale of investment securities are determined on the specific identified cost basis. Dividend income and distributions are recorded on the ex-dividend date (except for certain foreign dividends which may be recorded as soon as the Fund is informed of such dividends) net of
applicable withholding taxes. Interest income is recognized on the accrual basis except where collection is in doubt. Discounts and premiums on securities purchased are amortized according to the effective yield method over their respective lives. Most expenses of the Fund can be directly attributed to a particular Portfolio. Expenses which cannot be directly attributed are apportioned among the Portfolios based upon relative net assets or other appropriate measures. Income, expenses (other than class specific expenses) and realized and unrealized gains or losses are allocated to each class of shares based upon their relative net assets.
B. Advisory Fees: The Adviser, a wholly-owned subsidiary of Morgan Stanley, provides the Portfolio with advisory services under the terms of an Investment Advisory Agreement, paid quarterly, at an annual rate of 0.375% of the average daily net assets of the Portfolio.
The Adviser has agreed to reduce its advisory fee and/or reimburse the Portfolio so that total annual portfolio operating expenses, excluding certain investment related expenses, will not exceed 0.50% for Class I shares, 0.75% for Class P shares, 0.75% for Class H shares and 1.00% for Class L shares. The fee waivers and/or expense reimbursements will continue for at least one year or until such time that the Fund's Board of Trustees acts to discontinue all or a portion of such waivers and/or reimbursements when it deems such action is appropriate. For the year ended September 30, 2012, approximately $286,000 of advisory fees were waived and/or reimbursed pursuant to this arrangement.
C. Administration Fees: The Adviser also serves as Administrator to the Fund and provides administrative services pursuant to an Administration Agreement for an annual fee, accrued daily and paid monthly, of 0.08% of the Portfolio's average daily net assets.
Under a Sub-Administration Agreement between the Administrator and State Street Bank and Trust Company ("State Street"), State Street provides certain administrative services to the Fund. For such services, the Administrator pays State Street a portion of the fee the Administrator receives from the Fund.
D. Distribution and Shareholder Services Fees: Morgan Stanley Distribution, Inc. ("MSDI" or the "Distributor"), a wholly-owned subsidiary of the Adviser, and an indirect subsidiary of Morgan Stanley, serves as the Fund's Distributor of Portfolio shares pursuant to a Distribution agreement. The Fund has adopted Shareholder Services Plans
27
Morgan Stanley Institutional Fund Trust
Annual Report — September 30, 2012
Notes to Financial Statements (cont'd)
with respect to Class P and Class H shares pursuant to Rule 12b-1 under the Act. Under the Shareholder Services Plans, the Portfolio pays the Distributor a shareholder services fee, accrued daily and paid monthly, at an annual rate of 0.25% of the Portfolio's average daily net assets attributable to Class P and Class H shares.
The Fund has adopted a Distribution and Shareholder Services Plan with respect to Class L shares pursuant to Rule 12b-1 under the Act. Under the Distribution and Shareholder Services Plan, the Portfolio pays the Distributor a distribution fee, accrued daily and paid monthly, at an annual rate of 0.25% and a shareholder service fee, accrued daily and paid monthly, at an annual rate of 0.25% of the Portfolio's average daily net assets attributable to Class L shares.
The distribution and shareholder services fees are used to support the expenses associated with servicing and maintaining accounts. The Distributor may compensate other parties for providing shareholder support services to investors who purchase Class P, Class H and Class L shares.
E. Dividend Disbursing and Transfer Agent: The Fund's dividend disbursing and transfer agent is Morgan Stanley Services Company Inc. ("Morgan Stanley Services"). Pursuant to a transfer agency agreement, the Fund pays Morgan Stanley Services a fee based on the number of classes, accounts and transactions relating to the Portfolios of the Fund.
F. Custodian Fees: State Street (the "Custodian") serves as Custodian for the Fund in accordance with a custodian agreement. The Custodian holds cash, securities, and other assets of the Fund as required by the Act. Custody fees are payable monthly based on assets held in custody, investment purchases and sales activity and account maintenance fees, plus reimbursement for certain out-of-pocket expenses.
The Fund has entered into an arrangement with its Custodian whereby credits realized on uninvested cash balances were used to offset a portion of the Portfolio's expenses. If applicable, these custodian credits are shown as "Expense Offset" in the Statement of Operations.
G. Security Transactions and Transactions with Affiliates: For the year ended September 30, 2012, purchases and sales of investment securities for the Portfolio, other than long-term U.S. Government securities and short-term investments, were approximately $14,245,000 and $21,008,000, respectively. For the year ended September 30, 2012, purchases and sales of long-term U.S. Government securities were approximately $113,060,000 and $114,420,000, respectively.
The Portfolio invests in the Institutional Class of the Morgan Stanley Institutional Liquidity Funds — Money Market Portfolio (the "Liquidity Funds"), an open-end management investment company managed by the Adviser, both directly, and as a portion of the securities held as collateral on loaned securities. Advisory fees paid by the Portfolio are reduced by an amount equal to its pro-rata share of the advisory and administration fees paid by the Portfolio due to its investment in the Liquidity Funds. For the year ended September 30, 2012, advisory fees paid were reduced by approximately $5,000 relating to the Portfolio's investment in the Liquidity Funds.
A summary of the Portfolio's transactions in shares of the Liquidity Funds during the year ended September 30, 2012 is as follows:
Value
September 30,
2011
(000) | | Purchases
at Cost
(000) | | Sales
(000) | | Dividend
Income
(000) | | Value
September 30,
2012
(000) | |
| $ | 3,080 | | | $ | 39,217 | | | $ | 32,737 | | | $ | 5 | | | $ | 9,560 | | |
For the year ended September 30, 2012, the Portfolio had transactions with Citigroup, Inc., and its affiliated broker-dealers which may be deemed affiliates of the Adviser, Administrator and Distributor under Section 17 of the Act.
Value
September 30,
2011
(000) | | Purchases
at Cost
(000) | | Sales
(000) | | Realized
Gain
(000) | | Interest
Income
(000) | | Value
September 30,
2012
(000) | |
| $ | 456 | | | $ | — | | | $ | 321 | | | $ | 49 | | | $ | 19 | | | $ | 179 | | |
The Portfolio has an unfunded Deferred Compensation Plan (the "Compensation Plan"), which allows each independent Trustee to defer payment of all, or a portion, of the fees he or she receives for serving on the Board of Trustees. Each eligible Trustee generally may elect to have the deferred amounts credited with a return equal to the total return on one or more of the Morgan Stanley funds that are offered as investment options under the Compensation Plan. Appreciation/depreciation and distributions received from these investments are recorded with an offsetting increase/decrease in the deferred compensation obligation and do not affect the net asset value of the Portfolio.
H. Federal Income Taxes It is the Portfolio's intention to continue to qualify as a regulated investment company and distribute all of its taxable and tax-exempt income. Accordingly, no provision for Federal income taxes is required in the financial statements.
Dividend income and distributions to shareholders are recorded on the ex-dividend date. Interest income is recognized on an accrual basis. Dividends from net investment income, if
28
Morgan Stanley Institutional Fund Trust
Annual Report — September 30, 2012
Notes to Financial Statements (cont'd)
any, are declared and paid quarterly. Net realized capital gains, if any, are distributed at least annually.
The Portfolio may be subject to taxes imposed by countries in which it invests. Such taxes are generally based on income and/or capital gains earned or repatriated. Taxes are accrued based on net investment income, net realized gains and net unrealized appreciation as such income and/or gains are earned. Taxes may also be based on transactions in foreign currency and are accrued based on the value of investments denominated in such currency.
FASB ASC 740-10, Income Taxes — Overall, sets forth a minimum threshold for financial statement recognition of the benefit of a tax position taken or expected to be taken in a tax return. Management has concluded there are no significant uncertain tax positions that would require recognition in the financial statements. If applicable, the Portfolio recognizes interest accrued related to unrecognized tax benefits in "Interest Expense" and penalties in "Other Expenses" in the Statement of Operations. The Portfolio files tax returns with the U.S. Internal Revenue Service, New York and various states. Each of the tax years in the four-year period ended September 30, 2012, remains subject to examination by taxing authorities.
The tax character of distributions paid may differ from the character of distributions shown in the Statements of Changes in Net Assets due to short-term capital gains being treated as ordinary income for tax purposes. The tax character of distributions paid during fiscal 2012 and 2011 was as follows:
2012 Distributions
Paid From:
Ordinary Income
(000) | | 2011 Distributions
Paid From:
Ordinary Income
(000) | |
| $ | 2,118 | | | $ | 2,135 | | |
The amount and character of income and gains to be distributed are determined in accordance with income tax regulations which may differ from GAAP. These book/tax differences are either considered temporary or permanent in nature.
Temporary differences are attributable to differing book and tax treatments for the timing of the recognition of gains (losses) on certain investment transactions and the timing of the deductibility of certain expenses.
Permanent differences, primarily due to basis adjustments for swap transactions and paydown adjustments, resulted in the
following reclassifications among the components of net assets at September 30, 2012:
Accumulated
Undistributed
Net
Investment
Income
(000) | | Accumulated
Net Realized
Loss
(000) | | Paid-in-
Capital
(000) | |
| $ | 212 | | | $ | (212 | ) | | | — | | |
At September 30, 2012, the components of distributable earnings for the Portfolio on a tax basis were as follows:
Undistributed
Ordinary
Income
(000) | | Undistributed
Long-Term
Capital Gain
(000) | |
| $ | 769 | | | | — | | |
At September 30, 2012, the aggregate cost for federal income tax purposes is approximately $69,571,000. The aggregate gross unrealized appreciation is approximately $3,246,000 and the aggregate gross unrealized depreciation is approximately $168,000 resulting in net unrealized appreciation of approximately $3,078,000.
On December 22, 2010, the Regulated Investment Company Modernization Act of 2010 (the "Modernization Act") was signed into law. The Modernization Act modernizes several tax provisions related to Regulated Investment Companies ("RICs") and their shareholders. One key change made by the Modernization Act is that capital losses will generally retain their character as short-term or long-term and may be carried forward indefinitely to offset future gains. These losses are utilized before other capital loss carryforwards that expire. Generally, the Modernization Act is effective for taxable years beginning after December 22, 2010.
At September 30, 2012, the Portfolio had available for Federal income tax purposes unused capital losses, which will expire on the indicated dates:
| Amount (000) | | Expiration | |
| $ | 34,679 | | | September 30, 2017 | |
| | 3,319 | | | September 30, 2018 | |
To the extent that capital loss carryforwards are used to offset any future capital gains realized during the carryover period as provided by U.S. Federal income tax regulations, no capital gains tax liability will be incurred by the Portfolio for gains realized and not distributed. To the extent that capital gains are offset, such gains will not be distributed to the shareholders. During the year ended September 30, 2012, the Portfolio utilized capital loss carryforwards for U.S. Federal income tax purposes of approximately $1,347,000.
29
Morgan Stanley Institutional Fund Trust
Annual Report — September 30, 2012
Notes to Financial Statements (cont'd)
I. Accounting Pronouncement: In December 2011, FASB issued Accounting Standards Update ("ASU") 2011-11, Balance Sheet: Disclosures about Offsetting Assets and Liabilities. The pronouncement improves disclosures for recognized financial and derivative instruments that are either offset on the balance sheet in accordance with the offsetting guidance in ASC 210-20-45 or ASC 815-10-45 or are subject to an enforceable master netting agreements or similar. The Fund will be required to disclose information about rights to offset and related arrangements (such as collateral agreements) in order to enable financial statement users to understand the effect of those rights and arrangements on its financial position as well as disclose the following (1) gross amounts; (2) amounts offset in the statement of financial position; (3) any other amounts that can be offset in the event of bankruptcy, insolvency or default of any of the parties (including cash and noncash financial collateral); and (4) the Fund's net exposure. The requirements are effective for annual reporting periods beginning on or after January 1, 2013, and must be applied retrospectively. At this time, the Fund's management is evaluating the implications of ASU 2011-11 and its impact, if any, on the financial statements.
30
Morgan Stanley Institutional Fund Trust
Annual Report — September 30, 2012
Report of Independent Registered Public Accounting Firm
To the Shareholders and Board of Trustees of
Morgan Stanley Institutional Fund Trust —
Core Fixed Income Portfolio
We have audited the accompanying statement of assets and liabilities, including the portfolio of investments, of Core Fixed Income Portfolio (one of the portfolios constituting Morgan Stanley Institutional Fund Trust) (the "Portfolio") as of September 30, 2012, and the related statement of operations for the year then ended, the statements of changes in net assets for each of the two years in the period then ended, and the financial highlights for each of the periods indicated therein. These financial statements and financial highlights are the responsibility of the Portfolio's management. Our responsibility is to express an opinion on these financial statements and financial highlights based on our audits.
We conducted our audits in accordance with the standards of the Public Company Accounting Oversight Board (United States). Those standards require that we plan and perform the audit to obtain reasonable assurance about whether the financial statements and financial highlights are free of material misstatement. We were not engaged to perform an audit of the Portfolio's internal control over financial reporting. Our audits included consideration of internal control over financial reporting as a basis for designing audit procedures that are appropriate in the circumstances, but not for the purpose of expressing an opinion on the effectiveness of the Portfolio's internal control over financial reporting. Accordingly, we express no such opinion. An audit also includes examining, on a test basis, evidence supporting the amounts and disclosures in the financial statements and financial highlights, assessing the accounting principles used and significant estimates made by management, and evaluating the overall financial statement presentation. Our procedures included confirmation of securities owned as of September 30, 2012, by correspondence with the custodian and others, or by other appropriate auditing procedures where replies from others were not received. We believe that our audits provide a reasonable basis for our opinion.
In our opinion, the financial statements and financial highlights referred to above present fairly, in all material respects, the financial position of Core Fixed Income Portfolio of Morgan Stanley Institutional Fund Trust at September 30, 2012, the results of its operations for the year then ended, the changes in its net assets for each of the two years in the period then ended, and the financial highlights for each of the periods indicated therein, in conformity with U.S. generally accepted accounting principles.

Boston, Massachusetts
November 27, 2012
31
Morgan Stanley Institutional Fund Trust
Annual Report — September 30, 2012
U.S. Privacy Policy (unaudited)
AN IMPORTANT NOTICE CONCERNING OUR U.S. PRIVACY POLICY
This privacy notice describes the U.S. privacy policy of Morgan Stanley Distribution, Inc., and the Morgan Stanley family of mutual funds ("us", "our", "we").
We are required by federal law to provide you with notice of our U.S. privacy policy ("Policy"). This Policy applies to both our current and former clients unless we state otherwise and is intended for individual clients who purchase products or receive services from us for personal, family or household purposes. This Policy is not applicable to partnerships, corporations, trusts or other non-individual clients or account holders, nor is this Policy applicable to individuals who are either beneficiaries of a trust for which we serve as trustee or participants in an employee benefit plan administered or advised by us. This Policy is, however, applicable to individuals who select us to be a custodian of securities or assets in individual retirement accounts, 401(k) accounts, or accounts subject to the Uniform Gifts to Minors Act.
This notice sets out our business practices to protect your privacy; how we collect and share personal information about you; and how you can limit our sharing or certain uses by others of this information. We may amend this Policy at any time, and will inform you of any changes to our Policy as required by law.
WE RESPECT YOUR PRIVACY
We appreciate that you have provided us with your personal financial information and understand your concerns about your information. We strive to safeguard the information our clients entrust to us. Protecting the confidentiality and security of client information is an important part of how we conduct our business.
This notice describes what personal information we collect about you, how we collect it, when we may share it with others, and how certain others may use it. It discusses the steps you may take to limit our sharing of certain information about you with our affiliated companies, including, but not limited to our affiliated banking businesses, brokerage firms and credit service affiliates. It also discloses how you may limit our affiliates' use of shared information for marketing purposes.
Throughout this Policy, we refer to the nonpublic information that personally identifies you as "personal information." We also use the term "affiliated company" in this notice. An affiliated company is a company in our family of companies and includes companies with the Morgan Stanley name. These affiliated companies are financial institutions such as broker-dealers, banks, investment advisers and credit card issuers. We refer to any company that is not an affiliated company as a nonaffiliated third party. For purposes of Section 5 of this notice, and your ability to limit certain uses of personal information by our affiliates, this notice applies to the use of personal information by our affiliated companies.
1. WHAT PERSONAL INFORMATION DO WE COLLECT FROM YOU?
We may collect the following types of information about you: (i) information provided by you, including information from applications and other forms we receive from you, (ii) information about your transactions with us or our affiliates, (iii) information about your transactions with nonaffiliated third parties, (iv) information from consumer reporting agencies, (v) information obtained from our websites, and (vi) information obtained from other sources. For example:
• We collect information such as your name, address, e-mail address, telephone/fax numbers, assets, income and investment objectives through applications and other forms you submit to us.
• We may obtain information about account balances, your use of account(s) and the types of products and services you prefer to receive from us through your dealings and transactions with us and other sources.
• We may obtain information about your creditworthiness and credit history from consumer reporting agencies.
• We may collect background information from and through third-party vendors to verify representations you have made and to comply with various regulatory requirements.
2. WHEN DO WE DISCLOSE PERSONAL INFORMATION WE COLLECT ABOUT YOU?
We may disclose personal information we collect about you in each of the categories listed above to affiliated and nonaffiliated third parties.
32
Morgan Stanley Institutional Fund Trust
Annual Report — September 30, 2012
U.S. Privacy Policy (unaudited) (cont'd)
a. Information we disclose to affiliated companies.
We may disclose personal information that we collect about you to our affiliated companies to manage your account(s) effectively, to service and process your transactions, and to let you know about products and services offered by us and affiliated companies, to manage our business, and as otherwise required or permitted by law. Offers for products and services from affiliated companies are developed under conditions designed to safeguard your personal information.
b. Information we disclose to third parties.
We may disclose personal information that we collect about you to nonaffiliated third parties to provide marketing services on our behalf or to other financial institutions with whom we have joint marketing agreements. We may also disclose all of the information we collect to other nonaffiliated third parties for our everyday business purposes, such as to process transactions, maintain account(s), respond to court orders and legal investigations, report to credit bureaus, offer our own products and services, protect against fraud, for institutional risk control, to perform services on our behalf, and as otherwise required or permitted by law.
When we share personal information about you with a nonaffiliated third party, they are required to limit their use of personal information about you to the particular purpose for which it was shared and they are not allowed to share personal information about you with others except to fulfill that limited purpose or as may be permitted or required by law.
3. HOW DO WE PROTECT THE SECURITY AND CONFIDENTIALITY OF PERSONAL INFORMATION WE COLLECT ABOUT YOU?
We maintain physical, electronic and procedural security measures that comply with applicable law and regulations to help safeguard the personal information we collect about you. We have internal policies governing the proper handling of client information by employees. Third parties that provide support or marketing services on our behalf may also receive personal information about you, and we require them to adhere to appropriate security standards with respect to such information.
4. HOW CAN YOU LIMIT OUR SHARING CERTAIN PERSONAL INFORMATION ABOUT YOU WITH OUR AFFILIATED COMPANIES FOR ELIGIBILITY DETERMINATION?
By following the opt-out procedures in Section 6 below, you may limit the extent to which we share with our affiliated companies, personal information that was collected to determine your eligibility for products and services such as your credit reports and other information that you have provided to us or that we may obtain from third parties ("eligibility information"). Eligibility information does not include your identification information or personal information pertaining to our transactions or experiences with you. Please note that, even if you direct us not to share eligibility information with our affiliated companies, we may still share your personal information, including eligibility information, with our affiliated companies under circumstances that are permitted under applicable law, such as to process transactions or to service your account.
5. HOW CAN YOU LIMIT THE USE OF CERTAIN PERSONAL INFORMATION ABOUT YOU BY OUR AFFILIATED COMPANIES FOR MARKETING?
By following the opt-out instructions in Section 6 below, you may limit our affiliated companies from marketing their products or services to you based on personal information we disclose to them. This information may include, for example, your income and account history with us. Please note that, even if you choose to limit our affiliated companies from using personal information about you that we may share with them for marketing their products and services to you, our affiliated companies may use your personal information that they obtain from us to market to you in circumstances permitted by law, such as if the affiliated party has its own relationship with you.
33
Morgan Stanley Institutional Fund Trust
Annual Report — September 30, 2012
U.S. Privacy Policy (unaudited) (cont'd)
6. HOW CAN YOU SEND US AN OPT-OUT INSTRUCTION?
If you wish to limit our sharing of eligibility information about you with our affiliated companies, or our affiliated companies' use of personal information for marketing purposes, as described in this notice, you may do so by:
• Calling us at (800) 548-7786
Monday–Friday between 8a.m. and 5p.m. (EST)
• Writing to us at the following address:
Morgan Stanley Services Company Inc.
c/o Privacy Coordinator
201 Plaza Two, 3rd Floor
Jersey City, New Jersey 07311
If you choose to write to us, your request should include: your name, address, telephone number and account number(s) to which the opt-out applies and whether you are opting out with respect to sharing of eligibility information (Section 4 above), or information used for marketing (Section 5 above), or both. Written opt-out requests should not be sent with any other correspondence. In order to process your request, we require that the request be provided by you directly and not through a third party. Once you have informed us about your privacy preferences, your opt-out preference will remain in effect with respect to this Policy (as it may be amended) until you notify us otherwise. If you are a joint account owner, we will accept instructions from any one of you and apply those instructions to the entire account.
Please understand that if you limit our sharing or our affiliated companies' use of personal information, you and any joint account holder(s) may not receive information about our affiliated companies' products and services, including products or services that could help you manage your financial resources and achieve your investment objectives.
If you have more than one account or relationship with us, please specify the accounts to which you would like us to apply your privacy choices. If you have accounts or relationships with our affiliates, you may receive multiple privacy policies from them, and will need to separately notify those companies of your privacy choices for those accounts or relationships.
7. WHAT IF AN AFFILIATED COMPANY BECOMES A NONAFFILIATED THIRD PARTY?
If, at any time in the future, an affiliated company becomes a nonaffiliated third party, further disclosures of personal information made to the former affiliated company will be limited to those described in Section 2(b) above relating to nonaffiliated third parties. If you elected under Section 6 to limit disclosures we make to affiliated companies, or use of personal information by affiliated companies, your election will not apply to use by any former affiliated company of your personal information in their possession once it becomes a nonaffiliated third party.
SPECIAL NOTICE TO RESIDENTS OF VERMONT
The following section supplements our Policy with respect to our individual clients who have a Vermont address and supersedes anything to the contrary in the above Policy with respect to those clients only.
The State of Vermont requires financial institutions to obtain your consent prior to sharing personal information that they collect about you with nonaffiliated third parties, or eligibility information with affiliated companies, other than in certain limited circumstances. Except as permitted by law, we will not share personal information we collect about you with nonaffiliated third parties or eligibility information with affiliated companies, unless you provide us with your written consent to share such information.
SPECIAL NOTICE TO RESIDENTS OF CALIFORNIA
The following section supplements our Policy with respect to our individual clients who have a California address and supersedes anything to the contrary in the above Policy with respect to those clients only.
In response to a California law, if your account has a California home address, your personal information will not be disclosed to nonaffiliated third parties except as permitted by applicable California law, and we will limit sharing such personal information with our affiliates to comply with California privacy laws that apply to us.
34
Morgan Stanley Institutional Fund Trust
Annual Report — September 30, 2012
Trustee and Officer Information (unaudited)
Independent Trustees:
Name, Age and Address of
Independent Trustee | | Position(s)
Held with
Registrant | | Length of Time
Served* | | Principal Occupation(s) During Past 5 Years | | Number of
Portfolios in
Fund Complex
Overseen by
Independent
Trustee** | | Other Directorships
Held by Independent
Trustee*** | |
Frank L. Bowman (67)
c/o Kramer Levin Naftalis &
Frankel LLP
Counsel to the Independent
Trustees
1177 Avenue of the Americas
New York, NY 10036 | | Trustee | | Since
August
2006 | | President, Strategic Decisions, LLC (consulting) (since February 2009); Director or Trustee of various Morgan Stanley Funds (since August 2006); Chairperson of the Insurance Sub-Committee of the Compliance and Insurance Committee (since February 2007); served as President and Chief Executive Officer of the Nuclear Energy Institute (policy organization) (February 2005-November 2008); retired as Admiral, U.S. Navy after serving over 38 years on active duty including 8 years as Director of the Naval Nuclear Propulsion Program in the Department of the Navy and the U.S. Department of Energy (1996-2004); served as Chief of Naval Personnel (July 1994-September 1996); and on the Joint Staff as Director of Political Military Affairs (June 1992-July 1994); Knighted as Honorary Knight Commander of the Most Excellent Order of the British Empire; Awarded the Officer de l'Orde National du Mérite by the French Government; elected to the National Academy of Engineering (2009). | | | 102 | | | Director of BP p.l.c.; Director of Naval and Nuclear Technologies LLP; Director of the Armed Services YMCA of the USA and the Naval Submarine League; Director of the American Shipbuilding Suppliers Association; Member of the National Security Advisory Council of the Center for U.S. Global Engagement and a member of the CNA Military Advisory Board; Member of the American Lung Association's President's Council. | |
Michael Bozic (71)
c/o Kramer Levin Naftalis &
Frankel LLP
Counsel to the Independent
Trustees
1177 Avenue of the Americas
New York, NY 10036 | | Trustee | | Since
April
1994 | | Private investor; Chairperson of the Compliance and Insurance Committee (since October 2006); Director or Trustee of various Morgan Stanley Funds (since April 1994); formerly, Chairperson of the Insurance Committee (July 2006-September 2006); Vice Chairman of Kmart Corporation (December 1998-October 2000), Chairman and Chief Executive Officer of Levitz Furniture Corporation (November 1995-November 1998) and President and Chief Executive Officer of Hills Department Stores (May 1991-July 1995); variously Chairman, Chief Executive Officer, President and Chief Operating Officer (1987-1991) of the Sears Merchandise Group of Sears, Roebuck & Co. | | | 104 | | | Director of various business organizations. | |
Kathleen A. Dennis (59)
c/o Kramer Levin Naftalis &
Frankel LLP
Counsel to the Independent
Trustees
1177 Avenue of the Americas
New York, NY 10036 | | Trustee | | Since
August
2006 | | President, Cedarwood Associates (mutual fund and investment management consulting) (since July 2006); Chairperson of the Money Market and Alternatives Sub-Committee of the Investment Committee (since October 2006) and Director or Trustee of various Morgan Stanley Funds (since August 2006); formerly, Senior Managing Director of Victory Capital Management (1993-2006). | | | 102 | | | Director of various non-profit organizations. | |
Dr. Manuel H. Johnson (63)
c/o Johnson Smick
Group, Inc.
888 16th Street, N.W.
Suite 740
Washington, D.C. 20006 | | Trustee | | Since
July
1991 | | Senior Partner, Johnson Smick International, Inc. (consulting firm); Chairperson of the Investment Committee (since October 2006) and Director or Trustee of various Morgan Stanley Funds (since July 1991); Co-Chairman and a founder of the Group of Seven Council (G7C) (international economic commission); formerly, Chairperson of the Audit Committee (July 1991-September 2006), Vice Chairman of the Board of Governors of the Federal Reserve System and Assistant Secretary of the U.S. Treasury. | | | 104 | | | Director of NVR, Inc. (home construction). | |
Joseph J. Kearns (70)
c/o Kearns & Associates LLC
PMB754
22631 Pacific Coast Highway
Malibu, CA 90265 | | Trustee | | Since
August
1994 | | President, Kearns & Associates LLC (investment consulting); Chairperson of the Audit Committee (since October 2006) and Director or Trustee of various Morgan Stanley Funds (since August 1994); formerly, Deputy Chairperson of the Audit Committee (July 2003-September 2006) and Chairperson of the Audit Committee of various Morgan Stanley Funds (since August 1994); CFO of the J. Paul Getty Trust. | | | 105 | | | Director of Electro Rent Corporation (equipment leasing) and The Ford Family Foundation. | |
35
Morgan Stanley Institutional Fund Trust
Annual Report — September 30, 2012
Trustee and Officer Information (unaudited) (cont'd)
Independent Trustees: (cont'd)
Name, Age and Address of
Independent Trustee | | Position(s)
Held with
Registrant | | Length of Time
Served* | | Principal Occupation(s) During Past 5 Years | | Number of
Portfolios in
Fund Complex
Overseen by
Independent
Trustee** | | Other Directorships
Held by Independent
Trustee*** | |
Michael F. Klein (53)
c/o Kramer Levin Naftalis & Frankel LLP
Counsel to the
Independent Trustees
1177 Avenue of the Americas
New York, NY 10036 | | Trustee | | Since
August
2006 | | Managing Director, Aetos Capital, LLC (since March 2000) and Co-President, Aetos Alternatives Management, LLC (since January 2004); Chairperson of the Fixed Income Sub-Committee of the Investment Committee (since October 2006) and Director or Trustee of various Morgan Stanley Funds (since August 2006); formerly, Managing Director, Morgan Stanley & Co. Inc. and Morgan Stanley Dean Witter Investment Management, President, various Morgan Stanley Funds (June 1998-March 2000) and Principal, Morgan Stanley & Co. Inc. and Morgan Stanley Dean Witter Investment Management (August 1997-December 1999). | | | 102 | | | Director of certain investment funds managed or sponsored by Aetos Capital, LLC. Director of Sanitized AG and Sanitized Marketing AG (specialty chemicals). | |
Michael E. Nugent (76)
c/o Triumph Capital, L.P.
445 Park Avenue
New York, NY 10022 | | Chairperson
of the
Board and
Trustee | | Chairperson of
the Boards since
July 2006 and
Trustee since
July 1991 | | General Partner, Triumph Capital, L.P. (private investment partnership); Chairperson of the Boards of various Morgan Stanley Funds (since July 2006); Chairperson of the Closed-End Fund Committee (since June 2012) and Director or Trustee of various Morgan Stanley Funds (since July 1991); formerly, Chairperson of the Insurance Committee (until July 2006). | | | 104 | | | None. | |
W. Allen Reed (65)
c/o Kramer Levin Naftalis &
Frankel LLP
Counsel to the
Independent Trustees
1177 Avenue of the Americas
New York, NY 10036 | | Trustee | | Since
August
2006 | | Chairperson of the Equity Sub-Committee of the Investment Committee (since October 2006) and Director or Trustee of various Morgan Stanley Funds (since August 2006); formerly, President and CEO of General Motors Asset Management; Chairman and Chief Executive Officer of the GM Trust Bank and Corporate Vice President of General Motors Corporation (August 1994-December 2005). | | | 102 | | | Director of Temple-Inland Industries (packaging and forest products); Director of Legg Mason, Inc. and Director of the Auburn University Foundation. | |
Fergus Reid (80)
c/o Joe Pietryka, Inc.
85 Charles Colman Blvd.
Pawling, NY 12564 | | Trustee | | Since
June
1992 | | Chairman, Joe Pietryka, Inc.; Chairperson of the Governance Committee and Director or Trustee of various Morgan Stanley Funds (since June 1992). | | | 105 | | | Trustee and Director of certain investment companies in the JPMorgan Funds complex managed by JP Morgan Investment Management Inc. | |
36
Morgan Stanley Institutional Fund Trust
Annual Report — September 30, 2012
Trustee and Officer Information (unaudited) (cont'd)
Interested Trustee:
Name, Age and Address of
Interested Trustee | | Position(s) Held
with Registrant | | Length of Time
Served* | | Principal Occupation(s) During Past 5 Years | | Number of
Portfolios in
Fund Complex
Overseen by
Interested
Trustee** | | Other Directorships
Held by Interested
Trustee*** | |
James F. Higgins (64)
c/o Morgan Stanley Services Company Inc.
Harborside Financial Center
201 Plaza Two
Jersey City, NJ 07311 | | Trustee | | Since
June
2000 | | Director or Trustee of various Morgan Stanley Funds (since June 2000); Senior Advisor of Morgan Stanley (since August 2000). | | | 103 | | | Director of AXA Financial, Inc. and The Equitable Life Assurance Society of the United States (financial services). | |
* Each Trustee serves an indefinite term, until his or her successor is elected.
** The Fund Complex includes (as of December 31, 2011) all open-end and closed-end funds (including all of their portfolios) advised by Morgan Stanley Investment Management Inc. (the "Adviser") and any funds that have an adviser that is an affiliated person of the Adviser (including, but not limited to, Morgan Stanley AIP GP LP).
*** This includes any directorships at public companies and registered investment companies held by the Trustee at any time during the past five years.
37
Morgan Stanley Institutional Fund Trust
Annual Report — September 30, 2012
Trustee and Officer Information (unaudited) (cont'd)
Executive Officers:
Name, Age and Address of Executive Officer | | Position(s) Held
with
Registrant | | Length of Time
Served* | | Principal Occupation(s) During Past 5 Years | |
Arthur Lev (51)
522 Fifth Avenue
New York, NY 10036 | | President and Principal Executive Officer – Equity and Fixed Income Funds | | Since
June 2011 | | President and Principal Executive Officer (since June 2011) of the Equity and Fixed Income Funds in the Fund Complex; Head of the Long Only Business of Morgan Stanley Investment Management (since February 2011); Managing Director of the Adviser and various entities affiliated with the Adviser (since December 2006). Formerly, Chief Strategy Officer of Morgan Stanley Investment Management's Traditional Asset Management business (November 2010-February 2011); General Counsel of Morgan Stanley Investment Management (December 2006-October 2010); Partner and General Counsel of FrontPoint Partners LLC (July 2002-December 2006); Managing Director and General Counsel of Morgan Stanley Investment Management (May 2000-June 2002). | |
Mary Ann Picciotto (39)
c/o Morgan Stanley Services Company Inc.
Harborside Financial Center
201 Plaza Two
Jersey City, NJ 07311 | | Chief Compliance Officer | | Since
May 2010 | | Managing Director of the Adviser and various entities affiliated with the Adviser; Chief Compliance Officer of various Morgan Stanley Funds (since May 2010); Chief Compliance Officer of the Adviser (since April 2007). | |
Stefanie V. Chang Yu (45)
522 Fifth Avenue
New York, NY 10036 | | Vice President | | Since December 1997 | | Managing Director of the Adviser and various entities affiliated with the Adviser; Vice President of various Morgan Stanley Funds (since December 1997). | |
Francis J. Smith (47)
c/o Morgan Stanley Services Company Inc.
Harborside Financial Center
201 Plaza Two
Jersey City, NJ 07311 | | Treasurer and Principal Financial
Officer | | Treasurer since July 2003 and Principal Financial Officer since September 2002 | | Executive Director of the Adviser and various entities affiliated with the Adviser; Treasurer and Principal Financial Officer of various Morgan Stanley Funds (since July 2003). | |
Mary E. Mullin (45)
522 Fifth Avenue
New York, NY 10036 | | Secretary | | Since
June
1999 | | Executive Director of the Adviser and various entities affiliated with the Adviser; Secretary of various Morgan Stanley Funds (since June 1999). | |
* Each officer serves an indefinite term, until his or her successor is elected.?
38
Morgan Stanley Institutional Fund Trust
Annual Report — September 30, 2012
Adviser and Administrator
Morgan Stanley Investment Management Inc.
522 Fifth Avenue
New York, New York 10036
Distributor
Morgan Stanley Distribution, Inc.
522 Fifth Avenue
New York, New York 10036
Dividend Disbursing and Transfer Agent
Morgan Stanley Services Company Inc.
P.O. Box 219804
Kansas City, Missouri 64121
Custodian
State Street Bank and Trust Company
One Lincoln Street
Boston, Massachusetts 02111
Legal Counsel
Dechert LLP
1095 Avenue of the Americas
New York, New York 10036
Independent Registered Public Accounting Firm
Ernst & Young LLP
200 Clarendon Street
Boston, Massachusetts 02116
Reporting to Shareholders
Each Morgan Stanley fund provides a complete schedule of portfolio holdings in its semi-annual and annual reports within 60 days of the end of the fund's second and fourth fiscal quarters by filing the schedule electronically with the Securities and Exchange Commission (SEC). The semi-annual reports are filed on Form N-CSRS and the annual reports are filed on Form N-CSR. Morgan Stanley also delivers the semi-annual and annual reports to fund shareholders and makes these reports available on its public website, www.morganstanley.com/im. Each Morgan Stanley fund also files a complete schedule of portfolio holdings with the SEC for the fund's first and third fiscal quarters on Form N-Q. Morgan Stanley does not deliver the reports for the first and third fiscal quarters to shareholders, nor are the reports posted to the Morgan Stanley public website. You may, however, obtain the Form N-Q filings (as well as the Form N-CSR and N-CSRS filings) by accessing the SEC's website, www.sec.gov. You may also review and copy them at the SEC's Public Reference Room in Washington, DC. Information on the operation of the SEC's Public Reference Room may be obtained by calling the SEC toll free at 1-800-SEC-0330. You can also request copies of these materials, upon payment of a duplicating fee, by electronic request at the SEC's email address (publicinfo@sec.gov) or by writing the Public Reference Room of the SEC, Washington, DC 20549-0102.
Proxy Voting Policies and Procedures and Proxy Voting Record
You may obtain a copy of the Fund's Proxy Voting Policy and Procedures and information regarding how the Fund voted proxies relating to portfolio securities during the most recent twelve-month period ended June 30, without charge, upon request, by calling toll free 1-800-548-7786 or by visiting our website at www.morganstanley.com/im. This information is also available on the SEC's website at www.sec.gov.
This report is authorized for distribution only when preceded or accompanied by a prospectus of the Fund which describes in detail each Investment Portfolio's investment policies, risks, fees and expenses. Please read the prospectus carefully before you invest or send money. For additional information, including information regarding the investments comprising the Portfolio, please visit our website at www.morganstanley.com/im or call toll free 1-(800) 548-7786.
39
(This Page has been left blank intentionally.)
Printed in U.S.A.
This Report has been prepared for shareholders and may be distributed to others only if preceded or accompanied by a current prospectus.
Morgan Stanley Investment Management Inc.
522 Fifth Avenue
New York, New York 10036
© 2012 Morgan Stanley. Morgan Stanley Distribution, Inc.

IFTFXDINCANN
IU12-02341P-Y09/12

Morgan Stanley
Institutional Fund Trust
Core Plus Fixed Income Portfolio
Annual
Report
September 30, 2012


Morgan Stanley Institutional Fund Trust
Annual Report — September 30, 2012
Shareholders' Letter | | | 2 | | |
Expense Example | | | 3 | | |
Investment Advisory Agreement Approval | | | 4 | | |
Investment Overview | | | 6 | | |
Portfolio of Investments | | | 9 | | |
Statement of Assets and Liabilities | | | 16 | | |
Statement of Operations | | | 18 | | |
Statements of Changes in Net Assets | | | 19 | | |
Financial Highlights | | | 21 | | |
Notes to Financial Statements | | | 25 | | |
Report of Independent Registered Public Accounting Firm | | | 34 | | |
U.S. Privacy Policy | | | 35 | | |
Trustee and Officer Information | | | 38 | | |
This report is authorized for distribution only when preceded or accompanied by prospectuses of the Morgan Stanley Institutional Fund Trust. To receive a prospectus and/or SAI, which contains more complete information such as investment objectives, charges, expenses, policies for voting proxies, risk considerations, and describes in detail each of the Portfolio's investment policies to the prospective investor, please call toll free 1-(800) 548-7786. Please read the prospectuses carefully before you invest or send money.
Additionally, you can access portfolio information including performance, characteristics, and investment team commentary through Morgan Stanley Investment Management's website: www.morganstanley.com/im.
Market forecasts provided in this report may not necessarily come to pass. There is no guarantee that any sectors mentioned will continue to perform as discussed herein or that securities in such sectors will be held by the Portfolio in the future. There is no assurance that a Portfolio will achieve its investment objective. Portfolios are subject to market risk, which is the possibility that market values of securities owned by the Portfolio will decline and, therefore, the value of the Portfolio's shares may be less than what you paid for them. Accordingly, you can lose money investing in Portfolios. Please see the prospectus for more complete information on investment risks.
1
Morgan Stanley Institutional Fund Trust
Annual Report — September 30, 2012
Shareholders' Letter (unaudited)
Dear Shareholders,
We are pleased to provide this Annual report, in which you will learn how your investment in Core Plus Fixed Income Portfolio performed during the latest twelve-month period.
Morgan Stanley Investment Management is a client-centric, investor-led organization. Our global presence, intellectual capital, and breadth of products and services enable us to partner with investors to meet the evolving challenges of today's financial markets. We aim to deliver superior investment service and to empower our clients to make the informed decisions that help them reach their investment goals.
As always, we thank you for selecting Morgan Stanley Investment Management, and look forward to working with you in the months and years ahead.
Sincerely,

Arthur Lev
President and Principal Executive Officer
October 2012
2
Morgan Stanley Institutional Fund Trust
Annual Report — September 30, 2012
Expense Example (unaudited)
Core Plus Fixed Income Portfolio
As a shareholder of the Portfolio, you may incur two types of costs: (1) transactional costs, including sales charge (loads) on purchase payments; and (2) ongoing costs, including advisory fees, administration fees, distribution and shareholder servicing fees; and other Portfolio expenses. This example is intended to help you understand your ongoing costs (in dollars) of investing in the Portfolio and to compare these costs with the ongoing costs of investing in other mutual funds.
This example is based on an investment of $1,000 invested at the beginning of the six-month period ended September 30, 2012 and held for the entire six-month period.
Actual Expenses
The table below provides information about actual account values and actual expenses. You may use the information in this table, together with the amount you invested, to estimate the expenses that you paid over the period. Simply divide your account value by $1,000 (for example, an $8,600 account value divided by $1,000 = 8.6), then multiply the result by the number in the table under the heading entitled "Actual Expenses Paid During Period" to estimate the expenses you paid on your account during this period.
Please note that "Actual Expenses Paid During Period" are grossed up to reflect Portfolio expenses prior to the effect of Expense Offset (See Note F in the Notes to Financial Statements). Therefore, the annualized net expense ratios may differ from the ratio of expenses to average net assets shown in the Financial Highlights.
Hypothetical Example for Comparison Purposes
The table below provides information about hypothetical account values and hypothetical expenses based on the Portfolio's actual expense ratio and an assumed rate of return of 5% per year before expenses, which is not the Portfolio's actual return. The hypothetical account values and expenses may not be used to estimate the actual ending account balance or expenses you paid for the period. You may use this information to compare the ongoing costs of investing in the Portfolio and other funds. To do so, compare this 5% hypothetical example with the 5% hypothetical examples that appear in the shareholder reports of the other funds.
Please note that the expenses shown in the table are meant to highlight your ongoing costs only and do not reflect any transactional costs, such as sales charges (loads, if applicable). Therefore, the hypothetical account values and hypothetical expenses are useful in comparing ongoing costs only, and will not help you determine the relative total costs of owning different funds. In addition, if these transactional costs were included, your costs would have been higher.
| | | Beginning
Account
Value
4/1/12 | | Actual Ending
Account
Value
9/30/12 | | Hypothetical
Ending Account
Value | | Actual
Expenses
Paid
During
Period | | Hypothetical
Expenses Paid
During Period | | Net
Expense
Ratio
During
Period** | |
Core Plus Fixed Income Portfolio Class I | | $ | 1,000.00 | | | $ | 1,058.30 | | | $ | 1,021.70 | | | $ | 3.40 | * | | $ | 3.34 | * | | | 0.66 | % | |
Core Plus Fixed Income Portfolio Class P | | | 1,000.00 | | | | 1,057.90 | | | | 1,020.45 | | | | 4.68 | * | | | 4.60 | * | | | 0.91 | | |
Core Plus Fixed Income Portfolio Class H | | | 1,000.00 | | | | 1,047.40 | | | | 1,017.25 | | | | 3.88 | + | | | 3.82 | + | | | 0.90 | | |
Core Plus Fixed Income Portfolio Class L | | | 1,000.00 | | | | 1,045.90 | | | | 1,016.16 | | | | 4.99 | + | | | 4.92 | + | | | 1.16 | | |
* Expenses are calculated using each Portfolio Class' annualized net expense ratio (as disclosed), multiplied by the average account value over the period, and multiplied by 183/366 (to reflect the most recent one-half year period).
** Annualized.
+ Expenses are calculated using each Portfolio Class' annualized net expense ratio (as disclosed), multiplied by the average account value over the period, and multiplied by 154/366 (to reflect the actual days in period).
3
Morgan Stanley Institutional Fund Trust
Annual Report — September 30, 2012
Investment Advisory Agreement Approval (unaudited)
Nature, Extent and Quality of Services
The Board reviewed and considered the nature and extent of the investment advisory services provided by the Adviser (as defined herein) under the advisory agreement, including portfolio management, investment research and equity and fixed income securities trading. The Board also reviewed and considered the nature and extent of the non-advisory, administrative services provided by the Adviser under the administration agreement, including accounting, clerical, bookkeeping, compliance, business management and planning, and the provision of supplies, office space and utilities at the Adviser's expense. (The advisory and administration agreements together are referred to as the "Management Agreement.") The Board also compared the nature of the services provided by the Adviser with similar services provided by non-affiliated advisers as reported to the Board by Lipper, Inc. ("Lipper").
The Board reviewed and considered the qualifications of the portfolio managers, the senior administrative managers and other key personnel of the Adviser who provide the advisory and administrative services to the Portfolio. The Board determined that the Adviser's portfolio managers and key personnel are well qualified by education and/or training and experience to perform the services in an efficient and professional manner. The Board concluded that the nature and extent of the advisory and administrative services provided were necessary and appropriate for the conduct of the business and investment activities of the Portfolio and supported its decision to approve the Management Agreement.
Performance, Fees and Expenses of the Portfolio
The Board reviewed the performance, fees and expenses of the Portfolio compared to its peers, as determined by Lipper, and to appropriate benchmarks where applicable. The Board discussed with the Adviser the performance goals and the actual results achieved in managing the Portfolio. When considering a fund's performance, the Board and the Adviser place emphasis on trends and longer-term returns (focusing on one-year, three-year and five-year performance, as of December 31, 2011, or since inception, as applicable). When a fund underperforms its benchmark and/or its peer group average, they discuss the causes of such underperformance and, where necessary, they discuss specific changes to investment strategy or investment personnel. The Board noted that the Portfolio's performance was below its peer group average for the one-, three- and five-year periods. The Board discussed with the Adviser the level of the advisory and administration fees (together, the "management fee") for this Portfolio relative to comparable funds and/or other accounts advised by the Adviser and/or compared to its peers as determined by Lipper. In addition to the management fee, the Board also reviewed the Portfolio's total expense ratio. The Board noted that the Portfolio's management fee was higher but close to its peer group average and the total expense ratio was higher than its peer group average. After discussion, the Board concluded that the Portfolio's (i) performance was acceptable; (ii) management fee was competitive with its peer group average; and (iii) total expense ratio was acceptable given the quality and nature of services provided.
Economies of Scale
The Board considered the size and growth prospects of the Portfolio and how that relates to the Portfolio's total expense ratio and particularly the Portfolio's management fee rate which does not include breakpoints. In conjunction with its review of the Adviser's profitability, the Board discussed with the Adviser how a change in assets can affect the efficiency or effectiveness of managing the Portfolio and whether the management fee level is appropriate relative to current and projected asset levels and/or whether the management fee structure reflects economies of scale as asset levels change. The Board has determined that its review of the actual and potential economies of scale of the Portfolio supports its decision to approve the Management Agreement.
Profitability of the Adviser and Affiliates
The Board considered information concerning the costs incurred and profits realized by the Adviser and its affiliates during the last year from their relationship with the Portfolio and during the last two years from their relationship with the Morgan Stanley Fund Complex and reviewed with the Adviser the cost allocation methodology used to determine the profitability of the Adviser and affiliates. The Board has determined that its review of the analysis of the Adviser's expenses and profitability supports its decision to approve the Management Agreement.
Other Benefits of the Relationship
The Board considered other benefits to the Adviser and its affiliates derived from their relationship with the Portfolio and other funds advised by the Adviser. These benefits may include, among other things, "float" benefits derived from handling of checks for purchases and sales, research received by the Adviser generated from commission dollars spent on funds' portfolio trading and fees
4
Morgan Stanley Institutional Fund Trust
Annual Report — September 30, 2012
Investment Advisory Agreement Approval (unaudited) (cont'd)
for distribution and/or shareholder servicing. The Board reviewed with the Adviser each of these arrangements and the reasonableness of the Adviser's costs relative to the services performed. The Board has determined that its review of the other benefits received by the Adviser or its affiliates supports its decision to approve the Management Agreement.
Resources of the Adviser and Historical Relationship Between the Portfolio and the Adviser
The Board considered whether the Adviser is financially sound and has the resources necessary to perform its obligations under the Management Agreement. The Board also reviewed and considered the historical relationship between the Portfolio and the Adviser, including the organizational structure of the Adviser, the policies and procedures formulated and adopted by the Adviser for managing the Portfolio's operations and the Board's confidence in the competence and integrity of the senior managers and key personnel of the Adviser. The Board concluded that the Adviser has the financial resources necessary to fulfill its obligations under the Management Agreement and that it is beneficial for the Portfolio to continue its relationship with the Adviser.
Other Factors and Current Trends
The Board considered the controls and procedures adopted and implemented by the Adviser and monitored by the Fund's Chief Compliance Officer and concluded that the conduct of business by the Adviser indicates a good faith effort on its part to adhere to high ethical standards in the conduct of the Fund's business.
General Conclusion
After considering and weighing all of the above factors, the Board concluded that it would be in the best interest of the Portfolio and its shareholders to approve renewal of the Management Agreement for another year. In reaching this conclusion the Board did not give particular weight to any single factor referenced above. The Board considered these factors over the course of numerous meetings, some of which were in executive session with only the independent Board members and their counsel present. It is possible that individual Board members may have weighed these factors differently in reaching their individual decisions to approve the Management Agreement.
5
Morgan Stanley Institutional Fund Trust
Annual Report — September 30, 2012
Investment Overview (unaudited)
Core Plus Fixed Income Portfolio
Performance
For the fiscal year ended September 30, 2012, the Portfolio's Class I had a total return based on net asset value and reinvestment of distributions per share of 10.62%, net of fees. The Portfolio's Class I outperformed against its benchmark the Barclays Capital U.S. Aggregate Index (the "Index"), which returned 5.16%.
Factors Affecting Performance
• Aggressive central bank policy actions to support economic growth and provide stability led to a huge rally in risky assets so far in 2012. The European Central Bank's (ECB) longer-term refinancing operation announced at the end of 2011 was successful and helped improve investor sentiment significantly. As problems in Spain and Italy came to the forefront again this year, the ECB committed to providing unlimited support to the countries' bond markets by launching the Outright Monetary Transactions program. This program is subject to conditionality and would be triggered only if countries request for help.
• Given the weaker-than-expected economic conditions in the U.S., the Federal Reserve Bank also enacted various easing policies during the course of the period. This included extending the timeline to keep the target federal funds rate on hold, buying longer-maturity Treasuries and selling short-term Treasuries to put downward pressure on longer-term interest rates, and another round of quantitative easing focused on mortgage purchases, until the unemployment rate falls to an acceptable level.
• The labor market in the U.S. showed improvement but unemployment remained high. The unemployment rate fell to 7.8% from 9% a year ago. However, a large part of that decline was due to a drop in the labor participation rate. Economic growth in the U.S. remained sluggish as gross domestic product (GDP) growth in the first half of the year was under 2%.
• After the sell-off in the second half of 2011, spread sectors had strong performance so far in 2012 (through September). Spreads on corporate debt have tightened significantly with the riskier sectors of the market posting the best performance. Spreads of high yield corporate debt tightened by 240 basis
points while investment-grade corporate spreads narrowed by almost 85 basis points. The financials sector did very well with spreads tightening by about 150 basis points. Whilst the strong market rally has reduced the risk premium in the corporate credit market, we continue to believe that conditions could favor the asset class over the rest of the year.
• Mortgage-backed securities (MBS) performed very well over the period. The latest round of quantitative easing led to a substantial tightening in yield spreads of lower-coupon, fixed-rate MBS. Despite historically low mortgage rates, refinancing activity has been slower than it has been in the past under similar rate incentives, as many borrowers are unable to refinance due to tighter underwriting standards. However, with further quantitative easing, the expectation is that there will be an increase in mortgage refinancing. The U.S. housing market has started showing signs of stabilization. After many months of continuous declines, the headline home price index has turned positive on a year-over-year basis.
• Government bonds in major markets such as the U.S., Germany and the U.K. rallied significantly. The 10-year Treasury yield touched an all-time low of 1.43% in July. The decline in U.S. Treasury yields over the year was led by the intermediate part of the curve as 2-, 5-, 10- and 30-year rates fell by 2, 33, 29, and 9 basis points, respectively.
• The Portfolio's positioning in the mortgage sector was one of the main drivers of outperformance. In particular, allocations to non-agency mortgages and agency mortgage derivatives through interest-only (IO) and inverse interest-only (IIO) securities contributed significantly to returns.
• An overweight to the corporate sector, especially in financials and high yield securities, was the other main driver of performance as spreads tightened over the year.
• An underweight in the agency sector detracted slightly from performance.
6
Morgan Stanley Institutional Fund Trust
Annual Report — September 30, 2012
Investment Overview (unaudited) (cont'd)
Core Plus Fixed Income Portfolio
Management Strategies
• Throughout the period, the Portfolio was positioned with an overweight to investment-grade credit as corporate bond valuations relative to fundamentals have been attractive. We took advantage of the strong rally in financials this year to trim some of the overweight in the sector.
• In terms of mortgage strategy, the Portfolio has had a position in IO and IIO securities. Prepayment speeds have been slow, which has been beneficial for this position. A number of factors, such as increased credit requirements and fees, have mitigated prepayments and presented hurdles for borrowers looking to refinance.
• The Portfolio also had allocations to riskier segments of the market such as high-yield corporates, non-agency mortgages and convertible bonds. These sectors performed very well during the period and we have reduced exposures in some positions.
• Given the current low yielding environment, being overweight spread product seems attractive as we believe the yield advantage could provide a large part of returns over the medium term.
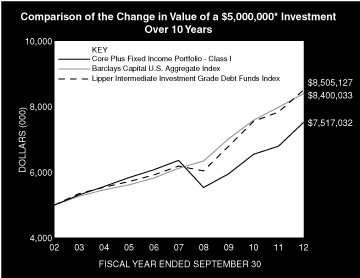
* Minimum Investment
In accordance with SEC regulations, the Portfolio's performance shown assumes that all recurring fees (including management fees) were deducted and all dividends and distributions were reinvested. The performance of Class P, Class H and Class L shares will vary from the Class I shares based upon their different inception dates and will be negatively impacted by additional fees assessed to those classes.
Performance Compared to the Barclays Capital U.S. Aggregate Index(1) and the Lipper Intermediate Investment Grade Debt Funds Index(2)
| | Period Ended September 30, 2012
Total Returns(3) | |
| | | | Average Annual | |
| | One
Year | | Five
Years | | Ten
Years | | Since
Inception(7) | |
Portfolio — Class I Shares
w/o sales charges(4) | | | 10.62 | % | | | 3.37 | % | | | 4.16 | % | | | 7.73 | % | |
Barclays Capital U.S. Aggregate Index | | | 5.16 | | | | 6.53 | | | | 5.32 | | | | 7.97 | | |
Lipper Intermediate Investment
Grade Debt Funds Index | | | 8.52 | | | | 6.55 | | | | 5.46 | | | | — | | |
Portfolio — Class P Shares
w/o sales charges(5) | | | 10.31 | | | | 3.13 | | | | 3.91 | | | | 4.99 | | |
Barclays Capital U.S. Aggregate Index | | | 5.16 | | | | 6.53 | | | | 5.32 | | | | 6.23 | | |
Lipper Intermediate Investment
Grade Debt Funds Index | | | 8.52 | | | | 6.55 | | | | 5.46 | | | | 5.97 | | |
Portfolio — Class H Shares
w/o sales charges(6) | | | — | | | | — | | | | — | | | | 4.74 | | |
Portfolio — Class H Shares
with maximum 3.50% sales charges(6) | | | — | | | | — | | | | — | | | | 1.05 | | |
Barclays Capital U.S. Aggregate Index | | | — | | | | — | | | | — | | | | 2.63 | | |
Lipper Intermediate Investment Grade
Debt Funds Index | | | — | | | | — | | | | — | | | | 3.89 | | |
Portfolio — Class L Shares
w/o sales charges(6) | | | — | | | | — | | | | — | | | | 4.59 | | |
Barclays Capital U.S. Aggregate Index | | | — | | | | — | | | | — | | | | 2.63 | | |
Lipper Intermediate Investment Grade
Debt Funds Index | | | — | | | | — | | | | — | | | | 3.89 | | |
Performance data quoted represents past performance, which is no guarantee of future results, and current performance may be lower or higher than the figures shown. Performance assumes that all dividends and distributions, if any, were reinvested. Returns for periods less than one year are not annualized. For the most recent month-end performance figures, please visit www.morganstanley.com/im. Investment returns and principal value will fluctuate so that Portfolio shares, when redeemed, may be worth more or less than their original cost. Total returns do not reflect the deduction of taxes that a shareholder would pay on Portfolio distributions or the redemption of Portfolio shares. Performance of share classes will vary due to differences in sales charges and expenses.
(1) The Barclays Capital U.S. Aggregate Index tracks the performance of all U.S. government agency and Treasury securities, investment-grade corporate debt securities, agency mortgage-backed securities, asset-backed securities and commercial mortgage-backed securities. The Index is unmanaged and its returns do not include any sales charges or fees. Such costs would lower performance. It is not possible to invest directly in an index.
(2) The Lipper Intermediate Investment Grade Debt Funds Index is an equally weighted performance index of the largest qualifying funds (based on net assets) in the Lipper Intermediate Investment Grade Debt Funds classification. The Index, which is adjusted for capital gains distributions and income dividends, is unmanaged and should not be considered an investment. There are currently 30 funds represented in this Index. As of the date of this report, the Portfolio was in the Lipper Intermediate Investment Grade Debt Funds classification.
(3) Total returns for the Portfolio reflect expenses waived and/or reimbursed, if applicable, by the Adviser. Without such waivers and/or reimbursements, total returns would have been lower. The fee waivers and/or expense reimbursements
7
Morgan Stanley Institutional Fund Trust
Annual Report — September 30, 2012
Investment Overview (unaudited) (cont'd)
Core Plus Fixed Income Portfolio
will continue for at least one year or until such time as the Fund's Board of Trustees acts to discontinue all or a portion of such waivers and/or reimbursements when it deems such action is appropriate.
(4) Commenced operations on November 14, 1984.
(5) Commenced operations on November 7, 1996.
(6) Commenced operations on April 27, 2012.
(7) For comparative purposes, average annual since inception returns listed for the Indexes refer to the inception date or initial offering of the respective share class of the Portfolio, not the inception of the Indexes.
Portfolio Composition*
Classification | | Percentage of
Total Investments | |
Agency Fixed Rate Mortgages | | | 27.5 | % | |
Industrials | | | 18.2 | | |
Other** | | | 15.5 | | |
Finance | | | 12.3 | | |
U.S. Treasury Securities | | | 12.2 | | |
Short-Term Investments | | | 8.9 | | |
Mortgages — Other | | | 5.4 | | |
Total Investments | | | 100.0 | %*** | |
* Percentages indicated are based upon total investments (excluding Securities held as Collateral on Loaned Securities) as of September 30, 2012.
** Industries and/or investment types representing less than 5% of total investments.
*** Does not include open long/short futures contracts with an underlying face amount of approximately $95,757,000 and net unrealized depreciation of approximately $15,000. Also, does not include open foreign currency exchange contracts with net unrealized appreciation of approximately $7,000 and open swap agreements with net unrealized depreciation of approximately $99,000.
8
Morgan Stanley Institutional Fund Trust
Annual Report — September 30, 2012
Portfolio of Investments
Core Plus Fixed Income Portfolio
| | | Face
Amount
(000) | | Value
(000) | |
Fixed Income Securities (98.0%) | |
Agency Adjustable Rate Mortgages (0.8%) | |
Federal National Mortgage Association, | |
Conventional Pool | |
2.32%, 5/1/35 | | $ | 1,737 | | | $ | 1,855 | | |
Agency Fixed Rate Mortgages (29.6%) | |
Federal Home Loan Mortgage Corporation, | |
Conventional Pools: | |
12.00%, 2/1/15 | | | — | @ | | | — | @ | |
13.00%, 6/1/19 | | | — | @ | | | — | @ | |
Gold Pools: | |
3.50%, 8/1/42 | | | 1,173 | | | | 1,261 | | |
4.00%, 12/1/41 | | | 2,678 | | | | 2,884 | | |
4.50%, 6/1/39 - 3/1/41 | | | 8,421 | | | | 9,277 | | |
5.00%, 10/1/35 | | | 275 | | | | 300 | | |
6.00%, 10/1/36 - 8/1/38 | | | 1,433 | | | | 1,580 | | |
6.50%, 3/1/16 - 8/1/33 | | | 405 | | | | 468 | | |
7.00%, 6/1/28 - 11/1/31 | | | 111 | | | | 132 | | |
October TBA: | |
3.00%, 10/1/27 (a) | | | 1,750 | | | | 1,848 | | |
3.50%, 10/1/42 (a) | | | 8,125 | | | | 8,714 | | |
Federal National Mortgage Association, | |
Conventional Pools: | |
4.00%, 11/1/41 - 1/1/42 | | | 12,130 | | | | 13,093 | | |
5.00%, 1/1/37 - 3/1/41 | | | 2,958 | | | | 3,250 | | |
5.50%, 6/1/35 - 5/1/41 | | | 8,751 | | | | 9,717 | | |
6.00%, 5/1/38 | | | 1,490 | | | | 1,646 | | |
6.50%, 11/1/23 - 1/1/34 | | | 4,616 | | | | 5,356 | | |
7.00%, 11/1/13 - 1/1/34 | | | 760 | | | | 898 | | |
8.50%, 1/1/15 | | | 2 | | | | 3 | | |
9.50%, 4/1/30 | | | 640 | | | | 775 | | |
12.00%, 11/1/15 | | | 21 | | | | 22 | | |
12.50%, 9/1/15 | | | 4 | | | | 4 | | |
Government National Mortgage Association, | |
October TBA: | |
3.50%, 10/15/42 (a) | | | 3,125 | | | | 3,425 | | |
4.00%, 10/15/42 (a) | | | 2,700 | | | | 2,973 | | |
Various Pool | |
4.50%, 8/15/39 | | | 672 | | | | 742 | | |
| | | | 68,368 | | |
Asset-Backed Securities (1.8%) | |
Contimortgage Home Equity Trust | |
8.10%, 8/15/25 | | | 41 | | | | 41 | | |
CVS Pass-Through Trust | |
6.04%, 12/10/28 | | | 476 | | | | 555 | | |
Mid-State Trust | |
8.33%, 4/1/30 | | | 30 | | | | 31 | | |
Santander Drive Auto Receivables Trust | |
3.06%, 11/15/17 | | | 1,075 | | | | 1,091 | | |
Textainer Marine Containers Ltd. | |
4.70%, 6/15/26 (b) | | | 656 | | | | 691 | | |
U-Haul S Fleet LLC | |
4.90%, 10/25/23 (b) | | | 1,403 | | | | 1,526 | | |
| | | Face
Amount
(000) | | Value
(000) | |
Westlake Automobile Receivables Trust | |
5.00%, 5/15/15 (b) | | $ | 215 | | | $ | 216 | | |
| | | | 4,151 | | |
Collateralized Mortgage Obligations — Agency Collateral Series (4.7%) | |
Federal Home Loan Mortgage Corporation, | |
IO | |
0.83%, 1/25/21 (c) | | | 10,075 | | | | 406 | | |
IO PAC REMIC | |
6.25%, 6/15/40 (c) | | | 10,453 | | | | 2,042 | | |
IO REMIC | |
5.83%, 4/15/39 (c) | | | 3,322 | | | | 803 | | |
IO STRIPS | |
7.50%, 12/1/29 | | | 84 | | | | 21 | | |
8.00%, 1/1/28 | | | 144 | | | | 33 | | |
PAC REMIC | |
9.50%, 4/15/20 | | | 1 | | | | 1 | | |
Federal National Mortgage Association, | |
IO | |
6.17%, 9/25/20 (c) | | | 5,188 | | | | 1,336 | | |
IO PAC REMIC | |
8.00%, 9/18/27 | | | 374 | | | | 82 | | |
IO REMIC | |
5.00%, 8/25/37 | | | 1,690 | | | | 61 | | |
6.00%, 7/25/33 | | | 535 | | | | 88 | | |
6.38%, 9/25/38 (c) | | | 2,796 | | | | 579 | | |
IO STRIPS | |
6.50%, 9/1/29 - 12/1/29 | | | 1,627 | | | | 334 | | |
8.00%, 4/1/24 | | | 454 | | | | 99 | | |
8.50%, 10/1/25 | | | 122 | | | | 29 | | |
9.00%, 11/1/26 | | | 114 | | | | 27 | | |
REMIC | |
7.00%, 9/25/32 | | | 771 | | | | 912 | | |
9.14%, 10/25/41 (c)(d) | | | 863 | | | | 933 | | |
63.21%, 9/25/20 (c)(d) | | | 8 | | | | 17 | | |
Government National Mortgage Association, | |
IO | |
5.00%, 2/16/41 | | | 860 | | | | 181 | | |
5.83%, 11/16/40 (c) | | | 4,860 | | | | 930 | | |
6.36%, 6/20/40 (c) | | | 3,531 | | | | 599 | | |
6.38%, 4/16/41 (c) | | | 6,251 | | | | 1,399 | | |
| | | | 10,912 | | |
Commercial Mortgage Backed Securities (1.4%) | |
Bear Stearns Commercial Mortgage Securities | |
5.47%, 1/12/45 (c) | | | 1,526 | | | | 1,783 | | |
DBUBS Mortgage Trust | |
5.63%, 7/10/44 (b)(c) | | | 325 | | | | 360 | | |
WF-RBS Commercial Mortgage Trust | |
3.43%, 6/15/45 | | | 966 | | | | 1,045 | | |
| | | | 3,188 | | |
Corporate Bonds (33.9%) | |
Finance (13.2%) | |
ABB Treasury Center USA, Inc. | |
2.50%, 6/15/16 (b) | | | 800 | | | | 837 | | |
The accompanying notes are an integral part of the financial statements.
9
Morgan Stanley Institutional Fund Trust
Annual Report — September 30, 2012
Portfolio of Investments (cont'd)
Core Plus Fixed Income Portfolio
| | | Face
Amount
(000) | | Value
(000) | |
Finance (cont'd) | |
Abbey National Treasury Services PLC, | |
MTN | |
3.88%, 11/10/14 (b) | | $ | 439 | | | $ | 448 | | |
Aegon N.V. | |
4.63%, 12/1/15 (e) | | | 480 | | | | 526 | | |
Affiliated Managers Group, Inc. | |
3.95%, 8/15/38 | | | 496 | | | | 555 | | |
Alexandria Real Estate Equities, Inc. | |
4.60%, 4/1/22 | | | 400 | | | | 428 | | |
Ally Financial, Inc. | |
5.50%, 2/15/17 | | | 350 | | | | 366 | | |
American International Group, Inc. | |
6.40%, 12/15/20 | | | 375 | | | | 457 | | |
AvalonBay Communities, Inc. | |
2.95%, 9/15/22 | | | 300 | | | | 300 | | |
Banco Santander Brasil SA, | |
4.25%, 1/14/16 (b) | | | 204 | | | | 209 | | |
4.63%, 2/13/17 (b)(e) | | | 325 | | | | 336 | | |
Barclays Bank PLC | |
6.05%, 12/4/17 (b) | | | 650 | | | | 703 | | |
BNP Paribas SA | |
2.38%, 9/14/17 | | | 465 | | | | 467 | | |
Brookfield Asset Management, Inc. | |
5.80%, 4/25/17 (e) | | | 300 | | | | 335 | | |
Capital One Bank, USA NA | |
8.80%, 7/15/19 | | | 305 | | | | 403 | | |
Cigna Corp., | |
2.75%, 11/15/16 (e) | | | 335 | | | | 354 | | |
5.38%, 2/15/42 | | | 45 | | | | 51 | | |
Citigroup, Inc. (See Note G), | |
5.88%, 5/29/37 | | | 264 | | | | 311 | | |
8.50%, 5/22/19 | | | 594 | | | | 787 | | |
CNA Financial Corp. | |
5.75%, 8/15/21 (e) | | | 315 | | | | 367 | | |
Commonwealth Bank of Australia | |
1.90%, 9/18/17 | | | 485 | | | | 487 | | |
Coventry Health Care, Inc. | |
5.45%, 6/15/21 | | | 540 | | | | 633 | | |
Credit Agricole SA | |
3.00%, 10/1/17 (b)(f) | | | 575 | | | | 574 | | |
Credit Suisse | |
6.00%, 2/15/18 (e) | | | 369 | | | | 419 | | |
Discover Bank | |
7.00%, 4/15/20 (e) | | | 575 | | | | 694 | | |
DNB Bank ASA | |
3.20%, 4/3/17 (b) | | | 685 | | | | 716 | | |
Federal Realty Investment Trust | |
3.00%, 8/1/22 | | | 350 | | | | 349 | | |
General Electric Capital Corp., | |
Series G | |
6.00%, 8/7/19 | | | 694 | | | | 845 | | |
| | | Face
Amount
(000) | | Value
(000) | |
Genworth Financial, Inc. | |
7.20%, 2/15/21 | | $ | 625 | | | $ | 640 | | |
Goldman Sachs Group, Inc. (The) | |
5.75%, 1/24/22 | | | 1,030 | | | | 1,189 | | |
Goodman Funding Pty Ltd. | |
6.38%, 4/15/21 (b) | | | 850 | | | | 935 | | |
Hartford Financial Services Group, Inc. | |
5.50%, 3/30/20 | | | 645 | | | | 731 | | |
HBOS PLC, | |
Series G | |
6.75%, 5/21/18 (b)(e) | | | 813 | | | | 829 | | |
HSBC Holdings PLC | |
4.00%, 3/30/22 | | | 650 | | | | 699 | | |
ING Bank N.V. | |
3.75%, 3/7/17 (b) | | | 600 | | | | 633 | | |
ING US, Inc. | |
5.50%, 7/15/22 (b) | | | 400 | | | | 418 | | |
JPMorgan Chase & Co., | |
4.50%, 1/24/22 | | | 225 | | | | 250 | | |
4.63%, 5/10/21 | | | 380 | | | | 425 | | |
JPMorgan Chase Bank NA | |
6.00%, 10/1/17 | | | 715 | | | | 847 | | |
Mack-Cali Realty LP | |
4.50%, 4/18/22 | | | 400 | | | | 429 | | |
Macquarie Bank Ltd. | |
6.63%, 4/7/21 (b) | | | 490 | | | | 525 | | |
Merrill Lynch & Co., Inc., | |
MTN | |
6.88%, 4/25/18 | | | 908 | | | | 1,089 | | |
MetLife, Inc. | |
7.72%, 2/15/19 | | | 285 | | | | 372 | | |
Nationwide Building Society | |
6.25%, 2/25/20 (b) | | | 645 | | | | 741 | | |
Nationwide Financial Services | |
5.38%, 3/25/21 (b) | | | 450 | | | | 478 | | |
Nordea Bank AB | |
4.88%, 5/13/21 (b) | | | 765 | | | | 805 | | |
Platinum Underwriters Finance, Inc., | |
Series B | |
7.50%, 6/1/17 (e) | | | 791 | | | | 871 | | |
QBE Capital Funding III Ltd. | |
7.25%, 5/24/41 (b)(c) | | | 550 | | | | 558 | | |
Royal Bank of Scotland Group PLC | |
2.55%, 9/18/15 | | | 495 | | | | 501 | | |
Santander Holdings USA, Inc., | |
3.00%, 9/24/15 | | | 105 | | | | 106 | | |
4.63%, 4/19/16 | | | 250 | | | | 262 | | |
Societe Generale SA | |
5.20%, 4/15/21 (b)(e) | | | 455 | | | | 489 | | |
Standard Chartered Bank | |
6.40%, 9/26/17 (b) | | | 790 | | | | 908 | | |
Swedbank AB | |
2.13%, 9/29/17 (b)(f) | | | 460 | | | | 459 | | |
The accompanying notes are an integral part of the financial statements.
10
Morgan Stanley Institutional Fund Trust
Annual Report — September 30, 2012
Portfolio of Investments (cont'd)
Core Plus Fixed Income Portfolio
| | | Face
Amount
(000) | | Value
(000) | |
Finance (cont'd) | |
US Bancorp | |
2.95%, 7/15/22 | | $ | 510 | | | $ | 516 | | |
WEA Finance LLC/ WT Finance Aust Pty Ltd. | |
3.38%, 10/3/22 (b)(f) | | | 325 | | | | 324 | | |
WellPoint, Inc. | |
3.30%, 1/15/23 | | | 470 | | | | 476 | | |
| | | | 30,462 | | |
Industrials (19.5%) | |
Alpha Natural Resources, Inc. | |
6.25%, 6/1/21 (e) | | | 105 | | | | 88 | | |
Altria Group, Inc. | |
2.85%, 8/9/22 | | | 360 | | | | 360 | | |
America Movil SAB de CV | |
3.13%, 7/16/22 | | | 200 | | | | 207 | | |
American Honda Finance Corp. | |
2.13%, 2/28/17 (b) | | | 770 | | | | 797 | | |
Amgen, Inc. | |
3.88%, 11/15/21 | | | 325 | | | | 350 | | |
Anheuser-Busch InBev Worldwide, Inc. | |
5.38%, 1/15/20 | | | 425 | | | | 529 | | |
Anixter, Inc. | |
5.63%, 5/1/19 | | | 510 | | | | 535 | | |
ArcelorMittal | |
10.10%, 6/1/19 | | | 666 | | | | 768 | | |
AT&T, Inc., | |
5.35%, 9/1/40 | | | 150 | | | | 181 | | |
6.30%, 1/15/38 | | | 500 | | | | 659 | | |
BAA Funding Ltd. | |
4.88%, 7/15/21 (b)(e) | | | 525 | | | | 558 | | |
Ball Corp. | |
5.00%, 3/15/22 (e) | | | 450 | | | | 472 | | |
BE Aerospace, Inc. | |
5.25%, 4/1/22 | | | 450 | | | | 469 | | |
Best Buy Co., Inc. | |
3.75%, 3/15/16 (e) | | | 545 | | | | 522 | | |
Bombardier, Inc. | |
7.75%, 3/15/20 (b) | | | 575 | | | | 663 | | |
Boston Scientific Corp. | |
6.00%, 1/15/20 | | | 480 | | | | 571 | | |
BP Capital Markets PLC | |
3.25%, 5/6/22 | | | 600 | | | | 636 | | |
Burlington Northern Santa Fe LLC | |
3.05%, 3/15/22 | | | 400 | | | | 414 | | |
Canadian Oil Sands Ltd. | |
7.75%, 5/15/19 (b) | | | 425 | | | | 536 | | |
CenturyLink, Inc. | |
6.45%, 6/15/21 | | | 440 | | | | 497 | | |
CF Industries, Inc. | |
6.88%, 5/1/18 | | | 475 | | | | 579 | | |
Chrysler Group LLC/CG Co-Issuer, Inc. | |
8.00%, 6/15/19 (e) | | | 560 | | | | 596 | | |
| | | Face
Amount
(000) | | Value
(000) | |
Cimarex Energy Co. | |
5.88%, 5/1/22 | | $ | 400 | | | $ | 424 | | |
Continental Resources, Inc. | |
7.13%, 4/1/21 | | | 575 | | | | 650 | | |
Covidien International Finance SA | |
3.20%, 6/15/22 | | | 175 | | | | 185 | | |
CRH America, Inc. | |
6.00%, 9/30/16 | | | 580 | | | | 648 | | |
CSC Holdings LLC | |
6.75%, 11/15/21 (b) | | | 470 | | | | 521 | | |
Daimler Finance North America LLC | |
8.50%, 1/18/31 | | | 224 | | | | 356 | | |
Darden Restaurants, Inc. | |
6.20%, 10/15/17 | | | 520 | | | | 607 | | |
Deere & Co. | |
3.90%, 6/9/42 | | | 220 | | | | 229 | | |
Delhaize Group SA | |
5.70%, 10/1/40 | | | 433 | | | | 387 | | |
Diageo Capital PLC | |
1.50%, 5/11/17 | | | 325 | | | | 331 | | |
DirecTV Holdings LLC/DirecTV Financing Co., Inc. | |
3.80%, 3/15/22 | | | 675 | | | | 696 | | |
DISH DBS Corp. | |
5.88%, 7/15/22 (b) | | | 625 | | | | 644 | | |
EOG Resources, Inc. | |
2.63%, 3/15/23 | | | 450 | | | | 456 | | |
Exide Technologies | |
8.63%, 2/1/18 | | | 219 | | | | 191 | | |
Experian Finance PLC | |
2.38%, 6/15/17 (b) | | | 635 | | | | 645 | | |
Express Scripts Holding Co., | |
2.65%, 2/15/17 (b) | | | 485 | | | | 509 | | |
3.90%, 2/15/22 (b) | | | 190 | | | | 207 | | |
Fiserv, Inc. | |
3.13%, 6/15/16 | | | 360 | | | | 379 | | |
FMC Technologies, Inc. | |
3.45%, 10/1/22 | | | 235 | | | | 239 | | |
FMG Resources August 2006 Pty Ltd. | |
6.38%, 2/1/16 (b)(e) | | | 380 | | | | 371 | | |
Ford Motor Credit Co. LLC | |
4.21%, 4/15/16 | | | 860 | | | | 912 | | |
Gap, Inc. (The) | |
5.95%, 4/12/21 | | | 645 | | | | 720 | | |
Georgia-Pacific LLC | |
8.88%, 5/15/31 | | | 280 | | | | 415 | | |
Gilead Sciences, Inc. | |
4.50%, 4/1/21 (e) | | | 485 | | | | 557 | | |
Goldcorp, Inc. | |
2.00%, 8/1/14 (e) | | | 335 | | | | 406 | | |
Grupo Bimbo SAB de CV | |
4.88%, 6/30/20 (b) | | | 435 | | | | 487 | | |
Harley-Davidson Funding Corp. | |
6.80%, 6/15/18 (b) | | | 630 | | | | 781 | | |
The accompanying notes are an integral part of the financial statements.
11
Morgan Stanley Institutional Fund Trust
Annual Report — September 30, 2012
Portfolio of Investments (cont'd)
Core Plus Fixed Income Portfolio
| | | Face
Amount
(000) | | Value
(000) | |
Industrials (cont'd) | |
HCA, Inc. | |
5.88%, 3/15/22 | | $ | 545 | | | $ | 593 | | |
Hewlett-Packard Co. | |
4.65%, 12/9/21 | | | 380 | | | | 397 | | |
Holcim US Finance Sarl & Cie SCS | |
6.00%, 12/30/19 (b)(e) | | | 483 | | | | 537 | | |
Home Depot, Inc. | |
5.88%, 12/16/36 | | | 293 | | | | 387 | | |
Ingram Micro, Inc. | |
5.25%, 9/1/17 | | | 295 | | | | 324 | | |
Intel Corp. | |
2.95%, 12/15/35 | | | 356 | | | | 389 | | |
International Business Machines Corp. | |
1.88%, 5/15/19 (e) | | | 650 | | | | 675 | | |
International Game Technology | |
3.25%, 5/1/14 | | | 492 | | | | 516 | | |
Kinross Gold Corp. | |
5.13%, 9/1/21 (e) | | | 520 | | | | 539 | | |
Lam Research Corp. | |
1.25%, 5/15/18 (e) | | | 304 | | | | 295 | | |
LyondellBasell Industries N.V. | |
5.00%, 4/15/19 | | | 475 | | | | 507 | | |
MeadWestvaco Corp. | |
7.38%, 9/1/19 (e) | | | 155 | | | | 197 | | |
Micron Technology, Inc. | |
1.88%, 6/1/14 | | | 466 | | | | 463 | | |
Microsoft Corp. | |
Zero Coupon, 6/15/13 (b)(e) | | | 262 | | | | 274 | | |
Molson Coors Brewing Co. | |
2.50%, 7/30/13 | | | 497 | | | | 517 | | |
Murphy Oil Corp. | |
4.00%, 6/1/22 | | | 470 | | | | 500 | | |
NBC Universal Media LLC, | |
2.88%, 1/15/23 (f) | | | 250 | | | | 250 | | |
5.95%, 4/1/41 | | | 400 | | | | 492 | | |
News America, Inc. | |
6.15%, 2/15/41 | | | 400 | | | | 500 | | |
Omnicom Group, Inc. | |
3.63%, 5/1/22 | | | 455 | | | | 482 | | |
Philip Morris International, Inc. | |
2.50%, 8/22/22 | | | 495 | | | | 497 | | |
Phillips 66 | |
4.30%, 4/1/22 (b) | | | 525 | | | | 576 | | |
Pioneer Natural Resources Co. | |
7.50%, 1/15/20 | | | 375 | | | | 468 | | |
SABMiller Holdings, Inc. | |
3.75%, 1/15/22 (b) | | | 420 | | | | 457 | | |
SBA Telecommunications, Inc. | |
8.25%, 8/15/19 | | | 565 | | | | 634 | | |
Schlumberger Norge AS | |
1.25%, 8/1/17 (b) | | | 300 | | | | 299 | | |
| | | Face
Amount
(000) | | Value
(000) | |
Schneider Electric SA | |
2.95%, 9/27/22 (b) | | $ | 525 | | | $ | 530 | | |
Silgan Holdings, Inc. | |
5.00%, 4/1/20 | | | 750 | | | | 788 | | |
Symantec Corp., | |
Series B | |
1.00%, 6/15/13 | | | 488 | | | | 531 | | |
Syngenta Finance N.V. | |
3.13%, 3/28/22 | | | 585 | | | | 616 | | |
Telefonaktiebolaget LM Ericsson | |
4.13%, 5/15/22 | | | 300 | | | | 310 | | |
Tesoro Corp. | |
5.38%, 10/1/22 | | | 220 | | | | 227 | | |
Teva Pharmaceutical Finance IV BV | |
3.65%, 11/10/21 | | | 525 | | | | 570 | | |
Thermo Fisher Scientific, Inc. | |
3.15%, 1/15/23 | | | 485 | | | | 502 | | |
Time Warner Cable, Inc. | |
4.50%, 9/15/42 | | | 205 | | | | 205 | | |
Tronox Finance LLC | |
6.38%, 8/15/20 (b) | | | 503 | | | | 510 | | |
United Technologies Corp. | |
4.50%, 6/1/42 | | | 165 | | | | 186 | | |
Verisk Analytics, Inc. | |
5.80%, 5/1/21 | | | 550 | | | | 619 | | |
Volkswagen International Finance N.V. | |
2.38%, 3/22/17 (b) | | | 550 | | | | 572 | | |
Wal-Mart Stores, Inc. | |
5.25%, 9/1/35 | | | 290 | | | | 361 | | |
Waste Management, Inc. | |
2.90%, 9/15/22 | | | 350 | | | | 350 | | |
Watson Pharmaceuticals, | |
3.25%, 10/1/22 | | | 95 | | | | 96 | | |
4.63%, 10/1/42 | | | 50 | | | | 51 | | |
Wesfarmers Ltd. | |
2.98%, 5/18/16 (b) | | | 390 | | | | 408 | | |
Westvaco Corp. | |
8.20%, 1/15/30 | | | 185 | | | | 247 | | |
WPP Finance UK | |
8.00%, 9/15/14 | | | 664 | | | | 746 | | |
Wyndham Worldwide Corp. | |
4.25%, 3/1/22 | | | 680 | | | | 700 | | |
Wynn Las Vegas LLC/Wynn Las Vegas Capital Corp. | |
5.38%, 3/15/22 (b)(e) | | | 350 | | | | 357 | | |
| | | | 45,187 | | |
Utilities (1.2%) | |
Delmarva Power & Light Co. | |
4.00%, 6/1/42 | | | 475 | | | | 501 | | |
Enterprise Products Operating LLC | |
5.20%, 9/1/20 (e) | | | 635 | | | | 749 | | |
Exelon Generation Co., LLC | |
6.25%, 10/1/39 | | | 445 | | | | 517 | | |
The accompanying notes are an integral part of the financial statements.
12
Morgan Stanley Institutional Fund Trust
Annual Report — September 30, 2012
Portfolio of Investments (cont'd)
Core Plus Fixed Income Portfolio
| | | Face
Amount
(000) | | Value
(000) | |
Utilities (cont'd) | |
Plains All American Pipeline LP/PAA Finance Corp. | |
6.70%, 5/15/36 | | $ | 439 | | | $ | 563 | | |
PPL WEM Holdings PLC | |
3.90%, 5/1/16 (b) | | | 375 | | | | 395 | | |
| | | | 2,725 | | |
| | | | 78,374 | | |
Mortgages — Other (5.8%) | |
Banc of America Alternative Loan Trust, | |
5.86%, 10/25/36 (c) | | | 1,132 | | | | 863 | | |
5.91%, 10/25/36 (c) | | | 1,974 | | | | 1,503 | | |
6.00%, 4/25/36 | | | 705 | | | | 725 | | |
Banc of America Funding Corp. | |
0.59%, 8/25/36 (c) | | | 451 | | | | 429 | | |
Chaseflex Trust | |
6.00%, 2/25/37 | | | 1,833 | | | | 1,408 | | |
First Horizon Alternative Mortgage Securities | |
6.25%, 8/25/36 | | | 1,167 | | | | 957 | | |
GS Mortgage Securities Corp. | |
7.50%, 9/25/36 (b)(c) | | | 1,309 | | | | 1,060 | | |
JP Morgan Mortgage Trust | |
6.00%, 6/25/37 | | | 688 | | | | 668 | | |
Lehman Mortgage Trust, | |
5.50%, 11/25/35 - 2/25/36 | | | 2,538 | | | | 2,514 | | |
6.50%, 9/25/37 | | | 2,391 | | | | 1,983 | | |
WaMu Mortgage Pass-Through Certificates | |
1.13%, 7/25/46 (c) | | | 1,922 | | | | 1,422 | | |
| | | | 13,532 | | |
Municipal Bonds (1.4%) | |
City of Chicago, IL, | |
O'Hare International Airport Revenue | |
6.40%, 1/1/40 | | | 255 | | | | 334 | | |
City of New York, NY, | |
Series G-1 | |
5.97%, 3/1/36 | | | 270 | | | | 355 | | |
Illinois State Toll Highway Authority, | |
Highway Revenue, Build America Bonds | |
6.18%, 1/1/34 | | | 477 | | | | 614 | | |
Municipal Electric Authority of Georgia, | |
6.64%, 4/1/57 | | | 283 | | | | 334 | | |
6.66%, 4/1/57 | | | 320 | | | | 373 | | |
New York City, NY, | |
Transitional Finance Authority Future Tax Secured Revenue | |
5.27%, 5/1/27 | | | 320 | | | | 391 | | |
State of California, | |
General Obligation Bonds | |
5.95%, 4/1/16 | | | 830 | | | | 944 | | |
| | | | 3,345 | | |
Sovereign (3.3%) | |
Banco Nacional de Desenvolvimento, Economico e Social | |
5.50%, 7/12/20 (b) | | | 1,100 | | | | 1,309 | | |
| | | Face
Amount
(000) | | Value
(000) | |
Brazilian Government International Bond | |
4.88%, 1/22/21 (e) | | $ | 800 | | | $ | 960 | | |
Eskom Holdings SOC Ltd. | |
5.75%, 1/26/21 (b) | | | 1,000 | | | | 1,145 | | |
KazMunayGas National Co. | |
6.38%, 4/9/21 (b) | | | 1,100 | | | | 1,326 | | |
Petroleos Mexicanos | |
4.88%, 1/24/22 | | | 1,000 | | | | 1,132 | | |
Poland Government International Bond | |
5.00%, 3/23/22 | | | 400 | | | | 465 | | |
Russian Foreign Bond - Eurobond | |
3.25%, 4/4/17 (b) | | | 1,200 | | | | 1,266 | | |
| | | | 7,603 | | |
U.S. Agency Securities (2.1%) | |
Federal Home Loan Mortgage Corporation, | |
3.75%, 3/27/19 | | | 3,500 | | | | 4,085 | | |
6.75%, 3/15/31 | | | 470 | | | | 737 | | |
| | | | 4,822 | | |
U.S. Treasury Securities (13.2%) | |
U.S. Treasury Bonds, | |
3.00%, 5/15/42 (e) | | | 350 | | | | 363 | | |
3.88%, 8/15/40 | | | 9,545 | | | | 11,663 | | |
5.25%, 11/15/28 | | | 3,090 | | | | 4,325 | | |
U.S. Treasury Notes, | |
0.88%, 4/30/17 | | | 10,600 | | | | 10,752 | | |
1.75%, 7/31/15 | | | 3,200 | | | | 3,330 | | |
| | | | 30,433 | | |
Total Fixed Income Securities (Cost $215,705) | | | 226,583 | | |
| | | Shares | | | |
Short-Term Investments (13.6%) | |
Securities held as Collateral on Loaned Securities (4.1%) | |
Investment Company (3.0%) | |
Morgan Stanley Institutional Liquidity
Funds — Money Market Portfolio —
Institutional Class (See Note G) | | | 7,053,625 | | | | 7,054 | | |
| | | Face
Amount
(000) | | | |
Repurchase Agreements (1.1%) | |
Barclays Capital, Inc., (0.15%, dated 9/28/12,
due 10/1/12; proceeds $747; fully
collateralized by a U.S. Government
Obligation; U.S. Treasury Note 0.75%
due 6/30/17; valued at $761) | | $ | 747 | | | | 747 | | |
Merrill Lynch & Co., Inc., (0.15%, dated 9/28/12,
due 10/1/12; proceeds $275; fully
collateralized by a U.S. Government
Obligation; U.S. Treasury Note 1.75%
due 5/15/22; valued at $281) | | | 275 | | | | 275 | | |
The accompanying notes are an integral part of the financial statements.
13
Morgan Stanley Institutional Fund Trust
Annual Report — September 30, 2012
Portfolio of Investments (cont'd)
Core Plus Fixed Income Portfolio
| | | Face
Amount
(000) | | Value
(000) | |
Repurchase Agreements (cont'd) | |
Merrill Lynch & Co., Inc., (0.22%, dated 9/28/12,
due 10/1/12; proceeds $1,414; fully
collateralized by a U.S. Government Agency;
Federal National Mortgage Association 4.00%
due 4/1/42; valued at $1,443) | | $ | 1,414 | | | $ | 1,414 | | |
| | | | 2,436 | | |
Total Securities held as Collateral on
Loaned Securities (Cost $9,490) | | | 9,490 | | |
| | | Shares | | | |
Investment Company (5.8%) | |
Morgan Stanley Institutional Liquidity
Funds — Money Market Portfolio —
Institutional Class (See Note G)
(Cost $13,379) | | | 13,379,171 | | | | 13,379 | | |
| | | Face
Amount
(000) | | | |
U.S. Treasury Securities (3.7%) | |
U.S. Treasury Bills, | |
0.11%, 10/4/12 (e)(g) | | $ | 2,115 | | | | 2,115 | | |
0.13%, 11/29/12 - 12/13/12 (e)(g) | | | 6,500 | | | | 6,499 | | |
| | | 8,614 | | |
Total Short-Term Investments (Cost $31,482) | | | 31,483 | | |
Total Investments (111.6%) (Cost $247,187)
Including $9,308 of Securities Loaned (h) | | | 258,066 | | |
Liabilities in Excess of Other Assets (-11.6%) | | | (26,896 | ) | |
Net Assets (100.0%) | | $ | 231,170 | | |
(a) Security is subject to delayed delivery.
(b) 144A security — Certain conditions for public sale may exist. Unless otherwise noted, these securities are deemed to be liquid.
(c) Variable/Floating Rate Security — Interest rate changes on these instruments are based on changes in a designated base rate. The rates shown are those in effect on September 30, 2012.
(d) Inverse Floating Rate Security — Interest rate fluctuates with an inverse relationship to an associated interest rate. Indicated rate is the effective rate at September 30, 2012.
(e) All or a portion of this security was on loan at September 30, 2012.
(f) When-issued security.
(g) Rate shown is the yield to maturity at September 30, 2012.
(h) Securities are available for collateral in connection with purchase of when-issued securities, securities purchased on a forward commitment basis, open foreign currency exchange contracts, futures contracts and swap agreements.
@ Face Amount/Value is less than $500.
IO Interest Only.
MTN Medium Term Note.
PAC Planned Amortization Class.
REMIC Real Estate Mortgage Investment Conduit.
STRIPS Separate Trading of Registered Interest and Principal of Securities.
TBA To Be Announced.
Foreign Currency Exchange Contracts Information:
The Portfolio had the following foreign currency exchange contracts open at September 30, 2012:
Counterparty | | Currency to
Deliver
(000) | | Value
(000) | | Settlement
Date | | In Exchange
For
(000) | | Value
(000) | | Unrealized
Appreciation
(Depreciation)
(000) | |
JPMorgan Chase | | SEK | 10,425 | | | $ | 1,586 | | | 10/31/12 | | USD | 1,587 | | | $ | 1,587 | | | $ | 1 | | |
UBS AG | | AUD | 2,341 | | | | 2,422 | | | 10/31/12 | | USD | 2,437 | | | | 2,437 | | | | 15 | | |
UBS AG | | USD | 1,602 | | | | 1,602 | | | 10/31/12 | | NOK | 9,135 | | | | 1,593 | | | | (9 | ) | |
| | | | | $ | 5,610 | | | | | | | $ | 5,617 | | | $ | 7 | | |
Futures Contracts:
The Portfolio had the following futures contracts open at September 30, 2012:
| | | Number
of
Contracts | | Value
(000) | | Expiration
Date | | Unrealized
Appreciation
(Depreciation)
(000) | |
Long: | |
U.S. Treasury 2 yr. Note | | | 171 | | | $ | 37,711 | | | Dec-12 | | $ | 19 | | |
U.S. Treasury 5 yr. Note | | | 292 | | | | 36,393 | | | Dec-12 | | | 109 | | |
Short: | |
U.S. Treasury 10 yr. Note | | | 134 | | | | (17,887 | ) | | Dec-12 | | | (92 | ) | |
U.S. Treasury 30 yr. Bond | | | 23 | | | | (3,436 | ) | | Dec-12 | | | (38 | ) | |
Ultra Long U.S. Treasury Bond | | | 2 | | | | (330 | ) | | Dec-12 | | | (13 | ) | |
| | | | | | | | | $ | (15 | ) | |
The accompanying notes are an integral part of the financial statements.
14
Morgan Stanley Institutional Fund Trust
Annual Report — September 30, 2012
Portfolio of Investments (cont'd)
Core Plus Fixed Income Portfolio
Interest Rate Swap Agreements:
The Portfolio had the following interest rate swap agreements open at September 30, 2012:
Swap Counterparty | | Floating Rate
Index | | Pay/Receive
Floating Rate | | Fixed Rate | | Termination
Date | | Notional
Amount
(000) | | Unrealized
Appreciation
(Depreciation)
(000) | |
Barclays Capital | | 3 Month LIBOR | | Receive | | | 0.81 | % | | 9/24/17 | | $ | 4,730 | | | $ | (11 | ) | |
Credit Suisse | | 3 Month LIBOR | | Receive | | | 0.39 | | | 9/25/14 | | | 14,860 | | | | (10 | ) | |
Credit Suisse | | 3 Month LIBOR | | Receive | | | 0.82 | | | 9/13/17 | | | 7,520 | | | | (22 | ) | |
Deutsche Bank | | 3 Month LIBOR | | Receive | | | 0.82 | | | 7/24/17 | | | 12,735 | | | | (61 | ) | |
Goldman Sachs | | 3 Month CDOR | | Pay | | | 1.75 | | | 8/1/16 | | CAD | 25,600 | | | | 50 | | |
Goldman Sachs | | 3 Month LIBOR | | Receive | | | 0.83 | | | 8/3/16 | | $ | 25,080 | | | | (45 | ) | |
| | | | | | | | | | | | | | | $ | (99 | ) | |
CDOR Canadian Dealer Offered Rate.
LIBOR London Interbank Offered Rate.
AUD — Australian Dollar
CAD — Canadian Dollar
NOK — Norwegian Krone
SEK — Swedish Krona
USD — United States Dollar
The accompanying notes are an integral part of the financial statements.
15
Morgan Stanley Institutional Fund Trust
Annual Report — September 30, 2012
Core Plus Fixed Income Portfolio
Statement of Assets and Liabilities | | September 30, 2012
(000) | |
Assets: | |
Investments in Securities of Unaffiliated Issuers, at Value(1) (Cost $225,842) | | $ | 236,535 | | |
Investment in Securities of Affiliated Issuers, at Value (Cost $21,345) | | | 21,531 | | |
Total Investments in Securities, at Value (Cost $247,187) | | | 258,066 | | |
Foreign Currency, at Value (Cost $—@) | | | — | @ | |
Cash | | | 11 | | |
Receivable for Investments Sold | | | 5,874 | | |
Interest Receivable | | | 1,690 | | |
Receivable for Swap Agreement Termination | | | 282 | | |
Receivable for Variation Margin | | | 201 | | |
Receivable for Portfolio Shares Sold | | | 156 | | |
Unrealized Appreciation on Swap Agreements | | | 50 | | |
Receivable from Affiliates | | | 25 | | |
Unrealized Appreciation on Foreign Currency Exchange Contracts | | | 16 | | |
Other Assets | | | 23 | | |
Total Assets | | | 266,394 | | |
Liabilities: | |
Collateral on Securities Loaned, at Value | | | 9,500 | | |
Payable for Investments Purchased | | | 24,341 | | |
Payable for Portfolio Shares Redeemed | | | 437 | | |
Due to Broker | | | 252 | | |
Payable for Advisory Fees | | | 226 | | |
Unrealized Depreciation on Swap Agreements | | | 149 | | |
Payable for Sub Transfer Agency Fees | | | 101 | | |
Payable for Trustees' Fees and Expenses | | | 84 | | |
Payable for Professional Fees | | | 43 | | |
Payable for Administration Fees | | | 16 | | |
Payable for Custodian Fees | | | 13 | | |
Unrealized Depreciation on Foreign Currency Exchange Contracts | | | 9 | | |
Payable for Transfer Agent Fees | | | 3 | | |
Payable for Shareholder Services Fees — Class P | | | 1 | | |
Payable for Shareholder Services Fees — Class H | | | — | @ | |
Payable for Distribution and Shareholder Services Fees — Class L | | | — | @ | |
Other Liabilities | | | 49 | | |
Total Liabilities | | | 35,224 | | |
Net Assets | | $ | 231,170 | | |
Net Assets Consist Of: | |
Paid-in-Capital | | $ | 698,431 | | |
Undistributed Net Investment Income | | | 6,309 | | |
Accumulated Net Realized Loss | | | (484,342 | ) | |
Unrealized Appreciation (Depreciation) on: | |
Investments | | | 10,693 | | |
Investments in Affiliates | | | 186 | | |
Futures Contracts | | | (15 | ) | |
Swap Agreements | | | (99 | ) | |
Foreign Currency Exchange Contracts | | | 7 | | |
Foreign Currency Translations | | | (— | @) | |
Net Assets | | $ | 231,170 | | |
The accompanying notes are an integral part of the financial statements.
16
Morgan Stanley Institutional Fund Trust
Annual Report — September 30, 2012
Core Plus Fixed Income Portfolio
Statement of Assets and Liabilities | | September 30, 2012
(000) | |
CLASS I: | |
Net Assets | | $ | 227,331 | | |
| Shares Outstanding (unlimited number of shares authorized, no par value) (not in 000s) | | | 21,686,329 | | |
Net Asset Value, Offering and Redemption Price Per Share | | $ | 10.48 | | |
CLASS P: | |
Net Assets | | $ | 3,673 | | |
| Shares Outstanding (unlimited number of shares authorized, no par value) (not in 000s) | | | 349,823 | | |
Net Asset Value, Offering and Redemption Price Per Share | | $ | 10.50 | | |
CLASS H: | |
Net Assets | | $ | 36 | | |
| Shares Outstanding (unlimited number of shares authorized, no par value) (not in 000s) | | | 3,470 | | |
Net Asset Value, Redemption Price Per Share | | $ | 10.50 | | |
Maximum Sales Load | | | 3.50 | % | |
Maximum Sales Charge | | $ | 0.38 | | |
Maximum Offering Price Per Share | | $ | 10.88 | | |
CLASS L: | |
Net Assets | | $ | 130 | | |
| Shares Outstanding (unlimited number of shares authorized, no par value) (not in 000s) | | | 12,389 | | |
Net Asset Value, Offering and Redemption Price Per Share | | $ | 10.49 | | |
(1) Including:
Securities on Loan, at Value: | | $ | 9,308 | | |
@ Amount is less than $500.
The accompanying notes are an integral part of the financial statements.
17
Morgan Stanley Institutional Fund Trust
Annual Report — September 30, 2012
Core Plus Fixed Income Portfolio
Statement of Operations | | Year Ended
September 30, 2012
(000) | |
Investment Income: | |
Interest from Securities of Unaffiliated Issuers (Net of $2 Foreign Taxes Withheld) | | $ | 11,944 | | |
Interest from Securities of Affiliated Issuers | | | 109 | | |
Income from Securities Loaned — Net | | | 34 | | |
Dividends from Security of Affiliated Issuer | | | 20 | | |
Total Investment Income | | | 12,107 | | |
Expenses: | |
Advisory Fees (Note B) | | | 1,009 | | |
Administration Fees (Note C) | | | 215 | | |
Sub Transfer Agency Fees | | | 142 | | |
Custodian Fees (Note F) | | | 81 | | |
Professional Fees | | | 80 | | |
Registration Fees | | | 54 | | |
Pricing Fees | | | 47 | | |
Transfer Agency Fees (Note E) | | | 28 | | |
Shareholder Reporting Fees | | | 18 | | |
Shareholder Services Fees — Class P (Note D) | | | 10 | | |
Shareholder Services Fees — Class H (Note D) | | | — | @ | |
Distribution and Shareholder Services Fees — Class L (Note D) | | | — | @ | |
Trustees' Fees and Expenses | | | 9 | | |
Other Expenses | | | 13 | | |
Total Expenses | | | 1,706 | | |
Rebate from Morgan Stanley Affiliate (Note G) | | | (19 | ) | |
Expense Offset (Note F) | | | (— | @) | |
Net Expenses | | | 1,687 | | |
Net Investment Income | | | 10,420 | | |
Realized Gain (Loss): | |
Investments Sold | | | 2,040 | | |
Investments in Affiliates | | | 196 | | |
Foreign Currency Exchange Contracts | | | 132 | | |
Foreign Currency Transactions | | | 974 | | |
Futures Contracts | | | (106 | ) | |
Swap Agreements | | | (791 | ) | |
Net Realized Gain | | | 2,445 | | |
Change in Unrealized Appreciation (Depreciation): | |
Investments | | | 13,254 | | |
Investments in Affiliates | | | 207 | | |
Foreign Currency Exchange Contracts | | | (5 | ) | |
Foreign Currency Translations | | | (1 | ) | |
Futures Contracts | | | 51 | | |
Swap Agreements | | | 370 | | |
Net Change in Unrealized Appreciation (Depreciation) | | | 13,876 | | |
Net Realized Gain and Change in Unrealized Appreciation (Depreciation) | | | 16,321 | | |
Net Increase in Net Assets Resulting from Operations | | $ | 26,741 | | |
@ Amount is less than $500.
The accompanying notes are an integral part of the financial statements.
18
Morgan Stanley Institutional Fund Trust
Annual Report — September 30, 2012
Core Plus Fixed Income Portfolio
Statements of Changes in Net Assets | | Year Ended
September 30, 2012
(000) | | Year Ended
September 30, 2011
(000) | |
Increase (Decrease) in Net Assets: | |
Operations: | |
Net Investment Income | | $ | 10,420 | | | $ | 14,267 | | |
Net Realized Gain | | | 2,445 | | | | 20,947 | | |
Net Change in Unrealized Appreciation (Depreciation) | | | 13,876 | | | | (23,167 | ) | |
Net Increase in Net Assets Resulting from Operations | | | 26,741 | | | | 12,047 | | |
Distributions from and/or in Excess of: | |
Class I: | |
Net Investment Income | | | (12,432 | ) | | | (15,254 | ) | |
Investment Class: | |
Net Investment Income | | | — | | | | (898 | )* | |
Class P: | |
Net Investment Income | | | (181 | ) | | | (206 | ) | |
Class H: | |
Net Investment Income | | | (— | @)** | | | — | | |
Class L: | |
Net Investment Income | | | (— | @)** | | | — | | |
Total Distributions | | | (12,613 | ) | | | (16,358 | ) | |
Capital Share Transactions:(1) | |
Class I: | |
Subscribed | | | 26,881 | | | | 42,742 | | |
Distributions Reinvested | | | 12,404 | | | | 15,228 | | |
Conversion from Investment Class | | | — | | | | 94 | | |
Redeemed | | | (121,093 | ) | | | (193,906 | ) | |
Investment Class: | |
Conversion to Class I | | | — | | | | (94 | ) | |
Redeemed | | | — | | | | (92,182 | )* | |
Class P: | |
Subscribed | | | 1,208 | | | | 1,120 | | |
Distributions Reinvested | | | 181 | | | | 206 | | |
Redeemed | | | (2,580 | ) | | | (2,394 | ) | |
Class H: | |
Subscribed | | | 35 | ** | | | — | | |
Distributions Reinvested | | | — | @** | | | — | | |
Class L: | |
Subscribed | | | 135 | ** | | | — | | |
Distributions Reinvested | | | — | @** | | | — | | |
Redeemed | | | (9 | )** | | | — | | |
Net Decrease in Net Assets Resulting from Capital Share Transactions | | | (82,838 | ) | | | (229,186 | ) | |
Total Decrease in Net Assets | | | (68,710 | ) | | | (233,497 | ) | |
Net Assets: | |
Beginning of Period | | | 299,880 | | | | 533,377 | | |
End of Period (Including Undistributed Net Investment Income of $6,309 and $6,415) | | $ | 231,170 | | | $ | 299,880 | | |
The accompanying notes are an integral part of the financial statements.
19
Morgan Stanley Institutional Fund Trust
Annual Report — September 30, 2012
Core Plus Fixed Income Portfolio
Statements of Changes in Net Assets | | Year Ended
September 30, 2012
(000) | | Year Ended
September 30, 2011
(000) | |
(1) Capital Share Transactions: | |
Class I: | |
Shares Subscribed | | | 2,670 | | | | 4,346 | | |
Shares Issued on Distributions Reinvested | | | 1,248 | | | | 1,559 | | |
Conversion from Investment Class | | | — | | | | 10 | | |
Shares Redeemed | | | (11,980 | ) | | | (19,801 | ) | |
Net Decrease in Class I Shares Outstanding | | | (8,062 | ) | | | (13,886 | ) | |
Investment Class: | |
Conversion to Class I | | | — | | | | (9 | ) | |
Shares Redeemed | | | — | | | | (9,331 | )* | |
Net Decrease in Investment Class Shares Outstanding | | | — | | | | (9,340 | ) | |
Class P: | |
Shares Subscribed | | | 118 | | | | 114 | | |
Shares Issued on Distributions Reinvested | | | 18 | | | | 21 | | |
Shares Redeemed | | | (255 | ) | | | (242 | ) | |
Net Decrease in Class P Shares Outstanding | | | (119 | ) | | | (107 | ) | |
Class H: | |
Shares Subscribed | | | 3 | ** | | | — | | |
Shares Issued on Distributions Reinvested | | | — | @@** | | | — | | |
Net Increase in Class H Shares Outstanding | | | 3 | | | | — | | |
Class L: | |
Shares Subscribed | | | 13 | ** | | | — | | |
Shares Issued on Distributions Reinvested | | | — | @@** | | | — | | |
Shares Redeemed | | | (1 | )** | | | — | | |
Net Increase in Class L Shares Outstanding | | | 12 | | | | — | | |
@ Amount is less than $500.
@@ Amount is less than 500 shares.
* For the period October 1, 2010 through March 14, 2011.
** For the period April 27, 2012 through September 30, 2012.
The accompanying notes are an integral part of the financial statements.
20
Morgan Stanley Institutional Fund Trust
Annual Report — September 30, 2012
Financial Highlights
Core Plus Fixed Income Portfolio
| | | Class I | |
| | | Year Ended September 30, | |
Selected Per Share Data and Ratios | | 2012 | | 2011 | | 2010 | | 2009 | | 2008 | |
Net Asset Value, Beginning of Period | | $ | 9.92 | | | $ | 9.96 | | | $ | 9.41 | | | $ | 9.41 | | | $ | 11.40 | | |
Income (Loss) from Investment Operations: | |
Net Investment Income† | | | 0.39 | | | | 0.38 | | | | 0.34 | | | | 0.41 | | | | 0.66 | | |
Net Realized and Unrealized Gain (Loss) | | | 0.63 | | | | (0.02 | ) | | | 0.57 | | | | 0.27 | | | | (2.10 | ) | |
Total from Investment Operations | | | 1.02 | | | | 0.36 | | | | 0.91 | | | | 0.68 | | | | (1.44 | ) | |
Distributions from and/or in Excess of: | |
Net Investment Income | | | (0.46 | ) | | | (0.40 | ) | | | (0.36 | ) | | | (0.68 | ) | | | (0.55 | ) | |
Redemption Fees | | | — | | | | — | | | | — | | | | 0.00 | ‡ | | | 0.00 | ‡ | |
Net Asset Value, End of Period | | $ | 10.48 | | | $ | 9.92 | | | $ | 9.96 | | | $ | 9.41 | | | $ | 9.41 | | |
Total Return++ | | | 10.62 | % | | | 3.74 | % | | | 10.02 | % | | | 7.56 | % | | | (13.07 | )% | |
Ratios and Supplemental Data: | |
Net Assets, End of Period (Thousands) | | $ | 227,331 | | | $ | 295,226 | | | $ | 434,657 | | | $ | 797,788 | | | $ | 1,210,286 | | |
Ratio of Expenses to Average Net Assets (1) | | | 0.62 | %+ | | | 0.66 | %+†† | | | 0.51 | %+†† | | | 0.49 | %+ | | | 0.45 | %+ | |
Ratio of Net Investment Income to Average Net Assets (1) | | | 3.88 | %+ | | | 3.88 | %+†† | | | 3.53 | %+†† | | | 4.56 | %+ | | | 6.13 | %+ | |
Ratio of Rebate from Morgan Stanley Affiliates to Average Net Assets | | | 0.01 | % | | | 0.00 | %§ | | | 0.01 | % | | | 0.00 | %§ | | | 0.01 | % | |
Portfolio Turnover Rate | | | 189 | % | | | 225 | % | | | 270 | % | | | 402 | % | | | 320 | % | |
(1) Supplemental Information on the Ratios to Average Net Assets: | |
Ratios Before Expense Limitation: | |
Expenses to Average Net Assets | | | N/A | | | | N/A | | | | N/A | | | | 0.50 | %+ | | | 0.45 | %+ | |
Net Investment Income to Average Net Assets | | | N/A | | | | N/A | | | | N/A | | | | 4.55 | %+ | | | 6.13 | %+ | |
† Per share amount is based on average shares outstanding.
‡ Amount is less than $0.005 per share.
++ Calculated based on the net asset value as of the last business day of the period.
+ The Ratios of Expenses and Net Investment Income reflect the rebate of certain Portfolio expenses in connection with the investments in Morgan Stanley affiliates during the period. The effect of the rebate on the ratios is disclosed in the above table as "Ratio of Rebate from Morgan Stanley Affiliates to Average Net Assets."
†† Reflects overall Portfolio ratios for investment income and non-class specific expenses.
§ Amount is less than 0.005%.
The accompanying notes are an integral part of the financial statements.
21
Morgan Stanley Institutional Fund Trust
Annual Report — September 30, 2012
Financial Highlights
Core Plus Fixed Income Portfolio
| | | Class P | |
| | | Year Ended September 30, | |
Selected Per Share Data and Ratios | | 2012 | | 2011 | | 2010 | | 2009 | | 2008 | |
Net Asset Value, Beginning of Period | | $ | 9.94 | | | $ | 9.97 | | | $ | 9.40 | | | $ | 9.40 | | | $ | 11.38 | | |
Income (Loss) from Investment Operations: | |
Net Investment Income† | | | 0.37 | | | | 0.36 | | | | 0.31 | | | | 0.41 | | | | 0.63 | | |
Net Realized and Unrealized Gain (Loss) | | | 0.62 | | | | (0.02 | ) | | | 0.57 | | | | 0.24 | | | | (2.09 | ) | |
Total from Investment Operations | | | 0.99 | | | | 0.34 | | | | 0.88 | | | | 0.65 | | | | (1.46 | ) | |
Distributions from and/or in Excess of: | |
Net Investment Income | | | (0.43 | ) | | | (0.37 | ) | | | (0.31 | ) | | | (0.65 | ) | | | (0.52 | ) | |
Redemption Fees | | | — | | | | — | | | | — | | | | 0.00 | ‡ | | | 0.00 | ‡ | |
Net Asset Value, End of Period | | $ | 10.50 | | | $ | 9.94 | | | $ | 9.97 | | | $ | 9.40 | | | $ | 9.40 | | |
Total Return++ | | | 10.31 | % | | | 3.57 | % | | | 9.73 | % | | | 7.26 | % | | | (13.23 | )% | |
Ratios and Supplemental Data: | |
Net Assets, End of Period (Thousands) | | $ | 3,673 | | | $ | 4,654 | | | $ | 5,732 | | | $ | 6,442 | | | $ | 97,823 | | |
Ratio of Expenses to Average Net Assets (1) | | | 0.87 | %+ | | | 0.91 | %+†† | | | 0.76 | %+†† | | | 0.73 | %+ | | | 0.70 | %+ | |
Ratio of Net Investment Income to Average Net Assets (1) | | | 3.63 | %+ | | | 3.63 | %+†† | | | 3.28 | %+†† | | | 4.56 | %+ | | | 5.87 | %+ | |
Ratio of Rebate from Morgan Stanley Affiliates to Average Net Assets | | | 0.01 | % | | | 0.00 | %§ | | | 0.01 | % | | | 0.00 | %§ | | | 0.01 | % | |
Portfolio Turnover Rate | | | 189 | % | | | 225 | % | | | 270 | % | | | 402 | % | | | 320 | % | |
(1) Supplemental Information on the Ratios to Average Net Assets: | |
Ratios Before Expense Limitation: | |
Expenses to Average Net Assets | | | N/A | | | | N/A | | | | N/A | | | | N/A | | | | 0.70 | %+ | |
Net Investment Income to Average Net Assets | | | N/A | | | | N/A | | | | N/A | | | | N/A | | | | 5.87 | %+ | |
† Per share amount is based on average shares outstanding.
‡ Amount is less than $0.005 per share.
++ Calculated based on the net asset value as of the last business day of the period.
+ The Ratios of Expenses and Net Investment Income reflect the rebate of certain Portfolio expenses in connection with the investments in Morgan Stanley affiliates during the period. The effect of the rebate on the ratios is disclosed in the above table as "Ratio of Rebate from Morgan Stanley Affiliates to Average Net Assets."
†† Reflects overall Portfolio ratios for investment income and non-class specific expenses.
§ Amount is less than 0.005%.
The accompanying notes are an integral part of the financial statements.
22
Morgan Stanley Institutional Fund Trust
Annual Report — September 30, 2012
Financial Highlights
Core Plus Fixed Income Portfolio
| | | Class H | |
Selected Per Share Data and Ratios | | Period from
April 27, 2012^ to
September 30, 2012 | |
Net Asset Value, Beginning of Period | | $ | 10.14 | | |
Income from Investment Operations: | |
Net Investment Income† | | | 0.13 | | |
Net Realized and Unrealized Gain | | | 0.35 | | |
Total from Investment Operations | | | 0.48 | | |
Distributions from and/or in Excess of: | |
Net Investment Income | | | (0.12 | ) | |
Net Asset Value, End of Period | | $ | 10.50 | | |
Total Return++ | | | 4.74 | %# | |
Ratios and Supplemental Data: | |
Net Assets, End of Period (Thousands) | | $ | 36 | | |
Ratio of Expenses to Average Net Assets | | | 0.90 | %+* | |
Ratio of Net Investment Income to Average Net Assets | | | 3.02 | %+* | |
Rebate from Morgan Stanley Affiliates to Average Net Assets | | | 0.01 | %* | |
Portfolio Turnover Rate | | | 189 | %# | |
^ Commencement of Operations.
† Per share amount is based on average shares outstanding.
++ Calculated based on the net asset value which does not reflect sales charges, if applicable, as of the last business day of the period.
+ The Ratios of Expenses and Net Investment Income reflect the rebate of certain Portfolio expenses in connection with the investments in Morgan Stanley affiliates during the period. The effect of the rebate on the ratios is disclosed in the above table as "Ratio of Rebate from Morgan Stanley Affiliates to Average Net Assets."
# Not Annualized.
* Annualized.
The accompanying notes are an integral part of the financial statements.
23
Morgan Stanley Institutional Fund Trust
Annual Report — September 30, 2012
Financial Highlights
Core Plus Fixed Income Portfolio
| | | Class L | |
Selected Per Share Data and Ratios | | Period from
April 27, 2012^ to
September 30, 2012 | |
Net Asset Value, Beginning of Period | | $ | 10.14 | | |
Income from Investment Operations: | |
Net Investment Income† | | | 0.11 | | |
Net Realized and Unrealized Gain | | | 0.35 | | |
Total from Investment Operations | | | 0.46 | | |
Distributions from and/or in Excess of: | |
Net Investment Income | | | (0.11 | ) | |
Net Asset Value, End of Period | | $ | 10.49 | | |
Total Return++ | | | 4.59 | %# | |
Ratios and Supplemental Data: | |
Net Assets, End of Period (Thousands) | | $ | 130 | | |
Ratio of Expenses to Average Net Assets | | | 1.16 | %+* | |
Ratio of Net Investment Income to Average Net Assets | | | 2.60 | %+* | |
Rebate from Morgan Stanley Affiliates to Average Net Assets | | | 0.01 | %* | |
Portfolio Turnover Rate | | | 189 | %# | |
^ Commencement of Operations.
† Per share amount is based on average shares outstanding.
++ Calculated based on the net asset value as of the last business day of the period.
+ The Ratios of Expenses and Net Investment Income reflect the rebate of certain Portfolio expenses in connection with the investments in Morgan Stanley affiliates during the period. The effect of the rebate on the ratios is disclosed in the above table as "Ratio of Rebate from Morgan Stanley Affiliates to Average Net Assets."
# Not Annualized.
* Annualized.
The accompanying notes are an integral part of the financial statements.
24
Morgan Stanley Institutional Fund Trust
Annual Report — September 30, 2012
Notes to Financial Statements
Morgan Stanley Institutional Fund Trust ("MSIFT" or the "Fund") is registered under the Investment Company Act of 1940, as amended (the "Act"), as an open-end management investment company. The Fund is comprised of seven separate, active portfolios (individually referred to as a "Portfolio", collectively as the "Portfolios"). All Portfolios are considered diversified for purposes of the Act.
The accompanying financial statements relate to the Core Plus Fixed Income Portfolio. The Portfolio seeks above-average total return over a market cycle of three to five years. The Portfolio offers four classes of shares — Class I, Class P, Class H and Class L.
A. Significant Accounting Policies: The following significant accounting policies are in conformity with U.S. generally accepted accounting principles ("GAAP"). Such policies are consistently followed by the Fund in the preparation of its financial statements. GAAP may require management to make estimates and assumptions that affect the reported amounts and disclosures in the financial statements. Actual results may differ from those estimates.
1. Security Valuation: Bonds and other fixed income securities may be valued according to the broadest and most representative market. In addition, bonds and other fixed income securities may be valued on the basis of prices provided by a pricing service. The prices provided by a pricing service take into account broker-dealer market price quotations for institutional size trading in similar groups of securities, security quality, maturity, coupon and other security characteristics as well as any developments related to the specific securities. Short-term debt securities purchased with remaining maturities of 60 days or less are valued at amortized cost, unless the Board of Trustees (the "Trustees") determines such valuation does not reflect the securities' fair value, in which case these securities will be valued at their fair value as determined in good faith under procedures adopted by the Trustees. Equity securities listed on a U.S. exchange are valued at the latest quoted sales price on the valuation date. Equity securities listed or traded on NASDAQ, for which market quotations are available, are valued at the NASDAQ Official Closing Price. Securities listed on a foreign exchange are valued at their closing price, except as noted below. Unlisted and listed equity securities not traded on the valuation date, for which market quotations are readily available, are valued at the mean between the last reported bid and asked prices obtained from reputable brokers.
Under procedures approved by the Trustees, the Fund's adviser, Morgan Stanley Investment Management Inc. (the "Adviser"), has formed a Valuation Committee. The Valuation Committee provides administration and oversight of the Fund's valuation policies and procedures, which are reviewed at least annually by the Trustees. Among other things, these procedures allow the Fund to utilize independent pricing services, quotations from securities and financial instrument dealers, and other market sources to determine fair value.
The Fund has procedures to determine the fair value of securities and other financial instruments for which market prices are not readily available. Under these procedures, the Valuation Committee convenes on a regular and adhoc basis to review such securities and considers a number of factors, including valuation methodologies and significant unobservable valuation inputs, when arriving at fair value. The Valuation Committee may employ a market-based approach which may use related or comparable assets or liabilities, recent transactions, market multiples, book values, and other relevant information for the investment to determine the fair value of the investment. An income-based valuation approach may also be used in which the anticipated future cash flows of the investment are discounted to calculate fair value. Discounts may also be applied due to the nature or duration of any restrictions on the disposition of the investments. Due to the inherent uncertainty of valuations of such investments, the fair values may differ significantly from the values that would have been used had an active market existed. The Valuation Committee employs various methods for calibrating these valuation approaches including a regular review of valuation methodologies, key inputs and assumptions, transactional back-testing or disposition analysis, and reviews of any related market activity.
Most foreign markets close before the New York Stock Exchange ("NYSE"). Occasionally, developments that could affect the closing prices of securities and other assets may occur between the times at which valuations of such securities are determined (that is, close of the foreign market on which the securities trade) and the close of business on the NYSE. If these developments are expected to materially affect the value of the securities, the valuations may be adjusted to reflect the estimated fair
25
Morgan Stanley Institutional Fund Trust
Annual Report — September 30, 2012
Notes to Financial Statements (cont'd)
value as of the close of the NYSE, as determined in good faith under procedures established by the Trustees.
2. Fair Value Measurement: Financial Accounting Standards Board ("FASB") Accounting Standards CodificationTM ("ASC") 820, "Fair Value Measurements and Disclosures" ("ASC 820"), defines fair value as the value that the Fund would receive to sell an investment or pay to transfer a liability in a timely transaction with an independent buyer in the principal market, or in the absence of a principal market the most advantageous market for the investment or liability. ASC 820 establishes a three-tier hierarchy to distinguish between (1) inputs that reflect the assumptions market participants would use in valuing an asset or liability developed based on market data obtained from sources independent of the reporting entity (observable inputs) and (2) inputs that reflect the reporting entity's own assumptions about the assumptions market participants would use in valuing an asset or liability developed based on the best information available in the circumstances (unobservable inputs) and to establish classification of fair value measurements for disclosure purposes. Various inputs are used in determining the value of the Fund's investments. The inputs are summarized in the three broad levels listed below.
• Level 1 – unadjusted quoted prices in active markets for identical investments
• Level 2 – other significant observable inputs (including quoted prices for similar investments, interest rates, prepayment speeds, credit risk, etc.)
• Level 3 – significant unobservable inputs including the Fund's own assumptions in determining the fair value of investments. Factors considered in making this determination may include, but are not limited to, information obtained by contacting the issuer, analysts, or the appropriate stock exchange (for exchange-traded securities), analysis of the issuer's financial statements or other available documents and, if necessary, available information concerning other securities in similar circumstances
The inputs or methodology used for valuing securities are not necessarily an indication of the risk associated with investing in those securities and the determination
of the significance of a particular input to the fair value measurement in its entirety requires judgment and considers factors specific to each security.
The following is a summary of the inputs used to value the Portfolio's investments as of September 30, 2012.
Investment Type | | Level 1
Unadjusted
quoted
prices
(000) | | Level 2
Other
significant
observable
inputs
(000) | | Level 3
Significant
unobservable
inputs
(000) | | Total
(000) | |
Assets: | |
Fixed Income Securities | |
Agency Adjustable Rate
Mortgages | | $ | — | | | $ | 1,855 | | | $ | — | | | $ | 1,855 | | |
Agency Fixed Rate
Mortgages | | | — | | | | 68,368 | | | | — | | | | 68,368 | | |
Asset-Backed Securities | | | — | | | | 4,151 | | | | — | | | | 4,151 | | |
Collateralized Mortgage
Obligations — Agency
Collateral Series | | | — | | | | 10,912 | | | | — | | | | 10,912 | | |
Commercial Mortgage
Backed Securities | | | — | | | | 3,188 | | | | — | | | | 3,188 | | |
Corporate Bonds | | | — | | | | 78,374 | | | | — | | | | 78,374 | | |
Mortgages — Other | | | — | | | | 13,532 | | | | — | | | | 13,532 | | |
Municipal Bonds | | | — | | | | 3,345 | | | | — | | | | 3,345 | | |
Sovereign | | | — | | | | 7,603 | | | | — | | | | 7,603 | | |
U.S. Agency Securities | | | — | | | | 4,822 | | | | — | | | | 4,822 | | |
U.S. Treasury Securities | | | — | | | | 30,433 | | | | — | | | | 30,433 | | |
Total Fixed Income
Securities | | | — | | | | 226,583 | | | | — | | | | 226,583 | | |
Short-Term Investments | |
Investment Company | | | 20,433 | | | | — | | | | — | | | | 20,433 | | |
Repurchase Agreements | | | — | | | | 2,436 | | | | — | | | | 2,436 | | |
U.S. Treasury Securities | | | — | | | | 8,614 | | | | — | | | | 8,614 | | |
Total Short-Term
Investments | | | 20,433 | | | | 11,050 | | | | — | | | | 31,483 | | |
Foreign Currency
Exchange Contracts | | | — | | | | 16 | | | | — | | | | 16 | | |
Futures Contracts | | | 128 | | | | — | | | | — | | | | 128 | | |
Interest Rate Swap
Agreements | | | — | | | | 50 | | | | — | | | | 50 | | |
Total Assets | | | 20,561 | | | | 237,699 | | | | — | | | | 258,260 | | |
Liabilities: | |
Foreign Currency
Exchange Contracts | | | — | | | | (9 | ) | | | — | | | | (9 | ) | |
Futures Contracts | | | (143 | ) | | | — | | | | — | | | | (143 | ) | |
Interest Rate Swap
Agreements | | | — | | | | (149 | ) | | | — | | | | (149 | ) | |
Total Liabilities | | | (143 | ) | | | (158 | ) | | | — | | | | (301 | ) | |
Total | | $ | 20,418 | | | $ | 237,541 | | | $ | — | | | $ | 257,959 | | |
Transfers between investment levels may occur as the markets fluctuate and/or the availability of data used in an investment's valuation changes. The Portfolio recognizes transfers between the levels as of the end of the period. As of September 30, 2012, the Portfolio did not have any investments transfer between investment levels.
26
Morgan Stanley Institutional Fund Trust
Annual Report — September 30, 2012
Notes to Financial Statements (cont'd)
3. Foreign Currency Translation and Foreign Investments: The books and records of the Fund are maintained in U.S. dollars. Foreign currency amounts are translated into U.S. dollars at the mean of the bid and ask prices of such currencies against U.S. dollars last quoted by a major bank as follows:
– investments, other assets and liabilities at the prevailing rate of exchange on the valuation date;
– investment transactions and investment income at the prevailing rates of exchange on the dates of such transactions.
Although the net assets of the Fund are presented at the foreign exchange rates and market values at the close of the period, the Fund does not isolate that portion of the results of operations arising as a result of changes in the foreign exchange rates from the fluctuations arising from changes in the market prices of securities held at period end. Similarly, the Fund does not isolate the effect of changes in foreign exchange rates from the fluctuations arising from changes in the market prices of securities sold during the period. Accordingly, realized and unrealized foreign currency gains (losses) on investments in securities are included in the reported net realized and unrealized gains (losses) on investment transactions and balances. However, pursuant to U.S. Federal income tax regulations, gains and losses from certain foreign currency transactions and the foreign currency portion of gains and losses realized on sales and maturities of foreign denominated debt securities are treated as ordinary income for U.S. Federal income tax purposes.
Net realized gains (losses) on foreign currency transactions represent net foreign exchange gains (losses) from foreign currency exchange contracts, disposition of foreign currencies, currency gains (losses) realized between the trade and settlement dates on securities transactions, and the difference between the amount of investment income and foreign withholding taxes recorded on the Fund's books and the U.S. dollar equivalent amounts actually received or paid. Net unrealized currency gains (losses) from valuing foreign currency denominated assets and liabilities at period end exchange rates are reflected as a component of unrealized appreciation (depreciation) on the Statement of Assets and Liabilities. The change in unrealized currency gains (losses) on
foreign currency translations for the period is reflected in the Statement of Operations.
Foreign security and currency transactions may involve certain considerations and risks not typically associated with those of U.S. dollar denominated transactions as a result of, among other factors, fluctuations of exchange rates in relation to the U.S. dollar, the possibility of lower levels of governmental supervision and regulation of foreign securities markets and the possibility of political or economic instability.
The net assets of the Portfolio include foreign denominated securities and currency. Changes in currency exchange rates will affect the U.S. Dollar value of and investment income from such securities. Further, at times the Portfolio's investments are concentrated in a limited number of countries and regions. This concentration may further increase the risk of the Portfolio.
Governmental approval for foreign investments may be required in advance of making an investment under certain circumstances in some countries, and the extent of foreign investments in domestic companies may be subject to limitation in other countries. Foreign ownership limitations also may be imposed by the charters of individual companies to prevent, among other concerns, violations of foreign investment limitations. As a result, an additional class of shares (identified as "Foreign" in the Portfolio of Investments) may be created and offered for investment. The "local" and "foreign shares" market values may differ. In the absence of trading of the foreign shares in such markets, the Fund values the foreign shares at the closing exchange price of the local shares. Such securities, if any, are identified as fair valued in the Portfolio of Investments.
4. Derivatives: The Portfolio may, but is not required to, use derivative instruments for a variety of purposes, including hedging, risk management, portfolio management or to earn income. Derivatives are financial instruments whose value is based on the value of an underlying asset, interest rate, index or financial instrument. A derivative instrument often has risks similar to its underlying asset and may have additional risks, including imperfect correlation between the value of the derivative and the underlying asset, risks of default by the counterparty to certain transactions, magnification of losses incurred due to changes in the market value of the securities, instruments, indices or interest rates
27
Morgan Stanley Institutional Fund Trust
Annual Report — September 30, 2012
Notes to Financial Statements (cont'd)
to which they relate, and risks that the transactions may not be liquid. The use of derivatives involves risks that are different from, and possibly greater than, the risks associated with other portfolio investments. Derivatives may involve the use of highly specialized instruments that require investment techniques and risk analyses different from those associated with other portfolio investments. All of the Portfolio's holdings, including derivative instruments, are marked-to-market each day with the change in value reflected in unrealized appreciation (depreciation). Upon disposition, a realized gain or loss is recognized.
Certain derivative transactions may give rise to a form of leverage. Leverage magnifies the potential for gain and risk for loss. Leverage associated with derivative transactions may cause the Portfolio to liquidate portfolio positions when it may not be advantageous to do so to satisfy its obligations or to meet earmarking or segregation requirements, pursuant to applicable Securities and Exchange Commission rules and regulations, or may cause the Portfolio to be more volatile than if the Portfolio had not been leveraged. Although the Adviser seeks to use derivatives to further the Portfolio's investment objectives, there is no assurance that the use of derivatives will achieve this result.
Following is a description of the derivative instruments and techniques that the Portfolio used during the period and their associated risks:
Futures: A futures contract is a standardized agreement between two parties to buy or sell a specific quantity of an underlying instrument at a specific price at a specific future time. The value of a futures contract tends to increase and decrease in tandem with the value of the underlying instrument. Depending on the terms of the particular contract, futures contracts are settled through either physical delivery of the underlying instrument on the settlement date or by payment of a cash settlement amount on the settlement date. During the period the futures contract is open, payments are received from or made to the broker based upon changes in the value of the contract (the variation margin). A decision as to whether, when and how to use futures involves the exercise of skill and judgment and even a well conceived futures transaction may be unsuccessful because of market behavior or unexpected events. In addition to the derivatives risks discussed above, the prices of futures can be highly volatile, using futures can lower total return, and
the potential loss from futures can exceed the Portfolio's initial investment in such contracts.
Swaps: An over-the-counter ("OTC") swap agreement is an agreement between two parties pursuant to which the parties exchange payments at specified dates on the basis of a specified notional amount, with the payments calculated by reference to specified securities, indexes, reference rates, currencies or other instruments. A small percentage of swap agreements are cleared through a central clearing house. Most swap agreements provide that when the period payment dates for both parties are the same, the payments are made on a net basis (i.e., the two payment streams are netted out, with only the net amount paid by one party to the other). The Portfolio's obligations or rights under a swap agreement entered into on a net basis will generally be equal only to the net amount to be paid or received under the agreement, based on the relative values of the positions held by each counterparty. Most swap agreements are not entered into or traded on exchanges and there is no central clearing or guaranty function for swaps. These OTC swaps are often subject to credit risk or the risk of default or non-performance by the counterparty. Swaps could result in losses if interest rate or foreign currency exchange rates or credit quality changes are not correctly anticipated by the Portfolio or if the reference index, security or investments do not perform as expected.
When the Portfolio has an unrealized loss on a swap agreement, the Portfolio has instructed the custodian to pledge cash or liquid securities as collateral with a value approximately equal to the amount of the unrealized loss. Collateral pledges are monitored and subsequently adjusted if and when the swap valuations fluctuate. Cash collateral is included with "Due from (to) Broker" in the Statement of Assets and Liabilities. Cash collateral has been offset against open swap agreements under the provisions of FASB ASC 210 "Balance Sheet" ("ASC 210"). Offsetting of Amounts Related to Certain Contracts, an interpretation of ASC 210-20, are included within "Unrealized Appreciation (Depreciation) on Swap Agreements" in the Statement of Assets and Liabilities. For cash collateral received, the Portfolio pays a monthly fee to the counterparty based on the effective rate for Federal Funds. This fee, when paid, is included within realized gain (loss) on swap agreements in the Statement of Operations.
28
Morgan Stanley Institutional Fund Trust
Annual Report — September 30, 2012
Notes to Financial Statements (cont'd)
Foreign Currency Exchange Contracts: In connection with its investments in foreign securities, the Portfolio also entered into contracts with banks, brokers or dealers to purchase or sell securities or foreign currencies at a future date. A foreign currency exchange contract ("currency contracts") is a negotiated agreement between two parties to exchange specified amounts of two or more currencies at a specified future time at a specified rate. The rate specified by the currency contract can be higher or lower than the spot rate between the currencies that are the subject of the contract. Currency contracts may be used to protect against uncertainty in the level of future foreign currency exchange rates or to gain or modify exposure to a particular currency. Hedging the Portfolio's currency risks involves the risk of mismatching the Portfolio's objectives under a currency contract with the value of securities denominated in a particular currency. Furthermore, such transactions reduce or preclude the opportunity for gain if the value of the currency should move in the direction opposite to the position taken. There is an additional risk to the effect that currency contracts create exposure to currencies in which the Portfolio's securities are not denominated. Unanticipated changes in currency prices may result in poorer overall performance for the Portfolio than if it had not entered into such currency contracts. The use of currency contracts involves the risk of loss from the insolvency or bankruptcy of the counterparty to the contract or the failure of the counterparty to make payments or otherwise comply with the terms of the contract. A currency contract is marked-to-market daily and the change in market value is recorded by the Portfolio as unrealized gain or (loss). The Portfolio records realized gains (losses) when the currency contract is closed equal to the difference between the value of the currency contract at the time it was opened and the value at the time it was closed.
FASB ASC 815, "Derivatives and Hedging: Overall" ("ASC 815"), is intended to improve financial reporting about derivative instruments by requiring enhanced disclosures to enable investors to better understand how and why the Portfolio uses derivative instruments, how these derivative instruments are accounted for and their effects on the Portfolio's financial position and results of operations.
The following table sets forth the fair value of the Portfolio's derivative contracts by primary risk exposure as of September 30, 2012.
Primary Risk Exposure | | Statement of
Assets and
Liabilities | | Foreign
Currency
Exchange
Contracts
(000) | | Futures
Contracts
(000)(a) | | Swap
Agreements
(000) | |
Assets: | |
Currency Risk | | Receivables | | $ | 16 | | | $ | — | | | $ | — | | |
Interest Rate Risk | | Receivables | | | — | | | | 128 | | | | 50 | | |
Total Receivables | | | | $ | 16 | | | $ | 128 | | | $ | 50 | | |
Liabilities: | |
Currency Risk | | Payables | | $ | 9 | | | $ | — | | | $ | — | | |
Interest Rate Risk | | Payables | | | — | | | | 143 | | | | 149 | | |
Total Payables | | | | $ | 9 | | | $ | 143 | | | $ | 149 | | |
(a) This amount represents the cumulative appreciation (depreciation) of futures contracts as reported in the Portfolio of Investments. The Statement of Assets and Liabilities only reflects the current day's net variation margin.
The following tables set forth by primary risk exposure the Portfolio's realized gains (losses) and change in unrealized appreciation (depreciation) by type of derivative contract for the year ended September 30, 2012 in accordance with ASC 815.
Realized Gain (Loss) | |
Primary Risk Exposure | | Derivative Type | | Value
(000) | |
Currency Risk | | Foreign Currency
Exchange Contracts | | $ | 132 | | |
Interest Rate Risk | | Futures Contracts | | | (106 | ) | |
Interest Rate Risk | | Swap Agreements | | | (791 | ) | |
Total | | | | $ | (765 | ) | |
Change in Unrealized Appreciation (Depreciation) | |
Primary Risk Exposure | | Derivative Type | | Value
(000) | |
Currency Risk | | Foreign Currency
Exchange Contracts | | $ | (5 | ) | |
Interest Rate Risk | | Futures Contracts | | | 51 | | |
Interest Rate Risk | | Swap Agreements | | | 370 | | |
Total | | | | $ | 416 | | |
For the year ended September 30, 2012, the average monthly principal amount of foreign currency exchange contracts was approximately $11,394,000, the average monthly original value of futures contracts was approximately $73,870,000 and the average monthly notional amount of swap agreements was approximately $184,826,000.
5. Securities Lending: The Portfolio lends securities to qualified financial institutions, such as broker-dealers, to earn additional income. Any increase or decrease in the fair value of the securities loaned that might occur and any interest earned or dividends declared on those securities
29
Morgan Stanley Institutional Fund Trust
Annual Report — September 30, 2012
Notes to Financial Statements (cont'd)
during the term of the loan would remain in the Portfolio. The Portfolio would receive cash or securities as collateral in an amount equal to or exceeding 100% of the current fair value of the loaned securities. The collateral is marked-to-market daily, by the securities lending agent, to ensure that a minimum of 100% collateral coverage is maintained.
Based on pre-established guidelines, the securities lending agent invests any cash collateral that is received in an affiliated money market portfolio and repurchase agreements. Securities lending income is generated from the earnings on the invested collateral and borrowing fees, less any rebates owed to the borrowers and compensation to the lending agent, and is recorded as "Income from Securities Loaned-Net" in the Portfolio's Statement of Operations. Risks in securities lending transactions are that a borrower may not provide additional collateral when required or return the securities when due, and that the value of the short-term investments will be less than the amount of cash collateral plus any rebate that is required to be returned to the borrower.
The value of loaned securities and related collateral outstanding at September 30, 2012 were approximately $9,308,000 and $9,500,000, respectively. The Portfolio received cash collateral of approximately $9,500,000, of which, approximately $9,490,000 was subsequently invested in Repurchase Agreements and Morgan Stanley Institutional Liquidity Funds as reported in the Portfolio of Investments. At September 30, 2012, there was uninvested cash collateral of approximately $10,000, which is not reflected in the Portfolio of Investments. The Portfolio has the right under the lending agreement to recover the securities from the borrower on demand.
6. When-Issued/Delayed Delivery Securities: The Portfolio purchases and sells when-issued and delayed delivery securities. Securities purchased on a when-issued or delayed delivery basis are purchased for delivery beyond the normal settlement date at a stated price and yield, and no income accrues to the Portfolio on such securities prior to delivery date. Payment and delivery for when-issued and delayed delivery securities can take place up to 120 days after the date of the transaction. When the Portfolio enters into a purchase transaction on a when-issued or delayed delivery basis, securities are available for collateral in an amount at least equal in value to the Portfolio's commitments to purchase such securities. Purchasing securities on a when-issued or delayed delivery basis may involve a risk
that the market price at the time of delivery may be lower than the agreed upon purchase price, in which case there could be an unrealized loss at the time of delivery. Purchasing investments on a when-issued or delayed delivery basis may be considered a form of leverage which may increase the impact that gains (losses) may have on the Portfolio.
7. Indemnifications: The Fund enters into contracts that contain a variety of indemnifications. The Fund's maximum exposure under these arrangements is unknown. However, the Fund has not had prior claims or losses pursuant to these contracts and expects the risk of loss to be remote.
8. Other: Security transactions are accounted for on the date the securities are purchased or sold. Realized gains (losses) on the sale of investment securities are determined on the specific identified cost basis. Dividend income and distributions are recorded on the ex-dividend date (except for certain foreign dividends which may be recorded as soon as the Fund is informed of such dividends) net of applicable withholding taxes. Interest income is recognized on the accrual basis except where collection is in doubt. Discounts and premiums on securities purchased are amortized according to the effective yield method over their respective lives. Most expenses of the Fund can be directly attributed to a particular Portfolio. Expenses which cannot be directly attributed are apportioned among the Portfolios based upon relative net assets or other appropriate measures. Income, expenses (other than class specific expenses) and realized and unrealized gains or losses are allocated to each class of shares based upon their relative net assets.
B. Advisory Fees: The Adviser, a wholly-owned subsidiary of Morgan Stanley, provides the Portfolio with advisory services under the terms of an Investment Advisory Agreement, paid quarterly, at the annual rate based on the average daily net assets as follows:
First $1
billion | | Over $1
billion | |
| | 0.375 | % | | | 0.300 | % | |
C. Administration Fees: The Adviser also serves as Administrator to the Fund and provides administrative services pursuant to an Administration Agreement for an annual fee, accrued daily and paid monthly, of 0.08% of the Portfolio's average daily net assets. Under a Sub-Administration Agreement between the Administrator and State Street Bank and Trust Company ("State Street"), State Street provides certain administrative services to the Fund. For such services, the Adminis-
30
Morgan Stanley Institutional Fund Trust
Annual Report — September 30, 2012
Notes to Financial Statements (cont'd)
trator pays State Street a portion of the fee the Administrator receives from the Fund.
D. Distribution and Shareholder Services Fees: Morgan Stanley Distribution, Inc. ("MSDI" or the "Distributor"), a wholly-owned subsidiary of the Adviser, and an indirect subsidiary of Morgan Stanley, serves as the Fund's Distributor of Portfolio shares pursuant to a Distribution agreement. The Fund has adopted Shareholder Services Plans with respect to Class P and Class H shares pursuant to Rule 12b-1 under the Act. Under the Shareholder Services Plans, the Portfolio pays the Distributor a shareholder services fee, accrued daily and paid monthly, at an annual rate of 0.25% of the Portfolio's average daily net assets attributable to Class P and Class H shares.
The Fund has adopted a Distribution and Shareholder Services Plan with respect to Class L shares pursuant to Rule 12b-1 under the Act. Under the Distribution and Shareholder Services Plan, the Portfolio pays the Distributor a distribution fee, accrued daily and paid monthly, at an annual rate of 0.25% and a shareholder service fee, accrued daily and paid monthly, at an annual rate of 0.25% of the Portfolio's average daily net assets attributable to Class L shares.
The distribution and shareholder services fees are used to support the expenses associated with servicing and maintaining accounts. The Distributor may compensate other parties for providing shareholder support services to investors who purchase Class P, Class H and Class L shares.
E. Dividend Disbursing and Transfer Agent: The Fund's dividend disbursing and transfer agent is Morgan Stanley Services Company Inc. ("Morgan Stanley Services"). Pursuant to a transfer agency agreement, the Fund pays Morgan Stanley Services a fee based on the number of classes, accounts and transactions relating to the Portfolios of the Fund.
F. Custodian Fees: State Street (the "Custodian") serves as Custodian for the Fund in accordance with a custodian agreement. The Custodian holds cash, securities, and other assets of the Fund as required by the Act. Custody fees are payable monthly based on assets held in custody, investment purchases and sales activity and account maintenance fees, plus reimbursement for certain out-of-pocket expenses.
The Fund has entered into an arrangement with its Custodian whereby credits realized on uninvested cash balances were used to offset a portion of the Portfolio's expenses. If applicable, these custodian credits are shown as "Expense Offset" in the Statement of Operations.
G. Security Transactions and Transactions with Affiliates: For the year ended September 30, 2012, purchases and sales of investment securities for the Portfolio, other than long-term U.S. Government securities and short-term investments, were approximately $89,967,000 and $154,165,000, respectively. For the year ended September 30, 2012, purchases and sales of long-term U.S. Government securities were approximately $400,137,000 and $405,258,000, respectively.
The Portfolio invests in the Institutional Class of the Morgan Stanley Institutional Liquidity Funds — Money Market Portfolio (the "Liquidity Funds"), an open-end management investment company managed by the Adviser, both directly, and as a portion of the securities held as collateral on loaned securities. Advisory fees paid by the Portfolio are reduced by an amount equal to its pro-rata share of the advisory and administration fees paid by the Portfolio due to its investment in the Liquidity Funds. For the year ended September 30, 2012, advisory fees paid were reduced by approximately $19,000 relating to the Portfolio's investment in the Liquidity Funds.
A summary of the Portfolio's transactions in shares of the Liquidity Funds during the year ended September 30, 2012 is as follows:
Value
September 30,
2011
(000) | | Purchases
at Cost
(000) | | Sales
(000) | | Dividend
Income
(000) | | Value
September 30,
2012
(000) | |
| $ | 17,246 | | | $ | 204,992 | | | $ | 201,805 | | | $ | 20 | | | $ | 20,433 | | |
For the year ended September 30, 2012, the Portfolio had transactions with Citigroup, Inc., and its affiliated broker-dealers which may be deemed affiliates of the Adviser, Administrator and Distributor under Section 17 of the Act.
Value
September 30,
2011
(000) | | Purchases
at Cost
(000) | | Sales
(000) | | Realized
Gain
(000) | | Interest
Income
(000) | | Value
September 30,
2012
(000) | |
| $ | 3,518 | | | $ | — | | | $ | 2,813 | | | $ | 196 | | | $ | 109 | | | $ | 1,098 | | |
The Portfolio has an unfunded Deferred Compensation Plan (the "Compensation Plan"), which allows each independent Trustee to defer payment of all, or a portion, of the fees he or she receives for serving on the Board of Trustees. Each eligible Trustee generally may elect to have the deferred amounts credited with a return equal to the total return on one or more of the Morgan Stanley funds that are offered as investment options under the Compensation Plan. Appreciation/depreciation and distributions received from these investments are recorded with an offsetting increase/decrease in the deferred compensation obligation and do not affect the net asset value of the Portfolio.
31
Morgan Stanley Institutional Fund Trust
Annual Report — September 30, 2012
Notes to Financial Statements (cont'd)
H. Federal Income Taxes: It is the Portfolio's intention to continue to qualify as a regulated investment company and distribute all of its taxable and tax-exempt income. Accordingly, no provision for Federal income taxes is required in the financial statements.
Dividend income and distributions to shareholders are recorded on the ex-dividend date. Interest income is recognized on an accrual basis. Dividends from net investment income, if any, are declared and paid quarterly. Net realized capital gains, if any, are distributed at least annually.
The Portfolio may be subject to taxes imposed by countries in which it invests. Such taxes are generally based on income and/or capital gains earned or repatriated. Taxes are accrued based on net investment income, net realized gains and net unrealized appreciation as such income and/or gains are earned. Taxes may also be based on transactions in foreign currency and are accrued based on the value of investments denominated in such currency.
FASB ASC 740-10, Income Taxes — Overall, sets forth a minimum threshold for financial statement recognition of the benefit of a tax position taken or expected to be taken in a tax return. Management has concluded there are no significant uncertain tax positions that would require recognition in the financial statements. If applicable, the Portfolio recognizes interest accrued related to unrecognized tax benefits in "Interest Expense" and penalties in "Other Expenses" in the Statement of Operations. The Portfolio files tax returns with the U.S. Internal Revenue Service, New York and various states. Each of the tax years in the four-year period ended September 30, 2012, remains subject to examination by taxing authorities.
The tax character of distributions paid may differ from the character of distributions shown in the Statements of Changes in Net Assets due to short-term capital gains being treated as ordinary income for tax purposes. The tax character of distributions paid during fiscal 2012 and 2011 was as follows:
2012
Distributions
Paid From: | | 2011
Distributions
Paid From: | |
Ordinary
Income
(000) | | Ordinary
Income
(000) | |
| $ | 12,613 | | | $ | 16,358 | | |
The amount and character of income and gains to be distributed are determined in accordance with income tax regulations which may differ from GAAP. These book/tax differences are either considered temporary or permanent in nature.
Temporary differences are attributable to differing book and tax treatments for the timing of the recognition of gains (losses) on certain investment transactions and the timing of the deductibility of certain expenses.
Permanent differences, primarily due to differing treatments of gains (losses) related to foreign currency transactions, basis adjustments for swap transactions and paydown adjustments, resulted in the following reclassifications among the components of net assets at September 30, 2012:
Accumulated
Undistributed
Net Investment
Income
(000) | | Accumulated
Net Realized
Loss
(000) | | Paid-in-
Capital
(000) | |
| $ | 2,087 | | | $ | (2,087 | ) | | | — | | |
At September 30, 2012, the components of distributable earnings for the Portfolio on a tax basis were as follows:
Undistributed
Ordinary
Income
(000) | | Undistributed
Long-Term
Capital Gain
(000) | |
| $ | 6,327 | | | | — | | |
At September 30, 2012, the aggregate cost for federal income tax purposes is approximately $247,201,000. The aggregate gross unrealized appreciation is approximately $14,595,000 and the aggregate gross unrealized depreciation is approximately $3,730,000 resulting in net unrealized appreciation of approximately $10,865,000.
On December 22, 2010, the Regulated Investment Company Modernization Act of 2010 (the "Modernization Act") was signed into law. The Modernization Act modernizes several tax provisions related to Regulated Investment Companies ("RICs") and their shareholders. One key change made by the Modernization Act is that capital losses will generally retain their character as short-term or long-term and may be carried forward indefinitely to offset future gains. These losses are utilized before other capital loss carryforwards that expire. Generally, the Modernization Act is effective for taxable years beginning after December 22, 2010.
At September 30, 2012, the Portfolio had available for Federal income tax purposes unused capital losses, which will expire on the indicated dates:
| Amount (000) | | Expiration | |
| $ | 6,102 | | | September 30, 2014 | |
| | 15,680 | | | September 30, 2015 | |
| | 5,336 | | | September 30, 2016 | |
| | 254,264 | | | September 30, 2017 | |
| | 201,462 | | | September 30, 2018 | |
32
Morgan Stanley Institutional Fund Trust
Annual Report — September 30, 2012
Notes to Financial Statements (cont'd)
To the extent that capital loss carryforwards are used to offset any future capital gains realized during the carryover period as provided by U.S. Federal income tax regulations, no capital gains tax liability will be incurred by the Portfolio for gains realized and not distributed. To the extent that capital gains are offset, such gains will not be distributed to the shareholders. During the year ended September 30, 2012, the Portfolio utilized capital loss carryforwards for U.S. Federal income tax purposes of approximately $1,032,000.
Capital losses and specified ordinary losses, including currency losses, incurred after October 31 but within the taxable year are deemed to arise on the first day of the Portfolio's next taxable year. For the year ended September 30, 2012, the Portfolio deferred to October 1, 2012 for U.S. Federal income tax purposes the following losses:
Post-October
Currency and
Specified Ordinary
Losses (000) | | Post-October
Capital
Losses (000) | |
| | — | | | $ | 820 | | |
I. Other (unaudited): At September 30, 2012, the Portfolio had otherwise unaffiliated record owners of 10% or greater. Investment activities of these shareholders could have a material impact on the Portfolio. The aggregate percentage of such owners was 43.1%, 26.3% and 71.6%, for Class I, Class P and Class H shares, respectively.
J. Accounting Pronouncement: In December 2011, FASB issued Accounting Standards Update ("ASU") 2011-11, Balance Sheet: Disclosures about Offsetting Assets and Liabilities. The pronouncement improves disclosures for recognized financial and derivative instruments that are either offset on the balance sheet in accordance with the offsetting guidance in ASC 210-20-45 or ASC 815-10-45 or are subject to an enforceable master netting agreements or similar. The Fund will be required to disclose information about rights to offset and related arrangements (such as collateral agreements) in order to enable financial statement users to understand the effect of those rights and arrangements on its financial position as well as disclose the following (1) gross amounts; (2) amounts offset in the statement of financial position; (3) any other amounts that can be offset in the event of bankruptcy, insolvency or default of any of the parties (including cash and noncash financial collateral); and (4) the Fund's net exposure. The
requirements are effective for annual reporting periods beginning on or after January 1, 2013, and must be applied retrospectively. At this time, the Fund's management is evaluating the implications of ASU 2011-11 and its impact, if any, on the financial statements.
33
Morgan Stanley Institutional Fund Trust
Annual Report — September 30, 2012
Report of Independent Registered Public Accounting Firm
To the Shareholders and Board of Trustees of
Morgan Stanley Institutional Fund Trust —
Core Plus Fixed Income Portfolio
We have audited the accompanying statement of assets and liabilities, including the portfolio of investments, of Core Plus Fixed Income Portfolio (one of the portfolios constituting Morgan Stanley Institutional Fund Trust) (the "Portfolio") as of September 30, 2012, and the related statement of operations for the year then ended, the statements of changes in net assets for each of the two years in the period then ended, and the financial highlights for each of the periods indicated therein. These financial statements and financial highlights are the responsibility of the Portfolio's management. Our responsibility is to express an opinion on these financial statements and financial highlights based on our audits.
We conducted our audits in accordance with the standards of the Public Company Accounting Oversight Board (United States). Those standards require that we plan and perform the audit to obtain reasonable assurance about whether the financial statements and financial highlights are free of material misstatement. We were not engaged to perform an audit of the Portfolio's internal control over financial reporting. Our audits included consideration of internal control over financial reporting as a basis for designing audit procedures that are appropriate in the circumstances, but not for the purpose of expressing an opinion on the effectiveness of the Portfolio's internal control over financial reporting. Accordingly, we express no such opinion. An audit also includes examining, on a test basis, evidence supporting the amounts and disclosures in the financial statements and financial highlights, assessing the accounting principles used and significant estimates made by management, and evaluating the overall financial statement presentation. Our procedures included confirmation of securities owned as of September 30, 2012, by correspondence with the custodian and others, or by other appropriate auditing procedures where replies from others were not received. We believe that our audits provide a reasonable basis for our opinion.
In our opinion, the financial statements and financial highlights referred to above present fairly, in all material respects, the financial position of Core Plus Fixed Income Portfolio of Morgan Stanley Institutional Fund Trust at September 30, 2012, the results of its operations for the year then ended, the changes in its net assets for each of the two years in the period then ended, and the financial highlights for each of the periods indicated therein, in conformity with U.S. generally accepted accounting principles.

Boston, Massachusetts
November 27, 2012
34
Morgan Stanley Institutional Fund Trust
Annual Report — September 30, 2012
U.S. Privacy Policy (unaudited)
AN IMPORTANT NOTICE CONCERNING OUR U.S. PRIVACY POLICY
This privacy notice describes the U.S. privacy policy of Morgan Stanley Distribution, Inc., and the Morgan Stanley family of mutual funds ("us", "our", "we").
We are required by federal law to provide you with notice of our U.S. privacy policy ("Policy"). This Policy applies to both our current and former clients unless we state otherwise and is intended for individual clients who purchase products or receive services from us for personal, family or household purposes. This Policy is not applicable to partnerships, corporations, trusts or other non-individual clients or account holders, nor is this Policy applicable to individuals who are either beneficiaries of a trust for which we serve as trustee or participants in an employee benefit plan administered or advised by us. This Policy is, however, applicable to individuals who select us to be a custodian of securities or assets in individual retirement accounts, 401(k) accounts, or accounts subject to the Uniform Gifts to Minors Act.
This notice sets out our business practices to protect your privacy; how we collect and share personal information about you; and how you can limit our sharing or certain uses by others of this information. We may amend this Policy at any time, and will inform you of any changes to our Policy as required by law.
WE RESPECT YOUR PRIVACY
We appreciate that you have provided us with your personal financial information and understand your concerns about your information. We strive to safeguard the information our clients entrust to us. Protecting the confidentiality and security of client information is an important part of how we conduct our business.
This notice describes what personal information we collect about you, how we collect it, when we may share it with others, and how certain others may use it. It discusses the steps you may take to limit our sharing of certain information about you with our affiliated companies, including, but not limited to our affiliated banking businesses, brokerage firms and credit service affiliates. It also discloses how you may limit our affiliates' use of shared information for marketing purposes.
Throughout this Policy, we refer to the nonpublic information that personally identifies you as "personal information." We also use the term "affiliated company" in this notice. An affiliated company is a company in our family of companies and includes companies with the Morgan Stanley name. These affiliated companies are financial institutions such as broker-dealers, banks, investment advisers and credit card issuers. We refer to any company that is not an affiliated company as a nonaffiliated third party. For purposes of Section 5 of this notice, and your ability to limit certain uses of personal information by our affiliates, this notice applies to the use of personal information by our affiliated companies.
1. WHAT PERSONAL INFORMATION DO WE COLLECT FROM YOU?
We may collect the following types of information about you: (i) information provided by you, including information from applications and other forms we receive from you, (ii) information about your transactions with us or our affiliates, (iii) information about your transactions with nonaffiliated third parties, (iv) information from consumer reporting agencies, (v) information obtained from our websites, and (vi) information obtained from other sources. For example:
• We collect information such as your name, address, e-mail address, telephone/fax numbers, assets, income and investment objectives through applications and other forms you submit to us.
• We may obtain information about account balances, your use of account(s) and the types of products and services you prefer to receive from us through your dealings and transactions with us and other sources.
• We may obtain information about your creditworthiness and credit history from consumer reporting agencies.
• We may collect background information from and through third-party vendors to verify representations you have made and to comply with various regulatory requirements.
2. WHEN DO WE DISCLOSE PERSONAL INFORMATION WE COLLECT ABOUT YOU?
We may disclose personal information we collect about you in each of the categories listed above to affiliated and nonaffiliated third parties.
35
Morgan Stanley Institutional Fund Trust
Annual Report — September 30, 2012
U.S. Privacy Policy (unaudited) (cont'd)
a. Information we disclose to affiliated companies.
We may disclose personal information that we collect about you to our affiliated companies to manage your account(s) effectively, to service and process your transactions, and to let you know about products and services offered by us and affiliated companies, to manage our business, and as otherwise required or permitted by law. Offers for products and services from affiliated companies are developed under conditions designed to safeguard your personal information.
b. Information we disclose to third parties.
We may disclose personal information that we collect about you to nonaffiliated third parties to provide marketing services on our behalf or to other financial institutions with whom we have joint marketing agreements. We may also disclose all of the information we collect to other nonaffiliated third parties for our everyday business purposes, such as to process transactions, maintain account(s), respond to court orders and legal investigations, report to credit bureaus, offer our own products and services, protect against fraud, for institutional risk control, to perform services on our behalf, and as otherwise required or permitted by law.
When we share personal information about you with a nonaffiliated third party, they are required to limit their use of personal information about you to the particular purpose for which it was shared and they are not allowed to share personal information about you with others except to fulfill that limited purpose or as may be permitted or required by law.
3. HOW DO WE PROTECT THE SECURITY AND CONFIDENTIALITY OF PERSONAL INFORMATION WE COLLECT ABOUT YOU?
We maintain physical, electronic and procedural security measures that comply with applicable law and regulations to help safeguard the personal information we collect about you. We have internal policies governing the proper handling of client information by employees. Third parties that provide support or marketing services on our behalf may also receive personal information about you, and we require them to adhere to appropriate security standards with respect to such information.
4. HOW CAN YOU LIMIT OUR SHARING CERTAIN PERSONAL INFORMATION ABOUT YOU WITH OUR AFFILIATED COMPANIES FOR ELIGIBILITY DETERMINATION?
By following the opt-out procedures in Section 6 below, you may limit the extent to which we share with our affiliated companies, personal information that was collected to determine your eligibility for products and services such as your credit reports and other information that you have provided to us or that we may obtain from third parties ("eligibility information"). Eligibility information does not include your identification information or personal information pertaining to our transactions or experiences with you. Please note that, even if you direct us not to share eligibility information with our affiliated companies, we may still share your personal information, including eligibility information, with our affiliated companies under circumstances that are permitted under applicable law, such as to process transactions or to service your account.
5. HOW CAN YOU LIMIT THE USE OF CERTAIN PERSONAL INFORMATION ABOUT YOU BY OUR AFFILIATED COMPANIES FOR MARKETING?
By following the opt-out instructions in Section 6 below, you may limit our affiliated companies from marketing their products or services to you based on personal information we disclose to them. This information may include, for example, your income and account history with us. Please note that, even if you choose to limit our affiliated companies from using personal information about you that we may share with them for marketing their products and services to you, our affiliated companies may use your personal information that they obtain from us to market to you in circumstances permitted by law, such as if the affiliated party has its own relationship with you.
36
Morgan Stanley Institutional Fund Trust
Annual Report — September 30, 2012
U.S. Privacy Policy (unaudited) (cont'd)
6. HOW CAN YOU SEND US AN OPT-OUT INSTRUCTION?
If you wish to limit our sharing of eligibility information about you with our affiliated companies, or our affiliated companies' use of personal information for marketing purposes, as described in this notice, you may do so by:
• Calling us at (800) 548-7786
Monday–Friday between 8a.m. and 5p.m. (EST)
• Writing to us at the following address:
Morgan Stanley Services Company Inc.
c/o Privacy Coordinator
201 Plaza Two, 3rd Floor
Jersey City, New Jersey 07311
If you choose to write to us, your request should include: your name, address, telephone number and account number(s) to which the opt-out applies and whether you are opting out with respect to sharing of eligibility information (Section 4 above), or information used for marketing (Section 5 above), or both. Written opt-out requests should not be sent with any other correspondence. In order to process your request, we require that the request be provided by you directly and not through a third party. Once you have informed us about your privacy preferences, your opt-out preference will remain in effect with respect to this Policy (as it may be amended) until you notify us otherwise. If you are a joint account owner, we will accept instructions from any one of you and apply those instructions to the entire account.
Please understand that if you limit our sharing or our affiliated companies' use of personal information, you and any joint account holder(s) may not receive information about our affiliated companies' products and services, including products or services that could help you manage your financial resources and achieve your investment objectives.
If you have more than one account or relationship with us, please specify the accounts to which you would like us to apply your privacy choices. If you have accounts or relationships with our affiliates, you may receive multiple privacy policies from them, and will need to separately notify those companies of your privacy choices for those accounts or relationships.
7. WHAT IF AN AFFILIATED COMPANY BECOMES A NONAFFILIATED THIRD PARTY?
If, at any time in the future, an affiliated company becomes a nonaffiliated third party, further disclosures of personal information made to the former affiliated company will be limited to those described in Section 2(b) above relating to nonaffiliated third parties. If you elected under Section 6 to limit disclosures we make to affiliated companies, or use of personal information by affiliated companies, your election will not apply to use by any former affiliated company of your personal information in their possession once it becomes a nonaffiliated third party.
SPECIAL NOTICE TO RESIDENTS OF VERMONT
The following section supplements our Policy with respect to our individual clients who have a Vermont address and supersedes anything to the contrary in the above Policy with respect to those clients only.
The State of Vermont requires financial institutions to obtain your consent prior to sharing personal information that they collect about you with nonaffiliated third parties, or eligibility information with affiliated companies, other than in certain limited circumstances. Except as permitted by law, we will not share personal information we collect about you with nonaffiliated third parties or eligibility information with affiliated companies, unless you provide us with your written consent to share such information.
SPECIAL NOTICE TO RESIDENTS OF CALIFORNIA
The following section supplements our Policy with respect to our individual clients who have a California address and supersedes anything to the contrary in the above Policy with respect to those clients only.
In response to a California law, if your account has a California home address, your personal information will not be disclosed to nonaffiliated third parties except as permitted by applicable California law, and we will limit sharing such personal information with our affiliates to comply with California privacy laws that apply to us.
37
Morgan Stanley Institutional Fund Trust
Annual Report — September 30, 2012
Trustee and Officer Information (unaudited)
Independent Trustees:
Name, Age and Address of
Independent Trustee | | Position(s)
Held with
Registrant | | Length of Time
Served* | | Principal Occupation(s) During Past 5 Years | | Number of
Portfolios in
Fund Complex
Overseen by
Independent
Trustee** | | Other Directorships
Held by Independent
Trustee*** | |
Frank L. Bowman (67)
c/o Kramer Levin Naftalis &
Frankel LLP
Counsel to the Independent
Trustees
1177 Avenue of the Americas
New York, NY 10036 | | Trustee | | Since
August
2006 | | President, Strategic Decisions, LLC (consulting) (since February 2009); Director or Trustee of various Morgan Stanley Funds (since August 2006); Chairperson of the Insurance Sub-Committee of the Compliance and Insurance Committee (since February 2007); served as President and Chief Executive Officer of the Nuclear Energy Institute (policy organization) (February 2005-November 2008); retired as Admiral, U.S. Navy after serving over 38 years on active duty including 8 years as Director of the Naval Nuclear Propulsion Program in the Department of the Navy and the U.S. Department of Energy (1996-2004); served as Chief of Naval Personnel (July 1994-September 1996); and on the Joint Staff as Director of Political Military Affairs (June 1992-July 1994); Knighted as Honorary Knight Commander of the Most Excellent Order of the British Empire; Awarded the Officer de l'Orde National du Mérite by the French Government; elected to the National Academy of Engineering (2009). | | | 102 | | | Director of BP p.l.c.; Director of Naval and Nuclear Technologies LLP; Director of the Armed Services YMCA of the USA and the Naval Submarine League; Director of the American Shipbuilding Suppliers Association; Member of the National Security Advisory Council of the Center for U.S. Global Engagement and a member of the CNA Military Advisory Board; Member of the American Lung Association's President's Council. | |
Michael Bozic (71)
c/o Kramer Levin Naftalis &
Frankel LLP
Counsel to the Independent
Trustees
1177 Avenue of the Americas
New York, NY 10036 | | Trustee | | Since
April
1994 | | Private investor; Chairperson of the Compliance and Insurance Committee (since October 2006); Director or Trustee of various Morgan Stanley Funds (since April 1994); formerly, Chairperson of the Insurance Committee (July 2006-September 2006); Vice Chairman of Kmart Corporation (December 1998-October 2000), Chairman and Chief Executive Officer of Levitz Furniture Corporation (November 1995-November 1998) and President and Chief Executive Officer of Hills Department Stores (May 1991-July 1995); variously Chairman, Chief Executive Officer, President and Chief Operating Officer (1987-1991) of the Sears Merchandise Group of Sears, Roebuck & Co. | | | 104 | | | Director of various business organizations. | |
Kathleen A. Dennis (59)
c/o Kramer Levin Naftalis &
Frankel LLP
Counsel to the Independent
Trustees
1177 Avenue of the Americas
New York, NY 10036 | | Trustee | | Since
August
2006 | | President, Cedarwood Associates (mutual fund and investment management consulting) (since July 2006); Chairperson of the Money Market and Alternatives Sub-Committee of the Investment Committee (since October 2006) and Director or Trustee of various Morgan Stanley Funds (since August 2006); formerly, Senior Managing Director of Victory Capital Management (1993-2006). | | | 102 | | | Director of various non-profit organizations. | |
Dr. Manuel H. Johnson (63)
c/o Johnson Smick
Group, Inc.
888 16th Street, N.W.
Suite 740
Washington, D.C. 20006 | | Trustee | | Since
July
1991 | | Senior Partner, Johnson Smick International, Inc. (consulting firm); Chairperson of the Investment Committee (since October 2006) and Director or Trustee of various Morgan Stanley Funds (since July 1991); Co-Chairman and a founder of the Group of Seven Council (G7C) (international economic commission); formerly, Chairperson of the Audit Committee (July 1991-September 2006), Vice Chairman of the Board of Governors of the Federal Reserve System and Assistant Secretary of the U.S. Treasury. | | | 104 | | | Director of NVR, Inc. (home construction). | |
Joseph J. Kearns (70)
c/o Kearns & Associates LLC
PMB754
22631 Pacific Coast Highway
Malibu, CA 90265 | | Trustee | | Since
August
1994 | | President, Kearns & Associates LLC (investment consulting); Chairperson of the Audit Committee (since October 2006) and Director or Trustee of various Morgan Stanley Funds (since August 1994); formerly, Deputy Chairperson of the Audit Committee (July 2003-September 2006) and Chairperson of the Audit Committee of various Morgan Stanley Funds (since August 1994); CFO of the J. Paul Getty Trust. | | | 105 | | | Director of Electro Rent Corporation (equipment leasing) and The Ford Family Foundation. | |
38
Morgan Stanley Institutional Fund Trust
Annual Report — September 30, 2012
Trustee and Officer Information (unaudited) (cont'd)
Independent Trustees: (cont'd)
Name, Age and Address of
Independent Trustee | | Position(s)
Held with
Registrant | | Length of Time
Served* | | Principal Occupation(s) During Past 5 Years | | Number of
Portfolios in
Fund Complex
Overseen by
Independent
Trustee** | | Other Directorships
Held by Independent
Trustee*** | |
Michael F. Klein (53)
c/o Kramer Levin Naftalis & Frankel LLP
Counsel to the
Independent Trustees
1177 Avenue of the Americas
New York, NY 10036 | | Trustee | | Since
August
2006 | | Managing Director, Aetos Capital, LLC (since March 2000) and Co-President, Aetos Alternatives Management, LLC (since January 2004); Chairperson of the Fixed Income Sub-Committee of the Investment Committee (since October 2006) and Director or Trustee of various Morgan Stanley Funds (since August 2006); formerly, Managing Director, Morgan Stanley & Co. Inc. and Morgan Stanley Dean Witter Investment Management, President, various Morgan Stanley Funds (June 1998-March 2000) and Principal, Morgan Stanley & Co. Inc. and Morgan Stanley Dean Witter Investment Management (August 1997-December 1999). | | | 102 | | | Director of certain investment funds managed or sponsored by Aetos Capital, LLC. Director of Sanitized AG and Sanitized Marketing AG (specialty chemicals). | |
Michael E. Nugent (76)
c/o Triumph Capital, L.P.
445 Park Avenue
New York, NY 10022 | | Chairperson
of the
Board and
Trustee | | Chairperson of
the Boards since
July 2006 and
Trustee since
July 1991 | | General Partner, Triumph Capital, L.P. (private investment partnership); Chairperson of the Boards of various Morgan Stanley Funds (since July 2006); Chairperson of the Closed-End Fund Committee (since June 2012) and Director or Trustee of various Morgan Stanley Funds (since July 1991); formerly, Chairperson of the Insurance Committee (until July 2006). | | | 104 | | | None. | |
W. Allen Reed (65)
c/o Kramer Levin Naftalis &
Frankel LLP
Counsel to the
Independent Trustees
1177 Avenue of the Americas
New York, NY 10036 | | Trustee | | Since
August
2006 | | Chairperson of the Equity Sub-Committee of the Investment Committee (since October 2006) and Director or Trustee of various Morgan Stanley Funds (since August 2006); formerly, President and CEO of General Motors Asset Management; Chairman and Chief Executive Officer of the GM Trust Bank and Corporate Vice President of General Motors Corporation (August 1994-December 2005). | | | 102 | | | Director of Temple-Inland Industries (packaging and forest products); Director of Legg Mason, Inc. and Director of the Auburn University Foundation. | |
Fergus Reid (80)
c/o Joe Pietryka, Inc.
85 Charles Colman Blvd.
Pawling, NY 12564 | | Trustee | | Since
June
1992 | | Chairman, Joe Pietryka, Inc.; Chairperson of the Governance Committee and Director or Trustee of various Morgan Stanley Funds (since June 1992). | | | 105 | | | Trustee and Director of certain investment companies in the JPMorgan Funds complex managed by JP Morgan Investment Management Inc. | |
39
Morgan Stanley Institutional Fund Trust
Annual Report — September 30, 2012
Trustee and Officer Information (unaudited) (cont'd)
Interested Trustee:
Name, Age and Address of
Interested Trustee | | Position(s) Held
with Registrant | | Length of Time
Served* | | Principal Occupation(s) During Past 5 Years | | Number of
Portfolios in
Fund Complex
Overseen by
Interested
Trustee** | | Other Directorships
Held by Interested
Trustee*** | |
James F. Higgins (64)
c/o Morgan Stanley Services Company Inc.
Harborside Financial Center
201 Plaza Two
Jersey City, NJ 07311 | | Trustee | | Since
June
2000 | | Director or Trustee of various Morgan Stanley Funds (since June 2000); Senior Advisor of Morgan Stanley (since August 2000). | | | 103 | | | Director of AXA Financial, Inc. and The Equitable Life Assurance Society of the United States (financial services). | |
* Each Trustee serves an indefinite term, until his or her successor is elected.
** The Fund Complex includes (as of December 31, 2011) all open-end and closed-end funds (including all of their portfolios) advised by Morgan Stanley Investment Management Inc. (the "Adviser") and any funds that have an adviser that is an affiliated person of the Adviser (including, but not limited to, Morgan Stanley AIP GP LP).
*** This includes any directorships at public companies and registered investment companies held by the Trustee at any time during the past five years.
40
Morgan Stanley Institutional Fund Trust
Annual Report — September 30, 2012
Trustee and Officer Information (unaudited) (cont'd)
Executive Officers:
Name, Age and Address of Executive Officer | | Position(s) Held
with
Registrant | | Length of Time
Served* | | Principal Occupation(s) During Past 5 Years | |
Arthur Lev (51)
522 Fifth Avenue
New York, NY 10036 | | President and Principal Executive Officer – Equity and Fixed Income Funds | | Since
June 2011 | | President and Principal Executive Officer (since June 2011) of the Equity and Fixed Income Funds in the Fund Complex; Head of the Long Only Business of Morgan Stanley Investment Management (since February 2011); Managing Director of the Adviser and various entities affiliated with the Adviser (since December 2006). Formerly, Chief Strategy Officer of Morgan Stanley Investment Management's Traditional Asset Management business (November 2010-February 2011); General Counsel of Morgan Stanley Investment Management (December 2006-October 2010); Partner and General Counsel of FrontPoint Partners LLC (July 2002-December 2006); Managing Director and General Counsel of Morgan Stanley Investment Management (May 2000-June 2002). | |
Mary Ann Picciotto (39)
c/o Morgan Stanley Services Company Inc.
Harborside Financial Center
201 Plaza Two
Jersey City, NJ 07311 | | Chief Compliance Officer | | Since
May 2010 | | Managing Director of the Adviser and various entities affiliated with the Adviser; Chief Compliance Officer of various Morgan Stanley Funds (since May 2010); Chief Compliance Officer of the Adviser (since April 2007). | |
Stefanie V. Chang Yu (45)
522 Fifth Avenue
New York, NY 10036 | | Vice President | | Since December 1997 | | Managing Director of the Adviser and various entities affiliated with the Adviser; Vice President of various Morgan Stanley Funds (since December 1997). | |
Francis J. Smith (47)
c/o Morgan Stanley Services Company Inc.
Harborside Financial Center
201 Plaza Two
Jersey City, NJ 07311 | | Treasurer and Principal Financial
Officer | | Treasurer since July 2003 and Principal Financial Officer since September 2002 | | Executive Director of the Adviser and various entities affiliated with the Adviser; Treasurer and Principal Financial Officer of various Morgan Stanley Funds (since July 2003). | |
Mary E. Mullin (45)
522 Fifth Avenue
New York, NY 10036 | | Secretary | | Since
June
1999 | | Executive Director of the Adviser and various entities affiliated with the Adviser; Secretary of various Morgan Stanley Funds (since June 1999). | |
* Each officer serves an indefinite term, until his or her successor is elected.?
41
Morgan Stanley Institutional Fund Trust
Annual Report — September 30, 2012
Adviser and Administrator
Morgan Stanley Investment Management Inc.
522 Fifth Avenue
New York, New York 10036
Distributor
Morgan Stanley Distribution, Inc.
522 Fifth Avenue
New York, New York 10036
Dividend Disbursing and Transfer Agent
Morgan Stanley Services Company Inc.
P.O. Box 219804
Kansas City, Missouri 64121
Custodian
State Street Bank and Trust Company
One Lincoln Street
Boston, Massachusetts 02111
Legal Counsel
Dechert LLP
1095 Avenue of the Americas
New York, New York 10036
Independent Registered Public Accounting Firm
Ernst & Young LLP
200 Clarendon Street
Boston, Massachusetts 02116
Reporting to Shareholders
Each Morgan Stanley fund provides a complete schedule of portfolio holdings in its semi-annual and annual reports within 60 days of the end of the fund's second and fourth fiscal quarters by filing the schedule electronically with the Securities and Exchange Commission (SEC). The semi-annual reports are filed on Form N-CSRS and the annual reports are filed on Form N-CSR. Morgan Stanley also delivers the semi-annual and annual reports to fund shareholders and makes these reports available on its public website, www.morganstanley.com/im. Each Morgan Stanley fund also files a complete schedule of portfolio holdings with the SEC for the fund's first and third fiscal quarters on Form N-Q. Morgan Stanley does not deliver the reports for the first and third fiscal quarters to shareholders, nor are the reports posted to the Morgan Stanley public website. You may, however, obtain the Form N-Q filings (as well as the Form N-CSR and N-CSRS filings) by accessing the SEC's website, www.sec.gov. You may also review and copy them at the SEC's Public Reference Room in Washington, DC. Information on the operation of the SEC's Public Reference Room may be obtained by calling the SEC toll free at 1-800-SEC-0330. You can also request copies of these materials, upon payment of a duplicating fee, by electronic request at the SEC's email address (publicinfo@sec.gov) or by writing the Public Reference Room of the SEC, Washington, DC 20549-0102.
Proxy Voting Policies and Procedures and Proxy Voting Record
You may obtain a copy of the Fund's Proxy Voting Policy and Procedures and information regarding how the Fund voted proxies relating to portfolio securities during the most recent twelve-month period ended June 30, without charge, upon request, by calling toll free 1-800-548-7786 or by visiting our website at www.morganstanley.com/im. This information is also available on the SEC's website at www.sec.gov.
This report is authorized for distribution only when preceded or accompanied by a prospectus of the Fund which describes in detail each Investment Portfolio's investment policies, risks, fees and expenses. Please read the prospectus carefully before you invest or send money. For additional information, including information regarding the investments comprising the Portfolio, please visit our website at www.morganstanley.com/im or call toll free 1-(800) 548-7786.
42
(This Page has been left blank intentionally.)
(This Page has been left blank intentionally.)
Printed in U.S.A.
This Report has been prepared for shareholders and may be distributed to others only if preceded or accompanied by a current prospectus.
Morgan Stanley Investment Management Inc.
522 Fifth Avenue
New York, New York 10036
© 2012 Morgan Stanley. Morgan Stanley Distribution, Inc.

IFTCPFIANN
IU12-02340P-Y09/12

Morgan Stanley
Institutional Fund Trust
Corporate Bond Portfolio
(formerly Investment Grade Fixed Income Portfolio)
Annual
Report
September 30, 2012


Morgan Stanley Institutional Fund Trust
Annual Report — September 30, 2012
Shareholders' Letter | | | 2 | | |
Expense Example | | | 3 | | |
Investment Advisory Agreement Approval | | | 4 | | |
Investment Overview | | | 6 | | |
Portfolio of Investments | | | 9 | | |
Statement of Assets and Liabilities | | | 15 | | |
Statement of Operations | | | 17 | | |
Statements of Changes in Net Assets | | | 18 | | |
Financial Highlights | | | 19 | | |
Notes to Financial Statements | | | 23 | | |
Report of Independent Registered Public Accounting Firm | | | 30 | | |
U.S. Privacy Policy | | | 31 | | |
Trustee and Officer Information | | | 34 | | |
This report is authorized for distribution only when preceded or accompanied by prospectuses of the Morgan Stanley Institutional Fund Trust. To receive a prospectus and/or SAI, which contains more complete information such as investment objectives, charges, expenses, policies for voting proxies, risk considerations, and describes in detail each of the Portfolio's investment policies to the prospective investor, please call toll free 1-(800) 548-7786. Please read the prospectuses carefully before you invest or send money.
Additionally, you can access portfolio information including performance, characteristics, and investment team commentary through Morgan Stanley Investment Management's website: www.morganstanley.com/im.
Market forecasts provided in this report may not necessarily come to pass. There is no guarantee that any sectors mentioned will continue to perform as discussed herein or that securities in such sectors will be held by the Portfolio in the future. There is no assurance that a Portfolio will achieve its investment objective. Portfolios are subject to market risk, which is the possibility that market values of securities owned by the Portfolio will decline and, therefore, the value of the Portfolio's shares may be less than what you paid for them. Accordingly, you can lose money investing in Portfolios. Please see the prospectus for more complete information on investment risks.
1
Morgan Stanley Institutional Fund Trust
Annual Report — September 30, 2012
Shareholders' Letter (unaudited)
Dear Shareholders,
We are pleased to provide this Annual report, in which you will learn how your investment in Corporate Bond Portfolio performed during the latest twelve-month period.
Morgan Stanley Investment Management is a client-centric, investor-led organization. Our global presence, intellectual capital, and breadth of products and services enable us to partner with investors to meet the evolving challenges of today's financial markets. We aim to deliver superior investment service and to empower our clients to make the informed decisions that help them reach their investment goals.
As always, we thank you for selecting Morgan Stanley Investment Management, and look forward to working with you in the months and years ahead.
Sincerely,

Arthur Lev
President and Principal Executive Officer
October 2012
2
Morgan Stanley Institutional Fund Trust
Annual Report — September 30, 2012
Expense Example (unaudited)
Corporate Bond Portfolio
As a shareholder of the Portfolio, you may incur two types of costs: (1) transactional costs, including sales charge (loads) on purchase payments; and (2) ongoing costs, including advisory fees, administration fees, distribution and shareholder servicing fees; and other Portfolio expenses. This example is intended to help you understand your ongoing costs (in dollars) of investing in the Portfolio and to compare these costs with the ongoing costs of investing in other mutual funds.
This example is based on an investment of $1,000 invested at the beginning of the six-month period ended September 30, 2012 and held for the entire six-month period.
Actual Expenses
The table below provides information about actual account values and actual expenses. You may use the information in this table, together with the amount you invested, to estimate the expenses that you paid over the period. Simply divide your account value by $1,000 (for example, an $8,600 account value divided by $1,000 = 8.6), then multiply the result by the number in the table under the heading entitled "Actual Expenses Paid During Period" to estimate the expenses you paid on your account during this period.
Please note that "Actual Expenses Paid During Period" are grossed up to reflect Portfolio expenses prior to the effect of Expense Offset (See Note F in the Notes to Financial Statements). Therefore, the annualized net expense ratios may differ from the ratio of expenses to average net assets shown in the Financial Highlights.
Hypothetical Example for Comparison Purposes
The table below provides information about hypothetical account values and hypothetical expenses based on the Portfolio's actual expense ratio and an assumed rate of return of 5% per year before expenses, which is not the Portfolio's actual return. The hypothetical account values and expenses may not be used to estimate the actual ending account balance or expenses you paid for the period. You may use this information to compare the ongoing costs of investing in the Portfolio and other funds. To do so, compare this 5% hypothetical example with the 5% hypothetical examples that appear in the shareholder reports of the other funds.
Please note that the expenses shown in the table are meant to highlight your ongoing costs only and do not reflect any transactional costs, such as sales charges (loads, if applicable). Therefore, the hypothetical account values and hypothetical expenses are useful in comparing ongoing costs only, and will not help you determine the relative total costs of owning different funds. In addition, if these transactional costs were included, your costs would have been higher.
| | | Beginning
Account
Value
4/1/12 | | Actual Ending
Account
Value
9/30/12 | | Hypothetical
Ending Account
Value | | Actual
Expenses
Paid
During
Period* | | Hypothetical
Expenses Paid
During Period* | | Net
Expense
Ratio
During
Period** | |
Corporate Bond Portfolio Class I | | $ | 1,000.00 | | | $ | 1,066.10 | | | $ | 1,018.50 | | | $ | 6.71 | | | $ | 6.56 | | | | 1.30 | % | |
Corporate Bond Portfolio Class P | | | 1,000.00 | | | | 1,064.50 | | | | 1,017.75 | | | | 7.48 | | | | 7.31 | | | | 1.45 | | |
Corporate Bond Portfolio Class H | | | 1,000.00 | | | | 1,063.80 | | | | 1,017.25 | | | | 8.00 | | | | 7.82 | | | | 1.55 | | |
Corporate Bond Portfolio Class L | | | 1,000.00 | | | | 1,063.40 | | | | 1,016.00 | | | | 9.29 | | | | 9.07 | | | | 1.80 | | |
* Expenses are calculated using each Portfolio Class' annualized net expense ratio (as disclosed), multiplied by the average account value over the period, and multiplied by 183/366 (to reflect the most recent one-half year period).
** Annualized.
3
Morgan Stanley Institutional Fund Trust
Annual Report — September 30, 2012
Investment Advisory Agreement Approval (unaudited)
Nature, Extent and Quality of Services
The Board reviewed and considered the nature and extent of the investment advisory services provided by the Adviser (as defined herein) under the advisory agreement, including portfolio management, investment research and equity and fixed income securities trading. The Board also reviewed and considered the nature and extent of the non-advisory, administrative services provided by the Adviser under the administration agreement, including accounting, clerical, bookkeeping, compliance, business management and planning, and the provision of supplies, office space and utilities at the Adviser's expense. (The advisory and administration agreements together are referred to as the "Management Agreement.") The Board also compared the nature of the services provided by the Adviser with similar services provided by non-affiliated advisers as reported to the Board by Lipper, Inc. ("Lipper").
The Board reviewed and considered the qualifications of the portfolio managers, the senior administrative managers and other key personnel of the Adviser who provide the advisory and administrative services to the Portfolio. The Board determined that the Adviser's portfolio managers and key personnel are well qualified by education and/or training and experience to perform the services in an efficient and professional manner. The Board concluded that the nature and extent of the advisory and administrative services provided were necessary and appropriate for the conduct of the business and investment activities of the Portfolio and supported its decision to approve the Management Agreement.
Performance, Fees and Expenses of the Portfolio
The Board reviewed the performance, fees and expenses of the Portfolio compared to its peers, as determined by Lipper, and to appropriate benchmarks where applicable. The Board discussed with the Adviser the performance goals and the actual results achieved in managing the Portfolio. When considering a fund's performance, the Board and the Adviser place emphasis on trends and longer-term returns (focusing on one-year, three-year and five-year performance, as of December 31, 2011, or since inception, as applicable). When a fund underperforms its benchmark and/or its peer group average, they discuss the causes of such underperformance and, where necessary, they discuss specific changes to investment strategy or investment personnel. The Board noted that the Portfolio's performance was better than its peer group average for the one-year period but below its peer group average for the three- and five-year periods. The Board discussed with the Adviser the level of the advisory and administration fees (together, the "management fee") for this Portfolio relative to comparable funds and/or other accounts advised by the Adviser and/or compared to its peers as determined by Lipper. In addition to the management fee, the Board also reviewed the Portfolio's total expense ratio. The Board noted that the Portfolio's management fee and total expense ratio were higher than its peer group average. After discussion, the Board concluded that (i) the Portfolio's performance was acceptable; and (ii) the Portfolio's management fee and total expense ratio were acceptable given the quality and nature of services provided.
Economies of Scale
The Board considered the size and growth prospects of the Portfolio and how that relates to the Portfolio's total expense ratio and particularly the Portfolio's management fee rate which does not include breakpoints. In conjunction with its review of the Adviser's profitability, the Board discussed with the Adviser how a change in assets can affect the efficiency or effectiveness of managing the Portfolio and whether the management fee level is appropriate relative to current and projected asset levels and/or whether the management fee structure reflects economies of scale as asset levels change. The Board has determined that its review of the actual and potential economies of scale of the Portfolio supports its decision to approve the Management Agreement.
Profitability of the Adviser and Affiliates
The Board considered information concerning the costs incurred and profits realized by the Adviser and its affiliates during the last year from their relationship with the Portfolio and during the last two years from their relationship with the Morgan Stanley Fund Complex and reviewed with the Adviser the cost allocation methodology used to determine the profitability of the Adviser and affiliates. The Board has determined that its review of the analysis of the Adviser's expenses and profitability supports its decision to approve the Management Agreement.
Other Benefits of the Relationship
The Board considered other benefits to the Adviser and its affiliates derived from their relationship with the Portfolio and other funds advised by the Adviser. These benefits may include, among other things, "float" benefits derived from handling of checks for
4
Morgan Stanley Institutional Fund Trust
Annual Report — September 30, 2012
Investment Advisory Agreement Approval (unaudited) (cont'd)
purchases and sales, research received by the Adviser generated from commission dollars spent on funds' portfolio trading and fees for distribution and/or shareholder servicing. The Board reviewed with the Adviser each of these arrangements and the reasonableness of the Adviser's costs relative to the services performed. The Board has determined that its review of the other benefits received by the Adviser or its affiliates supports its decision to approve the Management Agreement.
Resources of the Adviser and Historical Relationship Between the Portfolio and the Adviser
The Board considered whether the Adviser is financially sound and has the resources necessary to perform its obligations under the Management Agreement. The Board also reviewed and considered the historical relationship between the Portfolio and the Adviser, including the organizational structure of the Adviser, the policies and procedures formulated and adopted by the Adviser for managing the Portfolio's operations and the Board's confidence in the competence and integrity of the senior managers and key personnel of the Adviser. The Board concluded that the Adviser has the financial resources necessary to fulfill its obligations under the Management Agreement and that it is beneficial for the Portfolio to continue its relationship with the Adviser.
Other Factors and Current Trends
The Board considered the controls and procedures adopted and implemented by the Adviser and monitored by the Fund's Chief Compliance Officer and concluded that the conduct of business by the Adviser indicates a good faith effort on its part to adhere to high ethical standards in the conduct of the Fund's business.
General Conclusion
After considering and weighing all of the above factors, the Board concluded that it would be in the best interest of the Portfolio and its shareholders to approve renewal of the Management Agreement for another year. In reaching this conclusion the Board did not give particular weight to any single factor referenced above. The Board considered these factors over the course of numerous meetings, some of which were in executive session with only the independent Board members and their counsel present. It is possible that individual Board members may have weighed these factors differently in reaching their individual decisions to approve the Management Agreement.
5
Morgan Stanley Institutional Fund Trust
Annual Report — September 30, 2012
Investment Overview (unaudited)
Corporate Bond Portfolio
Performance
For the fiscal year ended September 30, 2012, the Portfolio's Class I had a total return based on net asset value and reinvestment of distributions per share of 10.94%, net of fees. The Portfolio's Class I outperformed against its benchmark the Barclays Capital U.S. Corporate Index (the "Index"), which returned 10.76% and the Barclays Capital U.S. Aggregate Index, which returned 5.16%.
Factors Affecting Performance
• Driven primarily by stabilization of the European sovereign crisis, corporate credit markets performed strongly for the year ending September 30, 2012. Following a brief bout of volatility early in the period, the period can be characterized as a triumph of falling risk premiums over weak fundamentals, as risky assets rallied in the face of lackluster global economic data. Most importantly for corporate credit spreads, coordinated unorthodox central bank actions served to reduce the "tail risks" that had previously been priced into the markets. The most notable announcement was the Outright Monetary Transactions (OMT) program of the European Central Bank (ECB). This was believed to dramatically reduce the likelihood of a disorderly default by periphery governments. While this program was announced late in the period, such involvement was anticipated by the market and was a major contributor to the decline in risk premiums.
• Much of the rally in asset prices occurred in spite of weaker growth prospects. The level of global growth remained subdued throughout the period and forward-looking indicators have been mixed as well. Economic data remains constrained by serious fiscal headwinds in Europe, an engineered slowdown in China and a looming "fiscal cliff" in the United States.
• Despite these headwinds to growth, central banks have succeeded in boosting asset prices, which should continue to feed through to improved economic conditions in the months ahead. This is not to say recession risk has been eliminated; however, central bankers will continue to work hard to avoid that outcome. We continue to believe that central banks will succeed and prevent any further significant slowdown with the caveat that fiscal agents do not do anything too outlandish (such as letting the U.S. fall off the "fiscal cliff" next year).
• The Portfolio's allocation to financial sector credits (both in the U.S. and Europe) contributed meaningfully to returns as spreads in the sector narrowed significantly. The Portfolio's opportunistic allocations to below investment grade bonds also contributed positively to performance.
• The Portfolio's opportunistic allocations to below investment grade bonds also contributed positively to performance.
• However, the Portfolio's underweight to select investment grade, non-financial corporate bonds detracted from performance, as their spreads also narrowed relative to Treasuries.
Management Strategies
• Heading into the new fiscal year, the Portfolio remains positioned with an overweight credit position. Within this position, overweights are focused on financials, BBB-rated industrials and selected below investment grade corporates.
• While uncertainty remains — especially with regard to global economic growth and the European sovereign debt crisis outlook — we believe the fundamentals supporting both the financials and non-financials sectors remain supportive. Financials continue to de-lever and non-financials' balance sheets remain robust, in our opinion, despite slowing earnings growth.
• We believe the technicals supporting the market remain healthy as well. Demand for yield remains strong while deleveraging and the European Central Bank's long-term refinancing operation (LTRO) program have reduced supply.
6
Morgan Stanley Institutional Fund Trust
Annual Report — September 30, 2012
Investment Overview (unaudited) (cont'd)
Corporate Bond Portfolio

* Minimum Investment
In accordance with SEC regulations, the Portfolio's performance shown assumes that all recurring fees (including management fees) were deducted and all dividends and distributions were reinvested. The performance of Class P, Class H, and Class L shares will vary from the Class I shares based upon their different inception dates and will be negatively impacted by additional fees assessed to those classes.
Performance Compared to the Barclays Capital U.S. Corporate Index(1), the Barclays Capital U.S. Aggregate Index(2) and the Lipper Corporate Debt Funds BBB-Rated Index(3)
| | Period Ended September 30, 2012
Total Returns(4) | |
| | | | Average Annual | |
| | One
Year | | Five
Years | | Ten
Years | | Since
Inception(9) | |
Portfolio — Class I Shares
w/o sales charges(5) | | | 10.94 | % | | | 4.08 | % | | | 4.26 | % | | | 6.76 | % | |
Barclays Capital U.S.
Corporate Index | | | 10.76 | | | | 8.06 | | | | 6.56 | | | | 7.75 | | |
Barclays Capital U.S.
Aggregate Index | | | 5.16 | | | | 6.53 | | | | 5.32 | | | | 7.05 | | |
Lipper Corporate Debt Funds
BBB-Rated Index | | | 10.77 | | | | 7.30 | | | | 6.56 | | | | 7.26 | | |
Portfolio — Class P Shares
w/o sales charges(6) | | | 10.69 | | | | 3.94 | | | | 4.10 | | | | 4.39 | | |
Barclays Capital U.S.
Corporate Index | | | 10.76 | | | | 8.06 | | | | 6.56 | | | | 6.90 | | |
Barclays Capital U.S.
Aggregate Index | | | 5.16 | | | | 6.53 | | | | 5.32 | | | | 5.76 | | |
Lipper Corporate Debt Funds
BBB-Rated Index | | | 10.77 | | | | 7.30 | | | | 6.56 | | | | 6.63 | | |
Portfolio — Class H Shares
w/o sales charges(7) | | | 10.55 | | | | — | | | | — | | | | 3.15 | | |
Portfolio — Class H Shares with
maximum 3.50% sales charges(7) | | | 6.70 | | | | — | | | | — | | | | 2.38 | | |
Barclays Capital U.S.
Corporate Index | | | 10.76 | | | | — | | | | — | | | | 7.86 | | |
Barclays Capital U.S.
Aggregate Index | | | 5.16 | | | | — | | | | — | | | | 6.09 | | |
Lipper Corporate Debt Funds
BBB-Rated Index | | | 10.77 | | | | — | | | | — | | | | 7.16 | | |
Portfolio — Class L Shares
w/o sales charges(8) | | | 10.38 | | | | — | | | | — | | | | 5.54 | | |
Barclays Capital U.S.
Corporate Index | | | 10.76 | | | | — | | | | — | | | | 9.28 | | |
Barclays Capital U.S.
Aggregate Index | | | 5.16 | | | | — | | | | — | | | | 6.93 | | |
Lipper Corporate Debt Funds
BBB-Rated Index | | | 10.77 | | | | — | | | | — | | | | 8.48 | | |
Performance data quoted represents past performance, which is no guarantee of future results, and current performance may be lower or higher than the figures shown. Performance assumes that all dividends and distributions, if any, were reinvested. Returns for periods less than one year are not annualized. For the most recent month-end performance figures, please visit www.morganstanley.com/im. Investment returns and principal value will fluctuate so that Portfolio shares, when redeemed, may be worth more or less than their original cost. Total returns do not reflect the deduction of taxes that a shareholder would pay on Portfolio distributions or the redemption of Portfolio shares. Performance of share classes will vary due to differences in sales charges and expenses.
(1) The Barclays Capital U.S. Corporate Index is a broad-based benchmark that measures the investment grade, fixed-rate, taxable, corporate bond market. It is not possible to invest directly in an index. The Index is unmanaged and its returns do not include any sales charges or fees. Such costs would lower performance. The Portfolio's primary benchmark was changed in December 2011 from the
7
Morgan Stanley Institutional Fund Trust
Annual Report — September 30, 2012
Investment Overview (unaudited) (cont'd)
Corporate Bond Portfolio
Barclays Capital U.S. Aggregate Bond Index because the Adviser believes the Barclays Capital U.S. Corporate Index is a more appropriate benchmark for the Portfolio.
(2) The Barclays Capital U.S. Aggregate Index tracks the performance of all U.S. government agency and Treasury securities, investment-grade corporate debt securities, agency mortgage-backed securities, asset-backed securities and commercial mortgage-backed securities. The Index is unmanaged and its returns do not include any sales charges or fees. Such costs would lower performance. It is not possible to invest directly in an index.
(3) The Lipper Corporate Debt Funds BBB-Rated Index is an equally weighted performance index of the largest qualifying funds (based on net assets) in the Lipper Corporate Debt Funds BBB-Rated classification. The Index, which is adjusted for capital gains distributions and income dividends, is unmanaged and should not be considered an investment. There are currently 30 funds represented in this Index. As of the date of this report, the Portfolio was in the Lipper Corporate Debt Funds BBB-Rated classification.
(4) Total returns for the Portfolio reflect expenses waived and/or reimbursed, if applicable, by the Adviser and Distributor. Without such waivers and/or reimbursements, total returns would have been lower. The fee waivers and/or expense reimbursements will continue for at least one year or until such time as the Fund's Board of Trustees acts to discontinue all or a portion of such waivers and/or reimbursements when it deems such action is appropriate.
(5) Commenced operations on August 31, 1990.
(6) Commenced operations on May 20, 2002.
(7) Commenced operations on January 2, 2008.
(8) Commenced operations on June 16, 2008.
(9) For comparative purposes, average annual listed for the Indexes refer to the inception date or initial offering of the respective share class of the Portfolio, not the inception of the Indexes.
Portfolio Composition*
Classification | | Percentage of
Total Investments | |
Industrials | | | 49.1 | % | |
Finance | | | 36.3 | | |
Utilities | | | 8.5 | | |
Short-Term Investments | | | 5.7 | | |
Other** | | | 0.4 | | |
Total Investments | | | 100.0 | %*** | |
* Percentages indicated are based upon total investments (excluding Securities held as Collateral on Loaned Securities) as of September 30, 2012.
** Industries and/or investment types representing less than 5% of total investments.
*** Does not include open long/short futures contracts with an underlying face amount of approximately $30,907,000 and net unrealized depreciation of approximately $43,000 and open swap agreements with total unrealized depreciation of approximately $90,000.
8
Morgan Stanley Institutional Fund Trust
Annual Report — September 30, 2012
Portfolio of Investments
Corporate Bond Portfolio
| | | Face
Amount
(000) | | Value
(000) | |
Fixed Income Securities (94.8%) | |
Asset-Backed Security (0.4%) | |
CVS Pass-Through Trust | |
8.35%, 7/10/31 (a) | | $ | 141 | | | $ | 192 | | |
Collateralized Mortgage Obligation — Agency Collateral Series (0.0%) | |
Federal Home Loan Mortgage Corporation, | |
IO STRIPS | |
8.00%, 1/1/28 | | | 28 | | | | 6 | | |
Corporate Bonds (94.4%) | |
Finance (36.5%) | |
ABB Treasury Center USA, Inc. | |
2.50%, 6/15/16 (a) | | | 195 | | | | 204 | | |
Abbey National Treasury Services PLC, | |
MTN | |
3.88%, 11/10/14 (a) | | | 146 | | | | 149 | | |
ABN Amro Bank N.V. | |
4.25%, 2/2/17 (a) | | | 210 | | | | 226 | | |
Alexandria Real Estate Equities, Inc. | |
4.60%, 4/1/22 | | | 150 | | | | 160 | | |
Ally Financial, Inc. | |
5.50%, 2/15/17 | | | 175 | | | | 183 | | |
American Express Co. | |
8.13%, 5/20/19 | | | 100 | | | | 135 | | |
American Financial Group, Inc. | |
9.88%, 6/15/19 | | | 225 | | | | 283 | | |
American International Group, Inc. | |
6.40%, 12/15/20 | | | 345 | | | | 421 | | |
AvalonBay Communities, Inc. | |
2.95%, 9/15/22 | | | 100 | | | | 100 | | |
Bank of America Corp. | |
5.63%, 7/1/20 | | | 665 | | | | 759 | | |
Barclays Bank PLC | |
6.05%, 12/4/17 (a) | | | 515 | | | | 557 | | |
BBVA Bancomer SA | |
6.50%, 3/10/21 (a) | | | 150 | | | | 165 | | |
Bear Stearns Cos. LLC (The) | |
5.55%, 1/22/17 | | | 200 | | | | 228 | | |
Berkshire Hathaway, Inc. | |
3.75%, 8/15/21 (b) | | | 265 | | | | 291 | | |
BNP Paribas SA | |
5.00%, 1/15/21 (b) | | | 170 | | | | 188 | | |
Boston Properties LP, | |
3.85%, 2/1/23 | | | 150 | | | | 158 | | |
5.88%, 10/15/19 | | | 30 | | | | 36 | | |
Brookfield Asset Management, Inc. | |
5.80%, 4/25/17 | | | 70 | | | | 78 | | |
Capital One Bank, USA NA | |
8.80%, 7/15/19 | | | 285 | | | | 377 | | |
Capital One Capital VI | |
8.88%, 5/15/40 | | | 150 | | | | 153 | | |
Cigna Corp. | |
5.38%, 2/15/42 | | | 120 | | | | 135 | | |
| | | Face
Amount
(000) | | Value
(000) | |
Citigroup, Inc. (See Note G), | |
4.45%, 1/10/17 | | $ | 125 | | | $ | 137 | | |
6.13%, 11/21/17 - 5/15/18 | | | 557 | | | | 657 | | |
8.50%, 5/22/19 | | | 65 | | | | 86 | | |
CNA Financial Corp. | |
5.75%, 8/15/21 | | | 250 | | | | 291 | | |
Commonwealth Bank of Australia | |
1.90%, 9/18/17 | | | 250 | | | | 251 | | |
Cooperatieve Centrale Raiffeisen-Boerenleenbank
BA/Utrect | |
3.88%, 2/8/22 | | | 260 | | | | 276 | | |
Credit Agricole SA | |
3.00%, 10/1/17 (a)(c) | | | 250 | | | | 249 | | |
Credit Suisse, | |
5.40%, 1/14/20 | | | 295 | | | | 323 | | |
6.00%, 2/15/18 | | | 61 | | | | 69 | | |
Dexus Diversified Trust/Dexus Office Trust | |
5.60%, 3/15/21 (a) | | | 225 | | | | 236 | | |
DNB Bank ASA | |
3.20%, 4/3/17 (a) | | | 255 | | | | 267 | | |
Farmers Exchange Capital | |
7.05%, 7/15/28 (a) | | | 215 | | | | 262 | | |
Federal Realty Investment Trust | |
3.00%, 8/1/22 | | | 125 | | | | 125 | | |
General Electric Capital Corp., | |
3.15%, 9/7/22 | | | 300 | | | | 302 | | |
5.30%, 2/11/21 | | | 120 | | | | 138 | | |
Series G | |
6.00%, 8/7/19 | | | 666 | | | | 811 | | |
Goldman Sachs Group, Inc. (The), | |
5.75%, 1/24/22 | | | 360 | | | | 415 | | |
6.15%, 4/1/18 | | | 840 | | | | 982 | | |
6.75%, 10/1/37 | | | 50 | | | | 54 | | |
Goodman Funding Pty Ltd. | |
6.38%, 4/15/21 (a) | | | 250 | | | | 275 | | |
Hartford Financial Services Group, Inc. | |
5.50%, 3/30/20 | | | 275 | | | | 312 | | |
HBOS PLC, | |
Series G | |
6.75%, 5/21/18 (a)(b) | | | 357 | | | | 364 | | |
HCP, Inc. | |
5.63%, 5/1/17 | | | 95 | | | | 108 | | |
HSBC Finance Corp. | |
6.68%, 1/15/21 | | | 135 | | | | 157 | | |
HSBC Holdings PLC, | |
4.00%, 3/30/22 | | | 200 | | | | 215 | | |
4.88%, 1/14/22 (b) | | | 100 | | | | 115 | | |
6.50%, 5/2/36 | | | 100 | | | | 118 | | |
ING US, Inc. | |
5.50%, 7/15/22 (a) | | | 150 | | | | 157 | | |
JPMorgan Chase & Co., | |
4.50%, 1/24/22 | | | 380 | | | | 422 | | |
4.63%, 5/10/21 | | | 260 | | | | 291 | | |
The accompanying notes are an integral part of the financial statements.
9
Morgan Stanley Institutional Fund Trust
Annual Report — September 30, 2012
Portfolio of Investments (cont'd)
Corporate Bond Portfolio
| | | Face
Amount
(000) | | Value
(000) | |
Finance (cont'd) | |
Mack-Cali Realty LP | |
4.50%, 4/18/22 | | $ | 125 | | | $ | 134 | | |
Macquarie Group Ltd. | |
6.00%, 1/14/20 (a)(b) | | | 215 | | | | 231 | | |
Merrill Lynch & Co., Inc., | |
MTN | |
6.88%, 4/25/18 | | | 217 | | | | 260 | | |
MetLife, Inc. | |
7.72%, 2/15/19 | | | 70 | | | | 91 | | |
National Australia Bank Ltd. | |
2.75%, 3/9/17 | | | 250 | | | | 262 | | |
Nationwide Building Society | |
6.25%, 2/25/20 (a) | | | 260 | | | | 299 | | |
Nationwide Financial Services | |
5.38%, 3/25/21 (a) | | | 175 | | | | 186 | | |
Nordea Bank AB | |
4.88%, 5/13/21 (a) | | | 200 | | | | 210 | | |
Pacific LifeCorp | |
6.00%, 2/10/20 (a) | | | 150 | | | | 167 | | |
Platinum Underwriters Finance, Inc., | |
Series B | |
7.50%, 6/1/17 | | | 234 | | | | 258 | | |
PNC Funding Corp. | |
5.13%, 2/8/20 | | | 110 | | | | 131 | | |
Protective Life Corp. | |
7.38%, 10/15/19 | | | 175 | | | | 209 | | |
Prudential Financial, Inc. | |
7.38%, 6/15/19 | | | 200 | | | | 253 | | |
Royal Bank of Scotland Group PLC | |
2.55%, 9/18/15 | | | 205 | | | | 208 | | |
Santander Holdings USA, Inc., | |
3.00%, 9/24/15 | | | 55 | | | | 56 | | |
4.63%, 4/19/16 | | | 55 | | | | 58 | | |
Santander US Debt SAU | |
3.72%, 1/20/15 (a) | | | 200 | | | | 199 | | |
SLM Corp., | |
MTN | |
8.00%, 3/25/20 | | | 90 | | | | 104 | | |
Societe Generale SA | |
5.20%, 4/15/21 (a)(b) | | | 200 | | | | 215 | | |
Standard Chartered Bank | |
6.40%, 9/26/17 (a) | | | 200 | | | | 230 | | |
Swedbank AB | |
2.13%, 9/29/17 (a)(c) | | | 200 | | | | 200 | | |
US Bancorp | |
2.95%, 7/15/22 | | | 165 | | | | 167 | | |
WEA Finance LLC/WT Finance Aust Pty Ltd. | |
3.38%, 10/3/22 (a)(c) | | | 125 | | | | 125 | | |
WellPoint, Inc. | |
3.30%, 1/15/23 | | | 188 | | | | 191 | | |
| | | | 17,895 | | |
| | | Face
Amount
(000) | | Value
(000) | |
Industrials (49.4%) | |
ABB Treasury Center USA, Inc. | |
4.00%, 6/15/21 (a) | | $ | 50 | | | $ | 56 | | |
Agilent Technologies, Inc. | |
5.50%, 9/14/15 | | | 126 | | | | 142 | | |
Altria Group, Inc. | |
2.85%, 8/9/22 | | | 315 | | | | 315 | | |
America Movil SAB de CV | |
3.13%, 7/16/22 | | | 200 | | | | 207 | | |
Amgen, Inc. | |
3.88%, 11/15/21 | | | 430 | | | | 463 | | |
Anixter, Inc. | |
5.63%, 5/1/19 | | | 135 | | | | 142 | | |
ArcelorMittal | |
10.10%, 6/1/19 (b) | | | 209 | | | | 241 | | |
AstraZeneca PLC | |
6.45%, 9/15/37 | | | 125 | | | | 172 | | |
AT&T, Inc., | |
5.55%, 8/15/41 | | | 250 | | | | 312 | | |
6.30%, 1/15/38 | | | 275 | | | | 362 | | |
BAA Funding Ltd. | |
4.88%, 7/15/21 (a) | | | 190 | | | | 202 | | |
Ball Corp. | |
5.00%, 3/15/22 | | | 175 | | | | 184 | | |
Barrick Gold Corp. | |
3.85%, 4/1/22 | | | 105 | | | | 110 | | |
Barrick North America Finance LLC | |
4.40%, 5/30/21 | | | 145 | | | | 158 | | |
Bemis Co., Inc. | |
4.50%, 10/15/21 | | | 230 | | | | 253 | | |
Best Buy Co., Inc. | |
3.75%, 3/15/16 (b) | | | 220 | | | | 211 | | |
Boeing Capital Corp. | |
2.13%, 8/15/16 | | | 175 | | | | 184 | | |
Boston Scientific Corp. | |
6.00%, 1/15/20 | | | 105 | | | | 125 | | |
BP Capital Markets PLC | |
3.25%, 5/6/22 | | | 275 | | | | 292 | | |
Burlington Northern Santa Fe LLC, | |
3.05%, 3/15/22 | | | 150 | | | | 155 | | |
5.65%, 5/1/17 | | | 130 | | | | 156 | | |
Canadian Natural Resources Ltd. | |
6.25%, 3/15/38 | | | 150 | | | | 197 | | |
Canadian Oil Sands Ltd., | |
6.00%, 4/1/42 (a) | | | 50 | | | | 58 | | |
7.75%, 5/15/19 (a) | | | 175 | | | | 221 | | |
Caterpillar, Inc. | |
3.90%, 5/27/21 (b) | | | 130 | | | | 148 | | |
CenturyLink, Inc. | |
6.45%, 6/15/21 | | | 180 | | | | 203 | | |
CF Industries, Inc. | |
6.88%, 5/1/18 | | | 200 | | | | 244 | | |
The accompanying notes are an integral part of the financial statements.
10
Morgan Stanley Institutional Fund Trust
Annual Report — September 30, 2012
Portfolio of Investments (cont'd)
Corporate Bond Portfolio
| | | Face
Amount
(000) | | Value
(000) | |
Industrials (cont'd) | |
Cimarex Energy Co. | |
5.88%, 5/1/22 | | $ | 75 | | | $ | 79 | | |
Cisco Systems, Inc. | |
3.15%, 3/14/17 | | | 300 | | | | 329 | | |
Comcast Corp. | |
6.40%, 5/15/38 | | | 100 | | | | 128 | | |
Continental Resources, Inc. | |
5.00%, 9/15/22 | | | 175 | | | | 183 | | |
Corning, Inc. | |
4.75%, 3/15/42 | | | 160 | | | | 174 | | |
Covidien International Finance SA | |
3.20%, 6/15/22 (b) | | | 55 | | | | 58 | | |
CRH America, Inc. | |
6.00%, 9/30/16 | | | 400 | | | | 447 | | |
Daimler Finance North America LLC | |
8.50%, 1/18/31 | | | 161 | | | | 256 | | |
Darden Restaurants, Inc. | |
6.20%, 10/15/17 | | | 235 | | | | 274 | | |
Deere & Co. | |
3.90%, 6/9/42 | | | 60 | | | | 62 | | |
Delhaize Group SA | |
5.70%, 10/1/40 | | | 125 | | | | 112 | | |
Deutsche Telekom International Finance BV | |
8.75%, 6/15/30 | | | 100 | | | | 151 | | |
Diageo Investment Corp. | |
2.88%, 5/11/22 | | | 125 | | | | 131 | | |
DirecTV Holdings LLC/DirecTV Financing Co., Inc. | |
3.80%, 3/15/22 | | | 355 | | | | 366 | | |
Discovery Communications LLC | |
3.30%, 5/15/22 | | | 125 | | | | 130 | | |
DISH DBS Corp. | |
4.63%, 7/15/17 (a)(b) | | | 120 | | | | 123 | | |
Dr. Pepper Snapple Group, Inc. | |
7.45%, 5/1/38 | | | 100 | | | | 149 | | |
EOG Resources, Inc. | |
2.63%, 3/15/23 (b) | | | 150 | | | | 152 | | |
Experian Finance PLC | |
2.38%, 6/15/17 (a) | | | 210 | | | | 213 | | |
Express Scripts Holding Co., | |
2.65%, 2/15/17 (a) | | | 225 | | | | 236 | | |
3.90%, 2/15/22 (a) | | | 65 | | | | 71 | | |
Fiserv, Inc. | |
3.13%, 6/15/16 | | | 190 | | | | 200 | | |
FMC Technologies, Inc. | |
3.45%, 10/1/22 | | | 105 | | | | 107 | | |
Ford Motor Credit Co. LLC, | |
4.21%, 4/15/16 | | | 200 | | | | 212 | | |
5.88%, 8/2/21 (b) | | | 200 | | | | 227 | | |
Gap, Inc. (The) | |
5.95%, 4/12/21 | | | 185 | | | | 206 | | |
Georgia-Pacific LLC, | |
5.40%, 11/1/20 (a)(b) | | | 95 | | | | 112 | | |
8.88%, 5/15/31 | | | 75 | | | | 111 | | |
| | | Face
Amount
(000) | | Value
(000) | |
Gilead Sciences, Inc. | |
4.50%, 4/1/21 (b) | | $ | 140 | | | $ | 161 | | |
Grupo Bimbo SAB de CV | |
4.88%, 6/30/20 (a) | | | 225 | | | | 252 | | |
Halliburton Co. | |
4.50%, 11/15/41 | | | 175 | | | | 198 | | |
Harley-Davidson Funding Corp. | |
6.80%, 6/15/18 (a) | | | 245 | | | | 304 | | |
HCA, Inc. | |
5.88%, 3/15/22 | | | 175 | | | | 191 | | |
Hess Corp. | |
6.00%, 1/15/40 | | | 125 | | | | 152 | | |
Hewlett-Packard Co., | |
2.60%, 9/15/17 (b) | | | 80 | | | | 80 | | |
4.65%, 12/9/21 | | | 285 | | | | 298 | | |
Holcim US Finance Sarl & Cie SCS | |
6.00%, 12/30/19 (a)(b) | | | 182 | | | | 202 | | |
Home Depot, Inc. | |
5.88%, 12/16/36 | | | 159 | | | | 210 | | |
Incitec Pivot Ltd. | |
4.00%, 12/7/15 (a) | | | 160 | | | | 166 | | |
International Business Machines Corp. | |
1.25%, 2/6/17 | | | 200 | | | | 204 | | |
Inversiones CMPC SA | |
4.50%, 4/25/22 (a)(b) | | | 150 | | | | 157 | | |
Kinross Gold Corp. | |
5.13%, 9/1/21 (b) | | | 180 | | | | 187 | | |
Koninklijke Philips Electronics N.V. | |
3.75%, 3/15/22 (b) | | | 300 | | | | 325 | | |
Kraft Foods Group, Inc. | |
6.88%, 1/26/39 (a) | | | 225 | | | | 308 | | |
Kroger Co. (The) | |
6.90%, 4/15/38 | | | 80 | | | | 101 | | |
Lubrizol Corp. | |
8.88%, 2/1/19 | | | 165 | | | | 234 | | |
LyondellBasell Industries N.V. | |
5.00%, 4/15/19 | | | 200 | | | | 213 | | |
Macy's Retail Holdings, Inc. | |
3.88%, 1/15/22 (b) | | | 100 | | | | 108 | | |
Marathon Petroleum Corp., | |
5.13%, 3/1/21 | | | 195 | | | | 225 | | |
6.50%, 3/1/41 | | | 44 | | | | 54 | | |
McDonald's Corp. | |
2.63%, 1/15/22 | | | 250 | | | | 264 | | |
MeadWestvaco Corp. | |
7.38%, 9/1/19 (b) | | | 120 | | | | 152 | | |
Murphy Oil Corp. | |
4.00%, 6/1/22 | | | 225 | | | | 239 | | |
NBC Universal Media LLC, | |
2.88%, 1/15/23 (c) | | | 300 | | | | 301 | | |
5.95%, 4/1/41 | | | 125 | | | | 154 | | |
News America, Inc. | |
6.15%, 2/15/41 | | | 100 | | | | 125 | | |
The accompanying notes are an integral part of the financial statements.
11
Morgan Stanley Institutional Fund Trust
Annual Report — September 30, 2012
Portfolio of Investments (cont'd)
Corporate Bond Portfolio
| | | Face
Amount
(000) | | Value
(000) | |
Industrials (cont'd) | |
Odebrecht Finance Ltd. | |
6.00%, 4/5/23 (a) | | $ | 200 | | | $ | 223 | | |
Omnicom Group, Inc. | |
3.63%, 5/1/22 | | | 145 | | | | 153 | | |
PepsiCo, Inc. | |
2.75%, 3/5/22 (b) | | | 275 | | | | 286 | | |
Petro-Canada | |
6.80%, 5/15/38 | | | 130 | | | | 178 | | |
Philip Morris International, Inc. | |
4.50%, 3/20/42 (b) | | | 150 | | | | 166 | | |
Phillips 66 | |
4.30%, 4/1/22 (a) | | | 300 | | | | 329 | | |
Pioneer Natural Resources Co. | |
3.95%, 7/15/22 | | | 175 | | | | 186 | | |
SABMiller Holdings, Inc. | |
3.75%, 1/15/22 (a) | | | 200 | | | | 218 | | |
Sanofi | |
4.00%, 3/29/21 (b) | | | 150 | | | | 172 | | |
Schneider Electric SA | |
2.95%, 9/27/22 (a) | | | 225 | | | | 227 | | |
Sinopec Group Overseas Development 2012 Ltd. | |
2.75%, 5/17/17 (a)(d) | | | 200 | | | | 208 | | |
Sonoco Products Co. | |
5.75%, 11/1/40 | | | 150 | | | | 175 | | |
Stryker Corp. | |
2.00%, 9/30/16 | | | 325 | | | | 339 | | |
Syngenta Finance N.V. | |
4.38%, 3/28/42 | | | 75 | | | | 82 | | |
Teck Resources Ltd. | |
6.25%, 7/15/41 (b) | | | 90 | | | | 98 | | |
Telecom Italia Capital SA | |
7.18%, 6/18/19 (b) | | | 209 | | | | 231 | | |
Telefonaktiebolaget LM Ericsson | |
4.13%, 5/15/22 | | | 100 | | | | 103 | | |
Telefonica Europe BV | |
8.25%, 9/15/30 | | | 184 | | | | 196 | | |
Tesoro Corp. | |
5.38%, 10/1/22 | | | 45 | | | | 46 | | |
Teva Pharmaceutical Finance IV BV | |
3.65%, 11/10/21 | | | 250 | | | | 272 | | |
Thermo Fisher Scientific, Inc. | |
3.15%, 1/15/23 | | | 250 | | | | 259 | | |
Time Warner Cable, Inc., | |
4.50%, 9/15/42 | | | 130 | | | | 130 | | |
6.75%, 6/15/39 | | | 80 | | | | 105 | | |
Time Warner, Inc. | |
7.70%, 5/1/32 | | | 291 | | | | 410 | | |
Total Capital International SA | |
2.88%, 2/17/22 | | | 175 | | | | 182 | | |
Tronox Finance LLC | |
6.38%, 8/15/20 (a) | | | 124 | | | | 126 | | |
Union Pacific Corp. | |
4.30%, 6/15/42 | | | 200 | | | | 214 | | |
| | | Face
Amount
(000) | | Value
(000) | |
United Technologies Corp. | |
4.50%, 6/1/42 | | $ | 135 | | | $ | 152 | | |
URS Corp. | |
3.85%, 4/1/17 (a) | | | 300 | | | | 302 | | |
Valero Energy Corp. | |
6.13%, 2/1/20 (b) | | | 150 | | | | 182 | | |
Verisk Analytics, Inc. | |
5.80%, 5/1/21 | | | 185 | | | | 208 | | |
Verizon Communications, Inc., | |
6.35%, 4/1/19 (b) | | | 125 | | | | 160 | | |
8.95%, 3/1/39 (b) | | | 150 | | | | 262 | | |
VF Corp. | |
3.50%, 9/1/21 | | | 120 | | | | 129 | | |
Volkswagen International Finance N.V. | |
2.38%, 3/22/17 (a) | | | 160 | | | | 166 | | |
Waste Management, Inc. | |
6.13%, 11/30/39 | | | 100 | | | | 126 | | |
Watson Pharmaceuticals, | |
3.25%, 10/1/22 | | | 50 | | | | 51 | | |
4.63%, 10/1/42 | | | 30 | | | | 31 | | |
Weatherford International Ltd. | |
4.50%, 4/15/22 (b) | | | 150 | | | | 157 | | |
Wesfarmers Ltd. | |
2.98%, 5/18/16 (a) | | | 100 | | | | 105 | | |
Woolworths Ltd. | |
4.00%, 9/22/20 (a) | | | 140 | | | | 151 | | |
WPP Finance UK | |
8.00%, 9/15/14 | | | 136 | | | | 153 | | |
Wyndham Worldwide Corp. | |
4.25%, 3/1/22 | | | 255 | | | | 263 | | |
Wynn Las Vegas LLC/Wynn Las Vegas Capital Corp. | |
5.38%, 3/15/22 (a)(b) | | | 115 | | | | 117 | | |
Yum! Brands, Inc. | |
6.88%, 11/15/37 | | | 89 | | | | 122 | | |
| | | | 24,228 | | |
Utilities (8.5%) | |
Appalachian Power Co. | |
7.00%, 4/1/38 | | | 150 | | | | 210 | | |
Boston Gas Co. | |
4.49%, 2/15/42 (a) | | | 125 | | | | 138 | | |
Consolidated Edison Co. of New York, Inc. | |
6.65%, 4/1/19 | | | 190 | | | | 246 | | |
Duke Energy Carolinas LLC | |
1.75%, 12/15/16 (b) | | | 320 | | | | 331 | | |
Enel Finance International N.V. | |
5.13%, 10/7/19 (a)(b) | | | 200 | | | | 208 | | |
Enterprise Products Operating LLC, | |
5.25%, 1/31/20 | | | 25 | | | | 29 | | |
Series N | |
6.50%, 1/31/19 | | | 404 | | | | 502 | | |
Exelon Generation Co., LLC | |
6.25%, 10/1/39 | | | 145 | | | | 168 | | |
The accompanying notes are an integral part of the financial statements.
12
Morgan Stanley Institutional Fund Trust
Annual Report — September 30, 2012
Portfolio of Investments (cont'd)
Corporate Bond Portfolio
| | | Face
Amount
(000) | | Value
(000) | |
Utilities (cont'd) | |
FirstEnergy Solutions Corp., | |
6.05%, 8/15/21 | | $ | 96 | | | $ | 108 | | |
6.80%, 8/15/39 | | | 125 | | | | 138 | | |
Iberdrola Finance Ireland Ltd. | |
5.00%, 9/11/19 (a) | | | 175 | | | | 176 | | |
Kinder Morgan Energy Partners LP | |
5.95%, 2/15/18 | | | 300 | | | | 362 | | |
Nevada Power Co. | |
6.65%, 4/1/36 | | | 150 | | | | 208 | | |
Plains All American Pipeline LP/PAA Finance Corp. | |
6.70%, 5/15/36 | | | 136 | | | | 174 | | |
PPL WEM Holdings PLC | |
3.90%, 5/1/16 (a) | | | 315 | | | | 332 | | |
PSEG Power LLC | |
8.63%, 4/15/31 (b) | | | 200 | | | | 295 | | |
Sempra Energy | |
6.00%, 10/15/39 (b) | | | 125 | | | | 163 | | |
Spectra Energy Capital LLC | |
8.00%, 10/1/19 | | | 50 | | | | 65 | | |
Virginia Electric and Power Co. | |
2.95%, 1/15/22 (b) | | | 325 | | | | 345 | | |
| | | | 4,198 | | |
| | | | 46,321 | | |
Total Fixed Income Securities (Cost $43,381) | | | 46,519 | | |
| | | Shares | | | |
Short-Term Investments (20.0%) | |
Securities held as Collateral on Loaned Securities (14.3%) | |
Investment Company (10.6%) | |
Morgan Stanley Institutional
Liquidity Funds — Money Market Portfolio —
Institutional Class (See Note G) | | | 5,216,387 | | | | 5,216 | | |
| | | Face
Amount
(000) | | | |
Repurchase Agreements (3.7%) | |
Barclays Capital, Inc., (0.15%, dated 9/28/12,
due 10/1/12; proceeds $552; fully
collateralized by a U.S. Government
Obligation; U.S. Treasury Note 0.75%
due 6/30/17; valued at $563) | | $ | 552 | | | | 552 | | |
Merrill Lynch & Co., Inc., (0.15%, dated 9/28/12,
due 10/1/12; proceeds $204; fully
collateralized by a U.S. Government
Obligation; U.S. Treasury Note 1.75%
due 5/15/22; valued at $208) | | | 204 | | | | 204 | | |
Merrill Lynch & Co., Inc., (0.22%, dated 9/28/12,
due 10/1/12; proceeds $1,046; fully
collateralized by a U.S. Government Agency;
Federal National Mortgage Association 4.00%
due 4/1/42; valued at $1,067) | | | 1,046 | | | | 1,046 | | |
| | | | 1,802 | | |
Total Securities held as Collateral on
Loaned Securities (Cost $7,018) | | | 7,018 | | |
| | | Shares | | Value
(000) | |
Investment Company (5.6%) | |
Morgan Stanley Institutional
Liquidity Funds — Money Market
Portfolio — Institutional Class (See Note G)
(Cost $2,733) | | | 2,733,415 | | | $ | 2,733 | | |
| | | Face
Amount
(000) | | | |
U.S. Treasury Securities (0.1%) | |
U.S. Treasury Bills, | |
0.12%, 2/21/13 (e)(f) | | $ | 10 | | | | 10 | | |
0.13%, 2/21/13 (e)(f) | | | 40 | | | | 40 | | |
| | | | | | 50 | | |
Total Short-Term Investments (Cost $9,801) | | | 9,801 | | |
Total Investments (114.8%) (Cost $53,182)
Including $6,893 of Securities Loaned (g) | | | 56,320 | | |
Liabilities in Excess of Other Assets (-14.8%) | | | (7,253 | ) | |
Net Assets (100.0%) | | $ | 49,067 | | |
(a) 144A security — Certain conditions for public sale may exist. Unless otherwise noted, these securities are deemed to be liquid.
(b) All or a portion of this security was on loan at September 30, 2012.
(c) When-issued security.
(d) Security trades on the Hong Kong exchange.
(e) Rate shown is the yield to maturity at September 30, 2012.
(f) All or a portion of the security was pledged to cover margin requirements for futures contracts.
(g) Securities are available for collateral in connection with purchase of when-issued securities, open futures contracts and swap agreements.
IO Interest Only.
MTN Medium Term Note.
STRIPS Separate Trading of Registered Interest and Principal of Securities.
The accompanying notes are an integral part of the financial statements.
13
Morgan Stanley Institutional Fund Trust
Annual Report — September 30, 2012
Portfolio of Investments (cont'd)
Corporate Bond Portfolio
Futures Contracts:
The Portfolio had the following futures contracts open at September 30, 2012:
| | | Number
of
Contracts | | Value
(000) | | Expiration
Date | | Unrealized
Appreciation
(Depreciation)
(000) | |
Long: | |
U.S. Treasury 2 yr. Note | | | 42 | | | $ | 9,262 | | | Dec-12 | | $ | 6 | | |
U.S. Treasury 5 yr. Note | | | 59 | | | | 7,353 | | | Dec-12 | | | 22 | | |
U.S. Treasury Ultra Long Bond | | | 21 | | | | 3,470 | | | Dec-12 | | | (24 | ) | |
Short: | |
U.S. Treasury 10 yr. Note | | | 71 | | | | (9,478 | ) | | Dec-12 | | | (51 | ) | |
U.S. Treasury 30 yr. Bond | | | 9 | | | | (1,344 | ) | | Dec-12 | | | 4 | | |
| | | | | | | | | $ | (43 | ) | |
Interest Rate Swap Agreements:
The Portfolio had the following interest rate swap agreements open at September 30, 2012:
Swap Counterparty | | Floating Rate
Index | | Pay/Receive
Floating Rate | | Fixed Rate | | Termination
Date | | Notional
Amount
(000) | | Unrealized
Depreciation
(000) | |
Barclays Capital | | 3 Month LIBOR | | Receive | | | 0.81 | % | | 9/24/17 | | $ | 1,000 | | | $ | (2 | ) | |
Credit Suisse | | 3 Month LIBOR | | Receive | | | 0.39 | | | 9/25/14 | | | 3,150 | | | | (2 | ) | |
Credit Suisse | | 3 Month LIBOR | | Receive | | | 0.82 | | | 9/13/17 | | | 1,500 | | | | (5 | ) | |
Deutsche Bank | | 3 Month LIBOR | | Receive | | | 0.82 | | | 7/24/17 | | | 2,532 | | | | (12 | ) | |
Goldman Sachs | | 3 Month LIBOR | | Receive | | | 2.42 | | | 3/22/22 | | | 642 | | | | (46 | ) | |
JPMorgan Chase | | 3 Month LIBOR | | Receive | | | 2.43 | | | 3/22/22 | | | 311 | | | | (23 | ) | |
| | | | | | | | | | | | | | | $ | (90 | ) | |
LIBOR London Interbank Offered Rate.
The accompanying notes are an integral part of the financial statements.
14
Morgan Stanley Institutional Fund Trust
Annual Report — September 30, 2012
Statement of Assets and Liabilities | | September 30, 2012
(000) | |
Assets: | |
Investments in Securities of Unaffiliated Issuers, at Value(1) (Cost $44,457) | | $ | 47,491 | | |
Investment in Securities of Affiliated Issuers, at Value (Cost $8,725) | | | 8,829 | | |
Total Investments in Securities, at Value (Cost $53,182) | | | 56,320 | | |
Cash | | | 8 | | |
Receivable for Investments Sold | | | 685 | | |
Interest Receivable | | | 553 | | |
Receivable for Portfolio Shares Sold | | | 17 | | |
Receivable from Affiliates | | | 16 | | |
Receivable for Variation Margin | | | 2 | | |
Other Assets | | | 6 | | |
Total Assets | | | 57,607 | | |
Liabilities: | |
Collateral on Securities Loaned, at Value | | | 7,026 | | |
Payable for Investments Purchased | | | 1,253 | | |
Unrealized Depreciation on Swap Agreements | | | 90 | | |
Payable for Portfolio Shares Redeemed | | | 46 | | |
Payable for Advisory Fees | | | 46 | | |
Payable for Sub Transfer Agency Fees | | | 21 | | |
Payable for Professional Fees | | | 18 | | |
Payable for Trustees' Fees and Expenses | | | 14 | | |
Payable for Custodian Fees | | | 5 | | |
Payable for Administration Fees | | | 3 | | |
Payable for Shareholder Services Fees — Class P | | | — | @ | |
Payable for Shareholder Services Fees — Class H | | | — | @ | |
Payable for Distribution and Shareholder Services Fees — Class L | | | 1 | | |
Payable for Transfer Agent Fees | | | 1 | | |
Bank Overdraft | | | — | @ | |
Other Liabilities | | | 16 | | |
Total Liabilities | | | 8,540 | | |
Net Assets | | $ | 49,067 | | |
Net Assets Consist Of: | |
Paid-in-Capital | | $ | 104,805 | | |
Undistributed Net Investment Income | | | 553 | | |
Accumulated Net Realized Loss | | | (59,296 | ) | |
Unrealized Appreciation (Depreciation) on: | |
Investments | | | 3,034 | | |
Investments in Affiliates | | | 104 | | |
Futures Contracts | | | (43 | ) | |
Swap Agreements | | | (90 | ) | |
Net Assets | | $ | 49,067 | | |
The accompanying notes are an integral part of the financial statements.
15
Morgan Stanley Institutional Fund Trust
Annual Report — September 30, 2012
Statement of Assets and Liabilities (cont'd) | | September 30, 2012
(000) | |
CLASS I: | |
Net Assets | | $ | 44,779 | | |
| Shares Outstanding (unlimited number of shares authorized, no par value) (not in 000s) | | | 4,096,495 | | |
Net Asset Value, Offering and Redemption Price Per Share | | $ | 10.93 | | |
CLASS P: | |
Net Assets | | $ | 961 | | |
| Shares Outstanding (unlimited number of shares authorized, no par value) (not in 000s) | | | 87,967 | | |
Net Asset Value, Offering and Redemption Price Per Share | | $ | 10.92 | | |
CLASS H: | |
Net Assets | | $ | 178 | | |
| Shares Outstanding (unlimited number of shares authorized, no par value) (not in 000s) | | | 16,334 | | |
Net Asset Value, Redemption Price Per Share | | $ | 10.92 | | |
Maximum Sales Load | | | 3.50 | % | |
Maximum Sales Charge | | $ | 0.40 | | |
Maximum Offering Price Per Share | | $ | 11.32 | | |
CLASS L: | |
Net Assets | | $ | 3,149 | | |
| Shares Outstanding (unlimited number of shares authorized, no par value) (not in 000s) | | | 288,272 | | |
Net Asset Value, Offering and Redemption Price Per Share | | $ | 10.92 | | |
(1) Including:
Securities on Loan, at Value: | | $ | 6,893 | | |
@ Amount is less than $500.
The accompanying notes are an integral part of the financial statements.
16
Morgan Stanley Institutional Fund Trust
Annual Report — September 30, 2012
Statement of Operations | | Year Ended
September 30, 2012
(000) | |
Investment Income: | |
Interest from Securities of Unaffiliated Issuers (Net of $—@ Foreign Taxes Withheld) | | $ | 2,420 | | |
Interest from Securities of Affiliated Issuers | | | 60 | | |
Income from Securities Loaned — Net | | | 15 | | |
Dividends from Security of Affiliated Issuer | | | 2 | | |
Total Investment Income | | | 2,497 | | |
Expenses: | |
Advisory Fees (Note B) | | | 212 | | |
Professional Fees | | | 96 | | |
Administration Fees (Note C) | | | 45 | | |
Shareholder Reporting Fees | | | 44 | | |
Registration Fees | | | 43 | | |
Custodian Fees (Note F) | | | 34 | | |
Pricing Fees | | | 33 | | |
Sub Transfer Agency Fees | | | 29 | | |
Shareholder Services Fees — Class P (Note D) | | | 2 | | |
Shareholder Services Fees — Class H (Note D) | | | — | @ | |
Distribution and Shareholder Services Fees — Class L (Note D) | | | 18 | | |
Transfer Agency Fees (Note E) | | | 16 | | |
Trustees' Fees and Expenses | | | 3 | | |
Other Expenses | | | 12 | | |
Total Expenses | | | 587 | | |
Waiver of Shareholder Services Fees — Class P (Note D) | | | (1 | ) | |
Expense Offset (Note F) | | | (— | @) | |
Rebate from Morgan Stanley Affiliate (Note G) | | | (2 | ) | |
Net Expenses | | | 584 | | |
Net Investment Income | | | 1,913 | | |
Realized Gain (Loss): | |
Investments Sold | | | 3,641 | | |
Investments in Affiliates | | | 188 | | |
Futures Contracts | | | (303 | ) | |
Swap Agreements | | | (29 | ) | |
Net Realized Gain | | | 3,497 | | |
Change in Unrealized Appreciation (Depreciation): | |
Investments | | | 473 | | |
Investments in Affiliates | | | (71 | ) | |
Futures Contracts | | | 36 | | |
Swap Agreements | | | (90 | ) | |
Net Change in Unrealized Appreciation (Depreciation) | | | 348 | | |
Net Realized Gain and Change in Unrealized Appreciation (Depreciation) | | | 3,845 | | |
Net Increase in Net Assets Resulting from Operations | | $ | 5,758 | | |
@ Amount is less than $500.
The accompanying notes are an integral part of the financial statements.
17
Morgan Stanley Institutional Fund Trust
Annual Report — September 30, 2012
Statements of Changes in Net Assets | | Year Ended
September 30, 2012
(000) | | Year Ended
September 30, 2011
(000) | |
Increase (Decrease) in Net Assets: | |
Operations: | |
Net Investment Income | | $ | 1,913 | | | $ | 2,508 | | |
Net Realized Gain | | | 3,497 | | | | 2,094 | | |
Net Change in Unrealized Appreciation (Depreciation) | | | 348 | | | | (1,640 | ) | |
Net Increase in Net Assets Resulting from Operations | | | 5,758 | | | | 2,962 | | |
Distributions from and/or in Excess of: | |
Class I: | |
Net Investment Income | | | (2,199 | ) | | | (2,195 | ) | |
Class P: | |
Net Investment Income | | | (23 | ) | | | (14 | ) | |
Class H: | |
Net Investment Income | | | (9 | ) | | | (5 | ) | |
Class L: | |
Net Investment Income | | | (137 | ) | | | (119 | ) | |
Total Distributions | | | (2,368 | ) | | | (2,333 | ) | |
Capital Share Transactions:(1) | |
Class I: | |
Subscribed | | | 1,425 | | | | 4,447 | | |
Distributions Reinvested | | | 2,197 | | | | 2,100 | | |
Redeemed | | | (24,373 | ) | | | (24,083 | ) | |
Class P: | |
Subscribed | | | 809 | | | | 10 | | |
Distributions Reinvested | | | 23 | | | | 14 | | |
Redeemed | | | (325 | ) | | | (207 | ) | |
Class H: | |
Subscribed | | | — | | | | 301 | | |
Distributions Reinvested | | | 5 | | | | 2 | | |
Redeemed | | | (308 | ) | | | (1 | ) | |
Class L: | |
Subscribed | | | 58 | | | | 266 | | |
Distributions Reinvested | | | 137 | | | | 115 | | |
Redeemed | | | (1,342 | ) | | | (1,827 | ) | |
Net Decrease in Net Assets Resulting from Capital Share Transactions | | | (21,694 | ) | | | (18,863 | ) | |
Total Decrease in Net Assets | | | (18,304 | ) | | | (18,234 | ) | |
Net Assets: | |
Beginning of Period | | | 67,371 | | | | 85,605 | | |
End of Period (Including Undistributed Net Investment Income of $553 and $916) | | $ | 49,067 | | | $ | 67,371 | | |
(1) Capital Share Transactions: | |
Class I: | |
Shares Subscribed | | | 137 | | | | 443 | | |
Shares Issued on Distributions Reinvested | | | 213 | | | | 210 | | |
Shares Redeemed | | | (2,328 | ) | | | (2,383 | ) | |
Net Decrease in Class I Shares Outstanding | | | (1,978 | ) | | | (1,730 | ) | |
Class P: | |
Shares Subscribed | | | 77 | | | | 1 | | |
Shares Issued on Distributions Reinvested | | | 2 | | | | 1 | | |
Shares Redeemed | | | (31 | ) | | | (20 | ) | |
Net Increase (Decrease) in Class P Shares Outstanding | | | 48 | | | | (18 | ) | |
Class H: | |
Shares Subscribed | | | — | | | | 29 | | |
Shares Issued on Distributions Reinvested | | | — | @@ | | | — | @@ | |
Shares Redeemed | | | (30 | ) | | | (— | @@) | |
Net Increase (Decrease) in Class H Shares Outstanding | | | (30 | ) | | | 29 | | |
Class L: | |
Shares Subscribed | | | 5 | | | | 27 | | |
Shares Issued on Distributions Reinvested | | | 13 | | | | 12 | | |
Shares Redeemed | | | (127 | ) | | | (183 | ) | |
Net Decrease in Class L Shares Outstanding | | | (109 | ) | | | (144 | ) | |
@@ Amount is less than 500 shares.
The accompanying notes are an integral part of the financial statements.
18
Morgan Stanley Institutional Fund Trust
Annual Report — September 30, 2012
Financial Highlights
Corporate Bond Portfolio
| | | Class I | |
| | | Year Ended September 30, | |
Selected Per Share Data and Ratios | | 2012 | | 2011 | | 2010 | | 2009 | | 2008 | |
Net Asset Value, Beginning of Period | | $ | 10.27 | | | $ | 10.17 | | | $ | 9.75 | | | $ | 9.61 | | | $ | 11.15 | | |
Income (Loss) from Investment Operations: | |
Net Investment Income† | | | 0.36 | | | | 0.33 | | | | 0.33 | | | | 0.31 | | | | 0.55 | | |
Net Realized and Unrealized Gain (Loss) | | | 0.73 | | | | 0.07 | | | | 0.49 | | | | 0.38 | | | | (1.57 | ) | |
Total from Investment Operations | | | 1.09 | | | | 0.40 | | | | 0.82 | | | | 0.69 | | | | (1.02 | ) | |
Distributions from and/or in Excess of: | |
Net Investment Income | | | (0.43 | ) | | | (0.30 | ) | | | (0.40 | ) | | | (0.55 | ) | | | (0.52 | ) | |
Redemption Fees | | | — | | | | — | | | | — | | | | 0.00 | ‡ | | | 0.00 | ‡ | |
Net Asset Value, End of Period | | $ | 10.93 | | | $ | 10.27 | | | $ | 10.17 | | | $ | 9.75 | | | $ | 9.61 | | |
Total Return++ | | | 10.94 | % | | | 4.05 | % | | | 8.65 | % | | | 7.46 | % | | | (9.37 | )% | |
Ratios and Supplemental Data: | |
Net Assets, End of Period (Thousands) | | $ | 44,779 | | | $ | 62,410 | | | $ | 79,337 | | | $ | 140,890 | | | $ | 316,894 | | |
Ratio of Expenses to Average Net Assets | | | 1.00 | %+†† | | | 0.80 | %+†† | | | 0.76 | %+†† | | | 0.56 | %+ | | | 0.52 | %+ | |
Ratio of Net Investment Income to Average Net Assets | | | 3.41 | %+†† | | | 3.27 | %+†† | | | 3.36 | %+†† | | | 3.30 | %+ | | | 5.18 | %+ | |
Ratio of Rebate from Morgan Stanley Affiliates to Average Net Assets | | | 0.00 | %§ | | | 0.00 | %§ | | | 0.00 | %§ | | | 0.01 | % | | | 0.01 | % | |
Portfolio Turnover Rate | | | 129 | % | | | 224 | % | | | 277 | % | | | 545 | % | | | 325 | % | |
† Per share amount is based on average shares outstanding.
‡ Amount is less than $0.005 per share.
++ Calculated based on the net asset value as of the last business day of the period.
+ The Ratios of Expenses and Net Investment Income reflect the rebate of certain Portfolio expenses in connection with the investments in Morgan Stanley affiliates during the period. The effect of the rebate on the ratios is disclosed in the above table as "Ratio of Rebate from Morgan Stanley Affiliates to Average Net Assets."
†† Reflects overall Portfolio ratios for investment income and non-class specific expenses.
§ Amount is less than 0.005%.
The accompanying notes are an integral part of the financial statements.
19
Morgan Stanley Institutional Fund Trust
Annual Report — September 30, 2012
Financial Highlights
Corporate Bond Portfolio
| | | Class P | |
| | | Year Ended September 30, | |
Selected Per Share Data and Ratios | | 2012 | | 2011 | | 2010 | | 2009 | | 2008 | |
Net Asset Value, Beginning of Period | | $ | 10.27 | | | $ | 10.16 | | | $ | 9.74 | | | $ | 9.60 | | | $ | 11.14 | | |
Income (Loss) from Investment Operations: | |
Net Investment Income† | | | 0.34 | | | | 0.31 | | | | 0.31 | | | | 0.30 | | | | 0.53 | | |
Net Realized and Unrealized Gain (Loss) | | | 0.73 | | | | 0.08 | | | | 0.49 | | | | 0.38 | | | | (1.57 | ) | |
Total from Investment Operations | | | 1.07 | | | | 0.39 | | | | 0.80 | | | | 0.68 | | | | (1.04 | ) | |
Distributions from and/or in Excess of: | |
Net Investment Income | | | (0.42 | ) | | | (0.28 | ) | | | (0.38 | ) | | | (0.54 | ) | | | (0.50 | ) | |
Redemption Fees | | | — | | | | — | | | | — | | | | 0.00 | ‡ | | | 0.00 | ‡ | |
Net Asset Value, End of Period | | $ | 10.92 | | | $ | 10.27 | | | $ | 10.16 | | | $ | 9.74 | | | $ | 9.60 | | |
Total Return++ | | | 10.69 | % | | | 3.99 | % | | | 8.50 | % | | | 7.44 | % | | | (9.60 | )% | |
Ratios and Supplemental Data: | |
Net Assets, End of Period (Thousands) | | $ | 961 | | | $ | 408 | | | $ | 590 | | | $ | 611 | | | $ | 842 | | |
Ratio of Expenses to Average Net Assets (1) | | | 1.15 | %+†† | | | 0.95 | %+†† | | | 0.91 | %+†† | | | 0.69 | %+ | | | 0.67 | %+ | |
Ratio of Net Investment Income to Average Net Assets (1) | | | 3.26 | %+†† | | | 3.12 | %+†† | | | 3.21 | %+†† | | | 3.19 | %+ | | | 5.01 | %+ | |
Ratio of Rebate from Morgan Stanley Affiliates to Average Net Assets | | | 0.00 | %§ | | | 0.00 | %§ | | | 0.00 | %§ | | | 0.01 | % | | | 0.01 | % | |
Portfolio Turnover Rate | | | 129 | % | | | 224 | % | | | 277 | % | | | 545 | % | | | 325 | % | |
(1) Supplemental Information on the Ratios to Average Net Assets: | |
Ratios Before Expense Limitation: | |
Expenses to Average Net Assets | | | 1.25 | %†† | | | 1.05 | %†† | | | 1.01 | %+†† | | | 0.79 | %+ | | | 0.77 | %+ | |
Net Investment Income to Average Net Assets | | | 3.16 | %†† | | | 3.02 | %†† | | | 3.11 | %+†† | | | 3.09 | %+ | | | 4.91 | %+ | |
† Per share amount is based on average shares outstanding.
‡ Amount is less than $0.005 per share.
++ Calculated based on the net asset value as of the last business day of the period.
+ The Ratios of Expenses and Net Investment Income reflect the rebate of certain Portfolio expenses in connection with the investments in Morgan Stanley affiliates during the period. The effect of the rebate on the ratios is disclosed in the above table as "Ratio of Rebate from Morgan Stanley Affiliates to Average Net Assets."
†† Reflects overall Portfolio ratios for investment income and non-class specific expenses.
§ Amount is less than 0.005%.
The accompanying notes are an integral part of the financial statements.
20
Morgan Stanley Institutional Fund Trust
Annual Report — September 30, 2012
Financial Highlights
Corporate Bond Portfolio
| | | Class H | |
| | | Year Ended September 30, | | Period from
January 2, 2008^ to | |
Selected Per Share Data and Ratios | | 2012 | | 2011 | | 2010 | | 2009 | | September 30, 2008 | |
Net Asset Value, Beginning of Period | | $ | 10.27 | | | $ | 10.16 | | | $ | 9.74 | | | $ | 9.53 | | | $ | 11.15 | | |
Income (Loss) from Investment Operations: | |
Net Investment Income† | | | 0.33 | | | | 0.31 | | | | 0.31 | | | | 0.28 | | | | 0.21 | | |
Net Realized and Unrealized Gain (Loss) | | | 0.72 | | | | 0.07 | | | | 0.48 | | | | 0.39 | | | | (1.68 | ) | |
Total from Investment Operations | | | 1.05 | | | | 0.38 | | | | 0.79 | | | | 0.67 | | | | (1.47 | ) | |
Distributions from and/or in Excess of: | |
Net Investment Income | | | (0.40 | ) | | | (0.27 | ) | | | (0.37 | ) | | | (0.46 | ) | | | (0.15 | ) | |
Redemption Fees | | | — | | | | — | | | | — | | | | 0.00 | ‡ | | | — | | |
Net Asset Value, End of Period | | $ | 10.92 | | | $ | 10.27 | | | $ | 10.16 | | | $ | 9.74 | | | $ | 9.53 | | |
Total Return++ | | | 10.55 | % | | | 3.89 | % | | | 8.39 | % | | | 7.21 | % | | | (13.21 | )%# | |
Ratios and Supplemental Data: | |
Net Assets, End of Period (Thousands) | | $ | 178 | | | $ | 473 | | | $ | 170 | | | $ | 162 | | | $ | 85 | | |
Ratio of Expenses to Average Net Assets | | | 1.25 | %+†† | | | 1.05 | %+†† | | | 1.01 | %+†† | | | 0.81 | %+ | | | 2.98 | %*+ | |
Ratio of Net Investment Income to Average Net Assets | | | 3.16 | %+†† | | | 3.02 | %+†† | | | 3.11 | %+†† | | | 2.94 | %+ | | | 2.71 | %*+ | |
Ratio of Rebate from Morgan Stanley Affiliates to Average Net Assets | | | 0.00 | %§ | | | 0.00 | %§ | | | 0.00 | %§ | | | 0.01 | % | | | 0.01 | %* | |
Portfolio Turnover Rate | | | 129 | % | | | 224 | % | | | 277 | % | | | 545 | % | | | 325 | %# | |
^ Commencement of Operations.
† Per share amount is based on average shares outstanding.
‡ Amount is less than $0.005 per share.
++ Calculated based on the net asset value which does not reflect sales charges, if applicable, as of the last business day of the period.
# Not Annualized.
* Annualized.
+ The Ratios of Expenses and Net Investment Income reflect the rebate of certain Portfolio expenses in connection with the investments in Morgan Stanley affiliates during the period. The effect of the rebate on the ratios is disclosed in the above table as "Ratio of Rebate from Morgan Stanley Affiliates to Average Net Assets."
†† Reflects overall Portfolio ratios for investment income and non-class specific expenses.
§ Amount is less than 0.005%.
The accompanying notes are an integral part of the financial statements.
21
Morgan Stanley Institutional Fund Trust
Annual Report — September 30, 2012
Financial Highlights
Corporate Bond Portfolio
| | | Class L | |
| | | Year Ended September 30, | | Period from
June 16, 2008^ to | |
Selected Per Share Data and Ratios | | 2012 | | 2011 | | 2010 | | 2009 | | September 30, 2008 | |
Net Asset Value, Beginning of Period | | $ | 10.26 | | | $ | 10.15 | | | $ | 9.74 | | | $ | 9.63 | | | $ | 10.12 | | |
Income (Loss) from Investment Operations: | |
Net Investment Income† | | | 0.30 | | | | 0.28 | | | | 0.28 | | | | 0.24 | | | | 0.12 | | |
Net Realized and Unrealized Gain (Loss) | | | 0.74 | | | | 0.08 | | | | 0.48 | | | | 0.41 | | | | (0.60 | ) | |
Total from Investment Operations | | | 1.04 | | | | 0.36 | | | | 0.76 | | | | 0.65 | | | | (0.48 | ) | |
Distributions from and/or in Excess of: | |
Net Investment Income | | | (0.38 | ) | | | (0.25 | ) | | | (0.35 | ) | | | (0.54 | ) | | | (0.01 | ) | |
Redemption Fees | | | — | | | | — | | | | — | | | | 0.00 | ‡ | | | — | | |
Net Asset Value, End of Period | | $ | 10.92 | | | $ | 10.26 | | | $ | 10.15 | | | $ | 9.74 | | | $ | 9.63 | | |
Total Return++ | | | 10.38 | % | | | 3.51 | % | | | 8.15 | % | | | 7.08 | % | | | (4.73 | )%# | |
Ratios and Supplemental Data: | |
Net Assets, End of Period (Thousands) | | $ | 3,149 | | | $ | 4,080 | | | $ | 5,508 | | | $ | 5,159 | | | $ | 58 | | |
Ratio of Expenses Average Net Assets | | | 1.50 | %+†† | | | 1.30 | %+†† | | | 1.26 | %+†† | | | 1.06 | %+ | | | 1.15 | %+* | |
Ratio of Net Investment Income to Average Net Assets | | | 2.91 | %+†† | | | 2.77 | %+†† | | | 2.86 | %+†† | | | 2.58 | %+ | | | 4.34 | %+* | |
Ratio of Rebate from Morgan Stanley Affiliates to Average Net Assets | | | 0.00 | %§ | | | 0.00 | %§ | | | 0.00 | %§ | | | 0.01 | % | | | 0.01 | %* | |
Portfolio Turnover Rate | | | 129 | % | | | 224 | % | | | 277 | % | | | 545 | % | | | 325 | %# | |
^ Commencement of Operations.
† Per share amount is based on average shares outstanding.
‡ Amount is less than $0.005 per share.
++ Calculated based on the net asset value as of the last business day of the period.
# Not Annualized.
+ The Ratios of Expenses and Net Investment Income reflect the rebate of certain Portfolio expenses in connection with the investments in Morgan Stanley affiliates during the period. The effect of the rebate on the ratios is disclosed in the above table as "Ratio of Rebate from Morgan Stanley Affiliates to Average Net Assets."
†† Reflects overall Portfolio ratios for investment income and non-class specific expenses.
* Annualized.
§ Amount is less than 0.005%.
The accompanying notes are an integral part of the financial statements.
22
Morgan Stanley Institutional Fund Trust
Annual Report — September 30, 2012
Notes to Financial Statements
Morgan Stanley Institutional Fund Trust ("MSIFT'' or the "Fund'') is registered under the Investment Company Act of 1940, as amended (the "Act''), as an open-end management investment company. The Fund is comprised of seven separate, active portfolios (individually referred to as a "Portfolio", collectively as the "Portfolios"). All Portfolios are considered diversified for purposes of the Act.
The accompanying financial statements relate to the Corporate Bond Portfolio, formerly the "Investment Grade Fixed Income Portfolio". The Portfolio seeks above-average total return over a market cycle of three to five years. The Portfolio offers four classes of shares — Class I, Class P, Class H and Class L.
A. Significant Accounting Policies: The following significant accounting policies are in conformity with U.S. generally accepted accounting principles ("GAAP"). Such policies are consistently followed by the Fund in the preparation of its financial statements. GAAP may require management to make estimates and assumptions that affect the reported amounts and disclosures in the financial statements. Actual results may differ from those estimates.
1. Security Valuation: Bonds and other fixed income securities may be valued according to the broadest and most representative market. In addition, bonds and other fixed income securities may be valued on the basis of prices provided by a pricing service. The prices provided by a pricing service take into account broker-dealer market price quotations for institutional size trading in similar groups of securities, security quality, maturity, coupon and other security characteristics as well as any developments related to the specific securities. Short-term debt securities purchased with remaining maturities of 60 days or less are valued at amortized cost, unless the Board of Trustees (the "Trustees") determines such valuation does not reflect the securities' fair value, in which case these securities will be valued at their fair value as determined in good faith under procedures adopted by the Trustees. Equity securities listed on a U.S. exchange are valued at the latest quoted sales price on the valuation date. Equity securities listed or traded on NASDAQ, for which market quotations are available, are valued at the NASDAQ Official Closing Price. Securities listed on a foreign exchange are valued at their closing price, except as noted below. Unlisted and listed equity securities not traded on the valuation date, for which market quotations are readily available, are valued at the mean between the last reported bid and asked prices obtained from reputable brokers.
Under procedures approved by the Trustees, the Fund's adviser, Morgan Stanley Investment Management Inc. (the "Adviser"), has formed a Valuation Committee. The Valuation Committee provides administration and oversight of the Fund's valuation policies and procedures, which are reviewed at least annually by the Trustees. Among other things, these procedures allow the Fund to utilize independent pricing services, quotations from securities and financial instrument dealers, and other market sources to determine fair value.
The Fund has procedures to determine the fair value of securities and other financial instruments for which market prices are not readily available. Under these procedures, the Valuation Committee convenes on a regular and adhoc basis to review such securities and considers a number of factors, including valuation methodologies and significant unobservable valuation inputs, when arriving at fair value. The Valuation Committee may employ a market-based approach which may use related or comparable assets or liabilities, recent transactions, market multiples, book values, and other relevant information for the investment to determine the fair value of the investment. An income-based valuation approach may also be used in which the anticipated future cash flows of the investment are discounted to calculate fair value. Discounts may also be applied due to the nature or duration of any restrictions on the disposition of the investments. Due to the inherent uncertainty of valuations of such investments, the fair values may differ significantly from the values that would have been used had an active market existed. The Valuation Committee employs various methods for calibrating these valuation approaches including a regular review of valuation methodologies, key inputs and assumptions, transactional back-testing or disposition analysis, and reviews of any related market activity.
Most foreign markets close before the New York Stock Exchange ("NYSE"). Occasionally, developments that could affect the closing prices of securities and other assets may occur between the times at which valuations of such securities are determined (that is, close of the foreign market on which the securities trade) and the close of business on the NYSE. If these developments are expected to materially affect the value of the securities, the valuations may be adjusted to reflect the estimated fair
23
Morgan Stanley Institutional Fund Trust
Annual Report — September 30, 2012
Notes to Financial Statements (cont'd)
value as of the close of the NYSE, as determined in good faith under procedures established by the Trustees.
2. Fair Value Measurement: Financial Accounting Standards Board ("FASB") Accounting Standards CodificationTM ("ASC") 820, "Fair Value Measurements and Disclosures" ("ASC 820"), defines fair value as the value that the Fund would receive to sell an investment or pay to transfer a liability in a timely transaction with an independent buyer in the principal market, or in the absence of a principal market the most advantageous market for the investment or liability. ASC 820 establishes a three-tier hierarchy to distinguish between (1) inputs that reflect the assumptions market participants would use in valuing an asset or liability developed based on market data obtained from sources independent of the reporting entity (observable inputs) and (2) inputs that reflect the reporting entity's own assumptions about the assumptions market participants would use in valuing an asset or liability developed based on the best information available in the circumstances (unobservable inputs) and to establish classification of fair value measurements for disclosure purposes. Various inputs are used in determining the value of the Fund's investments. The inputs are summarized in the three broad levels listed below.
• Level 1 – unadjusted quoted prices in active markets for identical investments
• Level 2 – other significant observable inputs (including quoted prices for similar investments, interest rates, prepayment speeds, credit risk, etc.)
• Level 3 – significant unobservable inputs including the Fund's own assumptions in determining the fair value of investments. Factors considered in making this determination may include, but are not limited to, information obtained by contacting the issuer, analysts, or the appropriate stock exchange (for exchange-traded securities), analysis of the issuer's financial statements or other available documents and, if necessary, available information concerning other securities in similar circumstances
The inputs or methodology used for valuing securities are not necessarily an indication of the risk associated with investing in those securities and the determination
of the significance of a particular input to the fair value measurement in its entirety requires judgment and considers factors specific to each security.
The following is a summary of the inputs used to value the Portfolio's investments as of September 30, 2012.
Investment Type | | Level 1
Unadjusted
quoted
prices
(000) | | Level 2
Other
significant
observable
inputs
(000) | | Level 3
Significant
unobservable
inputs
(000) | | Total
(000) | |
Assets: | |
Fixed Income Securities | |
Asset-Backed Security | | $ | — | | | $ | 192 | | | $ | — | | | $ | 192 | | |
Collateralized Mortgage
Obligation — Agency
Collateral Series | | | — | | | | 6 | | | | — | | | | 6 | | |
Corporate Bonds | | | — | | | | 46,321 | | | | — | | | | 46,321 | | |
Total Fixed Income
Securities | | | — | | | | 46,519 | | | | — | | | | 46,519 | | |
Short-Term Investments | |
Investment Company | | | 7,949 | | | | — | | | | — | | | | 7,949 | | |
Repurchase Agreements | | | — | | | | 1,802 | | | | — | | | | 1,802 | | |
U.S. Treasury Securities | | | — | | | | 50 | | | | — | | | | 50 | | |
Total Short-Term
Investments | | | 7,949 | | | | 1,852 | | | | — | | | | 9,801 | | |
Futures Contracts | | | 32 | | | | — | | | | — | | | | 32 | | |
Total Assets | | | 7,981 | | | | 48,371 | | | | — | | | | 56,352 | | |
Liabilities: | |
Futures Contracts | | | (75 | ) | | | — | | | | — | | | | (75 | ) | |
Interest Rate Swap
Agreements | | | — | | | | (90 | ) | | | — | | | | (90 | ) | |
Total Liabilities | | | (75 | ) | | | (90 | ) | | | — | | | | (165 | ) | |
Total | | $ | 7,906 | | | $ | 48,281 | | | $ | — | | | $ | 56,187 | | |
Transfers between investment levels may occur as the markets fluctuate and/or the availability of data used in an investment's valuation changes. The Portfolio recognizes transfers between the levels as of the end of the period. As of September 30, 2012, the Portfolio did not have any investments transfer between investment levels.
3. Derivatives: The Portfolio may, but is not required to, use derivative instruments for a variety of purposes, including hedging, risk management, portfolio management or to earn income. Derivatives are financial instruments whose value is based on the value of an underlying asset, interest rate, index or financial instrument. A derivative instrument often has risks similar to its underlying asset and may have additional risks, including imperfect correlation between the value of the derivative and the underlying asset, risks of default by the counterparty to certain transactions, magnification of losses incurred due to changes in the market value of the securities, instruments,
24
Morgan Stanley Institutional Fund Trust
Annual Report — September 30, 2012
Notes to Financial Statements (cont'd)
indices or interest rates to which they relate, and risks that the transactions may not be liquid. The use of derivatives involves risks that are different from, and possibly greater than, the risks associated with other portfolio investments. Derivatives may involve the use of highly specialized instruments that require investment techniques and risk analyses different from those associated with other portfolio investments. All of the Portfolio's holdings, including derivative instruments, are marked-to-market each day with the change in value reflected in unrealized appreciation (depreciation). Upon disposition, a realized gain or loss is recognized.
Certain derivative transactions may give rise to a form of leverage. Leverage magnifies the potential for gain and risk for loss. Leverage associated with derivative transactions may cause the Portfolio to liquidate portfolio positions when it may not be advantageous to do so to satisfy its obligations or to meet earmarking or segregation requirements, pursuant to applicable Securities and Exchange Commission rules and regulations, or may cause the Portfolio to be more volatile than if the Portfolio had not been leveraged. Although the Adviser seeks to use derivatives to further the Portfolio's investment objectives, there is no assurance that the use of derivatives will achieve this result.
Following is a description of the derivative instruments and techniques that the Portfolio used during the period and their associated risks:
Futures: A futures contract is a standardized agreement between two parties to buy or sell a specific quantity of an underlying instrument at a specific price at a specific future time. The value of a futures contract tends to increase and decrease in tandem with the value of the underlying instrument. Depending on the terms of the particular contract, futures contracts are settled through either physical delivery of the underlying instrument on the settlement date or by payment of a cash settlement amount on the settlement date. During the period the futures contract is open, payments are received from or made to the broker based upon changes in the value of the contract (the variation margin). A decision as to whether, when and how to use futures involves the exercise of skill and judgment and even a well conceived futures transaction may be unsuccessful because of market behavior or unexpected events. In addition to the derivatives risks discussed above, the prices of futures can be
highly volatile, using futures can lower total return, and the potential loss from futures can exceed the Portfolio's initial investment in such contracts.
Swaps: An over-the-counter ("OTC") swap agreement is an agreement between two parties pursuant to which the parties exchange payments at specified dates on the basis of a specified notional amount, with the payments calculated by reference to specified securities, indexes, reference rates, currencies or other instruments. A small percentage of swap agreements are cleared through a central clearing house. Most swap agreements provide that when the period payment dates for both parties are the same, the payments are made on a net basis (i.e., the two payment streams are netted out, with only the net amount paid by one party to the other). The Portfolio's obligations or rights under a swap agreement entered into on a net basis will generally be equal only to the net amount to be paid or received under the agreement, based on the relative values of the positions held by each counterparty. In a zero coupon interest rate swap, payment only occurs at maturity, at which time one counterparty pays the total compounded fixed rate over the life of the swap and the other pays the total compounded floating rate that would have been earned had a series of floating rate investments been rolled over through the life of the swap. Most swap agreements are not entered into or traded on exchanges and there is no central clearing or guaranty function for swaps. These OTC swaps are often subject to credit risk or the risk of default or non-performance by the counterparty. Swaps could result in losses if interest rate or foreign currency exchange rates or credit quality changes are not correctly anticipated by the Portfolio or if the reference index, security or investments do not perform as expected.
When the Portfolio has an unrealized loss on a swap agreement, the Portfolio has instructed the custodian to pledge cash or liquid securities as collateral with a value approximately equal to the amount of the unrealized loss. Collateral pledges are monitored and subsequently adjusted if and when the swap valuations fluctuate. Cash collateral is included with "Due from (to) Broker" in the Statement of Assets and Liabilities. Cash collateral has been offset against open swap agreements under the provisions of FASB ASC 210 "Balance Sheet" (ASC 210). Offsetting of Amounts Related to Certain Contracts, an interpretation of ASC 210-20, are included within
25
Morgan Stanley Institutional Fund Trust
Annual Report — September 30, 2012
Notes to Financial Statements (cont'd)
"Unrealized Appreciation (Depreciation) on Swap Agreements" in the Statement of Assets and Liabilities. For cash collateral received, the Portfolio pays a monthly fee to the counterparty based on the effective rate for Federal Funds. This fee, when paid, is included within realized gain (loss) on swap agreements in the Statement of Operations.
FASB ASC 815, "Derivatives and Hedging: Overall" ("ASC 815"), is intended to improve financial reporting about derivative instruments by requiring enhanced disclosures to enable investors to better understand how and why the Portfolio uses derivative instruments, how these derivative instruments are accounted for and their effects on the Portfolio's financial position and results of operations.
The following table sets forth the fair value of the Portfolio's derivative contracts by primary risk exposure as of September 30, 2012.
Primary Risk Exposure | | Statement of
Assets and
Liabilities | | Futures
Contracts
(000)(a) | | Swap
Agreements
(000) | |
Assets: | |
Interest Rate Risk | | Receivables | | $ | 32 | | | $ | — | | |
Liabilities: | |
Interest Rate Risk | | Payables | | $ | 75 | | | $ | 90 | | |
(a) This amount represents the cumulative appreciation (depreciation) of futures contracts as reported in the Portfolio of Investments. The Statement of Assets and Liabilities only reflects the current day's net variation margin.
The following tables set forth by primary risk exposure the Portfolio's realized gains (losses) and change in unrealized appreciation (depreciation) by type of derivative contract for the year ended September 30, 2012 in accordance with ASC 815.
Realized Gain (Loss) | |
Primary Risk Exposure | | Derivative Type | | Value
(000) | |
Interest Rate Risk | | Futures Contracts | | $ | (303 | ) | |
| | | | | Swap Agreements | | | (29 | ) | |
| | | Total | | $ | (332 | ) | |
Change in Unrealized Appreciation (Depreciation) | |
Primary Risk Exposure | | Derivative Type | | Value
(000) | |
Interest Rate Risk | | Futures Contracts | | $ | 36 | | |
| | | | | Swap Agreements | | | (90 | ) | |
| | | Total | | $ | (54 | ) | |
For the year ended September 30, 2012, the average monthly original value of futures contracts was approximately $26,880,000 and the average monthly notional
amount of swap agreements was approximately $1,718,000.
4. Securities Lending: The Portfolio lends securities to qualified financial institutions, such as broker-dealers, to earn additional income. Any increase or decrease in the fair value of the securities loaned that might occur and any interest earned or dividends declared on those securities during the term of the loan would remain in the Portfolio. The Portfolio would receive cash or securities as collateral in an amount equal to or exceeding 100% of the current fair value of the loaned securities. The collateral is marked-to-market daily, by the securities lending agent, to ensure that a minimum of 100% collateral coverage is maintained.
Based on pre-established guidelines, the securities lending agent invests any cash collateral that is received in an affiliated money market portfolio and repurchase agreements. Securities lending income is generated from the earnings on the invested collateral and borrowing fees, less any rebates owed to the borrowers and compensation to the lending agent, and is recorded as "Income from Securities Loaned-Net" in the Portfolio's Statement of Operations. Risks in securities lending transactions are that a borrower may not provide additional collateral when required or return the securities when due, and that the value of the short-term investments will be less than the amount of cash collateral plus any rebate that is required to be returned to the borrower.
The value of loaned securities and related collateral outstanding at September 30, 2012 were approximately $6,893,000 and $7,026,000, respectively. The Portfolio received cash collateral of approximately $7,026,000, of which approximately $7,018,000 was subsequently invested in Repurchase Agreements and Morgan Stanley Institutional Liquidity Funds as reported in the Portfolio of Investments. At September 30, 2012, there was uninvested cash collateral of approximately $8,000, which is not reflected in the Portfolio of Investments. The Portfolio has the right under the lending agreement to recover the securities from the borrower on demand.
5. When-Issued/Delayed Delivery Securities: The Portfolio purchases and sells when-issued and delayed delivery securities. Securities purchased on a when-issued or delayed delivery basis are purchased for delivery beyond the normal settlement date at a stated price and yield, and
26
Morgan Stanley Institutional Fund Trust
Annual Report — September 30, 2012
Notes to Financial Statements (cont'd)
no income accrues to the Portfolio on such securities prior to delivery date. Payment and delivery for when-issued and delayed delivery securities can take place up to 120 days after the date of the transaction. When the Portfolio enters into a purchase transaction on a when-issued or delayed delivery basis, securities are available for collateral in an amount at least equal in value to the Portfolio's commitments to purchase such securities. Purchasing securities on a when-issued or delayed delivery basis may involve a risk that the market price at the time of delivery may be lower than the agreed upon purchase price, in which case there could be an unrealized loss at the time of delivery. Purchasing investments on a when-issued or delayed delivery basis may be considered a form of leverage which may increase the impact that gains (losses) may have on the Portfolio.
6. Indemnifications: The Fund enters into contracts that contain a variety of indemnifications. The Fund's maximum exposure under these arrangements is unknown. However, the Fund has not had prior claims or losses pursuant to these contracts and expects the risk of loss to be remote.
7. Other: Security transactions are accounted for on the date the securities are purchased or sold. Realized gains (losses) on the sale of investment securities are determined on the specific identified cost basis. Dividend income and distributions are recorded on the ex-dividend date (except for certain foreign dividends which may be recorded as soon as the Fund is informed of such dividends) net of applicable withholding taxes. Interest income is recognized on the accrual basis except where collection is in doubt. Discounts and premiums on securities purchased are amortized according to the effective yield method over their respective lives. Most expenses of the Fund can be directly attributed to a particular Portfolio. Expenses which cannot be directly attributed are apportioned among the Portfolios based upon relative net assets or other appropriate measures. Income, expenses (other than class specific expenses) and realized and unrealized gains or losses are allocated to each class of shares based upon their relative net assets.
B. Advisory Fees: The Adviser, a wholly-owned subsidiary of Morgan Stanley, provides the Portfolio with advisory services under the terms of an Investment Advisory Agreement, paid quarterly, at an annual rate of 0.375% of the average daily net assets of the Portfolio.
C. Administration Fees: The Adviser also serves as Administrator to the Fund and provides administrative services pursuant to an Administration Agreement for an annual fee, accrued daily and paid monthly, of 0.08% of the Portfolio's average daily net assets. Under a Sub-Administration Agreement between the Administrator and State Street Bank and Trust Company ("State Street"), State Street provides certain administrative services to the Fund. For such services, the Administrator pays State Street a portion of the fee the Administrator receives from the Fund.
D. Distribution and Shareholder Services Fees: Morgan Stanley Distribution, Inc. ("MSDI" or the "Distributor"), a wholly-owned subsidiary of the Adviser, and an indirect subsidiary of Morgan Stanley, serves as the Fund's Distributor of Portfolio shares pursuant to a Distribution agreement. The Fund has adopted Shareholder Services Plans with respect to Class P and Class H shares pursuant to Rule 12b-1 under the Act. Under the Shareholder Services Plans, the Portfolio pays the Distributor a shareholder services fee, accrued daily and paid monthly, at an annual rate of 0.25% of the Portfolio's average daily net assets attributable to Class P and Class H shares. The Distributor has agreed to waive 0.10% of the 0.25% shareholder services fee it is entitled to receive from Class P shares' average daily net assets for the Portfolio. For the year ended September 30, 2012, the Portfolio waived approximately $1,000.
The Fund has adopted a Distribution and Shareholder Services Plan with respect to Class L shares pursuant to Rule 12b-1 under the Act. Under the Distribution and Shareholder Services Plan, the Portfolio pays the Distributor a distribution fee, accrued daily and paid monthly, at an annual rate of 0.25% and a shareholder service fee, accrued daily and paid monthly, at an annual rate of 0.25% of the Portfolio's average daily net assets attributable to Class L shares.
The distribution and shareholder services fees are used to support the expenses associated with servicing and maintaining accounts. The Distributor may compensate other parties for providing shareholder support services to investors who purchase Class P, Class H and Class L shares.
E. Dividend Disbursing and Transfer Agent: The Fund's dividend disbursing and transfer agent is Morgan Stanley Services Company Inc. ("Morgan Stanley Services"). Pursuant to a transfer agency agreement, the Fund pays Morgan Stanley Services a fee based on the number of classes,
27
Morgan Stanley Institutional Fund Trust
Annual Report — September 30, 2012
Notes to Financial Statements (cont'd)
accounts and transactions relating to the Portfolios of the Fund.
F. Custodian Fees: State Street (the "Custodian") serves as Custodian for the Fund in accordance with a custodian agreement. The Custodian holds cash, securities, and other assets of the Fund as required by the Act. Custody fees are payable monthly based on assets held in custody, investment purchases and sales activity and account maintenance fees, plus reimbursement for certain out-of-pocket expenses.
The Fund has entered into an arrangement with its Custodian whereby credits realized on uninvested cash balances were used to offset a portion of the Portfolio's expenses. If applicable, these custodian credits are shown as "Expense Offset" in the Statement of Operations.
G. Security Transactions and Transactions with Affiliates: For the year ended September 30, 2012, purchases and sales of investment securities for the Portfolio, other than long-term U.S. Government securities and short-term investments, were approximately $63,416,000 and $53,604,000, respectively. For the year ended September 30, 2012, purchases and sales of long-term U.S. Government securities were approximately $7,519,000 and $39,180,000, respectively.
The Portfolio invests in the Institutional Class of the Morgan Stanley Institutional Liquidity Funds — Money Market Portfolio (the "Liquidity Funds"), an open-end management investment company managed by the Adviser, both directly, and as a portion of the securities held as collateral on loaned securities. Advisory fees paid by the Portfolio are reduced by an amount equal to its pro-rata share of the advisory and administration fees paid by the Portfolio due to its investment in the Liquidity Funds. For the year ended September 30, 2012, advisory fees paid were reduced by approximately $2,000 relating to the Portfolio's investment in the Liquidity Funds.
A summary of the Portfolio's transactions in shares of the Liquidity Funds during the year ended September 30, 2012 is as follows:
Value
September 30,
2011
(000) | | Purchases
at Cost
(000) | | Sales
(000) | | Dividend
Income
(000) | | Value
September 30,
2012
(000) | |
| $ | 4,141 | | | $ | 49,067 | | | $ | 45,259 | | | $ | 2 | | | $ | 7,949 | | |
For the year ended September 30, 2012, the Portfolio had transactions with Citigroup, Inc., and its affiliated broker-dealers which may be deemed affiliates of the Adviser, Administrator and Distributor under Section 17 of the Act.
Value
September 30,
2011
(000) | | Purchases
at Cost
(000) | | Sales
(000) | | Realized
Gain
(000) | | Interest
Income
(000) | | Value
September 30,
2012
(000) | |
| $ | 1,047 | | | $ | 1,212 | | | $ | 1,490 | | | $ | 188 | | | $ | 60 | | | $ | 880 | | |
The Portfolio has an unfunded Deferred Compensation Plan (the "Compensation Plan"), which allows each independent Trustee to defer payment of all, or a portion, of the fees he or she receives for serving on the Board of Trustees. Each eligible Trustee generally may elect to have the deferred amounts credited with a return equal to the total return on one or more of the Morgan Stanley funds that are offered as investment options under the Compensation Plan. Appreciation/depreciation and distributions received from these investments are recorded with an offsetting increase/decrease in the deferred compensation obligation and do not affect the net asset value of the Portfolio.
H. Federal Income Taxes: It is the Portfolio's intention to continue to qualify as a regulated investment company and distribute all of its taxable and tax-exempt income. Accordingly, no provision for Federal income taxes is required in the financial statements.
Dividend income and distributions to shareholders are recorded on the ex-dividend date. Interest income is recognized on an accrual basis. Dividends from net investment income, if any, are declared and paid quarterly. Net realized capital gains, if any, are distributed at least annually.
The Portfolio may be subject to taxes imposed by countries in which it invests. Such taxes are generally based on income and/or capital gains earned or repatriated. Taxes are accrued based on net investment income, net realized gains and net unrealized appreciation as such income and/or gains are earned. Taxes may also be based on transactions in foreign currency and are accrued based on the value of investments denominated in such currency.
FASB ASC 740-10, Income Taxes — Overall, sets forth a minimum threshold for financial statement recognition of the benefit of a tax position taken or expected to be taken in a tax return. Management has concluded there are no significant uncertain tax positions that would require recognition in the financial statements. If applicable, the Portfolio recognizes interest accrued related to unrecognized tax benefits in "Interest Expense" and penalties in "Other Expenses" in the Statement of Operations. The Portfolio files tax returns with the U.S. Internal Revenue Service, New York and various states. Each of the tax years in the four-year period ended September 30, 2012, remains subject to examination by taxing authorities.
28
Morgan Stanley Institutional Fund Trust
Annual Report — September 30, 2012
Notes to Financial Statements (cont'd)
The tax character of distributions paid may differ from the character of distributions shown in the Statements of Changes in Net Assets due to short-term capital gains being treated as ordinary income for tax purposes. The tax character of distributions paid during fiscal 2012 and 2011 was as follows:
2012 Distributions
Paid From:
Ordinary Income
(000) | | 2011 Distributions
Paid From:
Ordinary Income
(000) | |
| $ | 2,368 | | | $ | 2,333 | | |
The amount and character of income and gains to be distributed are determined in accordance with income tax regulations which may differ from GAAP. These book/tax differences are either considered temporary or permanent in nature.
Temporary differences are attributable to differing book and tax treatments for the timing of the recognition of gains (losses) on certain investment transactions and the timing of the deductibility of certain expenses.
Permanent differences, primarily due to basis adjustments for swap transactions and paydown adjustments, resulted in the following reclassifications among the components of net assets at September 30, 2012:
Accumulated
Undistributed
Net Investment
Income
(000) | | Accumulated
Net Realized
Loss
(000) | | Paid-in-
Capital
(000) | |
| $ | 92 | | | $ | (92 | ) | | | — | | |
At September 30, 2012, the components of distributable earnings for the Portfolio on a tax basis were as follows:
Undistributed
Ordinary
Income
(000) | | Undistributed
Long-Term
Capital Gain
(000) | |
| $ | 557 | | | | — | | |
At September 30, 2012, the aggregate cost for federal income tax purposes is approximately $53,182,000. The aggregate gross unrealized appreciation is approximately $3,220,000 and the aggregate gross unrealized depreciation is approximately $82,000 resulting in net unrealized appreciation of approximately $3,138,000.
On December 22, 2010, the Regulated Investment Company Modernization Act of 2010 (the "Modernization Act") was signed into law. The Modernization Act modernizes several tax provisions related to Regulated Investment Companies ("RICs") and their shareholders. One key change made by the Modernization Act is that capital losses will generally retain their character as short-term or long-term and may be carried
forward indefinitely to offset future gains. These losses are utilized before other capital loss carryforwards that expire. Generally, the Modernization Act is effective for taxable years beginning after December 22, 2010.
At September 30, 2012, the Portfolio had available for Federal income tax purposes unused capital losses, which will expire on the indicated dates:
Amount
(000) | | Expiration | |
| $ | 51,214 | | | September 30, 2017 | |
| | 8,130 | | | September 30, 2018 | |
To the extent that capital loss carryforwards are used to offset any future capital gains realized during the carryover period as provided by U.S. Federal income tax regulations, no capital gains tax liability will be incurred by the Portfolio for gains realized and not distributed. To the extent that capital gains are offset, such gains will not be distributed to the shareholders. During the year ended September 30, 2012, the Portfolio utilized capital loss carryforwards for U.S. Federal income tax purposes of approximately $3,205,000.
I. Accounting Pronouncement: In December 2011, FASB issued Accounting Standards Update ("ASU") 2011-11, Balance Sheet: Disclosures about Offsetting Assets and Liabilities. The pronouncement improves disclosures for recognized financial and derivative instruments that are either offset on the balance sheet in accordance with the offsetting guidance in ASC 210-20-45 or ASC 815-10-45 or are subject to an enforceable master netting agreements or similar. The Fund will be required to disclose information about rights to offset and related arrangements (such as collateral agreements) in order to enable financial statement users to understand the effect of those rights and arrangements on its financial position as well as disclose the following (1) gross amounts; (2) amounts offset in the statement of financial position; (3) any other amounts that can be offset in the event of bankruptcy, insolvency or default of any of the parties (including cash and noncash financial collateral); and (4) the Fund's net exposure. The requirements are effective for annual reporting periods beginning on or after January 1, 2013, and must be applied retrospectively. At this time, the Fund's management is evaluating the implications of ASU 2011-11 and its impact, if any, on the financial statements.
29
Morgan Stanley Institutional Fund Trust
Annual Report — September 30, 2012
Report of Independent Registered Public Accounting Firm
To the Shareholders and Board of Trustees of
Morgan Stanley Institutional Fund Trust —
Corporate Bond Portfolio
We have audited the accompanying statement of assets and liabilities, including the portfolio of investments, of Corporate Bond Portfolio (formerly Investment Grade Fixed Income Portfolio) (one of the portfolios constituting Morgan Stanley Institutional Fund Trust) (the "Portfolio") as of September 30, 2012, and the related statement of operations for the year then ended, the statements of changes in net assets for each of the two years in the period then ended, and the financial highlights for each of the periods indicated therein. These financial statements and financial highlights are the responsibility of the Portfolio's management. Our responsibility is to express an opinion on these financial statements and financial highlights based on our audits.
We conducted our audits in accordance with the standards of the Public Company Accounting Oversight Board (United States). Those standards require that we plan and perform the audit to obtain reasonable assurance about whether the financial statements and financial highlights are free of material misstatement. We were not engaged to perform an audit of the Portfolio's internal control over financial reporting. Our audits included consideration of internal control over financial reporting as a basis for designing audit procedures that are appropriate in the circumstances, but not for the purpose of expressing an opinion on the effectiveness of the Portfolio's internal control over financial reporting. Accordingly, we express no such opinion. An audit also includes examining, on a test basis, evidence supporting the amounts and disclosures in the financial statements and financial highlights, assessing the accounting principles used and significant estimates made by management, and evaluating the overall financial statement presentation. Our procedures included confirmation of securities owned as of September 30, 2012, by correspondence with the custodian and others, or by other appropriate auditing procedures where replies from others were not received. We believe that our audits provide a reasonable basis for our opinion.
In our opinion, the financial statements and financial highlights referred to above present fairly, in all material respects, the financial position of Corporate Bond Portfolio of Morgan Stanley Institutional Fund Trust at September 30, 2012, the results of its operations for the year then ended, the changes in its net assets for each of the two years in the period then ended, and the financial highlights for each of the periods indicated therein, in conformity with U.S. generally accepted accounting principles.

Boston, Massachusetts
November 27, 2012
30
Morgan Stanley Institutional Fund Trust
Annual Report — September 30, 2012
U.S. Privacy Policy (unaudited)
AN IMPORTANT NOTICE CONCERNING OUR U.S. PRIVACY POLICY
This privacy notice describes the U.S. privacy policy of Morgan Stanley Distribution, Inc., and the Morgan Stanley family of mutual funds ("us", "our", "we").
We are required by federal law to provide you with notice of our U.S. privacy policy ("Policy"). This Policy applies to both our current and former clients unless we state otherwise and is intended for individual clients who purchase products or receive services from us for personal, family or household purposes. This Policy is not applicable to partnerships, corporations, trusts or other non-individual clients or account holders, nor is this Policy applicable to individuals who are either beneficiaries of a trust for which we serve as trustee or participants in an employee benefit plan administered or advised by us. This Policy is, however, applicable to individuals who select us to be a custodian of securities or assets in individual retirement accounts, 401(k) accounts, or accounts subject to the Uniform Gifts to Minors Act.
This notice sets out our business practices to protect your privacy; how we collect and share personal information about you; and how you can limit our sharing or certain uses by others of this information. We may amend this Policy at any time, and will inform you of any changes to our Policy as required by law.
WE RESPECT YOUR PRIVACY
We appreciate that you have provided us with your personal financial information and understand your concerns about your information. We strive to safeguard the information our clients entrust to us. Protecting the confidentiality and security of client information is an important part of how we conduct our business.
This notice describes what personal information we collect about you, how we collect it, when we may share it with others, and how certain others may use it. It discusses the steps you may take to limit our sharing of certain information about you with our affiliated companies, including, but not limited to our affiliated banking businesses, brokerage firms and credit service affiliates. It also discloses how you may limit our affiliates' use of shared information for marketing purposes.
Throughout this Policy, we refer to the nonpublic information that personally identifies you as "personal information." We also use the term "affiliated company" in this notice. An affiliated company is a company in our family of companies and includes companies with the Morgan Stanley name. These affiliated companies are financial institutions such as broker-dealers, banks, investment advisers and credit card issuers. We refer to any company that is not an affiliated company as a nonaffiliated third party. For purposes of Section 5 of this notice, and your ability to limit certain uses of personal information by our affiliates, this notice applies to the use of personal information by our affiliated companies.
1. WHAT PERSONAL INFORMATION DO WE COLLECT FROM YOU?
We may collect the following types of information about you: (i) information provided by you, including information from applications and other forms we receive from you, (ii) information about your transactions with us or our affiliates, (iii) information about your transactions with nonaffiliated third parties, (iv) information from consumer reporting agencies, (v) information obtained from our websites, and (vi) information obtained from other sources. For example:
• We collect information such as your name, address, e-mail address, telephone/fax numbers, assets, income and investment objectives through applications and other forms you submit to us.
• We may obtain information about account balances, your use of account(s) and the types of products and services you prefer to receive from us through your dealings and transactions with us and other sources.
• We may obtain information about your creditworthiness and credit history from consumer reporting agencies.
• We may collect background information from and through third-party vendors to verify representations you have made and to comply with various regulatory requirements.
2. WHEN DO WE DISCLOSE PERSONAL INFORMATION WE COLLECT ABOUT YOU?
We may disclose personal information we collect about you in each of the categories listed above to affiliated and nonaffiliated third parties.
31
Morgan Stanley Institutional Fund Trust
Annual Report — September 30, 2012
U.S. Privacy Policy (unaudited) (cont'd)
a. Information we disclose to affiliated companies.
We may disclose personal information that we collect about you to our affiliated companies to manage your account(s) effectively, to service and process your transactions, and to let you know about products and services offered by us and affiliated companies, to manage our business, and as otherwise required or permitted by law. Offers for products and services from affiliated companies are developed under conditions designed to safeguard your personal information.
b. Information we disclose to third parties.
We may disclose personal information that we collect about you to nonaffiliated third parties to provide marketing services on our behalf or to other financial institutions with whom we have joint marketing agreements. We may also disclose all of the information we collect to other nonaffiliated third parties for our everyday business purposes, such as to process transactions, maintain account(s), respond to court orders and legal investigations, report to credit bureaus, offer our own products and services, protect against fraud, for institutional risk control, to perform services on our behalf, and as otherwise required or permitted by law.
When we share personal information about you with a nonaffiliated third party, they are required to limit their use of personal information about you to the particular purpose for which it was shared and they are not allowed to share personal information about you with others except to fulfill that limited purpose or as may be permitted or required by law.
3. HOW DO WE PROTECT THE SECURITY AND CONFIDENTIALITY OF PERSONAL INFORMATION WE COLLECT ABOUT YOU?
We maintain physical, electronic and procedural security measures that comply with applicable law and regulations to help safeguard the personal information we collect about you. We have internal policies governing the proper handling of client information by employees. Third parties that provide support or marketing services on our behalf may also receive personal information about you, and we require them to adhere to appropriate security standards with respect to such information.
4. HOW CAN YOU LIMIT OUR SHARING CERTAIN PERSONAL INFORMATION ABOUT YOU WITH OUR AFFILIATED COMPANIES FOR ELIGIBILITY DETERMINATION?
By following the opt-out procedures in Section 6 below, you may limit the extent to which we share with our affiliated companies, personal information that was collected to determine your eligibility for products and services such as your credit reports and other information that you have provided to us or that we may obtain from third parties ("eligibility information"). Eligibility information does not include your identification information or personal information pertaining to our transactions or experiences with you. Please note that, even if you direct us not to share eligibility information with our affiliated companies, we may still share your personal information, including eligibility information, with our affiliated companies under circumstances that are permitted under applicable law, such as to process transactions or to service your account.
5. HOW CAN YOU LIMIT THE USE OF CERTAIN PERSONAL INFORMATION ABOUT YOU BY OUR AFFILIATED COMPANIES FOR MARKETING?
By following the opt-out instructions in Section 6 below, you may limit our affiliated companies from marketing their products or services to you based on personal information we disclose to them. This information may include, for example, your income and account history with us. Please note that, even if you choose to limit our affiliated companies from using personal information about you that we may share with them for marketing their products and services to you, our affiliated companies may use your personal information that they obtain from us to market to you in circumstances permitted by law, such as if the affiliated party has its own relationship with you.
32
Morgan Stanley Institutional Fund Trust
Annual Report — September 30, 2012
U.S. Privacy Policy (unaudited) (cont'd)
6. HOW CAN YOU SEND US AN OPT-OUT INSTRUCTION?
If you wish to limit our sharing of eligibility information about you with our affiliated companies, or our affiliated companies' use of personal information for marketing purposes, as described in this notice, you may do so by:
• Calling us at (800) 548-7786
Monday–Friday between 8a.m. and 5p.m. (EST)
• Writing to us at the following address:
Morgan Stanley Services Company Inc.
c/o Privacy Coordinator
201 Plaza Two, 3rd Floor
Jersey City, New Jersey 07311
If you choose to write to us, your request should include: your name, address, telephone number and account number(s) to which the opt-out applies and whether you are opting out with respect to sharing of eligibility information (Section 4 above), or information used for marketing (Section 5 above), or both. Written opt-out requests should not be sent with any other correspondence. In order to process your request, we require that the request be provided by you directly and not through a third party. Once you have informed us about your privacy preferences, your opt-out preference will remain in effect with respect to this Policy (as it may be amended) until you notify us otherwise. If you are a joint account owner, we will accept instructions from any one of you and apply those instructions to the entire account.
Please understand that if you limit our sharing or our affiliated companies' use of personal information, you and any joint account holder(s) may not receive information about our affiliated companies' products and services, including products or services that could help you manage your financial resources and achieve your investment objectives.
If you have more than one account or relationship with us, please specify the accounts to which you would like us to apply your privacy choices. If you have accounts or relationships with our affiliates, you may receive multiple privacy policies from them, and will need to separately notify those companies of your privacy choices for those accounts or relationships.
7. WHAT IF AN AFFILIATED COMPANY BECOMES A NONAFFILIATED THIRD PARTY?
If, at any time in the future, an affiliated company becomes a nonaffiliated third party, further disclosures of personal information made to the former affiliated company will be limited to those described in Section 2(b) above relating to nonaffiliated third parties. If you elected under Section 6 to limit disclosures we make to affiliated companies, or use of personal information by affiliated companies, your election will not apply to use by any former affiliated company of your personal information in their possession once it becomes a nonaffiliated third party.
SPECIAL NOTICE TO RESIDENTS OF VERMONT
The following section supplements our Policy with respect to our individual clients who have a Vermont address and supersedes anything to the contrary in the above Policy with respect to those clients only.
The State of Vermont requires financial institutions to obtain your consent prior to sharing personal information that they collect about you with nonaffiliated third parties, or eligibility information with affiliated companies, other than in certain limited circumstances. Except as permitted by law, we will not share personal information we collect about you with nonaffiliated third parties or eligibility information with affiliated companies, unless you provide us with your written consent to share such information.
SPECIAL NOTICE TO RESIDENTS OF CALIFORNIA
The following section supplements our Policy with respect to our individual clients who have a California address and supersedes anything to the contrary in the above Policy with respect to those clients only.
In response to a California law, if your account has a California home address, your personal information will not be disclosed to nonaffiliated third parties except as permitted by applicable California law, and we will limit sharing such personal information with our affiliates to comply with California privacy laws that apply to us.
33
Morgan Stanley Institutional Fund Trust
Annual Report — September 30, 2012
Trustee and Officer Information (unaudited)
Independent Trustees:
Name, Age and Address of
Independent Trustee | | Position(s)
Held with
Registrant | | Length of Time
Served* | | Principal Occupation(s) During Past 5 Years | | Number of
Portfolios in
Fund Complex
Overseen by
Independent
Trustee** | | Other Directorships
Held by Independent
Trustee*** | |
Frank L. Bowman (67)
c/o Kramer Levin Naftalis & Frankel LLP
Counsel to the Independent Trustees
1177 Avenue of the Americas
New York, NY 10036 | | Trustee | | Since
August 2006 | | President, Strategic Decisions, LLC (consulting) (since February 2009); Director or Trustee of various Morgan Stanley Funds (since August 2006); Chairperson of the Insurance Sub-Committee of the Compliance and Insurance Committee (since February 2007); served as President and Chief Executive Officer of the Nuclear Energy Institute (policy organization) (February 2005-November 2008); retired as Admiral, U.S. Navy after serving over 38 years on active duty including 8 years as Director of the Naval Nuclear Propulsion Program in the Department of the Navy and the U.S. Department of Energy (1996-2004); served as Chief of Naval Personnel (July 1994-September 1996); and on the Joint Staff as Director of Political Military Affairs (June 1992-July 1994); Knighted as Honorary Knight Commander of the Most Excellent Order of the British Empire; Awarded the Officer de l'Orde National du Mérite by the French Government; elected to the National Academy of Engineering (2009). | | | 102 | | | Director of BP p.l.c.; Director of Naval and Nuclear Technologies LLP; Director of the Armed Services YMCA of the USA and the Naval Submarine League; Director of the American Shipbuilding Suppliers Association; Member of the National Security Advisory Council of the Center for U.S. Global Engagement and a member of the CNA Military Advisory Board; Member of the American Lung Association's President's Council. | |
Michael Bozic (71)
c/o Kramer Levin Naftalis & Frankel LLP
Counsel to the Independent Trustees
1177 Avenue of the Americas
New York, NY 10036 | | Trustee | | Since
April 1994 | | Private investor; Chairperson of the Compliance and Insurance Committee (since October 2006); Director or Trustee of various Morgan Stanley Funds (since April 1994); formerly, Chairperson of the Insurance Committee (July 2006-September 2006); Vice Chairman of Kmart Corporation (December 1998-October 2000), Chairman and Chief Executive Officer of Levitz Furniture Corporation (November 1995-November 1998) and President and Chief Executive Officer of Hills Department Stores (May 1991-July 1995); variously Chairman, Chief Executive Officer, President and Chief Operating Officer (1987-1991) of the Sears Merchandise Group of Sears, Roebuck & Co. | | | 104 | | | Director of various business organizations. | |
Kathleen A. Dennis (59)
c/o Kramer Levin Naftalis & Frankel LLP
Counsel to the Independent Trustees
1177 Avenue of the Americas
New York, NY 10036 | | Trustee | | Since
August 2006 | | President, Cedarwood Associates (mutual fund and investment management consulting) (since July 2006); Chairperson of the Money Market and Alternatives Sub-Committee of the Investment Committee (since October 2006) and Director or Trustee of various Morgan Stanley Funds (since August 2006); formerly, Senior Managing Director of Victory Capital Management (1993-2006). | | | 102 | | | Director of various non-profit organizations. | |
Dr. Manuel H. Johnson (63)
c/o Johnson Smick
Group, Inc.
888 16th Street, N.W.
Suite 740
Washington, D.C. 20006 | | Trustee | | Since
July 1991 | | Senior Partner, Johnson Smick International, Inc. (consulting firm); Chairperson of the Investment Committee (since October 2006) and Director or Trustee of various Morgan Stanley Funds (since July 1991); Co-Chairman and a founder of the Group of Seven Council (G7C) (international economic commission); formerly, Chairperson of the Audit Committee (July 1991-September 2006), Vice Chairman of the Board of Governors of the Federal Reserve System and Assistant Secretary of the U.S. Treasury. | | | 104 | | | Director of NVR, Inc. (home construction). | |
34
Morgan Stanley Institutional Fund Trust
Annual Report — September 30, 2012
Trustee and Officer Information (unaudited) (cont'd)
Independent Trustees: (cont'd)
Name, Age and Address of
Independent Trustee | | Position(s)
Held with
Registrant | | Length of Time
Served* | | Principal Occupation(s) During Past 5 Years | | Number of
Portfolios in
Fund Complex
Overseen by
Independent
Trustee** | | Other Directorships
Held by Independent
Trustee*** | |
Joseph J. Kearns (70)
c/o Kearns & Associates LLC
PMB754
22631 Pacific Coast Highway
Malibu, CA 90265 | | Trustee | | Since
August 1994 | | President, Kearns & Associates LLC (investment consulting); Chairperson of the Audit Committee (since October 2006) and Director or Trustee of various Morgan Stanley Funds (since August 1994); formerly, Deputy Chairperson of the Audit Committee (July 2003-September 2006) and Chairperson of the Audit Committee of various Morgan Stanley Funds (since August 1994); CFO of the J. Paul Getty Trust. | | | 105 | | | Director of Electro Rent Corporation (equipment leasing) and The Ford Family Foundation. | |
Michael F. Klein (53)
c/o Kramer Levin Naftalis & Frankel LLP
Counsel to the
Independent Trustees
1177 Avenue of the Americas
New York, NY 10036 | | Trustee | | Since
August 2006 | | Managing Director, Aetos Capital, LLC (since March 2000) and Co-President, Aetos Alternatives Management, LLC (since January 2004); Chairperson of the Fixed Income Sub-Committee of the Investment Committee (since October 2006) and Director or Trustee of various Morgan Stanley Funds (since August 2006); formerly, Managing Director, Morgan Stanley & Co. Inc. and Morgan Stanley Dean Witter Investment Management, President, various Morgan Stanley Funds (June 1998-March 2000) and Principal, Morgan Stanley & Co. Inc. and Morgan Stanley Dean Witter Investment Management (August 1997-December 1999). | | | 102 | | | Director of certain investment funds managed or sponsored by Aetos Capital, LLC. Director of Sanitized AG and Sanitized Marketing AG (specialty chemicals). | |
Michael E. Nugent (76)
c/o Triumph Capital, L.P.
445 Park Avenue
New York, NY 10022 | | Chairperson of the Board and Trustee | | Chairperson of the Boards since July 2006 and Trustee since July 1991 | | General Partner, Triumph Capital, L.P. (private investment partnership); Chairperson of the Boards of various Morgan Stanley Funds (since July 2006); Chairperson of the Closed-End Fund Committee (since June 2012) and Director or Trustee of various Morgan Stanley Funds (since July 1991); formerly, Chairperson of the Insurance Committee (until July 2006). | | | 104 | | | None. | |
W. Allen Reed (65)
c/o Kramer Levin Naftalis & Frankel LLP
Counsel to the
Independent Trustees
1177 Avenue of the Americas
New York, NY 10036 | | Trustee | | Since
August 2006 | | Chairperson of the Equity Sub-Committee of the Investment Committee (since October 2006) and Director or Trustee of various Morgan Stanley Funds (since August 2006); formerly, President and CEO of General Motors Asset Management; Chairman and Chief Executive Officer of the GM Trust Bank and Corporate Vice President of General Motors Corporation (August 1994-December 2005). | | | 102 | | | Director of Temple-Inland Industries (packaging and forest products); Director of Legg Mason, Inc. and Director of the Auburn University Foundation. | |
Fergus Reid (80)
c/o Joe Pietryka, Inc.
85 Charles Colman Blvd.
Pawling, NY 12564 | | Trustee | | Since
June 1992 | | Chairman, Joe Pietryka, Inc.; Chairperson of the Governance Committee and Director or Trustee of various Morgan Stanley Funds (since June 1992). | | | 105 | | | Trustee and Director of certain investment companies in the JPMorgan Funds complex managed by JP Morgan Investment Management Inc. | |
35
Morgan Stanley Institutional Fund Trust
Annual Report — September 30, 2012
Trustee and Officer Information (unaudited) (cont'd)
Interested Trustee:
Name, Age and Address of
Interested Trustee | | Position(s) Held
with Registrant | | Length of Time
Served* | | Principal Occupation(s) During Past 5 Years | | Number of
Portfolios in
Fund Complex
Overseen by
Interested
Trustee** | | Other Directorships
Held by Interested
Trustee*** | |
James F. Higgins (64)
c/o Morgan Stanley Services Company Inc.
Harborside Financial Center
201 Plaza Two
Jersey City, NJ 07311 | | Trustee | | Since
June 2000 | | Director or Trustee of various Morgan Stanley Funds (since June 2000); Senior Advisor of Morgan Stanley (since August 2000). | | | 103 | | | Director of AXA Financial, Inc. and The Equitable Life Assurance Society of the United States (financial services). | |
* Each Trustee serves an indefinite term, until his or her successor is elected.
** The Fund Complex includes (as of December 31, 2011) all open-end and closed-end funds (including all of their portfolios) advised by Morgan Stanley Investment Management Inc. (the "Adviser") and any funds that have an adviser that is an affiliated person of the Adviser (including, but not limited to, Morgan Stanley AIP GP LP).
*** This includes any directorships at public companies and registered investment companies held by the Trustee at any time during the past five years.
36
Morgan Stanley Institutional Fund Trust
Annual Report — September 30, 2012
Trustee and Officer Information (unaudited) (cont'd)
Executive Officers:
Name, Age and Address of Executive Officer | | Position(s) Held
with
Registrant | | Length of Time
Served* | | Principal Occupation(s) During Past 5 Years | |
Arthur Lev (51)
522 Fifth Avenue
New York, NY 10036 | | President and Principal Executive Officer – Equity and Fixed Income Funds | | Since June 2011 | | President and Principal Executive Officer (since June 2011) of the Equity and Fixed Income Funds in the Fund Complex; Head of the Long Only Business of Morgan Stanley Investment Management (since February 2011); Managing Director of the Adviser and various entities affiliated with the Adviser (since December 2006). Formerly, Chief Strategy Officer of Morgan Stanley Investment Management's Traditional Asset Management business (November 2010-February 2011); General Counsel of Morgan Stanley Investment Management (December 2006-October 2010); Partner and General Counsel of FrontPoint Partners LLC (July 2002-December 2006); Managing Director and General Counsel of Morgan Stanley Investment Management (May 2000-June 2002). | |
Mary Ann Picciotto (39)
c/o Morgan Stanley Services Company Inc.
Harborside Financial Center
201 Plaza Two
Jersey City, NJ 07311 | | Chief Compliance Officer | | Since May 2010 | | Managing Director of the Adviser and various entities affiliated with the Adviser; Chief Compliance Officer of various Morgan Stanley Funds (since May 2010); Chief Compliance Officer of the Adviser (since April 2007). | |
Stefanie V. Chang Yu (45)
522 Fifth Avenue
New York, NY 10036 | | Vice President | | Since December 1997 | | Managing Director of the Adviser and various entities affiliated with the Adviser; Vice President of various Morgan Stanley Funds (since December 1997). | |
Francis J. Smith (47)
c/o Morgan Stanley Services Company Inc.
Harborside Financial Center
201 Plaza Two
Jersey City, NJ 07311 | | Treasurer and Principal Financial
Officer | | Treasurer since July 2003 and Principal Financial Officer since September 2002 | | Executive Director of the Adviser and various entities affiliated with the Adviser; Treasurer and Principal Financial Officer of various Morgan Stanley Funds (since July 2003). | |
Mary E. Mullin (45)
522 Fifth Avenue
New York, NY 10036 | | Secretary | | Since June 1999 | | Executive Director of the Adviser and various entities affiliated with the Adviser; Secretary of various Morgan Stanley Funds (since June 1999). | |
* Each officer serves an indefinite term, until his or her successor is elected.
37
Morgan Stanley Institutional Fund Trust
Annual Report — September 30, 2012
Adviser and Administrator
Morgan Stanley Investment Management Inc.
522 Fifth Avenue
New York, New York 10036
Distributor
Morgan Stanley Distribution, Inc.
522 Fifth Avenue
New York, New York 10036
Dividend Disbursing and Transfer Agent
Morgan Stanley Services Company Inc.
P.O. Box 219804
Kansas City, Missouri 64121
Custodian
State Street Bank and Trust Company
One Lincoln Street
Boston, Massachusetts 02111
Legal Counsel
Dechert LLP
1095 Avenue of the Americas
New York, New York 10036
Independent Registered Public Accounting Firm
Ernst & Young LLP
200 Clarendon Street
Boston, Massachusetts 02116
Reporting to Shareholders
Each Morgan Stanley fund provides a complete schedule of portfolio holdings in its semi-annual and annual reports within 60 days of the end of the fund's second and fourth fiscal quarters by filing the schedule electronically with the Securities and Exchange Commission (SEC). The semi-annual reports are filed on Form N-CSRS and the annual reports are filed on Form N-CSR. Morgan Stanley also delivers the semi-annual and annual reports to fund shareholders and makes these reports available on its public website, www.morganstanley.com/im. Each Morgan Stanley fund also files a complete schedule of portfolio holdings with the SEC for the fund's first and third fiscal quarters on Form N-Q. Morgan Stanley does not deliver the reports for the first and third fiscal quarters to shareholders, nor are the reports posted to the Morgan Stanley public website. You may, however, obtain the Form N-Q filings (as well as the Form N-CSR and N-CSRS filings) by accessing the SEC's website, www.sec.gov. You may also review and copy them at the SEC's Public Reference Room in Washington, DC. Information on the operation of the SEC's Public Reference Room may be obtained by calling the SEC toll free at 1-800-SEC-0330. You can also request copies of these materials, upon payment of a duplicating fee, by electronic request at the SEC's email address (publicinfo@sec.gov) or by writing the Public Reference Room of the SEC, Washington, DC 20549-0102.
Proxy Voting Policies and Procedures and Proxy Voting Record
You may obtain a copy of the Fund's Proxy Voting Policy and Procedures and information regarding how the Fund voted proxies relating to portfolio securities during the most recent twelve-month period ended June 30, without charge, upon request, by calling toll free 1-800-548-7786 or by visiting our website at www.morganstanley.com/im. This information is also available on the SEC's website at www.sec.gov.
This report is authorized for distribution only when preceded or accompanied by a prospectus of the Fund which describes in detail each Investment Portfolio's investment policies, risks, fees and expenses. Please read the prospectus carefully before you invest or send money. For additional information, including information regarding the investments comprising the Portfolio, please visit our website at www.morganstanley.com/im or call toll free 1-(800) 548-7786.
38
(This Page has been left blank intentionally.)
(This Page has been left blank intentionally.)
(This Page has been left blank intentionally.)
Printed in U.S.A.
This Report has been prepared for shareholders and may be distributed to others only if preceded or accompanied by a current prospectus.
Morgan Stanley Investment Management Inc.
522 Fifth Avenue
New York, New York 10036
© 2012 Morgan Stanley. Morgan Stanley Distribution, Inc.

IFTCBANN
IU12-02344P-Y09/12

Morgan Stanley
Institutional Fund Trust
Annual
Report
September 30, 2012


Morgan Stanley Institutional Fund Trust
Annual Report — September 30, 2012
Shareholders' Letter | | | 2 | | |
Expense Example | | | 3 | | |
Investment Advisory Agreement Approval | | | 4 | | |
Investment Overview | | | 6 | | |
Portfolio of Investments | | | 8 | | |
Statement of Assets and Liabilities | | | 11 | | |
Statement of Operations | | | 12 | | |
Statement of Changes in Net Assets | | | 13 | | |
Financial Highlights | | | 14 | | |
Notes to Financial Statements | | | 18 | | |
Report of Independent Registered Public Accounting Firm | | | 23 | | |
U.S. Privacy Policy | | | 24 | | |
Trustee and Officer Information | | | 27 | | |
This report is authorized for distribution only when preceded or accompanied by prospectuses of the Morgan Stanley Institutional Fund Trust. To receive a prospectus and/or SAI, which contains more complete information such as investment objectives, charges, expenses, policies for voting proxies, risk considerations, and describes in detail each of the Portfolio's investment policies to the prospective investor, please call toll free 1-(800) 548-7786. Please read the prospectuses carefully before you invest or send money.
Additionally, you can access portfolio information including performance, characteristics, and investment team commentary through Morgan Stanley Investment Management's website: www.morganstanley.com/im.
Market forecasts provided in this report may not necessarily come to pass. There is no guarantee that any sectors mentioned will continue to perform as discussed herein or that securities in such sectors will be held by the Portfolio in the future. There is no assurance that a Portfolio will achieve its investment objective. Portfolios are subject to market risk, which is the possibility that market values of securities owned by the Portfolio will decline and, therefore, the value of the Portfolio's shares may be less than what you paid for them. Accordingly, you can lose money investing in Portfolios. Please see the prospectus for more complete information on investment risks.
1
Morgan Stanley Institutional Fund Trust
Annual Report — September 30, 2012
Shareholders' Letter (unaudited)
Dear Shareholders,
We are pleased to provide this Annual report, in which you will learn how your investment in High Yield Portfolio performed during the period from February 7, 2012 to September 30, 2012.
Morgan Stanley Investment Management is a client-centric, investor-led organization. Our global presence, intellectual capital, and breadth of products and services enable us to partner with investors to meet the evolving challenges of today's financial markets. We aim to deliver superior investment service and to empower our clients to make the informed decisions that help them reach their investment goals.
As always, we thank you for selecting Morgan Stanley Investment Management, and look forward to working with you in the months and years ahead.
Sincerely,

Arthur Lev
President and Principal Executive Officer
October 2012
2
Morgan Stanley Institutional Fund Trust
Annual Report — September 30, 2012
Expense Example (unaudited)
High Yield Portfolio
As a shareholder of the Portfolio, you may incur two types of costs: (1) transactional costs, including sales charge (loads) on purchase payments; and (2) ongoing costs, including advisory fees, administration fees, distribution and shareholder servicing fees; and other Portfolio expenses. This example is intended to help you understand your ongoing costs (in dollars) of investing in the Portfolio and to compare these costs with the ongoing costs of investing in other mutual funds.
This example is based on an investment of $1,000 invested at the beginning of the six-month period ended September 30, 2012 and held for the entire six-month period.
Actual Expenses
The table below provides information about actual account values and actual expenses. You may use the information in this table, together with the amount you invested, to estimate the expenses that you paid over the period. Simply divide your account value by $1,000 (for example, an $8,600 account value divided by $1,000 = 8.6), then multiply the result by the number in the table under the heading entitled "Actual Expenses Paid During Period" to estimate the expenses you paid on your account during this period.
Please note that "Actual Expenses Paid During Period" are grossed up to reflect Portfolio expenses prior to the effect of Expense Offset (See Note F in the Notes to Financial Statements). Therefore, the annualized net expense ratios may differ from the ratio of expenses to average net assets shown in the Financial Highlights.
Hypothetical Example for Comparison Purposes
The table below provides information about hypothetical account values and hypothetical expenses based on the Portfolio's actual expense ratio and an assumed rate of return of 5% per year before expenses, which is not the Portfolio's actual return. The hypothetical account values and expenses may not be used to estimate the actual ending account balance or expenses you paid for the period. You may use this information to compare the ongoing costs of investing in the Portfolio and other funds. To do so, compare this 5% hypothetical example with the 5% hypothetical examples that appear in the shareholder reports of the other funds.
Please note that the expenses shown in the table are meant to highlight your ongoing costs only and do not reflect any transactional costs, such as sales charges (loads, if applicable). Therefore, the hypothetical account values and hypothetical expenses are useful in comparing ongoing costs only, and will not help you determine the relative total costs of owning different funds. In addition, if these transactional costs were included, your costs would have been higher.
| | | Beginning
Account
Value
4/1/12 | | Actual Ending
Account
Value
9/30/12 | | Hypothetical
Ending Account
Value | | Actual
Expenses
Paid
During
Period* | | Hypothetical
Expenses Paid
During Period* | | Net
Expense
Ratio
During
Period** | |
High Yield Portfolio Class I | | $ | 1,000.00 | | | $ | 1,085.70 | | | $ | 1,021.25 | | | $ | 3.91 | | | $ | 3.79 | | | | 0.75 | % | |
High Yield Portfolio Class P | | | 1,000.00 | | | | 1,084.20 | | | | 1,020.00 | | | | 5.21 | | | | 5.05 | | | | 1.00 | | |
High Yield Portfolio Class H | | | 1,000.00 | | | | 1,084.30 | | | | 1,020.00 | | | | 5.21 | | | | 5.05 | | | | 1.00 | | |
High Yield Portfolio Class L | | | 1,000.00 | | | | 1,081.70 | | | | 1,018.75 | | | | 6.51 | | | | 6.31 | | | | 1.25 | | |
* Expenses are calculated using each Portfolio Class' annualized net expense ratio (as disclosed), multiplied by the average account value over the period, and multiplied by 183/366 (to reflect the most recent one-half year period).
** Annualized.
3
Morgan Stanley Institutional Fund Trust
Annual Report — September 30, 2012
Investment Advisory Agreement Approval (unaudited)
Nature, Extent and Quality of Services
The Board reviewed and considered the nature and extent of the investment advisory services to be provided by the Adviser (as defined herein) under the advisory agreement, including portfolio management, investment research and equity and fixed income securities trading. The Board also reviewed and considered the nature and extent of the non-advisory, administrative services to be provided by the Adviser under the administration agreement, including accounting, clerical, bookkeeping, compliance, business management and planning, and the provision of supplies, office space and utilities at the Adviser's expense. (The advisory and administration agreements together are referred to as the "Management Agreement.")
The Board reviewed and considered the qualifications of the portfolio managers, the senior administrative managers and other key personnel of the Adviser who will provide the administrative and advisory services to the Portfolios. The Board determined that the Adviser's portfolio managers and key personnel are well qualified by education and/or training and experience to perform the services in an efficient and professional manner. The Board concluded that the nature and extent of the advisory and administrative services to be provided were necessary and appropriate for the conduct of the business and investment activities of the Portfolios and supported its decision to approve the Management Agreement.
Performance, Fees and Expenses of the Portfolio
The Board considered that the Adviser plans to arrange for a public offering of shares of the Portfolio to raise assets for investment and that the offering had not yet begun and concluded that, since the Portfolio currently had no assets to invest (other than seed capital required under the Investment Company Act) and had no track record of performance, this was not a factor it needed to address at the present time.
The Board reviewed the advisory and administrative fee rates (the "management fee rates") proposed to be paid by the Portfolio under the Management Agreement relative to comparable funds advised by the Adviser, when applicable, and compared to their peers as determined by the Adviser, and reviewed the anticipated total expense ratios of the Portfolio. The Board considered that the Portfolio requires the Adviser to develop processes, invest in additional resources and incur additional risks to successfully manage the Portfolio and concluded that the proposed management fee rate and anticipated total expense ratio would be competitive with its peer group average.
Economies of Scale
The Board considered the growth prospects of the Portfolio and the structure of the proposed management fee schedule, which does not include breakpoints for the Portfolio. The Board considered that the Portfolio's potential growth was uncertain and concluded that it would be premature to consider economies of scale as a factor in approving the Management Agreement at the present time.
Profitability of the Adviser and Affiliates
Since the Portfolio has not begun operations and has not paid any fees to the Adviser, the Board concluded that this was not a factor that needed to be considered at the present time.
Other Benefits of the Relationship
The Board considered other benefits to the Adviser and its affiliates derived from their relationship with the Portfolio and other funds advised by the Adviser. These benefits may include, among other things, "float" benefits derived from handling of checks for purchases and sales, research received by the Adviser generated from commission dollars spent on funds' portfolio trading and fees for distribution and/or shareholder servicing. Since the Portfolio has not begun operations and has not paid any fees to the Adviser, the Board concluded that these benefits were not a factor that needed to be considered at the present time.
Resources of the Adviser and Historical Relationship Between the Portfolios and the Adviser
The Board considered whether the Adviser is financially sound and has the resources necessary to perform its obligations under the Management Agreement. The Board also reviewed and considered the historical relationship between the Fund and the Adviser, including the organizational structure of the Adviser, the policies and procedures formulated and adopted by the Adviser for managing the Portfolio's operations and the Board's confidence in the competence and integrity of the senior managers and key
4
Morgan Stanley Institutional Fund Trust
Annual Report — September 30, 2012
Investment Advisory Agreement Approval (unaudited) (cont'd)
personnel of the Adviser. The Board concluded that the Adviser has the financial resources necessary to fulfill its obligations under the Management Agreement and that it is beneficial for the Portfolio to enter into this relationship with the Adviser.
Other Factors and Current Trends
The Board considered the controls and procedures adopted and implemented by the Adviser and monitored by the Fund's Chief Compliance Officer and concluded that the conduct of business by the Adviser indicates a good faith effort on its part to adhere to high ethical standards in the conduct of the Fund's business.
General Conclusion
After considering and weighing all of the above factors, the Board concluded that it would be in the best interest of the Portfolio and its future shareholders to approve the Management Agreement, which will remain in effect for two years and thereafter must be approved annually by the Board of the Fund if it is to continue in effect. In reaching this conclusion the Board did not give particular weight to any single factor referenced above. It is possible that individual Board members may have weighed these factors differently in reaching their individual decisions to approve the Management Agreement.
5
Morgan Stanley Institutional Fund Trust
Annual Report — September 30, 2012
Investment Overview (unaudited)
High Yield Portfolio
Performance
For the period from February 7, 2012 (the inception date of the Portfolio), through September 30, 2012, the Portfolio's Class I had a total return based on net asset value and reinvestment of distributions per share of 11.07%, net of fees. The Portfolio's Class I outperformed against its benchmark the Barclays Capital U.S. Corporate High Yield Index (the "Index"), which returned 7.97%.
Factors Affecting Performance
• Driven primarily by stabilization in the European sovereign crisis, high yield corporate credit markets performed strongly for the period from February 7 to September 30, 2012. The period can be characterized as a triumph of falling risk premiums over weak fundamentals, as risky assets rallied in the face of lackluster global economic data. Most importantly for high yield corporate credit spreads, coordinated unorthodox central bank actions served to reduce the "tail risks" that had previously been priced into the markets. The most notable announcement was the Outright Monetary Transactions (OMT) program of the European Central Bank (ECB). This was believed to dramatically reduce the likelihood of a disorderly default by periphery governments. While this program was announced late in the period, such involvement was anticipated by the market and was a major contributor to the decline in risk premiums.
• Much of the rally in asset prices occurred in spite of weaker growth prospects. The level of global growth remained subdued throughout the year and forward-looking indicators have been mixed as well. Economic data remains constrained by serious fiscal headwinds in Europe, an engineered slowdown in China and a looming "fiscal cliff" in the United States.
• Despite these headwinds to growth, central banks have succeeded in boosting asset prices, which should continue to feed through to improved economic conditions in the months ahead. This is not to say recession risk has been eliminated; however, central bankers will continue to work hard to avoid that outcome. We continue to believe that central banks will succeed and prevent any further significant slowdown with the caveat that fiscal agents do not do anything too outlandish (such as letting the U.S. fall off the "fiscal cliff" next year).
• While the strong market rally has reduced the risk premium in the high yield market, we continue to believe that conditions will favor the asset class over the rest of the year.
• The Portfolio was positioned with an overweight to high yield industrial credits and an underweight to high yield financial and utility credits, all of which benefited performance relative to the Index.
• Individual credit selection was also a positive for performance, as was an overweight to B-rated and CCC-rated credits.
Management Strategies
• The Portfolio is focused on middle-market high yield credits, which we define as companies with $200 million to $1 billion of total debt outstanding. We believe that this segment of the high yield market offers attractive opportunities, as market participants, including asset managers and sell-side research analysts, do not cover it as closely as they do the largest high yield credits.
• We positioned the Portfolio with a yield advantage of approximately 100 to 125 basis points relative to the Index. The Portfolio's duration was largely similar to that of the Index, while its average rating was B relative to the Index's average rating of B+.
• We believe that yields offered by high yield credits are likely to compensate investors for the expected default rate, although we may see an increase in defaults over the next year.
6
Morgan Stanley Institutional Fund Trust
Annual Report — September 30, 2012
Investment Overview (unaudited) (cont'd)
High Yield Portfolio
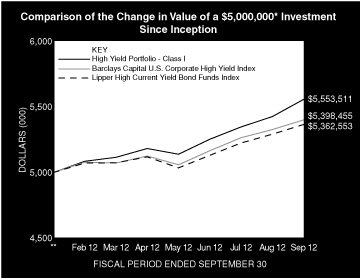
* Minimum Investment
** Commenced Operations on February 7, 2012.
In accordance with SEC regulations, the Portfolio's performance shown assumes that all recurring fees (including management fees) were deducted and all dividends and distributions were reinvested. The performance of Class P, Class H, and Class L shares will vary from the Class I shares and will be negatively impacted by additional fees assessed to those classes.
Performance Compared to the Barclays Capital U.S. Corporate High Yield Index(1) and the Lipper High Current Yield Bond Funds Index(2)
| | Period Ended September 30, 2012
Total Returns(3) | |
| | One
Year | | Five
Years | | Ten
Years | | Since
Inception(5) | |
Portfolio — Class H Shares
w/o sales charges(4) | | | — | | | | — | | | | — | | | | 10.92 | % | |
Portfolio — Class H Shares with
maximum 3.50% sales charges(4) | | | — | | | | — | | | | — | | | | 7.07 | | |
Barclays Capital U.S. Corporate
High Yield Index | | | — | | | | — | | | | — | | | | 7.97 | | |
Lipper High Current Yield Bond
Funds Index | | | — | | | | — | | | | — | | | | 7.25 | | |
Portfolio — Class I Shares
w/o sales charges(4) | | | — | | | | — | | | | — | | | | 11.07 | | |
Barclays Capital U.S. Corporate
High Yield Index | | | — | | | | — | | | | — | | | | 7.97 | | |
Lipper High Current Yield Bond
Funds Index | | | — | | | | — | | | | — | | | | 7.25 | | |
Portfolio — Class L Shares
w/o sales charges(4) | | | — | | | | — | | | | — | | | | 10.66 | | |
Barclays Capital U.S. Corporate
High Yield Index | | | — | | | | — | | | | — | | | | 7.97 | | |
Lipper High Current Yield Bond
Funds Index | | | — | | | | — | | | | — | | | | 7.25 | | |
| | Period Ended September 30, 2012
Total Returns(3) | |
| | One
Year | | Five
Years | | Ten
Years | | Since
Inception(5) | |
Portfolio — Class P Shares
w/o sales charges(4) | | | — | | | | — | | | | — | | | | 10.92 | % | |
Barclays Capital U.S. Corporate
High Yield Index | | | — | | | | — | | | | — | | | | 7.97 | | |
Lipper High Current Yield Bond
Funds Index | | | — | | | | — | | | | — | | | | 7.25 | | |
Performance data quoted represents past performance, which is no guarantee of future results, and current performance may be lower or higher than the figures shown. Performance assumes that all dividends and distributions, if any, were reinvested. Returns for periods less than one year are not annualized. For the most recent month-end performance figures, please visit www.morganstanley.com/im. Investment return and principal value will fluctuate so that Portfolio shares, when redeemed, may be worth more or less than their original cost. Total returns do not reflect the deduction of taxes that a shareholder would pay on Portfolio distributions or the redemption of Portfolio shares. Performance of share classes will vary due to differences in sales charges and expenses.
(1) The Barclays Capital U.S. Corporate High-Yield Index measures the market of USD-denominated, non-investment grade, fixed-rate, taxable corporate bonds. Securities are classified as high yield if the middle rating of Moody's, Fitch, and S&P is Ba1/BB+/BB+ or below. The index excludes emerging market debt. The index is unmanaged and its returns do not include any sales charges or fees. Such costs would lower performance. It is not possible to invest directly in an index.
(2) The Lipper High Current Yield Bond Funds Index is an equally weighted performance index of the largest qualifying funds (based on net assets) in the Lipper High Current Yield Bond Funds classification. The Index, which is adjusted for capital gains distributions and income dividends, is unmanaged and should not be considered an investment. There are currently 30 funds represented in this Index. As of the date of this report, the Portfolio was in the Lipper High Current Yield Bond Funds classification.
(3) Total returns for the Portfolio reflect expenses waived and/or reimbursed, if applicable, by the Adviser. Without such waivers and/or reimbursements, total returns would have been lower. The fee waivers and/or expense reimbursements will continue for at least one year or until such time as the Fund's Board of Trustees acts to discontinue all or a portion of such waivers and/or reimbursements when it deems such action is appropriate.
(4) Commenced operations on February 7, 2012.
(5) For comparative purposes, since inception returns listed for the Indexes refer to the inception date or initial offering of the respective share class of the Portfolio, not the inception of the Indexes.
Portfolio Composition
| Classification | | Percentage of
Total Investments | |
Consumer, Cyclical | | | 25.0 | % | |
Industrials | | | 20.0 | | |
Consumer, Non-Cyclical | | | 15.6 | | |
Energy | | | 8.7 | | |
Finance | | | 8.6 | | |
Communications | | | 8.1 | | |
Other* | | | 8.0 | | |
Basic Materials | | | 6.0 | | |
Total Investments | | | 100.0 | % | |
* Industries and/or investment types representing less than 5% of total investments.
7
Morgan Stanley Institutional Fund Trust
Annual Report — September 30, 2012
Portfolio of Investments
High Yield Portfolio
| | | Face
Amount
(000) | | Value
(000) | |
Fixed Income Securities (98.4%) | |
Corporate Bonds (98.4%) | |
Basic Materials (6.0%) | |
American Gilsonite Co. | |
11.50%, 9/1/17 (a) | | $ | 100 | | | $ | 103 | | |
FMG Resources August 2006 Pty Ltd. | |
6.88%, 4/1/22 (a) | | | 50 | | | | 46 | | |
HudBay Minerals, Inc. | |
9.50%, 10/1/20 (a) | | | 150 | | | | 158 | | |
Ineos Group Holdings SA | |
8.50%, 2/15/16 (a) | | | 150 | | | | 142 | | |
Inmet Mining Corp. | |
8.75%, 6/1/20 (a) | | | 50 | | | | 52 | | |
Kraton Polymers LLC/Kraton Polymers
Capital Corp. | |
6.75%, 3/1/19 | | | 50 | | | | 52 | | |
Olin Corp. | |
5.50%, 8/15/22 | | | 75 | | | | 78 | | |
Tronox Finance LLC | |
6.38%, 8/15/20 (a) | | | 50 | | | | 51 | | |
| | | | 682 | | |
Communications (8.1%) | |
Avaya, Inc. | |
7.00%, 4/1/19 (a) | | | 100 | | | | 94 | | |
Cablevision Systems Corp. | |
7.75%, 4/15/18 | | | 50 | | | | 56 | | |
GXS Worldwide, Inc. | |
9.75%, 6/15/15 | | | 150 | | | | 155 | | |
Harron Communications LP/Harron Finance Corp. | |
9.13%, 4/1/20 (a) | | | 150 | | | | 163 | | |
Intelsat Jackson Holdings SA | |
7.25%, 10/15/20 (a) | | | 50 | | | | 54 | | |
inVentiv Health, Inc. | |
10.25%, 8/15/18 (a) | | | 150 | | | | 133 | | |
Level 3 Financing, Inc. | |
8.13%, 7/1/19 | | | 50 | | | | 53 | | |
MDC Partners, Inc. | |
11.00%, 11/1/16 | | | 100 | | | | 109 | | |
SBA Telecommunications, Inc. | |
5.75%, 7/15/20 (a) | | | 100 | | | | 105 | | |
| | | | 922 | | |
Consumer, Cyclical (25.0%) | |
Academy Ltd./Academy Finance Corp. | |
9.25%, 8/1/19 (a) | | | 100 | | | | 110 | | |
Ameristar Casinos, Inc. | |
7.50%, 4/15/21 | | | 50 | | | | 54 | | |
Burlington Coat Factory Warehouse Corp. | |
10.00%, 2/15/19 | | | 100 | | | | 111 | | |
Caesars Entertainment Operating Co., Inc., | |
8.50%, 2/15/20 (a) | | | 50 | | | | 50 | | |
10.00%, 12/15/18 | | | 150 | | | | 99 | | |
CCM Merger, Inc. | |
9.13%, 5/1/19 (a) | | | 100 | | | | 102 | | |
| | | Face
Amount
(000) | | Value
(000) | |
Chester Downs & Marina LLC | |
9.25%, 2/1/20 (a) | | $ | 100 | | | $ | 101 | | |
Choice Hotels International, Inc. | |
5.75%, 7/1/22 | | | 50 | | | | 55 | | |
Chrysler Group LLC/CG Co-Issuer, Inc. | |
8.00%, 6/15/19 | | | 200 | | | | 213 | | |
CKE Restaurants, Inc. | |
11.38%, 7/15/18 | | | 89 | | | | 104 | | |
Diamond Resorts Corp. | |
12.00%, 8/15/18 | | | 150 | | | | 162 | | |
Exide Technologies | |
8.63%, 2/1/18 | | | 100 | | | | 87 | | |
Graton Economic Development Authority | |
9.63%, 9/1/19 (a) | | | 200 | | | | 208 | | |
IDQ Holdings, Inc. | |
11.50%, 4/1/17 (a) | | | 150 | | | | 160 | | |
INTCOMEX, Inc. | |
13.25%, 12/15/14 | | | 150 | | | | 154 | | |
Levi Strauss & Co. | |
6.88%, 5/1/22 | | | 50 | | | | 52 | | |
Libbey Glass, Inc. | |
6.88%, 5/15/20 (a) | | | 50 | | | | 54 | | |
Lions Gate Entertainment, Inc. | |
10.25%, 11/1/16 (a) | | | 100 | | | | 112 | | |
Logan's Roadhouse, Inc. | |
10.75%, 10/15/17 | | | 150 | | | | 147 | | |
MGM Resorts International | |
8.63%, 2/1/19 (a) | | | 50 | | | | 55 | | |
Rite Aid Corp. | |
9.50%, 6/15/17 | | | 50 | | | | 52 | | |
Sabre Holdings Corp. | |
8.35%, 3/15/16 | | | 160 | | | | 163 | | |
Scientific Games International, Inc. | |
6.25%, 9/1/20 (a) | | | 50 | | | | 50 | | |
Snoqualmie Entertainment Authority | |
9.13%, 2/1/15 (a) | | | 127 | | | | 129 | | |
Sonic Automotive, Inc. | |
7.00%, 7/15/22 (a) | | | 100 | | | | 108 | | |
VWR Funding, Inc. | |
7.25%, 9/15/17 (a) | | | 50 | | | | 51 | | |
Wolverine World Wide, Inc. | |
6.13%, 10/15/20 (a)(b) | | | 100 | | | | 100 | | |
| | | | 2,843 | | |
Consumer, Non-Cyclical (15.5%) | |
Armored Autogroup, Inc. | |
9.25%, 11/1/18 | | | 150 | | | | 135 | | |
BioScrip, Inc. | |
10.25%, 10/1/15 | | | 100 | | | | 108 | | |
Bumble Bee Holdco SCA,
PIK | |
9.63%, 3/15/18 (a)(c) | | | 200 | | | | 192 | | |
CHS/Community Health Systems, Inc. | |
7.13%, 7/15/20 | | | 50 | | | | 53 | | |
The accompanying notes are an integral part of the financial statements.
8
Morgan Stanley Institutional Fund Trust
Annual Report — September 30, 2012
Portfolio of Investments (cont'd)
High Yield Portfolio
| | | Face
Amount
(000) | | Value
(000) | |
Consumer, Non-Cyclical (cont'd) | |
Emergency Medical Services Corp. | |
8.13%, 6/1/19 | | $ | 50 | | | $ | 53 | | |
HCA, Inc. | |
5.88%, 3/15/22 | | | 50 | | | | 54 | | |
Hologic, Inc. | |
6.25%, 8/1/20 (a) | | | 100 | | | | 107 | | |
Kindred Healthcare, Inc. | |
8.25%, 6/1/19 | | | 150 | | | | 147 | | |
Knowledge Universe Education LLC | |
7.75%, 2/1/15 (a) | | | 150 | | | | 132 | | |
Mead Products LLC/ACCO Brands Corp. | |
6.75%, 4/30/20 (a) | | | 50 | | | | 52 | | |
Monitronics International, Inc. | |
9.13%, 4/1/20 | | | 100 | | | | 105 | | |
Physiotherapy Associates Holdings, Inc. | |
11.88%, 5/1/19 (a) | | | 100 | | | | 103 | | |
ServiceMaster Co. | |
8.00%, 2/15/20 | | | 100 | | | | 107 | | |
Smithfield Foods, Inc. | |
6.63%, 8/15/22 | | | 50 | | | | 52 | | |
Spectrum Brands, Inc. | |
6.75%, 3/15/20 (a) | | | 50 | | | | 52 | | |
Universal Hospital Services, Inc. | |
7.63%, 8/15/20 (a) | | | 50 | | | | 52 | | |
US Foods, Inc. | |
8.50%, 6/30/19 (a) | | | 100 | | | | 105 | | |
Vanguard Health Holding Co. II LLC/Vanguard
Holding Co. II, Inc. | |
8.00%, 2/1/18 | | | 50 | | | | 54 | | |
YCC Holdings LLC/Yankee Finance, Inc.,
PIK | |
10.25%, 2/15/16 (c) | | | 100 | | | | 104 | | |
| | | | 1,767 | | |
Energy (9.6%) | |
Bristow Group, Inc. | |
6.25%, 10/15/22 | | | 200 | | | | 205 | | |
Concho Resources, Inc. | |
5.50%, 10/1/22 | | | 50 | | | | 52 | | |
Continental Resources, Inc. | |
5.00%, 9/15/22 | | | 100 | | | | 105 | | |
Crestwood Midstream Partners LP/Crestwood
Midstream Finance Corp. | |
7.75%, 4/1/19 | | | 50 | | | | 51 | | |
Crosstex Energy LP/Crosstex Energy Finance Corp. | |
7.13%, 6/1/22 (a) | | | 50 | | | | 50 | | |
Eagle Rock Energy Partners LP/Eagle Rock
Energy Finance Corp. | |
8.38%, 6/1/19 | | | 50 | | | | 49 | | |
Laredo Petroleum, Inc. | |
7.38%, 5/1/22 | | | 100 | | | | 109 | | |
Northern Oil and Gas, Inc. | |
8.00%, 6/1/20 | | | 50 | | | | 52 | | |
| | | Face
Amount
(000) | | Value
(000) | |
Penn Virginia Corp. | |
10.38%, 6/15/16 | | $ | 150 | | | $ | 157 | | |
PetroBakken Energy Ltd. | |
8.63%, 2/1/20 (a) | | | 100 | | | | 104 | | |
SM Energy Co. | |
6.50%, 1/1/23 (a) | | | 50 | | | | 53 | | |
Tesoro Corp. | |
5.38%, 10/1/22 | | | 100 | | | | 103 | | |
| | | | 1,090 | | |
Finance (8.6%) | |
CNO Financial Group, Inc. | |
6.38%, 10/1/20 (a) | | | 150 | | | | 154 | | |
E*Trade Financial Corp. | |
7.88%, 12/1/15 | | | 50 | | | | 51 | | |
Icahn Enterprises LP/Icahn Enterprises
Finance Corp. | |
7.75%, 1/15/16 | | | 50 | | | | 52 | | |
Infor US, Inc. | |
11.50%, 7/15/18 (a) | | | 45 | | | | 52 | | |
Kennedy-Wilson, Inc. | |
8.75%, 4/1/19 | | | 50 | | | | 54 | | |
Nationstar Mortgage LLC/Nationstar Capital Corp. | |
7.88%, 10/1/20 (a) | | | 100 | | | | 102 | | |
Neuberger Berman Group LLC/Neuberger
Berman Finance Corp. | |
5.88%, 3/15/22 (a) | | | 100 | | | | 107 | | |
Nuveen Investments, Inc. | |
9.13%, 10/15/17 (a) | | | 100 | | | | 100 | | |
Pinnacle Foods Finance LLC/Pinnacle Foods
Finance Corp. | |
8.25%, 9/1/17 | | | 50 | | | | 54 | | |
Rivers Pittsburgh Borrower LP/Rivers Pittsburgh
Finance Corp. | |
9.50%, 6/15/19 (a) | | | 100 | | | | 107 | | |
USI Holdings Corp. | |
4.31%, 11/15/14 (a)(d) | | | 150 | | | | 146 | | |
| | | | 979 | | |
Industrials (19.9%) | |
Anixter, Inc. | |
5.63%, 5/1/19 | | | 50 | | | | 53 | | |
Atkore International, Inc. | |
9.88%, 1/1/18 | | | 100 | | | | 98 | | |
BE Aerospace, Inc. | |
5.25%, 4/1/22 | | | 50 | | | | 52 | | |
CEVA Group PLC | |
8.38%, 12/1/17 (a) | | | 100 | | | | 97 | | |
Consolidated Container Co., LLC/Consolidated
Container Capital, Inc. | |
10.13%, 7/15/20 (a) | | | 150 | | | | 160 | | |
Digicel Group Ltd. | |
8.25%, 9/30/20 (a) | | | 200 | | | | 211 | | |
DryShips, Inc. | |
5.00%, 12/1/14 | | | 100 | | | | 83 | | |
The accompanying notes are an integral part of the financial statements.
9
Morgan Stanley Institutional Fund Trust
Annual Report — September 30, 2012
Portfolio of Investments (cont'd)
High Yield Portfolio
| | | Face
Amount
(000) | | Value
(000) | |
Industrials (cont'd) | |
Griffon Corp. | |
7.13%, 4/1/18 | | $ | 50 | | | $ | 53 | | |
Heckmann Corp. | |
9.88%, 4/15/18 | | | 100 | | | | 103 | | |
Isabelle Acquisition Sub, Inc.,
PIK | |
10.00%, 11/15/18 (a)(c) | | | 150 | | | | 163 | | |
JB Poindexter & Co., Inc. | |
9.00%, 4/1/22 (a) | | | 150 | | | | 151 | | |
Kratos Defense & Security Solutions, Inc. | |
10.00%, 6/1/17 | | | 100 | | | | 109 | | |
Marquette Transportation Co./Marquette
Transportation Finance Corp. | |
10.88%, 1/15/17 | | | 150 | | | | 159 | | |
Navios Maritime Holdings, Inc./Navios Maritime
Finance II US, Inc. | |
8.13%, 2/15/19 | | | 100 | | | | 91 | | |
Pretium Packaging LLC/Pretium Finance, Inc. | |
11.50%, 4/1/16 | | | 100 | | | | 103 | | |
Quality Distribution LLC/QD Capital Corp. | |
9.88%, 11/1/18 | | | 150 | | | | 164 | | |
Sequa Corp. | |
11.75%, 12/1/15 (a) | | | 150 | | | | 158 | | |
Silgan Holdings, Inc. | |
5.00%, 4/1/20 | | | 50 | | | | 53 | | |
Tekni-Plex, Inc. | |
9.75%, 6/1/19 (a) | | | 100 | | | | 107 | | |
Terex Corp. | |
6.50%, 4/1/20 | | | 50 | | | | 52 | | |
Viasystems, Inc. | |
7.88%, 5/1/19 (a) | | | 50 | | | | 50 | | |
| | | | 2,270 | | |
Technology (3.8%) | |
CDW LLC/CDW Finance Corp. | |
8.50%, 4/1/19 | | | 50 | | | | 55 | | |
First Data Corp. | |
10.55%, 9/24/15 | | | 50 | | | | 51 | | |
Freescale Semiconductor, Inc. | |
9.25%, 4/15/18 (a) | | | 100 | | | | 109 | | |
iGate Corp. | |
9.00%, 5/1/16 | | | 50 | | | | 55 | | |
Infor US, Inc. | |
9.38%, 4/1/19 (a) | | | 100 | | | | 111 | | |
Unisys Corp. | |
6.25%, 8/15/17 | | | 50 | | | | 53 | | |
| | | | 434 | | |
Utilities (1.9%) | |
AES Corp. (The) | |
7.38%, 7/1/21 | | | 50 | | | | 57 | | |
CMS Energy Corp. | |
5.05%, 3/15/22 | | | 50 | | | | 56 | | |
| | | Face
Amount
(000) | | Value
(000) | |
GenOn Americas Generation LLC | |
8.50%, 10/1/21 | | $ | 100 | | | $ | 109 | | |
| | | | 222 | | |
Total Fixed Income Securities (Cost $10,839) | | | 11,209 | | |
| | | Shares | | | |
Short-Term Investment (1.3%) | |
Investment Company (1.3%) | |
Morgan Stanley Institutional Liquidity
Funds — Money Market Portfolio —
Institutional Class (See Note G)
(Cost $148) | | | 148,270 | | | | 148 | | |
Total Investments (99.7%) (Cost $10,987) | | | 11,357 | | |
Other Assets in Excess of Liabilities (0.3%) | | | 39 | | |
Net Assets (100.0%) | | $ | 11,396 | | |
(a) 144A security — Certain conditions for public sale may exist. Unless otherwise noted, these securities are deemed to be liquid.
(b) When-issued security.
(c) Payment-in-kind security.
(d) Variable/Floating Rate Security — Interest rate changes on these instruments are based on changes in a designated base rate. The rates shown are those in effect on September 30, 2012.
PIK Payment-in-Kind. Income may be paid in additional securities or cash at the discretion of the issuer.
The accompanying notes are an integral part of the financial statements.
10
Morgan Stanley Institutional Fund Trust
Annual Report — September 30, 2012
Statement of Assets and Liabilities | | September 30, 2012
(000) | |
Assets: | |
Investments in Securities of Unaffiliated Issuers, at Value (Cost $10,839) | | $ | 11,209 | | |
Investment in Security of Affiliated Issuer, at Value (Cost $148) | | | 148 | | |
Total Investments in Securities, at Value (Cost $10,987) | | | 11,357 | | |
Receivable for Investments Sold | | | 580 | | |
Interest Receivable | | | 245 | | |
Due from Adviser | | | 59 | | |
Prepaid Offering Costs | | | 48 | | |
Receivable from Affiliate | | | — | @ | |
Other Assets | | | 13 | | |
Total Assets | | | 12,302 | | |
Liabilities: | |
Payable for Investments Purchased | | | 875 | | |
Payable for Professional Fees | | | 24 | | |
Payable for Administration Fees | | | 1 | | |
Payable for Custodian Fees | | | 1 | | |
Payable for Transfer Agent Fees | | | 1 | | |
Payable for Shareholder Services Fees — Class P | | | — | @ | |
Payable for Shareholder Services Fees — Class H | | | — | @ | |
Payable for Distribution and Shareholder Services Fees — Class L | | | — | @ | |
Other Liabilities | | | 4 | | |
Total Liabilities | | | 906 | | |
Net Assets | | $ | 11,396 | | |
Net Assets Consist Of: | |
Paid-in-Capital | | $ | 10,684 | | |
Undistributed Net Investment Income | | | 126 | | |
Accumulated Net Realized Gain | | | 216 | | |
Unrealized Appreciation (Depreciation) on: | |
Investments | | | 370 | | |
Net Assets | | $ | 11,396 | | |
CLASS I: | |
Net Assets | | $ | 10,975 | | |
| Shares Outstanding (unlimited number of shares authorized, no par value) (not in 000s) | | | 1,024,913 | | |
Net Asset Value, Offering and Redemption Price Per Share | | $ | 10.71 | | |
CLASS P: | |
Net Assets | | $ | 107 | | |
| Shares Outstanding (unlimited number of shares authorized, no par value) (not in 000s) | | | 10,000 | | |
Net Asset Value, Offering and Redemption Price Per Share | | $ | 10.71 | | |
CLASS H: | |
Net Assets | | $ | 207 | | |
| Shares Outstanding (unlimited number of shares authorized, no par value) (not in 000s) | | | 19,311 | | |
Net Asset Value, Redemption Price Per Share | | $ | 10.71 | | |
Maximum Sales Load | | | 3.50 | % | |
Maximum Sales Charge | | $ | 0.39 | | |
Maximum Offering Price Per Share | | $ | 11.10 | | |
CLASS L: | |
Net Assets | | $ | 107 | | |
| Shares Outstanding (unlimited number of shares authorized, no par value) (not in 000s) | | | 10,000 | | |
Net Asset Value, Offering and Redemption Price Per Share | | $ | 10.70 | | |
@ Amount is less than $500.
The accompanying notes are an integral part of the financial statements.
11
Morgan Stanley Institutional Fund Trust
Annual Report — September 30, 2012
| Statement of Operations | | Period from
February 7, 2012^
to September 30,
2012
(000) | |
Investment Income: | |
Interest from Securities of Unaffiliated Issuers | | $ | 552 | | |
Dividends from Security of Affiliated Issuer | | | 1 | | |
Total Investment Income | | | 553 | | |
Expenses: | |
Offering Costs | | | 88 | | |
Professional Fees | | | 50 | | |
Advisory Fees (Note B) | | | 40 | | |
Transfer Agency Fees (Note E) | | | 8 | | |
Pricing Fees | | | 6 | | |
Custodian Fees (Note F) | | | 5 | | |
Administration Fees (Note C) | | | 5 | | |
Registration Fees | | | 4 | | |
Shareholder Services Fees — Class P (Note D) | | | — | @ | |
Shareholder Services Fees — Class H (Note D) | | | — | @ | |
Distribution and Shareholder Services Fees — Class L (Note D) | | | — | @ | |
Shareholder Reporting Fees | | | 1 | | |
Trustees' Fees and Expenses | | | — | @ | |
Other Expenses | | | 5 | | |
Total Expenses | | | 212 | | |
Expenses Reimbursed by Adviser (Note B) | | | (122 | ) | |
Waiver of Advisory Fees (Note B) | | | (40 | ) | |
Rebate from Morgan Stanley Affiliate (Note G) | | | (— | @) | |
Expense Offset (Note F) | | | (— | @) | |
Net Expenses | | | 50 | | |
Net Investment Income | | | 503 | | |
Realized Gain: | |
Investments Sold | | | 216 | | |
Change in Unrealized Appreciation (Depreciation): | |
Investments | | | 370 | | |
Net Realized Gain and Change in Unrealized Appreciation (Depreciation) | | | 586 | | |
Net Increase in Net Assets Resulting from Operations | | $ | 1,089 | | |
^ Commencement of Operations.
@ Amount is less than $500.
The accompanying notes are an integral part of the financial statements.
12
Morgan Stanley Institutional Fund Trust
Annual Report — September 30, 2012
Statement of Changes in Net Assets | | Period from
February 7, 2012^
to September 30,
2012
(000) | |
Increase in Net Assets: | |
Operations: | |
Net Investment Income | | $ | 503 | | |
Net Realized Gain | | | 216 | | |
Net Change in Unrealized Appreciation (Depreciation) | | | 370 | | |
Net Increase in Net Assets Resulting from Operations | | | 1,089 | | |
Distributions from and/or in Excess of: | |
Class I: | |
Net Investment Income | | | (365 | ) | |
Class P: | |
Net Investment Income | | | (4 | ) | |
Class H: | |
Net Investment Income | | | (5 | ) | |
Class L: | |
Net Investment Income | | | (3 | ) | |
Total Distributions | | | (377 | ) | |
Capital Share Transactions:(1) | |
Class I: | |
Subscribed | | | 10,286 | | |
Distributions Reinvested | | | 1 | | |
Class P: | |
Subscribed | | | 100 | | |
Class H: | |
Subscribed | | | 250 | | |
Distributions Reinvested | | | 1 | | |
Redeemed | | | (54 | ) | |
Class L: | |
Subscribed | | | 100 | | |
Net Increase in Net Assets Resulting from Capital Share Transactions | | | 10,684 | | |
Total Increase in Net Assets | | | 11,396 | | |
Net Assets: | |
Beginning of Period | | | — | | |
End of Period (Including Undistributed Net Investment Income of $126) | | $ | 11,396 | | |
(1) Capital Share Transactions: | |
Class I: | |
Shares Subscribed | | | 1,025 | | |
Shares Issued on Distributions Reinvested | | | — | @@ | |
Net Increase in Class I Shares Outstanding | | | 1,025 | | |
Class P: | |
Shares Subscribed | | | 10 | | |
Class H: | |
Shares Subscribed | | | 24 | | |
Shares Issued on Distributions Reinvested | | | — | @@ | |
Shares Redeemed | | | (5 | ) | |
Net Increase in Class H Shares Outstanding | | | 19 | | |
Class L: | |
Shares Subscribed | | | 10 | | |
^ Commencement of Operations.
@@ Amount is less than 500 shares.
The accompanying notes are an integral part of the financial statements.
13
Morgan Stanley Institutional Fund Trust
Annual Report — September 30, 2012
Financial Highlights
High Yield Portfolio
| | | Class I | |
Selected Per Share Data and Ratios | | Period from
February 7, 2012^ to
September 30, 2012 | |
Net Asset Value, Beginning of Period | | $ | 10.00 | | |
Income from Investment Operations: | |
Net Investment Income† | | | 0.50 | | |
Net Realized and Unrealized Gain | | | 0.59 | | |
Total from Investment Operations | | | 1.09 | | |
Distributions from and/or in Excess of: | |
Net Investment Income | | | (0.38 | ) | |
Net Asset Value, End of Period | | $ | 10.71 | | |
Total Return++ | | | 11.07 | %# | |
Ratios and Supplemental Data:†† | |
Net Assets, End of Period (Thousands) | | $ | 10,975 | | |
Ratio of Expenses to Average Net Assets (1) | | | 0.74 | %+* | |
Ratio of Net Investment Income to Average Net Assets (1) | | | 7.53 | %+* | |
Ratio of Rebate from Morgan Stanley Affiliates to Average Net Assets | | | 0.01 | %* | |
Portfolio Turnover Rate | | | 192 | %# | |
(1) Supplemental Information on the Ratios to Average Net Assets:†† | |
Ratios Before Expense Limitation: | |
Expenses to Average Net Assets | | | 3.17 | %* | |
Net Investment Income to Average Net Assets | | | 5.10 | %* | |
^ Commencement of Operations.
† Per share amount is based on average shares outstanding.
++ Calculated based on the net asset value as of the last business day of the period.
# Not Annualized.
†† Reflects overall Portfolio ratios for investment income and non-class specific expenses.
+ The Ratios of Expenses and Net Investment Income reflect the rebate of certain Portfolio expenses in connection with the investments in Morgan Stanley affiliates during the period. The effect of the rebate on the ratios is disclosed in the above table as "Ratio of Rebate from Morgan Stanley Affiliates to Average Net Assets."
* Annualized.
The accompanying notes are an integral part of the financial statements.
14
Morgan Stanley Institutional Fund Trust
Annual Report — September 30, 2012
Financial Highlights
High Yield Portfolio
| | | Class P | |
Selected Per Share Data and Ratios | | Period from
February 7, 2012^ to
September 30, 2012 | |
Net Asset Value, Beginning of Period | | $ | 10.00 | | |
Income from Investment Operations: | |
Net Investment Income† | | | 0.48 | | |
Net Realized and Unrealized Gain | | | 0.59 | | |
Total from Investment Operations | | | 1.07 | | |
Distributions from and/or in Excess of: | |
Net Investment Income | | | (0.36 | ) | |
Net Asset Value, End of Period | | $ | 10.71 | | |
Total Return++ | | | 10.92 | %# | |
Ratios and Supplemental Data:†† | |
Net Assets, End of Period (Thousands) | | $ | 107 | | |
Ratio of Expenses to Average Net Assets (1) | | | 0.99 | %+* | |
Ratio of Net Investment Income to Average Net Assets (1) | | | 7.28 | %+* | |
Ratio of Rebate from Morgan Stanley Affiliates to Average Net Assets | | | 0.01 | %* | |
Portfolio Turnover Rate | | | 192 | %# | |
(1) Supplemental Information on the Ratios to Average Net Assets:†† | |
Ratios Before Expense Limitation: | |
Expenses to Average Net Assets | | | 3.42 | %* | |
Net Investment Income to Average Net Assets | | | 4.85 | %* | |
^ Commencement of Operations.
† Per share amount is based on average shares outstanding.
++ Calculated based on the net asset value as of the last business day of the period.
# Not Annualized.
†† Reflects overall Portfolio ratios for investment income and non-class specific expenses.
+ The Ratios of Expenses and Net Investment Income reflect the rebate of certain Portfolio expenses in connection with the investments in Morgan Stanley affiliates during the period. The effect of the rebate on the ratios is disclosed in the above table as "Ratio of Rebate from Morgan Stanley Affiliates to Average Net Assets."
* Annualized.
The accompanying notes are an integral part of the financial statements.
15
Morgan Stanley Institutional Fund Trust
Annual Report — September 30, 2012
Financial Highlights
High Yield Portfolio
| | | Class H | |
Selected Per Share Data and Ratios | | Period from
February 7, 2012^ to
September 30, 2012 | |
Net Asset Value, Beginning of Period | | $ | 10.00 | | |
Income from Investment Operations: | |
Net Investment Income† | | | 0.48 | | |
Net Realized and Unrealized Gain | | | 0.59 | | |
Total from Investment Operations | | | 1.07 | | |
Distributions from and/or in Excess of: | |
Net Investment Income | | | (0.36 | ) | |
Net Asset Value, End of Period | | $ | 10.71 | | |
Total Return++ | | | 10.92 | %# | |
Ratios and Supplemental Data:†† | |
Net Assets, End of Period (Thousands) | | $ | 207 | | |
Ratio of Expenses to Average Net Assets (1) | | | 0.99 | %+* | |
Ratio of Net Investment Income to Average Net Assets (1) | | | 7.28 | %+* | |
Ratio of Rebate from Morgan Stanley Affiliates to Average Net Assets | | | 0.01 | %* | |
Portfolio Turnover Rate | | | 192 | %# | |
(1) Supplemental Information on the Ratios to Average Net Assets:†† | |
Ratios Before Expense Limitation: | |
Expense to Average Net Assets | | | 3.42 | %* | |
Net Investment Income to Average Net Assets | | | 4.85 | %* | |
^ Commencement of Operations.
† Per share amount is based on average shares outstanding.
++ Calculated based on the net asset value, which does not reflect sales charges, if applicable, as of the last business day of the period.
# Not Annualized.
†† Reflects overall Portfolio ratios for investment income and non-class specific expenses.
+ The Ratios of Expenses and Net Investment Income reflect the rebate of certain Portfolio expenses in connection with the investments in Morgan Stanley affiliates during the period. The effect of the rebate on the ratios is disclosed in the above table as "Ratio of Rebate from Morgan Stanley Affiliates to Average Net Assets."
* Annualized.
The accompanying notes are an integral part of the financial statements.
16
Morgan Stanley Institutional Fund Trust
Annual Report — September 30, 2012
Financial Highlights
High Yield Portfolio
| | | Class L | |
Selected Per Share Data and Ratios | | Period from
February 7, 2012^ to
September 30, 2012 | |
Net Asset Value, Beginning of Period | | $ | 10.00 | | |
Income from Investment Operations: | |
Net Investment Income† | | | 0.46 | | |
Net Realized and Unrealized Gain | | | 0.59 | | |
Total from Investment Operations | | | 1.05 | | |
Distributions from and/or in Excess of: | |
Net Investment Income | | | (0.35 | ) | |
Net Asset Value, End of Period | | $ | 10.70 | | |
Total Return++ | | | 10.66 | %# | |
Ratios and Supplemental Data:†† | |
Net Assets, End of Period (Thousands) | | $ | 107 | | |
Ratio of Expenses Average Net Assets (1) | | | 1.24 | %+* | |
Ratio of Net Investment Income to Average Net Assets (1) | | | 7.03 | %+* | |
Ratio of Rebate from Morgan Stanley Affiliates to Average Net Assets | | | 0.01 | %* | |
Portfolio Turnover Rate | | | 192 | %# | |
(1) Supplemental Information on the Ratios to Average Net Assets:†† | |
Ratios Before Expense Limitation: | |
Expenses to Average Net Assets | | | 3.67 | %* | |
Net Investment Income to Average Net Assets | | | 4.60 | %* | |
^ Commencement of Operations.
† Per share amount is based on average shares outstanding.
++ Calculated based on the net asset value as of the last business day of the period.
# Not Annualized.
†† Reflects overall Portfolio ratios for investment income and non-class specific expenses.
+ The Ratios of Expenses and Net Investment Income reflect the rebate of certain Portfolio expenses in connection with the investments in Morgan Stanley affiliates during the period. The effect of the rebate on the ratios is disclosed in the above table as "Ratio of Rebate from Morgan Stanley Affiliates to Average Net Assets."
* Annualized.
The accompanying notes are an integral part of the financial statements.
17
Morgan Stanley Institutional Fund Trust
Annual Report — September 30, 2012
Notes to Financial Statements
Morgan Stanley Institutional Fund Trust ("MSIFT'' or the "Fund'') is registered under the Investment Company Act of 1940, as amended (the "Act''), as an open-end management investment company. The Fund is comprised of seven separate, active portfolios (individually referred to as a "Portfolio", collectively as the "Portfolios"). All Portfolios are considered diversified for purposes of the Act.
The accompanying financial statements relate to the High Yield Portfolio. The Portfolio seeks total return. The Portfolio offers four classes of shares — Class I, Class P, Class H and Class L.
A. Significant Accounting Policies: The following significant accounting policies are in conformity with U.S. generally accepted accounting principles ("GAAP"). Such policies are consistently followed by the Fund in the preparation of its financial statements. GAAP may require management to make estimates and assumptions that affect the reported amounts and disclosures in the financial statements. Actual results may differ from those estimates.
1. Security Valuation: Bonds and other fixed income securities may be valued according to the broadest and most representative market. In addition, bonds and other fixed income securities may be valued on the basis of prices provided by a pricing service. The prices provided by a pricing service take into account broker-dealer market price quotations for institutional size trading in similar groups of securities, security quality, maturity, coupon and other security characteristics as well as any developments related to the specific securities. Short-term debt securities purchased with remaining maturities of 60 days or less are valued at amortized cost, unless the Board of Trustees (the "Trustees") determines such valuation does not reflect the securities' fair value, in which case these securities will be valued at their fair value as determined in good faith under procedures adopted by the Trustees. Equity securities listed on a U.S. exchange are valued at the latest quoted sales price on the valuation date. Equity securities listed or traded on NASDAQ, for which market quotations are available, are valued at the NASDAQ Official Closing Price. Securities listed on a foreign exchange are valued at their closing price, except as noted below. Unlisted and listed equity securities not traded on the valuation date, for which market quotations are readily available, are valued at the mean between the last reported bid and asked prices obtained from reputable brokers.
Under procedures approved by the Trustees, the Fund's adviser, Morgan Stanley Investment Management Inc. (the "Adviser"), has formed a Valuation Committee. The Valuation Committee provides administration and oversight of the Fund's valuation policies and procedures, which are reviewed at least annually by the Trustees. Among other things, these procedures allow the Fund to utilize independent pricing services, quotations from securities and financial instrument dealers, and other market sources to determine fair value.
The Fund has procedures to determine the fair value of securities and other financial instruments for which market prices are not readily available. Under these procedures, the Valuation Committee convenes on a regular and adhoc basis to review such securities and considers a number of factors, including valuation methodologies and significant unobservable valuation inputs, when arriving at fair value. The Valuation Committee may employ a market-based approach which may use related or comparable assets or liabilities, recent transactions, market multiples, book values, and other relevant information for the investment to determine the fair value of the investment. An income-based valuation approach may also be used in which the anticipated future cash flows of the investment are discounted to calculate fair value. Discounts may also be applied due to the nature or duration of any restrictions on the disposition of the investments. Due to the inherent uncertainty of valuations of such investments, the fair values may differ significantly from the values that would have been used had an active market existed. The Valuation Committee employs various methods for calibrating these valuation approaches including a regular review of valuation methodologies, key inputs and assumptions, transactional back-testing or disposition analysis, and reviews of any related market activity.
Most foreign markets close before the New York Stock Exchange ("NYSE"). Occasionally, developments that could affect the closing prices of securities and other assets may occur between the times at which valuations of such securities are determined (that is, close of the foreign market on which the securities trade) and the close of business on the NYSE. If these developments are expected to materially affect the value of the securities, the valuations may be adjusted to reflect the
18
Morgan Stanley Institutional Fund Trust
Annual Report — September 30, 2012
Notes to Financial Statements (cont'd)
estimated fair value as of the close of the NYSE, as determined in good faith under procedures established by the Trustees.
2. Fair Value Measurement: Financial Accounting Standards Board ("FASB") Accounting Standards CodificationTM ("ASC") 820, "Fair Value Measurements and Disclosures" ("ASC 820"), defines fair value as the value that the Fund would receive to sell an investment or pay to transfer a liability in a timely transaction with an independent buyer in the principal market, or in the absence of a principal market the most advantageous market for the investment or liability. ASC 820 establishes a three-tier hierarchy to distinguish between (1) inputs that reflect the assumptions market participants would use in valuing an asset or liability developed based on market data obtained from sources independent of the reporting entity (observable inputs) and (2) inputs that reflect the reporting entity's own assumptions about the assumptions market participants would use in valuing an asset or liability developed based on the best information available in the circumstances (unobservable inputs) and to establish classification of fair value measurements for disclosure purposes. Various inputs are used in determining the value of the Fund's investments. The inputs are summarized in the three broad levels listed below.
• Level 1 – unadjusted quoted prices in active markets for identical investments
• Level 2 – other significant observable inputs (including quoted prices for similar investments, interest rates, prepayment speeds, credit risk, etc.)
• Level 3 – significant unobservable inputs including the Fund's own assumptions in determining the fair value of investments. Factors considered in making this determination may include, but are not limited to, information obtained by contacting the issuer, analysts, or the appropriate stock exchange (for exchange-traded securities), analysis of the issuer's financial statements or other available documents and, if necessary, available information concerning other securities in similar circumstances
The inputs or methodology used for valuing securities are not necessarily an indication of the risk associated with investing in those securities and the determination
of the significance of a particular input to the fair value measurement in its entirety requires judgment and considers factors specific to each security.
The following is a summary of the inputs used to value the Portfolio's investments as of September 30, 2012.
Investment Type | | Level 1
Unadjusted
quoted
prices
(000) | | Level 2
Other
significant
observable
inputs
(000) | | Level 3
Significant
unobservable
inputs
(000) | | Total
(000) | |
Assets: | |
Fixed Income Securities —
Corporate Bonds | | $ | — | | | $ | 11,209 | | | $ | — | | | $ | 11,209 | | |
Short-Term Investment —
Investment Company | | | 148 | | | | — | | | | — | | | | 148 | | |
Total Assets | | $ | 148 | | | $ | 11,209 | | | $ | — | | | $ | 11,357 | | |
Transfers between investment levels may occur as the markets fluctuate and/or the availability of data used in an investment's valuation changes. The Portfolio recognizes transfers between the levels as of the end of the period.
3. When-Issued/Delayed Delivery Securities: The Portfolio purchases and sells when-issued and delayed delivery securities. Securities purchased on a when-issued or delayed delivery basis are purchased for delivery beyond the normal settlement date at a stated price and yield, and no income accrues to the Portfolio on such securities prior to delivery date. Payment and delivery for when-issued and delayed delivery securities can take place up to 120 days after the date of the transaction. When the Portfolio enters into a purchase transaction on a when-issued or delayed delivery basis, securities are available for collateral in an amount at least equal in value to the Portfolio's commitments to purchase such securities. Purchasing securities on a when-issued or delayed delivery basis may involve a risk that the market price at the time of delivery may be lower than the agreed upon purchase price, in which case there could be an unrealized loss at the time of delivery. Purchasing investments on a when-issued or delayed delivery basis may be considered a form of leverage which may increase the impact that gains (losses) may have on the Portfolio.
4. Indemnifications: The Fund enters into contracts that contain a variety of indemnifications. The Fund's maximum exposure under these arrangements is unknown. However, the Fund has not had prior claims or losses pursuant to these contracts and expects the risk of loss to be remote.
19
Morgan Stanley Institutional Fund Trust
Annual Report — September 30, 2012
Notes to Financial Statements (cont'd)
5. Other: Security transactions are accounted for on the date the securities are purchased or sold. Realized gains (losses) on the sale of investment securities are determined on the specific identified cost basis. Dividend income and distributions are recorded on the ex-dividend date (except for certain foreign dividends which may be recorded as soon as the Fund is informed of such dividends) net of applicable withholding taxes. Interest income is recognized on the accrual basis except where collection is in doubt. Discounts and premiums on securities purchased are amortized according to the effective yield method over their respective lives. Most expenses of the Fund can be directly attributed to a particular Portfolio. Expenses which cannot be directly attributed are apportioned among the Portfolios based upon relative net assets or other appropriate measures. Income, expenses (other than class specific expenses) and realized and unrealized gains or losses are allocated to each class of shares based upon their relative net assets.
B. Advisory Fees: The Adviser, a wholly-owned subsidiary of Morgan Stanley, provides the Portfolio with advisory services under the terms of an Investment Advisory Agreement, paid quarterly, at an annual rate of 0.60% of the average daily net assets of the Portfolio.
The Adviser has agreed to reduce its advisory fee and/or reimburse the Portfolio so that total annual portfolio operating expenses, excluding certain investment related expenses, will not exceed 0.75% for Class I shares, 1.00% for Class P shares, 1.00% for Class H shares and 1.25% for Class L shares. The fee waivers and/or expense reimbursements will continue for at least one year or until such time that the Fund's Board of Trustees acts to discontinue all or a portion of such waivers and/or reimbursements when it deems such action is appropriate. For the period ended September 30, 2012, approximately $162,000 of advisory fees were waived and/or reimbursed pursuant to this arrangement.
C. Administration Fees: The Adviser also serves as Administrator to the Fund and provides administrative services pursuant to an Administration Agreement for an annual fee, accrued daily and paid monthly, of 0.08% of the Portfolio's average daily net assets. Under a Sub-Administration Agreement between the Administrator and State Street Bank and Trust Company ("State Street"), State Street provides certain administrative services to the Fund. For such services, the Administrator pays State Street a portion of the fee the Administrator receives from the Fund.
D. Distribution and Shareholder Services Fees: Morgan Stanley Distribution, Inc. ("MSDI" or the "Distributor"), a wholly-owned subsidiary of the Adviser, and an indirect subsidiary of Morgan Stanley, serves as the Fund's Distributor of Portfolio shares pursuant to a Distribution agreement. The Fund has adopted Shareholder Services Plans with respect to Class P and Class H shares pursuant to Rule 12b-1 under the Act. Under the Shareholder Services Plans, the Portfolio pays the Distributor a shareholder services fee, accrued daily and paid monthly, at an annual rate of 0.25% of the Portfolio's average daily net assets attributable to Class P and Class H shares.
The Fund has adopted a Distribution and Shareholder Services Plan with respect to Class L shares pursuant to Rule 12b-1 under the Act. Under the Distribution and Shareholder Services Plan, the Portfolio pays the Distributor a distribution fee, accrued daily and paid monthly, at an annual rate of 0.25% and a shareholder service fee, accrued daily and paid monthly, at an annual rate of 0.25% of the Portfolio's average daily net assets attributable to Class L shares.
The distribution and shareholder services fees are used to support the expenses associated with servicing and maintaining accounts. The Distributor may compensate other parties for providing shareholder support services to investors who purchase Class P, Class H and Class L shares.
E. Dividend Disbursing and Transfer Agent: The Fund's dividend disbursing and transfer agent is Morgan Stanley Services Company Inc. ("Morgan Stanley Services"). Pursuant to a transfer agency agreement, the Fund pays Morgan Stanley Services a fee based on the number of classes, accounts and transactions relating to the Portfolios of the Fund.
F. Custodian Fees: State Street (the "Custodian") serves as Custodian for the Fund in accordance with a custodian agreement. The Custodian holds cash, securities, and other assets of the Fund as required by the Act. Custody fees are payable monthly based on assets held in custody, investment purchases and sales activity and account maintenance fees, plus reimbursement for certain out-of-pocket expenses.
The Fund has entered into an arrangement with its Custodian whereby credits realized on uninvested cash balances were used to offset a portion of the Portfolio's expenses. If applicable, these custodian credits are shown as "Expense Offset" in the Statement of Operations.
20
Morgan Stanley Institutional Fund Trust
Annual Report — September 30, 2012
Notes to Financial Statements (cont'd)
G. Security Transactions and Transactions with Affiliates: For the period ended September 30, 2012, purchases and sales of investment securities for the Portfolio, other than long-term U.S. Government securities and short-term investments, were approximately $28,850,000 and $18,229,000, respectively. There were no purchases and sales of long-term U.S. Government securities for the period ended September 30, 2012.
The Portfolio invests in the Institutional Class of the Morgan Stanley Institutional Liquidity Funds — Money Market Portfolio (the "Liquidity Funds"), an open-end management investment company managed by the Adviser. Advisory fees paid by the Portfolio are reduced by an amount equal to its pro-rata share of the advisory and administration fees paid by the Portfolio due to its investment in the Liquidity Funds. For the period ended September 30, 2012, advisory fees paid were reduced by less than $500 relating to the Portfolio's investment in the Liquidity Funds.
A summary of the Portfolio's transactions in shares of the Liquidity Funds during the period ended September 30, 2012 is as follows:
Value
September 30,
2011
(000) | | Purchases
at Cost
(000) | | Sales
(000) | | Dividend
Income
(000) | | Value
September 30,
2012
(000) | |
| $ | — | | | $ | 14,759 | | | $ | 14,611 | | | $ | 1 | | | $ | 148 | | |
The Portfolio has an unfunded Deferred Compensation Plan (the "Compensation Plan"), which allows each independent Trustee to defer payment of all, or a portion, of the fees he or she receives for serving on the Board of Trustees. Each eligible Trustee generally may elect to have the deferred amounts credited with a return equal to the total return on one or more of the Morgan Stanley funds that are offered as investment options under the Compensation Plan. Appreciation/depreciation and distributions received from these investments are recorded with an offsetting increase/decrease in the deferred compensation obligation and do not affect the net asset value of the Portfolio.
H. Federal Income Taxes: It is the Portfolio's intention to continue to qualify as a regulated investment company and distribute all of its taxable and tax-exempt income. Accordingly, no provision for Federal income taxes is required in the financial statements.
Dividend income and distributions to shareholders are recorded on the ex-dividend date. Interest income is recognized on an accrual basis. Dividends from net investment income, if
any, are declared and paid monthly. Net realized capital gains, if any, are distributed at least annually.
The Portfolio may be subject to taxes imposed by countries in which it invests. Such taxes are generally based on income and/or capital gains earned or repatriated. Taxes are accrued based on net investment income, net realized gains and net unrealized appreciation as such income and/or gains are earned. Taxes may also be based on transactions in foreign currency and are accrued based on the value of investments denominated in such currency.
FASB ASC 740-10, Income Taxes — Overall, sets forth a minimum threshold for financial statement recognition of the benefit of a tax position taken or expected to be taken in a tax return. Management has concluded there are no significant uncertain tax positions that would require recognition in the financial statements. If applicable, the Portfolio recognizes interest accrued related to unrecognized tax benefits in "Interest Expense" and penalties in "Other Expenses" in the Statement of Operations. The Portfolio files tax returns with the U.S. Internal Revenue Service, New York and various states. The tax period ended September 30, 2012 remains subject to examination by taxing authorities.
The tax character of distributions paid may differ from the character of distributions shown in the Statement of Changes in Net Assets due to short-term capital gains being treated as ordinary income for tax purposes. The tax character of distributions paid during fiscal 2012 was as follows:
2012 Distributions Paid From:
Ordinary Income (000) | |
| | | | | $ | 377 | | |
The amount and character of income and gains to be distributed are determined in accordance with income tax regulations which may differ from GAAP. These book/tax differences are either considered temporary or permanent in nature.
Temporary differences are attributable to differing book and tax treatments for the timing of the recognition of gains (losses) on certain investment transactions and the timing of the deductibility of certain expenses.
At September 30, 2012, the components of distributable earnings for the Portfolio on a tax basis were as follows:
Undistributed
Ordinary
Income
(000) | | Undistributed
Long-Term
Capital Gain
(000) | |
| $ | 342 | | | $ | — | | |
21
Morgan Stanley Institutional Fund Trust
Annual Report — September 30, 2012
Notes to Financial Statements (cont'd)
At September 30, 2012, the aggregate cost for federal income tax purposes is approximately $10,987,000. The aggregate gross unrealized appreciation is approximately $431,000 and the aggregate gross unrealized depreciation is approximately $61,000 resulting in net unrealized appreciation of approximately $370,000.
On December 22, 2010, the Regulated Investment Company Modernization Act of 2010 (the "Modernization Act") was signed into law. The Modernization Act modernizes several tax provisions related to Regulated Investment Companies ("RICs") and their shareholders. One key change made by the Modernization Act is that capital losses will generally retain their character as short-term or long-term and may be carried forward indefinitely to offset future gains. These losses are utilized before other capital loss carryforwards that expire. Generally, the Modernization Act is effective for taxable years beginning after December 22, 2010.
I. Accounting Pronouncement: In December 2011, FASB issued Accounting Standards Update ("ASU") 2011-11, Balance Sheet: Disclosures about Offsetting Assets and Liabilities. The pronouncement improves disclosures for recognized financial and derivative instruments that are either offset on the balance sheet in accordance with the offsetting guidance in ASC 210-20-45 or ASC 815-10-45 or are subject to an enforceable master netting agreements or similar. The Fund will be required to disclose information about rights to offset and related arrangements (such as collateral agreements) in order to enable financial statement users to understand the effect of those rights and arrangements on its financial position as well as disclose the following (1) gross amounts; (2) amounts offset in the statement of financial position; (3) any other amounts that can be offset in the event of bankruptcy, insolvency or default of any of the parties (including cash and noncash financial collateral); and (4) the Fund's net exposure. The requirements are effective for annual reporting periods beginning on or after January 1, 2013, and must be applied retrospectively. At this time, the Fund's management is evaluating the implications of ASU 2011-11 and its impact, if any, on the financial statements.
22
Morgan Stanley Institutional Fund Trust
Annual Report — September 30, 2012
Report of Independent Registered Public Accounting Firm
To the Shareholders and Board of Trustees of
Morgan Stanley Institutional Fund Trust —
High Yield Portfolio
We have audited the accompanying statement of assets and liabilities, including the portfolio of investments, of High Yield Portfolio (one of the portfolios constituting Morgan Stanley Institutional Fund Trust) (the "Portfolio") as of September 30, 2012, and the related statements of operations and changes in net assets and the financial highlights for the period from February 7, 2012 (commencement of operations) to September 30, 2012. These financial statements and financial highlights are the responsibility of the Portfolio's management. Our responsibility is to express an opinion on these financial statements and financial highlights based on our audit.
We conducted our audit in accordance with the standards of the Public Company Accounting Oversight Board (United States). Those standards require that we plan and perform the audit to obtain reasonable assurance about whether the financial statements and financial highlights are free of material misstatement. We were not engaged to perform an audit of the Portfolio's internal control over financial reporting. Our audit included consideration of internal control over financial reporting as a basis for designing audit procedures that are appropriate in the circumstances, but not for the purpose of expressing an opinion on the effectiveness of the Portfolio's internal control over financial reporting. Accordingly, we express no such opinion. An audit also includes examining, on a test basis, evidence supporting the amounts and disclosures in the financial statements and financial highlights, assessing the accounting principles used and significant estimates made by management, and evaluating the overall financial statement presentation. Our procedures included confirmation of securities owned as of September 30, 2012, by correspondence with the custodian and others, or by other appropriate auditing procedures where replies from others were not received. We believe that our audit provides a reasonable basis for our opinion.
In our opinion, the financial statements and financial highlights referred to above present fairly, in all material respects, the financial position of High Yield Portfolio of Morgan Stanley Institutional Fund Trust at September 30, 2012, the results of its operations, the changes in its net assets and the financial highlights for the period from February 7, 2012 to September 30, 2012, in conformity with U.S. generally accepted accounting principles.

Boston, Massachusetts
November 27, 2012
23
Morgan Stanley Institutional Fund Trust
Annual Report — September 30, 2012
U.S. Privacy Policy (unaudited)
AN IMPORTANT NOTICE CONCERNING OUR U.S. PRIVACY POLICY
This privacy notice describes the U.S. privacy policy of Morgan Stanley Distribution, Inc., and the Morgan Stanley family of mutual funds ("us", "our", "we").
We are required by federal law to provide you with notice of our U.S. privacy policy ("Policy"). This Policy applies to both our current and former clients unless we state otherwise and is intended for individual clients who purchase products or receive services from us for personal, family or household purposes. This Policy is not applicable to partnerships, corporations, trusts or other non-individual clients or account holders, nor is this Policy applicable to individuals who are either beneficiaries of a trust for which we serve as trustee or participants in an employee benefit plan administered or advised by us. This Policy is, however, applicable to individuals who select us to be a custodian of securities or assets in individual retirement accounts, 401(k) accounts, or accounts subject to the Uniform Gifts to Minors Act.
This notice sets out our business practices to protect your privacy; how we collect and share personal information about you; and how you can limit our sharing or certain uses by others of this information. We may amend this Policy at any time, and will inform you of any changes to our Policy as required by law.
WE RESPECT YOUR PRIVACY
We appreciate that you have provided us with your personal financial information and understand your concerns about your information. We strive to safeguard the information our clients entrust to us. Protecting the confidentiality and security of client information is an important part of how we conduct our business.
This notice describes what personal information we collect about you, how we collect it, when we may share it with others, and how certain others may use it. It discusses the steps you may take to limit our sharing of certain information about you with our affiliated companies, including, but not limited to our affiliated banking businesses, brokerage firms and credit service affiliates. It also discloses how you may limit our affiliates' use of shared information for marketing purposes.
Throughout this Policy, we refer to the nonpublic information that personally identifies you as "personal information." We also use the term "affiliated company" in this notice. An affiliated company is a company in our family of companies and includes companies with the Morgan Stanley name. These affiliated companies are financial institutions such as broker-dealers, banks, investment advisers and credit card issuers. We refer to any company that is not an affiliated company as a nonaffiliated third party. For purposes of Section 5 of this notice, and your ability to limit certain uses of personal information by our affiliates, this notice applies to the use of personal information by our affiliated companies.
1. WHAT PERSONAL INFORMATION DO WE COLLECT FROM YOU?
We may collect the following types of information about you: (i) information provided by you, including information from applications and other forms we receive from you, (ii) information about your transactions with us or our affiliates, (iii) information about your transactions with nonaffiliated third parties, (iv) information from consumer reporting agencies, (v) information obtained from our websites, and (vi) information obtained from other sources. For example:
• We collect information such as your name, address, e-mail address, telephone/fax numbers, assets, income and investment objectives through applications and other forms you submit to us.
• We may obtain information about account balances, your use of account(s) and the types of products and services you prefer to receive from us through your dealings and transactions with us and other sources.
• We may obtain information about your creditworthiness and credit history from consumer reporting agencies.
• We may collect background information from and through third-party vendors to verify representations you have made and to comply with various regulatory requirements.
2. WHEN DO WE DISCLOSE PERSONAL INFORMATION WE COLLECT ABOUT YOU?
We may disclose personal information we collect about you in each of the categories listed above to affiliated and nonaffiliated third parties.
24
Morgan Stanley Institutional Fund Trust
Annual Report — September 30, 2012
U.S. Privacy Policy (unaudited) (cont'd)
a. Information we disclose to affiliated companies.
We may disclose personal information that we collect about you to our affiliated companies to manage your account(s) effectively, to service and process your transactions, and to let you know about products and services offered by us and affiliated companies, to manage our business, and as otherwise required or permitted by law. Offers for products and services from affiliated companies are developed under conditions designed to safeguard your personal information.
b. Information we disclose to third parties.
We may disclose personal information that we collect about you to nonaffiliated third parties to provide marketing services on our behalf or to other financial institutions with whom we have joint marketing agreements. We may also disclose all of the information we collect to other nonaffiliated third parties for our everyday business purposes, such as to process transactions, maintain account(s), respond to court orders and legal investigations, report to credit bureaus, offer our own products and services, protect against fraud, for institutional risk control, to perform services on our behalf, and as otherwise required or permitted by law.
When we share personal information about you with a nonaffiliated third party, they are required to limit their use of personal information about you to the particular purpose for which it was shared and they are not allowed to share personal information about you with others except to fulfill that limited purpose or as may be permitted or required by law.
3. HOW DO WE PROTECT THE SECURITY AND CONFIDENTIALITY OF PERSONAL INFORMATION WE COLLECT ABOUT YOU?
We maintain physical, electronic and procedural security measures that comply with applicable law and regulations to help safeguard the personal information we collect about you. We have internal policies governing the proper handling of client information by employees. Third parties that provide support or marketing services on our behalf may also receive personal information about you, and we require them to adhere to appropriate security standards with respect to such information.
4. HOW CAN YOU LIMIT OUR SHARING CERTAIN PERSONAL INFORMATION ABOUT YOU WITH OUR AFFILIATED COMPANIES FOR ELIGIBILITY DETERMINATION?
By following the opt-out procedures in Section 6 below, you may limit the extent to which we share with our affiliated companies, personal information that was collected to determine your eligibility for products and services such as your credit reports and other information that you have provided to us or that we may obtain from third parties ("eligibility information"). Eligibility information does not include your identification information or personal information pertaining to our transactions or experiences with you. Please note that, even if you direct us not to share eligibility information with our affiliated companies, we may still share your personal information, including eligibility information, with our affiliated companies under circumstances that are permitted under applicable law, such as to process transactions or to service your account.
5. HOW CAN YOU LIMIT THE USE OF CERTAIN PERSONAL INFORMATION ABOUT YOU BY OUR AFFILIATED COMPANIES FOR MARKETING?
By following the opt-out instructions in Section 6 below, you may limit our affiliated companies from marketing their products or services to you based on personal information we disclose to them. This information may include, for example, your income and account history with us. Please note that, even if you choose to limit our affiliated companies from using personal information about you that we may share with them for marketing their products and services to you, our affiliated companies may use your personal information that they obtain from us to market to you in circumstances permitted by law, such as if the affiliated party has its own relationship with you.
25
Morgan Stanley Institutional Fund Trust
Annual Report — September 30, 2012
U.S. Privacy Policy (unaudited) (cont'd)
6. HOW CAN YOU SEND US AN OPT-OUT INSTRUCTION?
If you wish to limit our sharing of eligibility information about you with our affiliated companies, or our affiliated companies' use of personal information for marketing purposes, as described in this notice, you may do so by:
• Calling us at (800) 548-7786
Monday–Friday between 8a.m. and 5p.m. (EST)
• Writing to us at the following address:
Morgan Stanley Services Company Inc.
c/o Privacy Coordinator
201 Plaza Two, 3rd Floor
Jersey City, New Jersey 07311
If you choose to write to us, your request should include: your name, address, telephone number and account number(s) to which the opt-out applies and whether you are opting out with respect to sharing of eligibility information (Section 4 above), or information used for marketing (Section 5 above), or both. Written opt-out requests should not be sent with any other correspondence. In order to process your request, we require that the request be provided by you directly and not through a third party. Once you have informed us about your privacy preferences, your opt-out preference will remain in effect with respect to this Policy (as it may be amended) until you notify us otherwise. If you are a joint account owner, we will accept instructions from any one of you and apply those instructions to the entire account.
Please understand that if you limit our sharing or our affiliated companies' use of personal information, you and any joint account holder(s) may not receive information about our affiliated companies' products and services, including products or services that could help you manage your financial resources and achieve your investment objectives.
If you have more than one account or relationship with us, please specify the accounts to which you would like us to apply your privacy choices. If you have accounts or relationships with our affiliates, you may receive multiple privacy policies from them, and will need to separately notify those companies of your privacy choices for those accounts or relationships.
7. WHAT IF AN AFFILIATED COMPANY BECOMES A NONAFFILIATED THIRD PARTY?
If, at any time in the future, an affiliated company becomes a nonaffiliated third party, further disclosures of personal information made to the former affiliated company will be limited to those described in Section 2(b) above relating to nonaffiliated third parties. If you elected under Section 6 to limit disclosures we make to affiliated companies, or use of personal information by affiliated companies, your election will not apply to use by any former affiliated company of your personal information in their possession once it becomes a nonaffiliated third party.
SPECIAL NOTICE TO RESIDENTS OF VERMONT
The following section supplements our Policy with respect to our individual clients who have a Vermont address and supersedes anything to the contrary in the above Policy with respect to those clients only.
The State of Vermont requires financial institutions to obtain your consent prior to sharing personal information that they collect about you with nonaffiliated third parties, or eligibility information with affiliated companies, other than in certain limited circumstances. Except as permitted by law, we will not share personal information we collect about you with nonaffiliated third parties or eligibility information with affiliated companies, unless you provide us with your written consent to share such information.
SPECIAL NOTICE TO RESIDENTS OF CALIFORNIA
The following section supplements our Policy with respect to our individual clients who have a California address and supersedes anything to the contrary in the above Policy with respect to those clients only.
In response to a California law, if your account has a California home address, your personal information will not be disclosed to nonaffiliated third parties except as permitted by applicable California law, and we will limit sharing such personal information with our affiliates to comply with California privacy laws that apply to us.
26
Morgan Stanley Institutional Fund Trust
Annual Report — September 30, 2012
Trustee and Officer Information (unaudited)
Independent Trustees:
Name, Age and Address of
Independent Trustee | | Position(s)
Held with
Registrant | | Length of Time
Served* | | Principal Occupation(s) During Past 5 Years | | Number of
Portfolios in
Fund Complex
Overseen by
Independent
Trustee** | | Other Directorships
Held by Independent
Trustee*** | |
Frank L. Bowman (67)
c/o Kramer Levin Naftalis &
Frankel LLP
Counsel to the Independent
Trustees
1177 Avenue of the Americas
New York, NY 10036 | | Trustee | | Since
August
2006 | | President, Strategic Decisions, LLC (consulting) (since February 2009); Director or Trustee of various Morgan Stanley Funds (since August 2006); Chairperson of the Insurance Sub-Committee of the Compliance and Insurance Committee (since February 2007); served as President and Chief Executive Officer of the Nuclear Energy Institute (policy organization) (February 2005-November 2008); retired as Admiral, U.S. Navy after serving over 38 years on active duty including 8 years as Director of the Naval Nuclear Propulsion Program in the Department of the Navy and the U.S. Department of Energy (1996-2004); served as Chief of Naval Personnel (July 1994-September 1996); and on the Joint Staff as Director of Political Military Affairs (June 1992-July 1994); Knighted as Honorary Knight Commander of the Most Excellent Order of the British Empire; Awarded the Officer de l'Orde National du Mérite by the French Government; elected to the National Academy of Engineering (2009). | | | 102 | | | Director of BP p.l.c.; Director of Naval and Nuclear Technologies LLP; Director of the Armed Services YMCA of the USA and the Naval Submarine League; Director of the American Shipbuilding Suppliers Association; Member of the National Security Advisory Council of the Center for U.S. Global Engagement and a member of the CNA Military Advisory Board; Member of the American Lung Association's President's Council. | |
Michael Bozic (71)
c/o Kramer Levin Naftalis &
Frankel LLP
Counsel to the Independent
Trustees
1177 Avenue of the Americas
New York, NY 10036 | | Trustee | | Since
April
1994 | | Private investor; Chairperson of the Compliance and Insurance Committee (since October 2006); Director or Trustee of various Morgan Stanley Funds (since April 1994); formerly, Chairperson of the Insurance Committee (July 2006-September 2006); Vice Chairman of Kmart Corporation (December 1998-October 2000), Chairman and Chief Executive Officer of Levitz Furniture Corporation (November 1995-November 1998) and President and Chief Executive Officer of Hills Department Stores (May 1991-July 1995); variously Chairman, Chief Executive Officer, President and Chief Operating Officer (1987-1991) of the Sears Merchandise Group of Sears, Roebuck & Co. | | | 104 | | | Director of various business organizations. | |
Kathleen A. Dennis (59)
c/o Kramer Levin Naftalis &
Frankel LLP
Counsel to the Independent
Trustees
1177 Avenue of the Americas
New York, NY 10036 | | Trustee | | Since
August
2006 | | President, Cedarwood Associates (mutual fund and investment management consulting) (since July 2006); Chairperson of the Money Market and Alternatives Sub-Committee of the Investment Committee (since October 2006) and Director or Trustee of various Morgan Stanley Funds (since August 2006); formerly, Senior Managing Director of Victory Capital Management (1993-2006). | | | 102 | | | Director of various non-profit organizations. | |
Dr. Manuel H. Johnson (63)
c/o Johnson Smick
Group, Inc.
888 16th Street, N.W.
Suite 740
Washington, D.C. 20006 | | Trustee | | Since
July
1991 | | Senior Partner, Johnson Smick International, Inc. (consulting firm); Chairperson of the Investment Committee (since October 2006) and Director or Trustee of various Morgan Stanley Funds (since July 1991); Co-Chairman and a founder of the Group of Seven Council (G7C) (international economic commission); formerly, Chairperson of the Audit Committee (July 1991-September 2006), Vice Chairman of the Board of Governors of the Federal Reserve System and Assistant Secretary of the U.S. Treasury. | | | 104 | | | Director of NVR, Inc. (home construction). | |
Joseph J. Kearns (70)
c/o Kearns & Associates LLC
PMB754
22631 Pacific Coast Highway
Malibu, CA 90265 | | Trustee | | Since
August
1994 | | President, Kearns & Associates LLC (investment consulting); Chairperson of the Audit Committee (since October 2006) and Director or Trustee of various Morgan Stanley Funds (since August 1994); formerly, Deputy Chairperson of the Audit Committee (July 2003-September 2006) and Chairperson of the Audit Committee of various Morgan Stanley Funds (since August 1994); CFO of the J. Paul Getty Trust. | | | 105 | | | Director of Electro Rent Corporation (equipment leasing) and The Ford Family Foundation. | |
27
Morgan Stanley Institutional Fund Trust
Annual Report — September 30, 2012
Trustee and Officer Information (unaudited) (cont'd)
Independent Trustees: (cont'd)
Name, Age and Address of
Independent Trustee | | Position(s)
Held with
Registrant | | Length of Time
Served* | | Principal Occupation(s) During Past 5 Years | | Number of
Portfolios in
Fund Complex
Overseen by
Independent
Trustee** | | Other Directorships
Held by Independent
Trustee*** | |
Michael F. Klein (53)
c/o Kramer Levin Naftalis & Frankel LLP
Counsel to the
Independent Trustees
1177 Avenue of the Americas
New York, NY 10036 | | Trustee | | Since
August
2006 | | Managing Director, Aetos Capital, LLC (since March 2000) and Co-President, Aetos Alternatives Management, LLC (since January 2004); Chairperson of the Fixed Income Sub-Committee of the Investment Committee (since October 2006) and Director or Trustee of various Morgan Stanley Funds (since August 2006); formerly, Managing Director, Morgan Stanley & Co. Inc. and Morgan Stanley Dean Witter Investment Management, President, various Morgan Stanley Funds (June 1998-March 2000) and Principal, Morgan Stanley & Co. Inc. and Morgan Stanley Dean Witter Investment Management (August 1997-December 1999). | | | 102 | | | Director of certain investment funds managed or sponsored by Aetos Capital, LLC. Director of Sanitized AG and Sanitized Marketing AG (specialty chemicals). | |
Michael E. Nugent (76)
c/o Triumph Capital, L.P.
445 Park Avenue
New York, NY 10022 | | Chairperson
of the
Board and
Trustee | | Chairperson of
the Boards since
July 2006 and
Trustee since
July 1991 | | General Partner, Triumph Capital, L.P. (private investment partnership); Chairperson of the Boards of various Morgan Stanley Funds (since July 2006); Chairperson of the Closed-End Fund Committee (since June 2012) and Director or Trustee of various Morgan Stanley Funds (since July 1991); formerly, Chairperson of the Insurance Committee (until July 2006). | | | 104 | | | None. | |
W. Allen Reed (65)
c/o Kramer Levin Naftalis &
Frankel LLP
Counsel to the
Independent Trustees
1177 Avenue of the Americas
New York, NY 10036 | | Trustee | | Since
August
2006 | | Chairperson of the Equity Sub-Committee of the Investment Committee (since October 2006) and Director or Trustee of various Morgan Stanley Funds (since August 2006); formerly, President and CEO of General Motors Asset Management; Chairman and Chief Executive Officer of the GM Trust Bank and Corporate Vice President of General Motors Corporation (August 1994-December 2005). | | | 102 | | | Director of Temple-Inland Industries (packaging and forest products); Director of Legg Mason, Inc. and Director of the Auburn University Foundation. | |
Fergus Reid (80)
c/o Joe Pietryka, Inc.
85 Charles Colman Blvd.
Pawling, NY 12564 | | Trustee | | Since
June
1992 | | Chairman, Joe Pietryka, Inc.; Chairperson of the Governance Committee and Director or Trustee of various Morgan Stanley Funds (since June 1992). | | | 105 | | | Trustee and Director of certain investment companies in the JPMorgan Funds complex managed by JP Morgan Investment Management Inc. | |
28
Morgan Stanley Institutional Fund Trust
Annual Report — September 30, 2012
Trustee and Officer Information (unaudited) (cont'd)
Interested Trustee:
Name, Age and Address of
Interested Trustee | | Position(s) Held
with Registrant | | Length of Time
Served* | | Principal Occupation(s) During Past 5 Years | | Number of
Portfolios in
Fund Complex
Overseen by
Interested
Trustee** | | Other Directorships
Held by Interested
Trustee*** | |
James F. Higgins (64)
c/o Morgan Stanley Services Company Inc.
Harborside Financial Center
201 Plaza Two
Jersey City, NJ 07311 | | Trustee | | Since
June
2000 | | Director or Trustee of various Morgan Stanley Funds (since June 2000); Senior Advisor of Morgan Stanley (since August 2000). | | | 103 | | | Director of AXA Financial, Inc. and The Equitable Life Assurance Society of the United States (financial services). | |
* Each Trustee serves an indefinite term, until his or her successor is elected.
** The Fund Complex includes (as of December 31, 2011) all open-end and closed-end funds (including all of their portfolios) advised by Morgan Stanley Investment Management Inc. (the "Adviser") and any funds that have an adviser that is an affiliated person of the Adviser (including, but not limited to, Morgan Stanley AIP GP LP).
*** This includes any directorships at public companies and registered investment companies held by the Trustee at any time during the past five years.
29
Morgan Stanley Institutional Fund Trust
Annual Report — September 30, 2012
Trustee and Officer Information (unaudited) (cont'd)
Executive Officers:
Name, Age and Address of Executive Officer | | Position(s) Held
with
Registrant | | Length of Time
Served* | | Principal Occupation(s) During Past 5 Years | |
Arthur Lev (51)
522 Fifth Avenue
New York, NY 10036 | | President and Principal Executive Officer – Equity and Fixed Income Funds | | Since
June 2011 | | President and Principal Executive Officer (since June 2011) of the Equity and Fixed Income Funds in the Fund Complex; Head of the Long Only Business of Morgan Stanley Investment Management (since February 2011); Managing Director of the Adviser and various entities affiliated with the Adviser (since December 2006). Formerly, Chief Strategy Officer of Morgan Stanley Investment Management's Traditional Asset Management business (November 2010-February 2011); General Counsel of Morgan Stanley Investment Management (December 2006-October 2010); Partner and General Counsel of FrontPoint Partners LLC (July 2002-December 2006); Managing Director and General Counsel of Morgan Stanley Investment Management (May 2000-June 2002). | |
Mary Ann Picciotto (39)
c/o Morgan Stanley Services Company Inc.
Harborside Financial Center
201 Plaza Two
Jersey City, NJ 07311 | | Chief Compliance Officer | | Since
May 2010 | | Managing Director of the Adviser and various entities affiliated with the Adviser; Chief Compliance Officer of various Morgan Stanley Funds (since May 2010); Chief Compliance Officer of the Adviser (since April 2007). | |
Stefanie V. Chang Yu (45)
522 Fifth Avenue
New York, NY 10036 | | Vice President | | Since December 1997 | | Managing Director of the Adviser and various entities affiliated with the Adviser; Vice President of various Morgan Stanley Funds (since December 1997). | |
Francis J. Smith (47)
c/o Morgan Stanley Services Company Inc.
Harborside Financial Center
201 Plaza Two
Jersey City, NJ 07311 | | Treasurer and Principal Financial
Officer | | Treasurer since July 2003 and Principal Financial Officer since September 2002 | | Executive Director of the Adviser and various entities affiliated with the Adviser; Treasurer and Principal Financial Officer of various Morgan Stanley Funds (since July 2003). | |
Mary E. Mullin (45)
522 Fifth Avenue
New York, NY 10036 | | Secretary | | Since
June
1999 | | Executive Director of the Adviser and various entities affiliated with the Adviser; Secretary of various Morgan Stanley Funds (since June 1999). | |
* Each officer serves an indefinite term, until his or her successor is elected.?
30
Morgan Stanley Institutional Fund Trust
Annual Report — September 30, 2012
Adviser and Administrator
Morgan Stanley Investment Management Inc.
522 Fifth Avenue
New York, New York 10036
Distributor
Morgan Stanley Distribution, Inc.
522 Fifth Avenue
New York, New York 10036
Dividend Disbursing and Transfer Agent
Morgan Stanley Services Company Inc.
P.O. Box 219804
Kansas City, Missouri 64121
Custodian
State Street Bank and Trust Company
One Lincoln Street
Boston, Massachusetts 02111
Legal Counsel
Dechert LLP
1095 Avenue of the Americas
New York, New York 10036
Independent Registered Public Accounting Firm
Ernst & Young LLP
200 Clarendon Street
Boston, Massachusetts 02116
Reporting to Shareholders
Each Morgan Stanley fund provides a complete schedule of portfolio holdings in its semi-annual and annual reports within 60 days of the end of the fund's second and fourth fiscal quarters by filing the schedule electronically with the Securities and Exchange Commission (SEC). The semi-annual reports are filed on Form N-CSRS and the annual reports are filed on Form N-CSR. Morgan Stanley also delivers the semi-annual and annual reports to fund shareholders and makes these reports available on its public website, www.morganstanley.com/im. Each Morgan Stanley fund also files a complete schedule of portfolio holdings with the SEC for the fund's first and third fiscal quarters on Form N-Q. Morgan Stanley does not deliver the reports for the first and third fiscal quarters to shareholders, nor are the reports posted to the Morgan Stanley public website. You may, however, obtain the Form N-Q filings (as well as the Form N-CSR and N-CSRS filings) by accessing the SEC's website, www.sec.gov. You may also review and copy them at the SEC's Public Reference Room in Washington, DC. Information on the operation of the SEC's Public Reference Room may be obtained by calling the SEC toll free at 1-800-SEC-0330. You can also request copies of these materials, upon payment of a duplicating fee, by electronic request at the SEC's email address (publicinfo@sec.gov) or by writing the Public Reference Room of the SEC, Washington, DC 20549-0102.
Proxy Voting Policies and Procedures and Proxy Voting Record
You may obtain a copy of the Fund's Proxy Voting Policy and Procedures and information regarding how the Fund voted proxies relating to portfolio securities during the most recent twelve-month period ended June 30, without charge, upon request, by calling toll free 1-800-548-7786 or by visiting our website at www.morganstanley.com/im. This information is also available on the SEC's website at www.sec.gov.
This report is authorized for distribution only when preceded or accompanied by a prospectus of the Fund which describes in detail each Investment Portfolio's investment policies, risks, fees and expenses. Please read the prospectus carefully before you invest or send money. For additional information, including information regarding the investments comprising the Portfolio, please visit our website at www.morganstanley.com/im or call toll free 1-(800) 548-7786.
31
(This Page has been left blank intentionally.)
(This Page has been left blank intentionally.)
Printed in U.S.A.
This Report has been prepared for shareholders and may be distributed to others only if preceded or accompanied by a current prospectus.
Morgan Stanley Investment Management Inc.
522 Fifth Avenue
New York, New York 10036
© 2012 Morgan Stanley. Morgan Stanley Distribution, Inc.

IFTHYANN
IU12-02345P-Y09/12

Morgan Stanley
Institutional Fund Trust

Limited Duration Portfolio
Annual
Report
September 30, 2012

Morgan Stanley Institutional Fund Trust
Annual Report — September 30, 2012
Shareholders' Letter | | | 2 | | |
Expense Example | | | 3 | | |
Investment Advisory Agreement Approval | | | 4 | | |
Investment Overview | | | 6 | | |
Portfolio of Investments | | | 9 | | |
Statement of Assets and Liabilities | | | 14 | | |
Statement of Operations | | | 15 | | |
Statements of Changes in Net Assets | | | 16 | | |
Financial Highlights | | | 17 | | |
Notes to Financial Statements | | | 21 | | |
Report of Independent Registered Public Accounting Firm | | | 28 | | |
U.S. Privacy Policy | | | 29 | | |
Trustee and Officer Information | | | 32 | | |
This report is authorized for distribution only when preceded or accompanied by prospectuses of the Morgan Stanley Institutional Fund Trust. To receive a prospectus and/or SAI, which contains more complete information such as investment objectives, charges, expenses, policies for voting proxies, risk considerations, and describes in detail each of the Portfolio's investment policies to the prospective investor, please call toll free 1-(800) 548-7786. Please read the prospectuses carefully before you invest or send money.
Additionally, you can access portfolio information including performance, characteristics, and investment team commentary through Morgan Stanley Investment Management's website: www.morganstanley.com/im.
Market forecasts provided in this report may not necessarily come to pass. There is no guarantee that any sectors mentioned will continue to perform as discussed herein or that securities in such sectors will be held by the Portfolio in the future. There is no assurance that a Portfolio will achieve its investment objective. Portfolios are subject to market risk, which is the possibility that market values of securities owned by the Portfolio will decline and, therefore, the value of the Portfolio's shares may be less than what you paid for them. Accordingly, you can lose money investing in Portfolios. Please see the prospectus for more complete information on investment risks.
1
Morgan Stanley Institutional Fund Trust
Annual Report — September 30, 2012
Shareholders' Letter (unaudited)
Dear Shareholders,
We are pleased to provide this Annual report, in which you will learn how your investment in Limited Duration Portfolio performed during the latest twelve-month period.
Morgan Stanley Investment Management is a client-centric, investor-led organization. Our global presence, intellectual capital, and breadth of products and services enable us to partner with investors to meet the evolving challenges of today's financial markets. We aim to deliver superior investment service and to empower our clients to make the informed decisions that help them reach their investment goals.
As always, we thank you for selecting Morgan Stanley Investment Management, and look forward to working with you in the months and years ahead.
Sincerely,

Arthur Lev
President and Principal Executive Officer
October 2012
2
Morgan Stanley Institutional Fund Trust
Annual Report — September 30, 2012
Expense Example (unaudited)
Limited Duration Portfolio
As a shareholder of the Portfolio, you may incur two types of costs: (1) transactional costs, including sales charge (loads) on purchase payments; and (2) ongoing costs, including advisory fees, administration fees, distribution and shareholder servicing fees; and other Portfolio expenses. This example is intended to help you understand your ongoing costs (in dollars) of investing in the Portfolio and to compare these costs with the ongoing costs of investing in other mutual funds.
This example is based on an investment of $1,000 invested at the beginning of the six-month period ended September 30, 2012 and held for the entire six-month period.
Actual Expenses
The table below provides information about actual account values and actual expenses. You may use the information in this table, together with the amount you invested, to estimate the expenses that you paid over the period. Simply divide your account value by $1,000 (for example, an $8,600 account value divided by $1,000 = 8.6), then multiply the result by the number in the table under the heading entitled "Actual Expenses Paid During Period" to estimate the expenses you paid on your account during this period.
Please note that "Actual Expenses Paid During Period" are grossed up to reflect Portfolio expenses prior to the effect of Expense Offset (See Note F in the Notes to Financial Statements). Therefore, the annualized net expense ratios may differ from the ratio of expenses to average net assets shown in the Financial Highlights.
Hypothetical Example for Comparison Purposes
The table below provides information about hypothetical account values and hypothetical expenses based on the Portfolio's actual expense ratio and an assumed rate of return of 5% per year before expenses, which is not the Portfolio's actual return. The hypothetical account values and expenses may not be used to estimate the actual ending account balance or expenses you paid for the period. You may use this information to compare the ongoing costs of investing in the Portfolio and other funds. To do so, compare this 5% hypothetical example with the 5% hypothetical examples that appear in the shareholder reports of the other funds.
Please note that the expenses shown in the table are meant to highlight your ongoing costs only and do not reflect any transactional costs, such as sales charges (loads, if applicable). Therefore, the hypothetical account values and hypothetical expenses are useful in comparing ongoing costs only, and will not help you determine the relative total costs of owning different funds. In addition, if these transactional costs were included, your costs would have been higher.
| | | Beginning
Account
Value
4/1/12 | | Actual Ending
Account
Value
9/30/12 | | Hypothetical
Ending Account
Value | | Actual
Expenses
Paid
During
Period | | Hypothetical
Expenses Paid
During Period | | Net
Expense
Ratio
During
Period** | |
Limited Duration Portfolio Class I | | $ | 1,000.00 | | | $ | 1,014.30 | | | $ | 1,021.45 | | | $ | 3.58 | * | | $ | 3.59 | * | | | 0.71 | % | |
Limited Duration Portfolio Class P | | | 1,000.00 | | | | 1,014.30 | | | | 1,020.05 | | | | 4.99 | * | | | 5.00 | * | | | 0.99 | | |
Limited Duration Portfolio Class H | | | 1,000.00 | | | | 1,011.40 | | | | 1,017.21 | | | | 3.85 | + | | | 3.86 | + | | | 0.91 | | |
Limited Duration Portfolio Class L | | | 1,000.00 | | | | 1,010.60 | | | | 1,015.95 | | | | 5.12 | + | | | 5.13 | + | | | 1.21 | | |
* Expenses are calculated using each Portfolio Class' annualized net expense ratio (as disclosed), multiplied by the average account value over the period, and multiplied by 183/366 (to reflect the most recent one-half year period).
** Annualized.
+ Expenses are calculated using each Portfolio Class' annualized net expense ratio (as disclosed), multiplied by the average account value over the period, and multiplied by 154/366 (to reflect the actual days in the period).
3
Morgan Stanley Institutional Fund Trust
Annual Report — September 30, 2012
Investment Advisory Agreement Approval (unaudited)
Nature, Extent and Quality of Services
The Board reviewed and considered the nature and extent of the investment advisory services provided by the Adviser (as defined herein) under the advisory agreement, including portfolio management, investment research and equity and fixed income securities trading. The Board also reviewed and considered the nature and extent of the non-advisory, administrative services provided by the Adviser under the administration agreement, including accounting, clerical, bookkeeping, compliance, business management and planning, and the provision of supplies, office space and utilities at the Adviser's expense. (The advisory and administration agreements together are referred to as the "Management Agreement.") The Board also compared the nature of the services provided by the Adviser with similar services provided by non-affiliated advisers as reported to the Board by Lipper, Inc. ("Lipper").
The Board reviewed and considered the qualifications of the portfolio managers, the senior administrative managers and other key personnel of the Adviser who provide the advisory and administrative services to the Portfolio. The Board determined that the Adviser's portfolio managers and key personnel are well qualified by education and/or training and experience to perform the services in an efficient and professional manner. The Board concluded that the nature and extent of the advisory and administrative services provided were necessary and appropriate for the conduct of the business and investment activities of the Portfolio and supported its decision to approve the Management Agreement.
Performance, Fees and Expenses of the Portfolio
The Board reviewed the performance, fees and expenses of the Portfolio compared to its peers, as determined by Lipper, and to appropriate benchmarks where applicable. The Board discussed with the Adviser the performance goals and the actual results achieved in managing the Portfolio. When considering a fund's performance, the Board and the Adviser place emphasis on trends and longer-term returns (focusing on one-year, three-year and five-year performance, as of December 31, 2011, or since inception, as applicable). When a fund underperforms its benchmark and/or its peer group average, they discuss the causes of such underperformance and, where necessary, they discuss specific changes to investment strategy or investment personnel. The Board noted that the Portfolio's performance was better than its peer group average for the one-year period but below its peer group average for the three- and five-year periods. The Board discussed with the Adviser the level of the advisory and administration fees (together, the "management fee") for this Portfolio relative to comparable funds and/or other accounts advised by the Adviser and/or compared to its peers as determined by Lipper. In addition to the management fee, the Board also reviewed the Portfolio's total expense ratio. The Board noted that the Portfolio's management fee was higher but close to its peer group average and the total expense ratio was higher than its peer group average. After discussion, the Board concluded that the Portfolio's (i) performance was acceptable; (ii) management fee was competitive with its peer group average; and (iii) total expense ratio was acceptable given the quality and nature of the services provided.
Economies of Scale
The Board considered the size and growth prospects of the Portfolio and how that relates to the Portfolio's total expense ratio and particularly the Portfolio's management fee rate which does not include breakpoints. In conjunction with its review of the Adviser's profitability, the Board discussed with the Adviser how a change in assets can affect the efficiency or effectiveness of managing the Portfolio and whether the management fee level is appropriate relative to current and projected asset levels and/or whether the management fee structure reflects economies of scale as asset levels change. The Board has determined that its review of the actual and potential economies of scale of the Portfolio supports its decision to approve the Management Agreement.
Profitability of the Adviser and Affiliates
The Board considered information concerning the costs incurred and profits realized by the Adviser and its affiliates during the last year from their relationship with the Portfolio and during the last two years from their relationship with the Morgan Stanley Fund Complex and reviewed with the Adviser the cost allocation methodology used to determine the profitability of the Adviser and affiliates. The Board has determined that its review of the analysis of the Adviser's expenses and profitability supports its decision to approve the Management Agreement.
4
Morgan Stanley Institutional Fund Trust
Annual Report — September 30, 2012
Investment Advisory Agreement Approval (unaudited) (cont'd)
Other Benefits of the Relationship
The Board considered other benefits to the Adviser and its affiliates derived from their relationship with the Portfolio and other funds advised by the Adviser. These benefits may include, among other things, "float" benefits derived from handling of checks for purchases and sales, research received by the Adviser generated from commission dollars spent on funds' portfolio trading and fees for distribution and/or shareholder servicing. The Board reviewed with the Adviser each of these arrangements and the reasonableness of the Adviser's costs relative to the services performed. The Board has determined that its review of the other benefits received by the Adviser or its affiliates supports its decision to approve the Management Agreement.
Resources of the Adviser and Historical Relationship Between the Portfolio and the Adviser
The Board considered whether the Adviser is financially sound and has the resources necessary to perform its obligations under the Management Agreement. The Board also reviewed and considered the historical relationship between the Portfolio and the Adviser, including the organizational structure of the Adviser, the policies and procedures formulated and adopted by the Adviser for managing the Portfolio's operations and the Board's confidence in the competence and integrity of the senior managers and key personnel of the Adviser. The Board concluded that the Adviser has the financial resources necessary to fulfill its obligations under the Management Agreement and that it is beneficial for the Portfolio to continue its relationship with the Adviser.
Other Factors and Current Trends
The Board considered the controls and procedures adopted and implemented by the Adviser and monitored by the Fund's Chief Compliance Officer and concluded that the conduct of business by the Adviser indicates a good faith effort on its part to adhere to high ethical standards in the conduct of the Fund's business.
General Conclusion
After considering and weighing all of the above factors, the Board concluded that it would be in the best interest of the Portfolio and its shareholders to approve renewal of the Management Agreement for another year. In reaching this conclusion the Board did not give particular weight to any single factor referenced above. The Board considered these factors over the course of numerous meetings, some of which were in executive session with only the independent Board members and their counsel present. It is possible that individual Board members may have weighed these factors differently in reaching their individual decisions to approve the Management Agreement.
5
Morgan Stanley Institutional Fund Trust
Annual Report — September 30, 2012
Investment Overview (unaudited)
Limited Duration Portfolio
Performance
For the fiscal year ended September 30, 2012, the Portfolio's Class I had a total return based on net asset value and reinvestment of distributions per share of 3.35%, net of fees. The Portfolio's Class I outperformed against its benchmark Barclays Capital 1-3 Year U.S. Government/Credit Index (the "Index"), which returned 1.36%.
Factors Affecting Performance
• Aggressive central bank policy actions to support economic growth and provide stability led to a huge rally in risky assets so far in 2012. The European Central Bank's (ECB) longer-term refinancing operation announced at the end of 2011 was successful and helped improve investor sentiment significantly. As problems in Spain and Italy came to the forefront again this year, the ECB committed to providing unlimited support to the countries' bond markets by launching the Outright Monetary Transactions program. This program is subject to conditionality and would be triggered only if countries request for help.
• Given the weaker-than-expected economic conditions in the U.S., the Federal Reserve Bank also enacted various easing policies during the course of the period. This included extending the timeline to keep the target federal funds rate on hold, buying longer-maturity Treasuries and selling short-term Treasuries to put downward pressure on longer-term interest rates, and another round of quantitative easing focused on mortgage purchases, until the unemployment rate falls to an acceptable level.
• The labor market in the U.S. showed improvement but unemployment remained high. The unemployment rate fell to 7.8% from 9% a year ago. However, a large part of that decline was due to a drop in the labor participation rate. Economic growth in the U.S. remained sluggish as gross domestic product (GDP) growth in the first half of the year was under 2%.
• After the sell-off in the second half of 2011, spread sectors had strong performance so far in 2012 (through September). Spreads on corporate debt spread have tightened significantly with the riskier sectors of the market posting the best performance. Spreads of high yield corporate debt tightened by 240 basis points while short duration investment-grade corporate spreads narrowed by almost 95 basis
points. The financials sector did very well with spreads tightening by about 150 basis points. Whilst the strong market rally has reduced the risk premium in the corporate credit market, we continue to believe that conditions could favor the asset class over the rest of the year.
• Mortgage-backed securities (MBS) performed very well over the period. The latest round of quantitative easing led to a substantial tightening of yield spreads in lower-coupon, fixed-rate MBS. Despite historically low mortgage rates, refinancing activity has been slower than it has been in the past under similar rate incentives, as many borrowers are unable to refinance due to tighter underwriting standards. However, with further quantitative easing, the expectation is that there will be an increase in mortgage refinancing. The U.S. housing market has started showing signs of stabilization. After many months of continuous declines, the headline home price index has turned positive on a year-over-year basis.
• As with other spread product, spreads of asset-backed securities (ABS) also tightened over the period. ABS issuance continued to be strong with supply easily absorbed by the market. We believe technical factors should remain favorable for the sector due to the persistent supply shortage.
• Government bonds in major markets such as the U.S., Germany and the U.K. rallied significantly. The 10-year Treasury yield touched an all-time low of 1.43% in July. The decline in U.S. Treasury yields over the year was led by the intermediate part of the curve as 2-, 5-, 10- and 30-year rates fell by 2, 33, 29, and 9 basis points respectively.
• An overweight to the corporate sector, especially in financials, was the main driver of performance as spreads tightened over the year. A small allocation to high yield bonds also added to returns.
• The Portfolio also benefited from an allocation to ABS as spreads in the sector tightened over the period and the bonds provided attractive carry.
• An underweight in the agency sector detracted slightly from performance.
Management Strategies
• Throughout the period, the Portfolio was positioned with an overweight to investment-grade credit as
6
Morgan Stanley Institutional Fund Trust
Annual Report — September 30, 2012
Investment Overview (unaudited) (cont'd)
Limited Duration Portfolio
corporate bond valuations relative to fundamentals have been attractive. We continue to maintain an overweight to the sector. In addition, we also bought select high yield bonds during the year.
• The Portfolio also has an allocation to short maturity, high quality ABS. This is primarily in credit card, auto and equipment securities.
• Given the current low yielding environment, being overweight spread product seems attractive as we believe the yield advantage could provide a large part of returns over the medium term.
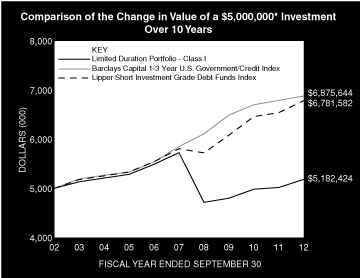
* Minimum Investment
In accordance with SEC regulations, the Portfolio's performance shown assumes that all recurring fees (including management fees) were deducted and all dividends and distributions were reinvested. The performance of Class P, Class H, and Class L shares will vary from the Class I shares based upon their different inception dates and will be negatively impacted by additional fees assessed to those classes.
Performance Compared to the Barclays Capital U.S. 1-3 year U.S. Government/Credit Index(1) and the Lipper Short Investment Grade Debt Funds Index(2)
| | Period Ended September 30, 2012
Total Returns(3) | |
| | | | Average Annual | |
| | One
Year | | Five
Years | | Ten
Years | | Since
Inception(7) | |
Portfolio — Class I Shares
w/o sales charges(4) | | | 3.35 | % | | | -1.96 | % | | | 0.36 | % | | | 3.27 | % | |
Barclays Capital 1-3 Year
U.S. Government/Credit Index. | | | 1.36 | | | | 3.29 | | | | 3.24 | | | | 4.82 | | |
Lipper Short Investment
Grade Debt Funds Index | | | 3.75 | | | | 3.17 | | | | 3.09 | | | | 4.49 | | |
| | Period Ended September 30, 2012
Total Returns(3) | |
| | | | Average Annual | |
| | One
Year | | Five
Years | | Ten
Years | | Since
Inception(7) | |
Portfolio — Class P Shares
w/o sales charges(5) | | | 3.22 | % | | | -2.18 | % | | | — | | | | -2.18 | % | |
Barclays Capital 1-3 Year
U.S. Government/Credit Index. | | | 1.36 | | | | 3.29 | | | | — | | | | 3.29 | | |
Lipper Short Investment
Grade Debt Funds Index | | | 3.75 | | | | 3.17 | | | | — | | | | 3.17 | | |
Portfolio — Class H Shares
w/o sales charges(6) | | | — | | | | — | | | | — | | | | 1.14 | | |
Portfolio — Class H Shares with
maximum 3.50% sales charges(6) | | | — | | | | — | | | | — | | | | -2.38 | | |
Barclays Capital 1-3 Year
U.S. Government/Credit Index. | | | — | | | | — | | | | — | | | | 0.56 | | |
Lipper Short Investment
Grade Debt Funds Index | | | — | | | | — | | | | — | | | | 1.69 | | |
Portfolio — Class L Shares
w/o sales charges(6) | | | — | | | | — | | | | — | | | | 1.06 | | |
Barclays Capital 1-3 Year
U.S. Government/Credit Index. | | | — | | | | — | | | | — | | | | 0.56 | | |
Lipper Short Investment
Grade Debt Funds Index | | | — | | | | — | | | | — | | | | 1.69 | | |
Performance data quoted represents past performance, which is no guarantee of future results, and current performance may be lower or higher than the figures shown. Performance assumes that all dividends and distributions, if any, were reinvested. Returns for periods less than one year are not annualized. For the most recent month-end performance figures, please visit www.morganstanley.com/im. Investment returns and principal value will fluctuate so that Portfolio shares, when redeemed, may be worth more or less than their original cost. Total returns do not reflect the deduction of taxes that a shareholder would pay on Portfolio distributions or the redemption of Portfolio shares. Performance of share classes will vary due to differences in sales charges and expenses.
(1) The Barclays Capital 1-3 Year U.S. Government/Credit Index tracks the securities in the 1-3 year maturity range of the Barclays Capital U.S. Government/Credit Index which tracks investment-grade (BBB-/Baa3) or higher publicly traded fixedrate U.S. government, U.S. agency, and corporate issues. The Index is unmanaged and its returns do not include any sales charges or fees. Such costs would lower performance. It is not possible to invest directly in an index.
(2) The Lipper Short Investment Grade Debt Funds Index is an equally weighted performance index of the largest qualifying funds (based on net assets) in the Lipper Short Investment Grade Debt Funds classification. The Index, which is adjusted for capital gains distributions and income dividends, is unmanaged and should not be considered an investment. There are currently 30 funds represented in this Index. As of the date of this report, the Portfolio was in the Lipper Short Investment Grade Debt Funds classification.
(3) Total returns for the Portfolio reflect expenses waived and/or reimbursed, if applicable, by the Adviser. Without such waivers and/or reimbursements, total returns would have been lower. The fee waivers and/or expense reimbursements will continue for at least one year or until such time as the Fund's Board of Trustees acts to discontinue all or a portion of such waivers and/or reimbursements when it deems such action is appropriate.
(4) Commenced operations on March 31, 1992.
(5) Commenced operations on September 28, 2007.
(6) Commenced operations on April 27, 2012.
(7) For comparative purposes, average annual since inception returns listed for the Indexes refer to the inception date or initial offering of the share class of the Portfolio, not the inception of the Indexes.
7
Morgan Stanley Institutional Fund Trust
Annual Report — September 30, 2012
Investment Overview (unaudited) (cont'd)
Limited Duration Portfolio
Portfolio Composition
Classification | | Percentage of
Total Investments | |
Finance | | | 30.6 | % | |
Industrials | | | 28.4 | | |
Other* | | | 18.4 | | |
Asset-Backed Securities | | | 12.3 | | |
U.S. Treasury Securities | | | 10.3 | | |
Total Investments | | | 100.0 | %** | |
* Industries and/or investment types representing less than 5% of total investments.
** Does not include open long/short futures contracts with an underlying face amount of approximately $42,159,000 and net unrealized appreciation of approximately $7,000 and open swap agreements with total unrealized depreciation of approximately $62,000.
8
Morgan Stanley Institutional Fund Trust
Annual Report — September 30, 2012
Portfolio of Investments
Limited Duration Portfolio
| | | Face
Amount
(000) | | Value
(000) | |
Fixed Income Securities (97.9%) | |
Agency Adjustable Rate Mortgages (2.9%) | |
Federal Home Loan Mortgage Corporation, | |
Conventional Pools: | |
2.70%, 7/1/36 | | $ | 200 | | | $ | 214 | | |
2.79%, 9/1/35 | | | 1,007 | | | | 1,083 | | |
2.84%, 7/1/38 | | | 632 | | | | 677 | | |
5.36%, 1/1/38 | | | 211 | | | | 227 | | |
Federal National Mortgage Association, | |
Conventional Pools: | |
2.32%, 5/1/35 | | | 756 | | | | 808 | | |
3.43%, 5/1/39 | | | 821 | | | | 884 | | |
Government National Mortgage Association, | |
Various Pool | |
4.00%, 2/20/40 | | | 308 | | | | 324 | | |
| | | | 4,217 | | |
Agency Fixed Rate Mortgages (0.8%) | |
Federal Home Loan Mortgage Corporation, | |
Gold Pools: | |
6.50%, 9/1/19 - 11/1/29 | | | 16 | | | | 19 | | |
7.50%, 11/1/19 | | | 2 | | | | 2 | | |
12.00%, 6/1/15 | | | — | @ | | | — | @ | |
Federal National Mortgage Association, | |
Conventional Pools: | |
6.50%, 2/1/28 - 10/1/32 | | | 896 | | | | 1,040 | | |
7.00%, 7/1/29 - 12/1/33 | | | 63 | | | | 76 | | |
Government National Mortgage Association, | |
Various Pools: | |
9.00%, 11/15/16 - 12/15/16 | | | 38 | | | | 42 | | |
| | | | 1,179 | | |
Asset-Backed Securities (12.5%) | |
Ally Auto Receivables Trust 2012-SN1 | |
0.57%, 8/20/15 | | | 560 | | | | 560 | | |
Ally Master Owner Trust, | |
1.97%, 1/15/15 (a)(b) | | | 275 | | | | 276 | | |
2.15%, 1/15/16 | | | 700 | | | | 713 | | |
2.88%, 4/15/15 (a) | | | 650 | | | | 656 | | |
American Express Credit Account Master Trust | |
1.47%, 3/15/17 (b) | | | 2,325 | | | | 2,380 | | |
Capital One Multi-Asset Execution Trust | |
0.30%, 9/15/15 (b) | | | 1,355 | | | | 1,355 | | |
Chase Issuance Trust | |
0.59%, 8/15/17 | | | 1,608 | | | | 1,613 | | |
Citibank Credit Card Issuance Trust (See Note G) | |
2.25%, 12/23/14 | | | 1,950 | | | | 1,959 | | |
CNH Equipment Trust | |
1.17%, 5/15/15 | | | 834 | | | | 837 | | |
Ford Credit Auto Lease Trust | |
0.57%, 9/15/15 (c) | | | 330 | | | | 330 | | |
Ford Credit Floorplan Master Owner Trust | |
4.20%, 2/15/17 (a) | | | 1,150 | | | | 1,239 | | |
| | | Face
Amount
(000) | | Value
(000) | |
GE Dealer Floorplan Master Note Trust | |
0.71%, 6/20/17 (b) | | $ | 750 | | | $ | 754 | | |
GE Equipment Midticket LLC | |
0.94%, 7/14/14 (a) | | | 359 | | | | 359 | | |
Harley-Davidson Motorcycle Trust | |
1.16%, 2/15/15 | | | 1,105 | | | | 1,107 | | |
Macquarie Equipment Funding Trust | |
1.21%, 9/20/13 (a) | | | 548 | | | | 549 | | |
MMAF Equipment Finance LLC | |
2.37%, 11/15/13 (a) | | | 208 | | | | 209 | | |
MMCA Auto Owner Trust 2010-A | |
1.39%, 1/15/14 (a) | | | 202 | | | | 202 | | |
Nissan Auto Lease Trust | |
1.12%, 12/15/13 | | | 869 | | | | 870 | | |
Nissan Master Owner Trust Receivables | |
1.37%, 1/15/15 (a)(b) | | | 625 | | | | 627 | | |
North Carolina State Education Assistance
Authority, | |
0.90%, 1/25/21 (b) | | | 503 | | | | 504 | | |
1.25%, 7/25/25 (b) | | | 625 | | | | 628 | | |
Panhandle-Plains Higher Education Authority, Inc. | |
1.31%, 7/1/24 (b) | | | 275 | | | | 278 | | |
World Omni Automobile Lease Securitization Trust | |
0.93%, 11/16/15 | | | 180 | | | | 181 | | |
| | | | 18,186 | | |
Collateralized Mortgage Obligations — Agency Collateral Series (1.5%) | |
Federal Home Loan Mortgage Corporation, | |
1.56%, 10/25/18 | | | 271 | | | | 280 | | |
REMIC | |
7.50%, 9/15/29 | | | 1,639 | | | | 1,940 | | |
| | | | 2,220 | | |
Corporate Bonds (64.7%) | |
Finance (31.1%) | |
ABB Treasury Center USA, Inc. | |
2.50%, 6/15/16 (a) | | | 745 | | | | 779 | | |
Abbey National Treasury Services PLC | |
2.88%, 4/25/14 | | | 615 | | | | 623 | | |
ABN Amro Bank N.V. | |
4.25%, 2/2/17 (a) | | | 400 | | | | 430 | | |
Aflac, Inc. | |
3.45%, 8/15/15 | | | 325 | | | | 349 | | |
American Express Co. | |
7.25%, 5/20/14 | | | 1,680 | | | | 1,855 | | |
American International Group, Inc. | |
3.65%, 1/15/14 | | | 745 | | | | 767 | | |
AWAS Aviation Capital Ltd. | |
7.00%, 10/17/16 (a) | | | 428 | | | | 456 | | |
Banco Bradesco SA | |
4.50%, 1/12/17 | | | 975 | | | | 1,041 | | |
Bank of America Corp., | |
Series 1 | |
3.75%, 7/12/16 | | | 1,295 | | | | 1,375 | | |
The accompanying notes are an integral part of the financial statements.
9
Morgan Stanley Institutional Fund Trust
Annual Report — September 30, 2012
Portfolio of Investments (cont'd)
Limited Duration Portfolio
| | | Face
Amount
(000) | | Value
(000) | |
Finance (cont'd) | |
Bank of Montreal | |
1.40%, 9/11/17 | | $ | 585 | | | $ | 589 | | |
Barclays Bank PLC | |
5.20%, 7/10/14 | | | 980 | | | | 1,047 | | |
BNP Paribas SA | |
2.38%, 9/14/17 | | | 1,000 | | | | 1,005 | | |
BP Capital Markets PLC | |
3.88%, 3/10/15 | | | 595 | | | | 640 | | |
Canadian Imperial Bank of Commerce, | |
0.90%, 10/1/15 (c) | | | 435 | | | | 436 | | |
1.45%, 9/13/13 | | | 1,130 | | | | 1,141 | | |
Capital One Financial Corp. | |
7.38%, 5/23/14 | | | 875 | | | | 963 | | |
CIT Group, Inc. | |
5.00%, 5/15/17 | | | 500 | | | | 536 | | |
Citigroup, Inc. (See Note G) | |
4.45%, 1/10/17 | | | 1,125 | | | | 1,237 | | |
CNH Capital LLC | |
6.25%, 11/1/16 (a) | | | 355 | | | | 387 | | |
Commonwealth Bank of Australia | |
1.95%, 3/16/15 | | | 735 | | | | 752 | | |
Cooperatieve Centrale
Raiffeisen-Boerenleenbank BA/Utrect | |
3.38%, 1/19/17 | | | 330 | | | | 351 | | |
Credit Agricole SA | |
3.00%, 10/1/17 (a)(c) | | | 725 | | | | 723 | | |
Credit Suisse | |
5.50%, 5/1/14 | | | 840 | | | | 897 | | |
Deutsche Bank AG | |
2.38%, 1/11/13 | | | 1,105 | | | | 1,111 | | |
DNB Bank ASA | |
3.20%, 4/3/17 (a) | | | 610 | | | | 638 | | |
General Electric Capital Corp. | |
2.95%, 5/9/16 | | | 2,790 | | | | 2,953 | | |
Genworth Life Institutional Funding Trust | |
5.88%, 5/3/13 (a) | | | 865 | | | | 883 | | |
Goldman Sachs Group, Inc. (The) | |
3.63%, 2/7/16 | | | 1,250 | | | | 1,320 | | |
HCP, Inc. | |
2.70%, 2/1/14 | | | 575 | | | | 587 | | |
HSBC USA, Inc. | |
2.38%, 2/13/15 | | | 775 | | | | 798 | | |
Icahn Enterprises LP/Icahn Enterprises
Finance Corp. | |
7.75%, 1/15/16 | | | 375 | | | | 393 | | |
ING Bank N.V. | |
3.75%, 3/7/17 (a) | | | 600 | | | | 633 | | |
International Lease Finance Corp. | |
6.75%, 9/1/16 (a) | | | 325 | | | | 367 | | |
JPMorgan Chase & Co., | |
1.88%, 3/20/15 | | | 475 | | | | 485 | | |
3.15%, 7/5/16 | | | 1,025 | | | | 1,085 | | |
| | | Face
Amount
(000) | | Value
(000) | |
Macquarie Group Ltd. | |
7.30%, 8/1/14 (a) | | $ | 720 | | | $ | 776 | | |
Metropolitan Life Global Funding I, | |
1.70%, 6/29/15 (a) | | | 530 | | | | 541 | | |
2.00%, 1/10/14 (a) | | | 950 | | | | 964 | | |
Monumental Global Funding III | |
5.25%, 1/15/14 (a) | | | 1,115 | | | | 1,177 | | |
National Australia Bank Ltd. | |
3.00%, 7/27/16 (a) | | | 900 | | | | 952 | | |
Nationwide Building Society | |
4.65%, 2/25/15 (a) | | | 840 | | | | 889 | | |
Nissan Motor Acceptance Corp. | |
3.25%, 1/30/13 (a) | | | 90 | | | | 91 | | |
Nordea Bank AB | |
2.25%, 3/20/15 (a) | | | 635 | | | | 647 | | |
Northern Trust Corp. | |
5.50%, 8/15/13 | | | 1,060 | | | | 1,107 | | |
Principal Financial Group, Inc. | |
7.88%, 5/15/14 | | | 816 | | | | 908 | | |
Prudential Financial, Inc., | |
MTN | |
4.75%, 9/17/15 | | | 930 | | | | 1,025 | | |
Royal Bank of Scotland Group PLC | |
2.55%, 9/18/15 | | | 495 | | | | 501 | | |
Santander Holdings USA, Inc. | |
3.00%, 9/24/15 | | | 110 | | | | 111 | | |
Standard Chartered PLC | |
3.85%, 4/27/15 (a) | | | 940 | | | | 992 | | |
UBS AG | |
3.88%, 1/15/15 | | | 1,140 | | | | 1,209 | | |
US Bancorp | |
2.20%, 11/15/16 | | | 940 | | | | 988 | | |
WellPoint, Inc. | |
1.88%, 1/15/18 | | | 705 | | | | 711 | | |
Wells Fargo & Co. | |
3.68%, 6/15/16 | | | 1,350 | | | | 1,471 | | |
Westpac Banking Corp. | |
1.38%, 7/17/15 (a) | | | 525 | | | | 532 | | |
| | | | 45,224 | | |
Industrials (28.9%) | |
Altria Group, Inc. | |
4.13%, 9/11/15 | | | 750 | | | | 822 | | |
Amgen, Inc. | |
2.50%, 11/15/16 | | | 425 | | | | 447 | | |
Anheuser-Busch InBev Worldwide, Inc., | |
4.13%, 1/15/15 | | | 350 | | | | 378 | | |
5.38%, 11/15/14 | | | 785 | | | | 864 | | |
Applied Materials, Inc. | |
2.65%, 6/15/16 | | | 455 | | | | 482 | | |
Apria Healthcare Group, Inc. | |
11.25%, 11/1/14 | | | 375 | | | | 386 | | |
ArcelorMittal | |
9.25%, 2/15/15 | | | 610 | | | | 671 | | |
The accompanying notes are an integral part of the financial statements.
10
Morgan Stanley Institutional Fund Trust
Annual Report — September 30, 2012
Portfolio of Investments (cont'd)
Limited Duration Portfolio
| | | Face
Amount
(000) | | Value
(000) | |
Industrials (cont'd) | |
AT&T, Inc. | |
1.70%, 6/1/17 | | $ | 1,075 | | | $ | 1,108 | | |
BAA Funding Ltd. | |
2.50%, 6/25/15 (a) | | | 400 | | | | 408 | | |
Bacardi Ltd. | |
7.45%, 4/1/14 (a) | | | 835 | | | | 916 | | |
Barrick Gold Corp. | |
1.75%, 5/30/14 | | | 660 | | | | 670 | | |
BAT International Finance PLC | |
1.40%, 6/5/15 (a) | | | 600 | | | | 605 | | |
Best Buy Co., Inc. | |
3.75%, 3/15/16 | | | 875 | | | | 838 | | |
Bill Barrett Corp. | |
9.88%, 7/15/16 | | | 425 | | | | 470 | | |
Bunge Ltd. Finance Corp. | |
5.35%, 4/15/14 | | | 830 | | | | 877 | | |
Chesapeake Energy Corp. | |
7.63%, 7/15/13 | | | 350 | | | | 365 | | |
Coca-Cola Co. (The) | |
0.75%, 3/13/15 | | | 855 | | | | 863 | | |
Comcast Corp. | |
6.50%, 1/15/15 | | | 870 | | | | 980 | | |
Covidien International Finance SA | |
1.35%, 5/29/15 | | | 265 | | | | 269 | | |
COX Communications, Inc. | |
4.63%, 6/1/13 | | | 690 | | | | 709 | | |
Daimler Finance North America LLC | |
1.88%, 9/15/14 (a) | | | 785 | | | | 798 | | |
Danaher Corp. | |
1.30%, 6/23/14 | | | 255 | | | | 259 | | |
Delhaize Group SA | |
5.88%, 2/1/14 | | | 1,025 | | | | 1,077 | | |
Diageo Capital PLC | |
1.50%, 5/11/17 | | | 775 | | | | 789 | | |
DirecTV Holdings LLC/DirecTV Financing Co., Inc. | |
4.75%, 10/1/14 | | | 695 | | | | 746 | | |
DISH DBS Corp. | |
7.13%, 2/1/16 | | | 475 | | | | 527 | | |
Ecolab, Inc., | |
1.00%, 8/9/15 | | | 245 | | | | 246 | | |
3.00%, 12/8/16 | | | 320 | | | | 344 | | |
Experian Finance PLC | |
2.38%, 6/15/17 (a) | | | 600 | | | | 609 | | |
Express Scripts Holding Co., | |
2.65%, 2/15/17 (a) | | | 35 | | | | 37 | | |
2.75%, 11/21/14 (a) | | | 580 | | | | 603 | | |
FMG Resources August 2006 Pty Ltd. | |
6.38%, 2/1/16 (a) | | | 500 | | | | 489 | | |
Ford Motor Credit Co. LLC | |
5.63%, 9/15/15 | | | 375 | | | | 411 | | |
Gilead Sciences, Inc. | |
3.05%, 12/1/16 | | | 1,000 | | | | 1,076 | | |
| | | Face
Amount
(000) | | Value
(000) | |
GlaxoSmithKline Capital PLC | |
0.75%, 5/8/15 | | $ | 340 | | | $ | 342 | | |
Harley-Davidson Funding Corp. | |
5.25%, 12/15/12 (a) | | | 820 | | | | 826 | | |
Hewlett-Packard Co. | |
3.30%, 12/9/16 | | | 815 | | | | 850 | | |
Home Depot, Inc. | |
5.40%, 3/1/16 | | | 630 | | | | 729 | | |
Hyundai Capital America | |
1.63%, 10/2/15 (a)(c) | | | 395 | | | | 395 | | |
Kellogg Co. | |
1.13%, 5/15/15 | | | 175 | | | | 177 | | |
Kinross Gold Corp. | |
3.63%, 9/1/16 | | | 740 | | | | 748 | | |
Kraft Foods Group, Inc. | |
2.25%, 6/5/17 (a) | | | 425 | | | | 438 | | |
Kroger Co. (The) | |
7.50%, 1/15/14 | | | 725 | | | | 788 | | |
LVMH Moet Hennessy Louis Vuitton SA | |
1.63%, 6/29/17 (a) | | | 525 | | | | 530 | | |
Marathon Petroleum Corp. | |
3.50%, 3/1/16 | | | 1,070 | | | | 1,135 | | |
McDonald's Corp. | |
0.75%, 5/29/15 | | | 225 | | | | 227 | | |
McKesson Corp. | |
3.25%, 3/1/16 | | | 1,070 | | | | 1,152 | | |
NBC Universal Media LLC | |
2.10%, 4/1/14 | | | 835 | | | | 853 | | |
News America, Inc. | |
5.30%, 12/15/14 | | | 455 | | | | 501 | | |
PepsiCo, Inc. | |
0.75%, 3/5/15 | | | 525 | | | | 529 | | |
Phillips 66 | |
1.95%, 3/5/15 (a) | | | 775 | | | | 793 | | |
Sealed Air Corp. | |
7.88%, 6/15/17 | | | 275 | | | | 296 | | |
Sealy Mattress Co. | |
10.88%, 4/15/16 (a) | | | 300 | | | | 328 | | |
Stryker Corp. | |
2.00%, 9/30/16 | | | 715 | | | | 746 | | |
Takeda Pharmaceutical Co., Ltd. | |
1.03%, 3/17/15 (a) | | | 440 | | | | 444 | | |
Texas Instruments, Inc. | |
1.38%, 5/15/14 | | | 955 | | | | 970 | | |
Time Warner Cable, Inc. | |
6.75%, 7/1/18 | | | 400 | | | | 504 | | |
Tyco Electronics Group SA | |
1.60%, 2/3/15 | | | 170 | | | | 173 | | |
United Air Lines, Inc. | |
9.88%, 8/1/13 (a) | | | 356 | | | | 366 | | |
United Technologies Corp. | |
1.20%, 6/1/15 | | | 125 | | | �� | 127 | | |
The accompanying notes are an integral part of the financial statements.
11
Morgan Stanley Institutional Fund Trust
Annual Report — September 30, 2012
Portfolio of Investments (cont'd)
Limited Duration Portfolio
| | | Face
Amount
(000) | | Value
(000) | |
Industrials (cont'd) | |
Verizon Communications, Inc. | |
1.25%, 11/3/14 | | $ | 715 | | | $ | 727 | | |
Viacom, Inc. | |
4.38%, 9/15/14 | | | 1,100 | | | | 1,177 | | |
Virgin Media Finance PLC, | |
Series 1 | |
9.50%, 8/15/16 | | | 450 | | | | 501 | | |
Vodafone Group PLC | |
1.25%, 9/26/17 | | | 775 | | | | 777 | | |
Volkswagen International Finance N.V. | |
1.63%, 3/22/15 (a) | | | 1,195 | | | | 1,215 | | |
Waste Management, Inc. | |
2.60%, 9/1/16 | | | 725 | | | | 762 | | |
Wesfarmers Ltd. | |
2.98%, 5/18/16 (a) | | | 395 | | | | 413 | | |
WMG Acquisition Corp. | |
9.50%, 6/15/16 | | | 350 | | | | 384 | | |
| | | | 42,062 | | |
Utilities (4.7%) | |
AES Corp. (The) | |
7.75%, 10/15/15 | | | 350 | | | | 397 | | |
Commonwealth Edison Co. | |
1.63%, 1/15/14 | | | 805 | | | | 816 | | |
Enel Finance International N.V. | |
3.88%, 10/7/14 (a) | | | 1,115 | | | | 1,147 | | |
Enterprise Products Operating LLC | |
1.25%, 8/13/15 | | | 315 | | | | 318 | | |
FirstEnergy Solutions Corp. | |
4.80%, 2/15/15 | | | 755 | | | | 812 | | |
Georgia Power Co. | |
0.75%, 8/10/15 | | | 340 | | | | 341 | | |
NextEra Energy Capital Holdings, Inc. | |
5.35%, 6/15/13 | | | 825 | | | | 852 | | |
Sempra Energy | |
2.00%, 3/15/14 | | | 915 | | | | 930 | | |
Spectra Energy Capital LLC | |
5.90%, 9/15/13 | | | 965 | | | | 1,011 | | |
TransCanada PipeLines Ltd. | |
0.88%, 3/2/15 | | | 300 | | | | 303 | | |
| | | | 6,927 | | |
| | | | 94,213 | | |
Mortgage — Other (0.3%) | |
FDIC Structured Sale Guaranteed Notes | |
0.78%, 2/25/48 (a)(b) | | | 448 | | | | 449 | | |
Non-U.S. Government — Guaranteed (4.3%) | |
Commonwealth Bank of Australia | |
2.50%, 12/10/12 (a) | | | 2,300 | | | | 2,309 | | |
Swedbank AB | |
2.90%, 1/14/13 (a) | | | 3,900 | | | | 3,928 | | |
| | | | 6,237 | | |
| | | Face
Amount
(000) | | Value
(000) | |
Sovereign (0.4%) | |
Qatar Government International Bond | |
4.00%, 1/20/15 (a) | | $ | 500 | | | $ | 532 | | |
U.S. Treasury Securities (10.5%) | |
U.S. Treasury Notes, | |
0.50%, 10/15/14 | | | 6,590 | | | | 6,625 | | |
1.25%, 10/31/15 | | | 8,453 | | | | 8,691 | | |
| | | | 15,316 | | |
Total Fixed Income Securities (Cost $139,032) | | | 142,549 | | |
| | | Shares | | | |
Short-Term Investments (3.8%) | |
Investment Company (3.7%) | |
Morgan Stanley Institutional
Liquidity Funds — Money Market Portfolio —
Institutional Class (See Note G)
(Cost $5,319) | | | 5,318,565 | | | | 5,319 | | |
| | | Face
Amount
(000) | | | |
U.S. Treasury Security (0.1%) | |
U.S. Treasury Bill | |
0.13%, 2/21/13 (d)(e) | | $ | 105 | | | | 105 | | |
Total Short-Term Investments (Cost $5,424) | | | 5,424 | | |
Total Investments (101.7%) (Cost $144,456) (f) | | | 147,973 | | |
Liabilities in Excess of Other Assets (-1.7%) | | | (2,421 | ) | |
Net Assets (100.0%) | | $ | 145,552 | | |
(a) 144A security — Certain conditions for public sale may exist. Unless otherwise noted, these securities are deemed to be liquid.
(b) Variable/Floating Rate Security — Interest rate changes on these instruments are based on changes in a designated base rate. The rates shown are those in effect on September 30, 2012.
(c) When-issued security.
(d) Rate shown is the yield to maturity at September 30, 2012.
(e) All or a portion of the security was pledged to cover margin requirements for futures contracts.
(f) Securities are available for collateral in connection with purchase of when-issued securities, open futures contracts and swap agreements.
@ Face Amount/Value is less than $500.
FDIC Federal Deposit Insurance Corporation.
MTN Medium Term Note.
REMIC Real Estate Mortgage Investment Conduit.
The accompanying notes are an integral part of the financial statements.
12
Morgan Stanley Institutional Fund Trust
Annual Report — September 30, 2012
Portfolio of Investments (cont'd)
Limited Duration Portfolio
Futures Contracts:
The Portfolio had the following futures contracts open at September 30, 2012:
| | | Number
of
Contracts | | Value
(000) | | Expiration
Date | | Unrealized
Appreciation
(Depreciation)
(000) | |
Long: | |
U.S. Treasury 2 yr. Note | | | 168 | | | $ | 37,049 | | | Dec-12 | | $ | 24 | | |
Short: | |
U.S. Treasury 5 yr. Note | | | 41 | | | | (5,110 | ) | | Dec-12 | | | (17 | ) | |
| | | | | | | | | $ | 7 | | |
Interest Rate Swap Agreements:
The Portfolio had the following interest rate swap agreements open at September 30, 2012:
Swap Counterparty | | Floating Rate
Index | | Pay/Receive
Floating Rate | | Fixed Rate | | Termination
Date | | Notional
Amount
(000) | | Unrealized
(Depreciation)
(000) | |
Barclays Capital | | 3 Month LIBOR | | Receive | | | 0.81 | % | | 9/24/17 | | $ | 3,000 | | | $ | (7 | ) | |
Credit Suisse | | 3 Month LIBOR | | Receive | | | 0.39 | | | 9/25/14 | | | 9,390 | | | | (6 | ) | |
Credit Suisse | | 3 Month LIBOR | | Receive | | | 0.82 | | | 9/13/17 | | | 4,500 | | | | (13 | ) | |
Deutsche Bank | | 3 Month LIBOR | | Receive | | | 0.82 | | | 7/24/17 | | | 7,644 | | | | (36 | ) | |
| | | | | | | | | | | | | $ | (62 | ) | |
LIBOR London Interbank Offered Rate.
The accompanying notes are an integral part of the financial statements.
13
Morgan Stanley Institutional Fund Trust
Annual Report — September 30, 2012
Limited Duration Portfolio
Statement of Assets and Liabilities | | September 30, 2012
(000) | |
Assets: | |
Investments in Securities of Unaffiliated Issuers, at Value (Cost $136,008) | | $ | 139,458 | | |
Investment in Security of Affiliated Issuer, at Value (Cost $8,448) | | | 8,515 | | |
Total Investments in Securities, at Value (Cost $144,456) | | | 147,973 | | |
Interest Receivable | | | 1,021 | | |
Receivable for Portfolio Shares Sold | | | 35 | | |
Receivable from Affiliate | | | 24 | | |
Receivable for Variation Margin | | | 9 | | |
Other Assets | | | 16 | | |
Total Assets | | | 149,078 | | |
Liabilities: | |
Payable for Investments Purchased | | | 2,780 | | |
Payable for Portfolio Shares Redeemed | | | 370 | | |
Payable for Sub Transfer Agency Fees | | | 117 | | |
Payable for Advisory Fees | | | 110 | | |
Unrealized Depreciation on Swap Agreements | | | 62 | | |
Payable for Professional Fees | | | 31 | | |
Payable for Administration Fees | | | 10 | | |
Payable for Custodian Fees | | | 4 | | |
Payable for Trustees' Fees and Expenses | | | 4 | | |
Payable for Transfer Agent Fees | | | 1 | | |
Payable for Shareholder Services Fees — Class P | | | — | @ | |
Payable for Shareholder Services Fees — Class H | | | — | @ | |
Payable for Distribution and Shareholder Services Fees — Class L | | | — | @ | |
Other Liabilities | | | 37 | | |
Total Liabilities | | | 3,526 | | |
Net Assets | | $ | 145,552 | | |
Net Assets Consist Of: | |
Paid-in-Capital | | $ | 400,653 | | |
Undistributed Net Investment Income | | | 506 | | |
Accumulated Net Realized Loss | | | (259,069 | ) | |
Unrealized Appreciation (Depreciation) on: | |
Investments | | | 3,450 | | |
Investments in Affiliates | | | 67 | | |
Futures Contracts | | | 7 | | |
Swap Agreements | | | (62 | ) | |
Net Assets | | $ | 145,552 | | |
CLASS I: | |
Net Assets | | $ | 145,387 | | |
| Shares Outstanding (unlimited number of shares authorized, no par value) (not in 000s) | | | 18,639,159 | | |
Net Asset Value, Offering and Redemption Price Per Share | | $ | 7.80 | | |
CLASS P: | |
Net Assets | | $ | 145 | | |
| Shares Outstanding (unlimited number of shares authorized, no par value) (not in 000s) | | | 18,644 | | |
Net Asset Value, Offering and Redemption Price Per Share | | $ | 7.80 | | |
CLASS H: | |
Net Assets | | $ | 10 | | |
| Shares Outstanding (unlimited number of shares authorized, no par value) (not in 000s) | | | 1,289 | | |
Net Asset Value, Redemption Price Per Share | | $ | 7.80 | | |
Maximum Sales Load | | | 3.50 | % | |
Maximum Sales Charge | | $ | 0.28 | | |
Maximum Offering Price Per Share | | $ | 8.08 | | |
CLASS L: | |
Net Assets | | $ | 10 | | |
| Shares Outstanding (unlimited number of shares authorized, no par value) (not in 000s) | | | 1,289 | | |
Net Asset Value, Offering and Redemption Price Per Share | | $ | 7.80 | | |
@ Amount is less than $500.
The accompanying notes are an integral part of the financial statements.
14
Morgan Stanley Institutional Fund Trust
Annual Report — September 30, 2012
Limited Duration Portfolio
Statement of Operations | | Year Ended
September 30, 2012
(000) | |
Investment Income: | |
Interest from Securities of Unaffiliated Issuers (Net of $1 Foreign Taxes Withheld) | | $ | 3,885 | | |
Interest from Securities of Affiliated Issuers | | | 87 | | |
Dividends from Security of Affiliated Issuer | | | 4 | | |
Total Investment Income | | | 3,976 | | |
Expenses: | |
Advisory Fees (Note B) | | | 467 | | |
Sub Transfer Agency Fees | | | 156 | | |
Administration Fees (Note C) | | | 125 | | |
Professional Fees | | | 72 | | |
Registration Fees | | | 58 | | |
Shareholder Reporting Fees | | | 37 | | |
Custodian Fees (Note F) | | | 26 | | |
Pricing Fees | | | 21 | | |
Transfer Agency Fees (Note E) | | | 11 | | |
Trustees' Fees and Expenses | | | 5 | | |
Shareholder Services Fees — Class P (Note D) | | | — | @ | |
Shareholder Services Fees — Class H (Note D) | | | — | @ | |
Distribution and Shareholder Services Fees — Class L (Note D) | | | — | @ | |
Other Expenses | | | 11 | | |
Total Expenses | | | 989 | | |
Rebate from Morgan Stanley Affiliate (Note G) | | | (4 | ) | |
Expense Offset (Note F) | | | (— | @) | |
Net Expenses | | | 985 | | |
Net Investment Income | | | 2,991 | | |
Realized Gain (Loss): | |
Investments Sold | | | 350 | | |
Investments in Affiliates | | | 46 | | |
Futures Contracts | | | (181 | ) | |
Swap Agreements | | | (560 | ) | |
Net Realized Loss | | | (345 | ) | |
Change in Unrealized Appreciation (Depreciation): | |
Investments | | | 1,916 | | |
Investments in Affiliates | | | 31 | | |
Futures Contracts | | | 24 | | |
Swap Agreements | | | 466 | | |
Net Change in Unrealized Appreciation (Depreciation) | | | 2,437 | | |
Net Realized Gain (Loss) and Change in Unrealized Appreciation (Depreciation) | | | 2,092 | | |
Net Increase in Net Assets Resulting from Operations | | $ | 5,083 | | |
@ Amount is less than $500.
The accompanying notes are an integral part of the financial statements.
15
Morgan Stanley Institutional Fund Trust
Annual Report — September 30, 2012
Limited Duration Portfolio
Statements of Changes in Net Assets | | Year Ended
September 30, 2012
(000) | | Year Ended
September 30, 2011
(000) | |
Increase (Decrease) in Net Assets: | |
Operations: | |
Net Investment Income | | $ | 2,991 | | | $ | 3,987 | | |
Net Realized Loss | | | (345 | ) | | | (157 | ) | |
Net Change in Unrealized Appreciation (Depreciation) | | | 2,437 | | | | (2,438 | ) | |
Net Increase in Net Assets Resulting from Operations | | | 5,083 | | | | 1,392 | | |
Distributions from and/or in Excess of: | |
Class I: | |
Net Investment Income | | | (3,363 | ) | | | (3,268 | ) | |
Class P: | |
Net Investment Income | | | (3 | ) | | | (2 | ) | |
Class H: | |
Net Investment Income | | | (— | @)* | | | — | | |
Class L: | |
Net Investment Income | | | (— | @)* | | | — | | |
Total Distributions | | | (3,366 | ) | | | (3,270 | ) | |
Capital Share Transactions:(1) | |
Class I: | |
Subscribed | | | 6,757 | | | | 11,161 | | |
Distributions Reinvested | | | 3,362 | | | | 3,267 | | |
Redeemed | | | (34,259 | ) | | | (53,349 | ) | |
Class P: | |
Subscribed | | | 131 | | | | 250 | | |
Distributions Reinvested | | | 3 | | | | 2 | | |
Redeemed | | | (184 | ) | | | (108 | ) | |
Class H: | |
Subscribed | | | 10 | * | | | — | | |
Class L: | |
Subscribed | | | 10 | * | | | — | | |
Net Decrease in Net Assets Resulting from Capital Share Transactions | | | (24,170 | ) | | | (38,777 | ) | |
Total Decrease in Net Assets | | | (22,453 | ) | | | (40,655 | ) | |
Net Assets: | |
Beginning of Period | | | 168,005 | | | | 208,660 | | |
End of Period (Including Undistributed Net Investment Income of $506 and $822) | | $ | 145,552 | | | $ | 168,005 | | |
(1) Capital Share Transactions: | |
Class I: | |
Shares Subscribed | | | 873 | | | | 1,439 | | |
Shares Issued on Distributions Reinvested | | | 435 | | | | 421 | | |
Shares Redeemed | | | (4,432 | ) | | | (6,875 | ) | |
Net Decrease in Class I Shares Outstanding | | | (3,124 | ) | | | (5,015 | ) | |
Class P: | |
Shares Subscribed | | | 17 | | | | 32 | | |
Shares Issued on Distributions Reinvested | | | 1 | | | | — | @@ | |
Shares Redeemed | | | (24 | ) | | | (14 | ) | |
Net Increase (Decrease) in Class P Shares Outstanding | | | (6 | ) | | | 18 | | |
Class H: | |
Shares Subscribed | | | 1 | * | | | — | | |
Class L: | |
Shares Subscribed | | | 1 | * | | | — | | |
@ Amount is less than $500.
@@ Amount is less than 500 shares.
* For the period April 27, 2012 through September 30, 2012.
The accompanying notes are an integral part of the financial statements.
16
Morgan Stanley Institutional Fund Trust
Annual Report — September 30, 2012
Financial Highlights
Limited Duration Portfolio
| | | Class I | |
| | | Year Ended September 30, | |
Selected Per Share Data and Ratios | | 2012 | | 2011 | | 2010 | | 2009 | | 2008 | |
Net Asset Value, Beginning of Period | | $ | 7.71 | | | $ | 7.79 | | | $ | 7.68 | | | $ | 8.00 | | | $ | 10.24 | | |
Income (Loss) from Investment Operations: | |
Net Investment Income† | | | 0.15 | | | | 0.16 | | | | 0.18 | | | | 0.24 | | | | 0.49 | | |
Net Realized and Unrealized Gain (Loss) | | | 0.11 | | | | (0.10 | ) | | | 0.10 | | | | (0.12 | ) | | | (2.22 | ) | |
Total from Investment Operations | | | 0.26 | | | | 0.06 | | | | 0.28 | | | | 0.12 | | | | (1.73 | ) | |
Distributions from and/or in Excess of: | |
Net Investment Income | | | (0.17 | ) | | | (0.14 | ) | | | (0.16 | ) | | | (0.44 | ) | | | (0.51 | ) | |
Paid-in-Capital | | | — | | | | — | | | | (0.01 | ) | | | — | | | | — | | |
Total Distributions | | | (0.17 | ) | | | (0.14 | ) | | | (0.17 | ) | | | (0.44 | ) | | | (0.51 | ) | |
Redemption Fees | | | — | | | | — | | | | — | | | | 0.00 | ‡ | | | — | | |
Net Asset Value, End of Period | | $ | 7.80 | | | $ | 7.71 | | | $ | 7.79 | | | $ | 7.68 | | | $ | 8.00 | | |
Total Return++ | | | 3.35 | % | | | 0.71 | % | | | 3.74 | % | | | 1.77 | % | | | (17.57 | )% | |
Ratios and Supplemental Data: | |
Net Assets, End of Period (Thousands) | | $ | 145,387 | | | $ | 167,811 | | | $ | 208,608 | | | $ | 262,794 | | | $ | 568,156 | | |
Ratio of Expenses to Average Net Assets (1) | | | 0.63 | %+ | | | 0.59 | %+†† | | | 0.55 | %+†† | | | 0.45 | %+ | | | 0.43 | %+ | |
Ratio of Net Investment Income to Average Net Assets (1) | | | 1.92 | %+ | | | 2.12 | %+†† | | | 2.39 | %+†† | | | 3.16 | %+ | | | 5.22 | %+ | |
Ratio of Rebate from Morgan Stanley Affiliates to Average Net Assets | | | 0.00 | %§ | | | 0.00 | %§ | | | 0.00 | %§ | | | 0.00 | %§ | | | 0.01 | % | |
Portfolio Turnover Rate | | | 51 | % | | | 35 | % | | | 95 | % | | | 110 | % | | | 20 | % | |
(1) Supplemental Information on the Ratios to Average Net Assets: | |
Ratios Before Expense Limitation: | |
Expenses to Average Net Assets | | | N/A | | | | N/A | | | | N/A | | | | N/A | | | | 0.43 | %+ | |
Net Investment Income to Average Net Assets | | | N/A | | | | N/A | | | | N/A | | | | N/A | | | | 5.22 | %+ | |
† Per share amount is based on average shares outstanding.
‡ Amount is less than $0.005 per share.
++ Calculated based on the net asset value as of the last business day of the period.
+ The Ratios of Expenses and Net Investment Income reflect the rebate of certain Portfolio expenses in connection with the investments in Morgan Stanley affiliates during the period. The effect of the rebate on the ratios is disclosed in the above table as "Ratio of Rebate from Morgan Stanley Affiliates to Average Net Assets."
†† Reflects overall Portfolio ratios for investment income and non-class specific expenses.
§ Amount is less than 0.005%.
The accompanying notes are an integral part of the financial statements.
17
Morgan Stanley Institutional Fund Trust
Annual Report — September 30, 2012
Financial Highlights
Limited Duration Portfolio
| | | Class P | |
| | | Year Ended September 30, | |
Selected Per Share Data and Ratios | | 2012 | | 2011 | | 2010 | | 2009 | | 2008 | |
Net Asset Value, Beginning of Period | | $ | 7.71 | | | $ | 7.79 | | | $ | 7.68 | | | $ | 8.00 | | | $ | 10.24 | | |
Income (Loss) from Investment Operations: | |
Net Investment Income† | | | 0.13 | | | | 0.15 | | | | 0.17 | | | | 0.22 | | | | 0.47 | | |
Net Realized and Unrealized Gain (Loss) | | | 0.11 | | | | (0.12 | ) | | | 0.09 | | | | (0.12 | ) | | | (2.23 | ) | |
Total from Investment Operations | | | 0.24 | | | | 0.03 | | | | 0.26 | | | | 0.10 | | | | (1.76 | ) | |
Distributions from and/or in Excess of: | |
Net Investment Income | | | (0.15 | ) | | | (0.11 | ) | | | (0.15 | ) | | | (0.42 | ) | | | (0.48 | ) | |
Paid-in-Capital | | | — | | | | — | | | | (0.00 | )‡ | | | — | | | | — | | |
Total Distributions | | | (0.15 | ) | | | (0.11 | ) | | | (0.15 | ) | | | (0.42 | ) | | | (0.48 | ) | |
Redemption Fees | | | — | | | | — | | | | — | | | | 0.00 | ‡ | | | — | | |
Net Asset Value, End of Period | | $ | 7.80 | | | $ | 7.71 | | | $ | 7.79 | | | $ | 7.68 | | | $ | 8.00 | | |
Total Return++ | | | 3.22 | % | | | 0.45 | % | | | 3.48 | % | | | 1.52 | % | | | (17.77 | )% | |
Ratios and Supplemental Data: | |
Net Assets, End of Period (Thousands) | | $ | 145 | | | $ | 194 | | | $ | 52 | | | $ | 169 | | | $ | 294 | | |
Ratio of Expenses to Average Net Assets | | | 0.88 | %+ | | | 0.84 | %+†† | | | 0.80 | %+†† | | | 0.70 | %+ | | | 0.68 | %+ | |
Ratio of Net Investment Income to Average Net Assets | | | 1.70 | %+ | | | 1.87 | %+†† | | | 2.14 | %+†† | | | 2.87 | %+ | | | 4.95 | %+ | |
Ratio of Rebate from Morgan Stanley Affiliates to Average Net Assets | | | 0.00 | %§ | | | 0.00 | %§ | | | 0.00 | %§ | | | 0.00 | %§ | | | 0.01 | % | |
Portfolio Turnover Rate | | | 51 | % | | | 35 | % | | | 95 | % | | | 110 | % | | | 20 | % | |
† Per share amount is based on average shares outstanding.
‡ Amount is less than $0.005 per share.
++ Calculated based on the net asset value as of the last business day of the period.
+ The Ratios of Expenses and Net Investment Income reflect the rebate of certain Portfolio expenses in connection with the investments in Morgan Stanley affiliates during the period. The effect of the rebate on the ratios is disclosed in the above table as "Ratio of Rebate from Morgan Stanley Affiliates to Average Net Assets."
†† Reflects overall Portfolio ratios for investment income and non-class specific expenses.
§ Amount is less than 0.005%.
The accompanying notes are an integral part of the financial statements.
18
Morgan Stanley Institutional Fund Trust
Annual Report — September 30, 2012
Financial Highlights
Limited Duration Portfolio
| | | Class H | |
Selected Per Share Data and Ratios | | Period from
April 27, 2012^ to
September 30, 2012 | |
Net Asset Value, Beginning of Period | | $ | 7.76 | | |
Income from Investment Operations: | |
Net Investment Income† | | | 0.05 | | |
Net Realized and Unrealized Gain | | | 0.04 | | |
Total from Investment Operations | | | 0.09 | | |
Distribution from and/or in Excess of: | |
Net Investment Income | | | (0.05 | ) | |
Net Asset Value, End of Period | | $ | 7.80 | | |
Total Return++ | | | 1.14 | %# | |
Ratios and Supplemental Data: | |
Net Assets, End of Period (Thousands) | | $ | 10 | | |
Ratio of Expenses to Average Net Assets | | | 0.91 | %+* | |
Ratio of Net Investment Income to Average Net Assets | | | 1.42 | %+* | |
Rebate from Morgan Stanley Affiliates to Average Net Assets | | | 0.00 | %*§ | |
Portfolio Turnover Rate | | | 51 | %# | |
^ Commencement of Operations.
† Per share amount is based on average shares outstanding.
++ Calculated based on the net asset value which does not reflect sales charges, if applicable, as of the last business day of the period.
+ The Ratios of Expenses and Net Investment Income reflect the rebate of certain Portfolio expenses in connection with the investments in Morgan Stanley affiliates during the period. The effect of the rebate on the ratios is disclosed in the above table as "Ratio of Rebate from Morgan Stanley Affiliates to Average Net Assets."
# Not Annualized.
* Annualized.
§ Amount is less than 0.005%.
The accompanying notes are an integral part of the financial statements.
19
Morgan Stanley Institutional Fund Trust
Annual Report — September 30, 2012
Financial Highlights
Limited Duration Portfolio
| | | Class L | |
Selected Per Share Data and Ratios | | Period from
April 27, 2012^ to
September 30, 2012 | |
Net Asset Value, Beginning of Period | | $ | 7.76 | | |
Income from Investment Operations: | |
Net Investment Income† | | | 0.04 | | |
Net Realized and Unrealized Gain | | | 0.04 | | |
Total from Investment Operations | | | 0.08 | | |
Distribution from and/or in Excess of: | |
Net Investment Income | | | (0.04 | ) | |
Net Asset Value, End of Period | | $ | 7.80 | | |
Total Return++ | | | 1.06 | %# | |
Ratios and Supplemental Data: | |
Net Assets, End of Period (Thousands) | | $ | 10 | | |
Ratio of Expenses Average Net Assets | | | 1.21 | %+* | |
Ratio of Net Investment Income to Average Net Assets | | | 1.14 | %+* | |
Ratio of Rebate from Morgan Stanley Affiliates to Average Net Assets | | | 0.00 | %*§ | |
Portfolio Turnover Rate | | | 51 | %# | |
^ Commencement of Operations.
† Per share amount is based on average shares outstanding.
++ Calculated based on the net asset value which does not reflect sales charges, if applicable, as of the last business day of the period.
+ The Ratios of Expenses and Net Investment Income reflect the rebate of certain Portfolio expenses in connection with the investments in Morgan Stanley affiliates during the period. The effect of the rebate on the ratios is disclosed in the above table as "Ratio of Rebate from Morgan Stanley Affiliates to Average Net Assets."
# Not Annualized.
* Annualized.
§ Amount is less than 0.005%.
The accompanying notes are an integral part of the financial statements.
20
Morgan Stanley Institutional Fund Trust
Annual Report — September 30, 2012
Notes to Financial Statements
Morgan Stanley Institutional Fund Trust ("MSIFT'' or the "Fund'') is registered under the Investment Company Act of 1940, as amended (the "Act''), as an open-end management investment company. The Fund is comprised of seven separate, active portfolios (individually referred to as a "Portfolio", collectively as the "Portfolios"). All Portfolios are considered diversified for purposes of the Act.
The accompanying financial statements relate to the Limited Duration Portfolio. The Portfolio seeks above-average total return over a market cycle of three to five years. The Portfolio offers four classes of shares — Class I, Class P, Class H and Class L.
A. Significant Accounting Policies: The following significant accounting policies are in conformity with U.S. generally accepted accounting principles ("GAAP"). Such policies are consistently followed by the Fund in the preparation of its financial statements. GAAP may require management to make estimates and assumptions that affect the reported amounts and disclosures in the financial statements. Actual results may differ from those estimates.
1. Security Valuation: Bonds and other fixed income securities may be valued according to the broadest and most representative market. In addition, bonds and other fixed income securities may be valued on the basis of prices provided by a pricing service. The prices provided by a pricing service take into account broker-dealer market price quotations for institutional size trading in similar groups of securities, security quality, maturity, coupon and other security characteristics as well as any developments related to the specific securities. Short-term debt securities purchased with remaining maturities of 60 days or less are valued at amortized cost, unless the Board of Trustees (the "Trustees") determines such valuation does not reflect the securities' fair value, in which case these securities will be valued at their fair value as determined in good faith under procedures adopted by the Trustees. Equity securities listed on a U.S. exchange are valued at the latest quoted sales price on the valuation date. Equity securities listed or traded on NASDAQ, for which market quotations are available, are valued at the NASDAQ Official Closing Price. Securities listed on a foreign exchange are valued at their closing price, except as noted below. Unlisted and listed equity securities not traded on the valuation date, for which market quotations are readily available, are valued at the mean between the last reported bid and asked prices obtained from reputable brokers.
Under procedures approved by the Trustees, the Fund's adviser, Morgan Stanley Investment Management Inc. (the "Adviser"), has formed a Valuation Committee. The Valuation Committee provides administration and oversight of the Fund's valuation policies and procedures, which are reviewed at least annually by the Trustees. Among other things, these procedures allow the Fund to utilize independent pricing services, quotations from securities and financial instrument dealers, and other market sources to determine fair value.
The Fund has procedures to determine the fair value of securities and other financial instruments for which market prices are not readily available. Under these procedures, the Valuation Committee convenes on a regular and adhoc basis to review such securities and considers a number of factors, including valuation methodologies and significant unobservable valuation inputs, when arriving at fair value. The Valuation Committee may employ a market-based approach which may use related or comparable assets or liabilities, recent transactions, market multiples, book values, and other relevant information for the investment to determine the fair value of the investment. An income-based valuation approach may also be used in which the anticipated future cash flows of the investment are discounted to calculate fair value. Discounts may also be applied due to the nature or duration of any restrictions on the disposition of the investments. Due to the inherent uncertainty of valuations of such investments, the fair values may differ significantly from the values that would have been used had an active market existed. The Valuation Committee employs various methods for calibrating these valuation approaches including a regular review of valuation methodologies, key inputs and assumptions, transactional back-testing or disposition analysis, and reviews of any related market activity.
Most foreign markets close before the New York Stock Exchange ("NYSE"). Occasionally, developments that could affect the closing prices of securities and other assets may occur between the times at which valuations of such securities are determined (that is, close of the foreign market on which the securities trade) and the close of business on the NYSE. If these developments are expected to materially affect the value of the securities, the valuations may be adjusted to reflect the estimated fair value as of the close of the NYSE, as determined in good faith under procedures established by the Trustees.
21
Morgan Stanley Institutional Fund Trust
Annual Report — September 30, 2012
Notes to Financial Statements (cont'd)
2. Fair Value Measurement: Financial Accounting Standards Board ("FASB") Accounting Standards CodificationTM ("ASC") 820, "Fair Value Measurements and Disclosures" ("ASC 820"), defines fair value as the value that the Fund would receive to sell an investment or pay to transfer a liability in a timely transaction with an independent buyer in the principal market, or in the absence of a principal market the most advantageous market for the investment or liability. ASC 820 establishes a three-tier hierarchy to distinguish between (1) inputs that reflect the assumptions market participants would use in valuing an asset or liability developed based on market data obtained from sources independent of the reporting entity (observable inputs) and (2) inputs that reflect the reporting entity's own assumptions about the assumptions market participants would use in valuing an asset or liability developed based on the best information available in the circumstances (unobservable inputs) and to establish classification of fair value measurements for disclosure purposes. Various inputs are used in determining the value of the Fund's investments. The inputs are summarized in the three broad levels listed below.
• Level 1 – unadjusted quoted prices in active markets for identical investments
• Level 2 – other significant observable inputs (including quoted prices for similar investments, interest rates, prepayment speeds, credit risk, etc.)
• Level 3 – significant unobservable inputs including the Fund's own assumptions in determining the fair value of investments. Factors considered in making this determination may include, but are not limited to, information obtained by contacting the issuer, analysts, or the appropriate stock exchange (for exchange-traded securities), analysis of the issuer's financial statements or other available documents and, if necessary, available information concerning other securities in similar circumstances
The inputs or methodology used for valuing securities are not necessarily an indication of the risk associated with investing in those securities and the determination of the significance of a particular input to the fair value measurement in its entirety requires judgment and considers factors specific to each security.
The following is a summary of the inputs used to value the Portfolio's investments as of September 30, 2012.
Investment Type | | Level 1
Unadjusted
quoted
prices
(000) | | Level 2
Other
significant
observable
inputs
(000) | | Level 3
Significant
unobservable
inputs
(000) | | Total
(000) | |
Assets: | |
Fixed Income Securities | |
Agency Adjustable
Rate Mortgages | | $ | — | | | $ | 4,217 | | | $ | — | | | $ | 4,217 | | |
Agency Fixed Rate
Mortgages | | | — | | | | 1,179 | | | | — | | | | 1,179 | | |
Asset-Backed Securities | | | — | | | | 18,186 | | | | — | | | | 18,186 | | |
Collateralized Mortgage
Obligations —
Agency Collateral
Series | | | — | | | | 2,220 | | | | — | | | | 2,220 | | |
Corporate Bonds | | | — | | | | 94,213 | | | | — | | | | 94,213 | | |
Mortgage — Other | | �� | — | | | | 449 | | | | — | | | | 449 | | |
Non-U.S. Government —
Guaranteed | | | — | | | | 6,237 | | | | — | | | | 6,237 | | |
Sovereign | | | — | | | | 532 | | | | — | | | | 532 | | |
U.S. Treasury Securities | | | — | | | | 15,316 | | | | — | | | | 15,316 | | |
Total Fixed Income
Securities | | | — | | | | 142,549 | | | | — | | | | 142,549 | | |
Short-Term Investments | |
Investment Company | | | 5,319 | | | | — | | | | — | | | | 5,319 | | |
U.S. Treasury Security | | | — | | | | 105 | | | | — | | | | 105 | | |
Total Short-Term
Investments | | | 5,319 | | | | 105 | | | | — | | | | 5,424 | | |
Futures Contracts | | | 24 | | | | — | | | | — | | | | 24 | | |
Total Assets | | | 5,343 | | | | 142,654 | | | | — | | | | 147,997 | | |
Liabilities: | |
Futures Contracts | | | (17 | ) | | | — | | | | — | | | | (17 | ) | |
Interest Rate Swap
Agreements | | | — | | | | (62 | ) | | | — | | | | (62 | ) | |
Total Liabilities | | | (17 | ) | | | (62 | ) | | | — | | | | (79 | ) | |
Total | | $ | 5,326 | | | $ | 142,592 | | | $ | — | | | $ | 147,918 | | |
Transfers between investment levels may occur as the markets fluctuate and/or the availability of data used in an investment's valuation changes. The Portfolio recognizes transfers between the levels as of the end of the period. As of September 30, 2012, the Portfolio did not have any investments transfer between investment levels.
3. Derivatives: The Portfolio may, but is not required to, use derivative instruments for a variety of purposes, including hedging, risk management, portfolio management or to earn income. Derivatives are financial instruments whose value is based on the value of an underlying asset, interest rate, index or financial instrument. A derivative instrument often has risks similar to its underlying asset and may have additional risks, including imperfect correlation between the value of the derivative and the underlying asset, risks of default by the counterparty to certain
22
Morgan Stanley Institutional Fund Trust
Annual Report — September 30, 2012
Notes to Financial Statements (cont'd)
transactions, magnification of losses incurred due to changes in the market value of the securities, instruments, indices or interest rates to which they relate, and risks that the transactions may not be liquid. The use of derivatives involves risks that are different from, and possibly greater than, the risks associated with other portfolio investments. Derivatives may involve the use of highly specialized instruments that require investment techniques and risk analyses different from those associated with other portfolio investments. All of the Portfolio's holdings, including derivative instruments, are marked-to-market each day with the change in value reflected in unrealized appreciation (depreciation). Upon disposition, a realized gain or loss is recognized.
Certain derivative transactions may give rise to a form of leverage. Leverage magnifies the potential for gain and risk for loss. Leverage associated with derivative transactions may cause the Portfolio to liquidate portfolio positions when it may not be advantageous to do so to satisfy its obligations or to meet earmarking or segregation requirements, pursuant to applicable Securities and Exchange Commission rules and regulations, or may cause the Portfolio to be more volatile than if the Portfolio had not been leveraged. Although the Adviser seeks to use derivatives to further the Portfolio's investment objectives, there is no assurance that the use of derivatives will achieve this result.
Following is a description of the derivative instruments and techniques that the Portfolio used during the period and their associated risks:
Futures: A futures contract is a standardized agreement between two parties to buy or sell a specific quantity of an underlying instrument at a specific price at a specific future time. The value of a futures contract tends to increase and decrease in tandem with the value of the underlying instrument. Depending on the terms of the particular contract, futures contracts are settled through either physical delivery of the underlying instrument on the settlement date or by payment of a cash settlement amount on the settlement date. During the period the futures contract is open, payments are received from or made to the broker based upon changes in the value of the contract (the variation margin). A decision as to whether, when and how to use futures involves the exercise of skill and judgment and even a well conceived futures transaction may be unsuccessful because of market
behavior or unexpected events. In addition to the derivatives risks discussed above, the prices of futures can be highly volatile, using futures can lower total return, and the potential loss from futures can exceed the Portfolio's initial investment in such contracts.
Swaps: An over-the-counter ("OTC") swap agreement is an agreement between two parties pursuant to which the parties exchange payments at specified dates on the basis of a specified notional amount, with the payments calculated by reference to specified securities, indexes, reference rates, currencies or other instruments. A small percentage of swap agreements are cleared through a central clearing house. Most swap agreements provide that when the period payment dates for both parties are the same, the payments are made on a net basis (i.e., the two payment streams are netted out, with only the net amount paid by one party to the other). The Portfolio's obligations or rights under a swap agreement entered into on a net basis will generally be equal only to the net amount to be paid or received under the agreement, based on the relative values of the positions held by each counterparty. In a zero coupon interest rate swap, payment only occurs at maturity, at which time one counterparty pays the total compounded fixed rate over the life of the swap and the other pays the total compounded floating rate that would have been earned had a series of floating rate investments been rolled over through the life of the swap. Most swap agreements are not entered into or traded on exchanges and there is no central clearing or guaranty function for swaps. These OTC swaps are often subject to credit risk or the risk of default or non-performance by the counterparty. Swaps could result in losses if interest rate or foreign currency exchange rates or credit quality changes are not correctly anticipated by the Portfolio or if the reference index, security or investments do not perform as expected.
When the Portfolio has an unrealized loss on a swap agreement, the Portfolio has instructed the custodian to pledge cash or liquid securities as collateral with a value approximately equal to the amount of the unrealized loss. Collateral pledges are monitored and subsequently adjusted if and when the swap valuations fluctuate. Cash collateral is included with "Due from (to) Broker" in the Statement of Assets and Liabilities. Cash collateral has been offset against open swap agreements under the provisions of FASB ASC 210 "Balance Sheet" ("ASC 210"). Offsetting of Amounts Related to Certain Contracts, an
23
Morgan Stanley Institutional Fund Trust
Annual Report — September 30, 2012
Notes to Financial Statements (cont'd)
interpretation of ASC 210-20, are included within "Unrealized Appreciation (Depreciation) on Swap Agreements" in the Statement of Assets and Liabilities. For cash collateral received, the Portfolio pays a monthly fee to the counterparty based on the effective rate for Federal Funds. This fee, when paid, is included within realized gain (loss) on swap agreements in the Statement of Operations.
FASB ASC 815, "Derivatives and Hedging: Overall" ("ASC 815"), is intended to improve financial reporting about derivative instruments by requiring enhanced disclosures to enable investors to better understand how and why the Portfolio uses derivative instruments, how these derivative instruments are accounted for and their effects on the Portfolio's financial position and results of operations.
The following table sets forth the fair value of the Portfolio's derivative contracts by primary risk exposure as of September 30, 2012.
Primary Risk Exposure | | Statement of
Assets and
Liabilities | | Swap
Agreements
(000) | | Futures
Contracts
(000)(a) | |
Assets: | |
Interest Rate Risk | | Receivables | | $ | — | | | $ | 24 | | |
Total Receivables | | | | $ | — | | | $ | 24 | | |
Liabilities: | |
Interest Rate Risk | | Payables | | $ | (62 | ) | | $ | (17 | ) | |
Total Payables | | | | $ | (62 | ) | | $ | (17 | ) | |
(a) This amount represents the cumulative appreciation (depreciation) of futures contracts as reported in the Portfolio of Investments. The Statement of Assets and Liabilities only reflects the current day's net variation margin.
The following tables set forth by primary risk exposure the Portfolio's realized gains (losses) and change in unrealized appreciation (depreciation) by type of derivative contract for the year ended September 30, 2012 in accordance with ASC 815.
Realized Loss | |
Primary Risk Exposure | | Derivative Type | | Value
(000) | |
Interest Rate Risk | | Swap Agreements | | $ | (560 | ) | |
Interest Rate Risk | | Futures Contracts | | | (181 | ) | |
| | | Total | | $ | (741 | ) | |
Change in Unrealized Appreciation (Depreciation) | |
Primary Risk Exposure | | Derivative Type | | Value
(000) | |
Interest Rate Risk | | Swap Agreements | | $ | 466 | | |
Interest Rate Risk | | Futures Contracts | | | 24 | | |
| | | Total | | $ | 490 | | |
For the year ended September 30, 2012, the average monthly original value of futures contracts was approximately
$49,434,000 and the average monthly notional amount of swap agreements was approximately $9,770,000.
4. When-Issued/Delayed Delivery Securities: The Portfolio purchases and sells when-issued and delayed delivery securities. Securities purchased on a when-issued or delayed delivery basis are purchased for delivery beyond the normal settlement date at a stated price and yield, and no income accrues to the Portfolio on such securities prior to delivery date. Payment and delivery for when-issued and delayed delivery securities can take place up to 120 days after the date of the transaction. When the Portfolio enters into a purchase transaction on a when-issued or delayed delivery basis, securities are available for collateral in an amount at least equal in value to the Portfolio's commitments to purchase such securities. Purchasing securities on a when-issued or delayed delivery basis may involve a risk that the market price at the time of delivery may be lower than the agreed upon purchase price, in which case there could be an unrealized loss at the time of delivery. Purchasing investments on a when-issued or delayed delivery basis may be considered a form of leverage which may increase the impact that gains (losses) may have on the Portfolio.
5. Indemnifications: The Fund enters into contracts that contain a variety of indemnifications. The Fund's maximum exposure under these arrangements is unknown. However, the Fund has not had prior claims or losses pursuant to these contracts and expects the risk of loss to be remote.
6. Other: Security transactions are accounted for on the date the securities are purchased or sold. Realized gains (losses) on the sale of investment securities are determined on the specific identified cost basis. Dividend income and distributions are recorded on the ex-dividend date (except for certain foreign dividends which may be recorded as soon as the Fund is informed of such dividends) net of applicable withholding taxes. Interest income is recognized on the accrual basis except where collection is in doubt. Discounts and premiums on securities purchased are amortized according to the effective yield method over their respective lives. Most expenses of the Fund can be directly attributed to a particular Portfolio. Expenses which cannot be directly attributed are apportioned among the Portfolios based upon relative net assets or other appropriate measures. Income, expenses (other than class specific expenses)
24
Morgan Stanley Institutional Fund Trust
Annual Report — September 30, 2012
Notes to Financial Statements (cont'd)
and realized and unrealized gains or losses are allocated to each class of shares based upon their relative net assets.
B. Advisory Fees: The Adviser, a wholly-owned subsidiary of Morgan Stanley, provides the Portfolio with advisory services under the terms of an Investment Advisory Agreement, paid quarterly, at an annual rate of 0.30% of the average daily net assets of the Portfolio.
C. Administration Fees: The Adviser also serves as Administrator to the Fund and provides administrative services pursuant to an Administration Agreement for an annual fee, accrued daily and paid monthly, of 0.08% of the Portfolio's average daily net assets. Under a Sub-Administration Agreement between the Administrator and State Street Bank and Trust Company ("State Street"), State Street provides certain administrative services to the Fund. For such services, the Administrator pays State Street a portion of the fee the Administrator receives from the Fund.
D. Distribution and Shareholder Services Fees: Morgan Stanley Distribution, Inc. ("MSDI" or the "Distributor"), a wholly-owned subsidiary of the Adviser, and an indirect subsidiary of Morgan Stanley, serves as the Fund's Distributor of Portfolio shares pursuant to a Distribution agreement. The Fund has adopted Shareholder Services Plans with respect to Class P and Class H shares pursuant to Rule 12b-1 under the Act. Under the Shareholder Services Plans, the Portfolio pays the Distributor a shareholder services fee, accrued daily and paid monthly, at an annual rate of 0.25% of the Portfolio's average daily net assets attributable to Class P and Class H shares.
The Fund has adopted a Distribution and Shareholder Services Plan with respect to Class L shares pursuant to Rule 12b-1 under the Act. Under the Distribution and Shareholder Services Plan, the Portfolio pays the Distributor a distribution fee, accrued daily and paid monthly, at an annual rate of 0.25% and a shareholder service fee, accrued daily and paid monthly, at an annual rate of 0.25% of the Portfolio's average daily net assets attributable to Class L shares.
The distribution and shareholder services fees are used to support the expenses associated with servicing and maintaining accounts. The Distributor may compensate other parties for providing shareholder support services to investors who purchase Class P, Class H and Class L shares.
E. Dividend Disbursing and Transfer Agent: The Fund's dividend disbursing and transfer agent is Morgan Stanley Services Company Inc. ("Morgan Stanley Services"). Pursuant to a transfer agency agreement, the Fund pays Morgan
Stanley Services a fee based on the number of classes, accounts and transactions relating to the Portfolios of the Fund.
F. Custodian Fees: State Street (the "Custodian") serves as Custodian for the Fund in accordance with a custodian agreement. The Custodian holds cash, securities, and other assets of the Fund as required by the Act. Custody fees are payable monthly based on assets held in custody, investment purchases and sales activity and account maintenance fees, plus reimbursement for certain out-of-pocket expenses.
The Fund has entered into an arrangement with its Custodian whereby credits realized on uninvested cash balances were used to offset a portion of the Portfolio's expenses. If applicable, these custodian credits are shown as "Expense Offset" in the Statement of Operations.
G. Security Transactions and Transactions with Affiliates: For the year ended September 30, 2012, purchases and sales of investment securities for the Portfolio, other than long-term U.S. Government securities and short-term investments, were approximately $45,096,000 and $66,007,000, respectively. For the year ended September 30, 2012, purchases and sales of long-term U.S. Government securities were approximately $32,565,000 and $18,888,000, respectively.
The Portfolio invests in the Institutional Class of the Morgan Stanley Institutional Liquidity Funds — Money Market Portfolio (the "Liquidity Funds"), an open-end management investment company managed by the Adviser. Advisory fees paid by the Portfolio are reduced by an amount equal to its pro-rata share of the advisory and administration fees paid by the Portfolio due to its investment in the Liquidity Funds. For the year ended September 30, 2012, advisory fees paid were reduced by approximately $4,000 relating to the Portfolio's investment in the Liquidity Funds.
A summary of the Portfolio's transactions in shares of the Liquidity Funds during the year ended September 30, 2012 is as follows:
Value
September 30,
2011
(000) | | Purchases
at Cost
(000) | | Sales
(000) | | Dividend
Income
(000) | | Value
September 30,
2012
(000) | |
| $ | 5,846 | | | $ | 70,859 | | | $ | 71,386 | | | $ | 4 | | | $ | 5,319 | | |
For the year ended September 30, 2012, the Portfolio had transactions with Citigroup, Inc., and its affiliated broker-dealers which may be deemed affiliates of the Adviser, Administrator and Distributor under Section 17 of the Act.
25
Morgan Stanley Institutional Fund Trust
Annual Report — September 30, 2012
Notes to Financial Statements (cont'd)
Value
September 30,
2011
(000) | | Purchases
at Cost
(000) | | Sales
(000) | | Realized
Gain
(000) | | Interest
Income
(000) | | Value
September 30,
2012
(000) | |
| $ | 3,413 | | | $ | 1,189 | | | $ | 1,472 | | | $ | 46 | | | $ | 87 | | | $ | 3,196 | | |
The Portfolio has an unfunded Deferred Compensation Plan (the "Compensation Plan"), which allows each independent Trustee to defer payment of all, or a portion, of the fees he or she receives for serving on the Board of Trustees. Each eligible Trustee generally may elect to have the deferred amounts credited with a return equal to the total return on one or more of the Morgan Stanley funds that are offered as investment options under the Compensation Plan. Appreciation/depreciation and distributions received from these investments are recorded with an offsetting increase/decrease in the deferred compensation obligation and do not affect the net asset value of the Portfolio.
H. Federal Income Taxes: It is the Portfolio's intention to continue to qualify as a regulated investment company and distribute all of its taxable and tax-exempt income. Accordingly, no provision for Federal income taxes is required in the financial statements.
Dividend income and distributions to shareholders are recorded on the ex-dividend date. Interest income is recognized on an accrual basis. Dividends from net investment income, if any, are declared and paid monthly. Net realized capital gains, if any, are distributed at least annually.
The Portfolio may be subject to taxes imposed by countries in which it invests. Such taxes are generally based on income and/or capital gains earned or repatriated. Taxes are accrued based on net investment income, net realized gains and net unrealized appreciation as such income and/or gains are earned. Taxes may also be based on transactions in foreign currency and are accrued based on the value of investments denominated in such currency.
FASB ASC 740-10, Income Taxes — Overall, sets forth a minimum threshold for financial statement recognition of the benefit of a tax position taken or expected to be taken in a tax return. Management has concluded there are no significant uncertain tax positions that would require recognition in the financial statements. If applicable, the Portfolio recognizes interest accrued related to unrecognized tax benefits in "Interest Expense" and penalties in ''Other Expenses" in the Statement of Operations. The Portfolio files tax returns with the U.S. Internal Revenue Service, New York and various states. Each of the tax years in the four-year period ended September 30, 2012, remains subject to examination by taxing authorities.
The tax character of distributions paid may differ from the character of distributions shown in the Statements of Changes in Net Assets due to short-term capital gains being treated as ordinary income for tax purposes. The tax character of distributions paid during fiscal 2012 and 2011 was as follows:
2012 Distributions
Paid From:
Ordinary Income
(000) | | 2011 Distributions
Paid From:
Ordinary Income
(000) | |
| $ | 3,366 | | | $ | 3,270 | | |
The amount and character of income and gains to be distributed are determined in accordance with income tax regulations which may differ from GAAP. These book/tax differences are either considered temporary or permanent in nature.
Temporary differences are attributable to differing book and tax treatments for the timing of the recognition of gains (losses) on certain investment transactions and the timing of the deductibility of certain expenses.
Permanent differences, primarily due to basis adjustments for swap transactions and paydown adjustments, resulted in the following reclassifications among the components of net assets at September 30, 2012:
Accumulated
Undistributed
Net Investment
Income
(000) | | Accumulated
Net Realized
Loss
(000) | | Paid-in-
Capital
(000) | |
| $ | 59 | | | $ | (59 | ) | | | — | | |
At September 30, 2012, the components of distributable earnings for the Portfolio on a tax basis were as follows:
Undistributed
Ordinary
Income
(000) | | Undistributed
Long-Term
Capital Gain
(000) | |
| $ | 509 | | | | — | | |
At September 30, 2012, the aggregate cost for federal income tax purposes is approximately $144,456,000. The aggregate gross unrealized appreciation is approximately $3,581,000 and the aggregate gross unrealized depreciation is approximately $64,000 resulting in net unrealized appreciation of approximately $3,517,000.
On December 22, 2010, the Regulated Investment Company Modernization Act of 2010 (the "Modernization Act") was signed into law. The Modernization Act modernizes several tax provisions related to Regulated Investment Companies ("RICs") and their shareholders. One key change made by the Modernization Act is that capital losses will generally retain their character as short-term or long-term and may be carried forward indefinitely to offset future gains. These losses are utilized before other
26
Morgan Stanley Institutional Fund Trust
Annual Report — September 30, 2012
Notes to Financial Statements (cont'd)
capital loss carryforwards that expire. Generally, the Modernization Act is effective for taxable years beginning after December 22, 2010.
At September 30, 2012, the Portfolio had available for Federal income tax purposes unused short term and long term capital losses of approximately $134,000 and $957,000, respectively that do not have an expiration date.
In addition, at September 30, 2012, the Portfolio had available for Federal income tax purposes unused capital losses, which will expire on the indicated dates:
Amount
(000) | | Expiration | |
| $ | 8,019 | | | September 30, 2013 | |
| | 8,229 | | | September 30, 2014 | |
| | 7,068 | | | September 30, 2015 | |
| | 265 | | | September 30, 2016 | |
| | 200,864 | | | September 30, 2017 | |
| | 33,504 | | | September 30, 2018 | |
To the extent that capital loss carryforwards are used to offset any future capital gains realized during the carryover period as provided by U.S. Federal income tax regulations, no capital gains tax liability will be incurred by the Portfolio for gains realized and not distributed. To the extent that capital gains are offset, such gains will not be distributed to the shareholders.
I. Accounting Pronouncement: In December 2011, FASB issued Accounting Standards Update ("ASU") 2011-11, Balance Sheet: Disclosures about Offsetting Assets and Liabilities. The pronouncement improves disclosures for recognized financial and derivative instruments that are either offset on the balance sheet in accordance with the offsetting guidance in ASC 210-20-45 or ASC 815-10-45 or are subject to an enforceable master netting agreements or similar. The Fund will be required to disclose information about rights to offset and related arrangements (such as collateral agreements) in order to enable financial statement users to understand the effect of those rights and arrangements on its financial position as well as disclose the following (1) gross amounts; (2) amounts offset in the statement of financial position; (3) any other amounts that can be offset in the event of bankruptcy, insolvency or default of any of the parties (including cash and noncash financial collateral); and (4) the Fund's net exposure. The requirements are effective for annual reporting periods beginning on or after January 1, 2013, and must be applied retrospectively. At this time, the Fund's management is evaluating the implications of ASU 2011-11 and its impact, if any, on the financial statements.
27
Morgan Stanley Institutional Fund Trust
Annual Report — September 30, 2012
Report of Independent Registered Public Accounting Firm
To the Shareholders and Board of Trustees of
Morgan Stanley Institutional Fund Trust —
Limited Duration Portfolio
We have audited the accompanying statement of assets and liabilities, including the portfolio of investments, of Limited Duration Portfolio (one of the portfolios constituting Morgan Stanley Institutional Fund Trust) (the "Portfolio") as of September 30, 2012, and the related statement of operations for the year then ended, the statements of changes in net assets for each of the two years in the period then ended, and the financial highlights for each of the periods indicated therein. These financial statements and financial highlights are the responsibility of the Portfolio's management. Our responsibility is to express an opinion on these financial statements and financial highlights based on our audits.
We conducted our audits in accordance with the standards of the Public Company Accounting Oversight Board (United States). Those standards require that we plan and perform the audit to obtain reasonable assurance about whether the financial statements and financial highlights are free of material misstatement. We were not engaged to perform an audit of the Portfolio's internal control over financial reporting. Our audits included consideration of internal control over financial reporting as a basis for designing audit procedures that are appropriate in the circumstances, but not for the purpose of expressing an opinion on the effectiveness of the Portfolio's internal control over financial reporting. Accordingly, we express no such opinion. An audit also includes examining, on a test basis, evidence supporting the amounts and disclosures in the financial statements and financial highlights, assessing the accounting principles used and significant estimates made by management, and evaluating the overall financial statement presentation. Our procedures included confirmation of securities owned as of September 30, 2012, by correspondence with the custodian and others, or by other appropriate auditing procedures where replies from others were not received. We believe that our audits provide a reasonable basis for our opinion.
In our opinion, the financial statements and financial highlights referred to above present fairly, in all material respects, the financial position of Limited Duration Portfolio of Morgan Stanley Institutional Fund Trust at September 30, 2012, the results of its operations for the year then ended, the changes in its net assets for each of the two years in the period then ended, and the financial highlights for each of the periods indicated therein, in conformity with U.S. generally accepted accounting principles.

Boston, Massachusetts
November 27, 2012
28
Morgan Stanley Institutional Fund Trust
Annual Report — September 30, 2012
U.S. Privacy Policy (unaudited)
AN IMPORTANT NOTICE CONCERNING OUR U.S. PRIVACY POLICY
This privacy notice describes the U.S. privacy policy of Morgan Stanley Distribution, Inc., and the Morgan Stanley family of mutual funds ("us", "our", "we").
We are required by federal law to provide you with notice of our U.S. privacy policy ("Policy"). This Policy applies to both our current and former clients unless we state otherwise and is intended for individual clients who purchase products or receive services from us for personal, family or household purposes. This Policy is not applicable to partnerships, corporations, trusts or other non-individual clients or account holders, nor is this Policy applicable to individuals who are either beneficiaries of a trust for which we serve as trustee or participants in an employee benefit plan administered or advised by us. This Policy is, however, applicable to individuals who select us to be a custodian of securities or assets in individual retirement accounts, 401(k) accounts, or accounts subject to the Uniform Gifts to Minors Act.
This notice sets out our business practices to protect your privacy; how we collect and share personal information about you; and how you can limit our sharing or certain uses by others of this information. We may amend this Policy at any time, and will inform you of any changes to our Policy as required by law.
WE RESPECT YOUR PRIVACY
We appreciate that you have provided us with your personal financial information and understand your concerns about your information. We strive to safeguard the information our clients entrust to us. Protecting the confidentiality and security of client information is an important part of how we conduct our business.
This notice describes what personal information we collect about you, how we collect it, when we may share it with others, and how certain others may use it. It discusses the steps you may take to limit our sharing of certain information about you with our affiliated companies, including, but not limited to our affiliated banking businesses, brokerage firms and credit service affiliates. It also discloses how you may limit our affiliates' use of shared information for marketing purposes.
Throughout this Policy, we refer to the nonpublic information that personally identifies you as "personal information." We also use the term "affiliated company" in this notice. An affiliated company is a company in our family of companies and includes companies with the Morgan Stanley name. These affiliated companies are financial institutions such as broker-dealers, banks, investment advisers and credit card issuers. We refer to any company that is not an affiliated company as a nonaffiliated third party. For purposes of Section 5 of this notice, and your ability to limit certain uses of personal information by our affiliates, this notice applies to the use of personal information by our affiliated companies.
1. WHAT PERSONAL INFORMATION DO WE COLLECT FROM YOU?
We may collect the following types of information about you: (i) information provided by you, including information from applications and other forms we receive from you, (ii) information about your transactions with us or our affiliates, (iii) information about your transactions with nonaffiliated third parties, (iv) information from consumer reporting agencies, (v) information obtained from our websites, and (vi) information obtained from other sources. For example:
• We collect information such as your name, address, e-mail address, telephone/fax numbers, assets, income and investment objectives through applications and other forms you submit to us.
• We may obtain information about account balances, your use of account(s) and the types of products and services you prefer to receive from us through your dealings and transactions with us and other sources.
• We may obtain information about your creditworthiness and credit history from consumer reporting agencies.
• We may collect background information from and through third-party vendors to verify representations you have made and to comply with various regulatory requirements.
2. WHEN DO WE DISCLOSE PERSONAL INFORMATION WE COLLECT ABOUT YOU?
We may disclose personal information we collect about you in each of the categories listed above to affiliated and nonaffiliated third parties.
29
Morgan Stanley Institutional Fund Trust
Annual Report — September 30, 2012
U.S. Privacy Policy (unaudited) (cont'd)
a. Information we disclose to affiliated companies.
We may disclose personal information that we collect about you to our affiliated companies to manage your account(s) effectively, to service and process your transactions, and to let you know about products and services offered by us and affiliated companies, to manage our business, and as otherwise required or permitted by law. Offers for products and services from affiliated companies are developed under conditions designed to safeguard your personal information.
b. Information we disclose to third parties.
We may disclose personal information that we collect about you to nonaffiliated third parties to provide marketing services on our behalf or to other financial institutions with whom we have joint marketing agreements. We may also disclose all of the information we collect to other nonaffiliated third parties for our everyday business purposes, such as to process transactions, maintain account(s), respond to court orders and legal investigations, report to credit bureaus, offer our own products and services, protect against fraud, for institutional risk control, to perform services on our behalf, and as otherwise required or permitted by law.
When we share personal information about you with a nonaffiliated third party, they are required to limit their use of personal information about you to the particular purpose for which it was shared and they are not allowed to share personal information about you with others except to fulfill that limited purpose or as may be permitted or required by law.
3. HOW DO WE PROTECT THE SECURITY AND CONFIDENTIALITY OF PERSONAL INFORMATION WE COLLECT ABOUT YOU?
We maintain physical, electronic and procedural security measures that comply with applicable law and regulations to help safeguard the personal information we collect about you. We have internal policies governing the proper handling of client information by employees. Third parties that provide support or marketing services on our behalf may also receive personal information about you, and we require them to adhere to appropriate security standards with respect to such information.
4. HOW CAN YOU LIMIT OUR SHARING CERTAIN PERSONAL INFORMATION ABOUT YOU WITH OUR AFFILIATED COMPANIES FOR ELIGIBILITY DETERMINATION?
By following the opt-out procedures in Section 6 below, you may limit the extent to which we share with our affiliated companies, personal information that was collected to determine your eligibility for products and services such as your credit reports and other information that you have provided to us or that we may obtain from third parties ("eligibility information"). Eligibility information does not include your identification information or personal information pertaining to our transactions or experiences with you. Please note that, even if you direct us not to share eligibility information with our affiliated companies, we may still share your personal information, including eligibility information, with our affiliated companies under circumstances that are permitted under applicable law, such as to process transactions or to service your account.
5. HOW CAN YOU LIMIT THE USE OF CERTAIN PERSONAL INFORMATION ABOUT YOU BY OUR AFFILIATED COMPANIES FOR MARKETING?
By following the opt-out instructions in Section 6 below, you may limit our affiliated companies from marketing their products or services to you based on personal information we disclose to them. This information may include, for example, your income and account history with us. Please note that, even if you choose to limit our affiliated companies from using personal information about you that we may share with them for marketing their products and services to you, our affiliated companies may use your personal information that they obtain from us to market to you in circumstances permitted by law, such as if the affiliated party has its own relationship with you.
30
Morgan Stanley Institutional Fund Trust
Annual Report — September 30, 2012
U.S. Privacy Policy (unaudited) (cont'd)
6. HOW CAN YOU SEND US AN OPT-OUT INSTRUCTION?
If you wish to limit our sharing of eligibility information about you with our affiliated companies, or our affiliated companies' use of personal information for marketing purposes, as described in this notice, you may do so by:
• Calling us at (800) 548-7786
Monday–Friday between 8a.m. and 5p.m. (EST)
• Writing to us at the following address:
Morgan Stanley Services Company Inc.
c/o Privacy Coordinator
201 Plaza Two, 3rd Floor
Jersey City, New Jersey 07311
If you choose to write to us, your request should include: your name, address, telephone number and account number(s) to which the opt-out applies and whether you are opting out with respect to sharing of eligibility information (Section 4 above), or information used for marketing (Section 5 above), or both. Written opt-out requests should not be sent with any other correspondence. In order to process your request, we require that the request be provided by you directly and not through a third party. Once you have informed us about your privacy preferences, your opt-out preference will remain in effect with respect to this Policy (as it may be amended) until you notify us otherwise. If you are a joint account owner, we will accept instructions from any one of you and apply those instructions to the entire account.
Please understand that if you limit our sharing or our affiliated companies' use of personal information, you and any joint account holder(s) may not receive information about our affiliated companies' products and services, including products or services that could help you manage your financial resources and achieve your investment objectives.
If you have more than one account or relationship with us, please specify the accounts to which you would like us to apply your privacy choices. If you have accounts or relationships with our affiliates, you may receive multiple privacy policies from them, and will need to separately notify those companies of your privacy choices for those accounts or relationships.
7. WHAT IF AN AFFILIATED COMPANY BECOMES A NONAFFILIATED THIRD PARTY?
If, at any time in the future, an affiliated company becomes a nonaffiliated third party, further disclosures of personal information made to the former affiliated company will be limited to those described in Section 2(b) above relating to nonaffiliated third parties. If you elected under Section 6 to limit disclosures we make to affiliated companies, or use of personal information by affiliated companies, your election will not apply to use by any former affiliated company of your personal information in their possession once it becomes a nonaffiliated third party.
SPECIAL NOTICE TO RESIDENTS OF VERMONT
The following section supplements our Policy with respect to our individual clients who have a Vermont address and supersedes anything to the contrary in the above Policy with respect to those clients only.
The State of Vermont requires financial institutions to obtain your consent prior to sharing personal information that they collect about you with nonaffiliated third parties, or eligibility information with affiliated companies, other than in certain limited circumstances. Except as permitted by law, we will not share personal information we collect about you with nonaffiliated third parties or eligibility information with affiliated companies, unless you provide us with your written consent to share such information.
SPECIAL NOTICE TO RESIDENTS OF CALIFORNIA
The following section supplements our Policy with respect to our individual clients who have a California address and supersedes anything to the contrary in the above Policy with respect to those clients only.
In response to a California law, if your account has a California home address, your personal information will not be disclosed to nonaffiliated third parties except as permitted by applicable California law, and we will limit sharing such personal information with our affiliates to comply with California privacy laws that apply to us.
31
Morgan Stanley Institutional Fund Trust
Annual Report — September 30, 2012
Trustee and Officer Information (unaudited)
Independent Trustees:
Name, Age and Address of
Independent Trustee | | Position(s)
Held with
Registrant | | Length of Time
Served* | | Principal Occupation(s) During Past 5 Years | | Number of
Portfolios in
Fund Complex
Overseen by
Independent
Trustee** | | Other Directorships
Held by Independent
Trustee*** | |
Frank L. Bowman (67)
c/o Kramer Levin Naftalis &
Frankel LLP
Counsel to the Independent
Trustees
1177 Avenue of the Americas
New York, NY 10036 | | Trustee | | Since
August
2006 | | President, Strategic Decisions, LLC (consulting) (since February 2009); Director or Trustee of various Morgan Stanley Funds (since August 2006); Chairperson of the Insurance Sub-Committee of the Compliance and Insurance Committee (since February 2007); served as President and Chief Executive Officer of the Nuclear Energy Institute (policy organization) (February 2005-November 2008); retired as Admiral, U.S. Navy after serving over 38 years on active duty including 8 years as Director of the Naval Nuclear Propulsion Program in the Department of the Navy and the U.S. Department of Energy (1996-2004); served as Chief of Naval Personnel (July 1994-September 1996); and on the Joint Staff as Director of Political Military Affairs (June 1992-July 1994); Knighted as Honorary Knight Commander of the Most Excellent Order of the British Empire; Awarded the Officer de l'Orde National du Mérite by the French Government; elected to the National Academy of Engineering (2009). | | | 102 | | | Director of BP p.l.c.; Director of Naval and Nuclear Technologies LLP; Director of the Armed Services YMCA of the USA and the Naval Submarine League; Director of the American Shipbuilding Suppliers Association; Member of the National Security Advisory Council of the Center for U.S. Global Engagement and a member of the CNA Military Advisory Board; Member of the American Lung Association's President's Council. | |
Michael Bozic (71)
c/o Kramer Levin Naftalis &
Frankel LLP
Counsel to the Independent
Trustees
1177 Avenue of the Americas
New York, NY 10036 | | Trustee | | Since
April
1994 | | Private investor; Chairperson of the Compliance and Insurance Committee (since October 2006); Director or Trustee of various Morgan Stanley Funds (since April 1994); formerly, Chairperson of the Insurance Committee (July 2006-September 2006); Vice Chairman of Kmart Corporation (December 1998-October 2000), Chairman and Chief Executive Officer of Levitz Furniture Corporation (November 1995-November 1998) and President and Chief Executive Officer of Hills Department Stores (May 1991-July 1995); variously Chairman, Chief Executive Officer, President and Chief Operating Officer (1987-1991) of the Sears Merchandise Group of Sears, Roebuck & Co. | | | 104 | | | Director of various business organizations. | |
Kathleen A. Dennis (59)
c/o Kramer Levin Naftalis &
Frankel LLP
Counsel to the Independent
Trustees
1177 Avenue of the Americas
New York, NY 10036 | | Trustee | | Since
August
2006 | | President, Cedarwood Associates (mutual fund and investment management consulting) (since July 2006); Chairperson of the Money Market and Alternatives Sub-Committee of the Investment Committee (since October 2006) and Director or Trustee of various Morgan Stanley Funds (since August 2006); formerly, Senior Managing Director of Victory Capital Management (1993-2006). | | | 102 | | | Director of various non-profit organizations. | |
Dr. Manuel H. Johnson (63)
c/o Johnson Smick
Group, Inc.
888 16th Street, N.W.
Suite 740
Washington, D.C. 20006 | | Trustee | | Since
July
1991 | | Senior Partner, Johnson Smick International, Inc. (consulting firm); Chairperson of the Investment Committee (since October 2006) and Director or Trustee of various Morgan Stanley Funds (since July 1991); Co-Chairman and a founder of the Group of Seven Council (G7C) (international economic commission); formerly, Chairperson of the Audit Committee (July 1991-September 2006), Vice Chairman of the Board of Governors of the Federal Reserve System and Assistant Secretary of the U.S. Treasury. | | | 104 | | | Director of NVR, Inc. (home construction). | |
Joseph J. Kearns (70)
c/o Kearns & Associates LLC
PMB754
22631 Pacific Coast Highway
Malibu, CA 90265 | | Trustee | | Since
August
1994 | | President, Kearns & Associates LLC (investment consulting); Chairperson of the Audit Committee (since October 2006) and Director or Trustee of various Morgan Stanley Funds (since August 1994); formerly, Deputy Chairperson of the Audit Committee (July 2003-September 2006) and Chairperson of the Audit Committee of various Morgan Stanley Funds (since August 1994); CFO of the J. Paul Getty Trust. | | | 105 | | | Director of Electro Rent Corporation (equipment leasing) and The Ford Family Foundation. | |
32
Morgan Stanley Institutional Fund Trust
Annual Report — September 30, 2012
Trustee and Officer Information (unaudited) (cont'd)
Independent Trustees: (cont'd)
Name, Age and Address of
Independent Trustee | | Position(s)
Held with
Registrant | | Length of Time
Served* | | Principal Occupation(s) During Past 5 Years | | Number of
Portfolios in
Fund Complex
Overseen by
Independent
Trustee** | | Other Directorships
Held by Independent
Trustee*** | |
Michael F. Klein (53)
c/o Kramer Levin Naftalis & Frankel LLP
Counsel to the
Independent Trustees
1177 Avenue of the Americas
New York, NY 10036 | | Trustee | | Since
August
2006 | | Managing Director, Aetos Capital, LLC (since March 2000) and Co-President, Aetos Alternatives Management, LLC (since January 2004); Chairperson of the Fixed Income Sub-Committee of the Investment Committee (since October 2006) and Director or Trustee of various Morgan Stanley Funds (since August 2006); formerly, Managing Director, Morgan Stanley & Co. Inc. and Morgan Stanley Dean Witter Investment Management, President, various Morgan Stanley Funds (June 1998-March 2000) and Principal, Morgan Stanley & Co. Inc. and Morgan Stanley Dean Witter Investment Management (August 1997-December 1999). | | | 102 | | | Director of certain investment funds managed or sponsored by Aetos Capital, LLC. Director of Sanitized AG and Sanitized Marketing AG (specialty chemicals). | |
Michael E. Nugent (76)
c/o Triumph Capital, L.P.
445 Park Avenue
New York, NY 10022 | | Chairperson
of the
Board and
Trustee | | Chairperson of
the Boards since
July 2006 and
Trustee since
July 1991 | | General Partner, Triumph Capital, L.P. (private investment partnership); Chairperson of the Boards of various Morgan Stanley Funds (since July 2006); Chairperson of the Closed-End Fund Committee (since June 2012) and Director or Trustee of various Morgan Stanley Funds (since July 1991); formerly, Chairperson of the Insurance Committee (until July 2006). | | | 104 | | | None. | |
W. Allen Reed (65)
c/o Kramer Levin Naftalis &
Frankel LLP
Counsel to the
Independent Trustees
1177 Avenue of the Americas
New York, NY 10036 | | Trustee | | Since
August
2006 | | Chairperson of the Equity Sub-Committee of the Investment Committee (since October 2006) and Director or Trustee of various Morgan Stanley Funds (since August 2006); formerly, President and CEO of General Motors Asset Management; Chairman and Chief Executive Officer of the GM Trust Bank and Corporate Vice President of General Motors Corporation (August 1994-December 2005). | | | 102 | | | Director of Temple-Inland Industries (packaging and forest products); Director of Legg Mason, Inc. and Director of the Auburn University Foundation. | |
Fergus Reid (80)
c/o Joe Pietryka, Inc.
85 Charles Colman Blvd.
Pawling, NY 12564 | | Trustee | | Since
June
1992 | | Chairman, Joe Pietryka, Inc.; Chairperson of the Governance Committee and Director or Trustee of various Morgan Stanley Funds (since June 1992). | | | 105 | | | Trustee and Director of certain investment companies in the JPMorgan Funds complex managed by JP Morgan Investment Management Inc. | |
33
Morgan Stanley Institutional Fund Trust
Annual Report — September 30, 2012
Trustee and Officer Information (unaudited) (cont'd)
Interested Trustee:
Name, Age and Address of
Interested Trustee | | Position(s) Held
with Registrant | | Length of Time
Served* | | Principal Occupation(s) During Past 5 Years | | Number of
Portfolios in
Fund Complex
Overseen by
Interested
Trustee** | | Other Directorships
Held by Interested
Trustee*** | |
James F. Higgins (64)
c/o Morgan Stanley Services Company Inc.
Harborside Financial Center
201 Plaza Two
Jersey City, NJ 07311 | | Trustee | | Since
June
2000 | | Director or Trustee of various Morgan Stanley Funds (since June 2000); Senior Advisor of Morgan Stanley (since August 2000). | | | 103 | | | Director of AXA Financial, Inc. and The Equitable Life Assurance Society of the United States (financial services). | |
* Each Trustee serves an indefinite term, until his or her successor is elected.
** The Fund Complex includes (as of December 31, 2011) all open-end and closed-end funds (including all of their portfolios) advised by Morgan Stanley Investment Management Inc. (the "Adviser") and any funds that have an adviser that is an affiliated person of the Adviser (including, but not limited to, Morgan Stanley AIP GP LP).
*** This includes any directorships at public companies and registered investment companies held by the Trustee at any time during the past five years.
34
Morgan Stanley Institutional Fund Trust
Annual Report — September 30, 2012
Trustee and Officer Information (unaudited) (cont'd)
Executive Officers:
Name, Age and Address of Executive Officer | | Position(s) Held
with
Registrant | | Length of Time
Served* | | Principal Occupation(s) During Past 5 Years | |
Arthur Lev (51)
522 Fifth Avenue
New York, NY 10036 | | President and Principal Executive Officer – Equity and Fixed Income Funds | | Since
June 2011 | | President and Principal Executive Officer (since June 2011) of the Equity and Fixed Income Funds in the Fund Complex; Head of the Long Only Business of Morgan Stanley Investment Management (since February 2011); Managing Director of the Adviser and various entities affiliated with the Adviser (since December 2006). Formerly, Chief Strategy Officer of Morgan Stanley Investment Management's Traditional Asset Management business (November 2010-February 2011); General Counsel of Morgan Stanley Investment Management (December 2006-October 2010); Partner and General Counsel of FrontPoint Partners LLC (July 2002-December 2006); Managing Director and General Counsel of Morgan Stanley Investment Management (May 2000-June 2002). | |
Mary Ann Picciotto (39)
c/o Morgan Stanley Services Company Inc.
Harborside Financial Center
201 Plaza Two
Jersey City, NJ 07311 | | Chief Compliance Officer | | Since
May 2010 | | Managing Director of the Adviser and various entities affiliated with the Adviser; Chief Compliance Officer of various Morgan Stanley Funds (since May 2010); Chief Compliance Officer of the Adviser (since April 2007). | |
Stefanie V. Chang Yu (45)
522 Fifth Avenue
New York, NY 10036 | | Vice President | | Since December 1997 | | Managing Director of the Adviser and various entities affiliated with the Adviser; Vice President of various Morgan Stanley Funds (since December 1997). | |
Francis J. Smith (47)
c/o Morgan Stanley Services Company Inc.
Harborside Financial Center
201 Plaza Two
Jersey City, NJ 07311 | | Treasurer and Principal Financial
Officer | | Treasurer since July 2003 and Principal Financial Officer since September 2002 | | Executive Director of the Adviser and various entities affiliated with the Adviser; Treasurer and Principal Financial Officer of various Morgan Stanley Funds (since July 2003). | |
Mary E. Mullin (45)
522 Fifth Avenue
New York, NY 10036 | | Secretary | | Since
June
1999 | | Executive Director of the Adviser and various entities affiliated with the Adviser; Secretary of various Morgan Stanley Funds (since June 1999). | |
* Each officer serves an indefinite term, until his or her successor is elected.
35
Morgan Stanley Institutional Fund Trust
Annual Report — September 30, 2012
Adviser and Administrator
Morgan Stanley Investment Management Inc.
522 Fifth Avenue
New York, New York 10036
Distributor
Morgan Stanley Distribution, Inc.
522 Fifth Avenue
New York, New York 10036
Dividend Disbursing and Transfer Agent
Morgan Stanley Services Company Inc.
P.O. Box 219804
Kansas City, Missouri 64121
Custodian
State Street Bank and Trust Company
One Lincoln Street
Boston, Massachusetts 02111
Legal Counsel
Dechert LLP
1095 Avenue of the Americas
New York, New York 10036
Independent Registered Public Accounting Firm
Ernst & Young LLP
200 Clarendon Street
Boston, Massachusetts 02116
Reporting to Shareholders
Each Morgan Stanley fund provides a complete schedule of portfolio holdings in its semi-annual and annual reports within 60 days of the end of the fund's second and fourth fiscal quarters by filing the schedule electronically with the Securities and Exchange Commission (SEC). The semi-annual reports are filed on Form N-CSRS and the annual reports are filed on Form N-CSR. Morgan Stanley also delivers the semi-annual and annual reports to fund shareholders and makes these reports available on its public website, www.morganstanley.com/im. Each Morgan Stanley fund also files a complete schedule of portfolio holdings with the SEC for the fund's first and third fiscal quarters on Form N-Q. Morgan Stanley does not deliver the reports for the first and third fiscal quarters to shareholders, nor are the reports posted to the Morgan Stanley public website. You may, however, obtain the Form N-Q filings (as well as the Form N-CSR and N-CSRS filings) by accessing the SEC's website, www.sec.gov. You may also review and copy them at the SEC's Public Reference Room in Washington, DC. Information on the operation of the SEC's Public Reference Room may be obtained by calling the SEC toll free at 1-800-SEC-0330. You can also request copies of these materials, upon payment of a duplicating fee, by electronic request at the SEC's email address (publicinfo@sec.gov) or by writing the Public Reference Room of the SEC, Washington, DC 20549-0102.
Proxy Voting Policies and Procedures and Proxy Voting Record
You may obtain a copy of the Fund's Proxy Voting Policy and Procedures and information regarding how the Fund voted proxies relating to portfolio securities during the most recent twelve-month period ended June 30, without charge, upon request, by calling toll free 1-800-548-7786 or by visiting our website at www.morganstanley.com/im. This information is also available on the SEC's website at www.sec.gov.
This report is authorized for distribution only when preceded or accompanied by a prospectus of the Fund which describes in detail each Investment Portfolio's investment policies, risks, fees and expenses. Please read the prospectus carefully before you invest or send money. For additional information, including information regarding the investments comprising the Portfolio, please visit our website at www.morganstanley.com/im or call toll free 1-(800) 548-7786.
36
(This Page has been left blank intentionally.)
Printed in U.S.A.
This Report has been prepared for shareholders and may be distributed to others only if preceded or accompanied by a current prospectus.
Morgan Stanley Investment Management Inc.
522 Fifth Avenue
New York, New York 10036
© 2012 Morgan Stanley. Morgan Stanley Distribution, Inc.

IFTLDANN
IU12-02343P-Y09/12
Item 2. Code of Ethics.
(a) The Fund has adopted a code of ethics (the “Code of Ethics”) that applies to its principal executive officer, principal financial officer, principal accounting officer or controller, or persons performing similar functions, regardless of whether these individuals are employed by the Fund or a third party.
(b) No information need be disclosed pursuant to this paragraph.
(c) Not applicable.
(d) Not applicable.
(e) Not applicable.
(f)
(1) The Fund’s Code of Ethics is attached hereto as Exhibit 12 A.
(2) Not applicable.
(3) Not applicable.
Item 3. Audit Committee Financial Expert.
The Fund’s Board of Trustees has determined that Joseph J. Kearns, an “independent” Trustee, is an “audit committee financial expert” serving on its audit committee. Under applicable securities laws, a person who is determined to be an audit committee financial expert will not be deemed an “expert” for any purpose, including without limitation for the purposes of Section 11 of the Securities Act of 1933, as a result of being designated or identified as an audit committee financial expert. The designation or identification of a person as an audit committee financial expert does not impose on such person any duties, obligations, or liabilities that are greater than the duties, obligations, and liabilities imposed on such person as a member of the audit committee and Board of Trustees in the absence of such designation or identification
Item 4. Principal Accountant Fees and Services.
(a)(b)(c)(d) and (g). Based on fees billed for the periods shown:
2012
| | Registrant | | Covered Entities(1) | |
Audit Fees | | $ | 249,100 | | N/A | |
| | | | | |
Non-Audit Fees | | | | | |
Audit-Related Fees | | $ | — | (2) | $ | — | (2) |
Tax Fees | | $ | 23,590 | (3) | $ | 201,000 | (4) |
All Other Fees | | $ | | | $ | 854,099 | |
Total Non-Audit Fees | | $ | 23,590 | | $ | 1,055,099 | |
| | | | | |
Total | | $ | 272,690 | | $ | 1,055,099 | |
2011
| | Registrant | | Covered Entities(1) | |
Audit Fees | | $ | 247,800 | | N/A | |
| | | | | |
Non-Audit Fees | | | | | |
Audit-Related Fees | | $ | — | (2) | $ | — | (2) |
Tax Fees | | $ | 23,590 | (3) | $ | 89,626 | (4) |
All Other Fees | | $ | | | $ | 390,354 | (5) |
Total Non-Audit Fees | | $ | 23,590 | | $ | 479,980 | |
| | | | | |
Total | | $ | 271,390 | | $ | 479,980 | |
N/A- Not applicable, as not required by Item 4.
(1) Covered Entities include the Adviser (excluding sub-advisors) and any entity controlling, controlled by or under common control with the Adviser that provides ongoing services to the Registrant.
(2) Audit-Related Fees represent assurance and related services provided that are reasonably related to the performance of the audit of the financial statements of the Covered Entities’ and funds advised by the Adviser or its affiliates, specifically data verification and agreed-upon procedures related to asset securitizations and agreed-upon procedures engagements.
(3) Tax Fees represent tax compliance, tax planning and tax advice services provided in connection with the preparation and review of the Registrant’s tax returns.
(4) Tax Fees represent tax compliance, tax planning and tax advice services provided in connection with the review of Covered Entities’ tax returns.
(5) All other fees represent project management for future business applications and improving business and operational processes.
(e)(1) The audit committee’s pre-approval policies and procedures are as follows:
APPENDIX A
AUDIT COMMITTEE
AUDIT AND NON-AUDIT SERVICES
PRE-APPROVAL POLICY AND PROCEDURES
OF THE
MORGAN STANLEY RETAIL AND INSTITUTIONAL FUNDS
AS ADOPTED AND AMENDED JULY 23, 2004,(1)
1. Statement of Principles
The Audit Committee of the Board is required to review and, in its sole discretion, pre-approve all Covered Services to be provided by the Independent Auditors to the Fund and Covered Entities in order to assure that services performed by the Independent Auditors do not impair the auditor’s independence from the Fund.
The SEC has issued rules specifying the types of services that an independent auditor may not provide to its audit client, as well as the audit committee’s administration of the engagement of the independent auditor. The SEC’s rules establish two different approaches to pre-approving services, which the SEC considers to be equally valid. Proposed services either: may be pre-approved without consideration of specific case-by-case services by the Audit Committee (“general pre-approval”); or require the specific pre-approval of the Audit Committee or its delegate (“specific pre-approval”). The Audit Committee believes that the combination of these two approaches in this Policy will result in an effective and efficient procedure to pre-approve services performed by the Independent Auditors. As set forth in this Policy, unless a type of service has received general pre-approval, it will require specific pre-approval by the Audit Committee (or by any member of the Audit Committee to which pre-approval authority has been delegated) if it is to be provided by the Independent Auditors. Any proposed services exceeding pre-approved cost levels or budgeted amounts will also require specific pre-approval by the Audit Committee.
The appendices to this Policy describe the Audit, Audit-related, Tax and All Other services that have the general pre-approval of the Audit Committee. The term of any general pre-approval is 12 months from the date of pre-approval, unless the Audit Committee considers and provides a different period and states otherwise. The Audit Committee will annually review and pre-approve the services that may be provided by the Independent Auditors without obtaining specific pre-approval from the Audit Committee. The Audit Committee will add to or subtract from the list of general pre-approved services from time to time, based on subsequent determinations.
(1) This Audit Committee Audit and Non-Audit Services Pre-Approval Policy and Procedures (the “Policy”), adopted as of the date above, supersedes and replaces all prior versions that may have been adopted from time to time.
The purpose of this Policy is to set forth the policy and procedures by which the Audit Committee intends to fulfill its responsibilities. It does not delegate the Audit Committee’s responsibilities to pre-approve services performed by the Independent Auditors to management.
The Fund’s Independent Auditors have reviewed this Policy and believes that implementation of the Policy will not adversely affect the Independent Auditors’ independence.
2. Delegation
As provided in the Act and the SEC’s rules, the Audit Committee may delegate either type of pre-approval authority to one or more of its members. The member to whom such authority is delegated must report, for informational purposes only, any pre-approval decisions to the Audit Committee at its next scheduled meeting.
3. Audit Services
The annual Audit services engagement terms and fees are subject to the specific pre-approval of the Audit Committee. Audit services include the annual financial statement audit and other procedures required to be performed by the Independent Auditors to be able to form an opinion on the Fund’s financial statements. These other procedures include information systems and procedural reviews and testing performed in order to understand and place reliance on the systems of internal control, and consultations relating to the audit. The Audit Committee will approve, if necessary, any changes in terms, conditions and fees resulting from changes in audit scope, Fund structure or other items.
In addition to the annual Audit services engagement approved by the Audit Committee, the Audit Committee may grant general pre-approval to other Audit services, which are those services that only the Independent Auditors reasonably can provide. Other Audit services may include statutory audits and services associated with SEC registration statements (on Forms N-1A, N-2, N-3, N-4, etc.), periodic reports and other documents filed with the SEC or other documents issued in connection with securities offerings.
The Audit Committee has pre-approved the Audit services in Appendix B.1. All other Audit services not listed in Appendix B.1 must be specifically pre-approved by the Audit Committee (or by any member of the Audit Committee to which pre-approval has been delegated).
4. Audit-related Services
Audit-related services are assurance and related services that are reasonably related to the performance of the audit or review of the Fund’s financial statements and, to the extent they are Covered Services, the Covered Entities or that are traditionally performed by the Independent Auditors. Because the Audit Committee believes that the provision of Audit-related services does not impair the independence of the auditor and is consistent with the SEC’s rules on auditor independence, the Audit Committee may grant general pre-approval to Audit-related services. Audit-related services include, among others, accounting consultations related to accounting, financial reporting or disclosure matters
not classified as “Audit services”; assistance with understanding and implementing new accounting and financial reporting guidance from rulemaking authorities; agreed-upon or expanded audit procedures related to accounting and/or billing records required to respond to or comply with financial, accounting or regulatory reporting matters; and assistance with internal control reporting requirements under Forms N-SAR and/or N-CSR.
The Audit Committee has pre-approved the Audit-related services in Appendix B.2. All other Audit-related services not listed in Appendix B.2 must be specifically pre-approved by the Audit Committee (or by any member of the Audit Committee to which pre-approval has been delegated).
5. Tax Services
The Audit Committee believes that the Independent Auditors can provide Tax services to the Fund and, to the extent they are Covered Services, the Covered Entities, such as tax compliance, tax planning and tax advice without impairing the auditor’s independence, and the SEC has stated that the Independent Auditors may provide such services.
Pursuant to the preceding paragraph, the Audit Committee has pre-approved the Tax Services in Appendix B.3. All Tax services in Appendix B.3 must be specifically pre-approved by the Audit Committee (or by any member of the Audit Committee to which pre-approval has been delegated).
6. All Other Services
The Audit Committee believes, based on the SEC’s rules prohibiting the Independent Auditors from providing specific non-audit services, that other types of non-audit services are permitted. Accordingly, the Audit Committee believes it may grant general pre-approval to those permissible non-audit services classified as All Other services that it believes are routine and recurring services, would not impair the independence of the auditor and are consistent with the SEC’s rules on auditor independence.
The Audit Committee has pre-approved the All Other services in Appendix B.4. Permissible All Other services not listed in Appendix B.4 must be specifically pre-approved by the Audit Committee (or by any member of the Audit Committee to which pre-approval has been delegated).
7. Pre-Approval Fee Levels or Budgeted Amounts
Pre-approval fee levels or budgeted amounts for all services to be provided by the Independent Auditors will be established annually by the Audit Committee. Any proposed services exceeding these levels or amounts will require specific pre-approval by the Audit Committee. The Audit Committee is mindful of the overall relationship of fees for audit and non-audit services in determining whether to pre-approve any such services.
8. Procedures
All requests or applications for services to be provided by the Independent Auditors that do not require specific approval by the Audit Committee will be submitted to the Fund’s Chief Financial Officer and must include a detailed description of the services to be
rendered. The Fund’s Chief Financial Officer will determine whether such services are included within the list of services that have received the general pre-approval of the Audit Committee. The Audit Committee will be informed on a timely basis of any such services rendered by the Independent Auditors. Requests or applications to provide services that require specific approval by the Audit Committee will be submitted to the Audit Committee by both the Independent Auditors and the Fund’s Chief Financial Officer, and must include a joint statement as to whether, in their view, the request or application is consistent with the SEC’s rules on auditor independence.
The Audit Committee has designated the Fund’s Chief Financial Officer to monitor the performance of all services provided by the Independent Auditors and to determine whether such services are in compliance with this Policy. The Fund’s Chief Financial Officer will report to the Audit Committee on a periodic basis on the results of its monitoring. Both the Fund’s Chief Financial Officer and management will immediately report to the chairman of the Audit Committee any breach of this Policy that comes to the attention of the Fund’s Chief Financial Officer or any member of management.
9. Additional Requirements
The Audit Committee has determined to take additional measures on an annual basis to meet its responsibility to oversee the work of the Independent Auditors and to assure the auditor’s independence from the Fund, such as reviewing a formal written statement from the Independent Auditors delineating all relationships between the Independent Auditors and the Fund, consistent with Independence Standards Board No. 1, and discussing with the Independent Auditors its methods and procedures for ensuring independence.
10. Covered Entities
Covered Entities include the Fund’s investment adviser(s) and any entity controlling, controlled by or under common control with the Fund’s investment adviser(s) that provides ongoing services to the Fund(s). Beginning with non-audit service contracts entered into on or after May 6, 2003, the Fund’s audit committee must pre-approve non-audit services provided not only to the Fund but also to the Covered Entities if the engagements relate directly to the operations and financial reporting of the Fund. This list of Covered Entities would include:
Morgan Stanley Retail Funds
Morgan Stanley Investment Advisors Inc.
Morgan Stanley & Co. Incorporated
Morgan Stanley DW Inc.
Morgan Stanley Investment Management Inc.
Morgan Stanley Investment Management Limited
Morgan Stanley Investment Management Private Limited
Morgan Stanley Asset & Investment Trust Management Co., Limited
Morgan Stanley Investment Management Company
Morgan Stanley Services Company, Inc.
Morgan Stanley Distributors Inc.
Morgan Stanley Trust FSB
Morgan Stanley Institutional Funds
Morgan Stanley Investment Management Inc.
Morgan Stanley Investment Advisors Inc.
Morgan Stanley Investment Management Limited
Morgan Stanley Investment Management Private Limited
Morgan Stanley Asset & Investment Trust Management Co., Limited
Morgan Stanley Investment Management Company
Morgan Stanley & Co. Incorporated
Morgan Stanley Distribution, Inc.
Morgan Stanley AIP GP LP
Morgan Stanley Alternative Investment Partners LP
(e)(2) Beginning with non-audit service contracts entered into on or after May 6, 2003, the audit committee also is required to pre-approve services to Covered Entities to the extent that the services are determined to have a direct impact on the operations or financial reporting of the Registrant. 100% of such services were pre-approved by the audit committee pursuant to the Audit Committee’s pre-approval policies and procedures (attached hereto).
(f) Not applicable.
(g) See table above.
(h) The audit committee of the Board of Trustees has considered whether the provision of services other than audit services performed by the auditors to the Registrant and Covered Entities is compatible with maintaining the auditors’ independence in performing audit services.
Item 5. Audit Committee of Listed Registrants.
(a) The Fund has a separately-designated standing audit committee established in accordance with Section 3(a)(58)(A) of the Exchange Act whose members are:
Joseph Kearns, Michael Nugent and Allen Reed.
(b) Not applicable.
Item 6. Schedule of Investments
(a) Refer to Item 1.
(b) Not applicable.
Item 7. Disclosure of Proxy Voting Policies and Procedures for Closed-End Management Investment Companies.
Applicable only to reports filed by closed-end funds.
Item 8. Portfolio Managers of Closed-End Management Investment Companies
Applicable only to reports filed by annual closed-end funds.
Item 9. Closed-End Fund Repurchases
Applicable only to reports filed by closed-end funds.
Item 10. Submission of Matters to a Vote of Security Holders
Not applicable.
Item 11. Controls and Procedures
(a) The Fund’s principal executive officer and principal financial officer have concluded that the Fund’s disclosure controls and procedures are sufficient to ensure that information required to be disclosed by the Fund in this Form N-CSR was recorded, processed, summarized and reported within the time periods specified in the Securities and Exchange Commission’s rules and forms, based upon such officers’ evaluation of these controls and procedures as of a date within 90 days of the filing date of the report.
(b) There were no changes in the registrant’s internal control over financial reporting that occurred during the second fiscal quarter of the period covered by this report that has materially affected, or is reasonably likely to materially affect, the registrant’s internal control over financial reporting.
Item 12. Exhibits
(a) The Code of Ethics for Principal Executive and Senior Financial Officers is attached hereto.
(b) A separate certification for each principal executive officer and principal financial officer of the registrant are attached hereto as part of EX-99.CERT.
SIGNATURES
Pursuant to the requirements of the Securities Exchange Act of 1934 and the Investment Company Act of 1940, the registrant has duly caused this report to be signed on its behalf by the undersigned, thereunto duly authorized.
Morgan Stanley Institutional Fund Trust
/s/ Arthur Lev | |
Arthur Lev | |
Principal Executive Officer | |
November 15, 2012 | |
Pursuant to the requirements of the Securities Exchange Act of 1934 and the Investment Company Act of 1940, this report has been signed by the following persons on behalf of the registrant and in the capacities and on the dates indicated.
/s/ Arthur Lev | |
Arthur Lev | |
Principal Executive Officer | |
November 15, 2012 | |
| |
/s/ Francis Smith | |
Francis Smith | |
Principal Financial Officer | |
November 15, 2012 | |