UNITED STATES
SECURITIES AND EXCHANGE COMMISSION
Washington, D.C. 20549
FORM N-CSR
CERTIFIED SHAREHOLDER REPORT OF REGISTERED
MANAGEMENT INVESTMENT COMPANIES
Investment Company Act file number | 811-03980 |
|
Morgan Stanley Institutional Fund Trust |
(Exact name of registrant as specified in charter) |
|
522 Fifth Avenue, New York, New York | | 10036 |
(Address of principal executive offices) | | (Zip code) |
|
John H. Gernon 522 Fifth Avenue, New York, New York 10036 |
(Name and address of agent for service) |
|
Registrant’s telephone number, including area code: | 212-296-0289 | |
|
Date of fiscal year end: | September 30, | |
|
Date of reporting period: | September 30, 2015 | |
| | | | | | | | |
Item 1 - Report to Shareholders

Morgan Stanley Institutional Fund Trust
Core Fixed Income Portfolio
Annual Report
September 30, 2015

Morgan Stanley Institutional Fund Trust
Annual Report — September 30, 2015
Shareholders' Letter | | | 2 | | |
Expense Example | | | 3 | | |
Investment Overview | | | 4 | | |
Portfolio of Investments | | | 7 | | |
Statement of Assets and Liabilities | | | 11 | | |
Statement of Operations | | | 13 | | |
Statements of Changes in Net Assets | | | 14 | | |
Financial Highlights | | | 15 | | |
Notes to Financial Statements | | | 19 | | |
Report of Independent Registered Public Accounting Firm | | | 28 | | |
Investment Advisory Agreement Approval | | | 29 | | |
U.S. Privacy Policy | | | 31 | | |
Trustee and Officer Information | | | 34 | | |
This report is authorized for distribution only when preceded or accompanied by prospectuses of the Morgan Stanley Institutional Fund Trust. To receive a prospectus and/or statement of additional information (SAI), which contains more complete information such as investment objectives, charges, expenses, policies for voting proxies, risk considerations, and describes in detail each of the Portfolio's investment policies to the prospective investor, please call toll free 1 (800) 548-7786. Please read the prospectuses carefully before you invest or send money.
Additionally, you can access portfolio information including performance, characteristics, and investment team commentary through Morgan Stanley Investment Management's website: www.morganstanley.com/im.
Market forecasts provided in this report may not necessarily come to pass. There is no guarantee that any sectors mentioned will continue to perform as discussed herein or that securities in such sectors will be held by the Portfolio in the future. There is no assurance that a Portfolio will achieve its investment objective. Portfolios are subject to market risk, which is the possibility that market values of securities owned by the Portfolio will decline and, therefore, the value of the Portfolio's shares may be less than what you paid for them. Accordingly, you can lose money investing in this Portfolio. Please see the prospectus for more complete information on investment risks.
1
Morgan Stanley Institutional Fund Trust
Annual Report — September 30, 2015
Shareholders' Letter (unaudited)
Dear Shareholders,
We are pleased to provide this Annual report, in which you will learn how your investment in Core Fixed Income Portfolio (the "Portfolio") performed during the latest twelve-month period.
Morgan Stanley Investment Management is a client-centric, investor-led organization. Our global presence, intellectual capital, and breadth of products and services enable us to partner with investors to meet the evolving challenges of today's financial markets. We aim to deliver superior investment service and to empower our clients to make the informed decisions that help them reach their investment goals.
As always, we thank you for selecting Morgan Stanley Investment Management, and look forward to working with you in the months and years ahead.
Sincerely,

John H. Gernon
President and Principal Executive Officer
October 2015
2
Morgan Stanley Institutional Fund Trust
Annual Report — September 30, 2015
Expense Example (unaudited)
Core Fixed Income Portfolio
As a shareholder of the Portfolio, you may incur two types of costs: (1) transactional costs, including sales charge (loads) on purchase payments; and (2) ongoing costs, including advisory fees, administration fees, distribution and shareholder services fees; and other Portfolio expenses. This example is intended to help you understand your ongoing costs (in dollars) of investing in the Portfolio and to compare these costs with the ongoing costs of investing in other mutual funds.
This example is based on an investment of $1,000 invested at the beginning of the six-month period ended September 30, 2015 and held for the entire six-month period (unless otherwise noted).
Actual Expenses
The table below provides information about actual account values and actual expenses. You may use the information in this table, together with the amount you invested, to estimate the expenses that you paid over the period. Simply divide your account value by $1,000 (for example, an $8,600 account value divided by $1,000 = 8.6), then multiply the result by the number in the table under the heading entitled "Actual Expenses Paid During Period" to estimate the expenses you paid on your account during this period.
Hypothetical Example for Comparison Purposes
The table below provides information about hypothetical account values and hypothetical expenses based on the Portfolio's actual expense ratio and an assumed rate of return of 5% per year before expenses, which is not the Portfolio's actual return. The hypothetical account values and expenses may not be used to estimate the actual ending account balance or expenses you paid for the period. You may use this information to compare the ongoing costs of investing in the Portfolio and other funds. To do so, compare this 5% hypothetical example with the 5% hypothetical examples that appear in the shareholder reports of the other funds.
Please note that the expenses shown in the table are meant to highlight your ongoing costs only and do not reflect any transactional costs, such as sales charges (loads, if applicable). Therefore, the information for each class in the table is useful in comparing ongoing costs only, and will not help you determine the relative total costs of owning different funds. In addition, if these transactional costs were included, your costs would have been higher.
| | | Beginning
Account
Value
4/1/15 | | Actual Ending
Account
Value
9/30/15 | | Hypothetical
Ending Account
Value | | Actual
Expenses
Paid
During
Period | | Hypothetical
Expenses Paid
During Period | | Net
Expense
Ratio
During
Period*** | |
Core Fixed Income Portfolio Class I | | $ | 1,000.00 | | | $ | 984.30 | | | $ | 1,023.36 | | | $ | 1.69 | * | | $ | 1.72 | * | | | 0.34 | % | |
Core Fixed Income Portfolio Class A | | | 1,000.00 | | | | 980.90 | | | | 1,020.86 | | | | 4.17 | * | | | 4.26 | * | | | 0.84 | | |
Core Fixed Income Portfolio Class L | | | 1,000.00 | | | | 979.90 | | | | 1,019.60 | | | | 5.41 | * | | | 5.52 | * | | | 1.09 | | |
Core Fixed Income Portfolio Class C | | | 1,000.00 | | | | 981.60 | | | | 1,014.29 | | | | 6.60 | ** | | | 6.71 | ** | | | 1.59 | | |
* Expenses are calculated using each Portfolio Class' annualized net expense ratio (as disclosed), multiplied by the average account value over the period, and multiplied by 183/365 (to reflect the most recent one-half year period).
** Expenses are calculated using the Portfolio Class' annualized net expense ratio (as disclosed), multiplied by the average account value over the period, and multiplied by 153/365 (to reflect the actual days in the period).
*** Annualized.
3
Morgan Stanley Institutional Fund Trust
Annual Report — September 30, 2015
Investment Overview (unaudited)
Core Fixed Income Portfolio
The Core Fixed Income Portfolio seeks above-average total return over a market cycle of three to five years.
Performance
For the fiscal year ended September 30, 2015, the Portfolio's Class I shares had a total return based on net asset value and reinvestment of distributions per share of 1.12%, net of fees. The Portfolio's Class I shares underperformed against the Portfolio's benchmark the Barclays U.S. Aggregate Index (the "Index"), which returned 2.94%.
Factors Affecting Performance
• Concerns over central bank policy around the world and global issues, such as Greece's debt crisis and China's economic slowdown, kept bond markets fairly turbulent during the period. Risk premia rose substantially in the latter months of the period and asset prices suffered. The rise in risk premia was driven by a continued tightening of financial conditions, catalyzed by a devaluation of the Chinese currency in August. This tightening of financial conditions resulted in falling business confidence and generally weaker-than-expected economic data. These factors drove "risk-off" sentiment and led to a widening of credit spreads, an equity market sell-off and a rally in U.S. Treasuries. Furthermore, to the surprise of many, the Federal Reserve (Fed) kept interest rates unchanged and delivered a more dovish-than-expected policy statement at its September 2015 meeting. As an unintended consequence, markets increasingly worried that the negative impact on the U.S. economy's growth dynamics would warrant a ratcheting down of global growth expectations. This fear drove risk premia even higher. The Fed has communicated that its decision to hike rates will be data dependent, which implies some uncertainty on whether a hike will happen this year. Only with a material recovery in labor market indicators over the next few months would a rate hike likely occur this year.
• Despite a general increase in yields in first half of the period, over the full 12-month period, 5-, 10-, and 30-year Treasury yields ended 41, 36 and 34 basis points lower, respectively.(i) U.S. 2-year yields ended the period relatively flat at 2 basis points higher.
• Recovering from a volatile fourth quarter of 2014, high yield credit started 2015 on a positive note, as one of the few fixed income sectors to have positive performance in the first quarter of 2015. However, amid economic and geopolitical worries, the U.S. credit markets endured record amounts of new issuance, which eventually pressured yield spreads wider (and prices lower, as bond prices move inversely to yields). Over the course of 2015, credit spreads in all markets have widened materially and are currently at levels which are typically only seen in periods of economic recession or systemic stress. The spreads observable in the investment grade markets include a material risk premium, and spreads in the high yield market are compensating for a significant uptick in defaults. While it is clear that certain emerging markets are seeing a material risk of recession, the consensus is for the developed world to see moderate growth over the coming year. We believe this growth backdrop, combined with low inflation, is likely to lead to ongoing accommodative monetary policy from the central banks around the world, which should keep defaults low and support credit markets.
• Another driver of credit spreads is the technical balance between supply and demand. Supply volume has been elevated across many of the credit markets. This has been most apparent in the U.S. investment grade market, where a combination of increased merger and acquisition activity and the fear that an interest rate tightening cycle could increase the future cost of long-term debt financing has caused corporate treasurers to turn to the bond markets. As a result, year-to-date new issue volumes have been running at record pace. This is to a lesser extent also true in the U.S. high yield and European investment grade markets. Along with this high level of issuance, demand has been muted as many yield-oriented investors are awaiting higher yields before committing capital to the market. This mismatch between supply and demand has resulted in a higher liquidity premium, which has contributed to the wider credit spreads.
(i) Source for U.S. Treasury yields: Bloomberg L.P.
4
Morgan Stanley Institutional Fund Trust
Annual Report — September 30, 2015
Investment Overview (unaudited) (cont'd)
Core Fixed Income Portfolio
• Despite widening in the latter part of the period, agency mortgage-backed securities (MBS) spreads remain historically expensive. Mortgage rates and prepayment speeds have been range-bound, helping support performance so far, but with the possibility of a Fed rate hike in the coming months, volatility and absolute rate levels could rise and MBS duration extension concerns could return. There is also the additional risk that at some point in 2016 the Fed could end their MBS purchase program, whereby it has been buying 25% to 30% of all new origination.
• Prior to September, non-agency MBS prices had been resilient to broader credit market declines and had traded more as a function of the strong U.S. housing market. However, prices finally began to weaken as relative spread differences became more pronounced at the end of September. In contrast to the price declines, the fundamental market conditions underlying the non-agency MBS market remain very strong. Home prices rose 0.6% in July (down 0.2% on a seasonally adjusted basis), and were up 5.0% year-on-year from July 2014.(ii) New home sales were up 5.7% in August and up 21.6% from August 2014.(iii) Existing home sales were down 1.4% in August, predominantly due to lack of supply, but were still up 6.1% from August 2014.(iv) The volume of outstanding homes for sale fell to a 4.7-month supply based on current sales volumes, down from 5.0-month supply in July and well below the six-month supply that is historically associated with a balanced housing market.(iii) The U.S. homebuilder confidence index climbed to the highest level since November 2005 as housing supply is historically low and housing demand is steadily improving.(v) U.S. household formation was up 2.25 million year-on-year as of June, roughly double the long-term average of roughly 1.15 million per year.(iii) Household formation had been depressed and substantially below historical norms for most for the past seven years, and we are now seeing some of this pent-up demand enter the market. Mortgage performance remains positive. Mortgage defaults were essentially unchanged in August at 0.8%, down 0.1% from August 2014 and well below the nearly 6% level in 2009.(vi)
• Commercial mortgage-backed securities (CMBS) spreads also widened significantly in the latter half of the period. Fundamentally, the CMBS sector
remains healthy. Retail sales continue to climb, with August numbers up 0.2% from July and up 2.2% from August 2014.(iii) Consumer confidence rose in September to the second highest level in the past eight years.(vii) Hotel occupancy rates are at their highest levels in more than 15 years, exceeding 65% occupancy so far in 2015.(viii) For comparison, the previous credit cycle peak of 2004-2006 averaged roughly 63% occupancy. These high occupancy rates are boosting the performance of the hotel sector of CMBS. The improving economy and employment numbers are also helping reduce office space vacancies. National office vacancy rates fell by 0.4% to 13.5% in the second quarter of 2015 and are expected to fall further this year.(ix) Office rental rates increased at roughly 1.1% in the second quarter of 2015, and this pace of increase is expected to continue based on the declining vacancy rates.(ix)
Management Strategies
• Throughout the period, the Portfolio was positioned with an overweight to investment-grade credit, particularly in financials, as we believe valuations relative to fundamentals have been attractive. This position detracted from performance as volatility in global markets pushed spreads wider.
• With regard to interest rate strategy, the Portfolio is positioned using futures and interest rate swaps to be underweight duration at the intermediate part of the yield curve. This detracted from relative performance as rates declined during the period.
• We continue being overweight spread product (non-government bonds) in the Portfolio as we believe the yield advantage could provide attractive returns over the near term.
(ii) S&P/Case-Shiller 20-City Composite Home Price Index, an index gauging the value of residential real estate in 20 major U.S. metropolitan areas.
(iii) U.S. Census Bureau
(iv) National Association of Realtors
(v) National Association of Home Builders
(vi) S&P/Experian First Mortgage Default Index, an index measuring default rates across first mortgages
(vii) The Conference Board
(viii) Statistica.com
(ix) CBRE Group, Inc.
5
Morgan Stanley Institutional Fund Trust
Annual Report — September 30, 2015
Investment Overview (unaudited) (cont'd)
Core Fixed Income Portfolio

* Minimum Investment
In accordance with SEC regulations, the Portfolio's performance shown assumes that all recurring fees (including management fees) were deducted and all dividends and distributions were reinvested. The performance of Class A, Class L and Class C shares will vary from the performance of Class I shares based upon their different inception dates and will be negatively impacted by additional fees assessed to those classes.
Performance Compared to the Barclays U.S. Aggregate Index(1) and the Lipper Core Bond Funds Index(2)
| | | Period Ended September 30, 2015
Total Returns(3) | |
| | | | | Average Annual | |
| | | One
Year | | Five
Years | | Ten
Years | | Since
Inception(8) | |
Portfolio — Class I Shares
w/o sales charges(4) | | | 1.12 | % | | | 3.29 | % | | | 3.22 | % | | | 6.44 | % | |
Portfolio — Class A Shares
w/o sales charges(5) | | | 0.58 | | | | 2.94 | | | | 2.93 | | | | 4.07 | | |
Portfolio — Class A Shares with
maximum 4.25% sales charges(5) | | | –3.73 | | | | 2.06 | | | | 2.48 | | | | 3.80 | | |
Portfolio — Class L Shares
w/o sales charges(6) | | | 0.31 | | | | — | | | | — | | | | 1.67 | | |
Portfolio — Class C Shares
w/o sales charges(7) | | | — | | | | — | | | | — | | | | –1.84 | | |
Portfolio — Class C Shares with
maximum 1.00% deferred
sales charges(7) | | | — | | | | — | | | | — | | | | –2.81 | | |
Barclays U.S. Aggregate Index | | | 2.94 | | | | 3.10 | | | | 4.64 | | | | 6.84 | | |
Lipper Core Bond Funds Index | | | 2.40 | | | | 3.47 | | | | 4.52 | | | | — | | |
Performance data quoted represents past performance, which is no guarantee of future results, and current performance may be lower or higher than the figures shown. Performance assumes that all dividends and distributions, if any, were reinvested. Returns for period less than one year are not annualized. For the most recent month-end performance figures, please visit www.morganstanley.com/im. Investment returns and principal value will fluctuate so that Portfolio shares, when redeemed, may be worth more or less than their original cost. Total returns do not reflect the deduction of taxes that a shareholder would pay on Portfolio distributions or the redemption of Portfolio shares. Performance of share classes will vary due to differences in sales charges and expenses.
(1) The Barclays U.S. Aggregate Index tracks the performance of U.S. government agency and Treasury securities, investment-grade corporate debt securities, agency mortgage-backed securities, asset-backed securities and commercial mortgage-backed securities. The Index is unmanaged and its returns do not include any sales charges or fees. Such costs would lower performance. It is not possible to invest directly in an index.
(2) The Lipper Core Bond Funds Index is an equally weighted performance index of the largest qualifying funds (based on net assets) in the Lipper Core Bond Funds classification. The Index, which is adjusted for capital gains distributions and income dividends, is unmanaged and should not be considered an investment. There are currently 30 funds represented in this Index. As of the date of this report, the Portfolio was in the Lipper Core Bond Funds classification.
(3) Total returns for the Portfolio reflect expenses waived and/or reimbursed, if applicable, by the Adviser. Without such waivers and/or reimbursements, total returns would have been lower.
(4) Commenced operations on September 29, 1987.
(5) Commenced operations on March 1, 1999.
(6) Commenced operations on April 27, 2012.
(7) Commenced operations on April 30, 2015.
(8) For comparative purposes, average annual since inception returns listed for the Indexes refer to the inception date of Class I of the Portfolio, not the inception of the Indexes.
6
Morgan Stanley Institutional Fund Trust
Annual Report — September 30, 2015
Portfolio of Investments
Core Fixed Income Portfolio
| | | Face
Amount
(000) | | Value
(000) | |
Fixed Income Securities (77.0%) | |
Agency Fixed Rate Mortgages (19.0%) | |
Federal Home Loan Mortgage Corporation, | |
Gold Pools: | |
6.00%, 5/1/37 - 11/1/37 | | $ | 48 | | | $ | 54 | | |
7.50%, 5/1/35 | | | 32 | | | | 38 | | |
8.00%, 8/1/32 | | | 19 | | | | 23 | | |
8.50%, 8/1/31 | | | 28 | | | | 37 | | |
Federal National Mortgage Association, | |
Conventional Pools: | |
4.00%, 11/1/41 | | | 132 | | | | 142 | | |
4.50%, 8/1/40 - 7/1/41 | | | 292 | | | | 318 | | |
5.50%, 4/1/34 | | | 42 | | | | 47 | | |
6.00%, 1/1/38 | | | 36 | | | | 40 | | |
6.50%, 7/1/29 - 11/1/32 | | | 110 | | | | 128 | | |
7.00%, 10/1/31 - 12/1/31 | | | 1 | | | | 1 | | |
7.50%, 8/1/37 | | | 56 | | | | 67 | | |
8.00%, 4/1/33 | | | 41 | | | | 50 | | |
8.50%, 10/1/32 | | | 41 | | | | 53 | | |
| | | | 998 | | |
Asset-Backed Security (3.8%) | |
Chase Issuance Trust | |
1.59%, 2/18/20 | | | 200 | | | | 202 | | |
Collateralized Mortgage Obligations — Agency Collateral Series (8.3%) | |
Federal National Mortgage Association, | |
IO | |
6.20%, 9/25/20 (a) | | | 291 | | | | 58 | | |
REMIC | |
9.21%, 10/25/41 (a)(b) | | | 28 | | | | 29 | | |
Government National Mortgage Association, | |
IO | |
0.83%, 8/20/58 (a) | | | 2,516 | | | | 78 | | |
3.50%, 5/20/43 | | | 501 | | | | 103 | | |
5.00%, 2/16/41 | | | 92 | | | | 18 | | |
5.89%, 8/16/42 (a) | | | 447 | | | | 77 | | |
5.93%, 6/20/43 (a) | | | 440 | | | | 71 | | |
| | | | 434 | | |
Corporate Bonds (42.2%) | |
Finance (16.2%) | |
ACE INA Holdings, Inc. | |
3.35%, 5/15/24 | | | 50 | | | | 50 | | |
American International Group, Inc. | |
4.88%, 6/1/22 | | | 25 | | | | 28 | | |
AvalonBay Communities, Inc. | |
2.95%, 9/15/22 | | | 25 | | | | 25 | | |
Bank of America Corp., | |
MTN | |
4.20%, 8/26/24 | | | 25 | | | | 25 | | |
4.25%, 10/22/26 | | | 23 | | | | 23 | | |
Bank of New York Mellon Corp. (The), | |
MTN | |
3.65%, 2/4/24 | | | 25 | | | | 26 | | |
| | | Face
Amount
(000) | | Value
(000) | |
Boston Properties LP | |
3.80%, 2/1/24 | | $ | 10 | | | $ | 10 | | |
Brookfield Asset Management, Inc. | |
5.80%, 4/25/17 | | | 50 | | | | 53 | | |
Capital One Financial Corp. | |
2.45%, 4/24/19 | | | 25 | | | | 25 | | |
Citigroup, Inc. | |
5.50%, 9/13/25 | | | 50 | | | | 54 | | |
Discover Financial Services | |
3.95%, 11/6/24 | | | 25 | | | | 25 | | |
ERP Operating LP | |
3.00%, 4/15/23 | | | 55 | | | | 54 | | |
Goldman Sachs Group, Inc. (The) | |
6.75%, 10/1/37 | | | 30 | | | | 36 | | |
HSBC Finance Corp. | |
6.68%, 1/15/21 | | | 50 | | | | 59 | | |
JPMorgan Chase & Co. | |
3.20%, 1/25/23 | | | 45 | | | | 45 | | |
Pacific LifeCorp | |
6.00%, 2/10/20 (c) | | | 50 | | | | 56 | | |
PNC Financial Services Group, Inc. (The) | |
3.90%, 4/29/24 (d) | | | 35 | | | | 35 | | |
Principal Financial Group, Inc. | |
8.88%, 5/15/19 | | | 50 | | | | 61 | | |
State Street Corp. | |
3.10%, 5/15/23 | | | 35 | | | | 34 | | |
TD Ameritrade Holding Corp. | |
3.63%, 4/1/25 | | | 25 | | | | 26 | | |
UnitedHealth Group, Inc. | |
2.88%, 3/15/23 (d) | | | 50 | | | | 50 | | |
Wells Fargo & Co., | |
Series M | |
3.45%, 2/13/23 | | | 50 | | | | 50 | | |
| | | | 850 | | |
Industrials (23.0%) | |
Actavis Funding SCS | |
3.80%, 3/15/25 | | | 5 | | | | 5 | | |
Altera Corp. | |
2.50%, 11/15/18 | | | 100 | | | | 102 | | |
Altria Group, Inc. | |
5.38%, 1/31/44 | | | 5 | | | | 5 | | |
Amazon.com, Inc. | |
1.20%, 11/29/17 | | | 25 | | | | 25 | | |
Anadarko Petroleum Corp. | |
6.45%, 9/15/36 | | | 25 | | | | 28 | | |
Apple, Inc. | |
3.85%, 5/4/43 | | | 25 | | | | 23 | | |
AT&T, Inc. | |
5.55%, 8/15/41 | | | 25 | | | | 25 | | |
BAT International Finance PLC | |
3.50%, 6/15/22 (c) | | | 25 | | | | 26 | | |
BHP Billiton Finance USA Ltd. | |
5.00%, 9/30/43 | | | 25 | | | | 25 | | |
The accompanying notes are an integral part of the financial statements.
7
Morgan Stanley Institutional Fund Trust
Annual Report — September 30, 2015
Portfolio of Investments (cont'd)
Core Fixed Income Portfolio
| | | Face
Amount
(000) | | Value
(000) | |
Industrials (cont'd) | |
BP Capital Markets PLC | |
3.51%, 3/17/25 (d) | | $ | 25 | | | $ | 25 | | |
Cardinal Health, Inc. | |
3.75%, 9/15/25 (d) | | | 25 | | | | 25 | | |
CCO Safari II LLC | |
4.91%, 7/23/25 (c) | | | 25 | | | | 25 | | |
Coca-Cola Co. | |
3.20%, 11/1/23 | | | 25 | | | | 26 | | |
EnLink Midstream Partners LP | |
5.60%, 4/1/44 | | | 25 | | | | 23 | | |
Ensco PLC | |
5.75%, 10/1/44 | | | 25 | | | | 17 | | |
Freeport-McMoRan, Inc. | |
3.88%, 3/15/23 | | | 20 | | | | 15 | | |
General Motors Financial Co., Inc., | |
4.00%, 1/15/25 | | | 25 | | | | 24 | | |
4.30%, 7/13/25 | | | 30 | | | | 29 | | |
Goldcorp, Inc. | |
3.70%, 3/15/23 (d) | | | 37 | | | | 35 | | |
Kinder Morgan, Inc. | |
4.30%, 6/1/25 (d) | | | 25 | | | | 23 | | |
McDonald's Corp., | |
MTN | |
4.60%, 5/26/45 | | | 25 | | | | 25 | | |
Merck & Co., Inc. | |
2.80%, 5/18/23 | | | 25 | | | | 25 | | |
NBC Universal Media LLC | |
5.95%, 4/1/41 | | | 25 | | | | 30 | | |
Omnicom Group, Inc. | |
3.65%, 11/1/24 | | | 15 | | | | 15 | | |
Oracle Corp. | |
3.40%, 7/8/24 | | | 25 | | | | 25 | | |
PepsiCo, Inc. | |
3.60%, 3/1/24 | | | 25 | | | | 26 | | |
Quest Diagnostics, Inc. | |
2.70%, 4/1/19 (d) | | | 250 | | | | 252 | | |
Shell International Finance BV | |
3.25%, 5/11/25 | | | 25 | | | | 25 | | |
Spectra Energy Capital LLC | |
3.30%, 3/15/23 | | | 25 | | | | 22 | | |
Tiffany & Co. | |
4.90%, 10/1/44 | | | 25 | | | | 24 | | |
Time Warner Cable, Inc. | |
4.50%, 9/15/42 | | | 25 | | | | 20 | | |
Tyson Foods, Inc. | |
3.95%, 8/15/24 | | | 5 | | | | 5 | | |
Yum! Brands, Inc. | |
3.88%, 11/1/20 | | | 175 | | | | 183 | | |
| | | | 1,208 | | |
Utilities (3.0%) | |
Jersey Central Power & Light Co. | |
4.70%, 4/1/24 (c)(d) | | | 75 | | | | 78 | | |
| | | Face
Amount
(000) | | Value
(000) | |
PPL WEM Ltd./Western Power Distribution Ltd. | |
3.90%, 5/1/16 (c) | | $ | 75 | | | $ | 76 | | |
| | | | 154 | | |
| | | | 2,212 | | |
U.S. Treasury Security (3.7%) | |
U.S. Treasury Inflation Indexed Bond | |
0.25%, 1/15/25 | | | 202 | | | | 193 | | |
Total Fixed Income Securities (Cost $3,953) | | | 4,039 | | |
| | | Shares
(000) | | | |
Short-Term Investments (26.0%) | |
Securities held as Collateral on Loaned Securities (3.7%) | |
Investment Company (3.2%) | |
Morgan Stanley Institutional Liquidity
Funds — Money Market Portfolio —
Institutional Class (See Note G) | | | 168,222 | | | | 168 | | |
| | | Face
Amount
(000) | | | |
Repurchase Agreements (0.5%) | |
Barclays Capital, Inc., (0.10%,
dated 9/30/15, due 10/1/15; proceeds $14;
fully collateralized by a U.S. Government
obligation; 3.13% due 8/15/44; valued at $14) | | $ | 14 | | | | 14 | | |
BNP Paribas Securities Corp., (0.09%,
dated 9/30/15, due 10/1/15; proceeds $10;
fully collateralized by various U.S. Government
agency securities; 0.00% - 7.25%
due 11/5/15 - 10/11/33 and U.S. Government
obligations; 0.00% - 1.88%
due 10/15/15 - 9/30/17; valued at $10) | | | 10 | | | | 10 | | |
| | | | 24 | | |
Total Securities held as Collateral on Loaned
Securities (Cost $192) | | | 192 | | |
| | | Shares | | | |
Investment Company (4.2%) | |
Morgan Stanley Institutional Liquidity
Funds — Money Market Portfolio —
Institutional Class (See Note G) (Cost $218) | | | 217,804 | | | | 218 | | |
| | | Face
Amount
(000) | | | |
U.S. Treasury Securities (18.1%) | |
U.S. Treasury Bill | |
0.26%, 3/10/16 (e)(f) | | $ | 199 | | | | 199 | | |
U.S. Treasury Note | |
0.38%, 1/31/16 | | | 750 | | | | 751 | | |
Total U.S. Treasury Securities (Cost $950) | | | 950 | | |
Total Short-Term Investments (Cost $1,360) | | | 1,360 | | |
Total Investments (103.0%) (Cost $5,313)
Including $514 of Securities Loaned (g)(h) | | | 5,399 | | |
Liabilities in Excess of Other Assets (-3.0%) | | | (157 | ) | |
Net Assets (100.0%) | | $ | 5,242 | | |
The accompanying notes are an integral part of the financial statements.
8
Morgan Stanley Institutional Fund Trust
Annual Report — September 30, 2015
Portfolio of Investments (cont'd)
Core Fixed Income Portfolio
(a) Variable/Floating Rate Security — Interest rate changes on these instruments are based on changes in a designated base rate. The rates shown are those in effect on September 30, 2015.
(b) Inverse Floating Rate Security — Interest rate fluctuates with an inverse relationship to an associated interest rate. Indicated rate is the effective rate at September 30, 2015.
(c) 144A security — Certain conditions for public sale may exist. Unless otherwise noted, these securities are deemed to be liquid.
(d) All or a portion of this security was on loan at September 30, 2015.
(e) Rate shown is the yield to maturity at September 30, 2015.
(f) All or a portion of the security was pledged to cover margin requirements for futures contracts and swap agreements.
(g) Securities are available for collateral in connection with open futures contracts and swap agreements.
(h) At September 30, 2015, the aggregate cost for Federal income tax purposes is approximately $5,313,000. The aggregate gross unrealized appreciation is approximately $185,000 and the aggregate gross unrealized depreciation is approximately $99,000 resulting in net unrealized appreciation of approximately $86,000.
IO Interest Only.
MTN Medium Term Note.
REMIC Real Estate Mortgage Investment Conduit.
Futures Contracts:
The Portfolio had the following futures contracts open at September 30, 2015:
| | | Number
of
Contracts | | Value
(000) | | Expiration
Date | | Unrealized
Appreciation
(Depreciation)
(000) | |
Long: | |
U.S. Treasury 2 yr. Note | | | 1 | | | $ | 219 | | | Dec-15 | | $ | — | @ | |
U.S. Treasury 5 yr. Note | | | 3 | | | | 362 | | | Dec-15 | | | 2 | | |
U.S. Treasury Ultra Long Bond | | | 16 | | | | 2,566 | | | Dec-15 | | | 35 | | |
Short: | |
U.S. Treasury 10 yr. Note | | | 1 | | | | (129 | ) | | Dec-15 | | | (2 | ) | |
U.S. Treasury Long Bond | | | 15 | | | | (2,360 | ) | | Dec-15 | | | (44 | ) | |
| | | | | | | | | $ | (9 | ) | |
Credit Default Swap Agreements:
The Portfolio had the following credit default swap agreements open at September 30, 2015:
Swap Counterparty and
Reference Obligation | | Buy/Sell
Protection | | Notional
Amount
(000) | | Pay/Receive
Fixed Rate | | Termination
Date | | Upfront
Payment
Paid
(Received)
(000) | | Unrealized
Appreciation
(Depreciation)
(000) | | Value
(000) | | Credit
Rating of
Reference
Obligation†
(Unaudited) | |
Barclays Bank PLC
Quest Diagnostics, Inc. | | Buy | | $ | 250 | | | | 1.00 | % | | 3/20/19 | | $ | 5 | | | $ | (9 | ) | | $ | (4 | ) | | BBB+ | |
Barclays Bank PLC
Yum! Brands, Inc. | | Buy | | | 250 | | | | 1.00 | | | 12/20/18 | | | (5 | ) | | | — | @ | | | (5 | ) | | BBB | |
| | | | | $ | 500 | | | | | | | $ | — | @ | | $ | (9 | ) | | $ | (9 | ) | | | |
Interest Rate Swap Agreements:
The Portfolio had the following interest rate swap agreements open at September 30, 2015:
Swap Counterparty | | Floating Rate
Index | | Pay/Receive
Floating Rate | | Fixed Rate | | Termination
Date | | Notional
Amount
(000) | | Unrealized
Depreciation
(000) | |
Morgan Stanley & Co., LLC* | | 3 Month LIBOR | | Receive | | | 1.73 | % | | 3/9/20 | | $ | 200 | | | $ | (4 | ) | |
Morgan Stanley & Co., LLC* | | 3 Month LIBOR | | Receive | | | 2.49 | | | 6/9/25 | | | 100 | | | | (5 | ) | |
| | | | | | | | | | | | | $ | (9 | ) | |
@ Value is less than $500.
† Credit rating as issued by Standard & Poor's.
* Cleared swap agreement, the broker is Morgan Stanley & Co., LLC.
LIBOR London Interbank Offered Rate.
The accompanying notes are an integral part of the financial statements.
9
Morgan Stanley Institutional Fund Trust
Annual Report — September 30, 2015
Portfolio of Investments (cont'd)
Core Fixed Income Portfolio
Portfolio Composition**
Classification | | Percentage of
Total Investments | |
Industrials | | | 23.2 | % | |
Short-Term Investments | | | 22.4 | | |
Agency Fixed Rate Mortgages | | | 19.2 | | |
Finance | | | 16.3 | | |
Other*** | | | 10.6 | | |
Collateralized Mortgage Obligations — Agency
Collateral Series | | | 8.3 | | |
Total Investments | | | 100.0 | %**** | |
** Percentages indicated are based upon total investments (excluding Securities held as Collateral on Loaned Securities) as of September 30, 2015.
*** Industries and/or investment types representing less than 5% of total investments.
**** Does not include open long/short futures contracts with an underlying face amount of approximately $5,636,000 with net unrealized depreciation of approximately $9,000. Does not include open swap agreements with net unrealized depreciation of approximately $18,000.
The accompanying notes are an integral part of the financial statements.
10
Morgan Stanley Institutional Fund Trust
Annual Report — September 30, 2015
Core Fixed Income Portfolio
Statement of Assets and Liabilities | | September 30, 2015
(000) | |
Assets: | |
Investments in Securities of Unaffiliated Issuers, at Value(1) (Cost $4,927) | | $ | 5,013 | | |
Investment in Security of Affiliated Issuer, at Value (Cost $386) | | | 386 | | |
Total Investments in Securities, at Value (Cost $5,313) | | | 5,399 | | |
Cash | | | 13 | | |
Interest Receivable | | | 38 | | |
Due from Adviser | | | 33 | | |
Premium Paid on Open Swap Agreements | | | 5 | | |
Receivable for Investments Sold | | | 2 | | |
Unrealized Appreciation on Swap Agreements | | | — | @ | |
Receivable from Affiliate | | | — | @ | |
Receivable for Variation Margin on Swap Agreements | | | — | @ | |
Other Assets | | | 33 | | |
Total Assets | | | 5,523 | | |
Liabilities: | |
Collateral on Securities Loaned, at Value | | | 205 | | |
Payable for Professional Fees | | | 26 | | |
Unrealized Depreciation on Swap Agreements | | | 9 | | |
Payable for Trustees' Fees and Expenses | | | 7 | | |
Premium Received on Open Swap Agreements | | | 5 | | |
Payable for Custodian Fees | | | 4 | | |
Payable for Variation Margin on Futures Contracts | | | 3 | | |
Payable for Sub Transfer Agency Fees — Class I | | | 2 | | |
Payable for Sub Transfer Agency Fees — Class A | | | — | @ | |
Payable for Sub Transfer Agency Fees — Class L | | | — | @ | |
Payable for Transfer Agency Fees — Class I | | | 1 | | |
Payable for Transfer Agency Fees — Class A | | | — | @ | |
Payable for Transfer Agency Fees — Class L | | | — | @ | |
Payable for Transfer Agency Fees — Class C | | | — | @ | |
Payable for Shareholder Services Fees — Class A | | | — | @ | |
Payable for Distribution and Shareholder Services Fees — Class L | | | — | @ | |
Payable for Distribution and Shareholder Services Fees — Class C | | | — | @ | |
Payable for Administration Fees | | | — | @ | |
Other Liabilities | | | 19 | | |
Total Liabilities | | | 281 | | |
Net Assets | | $ | 5,242 | | |
Net Assets Consist Of: | |
Paid-in-Capital | | $ | 41,614 | | |
Accumulated Undistributed Net Investment Income | | | 176 | | |
Accumulated Net Realized Loss | | | (36,607 | ) | |
Unrealized Appreciation (Depreciation) on: | |
Investments | | | 86 | | |
Futures Contracts | | | (9 | ) | |
Swap Agreements | | | (18 | ) | |
Net Assets | | $ | 5,242 | | |
The accompanying notes are an integral part of the financial statements.
11
Morgan Stanley Institutional Fund Trust
Annual Report — September 30, 2015
Core Fixed Income Portfolio
Statement of Assets and Liabilities (cont'd) | | September 30, 2015
(000) | |
CLASS I: | |
Net Assets | | $ | 4,790 | | |
| Shares Outstanding (unlimited number of shares authorized, no par value) (not in 000's) | | | 481,118 | | |
Net Asset Value, Offering and Redemption Price Per Share | | $ | 9.96 | | |
CLASS A: | |
Net Assets | | $ | 329 | | |
| Shares Outstanding (unlimited number of shares authorized, no par value) (not in 000's) | | | 32,817 | | |
Net Asset Value, Redemption Price Per Share | | $ | 10.01 | | |
Maximum Sales Load | | | 4.25 | % | |
Maximum Sales Charge | | $ | 0.44 | | |
Maximum Offering Price Per Share | | $ | 10.45 | | |
CLASS L: | |
Net Assets | | $ | 49 | | |
| Shares Outstanding (unlimited number of shares authorized, no par value) (not in 000's) | | | 4,904 | | |
Net Asset Value, Offering and Redemption Price Per Share | | $ | 9.99 | | |
CLASS C: | |
Net Assets | | $ | 74 | | |
| Shares Outstanding (unlimited number of shares authorized, no par value) (not in 000's) | | | 7,404 | | |
Net Asset Value, Offering and Redemption Price Per Share | | $ | 9.97 | | |
(1) Including:
Securities on Loan, at Value: | | $ | 514 | | |
@ Amount is less than $500.
The accompanying notes are an integral part of the financial statements.
12
Morgan Stanley Institutional Fund Trust
Annual Report — September 30, 2015
Core Fixed Income Portfolio
Statement of Operations | | Year Ended
September 30, 2015
(000) | |
Investment Income: | |
Interest from Securities of Unaffiliated Issuers | | $ | 376 | | |
Income from Securities Loaned — Net | | | 2 | | |
Dividends from Security of Affiliated Issuer (Note G) | | | 1 | | |
Total Investment Income | | | 379 | | |
Expenses: | |
Professional Fees | | | 113 | | |
Advisory Fees (Note B) | | | 47 | | |
Registration Fees | | | 41 | | |
Custodian Fees (Note F) | | | 29 | | |
Pricing Fees | | | 11 | | |
Administration Fees (Note C) | | | 10 | | |
Shareholder Reporting Fees | | | 9 | | |
Transfer Agency Fees — Class I (Note E) | | | 3 | | |
Transfer Agency Fees — Class A (Note E) | | | 2 | | |
Transfer Agency Fees — Class L (Note E) | | | 2 | | |
Transfer Agency Fees — Class C (Note E) | | | 1 | | |
Shareholder Services Fees — Class A (Note D) | | | 1 | | |
Distribution and Shareholder Services Fees — Class L (Note D) | | | — | @ | |
Distribution and Shareholder Services Fees — Class C (Note D) | | | — | @ | |
Trustees' Fees and Expenses | | | 1 | | |
Sub Transfer Agency Fees — Class A | | | — | @ | |
Sub Transfer Agency Fees — Class L | | | — | @ | |
Other Expenses | | | 7 | | |
Total Expenses | | | 277 | | |
Expenses Reimbursed by Adviser (Note B) | | | (169 | ) | |
Waiver of Advisory Fees (Note B) | | | (47 | ) | |
Reimbursement of Class Specific Expenses — Class A (Note B) | | | (2 | ) | |
Reimbursement of Class Specific Expenses — Class L (Note B) | | | (2 | ) | |
Reimbursement of Class Specific Expenses — Class C (Note B) | | | (1 | ) | |
Rebate from Morgan Stanley Affiliate (Note G) | | | (1 | ) | |
Net Expenses | | | 55 | | |
Net Investment Income | | | 324 | | |
Realized Gain (Loss): | |
Investments Sold | | | 237 | | |
Futures Contracts | | | (12 | ) | |
Swap Agreements | | | (78 | ) | |
Net Realized Gain | | | 147 | | |
Change in Unrealized Appreciation (Depreciation): | |
Investments | | | (326 | ) | |
Futures Contracts | | | (7 | ) | |
Swap Agreements | | | (31 | ) | |
Net Change in Unrealized Appreciation (Depreciation) | | | (364 | ) | |
Net Realized Gain and Change in Unrealized Appreciation (Depreciation) | | | (217 | ) | |
Net Increase in Net Assets Resulting from Operations | | $ | 107 | | |
@ Amount is less than $500.
The accompanying notes are an integral part of the financial statements.
13
Morgan Stanley Institutional Fund Trust
Annual Report — September 30, 2015
Core Fixed Income Portfolio
Statements of Changes in Net Assets | | Year Ended
September 30, 2015
(000) | | Year Ended
September 30,
2014
(000) | |
Increase (Decrease) in Net Assets: | |
Operations: | |
Net Investment Income | | $ | 324 | | | $ | 1,046 | | |
Net Realized Gain | | | 147 | | | | 891 | | |
Net Change in Unrealized Appreciation (Depreciation) | | | (364 | ) | | | 145 | | |
Net Increase in Net Assets Resulting from Operations | | | 107 | | | | 2,082 | | |
Distributions from and/or in Excess of: | |
Class I: | |
Net Investment Income | | | (497 | ) | | | (1,206 | ) | |
Class A: | |
Net Investment Income | | | (9 | ) | | | (12 | ) | |
Class L: | |
Net Investment Income | | | (1 | ) | | | (— | @) | |
Class C: | |
Net Investment Income | | | (— | @)* | | | — | | |
Total Distributions | | | (507 | ) | | | (1,218 | ) | |
Capital Share Transactions:(1) | |
Class I: | |
Subscribed | | | 319 | | | | 11,931 | | |
Distributions Reinvested | | | 148 | | | | 1,125 | | |
Redeemed | | | (9,639 | ) | | | (48,180 | ) | |
Class A: | |
Subscribed | | | 258 | | | | 100 | | |
Distributions Reinvested | | | 8 | | | | 12 | | |
Redeemed | | | (71 | ) | | | (497 | ) | |
Class L: | |
Subscribed | | | 45 | | | | 33 | | |
Distributions Reinvested | | | 1 | | | | — | @ | |
Redeemed | | | (5 | ) | | | (33 | ) | |
Class C: | |
Subscribed | | | 75 | * | | | — | | |
Distributions Reinvested | | | — | @* | | | — | | |
Net Decrease in Net Assets Resulting from Capital Share Transactions | | | (8,861 | ) | | | (35,509 | ) | |
Total Decrease in Net Assets | | | (9,261 | ) | | | (34,645 | ) | |
Net Assets: | |
Beginning of Period | | | 14,503 | | | | 49,148 | | |
End of Period (Including Accumulated Undistributed Net Investment Income of $176 and $356) | | $ | 5,242 | | | $ | 14,503 | | |
(1) Capital Share Transactions: | |
Class I: | |
Shares Subscribed | | | 31 | | | | 1,176 | | |
Shares Issued on Distributions Reinvested | | | 15 | | | | 113 | | |
Shares Redeemed | | | (972 | ) | | | (4,736 | ) | |
Net Decrease in Class I Shares Outstanding | | | (926 | ) | | | (3,447 | ) | |
Class A: | |
Shares Subscribed | | | 25 | | | | 11 | | |
Shares Issued on Distributions Reinvested | | | 1 | | | | 1 | | |
Shares Redeemed | | | (7 | ) | | | (49 | ) | |
Net Increase (Decrease) in Class A Shares Outstanding | | | 19 | | | | (37 | ) | |
Class L: | |
Shares Subscribed | | | 4 | | | | 3 | | |
Shares Issued on Distributions Reinvested | | | — | @@ | | | — | @@ | |
Shares Redeemed | | | (— | @@) | | | (3 | ) | |
Net Increase (Decrease) in Class L Shares Outstanding | | | 4 | | | | (— | @@) | |
Class C: | |
Shares Subscribed | | | 7 | * | | | — | | |
Shares Issued on Distributions Reinvested | | | — | @@* | | | — | | |
Net Increase in Class C Shares Outstanding | | | 7 | * | | | — | | |
* For the period April 30, 2015 through September 30, 2015.
@ Amount is less than $500.
@@ Amount is less than 500 shares.
The accompanying notes are an integral part of the financial statements.
14
Morgan Stanley Institutional Fund Trust
Annual Report — September 30, 2015
Financial Highlights
Core Fixed Income Portfolio
| | | Class I | |
| | | Year Ended September 30, | |
Selected Per Share Data and Ratios | | 2015 | | 2014 | | 2013 | | 2012 | | 2011 | |
Net Asset Value, Beginning of Period | | $ | 10.20 | | | $ | 10.02 | | | $ | 10.50 | | | $ | 10.08 | | | $ | 9.96 | | |
Income (Loss) from Investment Operations: | |
Net Investment Income† | | | 0.26 | | | | 0.28 | | | | 0.26 | | | | 0.29 | | | | 0.34 | | |
Net Realized and Unrealized Gain (Loss) | | | (0.15 | ) | | | 0.21 | | | | (0.42 | ) | | | 0.48 | | | | 0.08 | | |
Total from Investment Operations | | | 0.11 | | | | 0.49 | | | | (0.16 | ) | | | 0.77 | | | | 0.42 | | |
Distributions from and/or in Excess of: | |
Net Investment Income | | | (0.35 | ) | | | (0.31 | ) | | | (0.32 | ) | | | (0.35 | ) | | | (0.30 | ) | |
Net Asset Value, End of Period | | $ | 9.96 | | | $ | 10.20 | | | $ | 10.02 | | | $ | 10.50 | | | $ | 10.08 | | |
Total Return++ | | | 1.12 | % | | | 4.97 | % | | | (1.57 | )% | | | 7.83 | % | | | 4.34 | % | |
Ratios and Supplemental Data: | |
Net Assets, End of Period (Thousands) | | $ | 4,790 | | | $ | 14,350 | | | $ | 48,620 | | | $ | 57,013 | | | $ | 63,866 | | |
Ratio of Expenses to Average Net Assets (1) | | | 0.43 | %+ | | | 0.49 | %+ | | | 0.49 | %+ | | | 0.49 | %+ | | | 0.50 | %+ | |
Ratio of Net Investment Income to Average Net Assets (1) | | | 2.59 | %+ | | | 2.81 | %+ | | | 2.57 | %+ | | | 2.80 | %+ | | | 3.43 | %+ | |
Ratio of Rebate from Morgan Stanley Affiliates to Average Net Assets | | | 0.01 | % | | | 0.01 | % | | | 0.01 | % | | | 0.01 | % | | | 0.00 | %§ | |
Portfolio Turnover Rate | | | 104 | % | | | 172 | % | | | 187 | % | | | 216 | % | | | 234 | % | |
(1) Supplemental Information on the Ratios to Average Net Assets: | |
Ratios Before Expense Limitation: | |
Expenses to Average Net Assets | | | 2.15 | % | | | 1.47 | % | | | 1.16 | % | | | 0.97 | % | | | 0.99 | % | |
Net Investment Income to Average Net Assets | | | 0.87 | % | | | 1.83 | % | | | 1.90 | % | | | 2.32 | % | | | 2.94 | % | |
† Per share amount is based on average shares outstanding.
++ Calculated based on the net asset value as of the last business day of the period.
+ The Ratios of Expenses and Net Investment Income reflect the rebate of certain Portfolio expenses in connection with the investments in Morgan Stanley affiliates during the period. The effect of the rebate on the ratios is disclosed in the above table as "Ratio of Rebate from Morgan Stanley Affiliates to Average Net Assets."
§ Amount is less than 0.005%.
The accompanying notes are an integral part of the financial statements.
15
Morgan Stanley Institutional Fund Trust
Annual Report — September 30, 2015
Financial Highlights
Core Fixed Income Portfolio
| | | Class A | |
| | | Year Ended September 30, | |
Selected Per Share Data and Ratios | | 2015 | | 2014 | | 2013 | | 2012 | | 2011 | |
Net Asset Value, Beginning of Period | | $ | 10.27 | | | $ | 10.07 | | | $ | 10.56 | | | $ | 10.14 | | | $ | 10.01 | | |
Income (Loss) from Investment Operations: | |
Net Investment Income† | | | 0.21 | | | | 0.25 | | | | 0.24 | | | | 0.23 | | | | 0.31 | | |
Net Realized and Unrealized Gain (Loss) | | | (0.15 | ) | | | 0.21 | | | | (0.43 | ) | | | 0.52 | | | | 0.09 | | |
Total from Investment Operations | | | 0.06 | | | | 0.46 | | | | (0.19 | ) | | | 0.75 | | | | 0.40 | | |
Distributions from and/or in Excess of: | |
Net Investment Income | | | (0.32 | ) | | | (0.26 | ) | | | (0.30 | ) | | | (0.33 | ) | | | (0.27 | ) | |
Net Asset Value, End of Period | | $ | 10.01 | | | $ | 10.27 | | | $ | 10.07 | | | $ | 10.56 | | | $ | 10.14 | | |
Total Return++ | | | 0.58 | % | | | 4.61 | % | | | (1.89 | )% | | | 7.55 | % | | | 4.11 | % | |
Ratios and Supplemental Data: | |
Net Assets, End of Period (Thousands) | | $ | 329 | | | $ | 143 | | | $ | 518 | | | $ | 330 | | | $ | 44 | | |
Ratio of Expenses to Average Net Assets (1) | | | 0.84 | %+ | | | 0.84 | %+ | | | 0.75 | %+^ | | | 0.74 | %+ | | | 0.75 | %+ | |
Ratio of Net Investment Income to Average Net Assets (1) | | | 2.08 | %+ | | | 2.46 | %+ | | | 2.32 | %+^ | | | 2.25 | %+ | | | 3.18 | %+ | |
Ratio of Rebate from Morgan Stanley Affiliates to Average Net Assets | | | 0.01 | % | | | 0.01 | % | | | 0.01 | % | | | 0.01 | % | | | 0.00 | %§ | |
Portfolio Turnover Rate | | | 104 | % | | | 172 | % | | | 187 | % | | | 216 | % | | | 234 | % | |
(1) Supplemental Information on the Ratios to Average Net Assets: | |
Ratios Before Expense Limitation: | |
Expenses to Average Net Assets | | | 3.23 | % | | | 2.15 | % | | | 1.44 | % | | | 1.33 | % | | | 1.24 | % | |
Net Investment Income (Loss) to Average Net Assets | | | (0.31 | )% | | | 1.15 | % | | | 1.63 | % | | | 1.66 | % | | | 2.69 | % | |
† Per share amount is based on average shares outstanding.
++ Calculated based on the net asset value which does not reflect sales charges, if applicable, as of the last business day of the period.
+ The Ratios of Expenses and Net Investment Income reflect the rebate of certain Portfolio expenses in connection with the investments in Morgan Stanley affiliates during the period. The effect of the rebate on the ratios is disclosed in the above table as "Ratio of Rebate from Morgan Stanley Affiliates to Average Net Assets."
^ Effective September 16, 2013, the Adviser has agreed to limit the ratio of expenses to average net assets to the maximum ratio of 0.85% for Class A shares. Prior to September 16, 2013, the maximum ratio was 0.75% for Class A shares.
§ Amount is less than 0.005%.
The accompanying notes are an integral part of the financial statements.
16
Morgan Stanley Institutional Fund Trust
Annual Report — September 30, 2015
Financial Highlights
Core Fixed Income Portfolio
| | | Class L | |
| | | Year Ended September 30, | | Period from
April 27, 2012^ to | |
Selected Per Share Data and Ratios | | 2015 | | 2014 | | 2013 | | September 30, 2012 | |
Net Asset Value, Beginning of Period | | $ | 10.24 | | | $ | 10.07 | | | $ | 10.55 | | | $ | 10.29 | | |
Income (Loss) from Investment Operations: | |
Net Investment Income† | | | 0.18 | | | | 0.22 | | | | 0.27 | | | | 0.06 | | |
Net Realized and Unrealized Gain (Loss) | | | (0.15 | ) | | | 0.21 | | | | (0.48 | ) | | | 0.27 | | |
Total from Investment Operations | | | 0.03 | | | | 0.43 | | | | (0.21 | ) | | | 0.33 | | |
Distributions from and/or in Excess of: | |
Net Investment Income | | | (0.28 | ) | | | (0.26 | ) | | | (0.27 | ) | | | (0.07 | ) | |
Net Asset Value, End of Period | | $ | 9.99 | | | $ | 10.24 | | | $ | 10.07 | | | $ | 10.55 | | |
Total Return++ | | | 0.31 | % | | | 4.34 | % | | | (2.05 | )% | | | 3.23 | %# | |
Ratios and Supplemental Data: | |
Net Assets, End of Period (Thousands) | | $ | 49 | | | $ | 10 | | | $ | 10 | | | $ | 10 | | |
Ratio of Expenses to Average Net Assets (1) | | | 1.09 | %+ | | | 1.09 | %+ | | | 1.00 | %+^^ | | | 0.99 | %+* | |
Ratio of Net Investment Income to Average Net Assets (1) | | | 1.76 | %+ | | | 2.21 | %+ | | | 2.41 | %+^^ | | | 1.45 | %+* | |
Ratio of Rebate from Morgan Stanley Affiliates to Average Net Assets | | | 0.01 | % | | | 0.01 | % | | | 0.01 | % | | | 0.01 | %* | |
Portfolio Turnover Rate | | | 104 | % | | | 172 | % | | | 187 | % | | | 216 | %# | |
(1) Supplemental Information on the Ratios to Average Net Assets: | |
Ratios Before Expense Limitation: | |
Expenses to Average Net Assets | | | 7.59 | % | | | 14.10 | % | | | 2.21 | % | | | 1.58 | %* | |
Net Investment Income (Loss) to Average Net Assets | | | (4.74 | )% | | | (10.80 | )% | | | 1.20 | % | | | 0.86 | %* | |
^ Commencement of Operations.
† Per share amount is based on average shares outstanding.
++ Calculated based on the net asset value as of the last business day of the period.
+ The Ratios of Expenses and Net Investment Income reflect the rebate of certain Portfolio expenses in connection with the investments in Morgan Stanley affiliates during the period. The effect of the rebate on the ratios is disclosed in the above table as "Ratio of Rebate from Morgan Stanley Affiliates to Average Net Assets."
^^ Effective September 16, 2013, the Adviser has agreed to limit the ratio of expenses to average net assets to the maximum ratio of 1.10% for Class L shares. Prior to September 16, 2013, the maximum ratio was 1.00% for Class L shares.
# Not Annualized.
* Annualized.
The accompanying notes are an integral part of the financial statements.
17
Morgan Stanley Institutional Fund Trust
Annual Report — September 30, 2015
Financial Highlights
Core Fixed Income Portfolio
| | | Class C | |
Selected Per Share Data and Ratios | | Period from
April 30, 2015^ to
September 30, 2015 | |
Net Asset Value, Beginning of Period | | $ | 10.22 | | |
Income (Loss) from Investment Operations: | |
Net Investment Income† | | | 0.03 | | |
Net Realized and Unrealized Loss | | | (0.22 | ) | |
Total from Investment Operations | | | (0.19 | ) | |
Distributions from and/or in Excess of: | |
Net Investment Income | | | (0.06 | ) | |
Net Asset Value, End of Period | | $ | 9.97 | | |
Total Return++ | | | (1.84 | )%# | |
Ratios and Supplemental Data: | |
Net Assets, End of Period, (Thousands) | | $ | 74 | | |
Ratios of Expenses to Average Net Assets (1) | | | 1.59 | %+* | |
Ratio of Net Investment Income to Average Net Assets(1) | | | 0.70 | %+* | |
Ratio of Rebate from Morgan Stanley Affiliates to Average Net Assets | | | 0.01 | %* | |
Portfolio Turnover Rate | | | 104 | %# | |
(1) Supplemental Information on the Ratios to Average Net Assets: | |
Ratios Before Expense Limitation: | |
Expense to Average Net Assets | | | 5.48 | %* | |
Net Investment Loss to Average Net Assets | | | (3.19 | )%* | |
^ Commencement of Operations.
† Per share amount is based on average shares outstanding.
++ Calculated based on the net asset value which does not reflect sales charges, if applicable, as of the last business day of the period.
+ The Ratios of Expenses and Net Investment Income reflect the rebate of certain Portfolio expenses in connection with the investments in Morgan Stanley affiliates during the period. The effect of the rebate on the ratios is disclosed in the above table as "Ratio of Rebate from Morgan Stanley Affiliates to Average Net Assets."
# Not Annualized.
* Annualized.
The accompanying notes are an integral part of the financial statements.
18
Morgan Stanley Institutional Fund Trust
Annual Report — September 30, 2015
Notes to Financial Statements
Morgan Stanley Institutional Fund Trust (''MSIFT" or the "Fund'') is registered under the Investment Company Act of 1940, as amended (the "Act''), as an open-end management investment company. The Fund is comprised of nine separate, active portfolios (individually referred to as a "Portfolio", collectively as the "Portfolios"). The Fund applies investment company accounting and reporting guidance. All Portfolios are considered diversified for purposes of the Act.
The accompanying financial statements relate to the Core Fixed Income Portfolio. The Portfolio seeks above-average total return over a market cycle of three to five years. The Portfolio offers four classes of shares — Class I, Class A, Class L and Class C.
On April 30, 2015, the Portfolio commenced offering Class C shares.
A. Significant Accounting Policies: The following significant accounting policies are in conformity with U.S. generally accepted accounting principles ("GAAP"). Such policies are consistently followed by the Fund in the preparation of its financial statements. GAAP may require management to make estimates and assumptions that affect the reported amounts and disclosures in the financial statements. Actual results may differ from those estimates.
1. Security Valuation: (1) Certain portfolio securities may be valued by an outside pricing service approved by the Fund's Board of Trustees (the "Trustees"). The pricing service may utilize a matrix system or other model incorporating attributes such as security quality, maturity and coupon as the evaluation model parameters, and/or research evaluations by its staff, including review of broker-dealer market price quotations in determining what it believes is the fair valuation of the portfolios securities valued by such pricing service; (2) futures are valued at the latest price published by the commodities exchange on which they trade; (3) swaps are marked-to-market daily based upon quotations from market makers; (4) when market quotations are not readily available, including circumstances under which Morgan Stanley Investment Management Inc. (the "Adviser") determines that the closing price, last sale price or the mean between the last reported bid and asked prices are not reflective of a security's market value, portfolio securities are valued at their fair value as determined in good faith under procedures established by and under the general supervision of the
Trustees. Occasionally, developments affecting the closing prices of securities and other assets may occur between the times at which valuations of such securities are determined (that is, close of the foreign market on which the securities trade) and the close of business of the New York Stock Exchange ("NYSE"). If developments occur during such periods that are expected to materially affect the value of such securities, such valuations may be adjusted to reflect the estimated fair value of such securities as of the close of the NYSE, as determined in good faith by the Trustees or by the Adviser using a pricing service and/or procedures approved by the Trustees; (5) investments in mutual funds, including the Morgan Stanley Institutional Liquidity Funds, are valued at the net asset value ("NAV") as of the close of each business day; and (6) short-term taxable debt securities with remaining maturities of 60 days or less at the time of purchase may be valued at amortized cost, unless the Adviser determines such price does not reflect the securities' market value, in which case these securities will be valued at their fair market value determined by the Adviser. Other taxable short-term debt securities with maturities of more than 60 days will be valued on a mark-to-market basis until such time as they reach a maturity of 60 days, whereupon they will be valued at amortized cost using their value on the 61st day unless the Adviser determines such price does not reflect the securities' fair value, in which case these securities will be valued at their fair market value as determined by the Adviser.
The Trustees have responsibility for determining in good faith the fair value of the investments, and the Trustees may appoint others, such as the Fund's Adviser or a valuation committee, to assist the Trustees in determining fair value and to make the actual calculations pursuant to the fair valuation methodologies previously approved by the Trustees. Under procedures approved by the Trustees, the Fund's Adviser has formed a Valuation Committee whose members are approved by the Trustees. The Valuation Committee provides administration and oversight of the Fund's valuation policies and procedures, which are reviewed at least annually by the Trustees. These procedures allow the Fund to utilize independent pricing services, quotations from securities and financial instrument dealers, and other market sources to determine fair value.
19
Morgan Stanley Institutional Fund Trust
Annual Report — September 30, 2015
Notes to Financial Statements (cont'd)
The Fund has procedures to determine the fair value of securities and other financial instruments for which market prices are not readily available. Under these procedures, the Valuation Committee convenes on a regular and ad hoc basis to review such securities and considers a number of factors, including valuation methodologies and significant unobservable valuation inputs, when arriving at fair value. The Valuation Committee may employ a market-based approach which may use related or comparable assets or liabilities, recent transactions, market multiples, book values, and other relevant information for the investment to determine the fair value of the investment. An income-based valuation approach may also be used in which the anticipated future cash flows of the investment are discounted to calculate fair value. Discounts may also be applied due to the nature or duration of any restrictions on the disposition of the investments. Due to the inherent uncertainty of valuations of such investments, the fair values may differ significantly from the values that would have been used had an active market existed. The Valuation Committee employs various methods for calibrating these valuation approaches including a regular review of valuation methodologies, key inputs and assumptions, transactional back-testing or disposition analysis, and reviews of any related market activity.
2. Fair Value Measurement: Financial Accounting Standards Board ("FASB") Accounting Standards CodificationTM ("ASC") 820, "Fair Value Measurement" ("ASC 820"), defines fair value as the value that the Fund would receive to sell an investment or pay to transfer a liability in a timely transaction with an independent buyer in the principal market, or in the absence of a principal market the most advantageous market for the investment or liability. ASC 820 establishes a three-tier hierarchy to distinguish between (1) inputs that reflect the assumptions market participants would use in valuing an asset or liability developed based on market data obtained from sources independent of the reporting entity (observable inputs) and (2) inputs that reflect the reporting entity's own assumptions about the assumptions market participants would use in valuing an asset or liability developed based on the best information available in the circumstances (unobservable inputs) and to establish classification of fair value measurements for disclosure purposes. Various inputs are used in determining the value of the Fund's
investments. The inputs are summarized in the three broad levels listed below.
• Level 1 – unadjusted quoted prices in active markets for identical investments
• Level 2 – other significant observable inputs (including quoted prices for similar investments, interest rates, prepayment speeds, credit risk, etc.)
• Level 3 – significant unobservable inputs including the Fund's own assumptions in determining the fair value of investments. Factors considered in making this determination may include, but are not limited to, information obtained by contacting the issuer, analysts, or the appropriate stock exchange (for exchange-traded securities), analysis of the issuer's financial statements or other available documents and, if necessary, available information concerning other securities in similar circumstances
The inputs or methodology used for valuing securities are not necessarily an indication of the risk associated with investing in those securities and the determination of the significance of a particular input to the fair value measurement in its entirety requires judgment and considers factors specific to each security.
The following is a summary of the inputs used to value the Portfolio's investments as of September 30, 2015.
Investment Type | | Level 1
Unadjusted
quoted
prices
(000) | | Level 2
Other
significant
observable
inputs
(000) | | Level 3
Significant
unobservable
inputs
(000) | | Total
(000) | |
Assets: | |
Fixed Income Securities | |
Agency Fixed Rate
Mortgages | | $ | — | | | $ | 998 | | | $ | — | | | $ | 998 | | |
Asset-Backed Security | | | — | | | | 202 | | | | — | | | | 202 | | |
Collateralized Mortgage
Obligations — Agency
Collateral Series | | | — | | | | 434 | | | | — | | | | 434 | | |
Corporate Bonds | | | — | | | | 2,212 | | | | — | | | | 2,212 | | |
U.S. Treasury Security | | | — | | | | 193 | | | | — | | | | 193 | | |
Total Fixed Income
Securities | | | — | | | | 4,039 | | | | — | | | | 4,039 | | |
20
Morgan Stanley Institutional Fund Trust
Annual Report — September 30, 2015
Notes to Financial Statements (cont'd)
Investment Type | | Level 1
Unadjusted
quoted
prices
(000) | | Level 2
Other
significant
observable
inputs
(000) | | Level 3
Significant
unobservable
inputs
(000) | | Total
(000) | |
Short-Term Investments | |
Investment Company | | $ | 386 | | | $ | — | | | $ | — | | | $ | 386 | | |
Repurchase Agreements | | | — | | | | 24 | | | | — | | | | 24 | | |
U.S Treasury Securities | | | — | | | | 950 | | | | — | | | | 950 | | |
Total Short-Term
Investments | | | 386 | | | | 974 | | | | — | | | | 1,360 | | |
Futures Contracts | | | 37 | | | | — | | | | — | | | | 37 | | |
Credit Default Swap
Agreement | | | — | | | | — | @ | | | — | | | | — | @ | |
Total Assets | | | 423 | | | | 5,013 | | | | — | | | | 5,436 | | |
Liabilities: | |
Futures Contracts | | | (46 | ) | | | — | | | | — | | | | (46 | ) | |
Credit Default Swap
Agreement | | | — | | | | (9 | ) | | | — | | | | (9 | ) | |
Interest Rate Swap
Agreements | | | — | | | | (9 | ) | | | — | | | | (9 | ) | |
Total Liabilities | | | (46 | ) | | | (18 | ) | | | — | | | | (64 | ) | |
Total | | $ | 377 | | | $ | 4,995 | | | $ | — | | | $ | 5,372 | | |
@ Value is less than $500
Transfers between investment levels may occur as the markets fluctuate and/or the availability of data used in an investment's valuation changes. The Portfolio recognizes transfers between the levels as of the end of the period. As of September 30, 2015, the Portfolio did not have any investments transfer between investment levels.
3. Repurchase Agreements: The Portfolio may enter into repurchase agreements under which the Portfolio lends cash and takes possession of securities with an agreement that the counterparty will repurchase such securities. In connection with transactions in repurchase agreements, a bank as custodian for the Portfolio takes possession of the underlying securities which are held as collateral, with a market value at least equal to the amount of the repurchase transaction, including principal and accrued interest. To the extent that any repurchase transaction exceeds one business day, the value of the collateral is marked-to-market on a daily basis to determine that the value of the collateral does not decrease below the repurchase price plus accrued interest as earned. If such a decrease occurs, additional collateral will be requested and, when received, will be added to the account to maintain full collateralization. In the event of default on the obligation to repurchase, the Portfolio has the right to liquidate the collateral and apply the proceeds in satisfaction of the obligation. In the event of default or bankruptcy by the
counterparty to the agreement, realization of the collateral proceeds may be subject to cost and delays. The Portfolio, along with other affiliated investment companies, may utilize a joint trading account for the purpose of entering into repurchase agreements.
4. Derivatives: The Portfolio may, but is not required to, use derivative instruments for a variety of purposes, including hedging, risk management, portfolio management or to earn income. Derivatives are financial instruments whose value is based, in part, on the value of an underlying asset, interest rate, index or financial instrument. Prevailing interest rates and volatility levels, among other things, also affect the value of derivative instruments. A derivative instrument often has risks similar to its underlying asset and may have additional risks, including imperfect correlation between the value of the derivative and the underlying asset, risks of default by the counterparty to certain transactions, magnification of losses incurred due to changes in the market value of the securities, instruments, indices or interest rates to which the derivative instrument relates, risks that the transactions may not be liquid and risks arising from margin requirements. The use of derivatives involves risks that are different from, and possibly greater than, the risks associated with other portfolio investments. Derivatives may involve the use of highly specialized instruments that require investment techniques and risk analyses different from those associated with other portfolio investments. All of the Portfolio's holdings, including derivative instruments, are marked-to-market each day with the change in value reflected in unrealized appreciation (depreciation). Upon disposition, a realized gain or loss is recognized.
Certain derivative transactions may give rise to a form of leverage. Leverage magnifies the potential for gain and the risk of loss. Leverage associated with derivative transactions may cause the Portfolio to liquidate portfolio positions when it may not be advantageous to do so to satisfy its obligations or to meet earmarking or segregation requirements, pursuant to applicable Securities and Exchange Commission rules and regulations, or may cause the Portfolio to be more volatile than if the Portfolio had not been leveraged. Although the Adviser seeks to use derivatives to further the Portfolio's investment objectives, there is no assurance that the use of derivatives will achieve this result.
21
Morgan Stanley Institutional Fund Trust
Annual Report — September 30, 2015
Notes to Financial Statements (cont'd)
Following is a description of the derivative instruments and techniques that the Portfolio used during the period and their associated risks:
Futures: A futures contract is a standardized, exchange-traded agreement to buy or sell a specific quantity of an underlying asset, reference rate or index at a specific price at a specific future time. The value of a futures contract tends to increase and decrease in tandem with the value of the underlying instrument. Depending on the terms of the particular contract, futures contracts are settled through either physical delivery of the underlying instrument on the settlement date or by payment of a cash settlement amount on the settlement date. During the period the futures contract is open, payments are received from or made to the broker based upon changes in the value of the contract (the variation margin). A decision as to whether, when and how to use futures contracts involves the exercise of skill and judgment and even a well-conceived futures transaction may be unsuccessful because of market behavior or unexpected events. In addition to the derivatives risks discussed above, the prices of futures contracts can be highly volatile, using futures contracts can lower total return, and the potential loss from futures contracts can exceed the Portfolio's initial investment in such contracts. No assurance can be given that a liquid market will exist for any particular futures contract at any particular time. There is also the risk of loss by the Portfolio of margin deposits in the event of bankruptcy of a broker with which the Portfolio has open positions in the futures contract.
Swaps: The Portfolio may enter into over-the-counter ("OTC") swap contracts or cleared swap transactions. A swap contract is an agreement between two parties pursuant to which the parties exchange payments at specified dates on the basis of a specified notional amount, with the payments calculated by reference to specified securities, indices, reference rates, currencies or other instruments. Typically swap agreements provide that when the period payment dates for both parties are the same, the payments are made on a net basis (i.e., the two payment streams are netted out, with only the net amount paid by one party to the other). The Portfolio's obligations or rights under a swap contract entered into on a net basis will generally be equal only to the net amount to be paid or received under the agreement, based on the relative values of the positions held by each party. Cleared swap transactions may help reduce
counterparty credit risk. In a cleared swap, the Portfolio's ultimate counterparty is a clearinghouse rather than a swap dealer, bank or other financial institution. OTC swap agreements are not entered into or traded on exchanges and often there is no central clearing or guaranty function for OTC swaps. These OTC swaps are often subject to credit risk or the risk of default or non-performance by the counterparty. Both OTC and cleared swaps could result in losses if interest rates, foreign currency exchange rates or other factors are not correctly anticipated by the Portfolio or if the reference index, security or investments do not perform as expected. During the period swap agreements are open, payments are received from or made to the clearinghouse or counterparty based upon changes in the value of the contract (variation margin). The Dodd-Frank Wall Street Reform and Consumer Protection Act and related regulatory developments require the clearing and exchange-trading of certain standardized swap transactions. Mandatory exchange-trading and clearing is occurring on a phased-in basis.
The Portfolio's use of swaps during the period included those based on the credit of an underlying security commonly referred to as "credit default swaps." The Portfolio may be either the buyer or seller in a credit default swap. Where the Portfolio is the buyer of a credit default swap contract, it would typically be entitled to receive the par (or other agreed-upon) value of a referenced debt obligation from the counterparty to the contract only in the event of a default or similar event by the issuer of the debt obligation. If no default occurs, the Portfolio would have paid to the counterparty a periodic stream of payments over the term of the contract and received no benefit from the contract. When the Portfolio is the seller of a credit default swap contract, it typically receives the stream of payments but is obligated to pay an amount equal to the par (or other agreed-upon) value of a referenced debt obligation upon the default or similar event by the issuer of the referenced debt obligation. The use of credit default swaps could result in losses to the Portfolio if the Adviser fails to correctly evaluate the creditworthiness of the issuer of the referenced debt obligation.
If the Portfolio is a seller of protection and a credit event occurs, as defined under the terms of that particular swap agreement, the Portfolio will either (i) pay to the buyer of protection an amount equal to the notional
22
Morgan Stanley Institutional Fund Trust
Annual Report — September 30, 2015
Notes to Financial Statements (cont'd)
amount of the swap agreement and take delivery of the referenced obligation, other deliverable obligations or underlying securities comprising the referenced index or (ii) pay a net settlement amount in the form of cash or securities equal to the notional amount of the swap agreement less the recovery value of the referenced obligation or underlying securities comprising the referenced index. If the Portfolio is a buyer of protection and a credit event occurs, as defined under the terms of that particular swap agreement, the Portfolio will either (i) receive from the seller of protection an amount equal to the notional amount of the swap agreement and deliver the referenced obligation, other deliverable obligations or underlying securities comprising the referenced index or (ii) receive a net settlement amount in the form of cash or securities equal to the notional amount of the swap agreement less the recovery value of the referenced obligation or underlying securities comprising the referenced index. Recovery values are estimated by market makers considering either industry standard recovery rates or entity specific factors and considerations until a credit event occurs. If a credit event has occurred, the recovery value is determined by a facilitated auction whereby a minimum number of allowable broker bids, together with a specified valuation method, are used to calculate the settlement value. The Portfolio's maximum risk of loss from counterparty risk, either as the protection seller or as the protection buyer, is the fair value of the swap agreement.
The current credit rating of each individual issuer is listed in the table following the Portfolio of Investments and serves as an indicator of the current status of the payment/performance risk of the credit derivative. Alternatively, for credit default swaps on an index of credits, the quoted market prices and current values serve as an indicator of the current status of the payment/performance risk of the credit derivative. Generally, lower credit ratings and increasing market values, in absolute terms, represent a deterioration of the credit and a greater likelihood of an adverse credit event of the issuer.
When the Portfolio has an unrealized loss on a swap agreement, the Portfolio has instructed the custodian to pledge cash or liquid securities as collateral with a value approximately equal to the amount of the unrealized loss. Collateral pledges are monitored and subsequently
adjusted if and when the swap valuations fluctuate. If applicable, cash collateral is included with "Due from (to) Broker" in the Statement of Assets and Liabilities.
Upfront payments received or paid by the Portfolio will be reflected as an asset or liability, respectively, in the Statement of Assets and Liabilities.
FASB ASC 815, "Derivatives and Hedging" ("ASC 815"), is intended to improve financial reporting about derivative instruments by requiring enhanced disclosures to enable investors to better understand how and why the Portfolio uses derivative instruments, how these derivative instruments are accounted for and their effects on the Portfolio's financial position and results of operations.
The following tables set forth the fair value of the Portfolio's derivative contracts by primary risk exposure as of September 30, 2015.
| | | Asset Derivatives
Statement of Assets and
Liabilities Location | | Primary Risk
Exposure | | Value
(000) | |
Futures Contracts
| | Variation Margin on
Futures Contracts | |
Interest Rate Risk | | $ | 37 | (a) | |
Swap Agreement
| | Unrealized Appreciation on
Swap Agreement | |
Credit Risk | | | — | @ | |
Total | | | | | | $ | 37 | | |
| | | Liability Derivatives
Statement of Assets and
Liabilities Location | | Primary Risk
Exposure | | Value
(000) | |
Futures Contracts
| | Variation Margin on
Futures Contracts | |
Interest Rate Risk | | $ | (46 | )(a) | |
Swap Agreement
| | Unrealized Depreciation on
Swap Agreement | |
Credit Risk | | | (9 | ) | |
Swap Agreements
| | Variation Margin on
Swap Agreements | |
Interest Rate Risk | | | (9 | )(a) | |
Total | | | | | | $ | (64 | ) | |
(a) This amount represents the cumulative appreciation (depreciation) as reported in the Portfolio of Investments. The Statement of Assets and Liabilities only reflects the current day's net variation margin.
@ Amount is less than $500.
The following tables set forth by primary risk exposure the Portfolio's realized gains (losses) and change in unrealized appreciation (depreciation) by type of derivative contract for the year ended September 30, 2015 in accordance with ASC 815.
Realized Gain (Loss) | |
Primary Risk Exposure | | Derivative Type | | Value
(000) | |
Interest Rate Risk | | Futures Contracts | | $ | (12 | ) | |
Credit Risk | | Swap Agreements | | | (5 | ) | |
Interest Rate Risk | | Swap Agreements | | | (73 | ) | |
| | | Total | | $ | (90 | ) | |
23
Morgan Stanley Institutional Fund Trust
Annual Report — September 30, 2015
Notes to Financial Statements (cont'd)
Change in Unrealized Appreciation (Depreciation) | |
Primary Risk Exposure | | Derivative Type | | Value
(000) | |
Interest Rate Risk | | Futures Contracts | | $ | (7 | ) | |
Credit Risk | | Swap Agreements | | | (3 | ) | |
Interest Rate Risk | | Swap Agreements | | | (28 | ) | |
| | | Total | | $ | (38 | ) | |
At September 30, 2015, the Portfolio's derivative assets and liabilities are as follows:
Gross Amounts of Assets and Liabilities Presented in the
Statement of Assets and Liabilities | |
Derivatives(b) | | Assets(c)
(000) | | Liabilities(c)
(000) | |
Swap Agreements | | $ | — | @ | | $ | (9 | ) | |
(b) Excludes exchange traded derivatives
(c) Absent an event of default or early termination, OTC derivative assets and liabilities are presented gross and not offset in the Statement of Assets and Liabilities.
@ Amount is less than $500.
The Portfolio typically enters into International Swaps and Derivatives Association, Inc. Master Agreements ("ISDA Master Agreements") or similar master agreements (collectively, "Master Agreements") with its contract counterparties for certain OTC derivatives in order to, among other things, reduce its credit risk to counterparties. ISDA Master Agreements include provisions for general obligations, representations, collateral and events of default or termination. Under an ISDA Master Agreement, the Portfolio typically may offset with the counterparty certain OTC derivative financial instruments' payables and/or receivables with collateral held and/or posted and create one single net payment (close-out netting) in the event of default, termination and/or potential deterioration in the credit quality of the counterparty. Various Master Agreements govern the terms of certain transactions with counterparties, including transactions such as swap, forward, repurchase and reverse repurchase agreements. These Master Agreements typically attempt to reduce the counterparty risk associated with such transactions by specifying credit protection mechanisms and providing standardization that improves legal certainty. Cross-termination provisions under Master Agreements typically provide that a default in connection with one transaction between the Portfolio and a counterparty gives the non-defaulting party the right to terminate any other transactions in place with the defaulting party to create one single net payment due to/due from the defaulting party and may be a feature in certain Master Agreements. In the event the Portfolio exercises its right to terminate a Master Agreement after a counterparty experiences a termination event as defined in the Master
Agreement, the return of collateral with market value in excess of the Portfolio's net liability may be delayed or denied.
The following table presents derivative financial instruments that are subject to enforceable netting arrangements as of September 30, 2015.
Gross Amounts Not Offset in the Statement of Assets and Liabilities | |
Counterparty | | Gross Asset
Derivatives
Presented in
Statement of
Assets and
Liabilities
(000) | | Financial
Instrument
(000) | | Collateral
Pledged
(000) | | Net Amount
(not less
than $0)
(000) | |
Barclays Bank PLC | | $ | — | @ | | $ | (— | @) | | $ | — | | | $ | 0 | | |
Gross Amounts Not Offset in the Statement of Assets and Liabilities | |
Counterparty | | Gross Liability
Derivatives
Presented in
Statement of
Assets and
Liabilities
(000) | | Financial
Instrument
(000) | | Collateral
Pledged
(000) | | Net Amount
(not less
than $0)
(000) | |
Barclays Bank PLC | | $ | 9 | | | $ | (— | @) | | $ | — | | | $ | 9 | | |
@ Amount is less than $500.
For the year ended September 30, 2015, the approximate average monthly amount outstanding for each derivative type is as follows:
Futures Contracts: | |
Average monthly original value | | $ | 9,622,000 | | |
Swap Agreements: | |
Average monthly notional amount | | $ | 4,372,000 | | |
5. Securities Lending: The Portfolio lends securities to qualified financial institutions, such as broker-dealers, to earn additional income. Any increase or decrease in the fair value of the securities loaned that might occur and any interest earned or dividends declared on those securities during the term of the loan would remain in the Portfolio. The Portfolio would receive cash or securities as collateral in an amount equal to or exceeding 100% of the current fair value of the loaned securities. The collateral is marked-to-market daily by State Street Bank and Trust Company ("State Street"), the securities lending agent, to ensure that a minimum of 100% collateral coverage is maintained.
Based on pre-established guidelines, the securities lending agent invests any cash collateral that is received in an affiliated money market portfolio and repurchase agreements. Securities lending income is generated from the earnings on the invested collateral and borrowing fees, less any rebates owed to the borrowers and
24
Morgan Stanley Institutional Fund Trust
Annual Report — September 30, 2015
Notes to Financial Statements (cont'd)
compensation to the lending agent, and is recorded as "Income from Securities Loaned-Net" in the Portfolio's Statement of Operations. Risks in securities lending transactions are that a borrower may not provide additional collateral when required or return the securities when due, and that the value of the short-term investments will be less than the amount of cash collateral plus any rebate that is required to be returned to the borrower.
The Portfolio has the right under the lending agreement to recover the securities from the borrower on demand.
The following table presents securities on loan that are subject to enforceable netting arrangements as of September 30, 2015.
Gross Amounts Not Offset in the Statement of Assets and Liabilities | |
Gross Asset Amounts
Presented in Statement
of Assets and Liabilities
(000) | | Financial
Instrument
(000) | | Collateral
Received
(000) | | Net Amount
(not less
than $0)
(000) | |
| $ | 514 | (d) | | $ | — | | | $ | (514 | )(e)(f) | | $ | 0 | | |
(d) Represents market value of loaned securities at period end.
(e) The Portfolio received cash collateral of approximately $205,000, of which approximately $192,000 was subsequently invested in Repurchase Agreements and Morgan Stanley Institutional Liquidity Funds as reported in the Portfolio of Investments. As of September 30, 2015, there was uninvested cash of approximately $13,000, which is not reflected in the Portfolio of Investments. In addition, the Portfolio received non-cash collateral of approximately $323,000 in the form of U.S. Government agency securities and U.S. Government obligations, which the Portfolio cannot sell or repledge, and accordingly are not reflected in the Portfolio of Investments.
(f) The actual collateral received is greater than the amount shown here due to overcollateralization.
6. Indemnifications: The Fund enters into contracts that contain a variety of indemnifications. The Fund's maximum exposure under these arrangements is unknown. However, the Fund has not had prior claims or losses pursuant to these contracts and expects the risk of loss to be remote.
7. Dividends and Distributions to Shareholders: Dividend income and distributions to shareholders are recorded on the ex-dividend date. Dividends from net investment income, if any, are declared and paid quarterly. Net realized capital gains, if any, are distributed at least annually.
8. Security Transactions, Income and Expenses: Security transactions are accounted for on the trade date (date the order to buy or sell is executed). Realized gains and losses on the sale of investment securities are determined on the specific identified cost method. Dividend
income and other distributions are recorded on the ex-dividend date (except for certain foreign dividends which may be recorded as soon as the Portfolio is informed of such dividends) net of applicable withholding taxes. Interest income is recognized on the accrual basis except where collection is in doubt. Discounts are accreted and premiums are amortized over the life of the respective securities. Most expenses of the Fund can be directly attributed to a particular Portfolio. Expenses which cannot be directly attributed are apportioned among the Portfolios based upon relative net assets or other appropriate methods. Income, expenses (other than class specific expenses -distribution and shareholder services, transfer agency and sub transfer agency fees) and realized and unrealized gains or losses are allocated to each class of shares based upon their relative net assets.
B. Advisory Fees: The Adviser, a wholly-owned subsidiary of Morgan Stanley, provides the Portfolio with advisory services under the terms of an Investment Advisory Agreement, paid quarterly, at an annual rate of 0.375% of the daily net assets of the Portfolio.
The Adviser has agreed to reduce its advisory fee and/or reimburse the Portfolio so that total annual portfolio operating expenses, excluding certain investment related expenses, taxes, interest and other extraordinary expenses (including litigation), will not exceed 0.50% for Class I shares, 0.85% for Class A shares, 1.10% for Class L shares and 1.60% for Class C shares. The fee waivers and/or expense reimbursements will continue for at least one year from the date of the Portfolio's prospectus or until such time that the Trustees act to discontinue all or a portion of such waivers and/or reimbursements when they deem such action is appropriate. For the year ended September 30, 2015, approximately $47,000 of advisory fees were waived and approximately $174,000 of other expenses were reimbursed by the Adviser pursuant to this arrangement.
C. Administration Fees: The Adviser also serves as Administrator to the Fund and provides administrative services pursuant to an Administration Agreement for an annual fee, accrued daily and paid monthly, of 0.08% of the Portfolio's average daily net assets. Under a Sub-Administration Agreement between the Administrator and State Street, State Street provides certain administrative services to the Fund. For such services, the Administrator pays State Street a portion of the fee the Administrator receives from the Portfolio.
25
Morgan Stanley Institutional Fund Trust
Annual Report — September 30, 2015
Notes to Financial Statements (cont'd)
D. Distribution and Shareholder Services Fees: Morgan Stanley Distribution, Inc. ("MSDI" or the "Distributor"), a wholly-owned subsidiary of the Adviser, and an indirect subsidiary of Morgan Stanley, serves as the Fund's Distributor of Portfolio shares pursuant to a Distribution Agreement. The Fund has adopted a Shareholder Services Plan with respect to Class A shares pursuant to Rule 12b-1 under the Act. Under the Shareholder Services Plan, the Portfolio pays the Distributor a shareholder services fee, accrued daily and paid monthly, at an annual rate of 0.25% of the Portfolio's average daily net assets attributable to Class A shares.
The Fund has adopted a Distribution and Shareholder Services Plan with respect to Class L shares pursuant to Rule 12b-1 under the Act. Under the Distribution and Shareholder Services Plan, the Portfolio pays the Distributor a distribution fee, accrued daily and paid monthly, at an annual rate of 0.25% and a shareholder services fee, accrued daily and paid monthly, at an annual rate of 0.25% of the Portfolio's average daily net assets attributable to Class L shares.
The Fund has adopted a Distribution and Shareholder Services Plan with respect to Class C shares pursuant to Rule 12b-1 under the Act. Under the Distribution and Shareholder Services Plan, the Portfolio pays the Distributor a distribution fee, accrued daily and paid monthly, at an annual rate of 0.75% and a shareholder services fee, accrued daily and paid monthly, at an annual rate of 0.25% of the Portfolio's average daily net assets attributable to Class C shares.
The distribution and shareholder services fees are used to support the expenses associated with servicing and maintaining accounts. The Distributor may compensate other parties for providing shareholder support services to investors who purchase Class A, Class L and Class C shares.
E. Dividend Disbursing and Transfer Agent: The Fund's dividend disbursing and transfer agent is Boston Financial Data Services, Inc. ("BFDS"). Pursuant to a Transfer Agency Agreement, the Fund pays BFDS a fee based on the number of classes, accounts and transactions relating to the Portfolios of the Fund.
F. Custodian Fees: State Street (the "Custodian") serves as Custodian for the Fund in accordance with a Custodian Agreement. The Custodian holds cash, securities, and other assets of the Fund as required by the Act. Custody fees are payable monthly based on assets held in custody, investment purchases and sales activity and account maintenance fees, plus reimbursement for certain out-of-pocket expenses.
G. Security Transactions and Transactions with Affiliates: For the year ended September 30, 2015, purchases and sales of investment securities for the Portfolio, other than long-term U.S. Government securities and short-term investments, were approximately $2,601,000 and $5,402,000, respectively. For the year ended September 30, 2015, purchases and sales of long-term U.S. Government securities were approximately $8,965,000 and $14,807,000, respectively.
The Portfolio invests in the Institutional Class of the Morgan Stanley Institutional Liquidity Funds — Money Market Portfolio (the "Liquidity Funds"), an open-end management investment company managed by the Adviser, both directly and as a portion of the securities held as collateral on loaned securities. Advisory fees paid by the Portfolio are reduced by an amount equal to its pro-rata share of the advisory and administration fees paid by the Portfolio due to its investment in the Liquidity Funds. For the year ended September 30, 2015, advisory fees paid were reduced by approximately $1,000 relating to the Portfolio's investment in the Liquidity Funds.
A summary of the Portfolio's transactions in shares of the Liquidity Funds during the year ended September 30, 2015 is as follows:
Value
September 30,
2014
(000) | | Purchases
at Cost
(000) | | Sales
(000) | | Dividend
Income
(000) | | Value
September 30,
2015
(000) | |
| $ | 1,889 | | | $ | 12,105 | | | $ | 13,608 | | | $ | 1 | | | $ | 386 | | |
The Portfolio has an unfunded Deferred Compensation Plan (the "Compensation Plan"), which allows each independent Trustee to defer payment of all, or a portion, of the fees he or she receives for serving on the Board of Trustees. Each eligible Trustee generally may elect to have the deferred amounts credited with a return equal to the total return on one or more of the Morgan Stanley funds that are offered as investment options under the Compensation Plan. Appreciation/depreciation and distributions received from these investments are recorded with an offsetting increase/decrease in the deferred compensation obligation and do not affect the NAV of the Portfolio.
H. Federal Income Taxes: It is the Portfolio's intention to continue to qualify as a regulated investment company and distribute all of its taxable and tax-exempt income. Accordingly, no provision for Federal income taxes is required in the financial statements.
The Portfolio may be subject to taxes imposed by countries in which it invests. Such taxes are generally based on income and/or capital gains earned or repatriated. Taxes are accrued
26
Morgan Stanley Institutional Fund Trust
Annual Report — September 30, 2015
Notes to Financial Statements (cont'd)
based on net investment income, net realized gains and net unrealized appreciation as such income and/or gains are earned. Taxes may also be based on transactions in foreign currency and are accrued based on the value of investments denominated in such currency.
FASB ASC 740-10, "Income Taxes — Overall", sets forth a minimum threshold for financial statement recognition of the benefit of a tax position taken or expected to be taken in a tax return. Management has concluded there are no significant uncertain tax positions that would require recognition in the financial statements. If applicable, the Portfolio recognizes interest accrued related to unrecognized tax benefits in "Interest Expense" and penalties in "Other Expenses" in the Statement of Operations. The Portfolio files tax returns with the U.S. Internal Revenue Service, New York and various states. Each of the tax years in the four-year period ended September 30, 2015, remains subject to examination by taxing authorities.
The tax character of distributions paid may differ from the character of distributions shown in the Statements of Changes in Net Assets due to short-term capital gains being treated as ordinary income for tax purposes. The tax character of distributions paid during fiscal years 2015 and 2014 was as follows:
2015 Distributions
Paid From:
Ordinary Income
(000) | | 2014 Distributions
Paid From:
Ordinary Income
(000) | |
| $ | 507 | | | $ | 1,218 | | |
The amount and character of income and gains to be distributed are determined in accordance with income tax regulations which may differ from GAAP. These book/tax differences are either considered temporary or permanent in nature.
Temporary differences are attributable to differing book and tax treatments for the timing of the recognition of gains (losses) on certain investment transactions and the timing of the deductibility of certain expenses.
Permanent differences, primarily due to basis adjustments for swap transactions and paydown adjustments, resulted in the following reclassifications among the components of net assets at September 30, 2015:
Accumulated
Undistributed
Net Investment
Income
(000) | | Accumulated
Net Realized
Loss
(000) | | Paid-in-
Capital
(000) | |
| $ | 3 | | | $ | (3 | ) | | $ | — | | |
At September 30, 2015, the components of distributable earnings for the Portfolio on a tax basis were as follows:
Undistributed
Ordinary
Income
(000) | | Undistributed
Long-Term
Capital Gain
(000) | |
| $ | 168 | | | $ | — | | |
At September 30, 2015, the Portfolio had available for Federal income tax purposes unused capital losses, which will expire on the indicated dates:
Amount
(000) | | Expiration | |
| $ | 33,234 | | | September 30, 2017 | |
| | 3,319 | | | September 30, 2018 | |
To the extent that capital loss carryforwards are used to offset any future capital gains realized during the carryover period as provided by U.S. Federal income tax regulations, no capital gains tax liability will be incurred by the Portfolio for gains realized and not distributed. To the extent that capital gains are offset, such gains will not be distributed to the shareholders. During the year ended September 30, 2015, the Portfolio utilized capital loss carryforwards for U.S. Federal income tax purposes of approximately $195,000.
Capital losses and specified ordinary losses, including currency losses, incurred after October 31 but within the taxable year are deemed to arise on the first day of the Portfolio's next taxable year. For the year ended September 30, 2015, the Portfolio deferred to October 1, 2015 for U.S. Federal income tax purposes the following losses:
Post-October
Currency And
Specified Ordinary
Losses
(000) | | Post-October
Capital Losses
(000) | |
| $ | — | | | $ | 63 | | |
I. Other: At September 30, 2015, the Portfolio had otherwise unaffiliated record owners of 10% or greater. Investment activities of these shareholders could have a material impact on the Portfolio. The aggregate percentage of such owners was 87.5%.
27
Morgan Stanley Institutional Fund Trust
Annual Report — September 30, 2015
Report of Independent Registered Public Accounting Firm
To the Shareholders and Board of Trustees of
Morgan Stanley Institutional Fund Trust —
Core Fixed Income Portfolio
We have audited the accompanying statement of assets and liabilities, including the portfolio of investments, of Core Fixed Income Portfolio (one of the portfolios constituting Morgan Stanley Institutional Fund Trust) (the "Portfolio") as of September 30, 2015, and the related statement of operations for the year then ended, the statements of changes in net assets for each of the two years in the period then ended and the financial highlights for each of the years or periods indicated therein. These financial statements and financial highlights are the responsibility of the Portfolio's management. Our responsibility is to express an opinion on these financial statements and financial highlights based on our audits.
We conducted our audits in accordance with the standards of the Public Company Accounting Oversight Board (United States). Those standards require that we plan and perform the audit to obtain reasonable assurance about whether the financial statements and financial highlights are free of material misstatement. We were not engaged to perform an audit of the Portfolio's internal control over financial reporting. Our audits included consideration of internal control over financial reporting as a basis for designing audit procedures that are appropriate in the circumstances, but not for the purpose of expressing an opinion on the effectiveness of the Portfolio's internal control over financial reporting. Accordingly, we express no such opinion. An audit also includes examining, on a test basis, evidence supporting the amounts and disclosures in the financial statements and financial highlights, assessing the accounting principles used and significant estimates made by management, and evaluating the overall financial statement presentation. Our procedures included confirmation of securities owned as of September 30, 2015, by correspondence with the custodian and others or by other appropriate auditing procedures where replies from others were not received. We believe that our audits provide a reasonable basis for our opinion.
In our opinion, the financial statements and financial highlights referred to above present fairly, in all material respects, the financial position of Core Fixed Income Portfolio (one of the portfolios constituting Morgan Stanley Institutional Fund Trust) at September 30, 2015, the results of its operations for the year then ended, the changes in its net assets for each of the two years in the period then ended and the financial highlights for each of the years or periods indicated therein, in conformity with U.S. generally accepted accounting principles.

Boston, Massachusetts
November 25, 2015
28
Morgan Stanley Institutional Fund Trust
Annual Report — September 30, 2015
Investment Advisory Agreement Approval (unaudited)
Nature, Extent and Quality of Services
The Board reviewed and considered the nature and extent of the investment advisory services provided by the Adviser (as defined herein) under the advisory agreement, including portfolio management, investment research and equity and fixed income securities trading. The Board also reviewed and considered the nature and extent of the non-advisory, administrative services provided by the Adviser under the administration agreement, including accounting, operations, clerical, bookkeeping, compliance, business management and planning, legal services and the provision of supplies, office space and utilities at the Adviser's expense. The Board also considered the Adviser's investment in personnel and infrastructure that benefits the Portfolio. (The advisory and administration agreements together are referred to as the "Management Agreement.") The Board also considered that the Adviser serves a variety of other investment advisory clients and has experience overseeing service providers. The Board also compared the nature of the services provided by the Adviser with similar services provided by non-affiliated advisers as reported to the Board by Lipper, Inc. ("Lipper").
The Board reviewed and considered the qualifications of the portfolio managers, the senior administrative managers and other key personnel of the Adviser who provide the administrative and advisory services to the Portfolio. The Board determined that the Adviser's portfolio managers and key personnel are well qualified by education and/or training and experience to perform the services in an efficient and professional manner. The Board concluded that the nature and extent of the advisory and administrative services provided were necessary and appropriate for the conduct of the business and investment activities of the Portfolio and supported its decision to approve the Management Agreement.
Performance, Fees and Expenses of the Portfolio
The Board reviewed the performance, fees and expenses of the Portfolio compared to its peers, as determined by Lipper, and to appropriate benchmarks where applicable. The Board discussed with the Adviser the performance goals and the actual results achieved in managing the Portfolio. When considering a fund's performance, the Board and the Adviser place emphasis on trends and longer-term returns (focusing on one-year, three-year and five-year performance, as of December 31, 2014, or since inception, as applicable). When a fund underperforms its benchmark and/or its peer group average, the Board and the Adviser discuss the causes of such underperformance and, where necessary, they discuss specific changes to investment strategy or investment personnel. The Board noted that the Portfolio's performance was better than its peer group average for the one-, three- and five-year periods. The Board discussed with the Adviser the level of the advisory and administration fees (together, the "management fee") for this Portfolio relative to comparable funds and/or other accounts advised by the Adviser and/or compared to its peers as determined by Lipper. In addition to the management fee, the Board also reviewed the Portfolio's total expense ratio. The Board noted that the Portfolio's management fee and total expense ratio were lower than its peer group average. After discussion, the Board concluded that the Portfolio's (i) performance was competitive with its peer group average; and (ii) management fee and total expense ratio were competitive with its peer group averages.
Economies of Scale
The Board considered the size and growth prospects of the Portfolio and how that relates to the Portfolio's total expense ratio and particularly the Portfolio's management fee rate, which does not include breakpoints. In conjunction with its review of the Adviser's profitability, the Board discussed with the Adviser how a change in assets can affect the efficiency or effectiveness of managing the Portfolio and whether the management fee level is appropriate relative to current and projected asset levels and/or whether the management fee structure reflects economies of scale as asset levels change. The Board has determined that its review of the actual and/or potential economies of scale of the Portfolio supports its decision to approve the Management Agreement.
Profitability of the Adviser and Affiliates
The Board considered information concerning the costs incurred and profits realized by the Adviser and its affiliates during the last year from their relationship with the Portfolio and during the last two years from their relationship with the Morgan Stanley Fund Complex and reviewed with the Adviser the cost allocation methodology used to determine the profitability of the Adviser and affiliates. The Board has determined that its review of the analysis of the Adviser's expenses and profitability supports its decision to approve the Management Agreement.
29
Morgan Stanley Institutional Fund Trust
Annual Report — September 30, 2015
Investment Advisory Agreement Approval (unaudited) (cont'd)
Other Benefits of the Relationship
The Board considered other direct and indirect benefits to the Adviser and/or its affiliates derived from their relationship with the Portfolio and other funds advised by the Adviser. These benefits may include, among other things, fees for trading, distribution and/or shareholder servicing and for transaction processing and reporting platforms used by securities lending agents, and research received by the Adviser generated from commission dollars spent on funds' portfolio trading. The Board reviewed with the Adviser these arrangements and the reasonableness of the Adviser's costs relative to the services performed. The Board has determined that its review of the other benefits received by the Adviser or its affiliates supports its decision to approve the Management Agreement.
Resources of the Adviser and Historical Relationship Between the Portfolio and the Adviser
The Board considered whether the Adviser is financially sound and has the resources necessary to perform its obligations under the Management Agreement. The Board also reviewed and considered the historical relationship between the Portfolio and the Adviser, including the organizational structure of the Adviser, the policies and procedures formulated and adopted by the Adviser for managing the Portfolio's operations and the Board's confidence in the competence and integrity of the senior managers and key personnel of the Adviser. The Board concluded that the Adviser has the financial resources necessary to fulfill its obligations under the Management Agreement and that it is beneficial for the Portfolio to continue its relationship with the Adviser.
Other Factors and Current Trends
The Board considered the controls and procedures adopted and implemented by the Adviser and monitored by the Fund's Chief Compliance Officer and concluded that the conduct of business by the Adviser indicates a good faith effort on its part to adhere to high ethical standards in the conduct of the Portfolio's business.
General Conclusion
After considering and weighing all of the above factors, with various written materials and verbal information presented by the Adviser, the Board concluded that it would be in the best interest of the Portfolio and its shareholders to approve renewal of the Management Agreement for another year. In reaching this conclusion the Board did not give particular weight to any single piece of information or factor referenced above. The Board considered these factors and information over the course of the year and in numerous meetings, some of which were in executive session with only the independent Board members and their counsel present. It is possible that individual Board members may have weighed these factors, and the information presented, differently in reaching their individual decisions to approve the Management Agreement.
30
Morgan Stanley Institutional Fund Trust
Annual Report — September 30, 2015
U.S. Privacy Policy (unaudited)
AN IMPORTANT NOTICE CONCERNING OUR U.S. PRIVACY POLICY
This privacy notice describes the U.S. privacy policy of Morgan Stanley Distribution, Inc., and the Morgan Stanley family of mutual funds ("us", "our", "we").
We are required by federal law to provide you with notice of our U.S. privacy policy ("Policy"). This Policy applies to both our current and former clients unless we state otherwise and is intended for individual clients who purchase products or receive services from us for personal, family or household purposes. This Policy is not applicable to partnerships, corporations, trusts or other non-individual clients or account holders, nor is this Policy applicable to individuals who are either beneficiaries of a trust for which we serve as trustee or participants in an employee benefit plan administered or advised by us. This Policy is, however, applicable to individuals who select us to be a custodian of securities or assets in individual retirement accounts, 401(k) accounts, or accounts subject to the Uniform Gifts to Minors Act.
This notice sets out our business practices to protect your privacy; how we collect and share personal information about you; and how you can limit our sharing or certain uses by others of this information. We may amend this Policy at any time, and will inform you of any changes to our Policy as required by law.
WE RESPECT YOUR PRIVACY
We appreciate that you have provided us with your personal financial information and understand your concerns about your information. We strive to safeguard the information our clients entrust to us. Protecting the confidentiality and security of client information is an important part of how we conduct our business.
This notice describes what personal information we collect about you, how we collect it, when we may share it with others, and how certain others may use it. It discusses the steps you may take to limit our sharing of certain information about you with our affiliated companies, including, but not limited to our affiliated banking businesses, brokerage firms and credit service affiliates. It also discloses how you may limit our affiliates' use of shared information for marketing purposes.
Throughout this Policy, we refer to the nonpublic information that personally identifies you as "personal information." We also use the term "affiliated company" in this notice. An affiliated company is a company in our family of companies and includes companies with the Morgan Stanley name. These affiliated companies are financial institutions such as broker-dealers, banks, investment advisers and credit card issuers. We refer to any company that is not an affiliated company as a nonaffiliated third party. For purposes of Section 5 of this notice, and your ability to limit certain uses of personal information by our affiliates, this notice applies to the use of personal information by our affiliated companies.
1. WHAT PERSONAL INFORMATION DO WE COLLECT FROM YOU?
We may collect the following types of information about you: (i) information provided by you, including information from applications and other forms we receive from you, (ii) information about your transactions with us or our affiliates, (iii) information about your transactions with nonaffiliated third parties, (iv) information from consumer reporting agencies, (v) information obtained from our websites, and (vi) information obtained from other sources. For example:
• We collect information such as your name, address, e-mail address, telephone/fax numbers, assets, income and investment objectives through applications and other forms you submit to us.
• We may obtain information about account balances, your use of account(s) and the types of products and services you prefer to receive from us through your dealings and transactions with us and other sources.
• We may obtain information about your creditworthiness and credit history from consumer reporting agencies.
• We may collect background information from and through third-party vendors to verify representations you have made and to comply with various regulatory requirements.
2. WHEN DO WE DISCLOSE PERSONAL INFORMATION WE COLLECT ABOUT YOU?
We may disclose personal information we collect about you in each of the categories listed above to affiliated and nonaffiliated third parties.
31
Morgan Stanley Institutional Fund Trust
Annual Report — September 30, 2015
U.S. Privacy Policy (unaudited) (cont'd)
a. Information We Disclose to Affiliated Companies.
We may disclose personal information that we collect about you to our affiliated companies to manage your account(s) effectively, to service and process your transactions, and to let you know about products and services offered by us and affiliated companies, to manage our business, and as otherwise required or permitted by law. Offers for products and services from affiliated companies are developed under conditions designed to safeguard your personal information.
b. Information We Disclose to Third Parties.
We may disclose personal information that we collect about you to nonaffiliated third parties to provide marketing services on our behalf or to other financial institutions with whom we have joint marketing agreements. We may also disclose all of the information we collect to other nonaffiliated third parties for our everyday business purposes, such as to process transactions, maintain account(s), respond to court orders and legal investigations, report to credit bureaus, offer our own products and services, protect against fraud, for institutional risk control, to perform services on our behalf, and as otherwise required or permitted by law.
When we share personal information about you with a nonaffiliated third party, they are required to limit their use of personal information about you to the particular purpose for which it was shared and they are not allowed to share personal information about you with others except to fulfill that limited purpose or as may be permitted or required by law.
3. HOW DO WE PROTECT THE SECURITY AND CONFIDENTIALITY OF PERSONAL INFORMATION WE COLLECT ABOUT YOU?
We maintain physical, electronic and procedural security measures that comply with applicable law and regulations to help safeguard the personal information we collect about you. We have internal policies governing the proper handling of client information by employees. Third parties that provide support or marketing services on our behalf may also receive personal information about you, and we require them to adhere to appropriate security standards with respect to such information.
4. HOW CAN YOU LIMIT OUR SHARING CERTAIN PERSONAL INFORMATION ABOUT YOU WITH OUR AFFILIATED COMPANIES FOR ELIGIBILITY DETERMINATION?
By following the opt-out procedures in Section 6 below, you may limit the extent to which we share with our affiliated companies, personal information that was collected to determine your eligibility for products and services such as your credit reports and other information that you have provided to us or that we may obtain from third parties ("eligibility information"). Eligibility information does not include your identification information or personal information pertaining to our transactions or experiences with you. Please note that, even if you direct us not to share eligibility information with our affiliated companies, we may still share your personal information, including eligibility information, with our affiliated companies under circumstances that are permitted under applicable law, such as to process transactions or to service your account.
5. HOW CAN YOU LIMIT THE USE OF CERTAIN PERSONAL INFORMATION ABOUT YOU BY OUR AFFILIATED COMPANIES FOR MARKETING?
By following the opt-out instructions in Section 6 below, you may limit our affiliated companies from marketing their products or services to you based on personal information we disclose to them. This information may include, for example, your income and account history with us. Please note that, even if you choose to limit our affiliated companies from using personal information about you that we may share with them for marketing their products and services to you, our affiliated companies may use your personal information that they obtain from us to market to you in circumstances permitted by law, such as if the affiliated party has its own relationship with you.
32
Morgan Stanley Institutional Fund Trust
Annual Report — September 30, 2015
U.S. Privacy Policy (unaudited) (cont'd)
6. HOW CAN YOU SEND US AN OPT-OUT INSTRUCTION?
If you wish to limit our sharing of eligibility information about you with our affiliated companies, or our affiliated companies' use of personal information for marketing purposes, as described in this notice, you may do so by:
• Calling us at (800) 548-7786
Monday–Friday between 8a.m. and 6p.m. (EST)
• Writing to us at the following address:
Boston Financial Data Services, Inc.
c/o Privacy Coordinator
P.O. Box 219804
Kansas City, Missouri 64121
If you choose to write to us, your request should include: your name, address, telephone number and account number(s) to which the opt-out applies and whether you are opting out with respect to sharing of eligibility information (Section 4 above), or information used for marketing (Section 5 above), or both. Written opt-out requests should not be sent with any other correspondence. In order to process your request, we require that the request be provided by you directly and not through a third party. Once you have informed us about your privacy preferences, your opt-out preference will remain in effect with respect to this Policy (as it may be amended) until you notify us otherwise. If you are a joint account owner, we will accept instructions from any one of you and apply those instructions to the entire account.
Please understand that if you limit our sharing or our affiliated companies' use of personal information, you and any joint account holder(s) may not receive information about our affiliated companies' products and services, including products or services that could help you manage your financial resources and achieve your investment objectives.
If you have more than one account or relationship with us, please specify the accounts to which you would like us to apply your privacy choices. If you have accounts or relationships with our affiliates, you may receive multiple privacy policies from them, and will need to separately notify those companies of your privacy choices for those accounts or relationships.
7. WHAT IF AN AFFILIATED COMPANY BECOMES A NONAFFILIATED THIRD PARTY?
If, at any time in the future, an affiliated company becomes a nonaffiliated third party, further disclosures of personal information made to the former affiliated company will be limited to those described in Section 2(b) above relating to nonaffiliated third parties. If you elected under Section 6 to limit disclosures we make to affiliated companies, or use of personal information by affiliated companies, your election will not apply to use by any former affiliated company of your personal information in their possession once it becomes a nonaffiliated third party.
SPECIAL NOTICE TO RESIDENTS OF VERMONT
The following section supplements our Policy with respect to our individual clients who have a Vermont address and supersedes anything to the contrary in the above Policy with respect to those clients only.
The State of Vermont requires financial institutions to obtain your consent prior to sharing personal information that they collect about you with nonaffiliated third parties, or eligibility information with affiliated companies, other than in certain limited circumstances. Except as permitted by law, we will not share personal information we collect about you with nonaffiliated third parties or eligibility information with affiliated companies, unless you provide us with your written consent to share such information.
SPECIAL NOTICE TO RESIDENTS OF CALIFORNIA
The following section supplements our Policy with respect to our individual clients who have a California address and supersedes anything to the contrary in the above Policy with respect to those clients only.
In response to a California law, if your account has a California home address, your personal information will not be disclosed to nonaffiliated third parties except as permitted by applicable California law, and we will limit sharing such personal information with our affiliates to comply with California privacy laws that apply to us.
33
Morgan Stanley Institutional Fund Trust
Annual Report — September 30, 2015
Trustee and Officer Information (unaudited)
Independent Trustees:
Name, Age and Address of
Independent Trustee | | Positions(s)
Held with
Registrant | | Length of Time
Served* | | Principal Occupation(s) During Past 5 Years
and Other Relevant Professional Experience | | Number of
Portfolios in
Fund Complex
Overseen by
Trustee** | | Other Directorships
Held by Independent
Trustee*** | |
Frank L. Bowman (70)
c/o Kramer Levin Naftalis & Frankel LLP
Counsel to the Independent Trustees
1177 Avenue of the Americas
New York, NY 10036 | | Trustee | | Since
August
2006 | | President, Strategic Decisions, LLC (consulting) (since February 2009); Director or Trustee of various Morgan Stanley Funds (since August 2006); Chairperson of the Compliance and Insurance Committee (since October 2015); Chairperson of the Insurance Sub-Committee of the Compliance and Insurance Committee (since February 2007); served as President and Chief Executive Officer of the Nuclear Energy Institute (policy organization) (February 2005-November 2008); retired as Admiral, U.S. Navy after serving over 38 years on active duty including 8 years as Director of the Naval Nuclear Propulsion Program in the Department of the Navy and the U.S. Department of Energy (1996-2004); served as Chief of Naval Personnel (July 1994-September 1996); and on the Joint Staff as Director of Political Military Affairs (June 1992-July1994); knighted as Honorary Knight Commander of the Most Excellent Order of the British Empire; awarded the Officier de l'Orde National du Mérite by the French Government; elected to the National Academy of Engineering (2009). | | | 96 | | | Director of BP p.l.c.; Director of Naval and Nuclear Technologies LLP; Director Emeritus of the Armed Services YMCA of the USA; Director of the U.S. Naval Submarine League; Member of the National Security Advisory Council of the Center for U.S. Global Engagement and a member of the CNA Military Advisory Board; Chairman of the Charity J Street Cup Golf ; Trustee of Fairhaven United Methodist Church. | |
Kathleen A. Dennis (62)
c/o Kramer Levin Naftalis & Frankel LLP
Counsel to the Independent Trustees
1177 Avenue of the Americas
New York, NY 10036 | | Trustee | | Since
August
2006 | | President, Cedarwood Associates (mutual fund and investment management consulting) (since July 2006); Chairperson of the Money Market and Alternatives Sub-Committee of the Investment Committee (since October2006) and Director or Trustee of various Morgan Stanley Funds (since August 2006); formerly, Senior Managing Director of Victory Capital Management (1993-2006). | | | 96 | | | Director of various nonprofit organizations. | |
Nancy C. Everett (60)
c/o Kramer Levin Naftalis & Frankel LLP
Counsel to the Independent Trustees
1177 Avenue of the Americas
New York, NY 10036 | | Trustee | | Since
January
2015 | | Owner, OBIR, LLC (institutional investment management consulting) (since June 2014); formerly, Managing Director, BlackRock, Inc. (February 2011-December 2013); and Chief Executive Officer, General Motors Asset Management (a/k/a Promark Global Advisors, Inc.) (June 2005-May 2010). | | | 96 | | | Member of Virginia Commonwealth University Board of Visitors; Member of Virginia Commonwealth University School of Business Foundation; formerly, Member of Committee on Directors for Emerging Markets Growth Fund, Inc. (2007-2010); Chairperson of Performance Equity Management, LLC (2006-2010); and Chairperson, GMAM Absolute Return Strategies Fund, LLC (2006-2010). | |
34
Morgan Stanley Institutional Fund Trust
Annual Report — September 30, 2015
Trustee and Officer Information (unaudited) (cont'd)
Independent Trustees: (cont'd)
Name, Age and Address of
Independent Trustee | | Positions(s)
Held with
Registrant | | Length of Time
Served* | | Principal Occupation(s) During Past 5 Years
and Other Relevant Professional Experience | | Number of
Portfolios in
Fund Complex
Overseen by
Trustee** | | Other Directorships
Held by Independent
Trustee*** | |
Jakki L. Haussler (58)
c/o Kramer Levin Naftalis & Frankel LLP
Counsel to the Independent Trustees
1177 Avenue of the Americas
New York, NY 10036 | | Trustee | | Since
January
2015 | | Chairman and Chief Executive Officer, Opus Capital Group (since January 1996); and formerly, Director, Capvest Venture Fund, LP (May 2000-December 2011); Partner, Adena Ventures, LP (July 1999-December 2010); Director, The Victory Funds (February 2005-July 2008). | | | 96 | | | Director of Cincinnati Bell Inc. and Member, Audit Committee and Compensation Committee; Director of Northern Kentucky University Foundation and Member, Investment Committee; Member of Chase College of Law Transactional Law Practice Center Board of Advisors; Director of Best Transport; Member, University of Cincinnati Foundation Investment Committee; formerly, Member, Miami University Board of Visitors (2008-2011); Trustee of Victory Funds (2005-2008) and Chairman, Investment Committee (2007-2008) and Member, Service Provider Committee (2005-2008). | |
Dr. Manuel H. Johnson (66)
c/o Johnson Smick International, Inc.
220 I Street, N.E. —
Suite 200
Washington, D.C. 20002 | | Trustee | | Since
July
1991 | | Senior Partner, Johnson Smick International, Inc. (consulting firm); Chairperson of the Investment Committee (since October 2006) and Director or Trustee of various Morgan Stanley Funds (since July 1991); Co-Chairman and a founder of the Group of Seven Council (G7C) (international economic commission); formerly Chairperson of the Audit Committee (July 1991-September 2006), Vice Chairman of the Board of Governors of the Federal Reserve System and Assistant Secretary of the U.S. Treasury. | | | 98 | | | Director of NVR, Inc. (home construction). | |
Joseph J. Kearns (73)
c/o Kearns & Associates LLC
23823 Malibu Road
S-50-440
Malibu, CA 90265 | | Trustee | | Since
August
1994 | | President, Kearns & Associates LLC (investment consulting); Chairperson of the Audit Committee (since October 2006) and Director or Trustee of various Morgan Stanley Funds (since August 1994); formerly, Deputy Chairperson of the Audit Committee (July 2003-September 2006) and Chairperson of the Audit Committee of various Morgan Stanley Funds (since August 1994); CFO of the J. Paul Getty Trust. | | | 99 | | | Director of Electro Rent Corporation (equipment leasing). Prior to December 31, 2013, Director of The Ford Family Foundation. | |
35
Morgan Stanley Institutional Fund Trust
Annual Report — September 30, 2015
Trustee and Officer Information (unaudited) (cont'd)
Independent Trustees: (cont'd)
Name, Age and Address of
Independent Trustee | | Positions(s)
Held with
Registrant | | Length of Time
Served* | | Principal Occupation(s) During Past 5 Years
and Other Relevant Professional Experience | | Number of
Portfolios in
Fund Complex
Overseen by
Trustee** | | Other Directorships
Held by Independent
Trustee*** | |
Michael F. Klein (56)
c/o Kramer Levin Naftalis & Frankel LLP
Counsel to the Independent Trustees
1177 Avenue of the Americas
New York, NY 10036 | | Trustee | | Since
August
2006 | | Managing Director, Aetos Capital, LLC (since March 2000); Co-President, Aetos Alternatives Management, LLC (since January 2004); and Co-Chief Executive Officer of Aetos Capital LLC (since August 2013); Chairperson of the Fixed Income Sub-Committee of the Investment Committee (since October 2006) and Director or Trustee of various Morgan Stanley Funds (since August 2006); formerly, Managing Director, Morgan Stanley & Co. Inc. and Morgan Stanley Dean Witter Investment Management, President, various Morgan Stanley Funds (June1998-March 2000) and Principal, Morgan Stanley & Co. Inc. and Morgan Stanley Dean Witter Investment Management (August 1997-December 1999). | | | 96 | | | Director of certain investment funds managed or sponsored by Aetos Capital, LLC. Director of Sanitized AG and Sanitized Marketing AG (specialty chemicals). | |
Michael E. Nugent (79)
522 Fifth Avenue
New York, NY 10036 | | Chair of the
Board and
Trustee | | Chair of the Boards since
July 2006 and
Trustee since
July 1991 | | Chair of the Boards of various Morgan Stanley Funds (since July 2006); Chairperson of the Closed-End Fund Committee (since June 2012) and Director or Trustee of various Morgan Stanley Funds (since July 1991); formerly, Chairperson of the Insurance Committee (until July 2006), General Partner, Triumph Capital, L.P. (private investment partnership) (1988-2013). | | | 98 | | | None. | |
W. Allen Reed (68)
c/o Kramer Levin Naftalis & Frankel LLP
Counsel to the Independent Trustees
1177 Avenue of the Americas
New York, NY 10036 | | Trustee | | Since
August
2006 | | Chairperson of the Equity Sub-Committee of the Investment Committee (since October 2006) and Director or Trustee of various Morgan Stanley Funds (since August 2006); formerly, President and CEO of General Motors Asset Management; Chairman and Chief Executive Officer of the GM Trust Bank and Corporate Vice President of General Motors Corporation (August 1994-December 2005). | | | 96 | | | Director of Temple-Inland Industries (packaging and forest products); Director of Legg Mason, Inc. and Director of the Auburn University Foundation. | |
Fergus Reid (83)
c/o Joe Pietryka, Inc.
85 Charles Colman Blvd.
Pawling, NY 12564 | | Trustee | | Since
June
1992 | | Chairman, Joe Pietryka, Inc.; Chairperson of the Governance Committee and Director or Trustee of various Morgan Stanley Funds (since June 1992). | | | 99 | | | Formerly, Trustee and Director of certain investment companies in the JP Morgan Fund Complex managed by JP Morgan Investment Management Inc. (1987-December 2012). | |
36
Morgan Stanley Institutional Fund Trust
Annual Report — September 30, 2015
Trustee and Officer Information (unaudited) (cont'd)
Interested Trustee:
Name, Age and Address of
Interested Trustee | | Positions(s) Held
with Registrant | | Length of Time
Served* | | Principal Occupation(s) During Past 5 Years | | Number of
Portfolios in
Fund Complex
Overseen by
Interested
Trustee** | | Other Directorships
Held by Interested
Trustee*** | |
James F. Higgins (67)
One New York Plaza,
New York, NY 10004 | | Trustee | | Since
June
2000 | | Director or Trustee of various Morgan Stanley Funds (since June 2000); Senior Advisor of Morgan Stanley (since August 2000). | | | 97 | | | Formerly, Director of AXA Financial, Inc. and AXA Equitable Life Insurance Company (2002-2011) and Director of AXA MONY Life Insurance Company and AXA MONY Life Insurance Company of America (2004-2011). | |
* This is the earliest date the Trustee began serving the Morgan Stanley Funds. Each Trustee serves an indefinite term, until his or her successor is elected.
** The Fund Complex includes (as of December 31, 2014) all open-end and closed-end funds (including all of their portfolios) advised by Morgan Stanley Investment Management Inc. (the "Adviser") and any funds that have an adviser that is an affiliated person of the Adviser (including, but not limited to, Morgan Stanley AIP GP LP).
*** This includes any directorships at public companies and registered investment companies held by the Trustee at any time during the past five years.
37
Morgan Stanley Institutional Fund Trust
Annual Report — September 30, 2015
Trustee and Officer Information (unaudited) (cont'd)
Executive Officers:
Name, Age and Address of Executive Officer | | Position(s) Held
with
Registrant | | Length of Time
Served* | | Principal Occupation(s) During Past 5 Years | |
John H. Gernon (52)
522 Fifth Avenue
New York, NY 10036 | | President and Principal Executive Officer | | Since
September
2013 | | President and Principal Executive Officer of the Equity and Fixed Income Funds and the Morgan Stanley AIP Funds (since September 2013) and the Liquidity Funds and various money market funds (since May 2014) in the Fund Complex, Managing Director of the Adviser; Head of Product (since 2006) and Global Portfolio Analysis and Reporting (since 2012); for MSIM's Long Only business. | |
Stefanie V. Chang Yu (48)
522 Fifth Avenue
New York, NY 10036 | | Chief
Compliance
Officer | | Since
December
1997 | | Managing Director of the Adviser and various entities affiliated with the Adviser; Chief Compliance Officer of various Morgan Stanley Funds and the Adviser (since January 2014); formerly, Vice President of various Morgan Stanley Funds (December 1997-January 2014). | |
Joseph C. Benedetti (50)
522 Fifth Avenue
New York, NY 10036 | | Vice President | | Since
January
2014 | | Managing Director of the Adviser and various entities affiliated with the Adviser; Vice President of various Morgan Stanley Funds (since January 2014); formerly, Assistant Secretary of various Morgan Stanley Funds (October 2004-January 2014). | |
Francis J. Smith (50)
522 Fifth Avenue
New York, NY 10036 | | Treasurer and
Principal
Financial
Officer | | Treasurer
since July
2003 and
Principal
Financial
Officer since
September
2002 | | Executive Director of the Adviser and various entities affiliated with the Adviser; Treasurer (since July 2003) and Principal Financial Officer of various Morgan Stanley Funds (since September 2002). | |
Mary E. Mullin (48)
522 Fifth Avenue
New York, NY 10036 | | Secretary | | Since
June
1999 | | Executive Director of the Adviser and various entities affiliated with the Adviser; Secretary of various Morgan Stanley Funds (since June 1999). | |
* This is the earliest date the officer began serving the Morgan Stanley Funds. Each officer serves a one-year term, until his or her successor is elected and has qualified.
38
Morgan Stanley Institutional Fund Trust
Annual Report — September 30, 2015
Adviser and Administrator
Morgan Stanley Investment Management Inc.
522 Fifth Avenue
New York, New York 10036
Distributor
Morgan Stanley Distribution, Inc.
522 Fifth Avenue
New York, New York 10036
Dividend Disbursing and Transfer Agent
Boston Financial Data Services, Inc.
2000 Crown Colony Drive
Quincy, Massachusetts 02169
Custodian
State Street Bank and Trust Company
One Lincoln Street
Boston, Massachusetts 02111
Legal Counsel
Dechert LLP
1095 Avenue of the Americas
New York, New York 10036
Counsel to the Independent Trustees
Kramer Levin Naftalis & Frankel LLP
1177 Avenue of the Americas
New York, New York 10036
Independent Registered Public Accounting Firm
Ernst & Young LLP
200 Clarendon Street
Boston, Massachusetts 02116
Reporting to Shareholders
Each Morgan Stanley fund provides a complete schedule of portfolio holdings in its semi-annual and annual reports within 60 days of the end of the fund's second and fourth fiscal quarters. The semi-annual and annual reports are filed electronically with the Securities and Exchange Commission (SEC) on Form N-CSRS and Form N-CSR, respectively. Morgan Stanley also delivers the semi-annual and annual reports to fund shareholders and makes these reports available on its public website, www.morganstanley.com/im. Each Morgan Stanley fund also files a complete schedule of portfolio holdings with the SEC for the fund's first and third fiscal quarters on Form N-Q. Morgan Stanley does not deliver the reports for the first and third fiscal quarters to shareholders, nor are the reports posted to the Morgan Stanley public website. You may, however, obtain the Form N-Q filings (as well as the Form N-CSR and N-CSRS filings) by accessing the SEC's website, www.sec.gov. You may also review and copy them at the SEC's Public Reference Room in Washington, DC. Information on the operation of the SEC's Public Reference Room may be obtained by calling the SEC toll free at 1 (800) SEC-0330. You can also request copies of these materials, upon payment of a duplicating fee, by electronic request at the SEC's email address (publicinfo@sec.gov) or by writing the Public Reference Room of the SEC, Washington, DC 20549-0102.
Proxy Voting Policies and Procedures and Proxy Voting Record
You may obtain a copy of the Fund's Proxy Voting Policy and Procedures and information regarding how the Fund voted proxies relating to portfolio securities during the most recent twelve-month period ended June 30, without charge, upon request, by calling toll free 1 (800) 548-7786 or by visiting our website at www.morganstanley.com/im. This information is also available on the SEC's website at www.sec.gov.
This report is authorized for distribution only when preceded or accompanied by a prospectus of the Morgan Stanley Institutional Fund Trust, which describes in detail each Portfolio's investment policies, risks, fees and expenses. Please read the prospectus carefully before you invest or send money. For additional information, including information regarding the investments comprising the Portfolio, please visit our website at www.morganstanley.com/im or call toll free 1 (800) 548-7786.
39
(This Page has been left blank intentionally.)
Printed in U.S.A.
This Report has been prepared for shareholders and may be distributed to others only if preceded or accompanied by a current prospectus.
Morgan Stanley Investment Management Inc.
522 Fifth Avenue
New York, New York 10036
© 2015 Morgan Stanley. Morgan Stanley Distribution, Inc.

IFTFXDINCANN
1333135 EXP 11.30.16

Morgan Stanley Institutional Fund Trust
Core Plus Fixed Income Portfolio
Annual Report
September 30, 2015

Morgan Stanley Institutional Fund Trust
Annual Report — September 30, 2015
Shareholders' Letter | | | 2 | | |
Expense Example | | | 3 | | |
Investment Overview | | | 4 | | |
Portfolio of Investments | | | 7 | | |
Statement of Assets and Liabilities | | | 16 | | |
Statement of Operations | | | 18 | | |
Statements of Changes in Net Assets | | | 19 | | |
Financial Highlights | | | 20 | | |
Notes to Financial Statements | | | 24 | | |
Report of Independent Registered Public Accounting Firm | | | 35 | | |
Investment Advisory Agreement Approval | | | 36 | | |
U.S. Privacy Policy | | | 38 | | |
Trustee and Officer Information | | | 41 | | |
This report is authorized for distribution only when preceded or accompanied by prospectuses of the Morgan Stanley Institutional Fund Trust. To receive a prospectus and/or statement of additional information (SAI), which contains more complete information such as investment objectives, charges, expenses, policies for voting proxies, risk considerations, and describes in detail each of the Portfolio's investment policies to the prospective investor, please call toll free 1 (800) 548-7786. Please read the prospectuses carefully before you invest or send money.
Additionally, you can access portfolio information including performance, characteristics, and investment team commentary through Morgan Stanley Investment Management's website: www.morganstanley.com/im.
Market forecasts provided in this report may not necessarily come to pass. There is no guarantee that any sectors mentioned will continue to perform as discussed herein or that securities in such sectors will be held by the Portfolio in the future. There is no assurance that a Portfolio will achieve its investment objective. Portfolios are subject to market risk, which is the possibility that market values of securities owned by the Portfolio will decline and, therefore, the value of the Portfolio's shares may be less than what you paid for them. Accordingly, you can lose money investing in this Portfolio. Please see the prospectus for more complete information on investment risks.
1
Morgan Stanley Institutional Fund Trust
Annual Report — September 30, 2015
Shareholders' Letter (unaudited)
Dear Shareholders,
We are pleased to provide this Annual report, in which you will learn how your investment in Core Plus Fixed Income Portfolio (the "Portfolio") performed during the latest twelve-month period.
Morgan Stanley Investment Management is a client-centric, investor-led organization. Our global presence, intellectual capital, and breadth of products and services enable us to partner with investors to meet the evolving challenges of today's financial markets. We aim to deliver superior investment service and to empower our clients to make the informed decisions that help them reach their investment goals.
As always, we thank you for selecting Morgan Stanley Investment Management, and look forward to working with you in the months and years ahead.
Sincerely,

John H. Gernon
President and Principal Executive Officer
October 2015
2
Morgan Stanley Institutional Fund Trust
Annual Report — September 30, 2015
Expense Example (unaudited)
Core Plus Fixed Income Portfolio
As a shareholder of the Portfolio, you may incur two types of costs: (1) transactional costs, including sales charge (loads) on purchase payments; and (2) ongoing costs, including advisory fees, administration fees, distribution and shareholder services fees; and other Portfolio expenses. This example is intended to help you understand your ongoing costs (in dollars) of investing in the Portfolio and to compare these costs with the ongoing costs of investing in other mutual funds.
This example is based on an investment of $1,000 invested at the beginning of the six-month period ended September 30, 2015 and held for the entire six-month period (unless otherwise noted).
Actual Expenses
The table below provides information about actual account values and actual expenses. You may use the information in this table, together with the amount you invested, to estimate the expenses that you paid over the period. Simply divide your account value by $1,000 (for example, an $8,600 account value divided by $1,000 = 8.6), then multiply the result by the number in the table under the heading entitled "Actual Expenses Paid During Period" to estimate the expenses you paid on your account during this period.
Hypothetical Example for Comparison Purposes
The table below provides information about hypothetical account values and hypothetical expenses based on the Portfolio's actual expense ratio and an assumed rate of return of 5% per year before expenses, which is not the Portfolio's actual return. The hypothetical account values and expenses may not be used to estimate the actual ending account balance or expenses you paid for the period. You may use this information to compare the ongoing costs of investing in the Portfolio and other funds. To do so, compare this 5% hypothetical example with the 5% hypothetical examples that appear in the shareholder reports of the other funds.
Please note that the expenses shown in the table are meant to highlight your ongoing costs only and do not reflect any transactional costs, such as sales charges (loads, if applicable). Therefore, the information for each class in the table is useful in comparing ongoing costs only, and will not help you determine the relative total costs of owning different funds. In addition, if these transactional costs were included, your costs would have been higher.
| | | Beginning
Account
Value
4/1/15 | | Actual Ending
Account
Value
9/30/15 | | Hypothetical
Ending Account
Value | | Actual
Expenses
Paid
During
Period | | Hypothetical
Expenses Paid
During Period | | Net
Expense
Ratio
During
Period*** | |
Core Plus Fixed Income Portfolio Class I | | $ | 1,000.00 | | | $ | 983.20 | | | $ | 1,022.51 | | | $ | 2.54 | * | | $ | 2.59 | * | | | 0.51 | % | |
Core Plus Fixed Income Portfolio Class A | | | 1,000.00 | | | | 981.50 | | | | 1,020.76 | | | | 4.27 | * | | | 4.36 | * | | | 0.86 | | |
Core Plus Fixed Income Portfolio Class L | | | 1,000.00 | | | | 980.40 | | | | 1,019.50 | | | | 5.51 | * | | | 5.62 | * | | | 1.11 | | |
Core Plus Fixed Income Portfolio Class C | | | 1,000.00 | | | | 979.80 | | | | 1,014.21 | | | | 6.68 | ** | | | 6.80 | ** | | | 1.61 | | |
* Expenses are calculated using each Portfolio Class' annualized net expense ratio (as disclosed), multiplied by the average account value over the period, and multiplied by 183/365 (to reflect the most recent one-half year period).
** Expenses are calculated using the Portfolio Class' annualized net expense ratio (as disclosed), multiplied by the average account value over the period, and multiplied by 153/365 (to reflect the actual days in the period).
*** Annualized.
3
Morgan Stanley Institutional Fund Trust
Annual Report — September 30, 2015
Investment Overview (unaudited)
Core Plus Fixed Income Portfolio
The Core Plus Fixed Income Portfolio seeks above-average total return over a market cycle of three to five years.
Performance
For the fiscal year ended September 30, 2015, the Portfolio's Class I shares had a total return based on net asset value and reinvestment of distributions per share of 1.15%, net of fees. The Portfolio's Class I shares underperformed against the Portfolio's benchmark the Barclays U.S. Aggregate Index (the "Index"), which returned 2.94%.
Factors Affecting Performance
• Concerns over central bank policy around the world and global issues, such as Greece's debt crisis and China's economic slowdown, kept bond markets fairly turbulent during the period. Risk premia rose substantially in the latter months of the period and asset prices suffered. The rise in risk premia was driven by a continued tightening of financial conditions, catalyzed by a devaluation of the Chinese currency in August. This tightening of financial conditions resulted in falling business confidence and generally weaker-than-expected economic data. These factors drove "risk-off" sentiment and led to a widening of credit spreads, an equity market sell-off and a rally in U.S. Treasuries. Furthermore, to the surprise of many, the Federal Reserve (Fed) kept interest rates unchanged and delivered a more dovish-than-expected policy statement at its September 2015 meeting. As an unintended consequence, markets increasingly worried that the negative impact on the U.S. economy's growth dynamics would warrant a ratcheting down of global growth expectations. This fear drove risk premia even higher. The Fed has communicated that its decision to hike rates will be data dependent, which implies some uncertainty on whether a hike will happen this year. Only with a material recovery in labor market indicators over the next few months would a rate hike likely occur this year.
• Despite a general increase in yields in first half of the period, over the full 12-month period, 5-, 10-, and 30-year Treasury yields ended 41, 36 and 34 basis points lower, respectively.(i) U.S. 2-year yields ended the period relatively flat at 2 basis points higher.
• Recovering from a volatile fourth quarter of 2014, high yield credit started 2015 on a positive note, as one of the few fixed income sectors to have positive performance in the first quarter of 2015. However, amid economic and geopolitical worries, the U.S. credit markets endured record amounts of new issuance, which eventually pressured yield spreads wider (and prices lower, as bond prices move inversely to yields). Over the course of 2015, credit spreads in all markets have widened materially and are currently at levels which are typically only seen in periods of economic recession or systemic stress. The spreads observable in the investment grade markets include a material risk premium, and spreads in the high yield market are compensating for a significant uptick in defaults. While it is clear that certain emerging markets are seeing a material risk of recession, the consensus is for the developed world to see moderate growth over the coming year. We believe this growth backdrop, combined with low inflation, is likely to lead to ongoing accommodative monetary policy from the central banks around the world, which should keep defaults low and support credit markets.
• Another driver of credit spreads is the technical balance between supply and demand. Supply volume has been elevated across many of the credit markets. This has been most apparent in the U.S. investment grade market, where a combination of increased merger and acquisition activity and the fear that an interest rate tightening cycle could increase the future cost of long-term debt financing has caused corporate treasurers to turn to the bond markets. As a result, year-to-date new issue volumes have been running at record pace. This is to a lesser extent also true in the U.S. high yield and European investment grade markets. Along with this high level of issuance, demand has been muted as many yield-oriented investors are awaiting higher yields before committing capital to the market. This mismatch between supply and demand has resulted in a higher liquidity premium, which has contributed to the wider credit spreads.
(i) Source for U.S. Treasury yields: Bloomberg L.P.
4
Morgan Stanley Institutional Fund Trust
Annual Report — September 30, 2015
Investment Overview (unaudited) (cont'd)
Core Plus Fixed Income Portfolio
• Despite widening in the latter part of the period, agency mortgage-backed securities (MBS) spreads remain historically expensive. Mortgage rates and prepayment speeds have been range-bound, helping support performance so far, but with the possibility of a Fed rate hike in the coming months, volatility and absolute rate levels could rise and MBS duration extension concerns could return. There is also the additional risk that at some point in 2016 the Fed could end their MBS purchase program, whereby it has been buying 25% to 30% of all new origination.
• Prior to September, non-agency MBS prices had been resilient to broader credit market declines and had traded more as a function of the strong U.S. housing market. However, prices finally began to weaken as relative spread differences became more pronounced at the end of September. In contrast to the price declines, the fundamental market conditions underlying the non-agency MBS market remain very strong. Home prices rose 0.6% in July (down 0.2% on a seasonally adjusted basis), and were up 5.0% year-on-year from July 2014.(ii) New home sales were up 5.7% in August and up 21.6% from August 2014.(iii) Existing home sales were down 1.4% in August, predominantly due to lack of supply, but were still up 6.1% from August 2014.(iv) The volume of outstanding homes for sale fell to a 4.7-month supply based on current sales volumes, down from 5.0-month supply in July and well below the six-month supply that is historically associated with a balanced housing market.(iii) The U.S. homebuilder confidence index climbed to the highest level since November 2005 as housing supply is historically low and housing demand is steadily improving.(v) U.S. household formation was up 2.25 million year-on-year as of June, roughly double the long-term average of roughly 1.15 million per year.(iii) Household formation had been depressed and substantially below historical norms for most for the past seven years, and we are now seeing some of this pent-up demand enter the market. Mortgage performance remains positive. Mortgage defaults were essentially unchanged in August at 0.8%, down 0.1% from August 2014 and well below the nearly 6% level in 2009.(vi)
• Commercial mortgage-backed securities (CMBS) spreads also widened significantly in the latter half
of the period. Fundamentally, the CMBS sector remains healthy. Retail sales continue to climb, with August numbers up 0.2% from July and up 2.2% from August 2014.(iii) Consumer confidence rose in September to the second highest level in the past eight years.(vii) Hotel occupancy rates are at their highest levels in more than 15 years, exceeding 65% occupancy so far in 2015.(viii) For comparison, the previous credit cycle peak of 2004-2006 averaged roughly 63% occupancy. These high occupancy rates are boosting the performance of the hotel sector of CMBS. The improving economy and employment numbers are also helping reduce office space vacancies. National office vacancy rates fell by 0.4% to 13.5% in the second quarter of 2015 and are expected to fall further this year.(ix) Office rental rates increased at roughly 1.1% in the second quarter of 2015, and this pace of increase is expected to continue based on the declining vacancy rates.(ix)
Management Strategies
• Throughout the period, the Portfolio was positioned with exposure to the investment grade credit sector, primarily focused on financials, and to the high yield credit sector, as we believe valuations relative to fundamentals have been attractive in these segments. These positions detracted from performance during the period as volatility in global markets pushed spreads wider.
• The Portfolio also had allocations to non-agency mortgages and CMBS. Non-agency mortgage positions added to performance during the period as the sector remained mostly immune to global volatility; however, CMBS positioning detracted from performance.
(ii) S&P/Case-Shiller 20-City Composite Home Price Index, an index gauging the value of residential real estate in 20 major U.S. metropolitan areas.
(iii) U.S. Census Bureau
(iv) National Association of Realtors
(v) National Association of Home Builders
(vi) S&P/Experian First Mortgage Default Index, an index measuring default rates across first mortgages
(vii) The Conference Board
(viii) Statistica.com
(ix) CBRE Group, Inc.
5
Morgan Stanley Institutional Fund Trust
Annual Report — September 30, 2015
Investment Overview (unaudited) (cont'd)
Core Plus Fixed Income Portfolio
• With regard to interest rate strategy, the Portfolio is positioned using futures and interest rate swaps to be underweight duration at the intermediate part of the yield curve. This detracted from relative performance as rates fell during the period.
• We continue being overweight spread product (non-government bonds) as we believe the yield advantage could provide attractive returns over the near term.

* Minimum Investment
In accordance with SEC regulations, the Portfolio's performance shown assumes that all recurring fees (including management fees) were deducted and all dividends and distributions were reinvested. The performance of Class A, Class L and Class C shares will vary from the performance of Class I shares based upon their different inception dates and will be negatively impacted by additional fees assessed to those classes.
Performance Compared to the Barclays U.S. Aggregate Index(1) and the Lipper Core Plus Bond Funds Index(2)
| | | Period Ended September 30, 2015
Total Returns(3) | |
| | | | | Average Annual | |
| | | One
Year | | Five
Years | | Ten
Years | | Since
Inception(8) | |
Portfolio — Class I Shares
w/o sales charges(4) | | | 1.15 | % | | | 4.50 | % | | | 3.41 | % | | | 7.24 | % | |
Portfolio — Class A Shares
w/o sales charges(5) | | | 0.90 | | | | 4.21 | | | | 3.14 | | | | 4.58 | | |
Portfolio — Class A Shares with
maximum 4.25% sales charges(5) | | | –3.39 | | | | 3.31 | | | | 2.69 | | | | 4.34 | | |
Portfolio — Class L Shares
w/o sales charges(6) | | | 0.59 | | | | — | | | | — | | | | 3.28 | | |
Portfolio — Class C Shares
w/o sales charges(7) | | | — | | | | — | | | | — | | | | –2.02 | | |
Portfolio — Class C Shares with
maximum 1.00% deferred
sales charges(7) | | | — | | | | — | | | | — | | | | –3.00 | | |
Barclays U.S. Aggregate Index | | | 2.94 | | | | 3.10 | | | | 4.64 | | | | 7.35 | | |
Lipper Core Plus Bond Funds Index | | | 1.14 | | | | 3.71 | | | | 5.10 | | | | — | | |
Performance data quoted represents past performance, which is no guarantee of future results, and current performance may be lower or higher than the figures shown. Performance assumes that all dividends and distributions, if any, were reinvested. Returns for period less than one year are not annualized. For the most recent month-end performance figures, please visit www.morganstanley.com/im. Investment returns and principal value will fluctuate so that Portfolio shares, when redeemed, may be worth more or less than their original cost. Total returns do not reflect the deduction of taxes that a shareholder would pay on Portfolio distributions or the redemption of Portfolio shares. Performance of share classes will vary due to differences in sales charges and expenses.
(1) The Barclays U.S. Aggregate Index tracks the performance of U.S. government agency and Treasury securities, investment-grade corporate debt securities, agency mortgage-backed securities, asset-backed securities and commercial mortgage-backed securities. The Index is unmanaged and its returns do not include any sales charges or fees. Such costs would lower performance. It is not possible to invest directly in an index.
(2) The Lipper Core Plus Bond Funds Index is an equally weighted performance index of the largest qualifying funds (based on net assets) in the Lipper Core Plus Bond Funds classification. The Index, which is adjusted for capital gains distributions and income dividends, is unmanaged and should not be considered an investment. There are currently 30 funds represented in this Index. As of the date of this report, the Portfolio was in the Lipper Core Plus Bond Funds classification.
(3) Total returns for the Portfolio reflect expenses waived and/or reimbursed, if applicable, by the Adviser. Without such waivers and/or reimbursements, total returns would have been lower.
(4) Commenced operations on November 14, 1984.
(5) Commenced operations on November 7, 1996.
(6) Commenced operations on April 27, 2012.
(7) Commenced operations on April 30, 2015.
(8) For comparative purposes, average annual since inception returns listed for the Indexes refer to the inception date of Class I of the Portfolio, not the inception of the Indexes.
6
Morgan Stanley Institutional Fund Trust
Annual Report — September 30, 2015
Portfolio of Investments
Core Plus Fixed Income Portfolio
| | | Face
Amount
(000) | | Value
(000) | |
Fixed Income Securities (99.8%) | |
Agency Adjustable Rate Mortgage (0.5%) | |
Federal National Mortgage Association,
Conventional Pool
2.41%, 5/1/35 | | $ | 959 | | | $ | 1,018 | | |
Agency Fixed Rate Mortgages (20.1%) | |
Federal Home Loan Mortgage Corporation, | |
Gold Pools: | |
3.50%, 1/1/44 | | | 1,220 | | | | 1,275 | | |
5.41%, 2/1/37 - 8/1/37 | | | 63 | | | | 70 | | |
5.44%, 1/1/37 - 6/1/38 | | | 158 | | | | 175 | | |
5.46%, 5/1/37 - 4/1/38 | | | 140 | | | | 154 | | |
5.48%, 8/1/37 - 10/1/37 | | | 160 | | | | 177 | | |
5.50%, 8/1/37 - 4/1/38 | | | 173 | | | | 191 | | |
5.52%, 9/1/37 - 1/1/38 | | | 42 | | | | 46 | | |
5.62%, 12/1/36 - 7/1/38 | | | 120 | | | | 133 | | |
6.00%, 10/1/36 - 8/1/38 | | | 486 | | | | 547 | | |
6.50%, 3/1/16 - 8/1/33 | | | 246 | | | | 282 | | |
7.00%, 6/1/28 - 11/1/31 | | | 62 | | | | 65 | | |
November TBA: | |
3.00%, 11/1/45 (a) | | | 870 | | | | 877 | | |
3.50%, 11/1/45 (a) | | | 5,900 | | | | 6,126 | | |
4.00%, 11/1/45 (a) | | | 4,647 | | | | 4,938 | | |
Federal National Mortgage Association, | |
Conventional Pools: | |
3.00%, 5/1/30 - 4/1/45 | | | 1,907 | | | | 1,955 | | |
3.50%, 4/1/29 | | | 782 | | | | 827 | | |
4.00%, 11/1/41 - 7/1/43 | | | 5,303 | | | | 5,683 | | |
4.50%, 3/1/41 - 11/1/44 | | | 2,869 | | | | 3,174 | | |
5.00%, 3/1/41 | | | 473 | | | | 524 | | |
5.50%, 6/1/35 - 1/1/37 | | | 144 | | | | 162 | | |
5.62%, 12/1/36 | | | 35 | | | | 40 | | |
6.50%, 11/1/23 - 1/1/34 | | | 2,021 | | | | 2,316 | | |
7.00%, 11/1/17 - 1/1/34 | | | 349 | | | | 381 | | |
9.50%, 4/1/30 | | | 292 | | | | 340 | | |
November TBA: | |
4.50%, 11/1/45 (a) | | | 2,061 | | | | 2,233 | | |
October TBA: | |
3.00%, 10/1/30 (a) | | | 506 | | | | 527 | | |
3.50%, 10/1/30 (a) | | | 84 | | | | 89 | | |
Government National Mortgage Association, | |
October TBA: | |
3.50%, 10/20/45(a) | | | 4,831 | | | | 5,060 | | |
Various Pools: | |
3.50%, 12/15/43 | | | 798 | | | | 840 | | |
4.00%, 8/20/41 - 3/20/43 | | | 1,180 | | | | 1,266 | | |
5.48%, 9/20/37 | | | 10 | | | | 11 | | |
5.56%, 7/20/37 | | | 22 | | | | 24 | | |
| | | | 40,508 | | |
Asset-Backed Securities (4.7%) | |
American Homes 4 Rent | |
6.07%, 10/17/45 (b) | | | 500 | | | | 511 | | |
| | | Face
Amount
(000) | | Value
(000) | |
CAM Mortgage LLC | |
3.38%, 7/15/64 (b) | | $ | 727 | | | $ | 729 | | |
ContiMortgage Home Equity Loan Trust | |
8.10%, 8/15/25 | | | 30 | | | | 29 | | |
CVS Pass-Through Trust | |
6.04%, 12/10/28 | | | 419 | | | | 474 | | |
Invitation Homes Trust | |
4.96%, 8/17/32 (b)(c) | | | 997 | | | | 1,003 | | |
Mid-State Trust IV | |
8.33%, 4/1/30 | | | 13 | | | | 13 | | |
Nationstar HECM Loan Trust, | |
3.84%, 5/25/18 (b) | | | 568 | | | | 572 | | |
7.50%, 11/25/17 (b) | | | 739 | | | | 746 | | |
RMAT LLC | |
4.83%, 6/25/35 (b) | | | 1,039 | | | | 1,041 | | |
Silver Bay Realty Trust | |
3.76%, 9/17/31 (b)(c) | | | 700 | | | | 679 | | |
Skopos Auto Receivables Trust | |
3.10%, 12/15/23 (b) | | | 227 | | | | 227 | | |
U-Haul S Fleet LLC | |
4.90%, 10/25/23 (b) | | | 820 | | | | 854 | | |
VOLT NPL X LLC | |
4.75%, 10/26/54 (b) | | | 493 | | | | 488 | | |
VOLT XIX LLC | |
5.00%, 4/25/55 (b) | | | 300 | | | | 302 | | |
VOLT XXII LLC | |
4.25%, 2/25/55 (b) | | | 300 | | | | 296 | | |
VOLT XXX LLC | |
4.75%, 10/25/57 (b) | | | 400 | | | | 400 | | |
VOLT XXXI LLC | |
4.50%, 2/25/55 (b) | | | 400 | | | | 397 | | |
VOLT XXXIII LLC | |
4.25%, 3/25/55 (b) | | | 700 | | | | 691 | | |
| | | | 9,452 | | |
Collateralized Mortgage Obligations — Agency Collateral Series (2.8%) | |
Federal Home Loan Mortgage Corporation, | |
3.72%, 6/25/48 (b)(c) | | | 483 | | | | 442 | | |
IO | |
0.81%, 1/25/21 (c) | | | 9,408 | | | | 236 | | |
IO REMIC | |
5.79%, 11/15/43 (c) | | | 2,313 | | | | 359 | | |
5.84%, 4/15/39 (c) | | | 2,212 | | | | 330 | | |
IO STRIPS | |
7.50%, 12/1/29 | | | 52 | | | | 14 | | |
PAC REMIC | |
9.50%, 4/15/20 | | | — | @ | | | — | @ | |
Federal National Mortgage Association, | |
IO | |
6.20%, 9/25/20 (c) | | | 3,907 | | | | 777 | | |
IO PAC REMIC | |
8.00%, 9/18/27 | | | 213 | | | | 38 | | |
The accompanying notes are an integral part of the financial statements.
7
Morgan Stanley Institutional Fund Trust
Annual Report — September 30, 2015
Portfolio of Investments (cont'd)
Core Plus Fixed Income Portfolio
| | | Face
Amount
(000) | | Value
(000) | |
Collateralized Mortgage Obligations — Agency Collateral Series (cont'd) | |
IO REMIC | |
6.00%, 7/25/33 | | $ | 163 | | | $ | 37 | | |
IO STRIPS | |
6.50%, 9/25/29 - 12/25/29 | | | 839 | | | | 174 | | |
8.00%, 4/25/24 | | | 217 | | | | 29 | | |
8.50%, 10/25/25 | | | 74 | | | | 17 | | |
9.00%, 11/25/26 | | | 67 | | | | 17 | | |
REMIC | |
7.00%, 9/25/32 | | | 369 | | | | 427 | | |
9.21%, 10/25/41 (c)(d) | | | 125 | | | | 129 | | |
63.37%, 9/25/20 (c)(d) | | | 2 | | | | 2 | | |
Government National Mortgage Association, | |
IO | |
3.50%, 5/20/43 | | | 2,077 | | | | 426 | | |
5.00%, 2/16/41 | | | 483 | | | | 97 | | |
5.84%, 11/16/40 (c) | | | 2,887 | | | | 538 | | |
5.89%, 7/16/33 (c) | | | 3,942 | | | | 377 | | |
5.93%, 6/20/43 (c) | | | 1,708 | | | | 275 | | |
6.01%, 3/20/43 (c) | | | 1,165 | | | | 204 | | |
6.28%, 5/20/40 (c) | | | 1,402 | | | | 263 | | |
IO PAC | |
5.93%, 10/20/41 (c) | | | 3,892 | | | | 454 | | |
| | | | 5,662 | | |
Commercial Mortgage-Backed Securities (7.6%) | |
Citigroup Commercial Mortgage Trust, | |
0.99%, 9/10/58 (c) | | | 9,885 | | | | 709 | | |
3.14%, 9/15/17 (b)(c) | | | 800 | | | | 754 | | |
COMM Mortgage Trust, | |
5.07%, 4/10/47 (b)(c) | | | 883 | | | | 817 | | |
5.21%, 8/10/46 (b)(c) | | | 800 | | | | 788 | | |
IO | |
0.42%, 7/10/45 (c) | | | 16,078 | | | | 192 | | |
1.17%, 10/10/47 (c) | | | 4,702 | | | | 260 | | |
1.45%, 7/15/47 (c) | | | 4,240 | | | | 302 | | |
Commercial Mortgage Pass-Through Certificates | |
4.76%, 2/10/47 (b)(c) | | | 575 | | | | 537 | | |
Commercial Mortgage Trust | |
5.48%, 3/10/39 | | | 450 | | | | 467 | | |
CSMC Trust | |
4.36%, 3/15/17 (b)(c) | | | 200 | | | | 199 | | |
GS Mortgage Securities Trust, | |
4.93%, 8/10/46 (b)(c) | | | 500 | | | | 475 | | |
IO | |
1.02%, 9/10/47 (c) | | | 5,939 | | | | 326 | | |
HILT Mortgage Trust | |
3.95%, 7/15/29 (b)(c) | | | 600 | | | | 591 | | |
JP Morgan Chase Commercial Mortgage Securities Trust, | |
4.72%, 7/15/47 (b)(c) | | | 1,135 | | | | 996 | | |
5.46%, 12/12/43 | | | 600 | | | | 611 | | |
IO | |
0.72%, 4/15/46 (c) | | | 6,956 | | | | 263 | | |
1.32%, 7/15/47 (c) | | | 10,653 | | | | 655 | | |
| | | Face
Amount
(000) | | Value
(000) | |
JPMBB Commercial Mortgage Securities Trust, | |
4.83%, 4/15/47 (b)(c) | | $ | 775 | | | $ | 700 | | |
IO | |
1.27%, 8/15/47 (c) | | | 4,554 | | | | 327 | | |
LB-UBS Commercial Mortgage Trust | |
6.45%, 9/15/45 (c) | | | 550 | | | | 574 | | |
Wells Fargo Commercial Mortgage Trust, | |
3.94%, 8/15/50 (b) | | | 945 | | | | 795 | | |
4.65%, 9/15/58 (b)(c) | | | 471 | | | | 416 | | |
WF-RBS Commercial Mortgage Trust, | |
3.43%, 6/15/45 | | | 966 | | | | 1,016 | | |
3.80%, 11/15/47 (b)(c) | | | 950 | | | | 782 | | |
3.99%, 5/15/47 (b) | | | 580 | | | | 497 | | |
4.28%, 5/15/45 (b)(c) | | | 425 | | | | 394 | | |
5.15%, 9/15/46 (b)(c) | | | 805 | | | | 780 | | |
| | | | 15,223 | | |
Corporate Bonds (37.0%) | |
Finance (14.9%) | |
Abbey National Treasury Services PLC | |
3.05%, 8/23/18 | | | 490 | | | | 506 | | |
ABN Amro Bank N.V. | |
4.25%, 2/2/17 (b) | | | 600 | | | | 622 | | |
ACE INA Holdings, Inc. | |
3.35%, 5/15/24 | | | 400 | | | | 401 | | |
AerCap Ireland Capital Ltd./AerCap Global Aviation Trust | |
3.75%, 5/15/19 | | | 380 | | | | 374 | | |
Alexandria Real Estate Equities, Inc. | |
4.60%, 4/1/22 | | | 275 | | | | 289 | | |
Ally Financial, Inc., | |
3.25%, 2/13/18 | | | 10 | | | | 10 | | |
4.13%, 3/30/20 | | | 500 | | | | 496 | | |
American Campus Communities Operating Partnership LP | |
3.75%, 4/15/23 | | | 250 | | | | 247 | | |
American International Group, Inc. | |
4.88%, 6/1/22 | | | 275 | | | | 304 | | |
Banco de Credito del Peru | |
6.13%, 4/24/27 (b)(c) | | | 400 | | | | 414 | | |
Bank of America Corp., | |
MTN | |
4.00%, 1/22/25 | | | 830 | | | | 815 | | |
4.20%, 8/26/24 | | | 225 | | | | 225 | | |
4.25%, 10/22/26 | | | 113 | | | | 112 | | |
5.00%, 1/21/44 | | | 180 | | | | 190 | | |
Bank of New York Mellon Corp. (The), | |
MTN | |
3.65%, 2/4/24 | | | 400 | | | | 417 | | |
Barclays Bank PLC | |
3.75%, 5/15/24 (e) | | | 475 | | | | 481 | | |
BNP Paribas SA, | |
5.00%, 1/15/21 | | | 175 | | | | 197 | | |
MTN | |
4.25%, 10/15/24 (e) | | | 200 | | | | 199 | | |
The accompanying notes are an integral part of the financial statements.
8
Morgan Stanley Institutional Fund Trust
Annual Report — September 30, 2015
Portfolio of Investments (cont'd)
Core Plus Fixed Income Portfolio
| | | Face
Amount
(000) | | Value
(000) | |
Finance (cont'd) | |
Boston Properties LP | |
3.80%, 2/1/24 | | $ | 175 | | | $ | 178 | | |
| BPCE SA | |
5.15%, 7/21/24 (b)(e) | | | 600 | | | | 611 | | |
Brookfield Asset Management, Inc. | |
5.80%, 4/25/17 | | | 235 | | | | 249 | | |
Capital One Bank, USA NA | |
3.38%, 2/15/23 | | | 366 | | | | 357 | | |
Capital One Financial Corp. | |
2.45%, 4/24/19 | | | 150 | | | | 150 | | |
Citigroup, Inc., | |
4.45%, 9/29/27 | | | 100 | | | | 100 | | |
5.50%, 9/13/25 | | | 325 | | | | 354 | | |
6.68%, 9/13/43 | | | 120 | | | | 147 | | |
8.13%, 7/15/39 | | | 175 | | | | 252 | | |
CNOOC Finance 2013 Ltd. | |
3.00%, 5/9/23 | | | 540 | | | | 507 | | |
Commonwealth Bank of Australia | |
5.00%, 3/19/20 (b)(e) | | | 300 | | | | 335 | | |
Cooperatieve Centrale Raiffeisen-Boerenleenbank BA | |
3.95%, 11/9/22 | | | 650 | | | | 654 | | |
Credit Agricole SA, | |
3.88%, 4/15/24 (b)(e) | | | 500 | | | | 518 | | |
7.88%, 1/29/49 (b)(c)(f) | | | 200 | | | | 200 | | |
Credit Suisse AG | |
6.50%, 8/8/23 (b) | | | 425 | | | | 459 | | |
DBS Group Holdings Ltd. | |
2.25%, 7/16/19 (b)(e) | | | 525 | | | | 529 | | |
Discover Bank | |
7.00%, 4/15/20 | | | 250 | | | | 290 | | |
Discover Financial Services | |
3.95%, 11/6/24 | | | 300 | | | | 296 | | |
Five Corners Funding Trust | |
4.42%, 11/15/23 (b) | | | 500 | | | | 524 | | |
General Electric Capital Corp., | |
MTN | |
5.88%, 1/14/38 | | | 235 | | | | 294 | | |
Series G | |
6.00%, 8/7/19 | | | 694 | | | | 803 | | |
Genworth Holdings, Inc. | |
7.20%, 2/15/21 | | | 200 | | | | 201 | | |
Goldman Sachs Group, Inc. (The), | |
6.75%, 10/1/37 | | | 490 | | | | 586 | | |
MTN | |
4.80%, 7/8/44 | | | 175 | | | | 178 | | |
Goodman Funding Pty Ltd. | |
6.38%, 4/15/21 (b) | | | 425 | | | | 489 | | |
Hartford Financial Services Group, Inc. (The) | |
5.50%, 3/30/20 | | | 645 | | | | 726 | | |
HBOS PLC, | |
Series G | |
6.75%, 5/21/18 (b) | | | 813 | | | | 898 | | |
| | | Face
Amount
(000) | | Value
(000) | |
Healthcare Trust of America Holdings LP | |
3.70%, 4/15/23 | | $ | 350 | | | $ | 344 | | |
HSBC Finance Corp. | |
6.68%, 1/15/21 | | | 420 | | | | 492 | | |
HSBC Holdings PLC, | |
4.25%, 3/14/24 | | | 200 | | | | 199 | | |
6.38%, 12/29/49 (c)(f) | | | 200 | | | | 192 | | |
HSBC USA, Inc. | |
3.50%, 6/23/24 (e) | | | 225 | | | | 229 | | |
ING Bank N.V. | |
5.80%, 9/25/23 (b) | | | 520 | | | | 565 | | |
ING Groep N.V. | |
6.00%, 4/16/20 (c)(e)(f) | | | 200 | | | | 197 | | |
Intesa Sanpaolo SpA | |
5.25%, 1/12/24 | | | 410 | | | | 438 | | |
Jefferies Finance LLC/JFIN Co-Issuer Corp. | |
7.38%, 4/1/20 (b) | | | 380 | | | | 368 | | |
JPMorgan Chase & Co., | |
3.13%, 1/23/25 | | | 950 | | | | 918 | | |
4.13%, 12/15/26 | | | 300 | | | | 299 | | |
4.63%, 5/10/21 | | | 380 | | | | 414 | | |
Liberty Mutual Group, Inc. | |
4.85%, 8/1/44 (b) | | | 150 | | | | 146 | | |
Lloyds Bank PLC | |
6.50%, 9/14/20 (b) | | | 400 | | | | 462 | | |
Macquarie Bank Ltd. | |
6.63%, 4/7/21 (b) | | | 490 | | | | 550 | | |
Nationwide Building Society, | |
3.90%, 7/21/25 (b) | | | 200 | | | | 205 | | |
6.25%, 2/25/20 (b) | | | 645 | | | | 757 | | |
PNC Financial Services Group, Inc. (The) | |
3.90%, 4/29/24 (e) | | | 210 | | | | 213 | | |
Principal Financial Group, Inc. | |
1.85%, 11/15/17 | | | 575 | | | | 579 | | |
QBE Capital Funding III Ltd. | |
7.25%, 5/24/41 (b)(c) | | | 550 | | | | 615 | | |
Realty Income Corp. | |
3.25%, 10/15/22 | | | 400 | | | | 391 | | |
Standard Chartered PLC | |
3.95%, 1/11/23 (b) | | | 310 | | | | 289 | | |
Swedbank AB | |
2.38%, 2/27/19 (b) | | | 340 | | | | 345 | | |
TD Ameritrade Holding Corp. | |
3.63%, 4/1/25 | | | 500 | | | | 512 | | |
UBS Group Funding Co. | |
2.95%, 9/24/20 (b) | | | 525 | | | | 527 | | |
UnitedHealth Group, Inc., | |
2.88%, 3/15/23 (e) | | | 800 | | | | 798 | | |
3.75%, 7/15/25 | | | 300 | | | | 310 | | |
VEREIT, Inc. | |
3.00%, 8/1/18 | | | 525 | | | | 499 | | |
WEA Finance LLC/Westfield UK & Europe Finance PLC | |
3.25%, 10/5/20 (b)(g) | | | 450 | | | | 455 | | |
The accompanying notes are an integral part of the financial statements.
9
Morgan Stanley Institutional Fund Trust
Annual Report — September 30, 2015
Portfolio of Investments (cont'd)
Core Plus Fixed Income Portfolio
| | | Face
Amount
(000) | | Value
(000) | |
Finance (cont'd) | |
Wells Fargo & Co., | |
4.13%, 8/15/23 | | $ | 170 | | | $ | 177 | | |
Series M | |
3.45%, 2/13/23 | | | 320 | | | | 319 | | |
| | | | 29,988 | | |
Industrials (21.0%) | |
21st Century Fox America, Inc. | |
4.75%, 9/15/44 | | | 575 | | | | 568 | | |
AbbVie, Inc. | |
3.60%, 5/14/25 | | | 300 | | | | 297 | | |
Actavis Funding SCS, | |
3.80%, 3/15/25 | | | 95 | | | | 92 | | |
4.75%, 3/15/45 | | | 215 | | | | 196 | | |
ADT Corp. (The) | |
3.50%, 7/15/22 | | | 500 | | | | 445 | | |
Albea Beauty Holdings SA | |
8.38%, 11/1/19 (b) | | | 600 | | | | 633 | | |
Altria Group, Inc. | |
5.38%, 1/31/44 | | | 285 | | | | 311 | | |
Amazon.com, Inc. | |
3.80%, 12/5/24 | | | 475 | | | | 487 | | |
Anadarko Petroleum Corp. | |
6.45%, 9/15/36 | | | 250 | | | | 276 | | |
Anglo American Capital PLC | |
3.63%, 5/14/20 (b)(e) | | | 600 | | | | 524 | | |
Anheuser-Busch InBev Finance, Inc. | |
3.70%, 2/1/24 (e) | | | 475 | | | | 482 | | |
Apple, Inc., | |
3.85%, 5/4/43 | | | 125 | | | | 114 | | |
4.45%, 5/6/44 | | | 300 | | | | 299 | | |
AT&T, Inc., | |
5.55%, 8/15/41 | | | 525 | | | | 535 | | |
6.30%, 1/15/38 | | | 100 | | | | 110 | | |
Baidu, Inc. | |
2.75%, 6/9/19 | | | 475 | | | | 472 | | |
Barrick Gold Corp. | |
4.10%, 5/1/23 (e) | | | 255 | | | | 226 | | |
BAT International Finance PLC | |
3.50%, 6/15/22 (b) | | | 250 | | | | 257 | | |
Baxalta, Inc. | |
4.00%, 6/23/25 (b) | | | 625 | | | | 627 | | |
Bayer US Finance LLC | |
3.38%, 10/8/24 (b) | | | 200 | | | | 201 | | |
BHP Billiton Finance USA Ltd. | |
5.00%, 9/30/43 | | | 150 | | | | 152 | | |
Biogen, Inc. | |
4.05%, 9/15/25 | | | 375 | | | | 380 | | |
Boston Scientific Corp. | |
3.85%, 5/15/25 | | | 425 | | | | 419 | | |
BP Capital Markets PLC, | |
3.25%, 5/6/22 | | | 600 | | | | 604 | | |
3.51%, 3/17/25 (e) | | | 375 | | | | 371 | | |
| | | Face
Amount
(000) | | Value
(000) | |
Cardinal Health, Inc. | |
3.75%, 9/15/25 | | $ | 525 | | | $ | 534 | | |
Caterpillar, Inc. | |
3.80%, 8/15/42 (e) | | | 300 | | | | 276 | | |
CBS Corp. | |
4.60%, 1/15/45 | | | 175 | | | | 155 | | |
CCO Safari II LLC | |
4.91%, 7/23/25 (b) | | | 600 | | | | 598 | | |
CEVA Group PLC | |
7.00%, 3/1/21 (b) | | | 370 | | | | 329 | | |
CNH Industrial Capital LLC | |
3.25%, 2/1/17 | | | 309 | | | | 305 | | |
Coca-Cola Co. | |
3.20%, 11/1/23 | | | 375 | | | | 385 | | |
Comcast Corp. | |
4.60%, 8/15/45 | | | 230 | | | | 236 | | |
ConAgra Foods, Inc. | |
4.65%, 1/25/43 | | | 300 | | | | 274 | | |
DCP Midstream LLC | |
5.35%, 3/15/20 (b) | | | 180 | | | | 175 | | |
DCP Midstream Operating LP | |
3.88%, 3/15/23 | | | 375 | | | | 314 | | |
Denbury Resources, Inc. | |
5.50%, 5/1/22 | | | 168 | | | | 101 | | |
Devon Energy Corp. | |
4.75%, 5/15/42 | | | 125 | | | | 111 | | |
DirecTV Holdings LLC/DIRECTV Financing Co., Inc. | |
5.15%, 3/15/42 | | | 75 | | | | 71 | | |
Dollar Tree, Inc. | |
5.75%, 3/1/23 (b) | | | 325 | | | | 339 | | |
Eldorado Gold Corp. | |
6.13%, 12/15/20 (b) | | | 380 | | | | 334 | | |
EnLink Midstream Partners LP | |
5.60%, 4/1/44 | | | 225 | | | | 205 | | |
Ensco PLC | |
5.75%, 10/1/44 | | | 225 | | | | 156 | | |
Experian Finance PLC | |
2.38%, 6/15/17 (b) | | | 635 | | | | 639 | | |
Freeport-McMoRan, Inc. | |
3.88%, 3/15/23 | | | 170 | | | | 127 | | |
General Motors Financial Co., Inc., | |
4.00%, 1/15/25 | | | 225 | | | | 214 | | |
4.30%, 7/13/25 | | | 325 | | | | 315 | | |
4.38%, 9/25/21 | | | 400 | | | | 409 | | |
Gilead Sciences, Inc., | |
3.65%, 3/1/26 | | | 300 | | | | 302 | | |
4.80%, 4/1/44 | | | 200 | | | | 202 | | |
Glencore Funding LLC | |
4.13%, 5/30/23 (b) | | | 390 | | | | 307 | | |
Goldcorp, Inc. | |
3.70%, 3/15/23 (e) | | | 293 | | | | 273 | | |
Harley-Davidson Funding Corp. | |
6.80%, 6/15/18 (b) | | | 630 | | | | 713 | | |
The accompanying notes are an integral part of the financial statements.
10
Morgan Stanley Institutional Fund Trust
Annual Report — September 30, 2015
Portfolio of Investments (cont'd)
Core Plus Fixed Income Portfolio
| | | Face
Amount
(000) | | Value
(000) | |
Industrials (cont'd) | |
HCA, Inc. | |
4.75%, 5/1/23 | | $ | 445 | | | $ | 448 | | |
Heathrow Funding Ltd. | |
4.88%, 7/15/21 (b) | | | 525 | | | | 578 | | |
Hilcorp Energy I LP/Hilcorp Finance Co. | |
5.75%, 10/1/25 (b) | | | 315 | | | | 279 | | |
Home Depot, Inc. | |
5.88%, 12/16/36 | | | 400 | | | | 493 | | |
HP Enterprise Co. | |
4.90%, 10/15/25 (b) | | | 525 | | | | 524 | | |
Illumina, Inc. | |
0.00%, 6/15/19 (e) | | | 328 | | | | 361 | | |
Intel Corp., | |
2.70%, 12/15/22 | | | 400 | | | | 393 | | |
2.95%, 12/15/35 (Convertible) | | | 356 | | | | 433 | | |
Kinder Morgan, Inc., | |
4.30%, 6/1/25 (e) | | | 650 | | | | 585 | | |
5.55%, 6/1/45 | | | 300 | | | | 250 | | |
Lundin Mining Corp. | |
7.50%, 11/1/20 (b) | | | 352 | | | | 341 | | |
LyondellBasell Industries N.V. | |
4.63%, 2/26/55 | | | 300 | | | | 255 | | |
Mallinckrodt International Finance SA/Mallinckrodt CB LLC | |
5.50%, 4/15/25 (b) | | | 500 | | | | 448 | | |
MasTec, Inc. | |
4.88%, 3/15/23 | | | 515 | | | | 427 | | |
McDonald's Corp., | |
MTN | |
4.60%, 5/26/45 | | | 325 | | | | 325 | | |
Medtronic, Inc. | |
4.63%, 3/15/45 | | | 325 | | | | 336 | | |
Motorola Solutions, Inc. | |
4.00%, 9/1/24 | | | 300 | | | | 271 | | |
NBC Universal Media LLC, | |
2.88%, 1/15/23 | | | 250 | | | | 248 | | |
5.95%, 4/1/41 | | | 150 | | | | 180 | | |
NetApp, Inc. | |
2.00%, 12/15/17 | | | 200 | | | | 200 | | |
Netflix, Inc. | |
5.50%, 2/15/22 (b) | | | 480 | | | | 487 | | |
Noble Energy, Inc., | |
3.90%, 11/15/24 (e) | | | 225 | | | | 210 | | |
5.05%, 11/15/44 | | | 200 | | | | 174 | | |
NOVA Chemicals Corp. | |
5.25%, 8/1/23 (b) | | | 463 | | | | 450 | | |
Novartis Capital Corp. | |
4.40%, 5/6/44 | | | 250 | | | | 270 | | |
Nuance Communications, Inc. | |
2.75%, 11/1/31 | | | 286 | | | | 293 | | |
NVIDIA Corp. | |
1.00%, 12/1/18 | | | 550 | | | | 726 | | |
Omnicom Group, Inc. | |
3.65%, 11/1/24 | | | 230 | | | | 226 | | |
| | | Face
Amount
(000) | | Value
(000) | |
ON Semiconductor Corp., | |
Series B | |
2.63%, 12/15/26 | | $ | 290 | | | $ | 325 | | |
Ooredoo International Finance Ltd. | |
3.25%, 2/21/23 (b) | | | 450 | | | | 438 | | |
PepsiCo, Inc. | |
3.60%, 3/1/24 | | | 475 | | | | 494 | | |
Philip Morris International, Inc. | |
2.50%, 8/22/22 | | | 495 | | | | 484 | | |
Phillips 66 Partners LP | |
4.68%, 2/15/45 | | | 150 | | | | 124 | | |
QUALCOMM, Inc. | |
4.65%, 5/20/35 | | | 425 | | | | 389 | | |
Quest Diagnostics, Inc. | |
2.70%, 4/1/19 (e) | | | 1,000 | | | | 1,009 | | |
QVC, Inc. | |
4.38%, 3/15/23 | | | 400 | | | | 389 | | |
Rowan Cos., Inc. | |
5.85%, 1/15/44 (e) | | | 175 | | | | 110 | | |
SanDisk Corp. | |
0.50%, 10/15/20 | | | 575 | | | | 560 | | |
Shell International Finance BV | |
3.25%, 5/11/25 | | | 400 | | | | 396 | | |
Siemens Financieringsmaatschappij N.V. | |
3.25%, 5/27/25 (b)(e) | | | 450 | | | | 451 | | |
SK Telecom Co., Ltd. | |
2.13%, 5/1/18 (b) | | | 200 | | | | 201 | | |
Spectra Energy Capital LLC | |
3.30%, 3/15/23 | | | 475 | | | | 427 | | |
Spectrum Brands, Inc. | |
5.75%, 7/15/25 (b) | | | 125 | | | | 128 | | |
T-Mobile USA, Inc. | |
6.73%, 4/28/22 | | | 375 | | | | 375 | | |
Target Corp. | |
4.00%, 7/1/42 | | | 150 | | | | 148 | | |
Telstra Corp., Ltd. | |
3.13%, 4/7/25 (b) | | | 240 | | | | 234 | | |
Tiffany & Co. | |
4.90%, 10/1/44 | | | 100 | | | | 97 | | |
Time Warner Cable, Inc. | |
4.50%, 9/15/42 | | | 375 | | | | 298 | | |
Transocean, Inc., | |
4.30%, 10/15/22 (e) | | | 300 | | | | 187 | | |
6.88%, 12/15/21 (e) | | | 275 | | | | 206 | | |
Tyco International Finance SA | |
3.90%, 2/14/26 | | | 350 | | | | 355 | | |
Tyson Foods, Inc. | |
3.95%, 8/15/24 | | | 125 | | | | 128 | | |
United Airlines Pass-Through Trust, | |
Series A | |
4.00%, 4/11/26 | | | 675 | | | | 691 | | |
United Rentals North America, Inc. | |
5.75%, 11/15/24 | | | 370 | | | | 356 | | |
The accompanying notes are an integral part of the financial statements.
11
Morgan Stanley Institutional Fund Trust
Annual Report — September 30, 2015
Portfolio of Investments (cont'd)
Core Plus Fixed Income Portfolio
| | | Face
Amount
(000) | | Value
(000) | |
Industrials (cont'd) | |
United Technologies Corp. | |
4.50%, 6/1/42 | | $ | 165 | | | $ | 168 | | |
Verizon Communications, Inc., | |
3.50%, 11/1/24 | | | 350 | | | | 345 | | |
4.67%, 3/15/55 | | | 775 | | | | 670 | | |
5.01%, 8/21/54 | | | 283 | | | | 259 | | |
Volkswagen Group of America Finance LLC | |
2.40%, 5/22/20 (b)(e) | | | 525 | | | | 488 | | |
Wal-Mart Stores, Inc. | |
5.25%, 9/1/35 | | | 290 | | | | 336 | | |
Wesfarmers Ltd. | |
2.98%, 5/18/16 (b) | | | 390 | | | | 395 | | |
Williams Partners LP/ACMP Finance Corp. | |
4.88%, 5/15/23 | | | 475 | | | | 440 | | |
Wynn Las Vegas LLC/Wynn Las Vegas Capital Corp. | |
5.50%, 3/1/25 (b)(e) | | | 430 | | | | 370 | | |
Yahoo!, Inc. | |
0.00%, 12/1/18 | | | 550 | | | | 535 | | |
Yum! Brands, Inc. | |
3.88%, 11/1/20 (e) | | | 700 | | | | 734 | | |
ZF North America Capital, Inc. | |
4.50%, 4/29/22 (b) | | | 475 | | | | 451 | | |
Zimmer Biomet Holdings, Inc. | |
5.75%, 11/30/39 | | | 220 | | | | 242 | | |
| | | | 42,121 | | |
Utilities (1.1%) | |
CEZ AS | |
4.25%, 4/3/22 (b) | | | 210 | | | | 222 | | |
Delmarva Power & Light Co. | |
4.00%, 6/1/42 | | | 475 | | | | 463 | | |
Exelon Generation Co., LLC | |
6.25%, 10/1/39 | | | 445 | | | | 474 | | |
Jersey Central Power & Light Co. | |
4.70%, 4/1/24 (b)(e) | | | 700 | | | | 734 | | |
PPL WEM Ltd./Western Power Distribution Ltd. | |
3.90%, 5/1/16 (b) | | | 375 | | | | 380 | | |
| | | | 2,273 | | |
| | | | 74,382 | | |
Mortgages — Other (9.0%) | |
Banc of America Alternative Loan Trust, | |
0.84%, 7/25/46 (c) | | | 382 | | | | 260 | | |
5.50%, 10/25/35 | | | 1,700 | | | | 1,583 | | |
5.86%, 10/25/36 | | | 829 | | | | 526 | | |
6.00%, 4/25/36 | | | 306 | | | | 316 | | |
ChaseFlex Trust, | |
6.00%, 2/25/37 | | | 1,215 | | | | 1,046 | | |
Fannie Mae Connecticut Avenue Securities, | |
4.19%, 5/25/25 (c) | | | 671 | | | | 640 | | |
5.09%, 11/25/24 (c) | | | 698 | | | | 701 | | |
5.19%, 7/25/25 (c) | | | 500 | | | | 499 | | |
First Horizon Alternative Mortgage Securities Trust, | |
6.25%, 8/25/36 | | | 677 | | | | 542 | | |
| | | Face
Amount
(000) | | Value
(000) | |
Freddie Mac Structured Agency Credit Risk Debt Notes, | |
3.49%, 10/25/27 (c) | | $ | 400 | | | $ | 379 | | |
3.94%, 9/25/24 (c) | | | 352 | | | | 331 | | |
4.19%, 8/25/24 (c) | | | 312 | | | | 305 | | |
4.44%, 11/25/23 (c) | | | 700 | | | | 700 | | |
4.74%, 10/25/24 (c) | | | 948 | | | | 950 | | |
Freddie Mac Whole Loan Securities Trust, | |
3.50%, 5/25/45 | | | 568 | | | | 576 | | |
3.88%, 5/25/45 (b)(c) | | | 249 | | | | 214 | | |
4.00%, 5/25/45 | | | 224 | | | | 232 | | |
Grifonas Finance PLC, | |
0.32%, 8/28/39 (c) | | EUR | 490 | | | | 392 | | |
GSMSC Pass-Through Trust, | |
7.50%, 9/25/36 (b)(c) | | $ | 1,042 | | | | 851 | | |
HarborView Mortgage Loan Trust, | |
0.41%, 1/19/38 (c) | | | 306 | | | | 261 | | |
Impac CMB Trust, | |
0.93%, 4/25/35 (c) | | | 318 | | | | 239 | | |
JP Morgan Mortgage Trust, | |
2.74%, 6/25/37 (c) | | | 291 | | | | 269 | | |
6.00%, 6/25/37 | | | 250 | | | | 243 | | |
Lehman Mortgage Trust, | |
5.50%, 11/25/35 - 2/25/36 | | | 1,401 | | | | 1,353 | | |
6.50%, 9/25/37 | | | 1,586 | | | | 1,295 | | |
RALI Trust, | |
0.38%, 12/25/36 (c) | | | 880 | | | | 687 | | |
5.50%, 12/25/34 | | | 1,054 | | | | 1,057 | | |
6.00%, 11/25/36 | | | 373 | | | | 308 | | |
Springleaf Mortgage Loan Trust, | |
3.56%, 12/25/59 (b)(c) | | | 860 | | | | 863 | | |
Washington Mutual Mortgage Pass-Through Certificates Trust, | |
0.97%, 4/25/47 (c) | | | 681 | | | | 519 | | |
| | | | 18,137 | | |
Municipal Bonds (1.2%) | |
City of Chicago, IL, | |
O'Hare International Airport Revenue | |
6.40%, 1/1/40 | | | 255 | | | | 316 | | |
City of New York, NY, | |
Series G-1 | |
5.97%, 3/1/36 | | | 270 | | | | 333 | | |
Illinois State Toll Highway Authority, | |
Highway Revenue, Build America Bonds | |
6.18%, 1/1/34 | | | 477 | | | | 593 | | |
Municipal Electric Authority of Georgia, | |
6.64%, 4/1/57 | | | 283 | | | | 333 | | |
6.66%, 4/1/57 | | | 320 | | | | 376 | | |
New York City, NY, | |
Transitional Finance Authority Future Tax Secured Revenue | |
5.27%, 5/1/27 | | | 320 | | | | 372 | | |
| | | | 2,323 | | |
Sovereign (7.7%) | |
Brazilian Government International Bond, | |
5.00%, 1/27/45 | | | 244 | | | | 184 | | |
5.63%, 1/7/41 (e) | | | 132 | | | | 108 | | |
The accompanying notes are an integral part of the financial statements.
12
Morgan Stanley Institutional Fund Trust
Annual Report — September 30, 2015
Portfolio of Investments (cont'd)
Core Plus Fixed Income Portfolio
| | | Face
Amount
(000) | | Value
(000) | |
Sovereign (cont'd) | |
| EUROFIMA, | |
MTN | |
6.25%, 12/28/18 | | AUD | 1,190 | | | $ | 933 | | |
Hungary Government Bond, | |
5.50%, 6/24/25 | | HUF | 157,200 | | | | 662 | | |
Italy Buoni Poliennali Del Tesoro, | |
2.35%, 9/15/24 (b) | | EUR | 1,799 | | | | 2,275 | | |
Mexican Bonos, | |
10.00%, 12/5/24 | | MXN | 21,000 | | | | 1,585 | | |
Mexico Government International Bond, | |
3.63%, 3/15/22 | | $ | 868 | | | | 878 | | |
New Zealand Government Bond, | |
5.50%, 4/15/23 | | NZD | 2,000 | | | | 1,496 | | |
Pertamina Persero PT, | |
4.88%, 5/3/22 | | $ | 1,725 | | | | 1,645 | | |
Petroleos de Venezuela SA, | |
6.00%, 11/15/26 | | | 550 | | | | 177 | | |
Petroleos Mexicanos, | |
6.38%, 1/23/45 | | | 400 | | | | 361 | | |
Philippine Government International Bond, | |
6.38%, 10/23/34 | | | 450 | | | | 590 | | |
Portugal Obrigacoes do Tesouro OT, | |
3.88%, 2/15/30 (b) | | EUR | 1,040 | | | | 1,295 | | |
Romania Government Bond, | |
4.75%, 2/24/25 | | RON | 4,795 | | | | 1,323 | | |
South Africa Government Bond, | |
8.00%, 1/31/30 | | ZAR | 17,530 | | | | 1,179 | | |
Spain Government Inflation Linked Bond, | |
1.00%, 11/30/30 (b) | | EUR | 668 | | | | 715 | | |
| | | | 15,406 | | |
U.S. Agency Securities (1.7%) | |
Federal Home Loan Mortgage Corporation, | |
3.75%, 3/27/19 | | $ | 2,520 | | | | 2,744 | | |
6.75%, 3/15/31 | | | 470 | | | | 688 | | |
| | | | 3,432 | | |
U.S. Treasury Securities (7.5%) | |
U.S. Treasury Bond | |
2.75%, 11/15/42 | | | 1,100 | | | | 1,071 | | |
U.S. Treasury Inflation Indexed Bond | |
0.25%, 1/15/25 | | | 7,889 | | | | 7,569 | | |
U.S. Treasury Note | |
1.50%, 5/31/19 | | | 6,300 | | | | 6,385 | | |
| | | | 15,025 | | |
Total Fixed Income Securities (Cost $201,867) | | | 200,568 | | |
| | | Shares | | | |
Short-Term Investments (13.7%) | |
Securities held as Collateral on Loaned Securities (2.8%) | |
Investment Company (2.5%) | |
Morgan Stanley Institutional Liquidity
Funds — Money Market Portfolio —
Institutional Class (See Note G) | | | 4,951,914 | | | | 4,952 | | |
| | | Face
Amount
(000) | | Value
(000) | |
Repurchase Agreements (0.3%) | |
Barclays Capital, Inc., (0.10%,
dated 9/30/15, due 10/1/15; proceeds $415;
fully collateralized by a U.S. Government
obligation; 3.13% due 8/15/44;
valued at $423) | | $ | 415 | | | $ | 415 | | |
BNP Paribas Securities Corp., (0.09%,
dated 9/30/15, due 10/1/15; proceeds $296;
fully collateralized by various U.S. Government
agency securities; 0.00% - 7.25%
due 11/5/15 - 10/11/33 and
U.S. Government obligations; 0.00% - 1.88%
due 10/15/15 - 9/30/17;
valued at $302) | | | 296 | | | | 296 | | |
| | | | 711 | | |
Total Securities held as Collateral on Loaned
Securities (Cost $5,663) | | | 5,663 | | |
| | | Shares | | | |
Investment Company (10.2%) | |
Morgan Stanley Institutional Liquidity
Funds — Money Market Portfolio —
Institutional Class (See Note G)
(Cost $20,498) | | | 20,497,740 | | | | 20,498 | | |
U.S. Treasury Security (0.7%) | |
U.S. Treasury Bill | |
| 0.26%, 3/10/16 (h)(i) (Cost $1,486) | | | 1,488 | | | | 1,488 | | |
Total Short-Term Investments (Cost $27,647) | | | 27,649 | | |
Total Investments (113.5%) (Cost $229,514)
Including $10,398 of Securities Loaned (j)(k) | | | 228,217 | | |
Liabilities in Excess of Other Assets (-13.5%) | | | (27,225 | ) | |
Net Assets (100.0%) | | $ | 200,992 | | |
(a) Security is subject to delayed delivery.
(b) 144A security — Certain conditions for public sale may exist. Unless otherwise noted, these securities are deemed to be liquid.
(c) Variable/Floating Rate Security — Interest rate changes on these instruments are based on changes in a designated base rate. The rates shown are those in effect on September 30, 2015.
(d) Inverse Floating Rate Security — Interest rate fluctuates with an inverse relationship to an associated interest rate. Indicated rate is the effective rate at September 30, 2015.
(e) All or a portion of this security was on loan at September 30, 2015.
(f) Perpetual — One or more securities do not have a predetermined maturity date. Rates for these securities are fixed for a period of time, after which they revert to a floating rate. Interest rates in effect are as of September 30, 2015.
(g) When-issued security.
(h) Rate shown is the yield to maturity at September 30, 2015.
(i) All or a portion of the security was pledged to cover margin requirements for swap agreements.
(j) Securities are available for collateral in connection with purchase of a when-issued security, securities purchased on a forward commitment basis, open foreign currency forward exchange contracts, futures contracts and swap agreements.
The accompanying notes are an integral part of the financial statements.
13
Morgan Stanley Institutional Fund Trust
Annual Report — September 30, 2015
Portfolio of Investments (cont'd)
Core Plus Fixed Income Portfolio
(k) At September 30, 2015, the aggregate cost for Federal income tax purposes is approximately $229,609,000. The aggregate gross unrealized appreciation is approximately $4,999,000 and the aggregate gross unrealized depreciation is approximately $6,391,000 resulting in net unrealized depreciation of approximately $1,392,000.
@ Value is less than $500.
IO Interest Only.
MTN Medium Term Note.
PAC Planned Amortization Class.
REMIC Real Estate Mortgage Investment Conduit.
STRIPS Separate Trading of Registered Interest and Principal of Securities.
TBA To Be Announced.
Foreign Currency Forward Exchange Contracts:
The Portfolio had the following foreign currency forward exchange contracts open at September 30, 2015:
Counterparty | | Currency to
Deliver
(000) | | Value
(000) | | Settlement
Date | | In Exchange
For
(000) | | Value
(000) | | Unrealized
Appreciation
(Depreciation)
(000) | |
Citibank NA | | EUR | 4,703 | | | $ | 5,256 | | | 10/5/15 | | USD | 5,297 | | | $ | 5,297 | | | $ | 41 | | |
Citibank NA | | USD | 6 | | | | 6 | | | 10/5/15 | | NOK | 53 | | | | 6 | | | | (— | @) | |
Deutsche Bank AG | | MXN | 27,346 | | | | 1,618 | | | 10/5/15 | | USD | 1,617 | | | | 1,617 | | | | (1 | ) | |
Deutsche Bank AG | | PLN | 14 | | | | 4 | | | 10/5/15 | | USD | 4 | | | | 4 | | | | — | @ | |
HSBC Bank PLC | | NZD | 2,305 | | | | 1,474 | | | 10/5/15 | | USD | 1,458 | | | | 1,458 | | | | (16 | ) | |
JPMorgan Chase Bank NA | | HUF | 184,606 | | | | 658 | | | 10/5/15 | | USD | 660 | | | | 660 | | | | 2 | | |
JPMorgan Chase Bank NA | | SEK | 15 | | | | 2 | | | 10/5/15 | | USD | 2 | | | | 2 | | | | (— | @) | |
UBS AG | | CAD | 6 | | | | 4 | | | 10/5/15 | | USD | 4 | | | | 4 | | | | — | @ | |
UBS AG | | RON | 2,582 | | | | 653 | | | 10/5/15 | | USD | 656 | | | | 656 | | | | 3 | | |
UBS AG | | RON | 2,739 | | | | 693 | | | 10/5/15 | | USD | 695 | | | | 695 | | | | 2 | | |
UBS AG | | TRY | 60 | | | | 20 | | | 10/5/15 | | USD | 20 | | | | 20 | | | | — | @ | |
UBS AG | | USD | 2 | | | | 2 | | | 10/5/15 | | BRL | 7 | | | | 2 | | | | (— | @) | |
UBS AG | | USD | 727 | | | | 727 | | | 10/5/15 | | EUR | 642 | | | | 717 | | | | (10 | ) | |
UBS AG | | USD | 9 | | | | 9 | | | 10/5/15 | | JPY | 1,109 | | | | 9 | | | | (— | @) | |
UBS AG | | ZAR | 16,829 | | | | 1,213 | | | 10/5/15 | | USD | 1,248 | | | | 1,248 | | | | 35 | | |
JPMorgan Chase Bank NA | | AUD | 1,325 | | | | 929 | | | 10/6/15 | | USD | 933 | | | | 933 | | | | 4 | | |
| | | | | $ | 13,268 | | | | | | | $ | 13,328 | | | $ | 60 | | |
Futures Contracts:
The Portfolio had the following futures contracts open at September 30, 2015:
| | | Number
of
Contracts | | Value
(000) | | Expiration
Date | | Unrealized
Appreciation
(Depreciation)
(000) | |
Long: | |
U.S. Treasury 2 yr. Note | | | 18 | | | $ | 3,943 | | | Dec-15 | | $ | 13 | | |
U.S. Treasury 5 yr. Note | | | 123 | | | | 14,823 | | | Dec-15 | | | 81 | | |
U.S. Treasury Long Bond | | | 36 | | | | 5,664 | | | Dec-15 | | | 102 | | |
U.S. Treasury Ultra Long Bond | | | 41 | | | | 6,577 | | | Dec-15 | | | 84 | | |
Short: | |
U.S. Treasury 10 yr. Note | | | 216 | | | | (27,807 | ) | | Dec-15 | | | (359 | ) | |
| | | | | | | | | $ | (79 | ) | |
Credit Default Swap Agreements:
The Portfolio had the following credit default swap agreements open at September 30, 2015:
Swap Counterparty and
Reference Obligation | | Buy/Sell
Protection | | Notional
Amount
(000) | | Pay/Receive
Fixed Rate | | Termination
Date | | Upfront
Payment
Paid
(Received)
(000) | | Unrealized
Appreciation
(Depreciation)
(000) | | Value
(000) | | Credit
Rating of
Reference
Obligation†
(unaudited) | |
Barclays Bank PLC
Quest Diagnostics, Inc. | | Buy | | $ | 995 | | | | 1.00 | % | | 3/20/19 | | $ | 19 | | | $ | (36 | ) | | $ | (17 | ) | | BBB+ | |
Barclays Bank PLC
Yum! Brands, Inc. | | Buy | | | 950 | | | | 1.00 | | | 12/20/18 | | | (16 | ) | | | 1 | | | | (15 | ) | | BBB | |
Deutsche Bank AG
CMBX.NA.BB.60 | | Sell | | | 515 | | | | 5.00 | | | 5/11/63 | | | 3 | | | | (21 | ) | | | (18 | ) | | NR | |
Morgan Stanley & Co., LLC*
CDX.NA.IG.24 | | Buy | | | 2,975 | | | | 1.00 | | | 6/20/20 | | | (56 | ) | | | 41 | | | | (15 | ) | | NR | |
| | | | | $ | 5,435 | | | | | | | $ | (50 | ) | | $ | (15 | ) | | $ | (65 | ) | | | |
The accompanying notes are an integral part of the financial statements.
14
Morgan Stanley Institutional Fund Trust
Annual Report — September 30, 2015
Portfolio of Investments (cont'd)
Core Plus Fixed Income Portfolio
Interest Rate Swap Agreements:
The Portfolio had the following interest rate swap agreements open at September 30, 2015:
Swap Counterparty | | Floating Rate
Index | | Pay/Receive
Floating Rate | | Fixed Rate | | Termination
Date | | Notional
Amount
(000) | | Unrealized
Depreciation
(000) | |
Morgan Stanley & Co., LLC* | | 3 Month LIBOR | | Receive | | | 1.73 | % | | 3/9/20 | | $ | 8,500 | | | $ | (168 | ) | |
Morgan Stanley & Co., LLC* | | 3 Month LIBOR | | Receive | | | 2.49 | | | 6/9/25 | | | 3,550 | | | | (185 | ) | |
| | | | | | | | | | | | | $ | (353 | ) | |
@ Value is less than $500.
† Credit rating as issued by Standard & Poor's.
* Cleared swap agreement, the broker is Morgan Stanley & Co., LLC.
LIBOR London Interbank Offered Rate.
NR Not rated.
AUD — Australian Dollar
BRL — Brazilian Real
CAD — Canadian Dollar
EUR — Euro
HUF — Hungarian Forint
JPY — Japanese Yen
MXN — Mexican Peso
NOK — Norwegian Krone
NZD — New Zealand Dollar
PLN — Polish Zloty
RON — Romanian New Leu
SEK — Swedish Krona
TRY — Turkish Lira
USD — United States Dollar
ZAR — South African Rand
Portfolio Composition**
Classification | | Percentage of
Total Investments | |
Industrials | | | 18.9 | % | |
Agency Fixed Rate Mortgages | | | 18.2 | | |
Finance | | | 13.5 | | |
Other*** | | | 10.9 | | |
Short-Term Investments | | | 9.9 | | |
Mortgages — Other | | | 8.1 | | |
Sovereign | | | 6.9 | | |
Commercial Mortgage-Backed Securities | | | 6.8 | | |
U.S. Treasury Securities | | | 6.8 | | |
Total Investments | | | 100.0 | %**** | |
** Percentages indicated are based upon total investments (excluding Securities held as Collateral on Loaned Securities) as of September 30, 2015.
*** Industries and/or investment types representing less than 5% of total investments.
**** Does not include open long/short futures contracts with an underlying face amount of approximately $58,814,000 with net unrealized depreciation of approximately $79,000. Does not include open foreign currency forward exchange contracts with net unrealized appreciation of approximately $60,000 and does not include open swap agreements with net unrealized depreciation of approximately $368,000.
The accompanying notes are an integral part of the financial statements.
15
Morgan Stanley Institutional Fund Trust
Annual Report — September 30, 2015
Core Plus Fixed Income Portfolio
Statement of Assets and Liabilities | | September 30, 2015
(000) | |
Assets: | |
Investments in Securities of Unaffiliated Issuers, at Value(1) (Cost $204,064) | | $ | 202,767 | | |
Investment in Security of Affiliated Issuer, at Value (Cost $25,450) | | | 25,450 | | |
Total Investments in Securities, at Value (Cost $229,514) | | | 228,217 | | |
Cash | | | 382 | | |
Receivable for Investments Sold | | | 23,379 | | |
Interest Receivable | | | 1,487 | | |
Receivable for Portfolio Shares Sold | | | 198 | | |
Receivable for Variation Margin on Futures Contracts | | | 127 | | |
Unrealized Appreciation on Foreign Currency Forward Exchange Contracts | | | 87 | | |
Premium Paid on Open Swap Agreements | | | 22 | | |
Receivable for Variation Margin on Swap Agreements | | | 9 | | |
Tax Reclaim Receivable | | | 7 | | |
Receivable from Affiliate | | | 3 | | |
Unrealized Appreciation on Swap Agreements | | | 1 | | |
Other Assets | | | 58 | | |
Total Assets | | | 253,977 | | |
Liabilities: | |
Payable for Investments Purchased | | | 46,437 | | |
Collateral on Securities Loaned, at Value | | | 6,045 | | |
Payable for Trustees' Fees and Expenses | | | 138 | | |
Payable for Portfolio Shares Redeemed | | | 73 | | |
Unrealized Depreciation on Swap Agreements | | | 57 | | |
Payable for Advisory Fees | | | 56 | | |
Payable for Sub Transfer Agency Fees — Class I | | | 34 | | |
Payable for Sub Transfer Agency Fees — Class A | | | 1 | | |
Payable for Sub Transfer Agency Fees — Class L | | | — | @ | |
Payable for Sub Transfer Agency Fees — Class C | | | — | @ | |
Unrealized Depreciation on Foreign Currency Forward Exchange Contracts | | | 27 | | |
Payable for Professional Fees | | | 26 | | |
Payable for Custodian Fees | | | 17 | | |
Premium Received on Open Swap Agreements | | | 16 | | |
Payable for Administration Fees | | | 13 | | |
Payable for Transfer Agency Fees — Class I | | | 2 | | |
Payable for Transfer Agency Fees — Class A | | | 1 | | |
Payable for Transfer Agency Fees — Class L | | | — | @ | |
Payable for Transfer Agency Fees — Class C | | | — | @ | |
Payable for Shareholder Services Fees — Class A | | | 1 | | |
Payable for Distribution and Shareholder Services Fees — Class L | | | — | @ | |
Payable for Distribution and Shareholder Services Fees — Class C | | | — | @ | |
Other Liabilities | | | 41 | | |
Total Liabilities | | | 52,985 | | |
Net Assets | | $ | 200,992 | | |
Net Assets Consist Of: | |
Paid-in-Capital | | $ | 659,198 | | |
Accumulated Undistributed Net Investment Income | | | 4,482 | | |
Accumulated Net Realized Loss | | | (461,003 | ) | |
Unrealized Appreciation (Depreciation) on: | |
Investments | | | (1,297 | ) | |
Futures Contracts | | | (79 | ) | |
Swap Agreements | | | (368 | ) | |
Foreign Currency Forward Exchange Contracts | | | 60 | | |
Foreign Currency Translations | | | (1 | ) | |
Net Assets | | $ | 200,992 | | |
The accompanying notes are an integral part of the financial statements.
16
Morgan Stanley Institutional Fund Trust
Annual Report — September 30, 2015
Core Plus Fixed Income Portfolio
Statement of Assets and Liabilities (cont'd) | | September 30, 2015
(000) | |
CLASS I: | |
Net Assets | | $ | 197,057 | | |
| Shares Outstanding (unlimited number of shares authorized, no par value) (not in 000's) | | | 19,366,405 | | |
Net Asset Value, Offering and Redemption Price Per Share | | $ | 10.18 | | |
CLASS A: | |
Net Assets | | $ | 3,553 | | |
| Shares Outstanding (unlimited number of shares authorized, no par value) (not in 000's) | | | 348,656 | | |
Net Asset Value, Redemption Price Per Share | | $ | 10.19 | | |
Maximum Sales Load | | | 4.25 | % | |
Maximum Sales Charge | | $ | 0.45 | | |
Maximum Offering Price Per Share | | $ | 10.64 | | |
CLASS L: | |
Net Assets | | $ | 333 | | |
| Shares Outstanding (unlimited number of shares authorized, no par value) (not in 000's) | | | 32,724 | | |
Net Asset Value, Offering and Redemption Price Per Share | | $ | 10.18 | | |
CLASS C: | |
Net Assets | | $ | 49 | | |
| Shares Outstanding (unlimited number of shares authorized, no par value) (not in 000's) | | | 4,871 | | |
Net Asset Value, Offering and Redemption Price Per Share | | $ | 10.16 | | |
(1) Including:
Securities on Loan, at Value: | | $ | 10,398 | | |
@ Amount is less than $500.
The accompanying notes are an integral part of the financial statements.
17
Morgan Stanley Institutional Fund Trust
Annual Report — September 30, 2015
Core Plus Fixed Income Portfolio
Statement of Operations | | Year Ended
September 30, 2015
(000) | |
Investment Income: | |
Interest from Securities of Unaffiliated Issuers | | $ | 7,667 | | |
Dividends from Security of Affiliated Issuer (Note G) | | | 37 | | |
Income from Securities Loaned — Net | | | 30 | | |
Total Investment Income | | | 7,734 | | |
Expenses: | |
Advisory Fees (Note B) | | | 774 | | |
Sub Transfer Agency Fees — Class I | | | 178 | | |
Sub Transfer Agency Fees — Class A | | | 4 | | |
Sub Transfer Agency Fees — Class L | | | — | @ | |
Sub Transfer Agency Fees — Class C | | | 1 | | |
Administration Fees (Note C) | | | 165 | | |
Professional Fees | | | 120 | | |
Custodian Fees (Note F) | | | 93 | | |
Pricing Fees | | | 51 | | |
Registration Fees | | | 48 | | |
Shareholder Reporting Fees | | | 29 | | |
Transfer Agency Fees — Class I (Note E) | | | 6 | | |
Transfer Agency Fees — Class A (Note E) | | | 3 | | |
Transfer Agency Fees — Class L (Note E) | | | 2 | | |
Transfer Agency Fees — Class C (Note E) | | | 1 | | |
Shareholder Services Fees — Class A (Note D) | | | 9 | | |
Distribution and Shareholder Services Fees — Class L (Note D) | | | 2 | | |
Distribution and Shareholder Services Fees — Class C (Note D) | | | — | @ | |
Trustees' Fees and Expenses | | | 6 | | |
Other Expenses | | | 37 | | |
Total Expenses | | | 1,529 | | |
Waiver of Advisory Fees (Note B) | | | (246 | ) | |
Reimbursement of Class Specific Expenses — Class I (Note B) | | | (185 | ) | |
Reimbursement of Class Specific Expenses — Class A (Note B) | | | (3 | ) | |
Reimbursement of Class Specific Expenses — Class L (Note B) | | | (2 | ) | |
Reimbursement of Class Specific Expenses — Class C (Note B) | | | (1 | ) | |
Rebate from Morgan Stanley Affiliate (Note G) | | | (30 | ) | |
Net Expenses | | | 1,062 | | |
Net Investment Income | | | 6,672 | | |
Realized Gain (Loss): | |
Investments Sold | | | 1,904 | | |
Foreign Currency Forward Exchange Contracts | | | 2,030 | | |
Foreign Currency Transactions | | | (65 | ) | |
Futures Contracts | | | 252 | | |
Swap Agreements | | | (1,172 | ) | |
Net Realized Gain | | | 2,949 | | |
Change in Unrealized Appreciation (Depreciation): | |
Investments | | | (6,048 | ) | |
Foreign Currency Forward Exchange Contracts | | | (478 | ) | |
Foreign Currency Translations | | | 3 | | |
Futures Contracts | | | (138 | ) | |
Swap Agreements | | | (631 | ) | |
Net Change in Unrealized Appreciation (Depreciation) | | | (7,292 | ) | |
Net Realized Gain and Change in Unrealized Appreciation (Depreciation) | | | (4,343 | ) | |
Net Increase in Net Assets Resulting from Operations | | $ | 2,329 | | |
@ Amount is less than $500.
The accompanying notes are an integral part of the financial statements.
18
Morgan Stanley Institutional Fund Trust
Annual Report — September 30, 2015
Core Plus Fixed Income Portfolio
Statements of Changes in Net Assets | | Year Ended
September 30, 2015
(000) | | Year Ended
September 30, 2014
(000) | |
Increase (Decrease) in Net Assets: | |
Operations: | |
Net Investment Income | | $ | 6,672 | | | $ | 5,768 | | |
Net Realized Gain | | | 2,949 | | | | 4,661 | | |
Net Change in Unrealized Appreciation (Depreciation) | | | (7,292 | ) | | | 3,809 | | |
Net Increase in Net Assets Resulting from Operations | | | 2,329 | | | | 14,238 | | |
Distributions from and/or in Excess of: | |
Class I: | |
Net Investment Income | | | (6,016 | ) | | | (5,745 | ) | |
Class A: | |
Net Investment Income | | | (96 | ) | | | (93 | ) | |
Class L: | |
Net Investment Income | | | (7 | ) | | | (2 | ) | |
Class C: | |
Net Investment Income | | | (— | @)* | | | — | | |
Total Distributions | | | (6,119 | ) | | | (5,840 | ) | |
Capital Share Transactions:(1) | |
Class I: | |
Subscribed | | | 41,541 | | | | 23,107 | | |
Distributions Reinvested | | | 6,008 | | | | 5,736 | | |
Redeemed | | | (39,648 | ) | | | (31,232 | ) | |
Class A: | |
Subscribed | | | 2,479 | | | | 1,471 | | |
Distributions Reinvested | | | 96 | | | | 93 | | |
Redeemed | | | (1,892 | ) | | | (1,926 | ) | |
Class L: | |
Subscribed | | | 225 | | | | 14 | | |
Distributions Reinvested | | | 6 | | | | 2 | | |
Class C: | |
Subscribed | | | 50 | * | | | — | | |
Distributions Reinvested | | | — | @* | | | — | | |
Redeemed | | | (— | @)* | | | — | | |
Net Increase (Decrease) in Net Assets Resulting from Capital Share Transactions | | | 8,865 | | | | (2,735 | ) | |
Total Increase in Net Assets | | | 5,075 | | | | 5,663 | | |
Net Assets: | |
Beginning of Period | | | 195,917 | | | | 190,254 | | |
End of Period (Including Accumulated Undistributed Net Investment Income of $4,482 and $3,137) | | $ | 200,992 | | | $ | 195,917 | | |
(1) Capital Share Transactions: | |
Class I: | |
Shares Subscribed | | | 4,007 | | | | 2,271 | | |
Shares Issued on Distributions Reinvested | | | 583 | | | | 574 | | |
Shares Redeemed | | | (3,848 | ) | | | (3,088 | ) | |
Net Increase (Decrease) in Class I Shares Outstanding | | | 742 | | | | (243 | ) | |
Class A: | |
Shares Subscribed | | | 239 | | | | 146 | | |
Shares Issued on Distributions Reinvested | | | 9 | | | | 9 | | |
Shares Redeemed | | | (183 | ) | | | (188 | ) | |
Net Increase (Decrease) in Class A Shares Outstanding | | | 65 | | | | (33 | ) | |
Class L: | |
Shares Subscribed | | | 21 | | | | 1 | | |
Shares Issued on Distributions Reinvested | | | 1 | | | | — | @@ | |
Net Increase in Class L Shares Outstanding | | | 22 | | | | 1 | | |
Class C: | |
Shares Subscribed | | | 5 | * | | | — | | |
Shares Issued on Distributions Reinvested | | | — | @@* | | | — | | |
Shares Redeemed | | | (— | @@)* | | | — | | |
Net Increase in Class C Shares Outstanding | | | 5 | | | | — | | |
* For the period April 30, 2015 through September 30, 2015.
@ Amount is less than $500.
@@ Amount is less than 500 shares.
The accompanying notes are an integral part of the financial statements.
19
Morgan Stanley Institutional Fund Trust
Annual Report — September 30, 2015
Financial Highlights
Core Plus Fixed Income Portfolio
| | | Class I | |
| | | Year Ended September 30, | |
Selected Per Share Data and Ratios | | 2015 | | 2014 | | 2013 | | 2012 | | 2011 | |
Net Asset Value, Beginning of Period | | $ | 10.36 | | | $ | 9.91 | | | $ | 10.48 | | | $ | 9.92 | | | $ | 9.96 | | |
Income (Loss) from Investment Operations: | |
Net Investment Income† | | | 0.33 | | | | 0.31 | | | | 0.32 | | | | 0.39 | | | | 0.38 | | |
Net Realized and Unrealized Gain (Loss) | | | (0.20 | ) | | | 0.45 | | | | (0.36 | ) | | | 0.63 | | | | (0.02 | ) | |
Total from Investment Operations | | | 0.13 | | | | 0.76 | | | | (0.04 | ) | | | 1.02 | | | | 0.36 | | |
Distributions from and/or in Excess of: | |
Net Investment Income | | | (0.31 | ) | | | (0.31 | ) | | | (0.53 | ) | | | (0.46 | ) | | | (0.40 | ) | |
Net Asset Value, End of Period | | $ | 10.18 | | | $ | 10.36 | | | $ | 9.91 | | | $ | 10.48 | | | $ | 9.92 | | |
Total Return++ | | | 1.15 | % | | | 7.82 | % | | | (0.42 | )% | | | 10.62 | % | | | 3.74 | % | |
Ratios and Supplemental Data: | |
Net Assets, End of Period (Thousands) | | $ | 197,057 | | | $ | 192,868 | | | $ | 187,014 | | | $ | 227,331 | | | $ | 295,226 | | |
Ratio of Expenses to Average Net Assets (1) | | | 0.51 | %+^^ | | | 0.61 | %+ | | | 0.71 | %+^ | | | 0.62 | %+ | | | 0.66 | %+ | |
Ratio of Net Investment Income to Average Net Assets (1) | | | 3.24 | %+^^ | | | 3.02 | %+ | | | 3.14 | %+^ | | | 3.88 | %+ | | | 3.88 | %+ | |
Ratio of Rebate from Morgan Stanley Affiliates to Average Net Assets | | | 0.01 | % | | | 0.01 | % | | | 0.01 | % | | | 0.01 | % | | | 0.00 | %§ | |
Portfolio Turnover Rate | | | 348 | % | | | 296 | % | | | 226 | % | | | 189 | % | | | 225 | % | |
(1) Supplemental Information on the Ratios to Average Net Assets: | |
Ratios Before Expense Limitation: | |
Expenses to Average Net Assets | | | 0.73 | % | | | 0.81 | % | | | 0.73 | % | | | N/A | | | | N/A | | |
Net Investment Income to Average Net Assets | �� | | 3.02 | % | | | 2.82 | % | | | 3.12 | % | | | N/A | | | | N/A | | |
† Per share amount is based on average shares outstanding.
++ Calculated based on the net asset value as of the last business day of the period.
+ The Ratios of Expenses and Net Investment Income reflect the rebate of certain Portfolio expenses in connection with the investments in Morgan Stanley affiliates during the period. The effect of the rebate on the ratios is disclosed in the above table as "Ratio of Rebate from Morgan Stanley Affiliates to Average Net Assets."
^^ Effective October 6, 2014, the Adviser has agreed to limit the ratio of expenses to average net assets to the maximum ratio of 0.52% for Class I shares. Prior to October 6, 2014, the maximum ratio was 0.62% for Class I shares.
^ Effective September 16, 2013, the Adviser has agreed to limit the ratio of expenses to average net assets to the maximum ratio of 0.62% for Class I shares.
§ Amount is less than 0.005%.
The accompanying notes are an integral part of the financial statements.
20
Morgan Stanley Institutional Fund Trust
Annual Report — September 30, 2015
Financial Highlights
Core Plus Fixed Income Portfolio
| | | Class A | |
| | | Year Ended September 30, | |
Selected Per Share Data and Ratios | | 2015 | | 2014 | | 2013 | | 2012 | | 2011 | |
Net Asset Value, Beginning of Period | | $ | 10.37 | | | $ | 9.93 | | | $ | 10.50 | | | $ | 9.94 | | | $ | 9.97 | | |
Income (Loss) from Investment Operations: | |
Net Investment Income† | | | 0.30 | | | | 0.27 | | | | 0.29 | | | | 0.37 | | | | 0.36 | | |
Net Realized and Unrealized Gain (Loss) | | | (0.21 | ) | | | 0.45 | | | | (0.36 | ) | | | 0.62 | | | | (0.02 | ) | |
Total from Investment Operations | | | 0.09 | | | | 0.72 | | | | (0.07 | ) | | | 0.99 | | | | 0.34 | | |
Distributions from and/or in Excess of: | |
Net Investment Income | | | (0.27 | ) | | | (0.28 | ) | | | (0.50 | ) | | | (0.43 | ) | | | (0.37 | ) | |
Net Asset Value, End of Period | | $ | 10.19 | | | $ | 10.37 | | | $ | 9.93 | | | $ | 10.50 | | | $ | 9.94 | | |
Total Return++ | | | 0.90 | % | | | 7.35 | % | | | (0.68 | )% | | | 10.31 | % | | | 3.57 | % | |
Ratios and Supplemental Data: | |
Net Assets, End of Period (Thousands) | | $ | 3,553 | | | $ | 2,941 | | | $ | 3,152 | | | $ | 3,673 | | | $ | 4,654 | | |
Ratio of Expenses to Average Net Assets (1) | | | 0.86 | %+^^ | | | 0.96 | %+ | | | 0.96 | %+^ | | | 0.87 | %+ | | | 0.91 | %+ | |
Ratio of Net Investment Income to Average Net Assets (1) | | | 2.87 | %+^^ | | | 2.67 | %+ | | | 2.89 | %+^ | | | 3.63 | %+ | | | 3.63 | %+ | |
Ratio of Rebate from Morgan Stanley Affiliates to Average Net Assets | | | 0.01 | % | | | 0.01 | % | | | 0.01 | % | | | 0.01 | % | | | 0.00 | %§ | |
Portfolio Turnover Rate | | | 348 | % | | | 296 | % | | | 226 | % | | | 189 | % | | | 225 | % | |
(1) Supplemental Information on the Ratios to Average Net Assets: | |
Ratios Before Expense Limitation: | |
Expenses to Average Net Assets | | | 1.07 | % | | | 1.11 | % | | | 0.98 | % | | | N/A | | | | N/A | | |
Net Investment Income to Average Net Assets | | | 2.66 | % | | | 2.52 | % | | | 2.87 | % | | | N/A | | | | N/A | | |
† Per share amount is based on average shares outstanding.
++ Calculated based on the net asset value which does not reflect sales charges, if applicable, as of the last business day of the period.
+ The Ratios of Expenses and Net Investment Income reflect the rebate of certain Portfolio expenses in connection with the investments in Morgan Stanley affiliates during the period. The effect of the rebate on the ratios is disclosed in the above table as "Ratio of Rebate from Morgan Stanley Affiliates to Average Net Assets."
^^ Effective October 6, 2014, the Adviser has agreed to limit the ratio of expenses to average net assets to the maximum ratio of 0.87% for Class A shares. Prior to October 6, 2014, the maximum ratio was 0.97% for Class A shares.
^ Effective September 16, 2013, the Adviser has agreed to limit the ratio of expenses to average net assets to the maximum ratio of 0.97% for Class A shares.
§ Amount is less than 0.005%.
The accompanying notes are an integral part of the financial statements.
21
Morgan Stanley Institutional Fund Trust
Annual Report — September 30, 2015
Financial Highlights
Core Plus Fixed Income Portfolio
| | | Class L | |
| | | Year Ended September 30, | | Period from
April 27, 2012^ to | |
Selected Per Share Data and Ratios | | 2015 | | 2014 | | 2013 | | September 30, 2012 | |
Net Asset Value, Beginning of Period | | $ | 10.37 | | | $ | 9.92 | | | $ | 10.49 | | | $ | 10.14 | | |
Income (Loss) from Investment Operations: | |
Net Investment Income† | | | 0.27 | | | | 0.25 | | | | 0.27 | | | | 0.11 | | |
Net Realized and Unrealized Gain (Loss) | | | (0.21 | ) | | | 0.45 | | | | (0.36 | ) | | | 0.35 | | |
Total from Investment Operations | | | 0.06 | | | | 0.70 | | | | (0.09 | ) | | | 0.46 | | |
Distributions from and/or in Excess of: | |
Net Investment Income | | | (0.25 | ) | | | (0.25 | ) | | | (0.48 | ) | | | (0.11 | ) | |
Net Asset Value, End of Period | | $ | 10.18 | | | $ | 10.37 | | | $ | 9.92 | | | $ | 10.49 | | |
Total Return++ | | | 0.59 | % | | | 7.19 | % | | | (0.95 | )% | | | 4.59 | %# | |
Ratios and Supplemental Data: | |
Net Assets, End of Period (Thousands) | | $ | 333 | | | $ | 108 | | | $ | 88 | | | $ | 130 | | |
Ratio of Expenses to Average Net Assets (1) | | | 1.11 | %+^^^ | | | 1.21 | %+ | | | 1.21 | %+^^ | | | 1.16 | %+* | |
Ratio of Net Investment Income to Average Net Assets (1) | | | 2.65 | %+^^^ | | | 2.42 | %+ | | | 2.64 | %+^^ | | | 2.60 | %+* | |
Ratio of Rebate from Morgan Stanley Affiliates to Average Net Assets | | | 0.02 | % | | | 0.01 | % | | | 0.01 | % | | | 0.01 | %* | |
Portfolio Turnover Rate | | | 348 | % | | | 296 | % | | | 226 | % | | | 189 | %# | |
(1) Supplemental Information on the Ratios to Average Net Assets: | |
Ratios Before Expense Limitation: | |
Expenses to Average Net Assets | | | 1.76 | % | | | 3.10 | % | | | 1.27 | % | | | N/A | | |
Net Investment Income to Average Net Assets | | | 2.00 | % | | | 0.53 | % | | | 2.58 | % | | | N/A | | |
^ Commencement of Operations.
† Per share amount is based on average shares outstanding.
++ Calculated based on the net asset value as of the last business day of the period.
+ The Ratios of Expenses and Net Investment Income reflect the rebate of certain Portfolio expenses in connection with the investments in Morgan Stanley affiliates during the period. The effect of the rebate on the ratios is disclosed in the above table as "Ratio of Rebate from Morgan Stanley Affiliates to Average Net Assets."
^^^ Effective October 6, 2014, the Adviser has agreed to limit the ratio of expenses to average net assets to the maximum ratio of 1.12% for Class L shares. Prior to October 6, 2014, the maximum ratio was 1.22% for Class L shares.
^^ Effective September 16, 2013, the Adviser has agreed to limit the ratio of expenses to average net assets to the maximum ratio of 1.22% for Class L shares.
# Not Annualized.
* Annualized.
The accompanying notes are an integral part of the financial statements.
22
Morgan Stanley Institutional Fund Trust
Annual Report — September 30, 2015
Financial Highlights
Core Plus Fixed Income Portfolio
| | | Class C | |
Selected Per Share Data and Ratios | | Period from April 30, 2015^
to September 30, 2015 | |
Net Asset Value, Beginning of Period | | $ | 10.44 | | |
Income (Loss) from Investment Operations: | |
Net Investment Income† | | | 0.10 | | |
Net Realized and Unrealized Loss | | | (0.31 | ) | |
Total from Investment Operations | | | (0.21 | ) | |
Distributions from and/or in Excess of: | |
Net Investment Income | | | (0.07 | ) | |
Net Asset Value, End of Period | | $ | 10.16 | | |
Total Return++ | | | (2.02 | )%# | |
Ratios and Supplemental Data: | |
Net Assets, End of Period, (Thousands) | | $ | 49 | | |
Ratios of Expenses to Average Net Assets (1) | | | 1.61 | %+* | |
Ratio of Net Investment Income to Average Net Assets (1) | | | 2.23 | %+* | |
Ratio of Rebate from Morgan Stanley Affiliates to Average Net Assets | | | 0.01 | %* | |
Portfolio Turnover Rate | | | 348 | %# | |
(1) Supplemental Information on the Ratios to Average Net Assets: | |
Ratios Before Expense Limitation: | |
Expense to Average Net Assets | | | 14.06 | %* | |
Net Investment Loss to Average Net Assets | | | (10.22 | )%* | |
^ Commencement of Operations.
† Per share amount is based on average shares outstanding.
++ Calculated based on the net asset value which does not reflect sales charges, if applicable, as of the last business day of the period.
+ The Ratios of Expenses and Net Investment Income reflect the rebate of certain Portfolio expenses in connection with the investments in Morgan Stanley affiliates during the period. The effect of the rebate on the ratios is disclosed in the above table as "Ratio of Rebate from Morgan Stanley Affiliates to Average Net Assets."
# Not Annualized.
* Annualized.
The accompanying notes are an integral part of the financial statements.
23
Morgan Stanley Institutional Fund Trust
Annual Report — September 30, 2015
Notes to Financial Statements
Morgan Stanley Institutional Fund Trust ("MSIFT" or the "Fund'') is registered under the Investment Company Act of 1940, as amended (the "Act''), as an open-end management investment company. The Fund is comprised of nine separate, active portfolios (individually referred to as a "Portfolio", collectively as the "Portfolios"). The Fund applies investment company accounting and reporting guidance. All Portfolios are considered diversified for purposes of the Act.
The accompanying financial statements relate to the Core Plus Fixed Income Portfolio. The Portfolio seeks above-average total return over a market cycle of three to five years. The Portfolio offers four classes of shares — Class I, Class A, Class L and Class C.
On April 30, 2015, the Portfolio commenced offering Class C shares.
A. Significant Accounting Policies: The following significant accounting policies are in conformity with U.S. generally accepted accounting principles ("GAAP"). Such policies are consistently followed by the Fund in the preparation of its financial statements. GAAP may require management to make estimates and assumptions that affect the reported amounts and disclosures in the financial statements. Actual results may differ from those estimates.
1. Security Valuation: (1) Certain portfolio securities may be valued by an outside pricing service approved by the Fund's Board of Trustees (the "Trustees"). The pricing service may utilize a matrix system or other model incorporating attributes such as security quality, maturity and coupon as the evaluation model parameters, and/or research evaluations by its staff, including review of broker-dealer market price quotations in determining what it believes is the fair valuation of the portfolios securities valued by such pricing service; (2) futures are valued at the latest price published by the commodities exchange on which they trade; (3) swaps are marked-to-market daily based upon quotations from market makers; (4) when market quotations are not readily available, including circumstances under which Morgan Stanley Investment Management Inc. (the "Adviser") determines that the closing price, last sale price or the mean between the last reported bid and asked prices are not reflective of a security's market value, portfolio securities are valued at their fair value as determined in good faith under procedures established by and under the general supervision of the Trustees. Occasionally, developments affecting the closing prices of securities and other assets may occur between the
times at which valuations of such securities are determined (that is, close of the foreign market on which the securities trade) and the close of business of the New York Stock Exchange ("NYSE"). If developments occur during such periods that are expected to materially affect the value of such securities, such valuations may be adjusted to reflect the estimated fair value of such securities as of the close of the NYSE, as determined in good faith by the Trustees or by the Adviser using a pricing service and/or procedures approved by the Trustees; (5) quotations of foreign portfolio securities, other assets and liabilities and forward contracts stated in foreign currency are translated into U.S. dollar equivalents at the prevailing market rates prior to the close of the NYSE; (6) investments in mutual funds, including the Morgan Stanley Institutional Liquidity Funds, are valued at the net asset value ("NAV") as of the close of each business day; and (7) short-term taxable debt securities with remaining maturities of 60 days or less at the time of purchase may be valued at amortized cost, unless the Adviser determines such price does not reflect the securities' market value, in which case these securities will be valued at their fair market value determined by the Adviser. Other taxable short-term debt securities with maturities of more than 60 days will be valued on a mark-to-market basis until such time as they reach a maturity of 60 days, whereupon they will be valued at amortized cost using their value on the 61st day unless the Adviser determines such price does not reflect the securities' fair value, in which case these securities will be valued at their fair market value as determined by the Adviser.
The Trustees have responsibility for determining in good faith the fair value of the investments, and the Trustees may appoint others, such as the Fund's Adviser or a valuation committee, to assist the Trustees in determining fair value and to make the actual calculations pursuant to the fair valuation methodologies previously approved by the Trustees. Under procedures approved by the Trustees, the Fund's Adviser has formed a Valuation Committee whose members are approved by the Trustees. The Valuation Committee provides administration and oversight of the Fund's valuation policies and procedures, which are reviewed at least annually by the Trustees. These procedures allow the Fund to utilize independent pricing services, quotations from securities and financial instrument dealers, and other market sources to determine fair value.
24
Morgan Stanley Institutional Fund Trust
Annual Report — September 30, 2015
Notes to Financial Statements (cont'd)
The Fund has procedures to determine the fair value of securities and other financial instruments for which market prices are not readily available. Under these procedures, the Valuation Committee convenes on a regular and ad hoc basis to review such securities and considers a number of factors, including valuation methodologies and significant unobservable valuation inputs, when arriving at fair value. The Valuation Committee may employ a market-based approach which may use related or comparable assets or liabilities, recent transactions, market multiples, book values, and other relevant information for the investment to determine the fair value of the investment. An income-based valuation approach may also be used in which the anticipated future cash flows of the investment are discounted to calculate fair value. Discounts may also be applied due to the nature or duration of any restrictions on the disposition of the investments. Due to the inherent uncertainty of valuations of such investments, the fair values may differ significantly from the values that would have been used had an active market existed. The Valuation Committee employs various methods for calibrating these valuation approaches including a regular review of valuation methodologies, key inputs and assumptions, transactional back-testing or disposition analysis, and reviews of any related market activity.
2. Fair Value Measurement: Financial Accounting Standards Board ("FASB") Accounting Standards CodificationTM ("ASC") 820, "Fair Value Measurement" ("ASC 820"), defines fair value as the value that the Fund would receive to sell an investment or pay to transfer a liability in a timely transaction with an independent buyer in the principal market, or in the absence of a principal market the most advantageous market for the investment or liability. ASC 820 establishes a three-tier hierarchy to distinguish between (1) inputs that reflect the assumptions market participants would use in valuing an asset or liability developed based on market data obtained from sources independent of the reporting entity (observable inputs) and (2) inputs that reflect the reporting entity's own assumptions about the assumptions market participants would use in valuing an asset or liability developed based on the best information available in the circumstances (unobservable inputs) and to establish classification of fair value measurements for disclosure purposes. Various inputs are used in determining the value of the Fund's
investments. The inputs are summarized in the three broad levels listed below.
• Level 1 – unadjusted quoted prices in active markets for identical investments
• Level 2 – other significant observable inputs (including quoted prices for similar investments, interest rates, prepayment speeds, credit risk, etc.)
• Level 3 – significant unobservable inputs including the Fund's own assumptions in determining the fair value of investments. Factors considered in making this determination may include, but are not limited to, information obtained by contacting the issuer, analysts, or the appropriate stock exchange (for exchange-traded securities), analysis of the issuer's financial statements or other available documents and, if necessary, available information concerning other securities in similar circumstances
The inputs or methodology used for valuing securities are not necessarily an indication of the risk associated with investing in those securities and the determination of the significance of a particular input to the fair value measurement in its entirety requires judgment and considers factors specific to each security.
The following is a summary of the inputs used to value the Portfolio's investments as of September 30, 2015.
Investment Type | | Level 1
Unadjusted
quoted
prices
(000) | | Level 2
Other
significant
observable
inputs
(000) | | Level 3
Significant
unobservable
inputs
(000) | | Total
(000) | |
Assets: | |
Fixed Income Securities | |
Agency Adjustable Rate
Mortgage | | $ | — | | | $ | 1,018 | | | $ | — | | | $ | 1,018 | | |
Agency Fixed Rate
Mortgages | | | — | | | | 40,508 | | | | — | | | | 40,508 | | |
Asset-Backed Securities | | | — | | | | 9,452 | | | | — | | | | 9,452 | | |
Collateralized Mortgage
Obligations — Agency
Collateral Series | | | — | | | | 5,662 | | | | — | | | | 5,662 | | |
Commercial
Mortgage-Backed
Securities | | | — | | | | 15,223 | | | | — | | | | 15,223 | | |
Corporate Bonds | | | — | | | | 74,382 | | | | — | | | | 74,382 | | |
Mortgages — Other | | | — | | | | 18,137 | | | | — | | | | 18,137 | | |
Municipal Bonds | | | — | | | | 2,323 | | | | — | | | | 2,323 | | |
Sovereign | | | — | | | | 15,406 | | | | — | | | | 15,406 | | |
25
Morgan Stanley Institutional Fund Trust
Annual Report — September 30, 2015
Notes to Financial Statements (cont'd)
Investment Type | | Level 1
Unadjusted
quoted
prices
(000) | | Level 2
Other
significant
observable
inputs
(000) | | Level 3
Significant
unobservable
inputs
(000) | | Total
(000) | |
Fixed Income
Securities (cont'd) | |
U.S. Agency Securities | | $ | — | | | $ | 3,432 | | | $ | — | | | $ | 3,432 | | |
U.S. Treasury Securities | | | — | | | | 15,025 | | | | — | | | | 15,025 | | |
Total Fixed Income
Securities | | | — | | | | 200,568 | | | | — | | | | 200,568 | | |
Short-Term Investments | |
Investment Company | | | 25,450 | | | | — | | | | — | | | | 25,450 | | |
Repurchase Agreements | | | — | | | | 711 | | | | — | | | | 711 | | |
U.S Treasury Security | | | — | | | | 1,488 | | | | — | | | | 1,488 | | |
Total Short-Term
Investments | | | 25,450 | | | | 2,199 | | | | — | | | | 27,649 | | |
Foreign Currency Forward
Exchange Contracts | | | — | | | | 87 | | | | — | | | | 87 | | |
Futures Contracts | | | 280 | | | | — | | | | — | | | | 280 | | |
Credit Default Swap
Agreements | | | — | | | | 42 | | | | — | | | | 42 | | |
Total Assets | | | 25,730 | | | | 202,896 | | | | — | | | | 228,626 | | |
Liabilities: | |
Foreign Currency Forward
Exchange Contracts | | | — | | | | (27 | ) | | | — | | | | (27 | ) | |
Futures Contract | | | (359 | ) | | | — | | | | — | | | | (359 | ) | |
Credit Default Swap
Agreements | | | — | | | | (57 | ) | | | — | | | | (57 | ) | |
Interest Rate Swap
Agreements | | | — | | | | (353 | ) | | | — | | | | (353 | ) | |
Total Liabilities | | | (359 | ) | | | (437 | ) | | | — | | | | (796 | ) | |
Total | | $ | 25,371 | | | $ | 202,459 | | | $ | — | | | $ | 227,830 | | |
Transfers between investment levels may occur as the markets fluctuate and/or the availability of data used in an investment's valuation changes. The Portfolio recognizes transfers between the levels as of the end of the period. As of September 30, 2015, the Portfolio did not have any investments transfer between investment levels.
3. Repurchase Agreements: The Portfolio may enter into repurchase agreements under which the Portfolio lends cash and takes possession of securities with an agreement that the counterparty will repurchase such securities. In connection with transactions in repurchase agreements, a bank as custodian for the Portfolio takes possession of the underlying securities which are held as collateral, with a market value at least equal to the amount of the repurchase transaction, including principal and accrued interest. To the extent that any repurchase transaction exceeds one business day, the value of the collateral is marked-to-market on a daily basis to determine that the value of the collateral does not decrease below the repurchase price plus accrued interest as earned. If such a decrease occurs, additional collateral will be requested and,
when received, will be added to the account to maintain full collateralization. In the event of default on the obligation to repurchase, the Portfolio has the right to liquidate the collateral and apply the proceeds in satisfaction of the obligation. In the event of default or bankruptcy by the counterparty to the agreement, realization of the collateral proceeds may be subject to cost and delays. The Portfolio, along with other affiliated investment companies, may utilize a joint trading account for the purpose of entering into repurchase agreements.
4. Foreign Currency Translation and Foreign Investments: The books and records of the Portfolio are maintained in U.S. dollars. Foreign currency amounts are translated into U.S. dollars as follows:
– investments, other assets and liabilities at the prevailing rate of exchange on the valuation date;
– investment transactions and investment income at the prevailing rates of exchange on the dates of such transactions.
Although the net assets of the Portfolio are presented at the foreign exchange rates and market values at the close of the period, the Portfolio does not isolate that portion of the results of operations arising as a result of changes in the foreign exchange rates from the fluctuations arising from changes in the market prices of securities held at period end. Similarly, the Portfolio does not isolate the effect of changes in foreign exchange rates from the fluctuations arising from changes in the market prices of securities sold during the period. Accordingly, realized and unrealized foreign currency gains (losses) on investments in securities are included in the reported net realized and unrealized gains (losses) on investment transactions and balances. However, pursuant to U.S. Federal income tax regulations, gains and losses from certain foreign currency transactions and the foreign currency portion of gains and losses realized on sales and maturities of foreign denominated debt securities are treated as ordinary income for U.S. Federal income tax purposes.
Net realized gains (losses) on foreign currency transactions represent net foreign exchange gains (losses) from foreign currency forward exchange contracts, disposition of foreign currencies, currency gains (losses) realized between the trade and settlement dates on securities transactions, and the difference between the amount of
26
Morgan Stanley Institutional Fund Trust
Annual Report — September 30, 2015
Notes to Financial Statements (cont'd)
investment income and foreign withholding taxes recorded on the Portfolio's books and the U.S. dollar equivalent amounts actually received or paid. Net unrealized currency gains (losses) from valuing foreign currency denominated assets and liabilities at period end exchange rates are reflected as a component of unrealized appreciation (depreciation) in the Statement of Assets and Liabilities. The change in unrealized currency gains (losses) on foreign currency translations on foreign currency translations for the period is reflected in the Statement of Operations.
Foreign security and currency transactions may involve certain considerations and risks not typically associated with those of U.S. dollar denominated transactions as a result of, among other factors, fluctuations of exchange rates in relation to the U.S. dollar, the possibility of lower levels of governmental supervision and regulation of foreign securities markets and the possibility of political or economic instability.
Governmental approval for foreign investments may be required in advance of making an investment under certain circumstances in some countries, and the extent of foreign investments in domestic companies may be subject to limitation in other countries. Foreign ownership limitations also may be imposed by the charters of individual companies to prevent, among other concerns, violations of foreign investment limitations. As a result, an additional class of shares (identified as "Foreign" in the Portfolio of Investments) may be created and offered for investment. The "local" and "foreign shares" market values may differ. In the absence of trading of the foreign shares in such markets, the Portfolio values the foreign shares at the closing exchange price of the local shares.
5. Derivatives: The Portfolio may, but is not required to, use derivative instruments for a variety of purposes, including hedging, risk management, portfolio management or to earn income. Derivatives are financial instruments whose value is based, in part, on the value of an underlying asset, interest rate, index or financial instrument. Prevailing interest rates and volatility levels, among other things, also affect the value of derivative instruments. A derivative instrument often has risks similar to its underlying asset and may have additional risks, including imperfect correlation between the value of the derivative and the underlying asset, risks of default by the counterparty to certain transactions, magnification of losses incurred due
to changes in the market value of the securities, instruments, indices or interest rates to which the derivative instrument relates, risks that the transactions may not be liquid and risks arising from margin requirements. The use of derivatives involves risks that are different from, and possibly greater than, the risks associated with other portfolio investments. Derivatives may involve the use of highly specialized instruments that require investment techniques and risk analyses different from those associated with other portfolio investments. All of the Portfolio's holdings, including derivative instruments, are marked-to-market each day with the change in value reflected in unrealized appreciation (depreciation). Upon disposition, a realized gain or loss is recognized.
Certain derivative transactions may give rise to a form of leverage. Leverage magnifies the potential for gain and the risk of loss. Leverage associated with derivative transactions may cause the Portfolio to liquidate portfolio positions when it may not be advantageous to do so to satisfy its obligations or to meet earmarking or segregation requirements, pursuant to applicable Securities and Exchange Commission rules and regulations, or may cause the Portfolio to be more volatile than if the Portfolio had not been leveraged. Although the Adviser seeks to use derivatives to further the Portfolio's investment objectives, there is no assurance that the use of derivatives will achieve this result.
Following is a description of the derivative instruments and techniques that the Portfolio used during the period and their associated risks:
Futures: A futures contract is a standardized, exchange-traded agreement to buy or sell a specific quantity of an underlying asset, reference rate or index at a specific price at a specific future time. The value of a futures contract tends to increase and decrease in tandem with the value of the underlying instrument. Depending on the terms of the particular contract, futures contracts are settled through either physical delivery of the underlying instrument on the settlement date or by payment of a cash settlement amount on the settlement date. During the period the futures contract is open, payments are received from or made to the broker based upon changes in the value of the contract (the variation margin). A decision as to whether, when and how to use futures contracts involves the exercise of skill and judgment and even a well-conceived futures transaction may be
27
Morgan Stanley Institutional Fund Trust
Annual Report — September 30, 2015
Notes to Financial Statements (cont'd)
unsuccessful because of market behavior or unexpected events. In addition to the derivatives risks discussed above, the prices of futures contracts can be highly volatile, using futures contracts can lower total return, and the potential loss from futures contracts can exceed the Portfolio's initial investment in such contracts. No assurance can be given that a liquid market will exist for any particular futures contract at any particular time. There is also the risk of loss by the Portfolio of margin deposits in the event of bankruptcy of a broker with which the Portfolio has open positions in the futures contract.
Swaps: The Portfolio may enter into over-the-counter ("OTC") swap contracts or cleared swap transactions. A swap contract is an agreement between two parties pursuant to which the parties exchange payments at specified dates on the basis of a specified notional amount, with the payments calculated by reference to specified securities, indices, reference rates, currencies or other instruments. Typically swap agreements provide that when the period payment dates for both parties are the same, the payments are made on a net basis (i.e., the two payment streams are netted out, with only the net amount paid by one party to the other). The Portfolio's obligations or rights under a swap contract entered into on a net basis will generally be equal only to the net amount to be paid or received under the agreement, based on the relative values of the positions held by each party. Cleared swap transactions may help reduce counterparty credit risk. In a cleared swap, the Portfolio's ultimate counterparty is a clearinghouse rather than a swap dealer, bank or other financial institution. OTC swap agreements are not entered into or traded on exchanges and often there is no central clearing or guaranty function for OTC swaps. These OTC swaps are often subject to credit risk or the risk of default or non-performance by the counterparty. Both OTC and cleared swaps could result in losses if interest rates, foreign currency exchange rates or other factors are not correctly anticipated by the Portfolio or if the reference index, security or investments do not perform as expected. During the period swap agreements are open, payments are received from or made to the clearinghouse or counterparty based upon changes in the value of the contract (variation margin). The Dodd-Frank Wall Street Reform and Consumer Protection Act and
related regulatory developments require the clearing and exchange-trading of certain standardized swap transactions. Mandatory exchange-trading and clearing is occurring on a phased-in basis.
The Portfolio's use of swaps during the period included those based on the credit of an underlying security commonly referred to as "credit default swaps." The Portfolio may be either the buyer or seller in a credit default swap. Where the Portfolio is the buyer of a credit default swap contract, it would typically be entitled to receive the par (or other agreed-upon) value of a referenced debt obligation from the counterparty to the contract only in the event of a default or similar event by the issuer of the debt obligation. If no default occurs, the Portfolio would have paid to the counterparty a periodic stream of payments over the term of the contract and received no benefit from the contract. When the Portfolio is the seller of a credit default swap contract, it typically receives the stream of payments but is obligated to pay an amount equal to the par (or other agreed-upon) value of a referenced debt obligation upon the default or similar event by the issuer of the referenced debt obligation. The use of credit default swaps could result in losses to the Portfolio if the Adviser fails to correctly evaluate the creditworthiness of the issuer of the referenced debt obligation.
If the Portfolio is a seller of protection and a credit event occurs, as defined under the terms of that particular swap agreement, the Portfolio will either (i) pay to the buyer of protection an amount equal to the notional amount of the swap agreement and take delivery of the referenced obligation, other deliverable obligations or underlying securities comprising the referenced index or (ii) pay a net settlement amount in the form of cash or securities equal to the notional amount of the swap agreement less the recovery value of the referenced obligation or underlying securities comprising the referenced index. If the Portfolio is a buyer of protection and a credit event occurs, as defined under the terms of that particular swap agreement, the Portfolio will either (i) receive from the seller of protection an amount equal to the notional amount of the swap agreement and deliver the referenced obligation, other deliverable obligations or underlying securities comprising the referenced index or (ii) receive a net settlement amount in the form of cash or securities equal to the notional amount of the
28
Morgan Stanley Institutional Fund Trust
Annual Report — September 30, 2015
Notes to Financial Statements (cont'd)
swap agreement less the recovery value of the referenced obligation or underlying securities comprising the referenced index. Recovery values are estimated by market makers considering either industry standard recovery rates or entity specific factors and considerations until a credit event occurs. If a credit event has occurred, the recovery value is determined by a facilitated auction whereby a minimum number of allowable broker bids, together with a specified valuation method, are used to calculate the settlement value. The Portfolio's maximum risk of loss from counterparty risk, either as the protection seller or as the protection buyer, is the fair value of the swap agreement.
The current credit rating of each individual issuer is listed in the table following the Portfolio of Investments and serves as an indicator of the current status of the payment/performance risk of the credit derivative. Alternatively, for credit default swaps on an index of credits, the quoted market prices and current values serve as an indicator of the current status of the payment/performance risk of the credit derivative. Generally, lower credit ratings and increasing market values, in absolute terms, represent a deterioration of the credit and a greater likelihood of an adverse credit event of the issuer.
When the Portfolio has an unrealized loss on a swap agreement, the Portfolio has instructed the custodian to pledge cash or liquid securities as collateral with a value approximately equal to the amount of the unrealized loss. Collateral pledges are monitored and subsequently adjusted if and when the swap valuations fluctuate. If applicable, cash collateral is included with "Due from (to) Broker" in the Statement of Assets and Liabilities.
Upfront payments received or paid by the Portfolio will be reflected as an asset or liability, respectively, in the Statement of Assets and Liabilities.
Foreign Currency Forward Exchange Contracts: In connection with its investments in foreign securities, the Portfolio also entered into contracts with banks, brokers or dealers to purchase or sell securities or foreign currencies at a future date. A foreign currency forward exchange contract ("currency contract") is a negotiated agreement between the contracting parties to exchange a specified amount of currency at a specified future time at a specified rate. The rate can be higher or lower than the spot rate between the currencies that are the subject
of the contract. Currency contracts may be used to protect against uncertainty in the level of future foreign currency exchange rates or to gain or modify exposure to a particular currency. In addition, the Portfolio may use cross currency hedging or proxy hedging with respect to currencies in which the Portfolio has or expects to have portfolio or currency exposure. Cross currency hedges involve the sale of one currency against the positive exposure to a different currency and may be used for hedging purposes or to establish an active exposure to the exchange rate between any two currencies. To the extent hedged by the use of currency contracts, the precise matching of the currency contract amounts and the value of the securities involved will not generally be possible because the future value of such securities in foreign currencies will change as a consequence of market movements in the value of those securities between the date on which the contract is entered into and the date it matures. Furthermore, such transactions may reduce or preclude the opportunity for gain if the value of the currency should move in the direction opposite to the position taken. There is additional risk to the extent that currency contracts create exposure to currencies in which the Portfolio's securities are not denominated. Unanticipated changes in currency prices may result in poorer overall performance for the Portfolio than if it had not entered into such contracts. The use of currency contracts involves the risk of loss from the insolvency or bankruptcy of the counterparty to the contract or the failure of the counterparty to make payments or otherwise comply with the terms of the contract. A currency contract is marked-to-market daily and the change in market value is recorded by the Portfolio as unrealized gain or loss. The Portfolio records realized gains (losses) when the currency contract is closed equal to the difference between the value of the currency contract at the time it was opened and the value at the time it was closed.
FASB ASC 815, "Derivatives and Hedging" ("ASC 815"), is intended to improve financial reporting about derivative instruments by requiring enhanced disclosures to enable investors to better understand how and why the Portfolio uses derivative instruments, how these derivative instruments are accounted for and their effects on the Portfolio's financial position and results of operations.
29
Morgan Stanley Institutional Fund Trust
Annual Report — September 30, 2015
Notes to Financial Statements (cont'd)
The following tables set forth the fair value of the Portfolio's derivative contracts by primary risk exposure as of September 30, 2015.
| | | Asset Derivatives
Statement of Assets and
Liabilities Location | | Primary Risk
Exposure | | Value
(000) | |
Foreign Currency
Forward Exchange
Contracts | | Unrealized Appreciation on
Foreign Currency Forward
Exchange Contracts | |
Currency Risk | | $ | 87 | | |
Futures Contracts
| | Variation Margin on
Futures Contracts | |
Interest Rate Risk | | | 280 | (a) | |
Swap Agreement
| | Unrealized Appreciation on
Swap Agreement | |
Credit Risk | | | 1 | | |
Swap Agreement
| | Variation Margin on
Swap Agreement | |
Credit Risk | | | 41 | (a) | |
Total | | | | | | $ | 409 | | |
| | | Liability Derivatives
Statement of Assets and
Liabilities Location | | Primary Risk
Exposure | | Value
(000) | |
Foreign Currency
Forward Exchange
Contracts | | Unrealized Depreciation on
Foreign Currency Forward
Exchange Contracts | |
Currency Risk | | $ | (27 | ) | |
Futures Contracts
| | Variation Margin on
Futures Contracts | |
Interest Rate Risk | | | (359 | )(a) | |
Swap Agreements
| | Unrealized Depreciation on
Swap Agreements | |
Credit Risk | | | (57 | ) | |
Swap Agreements
| | Variation Margin on
Swap Agreements | |
Interest Rate Risk | | | (353 | )(a) | |
Total | | | | | | $ | (796 | ) | |
(a) This amount represents the cumulative appreciation (depreciation) as reported in the Portfolio of Investments. The Statement of Assets and Liabilities only reflects the current day's net variation margin.
The following tables set forth by primary risk exposure the Portfolio's realized gains (losses) and change in unrealized appreciation (depreciation) by type of derivative contract for the year ended September 30, 2015 in accordance with ASC 815.
Realized Gain (Loss) | |
Primary Risk Exposure | | Derivative Type | | Value
(000) | |
Currency Risk
| | Foreign Currency Forward
Exchange Contracts | | $ | 2,030 | | |
Interest Rate Risk | | Futures Contracts | | | 252 | | |
Credit Risk | | Swap Agreements | | | (41 | ) | |
Interest Rate Risk | | Swap Agreements | | | (1,131 | ) | |
| | | Total | | $ | 1,110 | | |
Change in Unrealized Appreciation (Depreciation) | |
Primary Risk Exposure | | Derivative Type | | Value
(000) | |
Currency Risk
| | Foreign Currency Forward
Exchange Contracts | | $ | (478 | ) | |
Interest Rate Risk | | Futures Contracts | | | (138 | ) | |
Credit Risk | | Swap Agreements | | | (26 | ) | |
Interest Rate Risk | | Swap Agreements | | | (605 | ) | |
| | | Total | | $ | (1,247 | ) | |
At September 30, 2015, the Portfolio's derivative assets and liabilities are as follows:
Gross Amounts of Assets and Liabilities Presented in the
Statement of Assets and Liabilities | |
Derivatives(b) | | Assets(c)
(000) | | Liabilities(c)
(000) | |
Foreign Currency Forward Exchange Contracts | | $ | 87 | | | $ | (27 | ) | |
Swap Agreements | | | 1 | | | | (57 | ) | |
Total | | $ | 88 | | | $ | (84 | ) | |
(b) Excludes exchange traded derivatives.
(c) Absent an event of default or early termination, OTC derivative assets and liabilities are presented gross and not offset in the Statement of Assets and Liabilities.
The Portfolio typically enters into International Swaps and Derivatives Association, Inc. Master Agreements ("ISDA Master Agreements") or similar master agreements (collectively, "Master Agreements") with its contract counterparties for certain OTC derivatives in order to, among other things, reduce its credit risk to counterparties. ISDA Master Agreements include provisions for general obligations, representations, collateral and events of default or termination. Under an ISDA Master Agreement, the Portfolio typically may offset with the counterparty certain OTC derivative financial instruments' payables and/or receivables with collateral held and/or posted and create one single net payment (close-out netting) in the event of default, termination and/or potential deterioration in the credit quality of the counterparty. Various Master Agreements govern the terms of certain transactions with counterparties, including transactions such as swap, forward, repurchase and reverse repurchase agreements. These Master Agreements typically attempt to reduce the counterparty risk associated with such transactions by specifying credit protection mechanisms and providing standardization that improves legal certainty. Cross-termination provisions under Master Agreements typically provide that a default in connection with one transaction between the Portfolio and a counterparty gives the non-defaulting party the right to terminate any other transactions in place with the defaulting party to create one single net payment due to/due from the defaulting party and may be a feature in certain Master Agreements. In the event the Portfolio exercises its right to terminate a Master Agreement after a counterparty experiences a termination event as defined in the Master Agreement, the return of collateral with market value in excess of the Portfolio's net liability may be delayed or denied.
30
Morgan Stanley Institutional Fund Trust
Annual Report — September 30, 2015
Notes to Financial Statements (cont'd)
The following tables present derivative financial instruments that are subject to enforceable netting arrangements as of September 30, 2015.
Gross Amounts Not Offset in the Statement of Assets and Liabilities | |
Counterparty | | Gross Asset
Derivatives
Presented in
Statement of
Assets and
Liabilities
(000) | | Financial
Instrument
(000) | | Collateral
Received
(000) | | Net Amount
(not less
than $0)
(000) | |
Barclays Bank PLC | | $ | 1 | | | $ | (1 | ) | | $ | — | | | $ | 0 | | |
Citibank NA | | | 41 | | | | (— | @) | | | — | | | | 41 | | |
Deutsche Bank AG | | | — | @ | | | (— | @) | | | — | | | | 0 | | |
JPMorgan Chase Bank NA | | | 6 | | | | (— | @) | | | — | | | | 6 | | |
UBS AG | | | 40 | | | | (10 | ) | | | — | | | | 30 | | |
Total | | $ | 88 | | | $ | (11 | ) | | $ | — | | | $ | 77 | | |
Gross Amounts Not Offset in the Statement of Assets and Liabilities | |
Counterparty | | Gross Liability
Derivatives
Presented in
Statement of
Assets and
Liabilities
(000) | | Financial
Instrument
(000) | | Collateral
Pledged
(000) | | Net Amount
(not less
than $0)
(000) | |
Barclays Bank PLC | | $ | 36 | | | $ | (1 | ) | | $ | — | | | $ | 35 | | |
Citibank NA | | | — | @ | | | (— | @) | | | — | | | | 0 | | |
Deutsche Bank AG | | | 22 | | | | (— | @) | | | — | | | | 22 | | |
HSBC Bank PLC | | | 16 | | | | — | | | | — | | | | 16 | | |
JPMorgan Chase Bank NA | | | — | @ | | | (— | @) | | | — | | | | 0 | | |
UBS AG | | | 10 | | | | (10 | ) | | | — | | | | 0 | | |
Total | | $ | 84 | | | $ | (11 | ) | | $ | — | | | $ | 73 | | |
@ Amount is less than $500.
For the year ended September 30, 2015, the approximate average monthly amount outstanding for each derivative type is as follows:
Foreign Currency Forward Exchange Contracts: | |
Average monthly principal amount | | $ | 21,119,000 | | |
Futures Contracts: | |
Average monthly original value | | $ | 142,944,000 | | |
Swap Agreements: | |
Average monthly notional amount | | $ | 75,223,000 | | |
6. Securities Lending: The Portfolio lends securities to qualified financial institutions, such as broker-dealers, to earn additional income. Any increase or decrease in the fair value of the securities loaned that might occur and any interest earned or dividends declared on those securities during the term of the loan would remain in the Portfolio. The Portfolio would receive cash or securities as collateral in an amount equal to or exceeding 100% of the current fair value of the loaned securities. The collateral is marked-to-market daily by State Street Bank and Trust Company
("State Street"), the securities lending agent, to ensure that a minimum of 100% collateral coverage is maintained.
Based on pre-established guidelines, the securities lending agent invests any cash collateral that is received in an affiliated money market portfolio and repurchase agreements. Securities lending income is generated from the earnings on the invested collateral and borrowing fees, less any rebates owed to the borrowers and compensation to the lending agent, and is recorded as "Income from Securities Loaned — Net" in the Portfolio's Statement of Operations. Risks in securities lending transactions are that a borrower may not provide additional collateral when required or return the securities when due, and that the value of the short-term investments will be less than the amount of cash collateral plus any rebate that is required to be returned to the borrower.
The Portfolio has the right under the lending agreement to recover the securities from the borrower on demand.
The following table presents securities on loan that are subject to enforceable netting arrangements as of September 30, 2015.
Gross Amounts Not Offset in the Statement of Assets and Liabilities | |
Gross Asset Amounts
Presented in Statement
of Assets and Liabilities
(000) | | Financial
Instrument
(000) | | Collateral
Received
(000) | | Net Amount
(not less
than $0)
(000) | |
| $ | 10,398 | (d) | | $ | — | | | $ | (10,398 | )(e)(f) | | $ | 0 | | |
(d) Represents market value of loaned securities at period end.
(e) The Portfolio received cash collateral of approximately $6,045,000, of which approximately $5,663,000 was subsequently invested in a Repurchase Agreement and Morgan Stanley Institutional Liquidity Funds as reported in the Portfolio of Investments. As of September 30, 2015, there was uninvested cash of approximately $382,000, which is not reflected in the Portfolio of Investments. In addition, the Portfolio received non-cash collateral of approximately $4,545,000 in the form of U.S. Government agency securities and U.S. Government obligations, which the Portfolio cannot sell or repledge, and accordingly are not reflected in the Portfolio of Investments.
(f) The actual collateral received is greater than the amount shown here due to overcollateralization.
7. When-Issued/Delayed Delivery Securities: The Portfolio purchases and sells when-issued and delayed delivery securities. Securities purchased on a when-issued or delayed delivery basis are purchased for delivery beyond the normal settlement date at a stated price and yield, and no income accrues to the Portfolio on such securities prior to delivery date. Payment and delivery for when-issued and delayed delivery securities can take place a month or more after the date of the transaction. When the Portfolio enters into a purchase transaction on a when-issued or delayed delivery basis, securities are available for collateral
31
Morgan Stanley Institutional Fund Trust
Annual Report — September 30, 2015
Notes to Financial Statements (cont'd)
in an amount at least equal in value to the Portfolio's commitments to purchase such securities. Purchasing securities on a when-issued or delayed delivery basis may involve a risk that the market price at the time of delivery may be lower than the agreed upon purchase price, in which case there could be an unrealized loss at the time of delivery. Purchasing investments on a when-issued or delayed delivery basis may be considered a form of leverage which may increase the impact that gains (losses) may have on the Portfolio.
8. Indemnifications: The Fund enters into contracts that contain a variety of indemnifications. The Fund's maximum exposure under these arrangements is unknown. However, the Fund has not had prior claims or losses pursuant to these contracts and expects the risk of loss to be remote.
9. Dividends and Distributions to Shareholders: Dividend income and distributions to shareholders are recorded on the ex-dividend date. Dividends from net investment income, if any, are declared and paid quarterly. Net realized capital gains, if any, are distributed at least annually.
10. Security Transactions, Income and Expenses: Security transactions are accounted for on the trade date (date the order to buy or sell is executed). Realized gains and losses on the sale of investment securities are determined on the specific identified cost method. Dividend income and other distributions are recorded on the ex-dividend date (except for certain foreign dividends which may be recorded as soon as the Portfolio is informed of such dividends) net of applicable withholding taxes. Interest income is recognized on the accrual basis except where collection is in doubt. Discounts are accreted and premiums are amortized over the life of the respective securities. Most expenses of the Fund can be directly attributed to a particular Portfolio. Expenses which cannot be directly attributed are apportioned among the Portfolios based upon relative net assets or other appropriate methods. Income, expenses (other than class specific expenses — distribution and shareholder services, transfer agency and sub transfer agency fees) and realized and unrealized gains or losses are allocated to each class of shares based upon their relative net assets.
B. Advisory Fees: The Adviser, a wholly-owned subsidiary of Morgan Stanley, provides the Portfolio with advisory services under the terms of an Investment Advisory Agreement, paid quarterly, at the annual rate based on the average daily net assets as follows:
First $1
billion | | Over $1
billion | |
| | 0.375 | % | | | 0.300 | % | |
For the year ended September 30, 2015, the advisory fee rate (net of waivers/rebate) was equivalent to an annual effective rate of 0.24% of the Portfolio's average daily net assets.
The Adviser has agreed to reduce its advisory fee and/or reimburse the Portfolio so that total annual portfolio operating expenses, excluding certain investment related expenses, taxes, interest and other extraordinary expenses (including litigation), will not exceed 0.62% for Class I shares, 0.97% for Class A shares, 1.22% for Class L shares. Effective October 6, 2014, the Adviser has agreed to reduce its advisory fee and/or reimburse the Portfolio so that total annual portfolio operating expenses will not exceed 0.52% for Class I shares, 0.87% for Class A shares, 1.12% for Class L shares and 1.62% for Class C shares (effective April 30, 2015). The fee waivers and/or expense reimbursements will continue for at least one year from the date of the Portfolio's prospectus or until such time that the Trustees act to discontinue all or a portion of such waivers and/or reimbursements when they deem such action is appropriate. For the year ended September 30, 2015, approximately $246,000 of advisory fees were waived and approximately $191,000 of other expenses were reimbursed by the Adviser pursuant to this arrangement.
C. Administration Fees: The Adviser also serves as Administrator to the Fund and provides administrative services pursuant to an Administration Agreement for an annual fee, accrued daily and paid monthly, of 0.08% of the Portfolio's average daily net assets. Under a Sub-Administration Agreement between the Administrator and State Street, State Street provides certain administrative services to the Fund. For such services, the Administrator pays State Street a portion of the fee the Administrator receives from the Portfolio.
D. Distribution and Shareholder Services Fees: Morgan Stanley Distribution, Inc. ("MSDI" or the "Distributor"), a wholly-owned subsidiary of the Adviser, and an indirect subsidiary of Morgan Stanley, serves as the Fund's Distributor of Portfolio shares pursuant to a Distribution Agreement. The Fund has adopted a Shareholder Services Plan
32
Morgan Stanley Institutional Fund Trust
Annual Report — September 30, 2015
Notes to Financial Statements (cont'd)
with respect to Class A shares pursuant to Rule 12b-1 under the Act. Under the Shareholder Services Plan, the Portfolio pays the Distributor a shareholder services fee, accrued daily and paid monthly, at an annual rate of 0.25% of the Portfolio's average daily net assets attributable to Class A shares.
The Fund has adopted a Distribution and Shareholder Services Plan with respect to Class L shares pursuant to Rule 12b-1 under the Act. Under the Distribution and Shareholder Services Plan, the Portfolio pays the Distributor a distribution fee, accrued daily and paid monthly, at an annual rate of 0.25% and a shareholder services fee, accrued daily and paid monthly, at an annual rate of 0.25% of the Portfolio's average daily net assets attributable to Class L shares.
The Fund has adopted a Distribution and Shareholder Services Plan with respect to Class C shares pursuant to Rule 12b-1 under the Act. Under the Distribution and Shareholder Services Plan, the Portfolio pays the Distributor a distribution fee, accrued daily and paid monthly, at an annual rate of 0.75% and a shareholder services fee, accrued daily and paid monthly, at an annual rate of 0.25% of the Portfolio's average daily net assets attributable to Class C shares.
The distribution and shareholder services fees are used to support the expenses associated with servicing and maintaining accounts. The Distributor may compensate other parties for providing shareholder support services to investors who purchase Class A, Class L and Class C shares.
E. Dividend Disbursing and Transfer Agent: The Fund's dividend disbursing and transfer agent is Boston Financial Data Services, Inc. ("BFDS"). Pursuant to a Transfer Agency Agreement, the Fund pays BFDS a fee based on the number of classes, accounts and transactions relating to the Portfolios of the Fund.
F. Custodian Fees: State Street (the "Custodian") serves as Custodian for the Fund in accordance with a Custodian Agreement. The Custodian holds cash, securities, and other assets of the Fund as required by the Act. Custody fees are payable monthly based on assets held in custody, investment purchases and sales activity and account maintenance fees, plus reimbursement for certain out-of-pocket expenses.
G. Security Transactions and Transactions with Affiliates: For the year ended September 30, 2015, purchases and sales of investment securities for the Portfolio, other than long-term U.S. Government securities and short-term investments, were approximately $87,645,000 and $53,085,000,
respectively. For the year ended September 30, 2015, purchases and sales of long-term U.S. Government securities were approximately $630,854,000 and $647,574,000, respectively.
The Portfolio invests in the Institutional Class of the Morgan Stanley Institutional Liquidity Funds — Money Market Portfolio (the "Liquidity Funds"), an open-end management investment company managed by the Adviser, both directly and as a portion of the securities held as collateral on loaned securities. Advisory fees paid by the Portfolio are reduced by an amount equal to its pro-rata share of the advisory and administration fees paid by the Portfolio due to its investment in the Liquidity Funds. For the year ended September 30, 2015, advisory fees paid were reduced by approximately $30,000 relating to the Portfolio's investment in the Liquidity Funds.
A summary of the Portfolio's transactions in shares of the Liquidity Funds during the year ended September 30, 2015 is as follows:
Value
September 30,
2014
(000) | | Purchases
at Cost
(000) | | Sales
(000) | | Dividend
Income
(000) | | Value
September 30,
2015
(000) | |
| $ | 35,341 | | | $ | 76,549 | | | $ | 86,440 | | | $ | 37 | | | $ | 25,450 | | |
The Portfolio has an unfunded Deferred Compensation Plan (the "Compensation Plan"), which allows each independent Trustee to defer payment of all, or a portion, of the fees he or she receives for serving on the Board of Trustees. Each eligible Trustee generally may elect to have the deferred amounts credited with a return equal to the total return on one or more of the Morgan Stanley funds that are offered as investment options under the Compensation Plan. Appreciation/depreciation and distributions received from these investments are recorded with an offsetting increase/decrease in the deferred compensation obligation and do not affect the NAV of the Portfolio.
H. Federal Income Taxes: It is the Portfolio's intention to continue to qualify as a regulated investment company and distribute all of its taxable and tax-exempt income. Accordingly, no provision for Federal income taxes is required in the financial statements.
The Portfolio may be subject to taxes imposed by countries in which it invests. Such taxes are generally based on income and/or capital gains earned or repatriated. Taxes are accrued based on net investment income, net realized gains and net unrealized appreciation as such income and/or gains are earned. Taxes may also be based on transactions in foreign currency and are accrued based on the value of investments denominated in such currency.
33
Morgan Stanley Institutional Fund Trust
Annual Report — September 30, 2015
Notes to Financial Statements (cont'd)
FASB ASC 740-10, "Income Taxes — Overall", sets forth a minimum threshold for financial statement recognition of the benefit of a tax position taken or expected to be taken in a tax return. Management has concluded there are no significant uncertain tax positions that would require recognition in the financial statements. If applicable, the Portfolio recognizes interest accrued related to unrecognized tax benefits in "Interest Expense" and penalties in "Other Expenses" in the Statement of Operations. The Portfolio files tax returns with the U.S. Internal Revenue Service, New York and various states. Each of the tax years in the four-year period ended September 30, 2015, remains subject to examination by taxing authorities.
The tax character of distributions paid may differ from the character of distributions shown in the Statements of Changes in Net Assets due to short-term capital gains being treated as ordinary income for tax purposes. The tax character of distributions paid during fiscal years 2015 and 2014 was as follows:
2015 Distributions
Paid From:
Ordinary Income
(000) | | 2014 Distributions
Paid From:
Ordinary Income
(000) | |
| $ | 6,119 | | | $ | 5,840 | | |
The amount and character of income and gains to be distributed are determined in accordance with income tax regulations which may differ from GAAP. These book/tax differences are either considered temporary or permanent in nature.
Temporary differences are attributable to differing book and tax treatments for the timing of the recognition of gains (losses) on certain investment transactions and the timing of the deductibility of certain expenses.
Permanent differences, primarily due to differing treatments of gains (losses) related to foreign currency transactions, basis adjustments for swap transactions, paydown adjustments and an expired capital loss carryforward, resulted in the following reclassifications among the components of net assets at September 30, 2015:
Accumulated
Undistributed
Net Investment
Income
(000) | | Accumulated
Net Realized
Loss
(000) | | Paid-in-Capital
(000) | |
| $ | 792 | | | $ | 12,997 | | | $ | (13,789 | ) | |
At September 30, 2015, the components of distributable earnings for the Portfolio on a tax basis were as follows:
Undistributed
Ordinary
Income
(000) | | Undistributed
Long-Term
Capital Gain
(000) | |
| $ | 4,616 | | | $ | — | | |
At September 30, 2015, the Portfolio had available for Federal income tax purposes unused capital losses, which will expire on the indicated dates:
Amount
(000) | | Expiration | |
| $ | 5,336 | | | September 30, 2016 | |
| | 254,264 | | | September 30, 2017 | |
| | 201,462 | | | September 30, 2018 | |
Capital loss carryforwards of approximately $13,785,000 expired during the year ended September 30, 2015.
To the extent that capital loss carryforwards are used to offset any future capital gains realized during the carryover period as provided by U.S. Federal income tax regulations, no capital gains tax liability will be incurred by the Portfolio for gains realized and not distributed. To the extent that capital gains are offset, such gains will not be distributed to the shareholders. During the year ended September 30, 2015, the Portfolio utilized capital loss carryforwards for U.S. Federal income tax purposes of approximately $1,895,000.
I. Other: At September 30, 2015, the Portfolio had otherwise unaffiliated record owners of 10% or greater. Investment activities of these shareholders could have a material impact on the Portfolio. The aggregate percentage of such owners was 90.3%.
34
Morgan Stanley Institutional Fund Trust
Annual Report — September 30, 2015
Report of Independent Registered Public Accounting Firm
To the Shareholders and Board of Trustees of
Morgan Stanley Institutional Fund Trust —
Core Plus Fixed Income Portfolio
We have audited the accompanying statement of assets and liabilities, including the portfolio of investments, of Core Plus Fixed Income Portfolio (one of the portfolios constituting Morgan Stanley Institutional Fund Trust) (the "Portfolio") as of September 30, 2015, and the related statement of operations for the year then ended, the statements of changes in net assets for each of the two years in the period then ended and the financial highlights for each of the years or periods indicated therein. These financial statements and financial highlights are the responsibility of the Portfolio's management. Our responsibility is to express an opinion on these financial statements and financial highlights based on our audits.
We conducted our audits in accordance with the standards of the Public Company Accounting Oversight Board (United States). Those standards require that we plan and perform the audit to obtain reasonable assurance about whether the financial statements and financial highlights are free of material misstatement. We were not engaged to perform an audit of the Portfolio's internal control over financial reporting. Our audits included consideration of internal control over financial reporting as a basis for designing audit procedures that are appropriate in the circumstances, but not for the purpose of expressing an opinion on the effectiveness of the Portfolio's internal control over financial reporting. Accordingly, we express no such opinion. An audit also includes examining, on a test basis, evidence supporting the amounts and disclosures in the financial statements and financial highlights, assessing the accounting principles used and significant estimates made by management, and evaluating the overall financial statement presentation. Our procedures included confirmation of securities owned as of September 30, 2015, by correspondence with the custodian and others or by other appropriate auditing procedures where replies from others were not received. We believe that our audits provide a reasonable basis for our opinion.
In our opinion, the financial statements and financial highlights referred to above present fairly, in all material respects, the financial position of Core Plus Fixed Income Portfolio (one of the portfolios constituting Morgan Stanley Institutional Fund Trust) at September 30, 2015, the results of its operations for the year then ended, the changes in its net assets for each of the two years in the period then ended and the financial highlights for each of the years or periods indicated therein, in conformity with U.S. generally accepted accounting principles.

Boston, Massachusetts
November 25, 2015
35
Morgan Stanley Institutional Fund Trust
Annual Report — September 30, 2015
Investment Advisory Agreement Approval (unaudited)
Nature, Extent and Quality of Services
The Board reviewed and considered the nature and extent of the investment advisory services provided by the Adviser (as defined herein) under the advisory agreement, including portfolio management, investment research and equity and fixed income securities trading. The Board also reviewed and considered the nature and extent of the non-advisory, administrative services provided by the Adviser under the administration agreement, including accounting, operations, clerical, bookkeeping, compliance, business management and planning, legal services and the provision of supplies, office space and utilities at the Adviser's expense. The Board also considered the Adviser's investment in personnel and infrastructure that benefits the Portfolio. (The advisory and administration agreements together are referred to as the "Management Agreement.") The Board also considered that the Adviser serves a variety of other investment advisory clients and has experience overseeing service providers. The Board also compared the nature of the services provided by the Adviser with similar services provided by non-affiliated advisers as reported to the Board by Lipper, Inc. ("Lipper").
The Board reviewed and considered the qualifications of the portfolio managers, the senior administrative managers and other key personnel of the Adviser who provide the administrative and advisory services to the Portfolio. The Board determined that the Adviser's portfolio managers and key personnel are well qualified by education and/or training and experience to perform the services in an efficient and professional manner. The Board concluded that the nature and extent of the advisory and administrative services provided were necessary and appropriate for the conduct of the business and investment activities of the Portfolio and supported its decision to approve the Management Agreement.
Performance, Fees and Expenses of the Portfolio
The Board reviewed the performance, fees and expenses of the Portfolio compared to its peers, as determined by Lipper, and to appropriate benchmarks where applicable. The Board discussed with the Adviser the performance goals and the actual results achieved in managing the Portfolio. When considering a fund's performance, the Board and the Adviser place emphasis on trends and longer-term returns (focusing on one-year, three-year and five-year performance, as of December 31, 2014, or since inception, as applicable). When a fund underperforms its benchmark and/or its peer group average, the Board and the Adviser discuss the causes of such underperformance and, where necessary, they discuss specific changes to investment strategy or investment personnel. The Board noted that the Portfolio's performance was better than its peer group average for the one-, three- and five-year periods. The Board discussed with the Adviser the level of the advisory and administration fees (together, the "management fee") for this Portfolio relative to comparable funds and/or other accounts advised by the Adviser and/or compared to its peers as determined by Lipper. In addition to the management fee, the Board also reviewed the Portfolio's total expense ratio. The Board noted that the Portfolio's management fee and total expense ratio were lower than its peer group averages. After discussion, the Board concluded that the Portfolio's (i) performance was competitive with its peer group average; and (ii) management fee and total expense ratio were competitive with its peer group averages.
Economies of Scale
The Board considered the size and growth prospects of the Portfolio and how that relates to the Portfolio's total expense ratio and particularly the Portfolio's management fee rate, which includes a breakpoint. In conjunction with its review of the Adviser's profitability, the Board discussed with the Adviser how a change in assets can affect the efficiency or effectiveness of managing the Portfolio and whether the management fee level is appropriate relative to current and projected asset levels and/or whether the management fee structure reflects economies of scale as asset levels change. The Board has determined that its review of the actual and/or potential economies of scale of the Portfolio supports its decision to approve the Management Agreement.
Profitability of the Adviser and Affiliates
The Board considered information concerning the costs incurred and profits realized by the Adviser and its affiliates during the last year from their relationship with the Portfolio and during the last two years from their relationship with the Morgan Stanley Fund Complex and reviewed with the Adviser the cost allocation methodology used to determine the profitability of the Adviser and affiliates. The Board has determined that its review of the analysis of the Adviser's expenses and profitability supports its decision to approve the Management Agreement.
36
Morgan Stanley Institutional Fund Trust
Annual Report — September 30, 2015
Investment Advisory Agreement Approval (unaudited) (cont'd)
Other Benefits of the Relationship
The Board considered other direct and indirect benefits to the Adviser and/or its affiliates derived from their relationship with the Portfolio and other funds advised by the Adviser. These benefits may include, among other things, fees for trading, distribution and/or shareholder servicing and for transaction processing and reporting platforms used by securities lending agents, and research received by the Adviser generated from commission dollars spent on funds' portfolio trading. The Board reviewed with the Adviser these arrangements and the reasonableness of the Adviser's costs relative to the services performed. The Board has determined that its review of the other benefits received by the Adviser or its affiliates supports its decision to approve the Management Agreement.
Resources of the Adviser and Historical Relationship Between the Portfolio and the Adviser
The Board considered whether the Adviser is financially sound and has the resources necessary to perform its obligations under the Management Agreement. The Board also reviewed and considered the historical relationship between the Portfolio and the Adviser, including the organizational structure of the Adviser, the policies and procedures formulated and adopted by the Adviser for managing the Portfolio's operations and the Board's confidence in the competence and integrity of the senior managers and key personnel of the Adviser. The Board concluded that the Adviser has the financial resources necessary to fulfill its obligations under the Management Agreement and that it is beneficial for the Portfolio to continue its relationship with the Adviser.
Other Factors and Current Trends
The Board considered the controls and procedures adopted and implemented by the Adviser and monitored by the Fund's Chief Compliance Officer and concluded that the conduct of business by the Adviser indicates a good faith effort on its part to adhere to high ethical standards in the conduct of the Portfolio's business.
General Conclusion
After considering and weighing all of the above factors, with various written materials and verbal information presented by the Adviser, the Board concluded that it would be in the best interest of the Portfolio and its shareholders to approve renewal of the Management Agreement for another year. In reaching this conclusion the Board did not give particular weight to any single piece of information or factor referenced above. The Board considered these factors and information over the course of the year and in numerous meetings, some of which were in executive session with only the independent Board members and their counsel present. It is possible that individual Board members may have weighed these factors, and the information presented, differently in reaching their individual decisions to approve the Management Agreement.
37
Morgan Stanley Institutional Fund Trust
Annual Report — September 30, 2015
U.S. Privacy Policy (unaudited)
AN IMPORTANT NOTICE CONCERNING OUR U.S. PRIVACY POLICY
This privacy notice describes the U.S. privacy policy of Morgan Stanley Distribution, Inc., and the Morgan Stanley family of mutual funds ("us", "our", "we").
We are required by federal law to provide you with notice of our U.S. privacy policy ("Policy"). This Policy applies to both our current and former clients unless we state otherwise and is intended for individual clients who purchase products or receive services from us for personal, family or household purposes. This Policy is not applicable to partnerships, corporations, trusts or other non-individual clients or account holders, nor is this Policy applicable to individuals who are either beneficiaries of a trust for which we serve as trustee or participants in an employee benefit plan administered or advised by us. This Policy is, however, applicable to individuals who select us to be a custodian of securities or assets in individual retirement accounts, 401(k) accounts, or accounts subject to the Uniform Gifts to Minors Act.
This notice sets out our business practices to protect your privacy; how we collect and share personal information about you; and how you can limit our sharing or certain uses by others of this information. We may amend this Policy at any time, and will inform you of any changes to our Policy as required by law.
WE RESPECT YOUR PRIVACY
We appreciate that you have provided us with your personal financial information and understand your concerns about your information. We strive to safeguard the information our clients entrust to us. Protecting the confidentiality and security of client information is an important part of how we conduct our business.
This notice describes what personal information we collect about you, how we collect it, when we may share it with others, and how certain others may use it. It discusses the steps you may take to limit our sharing of certain information about you with our affiliated companies, including, but not limited to our affiliated banking businesses, brokerage firms and credit service affiliates. It also discloses how you may limit our affiliates' use of shared information for marketing purposes.
Throughout this Policy, we refer to the nonpublic information that personally identifies you as "personal information." We also use the term "affiliated company" in this notice. An affiliated company is a company in our family of companies and includes companies with the Morgan Stanley name. These affiliated companies are financial institutions such as broker-dealers, banks, investment advisers and credit card issuers. We refer to any company that is not an affiliated company as a nonaffiliated third party. For purposes of Section 5 of this notice, and your ability to limit certain uses of personal information by our affiliates, this notice applies to the use of personal information by our affiliated companies.
1. WHAT PERSONAL INFORMATION DO WE COLLECT FROM YOU?
We may collect the following types of information about you: (i) information provided by you, including information from applications and other forms we receive from you, (ii) information about your transactions with us or our affiliates, (iii) information about your transactions with nonaffiliated third parties, (iv) information from consumer reporting agencies, (v) information obtained from our websites, and (vi) information obtained from other sources. For example:
• We collect information such as your name, address, e-mail address, telephone/fax numbers, assets, income and investment objectives through applications and other forms you submit to us.
• We may obtain information about account balances, your use of account(s) and the types of products and services you prefer to receive from us through your dealings and transactions with us and other sources.
• We may obtain information about your creditworthiness and credit history from consumer reporting agencies.
• We may collect background information from and through third-party vendors to verify representations you have made and to comply with various regulatory requirements.
2. WHEN DO WE DISCLOSE PERSONAL INFORMATION WE COLLECT ABOUT YOU?
We may disclose personal information we collect about you in each of the categories listed above to affiliated and nonaffiliated third parties.
38
Morgan Stanley Institutional Fund Trust
Annual Report — September 30, 2015
U.S. Privacy Policy (unaudited) (cont'd)
a. Information We Disclose to Affiliated Companies.
We may disclose personal information that we collect about you to our affiliated companies to manage your account(s) effectively, to service and process your transactions, and to let you know about products and services offered by us and affiliated companies, to manage our business, and as otherwise required or permitted by law. Offers for products and services from affiliated companies are developed under conditions designed to safeguard your personal information.
b. Information We Disclose to Third Parties.
We may disclose personal information that we collect about you to nonaffiliated third parties to provide marketing services on our behalf or to other financial institutions with whom we have joint marketing agreements. We may also disclose all of the information we collect to other nonaffiliated third parties for our everyday business purposes, such as to process transactions, maintain account(s), respond to court orders and legal investigations, report to credit bureaus, offer our own products and services, protect against fraud, for institutional risk control, to perform services on our behalf, and as otherwise required or permitted by law.
When we share personal information about you with a nonaffiliated third party, they are required to limit their use of personal information about you to the particular purpose for which it was shared and they are not allowed to share personal information about you with others except to fulfill that limited purpose or as may be permitted or required by law.
3. HOW DO WE PROTECT THE SECURITY AND CONFIDENTIALITY OF PERSONAL INFORMATION WE COLLECT ABOUT YOU?
We maintain physical, electronic and procedural security measures that comply with applicable law and regulations to help safeguard the personal information we collect about you. We have internal policies governing the proper handling of client information by employees. Third parties that provide support or marketing services on our behalf may also receive personal information about you, and we require them to adhere to appropriate security standards with respect to such information.
4. HOW CAN YOU LIMIT OUR SHARING CERTAIN PERSONAL INFORMATION ABOUT YOU WITH OUR AFFILIATED COMPANIES FOR ELIGIBILITY DETERMINATION?
By following the opt-out procedures in Section 6 below, you may limit the extent to which we share with our affiliated companies, personal information that was collected to determine your eligibility for products and services such as your credit reports and other information that you have provided to us or that we may obtain from third parties ("eligibility information"). Eligibility information does not include your identification information or personal information pertaining to our transactions or experiences with you. Please note that, even if you direct us not to share eligibility information with our affiliated companies, we may still share your personal information, including eligibility information, with our affiliated companies under circumstances that are permitted under applicable law, such as to process transactions or to service your account.
5. HOW CAN YOU LIMIT THE USE OF CERTAIN PERSONAL INFORMATION ABOUT YOU BY OUR AFFILIATED COMPANIES FOR MARKETING?
By following the opt-out instructions in Section 6 below, you may limit our affiliated companies from marketing their products or services to you based on personal information we disclose to them. This information may include, for example, your income and account history with us. Please note that, even if you choose to limit our affiliated companies from using personal information about you that we may share with them for marketing their products and services to you, our affiliated companies may use your personal information that they obtain from us to market to you in circumstances permitted by law, such as if the affiliated party has its own relationship with you.
39
Morgan Stanley Institutional Fund Trust
Annual Report — September 30, 2015
U.S. Privacy Policy (unaudited) (cont'd)
6. HOW CAN YOU SEND US AN OPT-OUT INSTRUCTION?
If you wish to limit our sharing of eligibility information about you with our affiliated companies, or our affiliated companies' use of personal information for marketing purposes, as described in this notice, you may do so by:
• Calling us at (800) 548-7786
Monday–Friday between 8a.m. and 6p.m. (EST)
• Writing to us at the following address:
Boston Financial Data Services, Inc.
c/o Privacy Coordinator
P.O. Box 219804
Kansas City, Missouri 64121
If you choose to write to us, your request should include: your name, address, telephone number and account number(s) to which the opt-out applies and whether you are opting out with respect to sharing of eligibility information (Section 4 above), or information used for marketing (Section 5 above), or both. Written opt-out requests should not be sent with any other correspondence. In order to process your request, we require that the request be provided by you directly and not through a third party. Once you have informed us about your privacy preferences, your opt-out preference will remain in effect with respect to this Policy (as it may be amended) until you notify us otherwise. If you are a joint account owner, we will accept instructions from any one of you and apply those instructions to the entire account.
Please understand that if you limit our sharing or our affiliated companies' use of personal information, you and any joint account holder(s) may not receive information about our affiliated companies' products and services, including products or services that could help you manage your financial resources and achieve your investment objectives.
If you have more than one account or relationship with us, please specify the accounts to which you would like us to apply your privacy choices. If you have accounts or relationships with our affiliates, you may receive multiple privacy policies from them, and will need to separately notify those companies of your privacy choices for those accounts or relationships.
7. WHAT IF AN AFFILIATED COMPANY BECOMES A NONAFFILIATED THIRD PARTY?
If, at any time in the future, an affiliated company becomes a nonaffiliated third party, further disclosures of personal information made to the former affiliated company will be limited to those described in Section 2(b) above relating to nonaffiliated third parties. If you elected under Section 6 to limit disclosures we make to affiliated companies, or use of personal information by affiliated companies, your election will not apply to use by any former affiliated company of your personal information in their possession once it becomes a nonaffiliated third party.
SPECIAL NOTICE TO RESIDENTS OF VERMONT
The following section supplements our Policy with respect to our individual clients who have a Vermont address and supersedes anything to the contrary in the above Policy with respect to those clients only.
The State of Vermont requires financial institutions to obtain your consent prior to sharing personal information that they collect about you with nonaffiliated third parties, or eligibility information with affiliated companies, other than in certain limited circumstances. Except as permitted by law, we will not share personal information we collect about you with nonaffiliated third parties or eligibility information with affiliated companies, unless you provide us with your written consent to share such information.
SPECIAL NOTICE TO RESIDENTS OF CALIFORNIA
The following section supplements our Policy with respect to our individual clients who have a California address and supersedes anything to the contrary in the above Policy with respect to those clients only.
In response to a California law, if your account has a California home address, your personal information will not be disclosed to nonaffiliated third parties except as permitted by applicable California law, and we will limit sharing such personal information with our affiliates to comply with California privacy laws that apply to us.
40
Morgan Stanley Institutional Fund Trust
Annual Report — September 30, 2015
Trustee and Officer Information (unaudited)
Independent Trustees:
Name, Age and Address of
Independent Trustee | | Positions(s)
Held with
Registrant | | Length of Time
Served* | | Principal Occupation(s) During Past 5 Years
and Other Relevant Professional Experience | | Number of
Portfolios in
Fund Complex
Overseen by
Trustee** | | Other Directorships
Held by Independent
Trustee*** | |
Frank L. Bowman (70)
c/o Kramer Levin Naftalis & Frankel LLP
Counsel to the Independent Trustees
1177 Avenue of the Americas
New York, NY 10036 | | Trustee | | Since
August
2006 | | President, Strategic Decisions, LLC (consulting) (since February 2009); Director or Trustee of various Morgan Stanley Funds (since August 2006); Chairperson of the Compliance and Insurance Committee (since October 2015); Chairperson of the Insurance Sub-Committee of the Compliance and Insurance Committee (since February 2007); served as President and Chief Executive Officer of the Nuclear Energy Institute (policy organization) (February 2005-November 2008); retired as Admiral, U.S. Navy after serving over 38 years on active duty including 8 years as Director of the Naval Nuclear Propulsion Program in the Department of the Navy and the U.S. Department of Energy (1996-2004); served as Chief of Naval Personnel (July 1994-September 1996); and on the Joint Staff as Director of Political Military Affairs (June 1992-July1994); knighted as Honorary Knight Commander of the Most Excellent Order of the British Empire; awarded the Officier de l'Orde National du Mérite by the French Government; elected to the National Academy of Engineering (2009). | | | 96 | | | Director of BP p.l.c.; Director of Naval and Nuclear Technologies LLP; Director Emeritus of the Armed Services YMCA of the USA; Director of the U.S. Naval Submarine League; Member of the National Security Advisory Council of the Center for U.S. Global Engagement and a member of the CNA Military Advisory Board; Chairman of the Charity J Street Cup Golf ; Trustee of Fairhaven United Methodist Church. | |
Kathleen A. Dennis (62)
c/o Kramer Levin Naftalis & Frankel LLP
Counsel to the Independent Trustees
1177 Avenue of the Americas
New York, NY 10036 | | Trustee | | Since
August
2006 | | President, Cedarwood Associates (mutual fund and investment management consulting) (since July 2006); Chairperson of the Money Market and Alternatives Sub-Committee of the Investment Committee (since October2006) and Director or Trustee of various Morgan Stanley Funds (since August 2006); formerly, Senior Managing Director of Victory Capital Management (1993-2006). | | | 96 | | | Director of various nonprofit organizations. | |
Nancy C. Everett (60)
c/o Kramer Levin Naftalis & Frankel LLP
Counsel to the Independent Trustees
1177 Avenue of the Americas
New York, NY 10036 | | Trustee | | Since
January
2015 | | Owner, OBIR, LLC (institutional investment management consulting) (since June 2014); formerly, Managing Director, BlackRock, Inc. (February 2011-December 2013); and Chief Executive Officer, General Motors Asset Management (a/k/a Promark Global Advisors, Inc.) (June 2005-May 2010). | | | 96 | | | Member of Virginia Commonwealth University Board of Visitors; Member of Virginia Commonwealth University School of Business Foundation; formerly, Member of Committee on Directors for Emerging Markets Growth Fund, Inc. (2007-2010); Chairperson of Performance Equity Management, LLC (2006-2010); and Chairperson, GMAM Absolute Return Strategies Fund, LLC (2006-2010). | |
41
Morgan Stanley Institutional Fund Trust
Annual Report — September 30, 2015
Trustee and Officer Information (unaudited) (cont'd)
Independent Trustees: (cont'd)
Name, Age and Address of
Independent Trustee | | Positions(s)
Held with
Registrant | | Length of Time
Served* | | Principal Occupation(s) During Past 5 Years
and Other Relevant Professional Experience | | Number of
Portfolios in
Fund Complex
Overseen by
Trustee** | | Other Directorships
Held by Independent
Trustee*** | |
Jakki L. Haussler (58)
c/o Kramer Levin Naftalis & Frankel LLP
Counsel to the Independent Trustees
1177 Avenue of the Americas
New York, NY 10036 | | Trustee | | Since
January
2015 | | Chairman and Chief Executive Officer, Opus Capital Group (since January 1996); and formerly, Director, Capvest Venture Fund, LP (May 2000-December 2011); Partner, Adena Ventures, LP (July 1999-December 2010); Director, The Victory Funds (February 2005-July 2008). | | | 96 | | | Director of Cincinnati Bell Inc. and Member, Audit Committee and Compensation Committee; Director of Northern Kentucky University Foundation and Member, Investment Committee; Member of Chase College of Law Transactional Law Practice Center Board of Advisors; Director of Best Transport; Member, University of Cincinnati Foundation Investment Committee; formerly, Member, Miami University Board of Visitors (2008-2011); Trustee of Victory Funds (2005-2008) and Chairman, Investment Committee (2007-2008) and Member, Service Provider Committee (2005-2008). | |
Dr. Manuel H. Johnson (66)
c/o Johnson Smick International, Inc.
220 I Street, N.E. —
Suite 200
Washington, D.C. 20002 | | Trustee | | Since
July
1991 | | Senior Partner, Johnson Smick International, Inc. (consulting firm); Chairperson of the Investment Committee (since October 2006) and Director or Trustee of various Morgan Stanley Funds (since July 1991); Co-Chairman and a founder of the Group of Seven Council (G7C) (international economic commission); formerly Chairperson of the Audit Committee (July 1991-September 2006), Vice Chairman of the Board of Governors of the Federal Reserve System and Assistant Secretary of the U.S. Treasury. | | | 98 | | | Director of NVR, Inc. (home construction). | |
Joseph J. Kearns (73)
c/o Kearns & Associates LLC
23823 Malibu Road
S-50-440
Malibu, CA 90265 | | Trustee | | Since
August
1994 | | President, Kearns & Associates LLC (investment consulting); Chairperson of the Audit Committee (since October 2006) and Director or Trustee of various Morgan Stanley Funds (since August 1994); formerly, Deputy Chairperson of the Audit Committee (July 2003-September 2006) and Chairperson of the Audit Committee of various Morgan Stanley Funds (since August 1994); CFO of the J. Paul Getty Trust. | | | 99 | | | Director of Electro Rent Corporation (equipment leasing). Prior to December 31, 2013, Director of The Ford Family Foundation. | |
42
Morgan Stanley Institutional Fund Trust
Annual Report — September 30, 2015
Trustee and Officer Information (unaudited) (cont'd)
Independent Trustees: (cont'd)
Name, Age and Address of
Independent Trustee | | Positions(s)
Held with
Registrant | | Length of Time
Served* | | Principal Occupation(s) During Past 5 Years
and Other Relevant Professional Experience | | Number of
Portfolios in
Fund Complex
Overseen by
Trustee** | | Other Directorships
Held by Independent
Trustee*** | |
Michael F. Klein (56)
c/o Kramer Levin Naftalis & Frankel LLP
Counsel to the Independent Trustees
1177 Avenue of the Americas
New York, NY 10036 | | Trustee | | Since
August
2006 | | Managing Director, Aetos Capital, LLC (since March 2000); Co-President, Aetos Alternatives Management, LLC (since January 2004); and Co-Chief Executive Officer of Aetos Capital LLC (since August 2013); Chairperson of the Fixed Income Sub-Committee of the Investment Committee (since October 2006) and Director or Trustee of various Morgan Stanley Funds (since August 2006); formerly, Managing Director, Morgan Stanley & Co. Inc. and Morgan Stanley Dean Witter Investment Management, President, various Morgan Stanley Funds (June1998-March 2000) and Principal, Morgan Stanley & Co. Inc. and Morgan Stanley Dean Witter Investment Management (August 1997-December 1999). | | | 96 | | | Director of certain investment funds managed or sponsored by Aetos Capital, LLC. Director of Sanitized AG and Sanitized Marketing AG (specialty chemicals). | |
Michael E. Nugent (79)
522 Fifth Avenue
New York, NY 10036 | | Chair of the
Board and
Trustee | | Chair of the
Boards since
July 2006 and
Trustee since
July 1991 | | Chair of the Boards of various Morgan Stanley Funds (since July 2006); Chairperson of the Closed-End Fund Committee (since June 2012) and Director or Trustee of various Morgan Stanley Funds (since July 1991); formerly, Chairperson of the Insurance Committee (until July 2006), General Partner, Triumph Capital, L.P. (private investment partnership) (1988-2013). | | | 98 | | | None. | |
W. Allen Reed (68)
c/o Kramer Levin Naftalis & Frankel LLP
Counsel to the Independent Trustees
1177 Avenue of the Americas
New York, NY 10036 | | Trustee | | Since
August
2006 | | Chairperson of the Equity Sub-Committee of the Investment Committee (since October 2006) and Director or Trustee of various Morgan Stanley Funds (since August 2006); formerly, President and CEO of General Motors Asset Management; Chairman and Chief Executive Officer of the GM Trust Bank and Corporate Vice President of General Motors Corporation (August 1994-December 2005). | | | 96 | | | Director of Temple-Inland Industries (packaging and forest products); Director of Legg Mason, Inc. and Director of the Auburn University Foundation. | |
Fergus Reid (83)
c/o Joe Pietryka, Inc.
85 Charles Colman Blvd.
Pawling, NY 12564 | | Trustee | | Since
June
1992 | | Chairman, Joe Pietryka, Inc.; Chairperson of the Governance Committee and Director or Trustee of various Morgan Stanley Funds (since June 1992). | | | 99 | | | Formerly, Trustee and Director of certain investment companies in the JP Morgan Fund Complex managed by JP Morgan Investment Management Inc. (1987-December 2012). | |
43
Morgan Stanley Institutional Fund Trust
Annual Report — September 30, 2015
Trustee and Officer Information (unaudited) (cont'd)
Interested Trustee:
Name, Age and Address of
Interested Trustee | | Positions(s) Held
with Registrant | | Length of Time
Served* | | Principal Occupation(s) During Past 5 Years | | Number of
Portfolios in
Fund Complex
Overseen by
Interested
Trustee** | | Other Directorships
Held by Interested
Trustee*** | |
James F. Higgins (67)
One New York Plaza,
New York, NY 10004 | | Trustee | | Since
June
2000 | | Director or Trustee of various Morgan Stanley Funds (since June 2000); Senior Advisor of Morgan Stanley (since August 2000). | | | 97 | | | Formerly, Director of AXA Financial, Inc. and AXA Equitable Life Insurance Company (2002-2011) and Director of AXA MONY Life Insurance Company and AXA MONY Life Insurance Company of America (2004-2011). | |
* This is the earliest date the Trustee began serving the Morgan Stanley Funds. Each Trustee serves an indefinite term, until his or her successor is elected.
** The Fund Complex includes (as of December 31, 2014) all open-end and closed-end funds (including all of their portfolios) advised by Morgan Stanley Investment Management Inc. (the "Adviser") and any funds that have an adviser that is an affiliated person of the Adviser (including, but not limited to, Morgan Stanley AIP GP LP).
*** This includes any directorships at public companies and registered investment companies held by the Trustee at any time during the past five years.
44
Morgan Stanley Institutional Fund Trust
Annual Report — September 30, 2015
Trustee and Officer Information (unaudited) (cont'd)
Executive Officers:
Name, Age and Address of Executive Officer | | Position(s) Held
with
Registrant | | Length of Time
Served* | | Principal Occupation(s) During Past 5 Years | |
John H. Gernon (52)
522 Fifth Avenue
New York, NY 10036 | | President and Principal Executive Officer | | Since
September
2013 | | President and Principal Executive Officer of the Equity and Fixed Income Funds and the Morgan Stanley AIP Funds (since September 2013) and the Liquidity Funds and various money market funds (since May 2014) in the Fund Complex, Managing Director of the Adviser; Head of Product (since 2006) and Global Portfolio Analysis and Reporting (since 2012); for MSIM's Long Only business. | |
Stefanie V. Chang Yu (48)
522 Fifth Avenue
New York, NY 10036 | | Chief
Compliance
Officer | | Since
December
1997 | | Managing Director of the Adviser and various entities affiliated with the Adviser; Chief Compliance Officer of various Morgan Stanley Funds and the Adviser (since January 2014); formerly, Vice President of various Morgan Stanley Funds (December 1997-January 2014). | |
Joseph C. Benedetti (50)
522 Fifth Avenue
New York, NY 10036 | | Vice President | | Since
January
2014 | | Managing Director of the Adviser and various entities affiliated with the Adviser; Vice President of various Morgan Stanley Funds (since January 2014); formerly, Assistant Secretary of various Morgan Stanley Funds (October 2004-January 2014). | |
Francis J. Smith (50)
522 Fifth Avenue
New York, NY 10036 | | Treasurer and
Principal
Financial
Officer | | Treasurer
since July
2003 and
Principal
Financial
Officer since
September
2002 | | Executive Director of the Adviser and various entities affiliated with the Adviser; Treasurer (since July 2003) and Principal Financial Officer of various Morgan Stanley Funds (since September 2002). | |
Mary E. Mullin (48)
522 Fifth Avenue
New York, NY 10036 | | Secretary | | Since
June
1999 | | Executive Director of the Adviser and various entities affiliated with the Adviser; Secretary of various Morgan Stanley Funds (since June 1999). | |
* This is the earliest date the officer began serving the Morgan Stanley Funds. Each officer serves a one-year term, until his or her successor is elected and has qualified.
45
Morgan Stanley Institutional Fund Trust
Annual Report — September 30, 2015
Adviser and Administrator
Morgan Stanley Investment Management Inc.
522 Fifth Avenue
New York, New York 10036
Distributor
Morgan Stanley Distribution, Inc.
522 Fifth Avenue
New York, New York 10036
Dividend Disbursing and Transfer Agent
Boston Financial Data Services, Inc.
2000 Crown Colony Drive
Quincy, Massachusetts 02169
Custodian
State Street Bank and Trust Company
One Lincoln Street
Boston, Massachusetts 02111
Legal Counsel
Dechert LLP
1095 Avenue of the Americas
New York, New York 10036
Counsel to the Independent Trustees
Kramer Levin Naftalis & Frankel LLP
1177 Avenue of the Americas
New York, New York 10036
Independent Registered Public Accounting Firm
Ernst & Young LLP
200 Clarendon Street
Boston, Massachusetts 02116
Reporting to Shareholders
Each Morgan Stanley fund provides a complete schedule of portfolio holdings in its semi-annual and annual reports within 60 days of the end of the fund's second and fourth fiscal quarters. The semi-annual and annual reports are filed electronically with the Securities and Exchange Commission (SEC) on Form N-CSRS and Form N-CSR, respectively. Morgan Stanley also delivers the semi-annual and annual reports to fund shareholders and makes these reports available on its public website, www.morganstanley.com/im. Each Morgan Stanley fund also files a complete schedule of portfolio holdings with the SEC for the fund's first and third fiscal quarters on Form N-Q. Morgan Stanley does not deliver the reports for the first and third fiscal quarters to shareholders, nor are the reports posted to the Morgan Stanley public website. You may, however, obtain the Form N-Q filings (as well as the Form N-CSR and N-CSRS filings) by accessing the SEC's website, www.sec.gov. You may also review and copy them at the SEC's Public Reference Room in Washington, DC. Information on the operation of the SEC's Public Reference Room may be obtained by calling the SEC toll free at 1 (800) SEC-0330. You can also request copies of these materials, upon payment of a duplicating fee, by electronic request at the SEC's email address (publicinfo@sec.gov) or by writing the Public Reference Room of the SEC, Washington, DC 20549-0102.
Proxy Voting Policies and Procedures and Proxy Voting Record
You may obtain a copy of the Fund's Proxy Voting Policy and Procedures and information regarding how the Fund voted proxies relating to portfolio securities during the most recent twelve-month period ended June 30, without charge, upon request, by calling toll free 1 (800) 548-7786 or by visiting our website at www.morganstanley.com/im. This information is also available on the SEC's website at www.sec.gov.
This report is authorized for distribution only when preceded or accompanied by a prospectus of the Morgan Stanley Institutional Fund Trust, which describes in detail each Portfolio's investment policies, risks, fees and expenses. Please read the prospectus carefully before you invest or send money. For additional information, including information regarding the investments comprising the Portfolio, please visit our website at www.morganstanley.com/im or call toll free 1 (800) 548-7786.
46
(This Page has been left blank intentionally.)
(This Page has been left blank intentionally.)
Printed in U.S.A.
This Report has been prepared for shareholders and may be distributed to others only if preceded or accompanied by a current prospectus.
Morgan Stanley Investment Management Inc.
522 Fifth Avenue
New York, New York 10036
© 2015 Morgan Stanley. Morgan Stanley Distribution, Inc.

IFTCPFIANN
1333153 EXP 11.30.16

Morgan Stanley Institutional Fund Trust
Global Strategist Portfolio
Annual Report
September 30, 2015

Morgan Stanley Institutional Fund Trust
Annual Report — September 30, 2015
Shareholders' Letter | | | 2 | | |
Expense Example | | | 3 | | |
Investment Overview | | | 4 | | |
Portfolio of Investments | | | 7 | | |
Statement of Assets and Liabilities | | | 32 | | |
Statement of Operations | | | 34 | | |
Statements of Changes in Net Assets | | | 35 | | |
Financial Highlights | | | 37 | | |
Notes to Financial Statements | | | 42 | | |
Report of Independent Registered Public Accounting Firm | | | 55 | | |
Investment Advisory Agreement Approval | | | 56 | | |
Federal Tax Notice | | | 58 | | |
U.S. Privacy Policy | | | 59 | | |
Trustee and Officer Information | | | 62 | | |
This report is authorized for distribution only when preceded or accompanied by prospectuses of the Morgan Stanley Institutional Fund Trust. To receive a prospectus and/or statement of additional information (SAI), which contains more complete information such as investment objectives, charges, expenses, policies for voting proxies, risk considerations, and describes in detail each of the Portfolio's investment policies to the prospective investor, please call toll free 1 (800) 548-7786. Please read the prospectuses carefully before you invest or send money.
Additionally, you can access portfolio information including performance, characteristics, and investment team commentary through Morgan Stanley Investment Management's website: www.morganstanley.com/im.
Market forecasts provided in this report may not necessarily come to pass. There is no guarantee that any sectors mentioned will continue to perform as discussed herein or that securities in such sectors will be held by the Portfolio in the future. There is no assurance that a Portfolio will achieve its investment objective. Portfolios are subject to market risk, which is the possibility that market values of securities owned by the Portfolio will decline and, therefore, the value of the Portfolio's shares may be less than what you paid for them. Accordingly, you can lose money investing in this Portfolio. Please see the prospectus for more complete information on investment risks.
1
Morgan Stanley Institutional Fund Trust
Annual Report — September 30, 2015
Shareholders' Letter (unaudited)
Dear Shareholders,
We are pleased to provide this Annual report, in which you will learn how your investment in Global Strategist Portfolio (the "Portfolio") performed during the latest twelve-month period.
Morgan Stanley Investment Management is a client-centric, investor-led organization. Our global presence, intellectual capital, and breadth of products and services enable us to partner with investors to meet the evolving challenges of today's financial markets. We aim to deliver superior investment service and to empower our clients to make the informed decisions that help them reach their investment goals.
As always, we thank you for selecting Morgan Stanley Investment Management, and look forward to working with you in the months and years ahead.
Sincerely,

John H. Gernon
President and Principal Executive Officer
October 2015
2
Morgan Stanley Institutional Fund Trust
Annual Report — September 30, 2015
Expense Example (unaudited)
Global Strategist Portfolio
As a shareholder of the Portfolio, you may incur two types of costs: (1) transactional costs, including sales charge (loads) on purchase payments; and (2) ongoing costs, including advisory fees, administration fees, distribution and shareholder services fees; and other Portfolio expenses. This example is intended to help you understand your ongoing costs (in dollars) of investing in the Portfolio and to compare these costs with the ongoing costs of investing in other mutual funds.
This example is based on an investment of $1,000 invested at the beginning of the six-month period ended September 30, 2015 and held for the entire six-month period (unless otherwise instructed).
Actual Expenses
The table below provides information about actual account values and actual expenses. You may use the information in this table, together with the amount you invested, to estimate the expenses that you paid over the period. Simply divide your account value by $1,000 (for example, an $8,600 account value divided by $1,000 = 8.6), then multiply the result by the number in the table under the heading entitled "Actual Expenses Paid During Period" to estimate the expenses you paid on your account during this period.
Hypothetical Example for Comparison Purposes
The table below provides information about hypothetical account values and hypothetical expenses based on the Portfolio's actual expense ratio and an assumed rate of return of 5% per year before expenses, which is not the Portfolio's actual return. The hypothetical account values and expenses may not be used to estimate the actual ending account balance or expenses you paid for the period. You may use this information to compare the ongoing costs of investing in the Portfolio and other funds. To do so, compare this 5% hypothetical example with the 5% hypothetical examples that appear in the shareholder reports of the other funds.
Please note that the expenses shown in the table are meant to highlight your ongoing costs only and do not reflect any transactional costs, such as sales charges (loads, if applicable). Therefore, the information for each class in the table is useful in comparing ongoing costs only, and will not help you determine the relative total costs of owning different funds. In addition, if these transactional costs were included, your costs would have been higher.
| | | Beginning
Account
Value
4/1/15 | | Actual Ending
Account
Value
9/30/15 | | Hypothetical
Ending Account
Value | | Actual
Expenses
Paid
During
Period | | Hypothetical
Expenses Paid
During Period | | Net
Expense
Ratio
During
Period**** | |
Global Strategist Portfolio Class I | | $ | 1,000.00 | | | $ | 917.00 | | | $ | 1,021.41 | | | $ | 3.51 | * | | $ | 3.70 | * | | | 0.73 | % | |
Global Strategist Portfolio Class A | | | 1,000.00 | | | | 916.00 | | | | 1,019.65 | | | | 5.19 | * | | | 5.47 | * | | | 1.08 | | |
Global Strategist Portfolio Class L | | | 1,000.00 | | | | 913.20 | | | | 1,017.15 | | | | 7.58 | * | | | 7.99 | * | | | 1.58 | | |
Global Strategist Portfolio Class C | | | 1,000.00 | | | | 898.90 | | | | 1,013.29 | | | | 7.28 | ** | | | 7.72 | ** | | | 1.83 | | |
Global Strategist Portfolio Class IS | | | 1,000.00 | | | | 913.00 | | | | 1,014.34 | | | | 2.27 | *** | | | 2.39 | *** | | | 0.71 | | |
* Expenses are calculated using each Portfolio Class' annualized net expense ratio (as disclosed), multiplied by the average account value over the period, and multiplied by 183/365 (to reflect the most recent one-half year period).
** Expenses are calculated using the Portfolio Class' annualized net expense ratio (as disclosed), multiplied by the average account value over the period, and multiplied by 153/365 (to reflect the actual days of the period).
*** Expenses are calculated using the Portfolio Class' annualized net expense ratio (as disclosed), multiplied by the average account value over the period, and multiplied by 122/365 (to reflect the actual days of the period).
**** Annualized.
3
Morgan Stanley Institutional Fund Trust
Annual Report — September 30, 2015
Investment Overview (unaudited)
Global Strategist Portfolio
The Global Strategist Portfolio seeks above-average total return over a market cycle of three to five years.
Performance
For the fiscal year ended September 30, 2015, the Portfolio's Class I Shares had a total return based on net asset value and reinvestment of distributions per share of –8.87%, net of fees. The Portfolio's Class I shares underperformed against the Portfolio's benchmarks, the MSCI All Country World Index, which returned –6.66%, and the Customized MSIM Global Allocation Index (the "Customized Index", which is comprised of 60% MSCI All Country World Index, 30% Barclays Global Aggregate Bond Index, 5% S&P GSCI Light Energy Index, and 5% Bank of America/Merrill Lynch U.S. Dollar 1-Month LIBID Average Index), which returned –6.42%.
Factors Affecting Performance(i)
• In the 12 months ended September 30, 2015, global equities underperformed bonds and outperformed commodities, with the MSCI All Country World Index down –6.7%, the Barclays Global Aggregate Bond Index down –3.3%, and the S&P GSCI Index, a broad index of commodity prices, falling –41.7%.(ii) (Except where noted, equity market returns are represented by the MSCI regional or country index and are calculated in U.S. dollars.)
• Within equities, the U.S. held up on a relative basis, with the S&P 500 Index falling only –0.6% for the period, as the labor market continued to show signs of improvement while monetary policy remained easy. Despite the European Central Bank's (ECB) expanded asset purchase program, European equities underperformed global markets, losing –11.6% as disappointing economic data, a debt crisis in Greece and fears of a global growth slowdown led to a 'risk off' sentiment. Europe also tends to have a higher beta in a market selloff. Emerging markets lost –21.2% on fears of a hard landing in China and its impact on the broader region. In April, Chinese equities were up by more than 37% for the period due to speculation on further policy easing, but these gains were fully reversed and China ended the period down –7.3%. Falling commodity prices, tensions surrounding Russia and a recession in Brazil also damaged sentiment for emerging market assets. Japanese equities were down –3.8%. Despite initial optimism, Japan appeared to enter a
technical recession during the third quarter of 2015, and S&P downgraded its sovereign credit rating, citing disappointment with the effectiveness of the economic stimulus plan ('Abenomics').
• Within bonds, the yield curve flattened as the normalization of U.S. monetary policy became imminent, while the pace and moderation of rate hikes were re-priced to be more subdued as the global growth outlook softened. The U.S. 2-year Treasury yield rose 6 basis points to 0.63%, and the U.S. 10-year Treasury yield fell 45 basis points to 2.04%. U.S. investment grade spreads rose 57 basis points to 1.7%, and high yield spreads rose 206 basis points to 6.3%, as weakness in China and the global energy sector led a flight to safe haven assets. Emerging market bond spreads widened by 140 basis points. In Europe, German bund yields reached all-time lows, with even the 5-year yield moving into negative territory, as the ECB commenced its quantitative easing program in March. Greek bond spreads spiked as the country's debt crisis escalated, with the 10-year yield reaching 13.6% in April before falling to 8.2% in September (rising only 159 basis points for the period) after a bailout package was approved.
• Within currencies, the U.S. dollar rallied by 12.1% on a trade-weighted basis, peaking at a 12-year high in March. Emerging market currencies lost –19.1% versus the dollar as commodity prices fell sharply, with the greatest losses in the Russian ruble, which fell –39.5%. The euro depreciated by –11.5% and the Japanese yen fell by –8.5%.
• Regarding the Portfolio's overall performance relative to the Customized Index, the Portfolio's underweight position in commodities contributed to performance, as did overweight positions in cash and equities. However, an underweight position in fixed income detracted from performance.
• Active positions within equities detracted from performance. Underweight positions in Chinese A-shares and Chinese H-shares relative to global equities detracted from performance, as did overweight positions in eurozone relative to U.S. equities and U.S. energy stocks relative to U.S. equities. Underweight positions in global machinery stocks relative to global equities and in U.S. equities contributed to performance.
4
Morgan Stanley Institutional Fund Trust
Annual Report — September 30, 2015
Investment Overview (unaudited) (cont'd)
Global Strategist Portfolio
• Active positions within fixed income detracted from performance. Underweight positions in U.S. 5-year and 2-year Treasuries and overweight positions in Brazilian 10-year bonds detracted from performance. Overweight positions in Greek bonds and underweight positions in U.S. credit spreads contributed positively.
• Active positions within commodities (implemented via commodity futures) had a neutral impact on performance, as gains from an underweight position in copper were offset by losses from an overweight position in Brent oil.
• Active currency positions (implemented via currency forwards and futures) positively impacted performance. Underweight positions in China-sensitive currencies and a broad basket of emerging market currencies contributed positively, as did an overweight position in the Russian ruble and an underweight position in the Chinese renminbi.
Management Strategies
• As of September 30, 2015, we are neutral on fixed income and tactically overweight global equities in the Portfolio. Heading into the fourth quarter of 2015, we believe that a short-term stabilization in China could lift global risky assets as the fear of an impending global recession subsides. We prefer European and emerging market equities over the U.S. and Japan. We believe that many yield-sensitive assets are overvalued globally, but re-pricing may continue to be delayed as the U.S. Federal Reserve (Fed) monitors the global economy. Given the dovish stance of the Fed, we are constructive on real and inflation-sensitive assets including gold and U.S. Treasury inflation-protected securities (TIPS).
• We believe the eurozone recovery remains on track. We are overweight eurozone equities versus the U.S., as eurozone equities are cheaper and likely to benefit from a cyclical earnings recovery versus the U.S.'s more mature profit cycle. We expect the tailwinds of a weaker euro, lower corporate borrowing rates, and lower oil prices to support eurozone economic growth and drive robust earnings growth. While recent economic data has been marginally softer than our expectations, we
believe the eurozone growth trajectory is still strong enough to support our view.
• We are tactically overweight emerging market equities. In the medium-term, we expect a continued China slowdown to remain a headwind for broad emerging market growth as the excesses of China's investment and credit bubbles inevitably unwind. However, in the near-term, several leading indicators are pointing to the possibility that Chinese growth may stabilize or even accelerate in the coming quarters as a result of massive policy easing. Amidst bearish sentiment, we believe this could be enough to halt or even temporarily reverse the bear market in emerging market and commodity related assets.
• We are underweight Japanese equities. Japan is now likely in a technical recession, as domestic activity has been insufficient to offset external drags from slower growth in Asia. We expect the market to increasingly recognize that Abenomics has largely failed, much like S&P has begun to do in downgrading Japan's sovereign credit rating. Japanese equity valuations are not cheap enough to offset deteriorating fundamentals, and sentiment is bullish.
(i) Certain of the Portfolio's investment themes may, in whole or part, be implemented through the use of derivatives, including the purchase and sale of futures, options, swaps, structured investments (including commodity-linked notes) and other related instruments and techniques. The Portfolio may also invest in foreign currency forward exchange contracts, which are also derivatives, in connection with its investments in foreign securities. The Portfolio may use derivative instruments for a variety of purposes, including hedging, risk management, portfolio management or to earn income. As a result, the use of derivatives had a material effect on the Portfolio's performance during the period.
(ii) Data sources used in preparation of this commentary include FactSet and Bloomberg LP. Data as of September 30, 2015.
5
Morgan Stanley Institutional Fund Trust
Annual Report — September 30, 2015
Investment Overview (unaudited) (cont'd)
Global Strategist Portfolio

* Minimum Investment
In accordance with SEC regulations, the Portfolio's performance shown assumes that all recurring fees (including management fees) were deducted and all dividends and distributions were reinvested. The performance of Class A, Class L, Class C and Class IS shares will vary from the performance of Class I shares based upon their different inception dates and will be negatively impacted by additional fees assessed to those classes (where applicable).
Performance Compared to the MSCI All Country World Index(1), the Customized MSIM Global Allocation Index(2) and the Lipper Flexible Portfolio Funds Index(3)
| | | Period Ended September 30, 2015
Total Returns(4) | |
| | | | | Average Annual | |
| | | One
Year | | Five
Years | | Ten
Years | | Since
Inception(10) | |
Portfolio — Class I Shares
w/o sales charges(5) | | | –8.87 | % | | | 6.85 | % | | | 5.35 | % | | | 7.14 | % | |
Portfolio — Class A Shares
w/o sales charges(6) | | | –9.16 | | | | 6.54 | | | | 5.06 | | | | 5.94 | | |
Portfolio — Class A Shares with
maximum 5.25% sales charges(6) | | | –13.95 | | | | 5.41 | | | | 4.49 | | | | 5.64 | | |
Portfolio — Class L Shares
w/o sales charges(7) | | | –9.66 | | | | — | | | | — | | | | 4.02 | | |
Portfolio — Class C Shares
w/o sales charges(8) | | | — | | | | — | | | | — | | | | –10.11 | | |
Portfolio — Class C Shares with
maximum 1.00% deferred
sales charges(8) | | | — | | | | — | | | | — | | | | –11.00 | | |
Portfolio — Class IS Shares
w/o sales charges(9) | | | — | | | | — | | | | — | | | | –8.70 | | |
MSCI All Country World Index | | | –6.66 | | | | 6.82 | | | | 4.58 | | | | 7.10 | | |
Customized MSIM Global
Allocation Index | | | –6.42 | | | | 4.08 | | | | 3.97 | | | | — | | |
Lipper Flexible Portfolio Funds Index | | | –4.83 | | | | 6.58 | | | | 5.12 | | | | 6.58 | | |
Performance data quoted represents past performance, which is no guarantee of future results, and current performance may be lower or higher than the figures shown. Performance assumes that all dividends and distributions, if any, were reinvested. Returns for period less than one year are not annualized. For the most recent month-end performance figures, please visit www.morganstanley.com/im. Investment returns and principal value will fluctuate so that Portfolio shares, when redeemed, may be worth more or less than their original cost. Total returns do not reflect the deduction of taxes that a shareholder would pay on Portfolio distributions or the redemption of Portfolio shares. Performance of share classes will vary due to differences in sales charges and expenses.
(1) The MSCI All Country World Index (ACWI) is a free float-adjusted market capitalization weighted index designed to measure the equity market performance of developed and emerging markets. The term "free float" represents the portion of shares outstanding that are deemed to be available for purchase in the public equity markets by investors. The performance of the Index is listed in U.S. dollars and assumes reinvestment of net dividends. "Net dividends" reflects a reduction in dividends after taking into account withholding of taxes by any foreign countries represented in the Index. Returns, including periods prior to January 1, 2001, are calculated using the return data of the MSCI All Country World Index (gross dividends) through December 31, 2000 and the return data of the MSCI All Country World Index (net dividends) after December 31, 2000. The Index is unmanaged and its returns do not include any sales charges or fees. Such costs would lower performance. It is not possible to invest directly in an index.
(2) The Customized MSIM Global Allocation Index is comprised of 60% MSCI All Country World Index (benchmark that measures the equity market performance of developed and emerging markets), 30% Barclays Global Aggregate Bond Index (benchmark that provides a broadbased measure of the global investment grade fixed-rate debt markets), 5% S&P GSCI Light Energy Index (benchmark for investment performance in the energy commodity market) and 5% Bank of America/Merrill Lynch U.S. Dollar 1-Month LIBID Average Index (benchmark that tracks the performance of a basket of synthetic assets paying LIBID to a stated maturity). The Customized MSIM Global Allocation Index was added as the Portfolio benchmark on October 2, 2013 and is provided for comparative purposes only. The Index is unmanaged and its returns do not include any sales charges or fees. Such costs would lower performance. It is not possible to invest directly in an index.
(3) The Lipper Flexible Portfolio Funds Index is an equally weighted performance index of the largest qualifying funds (based on net assets) in the Lipper Flexible Portfolio Funds classification. The Index, which is adjusted for capital gains distributions and income dividends, is unmanaged and should not be considered an investment. There are currently 30 funds represented in this Index. As of the date of this report, the Portfolio was in the Lipper Flexible Portfolio Funds classification.
(4) Total returns for the Portfolio reflect expenses waived and/or reimbursed, if applicable, by the Adviser. Without such waivers and/or reimbursements, total returns would have been lower.
(5) Commenced operations on December 31, 1992.
(6) Commenced operations on November 1, 1996.
(7) Commenced operations on April 27, 2012.
(8) Commenced operations on April 30, 2015.
(9) Commenced operations on May 29, 2015.
(10) For comparative purposes, average annual since inception returns listed for the Indexes refer to the inception date of the Class I of the Portfolio, not the inception of the Indexes.
6
Morgan Stanley Institutional Fund Trust
Annual Report — September 30, 2015
Portfolio of Investments
Global Strategist Portfolio
| | | Face
Amount
(000) | | Value
(000) | |
Fixed Income Securities (29.2%) | |
Agency Adjustable Rate Mortgage (0.0%) | |
United States (0.0%) | |
Federal National Mortgage Association,
Conventional Pool:
2.41%, 5/1/35 | | $ | 30 | | | $ | 32 | | |
Agency Fixed Rate Mortgages (3.0%) | |
United States (3.0%) | |
Federal Home Loan Mortgage Corporation, | |
Gold Pools: | |
3.50%, 1/1/44 | | | 441 | | | | 461 | | |
6.00%, 11/1/37 | | | 114 | | | | 129 | | |
6.50%, 5/1/32 - 9/1/32 | | | 80 | | | | 94 | | |
7.50%, 5/1/35 | | | 8 | | | | 9 | | |
November TBA: | |
3.50%, 11/1/45 (a) | | | 1,142 | | | | 1,186 | | |
4.00%, 11/1/45 (a) | | | 1,760 | | | | 1,870 | | |
Federal National Mortgage Association, | |
Conventional Pools: | |
3.00%, 3/1/30 - 5/1/30 | | | 456 | | | | 475 | | |
3.50%, 4/1/29 | | | 440 | | | | 465 | | |
4.00%, 8/1/45 - 9/1/45 | | | 1,309 | | | | 1,401 | | |
4.50%, 3/1/41 - 11/1/44 | | | 490 | | | | 540 | | |
5.00%, 1/1/41 - 3/1/41 | | | 1,516 | | | | 1,688 | | |
6.00%, 1/1/38 | | | 13 | | | | 15 | | |
6.50%, 12/1/29 | | | 26 | | | | 30 | | |
7.00%, 12/1/17 - 2/1/31 | | | 372 | | | | 426 | | |
7.50%, 8/1/37 | | | 16 | | | | 19 | | |
Government National Mortgage Association, | |
October TBA: | |
3.50%, 10/20/45 (a) | | | 1,473 | | | | 1,543 | | |
Various Pools: | |
3.50%, 12/15/43 | | | 528 | | | | 555 | | |
4.00%, 8/20/41 - 11/20/42 | | | 766 | | | | 822 | | |
5.50%, 8/15/39 | | | 124 | | | | 139 | | |
| | | | 11,867 | | |
Asset-Backed Security (0.1%) | |
United States (0.1%) | |
CVS Pass-Through Trust, | |
6.04%, 12/10/28 | | | 351 | | | | 397 | | |
Collateralized Mortgage Obligations — Agency Collateral Series (0.5%) | |
United States (0.5%) | |
Federal Home Loan Mortgage Corporation, | |
2.40%, 6/25/22 | | | 1,625 | | | | 1,649 | | |
2.79%, 1/25/22 | | | 75 | | | | 78 | | |
2.97%, 10/25/21 | | | 90 | | | | 95 | | |
IO | |
0.81%, 1/25/21 (b) | | | 1,297 | | | | 33 | | |
IO REMIC | |
5.84%, 4/15/39 (b) | | | 139 | | | | 21 | | |
| | | | 1,876 | | |
| | | Face
Amount
(000) | | Value
(000) | |
Commercial Mortgage-Backed Securities (0.8%) | |
United States (0.8%) | |
COMM Mortgage Trust, | |
3.28%, 1/10/46 | | $ | 305 | | | $ | 313 | | |
4.90%, 7/15/47 (b)(c) | | | 152 | | | | 137 | | |
Commercial Mortgage Pass-Through Certificates, | |
2.82%, 10/15/45 | | | 376 | | | | 382 | | |
Extended Stay America Trust, | |
2.96%, 12/5/31 (c) | | | 325 | | | | 328 | | |
JP Morgan Chase Commercial Mortgage Securities Trust, | |
4.39%, 7/15/46 (c) | | | 100 | | | | 110 | | |
4.72%, 7/15/47 (b)(c) | | | 745 | | | | 653 | | |
JPMBB Commercial Mortgage Securities Trust, | |
4.11%, 9/15/47 (b)(c) | | | 205 | | | | 177 | | |
4.71%, 9/15/47 (b)(c) | | | 263 | | | | 232 | | |
4.82%, 8/15/47 (b)(c) | | | 361 | | | | 323 | | |
UBS-Barclays Commercial Mortgage Trust, | |
3.53%, 5/10/63 | | | 255 | | | | 269 | | |
WF-RBS Commercial Mortgage Trust, | |
4.14%, 10/15/57 (b)(c) | | | 362 | | | | 310 | | |
| | | | 3,234 | | |
Corporate Bonds (8.5%) | |
Australia (0.4%) | |
Australia & New Zealand Banking Group Ltd., | |
5.13%, 9/10/19 | | EUR | 400 | | | | 509 | | |
BHP Billiton Finance USA Ltd., | |
3.85%, 9/30/23 | | $ | 170 | | | | 171 | | |
Macquarie Bank Ltd., | |
6.63%, 4/7/21 (c) | | | 270 | | | | 303 | | |
Origin Energy Finance Ltd., | |
3.50%, 10/9/18 (c) | | | 200 | | | | 194 | | |
QBE Insurance Group Ltd., | |
2.40%, 5/1/18 (c) | | | 200 | | | | 202 | | |
Telstra Corp., Ltd., | |
3.13%, 4/7/25 (c) | | | 135 | | | | 132 | | |
Wesfarmers Ltd., | |
2.98%, 5/18/16 (c) | | | 245 | | | | 248 | | |
| | | | 1,759 | | |
Belgium (0.1%) | |
Anheuser-Busch InBev Finance, Inc., | |
3.70%, 2/1/24 | | | 300 | | | | 304 | | |
Brazil (0.0%) | |
Vale Overseas Ltd., | |
6.88%, 11/10/39 | | | 50 | | | | 39 | | |
Canada (0.1%) | |
Barrick Gold Corp., | |
4.10%, 5/1/23 | | | 100 | | | | 89 | | |
Brookfield Asset Management, Inc., | |
5.80%, 4/25/17 | | | 295 | | | | 313 | | |
Goldcorp, Inc., | |
3.70%, 3/15/23 | | | 198 | | | | 184 | | |
| | | | 586 | | |
The accompanying notes are an integral part of the financial statements.
7
Morgan Stanley Institutional Fund Trust
Annual Report — September 30, 2015
Portfolio of Investments (cont'd)
Global Strategist Portfolio
| | | Face
Amount
(000) | | Value
(000) | |
Chile (0.1%) | |
Empresa Nacional de Telecomunicaciones SA, | |
4.75%, 8/1/26 (c) | | $ | 250 | | | $ | 241 | | |
China (0.1%) | |
Baidu, Inc., | |
3.25%, 8/6/18 | | | 225 | | | | 230 | | |
Want Want China Finance Ltd., | |
1.88%, 5/14/18 (c) | | | 200 | | | | 197 | | |
| | | | 427 | | |
Colombia (0.1%) | |
Ecopetrol SA, | |
5.88%, 9/18/23 | | | 270 | | | | 261 | | |
France (0.7%) | |
AXA SA, | |
3.94%, 11/7/24 (b)(d) | | EUR | 500 | | | | 523 | | |
Banque Federative du Credit Mutuel SA, | |
2.00%, 9/19/19 | | | 500 | | | | 587 | | |
BNP Paribas SA, | |
5.00%, 1/15/21 | | $ | 95 | | | | 107 | | |
MTN | |
4.25%, 10/15/24 | | | 250 | | | | 249 | | |
| BPCE SA, | |
5.15%, 7/21/24 (c) | | | 450 | | | | 458 | | |
Credit Agricole Assurances SA, | |
4.25%, 1/13/25 (b)(d) | | EUR | 500 | | | | 515 | | |
Credit Agricole SA, | |
3.90%, 4/19/21 | | | 50 | | | | 61 | | |
Electricite de France SA, | |
5.00%, 1/22/26 (b)(d) | | | 300 | | | | 334 | | |
| | | | 2,834 | | |
Germany (0.3%) | |
Bayer AG, | |
3.75%, 7/1/74 (b) | | | 300 | | | | 329 | | |
Muenchener Rueckversicherungs-Gesellschaft AG in Muenchen, | |
6.00%, 5/26/41 (b) | | | 400 | | | | 521 | | |
Siemens Financieringsmaatschappij N.V., | |
3.25%, 5/27/25 (c) | | $ | 250 | | | | 250 | | |
Vier Gas Transport GmbH, | |
3.13%, 7/10/23 | | EUR | 100 | | | | 125 | | |
| | | | 1,225 | | |
Hong Kong (0.1%) | |
Hutchison Whampoa International 14 Ltd., | |
1.63%, 10/31/17 (c) | | $ | 200 | | | | 199 | | |
Italy (0.4%) | |
Assicurazioni Generali SpA, | |
10.13%, 7/10/42 (b) | | EUR | 400 | | | | 579 | | |
FCA Capital Ireland PLC, | |
1.38%, 4/17/20 | | | 500 | | | | 539 | | |
Telecom Italia Finance SA, | |
7.75%, 1/24/33 | | | 80 | | | | 115 | | |
UniCredit SpA, | |
4.25%, 7/29/16 | | | 350 | | | | 404 | | |
| | | | 1,637 | | |
| | | Face
Amount
(000) | | Value
(000) | |
Korea, Republic of (0.1%) | |
SK Telecom Co., Ltd., | |
2.13%, 5/1/18 (c) | | $ | 200 | | | $ | 201 | | |
Malaysia (0.1%) | |
Petronas Capital Ltd., | |
3.50%, 3/18/25 (c) | | | 375 | | | | 359 | | |
Mexico (0.0%) | |
Mexichem SAB de CV, | |
5.88%, 9/17/44 (c) | | | 200 | | | | 170 | | |
Netherlands (0.5%) | |
ABN Amro Bank N.V., | |
2.50%, 10/30/18 (c) | | | 300 | | | | 305 | | |
3.63%, 10/6/17 | | EUR | 200 | | | | 238 | | |
ASR Nederland N.V., | |
5.00%, 9/30/24 (b)(d) | | | 500 | | | | 529 | | |
Cooperatieve Centrale Raiffeisen-Boerenleenbank BA, | |
3.95%, 11/9/22 | | $ | 250 | | | | 251 | | |
Series G | |
3.75%, 11/9/20 | | EUR | 300 | | | | 365 | | |
ING Bank N.V., | |
5.80%, 9/25/23 (c) | | $ | 240 | | | | 261 | | |
Shell International Finance BV, | |
2.13%, 5/11/20 | | | 225 | | | | 226 | | |
| | | | 2,175 | | |
Spain (0.4%) | |
Banco Bilbao Vizcaya Argentaria SA, | |
3.63%, 1/18/17 | | EUR | 350 | | | | 409 | | |
Santander Issuances SAU, | |
2.50%, 3/18/25 | | | 600 | | | | 611 | | |
Telefonica Emisiones SAU, | |
4.71%, 1/20/20 | | | 300 | | | | 383 | | |
| | | | 1,403 | | |
Sweden (0.1%) | |
Skandinaviska Enskilda Banken AB, | |
1.75%, 3/19/18 (c) | | $ | 200 | | | | 200 | | |
Swedbank AB, | |
1.75%, 3/12/18 (c) | | | 270 | | | | 272 | | |
| | | | 472 | | |
Switzerland (0.5%) | |
Aquarius and Investments PLC for Zurich Insurance Co., Ltd., | |
4.25%, 10/2/43 (b) | | EUR | 450 | | | | 536 | | |
Credit Suisse, | |
6.00%, 2/15/18 | | $ | 90 | | | | 98 | | |
Credit Suisse AG, | |
0.63%, 11/20/18 | | EUR | 550 | | | | 613 | | |
Glencore Funding LLC, | |
4.13%, 5/30/23 (c) | | $ | 200 | | | | 157 | | |
Novartis Capital Corp., | |
4.40%, 5/6/44 | | | 150 | | | | 162 | | |
UBS AG, | |
7.50%, 7/15/25 | | | 380 | | | | 479 | | |
| | | | 2,045 | | |
The accompanying notes are an integral part of the financial statements.
8
Morgan Stanley Institutional Fund Trust
Annual Report — September 30, 2015
Portfolio of Investments (cont'd)
Global Strategist Portfolio
| | | Face
Amount
(000) | | Value
(000) | |
Thailand (0.1%) | |
PTT Exploration & Production PCL, | |
3.71%, 9/16/18 (c) | | $ | 240 | | | $ | 248 | | |
PTT PCL, | |
3.38%, 10/25/22 (c) | | | 230 | | | | 228 | | |
| | | | 476 | | |
United Kingdom (0.9%) | |
Abbey National Treasury Services PLC, | |
4.00%, 3/13/24 | | | 120 | | | | 125 | | |
BAT International Finance PLC, | |
9.50%, 11/15/18 (c) | | | 155 | | | | 190 | | |
Diageo Capital PLC, | |
1.50%, 5/11/17 | | | 215 | | | | 216 | | |
Experian Finance PLC, | |
2.38%, 6/15/17 (c) | | | 400 | | | | 403 | | |
GlaxoSmithKline Capital, Inc., | |
6.38%, 5/15/38 | | | 100 | | | | 127 | | |
Heathrow Funding Ltd., | |
4.60%, 2/15/18 | | EUR | 300 | | | | 366 | | |
HSBC Holdings PLC, | |
6.38%, 9/17/24 (b)(d) | | $ | 200 | | | | 191 | | |
Imperial Tobacco Finance PLC, | |
8.38%, 2/17/16 | | EUR | 400 | | | | 461 | | |
Lloyds Bank PLC, | |
6.50%, 3/24/20 | | | 400 | | | | 533 | | |
Nationwide Building Society, | |
3.90%, 7/21/25 (c) | | $ | 200 | | | | 205 | | |
6.25%, 2/25/20 (c) | | | 300 | | | | 352 | | |
NGG Finance PLC, | |
5.63%, 6/18/73 (b) | | GBP | 200 | | | | 318 | | |
| | | | 3,487 | | |
United States (3.4%) | |
AbbVie, Inc., | |
3.60%, 5/14/25 | | $ | 200 | | | | 198 | | |
Actavis Funding SCS, | |
3.80%, 3/15/25 | | | 55 | | | | 53 | | |
Altria Group, Inc., | |
2.85%, 8/9/22 | | | 25 | | | | 24 | | |
5.38%, 1/31/44 | | | 155 | | | | 169 | | |
Apple, Inc., | |
3.85%, 5/4/43 | | | 100 | | | | 91 | | |
4.45%, 5/6/44 | | | 175 | | | | 175 | | |
AT&T, Inc., | |
5.55%, 8/15/41 | | | 50 | | | | 51 | | |
6.30%, 1/15/38 | | | 150 | | | | 165 | | |
Bank of America Corp., | |
MTN | |
4.00%, 4/1/24 | | | 250 | | | | 258 | | |
4.20%, 8/26/24 | | | 100 | | | | 100 | | |
4.25%, 10/22/26 | | | 45 | | | | 45 | | |
5.00%, 1/21/44 | | | 250 | | | | 264 | | |
| | | Face
Amount
(000) | | Value
(000) | |
Baxalta, Inc., | |
4.00%, 6/23/25 (c) | | $ | 300 | | | $ | 301 | | |
Bayer US Finance LLC, | |
3.38%, 10/8/24 (c) | | | 200 | | | | 201 | | |
Biogen, Inc., | |
4.05%, 9/15/25 | | | 175 | | | | 177 | | |
Boston Properties LP, | |
3.85%, 2/1/23 | | | 25 | | | | 26 | | |
Burlington Northern Santa Fe LLC, | |
4.55%, 9/1/44 | | | 195 | | | | 192 | | |
Capital One Bank, USA NA, | |
3.38%, 2/15/23 | | | 546 | | | | 532 | | |
CCO Safari II LLC, | |
4.91%, 7/23/25 (c) | | | 300 | | | | 299 | | |
Citigroup, Inc., | |
5.50%, 9/13/25 | | | 250 | | | | 272 | | |
6.13%, 5/15/18 | | | 107 | | | | 118 | | |
6.68%, 9/13/43 | | | 20 | | | | 25 | | |
8.13%, 7/15/39 | | | 175 | | | | 252 | | |
Coca-Cola Co., | |
3.20%, 11/1/23 | | | 250 | | | | 257 | | |
Comcast Corp., | |
4.60%, 8/15/45 | | | 130 | | | | 133 | | |
DirecTV Holdings LLC/DIRECTV Financing Co., Inc., | |
5.15%, 3/15/42 | | | 25 | | | | 24 | | |
Discover Bank, | |
2.00%, 2/21/18 | | | 345 | | | | 343 | | |
Enterprise Products Operating LLC, | |
3.35%, 3/15/23 | | | 275 | | | | 266 | | |
Five Corners Funding Trust, | |
4.42%, 11/15/23 (c) | | | 350 | | | | 367 | | |
Ford Motor Credit Co., LLC, | |
4.21%, 4/15/16 | | | 305 | | | | 310 | | |
Freeport-McMoRan, Inc., | |
3.88%, 3/15/23 | | | 45 | | | | 34 | | |
General Electric Capital Corp., | |
5.30%, 2/11/21 | | | 275 | | | | 316 | | |
General Motors Financial Co., Inc., | |
4.30%, 7/13/25 | | | 250 | | | | 242 | | |
Genworth Holdings, Inc., | |
7.20%, 2/15/21 | | | 105 | | | | 105 | | |
Gilead Sciences, Inc., | |
3.65%, 3/1/26 | | | 175 | | | | 176 | | |
4.80%, 4/1/44 | | | 75 | | | | 76 | | |
Goldman Sachs Group, Inc. (The), | |
4.80%, 7/8/44 | | | 275 | | | | 279 | | |
Hartford Financial Services Group, Inc. (The), | |
5.50%, 3/30/20 | | | 25 | | | | 28 | | |
Home Depot, Inc., | |
5.88%, 12/16/36 | | | 100 | | | | 123 | | |
HP Enterprise Co., | |
3.60%, 10/15/20 | | | 325 | | | | 325 | | |
HSBC USA, Inc., | |
3.50%, 6/23/24 | | | 100 | | | | 102 | | |
The accompanying notes are an integral part of the financial statements.
9
Morgan Stanley Institutional Fund Trust
Annual Report — September 30, 2015
Portfolio of Investments (cont'd)
Global Strategist Portfolio
| | | Face
Amount
(000) | | Value
(000) | |
United States (cont'd) | |
International Business Machines Corp., | |
1.95%, 2/12/19 | | $ | 300 | | | $ | 303 | | |
JPMorgan Chase & Co., | |
3.20%, 1/25/23 | | | 615 | | | | 611 | | |
3.88%, 2/1/24 | | | 200 | | | | 207 | | |
Kinder Morgan Energy Partners LP, | |
4.15%, 2/1/24 | | | 125 | | | | 113 | | |
Kinder Morgan, Inc., | |
4.30%, 6/1/25 | | | 150 | | | | 135 | | |
Liberty Mutual Group, Inc., | |
4.85%, 8/1/44 (c) | | | 100 | | | | 98 | | |
McDonald's Corp., | |
3.38%, 5/26/25 | | | 275 | | | | 277 | | |
Medtronic, Inc., | |
3.63%, 3/15/24 | | | 250 | | | | 257 | | |
4.63%, 3/15/45 | | | 50 | | | | 52 | | |
Merck & Co., Inc., | |
2.80%, 5/18/23 | | | 250 | | | | 249 | | |
Monongahela Power Co., | |
5.40%, 12/15/43 (c) | | | 100 | | | | 111 | | |
NBC Universal Media LLC, | |
4.38%, 4/1/21 | | | 175 | | | | 192 | | |
Omnicom Group, Inc., | |
3.63%, 5/1/22 | | | 60 | | | | 61 | | |
3.65%, 11/1/24 | | | 84 | | | | 83 | | |
Oracle Corp., | |
3.40%, 7/8/24 | | | 175 | | | | 178 | | |
Pacific LifeCorp, | |
6.00%, 2/10/20 (c) | | | 25 | | | | 28 | | |
PepsiCo, Inc., | |
3.60%, 3/1/24 | | | 250 | | | | 260 | | |
Philip Morris International, Inc., | |
2.13%, 5/30/19 | | EUR | 150 | | | | 176 | | |
Plains All American Pipeline LP/PAA Finance Corp., | |
6.70%, 5/15/36 | | $ | 190 | | | | 210 | | |
8.75%, 5/1/19 | | | 220 | | | | 263 | | |
Prudential Financial, Inc., | |
6.63%, 12/1/37 | | | 150 | | | | 188 | | |
QUALCOMM, Inc., | |
4.65%, 5/20/35 | | | 250 | | | | 229 | | |
Target Corp., | |
3.50%, 7/1/24 | | | 200 | | | | 209 | | |
Time Warner Cable, Inc., | |
4.50%, 9/15/42 | | | 175 | | | | 139 | | |
Tyco International Finance SA, | |
3.90%, 2/14/26 | | | 175 | | | | 178 | | |
Tyson Foods, Inc., | |
3.95%, 8/15/24 | | | 60 | | | | 61 | | |
UnitedHealth Group, Inc., | |
3.75%, 7/15/25 | | | 75 | | | | 78 | | |
4.25%, 3/15/43 | | | 150 | | | | 149 | | |
| | | Face
Amount
(000) | | Value
(000) | |
Verizon Communications, Inc., | |
4.67%, 3/15/55 | | $ | 231 | | | $ | 200 | | |
5.01%, 8/21/54 | | | 195 | | | | 178 | | |
Wells Fargo & Co., | |
3.45%, 2/13/23 | | | 395 | | | | 393 | | |
Zimmer Biomet Holdings, Inc., | |
5.75%, 11/30/39 | | | 150 | | | | 165 | | |
| | | | 13,525 | | |
| | | | 33,825 | | |
Mortgages — Other (0.4%) | |
United Kingdom (0.2%) | |
Holmes Master Issuer PLC, | |
2.13%, 10/15/54 (b)(c) | | GBP | 616 | | | | 948 | | |
United States (0.2%) | |
Banc of America Alternative Loan Trust, | |
5.86%, 10/25/36 | | $ | 46 | | | | 29 | | |
6.00%, 4/25/36 | | | 25 | | | | 26 | | |
ChaseFlex Trust, | |
6.00%, 2/25/37 | | | 41 | | | | 36 | | |
First Horizon Alternative Mortgage Securities Trust, | |
6.25%, 8/25/36 | | | 21 | | | | 17 | | |
Freddie Mac Whole Loan Securities Trust, | |
3.50%, 5/25/45 | | | 333 | | | | 338 | | |
4.00%, 5/25/45 | | | 135 | | | | 139 | | |
GSR Mortgage Loan Trust, | |
5.75%, 1/25/37 | | | 35 | | | | 34 | | |
Lehman Mortgage Trust, | |
5.50%, 11/25/35 | | | 13 | | | | 12 | | |
6.50%, 9/25/37 | | | 45 | | | | 37 | | |
RALI Trust, | |
0.69%, 3/25/35 (b) | | | 52 | | | | 38 | | |
| | | | 706 | | |
| | | | 1,654 | | |
Sovereign (12.0%) | |
Australia (0.4%) | |
Australia Government Bond, | |
2.75%, 4/21/24 | | AUD | 1,320 | | | | 941 | | |
3.25%, 4/21/25 | | | 750 | | | | 555 | | |
| | | | 1,496 | | |
Belgium (0.4%) | |
Belgium Government Bond, | |
0.80%, 6/22/25 (c) | | EUR | 900 | | | | 996 | | |
3.00%, 9/28/19 | | | 480 | | | | 601 | | |
| | | | 1,597 | | |
Bermuda (0.1%) | |
Bermuda Government International Bond, | |
4.85%, 2/6/24 (c) | | $ | 390 | | | | 409 | | |
Canada (1.0%) | |
Canadian Government Bond, | |
1.50%, 6/1/23 | | CAD | 2,300 | | | | 1,756 | | |
3.25%, 6/1/21 | | | 2,600 | | | | 2,194 | | |
| | | | 3,950 | | |
The accompanying notes are an integral part of the financial statements.
10
Morgan Stanley Institutional Fund Trust
Annual Report — September 30, 2015
Portfolio of Investments (cont'd)
Global Strategist Portfolio
| | | Face
Amount
(000) | | Value
(000) | |
China (0.1%) | |
Sinopec Group Overseas Development 2015 Ltd., | |
2.50%, 4/28/20 (c) | | $ | 375 | | | $ | 370 | | |
France (0.5%) | |
France Government Bond OAT, | |
3.25%, 5/25/45 | | EUR | 900 | | | | 1,316 | | |
5.50%, 4/25/29 | | | 300 | | | | 511 | | |
| | | | 1,827 | | |
Germany (0.4%) | |
Bundesrepublik Deutschland, | |
4.25%, 7/4/39 | | | 710 | | | | 1,286 | | |
4.75%, 7/4/34 | | | 220 | | | | 398 | | |
| | | | 1,684 | | |
Greece (0.3%) | |
Hellenic Republic Government Bond, | |
3.00%, 2/24/23 - 2/24/42 (e) | | | 1,700 | | | | 1,182 | | |
Hungary (0.3%) | |
Hungary Government International Bond, | |
5.38%, 3/25/24 | | $ | 250 | | | | 272 | | |
5.75%, 11/22/23 | | | 800 | | | | 892 | | |
| | | | 1,164 | | |
Indonesia (0.3%) | |
Indonesia Government International Bond, | |
5.88%, 1/15/24 (c) | | | 800 | | | | 849 | | |
Perusahaan Listrik Negara PT, | |
5.50%, 11/22/21 | | | 300 | | | | 303 | | |
| | | | 1,152 | | |
Ireland (0.1%) | |
Ireland Government Bond, | |
5.40%, 3/13/25 | | EUR | 200 | | | | 306 | | |
Italy (1.2%) | |
Italy Buoni Poliennali Del Tesoro, | |
1.50%, 6/1/25 | | | 1,080 | | | | 1,185 | | |
1.65%, 3/1/32 (c) | | | 880 | | | | 908 | | |
2.35%, 9/15/24 (c) | | | 2,226 | | | | 2,815 | | |
| | | | 4,908 | | |
Japan (1.9%) | |
Japan Finance Organization for Municipalities, | |
1.90%, 6/22/18 | | JPY | 70,000 | | | | 613 | | |
Japan Government Ten Year Bond, | |
0.50%, 9/20/24 | | | 80,000 | | | | 681 | | |
1.10%, 6/20/21 | | | 75,000 | | | | 662 | | |
Japan Government Thirty Year Bond, | |
1.70%, 6/20/33 | | | 395,000 | | | | 3,701 | | |
2.00%, 9/20/40 | | | 193,000 | | | | 1,850 | | |
| | | | 7,507 | | |
Korea, Republic of (0.3%) | |
Korea Development Bank (The), | |
3.88%, 5/4/17 | | $ | 400 | | | | 415 | | |
4.63%, 11/16/21 | | | 630 | | | | 700 | | |
| | | | 1,115 | | |
| | | Face
Amount
(000) | | Value
(000) | |
Mexico (0.2%) | |
Mexican Bonos, | |
8.00%, 6/11/20 | | MXN | 8,000 | | | $ | 530 | | |
Petroleos Mexicanos, | |
6.38%, 1/23/45 | | $ | 285 | | | | 258 | | |
| | | | 788 | | |
Netherlands (0.2%) | |
Netherlands Government Bond, | |
0.25%, 7/15/25 (c) | | EUR | 800 | | | | 850 | | |
New Zealand (0.5%) | |
New Zealand Government Bond, | |
5.50%, 4/15/23 | | NZD | 2,800 | | | | 2,095 | | |
Poland (0.2%) | |
Poland Government Bond, | |
4.00%, 10/25/23 | | PLN | 3,300 | | | | 947 | | |
South Africa (0.4%) | |
South Africa Government Bond, | |
7.75%, 2/28/23 | | ZAR | 4,500 | | | | 315 | | |
8.00%, 1/31/30 | | | 20,200 | | | | 1,359 | | |
| | | | 1,674 | | |
Spain (0.9%) | |
Spain Government Bond, | |
4.20%, 1/31/37 (c) | | EUR | 1,400 | | | | 1,914 | | |
Spain Government Inflation Linked Bond, | |
1.00%, 11/30/30 (c) | | | 777 | | | | 833 | | |
1.80%, 11/30/24 (c) | | | 550 | | | | 660 | | |
| | | | 3,407 | | |
Supernational (0.4%) | |
European Investment Bank, | |
2.15%, 1/18/27 | | JPY | 157,000 | | | | 1,573 | | |
United Kingdom (1.9%) | |
United Kingdom Gilt, | |
2.75%, 9/7/24 | | GBP | 2,100 | | | | 3,462 | | |
4.25%, 6/7/32 - 9/7/39 | | | 2,130 | | | | 4,217 | | |
| | | | 7,679 | | |
| | | | 47,680 | | |
U.S. Treasury Securities (3.9%) | |
United States (3.9%) | |
U.S. Treasury Bond, | |
3.50%, 2/15/39 | | $ | 4,200 | | | | 4,739 | | |
U.S. Treasury Inflation Indexed Bond, | |
0.25%, 1/15/25 | | | 4,736 | | | | 4,544 | | |
U.S. Treasury Notes, | |
0.63%, 9/30/17 | | | 3,800 | | | | 3,799 | | |
1.13%, 3/31/20 | | | 2,500 | | | | 2,480 | | |
| | | | 15,562 | | |
Total Fixed Income Securities (Cost $117,947) | | | 116,127 | | |
The accompanying notes are an integral part of the financial statements.
11
Morgan Stanley Institutional Fund Trust
Annual Report — September 30, 2015
Portfolio of Investments (cont'd)
Global Strategist Portfolio
| | | Shares | | Value
(000) | |
Common Stocks (60.8%) | |
Australia (1.6%) | |
AGL Energy Ltd. | | | 4,451 | | | $ | 50 | | |
Alumina Ltd. | | | 30,244 | | | | 24 | | |
Amcor Ltd. | | | 11,036 | | | | 102 | | |
AMP Ltd. | | | 31,080 | | | | 122 | | |
Arrium Ltd. (f) | | | 14,100 | | | | 1 | | |
Asciano Ltd. | | | 7,805 | | | | 46 | | |
ASX Ltd. | | | 1,539 | | | | 41 | | |
Australia & New Zealand Banking Group Ltd. | | | 29,480 | | | | 565 | | |
BHP Billiton Ltd. | | | 28,547 | | | | 450 | | |
BlueScope Steel Ltd. | | | 3,657 | | | | 9 | | |
Brambles Ltd. | | | 13,059 | | | | 90 | | |
CIMIC Group Ltd. | | | 1,366 | | | | 23 | | |
Coca-Cola Amatil Ltd. | | | 4,624 | | | | 29 | | |
Cochlear Ltd. | | | 499 | | | | 29 | | |
Commonwealth Bank of Australia | | | 12,195 | | | | 627 | | |
Computershare Ltd. | | | 4,195 | | | | 31 | | |
Crown Resorts Ltd. | | | 5,745 | | | | 40 | | |
CSL Ltd. | | | 4,783 | | | | 301 | | |
Dexus Property Group REIT | | | 7,020 | | | | 35 | | |
DuluxGroup Ltd. | | | 5,515 | | | | 21 | | |
Echo Entertainment Group Ltd. | | | 7,295 | | | | 25 | | |
Evolution Mining Ltd. | | | 29,744 | | | | 27 | | |
Fairfax Media Ltd. | | | 32,187 | | | | 20 | | |
Fortescue Metals Group Ltd. | | | 10,837 | | | | 14 | | |
Goodman Group REIT | | | 11,245 | | | | 46 | | |
GPT Group REIT | | | 17,813 | | | | 57 | | |
Incitec Pivot Ltd. | | | 14,433 | | | | 40 | | |
Insurance Australia Group Ltd. | | | 19,798 | | | | 68 | | |
Lend Lease Group REIT | | | 5,862 | | | | 52 | | |
Macquarie Group Ltd. | | | 2,760 | | | | 150 | | |
Mirvac Group REIT | | | 25,584 | | | | 31 | | |
National Australia Bank Ltd. | | | 24,937 | | | | 529 | | |
Newcrest Mining Ltd. (f) | | | 17,910 | | | | 162 | | |
Northern Star Resources Ltd. | | | 18,567 | | | | 35 | | |
OceanaGold Corp. | | | 2,584 | | | | 4 | | |
Orica Ltd. | | | 3,553 | | | | 38 | | |
Origin Energy Ltd. | | | 9,394 | | | | 31 | | |
Orora Ltd. | | | 11,036 | | | | 18 | | |
QBE Insurance Group Ltd. | | | 13,752 | | | | 125 | | |
Recall Holdings Ltd. | | | 2,611 | | | | 13 | | |
Rio Tinto Ltd. | | | 3,744 | | | | 129 | | |
Santos Ltd. | | | 9,011 | | | | 25 | | |
Scentre Group REIT | | | 41,036 | | | | 113 | | |
Shopping Centres Australasia Property Group REIT | | | 2,395 | | | | 3 | | |
Sonic Healthcare Ltd. | | | 3,160 | | | | 41 | | |
South32 Ltd. (f) | | | 20,867 | | | | 20 | | |
South32 Ltd. (f) | | | 28,547 | | | | 28 | | |
Stockland REIT | | | 25,532 | | | | 69 | | |
Suncorp Group Ltd. | | | 11,119 | | | | 96 | | |
Sydney Airport | | | 2,861 | | | | 12 | | |
Tabcorp Holdings Ltd. | | | 7,097 | | | | 23 | | |
| | | Shares | | Value
(000) | |
Telstra Corp., Ltd. | | | 41,748 | | | $ | 165 | | |
Transurban Group | | | 12,301 | | | | 86 | | |
Treasury Wine Estates Ltd. | | | 7,395 | | | | 34 | | |
Wesfarmers Ltd. | | | 10,023 | | | | 277 | | |
Westfield Corp. REIT | | | 18,583 | | | | 130 | | |
Westpac Banking Corp. | | | 24,560 | | | | 516 | | |
Woodside Petroleum Ltd. | | | 5,210 | | | | 107 | | |
Woolworths Ltd. | | | 10,835 | | | | 189 | | |
WorleyParsons Ltd. | | | 1,584 | | | | 7 | | |
| | | | 6,191 | | |
Austria (0.1%) | |
BUWOG AG (f) | | | 183 | | | | 4 | | |
Erste Group Bank AG (f) | | | 12,202 | | | | 355 | | |
Immofinanz AG (f) | | | 3,664 | | | | 8 | | |
Raiffeisen Bank International AG (f) | | | 61 | | | | 1 | | |
Voestalpine AG | | | 1,329 | | | | 46 | | |
| | | | 414 | | |
Belgium (0.6%) | |
Ageas | | | 3,005 | | | | 123 | | |
Anheuser-Busch InBev N.V. | | | 6,748 | | | | 717 | | |
Colruyt SA | | | 905 | | | | 44 | | |
Delhaize Group SA | | | 3,250 | | | | 288 | | |
Groupe Bruxelles Lambert SA | | | 1,457 | | | | 110 | | |
KBC Groep N.V. | | | 16,159 | | | | 1,019 | | |
Umicore SA | | | 1,567 | | | | 60 | | |
Viohalco SA (f) | | | 653 | | | | 2 | | |
| | | | 2,363 | | |
Canada (2.1%) | |
Agnico-Eagle Mines Ltd. | | | 3,680 | | | | 93 | | |
Agnico-Eagle Mines Ltd. | | | 1,600 | | | | 41 | | |
Agrium, Inc. | | | 1,500 | | | | 134 | | |
Bank of Montreal | | | 5,100 | | | | 278 | | |
Bank of Nova Scotia | | | 8,800 | | | | 388 | | |
Barrick Gold Corp. | | | 16,970 | | | | 108 | | |
Barrick Gold Corp. | | | 9,400 | | | | 60 | | |
BCE, Inc. | | | 5,300 | | | | 217 | | |
Blackberry Ltd. (f) | | | 4,200 | | | | 26 | | |
Bombardier, Inc. | | | 12,800 | | | | 16 | | |
Brookfield Asset Management, Inc., Class A | | | 8,250 | | | | 260 | | |
Cameco Corp. | | | 4,100 | | | | 50 | | |
Canadian Imperial Bank of Commerce | | | 3,700 | | | | 266 | | |
Canadian National Railway Co. | | | 8,600 | | | | 488 | | |
Canadian Natural Resources Ltd. | | | 10,300 | | | | 201 | | |
Canadian Oil Sands Ltd. | | | 2,700 | | | | 13 | | |
Canadian Pacific Railway Ltd. | | | 1,600 | | | | 230 | | |
Cenovus Energy, Inc. | | | 7,100 | | | | 108 | | |
Centerra Gold, Inc. | | | 7,250 | | | | 41 | | |
Crescent Point Energy Corp. | | | 2,100 | | | | 24 | | |
Detour Gold Corp. (f) | | | 5,390 | | | | 57 | | |
Eldorado Gold Corp. | | | 17,120 | | | | 55 | | |
Eldorado Gold Corp. | | | 5,400 | | | | 17 | | |
Enbridge, Inc. | | | 8,200 | | | | 304 | | |
The accompanying notes are an integral part of the financial statements.
12
Morgan Stanley Institutional Fund Trust
Annual Report — September 30, 2015
Portfolio of Investments (cont'd)
Global Strategist Portfolio
| | | Shares | | Value
(000) | |
Canada (cont'd) | |
Encana Corp. | | | 7,600 | | | $ | 49 | | |
Fairfax Financial Holdings Ltd. | | | 300 | | | | 137 | | |
First Majestic Silver Corp. (f) | | | 300 | | | | 1 | | |
First Quantum Minerals Ltd. | | | 5,100 | | | | 19 | | |
Fortis, Inc. | | | 1,300 | | | | 37 | | |
Franco-Nevada Corp. | | | 2,920 | | | | 128 | | |
Goldcorp, Inc. | | | 9,110 | | | | 114 | | |
Goldcorp, Inc. | | | 7,100 | | | | 89 | | |
Great-West Lifeco, Inc. | | | 4,100 | | | | 98 | | |
Husky Energy, Inc. | | | 2,600 | | | | 40 | | |
IGM Financial, Inc. | | | 1,800 | | | | 46 | | |
Imperial Oil Ltd. | | | 2,600 | | | | 82 | | |
Intact Financial Corp. | | | 1,500 | | | | 105 | | |
Kinross Gold Corp. (f) | | | 44,250 | | | | 76 | | |
Kinross Gold Corp. (f) | | | 1,200 | | | | 2 | | |
Lightstream Resources Ltd. | | | 1,136 | | | | — | @ | |
Loblaw Cos., Ltd. | | | 673 | | | | 35 | | |
Lululemon Athletica, Inc. (f) | | | 1,200 | | | | 61 | | |
Magna International, Inc. | | | 5,200 | | | | 249 | | |
Manulife Financial Corp. | | | 18,100 | | | | 280 | | |
National Bank of Canada | | | 3,000 | | | | 96 | | |
New Gold, Inc. (f) | | | 15,260 | | | | 35 | | |
Osisko Gold Royalties Ltd. | | | 2,770 | | | | 29 | | |
Pan American Silver Corp. | | | 4,630 | | | | 29 | | |
Pembina Pipeline Corp. | | | 400 | | | | 10 | | |
Penn West Petroleum Ltd. | | | 3,700 | | | | 2 | | |
Potash Corp. of Saskatchewan, Inc. | | | 8,200 | | | | 169 | | |
Power Corp. of Canada | | | 4,100 | | | | 85 | | |
Power Financial Corp. | | | 3,400 | | | | 78 | | |
Rogers Communications, Inc., Class B | | | 3,800 | | | | 131 | | |
Royal Bank of Canada | | | 12,300 | | | | 680 | | |
SEMAFO, Inc. (f) | | | 9,110 | | | | 20 | | |
Shaw Communications, Inc., Class B | | | 3,700 | | | | 72 | | |
Silver Wheaton Corp. | | | 7,550 | | | | 91 | | |
Silver Wheaton Corp. | | | 3,500 | | | | 42 | | |
SNC-Lavalin Group, Inc. | | | 1,800 | | | | 51 | | |
Sun Life Financial, Inc. | | | 5,900 | | | | 190 | | |
Suncor Energy, Inc. | | | 14,100 | | | | 377 | | |
Teck Resources Ltd., Class B | | | 4,700 | | | | 22 | | |
Thomson Reuters Corp. | | | 3,700 | | | | 149 | | |
Toronto-Dominion Bank (The) | | | 16,200 | | | | 638 | | |
Touchstone Exploration, Inc. (f) | | | 650 | | | | — | @ | |
TransAlta Corp. | | | 2,300 | | | | 11 | | |
TransCanada Corp. | | | 6,300 | | | | 199 | | |
Valeant Pharmaceuticals International, Inc. (f) | | | 300 | | | | 54 | | |
Yamana Gold, Inc. | | | 22,810 | | | | 39 | | |
Yamana Gold, Inc. | | | 7,200 | | | | 12 | | |
| | | | 8,434 | | |
Chile (0.0%) | |
Antofagasta PLC | | | 2,716 | | | | 21 | | |
| | | Shares | | Value
(000) | |
China (0.0%) | |
Hanergy Thin Film Power Group Ltd. (f)(g)(h)(i) | | | 42,000 | | | $ | 6 | | |
Zhaojin Mining Industry Co., Ltd. (g) | | | 25,500 | | | | 14 | | |
Zijin Mining Group Co., Ltd. H Shares (g) | | | 170,000 | | | | 45 | | |
| | | | 65 | | |
Denmark (0.5%) | |
AP Moeller - Maersk A/S Series A | | | 30 | | | | 45 | | |
AP Moeller - Maersk A/S Series B | | | 55 | | | | 85 | | |
Carlsberg A/S Series B | | | 98 | | | | 8 | | |
Coloplast A/S | | | 120 | | | | 8 | | |
Danske Bank A/S | | | 6,410 | | | | 194 | | |
DSV A/S | | | 3,452 | | | | 129 | | |
Novo Nordisk A/S Series B | | | 19,475 | | | | 1,048 | | |
Novozymes A/S Series B | | | 2,771 | | | | 121 | | |
TDC A/S | | | 537 | | | | 3 | | |
Vestas Wind Systems A/S | | | 3,486 | | | | 182 | | |
| | | | 1,823 | | |
Finland (0.2%) | |
Fortum Oyj | | | 6,094 | | | | 90 | | |
Kone Oyj, Class B | | | 5,074 | | | | 193 | | |
Nokia Oyj | | | 34,796 | | | | 238 | | |
Nokian Renkaat Oyj | | | 1,401 | | | | 46 | | |
Sampo Oyj, Class A | | | 3,582 | | | | 174 | | |
UPM-Kymmene Oyj | | | 11,663 | | | | 175 | | |
| | | | 916 | | |
France (4.0%) | |
Accor SA | | | 17,819 | | | | 834 | | |
Aeroports de Paris (ADP) | | | 480 | | | | 54 | | |
Air Liquide SA | | | 3,070 | | | | 364 | | |
Alcatel-Lucent (f) | | | 39,117 | | | | 144 | | |
Alstom SA (f) | | | 4,118 | | | | 127 | | |
Atos SE | | | 6,295 | | | | 483 | | |
AXA SA | | | 16,884 | | | | 410 | | |
BNP Paribas SA | | | 10,533 | | | | 620 | | |
Bouygues SA | | | 22,227 | | | | 791 | | |
Bureau Veritas SA | | | 2,324 | | | | 49 | | |
Cap Gemini SA | | | 13,734 | | | | 1,224 | | |
Carrefour SA | | | 5,540 | | | | 164 | | |
CGG SA (f) | | | 2,024 | | | | 7 | | |
Christian Dior SE | | | 710 | | | | 133 | | |
Cie de Saint-Gobain | | | 24,243 | | | | 1,053 | | |
Cie Generale des Etablissements Michelin | | | 1,855 | | | | 169 | | |
Credit Agricole SA | | | 86,252 | | | | 990 | | |
Danone SA | | | 6,671 | | | | 422 | | |
Edenred | | | 1,823 | | | | 30 | | |
Electricite de France SA | | | 3,256 | | | | 58 | | |
Engie | | | 12,237 | | | | 198 | | |
Essilor International SA | | | 1,528 | | | | 187 | | |
Eutelsat Communications SA | | | 799 | | | | 25 | | |
Groupe Eurotunnel SE | | | 20,762 | | | | 283 | | |
Hermes International | | | 150 | | | | 55 | | |
ICADE REIT | | | 86 | | | | 6 | | |
The accompanying notes are an integral part of the financial statements.
13
Morgan Stanley Institutional Fund Trust
Annual Report — September 30, 2015
Portfolio of Investments (cont'd)
Global Strategist Portfolio
| | | Shares | | Value
(000) | |
France (cont'd) | |
JCDecaux SA | | | 651 | | | $ | 24 | | |
Kering | | | 1,357 | | | | 222 | | |
L'Oreal SA | | | 2,407 | | | | 419 | | |
LVMH Moet Hennessy Louis Vuitton SE | | | 2,297 | | | | 392 | | |
Natixis SA | | | 495 | | | | 3 | | |
Orange SA | | | 19,419 | | | | 294 | | |
Pernod Ricard SA | | | 1,855 | | | | 187 | | |
Peugeot SA (f) | | | 1,221 | | | | 18 | | |
Publicis Groupe SA | | | 1,047 | | | | 72 | | |
Renault SA | | | 1,898 | | | | 136 | | |
Rexel SA | | | 15,516 | | | | 191 | | |
Sanofi | | | 11,589 | | | | 1,104 | | |
SES SA | | | 2,416 | | | | 76 | | |
Societe Generale SA | | | 7,294 | | | | 326 | | |
Societe Television Francaise 1 | | | 1,176 | | | | 17 | | |
Sodexo SA | | | 1,223 | | | | 101 | | |
Suez Environnement Co. | | | 4,193 | | | | 75 | | |
Technip SA | | | 933 | | | | 44 | | |
Thales SA | | | 1,262 | | | | 88 | | |
Total SA | | | 20,957 | | | | 945 | | |
Unibail-Rodamco SE REIT | | | 1,616 | | | | 419 | | |
Vallourec SA | | | 2,417 | | | | 21 | | |
Veolia Environnement SA | | | 5,613 | | | | 129 | | |
Vinci SA | | | 20,273 | | | | 1,289 | | |
Vivendi SA | | | 16,236 | | | | 384 | | |
| | | | 15,856 | | |
Germany (2.5%) | |
Adidas AG | | | 1,738 | | | | 140 | | |
Allianz SE (Registered) | | | 4,059 | | | | 636 | | |
Axel Springer SE | | | 168 | | | | 9 | | |
BASF SE | | | 10,277 | | | | 784 | | |
Bayer AG (Registered) | | | 6,754 | | | | 863 | | |
Bayerische Motoren Werke AG | | | 2,799 | | | | 248 | | |
Beiersdorf AG | | | 851 | | | | 75 | | |
Commerzbank AG (f) | | | 41,347 | | | | 435 | | |
Continental AG | | | 533 | | | | 113 | | |
Daimler AG (Registered) | | | 6,189 | | | | 449 | | |
Deutsche Bank AG (Registered) | | | 11,761 | | | | 316 | | |
Deutsche Boerse AG | | | 12,147 | | | | 1,046 | | |
Deutsche Lufthansa AG (Registered) (f) | | | 3,253 | | | | 45 | | |
Deutsche Post AG (Registered) | | | 5,009 | | | | 139 | | |
Deutsche Telekom AG (Registered) | | | 25,997 | | | | 462 | | |
E.ON SE | | | 15,975 | | | | 137 | | |
Esprit Holdings Ltd. (g) | | | 12,583 | | | | 9 | | |
Fraport AG Frankfurt Airport Services Worldwide | | | 268 | | | | 17 | | |
Fresenius Medical Care AG & Co., KGaA | | | 1,557 | | | | 121 | | |
Fresenius SE & Co., KGaA | | | 3,141 | | | | 211 | | |
Henkel AG & Co., KGaA | | | 1,420 | | | | 125 | | |
Henkel AG & Co., KGaA (Preference) | | | 2,044 | | | | 210 | | |
Infineon Technologies AG | | | 10,693 | | | | 120 | | |
K&S AG (Registered) | | | 1,306 | | | | 44 | | |
| | | Shares | | Value
(000) | |
Lanxess AG | | | 827 | | | $ | 39 | | |
Linde AG | | | 1,359 | | | | 220 | | |
Merck KGaA | | | 1,048 | | | | 93 | | |
Metro AG | | | 1,062 | | | | 29 | | |
Muenchener Rueckversicherungs AG (Registered) | | | 1,719 | | | | 320 | | |
Osram Licht AG | | | 765 | | | | 40 | | |
Porsche Automobil Holding SE (Preference) | | | 779 | | | | 33 | | |
ProSiebenSat.1 Media SE (Registered) | | | 11,079 | | | | 543 | | |
QIAGEN N.V. (f) | | | 2,514 | | | | 65 | | |
RWE AG | | | 3,402 | | | | 39 | | |
SAP SE | | | 9,219 | | | | 596 | | |
Siemens AG (Registered) | | | 7,650 | | | | 683 | | |
Suedzucker AG | | | 410 | | | | 7 | | |
ThyssenKrupp AG | | | 4,900 | | | | 86 | | |
TUI AG | | | 6,275 | | | | 116 | | |
TUI AG | | | 1,503 | | | | 27 | | |
Volkswagen AG | | | 290 | | | | 34 | | |
Volkswagen AG (Preference) | | | 1,450 | | | | 159 | | |
| | | | 9,883 | | |
Greece (0.1%) | |
Aegean Airlines SA | | | 711 | | | | 5 | | |
Alpha Bank AE (f) | | | 45,588 | | | | 5 | | |
Athens Water Supply & Sewage Co., SA (The) | | | 485 | | | | 3 | | |
Attica Bank SA (f) | | | 30,305 | | | | 1 | | |
Ellaktor SA (f) | | | 2,264 | | | | 4 | | |
Eurobank Ergasias SA (f) | | | 110,993 | | | | 3 | | |
FF Group (f) | | | 670 | | | | 14 | | |
Fourlis Holdings SA (f) | | | 952 | | | | 3 | | |
Frigoglass SAIC (f) | | | 326 | | | | 1 | | |
GEK Terna Holding Real Estate Construction SA (f) | | | 1,941 | | | | 4 | | |
Grivalia Properties REIC AE REIT | | | 647 | | | | 6 | | |
Hellenic Exchanges - Athens Stock Exchange SA | | | 2,748 | | | | 15 | | |
Hellenic Petroleum SA (f) | | | 1,449 | | | | 9 | | |
Hellenic Telecommunications Organization SA | | | 3,346 | | | | 29 | | |
Intralot SA-Integrated Lottery Systems & Services (f) | | | 832 | | | | 2 | | |
JUMBO SA | | | 2,761 | | | | 24 | | |
Lamda Development SA (f) | | | 225 | | | | 1 | | |
Marfin Investment Group Holdings SA (f) | | | 13,085 | | | | 1 | | |
Metka SA | | | 449 | | | | 4 | | |
Motor Oil Hellas Corinth Refineries SA (f) | | | 945 | | | | 11 | | |
Mytilineos Holdings SA (f) | | | 2,242 | | | | 12 | | |
National Bank of Greece SA (f) | | | 21,851 | | | | 9 | | |
OPAP SA | | | 2,890 | | | | 26 | | |
Piraeus Bank SA (f) | | | 25,114 | | | | 2 | | |
Piraeus Port Authority SA | | | 80 | | | | 1 | | |
Public Power Corp. SA | | | 4,763 | | | | 25 | | |
Sarantis SA | | | 115 | | | | 1 | | |
Terna Energy SA (f) | | | 600 | | | | 2 | | |
Thrace Plastics Co., SA | | | 394 | | | | 1 | | |
Titan Cement Co., SA | | | 464 | | | | 10 | | |
| | | | 234 | | |
The accompanying notes are an integral part of the financial statements.
14
Morgan Stanley Institutional Fund Trust
Annual Report — September 30, 2015
Portfolio of Investments (cont'd)
Global Strategist Portfolio
| | | Shares | | Value
(000) | |
Hong Kong (0.7%) | |
AIA Group Ltd. | | | 67,200 | | | $ | 350 | | |
Bank of East Asia Ltd. (The) | | | 18,693 | | | | 63 | | |
BOC Hong Kong Holdings Ltd. | | | 38,500 | | | | 114 | | |
Cheung Kong Property Holdings Ltd. | | | 28,364 | | | | 208 | | |
CK Hutchison Holdings Ltd. | | | 28,364 | | | | 369 | | |
CLP Holdings Ltd. | | | 19,000 | | | | 162 | | |
G-Resources Group Ltd. | | | 402,000 | | | | 10 | | |
Global Brands Group Holding Ltd. (f) | | | 40,000 | | | | 8 | | |
Hang Lung Group Ltd. | | | 8,000 | | | | 27 | | |
Hang Lung Properties Ltd. | | | 22,000 | | | | 49 | | |
Hang Seng Bank Ltd. | | | 11,900 | | | | 215 | | |
Henderson Land Development Co., Ltd. | | | 16,146 | | | | 97 | | |
Hong Kong & China Gas Co., Ltd. | | | 57,977 | | | | 109 | | |
Hong Kong Exchanges and Clearing Ltd. | | | 11,101 | | | | 255 | | |
Kerry Logistics Network Ltd. | | | 3,500 | | | | 5 | | |
Kerry Properties Ltd. | | | 7,000 | | | | 19 | | |
Link REIT (The) | | | 21,033 | | | | 116 | | |
MTR Corp., Ltd. | | | 16,053 | | | | 70 | | |
New World Development Co., Ltd. | | | 41,531 | | | | 40 | | |
Power Assets Holdings Ltd. | | | 14,500 | | | | 138 | | |
Sands China Ltd. | | | 28,400 | | | | 86 | | |
Sino Land Co., Ltd. | | | 23,340 | | | | 36 | | |
Sun Hung Kai Properties Ltd. | | | 15,504 | | | | 202 | | |
Swire Pacific Ltd., Class A | | | 6,500 | | | | 73 | | |
Swire Properties Ltd. | | | 4,550 | | | | 13 | | |
Wharf Holdings Ltd. (The) | | | 13,200 | | | | 75 | | |
Wheelock & Co., Ltd. | | | 10,000 | | | | 44 | | |
| | | | 2,953 | | |
Ireland (0.3%) | |
Bank of Ireland (f) | | | 1,047,847 | | | | 408 | | |
CRH PLC | | | 23,550 | | | | 622 | | |
| | | | 1,030 | | |
Israel (0.0%) | |
Bank Hapoalim BM | | | 553 | | | | 3 | | |
Bank Leumi Le-Israel BM (f) | | | 729 | | | | 2 | | |
Mizrahi Tefahot Bank Ltd. | | | 72 | | | | 1 | | |
| | | | 6 | | |
Italy (1.8%) | |
Assicurazioni Generali SpA | | | 11,606 | | | | 213 | | |
Atlantia SpA | | | 38,712 | | | | 1,084 | | |
Banca Monte dei Paschi di Siena SpA (f) | | | 9,295 | | | | 17 | | |
Banco Popolare SC (f) | | | 12,878 | | | | 190 | | |
Enel Green Power SpA | | | 11,984 | | | | 23 | | |
Enel SpA | | | 57,892 | | | | 259 | | |
Eni SpA | | | 22,322 | | | | 351 | | |
Finmeccanica SpA (f) | | | 1,205 | | | | 15 | | |
Intesa Sanpaolo SpA | | | 605,535 | | | | 2,138 | | |
Luxottica Group SpA | | | 1,123 | | | | 78 | | |
Mediobanca SpA | | | 83,531 | | | | 822 | | |
Prysmian SpA | | | 1,210 | | | | 25 | | |
Saipem SpA (f) | | | 2,154 | | | | 17 | | |
| | | Shares | | Value
(000) | |
Snam SpA | | | 20,778 | | | $ | 107 | | |
Telecom Italia SpA (f) | | | 90,977 | | | | 112 | | |
Telecom Italia SpA | | | 64,353 | | | | 66 | | |
Terna Rete Elettrica Nazionale SpA | | | 9,469 | | | | 46 | | |
UniCredit SpA | | | 227,059 | | | | 1,415 | | |
Unione di Banche Italiane SCPA | | | 34,973 | | | | 248 | | |
| | | | 7,226 | | |
Japan (5.5%) | |
Advantest Corp. | | | 1,600 | | | | 12 | | |
Aeon Co., Ltd. | | | 8,400 | | | | 131 | | |
Aisin Seiki Co., Ltd. | | | 2,800 | | | | 94 | | |
Ajinomoto Co., Inc. | | | 11,000 | | | | 232 | | |
Aozora Bank Ltd. | | | 1,000 | | | | 3 | | |
Asahi Glass Co., Ltd. | | | 12,000 | | | | 70 | | |
Asahi Group Holdings Ltd. | | | 3,700 | | | | 120 | | |
Asahi Kasei Corp. | | | 19,000 | | | | 134 | | |
Astellas Pharma, Inc. | | | 19,000 | | | | 247 | | |
Bank of Yokohama Ltd. (The) | | | 16,000 | | | | 97 | | |
Bridgestone Corp. | | | 6,600 | | | | 229 | | |
Canon, Inc. | | | 10,400 | | | | 301 | | |
Central Japan Railway Co. | | | 1,700 | | | | 275 | | |
Chiba Bank Ltd. (The) | | | 11,000 | | | | 78 | | |
Chubu Electric Power Co., Inc. | | | 5,800 | | | | 86 | | |
Chugai Pharmaceutical Co., Ltd. | | | 3,400 | | | | 105 | | |
Chugoku Bank Ltd. (The) | | | 100 | | | | 1 | | |
Chugoku Electric Power Co., Inc. (The) | | | 2,600 | | | | 36 | | |
Dai Nippon Printing Co., Ltd. | | | 8,000 | | | | 78 | | |
Dai-ichi Life Insurance Co., Ltd. (The) | | | 1,000 | | | | 16 | | |
Daiichi Sankyo Co., Ltd. | | | 6,800 | | | | 119 | | |
Daikin Industries Ltd. | | | 2,800 | | | | 157 | | |
Daito Trust Construction Co., Ltd. | | | 1,000 | | | | 102 | | |
Daiwa House Industry Co., Ltd. | | | 8,000 | | | | 199 | | |
Daiwa Securities Group, Inc. | | | 21,000 | | | | 136 | | |
Denso Corp. | | | 6,100 | | | | 259 | | |
Dentsu, Inc. | | | 2,200 | | | | 113 | | |
East Japan Railway Co. | | | 3,600 | | | | 305 | | |
Eisai Co., Ltd. | | | 2,800 | | | | 166 | | |
Electric Power Development Co., Ltd. | | | 1,900 | | | | 58 | | |
FANUC Corp. | | | 1,800 | | | | 278 | | |
Fast Retailing Co., Ltd. | | | 500 | | | | 203 | | |
FUJIFILM Holdings Corp. | | | 5,700 | | | | 214 | | |
Fujitsu Ltd. | | | 19,000 | | | | 83 | | |
Fukuoka Financial Group, Inc. | | | 1,000 | | | | 5 | | |
Hankyu Hanshin Holdings, Inc. | | | 24,000 | | | | 147 | | |
Hiroshima Bank Ltd. (The) | | | 1,000 | | | | 6 | | |
Hitachi Ltd. | | | 47,000 | | | | 238 | | |
Hokkaido Electric Power Co., Inc. (f) | | | 2,900 | | | | 28 | | |
Hokuhoku Financial Group, Inc. | | | 1,000 | | | | 2 | | |
Hokuriku Electric Power Co. | | | 2,700 | | | | 36 | | |
Honda Motor Co., Ltd. | | | 1,100 | | | | 33 | | |
Honda Motor Co., Ltd. ADR | | | 13,695 | | | | 409 | | |
Hoya Corp. | | | 4,200 | | | | 138 | | |
The accompanying notes are an integral part of the financial statements.
15
Morgan Stanley Institutional Fund Trust
Annual Report — September 30, 2015
Portfolio of Investments (cont'd)
Global Strategist Portfolio
| | | Shares | | Value
(000) | |
Japan (cont'd) | |
Ibiden Co., Ltd. | | | 1,400 | | | $ | 18 | | |
Inpex Corp. | | | 4,200 | | | | 38 | | |
Isetan Mitsukoshi Holdings Ltd. | | | 3,700 | | | | 56 | | |
Isuzu Motors Ltd. | | | 500 | | | | 5 | | |
ITOCHU Corp. | | | 15,500 | | | | 164 | | |
Iyo Bank Ltd. (The) | | | 100 | | | | 1 | | |
Japan Real Estate Investment Corp. REIT | | | 12 | | | | 55 | | |
Japan Steel Works Ltd. (The) | | | 3,000 | | | | 10 | | |
Japan Tobacco, Inc. | | | 11,500 | | | | 358 | | |
JFE Holdings, Inc. | | | 4,600 | | | | 60 | | |
JGC Corp. | | | 2,000 | | | | 27 | | |
Joyo Bank Ltd. (The) | | | 1,000 | | | | 5 | | |
JSR Corp. | | | 2,100 | | | | 30 | | |
JX Holdings, Inc. | | | 2,800 | | | | 10 | | |
Kansai Electric Power Co., Inc. (The) (f) | | | 4,900 | | | | 55 | | |
Kao Corp. | | | 5,900 | | | | 268 | | |
Kawasaki Heavy Industries Ltd. | | | 26,000 | | | | 90 | | |
KDDI Corp. | | | 22,500 | | | | 504 | | |
Keikyu Corp. | | | 7,000 | | | | 56 | | |
Keio Corp. | | | 7,000 | | | | 50 | | |
Keyence Corp. | | | 500 | | | | 224 | | |
Kintetsu Group Holdings Co., Ltd. | | | 29,000 | | | | 104 | | |
Kirin Holdings Co., Ltd. | | | 10,000 | | | | 132 | | |
Kobe Steel Ltd. | | | 49,000 | | | | 53 | | |
Komatsu Ltd. | | | 9,800 | | | | 144 | | |
Konica Minolta, Inc. | | | 3,500 | | | | 37 | | |
Kubota Corp. | | | 13,000 | | | | 179 | | |
Kuraray Co., Ltd. | | | 3,500 | | | | 44 | | |
Kyocera Corp. | | | 3,200 | | | | 147 | | |
Kyushu Electric Power Co., Inc. (f) | | | 2,700 | | | | 29 | | |
LIXIL Group Corp. | | | 3,900 | | | | 79 | | |
Makita Corp. | | | 1,100 | | | | 59 | | |
Marubeni Corp. | | | 21,000 | | | | 103 | | |
Mazda Motor Corp. | | | 3,400 | | | | 54 | | |
Mitsubishi Chemical Holdings Corp. | | | 15,500 | | | | 81 | | |
Mitsubishi Corp. | | | 12,800 | | | | 210 | | |
Mitsubishi Electric Corp. | | | 19,000 | | | | 174 | | |
Mitsubishi Estate Co., Ltd. | | | 12,000 | | | | 246 | | |
Mitsubishi Heavy Industries Ltd. | | | 37,000 | | | | 166 | | |
Mitsubishi Motors Corp. | | | 6,400 | | | | 49 | | |
Mitsui & Co., Ltd. | | | 19,300 | | | | 217 | | |
Mitsui Fudosan Co., Ltd. | | | 9,000 | | | | 248 | | |
Mitsui OSK Lines Ltd. | | | 12,000 | | | | 29 | | |
Mizuho Financial Group, Inc. | | | 156,800 | | | | 295 | | |
MS&AD Insurance Group Holdings, Inc. | | | 4,000 | | | | 108 | | |
Murata Manufacturing Co., Ltd. | | | 2,200 | | | | 286 | | |
NGK Insulators Ltd. | | | 3,000 | | | | 58 | | |
Nidec Corp. | | | 2,200 | | | | 152 | | |
Nikon Corp. | | | 3,500 | | | | 42 | | |
Nintendo Co., Ltd. | | | 1,000 | | | | 169 | | |
Nippon Building Fund, Inc. REIT | | | 12 | | | | 58 | | |
Nippon Electric Glass Co., Ltd. | | | 4,000 | | | | 19 | | |
| | | Shares | | Value
(000) | |
Nippon Express Co., Ltd. | | | 15,000 | | | $ | 72 | | |
Nippon Steel Sumitomo Metal Corp. | | | 8,000 | | | | 146 | | |
Nippon Telegraph & Telephone Corp. | | | 11,200 | | | | 393 | | |
Nippon Yusen KK | | | 24,000 | | | | 56 | | |
Nissan Motor Co., Ltd. | | | 23,900 | | | | 220 | | |
Nitto Denko Corp. | | | 1,700 | | | | 102 | | |
Nomura Holdings, Inc. | | | 36,100 | | | | 209 | | |
NSK Ltd. | | | 7,000 | | | | 68 | | |
NTT Data Corp. | | | 2,100 | | | | 106 | | |
NTT DoCoMo, Inc. | | | 14,700 | | | | 246 | | |
Odakyu Electric Railway Co., Ltd. | | | 12,000 | | | | 108 | | |
Oji Holdings Corp. | | | 9,000 | | | | 39 | | |
Olympus Corp. | | | 2,400 | | | | 75 | | |
Omron Corp. | | | 1,900 | | | | 57 | | |
Ono Pharmaceutical Co., Ltd. | | | 1,000 | | | | 119 | | |
Oriental Land Co., Ltd. | | | 400 | | | | 22 | | |
ORIX Corp. | | | 10,500 | | | | 136 | | |
Osaka Gas Co., Ltd. | | | 29,000 | | | | 110 | | |
Otsuka Holdings Co., Ltd. | | | 400 | | | | 13 | | |
Panasonic Corp. | | | 18,700 | | | | 190 | | |
Rakuten, Inc. | | | 10,000 | | | | 128 | | |
Resona Holdings, Inc. | | | 8,500 | | | | 43 | | |
Ricoh Co., Ltd. | | | 8,000 | | | | 81 | | |
Rohm Co., Ltd. | | | 800 | | | | 36 | | |
Secom Co., Ltd. | | | 2,100 | | | | 127 | | |
Sekisui House Ltd. | | | 8,000 | | | | 126 | | |
Seven & I Holdings Co., Ltd. | | | 8,400 | | | | 385 | | |
Seven Bank Ltd. | | | 300 | | | | 1 | | |
Sharp Corp. (f) | | | 10,000 | | | | 12 | | |
Shikoku Electric Power Co., Inc. | | | 3,800 | | | | 62 | | |
Shin-Etsu Chemical Co., Ltd. | | | 3,300 | | | | 170 | | |
Shinsei Bank Ltd. | | | 1,000 | | | | 2 | | |
Shionogi & Co., Ltd. | | | 4,400 | | | | 158 | | |
Shiseido Co., Ltd. | | | 4,500 | | | | 99 | | |
Shizuoka Bank Ltd. (The) | | | 11,000 | | | | 110 | | |
SMC Corp. | | | 600 | | | | 132 | | |
SoftBank Group Corp. | | | 7,400 | | | | 340 | | |
Sompo Japan Nipponkoa Holdings, Inc. | | | 400 | | | | 12 | | |
Sony Corp. | | | 900 | | | | 22 | | |
Sony Corp. ADR | | | 9,035 | | | | 221 | | |
Sumitomo Chemical Co., Ltd. | | | 15,000 | | | | 76 | | |
Sumitomo Corp. | | | 11,700 | | | | 113 | | |
Sumitomo Electric Industries Ltd. | | | 16,600 | | | | 213 | | |
Sumitomo Metal Mining Co., Ltd. | | | 6,000 | | | | 68 | | |
Sumitomo Mitsui Financial Group, Inc. | | | 13,700 | | | | 522 | | |
Sumitomo Mitsui Trust Holdings, Inc. | | | 32,000 | | | | 118 | | |
Sumitomo Realty & Development Co., Ltd. | | | 6,000 | | | | 192 | | |
Suruga Bank Ltd. | | | 100 | | | | 2 | | |
Suzuki Motor Corp. | | | 4,200 | | | | 130 | | |
T&D Holdings, Inc. | | | 5,800 | | | | 69 | | |
Takeda Pharmaceutical Co., Ltd. | | | 7,400 | | | | 326 | | |
TDK Corp. | | | 1,000 | | | | 57 | | |
Terumo Corp. | | | 4,600 | | | | 130 | | |
The accompanying notes are an integral part of the financial statements.
16
Morgan Stanley Institutional Fund Trust
Annual Report — September 30, 2015
Portfolio of Investments (cont'd)
Global Strategist Portfolio
| | | Shares | | Value
(000) | |
Japan (cont'd) | |
Tobu Railway Co., Ltd. | | | 23,000 | | | $ | 99 | | |
Tohoku Electric Power Co., Inc. | | | 4,600 | | | | 63 | | |
Tokio Marine Holdings, Inc. | | | 4,900 | | | | 183 | | |
Tokyo Electric Power Co., Inc. (f) | | | 9,500 | | | | 64 | | |
Tokyo Electron Ltd. | | | 1,500 | | | | 71 | | |
Tokyo Gas Co., Ltd. | | | 26,000 | | | | 126 | | |
Tokyu Corp. | | | 12,000 | | | | 88 | | |
Toppan Printing Co., Ltd. | | | 8,000 | | | | 65 | | |
Toray Industries, Inc. | | | 19,000 | | | | 165 | | |
Toshiba Corp. (f) | | | 42,000 | | | | 106 | | |
Toyota Industries Corp. | | | 2,500 | | | | 119 | | |
Toyota Motor Corp. | | | 27,300 | | | | 1,606 | | |
Trend Micro, Inc. | | | 1,200 | | | | 43 | | |
Unicharm Corp. | | | 5,400 | | | | 96 | | |
West Japan Railway Co. | | | 2,300 | | | | 144 | | |
Yahoo! Japan Corp. | | | 19,100 | | | | 73 | | |
Yamada Denki Co., Ltd. | | | 9,500 | | | | 38 | | |
Yamato Holdings Co., Ltd. | | | 6,600 | | | | 127 | | |
| | | | 21,680 | | |
Kazakhstan (0.0%) | |
KAZ Minerals PLC (f) | | | 2,888 | | | | 4 | | |
Mexico (0.0%) | |
Primero Mining Corp. (f) | | | 4,800 | | | | 11 | | |
Netherlands (1.0%) | |
Akzo Nobel N.V. | | | 4,136 | | | | 269 | | |
ArcelorMittal | | | 12,177 | | | | 64 | | |
ASML Holding N.V. | | | 2,380 | | | | 209 | | |
CNH Industrial N.V. | | | 6,659 | | | | 43 | | |
Fiat Chrysler Automobiles N.V. (f) | | | 9,996 | | | | 130 | | |
Fugro N.V. CVA (f) | | | 657 | | | | 12 | | |
Heineken N.V. | | | 3,516 | | | | 285 | | |
ING Groep N.V. CVA | | | 47,738 | | | | 678 | | |
Koninklijke Ahold N.V. | | | 10,633 | | | | 207 | | |
Koninklijke DSM N.V. | | | 3,186 | | | | 147 | | |
Koninklijke KPN N.V. | | | 6,177 | | | | 23 | | |
Koninklijke Philips N.V. | | | 11,422 | | | | 269 | | |
Koninklijke Vopak N.V. | | | 1,006 | | | | 40 | | |
PostNL N.V. (f) | | | 4,654 | | | | 17 | | |
Randstad Holding N.V. | | | 14,049 | | | | 838 | | |
TNT Express N.V. | | | 4,151 | | | | 32 | | |
Unilever N.V. CVA | | | 14,384 | | | | 579 | | |
| | | | 3,842 | | |
Nicaragua (0.0%) | |
B2Gold Corp. (f) | | | 27,000 | | | | 28 | | |
Norway (0.2%) | |
Akastor ASA (f) | | | 1,833 | | | | 2 | | |
Aker Solutions ASA | | | 1,833 | | | | 6 | | |
DNB ASA | | | 12,348 | | | | 161 | | |
Kvaerner ASA | | | 1,677 | | | | 1 | | |
Norsk Hydro ASA | | | 13,781 | | | | 46 | | |
Orkla ASA | | | 10,248 | | | | 76 | | |
REC Silicon ASA (f) | | | 6,482 | | | | 1 | | |
| | | Shares | | Value
(000) | |
Seadrill Ltd. | | | 328 | | | $ | 2 | | |
Statoil ASA | | | 13,168 | | | | 192 | | |
Subsea 7 SA (f) | | | 3,127 | | | | 24 | | |
Telenor ASA | | | 16,272 | | | | 304 | | |
Yara International ASA | | | 2,039 | | | | 82 | | |
| | | | 897 | | |
Peru (0.0%) | |
Cia de Minas Buenaventura SA ADR | | | 8,800 | | | | 52 | | |
Poland (0.0%) | |
Jeronimo Martins SGPS SA | | | 3,072 | | | | 42 | | |
Portugal (0.0%) | |
Banco Comercial Portugues SA (f) | | | 1,619,074 | | | | 79 | | |
Banco Espirito Santo SA (Registered) (f)(i) | | | 192,146 | | | | 1 | | |
Galp Energia SGPS SA | | | 2,866 | | | | 28 | | |
Pharol SGPS SA (Registered) (f) | | | 11,841 | | | | 4 | | |
| | | | 112 | | |
Singapore (0.0%) | |
DBS Group Holdings Ltd. | | | 900 | | | | 10 | | |
Oversea-Chinese Banking Corp., Ltd. | | | 1,600 | | | | 10 | | |
United Overseas Bank Ltd. | | | 700 | | | | 9 | | |
| | | | 29 | | |
South Africa (0.2%) | |
AngloGold Ashanti Ltd. ADR (f) | | | 11,900 | | | | 97 | | |
Gold Fields Ltd. ADR | | | 23,300 | | | | 62 | | |
Harmony Gold Mining Co., Ltd. ADR (f) | | | 12,500 | | | | 8 | | |
Mota-Engil Africa N.V. | | | 182 | | | | 1 | | |
SABMiller PLC | | | 10,797 | | | | 612 | | |
| | | | 780 | | |
Spain (2.5%) | |
Abertis Infraestructuras SA | | | 12,358 | | | | 196 | | |
ACS Actividades de Construccion y Servicios SA | | | 3,511 | | | | 101 | | |
Amadeus IT Holding SA, Class A | | | 5,400 | | | | 231 | | |
Banco Bilbao Vizcaya Argentaria SA | | | 135,705 | | | | 1,151 | | |
Banco de Sabadell SA | | | 189,655 | | | | 348 | | |
Banco Popular Espanol SA | | | 80,921 | | | | 295 | | |
Banco Santander SA | | | 249,022 | | | | 1,326 | | |
Bankia SA | | | 393,696 | | | | 510 | | |
Bankinter SA | | | 31,776 | | | | 234 | | |
CaixaBank SA | | | 236,850 | | | | 913 | | |
Distribuidora Internacional de Alimentacion SA (f) | | | 18,498 | | | | 112 | | |
Enagas SA | | | 4,460 | | | | 128 | | |
Ferrovial SA | | | 6,878 | | | | 164 | | |
Gas Natural SDG SA | | | 5,948 | | | | 116 | | |
Grifols SA | | | 2,531 | | | | 105 | | |
Grifols SA, Class B | | | 126 | | | | 4 | | |
Iberdrola SA | | | 103,127 | | | | 686 | | |
Industria de Diseno Textil SA | | | 27,630 | | | | 926 | | |
International Consolidated Airlines Group SA (f) | | | 115,956 | | | | 1,036 | | |
Red Electrica Corp., SA | | | 3,217 | | | | 267 | | |
Repsol SA | | | 16,546 | | | | 193 | | |
Telefonica SA | | | 71,322 | | | | 864 | | |
| | | | 9,906 | | |
The accompanying notes are an integral part of the financial statements.
17
Morgan Stanley Institutional Fund Trust
Annual Report — September 30, 2015
Portfolio of Investments (cont'd)
Global Strategist Portfolio
| | | Shares | | Value
(000) | |
Sweden (0.9%) | |
Assa Abloy AB, Class B | | | 9,837 | | | $ | 177 | | |
Atlas Copco AB, Class A | | | 9,926 | | | | 239 | | |
Atlas Copco AB, Class B | | | 7,174 | | | | 161 | | |
Electrolux AB, Class B | | | 2,950 | | | | 83 | | |
Hennes & Mauritz AB, Class B | | | 10,362 | | | | 379 | | |
Husqvarna AB, Class B | | | 5,449 | | | | 36 | | |
Investor AB, Class B | | | 11,790 | | | | 406 | | |
Millicom International Cellular SA SDR | | | 1,326 | | | | 83 | | |
Modern Times Group MTG AB, Class B | | | 443 | | | | 11 | | |
Nordea Bank AB | | | 27,656 | | | | 309 | | |
Sandvik AB | | | 15,296 | | | | 131 | | |
Skandinaviska Enskilda Banken AB, Class A | | | 14,978 | | | | 160 | | |
Skanska AB, Class B | | | 3,281 | | | | 64 | | |
| SKF AB, Class B | | | 6,298 | | | | 116 | | |
Svenska Cellulosa AB SCA, Class B | | | 8,585 | | | | 241 | | |
Svenska Handelsbanken AB, Class A | | | 17,218 | | | | 247 | | |
Swedbank AB, Class A | | | 5,373 | | | | 119 | | |
Swedish Match AB | | | 4,201 | | | | 127 | | |
Telefonaktiebolaget LM Ericsson, Class B | | | 25,830 | | | | 254 | | |
TeliaSonera AB | | | 31,426 | | | | 170 | | |
Volvo AB, Class B | | | 8,272 | | | | 79 | | |
| | | | 3,592 | | |
Switzerland (3.3%) | |
ABB Ltd. (Registered) (f) | | | 37,474 | | | | 664 | | |
Actelion Ltd. (Registered) (f) | | | 1,056 | | | | 134 | | |
Adecco SA (Registered) (f) | | | 16,636 | | | | 1,220 | | |
Cie Financiere Richemont SA (Registered) | | | 5,331 | | | | 415 | | |
Coca-Cola HBC AG (f) | | | 667 | | | | 14 | | |
Credit Suisse Group AG (Registered) (f) | | | 16,331 | | | | 393 | | |
Geberit AG (Registered) | | | 894 | | | | 274 | | |
Givaudan SA (Registered) (f) | | | 99 | | | | 161 | | |
Julius Baer Group Ltd. (f) | | | 2,309 | | | | 105 | | |
Kuehne & Nagel International AG (Registered) | | | 732 | | | | 94 | | |
LafargeHolcim Ltd. (Registered) (f) | | | 4,228 | | | | 221 | | |
LafargeHolcim Ltd. (Registered) (f) | | | 343 | | | | 18 | | |
Lonza Group AG (Registered) (f) | | | 523 | | | | 69 | | |
Nestle SA (Registered) | | | 38,089 | | | | 2,868 | | |
Novartis AG (Registered) | | | 23,572 | | | | 2,171 | | |
Roche Holding AG (Genusschein) | | | 6,415 | | | | 1,696 | | |
SGS SA (Registered) | | | 60 | | | | 105 | | |
Sonova Holding AG (Registered) | | | 957 | | | | 123 | | |
Swatch Group AG (The) | | | 353 | | | | 131 | | |
Swiss Re AG | | | 1,336 | | | | 115 | | |
Swisscom AG (Registered) | | | 745 | | | | 373 | | |
Syngenta AG (Registered) | | | 914 | | | | 294 | | |
Transocean Ltd. | | | 3,245 | | | | 42 | | |
UBS Group AG (Registered) | | | 30,443 | | | | 564 | | |
Zurich Insurance Group AG (f) | | | 2,528 | | | | 622 | | |
| | | | 12,886 | | |
Turkey (0.0%) | |
Alacer Gold Corp. (f) | | | 8,000 | | | | 18 | | |
| | | Shares | | Value
(000) | |
United Kingdom (5.9%) | |
| 3i Group PLC | | | 17,668 | | | $ | 125 | | |
Admiral Group PLC | | | 3,778 | | | | 86 | | |
Aggreko PLC | | | 2,431 | | | | 35 | | |
Amec Foster Wheeler PLC | | | 3,969 | | | | 43 | | |
Anglo American PLC | | | 12,293 | | | | 103 | | |
ARM Holdings PLC | | | 14,750 | | | | 213 | | |
Associated British Foods PLC | | | 1,859 | | | | 94 | | |
AstraZeneca PLC | | | 16,441 | | | | 1,043 | | |
Aviva PLC | | | 32,168 | | | | 220 | | |
Babcock International Group PLC | | | 4,000 | | | | 55 | | |
BAE Systems PLC | | | 51,079 | | | | 347 | | |
Barclays PLC | | | 174,173 | | | | 644 | | |
BG Group PLC | | | 32,584 | | | | 470 | | |
BHP Billiton PLC | | | 20,867 | | | | 319 | | |
| BP PLC | | | 189,666 | | | | 961 | | |
British American Tobacco PLC | | | 19,566 | | | | 1,081 | | |
British Land Co., PLC REIT | | | 12,968 | | | | 165 | | |
BT Group PLC | | | 102,679 | | | | 653 | | |
Burberry Group PLC | | | 4,196 | | | | 87 | | |
Cairn Energy PLC (f) | | | 6,451 | | | | 14 | | |
Capita PLC | | | 6,586 | | | | 120 | | |
Centrica PLC | | | 52,229 | | | | 181 | | |
Compass Group PLC | | | 19,815 | | | | 316 | | |
Diageo PLC | | | 24,702 | | | | 665 | | |
Experian PLC | | | 11,615 | | | | 186 | | |
G4S PLC | | | 14,808 | | | | 52 | | |
GlaxoSmithKline PLC | | | 58,621 | | | | 1,124 | | |
Glencore PLC (f) | | | 65,300 | | | | 91 | | |
HSBC Holdings PLC | | | 171,175 | | | | 1,295 | | |
Imperial Tobacco Group PLC | | | 10,308 | | | | 533 | | |
Indivior PLC | | | 6,915 | | | | 24 | | |
Inmarsat PLC | | | 4,106 | | | | 61 | | |
Intertek Group PLC | | | 1,847 | | | | 68 | | |
Investec PLC | | | 9,538 | | | | 73 | | |
ITV PLC | | | 32,244 | | | | 120 | | |
Johnson Matthey PLC | | | 2,335 | | | | 87 | | |
Land Securities Group PLC REIT | | | 12,437 | | | | 237 | | |
Legal & General Group PLC | | | 64,615 | | | | 233 | | |
Liberty Global PLC LiLAC, Class A (f) | | | 107 | | | | 4 | | |
Liberty Global PLC LiLAC Series C (f) | | | 290 | | | | 10 | | |
Lloyds Banking Group PLC | | | 409,276 | | | | 467 | | |
Lonmin PLC (f) | | | 2,693 | | | | 1 | | |
Man Group PLC | | | 15,236 | | | | 35 | | |
Marks & Spencer Group PLC | | | 10,082 | | | | 77 | | |
National Grid PLC | | | 35,017 | | | | 488 | | |
Next PLC | | | 1,962 | | | | 226 | | |
Old Mutual PLC | | | 76,950 | | | | 221 | | |
Pearson PLC | | | 12,902 | | | | 220 | | |
Petrofac Ltd. | | | 3,181 | | | | 37 | | |
Prudential PLC | | | 31,720 | | | | 671 | | |
Randgold Resources Ltd. | | | 924 | | | | 54 | | |
Reckitt Benckiser Group PLC | | | 6,915 | | | | 628 | | |
The accompanying notes are an integral part of the financial statements.
18
Morgan Stanley Institutional Fund Trust
Annual Report — September 30, 2015
Portfolio of Investments (cont'd)
Global Strategist Portfolio
| | | Shares | | Value
(000) | |
United Kingdom (cont'd) | |
RELX PLC | | | 3,587 | | | $ | 62 | | |
Rio Tinto PLC | | | 13,589 | | | | 456 | | |
Rolls-Royce Holdings PLC (f) | | | 34,143 | | | | 351 | | |
Royal Bank of Scotland Group PLC (f) | | | 22,325 | | | | 107 | | |
Royal Dutch Shell PLC, Class A | | | 35,881 | | | | 846 | | |
Royal Dutch Shell PLC, Class B | | | 27,048 | | | | 642 | | |
RSA Insurance Group PLC | | | 15,957 | | | | 97 | | |
Serco Group PLC (f) | | | 11,756 | | | | 18 | | |
Shire PLC | | | 5,464 | | | | 373 | | |
Signet Jewelers Ltd. | | | 700 | | | | 95 | | |
Sky PLC | | | 8,242 | | | | 130 | | |
Smith & Nephew PLC | | | 10,250 | | | | 179 | | |
Smiths Group PLC | | | 6,229 | | | | 95 | | |
SSE PLC | | | 17,723 | | | | 402 | | |
Standard Chartered PLC | | | 21,901 | | | | 213 | | |
Standard Life PLC | | | 15,169 | | | | 89 | | |
Tesco PLC | | | 78,475 | | | | 218 | | |
Tullow Oil PLC (f) | | | 8,851 | | | | 23 | | |
Unilever PLC | | | 13,299 | | | | 542 | | |
Vedanta Resources PLC | | | 1,623 | | | | 10 | | |
Verizon Communications, Inc. | | | 14,424 | | | | 628 | | |
Verizon Communications, Inc. | | | 15,926 | | | | 696 | | |
Vodafone Group PLC | | | 330,304 | | | | 1,044 | | |
WM Morrison Supermarkets PLC | | | 20,218 | | | | 51 | | |
Wolseley PLC | | | 3,226 | | | | 189 | | |
WPP PLC | | | 28,743 | | | | 599 | | |
| | | | 23,518 | | |
United States (26.8%) | |
3M Co. | | | 1,991 | | | | 282 | | |
Abbott Laboratories | | | 6,112 | | | | 246 | | |
AbbVie, Inc. | | | 6,112 | | | | 333 | | |
Abercrombie & Fitch Co., Class A | | | 249 | | | | 5 | | |
Accenture PLC, Class A | | | 3,825 | | | | 376 | | |
ACCO Brands Corp. (f) | | | 104 | | | | 1 | | |
Adobe Systems, Inc. (f) | | | 3,963 | | | | 326 | | |
ADT Corp. (The) | | | 404 | | | | 12 | | |
Advance Auto Parts, Inc. | | | 249 | | | | 47 | | |
Advanced Micro Devices, Inc. (f) | | | 2,880 | | | | 5 | | |
AES Corp. | | | 793 | | | | 8 | | |
Aetna, Inc. | | | 2,746 | | | | 300 | | |
Aflac, Inc. | | | 301 | | | | 18 | | |
Agilent Technologies, Inc. | | | 2,179 | | | | 75 | | |
Air Products & Chemicals, Inc. | | | 277 | | | | 35 | | |
Airgas, Inc. | | | 294 | | | | 26 | | |
Akamai Technologies, Inc. (f) | | | 1,312 | | | | 91 | | |
Alamos Gold, Inc., Class A (f) | | | 8,160 | | | | 30 | | |
Alcoa, Inc. | | | 3,980 | | | | 38 | | |
Alexion Pharmaceuticals, Inc. (f) | | | 1,301 | | | | 203 | | |
Allegheny Technologies, Inc. | | | 535 | | | | 8 | | |
Allegion PLC | | | 242 | | | | 14 | | |
Allergan PLC (f) | | | 989 | | | | 269 | | |
Allstate Corp. (The) | | | 643 | | | | 37 | | |
| | | Shares | | Value
(000) | |
Alpha Natural Resources, Inc. (f) | | | 984 | | | $ | — | @ | |
Alphabet, Inc., Class A | | | 1,783 | | | | 1,138 | | |
Alphabet, Inc., Class C | | | 1,787 | | | | 1,087 | | |
Altera Corp. | | | 4,541 | | | | 227 | | |
Altria Group, Inc. | | | 9,846 | | | | 536 | | |
Amazon.com, Inc. (f) | | | 1,570 | | | | 804 | | |
AMC Networks, Inc., Class A (f) | | | 21 | | | | 2 | | |
Ameren Corp. | | | 2,392 | | | | 101 | | |
American Electric Power Co., Inc. | | | 4,394 | | | | 250 | | |
American Express Co. | | | 3,791 | | | | 281 | | |
American Tower Corp. REIT | | | 3,760 | | | | 331 | | |
Ameriprise Financial, Inc. | | | 2,379 | | | | 260 | | |
AmerisourceBergen Corp. | | | 3,671 | | | | 349 | | |
AMETEK, Inc. | | | 916 | | | | 48 | | |
Amgen, Inc. | | | 5,917 | | | | 818 | | |
Amphenol Corp., Class A | | | 312 | | | | 16 | | |
Anadarko Petroleum Corp. | | | 3,141 | | | | 190 | | |
Analog Devices, Inc. | | | 3,957 | | | | 223 | | |
Annaly Capital Management, Inc. REIT | | | 2,258 | | | | 22 | | |
Anthem, Inc. | | | 1,787 | | | | 250 | | |
Aon PLC | | | 200 | | | | 18 | | |
Apache Corp. | | | 2,774 | | | | 109 | | |
Apollo Education Group, Inc., Class A (f) | | | 636 | | | | 7 | | |
Apple, Inc. | | | 54,863 | | | | 6,051 | | |
Applied Materials, Inc. | | | 7,649 | | | | 112 | | |
Arch Coal, Inc. (f) | | | 97 | | | | — | @ | |
Archer-Daniels-Midland Co. | | | 3,243 | | | | 134 | | |
AT&T, Inc. | | | 45,493 | | | | 1,482 | | |
Automatic Data Processing, Inc. | | | 1,770 | | | | 142 | | |
AutoZone, Inc. (f) | | | 257 | | | | 186 | | |
Avago Technologies Ltd. | | | 1,565 | | | | 196 | | |
AvalonBay Communities, Inc. REIT | | | 1,467 | | | | 256 | | |
Avery Dennison Corp. | | | 1,548 | | | | 88 | | |
Avon Products, Inc. | | | 4,575 | | | | 15 | | |
Baker Hughes, Inc. | | | 3,795 | | | | 198 | | |
Ball Corp. | | | 799 | | | | 50 | | |
Bank of America Corp. | | | 96,010 | | | | 1,496 | | |
Bank of New York Mellon Corp. (The) | | | 11,084 | | | | 434 | | |
Baxalta, Inc. | | | 4,320 | | | | 136 | | |
Baxter International, Inc. | | | 4,320 | | | | 142 | | |
BB&T Corp. | | | 6,760 | | | | 241 | | |
Becton Dickinson and Co. | | | 2,022 | | | | 268 | | |
Bed Bath & Beyond, Inc. (f) | | | 2,980 | | | | 170 | | |
Berkshire Hathaway, Inc., Class B (f) | | | 754 | | | | 98 | | |
Best Buy Co., Inc. | | | 4,446 | | | | 165 | | |
Biogen, Inc. (f) | | | 1,524 | | | | 445 | | |
Blackhawk Network Holdings, Inc. (f) | | | 53 | | | | 2 | | |
BlackRock, Inc. | | | 987 | | | | 294 | | |
Bloomin' Brands, Inc. | | | 1,100 | | | | 20 | | |
Boeing Co. (The) | | | 3,519 | | | | 461 | | |
Boston Properties, Inc. REIT | | | 1,316 | | | | 156 | | |
Boston Scientific Corp. (f) | | | 11,397 | | | | 187 | | |
Bristol-Myers Squibb Co. | | | 8,539 | | | | 506 | | |
The accompanying notes are an integral part of the financial statements.
19
Morgan Stanley Institutional Fund Trust
Annual Report — September 30, 2015
Portfolio of Investments (cont'd)
Global Strategist Portfolio
| | | Shares | | Value
(000) | |
United States (cont'd) | |
Broadcom Corp., Class A | | | 5,852 | | | $ | 301 | | |
Brookfield Property Partners LP | | | 2,480 | | | | 53 | | |
Brown-Forman Corp., Class B | | | 31 | | | | 3 | | |
Bunge Ltd. | | | 646 | | | | 47 | | |
C.H. Robinson Worldwide, Inc. | | | 1,227 | | | | 83 | | |
CA, Inc. | | | 1,975 | | | | 54 | | |
Cablevision Systems Corp. | | | 2,912 | | | | 95 | | |
California Resources Corp. | | | 2,926 | | | | 8 | | |
Cameron International Corp. (f) | | | 1,723 | | | | 106 | | |
Campbell Soup Co. | | | 222 | | | | 11 | | |
Capital One Financial Corp. | | | 3,777 | | | | 274 | | |
Cardinal Health, Inc. | | | 3,321 | | | | 255 | | |
Care Capital Properties, Inc. REIT | | | 161 | | | | 5 | | |
CarMax, Inc. (f) | | | 777 | | | | 46 | | |
Carnival Corp. | | | 2,209 | | | | 110 | | |
Carter's, Inc. | | | 500 | | | | 45 | | |
Caterpillar, Inc. | | | 4,687 | | | | 306 | | |
CBRE Group, Inc., Class A (f) | | | 5,889 | | | | 188 | | |
CBS Corp., Class B | | | 6,101 | | | | 243 | | |
CDK Global, Inc. | | | 590 | | | | 28 | | |
Celanese Corp. Series A | | | 220 | | | | 13 | | |
Celgene Corp. (f) | | | 5,522 | | | | 597 | | |
CenterPoint Energy, Inc. | | | 4,776 | | | | 86 | | |
CenturyLink, Inc. | | | 3,810 | | | | 96 | | |
Cerner Corp. (f) | | | 2,212 | | | | 133 | | |
CF Industries Holdings, Inc. | | | 3,280 | | | | 147 | | |
Charles Schwab Corp. (The) | | | 6,833 | | | | 195 | | |
Chemours Co. (The) | | | 314 | | | | 2 | | |
Chesapeake Energy Corp. | | | 4,434 | | | | 33 | | |
Chevron Corp. | | | 9,865 | | | | 778 | | |
Chipotle Mexican Grill, Inc. (f) | | | 223 | | | | 161 | | |
Chubb Corp. (The) | | | 284 | | | | 35 | | |
Cigna Corp. | | | 2,266 | | | | 306 | | |
Cintas Corp. | | | 1,294 | | | | 111 | | |
Cisco Systems, Inc. | | | 44,042 | | | | 1,156 | | |
CIT Group, Inc. | | | 1,855 | | | | 74 | | |
Citigroup, Inc. | | | 17,152 | | | | 851 | | |
Citizens Financial Group, Inc. | | | 200 | | | | 5 | | |
Citrix Systems, Inc. (f) | | | 1,779 | | | | 123 | | |
Cliffs Natural Resources, Inc. | | | 777 | | | | 2 | | |
Clorox Co. (The) | | | 1,259 | | | | 145 | | |
CME Group, Inc. | | | 211 | | | | 20 | | |
Coach, Inc. | | | 1,453 | | | | 42 | | |
Coca-Cola Co. | | | 29,991 | | | | 1,203 | | |
Coca-Cola Enterprises, Inc. | | | 1,705 | | | | 82 | | |
Coeur Mining, Inc. (f) | | | 4,330 | | | | 12 | | |
Cognizant Technology Solutions Corp., Class A (f) | | | 5,518 | | | | 345 | | |
Colgate-Palmolive Co. | | | 8,894 | | | | 564 | | |
Columbia Pipeline Group, Inc. | | | 64 | | | | 1 | | |
Comcast Corp., Class A | | | 12,874 | | | | 732 | | |
Comcast Corp. Special Class A | | | 3,675 | | | | 210 | | |
Comerica, Inc. | | | 322 | | | | 13 | | |
| | | Shares | | Value
(000) | |
ConAgra Foods, Inc. | | | 3,063 | | | $ | 124 | | |
Concho Resources, Inc. (f) | | | 680 | | | | 67 | | |
ConocoPhillips | | | 7,365 | | | | 353 | | |
CONSOL Energy, Inc. | | | 1,769 | | | | 17 | | |
Consolidated Edison, Inc. | | | 2,186 | | | | 146 | | |
Constellation Brands, Inc., Class A | | | 233 | | | | 29 | | |
Corning, Inc. | | | 4,684 | | | | 80 | | |
Costco Wholesale Corp. | | | 5,851 | | | | 846 | | |
CR Bard, Inc. | | | 651 | | | | 121 | | |
Crimson Wine Group Ltd. (f) | | | 181 | | | | 2 | | |
Crown Castle International Corp. REIT | | | 2,796 | | | | 221 | | |
Crown Holdings, Inc. (f) | | | 600 | | | | 27 | | |
CST Brands, Inc. | | | 219 | | | | 7 | | |
CSX Corp. | | | 6,508 | | | | 175 | | |
Cummins, Inc. | | | 1,721 | | | | 187 | | |
CVS Health Corp. | | | 1,481 | | | | 143 | | |
Danaher Corp. | | | 617 | | | | 53 | | |
Darden Restaurants, Inc. | | | 1,724 | | | | 118 | | |
DaVita HealthCare Partners, Inc. (f) | | | 1,292 | | | | 93 | | |
Deere & Co. | | | 2,818 | | | | 209 | | |
Denbury Resources, Inc. | | | 734 | | | | 2 | | |
Devon Energy Corp. | | | 2,222 | | | | 82 | | |
DeVry Education Group, Inc. | | | 21 | | | | 1 | | |
Diamond Offshore Drilling, Inc. | | | 43 | | | | 1 | | |
Discover Financial Services | | | 3,469 | | | | 180 | | |
Discovery Communications, Inc., Class A (f) | | | 1,542 | | | | 40 | | |
Discovery Communications, Inc., Class C (f) | | | 4,048 | | | | 98 | | |
Dollar General Corp. | | | 2,686 | | | | 195 | | |
Dollar Tree, Inc. (f) | | | 2,825 | | | | 188 | �� | |
Dominion Resources, Inc. | | | 5,823 | | | | 410 | | |
Dover Corp. | | | 226 | | | | 13 | | |
Dow Chemical Co. (The) | | | 2,080 | | | | 88 | | |
Dr. Pepper Snapple Group, Inc. | | | 911 | | | | 72 | | |
DTE Energy Co. | | | 1,490 | | | | 120 | | |
Duke Energy Corp. | | | 4,662 | | | | 335 | | |
Dun & Bradstreet Corp. (The) | | | 726 | | | | 76 | | |
Eastman Chemical Co. | | | 282 | | | | 18 | | |
Eaton Corp., PLC | | | 2,248 | | | | 115 | | |
eBay, Inc. (f) | | | 7,767 | | | | 190 | | |
Ecolab, Inc. | | | 1,468 | | | | 161 | | |
Edison International | | | 3,827 | | | | 241 | | |
Edwards Lifesciences Corp. (f) | | | 221 | | | | 31 | | |
EI du Pont de Nemours & Co. | | | 1,572 | | | | 76 | | |
Eli Lilly & Co. | | | 4,733 | | | | 396 | | |
EMC Corp. | | | 17,097 | | | | 413 | | |
Emerson Electric Co. | | | 4,765 | | | | 210 | | |
Engility Holdings, Inc. | | | 18 | | | | — | @ | |
Entergy Corp. | | | 1,290 | | | | 84 | | |
EOG Resources, Inc. | | | 4,252 | | | | 310 | | |
EQT Corp. | | | 859 | | | | 56 | | |
Equifax, Inc. | | | 1,461 | | | | 142 | | |
Equity Residential REIT | | | 2,833 | | | | 213 | | |
Estee Lauder Cos., Inc. (The), Class A | | | 2,959 | | | | 239 | | |
The accompanying notes are an integral part of the financial statements.
20
Morgan Stanley Institutional Fund Trust
Annual Report — September 30, 2015
Portfolio of Investments (cont'd)
Global Strategist Portfolio
| | | Shares | | Value
(000) | |
United States (cont'd) | |
Exelon Corp. | | | 7,330 | | | $ | 218 | | |
Expedia, Inc. | | | 232 | | | | 27 | | |
Expeditors International of Washington, Inc. | | | 656 | | | | 31 | | |
Express Scripts Holding Co. (f) | | | 6,526 | | | | 528 | | |
Exxon Mobil Corp. | | | 24,186 | | | | 1,798 | | |
Fastenal Co. | | | 1,771 | | | | 65 | | |
FedEx Corp. | | | 1,614 | | | | 232 | | |
Fidelity National Information Services, Inc. | | | 111 | | | | 7 | | |
Fifth Third Bancorp | | | 9,371 | | | | 177 | | |
First Republic Bank | | | 100 | | | | 6 | | |
First Solar, Inc. (f) | | | 295 | | | | 13 | | |
FirstEnergy Corp. | | | 3,256 | | | | 102 | | |
Fiserv, Inc. (f) | | | 1,436 | | | | 124 | | |
Flowserve Corp. | | | 900 | | | | 37 | | |
Fluor Corp. | | | 726 | | | | 31 | | |
FMC Corp. | | | 882 | | | | 30 | | |
FMC Technologies, Inc. (f) | | | 2,371 | | | | 74 | | |
Ford Motor Co. | | | 9,829 | | | | 133 | | |
Franklin Resources, Inc. | | | 3,508 | | | | 131 | | |
Freeport-McMoRan, Inc. | | | 2,760 | | | | 27 | | |
Frontier Communications Corp. | | | 9,547 | | | | 45 | | |
G-III Apparel Group Ltd. (f) | | | 400 | | | | 25 | | |
GameStop Corp., Class A | | | 536 | | | | 22 | | |
Gannett Co., Inc. | | | 116 | | | | 2 | | |
Gap, Inc. (The) | | | 5,096 | | | | 145 | | |
General Dynamics Corp. | | | 1,241 | | | | 171 | | |
General Electric Co. | | | 21,678 | | | | 547 | | |
General Growth Properties, Inc. REIT | | | 1,246 | | | | 32 | | |
General Mills, Inc. | | | 4,974 | | | | 279 | | |
Genuine Parts Co. | | | 111 | | | | 9 | | |
Gilead Sciences, Inc. | | | 9,180 | | | | 901 | | |
Goldman Sachs Group, Inc. (The) | | | 4,552 | | | | 791 | | |
H&R Block, Inc. | | | 5,837 | | | | 211 | | |
Halliburton Co. | | | 6,838 | | | | 242 | | |
Halyard Health, Inc. (f) | | | 455 | | | | 13 | | |
Hanesbrands, Inc. | | | 3,400 | | | | 98 | | |
Harman International Industries, Inc. | | | 43 | | | | 4 | | |
Harris Corp. | | | 23 | | | | 2 | | |
Hartford Financial Services Group, Inc. (The) | | | 228 | | | | 10 | | |
Hasbro, Inc. | | | 176 | | | | 13 | | |
HCP, Inc. REIT | | | 1,686 | | | | 63 | | |
Hecla Mining Co. | | | 12,030 | | | | 24 | | |
Helmerich & Payne, Inc. | | | 880 | | | | 42 | | |
Henry Schein, Inc. (f) | | | 680 | | | | 90 | | |
Hershey Co. (The) | | | 648 | | | | 60 | | |
Hess Corp. | | | 1,339 | | | | 67 | | |
Hewlett-Packard Co. | | | 11,406 | | | | 292 | | |
Hologic, Inc. (f) | | | 1,396 | | | | 55 | | |
Home Depot, Inc. | | | 1,231 | | | | 142 | | |
Honeywell International, Inc. | | | 5,030 | | | | 476 | | |
Host Hotels & Resorts, Inc. REIT | | | 8,371 | | | | 132 | | |
Hudson City Bancorp, Inc. | | | 522 | | | | 5 | | |
| | | Shares | | Value
(000) | |
Humana, Inc. | | | 704 | | | $ | 126 | | |
Huntington Bancshares, Inc. | | | 1,200 | | | | 13 | | |
Huntington Ingalls Industries, Inc. | | | 59 | | | | 6 | | |
IAMGOLD Corp. (f) | | | 10,670 | | | | 17 | | |
IHS, Inc., Class A (f) | | | 672 | | | | 78 | | |
Illinois Tool Works, Inc. | | | 2,374 | | | | 195 | | |
Illumina, Inc. (f) | | | 642 | | | | 113 | | |
Ingersoll-Rand PLC | | | 1,027 | | | | 52 | | |
Intel Corp. | | | 18,976 | | | | 572 | | |
Intercontinental Exchange, Inc. | | | 678 | | | | 159 | | |
International Business Machines Corp. | | | 7,771 | | | | 1,127 | | |
International Flavors & Fragrances, Inc. | | | 253 | | | | 26 | | |
International Game Technology PLC | | | 519 | | | | 8 | | |
International Paper Co. | | | 730 | | | | 28 | | |
Interpublic Group of Cos., Inc. (The) | | | 5,001 | | | | 96 | | |
Intuit, Inc. | | | 3,122 | | | | 277 | | |
Intuitive Surgical, Inc. (f) | | | 635 | | | | 292 | | |
Invesco Ltd. | | | 3,781 | | | | 118 | | |
Iron Mountain, Inc. REIT | | | 2,578 | | | | 80 | | |
ITT Corp. | | | 219 | | | | 7 | | |
Jabil Circuit, Inc. | | | 222 | | | | 5 | | |
Jacobs Engineering Group, Inc. (f) | | | 851 | | | | 32 | | |
Janus Capital Group, Inc. | | | 111 | | | | 2 | | |
JB Hunt Transport Services, Inc. | | | 228 | | | | 16 | | |
JC Penney Co., Inc. (f) | | | 222 | | | | 2 | | |
JM Smucker Co. (The) | | | 779 | | | | 89 | | |
Johnson & Johnson | | | 14,548 | | | | 1,358 | | |
Johnson Controls, Inc. | | | 2,148 | | | | 89 | | |
Joy Global, Inc. | | | 241 | | | | 4 | | |
JPMorgan Chase & Co. | | | 41,877 | | | | 2,553 | | |
Juniper Networks, Inc. | | | 5,831 | | | | 150 | | |
KBR, Inc. | | | 1,102 | | | | 18 | | |
Kellogg Co. | | | 2,040 | | | | 136 | | |
KeyCorp | | | 11,615 | | | | 151 | | |
Keysight Technologies, Inc. (f) | | | 1,089 | | | | 34 | | |
Kimberly-Clark Corp. | | | 3,747 | | | | 409 | | |
Kimco Realty Corp. REIT | | | 2,319 | | | | 57 | | |
KLA-Tencor Corp. | | | 889 | | | | 44 | | |
Knowles Corp. (f) | | | 113 | | | | 2 | | |
Kohl's Corp. | | | 3,449 | | | | 160 | | |
Kraft Heinz Co. (The) | | | 2,845 | | | | 201 | | |
Kroger Co. (The) | | | 13,150 | | | | 474 | | |
L Brands, Inc. | | | 4,631 | | | | 417 | | |
L-3 Communications Holdings, Inc. | | | 111 | | | | 12 | | |
Laboratory Corp. of America Holdings (f) | | | 649 | | | | 70 | | |
Lam Research Corp. | | | 742 | | | | 48 | | |
Las Vegas Sands Corp. | | | 2,035 | | | | 77 | | |
Legg Mason, Inc. | | | 1,764 | | | | 73 | | |
Leucadia National Corp. | | | 2,212 | | | | 45 | | |
Lexmark International, Inc., Class A | | | 111 | | | | 3 | | |
Li & Fung Ltd. (g) | | | 40,000 | | | | 31 | | |
Liberty Global PLC, Class A (f) | | | 2,141 | | | | 92 | | |
Liberty Global PLC Series C (f) | | | 5,809 | | | | 238 | | |
The accompanying notes are an integral part of the financial statements.
21
Morgan Stanley Institutional Fund Trust
Annual Report — September 30, 2015
Portfolio of Investments (cont'd)
Global Strategist Portfolio
| | | Shares | | Value
(000) | |
United States (cont'd) | |
Liberty Property Trust REIT | | | 529 | | | $ | 17 | | |
Linear Technology Corp. | | | 1,699 | | | | 69 | | |
Lockheed Martin Corp. | | | 883 | | | | 183 | | |
Loews Corp. | | | 586 | | | | 21 | | |
Lowe's Cos., Inc. | | | 6,273 | | | | 432 | | |
LyondellBasell Industries N.V., Class A | | | 854 | | | | 71 | | |
M&T Bank Corp. | | | 1,132 | | | | 138 | | |
Macerich Co. (The) REIT | | | 287 | | | | 22 | | |
Macy's, Inc. | | | 3,073 | | | | 158 | | |
Mallinckrodt PLC (f) | | | 224 | | | | 14 | | |
Manpowergroup, Inc. | | | 1,329 | | | | 109 | | |
Marathon Oil Corp. | | | 3,805 | | | | 59 | | |
Marathon Petroleum Corp. | | | 4,006 | | | | 186 | | |
Marriott International, Inc., Class A | | | 4,025 | | | | 275 | | |
Marriott Vacations Worldwide Corp. | | | 194 | | | | 13 | | |
Marsh & McLennan Cos., Inc. | | | 686 | | | | 36 | | |
Marvell Technology Group Ltd. | | | 2,949 | | | | 27 | | |
Mastercard, Inc., Class A | | | 9,790 | | | | 882 | | |
Mattel, Inc. | | | 1,565 | | | | 33 | | |
Maxim Integrated Products, Inc. | | | 1,570 | | | | 52 | | |
McDonald's Corp. | | | 5,282 | | | | 520 | | |
McGraw Hill Financial, Inc. | | | 3,315 | | | | 287 | | |
McKesson Corp. | | | 1,741 | | | | 322 | | |
Mead Johnson Nutrition Co. | | | 1,533 | | | | 108 | | |
Medtronic PLC | | | 9,342 | | | | 625 | | |
Men's Wearhouse, Inc. (The) | | | 400 | | | | 17 | | |
Merck & Co., Inc. | | | 15,239 | | | | 753 | | |
MetLife, Inc. | | | 870 | | | | 41 | | |
MGM Resorts International (f) | | | 2,334 | | | | 43 | | |
Microchip Technology, Inc. | | | 803 | | | | 35 | | |
Micron Technology, Inc. (f) | | | 5,496 | | | | 82 | | |
Microsoft Corp. | | | 39,320 | | | | 1,740 | | |
Molson Coors Brewing Co., Class B | | | 1,287 | | | | 107 | | |
Mondelez International, Inc., Class A | | | 8,338 | | | | 349 | | |
Monsanto Co. | | | 2,786 | | | | 238 | | |
Moody's Corp. | | | 1,255 | | | | 123 | | |
Mosaic Co. (The) | | | 1,508 | | | | 47 | | |
Motorola Solutions, Inc. | | | 1,299 | | | | 89 | | |
Murphy Oil Corp. | | | 914 | | | | 22 | | |
Murphy USA, Inc. (f) | | | 228 | | | | 13 | | |
Mylan N.V. (f) | | | 1,701 | | | | 69 | | |
NASDAQ, Inc. | | | 2,792 | | | | 149 | | |
National Oilwell Varco, Inc. | | | 3,989 | | | | 150 | | |
Navient Corp. | | | 5,330 | | | | 60 | | |
NetApp, Inc. | | | 3,516 | | | | 104 | | |
Netflix, Inc. (f) | | | 1,575 | | | | 163 | | |
NetScout Systems, Inc. (f) | | | 7,373 | | | | 261 | | |
New York Community Bancorp, Inc. | | | 4,771 | | | | 86 | | |
Newfield Exploration Co. (f) | | | 736 | | | | 24 | | |
Newmont Mining Corp. | | | 10,631 | | | | 171 | | |
News Corp., Class A | | | 3,791 | | | | 48 | | |
News Corp., Class B | | | 725 | | | | 9 | | |
| | | Shares | | Value
(000) | |
NextEra Energy, Inc. | | | 3,087 | | | $ | 301 | | |
NIKE, Inc., Class B | | | 3,126 | | | | 384 | | |
NiSource, Inc. | | | 64 | | | | 1 | | |
Noble Corp., PLC | | | 871 | | | | 10 | | |
Noble Energy, Inc. | | | 2,900 | | | | 88 | | |
Nordstrom, Inc. | | | 1,810 | | | | 130 | | |
Norfolk Southern Corp. | | | 3,830 | | | | 293 | | |
Northern Trust Corp. | | | 33 | | | | 2 | | |
Northrop Grumman Corp. | | | 839 | | | | 139 | | |
NOW, Inc. (f) | | | 847 | | | | 13 | | |
Nucor Corp. | | | 866 | | | | 33 | | |
NVIDIA Corp. | | | 3,556 | | | | 88 | | |
O'Reilly Automotive, Inc. (f) | | | 1,033 | | | | 258 | | |
Occidental Petroleum Corp. | | | 7,317 | | | | 484 | | |
Omnicom Group, Inc. | | | 1,961 | | | | 129 | | |
ONE Gas, Inc. | | | 642 | | | | 29 | | |
ONEOK, Inc. | | | 2,770 | | | | 89 | | |
Oracle Corp. | | | 24,511 | | | | 885 | | |
Owens-Illinois, Inc. (f) | | | 262 | | | | 5 | | |
PACCAR, Inc. | | | 2,826 | | | | 147 | | |
Paragon Offshore PLC | | | 323 | | | | — | @ | |
Patterson Cos., Inc. | | | 176 | | | | 8 | | |
Paychex, Inc. | | | 1,753 | | | | 84 | | |
PayPal Holdings, Inc. (f) | | | 7,767 | | | | 241 | | |
Peabody Energy Corp. | | | 2,523 | | | | 3 | | |
Pentair PLC | | | 189 | | | | 10 | | |
People's United Financial, Inc. | | | 767 | | | | 12 | | |
Pepco Holdings, Inc. | | | 94 | | | | 2 | | |
PepsiCo, Inc. | | | 7,337 | | | | 692 | | |
Perrigo Co., PLC | | | 221 | | | | 35 | | |
Pfizer, Inc. | | | 30,729 | | | | 965 | | |
PG&E Corp. | | | 3,537 | | | | 187 | | |
Philip Morris International, Inc. | | | 8,370 | | | | 664 | | |
Phillips 66 | | | 3,793 | | | | 291 | | |
Pioneer Natural Resources Co. | | | 1,022 | | | | 124 | | |
Pitney Bowes, Inc. | | | 2,781 | | | | 55 | | |
Plum Creek Timber Co., Inc. REIT | | | 758 | | | | 30 | | |
PNC Financial Services Group, Inc. (The) | | | 4,569 | | | | 408 | | |
PPG Industries, Inc. | | | 444 | | | | 39 | | |
PPL Corp. | | | 4,362 | | | | 143 | | |
Praxair, Inc. | | | 1,529 | | | | 156 | | |
Precision Castparts Corp. | | | 993 | | | | 228 | | |
Priceline Group, Inc. (The) (f) | | | 258 | | | | 319 | | |
Procter & Gamble Co. (The) | | | 20,928 | | | | 1,506 | | |
Progressive Corp. (The) | | | 259 | | | | 8 | | |
ProLogis, Inc. REIT | | | 4,009 | | | | 156 | | |
Prudential Financial, Inc. | | | 200 | | | | 15 | | |
Public Service Enterprise Group, Inc. | | | 4,394 | | | | 185 | | |
Public Storage REIT | | | 2,766 | | | | 585 | | |
QEP Resources, Inc. | | | 1,263 | | | | 16 | | |
QUALCOMM, Inc. | | | 12,926 | | | | 695 | | |
Quest Diagnostics, Inc. | | | 970 | | | | 60 | | |
Ralph Lauren Corp. | | | 47 | | | | 6 | | |
The accompanying notes are an integral part of the financial statements.
22
Morgan Stanley Institutional Fund Trust
Annual Report — September 30, 2015
Portfolio of Investments (cont'd)
Global Strategist Portfolio
| | | Shares | | Value
(000) | |
United States (cont'd) | |
Range Resources Corp. | | | 1,297 | | | $ | 42 | | |
Rayonier Advanced Materials, Inc. | | | 175 | | | | 1 | | |
Rayonier, Inc. REIT | | | 525 | | | | 12 | | |
Raytheon Co. | | | 974 | | | | 106 | | |
Regency Centers Corp. REIT | | | 251 | | | | 16 | | |
Regions Financial Corp. | | | 15,679 | | | | 141 | | |
Republic Services, Inc. | | | 3,058 | | | | 126 | | |
Reynolds American, Inc. | | | 7,272 | | | | 322 | | |
Robert Half International, Inc. | | | 1,760 | | | | 90 | | |
Rockwell Automation, Inc. | | | 1,462 | | | | 148 | | |
Rockwell Collins, Inc. | | | 832 | | | | 68 | | |
Roper Industries, Inc. | | | 256 | | | | 40 | | |
Ross Stores, Inc. | | | 6,400 | | | | 310 | | |
Rouse Properties, Inc. REIT | | | 71 | | | | 1 | | |
Royal Caribbean Cruises Ltd. | | | 1,578 | | | | 141 | | |
Royal Gold, Inc. | | | 2,010 | | | | 94 | | |
RR Donnelley & Sons Co. | | | 2,904 | | | | 42 | | |
Salesforce.com, Inc. (f) | | | 4,496 | | | | 312 | | |
SanDisk Corp. | | | 2,918 | | | | 159 | | |
Schlumberger Ltd. | | | 11,025 | | | | 760 | | |
Scripps Networks Interactive, Inc., Class A | | | 781 | | | | 38 | | |
Sealed Air Corp. | | | 287 | | | | 13 | | |
Sempra Energy | | | 2,203 | | | | 213 | | |
Seventy Seven Energy, Inc. (f) | | | 295 | | | | — | @ | |
Sherwin-Williams Co. (The) | | | 61 | | | | 14 | | |
Sibanye Gold Ltd. ADR | | | 6,800 | | | | 32 | | |
Sigma-Aldrich Corp. | | | 266 | | | | 37 | | |
Simon Property Group, Inc. REIT | | | 4,828 | | | | 887 | | |
SLM Corp. (f) | | | 5,330 | | | | 39 | | |
Southern Co. (The) | | | 6,830 | | | | 305 | | |
Southwest Airlines Co. | | | 578 | | | | 22 | | |
Southwestern Energy Co. (f) | | | 3,562 | | | | 45 | | |
Spectra Energy Corp. | | | 4,622 | | | | 121 | | |
Sprint Corp. (f) | | | 23,734 | | | | 91 | | |
St. Jude Medical, Inc. | | | 3,126 | | | | 197 | | |
Stanley Black & Decker, Inc. | | | 258 | | | | 25 | | |
Staples, Inc. | | | 5,838 | | | | 68 | | |
Starbucks Corp. | | | 9,604 | | | | 546 | | |
Starwood Hotels & Resorts Worldwide, Inc. | | | 784 | | | | 52 | | |
State Street Corp. | | | 2,968 | | | | 199 | | |
Stericycle, Inc. (f) | | | 717 | | | | 100 | | |
Steven Madden Ltd. (f) | | | 500 | | | | 18 | | |
Stryker Corp. | | | 2,747 | | | | 259 | | |
SunTrust Banks, Inc. | | | 5,417 | | | | 207 | | |
Symantec Corp. | | | 6,562 | | | | 128 | | |
Sysco Corp. | | | 7,022 | | | | 274 | | |
T-Mobile US, Inc. (f) | | | 116 | | | | 5 | | |
T. Rowe Price Group, Inc. | | | 3,131 | | | | 218 | | |
Tahoe Resources, Inc. | | | 6,950 | | | | 54 | | |
Talen Energy Corp. (f) | | | 544 | | | | 6 | | |
Target Corp. | | | 7,788 | | | | 613 | | |
TE Connectivity Ltd. | | | 2,800 | | | | 168 | | |
| | | Shares | | Value
(000) | |
TEGNA, Inc. | | | 233 | | | $ | 5 | | |
Tenaris SA | | | 4,172 | | | | 50 | | |
Tenet Healthcare Corp. (f) | | | 131 | | | | 5 | | |
Texas Instruments, Inc. | | | 11,405 | | | | 565 | | |
Textron, Inc. | | | 1,722 | | | | 65 | | |
Thermo Fisher Scientific, Inc. | | | 2,804 | | | | 343 | | |
Tiffany & Co. | | | 261 | | | | 20 | | |
Time Warner Cable, Inc. | | | 3,149 | | | | 565 | | |
Time Warner, Inc. | | | 6,509 | | | | 448 | | |
Time, Inc. | | | 751 | | | | 14 | | |
TJX Cos., Inc. (The) | | | 10,240 | | | | 731 | | |
Travelers Cos., Inc. (The) | | | 628 | | | | 63 | | |
TripAdvisor, Inc. (f) | | | 232 | | | | 15 | | |
Twenty-First Century Fox, Inc., Class A | | | 15,165 | | | | 409 | | |
Twenty-First Century Fox, Inc., Class B | | | 3,302 | | | | 89 | | |
Tyco International PLC | | | 1,309 | | | | 44 | | |
Tyson Foods, Inc., Class A | | | 2,358 | | | | 102 | | |
Ultra Petroleum Corp. (f) | | | 1,210 | | | | 8 | | |
Union Pacific Corp. | | | 4,270 | | | | 378 | | |
United Parcel Service, Inc., Class B | | | 3,720 | | | | 367 | | |
United States Steel Corp. | | | 541 | | | | 6 | | |
United Technologies Corp. | | | 2,773 | | | | 247 | | |
UnitedHealth Group, Inc. | | | 5,012 | | | | 581 | | |
Urban Edge Properties REIT | | | 154 | | | | 3 | | |
Urban Outfitters, Inc. (f) | | | 1,286 | | | | 38 | | |
US Bancorp | | | 15,773 | | | | 647 | | |
Valero Energy Corp. | | | 3,771 | | | | 227 | | |
Varian Medical Systems, Inc. (f) | | | 827 | | | | 61 | | |
Vectrus, Inc. (f) | | | 12 | | | | — | @ | |
Ventas, Inc. REIT | | | 647 | | | | 36 | | |
Verisk Analytics, Inc., Class A (f) | | | 1,688 | | | | 125 | | |
Veritiv Corp. (f) | | | 15 | | | | 1 | | |
Vertex Pharmaceuticals, Inc. (f) | | | 642 | | | | 67 | | |
VF Corp. | | | 2,412 | | | | 165 | | |
Viacom, Inc., Class B | | | 3,763 | | | | 162 | | |
Visa, Inc., Class A | | | 12,428 | | | | 866 | �� | |
Vornado Realty Trust REIT | | | 209 | | | | 19 | | |
Wal-Mart Stores, Inc. | | | 21,361 | | | | 1,385 | | |
Walgreens Boots Alliance, Inc. | | | 10,358 | | | | 861 | | |
Walt Disney Co. (The) | | | 10,374 | | | | 1,060 | | |
Waste Management, Inc. | | | 3,829 | | | | 191 | | |
Waters Corp. (f) | | | 221 | | | | 26 | | |
Weatherford International PLC (f) | | | 4,676 | | | | 40 | | |
WEC Energy Group, Inc. | | | 3,070 | | | | 160 | | |
Wells Fargo & Co. | | | 43,727 | | | | 2,245 | | |
Welltower, Inc. | | | 717 | | | | 49 | | |
Western Union Co. (The) | | | 5,969 | | | | 110 | | |
WestRock Co. | | | 180 | | | | 9 | | |
Weyerhaeuser Co. REIT | | | 2,179 | | | | 60 | | |
Whole Foods Market, Inc. | | | 4,346 | | | | 138 | | |
Williams Cos., Inc. (The) | | | 7,831 | | | | 289 | | |
Williams-Sonoma, Inc. | | | 800 | | | | 61 | | |
WP GLIMCHER, Inc. REIT | | | 2,364 | | | | 28 | | |
The accompanying notes are an integral part of the financial statements.
23
Morgan Stanley Institutional Fund Trust
Annual Report — September 30, 2015
Portfolio of Investments (cont'd)
Global Strategist Portfolio
| | | Shares | | Value
(000) | |
United States (cont'd) | |
WPX Energy, Inc. (f) | | | 3,705 | | | $ | 25 | | |
WW Grainger, Inc. | | | 688 | | | | 148 | | |
Wyndham Worldwide Corp. | | | 208 | | | | 15 | | |
Wynn Resorts Ltd. | | | 740 | | | | 39 | | |
Xcel Energy, Inc. | | | 4,316 | | | | 153 | | |
Xerox Corp. | | | 5,856 | | | | 57 | | |
Xilinx, Inc. | | | 1,708 | | | | 72 | | |
Xylem, Inc. | | | 1,738 | | | | 57 | | |
Yahoo!, Inc. (f) | | | 6,499 | | | | 188 | | |
Yum! Brands, Inc. | | | 3,489 | | | | 279 | | |
Zimmer Biomet Holdings, Inc. | | | 1,737 | | | | 163 | | |
Zions Bancorporation | | | 222 | | | | 6 | | |
Zoetis, Inc. | | | 9,664 | | | | 398 | | |
| | | | 106,476 | | |
Total Common Stocks (Cost $215,659) | | | 241,288 | | |
Investment Companies (0.1%) | |
United States (0.1%) | |
iShares MSCI Emerging Markets Index Fund | | | 8,000 | | | | 262 | | |
Morgan Stanley Institutional Fund, Inc. —
Emerging Markets Portfolio (See Note G) | | | 4,916 | | | | 98 | | |
Total Investment Companies (Cost $500) | | | 360 | | |
| | | No. of
Rights | | | |
Rights (0.0%) | |
United States (0.0%) | |
Safeway Casa Ley CVR (f) | | | 577 | | | | 1 | | |
Safeway PDC, LLC CVR (f) | | | 577 | | | | — | @ | |
Total Rights (Cost $1) | | | 1 | | |
| | | No. of
Warrants | | | |
Warrant (0.0%) | |
France (0.0%) | |
Peugeot SA, expires 4/29/17 (f)
(Cost $1) | | | 1,221 | | | | 3 | | |
| | | Shares | | | |
Short-Term Investments (9.5%) | |
Investment Company (7.7%) | |
Morgan Stanley Institutional Liquidity
Funds — Money Market Portfolio —
Institutional Class (See Note G)
(Cost $30,788) | | | 30,787,666 | | | | 30,788 | | |
| | | Face
Amount
(000) | | | |
U.S. Treasury Security (1.8%) | |
U.S. Treasury Bill, | |
| 0.26%, 3/10/16 (j)(k) (Cost $7,087) | | $ | 7,095 | | | | 7,094 | | |
Total Short-Term Investments (Cost $37,875) | | | 37,882 | | |
Total Investments (99.6%) (Cost $371,983) (l)(m)(n) | | | 395,661 | | |
Other Assets in Excess of Liabilities (0.4%) | | | 1,623 | | |
Net Assets (100.0%) | | $ | 397,284 | | |
(a) Security is subject to delayed delivery.
(b) Variable/Floating Rate Security — Interest rate changes on these instruments are based on changes in a designated base rate. The rates shown are those in effect on September 30, 2015.
(c) 144A security — Certain conditions for public sale may exist. Unless otherwise noted, these securities are deemed to be liquid.
(d) Perpetual — One or more securities do not have a predetermined maturity date. Rates for these securities are fixed for a period of time, after which they revert to a floating rate. Interest rates in effect are as of September 30, 2015.
(e) Multi-step — Coupon rate changes in predetermined increments to maturity. Rate disclosed is as of September 30, 2015. Maturity date disclosed is the ultimate maturity date.
(f) Non-income producing security.
(g) Security trades on the Hong Kong exchange.
(h) At September 30, 2015, the Portfolio held a fair valued security valued at approximately $6,000, representing less than 0.05% of net assets. This security has been fair valued as determined in good faith under procedures established by and under the general supervision of the Fund's Trustees.
(i) Security has been deemed illiquid at September 30, 2015.
(j) Rate shown is the yield to maturity at September 30, 2015.
(k) All or a portion of the security was pledged to cover margin requirements for swap agreements.
(l) Securities are available for collateral in connection with securities purchased on a forward commitment basis, open foreign currency forward exchange contracts, futures contracts and swap agreements.
(m) The approximate fair value and percentage of net assets, $124,809,000 and 31.4%, respectively, represent the securities that have been fair valued under the fair valuation policy for international investments as described in Note A-1 within the Notes to the Financial Statements.
(n) At September 30, 2015, the aggregate cost for Federal income tax purposes is approximately $381,055,000. The aggregate gross unrealized appreciation is approximately $43,627,000 and the aggregate gross unrealized depreciation is approximately $29,021,000 resulting in net unrealized appreciation of approximately $14,606,000.
@ Value is less than $500.
ADR American Depositary Receipt.
CVA Certificaten Van Aandelen.
IO Interest Only.
MTN Medium Term Note.
OAT Obligations Assimilables du Trésor (French Treasury Obligation).
REIT Real Estate Investment Trust.
REMIC Real Estate Mortgage Investment Conduit.
SDR Swedish Depositary Receipt.
TBA To Be Announced.
The accompanying notes are an integral part of the financial statements.
24
Morgan Stanley Institutional Fund Trust
Annual Report — September 30, 2015
Portfolio of Investments (cont'd)
Global Strategist Portfolio
Foreign Currency Forward Exchange Contracts:
The Portfolio had the following foreign currency forward exchange contracts open at September 30, 2015:
Counterparty | | Currency to
Deliver
(000) | | Value
(000) | | Settlement
Date | | In Exchange
For
(000) | | Value
(000) | | Unrealized
Appreciation
(Depreciation)
(000) | |
Citibank NA | | NOK | 3,350 | | | $ | 394 | | | 10/5/15 | | USD | 403 | | | $ | 403 | | | $ | 9 | | |
Citibank NA | | USD | 5,549 | | | | 5,549 | | | 10/5/15 | | EUR | 4,928 | | | | 5,506 | | | | (43 | ) | |
Deutsche Bank AG | | EUR | 665 | | | | 743 | | | 10/5/15 | | CHF | 720 | | | | 739 | | | | (4 | ) | |
Deutsche Bank AG | | EUR | 612 | | | | 683 | | | 10/5/15 | | PLN | 2,600 | | | | 684 | | | | 1 | | |
Deutsche Bank AG | | EUR | 754 | | | | 842 | | | 10/5/15 | | USD | 838 | | | | 838 | | | | (4 | ) | |
Deutsche Bank AG | | GBP | 415 | | | | 628 | | | 10/5/15 | | EUR | 564 | | | | 630 | | | | 2 | | |
Deutsche Bank AG | | MXN | 18,220 | | | | 1,077 | | | 10/5/15 | | USD | 1,077 | | | | 1,077 | | | | (— | @) | |
Deutsche Bank AG | | PLN | 3,157 | | | | 831 | | | 10/5/15 | | USD | 838 | | | | 838 | | | | 7 | | |
Deutsche Bank AG | | USD | 223 | | | | 223 | | | 10/5/15 | | CHF | 214 | | | | 220 | | | | (3 | ) | |
Deutsche Bank AG | | USD | 1,029 | | | | 1,029 | | | 10/5/15 | | GBP | 672 | | | | 1,016 | | | | (13 | ) | |
Deutsche Bank AG | | USD | 84 | | | | 84 | | | 10/5/15 | | GBP | 55 | | | | 84 | | | | (— | @) | |
HSBC Bank PLC | | GBP | 320 | | | | 484 | | | 10/5/15 | | USD | 489 | | | | 489 | | | | 5 | | |
HSBC Bank PLC | | NZD | 6,131 | | | | 3,919 | | | 10/5/15 | | USD | 3,877 | | | | 3,877 | | | | (42 | ) | |
HSBC Bank PLC | | NZD | 580 | | | | 371 | | | 10/5/15 | | USD | 365 | | | | 365 | | | | (6 | ) | |
JPMorgan Chase Bank NA | | CAD | 979 | | | | 734 | | | 10/5/15 | | USD | 733 | | | | 733 | | | | (1 | ) | |
JPMorgan Chase Bank NA | | GBP | 80 | | | | 122 | | | 10/5/15 | | EUR | 109 | | | | 122 | | | | — | @ | |
JPMorgan Chase Bank NA | | KRW | 1,658,797 | | | | 1,399 | | | 10/5/15 | | USD | 1,398 | | | | 1,398 | | | | (1 | ) | |
JPMorgan Chase Bank NA | | NZD | 717 | | | | 458 | | | 10/5/15 | | USD | 452 | | | | 452 | | | | (6 | ) | |
JPMorgan Chase Bank NA | | SEK | 2,850 | | | | 341 | | | 10/5/15 | | EUR | 299 | | | | 334 | | | | (7 | ) | |
JPMorgan Chase Bank NA | | USD | 23 | | | | 23 | | | 10/5/15 | | EUR | 21 | | | | 23 | | | | (— | @) | |
JPMorgan Chase Bank NA | | USD | 16 | | | | 16 | | | 10/5/15 | | EUR | 14 | | | | 16 | | | | — | @ | |
JPMorgan Chase Bank NA | | USD | 15 | | | | 15 | | | 10/5/15 | | JPY | 1,844 | | | | 15 | | | | (— | @) | |
JPMorgan Chase Bank NA | | USD | 610 | | | | 610 | | | 10/5/15 | | NOK | 5,232 | | | | 615 | | | | 5 | | |
JPMorgan Chase Bank NA | | USD | 320 | | | | 320 | | | 10/5/15 | | SEK | 2,712 | | | | 324 | | | | 4 | | |
JPMorgan Chase Bank NA | | ZAR | 174 | | | | 13 | | | 10/5/15 | | USD | 13 | | | | 13 | | | | — | @ | |
UBS AG | | CAD | 1,915 | | | | 1,435 | | | 10/5/15 | | USD | 1,458 | | | | 1,458 | | | | 23 | | |
UBS AG | | CHF | 214 | | | | 220 | | | 10/5/15 | | USD | 220 | | | | 220 | | | | (— | @) | |
UBS AG | | JPY | 34,583 | | | | 289 | | | 10/5/15 | | USD | 289 | | | | 289 | | | | — | @ | |
UBS AG | | USD | 7 | | | | 7 | | | 10/5/15 | | EUR | 6 | | | | 7 | | | | (— | @) | |
UBS AG | | USD | 28 | | | | 28 | | | 10/5/15 | | EUR | 25 | | | | 28 | | | | (— | @) | |
UBS AG | | USD | 41 | | | | 41 | | | 10/5/15 | | EUR | 36 | | | | 41 | | | | (— | @) | |
UBS AG | | USD | 10,598 | | | | 10,598 | | | 10/5/15 | | JPY | 1,269,339 | | | | 10,581 | | | | (17 | ) | |
UBS AG | | USD | 1,401 | | | | 1,401 | | | 10/5/15 | | KRW | 1,658,797 | | | | 1,399 | | | | (2 | ) | |
UBS AG | | USD | 997 | | | | 997 | | | 10/5/15 | | MXN | 16,941 | | | | 1,002 | | | | 5 | | |
UBS AG | | USD | 1,952 | | | | 1,952 | | | 10/5/15 | | NZD | 3,099 | | | | 1,981 | | | | 29 | | |
UBS AG | | USD | 13 | | | | 13 | | | 10/5/15 | | ZAR | 174 | | | | 13 | | | | (— | @) | |
UBS AG | | ZAR | 20,031 | | | | 1,445 | | | 10/5/15 | | USD | 1,486 | | | | 1,486 | | | | 41 | | |
Westpac Banking Corp. | | USD | 609 | | | | 609 | | | 10/5/15 | | EUR | 540 | | | | 604 | | | | (5 | ) | |
JPMorgan Chase Bank NA | | AUD | 1,121 | | | | 787 | | | 10/6/15 | | USD | 790 | | | | 790 | | | | 3 | | |
JPMorgan Chase Bank NA | | USD | 743 | | | | 743 | | | 10/6/15 | | AUD | 1,059 | | | | 743 | | | | (— | @) | |
Bank of America NA | | EUR | 2,567 | | | | 2,869 | | | 10/15/15 | | USD | 2,902 | | | | 2,902 | | | | 33 | | |
Bank of America NA | | EUR | 1,606 | | | | 1,795 | | | 10/15/15 | | USD | 1,797 | | | | 1,797 | | | | 2 | | |
Bank of America NA | | JPY | 171,352 | | | | 1,429 | | | 10/15/15 | | USD | 1,431 | | | | 1,431 | | | | 2 | | |
Bank of America NA | | PLN | 71 | | | | 19 | | | 10/15/15 | | USD | 19 | | | | 19 | | | | — | @ | |
Bank of America NA | | USD | 3,134 | | | | 3,134 | | | 10/15/15 | | JPY | 373,773 | | | | 3,116 | | | | (18 | ) | |
Bank of Montreal | | AUD | 4,848 | | | | 3,400 | | | 10/15/15 | | USD | 3,431 | | | | 3,431 | | | | 31 | | |
Bank of Montreal | | NZD | 7,879 | | | | 5,033 | | | 10/15/15 | | USD | 4,953 | | | | 4,953 | | | | (80 | ) | |
Bank of Montreal | | USD | 2,897 | | | | 2,897 | | | 10/15/15 | | AUD | 4,136 | | | | 2,901 | | | | 4 | | |
Bank of Montreal | | USD | 665 | | | | 665 | | | 10/15/15 | | CAD | 882 | | | | 661 | | | | (4 | ) | |
Bank of Montreal | | USD | 1,041 | | | | 1,041 | | | 10/15/15 | | EUR | 916 | | | | 1,024 | | | | (17 | ) | |
Bank of Montreal | | USD | 77 | | | | 77 | | | 10/15/15 | | ILS | 299 | | | | 76 | | | | (1 | ) | |
Bank of Montreal | | USD | 2,907 | | | | 2,907 | | | 10/15/15 | | NZD | 4,575 | | | | 2,922 | | | | 15 | | |
Bank of Montreal | | USD | 586 | | | | 586 | | | 10/15/15 | | NZD | 918 | | | | 586 | | | | (— | @) | |
Bank of Montreal | | USD | 29 | | | | 29 | | | 10/15/15 | | TRY | 88 | | | | 29 | | | | — | @ | |
Bank of New York Mellon | | CHF | 3,909 | | | | 4,013 | | | 10/15/15 | | USD | 4,020 | | | | 4,020 | | | | 7 | | |
Bank of New York Mellon | | USD | 3,745 | | | | 3,745 | | | 10/15/15 | | SEK | 31,031 | | | | 3,709 | | | | (36 | ) | |
Barclays Bank PLC | | AUD | 2,133 | | | | 1,496 | | | 10/15/15 | | USD | 1,510 | | | | 1,510 | | | | 14 | | |
Barclays Bank PLC | | CLP | 85,916 | | | | 123 | | | 10/15/15 | | USD | 124 | | | | 124 | | | | 1 | | |
The accompanying notes are an integral part of the financial statements.
25
Morgan Stanley Institutional Fund Trust
Annual Report — September 30, 2015
Portfolio of Investments (cont'd)
Global Strategist Portfolio
Foreign Currency Forward Exchange Contracts: (cont'd)
Counterparty | | Currency to
Deliver
(000) | | Value
(000) | | Settlement
Date | | In Exchange
For
(000) | | Value
(000) | | Unrealized
Appreciation
(Depreciation)
(000) | |
Barclays Bank PLC | | EUR | 257 | | | $ | 287 | | | 10/15/15 | | USD | 290 | | | $ | 290 | | | $ | 3 | | |
Barclays Bank PLC | | USD | 236 | | | | 236 | | | 10/15/15 | | BRL | 921 | | | | 231 | | | | (5 | ) | |
Barclays Bank PLC | | USD | 523 | | | | 523 | | | 10/15/15 | | BRL | 2,094 | | | | 526 | | | | 3 | | |
Barclays Bank PLC | | USD | 8 | | | | 8 | | | 10/15/15 | | SGD | 12 | | | | 8 | | | | (— | @) | |
Citibank NA | | EUR | 1,729 | | | | 1,932 | | | 10/15/15 | | USD | 1,950 | | | | 1,950 | | | | 18 | | |
Citibank NA | | EUR | 1,130 | | | | 1,263 | | | 10/15/15 | | USD | 1,271 | | | | 1,271 | | | | 8 | | |
Citibank NA | | GBP | 1,884 | | | | 2,849 | | | 10/15/15 | | USD | 2,919 | | | | 2,919 | | | | 70 | | |
Citibank NA | | GBP | 400 | | | | 605 | | | 10/15/15 | | USD | 614 | | | | 614 | | | | 9 | | |
Citibank NA | | GBP | 515 | | | | 779 | | | 10/15/15 | | USD | 780 | | | | 780 | | | | 1 | | |
Citibank NA | | THB | 143,760 | | | | 3,959 | | | 10/15/15 | | USD | 3,973 | | | | 3,973 | | | | 14 | | |
Citibank NA | | USD | 715 | | | | 715 | | | 10/15/15 | | KRW | 848,137 | | | | 715 | | | | — | @ | |
Citibank NA | | USD | 545 | | | | 545 | | | 10/15/15 | | RUB | 35,875 | | | | 547 | | | | 2 | | |
Citibank NA | | USD | 297 | | | | 297 | | | 10/15/15 | | RUB | 20,309 | | | | 310 | | | | 13 | | |
Citibank NA | | USD | 730 | | | | 730 | | | 10/15/15 | | THB | 26,119 | | | | 720 | | | | (10 | ) | |
Citibank NA | | USD | 2,174 | | | | 2,174 | | | 10/15/15 | | THB | 78,351 | | | | 2,158 | | | | (16 | ) | |
Commonwealth Bank of Australia | | AUD | 11,170 | | | | 7,834 | | | 10/15/15 | | USD | 7,907 | | | | 7,907 | | | | 73 | | |
Commonwealth Bank of Australia | | USD | 1,310 | | | | 1,310 | | | 10/15/15 | | AUD | 1,834 | | | | 1,287 | | | | (23 | ) | |
Commonwealth Bank of Australia | | USD | 4,658 | | | | 4,658 | | | 10/15/15 | | AUD | 6,504 | | | | 4,561 | | | | (97 | ) | |
Credit Suisse International | | CHF | 1,138 | | | | 1,168 | | | 10/15/15 | | USD | 1,170 | | | | 1,170 | | | | 2 | | |
Credit Suisse International | | NZD | 5,374 | | | | 3,432 | | | 10/15/15 | | USD | 3,378 | | | | 3,378 | | | | (54 | ) | |
Credit Suisse International | | USD | 6,271 | | | | 6,271 | | | 10/15/15 | | EUR | 5,491 | | | | 6,137 | | | | (134 | ) | |
Credit Suisse International | | USD | 671 | | | | 671 | | | 10/15/15 | | ILS | 2,604 | | | | 664 | | | | (7 | ) | |
Credit Suisse International | | USD | 2,942 | | | | 2,942 | | | 10/15/15 | | NZD | 4,634 | | | | 2,959 | | | | 17 | | |
Deutsche Bank AG | | CHF | 9,357 | | | | 9,605 | | | 10/15/15 | | USD | 9,621 | | | | 9,621 | | | | 16 | | |
Deutsche Bank AG | | HKD | 9,440 | | | | 1,218 | | | 10/15/15 | | USD | 1,218 | | | | 1,218 | | | | (— | @) | |
Deutsche Bank AG | | HUF | 9,057 | | | | 33 | | | 10/15/15 | | USD | 33 | | | | 33 | | | | — | @ | |
Deutsche Bank AG | | NOK | 3,381 | | | | 397 | | | 10/15/15 | | USD | 412 | | | | 412 | | | | 15 | | |
Deutsche Bank AG | | PLN | 1,384 | | | | 364 | | | 10/15/15 | | USD | 372 | | | | 372 | | | | 8 | | |
Deutsche Bank AG | | USD | 7,501 | | | | 7,501 | | | 10/15/15 | | SEK | 62,154 | | | | 7,428 | | | | (73 | ) | |
Goldman Sachs International | | EUR | 3,927 | | | | 4,389 | | | 10/15/15 | | USD | 4,430 | | | | 4,430 | | | | 41 | | |
Goldman Sachs International | | GBP | 1,175 | | | | 1,778 | | | 10/15/15 | | USD | 1,781 | | | | 1,781 | | | | 3 | | |
Goldman Sachs International | | JPY | 444,993 | | | | 3,709 | | | 10/15/15 | | USD | 3,704 | | | | 3,704 | | | | (5 | ) | |
Goldman Sachs International | | USD | 3,127 | | | | 3,127 | | | 10/15/15 | | GBP | 1,999 | | | | 3,023 | | | | (104 | ) | |
JPMorgan Chase Bank NA | | EUR | 2,112 | | | | 2,360 | | | 10/15/15 | | USD | 2,382 | | | | 2,382 | | | | 22 | | |
JPMorgan Chase Bank NA | | GBP | 397 | | | | 600 | | | 10/15/15 | | USD | 616 | | | | 616 | | | | 16 | | |
JPMorgan Chase Bank NA | | INR | 83,530 | | | | 1,271 | | | 10/15/15 | | USD | 1,252 | | | | 1,252 | | | | (19 | ) | |
JPMorgan Chase Bank NA | | KRW | 6,807,952 | | | | 5,741 | | | 10/15/15 | | USD | 5,733 | | | | 5,733 | | | | (8 | ) | |
JPMorgan Chase Bank NA | | USD | 885 | | | | 885 | | | 10/15/15 | | EUR | 782 | | | | 874 | | | | (11 | ) | |
JPMorgan Chase Bank NA | | USD | 1,336 | | | | 1,336 | | | 10/15/15 | | INR | 89,482 | | | | 1,361 | | | | 25 | | |
JPMorgan Chase Bank NA | | USD | 1,342 | | | | 1,342 | | | 10/15/15 | | KRW | 1,577,489 | | | | 1,330 | | | | (12 | ) | |
JPMorgan Chase Bank NA | | USD | 1,592 | | | | 1,592 | | | 10/15/15 | | KRW | 1,851,834 | | | | 1,562 | | | | (30 | ) | |
JPMorgan Chase Bank NA | | USD | 1,432 | | | | 1,432 | | | 10/15/15 | | KRW | 1,705,377 | | | | 1,438 | | | | 6 | | |
Northern Trust Company | | USD | 458 | | | | 458 | | | 10/15/15 | | SGD | 644 | | | | 452 | | | | (6 | ) | |
State Street Bank and Trust Co. | | CHF | 4,195 | | | | 4,306 | | | 10/15/15 | | USD | 4,329 | | | | 4,329 | | | | 23 | | |
State Street Bank and Trust Co. | | CHF | 1,747 | | | | 1,793 | | | 10/15/15 | | USD | 1,829 | | | | 1,829 | | | | 36 | | |
State Street Bank and Trust Co. | | JPY | 269,609 | | | | 2,247 | | | 10/15/15 | | USD | 2,244 | | | | 2,244 | | | | (3 | ) | |
State Street Bank and Trust Co. | | THB | 63,737 | | | | 1,755 | | | 10/15/15 | | USD | 1,762 | | | | 1,762 | | | | 7 | | |
State Street Bank and Trust Co. | | USD | 429 | | | | 429 | | | 10/15/15 | | DKK | 2,839 | | | | 425 | | | | (4 | ) | |
State Street Bank and Trust Co. | | USD | 4,339 | | | | 4,339 | | | 10/15/15 | | SEK | 35,734 | | | | 4,270 | | | | (69 | ) | |
State Street Bank and Trust Co. | | USD | 1,830 | | | | 1,830 | | | 10/15/15 | | SEK | 14,953 | | | | 1,787 | | | | (43 | ) | |
State Street Bank and Trust Co. | | USD | 1,430 | | | | 1,430 | | | 10/15/15 | | THB | 51,790 | | | | 1,426 | | | | (4 | ) | |
UBS AG | | CHF | 931 | | | | 955 | | | 10/15/15 | | USD | 958 | | | | 958 | | | | 3 | | |
UBS AG | | CHF | 568 | | | | 582 | | | 10/15/15 | | USD | 585 | | | | 585 | | | | 3 | | |
UBS AG | | CHF | 3,737 | | | | 3,836 | | | 10/15/15 | | USD | 3,843 | | | | 3,843 | | | | 7 | | |
UBS AG | | EUR | 3,334 | | | | 3,725 | | | 10/15/15 | | USD | 3,773 | | | | 3,773 | | | | 48 | | |
UBS AG | | EUR | 2,388 | | | | 2,668 | | | 10/15/15 | | USD | 2,693 | | | | 2,693 | | | | 25 | | |
UBS AG | | EUR | 1,329 | | | | 1,486 | | | 10/15/15 | | USD | 1,511 | | | | 1,511 | | | | 25 | | |
UBS AG | | EUR | 661 | | | | 738 | | | 10/15/15 | | USD | 737 | | | | 737 | | | | (1 | ) | |
UBS AG | | GBP | 179 | | | | 271 | | | 10/15/15 | | USD | 278 | | | | 278 | | | | 7 | | |
The accompanying notes are an integral part of the financial statements.
26
Morgan Stanley Institutional Fund Trust
Annual Report — September 30, 2015
Portfolio of Investments (cont'd)
Global Strategist Portfolio
Foreign Currency Forward Exchange Contracts: (cont'd)
Counterparty | | Currency to
Deliver
(000) | | Value
(000) | | Settlement
Date | | In Exchange
For
(000) | | Value
(000) | | Unrealized
Appreciation
(Depreciation)
(000) | |
UBS AG | | GBP | 789 | | | $ | 1,194 | | | 10/15/15 | | USD | 1,212 | | | $ | 1,212 | | | $ | 18 | | |
UBS AG | | GBP | 45 | | | | 67 | | | 10/15/15 | | USD | 69 | | | | 69 | | | | 2 | | |
UBS AG | | IDR | 3,984,135 | | | | 271 | | | 10/15/15 | | USD | 275 | | | | 275 | | | | 4 | | |
UBS AG | | MXN | 506 | | | | 30 | | | 10/15/15 | | USD | 30 | | | | 30 | | | | — | @ | |
UBS AG | | TWD | 4,342 | | | | 132 | | | 10/15/15 | | USD | 134 | | | | 134 | | | | 2 | | |
UBS AG | | USD | 937 | | | | 937 | | | 10/15/15 | | SGD | 1,316 | | | | 924 | | | | (13 | ) | |
UBS AG | | USD | 485 | | | | 485 | | | 10/15/15 | | TWD | 16,027 | | | | 487 | | | | 2 | | |
UBS AG | | USD | 84 | | | | 84 | | | 10/15/15 | | ZAR | 1,132 | | | | 82 | | | | (2 | ) | |
JPMorgan Chase Bank NA | | USD | 1,396 | | | | 1,396 | | | 11/4/15 | | KRW | 1,658,797 | | | | 1,398 | | | | 2 | | |
UBS AG | | USD | 220 | | | | 220 | | | 11/4/15 | | CHF | 214 | | | | 220 | | | | — | @ | |
Citibank NA | | CNY | 8,584 | | | | 1,333 | | | 5/19/16 | | USD | 1,376 | | | | 1,376 | | | | 43 | | |
Citibank NA | | CNY | 25,146 | | | | 3,903 | | | 5/19/16 | | USD | 4,029 | | | | 4,029 | | | | 126 | | |
Citibank NA | | USD | 459 | | | | 459 | | | 5/19/16 | | CNY | 2,981 | | | | 462 | | | | 3 | | |
Deutsche Bank AG | | CNY | 16,764 | | | | 2,601 | | | 5/19/16 | | USD | 2,686 | | | | 2,686 | | | | 85 | | |
| | | | | $ | 216,559 | | | | | | | $ | 216,595 | | | $ | 36 | | |
Futures Contracts:
The Portfolio had the following futures contracts open at September 30, 2015:
| | | Number
of
Contracts | | Value
(000) | | Expiration
Date | | Unrealized
Appreciation
(Depreciation)
(000) | |
Long: | |
Amsterdam Index (Netherlands) | | | 3 | | | $ | 282 | | | Oct-15 | | $ | (10 | ) | |
Australian 10 yr. Bond (Australia) | | | 8 | | | | 727 | | | Dec-15 | | | 5 | | |
CAC 40 Index (France) | | | 7 | | | | 348 | | | Oct-15 | | | (4 | ) | |
Euro Stoxx 50 Index (Germany) | | | 456 | | | | 15,750 | | | Dec-15 | | | (80 | ) | |
Gold Futures (United States) | | | 44 | | | | 4,907 | | | Dec-15 | | | (108 | ) | |
MSCI Emerging Market E Mini (United States) | | | 282 | | | | 11,155 | | | Dec-15 | | | (293 | ) | |
MSCI Singapore Free Index (Singapore) | | | 36 | | | | 1,581 | | | Oct-15 | | | (19 | ) | |
NIKKEI 225 (United States) | | | 24 | | | | 1,750 | | | Dec-15 | | | 8 | | |
OMXS 30 (Sweden) | | | 19 | | | | 321 | | | Oct-15 | | | (11 | ) | |
S&P 500 E MINI Index (United States) | | | 188 | | | | 17,942 | | | Dec-15 | | | (76 | ) | |
U.S. Dollar Index (United States) | | | 75 | | | | 7,236 | | | Dec-15 | | | 63 | | |
U.S. Treasury 5 yr. Note (United States) | | | 80 | | | | 9,641 | | | Dec-15 | | | 56 | | |
U.S. Treasury Ultra Long Bond (United States) | | | 87 | | | | 13,955 | | | Dec-15 | | | (218 | ) | |
Short: | |
Copper Futures (United States) | | | 20 | | | | (1,170 | ) | | Dec-15 | | | (47 | ) | |
FTSE 100 Index (United Kingdom) | | | 80 | | | | (7,284 | ) | | Dec-15 | | | 198 | | |
German Euro Bund (Germany) | | | 12 | | | | (2,094 | ) | | Dec-15 | | | (30 | ) | |
Hang Seng Index (Hong Kong) | | | 3 | | | | (402 | ) | | Oct-15 | | | 9 | | |
IBEX 35 Index (Spain) | | | 40 | | | | (4,264 | ) | | Oct-15 | | | 76 | | |
S&P TSX 60 Index (Canada) | | | 3 | | | | (351 | ) | | Dec-15 | | | (— | @) | |
SPI 200 Index (Australia) | | | 5 | | | | (439 | ) | | Dec-15 | | | 6 | | |
TOPIX Index (Japan) | | | 30 | | | | (3,530 | ) | | Dec-15 | | | 157 | | |
U.S. Treasury 10 yr. Note (United States) | | | 347 | | | | (44,671 | ) | | Dec-15 | | | (224 | ) | |
U.S. Treasury Long Bond (United States) | | | 11 | | | | (1,731 | ) | | Dec-15 | | | (40 | ) | |
U.S. Treasury Ultra Long Bond (United States) | | | 17 | | | | (2,727 | ) | | Dec-15 | | | (42 | ) | |
UK Long Gilt Bond (United Kingdom) | | | 11 | | | | (1,981 | ) | | Dec-15 | | | (36 | ) | |
| | | | | | | | | $ | (660 | ) | |
The accompanying notes are an integral part of the financial statements.
27
Morgan Stanley Institutional Fund Trust
Annual Report — September 30, 2015
Portfolio of Investments (cont'd)
Global Strategist Portfolio
Credit Default Swap Agreements:
The Portfolio had the following credit default swap agreements open at September 30, 2015:
Swap Counterparty and
Reference Obligation | | Buy/Sell
Protection | | Notional
Amount
(000) | | Pay/Receive
Fixed Rate | | Termination
Date | | Upfront
Payment
Paid
(Received)
(000) | | Unrealized
Appreciation
(Depreciation)
(000) | | Value
(000) | | Credit
Rating of
Reference
Obligation†
(Unaudited) | |
Barclays Bank PLC
Russian Federation | | Sell | | $ | 3,582 | | | | 1.00 | % | | 12/20/20 | | $ | (442 | ) | | $ | 38 | | | $ | (404 | ) | | BBB- | |
Goldman Sachs International
People's Republic of China | | Buy | | | 6,859 | | | | 1.00 | | | 12/20/20 | | | 87 | | | | (1 | ) | | | 86 | | | AA- | |
Goldman Sachs International
Australian Government | | Buy | | | 6,150 | | | | 1.00 | | | 12/20/20 | | | (163 | ) | | | 23 | | | | (140 | ) | | AAA | |
| | | | | $ | 16,591 | | | | | | | $ | (518 | ) | | $ | 60 | | | $ | (458 | ) | | | |
Interest Rate Swap Agreements:
The Portfolio had the following interest rate swap agreements open at September 30, 2015:
Swap Counterparty | | Floating Rate
Index | | Pay/Receive
Floating Rate | | Fixed Rate | | Termination
Date | | Notional
Amount
(000) | | Unrealized
Appreciation
(Depreciation)
(000) | |
Bank of America NA | | 1 Month TIIE | | Receive | | | 4.32 | % | | 7/27/17 | | MXN | 11,810 | | | $ | (1 | ) | |
Bank of America NA | | 1 Month TIIE | | Receive | | | 4.33 | | | 7/27/17 | | | 11,969 | | | | (1 | ) | |
Bank of America NA | | 1 Month TIIE | | Receive | | | 4.39 | | | 7/28/17 | | | 24,612 | | | | (3 | ) | |
Bank of America NA | | 1 Month TIIE | | Pay | | | 6.30 | | | 7/17/25 | | | 2,600 | | | | (1 | ) | |
Bank of America NA | | 1 Month TIIE | | Pay | | | 6.32 | | | 7/17/25 | | | 2,779 | | | | (1 | ) | |
Bank of America NA | | 1 Month TIIE | | Pay | | | 6.32 | | | 7/18/25 | | | 6,042 | | | | (1 | ) | |
Barclays Bank PLC | | 1 Month TIIE | | Receive | | | 4.28 | | | 7/26/17 | | | 36,177 | | | | (1 | ) | |
Barclays Bank PLC | | 1 Month TIIE | | Receive | | | 4.30 | | | 7/26/17 | | | 36,177 | | | | (1 | ) | |
Barclays Bank PLC | | 1 Month TIIE | | Receive | | | 4.33 | | | 7/26/17 | | | 24,815 | | | | (2 | ) | |
Barclays Bank PLC | | 1 Month TIIE | | Receive | | | 4.34 | | | 7/27/17 | | | 36,657 | | | | (3 | ) | |
Barclays Bank PLC | | 1 Month TIIE | | Receive | | | 4.36 | | | 7/27/17 | | | 34,293 | | | | (3 | ) | |
Barclays Bank PLC | | 1 Month TIIE | | Pay | | | 6.34 | | | 7/16/25 | | | 8,888 | | | | (1 | ) | |
Barclays Bank PLC | | 1 Month TIIE | | Pay | | | 6.35 | | | 7/16/25 | | | 8,888 | | | | (1 | ) | |
Barclays Bank PLC | | 1 Month TIIE | | Pay | | | 6.36 | | | 7/16/25 | | | 5,683 | | | | (— | @) | |
Barclays Bank PLC | | 1 Month TIIE | | Pay | | | 6.32 | | | 7/17/25 | | | 8,352 | | | | (2 | ) | |
Barclays Bank PLC | | 1 Month TIIE | | Pay | | | 6.34 | | | 7/17/25 | | | 7,996 | | | | (1 | ) | |
Citibank NA | | 1 Month TIIE | | Receive | | | 4.29 | | | 7/25/17 | | | 7,697 | | | | (— | @) | |
Citibank NA | | 1 Month TIIE | | Receive | | | 4.30 | | | 7/26/17 | | | 16,177 | | | | (1 | ) | |
Citibank NA | | 1 Month TIIE | | Receive | | | 4.38 | | | 7/28/17 | | | 7,014 | | | | (1 | ) | |
Citibank NA | | 1 Month TIIE | | Pay | | | 6.36 | | | 7/15/25 | | | 11,480 | | | | (— | @) | |
Citibank NA | | 1 Month TIIE | | Pay | | | 6.34 | | | 7/16/25 | | | 4,325 | | | | (— | @) | |
Citibank NA | | 1 Month TIIE | | Pay | | | 6.33 | | | 7/18/25 | | | 2,695 | | | | (— | @) | |
Deutsche Bank AG | | 1 Month TIIE | | Receive | | | 4.38 | | | 7/28/17 | | | 36,197 | | | | (4 | ) | |
Deutsche Bank AG | | 1 Month TIIE | | Pay | | | 6.33 | | | 7/18/25 | | | 8,297 | | | | (1 | ) | |
Goldman Sachs International | | 1 Month TIIE | | Receive | | | 4.29 | | | 7/26/17 | | | 36,215 | | | | (1 | ) | |
Goldman Sachs International | | 1 Month TIIE | | Receive | | | 4.38 | | | 7/28/17 | | | 36,112 | | | | (4 | ) | |
Goldman Sachs International | | 1 Month TIIE | | Pay | | | 6.33 | | | 7/16/25 | | | 8,897 | | | | (1 | ) | |
Goldman Sachs International | | 1 Month TIIE | | Pay | | | 6.32 | | | 7/18/25 | | | 8,280 | | | | (2 | ) | |
JPMorgan Chase Bank NA | | 1 Month TIIE | | Pay | | | 6.33 | | | 7/17/25 | | | 1,800 | | | | (— | @) | |
Morgan Stanley & Co., LLC* | | 3 Month LIBOR | | Receive | | | 1.71 | | | 3/19/20 | | $ | 7,400 | | | | (135 | ) | |
Morgan Stanley & Co., LLC* | | 3 Month LIBOR | | Receive | | | 2.45 | | | 7/17/25 | | | 3,400 | | | | (152 | ) | |
UBS AG | | 3 Month LIBOR | | Receive | | | 4.31 | | | 7/25/17 | | MXN | 47,900 | | | | (2 | ) | |
UBS AG | | 1 Month TIIE | | Receive | | | 4.30 | | | 7/26/17 | | | 23,744 | | | | (1 | ) | |
UBS AG | | 1 Month TIIE | | Receive | | | 4.33 | | | 7/27/17 | | | 36,841 | | | | (2 | ) | |
UBS AG | | 1 Month TIIE | | Pay | | | 6.37 | | | 7/15/25 | | | 11,761 | | | | 1 | | |
UBS AG | | 1 Month TIIE | | Pay | | | 6.34 | | | 7/16/25 | | | 5,868 | | | | (— | @) | |
UBS AG | | 1 Month TIIE | | Pay | | | 6.33 | | | 7/17/25 | | | 8,385 | | | | (1 | ) | |
UBS AG | | 1 Month TIIE | | Pay | | | 6.35 | | | 7/18/25 | | | 8,300 | | | | (1 | ) | |
Union Bank of Switzerland | | 1 Month TIIE | | Receive | | | 4.40 | | | 7/28/17 | | | 36,217 | | | | (5 | ) | |
| | | | | | | | | | | | | $ | (336 | ) | |
The accompanying notes are an integral part of the financial statements.
28
Morgan Stanley Institutional Fund Trust
Annual Report — September 30, 2015
Portfolio of Investments (cont'd)
Global Strategist Portfolio
Total Return Swap Agreements:
The Portfolio had the following total return swap agreements open at September 30, 2015:
Swap Counterparty | | Index | | Notional
Amount
(000) | | Floating
Rate | | Pay/Receive
Total Return
of Referenced
Index | | Maturity
Date | | Unrealized
Appreciation
(Depreciation)
(000) | |
Barclays Bank PLC
| | MSCI Emerging Market
Index | | $ | 21,555 | | | 3 Month USD LIBOR plus
0.30% | | Receive | | 2/29/16 | | $ | (659 | ) | |
Citibank NA
| | Citi Australia Bank
Custom Basket†† | | | 53 | | | 3 Month USD LIBOR minus
0.20% | | Pay | | 8/23/16 | | | (11 | ) | |
Citibank NA
| | Citi Australia Bank
Custom Basket†† | | | 1,295 | | | 3 Month USD LIBOR minus
0.20% | | Pay | | 8/23/16 | | | 158 | | |
Deutsche Bank AG
| | DB Global Machinery
Index†† | | | 1,613 | | | 3 Month USD LIBOR minus
0.35% | | Pay | | 11/10/15 | | | 243 | | |
Goldman Sachs
International | | GS Auto Components
Index†† | | | 501 | | | 3 Month USD LIBOR minus
0.25% | | Pay | | 12/12/15 | | | (8 | ) | |
Goldman Sachs
International | | GS Auto Components
Index†† | | | 1,386 | | | 3 Month USD LIBOR minus
0.25% | | Pay | | 12/17/15 | | | 5 | | |
JPMorgan Chase
Bank NA | | JPM U.S. Machinery
Index†† | | | 1,748 | | | 3 Month USD LIBOR minus
0.245% | | Pay | | 11/5/15 | | | 240 | | |
JPMorgan Chase
Bank NA | | JPMorgan U.S. Refineries
Custom Basket†† | | | 1,519 | | | 3 Month USD LIBOR minus
0.06% | | Pay | | 9/1/16 | | | (34 | ) | |
JPMorgan Chase
Bank NA | | JPM Aerospace Index†† | | | 4,776 | | | 3 Month USD LIBOR minus
0.26% | | Pay | | 9/8/16 | | | 115 | | |
JPMorgan Chase
Bank NA | | JPM Aerospace Index†† | | | 4,397 | | | 3 Month USD LIBOR minus
0.26% | | Pay | | 9/8/16 | | | (26 | ) | |
| | | | | | | | | | | | | $ | 23 | | |
†† See tables below for details of the equity basket holdings underlying the swap.
The following table represents the equity basket holdings underlying the total return swap with Citi Australia Bank Custom Basket as of September 30, 2015.
Security Description | | Index Weight | |
Citi Australia Bank Custom Basket | |
Australia & New Zealand Banking Group Ltd. | | | 19.80 | % | |
Bank of Queensland Ltd. | | | 1.14 | | |
Bendigo & Adelaide Bank Ltd. | | | 1.19 | | |
Commonwealth Bank of Australia | | | 32.65 | | |
National Australia Bank Ltd. | | | 20.72 | | |
Westpac Banking Corp. | | | 24.50 | | |
| | | | 100.00 | % | |
The following table represents the equity basket holdings underlying the total return swap with DB Global Machinery Index as of September 30, 2015.
Security Description | | Index Weight | |
DB Global Machinery Index | |
Alfa Laval AB | | | 2.85 | % | |
Atlas Copco AB | | | 8.34 | | |
Atlas Copco AB | | | 4.52 | | |
CNH Industrial N.V. | | | 3.32 | | |
Daewoo Shipbuilding & Marine Engineering | | | 0.39 | | |
Doosan Infracore Co., Ltd. | | | 0.43 | | |
GEA Group AG | | | 3.40 | | |
Hino Motors Ltd. | | | 1.31 | | |
Hitachi Construction Machinery Co., Ltd. | | | 0.72 | | |
Hiwin Technologies Corp. | | | 0.65 | | |
Hyundai Heavy Industries Co., Ltd. | | | 2.49 | | |
Hyundai Mipo Dockyard Co., Ltd. | | | 0.51 | | |
Security Description | | Index Weight | |
DB Global Machinery Index (cont'd) | |
IMI PLC | | | 2.27 | % | |
JTEKT Corp. | | | 1.48 | | |
Kawasaki Heavy Industries Ltd. | | | 2.39 | | |
Komatsu Ltd. | | | 6.70 | | |
Kone Oyj | | | 5.78 | | |
Kubota Corp. | | | 7.16 | | |
MAN SE | | | 1.87 | | |
Melrose Industries PLC | | | 2.38 | | |
Metso Oyj | | | 1.44 | | |
NGK Insulators Ltd. | | | 2.99 | | |
Samsung Heavy Industries Co., Ltd. | | | 0.90 | | |
Sandvik AB | | | 5.18 | | |
Schindler Holding AG | | | 3.46 | | |
Schindler Holding AG | | | 1.68 | | |
Sembcorp Marine Ltd. | | | 0.75 | | |
SMC Corp. | | | 5.67 | | |
Sulzer AG | | | 1.37 | | |
Sumitomo Heavy Industries Ltd. | | | 1.03 | | |
United Tractors Tbk PT | | | 1.24 | | |
Vallourec SA | | | 0.58 | | |
Volvo AB | | | 7.68 | | |
Wartsila Oyj Abp | | | 3.19 | | |
Weichai Power Co., Ltd. | | | 0.48 | | |
Weir Group PLC (The) | | | 2.27 | | |
Yangzijiang Shipbuilding Holdings Ltd. | | | 0.80 | | |
Zoomlion Heavy Industry Science & Technology | | | 0.33 | | |
| | | | 100.00 | % | |
The accompanying notes are an integral part of the financial statements.
29
Morgan Stanley Institutional Fund Trust
Annual Report — September 30, 2015
Portfolio of Investments (cont'd)
Global Strategist Portfolio
The following table represents the equity basket holdings underlying the total return swap with GS Auto Components Index as of September 30, 2015.
Security Description | | Index Weight | |
GS Auto Components Index | |
Aisin Seiki Co., Ltd. | | | 2.44 | % | |
Autoliv, Inc. | | | 3.86 | | |
BorgWarner, Inc. | | | 3.62 | | |
Bridgestone Corp. | | | 8.55 | | |
Cheng Shin Rubber Industry Co., Ltd. | | | 1.01 | | |
Cie Generale des Etablissements Michelin | | | 6.47 | | |
Continental AG | | | 8.92 | | |
Delphi Automotive PLC | | | 8.69 | | |
Denso Corp. | | | 7.80 | | |
GKN PLC | | | 2.54 | | |
Hankook Tire Co., Ltd. | | | 0.95 | | |
Hanon Systems | | | 0.47 | | |
Hyundai Mobis Co., Ltd. | | | 5.07 | | |
Hyundai Wia Corp. | | | 0.68 | | |
Johnson Controls, Inc. | | | 10.51 | | |
Koito Manufacturing Co., Ltd. | | | 1.19 | | |
Magna International, Inc. | | | 7.74 | | |
NGK Spark Plug Co., Ltd. | | | 1.56 | | |
NHK Spring Co., Ltd. | | | 0.58 | | |
NOK Corp. | | | 0.78 | | |
Nokian Renkaat Oyj | | | 1.40 | | |
Pirelli & C. SpA | | | 1.52 | | |
Stanley Electric Co., Ltd. | | | 1.08 | | |
Sumitomo Electric Industries Ltd. | | | 3.66 | | |
Sumitomo Rubber Industries Ltd. | | | 0.90 | | |
Toyoda Gosei Co., Ltd. | | | 0.49 | | |
Toyota Industries Corp. | | | 2.94 | | |
Valeo SA | | | 3.89 | | |
Yokohama Rubber Co., Ltd. (The) | | | 0.69 | | |
| | | | 100.00 | % | |
The following table represents the equity basket holdings underlying the total return swap with JPM U.S. Machinery Index as of September 30, 2015.
Security Description | | Index Weight | |
JPM U.S. Machinery Index | |
AGCO Corp. | | | 2.05 | % | |
Caterpillar, Inc. | | | 20.99 | | |
Cummins, Inc. | | | 9.58 | | |
Deere & Co. | | | 12.19 | | |
Dover Corp. | | | 4.78 | | |
Flowserve Corp. | | | 2.76 | | |
Illinois Tool Works, Inc. | | | 15.57 | | |
Ingersoll-Rand PLC | | | 6.86 | | |
Joy Global, Inc. | | | 0.78 | | |
PACCAR, Inc. | | | 9.14 | | |
Parker-Hannifin Corp. | | | 6.79 | | |
Pentair PLC | | | 4.81 | | |
SPX Corp. | | | 0.22 | | |
SPX FLOW, Inc. | | | 0.64 | | |
Xylem, Inc. | | | 2.84 | | |
| | | | 100.00 | % | |
The following table represents the equity basket holdings underlying the total return swap with JPMorgan U.S. Refineries Custom Basket as of September 30, 2015.
Security Description | | Index Weight | |
JPMorgan U.S. Refineries Custom Basket | |
Delek U.S. Holdings, Inc. | | | 1.30 | % | |
HollyFrontier Corp. | | | 6.45 | | |
Marathon Petroleum Corp. | | | 19.52 | | |
PBF Energy, Inc. | | | 2.81 | | |
Phillips 66 | | | 23.97 | | |
Tesoro Corp. | | | 16.33 | | |
Valero Energy Corp. | | | 26.23 | | |
Western Refining, Inc. | | | 3.39 | | |
| | | | 100.00 | % | |
The following table represents the equity basket holdings underlying the total return swap with JPM Aerospace Index as of September 30, 2015.
Security Description | | Index Weight | |
JPM Aerospace Index | |
Airbus Group SE | | | 13.75 | % | |
B/E Aerospace, Inc. | | | 1.50 | | |
Boeing Co. (The) | | | 33.15 | | |
Bombardier, Inc. | | | 0.72 | | |
KLX, Inc. | | | 0.61 | | |
Precision Castparts Corp. | | | 12.23 | | |
Rolls-Royce Holdings PLC | | | 5.86 | | |
Safran SA | | | 9.41 | | |
Textron, Inc. | | | 4.86 | | |
Thales SA | | | 2.84 | | |
TransDigm Group, Inc. | | | 3.69 | | |
United Technologies Corp. | | | 9.39 | | |
Zodiac Aerospace | | | 1.99 | | |
| | | | 100.00 | % | |
@ Value is less than $500.
† Credit rating as issued by Standard & Poor's.
* Cleared swap agreement, the broker is Morgan Stanley & Co., LLC.
LIBOR London Interbank Offered Rate.
TIIE Interbank Equilibrium Interest Rate.
AUD — Australian Dollar
BRL — Brazilian Real
CAD — Canadian Dollar
CHF — Swiss Franc
CLP — Chilean Peso
CNY — Chinese Yuan Renminbi
DKK — Danish Krone
EUR — Euro
GBP — British Pound
HKD — Hong Kong Dollar
HUF — Hungarian Forint
IDR — Indonesian Rupiah
ILS — Israeli Shekel
INR — Indian Rupee
JPY — Japanese Yen
KRW — South Korean Won
MXN — Mexican Peso
The accompanying notes are an integral part of the financial statements.
30
Morgan Stanley Institutional Fund Trust
Annual Report — September 30, 2015
Portfolio of Investments (cont'd)
Global Strategist Portfolio
NOK — Norwegian Krone
NZD — New Zealand Dollar
PLN — Polish Zloty
RUB — Russian Ruble
SEK — Swedish Krona
SGD — Singapore Dollar
THB — Thai Baht
TRY — Turkish Lira
TWD — Taiwan Dollar
USD — United States Dollar
ZAR — South African Rand
Portfolio Composition
Classification | | Percentage of
Total Investments | |
Common Stocks | | | 61.0 | % | |
Fixed Income Securities | | | 29.3 | | |
Short-Term Investments | | | 9.6 | | |
Other** | | | 0.1 | | |
Total Investments | | | 100.0 | %*** | |
** Industries and/or investment types representing less than 5% of total investments.
*** Does not include open long/short futures contracts with an underlying face amount of approximately $156,239,000 with net unrealized depreciation of approximately $660,000. Does not include open foreign currency forward exchange contracts with net unrealized appreciation of approximately $36,000 and does not include open swap agreements with net unrealized depreciation of approximately $253,000.
The accompanying notes are an integral part of the financial statements.
31
Morgan Stanley Institutional Fund Trust
Annual Report — September 30, 2015
Global Strategist Portfolio
Statement of Assets and Liabilities | | September 30, 2015
(000) | |
Assets: | |
Investments in Securities of Unaffiliated Issuers, at Value (Cost $341,063) | | $ | 364,775 | | |
Investment in Security of Affiliated Issuer, at Value (Cost $30,920) | | | 30,886 | | |
Total Investments in Securities, at Value (Cost $371,983) | | | 395,661 | | |
Foreign Currency, at Value (Cost $1,297) | | | 1,268 | | |
Cash | | | — | @ | |
Receivable for Investments Sold | | | 6,204 | | |
Receivable for Variation Margin on Futures Contracts | | | 4,998 | | |
Unrealized Appreciation on Foreign Currency Forward Exchange Contracts | | | 1,099 | | |
Interest Receivable | | | 925 | | |
Unrealized Appreciation on Swap Agreements | | | 823 | | |
Dividends Receivable | | | 440 | | |
Receivable for Portfolio Shares Sold | | | 323 | | |
Tax Reclaim Receivable | | | 184 | | |
Premium Paid on Open Swap Agreements | | | 87 | | |
Receivable for Variation Margin on Swap Agreements | | | 7 | | |
Receivable from Affiliate | | | 4 | | |
Other Assets | | | 71 | | |
Total Assets | | | 412,094 | | |
Liabilities: | |
Payable for Investments Purchased | | | 10,344 | | |
Unrealized Depreciation on Foreign Currency Forward Exchange Contracts | | | 1,063 | | |
Due to Broker | | | 845 | | |
Unrealized Depreciation on Swap Agreements | | | 789 | | |
Premium Received on Open Swap Agreements | | | 605 | | |
Payable for Portfolio Shares Redeemed | | | 298 | | |
Payable for Advisory Fees | | | 260 | | |
Payable for Sub Transfer Agency Fees — Class I | | | 9 | | |
Payable for Sub Transfer Agency Fees — Class A | | | 126 | | |
Payable for Sub Transfer Agency Fees — Class L | | | 17 | | |
Payable for Sub Transfer Agency Fees — Class C | | | — | @ | |
Payable for Trustees' Fees and Expenses | | | 81 | | |
Payable for Shareholder Services Fees — Class A | | | 60 | | |
Payable for Distribution and Shareholder Services Fees — Class L | | | 15 | | |
Payable for Distribution and Shareholder Services Fees — Class C | | | 1 | | |
Payable for Custodian Fees | | | 74 | | |
Payable for Professional Fees | | | 44 | | |
Payable for Administration Fees | | | 27 | | |
Payable for Transfer Agency Fees — Class I | | | 3 | | |
Payable for Transfer Agency Fees — Class A | | | 11 | | |
Payable for Transfer Agency Fees — Class L | | | 3 | | |
Payable for Transfer Agency Fees — Class C | | | — | @ | |
Payable for Transfer Agency Fees — Class IS | | | — | @ | |
Other Liabilities | | | 135 | | |
Total Liabilities | | | 14,810 | | |
Net Assets | | $ | 397,284 | | |
Net Assets Consist Of: | |
Paid-in-Capital | | $ | 395,638 | | |
Distributions in Excess of Net Investment Income | | | (921 | ) | |
Accumulated Net Realized Loss | | | (20,190 | ) | |
Unrealized Appreciation (Depreciation) on: | |
Investments | | | 23,712 | | |
Investments in Affiliates | | | (34 | ) | |
Futures Contracts | | | (660 | ) | |
Swap Agreements | | | (253 | ) | |
Foreign Currency Forward Exchange Contracts | | | 36 | | |
Foreign Currency Translations | | | (44 | ) | |
Net Assets | | $ | 397,284 | | |
The accompanying notes are an integral part of the financial statements.
32
Morgan Stanley Institutional Fund Trust
Annual Report — September 30, 2015
Global Strategist Portfolio
Statement of Assets and Liabilities (cont'd) | | September 30, 2015
(000) | |
CLASS I: | |
Net Assets | | $ | 83,930 | | |
| Shares Outstanding (unlimited number of shares authorized, no par value) (not in 000's) | | | 5,754,730 | | |
Net Asset Value, Offering and Redemption Price Per Share | | $ | 14.58 | | |
CLASS A: | |
Net Assets | | $ | 287,438 | | |
| Shares Outstanding (unlimited number of shares authorized, no par value) (not in 000's) | | | 19,826,161 | | |
Net Asset Value, Redemption Price Per Share | | $ | 14.50 | | |
Maximum Sales Load | | | 5.25 | % | |
Maximum Sales Charge | | $ | 0.80 | | |
Maximum Offering Price Per Share | | $ | 15.30 | | |
CLASS L: | |
Net Assets | | $ | 24,544 | | |
| Shares Outstanding (unlimited number of shares authorized, no par value) (not in 000's) | | | 1,702,853 | | |
Net Asset Value, Offering and Redemption Price Per Share | | $ | 14.41 | | |
CLASS C: | |
Net Assets | | $ | 1,363 | | |
| Shares Outstanding (unlimited number of shares authorized, no par value) (not in 000's) | | | 94,613 | | |
Net Asset Value, Offering and Redemption Price Per Share | | $ | 14.41 | | |
CLASS IS: | |
Net Assets | | $ | 9 | | |
| Shares Outstanding (unlimited number of shares authorized, no par value) (not in 000's) | | | 626 | | |
Net Asset Value, Offering and Redemption Price Per Share | | $ | 14.59 | | |
@ Amount is less than $500.
The accompanying notes are an integral part of the financial statements.
33
Morgan Stanley Institutional Fund Trust
Annual Report — September 30, 2015
Global Strategist Portfolio
Statement of Operations | | Year Ended
September 30, 2015
(000) | |
Investment Income: | |
Dividends from Securities of Unaffiliated Issuers (Net of $363 of Foreign Taxes Withheld) | | $ | 7,122 | | |
Interest from Securities of Unaffiliated Issuers | | | 3,863 | | |
Dividends from Security of Affiliated Issuer (Note G) | | | 50 | | |
Total Investment Income | | | 11,035 | | |
Expenses: | |
Advisory Fees (Note B) | | | 1,990 | | |
Shareholder Services Fees — Class A (Note D) | | | 841 | | |
Distribution and Shareholder Services Fees — Class L (Note D) | | | 205 | | |
Distribution and Shareholder Services Fees — Class C (Note D) | | | 4 | | |
Custodian Fees (Note F) | | | 535 | | |
Sub Transfer Agency Fees — Class I | | | 36 | | |
Sub Transfer Agency Fees — Class A | | | 294 | | |
Sub Transfer Agency Fees — Class L | | | 35 | | |
Sub Transfer Agency Fees — Class C | | | 1 | | |
Administration Fees (Note C) | | | 354 | | |
Professional Fees | | | 179 | | |
Pricing Fees | | | 134 | | |
Transfer Agency Fees — Class I (Note E) | | | 10 | | |
Transfer Agency Fees — Class A (Note E) | | | 42 | | |
Transfer Agency Fees — Class L (Note E) | | | 13 | | |
Transfer Agency Fees — Class C (Note E) | | | 1 | | |
Transfer Agency Fees — Class IS (Note E) | | | — | @ | |
Shareholder Reporting Fees | | | 66 | | |
Registration Fees | | | 58 | | |
Trustees' Fees and Expenses | | | 21 | | |
Other Expenses | | | 28 | | |
Total Expenses | | | 4,847 | | |
Waiver of Advisory Fees (Note B) | | | (208 | ) | |
Rebate from Morgan Stanley Affiliate (Note G) | | | (47 | ) | |
Reimbursement of Class Specific Expenses — Class I (Note B) | | | (25 | ) | |
Reimbursement of Class Specific Expenses — Class L (Note B) | | | (14 | ) | |
Reimbursement of Class Specific Expenses — Class C (Note B) | | | (1 | ) | |
Reimbursement of Class Specific Expenses — Class IS (Note B) | | | (— | @) | |
Net Expenses | | | 4,552 | | |
Net Investment Income | | | 6,483 | | |
Realized Gain (Loss): | |
Investments Sold | | | (10,234 | ) | |
Foreign Currency Forward Exchange Contracts | | | 5,606 | | |
Foreign Currency Transactions | | | (752 | ) | |
Futures Contracts | | | (5,342 | ) | |
Swap Agreements | | | (7,514 | ) | |
Net Realized Loss | | | (18,236 | ) | |
Change in Unrealized Appreciation (Depreciation): | |
Investments | | | (23,723 | ) | |
Investments in Affiliates | | | (24 | ) | |
Foreign Currency Forward Exchange Contracts | | | (1,618 | ) | |
Foreign Currency Translations | | | 49 | | |
Futures Contracts | | | (1,278 | ) | |
Swap Agreements | | | (2,003 | ) | |
Net Change in Unrealized Appreciation (Depreciation) | | | (28,597 | ) | |
Net Realized Loss and Change in Unrealized Appreciation (Depreciation) | | | (46,833 | ) | |
Net Decrease in Net Assets Resulting from Operations | | $ | (40,350 | ) | |
@ Amount is less than $500.
The accompanying notes are an integral part of the financial statements.
34
Morgan Stanley Institutional Fund Trust
Annual Report — September 30, 2015
Global Strategist Portfolio
Statements of Changes in Net Assets | | Year Ended
September 30, 2015
(000) | | Year Ended
September 30, 2014
(000) | |
Increase (Decrease) in Net Assets: | |
Operations: | |
Net Investment Income | | $ | 6,483 | | | $ | 7,745 | | |
Net Realized Gain (Loss) | | | (18,236 | ) | | | 13,188 | | |
Net Change in Unrealized Appreciation (Depreciation) | | | (28,597 | ) | | | 19,230 | | |
Net Increase (Decrease) in Net Assets Resulting from Operations | | | (40,350 | ) | | | 40,163 | | |
Distributions from and/or in Excess of: | |
Class I: | |
Net Investment Income | | | (1,528 | ) | | | (714 | ) | |
Net Realized Gain | | | (2,679 | ) | | | (3,844 | ) | |
Class A: | |
Net Investment Income | | | (6,120 | ) | | | (4,088 | ) | |
Net Realized Gain | | | (13,028 | ) | | | (26,774 | ) | |
Class L: | |
Net Investment Income | | | (334 | ) | | | (173 | ) | |
Net Realized Gain | | | (1,018 | ) | | | (2,073 | ) | |
Total Distributions | | | (24,707 | ) | | | (37,666 | ) | |
Capital Share Transactions:(1) | |
Class I: | |
Subscribed | | | 54,340 | | | | 25,332 | | |
Distributions Reinvested | | | 4,190 | | | | 4,536 | | |
Redeemed | | | (35,485 | ) | | | (9,847 | ) | |
Class A: | |
Subscribed | | | 16,757 | | | | 23,787 | | |
Distributions Reinvested | | | 18,802 | | | | 30,252 | | |
Redeemed | | | (64,828 | ) | | | (63,566 | ) | |
Class L: | |
Subscribed | | | 4,778 | | | | 1,835 | | |
Distributions Reinvested | | | 1,327 | | | | 2,203 | | |
Redeemed | | | (5,643 | ) | | | (5,157 | ) | |
Class C: | |
Subscribed | | | 1,467 | * | | | — | | |
Redeemed | | | (— | @)* | | | — | | |
Class IS: | |
Subscribed | | | 10 | ** | | | — | | |
Net Increase (Decrease) in Net Assets Resulting from Capital Share Transactions | | | (4,285 | ) | | | 9,375 | | |
Total Increase (Decrease) in Net Assets | | | (69,342 | ) | | | 11,872 | | |
Net Assets: | |
Beginning of Period | | | 466,626 | | | | 454,754 | | |
End of Period (Including Distributions in Excess of Net Investment Income and Accumulated Undistributed
Net Investment Income of $(921) and $3,936, respectively) | | $ | 397,284 | | | $ | 466,626 | | |
(1) Capital Share Transactions: | |
Class I: | |
Shares Subscribed | | | 3,417 | | | | 1,511 | | |
Shares Issued on Distributions Reinvested | | | 269 | | | | 284 | | |
Shares Redeemed | | | (2,225 | ) | | | (578 | ) | |
Net Increase in Class I Shares Outstanding | | | 1,461 | | | | 1,217 | | |
Class A: | |
Shares Subscribed | | | 1,040 | | | | 1,412 | | |
Shares Issued on Distributions Reinvested | | | 1,211 | | | | 1,903 | | |
Shares Redeemed | | | (4,081 | ) | | | (3,794 | ) | |
Net Decrease in Class A Shares Outstanding | | | (1,830 | ) | | | (479 | ) | |
Class L: | |
Shares Subscribed | | | 305 | | | | 110 | | |
Shares Issued on Distributions Reinvested | | | 86 | | | | 139 | | |
Shares Redeemed | | | (358 | ) | | | (309 | ) | |
Net Increase (Decrease) in Class L Shares Outstanding | | | 33 | | | | (60 | ) | |
The accompanying notes are an integral part of the financial statements.
35
Morgan Stanley Institutional Fund Trust
Annual Report — September 30, 2015
Global Strategist Portfolio
Statements of Changes in Net Assets (cont'd) | | Year Ended
September 30, 2015
(000) | | Year Ended
September 30, 2014
(000) | |
Class C: | |
Shares Subscribed | | | 95 | * | | | — | | |
Shares Redeemed | | | (— | @@)* | | | — | | |
Net Increase in Class C Shares Outstanding | | | 95 | | | | — | | |
Class IS: | |
Shares Subscribed | | | 1 | ** | | | — | | |
Net Increase in Class IS Shares Outstanding | | | 1 | | | | — | | |
* For the period April 30, 2015 through September 30, 2015.
** For the period May 29, 2015 through September 30, 2015.
@ Amount is less than $500.
@@ Amount is less than 500 shares.
The accompanying notes are an integral part of the financial statements.
36
Morgan Stanley Institutional Fund Trust
Annual Report — September 30, 2015
Financial Highlights
Global Strategist Portfolio
| | | Class I | |
| | | Year Ended September 30, | |
Selected Per Share Data and Ratios | | 2015 | | 2014 | | 2013 | | 2012 | | 2011 | |
Net Asset Value, Beginning of Period | | $ | 16.99 | | | $ | 16.96 | | | $ | 15.22 | | | $ | 12.50 | | | $ | 12.55 | | |
Income (Loss) from Investment Operations: | |
Net Investment Income† | | | 0.28 | | | | 0.34 | | | | 0.35 | | | | 0.14 | | | | 0.18 | | |
Net Realized and Unrealized Gain (Loss) | | | (1.73 | ) | | | 1.15 | | | | 1.44 | | | | 2.79 | | | | (0.02 | ) | |
Total from Investment Operations | | | (1.45 | ) | | | 1.49 | | | | 1.79 | | | | 2.93 | | | | 0.16 | | |
Distributions from and/or in Excess of: | |
Net Investment Income | | | (0.35 | ) | | | (0.23 | ) | | | (0.05 | ) | | | (0.21 | ) | | | (0.21 | ) | |
Net Realized Gain | | | (0.61 | ) | | | (1.23 | ) | | | — | | | | — | | | | — | | |
Total Distributions | | | (0.96 | ) | | | (1.46 | ) | | | (0.05 | ) | | | (0.21 | ) | | | (0.21 | ) | |
Net Asset Value, End of Period | | $ | 14.58 | | | $ | 16.99 | | | $ | 16.96 | | | $ | 15.22 | | | $ | 12.50 | | |
Total Return++ | | | (8.87 | )% | | | 9.37 | % | | | 11.79 | % | | | 23.66 | % | | | 1.07 | % | |
Ratios and Supplemental Data: | |
Net Assets, End of Period (Thousands) | | $ | 83,930 | | | $ | 72,952 | | | $ | 52,170 | | | $ | 23,756 | | | $ | 25,192 | | |
Ratio of Expenses to Average Net Assets (1) | | | 0.73 | %+ | | | 0.72 | %+ | | | 0.69 | %+ | | | 1.37 | %+ | | | 1.30 | %+ | |
Ratio of Expenses to Average Net Assets Excluding Non Operating Expenses | | | N/A | | | | N/A | | | | 0.76 | %+ | | | N/A | | | | N/A | | |
Ratio of Net Investment Income to Average Net Assets (1) | | | 1.78 | %+ | | | 1.99 | %+ | | | 2.18 | %+ | | | 1.01 | %+ | | | 1.35 | %+ | |
Ratio of Rebate from Morgan Stanley Affiliates to Average Net Assets | | | 0.01 | % | | | 0.02 | % | | | 0.01 | % | | | 0.02 | % | | | 0.01 | % | |
Portfolio Turnover Rate | | | 98 | % | | | 62 | % | | | 107 | % | | | 168 | % | | | 164 | % | |
(1) Supplemental Information on the Ratios to Average Net Assets: | |
Ratios Before Expense Limitation: | |
Expenses to Average Net Assets | | | 0.83 | % | | | 0.83 | % | | | 0.82 | % | | | N/A | | | | N/A | | |
Net Investment Income to Average Net Assets | | | 1.68 | % | | | 1.88 | % | | | 2.05 | % | | | N/A | | | | N/A | | |
† Per share amount is based on average shares outstanding.
++ Calculated based on the net asset value as of the last business day of the period.
+ The Ratios of Expenses and Net Investment Income reflect the rebate of certain Portfolio expenses in connection with the investments in Morgan Stanley affiliates during the period. The effect of the rebate on the ratios is disclosed in the above table as "Ratio of Rebate from Morgan Stanley Affiliates to Average Net Assets."
The accompanying notes are an integral part of the financial statements.
37
Morgan Stanley Institutional Fund Trust
Annual Report — September 30, 2015
Financial Highlights
Global Strategist Portfolio
| | | Class A | |
| | | Year Ended September 30, | |
Selected Per Share Data and Ratios | | 2015 | | 2014 | | 2013 | | 2012 | | 2011 | |
Net Asset Value, Beginning of Period | | $ | 16.88 | | | $ | 16.88 | | | $ | 15.18 | | | $ | 12.47 | | | $ | 12.52 | | |
Income (Loss) from Investment Operations: | |
Net Investment Income† | | | 0.23 | | | | 0.27 | | | | 0.42 | | | | 0.10 | | | | 0.15 | | |
Net Realized and Unrealized Gain (Loss) | | | (1.71 | ) | | | 1.15 | | | | 1.32 | | | | 2.79 | | | | (0.03 | ) | |
Total from Investment Operations | | | (1.48 | ) | | | 1.42 | | | | 1.74 | | | | 2.89 | | | | 0.12 | | |
Distributions from and/or in Excess of: | |
Net Investment Income | | | (0.29 | ) | | | (0.19 | ) | | | (0.04 | ) | | | (0.18 | ) | | | (0.17 | ) | |
Net Realized Gain | | | (0.61 | ) | | | (1.23 | ) | | | — | | | | — | | | | — | | |
Total Distributions | | | (0.90 | ) | | | (1.42 | ) | | | (0.04 | ) | | | (0.18 | ) | | | (0.17 | ) | |
Net Asset Value, End of Period | | $ | 14.50 | | | $ | 16.88 | | | $ | 16.88 | | | $ | 15.18 | | | $ | 12.47 | | |
Total Return++ | | | (9.16 | )% | | | 9.02 | % | | | 11.49 | % | | | 23.33 | % | | | 0.83 | % | |
Ratios and Supplemental Data: | |
Net Assets, End of Period (Thousands) | | $ | 287,438 | | | $ | 365,642 | | | $ | 373,559 | | | $ | 20,487 | | | $ | 16,857 | | |
Ratio of Expenses to Average Net Assets (1) | | | 1.05 | %+ | | | 1.07 | %+ | | | 0.47 | %+^ | | | 1.64 | %+ | | | 1.55 | %+ | |
Ratio of Expenses to Average Net Assets Excluding Non Operating Expenses | | | N/A | | | | N/A | | | | 1.03 | %+^ | | | N/A | | | | N/A | | |
Ratio of Net Investment Income to Average Net Assets (1) | | | 1.44 | %+ | | | 1.64 | %+ | | | 2.60 | %+^ | | | 0.69 | %+ | | | 1.10 | %+ | |
Ratio of Rebate from Morgan Stanley Affiliates to Average Net Assets | | | 0.01 | % | | | 0.02 | % | | | 0.01 | % | | | 0.02 | % | | | 0.01 | % | |
Portfolio Turnover Rate | | | 98 | % | | | 62 | % | | | 107 | % | | | 168 | % | | | 164 | % | |
(1) Supplemental Information on the Ratios to Average Net Assets: | |
Ratios Before Expense Limitation: | |
Expenses to Average Net Assets | | | 1.11 | % | | | 1.14 | % | | | 1.11 | % | | | N/A | | | | N/A | | |
Net Investment Income to Average Net Assets | | | 1.38 | % | | | 1.57 | % | | | 1.96 | % | | | N/A | | | | N/A | | |
† Per share amount is based on average shares outstanding.
++ Calculated based on the net asset value which does not reflect sales charges, if applicable, as of the last business day of the period.
+ The Ratios of Expenses and Net Investment Income reflect the rebate of certain Portfolio expenses in connection with the investments in Morgan Stanley affiliates during the period. The effect of the rebate on the ratios is disclosed in the above table as "Ratio of Rebate from Morgan Stanley Affiliates to Average Net Assets."
^ Effective September 16, 2013, the Adviser has agreed to limit the ratio of expenses to average net assets to the maximum ratio of 1.09% for Class A shares. Prior to September 16, 2013, the maximum ratio was 0.99% for Class A shares.
The accompanying notes are an integral part of the financial statements.
38
Morgan Stanley Institutional Fund Trust
Annual Report — September 30, 2015
Financial Highlights
Global Strategist Portfolio
| | | Class L | |
| | | Year Ended September 30, | | Period from
April 27, 2012^ to | |
Selected Per Share Data and Ratios | | 2015 | | 2014 | | 2013 | | September 30, 2012 | |
Net Asset Value, Beginning of Period | | $ | 16.79 | | | $ | 16.78 | | | $ | 15.15 | | | $ | 14.42 | | |
Income (Loss) from Investment Operations: | |
Net Investment Income (Loss)† | | | 0.15 | | | | 0.19 | | | | 0.23 | | | | (0.02 | ) | |
Net Realized and Unrealized Gain (Loss) | | | (1.72 | ) | | | 1.15 | | | | 1.42 | | | | 0.78 | | |
Total from Investment Operations | | | (1.57 | ) | | | 1.34 | | | | 1.65 | | | | 0.76 | | |
Distributions from and/or in Excess of: | |
Net Investment Income | | | (0.20 | ) | | | (0.10 | ) | | | (0.02 | ) | | | (0.03 | ) | |
Net Realized Gain | | | (0.61 | ) | | | (1.23 | ) | | | — | | | | — | | |
Total Distributions | | | (0.81 | ) | | | (1.33 | ) | | | (0.02 | ) | | | (0.03 | ) | |
Net Asset Value, End of Period | | $ | 14.41 | | | $ | 16.79 | | | $ | 16.78 | | | $ | 15.15 | | |
Total Return++ | | | (9.66 | )% | | | 8.49 | % | | | 10.91 | % | | | 5.30 | %# | |
Ratios and Supplemental Data: | |
Net Assets, End of Period (Thousands) | | $ | 24,544 | | | $ | 28,032 | | | $ | 29,025 | | | $ | 11 | | |
Ratio of Expenses to Average Net Assets (1) | | | 1.58 | %+ | | | 1.57 | %+ | | | 1.42 | %+^^ | | | 2.39 | %+* | |
Ratio of Expenses to Average Net Assets Excluding Non Operating Expenses | | | N/A | | | | N/A | | | | 1.49 | %+^^ | | | N/A | | |
Ratio of Net Investment Income (Loss) to Average Net Assets (1) | | | 0.93 | %+ | | | 1.14 | %+ | | | 1.44 | %+^^ | | | (0.29 | )%+* | |
Ratio of Rebate from Morgan Stanley Affiliates to Average Net Assets | | | 0.01 | % | | | 0.02 | % | | | 0.01 | % | | | 0.03 | %* | |
Portfolio Turnover Rate | | | 98 | % | | | 62 | % | | | 107 | % | | | 168 | %# | |
(1) Supplemental Information on the Ratios to Average Net Assets: | |
Ratios Before Expense Limitation: | |
Expenses to Average Net Assets | | | 1.69 | % | | | 1.70 | % | | | 1.54 | % | | | N/A | | |
Net Investment Income to Average Net Assets | | | 0.82 | % | | | 1.01 | % | | | 1.32 | % | | | N/A | | |
^ Commencement of Operations.
† Per share amount is based on average shares outstanding.
++ Calculated based on the net asset value as of the last business day of the period.
+ The Ratios of Expenses and Net Investment Income (Loss) reflect the rebate of certain Portfolio expenses in connection with the investments in Morgan Stanley affiliates during the period. The effect of the rebate on the ratios is disclosed in the above table as "Ratio of Rebate from Morgan Stanley Affiliates to Average Net Assets."
^^ Effective September 16, 2013, the Adviser has agreed to limit the ratio of expenses to average net assets to the maximum ratio of 1.59% for Class L shares. Prior to September 16, 2013, the maximum ratio was 1.49% for Class L shares.
# Not Annualized.
* Annualized.
The accompanying notes are an integral part of the financial statements.
39
Morgan Stanley Institutional Fund Trust
Annual Report — September 30, 2015
Financial Highlights
Global Strategist Portfolio
| | | Class C | |
Selected Per Share Data and Ratios | | Period from April 30, 2015^
to September 30, 2015 | |
Net Asset Value, Beginning of Period | | $ | 16.03 | | |
Income (Loss) from Investment Operations: | |
Net Investment Income† | | | 0.03 | | |
Net Realized and Unrealized Loss | | | (1.65 | ) | |
Total from Investment Operations | | | (1.62 | ) | |
Net Asset Value, End of Period | | $ | 14.41 | | |
Total Return++ | | | (10.11 | )%# | |
Ratios and Supplemental Data: | |
Net Assets, End of Period, (Thousands) | | $ | 1,363 | | |
Ratios of Expenses to Average Net Assets (1) | | | 1.83 | %+* | |
Ratio of Net Investment Income to Average Net Assets (1) | | | 0.54 | %+* | |
Ratio of Rebate from Morgan Stanley Affiliates to Average Net Assets | | | 0.01 | %* | |
Portfolio Turnover Rate | | | 98 | %# | |
(1) Supplemental Information on the Ratios to Average Net Assets: | |
Ratios Before Expense Limitation: | |
Expense to Average Net Assets | | | 2.28 | %* | |
Net Investment Income to Average Net Assets | | | 0.09 | %* | |
^ Commencement of Operations.
† Per share amount is based on average shares outstanding.
++ Calculated based on the net asset value which does not reflect sales charges, if applicable, as of the last business day of the period.
+ The Ratios of Expenses and Net Investment Income reflect the rebate of certain Portfolio expenses in connection with the investments in Morgan Stanley affiliates during the period. The effect of the rebate on the ratios is disclosed in the above table as "Ratio of Rebate from Morgan Stanley Affiliates to Average Net Assets."
# Not Annualized.
* Annualized.
The accompanying notes are an integral part of the financial statements.
40
Morgan Stanley Institutional Fund Trust
Annual Report — September 30, 2015
Financial Highlights
Global Strategist Portfolio
| | | Class IS | |
Selected Per Share Data and Ratios | | Period from May 29, 2015^
to September 30, 2015 | |
Net Asset Value, Beginning of Period | | $ | 15.97 | | |
Income (Loss) from Investment Operations: | |
Net Investment Income† | | | 0.09 | | |
Net Realized and Unrealized Loss | | | (1.47 | ) | |
Total from Investment Operations | | | (1.38 | ) | |
Net Asset Value, End of Period | | $ | 14.59 | | |
Total Return++ | | | (8.70 | )%# | |
Ratios and Supplemental Data: | |
Net Assets, End of Period, in (Thousands) | | $ | 9 | | |
Ratio of Expenses to Average Net Assets (1) | | | 0.71 | %+* | |
Ratio of Net Investment Income to Average Net Assets (1) | | | 1.66 | %+* | |
Ratio of Rebate from Morgan Stanley Affiliates to Average Net Assets | | | 0.00 | %§* | |
Portfolio Turnover Rate | | | 98 | %# | |
(1) Supplemental Information on the Ratios to Average Net Assets: | |
Ratios Before Expense Limitation | |
Expenses to Average Net Assets | | | 16.27 | %* | |
Net Investment Loss to Average Net Assets | | | (13.90 | )%* | |
^ Commencement of Operations.
† Per share amount is based on average shares outstanding.
++ Calculated based on the net asset value as of the last business day of the period.
+ The Ratios of Expenses and Net Investment Income reflect the rebate of certain Portfolio expenses in connection with the investments in Morgan Stanley affiliates during the period. The effect of the rebate on the ratios is disclosed in the above table as "Ratio of Rebate from Morgan Stanley Affiliates to Average Net Assets."
§ Amount is less than 0.005%.
# Not Annualized.
* Annualized.
The accompanying notes are an integral part of the financial statements.
41
Morgan Stanley Institutional Fund Trust
Annual Report — September 30, 2015
Notes to Financial Statements
Morgan Stanley Institutional Fund Trust ("MSIFT" or the "Fund'') is registered under the Investment Company Act of 1940, as amended (the "Act''), as an open-end management investment company. The Fund is comprised of nine separate, active portfolios (individually referred to as a "Portfolio", collectively as the "Portfolios"). The Fund applies investment company accounting and reporting guidance. All Portfolios are considered diversified for purposes of the Act.
The accompanying financial statements relate to the Global Strategist Portfolio. The Portfolio seeks above-average total return over a market cycle of three to five years. The Portfolio offers five classes of shares — Class I, Class A, Class L, Class C and Class IS.
On April 30, 2015, the Portfolio commenced offering Class C shares.
On May 29, 2015, the Portfolio commenced offering Class IS shares.
A. Significant Accounting Policies: The following significant accounting policies are in conformity with U.S. generally accepted accounting principles ("GAAP"). Such policies are consistently followed by the Fund in the preparation of its financial statements. GAAP may require management to make estimates and assumptions that affect the reported amounts and disclosures in the financial statements. Actual results may differ from those estimates.
1. Security Valuation: (1) Certain portfolio securities may be valued by an outside pricing service approved by the Fund's Board of Trustees (the "Trustees"). The pricing service may utilize a matrix system or other model incorporating attributes such as security quality, maturity and coupon as the evaluation model parameters, and/or research evaluations by its staff, including review of broker-dealer market price quotations in determining what it believes is the fair valuation of the portfolios securities valued by such pricing service; (2) an equity portfolio security listed or traded on an exchange is valued at its latest reported sales price (or at the exchange official closing price if such exchange reports an official closing price), if there were no sales on a given day, the security is valued at the mean between the last reported bid and asked prices; (3) all other equity portfolio securities for which over-the-counter ("OTC") market quotations are readily available are valued at its latest reported sales price. In cases where a security is traded on more than one exchange, the security is valued on the exchange
designated as the primary market; (4) futures are valued at the latest price published by the commodities exchange on which they trade; (5) swaps are marked-to-market daily based upon quotations from market makers; (6) when market quotations are not readily available, including circumstances under which Morgan Stanley Investment Management Inc. (the "Adviser") determines that the closing price, last sale price or the mean between the last reported bid and asked prices are not reflective of a security's market value, portfolio securities are valued at their fair value as determined in good faith under procedures established by and under the general supervision of the Trustees. Occasionally, developments affecting the closing prices of securities and other assets may occur between the times at which valuations of such securities are determined (that is, close of the foreign market on which the securities trade) and the close of business of the New York Stock Exchange ("NYSE"). If developments occur during such periods that are expected to materially affect the value of such securities, such valuations may be adjusted to reflect the estimated fair value of such securities as of the close of the NYSE, as determined in good faith by the Trustees or by the Adviser using a pricing service and/or procedures approved by the Trustees; (7) quotations of foreign portfolio securities, other assets and liabilities and forward contracts stated in foreign currency are translated into U.S. dollar equivalents at the prevailing market rates prior to the close of the NYSE; (8) investments in mutual funds, including the Morgan Stanley Institutional Liquidity Funds, are valued at the net asset value ("NAV") as of the close of each business day; and (9) short-term taxable debt securities with remaining maturities of 60 days or less at the time of purchase may be valued at amortized cost, unless the Adviser determines such price does not reflect the securities' market value, in which case these securities will be valued at their fair market value determined by the Adviser. Other taxable short-term debt securities with maturities of more than 60 days will be valued on a mark-to-market basis until such time as they reach a maturity of 60 days, whereupon they will be valued at amortized cost using their value on the 61st day unless the Adviser determines such price does not reflect the securities' fair value, in which case these securities will be valued at their fair market value as determined by the Adviser.
The Trustees have responsibility for determining in good faith the fair value of the investments, and the Trustees
42
Morgan Stanley Institutional Fund Trust
Annual Report — September 30, 2015
Notes to Financial Statements (cont'd)
may appoint others, such as the Fund's Adviser or a valuation committee, to assist the Trustees in determining fair value and to make the actual calculations pursuant to the fair valuation methodologies previously approved by the Trustees. Under procedures approved by the Trustees, the Fund's Adviser has formed a Valuation Committee whose members are approved by the Trustees. The Valuation Committee provides administration and oversight of the Fund's valuation policies and procedures, which are reviewed at least annually by the Trustees. These procedures allow the Fund to utilize independent pricing services, quotations from securities and financial instrument dealers, and other market sources to determine fair value.
The Fund has procedures to determine the fair value of securities and other financial instruments for which market prices are not readily available. Under these procedures, the Valuation Committee convenes on a regular and ad hoc basis to review such securities and considers a number of factors, including valuation methodologies and significant unobservable valuation inputs, when arriving at fair value. The Valuation Committee may employ a market-based approach which may use related or comparable assets or liabilities, recent transactions, market multiples, book values, and other relevant information for the investment to determine the fair value of the investment. An income-based valuation approach may also be used in which the anticipated future cash flows of the investment are discounted to calculate fair value. Discounts may also be applied due to the nature or duration of any restrictions on the disposition of the investments. Due to the inherent uncertainty of valuations of such investments, the fair values may differ significantly from the values that would have been used had an active market existed. The Valuation Committee employs various methods for calibrating these valuation approaches including a regular review of valuation methodologies, key inputs and assumptions, transactional back-testing or disposition analysis, and reviews of any related market activity.
2. Fair Value Measurement: Financial Accounting Standards Board ("FASB") Accounting Standards CodificationTM ("ASC") 820, "Fair Value Measurement" ("ASC 820"), defines fair value as the value that the Fund
would receive to sell an investment or pay to transfer a liability in a timely transaction with an independent buyer in the principal market, or in the absence of a principal market the most advantageous market for the investment or liability. ASC 820 establishes a three-tier hierarchy to distinguish between (1) inputs that reflect the assumptions market participants would use in valuing an asset or liability developed based on market data obtained from sources independent of the reporting entity (observable inputs) and (2) inputs that reflect the reporting entity's own assumptions about the assumptions market participants would use in valuing an asset or liability developed based on the best information available in the circumstances (unobservable inputs) and to establish classification of fair value measurements for disclosure purposes. Various inputs are used in determining the value of the Fund's investments. The inputs are summarized in the three broad levels listed below.
• Level 1 – unadjusted quoted prices in active markets for identical investments
• Level 2 – other significant observable inputs (including quoted prices for similar investments, interest rates, prepayment speeds, credit risk, etc.)
• Level 3 – significant unobservable inputs including the Fund's own assumptions in determining the fair value of investments. Factors considered in making this determination may include, but are not limited to, information obtained by contacting the issuer, analysts, or the appropriate stock exchange (for exchange-traded securities), analysis of the issuer's financial statements or other available documents and, if necessary, available information concerning other securities in similar circumstances
The inputs or methodology used for valuing securities are not necessarily an indication of the risk associated with investing in those securities and the determination of the significance of a particular input to the fair value measurement in its entirety requires judgment and considers factors specific to each security.
43
Morgan Stanley Institutional Fund Trust
Annual Report — September 30, 2015
Notes to Financial Statements (cont'd)
The following is a summary of the inputs used to value the Portfolio's investments as of September 30, 2015.
Investment Type | | Level 1
Unadjusted
quoted
prices
(000) | | Level 2
Other
significant
observable
inputs
(000) | | Level 3
Significant
unobservable
inputs
(000) | | Total
(000) | |
Assets: | |
Fixed Income Securities | |
Agency Adjustable Rate
Mortgage | | $ | — | | | $ | 32 | | | $ | — | | | $ | 32 | | |
Agency Fixed Rate
Mortgages | | | — | | | | 11,867 | | | | — | | | | 11,867 | | |
Asset-Backed Security | | | — | | | | 397 | | | | — | | | | 397 | | |
Collateralized Mortgage
Obligations — Agency
Collateral Series | | | — | | | | 1,876 | | | | — | | | | 1,876 | | |
Commercial
Mortgage-Backed
Securities | | | — | | | | 3,234 | | | | — | | | | 3,234 | | |
Corporate Bonds | | | — | | | | 33,825 | | | | — | | | | 33,825 | | |
Mortgages — Other | | | — | | | | 1,654 | | | | — | | | | 1,654 | | |
Sovereign | | | — | | | | 47,680 | | | | — | | | | 47,680 | | |
U.S. Treasury Securities | | | — | | | | 15,562 | | | | — | | | | 15,562 | | |
Total Fixed Income
Securities | | | — | | | | 116,127 | | | | — | | | | 116,127 | | |
Common Stocks | |
Aerospace & Defense | | | 2,178 | | | | 801 | | | | — | | | | 2,979 | | |
Air Freight & Logistics | | | 713 | | | | 320 | | | | — | | | | 1,033 | | |
Airlines | | | 22 | | | | 1,086 | | | | — | | | | 1,108 | | |
Auto Components | | | 338 | | | | 1,242 | | | | — | | | | 1,580 | | |
Automobiles | | | 542 | | | | 3,304 | | | | — | | | | 3,846 | | |
Banks | | | 11,730 | | | | 21,591 | | | | — | | | | 33,321 | | |
Beverages | | | 2,190 | | | | 2,803 | | | | — | | | | 4,993 | | |
Biotechnology | | | 3,167 | | | | 544 | | | | — | | | | 3,711 | | |
Building Products | | | 14 | | | | 1,810 | | | | — | | | | 1,824 | | |
Capital Markets | | | 2,763 | | | | 2,928 | | | | — | | | | 5,691 | | |
Chemicals | | | 1,528 | | | | 3,574 | | | | — | | | | 5,102 | | |
Commercial Services &
Supplies | | | 682 | | | | 563 | | | | — | | | | 1,245 | | |
Communications
Equipment | | | 2,353 | | | | 636 | | | | — | | | | 2,989 | | |
Construction & Engineering | | | 132 | | | | 2,468 | | | | — | | | | 2,600 | | |
Construction Materials | | | — | | | | 871 | | | | — | | | | 871 | | |
Consumer Finance | | | 834 | | | | — | | | | — | | | | 834 | | |
Containers & Packaging | | | 192 | | | | 120 | | | | — | | | | 312 | | |
Distributors | | | 9 | | | | — | | | | — | | | | 9 | | |
Diversified Consumer
Services | | | 219 | | | | — | | | | — | | | | 219 | | |
Diversified Financial
Services | | | 881 | | | | 2,010 | | | | — | | | | 2,891 | | |
Diversified
Telecommunication
Services | | | 2,468 | | | | 4,672 | | | | — | | | | 7,140 | | |
Electric Utilities | | | 2,171 | | | | 2,592 | | | | — | | | | 4,763 | | |
Electrical Equipment | | | 521 | | | | 1,364 | | | | — | | | | 1,885 | | |
Electronic Equipment,
Instruments &
Components | | | 305 | | | | 1,046 | | | | — | | | | 1,351 | | |
Energy Equipment &
Services | | | 1,623 | | | | 294 | | | | — | | | | 1,917 | | |
Food & Staples Retailing | | | 4,156 | | | | 2,137 | | | | — | | | | 6,293 | | |
Food Products | | | 1,640 | | | | 3,699 | | | | — | | | | 5,339 | | |
Gas Utilities | | | 29 | | | | 696 | | | | — | | | | 725 | | |
Investment Type | �� | Level 1
Unadjusted
quoted
prices
(000) | | Level 2
Other
significant
observable
inputs
(000) | | Level 3
Significant
unobservable
inputs
(000) | | Total
(000) | |
Common Stocks (cont'd) | |
Health Care Equipment &
Supplies | | $ | 2,660 | | | $ | 869 | | | $ | — | | | $ | 3,529 | | |
Health Care Providers &
Services | | | 3,343 | | | | 373 | | | | — | | | | 3,716 | | |
Health Care Technology | | | 133 | | | | — | | | | — | | | | 133 | | |
Hotels, Restaurants &
Leisure | | | 2,417 | | | | 1,618 | | | | — | | | | 4,035 | | |
Household Durables | | | 225 | | | | 511 | | | | — | | | | 736 | | |
Household Products | | | 2,624 | | | | 1,300 | | | | — | | | | 3,924 | | |
Independent Power
Producers & Energy
Traders | | | 25 | | | | 83 | | | | — | | | | 108 | | |
Industrial Conglomerates | | | 922 | | | | 1,522 | | | | — | | | | 2,444 | | |
Information Technology
Services | | | 4,363 | | | | 2,158 | | | | — | | | | 6,521 | | |
Insurance | | | 1,275 | | | | 5,379 | | | | — | | | | 6,654 | | |
Internet & Catalog Retail | | | 1,328 | | | | 128 | | | | — | | | | 1,456 | | |
Internet Software &
Services | | | 2,694 | | | | 73 | | | | — | | | | 2,767 | | |
Leisure Products | | | 46 | | | | — | | | | — | | | | 46 | | |
Life Sciences Tools &
Services | | | 557 | | | | 134 | | | | — | | | | 691 | | |
Machinery | | | 1,249 | | | | 2,172 | | | | — | | | | 3,421 | | |
Marine | | | — | | | | 309 | | | | — | | | | 309 | | |
Media | | | 5,059 | | | | 2,425 | | | | — | | | | 7,484 | | |
Metals & Mining | | | 2,044 | | | | 2,614 | | | | — | | | | 4,658 | | |
Multi-Utilities | | | 1,609 | | | | 1,297 | | | | — | | | | 2,906 | | |
Multi-line Retail | | | 1,446 | | | | 359 | | | | — | | | | 1,805 | | |
Oil, Gas & Consumable
Fuels | | | 7,473 | | | | 4,936 | | | | — | | | | 12,409 | | |
Paper & Forest Products | | | 28 | | | | 214 | | | | — | | | | 242 | | |
Personal Products | | | 254 | | | | 1,983 | | | | — | | | | 2,237 | | |
Pharmaceuticals | | | 5,150 | | | | 10,792 | | | | — | | | | 15,942 | | |
Professional Services | | | 620 | | | | 2,586 | | | | — | | | | 3,206 | | |
Real Estate Investment
Trusts (REITs) | | | 3,489 | | | | 1,546 | | | | — | | | | 5,035 | | |
Real Estate Management &
Development | | | 501 | | | | 1,935 | | | | — | | | | 2,436 | | |
Road & Rail | | | 1,580 | | | | 1,693 | | | | — | | | | 3,273 | | |
Semiconductors &
Semiconductor
Equipment | | | 2,731 | | | | 662 | | | | 6 | | | | 3,399 | | |
Software | | | 3,873 | | | | 808 | | | | — | | | | 4,681 | | |
Specialty Retail | | | 3,395 | | | | 1,596 | | | | — | | | | 4,991 | | |
Tech Hardware, Storage &
Peripherals | | | 7,048 | | | | 633 | | | | — | | | | 7,681 | | |
Textiles, Apparel & Luxury
Goods | | | 844 | | | | 1,692 | | | | — | | | | 2,536 | | |
Thrifts & Mortgage Finance | | | 91 | | | | — | | | | — | | | | 91 | | |
Tobacco | | | 1,522 | | | | 2,099 | | | | — | | | | 3,621 | | |
Trading Companies &
Distributors | | | 227 | | | | 1,187 | | | | — | | | | 1,414 | | |
Transportation
Infrastructure | | | — | | | | 1,733 | | | | — | | | | 1,733 | | |
Water Utilities | | | — | | | | 3 | | | | — | | | | 3 | | |
Wireless
Telecommunication
Services | | | 227 | | | | 2,217 | | | | — | | | | 2,444 | | |
Total Common Stocks | | | 116,472 | | | | 124,810 | | | | 6 | | | | 241,288 | | |
44
Morgan Stanley Institutional Fund Trust
Annual Report — September 30, 2015
Notes to Financial Statements (cont'd)
Investment Type | | Level 1
Unadjusted
quoted
prices
(000) | | Level 2
Other
significant
observable
inputs
(000) | | Level 3
Significant
unobservable
inputs
(000) | | Total
(000) | |
Investment Companies | | $ | 360 | | | $ | — | | | $ | — | | | $ | 360 | | |
Rights | | | — | | | | 1 | | | | — | | | | 1 | | |
Warrant | | | 3 | | | | — | | | | — | | | | 3 | | |
Short-Term Investments | |
Investment Company | | | 30,788 | | | | — | | | | — | | | | 30,788 | | |
U.S Treasury Security | | | — | | | | 7,094 | | | | — | | | | 7,094 | | |
Total Short-Term
Investments | | | 30,788 | | | | 7,094 | | | | — | | | | 37,882 | | |
Foreign Currency Forward
Exchange Contracts | | | — | | | | 1,099 | | | | — | | | | 1,099 | | |
Futures Contracts | | | 578 | | | | — | | | | — | | | | 578 | | |
Credit Default Swap
Agreements | | | — | | | | 61 | | | | — | | | | 61 | | |
Interest Rate Swap
Agreement | | | — | | | | 1 | | | | — | | | | 1 | | |
Total Return Swap
Agreements | | | — | | | | 761 | | | | — | | | | 761 | | |
Total Assets | | | 148,201 | | | | 249,954 | | | | 6 | | | | 398,161 | | |
Liabilities: | |
Foreign Currency Forward
Exchange Contracts | | | — | | | | (1,063 | ) | | | — | | | | (1,063 | ) | |
Futures Contracts | | | (1,238 | ) | | | — | | | | — | | | | (1,238 | ) | |
Credit Default Swap
Agreement | | | — | | | | (1 | ) | | | — | | | | (1 | ) | |
Interest Rate Swap
Agreements | | | — | | | | (337 | ) | | | — | | | | (337 | ) | |
Total Return Swap
Agreements | | | — | | | | (738 | ) | | | — | | | | (738 | ) | |
Total Liabilities | | | (1,238 | ) | | | (2,139 | ) | | | — | | | | (3,377 | ) | |
Total | | $ | 146,963 | | | $ | 247,815 | | | $ | 6 | | | $ | 394,784 | | |
Transfers between investment levels may occur as the markets fluctuate and/or the availability of data used in an investment's valuation changes. The Portfolio recognizes transfers between the levels as of the end of the period. As of September 30, 2015, securities with a total value of approximately $119,110,000 transferred from Level 1 to Level 2. At September 30, 2015, the fair value of certain securities were adjusted due to developments which occurred between the time of the close of the foreign markets on which they trade and the close of business on the NYSE which resulted in their Level 2 classification.
Following is a reconciliation of investments in which significant unobservable inputs (Level 3) were used in determining fair value.
| | | Common
Stock
(000) | |
Beginning Balance | | $ | — | | |
Purchases | | | 38 | | |
Sales | | | — | | |
Amortization of discount | | | — | | |
Transfers in | | | — | | |
Transfers out | | | — | | |
Corporate actions | | | — | | |
Change in unrealized appreciation (depreciation) | | | (32 | ) | |
Realized gains (losses) | | | — | | |
Ending Balance | | $ | 6 | | |
Net change in unrealized appreciation (depreciation) from investments
still held as of September 30, 2015 | | $ | (32 | ) | |
The following table presents additional information about valuation techniques and inputs used for investments that are measured at fair value and categorized within Level 3 as of September 30, 2015.
| | | Fair Value at
September 30, 2015
(000) | | Valuation
Technique | | Unobservable
Input | | Range | | Selected
Value | | Impact to
Valuation from an
Increase in Input | |
Semiconductors & Semiconductors Equipment | |
Common Stock | | $ | 6 | | | Market Transaction
Method | | Last Traded Price | | $ | 0.50 | | | $ | 0.50 | | | $ | 0.50 | | | Increase | |
| | | | |
Discounted Cash Flow | | Weighted Average
Cost of Capital | | | 13.0 | % | | | 13.0 | % | | | 13.0 | % | | Decrease | |
| | | | | | | Long-Term Growth Rate | | | 3.5 | % | | | 3.5 | % | | | 3.5 | % | | Increase | |
| | | | | | | Capitalization Rate | | | 9.5 | % | | | 9.5 | % | | | 9.5 | % | | Increase | |
| | | | | Market Comparable
Companies | | Enterprise Value/EBITDA | | | 5.6 | x | | | 6.9 | x | | | 6.0 | x | | Increase | |
| | | | | | | Discount for Lack
of Marketability | | | 15.0 | % | | | 15.0 | % | | | 15.0 | % | | Decrease | |
45
Morgan Stanley Institutional Fund Trust
Annual Report — September 30, 2015
Notes to Financial Statements (cont'd)
3. Foreign Currency Translation and Foreign Investments: The books and records of the Portfolio are maintained in U.S. dollars. Foreign currency amounts are translated into U.S. dollars as follows:
– investments, other assets and liabilities at the prevailing rate of exchange on the valuation date;
– investment transactions and investment income at the prevailing rates of exchange on the dates of such transactions.
Although the net assets of the Portfolio are presented at the foreign exchange rates and market values at the close of the period, the Portfolio does not isolate that portion of the results of operations arising as a result of changes in the foreign exchange rates from the fluctuations arising from changes in the market prices of securities held at period end. Similarly, the Portfolio does not isolate the effect of changes in foreign exchange rates from the fluctuations arising from changes in the market prices of securities sold during the period. Accordingly, realized and unrealized foreign currency gains (losses) on investments in securities are included in the reported net realized and unrealized gains (losses) on investment transactions and balances. However, pursuant to U.S. Federal income tax regulations, gains and losses from certain foreign currency transactions and the foreign currency portion of gains and losses realized on sales and maturities of foreign denominated debt securities are treated as ordinary income for U.S. Federal income tax purposes.
Net realized gains (losses) on foreign currency transactions represent net foreign exchange gains (losses) from foreign currency forward exchange contracts, disposition of foreign currencies, currency gains (losses) realized between the trade and settlement dates on securities transactions, and the difference between the amount of investment income and foreign withholding taxes recorded on the Portfolio's books and the U.S. dollar equivalent amounts actually received or paid. Net unrealized currency gains (losses) from valuing foreign currency denominated assets and liabilities at period end exchange rates are reflected as a component of unrealized appreciation (depreciation) in the Statement of Assets and Liabilities. The change in unrealized currency gains (losses) on foreign currency translations on foreign currency translations for the period is reflected in the Statement of Operations.
Foreign security and currency transactions may involve certain considerations and risks not typically associated with those of U.S. dollar denominated transactions as a result of, among other factors, fluctuations of exchange rates in relation to the U.S. dollar, the possibility of lower levels of governmental supervision and regulation of foreign securities markets and the possibility of political or economic instability.
Governmental approval for foreign investments may be required in advance of making an investment under certain circumstances in some countries, and the extent of foreign investments in domestic companies may be subject to limitation in other countries. Foreign ownership limitations also may be imposed by the charters of individual companies to prevent, among other concerns, violations of foreign investment limitations. As a result, an additional class of shares (identified as "Foreign" in the Portfolio of Investments) may be created and offered for investment. The "local" and "foreign shares" market values may differ. In the absence of trading of the foreign shares in such markets, the Portfolio values the foreign shares at the closing exchange price of the local shares.
4. Derivatives: The Portfolio may, but is not required to, use derivative instruments for a variety of purposes, including hedging, risk management, portfolio management or to earn income. Derivatives are financial instruments whose value is based, in part, on the value of an underlying asset, interest rate, index or financial instrument. Prevailing interest rates and volatility levels, among other things, also affect the value of derivative instruments. A derivative instrument often has risks similar to its underlying asset and may have additional risks, including imperfect correlation between the value of the derivative and the underlying asset, risks of default by the counterparty to certain transactions, magnification of losses incurred due to changes in the market value of the securities, instruments, indices or interest rates to which the derivative instrument relates, risks that the transactions may not be liquid and risks arising from margin requirements. The use of derivatives involves risks that are different from, and possibly greater than, the risks associated with other portfolio investments. Derivatives may involve the use of highly specialized instruments that require investment techniques and risk analyses different from those associated with other portfolio investments. All of the Portfolio's holdings, including derivative instruments, are marked-to-market each day with the change in value reflected in
46
Morgan Stanley Institutional Fund Trust
Annual Report — September 30, 2015
Notes to Financial Statements (cont'd)
unrealized appreciation (depreciation). Upon disposition, a realized gain or loss is recognized.
Certain derivative transactions may give rise to a form of leverage. Leverage magnifies the potential for gain and the risk of loss. Leverage associated with derivative transactions may cause the Portfolio to liquidate portfolio positions when it may not be advantageous to do so to satisfy its obligations or to meet earmarking or segregation requirements, pursuant to applicable Securities and Exchange Commission rules and regulations, or may cause the Portfolio to be more volatile than if the Portfolio had not been leveraged. Although the Adviser seeks to use derivatives to further the Portfolio's investment objectives, there is no assurance that the use of derivatives will achieve this result.
Following is a description of the derivative instruments and techniques that the Portfolio used during the period and their associated risks:
Futures: A futures contract is a standardized, exchange-traded agreement to buy or sell a specific quantity of an underlying asset, reference rate or index at a specific price at a specific future time. The value of a futures contract tends to increase and decrease in tandem with the value of the underlying instrument. Depending on the terms of the particular contract, futures contracts are settled through either physical delivery of the underlying instrument on the settlement date or by payment of a cash settlement amount on the settlement date. During the period the futures contract is open, payments are received from or made to the broker based upon changes in the value of the contract (the variation margin). A decision as to whether, when and how to use futures contracts involves the exercise of skill and judgment and even a well-conceived futures transaction may be unsuccessful because of market behavior or unexpected events. In addition to the derivatives risks discussed above, the prices of futures contracts can be highly volatile, using futures contracts can lower total return, and the potential loss from futures contracts can exceed the Portfolio's initial investment in such contracts. No assurance can be given that a liquid market will exist for any particular futures contract at any particular time. There is also the risk of loss by the Portfolio of margin deposits in the event of bankruptcy of a broker with which the Portfolio has open positions in the futures contract.
Swaps: The Portfolio may enter into OTC swap contracts or cleared swap transactions. A swap contract is an agreement between two parties pursuant to which the parties exchange payments at specified dates on the basis of a specified notional amount, with the payments calculated by reference to specified securities, indices, reference rates, currencies or other instruments. Typically swap agreements provide that when the period payment dates for both parties are the same, the payments are made on a net basis (i.e., the two payment streams are netted out, with only the net amount paid by one party to the other). The Portfolio's obligations or rights under a swap contract entered into on a net basis will generally be equal only to the net amount to be paid or received under the agreement, based on the relative values of the positions held by each party. Cleared swap transactions may help reduce counterparty credit risk. In a cleared swap, the Portfolio's ultimate counterparty is a clearinghouse rather than a swap dealer, bank or other financial institution. OTC swap agreements are not entered into or traded on exchanges and often there is no central clearing or guaranty function for OTC swaps. These OTC swaps are often subject to credit risk or the risk of default or non-performance by the counterparty. Both OTC and cleared swaps could result in losses if interest rates, foreign currency exchange rates or other factors are not correctly anticipated by the Portfolio or if the reference index, security or investments do not perform as expected. During the period swap agreements are open, payments are received from or made to the clearinghouse or counterparty based upon changes in the value of the contract (variation margin). The Dodd-Frank Wall Street Reform and Consumer Protection Act and related regulatory developments require the clearing and exchange-trading of certain standardized swap transactions. Mandatory exchange-trading and clearing is occurring on a phased-in basis.
The Portfolio's use of swaps during the period included those based on the credit of an underlying security commonly referred to as "credit default swaps." The Portfolio may be either the buyer or seller in a credit default swap. Where the Portfolio is the buyer of a credit default swap contract, it would typically be entitled to receive the par (or other agreed-upon) value of a referenced debt obligation from the counterparty to the contract only in the event of a default or similar event by the issuer of
47
Morgan Stanley Institutional Fund Trust
Annual Report — September 30, 2015
Notes to Financial Statements (cont'd)
the debt obligation. If no default occurs, the Portfolio would have paid to the counterparty a periodic stream of payments over the term of the contract and received no benefit from the contract. When the Portfolio is the seller of a credit default swap contract, it typically receives the stream of payments but is obligated to pay an amount equal to the par (or other agreed-upon) value of a referenced debt obligation upon the default or similar event by the issuer of the referenced debt obligation. The use of credit default swaps could result in losses to the Portfolio if the Adviser fails to correctly evaluate the creditworthiness of the issuer of the referenced debt obligation.
If the Portfolio is a seller of protection and a credit event occurs, as defined under the terms of that particular swap agreement, the Portfolio will either (i) pay to the buyer of protection an amount equal to the notional amount of the swap agreement and take delivery of the referenced obligation, other deliverable obligations or underlying securities comprising the referenced index or (ii) pay a net settlement amount in the form of cash or securities equal to the notional amount of the swap agreement less the recovery value of the referenced obligation or underlying securities comprising the referenced index. If the Portfolio is a buyer of protection and a credit event occurs, as defined under the terms of that particular swap agreement, the Portfolio will either (i) receive from the seller of protection an amount equal to the notional amount of the swap agreement and deliver the referenced obligation, other deliverable obligations or underlying securities comprising the referenced index or (ii) receive a net settlement amount in the form of cash or securities equal to the notional amount of the swap agreement less the recovery value of the referenced obligation or underlying securities comprising the referenced index. Recovery values are estimated by market makers considering either industry standard recovery rates or entity specific factors and considerations until a credit event occurs. If a credit event has occurred, the recovery value is determined by a facilitated auction whereby a minimum number of allowable broker bids, together with a specified valuation method, are used to calculate the settlement value. The Portfolio's maximum risk of loss from counterparty risk, either as the protection seller or as the protection buyer, is the fair value of the swap agreement.
The current credit rating of each individual issuer is listed in the table following the Portfolio of Investments and serves as an indicator of the current status of the payment/performance risk of the credit derivative. Alternatively, for credit default swaps on an index of credits, the quoted market prices and current values serve as an indicator of the current status of the payment/performance risk of the credit derivative. Generally, lower credit ratings and increasing market values, in absolute terms, represent a deterioration of the credit and a greater likelihood of an adverse credit event of the issuer.
When the Portfolio has an unrealized loss on a swap agreement, the Portfolio has instructed the custodian to pledge cash or liquid securities as collateral with a value approximately equal to the amount of the unrealized loss. Collateral pledges are monitored and subsequently adjusted if and when the swap valuations fluctuate. If applicable, cash collateral is included with "Due from (to) Broker" in the Statement of Assets and Liabilities.
Upfront payments received or paid by the Portfolio will be reflected as an asset or liability, respectively, in the Statement of Assets and Liabilities.
Foreign Currency Forward Exchange Contracts: In connection with its investments in foreign securities, the Portfolio also entered into contracts with banks, brokers or dealers to purchase or sell securities or foreign currencies at a future date. A foreign currency forward exchange contract ("currency contract") is a negotiated agreement between the contracting parties to exchange a specified amount of currency at a specified future time at a specified rate. The rate can be higher or lower than the spot rate between the currencies that are the subject of the contract. Currency contracts may be used to protect against uncertainty in the level of future foreign currency exchange rates or to gain or modify exposure to a particular currency. In addition, the Portfolio may use cross currency hedging or proxy hedging with respect to currencies in which the Portfolio has or expects to have portfolio or currency exposure. Cross currency hedges involve the sale of one currency against the positive exposure to a different currency and may be used for hedging purposes or to establish an active exposure to the exchange rate between any two currencies. To the extent hedged by the use of currency contracts, the precise matching of the currency contract amounts and the value of the securities involved will not generally be possible
48
Morgan Stanley Institutional Fund Trust
Annual Report — September 30, 2015
Notes to Financial Statements (cont'd)
because the future value of such securities in foreign currencies will change as a consequence of market movements in the value of those securities between the date on which the contract is entered into and the date it matures. Furthermore, such transactions may reduce or preclude the opportunity for gain if the value of the currency should move in the direction opposite to the position taken. There is additional risk to the extent that currency contracts create exposure to currencies in which the Portfolio's securities are not denominated. Unanticipated changes in currency prices may result in poorer overall performance for the Portfolio than if it had not entered into such contracts. The use of currency contracts involves the risk of loss from the insolvency or bankruptcy of the counterparty to the contract or the failure of the counterparty to make payments or otherwise comply with the terms of the contract. A currency contract is marked-to-market daily and the change in market value is recorded by the Portfolio as unrealized gain or loss. The Portfolio records realized gains (losses) when the currency contract is closed equal to the difference between the value of the currency contract at the time it was opened and the value at the time it was closed.
FASB ASC 815, "Derivatives and Hedging" ("ASC 815"), is intended to improve financial reporting about derivative instruments by requiring enhanced disclosures to enable investors to better understand how and why the Portfolio uses derivative instruments, how these derivative instruments are accounted for and their effects on the Portfolio's financial position and results of operations.
The following tables set forth the fair value of the Portfolio's derivative contracts by primary risk exposure as of September 30, 2015.
| | | Asset Derivatives
Statement of Assets and
Liabilities Location | | Primary Risk
Exposure | | Value
(000) | |
Foreign Currency
Forward Exchange
Contracts | | Unrealized Appreciation on
Foreign Currency Forward
Exchange Contracts | |
Currency Risk | | $ | 1,099 | | |
Futures Contract
| | Variation Margin on
Futures Contract | |
Currency Risk | | | 63 | (a) | |
Futures Contracts
| | Variation Margin on
Futures Contracts | |
Equity Risk | | | 454 | (a) | |
Futures Contracts
| | Variation Margin on
Futures Contracts | |
Interest Rate Risk | | | 61 | (a) | |
Swap Agreements
| | Unrealized Appreciation on
Swap Agreements | |
Credit Risk | | | 61 | | |
Swap Agreements
| | Unrealized Appreciation on
Swap Agreements | |
Equity Risk | | | 761 | | |
Swap Agreement
| | Unrealized Appreciation on
Swap Agreement | |
Interest Rate Risk | | | 1 | | |
Total | | | | | | $ | 2,500 | | |
| | | Liability Derivatives
Statement of Assets and
Liabilities Location | | Primary Risk
Exposure | | Value
(000) | |
Foreign Currency
Forward Exchange
Contracts | | Unrealized Depreciation on
Foreign Currency Forward
Exchange Contracts | |
Currency Risk | | $ | (1,063 | ) | |
Futures Contracts
| | Variation Margin on
Futures Contracts | |
Commodity Risk | | | (155 | )(a) | |
Futures Contracts
| | Variation Margin on
Futures Contracts | |
Equity Risk | | | (493 | )(a) | |
Futures Contracts
| | Variation Margin on
Futures Contracts | |
Interest Rate Risk | | | (590 | )(a) | |
Swap Agreement
| | Unrealized Depreciation on
Swap Agreement | |
Credit Risk | | | (1 | ) | |
Swap Agreements
| | Unrealized Depreciation on
Swap Agreements | |
Equity Risk | | | (738 | ) | |
Swap Agreements
| | Unrealized Depreciation on
Swap Agreements | |
Interest Rate Risk | | | (50 | ) | |
Swap Agreements
| | Variation Margin on
Swap Agreements | |
Interest Rate Risk | | | (287 | )(a) | |
Total | | | | | | $ | (3,377 | ) | |
(a) This amount represents the cumulative appreciation (depreciation) as reported in the Portfolio of Investments. The Statement of Assets and Liabilities only reflects the current day's net variation margin.
The following tables set forth by primary risk exposure the Portfolio's realized gains (losses) and change in unrealized appreciation (depreciation) by type of derivative contract for the year ended September 30, 2015 in accordance with ASC 815.
Realized Gain (Loss) | |
Primary Risk Exposure | | Derivative Type | | Value
(000) | |
Currency Risk
| | Foreign Currency Forward
Exchange Contracts | | $ | 5,606 | | |
Commodity Risk | | Futures Contracts | | | 659 | | |
Currency Risk | | Futures Contracts | | | 750 | | |
Equity Risk | | Futures Contracts | | | (7,456 | ) | |
Interest Rate Risk | | Futures Contracts | | | 705 | | |
Credit Risk | | Swap Agreements | | | 257 | | |
Equity Risk | | Swap Agreements | | | (4,735 | ) | |
Interest Rate Risk | | Swap Agreements | | | (3,036 | ) | |
| | | Total | | $ | (7,250 | ) | |
Change in Unrealized Appreciation (Depreciation) | |
Primary Risk Exposure | | Derivative Type | | Value
(000) | |
Currency Risk
| | Foreign Currency Forward
Exchange Contracts | | $ | (1,618 | ) | |
Commodity Risk | | Futures Contracts | | | (582 | ) | |
Currency Risk | | Futures Contracts | | | (58 | ) | |
Equity Risk | | Futures Contracts | | | 255 | | |
Interest Rate Risk | | Futures Contracts | | | (893 | ) | |
Credit Risk | | Swap Agreements | | | 49 | | |
Equity Risk | | Swap Agreements | | | (1,474 | ) | |
Interest Rate Risk | | Swap Agreements | | | (578 | ) | |
| | | Total | | $ | (4,899 | ) | |
49
Morgan Stanley Institutional Fund Trust
Annual Report — September 30, 2015
Notes to Financial Statements (cont'd)
At September 30, 2015, the Portfolio's derivative assets and liabilities are as follows:
Gross Amounts of Assets and Liabilities Presented in the
Statement of Assets and Liabilities | |
Derivatives(b) | | Assets(c)
(000) | | Liabilities(c)
(000) | |
Foreign Currency Forward Exchange Contracts | | $ | 1,099 | | | $ | (1,063 | ) | |
Swap Agreements | | | 823 | | | | (789 | ) | |
Total | | $ | 1,922 | | | $ | (1,852 | ) | |
(b) Excludes exchange traded derivatives.
(c) Absent an event of default or early termination, OTC derivative assets and liabilities are presented gross and not offset in the Statement of Assets and Liabilities.
The Portfolio typically enters into International Swaps and Derivatives Association, Inc. Master Agreements ("ISDA Master Agreements") or similar master agreements (collectively, "Master Agreements") with its contract counterparties for certain OTC derivatives in order to, among other things, reduce its credit risk to counterparties. ISDA Master Agreements include provisions for general obligations, representations, collateral and events of default or termination. Under an ISDA Master Agreement, the Portfolio typically may offset with the counterparty certain OTC derivative financial instruments' payables and/or receivables with collateral held and/or posted and create one single net payment (close-out netting) in the event of default, termination and/or potential deterioration in the credit quality of the counterparty. Various Master Agreements govern the terms of certain transactions with counterparties, including transactions such as swap, forward, repurchase and reverse repurchase agreements. These Master Agreements typically attempt to reduce the counterparty risk associated with such transactions by specifying credit protection mechanisms and providing standardization that improves legal certainty. Cross-termination provisions under Master Agreements typically provide that a default in connection with one transaction between the Portfolio and a counterparty gives the non-defaulting party the right to terminate any other transactions in place with the defaulting party to create one single net payment due to/due from the defaulting party and may be a feature in certain Master Agreements. In the event the Portfolio exercises its right to terminate a Master Agreement after a counterparty experiences a termination event as defined in the Master Agreement, the return of collateral with market value in excess of the Portfolio's net liability may be delayed or denied.
The following tables present derivative financial instruments that are subject to enforceable netting arrangements as of September 30, 2015.
Gross Amounts Not Offset in the Statement of Assets and Liabilities | |
Counterparty | | Gross Asset
Derivatives
Presented in
Statement of
Assets and
Liabilities
(000) | | Financial
Instrument
(000) | | Collateral
Received(d)
(000) | | Net Amount
(not less
than $0)
(000) | |
Bank of America NA | | $ | 37 | | | $ | (26 | ) | | $ | — | | | $ | 11 | | |
Bank of Montreal | | | 50 | | | | (50 | ) | | | — | | | | 0 | | |
Bank of New York Mellon | | | 7 | | | | (7 | ) | | | — | | | | 0 | | |
Barclays Bank PLC | | | 59 | | | | (59 | ) | | | — | | | | 0 | | |
Citibank NA | | | 474 | | | | (82 | ) | | | (325 | ) | | | 67 | | |
Commonwealth Bank of
Australia | | | 73 | | | | (73 | ) | | | — | | | | 0 | | |
Credit Suisse International | | | 19 | | | | (19 | ) | | | — | | | | 0 | | |
Deutsche Bank AG | | | 377 | | | | (102 | ) | | | (275 | ) | | | 0 | | |
Goldman Sachs International | | | 72 | | | | (72 | ) | | | — | | | | 0 | | |
HSBC Bank PLC | | | 5 | | | | (5 | ) | | | — | | | | 0 | | |
JPMorgan Chase Bank NA | | | 438 | | | | (155 | ) | | | (230 | ) | | | 53 | | |
State Street Bank and
Trust Co. | | | 66 | | | | (66 | ) | | | — | | | | 0 | | |
UBS AG | | | 245 | | | | (42 | ) | | | — | | | | 203 | | |
Total | | $ | 1,922 | | | $ | (758 | ) | | $ | (830 | ) | | $ | 334 | | |
(d) In some instances, the actual collateral received may be more than the amount shown here due to overcollateralization.
Gross Amounts Not Offset in the Statement of Assets and Liabilities | |
Counterparty | | Gross Liability
Derivatives
Presented in
Statement of
Assets and
Liabilities
(000) | | Financial
Instrument
(000) | | Collateral
Pledged(e)
(000) | | Net Amount
(not less
than $0)
(000) | |
Bank of America NA | | $ | 26 | | | $ | (26 | ) | | $ | — | | | $ | 0 | | |
Bank of Montreal | | | 102 | | | | (50 | ) | | | — | | | | 52 | | |
Bank of New York Mellon | | | 36 | | | | (7 | ) | | | — | | | | 29 | | |
Barclays Bank PLC | | | 679 | | | | (59 | ) | | | (620 | ) | | | 0 | | |
Citibank NA | | | 82 | | | | (82 | ) | | | — | | | | 0 | | |
Commonwealth Bank of
Australia | | | 120 | | | | (73 | ) | | | — | | | | 47 | | |
Credit Suisse International | | | 195 | | | | (19 | ) | | | — | | | | 176 | | |
Deutsche Bank AG | | | 102 | | | | (102 | ) | | | — | | | | 0 | | |
Goldman Sachs International | | | 126 | | | | (72 | ) | | | (54 | ) | | | 0 | | |
HSBC Bank PLC | | | 48 | | | | (5 | ) | | | — | | | | 43 | | |
JPMorgan Chase Bank NA | | | 155 | | | | (155 | ) | | | — | | | | 0 | | |
Northern Trust Company | | | 6 | | | | — | | | | — | | | | 6 | | |
State Street Bank and
Trust Co. | | | 123 | | | | (66 | ) | | | — | | | | 57 | | |
50
Morgan Stanley Institutional Fund Trust
Annual Report — September 30, 2015
Notes to Financial Statements (cont'd)
Gross Amounts Not Offset in the Statement of Assets and Liabilities | |
Counterparty | | Gross Liability
Derivatives
Presented in
Statement of
Assets and
Liabilities
(000) | | Financial
Instrument
(000) | | Collateral
Pledged(e)
(000) | | Net Amount
(not less
than $0)
(000) | |
UBS AG | | $ | 42 | | | $ | (42 | ) | | $ | — | | | $ | 0 | | |
Union Bank of Switzerland | | | 5 | | | | — | | | | — | | | | 5 | | |
Westpac Banking Corp. | | | 5 | | | | — | | | | — | | | | 5 | | |
Total | | $ | 1,852 | | | $ | (758 | ) | | $ | (674 | ) | | $ | 420 | | |
(e) In some instances, the actual collateral pledged may be more than the amount shown here due to overcollateralization.
For the year ended September 30, 2015, the approximate average monthly amount outstanding for each derivative type is as follows:
Foreign Currency Forward Exchange Contracts: | |
Average monthly principal amount | | $ | 179,842,000 | | |
Futures Contracts: | |
Average monthly original value | | $ | 374,167,000 | | |
Swap Agreements: | |
Average monthly notional amount | | $ | 300,835,000 | | |
5. When-Issued/Delayed Delivery Securities: The Portfolio purchases and sells when-issued and delayed delivery securities. Securities purchased on a when-issued or delayed delivery basis are purchased for delivery beyond the normal settlement date at a stated price and yield, and no income accrues to the Portfolio on such securities prior to delivery date. Payment and delivery for when-issued and delayed delivery securities can take place a month or more after the date of the transaction. When the Portfolio enters into a purchase transaction on a when-issued or delayed delivery basis, securities are available for collateral in an amount at least equal in value to the Portfolio's commitments to purchase such securities. Purchasing securities on a when-issued or delayed delivery basis may involve a risk that the market price at the time of delivery may be lower than the agreed upon purchase price, in which case there could be an unrealized loss at the time of delivery. Purchasing investments on a when-issued or delayed delivery basis may be considered a form of leverage which may increase the impact that gains (losses) may have on the Portfolio.
6. Indemnifications: The Fund enters into contracts that contain a variety of indemnifications. The Fund's maximum exposure under these arrangements is unknown. However, the Fund has not had prior claims or losses
pursuant to these contracts and expects the risk of loss to be remote.
7. Dividends and Distributions to Shareholders: Dividend income and distributions to shareholders are recorded on the ex-dividend date. Dividends from net investment income, if any, are declared and paid annually. Net realized capital gains, if any, are distributed at least annually.
8. Security Transactions, Income and Expenses: Security transactions are accounted for on the trade date (date the order to buy or sell is executed). Realized gains and losses on the sale of investment securities are determined on the specific identified cost method. Dividend income and other distributions are recorded on the ex-dividend date (except for certain foreign dividends which may be recorded as soon as the Portfolio is informed of such dividends) net of applicable withholding taxes. Interest income is recognized on the accrual basis except where collection is in doubt. Discounts are accreted and premiums are amortized over the life of the respective securities. Most expenses of the Fund can be directly attributed to a particular Portfolio. Expenses which cannot be directly attributed are apportioned among the Portfolios based upon relative net assets or other appropriate methods. Income, expenses (other than class specific expenses — distribution, transfer agency and sub transfer agency fees) and realized and unrealized gains or losses are allocated to each class of shares based upon their relative net assets.
The Portfolio owns shares of real estate investment trusts ("REITs") which report information on the source of their distributions annually in the following calendar year. A portion of distributions received from REITs during the year is estimated to be a return of capital and is recorded as a reduction of their cost.
B. Advisory Fees: The Adviser, a wholly-owned subsidiary of Morgan Stanley, provides the Portfolio with advisory services under the terms of an Investment Advisory Agreement, paid quarterly, at an annual rate of 0.45% of the average daily net assets of the Portfolio.
The Adviser has agreed to reduce its advisory fee and/or reimburse the Portfolio so that total annual portfolio operating expenses, excluding certain investment related expenses, taxes, interest and other extraordinary expenses (including litigation), will not exceed 0.74% for Class I shares, 1.09% for Class A
51
Morgan Stanley Institutional Fund Trust
Annual Report — September 30, 2015
Notes to Financial Statements (cont'd)
shares, 1.59% for Class L shares, 1.84% for Class C shares and 0.71% for Class IS shares. The fee waivers and/or expense reimbursements will continue for at least one year from the date of the Portfolio's prospectus or until such time that the Trustees act to discontinue all or a portion of such waivers and/or reimbursements when they deem such action is appropriate. For the year ended September 30, 2015, approximately $208,000 of advisory fees were waived and approximately $40,000 of other expenses were reimbursed by the Adviser pursuant to this arrangement.
C. Administration Fees: The Adviser also serves as Administrator to the Fund and provides administrative services pursuant to an Administration Agreement for an annual fee, accrued daily and paid monthly, of 0.08% of the Portfolio's average daily net assets. Under a Sub-Administration Agreement between the Administrator and State Street Bank and Trust Company ("State Street"), State Street provides certain administrative services to the Fund. For such services, the Administrator pays State Street a portion of the fee the Administrator receives from the Portfolio.
D. Distribution and Shareholder Services Fees: Morgan Stanley Distribution, Inc. ("MSDI" or the "Distributor"), a wholly-owned subsidiary of the Adviser, and an indirect subsidiary of Morgan Stanley, serves as the Fund's Distributor of Portfolio shares pursuant to a Distribution Agreement. The Fund has adopted a Shareholder Services Plan with respect to Class A shares pursuant to Rule 12b-1 under the Act. Under the Shareholder Services Plan, the Portfolio pays the Distributor a shareholder services fee, accrued daily and paid monthly, at an annual rate of 0.25% of the Portfolio's average daily net assets attributable to Class A shares.
The Fund has adopted a Distribution and Shareholder Services Plan with respect to Class L shares pursuant to Rule 12b-1 under the Act. Under the Distribution and Shareholder Services Plan, the Portfolio pays the Distributor a distribution fee, accrued daily and paid monthly, at an annual rate of 0.50% and a shareholder services fee, accrued daily and paid monthly, at an annual rate of 0.25% of the Portfolio's average daily net assets attributable to Class L shares.
The Fund has adopted a Distribution and Shareholder Services Plan with respect to Class C shares pursuant to Rule 12b-1 under the Act. Under the Distribution and Shareholder Services Plan, the Portfolio pays the Distributor a distribution fee, accrued daily and paid monthly, at an annual rate of 0.75% and a shareholder services fee, accrued daily and paid monthly, at
an annual rate of 0.25% of the Portfolio's average daily net assets attributable to Class C shares.
The distribution and shareholder services fees are used to support the expenses associated with servicing and maintaining accounts. The Distributor may compensate other parties for providing shareholder support services to investors who purchase Class A, Class L and Class C shares.
E. Dividend Disbursing and Transfer Agent: The Fund's dividend disbursing and transfer agent is Boston Financial Data Services, Inc. ("BFDS"). Pursuant to a Transfer Agency Agreement, the Fund pays BFDS a fee based on the number of classes, accounts and transactions relating to the Portfolios of the Fund.
F. Custodian Fees: State Street (the "Custodian") serves as Custodian for the Fund in accordance with a Custodian Agreement. The Custodian holds cash, securities, and other assets of the Fund as required by the Act. Custody fees are payable monthly based on assets held in custody, investment purchases and sales activity and account maintenance fees, plus reimbursement for certain out-of-pocket expenses.
G. Security Transactions and Transactions with Affiliates: For the year ended September 30, 2015, purchases and sales of investment securities for the Portfolio, other than long-term U.S. Government securities and short-term investments, were approximately $243,788,000 and $248,639,000, respectively. For the year ended September 30, 2015, purchases and sales of long-term U.S. Government securities were approximately $147,166,000 and $148,443,000, respectively.
The Portfolio invests in the Institutional Class of the Morgan Stanley Institutional Liquidity Funds — Money Market Portfolio (the "Liquidity Funds"), an open-end management investment company managed by the Adviser. Advisory fees paid by the Portfolio are reduced by an amount equal to its pro-rata share of the advisory and administration fees paid by the Portfolio due to its investment in the Liquidity Funds. For the year ended September 30, 2015, advisory fees paid were reduced by approximately $46,000 relating to the Portfolio's investment in the Liquidity Funds.
A summary of the Portfolio's transactions in shares of the Liquidity Funds during the year ended September 30, 2015 is as follows:
Value
September 30,
2014
(000) | | Purchases
at Cost
(000) | | Sales
(000) | | Dividend
Income
(000) | | Value
September 30,
2015
(000) | |
| $ | 73,049 | | | $ | 221,126 | | | $ | 263,387 | | | $ | 44 | | | $ | 30,788 | | |
52
Morgan Stanley Institutional Fund Trust
Annual Report — September 30, 2015
Notes to Financial Statements (cont'd)
The Portfolio invests in Morgan Stanley Institutional Fund, Inc. — Emerging Markets Portfolio ("Emerging Markets Portfolio"), an open-end management investment company advised by an affiliate of the Adviser. Advisory fees paid by the Portfolio are reduced by an amount equal to its pro-rata share of the advisory and administration fees paid by the Emerging Markets Portfolio. For the year ended September 30, 2015, advisory fees paid were reduced by approximately $1,000 relating to the Portfolio's investment in the Emerging Markets Portfolio. The Emerging Markets Portfolio has a cost basis of approximately $132,000 at September 30, 2015.
A summary of the Portfolio's transactions in shares of the Emerging Markets Portfolio during the year ended September 30, 2015 is as follows:
Value
September 30,
2014
(000) | | Purchases
at Cost
(000) | | Sales
(000) | | Dividend
Income
(000) | | Value
September 30,
2015
(000) | |
| $ | 116 | | | $ | 6 | | | $ | — | | | $ | 6 | | | $ | 98 | | |
The Portfolio has an unfunded Deferred Compensation Plan (the "Compensation Plan"), which allows each independent Trustee to defer payment of all, or a portion, of the fees he or she receives for serving on the Board of Trustees. Each eligible Trustee generally may elect to have the deferred amounts credited with a return equal to the total return on one or more of the Morgan Stanley funds that are offered as investment options under the Compensation Plan. Appreciation/depreciation and distributions received from these investments are recorded with an offsetting increase/decrease in the deferred compensation obligation and do not affect the NAV of the Portfolio.
H. Federal Income Taxes: It is the Portfolio's intention to continue to qualify as a regulated investment company and distribute all of its taxable and tax-exempt income. Accordingly, no provision for Federal income taxes is required in the financial statements.
The Portfolio may be subject to taxes imposed by countries in which it invests. Such taxes are generally based on income and/or capital gains earned or repatriated. Taxes are accrued based on net investment income, net realized gains and net unrealized appreciation as such income and/or gains are earned. Taxes may also be based on transactions in foreign currency and are accrued based on the value of investments denominated in such currency.
FASB ASC 740-10, "Income Taxes — Overall", sets forth a minimum threshold for financial statement recognition of the benefit of a tax position taken or expected to be taken in a tax
return. Management has concluded there are no significant uncertain tax positions that would require recognition in the financial statements. If applicable, the Portfolio recognizes interest accrued related to unrecognized tax benefits in "Interest Expense" and penalties in "Other Expenses" in the Statement of Operations. The Portfolio files tax returns with the U.S. Internal Revenue Service, New York and various states. Each of the tax years in the four-year period ended September 30, 2015, remains subject to examination by taxing authorities.
The tax character of distributions paid may differ from the character of distributions shown in the Statements of Changes in Net Assets due to short-term capital gains being treated as ordinary income for tax purposes. The tax character of distributions paid during fiscal years 2015 and 2014 was as follows:
2015
Distributions
Paid From: | | 2014
Distributions
Paid From: | |
Ordinary
Income
(000) | | Long-Term
Capital Gain
(000) | | Ordinary
Income
(000) | | Long-Term
Capital Gain
(000) | |
| $ | 17,981 | | | $ | 6,726 | | | $ | 18,470 | | | $ | 19,196 | | |
The amount and character of income and gains to be distributed are determined in accordance with income tax regulations which may differ from GAAP. These book/tax differences are either considered temporary or permanent in nature.
Temporary differences are attributable to differing book and tax treatments for the timing of the recognition of gains (losses) on certain investment transactions and the timing of the deductibility of certain expenses.
Permanent differences, primarily due to differing treatments of gains (losses) related to foreign currency transactions, basis adjustments for swap transactions, paydown adjustments, distribution redesignations and tax adjustments on passive foreign investment companies sold by the Portfolio, resulted in the following reclassifications among the components of net assets at September 30, 2015:
Distributions in
Excess of
Net Investment
Income
(000) | |
Accumulated
Net Realized
Loss
(000) | | Paid-in-
Capital
(000) | |
| $ | (3,358 | ) | | $ | 3,358 | | | | — | | |
At September 30, 2015, the components of distributable earnings for the Portfolio on a tax basis were as follows:
Undistributed
Ordinary
Income
(000) | | Undistributed
Long-Term
Capital Gain
(000) | |
| $ | — | | | $ | 425 | | |
53
Morgan Stanley Institutional Fund Trust
Annual Report — September 30, 2015
Notes to Financial Statements (cont'd)
Capital losses and specified ordinary losses, including currency losses, incurred after October 31 but within the taxable year are deemed to arise on the first day of the Portfolio's next taxable year. For the year ended September 30, 2015, the Portfolio deferred to October 1, 2015 for U.S. Federal income tax purposes the following losses:
Post-October
Currency And
Specified Ordinary
Losses
(000) | | Post-October
Capital Losses
(000) | |
| | — | | | $ | 12,881 | | |
I. Other: At September 30, 2015, the Portfolio had otherwise unaffiliated record owners of 10% or greater. Investment activities of these shareholders could have a material impact on the Portfolio. The aggregate percentage of such owners was 70.2%.
54
Morgan Stanley Institutional Fund Trust
Annual Report — September 30, 2015
Report of Independent Registered Public Accounting Firm
To the Shareholders and Board of Trustees of
Morgan Stanley Institutional Fund Trust —
Global Strategist Portfolio
We have audited the accompanying statement of assets and liabilities, including the portfolio of investments, of Global Strategist Portfolio (one of the portfolios constituting Morgan Stanley Institutional Fund Trust) (the "Portfolio") as of September 30, 2015, and the related statement of operations for the year then ended, the statements of changes in net assets for each of the two years in the period then ended and the financial highlights for each of the years or periods indicated therein. These financial statements and financial highlights are the responsibility of the Portfolio's management. Our responsibility is to express an opinion on these financial statements and financial highlights based on our audits.
We conducted our audits in accordance with the standards of the Public Company Accounting Oversight Board (United States). Those standards require that we plan and perform the audit to obtain reasonable assurance about whether the financial statements and financial highlights are free of material misstatement. We were not engaged to perform an audit of the Portfolio's internal control over financial reporting. Our audits included consideration of internal control over financial reporting as a basis for designing audit procedures that are appropriate in the circumstances, but not for the purpose of expressing an opinion on the effectiveness of the Portfolio's internal control over financial reporting. Accordingly, we express no such opinion. An audit also includes examining, on a test basis, evidence supporting the amounts and disclosures in the financial statements and financial highlights, assessing the accounting principles used and significant estimates made by management, and evaluating the overall financial statement presentation. Our procedures included confirmation of securities owned as of September 30, 2015, by correspondence with the custodian and others or by other appropriate auditing procedures where replies from others were not received. We believe that our audits provide a reasonable basis for our opinion.
In our opinion, the financial statements and financial highlights referred to above present fairly, in all material respects, the financial position of Global Strategist Portfolio (one of the portfolios constituting Morgan Stanley Institutional Fund Trust) at September 30, 2015, the results of its operations for the year then ended, the changes in its net assets for the two years in the period then ended and the financial highlights for each of the years or periods indicated therein, in conformity with U.S. generally accepted accounting principles.

Boston, Massachusetts
November 25, 2015
55
Morgan Stanley Institutional Fund Trust
Annual Report — September 30, 2015
Investment Advisory Agreement Approval (unaudited)
Nature, Extent and Quality of Services
The Board reviewed and considered the nature and extent of the investment advisory services provided by the Adviser (as defined herein) under the advisory agreement, including portfolio management, investment research and equity and fixed income securities trading. The Board also reviewed and considered the nature and extent of the non-advisory, administrative services provided by the Adviser under the administration agreement, including accounting, operations, clerical, bookkeeping, compliance, business management and planning, legal services and the provision of supplies, office space and utilities at the Adviser's expense. The Board also considered the Adviser's investment in personnel and infrastructure that benefits the Portfolio. (The advisory and administration agreements together are referred to as the "Management Agreement.") The Board also considered that the Adviser serves a variety of other investment advisory clients and has experience overseeing service providers. The Board also compared the nature of the services provided by the Adviser with similar services provided by non-affiliated advisers as reported to the Board by Lipper, Inc. ("Lipper").
The Board reviewed and considered the qualifications of the portfolio managers, the senior administrative managers and other key personnel of the Adviser who provide the administrative and advisory services to the Portfolio. The Board determined that the Adviser's portfolio managers and key personnel are well qualified by education and/or training and experience to perform the services in an efficient and professional manner. The Board concluded that the nature and extent of the advisory and administrative services provided were necessary and appropriate for the conduct of the business and investment activities of the Portfolio and supported its decision to approve the Management Agreement.
Performance, Fees and Expenses of the Portfolio
The Board reviewed the performance, fees and expenses of the Portfolio compared to its peers, as determined by Lipper, and to appropriate benchmarks where applicable. The Board discussed with the Adviser the performance goals and the actual results achieved in managing the Portfolio. When considering a fund's performance, the Board and the Adviser place emphasis on trends and longer-term returns (focusing on one-year, three-year and five-year performance, as of December 31, 2014, or since inception, as applicable). When a fund underperforms its benchmark and/or its peer group average, the Board and the Adviser discuss the causes of such underperformance and, where necessary, they discuss specific changes to investment strategy or investment personnel. The Board noted that the Portfolio's performance was better than its peer group average for the one-, three- and five-year periods. The Board discussed with the Adviser the level of the advisory and administration fees (together, the "management fee") for this Portfolio relative to comparable funds and/or other accounts advised by the Adviser and/or compared to its peers as determined by Lipper. In addition to the management fee, the Board also reviewed the Portfolio's total expense ratio. The Board noted that the Portfolio's management fee and total expense ratio were lower than its peer group averages. After discussion, the Board concluded that the Portfolio's (i) performance was competitive with its peer group average; and (ii) management fee and total expense ratio were competitive with its peer group averages.
Economies of Scale
The Board considered the size and growth prospects of the Portfolio and how that relates to the Portfolio's total expense ratio and particularly the Portfolio's management fee rate, which does not include breakpoints. In conjunction with its review of the Adviser's profitability, the Board discussed with the Adviser how a change in assets can affect the efficiency or effectiveness of managing the Portfolio and whether the management fee level is appropriate relative to current and projected asset levels and/or whether the management fee structure reflects economies of scale as asset levels change. The Board has determined that its review of the actual and/or potential economies of scale of the Portfolio supports its decision to approve the Management Agreement.
Profitability of the Adviser and Affiliates
The Board considered information concerning the costs incurred and profits realized by the Adviser and its affiliates during the last year from their relationship with the Portfolio and during the last two years from their relationship with the Morgan Stanley Fund Complex and reviewed with the Adviser the cost allocation methodology used to determine the profitability of the Adviser and affiliates. The Board has determined that its review of the analysis of the Adviser's expenses and profitability supports its decision to approve the Management Agreement.
56
Morgan Stanley Institutional Fund Trust
Annual Report — September 30, 2015
Investment Advisory Agreement Approval (unaudited) (cont'd)
Other Benefits of the Relationship
The Board considered other direct and indirect benefits to the Adviser and/or its affiliates derived from their relationship with the Portfolio and other funds advised by the Adviser. These benefits may include, among other things, fees for trading, distribution and/or shareholder servicing and for transaction processing and reporting platforms used by securities lending agents, and research received by the Adviser generated from commission dollars spent on funds' portfolio trading. The Board reviewed with the Adviser these arrangements and the reasonableness of the Adviser's costs relative to the services performed. The Board has determined that its review of the other benefits received by the Adviser or its affiliates supports its decision to approve the Management Agreement.
Resources of the Adviser and Historical Relationship Between the Portfolio and the Adviser
The Board considered whether the Adviser is financially sound and has the resources necessary to perform its obligations under the Management Agreement. The Board also reviewed and considered the historical relationship between the Portfolio and the Adviser, including the organizational structure of the Adviser, the policies and procedures formulated and adopted by the Adviser for managing the Portfolio's operations and the Board's confidence in the competence and integrity of the senior managers and key personnel of the Adviser. The Board concluded that the Adviser has the financial resources necessary to fulfill its obligations under the Management Agreement and that it is beneficial for the Portfolio to continue its relationship with the Adviser.
Other Factors and Current Trends
The Board considered the controls and procedures adopted and implemented by the Adviser and monitored by the Fund's Chief Compliance Officer and concluded that the conduct of business by the Adviser indicates a good faith effort on its part to adhere to high ethical standards in the conduct of the Portfolio's business.
General Conclusion
After considering and weighing all of the above factors, with various written materials and verbal information presented by the Adviser, the Board concluded that it would be in the best interest of the Portfolio and its shareholders to approve renewal of the Management Agreement for another year. In reaching this conclusion the Board did not give particular weight to any single piece of information or factor referenced above. The Board considered these factors and information over the course of the year and in numerous meetings, some of which were in executive session with only the independent Board members and their counsel present. It is possible that individual Board members may have weighed these factors, and the information presented, differently in reaching their individual decisions to approve the Management Agreement.
57
Morgan Stanley Institutional Fund Trust
Annual Report — September 30, 2015
Federal Tax Notice (unaudited)
For Federal income tax purposes, the following information is furnished with respect to the distributions paid by the Portfolio during its taxable year ended September 30, 2015. For corporate shareholders 27.46% of the dividends qualified for the dividends received deduction.
The Portfolio designated and paid approximately $6,726,000 as a long-term capital gain distribution.
For Federal income tax purposes, the following information is furnished with respect to the Portfolio's earnings for its taxable year ended September 30, 2015. When distributed, certain earnings may be subject to a maximum tax rate of 15% as provided for by the Jobs and Growth Tax Relief Reconciliation Act of 2003. The Portfolio designated up to a maximum of approximately $7,032,000 as taxable at this lower rate.
In January, the Portfolio provides tax information to shareholders for the preceding calendar year.
58
Morgan Stanley Institutional Fund Trust
Annual Report — September 30, 2015
U.S. Privacy Policy (unaudited)
AN IMPORTANT NOTICE CONCERNING OUR U.S. PRIVACY POLICY
This privacy notice describes the U.S. privacy policy of Morgan Stanley Distribution, Inc., and the Morgan Stanley family of mutual funds ("us", "our", "we").
We are required by federal law to provide you with notice of our U.S. privacy policy ("Policy"). This Policy applies to both our current and former clients unless we state otherwise and is intended for individual clients who purchase products or receive services from us for personal, family or household purposes. This Policy is not applicable to partnerships, corporations, trusts or other non-individual clients or account holders, nor is this Policy applicable to individuals who are either beneficiaries of a trust for which we serve as trustee or participants in an employee benefit plan administered or advised by us. This Policy is, however, applicable to individuals who select us to be a custodian of securities or assets in individual retirement accounts, 401(k) accounts, or accounts subject to the Uniform Gifts to Minors Act.
This notice sets out our business practices to protect your privacy; how we collect and share personal information about you; and how you can limit our sharing or certain uses by others of this information. We may amend this Policy at any time, and will inform you of any changes to our Policy as required by law.
WE RESPECT YOUR PRIVACY
We appreciate that you have provided us with your personal financial information and understand your concerns about your information. We strive to safeguard the information our clients entrust to us. Protecting the confidentiality and security of client information is an important part of how we conduct our business.
This notice describes what personal information we collect about you, how we collect it, when we may share it with others, and how certain others may use it. It discusses the steps you may take to limit our sharing of certain information about you with our affiliated companies, including, but not limited to our affiliated banking businesses, brokerage firms and credit service affiliates. It also discloses how you may limit our affiliates' use of shared information for marketing purposes.
Throughout this Policy, we refer to the nonpublic information that personally identifies you as "personal information." We also use the term "affiliated company" in this notice. An affiliated company is a company in our family of companies and includes companies with the Morgan Stanley name. These affiliated companies are financial institutions such as broker-dealers, banks, investment advisers and credit card issuers. We refer to any company that is not an affiliated company as a nonaffiliated third party. For purposes of Section 5 of this notice, and your ability to limit certain uses of personal information by our affiliates, this notice applies to the use of personal information by our affiliated companies.
1. WHAT PERSONAL INFORMATION DO WE COLLECT FROM YOU?
We may collect the following types of information about you: (i) information provided by you, including information from applications and other forms we receive from you, (ii) information about your transactions with us or our affiliates, (iii) information about your transactions with nonaffiliated third parties, (iv) information from consumer reporting agencies, (v) information obtained from our websites, and (vi) information obtained from other sources. For example:
• We collect information such as your name, address, e-mail address, telephone/fax numbers, assets, income and investment objectives through applications and other forms you submit to us.
• We may obtain information about account balances, your use of account(s) and the types of products and services you prefer to receive from us through your dealings and transactions with us and other sources.
• We may obtain information about your creditworthiness and credit history from consumer reporting agencies.
• We may collect background information from and through third-party vendors to verify representations you have made and to comply with various regulatory requirements.
2. WHEN DO WE DISCLOSE PERSONAL INFORMATION WE COLLECT ABOUT YOU?
We may disclose personal information we collect about you in each of the categories listed above to affiliated and nonaffiliated third parties.
59
Morgan Stanley Institutional Fund Trust
Annual Report — September 30, 2015
U.S. Privacy Policy (unaudited) (cont'd)
a. Information We Disclose to Affiliated Companies.
We may disclose personal information that we collect about you to our affiliated companies to manage your account(s) effectively, to service and process your transactions, and to let you know about products and services offered by us and affiliated companies, to manage our business, and as otherwise required or permitted by law. Offers for products and services from affiliated companies are developed under conditions designed to safeguard your personal information.
b. Information We Disclose to Third Parties.
We may disclose personal information that we collect about you to nonaffiliated third parties to provide marketing services on our behalf or to other financial institutions with whom we have joint marketing agreements. We may also disclose all of the information we collect to other nonaffiliated third parties for our everyday business purposes, such as to process transactions, maintain account(s), respond to court orders and legal investigations, report to credit bureaus, offer our own products and services, protect against fraud, for institutional risk control, to perform services on our behalf, and as otherwise required or permitted by law.
When we share personal information about you with a nonaffiliated third party, they are required to limit their use of personal information about you to the particular purpose for which it was shared and they are not allowed to share personal information about you with others except to fulfill that limited purpose or as may be permitted or required by law.
3. HOW DO WE PROTECT THE SECURITY AND CONFIDENTIALITY OF PERSONAL INFORMATION WE COLLECT ABOUT YOU?
We maintain physical, electronic and procedural security measures that comply with applicable law and regulations to help safeguard the personal information we collect about you. We have internal policies governing the proper handling of client information by employees. Third parties that provide support or marketing services on our behalf may also receive personal information about you, and we require them to adhere to appropriate security standards with respect to such information.
4. HOW CAN YOU LIMIT OUR SHARING CERTAIN PERSONAL INFORMATION ABOUT YOU WITH OUR AFFILIATED COMPANIES FOR ELIGIBILITY DETERMINATION?
By following the opt-out procedures in Section 6 below, you may limit the extent to which we share with our affiliated companies, personal information that was collected to determine your eligibility for products and services such as your credit reports and other information that you have provided to us or that we may obtain from third parties ("eligibility information"). Eligibility information does not include your identification information or personal information pertaining to our transactions or experiences with you. Please note that, even if you direct us not to share eligibility information with our affiliated companies, we may still share your personal information, including eligibility information, with our affiliated companies under circumstances that are permitted under applicable law, such as to process transactions or to service your account.
5. HOW CAN YOU LIMIT THE USE OF CERTAIN PERSONAL INFORMATION ABOUT YOU BY OUR AFFILIATED COMPANIES FOR MARKETING?
By following the opt-out instructions in Section 6 below, you may limit our affiliated companies from marketing their products or services to you based on personal information we disclose to them. This information may include, for example, your income and account history with us. Please note that, even if you choose to limit our affiliated companies from using personal information about you that we may share with them for marketing their products and services to you, our affiliated companies may use your personal information that they obtain from us to market to you in circumstances permitted by law, such as if the affiliated party has its own relationship with you.
60
Morgan Stanley Institutional Fund Trust
Annual Report — September 30, 2015
U.S. Privacy Policy (unaudited) (cont'd)
6. HOW CAN YOU SEND US AN OPT-OUT INSTRUCTION?
If you wish to limit our sharing of eligibility information about you with our affiliated companies, or our affiliated companies' use of personal information for marketing purposes, as described in this notice, you may do so by:
• Calling us at (800) 548-7786
Monday–Friday between 8a.m. and 6p.m. (EST)
• Writing to us at the following address:
Boston Financial Data Services, Inc.
c/o Privacy Coordinator
P.O. Box 219804
Kansas City, Missouri 64121
If you choose to write to us, your request should include: your name, address, telephone number and account number(s) to which the opt-out applies and whether you are opting out with respect to sharing of eligibility information (Section 4 above), or information used for marketing (Section 5 above), or both. Written opt-out requests should not be sent with any other correspondence. In order to process your request, we require that the request be provided by you directly and not through a third party. Once you have informed us about your privacy preferences, your opt-out preference will remain in effect with respect to this Policy (as it may be amended) until you notify us otherwise. If you are a joint account owner, we will accept instructions from any one of you and apply those instructions to the entire account.
Please understand that if you limit our sharing or our affiliated companies' use of personal information, you and any joint account holder(s) may not receive information about our affiliated companies' products and services, including products or services that could help you manage your financial resources and achieve your investment objectives.
If you have more than one account or relationship with us, please specify the accounts to which you would like us to apply your privacy choices. If you have accounts or relationships with our affiliates, you may receive multiple privacy policies from them, and will need to separately notify those companies of your privacy choices for those accounts or relationships.
7. WHAT IF AN AFFILIATED COMPANY BECOMES A NONAFFILIATED THIRD PARTY?
If, at any time in the future, an affiliated company becomes a nonaffiliated third party, further disclosures of personal information made to the former affiliated company will be limited to those described in Section 2(b) above relating to nonaffiliated third parties. If you elected under Section 6 to limit disclosures we make to affiliated companies, or use of personal information by affiliated companies, your election will not apply to use by any former affiliated company of your personal information in their possession once it becomes a nonaffiliated third party.
SPECIAL NOTICE TO RESIDENTS OF VERMONT
The following section supplements our Policy with respect to our individual clients who have a Vermont address and supersedes anything to the contrary in the above Policy with respect to those clients only.
The State of Vermont requires financial institutions to obtain your consent prior to sharing personal information that they collect about you with nonaffiliated third parties, or eligibility information with affiliated companies, other than in certain limited circumstances. Except as permitted by law, we will not share personal information we collect about you with nonaffiliated third parties or eligibility information with affiliated companies, unless you provide us with your written consent to share such information.
SPECIAL NOTICE TO RESIDENTS OF CALIFORNIA
The following section supplements our Policy with respect to our individual clients who have a California address and supersedes anything to the contrary in the above Policy with respect to those clients only.
In response to a California law, if your account has a California home address, your personal information will not be disclosed to nonaffiliated third parties except as permitted by applicable California law, and we will limit sharing such personal information with our affiliates to comply with California privacy laws that apply to us.
61
Morgan Stanley Institutional Fund Trust
Annual Report — September 30, 2015
Trustee and Officer Information (unaudited)
Independent Trustees:
Name, Age and Address of
Independent Trustee | | Positions(s)
Held with
Registrant | | Length of Time
Served* | | Principal Occupation(s) During Past 5 Years
and Other Relevant Professional Experience | | Number of
Portfolios in
Fund Complex
Overseen by
Trustee** | | Other Directorships
Held by Independent
Trustee*** | |
Frank L. Bowman (70)
c/o Kramer Levin Naftalis & Frankel LLP
Counsel to the Independent Trustees
1177 Avenue of the Americas
New York, NY 10036 | | Trustee | | Since
August
2006 | | President, Strategic Decisions, LLC (consulting) (since February 2009); Director or Trustee of various Morgan Stanley Funds (since August 2006); Chairperson of the Compliance and Insurance Committee (since October 2015); Chairperson of the Insurance Sub-Committee of the Compliance and Insurance Committee (since February 2007); served as President and Chief Executive Officer of the Nuclear Energy Institute (policy organization) (February 2005-November 2008); retired as Admiral, U.S. Navy after serving over 38 years on active duty including 8 years as Director of the Naval Nuclear Propulsion Program in the Department of the Navy and the U.S. Department of Energy (1996-2004); served as Chief of Naval Personnel (July 1994-September 1996); and on the Joint Staff as Director of Political Military Affairs (June 1992-July1994); knighted as Honorary Knight Commander of the Most Excellent Order of the British Empire; awarded the Officier de l'Orde National du Mérite by the French Government; elected to the National Academy of Engineering (2009). | | | 96 | | | Director of BP p.l.c.; Director of Naval and Nuclear Technologies LLP; Director Emeritus of the Armed Services YMCA of the USA; Director of the U.S. Naval Submarine League; Member of the National Security Advisory Council of the Center for U.S. Global Engagement and a member of the CNA Military Advisory Board; Chairman of the Charity J Street Cup Golf ; Trustee of Fairhaven United Methodist Church. | |
Kathleen A. Dennis (62)
c/o Kramer Levin Naftalis & Frankel LLP
Counsel to the Independent Trustees
1177 Avenue of the Americas
New York, NY 10036 | | Trustee | | Since
August
2006 | | President, Cedarwood Associates (mutual fund and investment management consulting) (since July 2006); Chairperson of the Money Market and Alternatives Sub-Committee of the Investment Committee (since October2006) and Director or Trustee of various Morgan Stanley Funds (since August 2006); formerly, Senior Managing Director of Victory Capital Management (1993-2006). | | | 96 | | | Director of various nonprofit organizations. | |
Nancy C. Everett (60)
c/o Kramer Levin Naftalis & Frankel LLP
Counsel to the Independent Trustees
1177 Avenue of the Americas
New York, NY 10036 | | Trustee | | Since
January
2015 | | Owner, OBIR, LLC (institutional investment management consulting) (since June 2014); formerly, Managing Director, BlackRock, Inc. (February 2011-December 2013); and Chief Executive Officer, General Motors Asset Management (a/k/a Promark Global Advisors, Inc.) (June 2005-May 2010). | | | 96 | | | Member of Virginia Commonwealth University Board of Visitors; Member of Virginia Commonwealth University School of Business Foundation; formerly, Member of Committee on Directors for Emerging Markets Growth Fund, Inc. (2007-2010); Chairperson of Performance Equity Management, LLC (2006-2010); and Chairperson, GMAM Absolute Return Strategies Fund, LLC (2006-2010). | |
62
Morgan Stanley Institutional Fund Trust
Annual Report — September 30, 2015
Trustee and Officer Information (unaudited) (cont'd)
Independent Trustees: (cont'd)
Name, Age and Address of
Independent Trustee | | Positions(s)
Held with
Registrant | | Length of Time
Served* | | Principal Occupation(s) During Past 5 Years
and Other Relevant Professional Experience | | Number of
Portfolios in
Fund Complex
Overseen by
Trustee** | | Other Directorships
Held by Independent
Trustee*** | |
Jakki L. Haussler (58)
c/o Kramer Levin Naftalis & Frankel LLP
Counsel to the Independent Trustees
1177 Avenue of the Americas
New York, NY 10036 | | Trustee | | Since
January
2015 | | Chairman and Chief Executive Officer, Opus Capital Group (since January 1996); and formerly, Director, Capvest Venture Fund, LP (May 2000-December 2011); Partner, Adena Ventures, LP (July 1999-December 2010); Director, The Victory Funds (February 2005-July 2008). | | | 96 | | | Director of Cincinnati Bell Inc. and Member, Audit Committee and Compensation Committee; Director of Northern Kentucky University Foundation and Member, Investment Committee; Member of Chase College of Law Transactional Law Practice Center Board of Advisors; Director of Best Transport; Member, University of Cincinnati Foundation Investment Committee; formerly, Member, Miami University Board of Visitors (2008-2011); Trustee of Victory Funds (2005-2008) and Chairman, Investment Committee (2007-2008) and Member, Service Provider Committee (2005-2008). | |
Dr. Manuel H. Johnson (66)
c/o Johnson Smick International, Inc.
220 I Street, N.E. — Suite 200
Washington, D.C. 20002 | | Trustee | | Since
July
1991 | | Senior Partner, Johnson Smick International, Inc. (consulting firm); Chairperson of the Investment Committee (since October 2006) and Director or Trustee of various Morgan Stanley Funds (since July 1991); Co-Chairman and a founder of the Group of Seven Council (G7C) (international economic commission); formerly Chairperson of the Audit Committee (July 1991-September 2006), Vice Chairman of the Board of Governors of the Federal Reserve System and Assistant Secretary of the U.S. Treasury. | | | 98 | | | Director of NVR, Inc. (home construction). | |
Joseph J. Kearns (73)
c/o Kearns & Associates LLC
23823 Malibu Road
S-50-440
Malibu, CA 90265 | | Trustee | | Since
August
1994 | | President, Kearns & Associates LLC (investment consulting); Chairperson of the Audit Committee (since October 2006) and Director or Trustee of various Morgan Stanley Funds (since August 1994); formerly, Deputy Chairperson of the Audit Committee (July 2003-September 2006) and Chairperson of the Audit Committee of various Morgan Stanley Funds (since August 1994); CFO of the J. Paul Getty Trust. | | | 99 | | | Director of Electro Rent Corporation (equipment leasing). Prior to December 31, 2013, Director of The Ford Family Foundation. | |
63
Morgan Stanley Institutional Fund Trust
Annual Report — September 30, 2015
Trustee and Officer Information (unaudited) (cont'd)
Independent Trustees: (cont'd)
Name, Age and Address of
Independent Trustee | | Positions(s)
Held with
Registrant | | Length of Time
Served* | | Principal Occupation(s) During Past 5 Years
and Other Relevant Professional Experience | | Number of
Portfolios in
Fund Complex
Overseen by
Trustee** | | Other Directorships
Held by Independent
Trustee*** | |
Michael F. Klein (56)
c/o Kramer Levin Naftalis & Frankel LLP
Counsel to the Independent Trustees
1177 Avenue of the Americas
New York, NY 10036 | | Trustee | | Since
August
2006 | | Managing Director, Aetos Capital, LLC (since March 2000); Co-President, Aetos Alternatives Management, LLC (since January 2004); and Co-Chief Executive Officer of Aetos Capital LLC (since August 2013); Chairperson of the Fixed Income Sub-Committee of the Investment Committee (since October 2006) and Director or Trustee of various Morgan Stanley Funds (since August 2006); formerly, Managing Director, Morgan Stanley & Co. Inc. and Morgan Stanley Dean Witter Investment Management, President, various Morgan Stanley Funds (June1998-March 2000) and Principal, Morgan Stanley & Co. Inc. and Morgan Stanley Dean Witter Investment Management (August 1997-December 1999). | | | 96 | | | Director of certain investment funds managed or sponsored by Aetos Capital, LLC. Director of Sanitized AG and Sanitized Marketing AG (specialty chemicals). | |
Michael E. Nugent (79)
522 Fifth Avenue
New York, NY 10036 | | Chair of the
Board and
Trustee | | Chair of the
Boards since
July 2006 and
Trustee since
July 1991 | | Chair of the Boards of various Morgan Stanley Funds (since July 2006); Chairperson of the Closed-End Fund Committee (since June 2012) and Director or Trustee of various Morgan Stanley Funds (since July 1991); formerly, Chairperson of the Insurance Committee (until July 2006), General Partner, Triumph Capital, L.P. (private investment partnership) (1988-2013). | | | 98 | | | None. | |
W. Allen Reed (68)
c/o Kramer Levin Naftalis & Frankel LLP
Counsel to the Independent Trustees
1177 Avenue of the Americas
New York, NY 10036 | | Trustee | | Since
August
2006 | | Chairperson of the Equity Sub-Committee of the Investment Committee (since October 2006) and Director or Trustee of various Morgan Stanley Funds (since August 2006); formerly, President and CEO of General Motors Asset Management; Chairman and Chief Executive Officer of the GM Trust Bank and Corporate Vice President of General Motors Corporation (August 1994-December 2005). | | | 96 | | | Director of Temple-Inland Industries (packaging and forest products); Director of Legg Mason, Inc. and Director of the Auburn University Foundation. | |
Fergus Reid (83)
c/o Joe Pietryka, Inc.
85 Charles Colman Blvd.
Pawling, NY 12564 | | Trustee | | Since
June
1992 | | Chairman, Joe Pietryka, Inc.; Chairperson of the Governance Committee and Director or Trustee of various Morgan Stanley Funds (since June 1992). | | | 99 | | | Formerly, Trustee and Director of certain investment companies in the JP Morgan Fund Complex managed by JP Morgan Investment Management Inc. (1987-December 2012). | |
64
Morgan Stanley Institutional Fund Trust
Annual Report — September 30, 2015
Trustee and Officer Information (unaudited) (cont'd)
Interested Trustee:
Name, Age and Address of
Interested Trustee | | Positions(s) Held
with Registrant | | Length of Time
Served* | | Principal Occupation(s) During Past 5 Years | | Number of
Portfolios in
Fund Complex
Overseen by
Interested
Trustee** | | Other Directorships
Held by Interested
Trustee*** | |
James F. Higgins (67)
One New York Plaza,
New York, NY 10004 | | Trustee | | Since
June
2000 | | Director or Trustee of various Morgan Stanley Funds (since June 2000); Senior Advisor of Morgan Stanley (since August 2000). | | | 97 | | | Formerly, Director of AXA Financial, Inc. and AXA Equitable Life Insurance Company (2002-2011) and Director of AXA MONY Life Insurance Company and AXA MONY Life Insurance Company of America
(2004-2011). | |
* This is the earliest date the Trustee began serving the Morgan Stanley Funds. Each Trustee serves an indefinite term, until his or her successor is elected.
** The Fund Complex includes (as of December 31, 2014) all open-end and closed-end funds (including all of their portfolios) advised by Morgan Stanley Investment Management Inc. (the "Adviser") and any funds that have an adviser that is an affiliated person of the Adviser (including, but not limited to, Morgan Stanley AIP GP LP).
*** This includes any directorships at public companies and registered investment companies held by the Trustee at any time during the past five years.
65
Morgan Stanley Institutional Fund Trust
Annual Report — September 30, 2015
Trustee and Officer Information (unaudited) (cont'd)
Executive Officers:
Name, Age and Address of Executive Officer | | Position(s) Held
with
Registrant | | Length of Time
Served* | | Principal Occupation(s) During Past 5 Years | |
John H. Gernon (52)
522 Fifth Avenue
New York, NY 10036 | | President and Principal Executive Officer | | Since
September
2013 | | President and Principal Executive Officer of the Equity and Fixed Income Funds and the Morgan Stanley AIP Funds (since September 2013) and the Liquidity Funds and various money market funds (since May 2014) in the Fund Complex, Managing Director of the Adviser; Head of Product (since 2006) and Global Portfolio Analysis and Reporting (since 2012); for MSIM's Long Only business. | |
Stefanie V. Chang Yu (48)
522 Fifth Avenue
New York, NY 10036 | | Chief
Compliance
Officer | | Since
December
1997 | | Managing Director of the Adviser and various entities affiliated with the Adviser; Chief Compliance Officer of various Morgan Stanley Funds and the Adviser (since January 2014); formerly, Vice President of various Morgan Stanley Funds (December 1997-January 2014). | |
Joseph C. Benedetti (50)
522 Fifth Avenue
New York, NY 10036 | | Vice President | | Since
January
2014 | | Managing Director of the Adviser and various entities affiliated with the Adviser; Vice President of various Morgan Stanley Funds (since January 2014); formerly, Assistant Secretary of various Morgan Stanley Funds (October 2004-January 2014). | |
Francis J. Smith (50)
522 Fifth Avenue
New York, NY 10036 | | Treasurer and
Principal
Financial
Officer | | Treasurer
since July
2003 and
Principal
Financial
Officer since
September
2002 | | Executive Director of the Adviser and various entities affiliated with the Adviser; Treasurer (since July 2003) and Principal Financial Officer of various Morgan Stanley Funds (since September 2002). | |
Mary E. Mullin (48)
522 Fifth Avenue
New York, NY 10036 | | Secretary | | Since
June
1999 | | Executive Director of the Adviser and various entities affiliated with the Adviser; Secretary of various Morgan Stanley Funds (since June 1999). | |
* This is the earliest date the officer began serving the Morgan Stanley Funds. Each officer serves a one-year term, until his or her successor is elected and has qualified.
66
Morgan Stanley Institutional Fund Trust
Annual Report — September 30, 2015
Adviser and Administrator
Morgan Stanley Investment Management Inc.
522 Fifth Avenue
New York, New York 10036
Distributor
Morgan Stanley Distribution, Inc.
522 Fifth Avenue
New York, New York 10036
Dividend Disbursing and Transfer Agent
Boston Financial Data Services, Inc.
2000 Crown Colony Drive
Quincy, Massachusetts 02169
Custodian
State Street Bank and Trust Company
One Lincoln Street
Boston, Massachusetts 02111
Legal Counsel
Dechert LLP
1095 Avenue of the Americas
New York, New York 10036
Counsel to the Independent Trustees
Kramer Levin Naftalis & Frankel LLP
1177 Avenue of the Americas
New York, New York 10036
Independent Registered Public Accounting Firm
Ernst & Young LLP
200 Clarendon Street
Boston, Massachusetts 02116
Reporting to Shareholders
Each Morgan Stanley fund provides a complete schedule of portfolio holdings in its semi-annual and annual reports within 60 days of the end of the fund's second and fourth fiscal quarters. The semi-annual and annual reports are filed electronically with the Securities and Exchange Commission (SEC) on Form N-CSRS and Form N-CSR, respectively. Morgan Stanley also delivers the semi-annual and annual reports to fund shareholders and makes these reports available on its public website, www.morganstanley.com/im. Each Morgan Stanley fund also files a complete schedule of portfolio holdings with the SEC for the fund's first and third fiscal quarters on Form N-Q. Morgan Stanley does not deliver the reports for the first and third fiscal quarters to shareholders, nor are the reports posted to the Morgan Stanley public website. You may, however, obtain the Form N-Q filings (as well as the Form N-CSR and N-CSRS filings) by accessing the SEC's website, www.sec.gov. You may also review and copy them at the SEC's Public Reference Room in Washington, DC. Information on the operation of the SEC's Public Reference Room may be obtained by calling the SEC toll free at 1 (800) SEC-0330. You can also request copies of these materials, upon payment of a duplicating fee, by electronic request at the SEC's email address (publicinfo@sec.gov) or by writing the Public Reference Room of the SEC, Washington, DC 20549-0102.
Proxy Voting Policies and Procedures and Proxy Voting Record
You may obtain a copy of the Fund's Proxy Voting Policy and Procedures and information regarding how the Fund voted proxies relating to portfolio securities during the most recent twelve-month period ended June 30, without charge, upon request, by calling toll free 1 (800) 548-7786 or by visiting our website at www.morganstanley.com/im. This information is also available on the SEC's website at www.sec.gov.
This report is authorized for distribution only when preceded or accompanied by a prospectus of the Morgan Stanley Institutional Fund Trust, which describes in detail each Portfolio's investment policies, risks, fees and expenses. Please read the prospectus carefully before you invest or send money. For additional information, including information regarding the investments comprising the Portfolio, please visit our website at www.morganstanley.com/im or call toll free 1 (800) 548-7786.
67
Printed in U.S.A.
This Report has been prepared for shareholders and may be distributed to others only if preceded or accompanied by a current prospectus.
Morgan Stanley Investment Management Inc.
522 Fifth Avenue
New York, New York 10036
© 2015 Morgan Stanley. Morgan Stanley Distribution, Inc.

IFTGSANN
1347154 EXP 11.30.16

Morgan Stanley Institutional Fund Trust
High Yield Portfolio
Annual Report
September 30, 2015

Morgan Stanley Institutional Fund Trust
Annual Report — September 30, 2015
Shareholders' Letter | | | 2 | | |
Expense Example | | | 3 | | |
Investment Overview | | | 4 | | |
Portfolio of Investments | | | 7 | | |
Statement of Assets and Liabilities | | | 13 | | |
Statement of Operations | | | 15 | | |
Statements of Changes in Net Assets | | | 16 | | |
Financial Highlights | | | 18 | | |
Notes to Financial Statements | | | 23 | | |
Report of Independent Registered Public Accounting Firm | | | 28 | | |
Investment Advisory Agreement Approval | | | 29 | | |
Federal Tax Notice | | | 31 | | |
U.S. Privacy Policy | | | 32 | | |
Trustee and Officer Information | | | 35 | | |
This report is authorized for distribution only when preceded or accompanied by prospectuses of the Morgan Stanley Institutional Fund Trust. To receive a prospectus and/or statement of additional information (SAI), which contains more complete information such as investment objectives, charges, expenses, policies for voting proxies, risk considerations, and describes in detail each of the Portfolio's investment policies to the prospective investor, please call toll free 1 (800) 548-7786. Please read the prospectuses carefully before you invest or send money.
Additionally, you can access portfolio information including performance, characteristics, and investment team commentary through Morgan Stanley Investment Management's website: www.morganstanley.com/im.
Market forecasts provided in this report may not necessarily come to pass. There is no guarantee that any sectors mentioned will continue to perform as discussed herein or that securities in such sectors will be held by the Portfolio in the future. There is no assurance that a Portfolio will achieve its investment objective. Portfolios are subject to market risk, which is the possibility that market values of securities owned by the Portfolio will decline and, therefore, the value of the Portfolio's shares may be less than what you paid for them. Accordingly, you can lose money investing in this Portfolio. Please see the prospectus for more complete information on investment risks.
1
Morgan Stanley Institutional Fund Trust
Annual Report — September 30, 2015
Shareholders' Letter (unaudited)
Dear Shareholders,
We are pleased to provide this Annual report, in which you will learn how your investment in High Yield Portfolio (the "Portfolio") performed during the latest twelve-month period.
Morgan Stanley Investment Management is a client-centric, investor-led organization. Our global presence, intellectual capital, and breadth of products and services enable us to partner with investors to meet the evolving challenges of today's financial markets. We aim to deliver superior investment service and to empower our clients to make the informed decisions that help them reach their investment goals.
As always, we thank you for selecting Morgan Stanley Investment Management, and look forward to working with you in the months and years ahead.
Sincerely,

John H. Gernon
President and Principal Executive Officer
October 2015
2
Morgan Stanley Institutional Fund Trust
Annual Report — September 30, 2015
Expense Example (unaudited)
High Yield Portfolio
As a shareholder of the Portfolio, you may incur two types of costs: (1) transactional costs, including sales charge (loads) on purchase payments; and (2) ongoing costs, including advisory fees, administration fees, distribution and shareholder services fees; and other Portfolio expenses. This example is intended to help you understand your ongoing costs (in dollars) of investing in the Portfolio and to compare these costs with the ongoing costs of investing in other mutual funds.
This example is based on an investment of $1,000 invested at the beginning of the six-month period ended September 30, 2015 and held for the entire six-month period (unless otherwise noted).
Actual Expenses
The table below provides information about actual account values and actual expenses. You may use the information in this table, together with the amount you invested, to estimate the expenses that you paid over the period. Simply divide your account value by $1,000 (for example, an $8,600 account value divided by $1,000 = 8.6), then multiply the result by the number in the table under the heading entitled "Actual Expenses Paid During Period" to estimate the expenses you paid on your account during this period.
Hypothetical Example for Comparison Purposes
The table below provides information about hypothetical account values and hypothetical expenses based on the Portfolio's actual expense ratio and an assumed rate of return of 5% per year before expenses, which is not the Portfolio's actual return. The hypothetical account values and expenses may not be used to estimate the actual ending account balance or expenses you paid for the period. You may use this information to compare the ongoing costs of investing in the Portfolio and other funds. To do so, compare this 5% hypothetical example with the 5% hypothetical examples that appear in the shareholder reports of the other funds.
Please note that the expenses shown in the table are meant to highlight your ongoing costs only and do not reflect any transactional costs, such as sales charges (loads, if applicable). Therefore, the information for each class in the table is useful in comparing ongoing costs only, and will not help you determine the relative total costs of owning different funds. In addition, if these transactional costs were included, your costs would have been higher.
| | | Beginning
Account
Value
4/1/15 | | Actual Ending
Account
Value
9/30/15 | | Hypothetical
Ending Account
Value | | Actual
Expenses
Paid
During
Period | | Hypothetical
Expenses Paid
During Period | | Net
Expense
Ratio
During
Period*** | |
High Yield Portfolio Class I | | $ | 1,000.00 | | | $ | 984.00 | | | $ | 1,021.31 | | | $ | 3.73 | * | | $ | 3.80 | * | | | 0.75 | % | |
High Yield Portfolio Class A | | | 1,000.00 | | | | 982.00 | | | | 1,019.55 | | | | 5.47 | * | | | 5.57 | * | | | 1.10 | | |
High Yield Portfolio Class L | | | 1,000.00 | | | | 981.00 | | | | 1,018.30 | | | | 6.70 | * | | | 6.83 | * | | | 1.35 | | |
High Yield Portfolio Class C | | | 1,000.00 | | | | 962.50 | | | | 1,013.25 | | | | 7.57 | ** | | | 7.76 | ** | | | 1.84 | | |
High Yield Portfolio Class IS | | | 1,000.00 | | | | 983.20 | | | | 1,021.46 | | | | 3.58 | * | | | 3.65 | * | | | 0.72 | | |
* Expenses are calculated using each Portfolio Class' annualized net expense ratio (as disclosed), multiplied by the average account value over the period, and multiplied by 183/365 (to reflect the most recent one-half year period).
** Expenses are calculated using the Portfolio Class' annualized net expense ratio (as disclosed), multiplied by the average account value over the period, and multiplied by 153/365 (to reflect the actual days in the period).
*** Annualized.
3
Morgan Stanley Institutional Fund Trust
Annual Report — September 30, 2015
Investment Overview (unaudited)
High Yield Portfolio
The High Yield Portfolio seeks total return.
Performance
For the fiscal year ended September 30, 2015, the Portfolio's Class I shares had a total return based on net asset value and reinvestment of distributions per share of –2.10%, net of fees. The Portfolio's Class I shares outperformed against the Portfolio's benchmark the Barclays U.S. Corporate High Yield Index (the "Index"), which returned –3.43%.
Factors Affecting Performance
• Concerns over central bank policy around the world and global issues, such as Greece's debt crisis and China's economic slowdown, kept bond markets fairly turbulent during the period. Risk premia rose substantially in the latter months of the period and asset prices suffered. The rise in risk premia was driven by a continued tightening of financial conditions, catalyzed by a devaluation of the Chinese currency in August. This tightening of financial conditions resulted in falling business confidence and generally weaker-than-expected economic data. These factors drove "risk-off" sentiment and led to a widening of credit spreads, an equity market sell-off and a rally in U.S. Treasuries. Furthermore, to the surprise of many, the Federal Reserve (Fed) kept interest rates unchanged and delivered a more dovish-than-expected policy statement at its September 2015 meeting. As an unintended consequence, markets increasingly worried that the negative impact on the U.S. economy's growth dynamics would warrant a ratcheting down of global growth expectations. This fear drove risk premia even higher. The Fed has communicated that its decision to hike rates will be data dependent, which implies some uncertainty on whether a hike will happen this year. Only with a material recovery in labor market indicators over the next few months would a rate hike likely occur this year.
• Despite a general increase in yields in first half of the period, over the full 12-month period, 5-, 10-, and 30-year Treasury yields ended 41, 36 and 34 basis points lower, respectively.(i) U.S. 2-year yields ended the period relatively flat at 2 basis points higher.
• Recovering from a volatile fourth quarter of 2014, high yield credit started 2015 on a positive note, as one of the few fixed income sectors to have positive performance in the first quarter of 2015. However, amid economic and geopolitical worries, the U.S. credit markets endured record amounts of new issuance, which eventually pressured yield spreads wider (and prices lower, as bond prices move inversely to yields). Over the course of 2015, credit spreads in all markets have widened materially and are currently at levels which are typically only seen in periods of economic recession or systemic stress. The spreads observable in the investment grade markets include a material risk premium, and spreads in the high yield market are compensating for a significant uptick in defaults. While it is clear that certain emerging markets are seeing a material risk of recession, the consensus is for the developed world to see moderate growth over the coming year. We believe this growth backdrop, combined with low inflation, is likely to lead to ongoing accommodative monetary policy from the central banks around the world, which should keep defaults low and support credit markets.
• Another driver of credit spreads is the technical balance between supply and demand. Supply volume has been elevated across many of the credit markets. This has been most apparent in the U.S. investment grade market, where a combination of increased merger and acquisition activity and the fear that an interest rate tightening cycle could increase the future cost of long-term debt financing has caused corporate treasurers to turn to the bond markets. As a result, year-to-date new issue volumes have been running at record pace. This is to a lesser extent also true in the U.S. high yield and European investment grade markets. Along with this high level of issuance, demand has been muted as many yield-oriented investors are awaiting higher yields before committing capital to the market. This mismatch between supply and demand has resulted in a higher liquidity premium, which has contributed to the wider credit spreads.
Management Strategies
• The Portfolio is focused on middle-market high yield credits, which we define as companies with
(i) Source for U.S. Treasury yields: Bloomberg L.P.
4
Morgan Stanley Institutional Fund Trust
Annual Report — September 30, 2015
Investment Overview (unaudited) (cont'd)
High Yield Portfolio
$200 million to $1 billion of total debt outstanding. We believe that this segment of the high yield market offers attractive opportunities, as market participants (including asset managers and sell-side research analysts) do not cover it as closely as they do the largest high yield credits. This focus aided relative performance because the middle-market segment offered a yield advantage over the broader high yield market during the period.
• A general underweight to the energy sector also aided relative performance as this sector endured considerable spread widening during the period. Although we note that the positioning did detract from absolute performance.

* Minimum Investment
** Commenced operations on February 7, 2012
In accordance with SEC regulations, the Portfolio's performance shown assumes that all recurring fees (including management fees) were deducted and all dividends and distributions were reinvested. The performance of Class A, Class L, Class C and Class IS shares will vary from the performance of Class I shares based upon their different inception dates and will be negatively impacted by additional fees assessed to those classes (where applicable).
Performance Compared to the Barclays U.S. Corporate High Yield Index(1) and the Lipper High Current Yield Bond Funds Index(2)
| | | Period Ended September 30, 2015
Total Returns(3) | |
| | | | | Average Annual | |
| | | One
Year | | Five
Years | | Ten
Years | | Since
Inception(7) | |
Portfolio — Class I Shares
w/o sales charges(4) | | | –2.10 | % | | | — | | | | — | | | | 8.57 | % | |
Portfolio — Class A Shares
w/o sales charges(4) | | | –2.43 | | | | — | | | | — | | | | 8.25 | | |
Portfolio — Class A Shares with
maximum 4.25% sales charges(4) | | | –6.61 | | | | — | | | | — | | | | 6.97 | | |
Portfolio — Class L Shares
w/o sales charges(4) | | | –2.70 | | | | — | | | | — | | | | 7.97 | | |
Portfolio — Class C Shares
w/o sales charges(6) | | | — | | | | — | | | | — | | | | –3.75 | | |
Portfolio — Class C Shares with
maximum 1.00% deferred
sales charges(6) | | | — | | | | — | | | | — | | | | –4.69 | | |
Portfolio — Class IS Shares
w/o sales charges(5) | | | –2.17 | | | | — | | | | — | | | | –0.86 | | |
Barclays U.S. Corporate
High Yield Index | | | –3.43 | | | | — | | | | — | | | | 5.07 | | |
Lipper High Current Yield
Bond Funds Index | | | –3.26 | | | | — | | | | — | | | | 4.91 | | |
Performance data quoted represents past performance, which is no guarantee of future results, and current performance may be lower or higher than the figures shown. Performance assumes that all dividends and distributions, if any, were reinvested. Returns for period less than one year are not annualized. For the most recent month-end performance figures, please visit www.morganstanley.com/im. Investment return and principal value will fluctuate so that Portfolio shares, when redeemed, may be worth more or less than their original cost. Total returns do not reflect the deduction of taxes that a shareholder would pay on Portfolio distributions or the redemption of Portfolio shares. Performance of share classes will vary due to differences in sales charges and expenses.
(1) The Barclays U.S. Corporate High Yield Index measures the market of USD-denominated, non-investment grade, fixed-rate, taxable corporate bonds. Securities are classified as high yield if the middle rating of Moody's, Fitch, and S&P is Ba1/BB+/BB+ or below. The index excludes emerging market debt. The Index is unmanaged and its returns do not include any sales charges or fees. Such costs would lower performance. It is not possible to invest directly in an index.
(2) The Lipper High Current Yield Bond Funds Index is an equally weighted performance index of the largest qualifying funds (based on net assets) in the Lipper High Current Yield Bond Funds classification. The Index, which is adjusted for capital gains distributions and income dividends, is unmanaged and should not be considered an investment. There are currently 30 funds represented in this Index. As of the date of this report, the Portfolio was in the Lipper High Current Yield Bond Funds classification.
(3) Total returns for the Portfolio reflect expenses waived and/or reimbursed, if applicable, by the Adviser. Without such waivers and/or reimbursements, total returns would have been lower.
5
Morgan Stanley Institutional Fund Trust
Annual Report — September 30, 2015
Investment Overview (unaudited) (cont'd)
High Yield Portfolio
(4) Commenced operations on February 7, 2012.
(5) Commenced operations on March 28, 2014.
(6) Commenced operations on April 30, 2015.
(7) For comparative purposes, average annual since inception returns listed for the Indexes refer to the inception date of Class I of the Portfolio, not the inception of the Indexes.
6
Morgan Stanley Institutional Fund Trust
Annual Report — September 30, 2015
Portfolio of Investments
High Yield Portfolio
| | | Face
Amount
(000) | | Value
(000) | |
Fixed Income Securities (97.3%) | |
Corporate Bonds (92.7%) | |
Basic Materials (5.0%) | |
American Gilsonite Co. | |
11.50%, 9/1/17 (a) | | $ | 500 | | | $ | 428 | | |
Chemtura Corp. | |
5.75%, 7/15/21 | | | 350 | | | | 347 | | |
Eco Services Operations LLC/Eco Finance Corp. | |
8.50%, 11/1/22 (a) | | | 350 | | | | 313 | | |
FMG Resources August 2006 Pty Ltd. | |
9.75%, 3/1/22 (a) | | | 450 | | | | 420 | | |
Hexion, Inc., | |
8.88%, 2/1/18 | | | 550 | | | | 443 | | |
10.00%, 4/15/20 | | | 250 | | | | 241 | | |
Lundin Mining Corp. | |
7.50%, 11/1/20 (a) | | | 400 | | | | 388 | | |
Permian Holdings, Inc. | |
10.50%, 1/15/18 (a) | | | 210 | | | | 118 | | |
Prince Mineral Holding Corp. | |
11.50%, 12/15/19 (a) | | | 450 | | | | 380 | | |
Signode Industrial Group Lux SA/
Signode Industrial Group US, Inc. | |
6.38%, 5/1/22 (a) | | | 550 | | | | 522 | | |
| | | | 3,600 | | |
Communications (9.5%) | |
Altice Financing SA | |
6.63%, 2/15/23 (a) | | | 500 | | | | 482 | | |
Altice Finco SA | |
8.13%, 1/15/24 (a) | | | 250 | | | | 239 | | |
Bankrate, Inc. | |
6.13%, 8/15/18 (a) | | | 350 | | | | 343 | | |
Cable One, Inc. | |
5.75%, 6/15/22 (a) | | | 500 | | | | 494 | | |
Cablevision Systems Corp. | |
7.75%, 4/15/18 | | | 150 | | | | 150 | | |
CCO Holdings LLC/CCO Holdings Capital Corp. | |
5.75%, 1/15/24 | | | 100 | | | | 96 | | |
Columbus International, Inc. | |
7.38%, 3/30/21 (a) | | | 450 | | | | 467 | | |
CommScope Technologies Finance LLC | |
6.00%, 6/15/25 (a) | | | 400 | | | | 385 | | |
CommScope, Inc. | |
5.50%, 6/15/24 (a) | | | 100 | | | | 96 | | |
Crown Castle International Corp. | |
5.25%, 1/15/23 | | | 250 | | | | 265 | | |
CSC Holdings LLC | |
5.25%, 6/1/24 | | | 500 | | | | 396 | | |
GCI, Inc. | |
6.88%, 4/15/25 | | | 250 | | | | 253 | | |
inVentiv Health, Inc. | |
9.00%, 1/15/18 (a) | | | 250 | | | | 259 | | |
Lamar Media Corp. | |
5.38%, 1/15/24 | | | 250 | | | | 254 | | |
| | | Face
Amount
(000) | | Value
(000) | |
MDC Partners, Inc. | |
6.75%, 4/1/20 (a) | | $ | 300 | | | $ | 297 | | |
Midcontinent Communications &
Midcontinent Finance Corp., | |
6.25%, 8/1/21 (a) | | | 450 | | | | 450 | | |
6.88%, 8/15/23 (a) | | | 350 | | | | 350 | | |
Outfront Media Capital LLC/
Outfront Media Capital Corp. | |
5.63%, 2/15/24 | | | 350 | | | | 356 | | |
Sable International Finance Ltd. | |
6.88%, 8/1/22 (a) | | | 500 | | | | 506 | | |
SBA Telecommunications, Inc. | |
5.75%, 7/15/20 | | | 250 | | | | 258 | | |
Syniverse Holdings, Inc. | |
9.13%, 1/15/19 | | | 250 | | | | 214 | | |
T-Mobile USA, Inc. | |
6.84%, 4/28/23 | | | 250 | | | | 248 | | |
| | | | 6,858 | | |
Consumer, Cyclical (20.5%) | |
Accuride Corp. | |
9.50%, 8/1/18 | | | 400 | | | | 403 | | |
Air Canada | |
7.75%, 4/15/21 (a) | | | 450 | | | | 475 | | |
Algeco Scotsman Global Finance PLC, | |
8.50%, 10/15/18 (a) | | | 200 | | | | 176 | | |
10.75%, 10/15/19 (a) | | | 200 | | | | 107 | | |
Allied Specialty Vehicles, Inc. | |
8.50%, 11/1/19 (a) | | | 350 | | | | 366 | | |
American Airlines Group, Inc. | |
5.50%, 10/1/19 (a) | | | 250 | | | | 253 | | |
American Builders & Contractors Supply Co., Inc. | |
5.63%, 4/15/21 (a) | | | 350 | | | | 345 | | |
AV Homes, Inc. | |
8.50%, 7/1/19 | | | 350 | | | | 347 | | |
Beacon Roofing Supply, Inc. | |
6.38%, 10/1/23 | | | 300 | | | | 302 | | |
Carrols Restaurant Group, Inc. | |
8.00%, 5/1/22 | | | 450 | | | | 476 | | |
CCM Merger, Inc. | |
9.13%, 5/1/19 (a) | | | 100 | | | | 106 | | |
Century Communities, Inc., | |
6.88%, 5/15/22 | | | 350 | | | | 334 | | |
6.88%, 5/15/22 (a) | | | 250 | | | | 239 | | |
Chester Downs & Marina LLC/
Chester Downs Finance Corp. | |
9.25%, 2/1/20 (a) | | | 450 | | | | 343 | | |
Dollar Tree, Inc. | |
5.75%, 3/1/23 (a) | | | 500 | | | | 521 | | |
Downstream Development Authority of the
Quapaw Tribe of Oklahoma | |
10.50%, 7/1/19 (a) | | | 417 | | | | 437 | | |
Eldorado Resorts, Inc. | |
7.00%, 8/1/23 (a) | | | 200 | | | | 198 | | |
The accompanying notes are an integral part of the financial statements.
7
Morgan Stanley Institutional Fund Trust
Annual Report — September 30, 2015
Portfolio of Investments (cont'd)
High Yield Portfolio
| | | Face
Amount
(000) | | Value
(000) | |
Consumer, Cyclical (cont'd) | |
Empire Today LLC/Empire Today Finance Corp. | |
11.38%, 2/1/17 (a) | | $ | 175 | | | $ | 165 | | |
Exide Technologies | |
8.63%, 2/1/18 (b)(c) | | | 100 | | | | 1 | | |
FelCor Lodging LP | |
6.00%, 6/1/25 | | | 450 | | | | 452 | | |
Gibson Brands, Inc. | |
8.88%, 8/1/18 (a) | | | 500 | | | | 444 | | |
Global Partners LP/GLP Finance Corp. | |
6.25%, 7/15/22 | | | 475 | | | | 420 | | |
Golden Nugget Escrow, Inc. | |
8.50%, 12/1/21 (a) | | | 250 | | | | 253 | | |
Greektown Holdings LLC/
Greektown Mothership Corp. | |
8.88%, 3/15/19 (a) | | | 350 | | | | 361 | | |
Guitar Center, Inc. | |
6.50%, 4/15/19 (a) | | | 350 | | | | 324 | | |
Hilton Worldwide Finance LLC/
Hilton Worldwide Finance Corp. | |
5.63%, 10/15/21 | | | 250 | | | | 259 | | |
International Game Technology PLC | |
5.63%, 2/15/20 (a) | | | 250 | | | | 244 | | |
JC Penney Corp., Inc. | |
8.13%, 10/1/19 | | | 400 | | | | 402 | | |
Logan's Roadhouse, Inc. | |
10.75%, 10/15/17 | | | 300 | | | | 200 | | |
Meritor, Inc. | |
6.25%, 2/15/24 | | | 250 | | | | 239 | | |
Neiman Marcus Group Ltd., LLC | |
8.75%, 10/15/21 (a)(d) | | | 350 | | | | 362 | | |
Oshkosh Corp. | |
5.38%, 3/1/22 | | | 350 | | | | 357 | | |
Party City Holdings, Inc. | |
6.13%, 8/15/23 (a) | | | 250 | | | | 253 | | |
Pittsburgh Glass Works LLC | |
8.00%, 11/15/18 (a) | | | 500 | | | | 520 | | |
Playa Resorts Holding BV | |
8.00%, 8/15/20 (a) | | | 500 | | | | 507 | | |
Rite Aid Corp., | |
6.13%, 4/1/23 (a) | | | 250 | | | | 249 | | |
6.75%, 6/15/21 | | | 500 | | | | 514 | | |
RSI Home Products, Inc. | |
6.50%, 3/15/23 (a) | | | 450 | | | | 452 | | |
Seminole Hard Rock Entertainment, Inc./
Seminole Hard Rock International LLC | |
5.88%, 5/15/21 (a) | | | 250 | | | | 248 | | |
Sonic Automotive, Inc. | |
5.00%, 5/15/23 | | | 375 | | | | 361 | | |
Speedway Motorsports, Inc. | |
5.13%, 2/1/23 | | | 250 | | | | 246 | | |
| | | Face
Amount
(000) | | Value
(000) | |
Suburban Propane Partners LP/
Suburban Energy Finance Corp. | |
5.75%, 3/1/25 | | $ | 250 | | | $ | 238 | | |
Sugarhouse HSP Gaming Prop Mezz LP/
Sugarhouse HSP Gaming Finance Corp. | |
6.38%, 6/1/21 (a) | | | 125 | | | | 118 | | |
Tops Holding LLC/Tops Markets II Corp. | |
8.00%, 6/15/22 (a) | | | 500 | | | | 503 | | |
United Continental Holdings, Inc. | |
6.38%, 6/1/18 | | | 400 | | | | 421 | | |
VistaJet Malta Finance PLC/
VistaJet Co., Finance LLC | |
7.75%, 6/1/20 (a) | | | 300 | | | | 273 | | |
| | | | 14,814 | | |
Consumer, Non-Cyclical (17.1%) | |
Acadia Healthcare Co., Inc., | |
5.13%, 7/1/22 | | | 250 | | | | 247 | | |
6.13%, 3/15/21 | | | 400 | | | | 418 | | |
Ahern Rentals, Inc. | |
7.38%, 5/15/23 (a) | | | 400 | | | | 350 | | |
Albea Beauty Holdings SA | |
8.38%, 11/1/19 (a) | | | 100 | | | | 106 | | |
Alere, Inc. | |
6.38%, 7/1/23 (a) | | | 200 | | | | 204 | | |
American Achievement Corp. | |
10.88%, 4/15/16 (a) | | | 400 | | | | 397 | | |
Amsurg Corp. | |
5.63%, 7/15/22 | | | 275 | | | | 276 | | |
Aramark Services, Inc. | |
5.75%, 3/15/20 | | | 500 | | | | 521 | | |
Beverages & More, Inc. | |
10.00%, 11/15/18 (a) | | | 500 | | | | 482 | | |
Brand Energy & Infrastructure Services, Inc. | |
8.50%, 12/1/21 (a) | | | 250 | | | | 224 | | |
Bumble Bee Holdco SCA | |
9.63%, 3/15/18 (a)(d) | | | 465 | | | | 472 | | |
Cenveo Corp. | |
6.00%, 8/1/19 (a) | | | 250 | | | | 211 | | |
Concordia Healthcare Corp. | |
7.00%, 4/15/23 (a) | | | 250 | | | | 219 | | |
Constellis Holdings LLC/Constellis Finance Corp. | |
9.75%, 5/15/20 (a) | | | 500 | | | | 457 | | |
DJO Finco, Inc./DJO Finance LLC/
DJO Finance Corp. | |
8.13%, 6/15/21 (a) | | | 250 | | | | 244 | | |
DPx Holdings BV | |
7.50%, 2/1/22 (a) | | | 100 | | | | 101 | | |
DS Services of America, Inc. | |
10.00%, 9/1/21 (a) | | | 304 | | | | 351 | | |
DynCorp International, Inc. | |
10.38%, 7/1/17 | | | 400 | | | | 288 | | |
Endo Ltd./Endo Finance LLC/Endo Finco, Inc. | |
6.00%, 7/15/23 (a) | | | 450 | | | | 445 | | |
The accompanying notes are an integral part of the financial statements.
8
Morgan Stanley Institutional Fund Trust
Annual Report — September 30, 2015
Portfolio of Investments (cont'd)
High Yield Portfolio
| | | Face
Amount
(000) | | Value
(000) | |
Consumer, Non-Cyclical (cont'd) | |
Global A&T Electronics Ltd. | |
10.00%, 2/1/19 (a) | | $ | 400 | | | $ | 315 | | |
Harland Clarke Holdings Corp. | |
9.75%, 8/1/18 (a) | | | 500 | | | | 516 | | |
Jaguar Holding Co. II/
Pharmaceutical Product Development LLC | |
6.38%, 8/1/23 (a) | | | 500 | | | | 487 | | |
JLL/Delta Dutch Pledgeco BV | |
8.75%, 5/1/20 (a)(d) | | | 350 | | | | 354 | | |
KeHE Distributors LLC/KeHE Finance Corp. | |
7.63%, 8/15/21 (a) | | | 370 | | | | 389 | | |
Mallinckrodt International Finance SA/
Mallinckrodt CB LLC | |
5.50%, 4/15/25 (a) | | | 450 | | | | 403 | | |
Monitronics International, Inc. | |
9.13%, 4/1/20 | | | 185 | | | | 167 | | |
Mustang Merger Corp. | |
8.50%, 8/15/21 (a) | | | 270 | | | | 281 | | |
Pinnacle Operating Corp. | |
9.00%, 11/15/20 (a) | | | 400 | | | | 389 | | |
Quintiles Transnational Corp. | |
4.88%, 5/15/23 (a) | | | 300 | | | | 298 | | |
Safway Group Holding LLC/Safway Finance Corp. | |
7.00%, 5/15/18 (a) | | | 375 | | | | 386 | | |
Service Corp. International | |
5.38%, 1/15/22 | | | 100 | | | | 104 | | |
Spectrum Brands, Inc. | |
5.75%, 7/15/25 (a) | | | 250 | | | | 256 | | |
Tenet Healthcare Corp. | |
3.84%, 6/15/20 (a)(e) | | | 450 | | | | 447 | | |
TMS International Corp. | |
7.63%, 10/15/21 (a) | | | 250 | | | | 234 | | |
United Rentals North America, Inc. | |
5.75%, 11/15/24 | | | 500 | | | | 481 | | |
US Foods, Inc. | |
8.50%, 6/30/19 | | | 470 | | | | 488 | | |
Valeant Pharmaceuticals International, Inc. | |
5.88%, 5/15/23 (a) | | | 250 | | | | 240 | | |
Wells Enterprises, Inc. | |
6.75%, 2/1/20 (a) | | | 88 | | | | 90 | | |
| | | | 12,338 | | |
Diversified (0.6%) | |
Argos Merger Sub, Inc. | |
7.13%, 3/15/23 (a) | | | 250 | | | | 253 | | |
Horizon Pharma Financing, Inc. | |
6.63%, 5/1/23 (a) | | | 250 | | | | 222 | | |
| | | | 475 | | |
Energy (9.5%) | |
Approach Resources, Inc. | |
7.00%, 6/15/21 | | | 50 | | | | 30 | | |
| | | Face
Amount
(000) | | Value
(000) | |
Blue Racer Midstream LLC/
Blue Racer Finance Corp. | |
6.13%, 11/15/22 (a) | | $ | 350 | | | $ | 334 | | |
Bonanza Creek Energy, Inc. | |
6.75%, 4/15/21 | | | 100 | | | | 70 | | |
Carrizo Oil & Gas, Inc. | |
6.25%, 4/15/23 | | | 425 | | | | 372 | | |
Crestwood Midstream Partners LP/
Crestwood Midstream Finance Corp., | |
6.13%, 3/1/22 | | | 130 | | | | 113 | | |
6.25%, 4/1/23 (a) | | | 250 | | | | 214 | | |
CrownRock LP/CrownRock Finance, Inc. | |
7.75%, 2/15/23 (a) | | | 200 | | | | 197 | | |
DCP Midstream LLC | |
5.35%, 3/15/20 (a) | | | 400 | | | | 389 | | |
Endeavor Energy Resources LP/
EER Finance, Inc. | |
8.13%, 9/15/23 (a) | | | 500 | | | | 482 | | |
Halcon Resources Corp. | |
8.63%, 2/1/20 (a) | | | 250 | | | | 209 | | |
Hilcorp Energy I LP/Hilcorp Finance Co., | |
5.00%, 12/1/24 (a) | | | 250 | | | | 214 | | |
5.75%, 10/1/25 (a) | | | 250 | | | | 221 | | |
Laredo Petroleum, Inc. | |
6.25%, 3/15/23 | | | 200 | | | | 183 | | |
Lonestar Resources America, Inc. | |
8.75%, 4/15/19 (a) | | | 350 | | | | 233 | | |
Matador Resources Co. | |
6.88%, 4/15/23 (a) | | | 225 | | | | 217 | | |
Memorial Resource Development Corp. | |
5.88%, 7/1/22 | | | 50 | | | | 46 | | |
Newfield Exploration Co. | |
5.38%, 1/1/26 | | | 200 | | | | 184 | | |
Noble Energy, Inc. | |
5.88%, 6/1/24 | | | 100 | | | | 100 | | |
Northern Oil and Gas, Inc. | |
8.00%, 6/1/20 | | | 300 | | | | 225 | | |
Northern Tier Energy LLC/
Northern Tier Finance Corp. | |
7.13%, 11/15/20 | | | 300 | | | | 301 | | |
Pacific Drilling V Ltd. | |
7.25%, 12/1/17 (a) | | | 450 | | | | 308 | | |
PetroQuest Energy, Inc. | |
10.00%, 9/1/17 | | | 400 | | | | 356 | | |
Rice Energy, Inc. | |
6.25%, 5/1/22 | | | 500 | | | | 448 | | |
Rose Rock Midstream LP/
Rose Rock Finance Corp. | |
5.63%, 11/15/23 (a) | | | 450 | | | | 394 | | |
Seven Generations Energy Ltd., | |
6.75%, 5/1/23 (a) | | | 50 | | | | 43 | | |
8.25%, 5/15/20 (a) | | | 350 | | | | 331 | | |
SM Energy Co. | |
5.00%, 1/15/24 | | | 250 | | | | 213 | | |
The accompanying notes are an integral part of the financial statements.
9
Morgan Stanley Institutional Fund Trust
Annual Report — September 30, 2015
Portfolio of Investments (cont'd)
High Yield Portfolio
| | | Face
Amount
(000) | | Value
(000) | |
Energy (cont'd) | |
Tesoro Logistics LP/
Tesoro Logistics Finance Corp. | |
5.50%, 10/15/19 (a) | | $ | 250 | | | $ | 246 | | |
Triangle USA Petroleum Corp. | |
6.75%, 7/15/22 (a) | | | 500 | | | | 213 | | |
| | | | 6,886 | | |
Finance (9.4%) | |
Ardagh Finance Holdings SA | |
8.63%, 6/15/19 (a)(d) | | | 490 | | | | 502 | | |
Baytex Energy Corp. | |
5.63%, 6/1/24 (a) | | | 350 | | | | 278 | | |
CNO Financial Group, Inc. | |
4.50%, 5/30/20 | | | 250 | | | | 256 | | |
Compiler Finance Sub, Inc. | |
7.00%, 5/1/21 (a) | | | 500 | | | | 302 | | |
CTR Partnership LP/CareTrust Capital Corp. | |
5.88%, 6/1/21 | | | 250 | | | | 256 | | |
DuPont Fabros Technology LP | |
5.63%, 6/15/23 | | | 250 | | | | 252 | | |
Forestar USA Real Estate Group, Inc. | |
8.50%, 6/1/22 (a) | | | 400 | | | | 416 | | |
HUB International Ltd. | |
7.88%, 10/1/21 (a) | | | 300 | | | | 287 | | |
Infinity Acquisition LLC/
Infinity Acquisition Finance Corp. | |
7.25%, 8/1/22 (a) | | | 250 | | | | 225 | | |
Iron Mountain, Inc. | |
6.00%, 10/1/20 (a) | | | 500 | | | | 506 | | |
Jefferies Finance LLC/JFIN Co-Issuer Corp. | |
6.88%, 4/15/22 (a) | | | 450 | | | | 412 | | |
KCG Holdings, Inc. | |
6.88%, 3/15/20 (a) | | | 400 | | | | 371 | | |
Kennedy-Wilson, Inc. | |
5.88%, 4/1/24 | | | 500 | | | | 490 | | |
NewStar Financial, Inc. | |
7.25%, 5/1/20 (a) | | | 400 | | | | 399 | | |
Oxford Finance LLC/Oxford Finance Co-Issuer, Inc. | |
7.25%, 1/15/18 (a) | | | 350 | | | | 358 | | |
Provident Funding Associates LP/
PFG Finance Corp. | |
6.75%, 6/15/21 (a) | | | 250 | | | | 238 | | |
Quicken Loans, Inc. | |
5.75%, 5/1/25 (a) | | | 350 | | | | 330 | | |
Rivers Pittsburgh Borrower LP/
Rivers Pittsburgh Finance Corp. | |
9.50%, 6/15/19 (a) | | | 498 | | | | 519 | | |
Sabra Health Care LP/Sabra Capital Corp. | |
5.50%, 2/1/21 | | | 350 | | | | 366 | | |
Transworld Systems, Inc. | |
9.50%, 8/15/21 (a) | | | 100 | | | | 54 | | |
| | | | 6,817 | | |
| | | Face
Amount
(000) | | Value
(000) | |
Industrials (18.4%) | |
ADS Tactical, Inc. | |
11.00%, 4/1/18 (a) | | $ | 500 | | | $ | 514 | | |
Aguila 3 SA | |
7.88%, 1/31/18 (a) | | | 250 | | | | 253 | | |
Apex Tool Group LLC | |
7.00%, 2/1/21 (a) | | | 500 | | | | 412 | | |
Artesyn Embedded Technologies, Inc. | |
9.75%, 10/15/20 (a) | | | 375 | | | | 377 | | |
Associated Asphalt Partners LLC/
Road Holdings III LLC/
Associated Asphalt Finance | |
8.50%, 2/15/18 (a) | | | 517 | | | | 509 | | |
Associated Materials LLC/AMH New Finance, Inc. | |
9.13%, 11/1/17 | | | 200 | | | | 162 | | |
Belden, Inc. | |
5.25%, 7/15/24 (a) | | | 300 | | | | 279 | | |
BlueLine Rental Finance Corp. | |
7.00%, 2/1/19 (a) | | | 450 | | | | 434 | | |
CEVA Group PLC | |
4.00%, 5/1/18 (a) | | | 400 | | | | 355 | | |
Cleaver-Brooks, Inc. | |
8.75%, 12/15/19 (a) | | | 300 | | | | 285 | | |
Consolidated Container Co., LLC/
Consolidated Container Capital, Inc. | |
10.13%, 7/15/20 (a) | | | 350 | | | | 296 | | |
Coveris Holdings SA | |
7.88%, 11/1/19 (a) | | | 200 | | | | 191 | | |
| CPG Merger Sub LLC | |
8.00%, 10/1/21 (a) | | | 400 | | | | 400 | | |
CTP Transportation Products LLC/CTP Finance, Inc. | |
8.25%, 12/15/19 (a) | | | 250 | | | | 267 | | |
DH Services Luxembourg Sarl | |
7.75%, 12/15/20 (a) | | | 50 | | | | 51 | | |
Emeco Pty Ltd. | |
9.88%, 3/15/19 (a) | | | 200 | | | | 108 | | |
EnPro Industries, Inc. | |
5.88%, 9/15/22 | | | 117 | | | | 118 | | |
Florida East Coast Holdings Corp. | |
6.75%, 5/1/19 (a) | | | 250 | | | | 246 | | |
Gibraltar Industries, Inc. | |
6.25%, 2/1/21 | | | 325 | | | | 332 | | |
Iracore International Holdings, Inc. | |
9.50%, 6/1/18 (a) | | | 400 | | | | 282 | | |
Jac Holding Corp. | |
11.50%, 10/1/19 (a) | | | 300 | | | | 296 | | |
JB Poindexter & Co., Inc. | |
9.00%, 4/1/22 (a) | | | 500 | | | | 529 | | |
Kemet Corp. | |
10.50%, 5/1/18 | | | 450 | | | | 417 | | |
Kratos Defense & Security Solutions, Inc. | |
7.00%, 5/15/19 | | | 251 | | | | 205 | | |
The accompanying notes are an integral part of the financial statements.
10
Morgan Stanley Institutional Fund Trust
Annual Report — September 30, 2015
Portfolio of Investments (cont'd)
High Yield Portfolio
| | | Face
Amount
(000) | | Value
(000) | |
Industrials (cont'd) | |
LMI Aerospace, Inc. | |
7.38%, 7/15/19 | | $ | 500 | | | $ | 485 | | |
Martin Midstream Partners LP/
Martin Midstream Finance Corp. | |
7.25%, 2/15/21 | | | 500 | | | | 465 | | |
MasTec, Inc. | |
4.88%, 3/15/23 | | | 500 | | | | 415 | | |
Michael Baker Holdings LLC/
Michael Baker Finance Corp. | |
8.88%, 4/15/19 (a)(d) | | | 350 | | | | 298 | | |
Michael Baker International LLC/
CDL Acquisition Co., Inc. | |
8.25%, 10/15/18 (a) | | | 200 | | | | 191 | | |
Navios Maritime Holdings, Inc./
Navios Maritime Finance II US, Inc. | |
8.13%, 2/15/19 | | | 550 | | | | 407 | | |
OPE KAG Finance Sub, Inc. | |
7.88%, 7/31/23 (a) | | | 400 | | | | 407 | | |
Plastipak Holdings, Inc. | |
6.50%, 10/1/21 (a) | | | 300 | | | | 288 | | |
SAExploration Holdings, Inc. | |
10.00%, 7/15/19 | | | 500 | | | | 318 | | |
Summit Materials LLC/
Summit Materials Finance Corp., | |
6.13%, 7/15/23 | | | 350 | | | | 339 | | |
10.50%, 1/31/20 | | | 86 | | | | 92 | | |
Syncreon Group BV/
Syncreon Global Finance US, Inc. | |
8.63%, 11/1/21 (a) | | | 450 | | | | 337 | | |
Techniplas LLC | |
10.00%, 5/1/20 (a) | | | 500 | | | | 462 | | |
Transfield Services Ltd. | |
8.38%, 5/15/20 (a) | | | 50 | | | | 52 | | |
Vander Intermediate Holding II Corp. | |
9.75%, 2/1/19 (a)(d) | | | 100 | | | | 81 | | |
Wise Metals Intermediate Holdings LLC/
Wise Holdings Finance Corp. | |
9.75%, 6/15/19 (a) | | | 450 | | | | 435 | | |
XPO Logistics, Inc. | |
7.88%, 9/1/19 (a) | | | 500 | | | | 489 | | |
Zachry Holdings, Inc. | |
7.50%, 2/1/20 (a) | | | 400 | | | | 397 | | |
| | | | 13,276 | | |
Technology (1.7%) | |
BCP Singapore VI Cayman Financing Co., Ltd. | |
8.00%, 4/15/21 (a) | | | 450 | | | | 424 | | |
Boxer Parent Co., Inc. | |
9.00%, 10/15/19 (a)(d) | | | 450 | | | | 321 | | |
First Data Corp. | |
11.75%, 8/15/21 | | | 315 | | | | 351 | | |
Quiksilver, Inc./QS Wholesale, Inc. | |
7.88%, 8/1/18 (a)(b)(c) | | | 150 | | | | 122 | | |
| | | | 1,218 | | |
| | | Face
Amount
(000) | | Value
(000) | |
Utilities (1.0%) | |
DPL, Inc. | |
6.75%, 10/1/19 | | $ | 200 | | | $ | 209 | | |
GenOn Americas Generation LLC | |
8.50%, 10/1/21 | | | 450 | | | | 387 | | |
LBC Tank Terminals Holding Netherlands BV | |
6.88%, 5/15/23 (a) | | | 100 | | | | 104 | | |
Sabine Pass LNG LP | |
6.50%, 11/1/20 | | | 50 | | | | 49 | | |
| | | | 749 | | |
| | | | 67,031 | | |
Sovereign (1.0%) | |
Government (1.0%) | |
Select Medical Corp. | |
6.38%, 6/1/21 | | | 350 | | | | 343 | | |
Waterjet Holdings, Inc. | |
7.63%, 2/1/20 (a) | | | 350 | | | | 352 | | |
| | | | 695 | | |
Variable Rate Senior Loan Interests (3.6%) | |
Basic Materials (0.3%) | |
FMG Resources August 2006 Pty Ltd.,
Term B | |
3.75%, 10/20/15 | | | 249 | | | | 204 | | |
Consumer, Cyclical (1.4%) | |
Builders Firstsource, Inc.,
Term B | |
6.00%, 12/31/15 | | | 250 | | | | 248 | | |
Diamond Resorts Corp.,
Term Loan | |
5.50%, 10/30/15 | | | 70 | | | | 70 | | |
Graton Economic Development Authority,
Term B | |
4.75%, 10/30/15 | | | 300 | | | | 300 | | |
Navistar International Corp.,
Term B | |
6.50%, 11/12/15 | | | 400 | | | | 392 | | |
| | | | 1,010 | | |
Energy (0.2%) | |
Drillships Ocean Ventures, Inc.,
Term B | |
5.50%, 10/26/15 | | | 272 | | | | 183 | | |
Industrials (1.1%) | |
Atkore international, Inc.,
2nd Lien Term | |
7.75%, 12/31/15 | | | 300 | | | | 277 | | |
Quality Distribution, Inc.,
1st Lien Term | |
5.75%, 12/30/15 | | | 500 | | | | 494 | | |
| | | | 771 | | |
Technology (0.6%) | |
Aspect Software, Inc.,
Term B | |
7.50%, 11/12/15 | | | 94 | | | | 92 | | |
The accompanying notes are an integral part of the financial statements.
11
Morgan Stanley Institutional Fund Trust
Annual Report — September 30, 2015
Portfolio of Investments (cont'd)
High Yield Portfolio
| | | Face
Amount
(000) | | Value
(000) | |
Technology (cont'd) | |
TTM Technologies, Inc.,
1st Lien Term | |
6.00%, 10/1/15 | | $ | 400 | | | $ | 374 | | |
| | | | 466 | | |
| | | | 2,634 | | |
Total Fixed Income Securities (Cost $75,107) | | | 70,360 | | |
| | | Shares | | Value
(000) | |
Common Stock (0.0%) | |
Auto Components (0.0%) | |
| Exide Technologies (f) (Cost $—) | | | 592 | | | | — | @ | |
Short-Term Investment (1.4%) | |
Investment Company (1.4%) | |
Morgan Stanley Institutional Liquidity
Funds — Money Market Portfolio —
Institutional Class (See Note G)
(Cost $991) | | | 991,485 | | | | 991 | | |
Total Investments (98.7%) (Cost $76,098) (g) | | | 71,351 | | |
Other Assets in Excess of Liabilities (1.3%) | | | 940 | | |
Net Assets (100.0%) | | $ | 72,291 | | |
(a) 144A security — Certain conditions for public sale may exist. Unless otherwise noted, these securities are deemed to be liquid.
(b) Non-income producing security; bond in default.
(c) Issuer in bankruptcy.
(d) Payment-in-kind security.
(e) Variable/Floating Rate Security — Interest rate changes on these instruments are based on changes in a designated base rate. The rates shown are those in effect on September 30, 2015.
(f) At September 30, 2015, the Portfolio held a fair valued security valued at less than $500, representing less than 0.05% of net assets. This security has been fair valued as determined in good faith under procedures established by and under the general supervision of the Fund's Trustees.
(g) At September 30, 2015, the aggregate cost for Federal income tax purposes is approximately $76,122,000. The aggregate gross unrealized appreciation is approximately $351,000 and the aggregate gross unrealized depreciation is approximately $5,122,000 resulting in net unrealized depreciation of approximately $4,771,000.
@ Value is less than $500.
Portfolio Composition
Classification | | Percentage of
Total Investments | |
Consumer, Cyclical | | | 22.2 | % | |
Industrials | | | 19.7 | | |
Consumer, Non-Cyclical | | | 17.3 | | |
Energy | | | 9.9 | | |
Communications | | | 9.6 | | |
Finance | | | 9.6 | | |
Other* | | | 6.4 | | |
Basic Materials | | | 5.3 | | |
Total Investments | | | 100.0 | % | |
* Industries and/or investment types representing less than 5% of total investments.
The accompanying notes are an integral part of the financial statements.
12
Morgan Stanley Institutional Fund Trust
Annual Report — September 30, 2015
Statement of Assets and Liabilities | | September 30, 2015
(000) | |
Assets: | |
Investments in Securities of Unaffiliated Issuers, at Value (Cost $75,107) | | $ | 70,360 | | |
Investment in Security of Affiliated Issuer, at Value (Cost $991) | | | 991 | | |
Total Investments in Securities, at Value (Cost $76,098) | | | 71,351 | | |
Interest Receivable | | | 1,583 | | |
Receivable for Investments Sold | | | 824 | | |
Receivable for Portfolio Shares Sold | | | 106 | | |
Receivable from Affiliate | | | — | @ | |
Other Assets | | | 36 | | |
Total Assets | | | 73,900 | | |
Liabilities: | |
Payable for Investments Purchased | | | 1,452 | | |
Payable for Advisory Fees | | | 63 | | |
Payable for Professional Fees | | | 29 | | |
Payable for Portfolio Shares Redeemed | | | 14 | | |
Payable for Shareholder Services Fees — Class A | | | 12 | | |
Payable for Distribution and Shareholder Services Fees — Class L | | | — | @ | |
Payable for Distribution and Shareholder Services Fees — Class C | | | 1 | | |
Payable for Sub Transfer Agency Fees — Class I | | | — | @ | |
Payable for Sub Transfer Agency Fees — Class A | | | 11 | | |
Payable for Sub Transfer Agency Fees — Class L | | | — | @ | |
Payable for Custodian Fees | | | 6 | | |
Payable for Administration Fees | | | 5 | | |
Payable for Transfer Agency Fees — Class I | | | — | @ | |
Payable for Transfer Agency Fees — Class A | | | 1 | | |
Payable for Transfer Agency Fees — Class L | | | — | @ | |
Payable for Transfer Agency Fees — Class C | | | — | @ | |
Payable for Transfer Agency Fees — Class IS | | | — | @ | |
Bank Overdraft | | | 1 | | |
Other Liabilities | | | 14 | | |
Total Liabilities | | | 1,609 | | |
Net Assets | | $ | 72,291 | | |
Net Assets Consist of: | |
Paid-in-Capital | | $ | 77,838 | | |
Accumulated Undistributed Net Investment Income | | | 643 | | |
Accumulated Net Realized Loss | | | (1,443 | ) | |
Unrealized Appreciation (Depreciation) on: | |
Investments | | | (4,747 | ) | |
Net Assets | | $ | 72,291 | | |
The accompanying notes are an integral part of the financial statements.
13
Morgan Stanley Institutional Fund Trust
Annual Report — September 30, 2015
Statement of Assets and Liabilities (cont'd) | | September 30, 2015
(000) | |
CLASS I: | |
Net Assets | | $ | 13,255 | | |
| Shares Outstanding (unlimited number of shares authorized, no par value) (not in 000's) | | | 1,353,125 | | |
Net Asset Value, Offering and Redemption Price Per Share | | $ | 9.80 | | |
CLASS A: | |
Net Assets | | $ | 56,042 | | |
| Shares Outstanding (unlimited number of shares authorized, no par value) (not in 000's) | | | 5,728,249 | | |
Net Asset Value, Redemption Price Per Share | | $ | 9.78 | | �� |
Maximum Sales Load | | | 4.25 | % | |
Maximum Sales Charge | | $ | 0.43 | | |
Maximum Offering Price Per Share | | $ | 10.21 | | |
CLASS L: | |
Net Assets | | $ | 1,111 | | |
| Shares Outstanding (unlimited number of shares authorized, no par value) (not in 000's) | | | 113,576 | | |
Net Asset Value, Offering and Redemption Price Per Share | | $ | 9.78 | | |
CLASS C: | |
Net Assets | | $ | 1,309 | | |
| Shares Outstanding (unlimited number of shares authorized, no par value) (not in 000's) | | | 133,837 | | |
Net Asset Value, Offering and Redemption Price Per Share | | $ | 9.78 | | |
CLASS IS: | |
Net Assets | | $ | 574 | | |
| Shares Outstanding (unlimited number of shares authorized, no par value) (not in 000's) | | | 58,603 | | |
Net Asset Value, Offering and Redemption Price Per Share | | $ | 9.79 | | |
@ Amount is less than $500.
The accompanying notes are an integral part of the financial statements.
14
Morgan Stanley Institutional Fund Trust
Annual Report — September 30, 2015
Statement of Operations | | Year Ended
September 30, 2015
(000) | |
Investment Income: | |
Interest from Securities of Unaffiliated Issuers (Net of $—@ of Foreign Taxes Withheld) | | $ | 4,602 | | |
Dividends from Security of Affiliated Issuer (Note G) | | | 1 | | |
Total Investment Income | | | 4,603 | | |
Expenses: | |
Advisory Fees (Note B) | | | 364 | | |
Shareholder Services Fees — Class A (Note D) | | | 118 | | |
Distribution and Shareholder Services Fees — Class L (Note D) | | | 6 | | |
Distribution and Shareholder Services Fees — Class C (Note D) | | | 5 | | |
Professional Fees | | | 126 | | |
Sub Transfer Agency Fees — Class I | | | 1 | | |
Sub Transfer Agency Fees — Class A | | | 73 | | |
Sub Transfer Agency Fees — Class L | | | 1 | | |
Registration Fees | | | 58 | | |
Administration Fees (Note C) | | | 48 | | |
Pricing Fees | | | 29 | | |
Custodian Fees (Note F) | | | 27 | | |
Shareholder Reporting Fees | | | 18 | | |
Transfer Agency Fees — Class I (Note E) | | | 2 | | |
Transfer Agency Fees — Class A (Note E) | | | 2 | | |
Transfer Agency Fees — Class L (Note E) | | | 2 | | |
Transfer Agency Fees — Class C (Note E) | | | 1 | | |
Transfer Agency Fees — Class IS (Note E) | | | 1 | | |
Trustees' Fees and Expenses | | | 2 | | |
Other Expenses | | | 10 | | |
Total Expenses | | | 894 | | |
Waiver of Advisory Fees (Note B) | | | (246 | ) | |
Reimbursement of Class Specific Expenses — Class I (Note B) | | | (— | @) | |
Reimbursement of Class Specific Expenses — Class A (Note B) | | | (14 | ) | |
Reimbursement of Class Specific Expenses — Class L (Note B) | | | (1 | ) | |
Reimbursement of Class Specific Expenses — Class IS (Note B) | | | (1 | ) | |
Rebate from Morgan Stanley Affiliate (Note G) | | | (1 | ) | |
Net Expenses | | | 631 | | |
Net Investment Income | | | 3,972 | | |
Realized Loss: | |
Investments Sold | | | (1,431 | ) | |
Change in Unrealized Appreciation (Depreciation): | |
Investments | | | (4,386 | ) | |
Net Realized Loss and Change in Unrealized Appreciation (Depreciation) | | | (5,817 | ) | |
Net Decrease in Net Assets Resulting from Operations | | $ | (1,845 | ) | |
@ Amount is less than $500.
The accompanying notes are an integral part of the financial statements.
15
Morgan Stanley Institutional Fund Trust
Annual Report — September 30, 2015
Statements of Changes in Net Assets | | Year Ended
September 30, 2015
(000) | | Year Ended
September 30, 2014
(000) | |
Increase (Decrease) in Net Assets: | |
Operations: | |
Net Investment Income | | $ | 3,972 | | | $ | 1,476 | | |
Net Realized Gain (Loss) | | | (1,431 | ) | | | 321 | | |
Net Change in Unrealized Appreciation (Depreciation) | | | (4,386 | ) | | | (643 | ) | |
Net Increase (Decrease) in Net Assets Resulting from Operations | | | (1,845 | ) | | | 1,154 | | |
Distributions from and/or in Excess of: | |
Class I: | |
Net Investment Income | | | (714 | ) | | | (910 | ) | |
Net Realized Gain | | | (65 | ) | | | (550 | ) | |
Class A: | |
Net Investment Income | | | (2,818 | ) | | | (339 | ) | |
Net Realized Gain | | | (216 | ) | | | (81 | ) | |
Class L: | |
Net Investment Income | | | (71 | ) | | | (60 | ) | |
Net Realized Gain | | | (6 | ) | | | (21 | ) | |
Class C: | |
Net Investment Income | | | (24 | ) | | | — | | |
Class IS: | |
Net Investment Income | | | (16 | ) | | | (— | @) | |
Net Realized Gain | | | (— | @) | | | — | | |
Total Distributions | | | (3,930 | ) | | | (1,961 | ) | |
Capital Share Transactions:(1) | |
Class I: | |
Subscribed | | | 13,941 | | | | 2,503 | | |
Distributions Reinvested | | | 339 | | | | 231 | | |
Redeemed | | | (13,226 | ) | | | (1,800 | ) | |
Class A: | |
Subscribed | | | 33,441 | | | | 42,604 | | |
Distributions Reinvested | | | 3,021 | | | | 395 | | |
Redeemed | | | (16,149 | ) | | | (3,475 | ) | |
Class L: | |
Subscribed | | | 527 | | | | 1,661 | | |
Distributions Reinvested | | | 71 | | | | 69 | | |
Redeemed | | | (884 | ) | | | (501 | ) | |
Class C: | |
Subscribed | | | 2,023 | ** | | | — | | |
Distributions Reinvested | | | 23 | ** | | | — | | |
Redeemed | | | (651 | )** | | | — | | |
Class IS: | |
Subscribed | | | 1,828 | | | | 10 | * | |
Redeemed | | | (1,224 | ) | | | — | | |
Net Increase in Net Assets Resulting from Capital Share Transactions | | | 23,080 | | | | 41,697 | | |
Total Increase in Net Assets | | | 17,305 | | | | 40,890 | | |
Net Assets: | |
Beginning of Period | | | 54,986 | | | | 14,096 | | |
End of Period (Including Accumulated Undistributed Net Investment Income of $643 and $303) | | $ | 72,291 | | | $ | 54,986 | | |
(1) Capital Share Transactions: | |
Class I: | |
Shares Subscribed | | | 1,367 | | | | 230 | | |
Shares Issued on Distributions Reinvested | | | 33 | | | | 21 | | |
Shares Redeemed | | | (1,286 | ) | | | (164 | ) | |
Net Increase in Class I Shares Outstanding | | | 114 | | | | 87 | | |
Class A: | |
Shares Subscribed | | | 3,271 | | | | 3,929 | | |
Shares Issued on Distributions Reinvested | | | 297 | | | | 37 | | |
Shares Redeemed | | | (1,586 | ) | | | (319 | ) | |
Net Increase in Class A Shares Outstanding | | | 1,982 | | | | 3,647 | | |
The accompanying notes are an integral part of the financial statements.
16
Morgan Stanley Institutional Fund Trust
Annual Report — September 30, 2015
Statements of Changes in Net Assets (cont'd) | | Year Ended
September 30, 2015
(000) | | Year Ended
September 30, 2014
(000) | |
Class L: | |
Shares Subscribed | | | 52 | | | | 152 | | |
Shares Issued on Distributions Reinvested | | | 7 | | | | 6 | | |
Shares Redeemed | | | (87 | ) | | | (46 | ) | |
Net Increase (Decrease) in Class L Shares Outstanding | | | (28 | ) | | | 112 | | |
Class C: | |
Shares Subscribed | | | 197 | ** | | | — | | |
Shares Issued on Distributions Reinvested | | | 2 | ** | | | — | | |
Shares Redeemed | | | (65 | )** | | | — | | |
Net Increase in Class C Shares Outstanding | | | 134 | | | | — | | |
Class IS: | |
Shares Subscribed | | | 180 | | | | 1 | * | |
Shares Redeemed | | | (122 | ) | | | — | | |
Net Increase in Class IS Shares Outstanding | | | 58 | | | | 1 | | |
* For the period March 31, 2014 through September 30, 2014.
** For the period April 30, 2015 through September 30, 2015.
@ Amount is less than $500.
The accompanying notes are an integral part of the financial statements.
17
Morgan Stanley Institutional Fund Trust
Annual Report — September 30, 2015
Financial Highlights
High Yield Portfolio
| | | Class I | |
| | | Year Ended September 30, | | Period from
February 7, 2012^ to | |
Selected Per Share Data and Ratios | | 2015 | | 2014 | | 2013 | | September 30, 2012 | |
Net Asset Value, Beginning of Period | | $ | 10.73 | | | $ | 11.00 | | | $ | 10.71 | | | $ | 10.00 | | |
Income (Loss) from Investment Operations: | |
Net Investment Income† | | | 0.71 | | | | 0.75 | | | | 0.81 | | | | 0.50 | | |
Net Realized and Unrealized Gain (Loss) | | | (0.92 | ) | | | 0.25 | | | | 0.55 | | | | 0.59 | | |
Total from Investment Operations | | | (0.21 | ) | | | 1.00 | | | | 1.36 | | | | 1.09 | | |
Distributions from and/or in Excess of: | |
Net Investment Income | | | (0.66 | ) | | | (0.77 | ) | | | (0.81 | ) | | | (0.38 | ) | |
Net Realized Gain | | | (0.06 | ) | | | (0.50 | ) | | | (0.26 | ) | | | — | | |
Total Distributions | | | (0.72 | ) | | | (1.27 | ) | | | (1.07 | ) | | | (0.38 | ) | |
Net Asset Value, End of Period | | $ | 9.80 | | | $ | 10.73 | | | $ | 11.00 | | | $ | 10.71 | | |
Total Return++ | | | (2.10 | )% | | | 9.48 | % | | | 13.38 | % | | | 11.07 | %# | |
Ratios and Supplemental Data: | |
Net Assets, End of Period (Thousands) | | $ | 13,255 | | | $ | 13,300 | | | $ | 12,678 | | | $ | 10,975 | | |
Ratio of Expenses to Average Net Assets (1) | | | 0.74 | %+ | | | 0.75 | %+ | | | 0.75 | %+ | | | 0.74 | %+* | |
Ratio of Net Investment Income to Average Net Assets (1) | | | 6.88 | %+ | | | 6.89 | %+ | | | 7.42 | %+ | | | 7.53 | %+* | |
Ratio of Rebate from Morgan Stanley Affiliates to Average Net Assets | | | 0.00 | %§ | | | 0.00 | %§ | | | 0.00 | %§ | | | 0.01 | %* | |
Portfolio Turnover Rate | | | 62 | % | | | 96 | % | | | 227 | % | | | 192 | %# | |
(1) Supplemental Information on the Ratios to Average Net Assets: | |
Ratios Before Expense Limitation: | |
Expenses to Average Net Assets | | | 1.17 | % | | | 1.85 | % | | | 3.16 | % | | | 3.17 | %* | |
Net Investment Income to Average Net Assets | | | 6.45 | % | | | 5.79 | % | | | 5.01 | % | | | 5.10 | %* | |
^ Commencement of Operations.
† Per share amount is based on average shares outstanding.
++ Calculated based on the net asset value as of the last business day of the period.
+ The Ratios of Expenses and Net Investment Income reflect the rebate of certain Portfolio expenses in connection with the investments in Morgan Stanley affiliates during the period. The effect of the rebate on the ratios is disclosed in the above table as "Ratio of Rebate from Morgan Stanley Affiliates to Average Net Assets."
§ Amount is less than 0.005%.
# Not Annualized.
* Annualized.
The accompanying notes are an integral part of the financial statements.
18
Morgan Stanley Institutional Fund Trust
Annual Report — September 30, 2015
Financial Highlights
High Yield Portfolio
| | | Class A | |
| | | Year Ended September 30, | | Period from
February 7, 2012^ to | |
Selected Per Share Data and Ratios | | 2015 | | 2014 | | 2013 | | September 30, 2012 | |
Net Asset Value, Beginning of Period | | $ | 10.72 | | | $ | 10.99 | | | $ | 10.71 | | | $ | 10.00 | | |
Income (Loss) from Investment Operations: | |
Net Investment Income† | | | 0.66 | | | | 0.65 | | | | 0.77 | | | | 0.48 | | |
Net Realized and Unrealized Gain (Loss) | | | (0.92 | ) | | | 0.31 | | | | 0.55 | | | | 0.59 | | |
Total from Investment Operations | | | (0.26 | ) | | | 0.96 | | | | 1.32 | | | | 1.07 | | |
Distributions from and/or in Excess of: | |
Net Investment Income | | | (0.62 | ) | | | (0.73 | ) | | | (0.78 | ) | | | (0.36 | ) | |
Net Realized Gain | | | (0.06 | ) | | | (0.50 | ) | | | (0.26 | ) | | | — | | |
Total Distributions | | | (0.68 | ) | | | (1.23 | ) | | | (1.04 | ) | | | (0.36 | ) | |
Net Asset Value, End of Period | | $ | 9.78 | | | $ | 10.72 | | | $ | 10.99 | | | $ | 10.71 | | |
Total Return++ | | | (2.43 | )% | | | 9.15 | % | | | 13.01 | % | | | 10.92 | %# | |
Ratios and Supplemental Data: | |
Net Assets, End of Period (Thousands) | | $ | 56,042 | | | $ | 40,157 | | | $ | 1,092 | | | $ | 107 | | |
Ratio of Expenses to Average Net Assets (1) | | | 1.10 | %+ | | | 1.02 | %+ | | | 1.01 | %+^^ | | | 0.99 | %+* | |
Ratio of Net Investment Income to Average Net Assets (1) | | | 6.49 | %+ | | | 5.99 | %+ | | | 7.04 | %+^^ | | | 7.28 | %+* | |
Ratio of Rebate from Morgan Stanley Affiliates to Average Net Assets | | | 0.00 | %§ | | | 0.01 | % | | | 0.00 | %§ | | | 0.01 | %* | |
Portfolio Turnover Rate | | | 62 | % | | | 96 | % | | | 227 | % | | | 192 | %# | |
(1) Supplemental Information on the Ratios to Average Net Assets: | |
Ratios Before Expense Limitation: | |
Expenses to Average Net Assets | | | 1.53 | % | | | 2.06 | % | | | 4.22 | % | | | 3.42 | %* | |
Net Investment Income to Average Net Assets | | | 6.06 | % | | | 4.95 | % | | | 3.83 | % | | | 4.85 | %* | |
^ Commencement of Operations.
† Per share amount is based on average shares outstanding.
++ Calculated based on the net asset value which does not reflect sales charges, if applicable, as of the last business day of the period.
+ The Ratios of Expenses and Net Investment Income reflect the rebate of certain Portfolio expenses in connection with the investments in Morgan Stanley affiliates during the period. The effect of the rebate on the ratios is disclosed in the above table as "Ratio of Rebate from Morgan Stanley Affiliates to Average Net Assets."
^^ Effective September 16, 2013, the Adviser has agreed to limit the ratio of expenses to average net assets to the maximum ratio of 1.10% for Class A shares. Prior to September 16, 2013, the maximum ratio was 1.00% for Class A shares.
§ Amount is less than 0.005%.
# Not Annualized.
* Annualized.
The accompanying notes are an integral part of the financial statements.
19
Morgan Stanley Institutional Fund Trust
Annual Report — September 30, 2015
Financial Highlights
High Yield Portfolio
| | | Class L | |
| | | Year Ended September 30, | | Period from
February 7, 2012^ to | |
Selected Per Share Data and Ratios | | 2015 | | 2014 | | 2013 | | September 30, 2012 | |
Net Asset Value, Beginning of Period | | $ | 10.72 | | | $ | 10.99 | | | $ | 10.70 | | | $ | 10.00 | | |
Income (Loss) from Investment Operations: | |
Net Investment Income† | | | 0.64 | | | | 0.67 | | | | 0.75 | | | | 0.46 | | |
Net Realized and Unrealized Gain (Loss) | | | (0.93 | ) | | | 0.27 | | | | 0.56 | | | | 0.59 | | |
Total from Investment Operations | | | (0.29 | ) | | | 0.94 | | | | 1.31 | | | | 1.05 | | |
Distributions from and/or in Excess of: | |
Net Investment Income | | | (0.59 | ) | | | (0.71 | ) | | | (0.76 | ) | | | (0.35 | ) | |
Net Realized Gain | | | (0.06 | ) | | | (0.50 | ) | | | (0.26 | ) | | | — | | |
Total Distributions | | | (0.65 | ) | | | (1.21 | ) | | | (1.02 | ) | | | (0.35 | ) | |
Net Asset Value, End of Period | | $ | 9.78 | | | $ | 10.72 | | | $ | 10.99 | | | $ | 10.70 | | |
Total Return++ | | | (2.70 | )% | | | 8.88 | % | | | 12.82 | % | | | 10.66 | %# | |
Ratios and Supplemental Data: | |
Net Assets, End of Period (Thousands) | | $ | 1,111 | | | $ | 1,519 | | | $ | 326 | | | $ | 107 | | |
Ratio of Expenses to Average Net Assets (1) | | | 1.35 | %+ | | | 1.35 | %+ | | | 1.26 | %+^^ | | | 1.24 | %+* | |
Ratio of Net Investment Income to Average Net Assets (1) | | | 6.25 | %+ | | | 6.14 | %+ | | | 6.90 | %+^^ | | | 7.03 | %+* | |
Ratio of Rebate from Morgan Stanley Affiliates to Average Net Assets | | | 0.00 | %§ | | | 0.00 | %§ | | | 0.00 | %§ | | | 0.01 | %* | |
Portfolio Turnover Rate | | | 62 | % | | | 96 | % | | | 227 | % | | | 192 | %# | |
(1) Supplemental Information on the Ratios to Average Net Assets: | |
Ratios Before Expense Limitation: | |
Expenses to Average Net Assets | | | 1.84 | % | | | 2.52 | % | | | 4.11 | % | | | 3.67 | %* | |
Net Investment Income to Average Net Assets | | | 5.76 | % | | | 4.97 | % | | | 4.05 | % | | | 4.60 | %* | |
^ Commencement of Operations.
† Per share amount is based on average shares outstanding.
++ Calculated based on the net asset value as of the last business day of the period.
+ The Ratios of Expenses and Net Investment Income reflect the rebate of certain Portfolio expenses in connection with the investments in Morgan Stanley affiliates during the period. The effect of the rebate on the ratios is disclosed in the above table as "Ratio of Rebate from Morgan Stanley Affiliates to Average Net Assets."
^^ Effective September 16, 2013, the Adviser has agreed to limit the ratio of expenses to average net assets to the maximum ratio of 1.35% for Class L shares. Prior to September 16, 2013, the maximum ratio was 1.25% for Class L shares.
§ Amount is less than 0.005%.
# Not Annualized.
* Annualized.
The accompanying notes are an integral part of the financial statements.
20
Morgan Stanley Institutional Fund Trust
Annual Report — September 30, 2015
Financial Highlights
High Yield Portfolio
| | | Class C | |
Selected Per Share Data and Ratios | | Period from
April 30, 2015^ to
September 30, 2015 | |
Net Asset Value, Beginning of Period | | $ | 10.39 | | |
Income (Loss) from Investment Operations: | |
Net Investment Income† | | | 0.24 | | |
Net Realized and Unrealized Loss | | | (0.62 | ) | |
Total from Investment Operations | | | (0.38 | ) | |
Distributions from and/or in Excess of: | |
Net Investment Income | | | (0.23 | ) | |
Net Asset Value, End of Period | | $ | 9.78 | | |
Total Return++ | | | (3.75 | )%# | |
Ratios and Supplemental Data: | |
Net Assets, End of Period, (Thousands) | | $ | 1,309 | | |
Ratios of Expenses to Average Net Assets (1) | | | 1.84 | %+* | |
Ratio of Net Investment Income to Average Net Assets (1) | | | 5.60 | %+* | |
Ratio of Rebate from Morgan Stanley Affiliates to Average Net Assets | | | 0.00 | %§* | |
Portfolio Turnover Rate | | | 62 | %# | |
(1) Supplemental Information on the Ratios to Average Net Assets: | |
Ratios Before Expense Limitation: | |
Expense to Average Net Assets | | | 2.15 | %* | |
Net Investment Income to Average Net Assets | | | 5.29 | %* | |
^ Commencement of Operations.
† Per share amount is based on average shares outstanding.
++ Calculated based on the net asset value which does not reflect sales charges, if applicable, as of the last business day of the period.
+ The Ratios of Expenses and Net Investment Income reflect the rebate of certain Portfolio expenses in connection with the investments in Morgan Stanley affiliates during the period. The effect of the rebate on the ratios is disclosed in the above table as "Ratio of Rebate from Morgan Stanley Affiliates to Average Net Assets."
§ Amount is less than 0.005%.
# Not Annualized.
* Annualized.
The accompanying notes are an integral part of the financial statements.
21
Morgan Stanley Institutional Fund Trust
Annual Report — September 30, 2015
Financial Highlights
High Yield Portfolio
| | | Class IS | |
Selected Per Share Data and Ratios | | Year Ended
September 30, 2015 | | Period from
March 28, 2014^ to
September 30, 2014 | |
Net Asset Value, Beginning of Period | | $ | 10.74 | | | $ | 10.98 | | |
Income (Loss) from Investment Operations: | |
Net Investment Income† | | | 0.69 | | | | 0.37 | | |
Net Realized and Unrealized Loss | | | (0.92 | ) | | | (0.27 | ) | |
Total from Investment Operations | | | (0.23 | ) | | | 0.10 | | |
Distributions from and/or in Excess of: | |
Net Investment Income | | | (0.66 | ) | | | (0.34 | ) | |
Net Realized Gain | | | (0.06 | ) | | | — | | |
Total Distributions | | | (0.72 | ) | | | (0.34 | ) | |
Net Asset Value, End of Period | | $ | 9.79 | | | $ | 10.74 | | |
Total Return++ | | | (2.17 | )% | | | 0.89 | %# | |
Ratios and Supplemental Data: | |
Net Assets, End of Period, in (Thousands) | | $ | 574 | | | $ | 10 | | |
Ratio of Expenses to Average Net Assets (1) | | | 0.72 | %+ | | | 0.72 | %+* | |
Ratio of Net Investment Income to Average Net Assets (1) | | | 6.75 | %+ | | | 6.66 | %+* | |
Ratio of Rebate from Morgan Stanley Affiliates to Average Net Assets | | | 0.00 | %§ | | | 0.00 | %§* | |
Portfolio Turnover Rate | | | 62 | % | | | 96 | %# | |
(1) Supplemental Information on the Ratios to Average Net Assets: | |
Ratios Before Expense Limitation | |
Expenses to Average Net Assets | | | 1.57 | % | | | 15.70 | %* | |
Net Investment Income (Loss) to Average Net Assets | | | 5.90 | % | | | (8.32 | )%* | |
^ Commencement of Operations.
† Per share amount is based on average shares outstanding.
++ Calculated based on the net asset value as of the last business day of the period.
+ The Ratios of Expenses and Net Investment Income reflect the rebate of certain Portfolio expenses in connection with the investments in Morgan Stanley affiliates during the period. The effect of the rebate on the ratios is disclosed in the above table as "Ratio of Rebate from Morgan Stanley Affiliates to Average Net Assets."
§ Amount is less than 0.005%.
# Not Annualized.
* Annualized.
The accompanying notes are an integral part of the financial statements.
22
Morgan Stanley Institutional Fund Trust
Annual Report — September 30, 2015
Notes to Financial Statements
Morgan Stanley Institutional Fund Trust (''MSIFT" or the "Fund'') is registered under the Investment Company Act of 1940, as amended (the "Act''), as an open-end management investment company. The Fund is comprised of nine separate, active portfolios (individually referred to as a "Portfolio", collectively as the "Portfolios"). The Fund applies investment company accounting and reporting guidance. All Portfolios are considered diversified for purposes of the Act.
The accompanying financial statements relate to the High Yield Portfolio. The Portfolio seeks total return. The Portfolio offers five classes of shares — Class I, Class A, Class L, Class C and Class IS.
On April 30, 2015, the Portfolio commenced offering Class C shares.
A. Significant Accounting Policies: The following significant accounting policies are in conformity with U.S. generally accepted accounting principles ("GAAP"). Such policies are consistently followed by the Fund in the preparation of its financial statements. GAAP may require management to make estimates and assumptions that affect the reported amounts and disclosures in the financial statements. Actual results may differ from those estimates.
1. Security Valuation: (1) Certain portfolio securities may be valued by an outside pricing service approved by the Fund's Board of Trustees (the "Trustees"). The pricing service may utilize a matrix system or other model incorporating attributes such as security quality, maturity and coupon as the evaluation model parameters, and/or research evaluations by its staff, including review of broker-dealer market price quotations in determining what it believes is the fair valuation of the portfolios securities valued by such pricing service; (2) an equity portfolio security listed or traded on an exchange is valued at its latest reported sales price (or at the exchange official closing price if such exchange reports an official closing price), if there were no sales on a given day, the security is valued at the mean between the last reported bid and asked prices; (3) all other equity portfolio securities for which over-the-counter ("OTC") market quotations are readily available are valued at its latest reported sales price. In cases where a security is traded on more than one exchange, the security is valued on the exchange designated as the primary market; (4) certain senior collateralized loans ("Senior Loans") are valued based on quotations received from an independent pricing service; (5) when market quotations are
not readily available, including circumstances under which Morgan Stanley Investment Management Inc. (the "Adviser") determines that the closing price, last sale price or the mean between the last reported bid and asked prices are not reflective of a security's market value, portfolio securities are valued at their fair value as determined in good faith under procedures established by and under the general supervision of the Trustees. Occasionally, developments affecting the closing prices of securities and other assets may occur between the times at which valuations of such securities are determined (that is, close of the foreign market on which the securities trade) and the close of business of the New York Stock Exchange ("NYSE"). If developments occur during such periods that are expected to materially affect the value of such securities, such valuations may be adjusted to reflect the estimated fair value of such securities as of the close of the NYSE, as determined in good faith by the Trustees or by the Adviser using a pricing service and/or procedures approved by the Trustees; (6) investments in mutual funds, including the Morgan Stanley Institutional Liquidity Funds, are valued at the net asset value ("NAV") as of the close of each business day; and (7) short-term debt securities with remaining maturities of 60 days or less at the time of purchase may be valued at amortized cost, unless the Adviser determines such valuation does not reflect the securities' market value, in which case these securities will be valued at their fair market value determined by the Adviser.
The Trustees have responsibility for determining in good faith the fair value of the investments, and the Trustees may appoint others, such as the Fund's Adviser or a valuation committee, to assist the Trustees in determining fair value and to make the actual calculations pursuant to the fair valuation methodologies previously approved by the Trustees. Under procedures approved by the Trustees, the Fund's Adviser has formed a Valuation Committee whose members are approved by the Trustees. The Valuation Committee provides administration and oversight of the Fund's valuation policies and procedures, which are reviewed at least annually by the Trustees. These procedures allow the Fund to utilize independent pricing services, quotations from securities and financial instrument dealers, and other market sources to determine fair value.
The Fund has procedures to determine the fair value of securities and other financial instruments for which
23
Morgan Stanley Institutional Fund Trust
Annual Report — September 30, 2015
Notes to Financial Statements (cont'd)
market prices are not readily available. Under these procedures, the Valuation Committee convenes on a regular and ad hoc basis to review such securities and considers a number of factors, including valuation methodologies and significant unobservable valuation inputs, when arriving at fair value. The Valuation Committee may employ a market-based approach which may use related or comparable assets or liabilities, recent transactions, market multiples, book values, and other relevant information for the investment to determine the fair value of the investment. An income-based valuation approach may also be used in which the anticipated future cash flows of the investment are discounted to calculate fair value. Discounts may also be applied due to the nature or duration of any restrictions on the disposition of the investments. Due to the inherent uncertainty of valuations of such investments, the fair values may differ significantly from the values that would have been used had an active market existed. The Valuation Committee employs various methods for calibrating these valuation approaches including a regular review of valuation methodologies, key inputs and assumptions, transactional back-testing or disposition analysis, and reviews of any related market activity.
2. Fair Value Measurement: Financial Accounting Standards Board ("FASB") Accounting Standards CodificationTM ("ASC") 820, "Fair Value Measurement" ("ASC 820"), defines fair value as the value that the Fund would receive to sell an investment or pay to transfer a liability in a timely transaction with an independent buyer in the principal market, or in the absence of a principal market the most advantageous market for the investment or liability. ASC 820 establishes a three-tier hierarchy to distinguish between (1) inputs that reflect the assumptions market participants would use in valuing an asset or liability developed based on market data obtained from sources independent of the reporting entity (observable inputs) and (2) inputs that reflect the reporting entity's own assumptions about the assumptions market participants would use in valuing an asset or liability developed based on the best information available in the circumstances (unobservable inputs) and to establish classification of fair value measurements for disclosure purposes. Various inputs are used in determining the value of the Fund's
investments. The inputs are summarized in the three broad levels listed below.
• Level 1 – unadjusted quoted prices in active markets for identical investments
• Level 2 – other significant observable inputs (including quoted prices for similar investments, interest rates, prepayment speeds, credit risk, etc.)
• Level 3 – significant unobservable inputs including the Fund's own assumptions in determining the fair value of investments. Factors considered in making this determination may include, but are not limited to, information obtained by contacting the issuer, analysts, or the appropriate stock exchange (for exchange-traded securities), analysis of the issuer's financial statements or other available documents and, if necessary, available information concerning other securities in similar circumstances
The inputs or methodology used for valuing securities are not necessarily an indication of the risk associated with investing in those securities and the determination of the significance of a particular input to the fair value measurement in its entirety requires judgment and considers factors specific to each security.
The following is a summary of the inputs used to value the Portfolio's investments as of September 30, 2015.
Investment Type | | Level 1
Unadjusted
quoted
prices
(000) | | Level 2
Other
significant
observable
inputs
(000) | | Level 3
Significant
unobservable
inputs
(000) | | Total
(000) | |
Assets: | |
Fixed Income Securities | |
Corporate Bonds | | $ | — | | | $ | 67,031 | | | $ | — | | | $ | 67,031 | | |
Sovereign | | | — | | | | 695 | | | | — | | | | 695 | | |
Variable Rate Senior
Loan Interests | | | — | | | | 2,634 | | | | — | | | | 2,634 | | |
Total Fixed Income
Securities | | | — | | | | 70,360 | | | | — | | | | 70,360 | | |
Common Stock | |
Auto Components | | | — | | | | — | | | | — | @ | | | — | @ | |
Short-Term Investment | |
Investment Company | | | 991 | | | | — | | | | — | | | | 991 | | |
Total Assets | | $ | 991 | | | $ | 70,360 | | | $ | — | @ | | $ | 71,351 | | |
@ Value is less than $500.
24
Morgan Stanley Institutional Fund Trust
Annual Report — September 30, 2015
Notes to Financial Statements (cont'd)
Transfers between investment levels may occur as the markets fluctuate and/or the availability of data used in an investment's valuation changes. The Portfolio recognizes transfers between the levels as of the end of the period. As of September 30, 2015, the Portfolio did not have any investments transfer between investment levels.
Following is a reconciliation of investments in which significant unobservable inputs (Level 3) were used in determining fair value.
| | | Common
Stock
(000) | |
Beginning Balance | | $ | — | | |
Purchases | | | — | † | |
Sales | | | — | | |
Amortization of discount | | | — | | |
Transfers in | | | — | | |
Transfers out | | | — | | |
Corporate actions | | | — | | |
Change in unrealized appreciation (depreciation) | | | — | @ | |
Realized gains (losses) | | | — | | |
Ending Balance | | $ | — | @ | |
Net change in unrealized appreciation (depreciation) from investments
still held as of September 30, 2015 | | $ | — | @ | |
† Includes one security which was purchased at zero cost.
@ Value is less than $500.
3. Senior Loans: Senior Loans are typically structured by a syndicate of lenders ("Lenders"), one or more of which administers the Senior Loan on behalf of the Lenders ("Agent"). Lenders may sell interests in Senior Loans to third parties ("Participations") or may assign all or a portion of their interest in a Senior Loan to third parties ("Assignments"). Senior Loans are exempt from registration under the Securities Act of 1933. Presently, Senior Loans are not readily marketable and are often subject to restrictions on resale.
4. Indemnifications: The Fund enters into contracts that contain a variety of indemnifications. The Fund's maximum exposure under these arrangements is unknown. However, the Fund has not had prior claims or losses pursuant to these contracts and expects the risk of loss to be remote.
5. Dividends and Distributions to Shareholders: Dividend income and distributions to shareholders are recorded on the ex-dividend date. Dividends from net investment income, if any, are declared and paid monthly.
Net realized capital gains, if any, are distributed at least annually.
6. Security Transactions, Income and Expenses: Security transactions are accounted for on the trade date (date the order to buy or sell is executed). Realized gains and losses on the sale of investment securities are determined on the specific identified cost method. When the Portfolio buys an interest in a Senior Loan, it may receive a commitment fee which is paid to lenders on an ongoing basis based upon the undrawn portion committed by the lenders of the underlying Senior Loan. The Portfolio accrues the commitment fee over the expected term of the loan. When the Portfolio sells interest in a Senior Loan, it may be required to pay fees or commissions to the purchaser of the interest. Fees received in connection with loan amendments are accrued as earned. Dividend income and other distributions are recorded on the ex-dividend date (except for certain foreign dividends which may be recorded as soon as the Portfolio is informed of such dividends) net of applicable withholding taxes. Interest income is recognized on the accrual basis except where collection is in doubt. Discounts are accreted and premiums are amortized over the life of the respective securities. Most expenses of the Fund can be directly attributed to a particular Portfolio. Expenses which cannot be directly attributed are apportioned among the Portfolios based upon relative net assets or other appropriate methods. Income, expenses (other than class specific expenses — distribution and shareholder services, transfer agency and sub transfer agency fees) and realized and unrealized gains or losses are allocated to each class of shares based upon their relative net assets.
B. Advisory Fees: The Adviser, a wholly-owned subsidiary of Morgan Stanley, provides the Portfolio with advisory services under the terms of an Investment Advisory Agreement, paid quarterly, at an annual rate of 0.60% of the average daily net assets of the Portfolio.
The Adviser has agreed to reduce its advisory fee and/or reimburse the Portfolio so that total annual portfolio operating expenses, excluding certain investment related expenses, taxes, interest and other extraordinary expenses (including litigation), will not exceed 0.75% for Class I shares, 1.10% for Class A shares, 1.35% for Class L shares, 1.85% for Class C shares and 0.72% for Class IS shares. The fee waivers and/or expense reimbursements will continue for at least one year from the date of the Portfolio's prospectus or until such time that the
25
Morgan Stanley Institutional Fund Trust
Annual Report — September 30, 2015
Notes to Financial Statements (cont'd)
Trustees act to discontinue all or a portion of such waivers and/or reimbursements when they deem such action is appropriate. For the year ended September 30, 2015, approximately $246,000 of advisory fees were waived and approximately $16,000 of other expenses were reimbursed by the Adviser pursuant to this arrangement.
C. Administration Fees: The Adviser also serves as Administrator to the Fund and provides administrative services pursuant to an Administration Agreement for an annual fee, accrued daily and paid monthly, of 0.08% of the Portfolio's average daily net assets. Under a Sub-Administration Agreement between the Administrator and State Street Bank and Trust Company ("State Street"), State Street provides certain administrative services to the Fund. For such services, the Administrator pays State Street a portion of the fee the Administrator receives from the Portfolio.
D. Distribution and Shareholder Services Fees: Morgan Stanley Distribution, Inc. ("MSDI" or the "Distributor"), a wholly-owned subsidiary of the Adviser, and an indirect subsidiary of Morgan Stanley, serves as the Fund's Distributor of Portfolio shares pursuant to a Distribution Agreement. The Fund has adopted a Shareholder Services Plan with respect to Class A shares pursuant to Rule 12b-1 under the Act. Under the Shareholder Services Plan, the Portfolio pays the Distributor a shareholder services fee, accrued daily and paid monthly, at an annual rate of 0.25% of the Portfolio's average daily net assets attributable to Class A shares.
The Fund has adopted a Distribution and Shareholder Services Plan with respect to Class L shares pursuant to Rule 12b-1 under the Act. Under the Distribution and Shareholder Services Plan, the Portfolio pays the Distributor a distribution fee, accrued daily and paid monthly, at an annual rate of 0.25% and a shareholder services fee, accrued daily and paid monthly, at an annual rate of 0.25% of the Portfolio's average daily net assets attributable to Class L shares.
The Fund has adopted a Distribution and Shareholder Services Plan with respect to Class C shares pursuant to Rule 12b-1 under the Act. Under the Distribution and Shareholder Services Plan, the Portfolio pays the Distributor a distribution fee, accrued daily and paid monthly, at an annual rate of 0.75% and a shareholder services fee, accrued daily and paid monthly, at an annual rate of 0.25% of the Portfolio's average daily net assets attributable to Class C shares.
The distribution and shareholder services fees are used to support the expenses associated with servicing and maintaining
accounts. The Distributor may compensate other parties for providing shareholder support services to investors who purchase Class A, Class L and Class C shares.
E. Dividend Disbursing and Transfer Agent: The Fund's dividend disbursing and transfer agent is Boston Financial Data Services, Inc. ("BFDS"). Pursuant to a Transfer Agency Agreement, the Fund pays BFDS a fee based on the number of classes, accounts and transactions relating to the Portfolios of the Fund.
F. Custodian Fees: State Street (the "Custodian") serves as Custodian for the Fund in accordance with a Custodian Agreement. The Custodian holds cash, securities, and other assets of the Fund as required by the Act. Custody fees are payable monthly based on assets held in custody, investment purchases and sales activity and account maintenance fees, plus reimbursement for certain out-of-pocket expenses.
G. Security Transactions and Transactions with Affiliates: For the year ended September 30, 2015, purchases and sales of investment securities for the Portfolio, other than long-term U.S. Government securities and short-term investments, were approximately $58,570,000 and $36,979,000, respectively. There were no purchases and sales of long-term U.S. Government securities for the year ended September 30, 2015.
The Portfolio invests in the Institutional Class of the Morgan Stanley Institutional Liquidity Funds — Money Market Portfolio (the "Liquidity Funds"), an open-end management investment company managed by the Adviser. Advisory fees paid by the Portfolio are reduced by an amount equal to its pro-rata share of the advisory and administration fees paid by the Portfolio due to its investment in the Liquidity Funds. For the year ended September 30, 2015, advisory fees paid were reduced by approximately $1,000 relating to the Portfolio's investment in the Liquidity Funds.
A summary of the Portfolio's transactions in shares of the Liquidity Funds during the year ended September 30, 2015 is as follows:
Value
September 30,
2014
(000) | | Purchases
at Cost
(000) | | Sales
(000) | | Dividend
Income
(000) | | Value
September 30,
2015
(000) | |
| $ | — | | | $ | 36,236 | | | $ | 35,245 | | | $ | 1 | | | $ | 991 | | |
The Portfolio has an unfunded Deferred Compensation Plan (the "Compensation Plan"), which allows each independent Trustee to defer payment of all, or a portion, of the fees he or she receives for serving on the Board of Trustees. Each eligible
26
Morgan Stanley Institutional Fund Trust
Annual Report — September 30, 2015
Notes to Financial Statements (cont'd)
Trustee generally may elect to have the deferred amounts credited with a return equal to the total return on one or more of the Morgan Stanley funds that are offered as investment options under the Compensation Plan. Appreciation/depreciation and distributions received from these investments are recorded with an offsetting increase/decrease in the deferred compensation obligation and do not affect the NAV of the Portfolio.
H. Federal Income Taxes: It is the Portfolio's intention to continue to qualify as a regulated investment company and distribute all of its taxable and tax-exempt income. Accordingly, no provision for Federal income taxes is required in the financial statements.
The Portfolio may be subject to taxes imposed by countries in which it invests. Such taxes are generally based on income and/or capital gains earned or repatriated. Taxes are accrued based on net investment income, net realized gains and net unrealized appreciation as such income and/or gains are earned. Taxes may also be based on transactions in foreign currency and are accrued based on the value of investments denominated in such currency.
FASB ASC 740-10, "Income Taxes — Overall", sets forth a minimum threshold for financial statement recognition of the benefit of a tax position taken or expected to be taken in a tax return. Management has concluded there are no significant uncertain tax positions that would require recognition in the financial statements. If applicable, the Portfolio recognizes interest accrued related to unrecognized tax benefits in "Interest Expense" and penalties in "Other Expenses" in the Statement of Operations. The Portfolio files tax returns with the U.S. Internal Revenue Service, New York and various states. Each of the tax years in the four-year period ended September 30, 2015, remains subject to examination by taxing authorities.
The tax character of distributions paid may differ from the character of distributions shown in the Statements of Changes in Net Assets due to short-term capital gains being treated as ordinary income for tax purposes. The tax character of distributions paid during fiscal years 2015 and 2014 was as follows:
2015
Distributions
Paid From: | | 2014
Distributions
Paid From: | |
Ordinary
Income
(000) | | Long-Term
Capital Gain
(000) | | Ordinary
Income
(000) | | Long-Term
Capital Gain
(000) | |
| $ | 3,836 | | | $ | 94 | | | $ | 1,880 | | | $ | 81 | | |
The amount and character of income and gains to be distributed are determined in accordance with income tax regulations
which may differ from GAAP. These book/tax differences are either considered temporary or permanent in nature.
Temporary differences are attributable to differing book and tax treatments for the timing of the recognition of gains (losses) on certain investment transactions and the timing of the deductibility of certain expenses.
Permanent differences, primarily due to a nondeductible expense and tax adjustments on bonds sold, resulted in the following reclassifications among the components of net assets at September 30, 2015:
Accumulated
Undistributed
Net Investment
Income
(000) | | Accumulated
Net Realized
Loss
(000) | | Paid-in-
Capital
(000) | |
| $ | 11 | | | $ | (1 | ) | | $ | (10 | ) | |
At September 30, 2015, the components of distributable earnings for the Portfolio on a tax basis were as follows:
Undistributed
Ordinary
Income
(000) | | Undistributed
Long-Term
Capital Gain
(000) | |
| $ | 668 | | | $ | — | | |
Capital losses and specified ordinary losses, including currency losses, incurred after October 31 but within the taxable year are deemed to arise on the first day of the Portfolio's next taxable year. For the year ended September 30, 2015, the Portfolio deferred to October 1, 2015 for U.S. Federal income tax purposes the following losses:
Post-October
Currency And
Specified Ordinary
Losses
(000) | | Post-October
Capital Losses
(000) | |
| $ | — | | | $ | 1,419 | | |
I. Other: At September 30, 2015, the Portfolio had otherwise unaffiliated record owners of 10% or greater. Investment activities of these shareholders could have a material impact on the Portfolio. The aggregate percentage of such owners was 84.4%.
27
Morgan Stanley Institutional Fund Trust
Annual Report — September 30, 2015
Report of Independent Registered Public Accounting Firm
To the Shareholders and Board of Trustees of
Morgan Stanley Institutional Fund Trust —
High Yield Portfolio
We have audited the accompanying statement of assets and liabilities, including the portfolio of investments, of High Yield Portfolio (one of the portfolios constituting Morgan Stanley Institutional Fund Trust) (the "Portfolio") as of September 30, 2015, and the related statements of operations for the year then ended, the statements changes in net assets for each of the two years in the period then ended and the financial highlights for each of the years or periods indicated therein. These financial statements and financial highlights are the responsibility of the Portfolio's management. Our responsibility is to express an opinion on these financial statements and financial highlights based on our audit.
We conducted our audit in accordance with the standards of the Public Company Accounting Oversight Board (United States). Those standards require that we plan and perform the audit to obtain reasonable assurance about whether the financial statements and financial highlights are free of material misstatement. We were not engaged to perform an audit of the Portfolio's internal control over financial reporting. Our audit included consideration of internal control over financial reporting as a basis for designing audit procedures that are appropriate in the circumstances, but not for the purpose of expressing an opinion on the effectiveness of the Portfolio's internal control over financial reporting. Accordingly, we express no such opinion. An audit also includes examining, on a test basis, evidence supporting the amounts and disclosures in the financial statements and financial highlights, assessing the accounting principles used and significant estimates made by management, and evaluating the overall financial statement presentation. Our procedures included confirmation of securities owned as of September 30, 2015, by correspondence with the custodian and others or by other appropriate auditing procedures where replies from others were not received. We believe that our audit provides a reasonable basis for our opinion.
In our opinion, the financial statements and financial highlights referred to above present fairly, in all material respects, the financial position of High Yield Portfolio (one of the portfolios constituting Morgan Stanley Institutional Fund Trust) at September 30, 2015, the results of its operations for the year then ended, the changes in its net assets for each of the two years in the period then ended and the financial highlights for each of the years or periods indicated therein, in conformity with U.S. generally accepted accounting principles.

Boston, Massachusetts
November 25, 2015
28
Morgan Stanley Institutional Fund Trust
Annual Report — September 30, 2015
Investment Advisory Agreement Approval (unaudited)
Nature, Extent and Quality of Services
The Board reviewed and considered the nature and extent of the investment advisory services provided by the Adviser (as defined herein) under the advisory agreement, including portfolio management, investment research and equity and fixed income securities trading. The Board also reviewed and considered the nature and extent of the non-advisory, administrative services provided by the Adviser under the administration agreement, including accounting, operations, clerical, bookkeeping, compliance, business management and planning, legal services and the provision of supplies, office space and utilities at the Adviser's expense. The Board also considered the Adviser's investment in personnel and infrastructure that benefits the Portfolio. (The advisory and administration agreements together are referred to as the "Management Agreement.") The Board also considered that the Adviser serves a variety of other investment advisory clients and has experience overseeing service providers. The Board also compared the nature of the services provided by the Adviser with similar services provided by non-affiliated advisers as reported to the Board by Lipper, Inc. ("Lipper").
The Board reviewed and considered the qualifications of the portfolio managers, the senior administrative managers and other key personnel of the Adviser who provide the administrative and advisory services to the Portfolio. The Board determined that the Adviser's portfolio managers and key personnel are well qualified by education and/or training and experience to perform the services in an efficient and professional manner. The Board concluded that the nature and extent of the advisory and administrative services provided were necessary and appropriate for the conduct of the business and investment activities of the Portfolio and supported its decision to approve the Management Agreement.
Performance, Fees and Expenses of the Portfolio
The Board reviewed the performance, fees and expenses of the Portfolio compared to its peers, as determined by Lipper, and to appropriate benchmarks where applicable. The Board discussed with the Adviser the performance goals and the actual results achieved in managing the Portfolio. When considering a fund's performance, the Board and the Adviser place emphasis on trends and longer-term returns (focusing on one-year, three-year and five-year performance as of December 31, 2014, or since inception, as applicable). When a fund underperforms its benchmark and/or its peer group average, the Board and the Adviser discuss the causes of such underperformance and, where necessary, they discuss specific changes to investment strategy or investment personnel. The Board noted that the Portfolio's performance was better than its peer group average for the one-year period and the period since inception on February 7, 2012. The Board discussed with the Adviser the level of the advisory and administration fees (together, the "management fee") for this Portfolio relative to comparable funds and/or other accounts advised by the Adviser and/or compared to its peers as determined by Lipper. In addition to the management fee, the Board also reviewed the Portfolio's total expense ratio. The Board noted that the Portfolio's management fee and total expense ratio were lower than its peer group averages. After discussion, the Board concluded that the Portfolio's (i) performance was competitive with its peer group average; (ii) management fee and total expense ratio were competitive with its peer group averages.
Economies of Scale
The Board considered the size and growth prospects of the Portfolio and how that relates to the Portfolio's total expense ratio and particularly the Portfolio's management fee rate, which does not include breakpoints. In conjunction with its review of the Adviser's profitability, the Board discussed with the Adviser how a change in assets can affect the efficiency or effectiveness of managing the Portfolio and whether the management fee level is appropriate relative to current and projected asset levels and/or whether the management fee structure reflects economies of scale as asset levels change. The Board has determined that its review of the actual and/or potential economies of scale of the Portfolio supports its decision to approve the Management Agreement.
Profitability of the Adviser and Affiliates
The Board considered information concerning the costs incurred and profits realized by the Adviser and its affiliates during the last year from their relationship with the Portfolio and during the last two years from their relationship with the Morgan Stanley Fund Complex and reviewed with the Adviser the cost allocation methodology used to determine the profitability of the Adviser and affiliates. The Board has determined that its review of the analysis of the Adviser's expenses and profitability supports its decision to approve the Management Agreement.
29
Morgan Stanley Institutional Fund Trust
Annual Report — September 30, 2015
Investment Advisory Agreement Approval (unaudited) (cont'd)
Other Benefits of the Relationship
The Board considered other direct and indirect benefits to the Adviser and/or its affiliates derived from their relationship with the Portfolio and other funds advised by the Adviser. These benefits may include, among other things, fees for trading, distribution and/or shareholder servicing and for transaction processing and reporting platforms used by securities lending agents, and research received by the Adviser generated from commission dollars spent on funds' portfolio trading. The Board reviewed with the Adviser these arrangements and the reasonableness of the Adviser's costs relative to the services performed. The Board has determined that its review of the other benefits received by the Adviser or its affiliates supports its decision to approve the Management Agreement.
Resources of the Adviser and Historical Relationship Between the Portfolio and the Adviser
The Board considered whether the Adviser is financially sound and has the resources necessary to perform its obligations under the Management Agreement. The Board also reviewed and considered the historical relationship between the Portfolio and the Adviser, including the organizational structure of the Adviser, the policies and procedures formulated and adopted by the Adviser for managing the Portfolio's operations and the Board's confidence in the competence and integrity of the senior managers and key personnel of the Adviser. The Board concluded that the Adviser has the financial resources necessary to fulfill its obligations under the Management Agreement and that it is beneficial for the Portfolio to continue its relationship with the Adviser.
Other Factors and Current Trends
The Board considered the controls and procedures adopted and implemented by the Adviser and monitored by the Fund's Chief Compliance Officer and concluded that the conduct of business by the Adviser indicates a good faith effort on its part to adhere to high ethical standards in the conduct of the Portfolio's business.
General Conclusion
After considering and weighing all of the above factors, with various written materials and verbal information presented by the Adviser, the Board concluded that it would be in the best interest of the Portfolio and its shareholders to approve renewal of the Management Agreement for another year. In reaching this conclusion the Board did not give particular weight to any single piece of information or factor referenced above. The Board considered these factors and information over the course of the year and in numerous meetings, some of which were in executive session with only the independent Board members and their counsel present. It is possible that individual Board members may have weighed these factors, and the information presented, differently in reaching their individual decisions to approve the Management Agreement.
30
Morgan Stanley Institutional Fund Trust
Annual Report — September 30, 2015
Federal Tax Notice (unaudited)
For Federal income tax purposes, the following information is furnished with respect to the distributions paid by the Portfolio during its taxable year ended September 30, 2015.
The Portfolio designated and paid approximately $94,000 as a long-term capital gain distribution.
In January, the Portfolio provides tax information to shareholders for the preceding calendar year.
31
Morgan Stanley Institutional Fund Trust
Annual Report — September 30, 2015
U.S. Privacy Policy (unaudited)
AN IMPORTANT NOTICE CONCERNING OUR U.S. PRIVACY POLICY
This privacy notice describes the U.S. privacy policy of Morgan Stanley Distribution, Inc., and the Morgan Stanley family of mutual funds ("us", "our", "we").
We are required by federal law to provide you with notice of our U.S. privacy policy ("Policy"). This Policy applies to both our current and former clients unless we state otherwise and is intended for individual clients who purchase products or receive services from us for personal, family or household purposes. This Policy is not applicable to partnerships, corporations, trusts or other non-individual clients or account holders, nor is this Policy applicable to individuals who are either beneficiaries of a trust for which we serve as trustee or participants in an employee benefit plan administered or advised by us. This Policy is, however, applicable to individuals who select us to be a custodian of securities or assets in individual retirement accounts, 401(k) accounts, or accounts subject to the Uniform Gifts to Minors Act.
This notice sets out our business practices to protect your privacy; how we collect and share personal information about you; and how you can limit our sharing or certain uses by others of this information. We may amend this Policy at any time, and will inform you of any changes to our Policy as required by law.
WE RESPECT YOUR PRIVACY
We appreciate that you have provided us with your personal financial information and understand your concerns about your information. We strive to safeguard the information our clients entrust to us. Protecting the confidentiality and security of client information is an important part of how we conduct our business.
This notice describes what personal information we collect about you, how we collect it, when we may share it with others, and how certain others may use it. It discusses the steps you may take to limit our sharing of certain information about you with our affiliated companies, including, but not limited to our affiliated banking businesses, brokerage firms and credit service affiliates. It also discloses how you may limit our affiliates' use of shared information for marketing purposes.
Throughout this Policy, we refer to the nonpublic information that personally identifies you as "personal information." We also use the term "affiliated company" in this notice. An affiliated company is a company in our family of companies and includes companies with the Morgan Stanley name. These affiliated companies are financial institutions such as broker-dealers, banks, investment advisers and credit card issuers. We refer to any company that is not an affiliated company as a nonaffiliated third party. For purposes of Section 5 of this notice, and your ability to limit certain uses of personal information by our affiliates, this notice applies to the use of personal information by our affiliated companies.
1. WHAT PERSONAL INFORMATION DO WE COLLECT FROM YOU?
We may collect the following types of information about you: (i) information provided by you, including information from applications and other forms we receive from you, (ii) information about your transactions with us or our affiliates, (iii) information about your transactions with nonaffiliated third parties, (iv) information from consumer reporting agencies, (v) information obtained from our websites, and (vi) information obtained from other sources. For example:
• We collect information such as your name, address, e-mail address, telephone/fax numbers, assets, income and investment objectives through applications and other forms you submit to us.
• We may obtain information about account balances, your use of account(s) and the types of products and services you prefer to receive from us through your dealings and transactions with us and other sources.
• We may obtain information about your creditworthiness and credit history from consumer reporting agencies.
• We may collect background information from and through third-party vendors to verify representations you have made and to comply with various regulatory requirements.
2. WHEN DO WE DISCLOSE PERSONAL INFORMATION WE COLLECT ABOUT YOU?
We may disclose personal information we collect about you in each of the categories listed above to affiliated and nonaffiliated third parties.
32
Morgan Stanley Institutional Fund Trust
Annual Report — September 30, 2015
U.S. Privacy Policy (unaudited) (cont'd)
a. Information We Disclose to Affiliated Companies.
We may disclose personal information that we collect about you to our affiliated companies to manage your account(s) effectively, to service and process your transactions, and to let you know about products and services offered by us and affiliated companies, to manage our business, and as otherwise required or permitted by law. Offers for products and services from affiliated companies are developed under conditions designed to safeguard your personal information.
b. Information We Disclose to Third Parties.
We may disclose personal information that we collect about you to nonaffiliated third parties to provide marketing services on our behalf or to other financial institutions with whom we have joint marketing agreements. We may also disclose all of the information we collect to other nonaffiliated third parties for our everyday business purposes, such as to process transactions, maintain account(s), respond to court orders and legal investigations, report to credit bureaus, offer our own products and services, protect against fraud, for institutional risk control, to perform services on our behalf, and as otherwise required or permitted by law.
When we share personal information about you with a nonaffiliated third party, they are required to limit their use of personal information about you to the particular purpose for which it was shared and they are not allowed to share personal information about you with others except to fulfill that limited purpose or as may be permitted or required by law.
3. HOW DO WE PROTECT THE SECURITY AND CONFIDENTIALITY OF PERSONAL INFORMATION WE COLLECT ABOUT YOU?
We maintain physical, electronic and procedural security measures that comply with applicable law and regulations to help safeguard the personal information we collect about you. We have internal policies governing the proper handling of client information by employees. Third parties that provide support or marketing services on our behalf may also receive personal information about you, and we require them to adhere to appropriate security standards with respect to such information.
4. HOW CAN YOU LIMIT OUR SHARING CERTAIN PERSONAL INFORMATION ABOUT YOU WITH OUR AFFILIATED COMPANIES FOR ELIGIBILITY DETERMINATION?
By following the opt-out procedures in Section 6 below, you may limit the extent to which we share with our affiliated companies, personal information that was collected to determine your eligibility for products and services such as your credit reports and other information that you have provided to us or that we may obtain from third parties ("eligibility information"). Eligibility information does not include your identification information or personal information pertaining to our transactions or experiences with you. Please note that, even if you direct us not to share eligibility information with our affiliated companies, we may still share your personal information, including eligibility information, with our affiliated companies under circumstances that are permitted under applicable law, such as to process transactions or to service your account.
5. HOW CAN YOU LIMIT THE USE OF CERTAIN PERSONAL INFORMATION ABOUT YOU BY OUR AFFILIATED COMPANIES FOR MARKETING?
By following the opt-out instructions in Section 6 below, you may limit our affiliated companies from marketing their products or services to you based on personal information we disclose to them. This information may include, for example, your income and account history with us. Please note that, even if you choose to limit our affiliated companies from using personal information about you that we may share with them for marketing their products and services to you, our affiliated companies may use your personal information that they obtain from us to market to you in circumstances permitted by law, such as if the affiliated party has its own relationship with you.
33
Morgan Stanley Institutional Fund Trust
Annual Report — September 30, 2015
U.S. Privacy Policy (unaudited) (cont'd)
6. HOW CAN YOU SEND US AN OPT-OUT INSTRUCTION?
If you wish to limit our sharing of eligibility information about you with our affiliated companies, or our affiliated companies' use of personal information for marketing purposes, as described in this notice, you may do so by:
• Calling us at (800) 548-7786
Monday–Friday between 8a.m. and 6p.m. (EST)
• Writing to us at the following address:
Boston Financial Data Services, Inc.
c/o Privacy Coordinator
P.O. Box 219804
Kansas City, Missouri 64121
If you choose to write to us, your request should include: your name, address, telephone number and account number(s) to which the opt-out applies and whether you are opting out with respect to sharing of eligibility information (Section 4 above), or information used for marketing (Section 5 above), or both. Written opt-out requests should not be sent with any other correspondence. In order to process your request, we require that the request be provided by you directly and not through a third party. Once you have informed us about your privacy preferences, your opt-out preference will remain in effect with respect to this Policy (as it may be amended) until you notify us otherwise. If you are a joint account owner, we will accept instructions from any one of you and apply those instructions to the entire account.
Please understand that if you limit our sharing or our affiliated companies' use of personal information, you and any joint account holder(s) may not receive information about our affiliated companies' products and services, including products or services that could help you manage your financial resources and achieve your investment objectives.
If you have more than one account or relationship with us, please specify the accounts to which you would like us to apply your privacy choices. If you have accounts or relationships with our affiliates, you may receive multiple privacy policies from them, and will need to separately notify those companies of your privacy choices for those accounts or relationships.
7. WHAT IF AN AFFILIATED COMPANY BECOMES A NONAFFILIATED THIRD PARTY?
If, at any time in the future, an affiliated company becomes a nonaffiliated third party, further disclosures of personal information made to the former affiliated company will be limited to those described in Section 2(b) above relating to nonaffiliated third parties. If you elected under Section 6 to limit disclosures we make to affiliated companies, or use of personal information by affiliated companies, your election will not apply to use by any former affiliated company of your personal information in their possession once it becomes a nonaffiliated third party.
SPECIAL NOTICE TO RESIDENTS OF VERMONT
The following section supplements our Policy with respect to our individual clients who have a Vermont address and supersedes anything to the contrary in the above Policy with respect to those clients only.
The State of Vermont requires financial institutions to obtain your consent prior to sharing personal information that they collect about you with nonaffiliated third parties, or eligibility information with affiliated companies, other than in certain limited circumstances. Except as permitted by law, we will not share personal information we collect about you with nonaffiliated third parties or eligibility information with affiliated companies, unless you provide us with your written consent to share such information.
SPECIAL NOTICE TO RESIDENTS OF CALIFORNIA
The following section supplements our Policy with respect to our individual clients who have a California address and supersedes anything to the contrary in the above Policy with respect to those clients only.
In response to a California law, if your account has a California home address, your personal information will not be disclosed to nonaffiliated third parties except as permitted by applicable California law, and we will limit sharing such personal information with our affiliates to comply with California privacy laws that apply to us.
34
Morgan Stanley Institutional Fund Trust
Annual Report — September 30, 2015
Trustee and Officer Information (unaudited)
Independent Trustees:
Name, Age and Address of
Independent Trustee | | Positions(s)
Held with
Registrant | | Length of Time
Served* | | Principal Occupation(s) During Past 5 Years
and Other Relevant Professional Experience | | Number of
Portfolios in
Fund Complex
Overseen by
Trustee** | | Other Directorships
Held by Independent
Trustee*** | |
Frank L. Bowman (70)
c/o Kramer Levin Naftalis & Frankel LLP
Counsel to the Independent Trustees
1177 Avenue of the Americas
New York, NY 10036 | | Trustee | | Since
August
2006 | | President, Strategic Decisions, LLC (consulting) (since February 2009); Director or Trustee of various Morgan Stanley Funds (since August 2006); Chairperson of the Compliance and Insurance Committee (since October 2015); Chairperson of the Insurance Sub-Committee of the Compliance and Insurance Committee (since February 2007); served as President and Chief Executive Officer of the Nuclear Energy Institute (policy organization) (February 2005-November 2008); retired as Admiral, U.S. Navy after serving over 38 years on active duty including 8 years as Director of the Naval Nuclear Propulsion Program in the Department of the Navy and the U.S. Department of Energy (1996-2004); served as Chief of Naval Personnel (July 1994-September 1996); and on the Joint Staff as Director of Political Military Affairs (June 1992-July1994); knighted as Honorary Knight Commander of the Most Excellent Order of the British Empire; awarded the Officier de l'Orde National du Mérite by the French Government; elected to the National Academy of Engineering (2009). | | | 96 | | | Director of BP p.l.c.; Director of Naval and Nuclear Technologies LLP; Director Emeritus of the Armed Services YMCA of the USA; Director of the U.S. Naval Submarine League; Member of the National Security Advisory Council of the Center for U.S. Global Engagement and a member of the CNA Military Advisory Board; Chairman of the Charity J Street Cup Golf ; Trustee of Fairhaven United Methodist Church. | |
Kathleen A. Dennis (62)
c/o Kramer Levin Naftalis & Frankel LLP
Counsel to the Independent Trustees
1177 Avenue of the Americas
New York, NY 10036 | | Trustee | | Since
August
2006 | | President, Cedarwood Associates (mutual fund and investment management consulting) (since July 2006); Chairperson of the Money Market and Alternatives Sub-Committee of the Investment Committee (since October 2006) and Director or Trustee of various Morgan Stanley Funds (since August 2006); formerly, Senior Managing Director of Victory Capital Management (1993-2006). | | | 96 | | | Director of various nonprofit organizations. | |
Nancy C. Everett (60)
c/o Kramer Levin Naftalis & Frankel LLP
Counsel to the Independent Trustees
1177 Avenue of the Americas
New York, NY 10036 | | Trustee | | Since
January
2015 | | Owner, OBIR, LLC (institutional investment management consulting) (since June 2014); formerly, Managing Director, BlackRock, Inc. (February 2011-December 2013); and Chief Executive Officer, General Motors Asset Management (a/k/a Promark Global Advisors, Inc.) (June 2005-May 2010). | | | 96 | | | Member of Virginia Commonwealth University Board of Visitors; Member of Virginia Commonwealth University School of Business Foundation; formerly, Member of Committee on Directors for Emerging Markets Growth Fund, Inc. (2007-2010); Chairperson of Performance Equity Management, LLC (2006-2010); and Chairperson, GMAM Absolute Return Strategies Fund, LLC (2006-2010). | |
35
Morgan Stanley Institutional Fund Trust
Annual Report — September 30, 2015
Trustee and Officer Information (unaudited) (cont'd)
Independent Trustees: (cont'd)
Name, Age and Address of
Independent Trustee | | Positions(s)
Held with
Registrant | | Length of Time
Served* | | Principal Occupation(s) During Past 5 Years
and Other Relevant Professional Experience | | Number of
Portfolios in
Fund Complex
Overseen by
Trustee** | | Other Directorships
Held by Independent
Trustee*** | |
Jakki L. Haussler (58)
c/o Kramer Levin Naftalis & Frankel LLP
Counsel to the Independent Trustees
1177 Avenue of the Americas
New York, NY 10036 | | Trustee | | Since
January
2015 | | Chairman and Chief Executive Officer, Opus Capital Group (since January 1996); and formerly, Director, Capvest Venture Fund, LP (May 2000-December 2011); Partner, Adena Ventures, LP (July 1999-December 2010); Director, The Victory Funds (February 2005-July 2008). | | | 96 | | | Director of Cincinnati Bell Inc. and Member, Audit Committee and Compensation Committee; Director of Northern Kentucky University Foundation and Member, Investment Committee; Member of Chase College of Law Transactional Law Practice Center Board of Advisors; Director of Best Transport; Member, University of Cincinnati Foundation Investment Committee; formerly, Member, Miami University Board of Visitors (2008-2011); Trustee of Victory Funds (2005-2008) and Chairman, Investment Committee (2007-2008) and Member, Service Provider Committee (2005-2008). | |
Dr. Manuel H. Johnson (66)
c/o Johnson Smick
International, Inc.
220 I Street, N.E. – Suite 200
Washington, D.C. 20002 | | Trustee | | Since
July
1991 | | Senior Partner, Johnson Smick International, Inc. (consulting firm); Chairperson of the Investment Committee (since October 2006) and Director or Trustee of various Morgan Stanley Funds (since July 1991); Co-Chairman and a founder of the Group of Seven Council (G7C) (international economic commission); formerly Chairperson of the Audit Committee (July 1991-September 2006), Vice Chairman of the Board of Governors of the Federal Reserve System and Assistant Secretary of the U.S. Treasury. | | | 98 | | | Director of NVR, Inc. (home construction). | |
Joseph J. Kearns (73)
c/o Kearns & Associates LLC
23823 Malibu Road
S-50-440
Malibu, CA 90265 | | Trustee | | Since
August
1994 | | President, Kearns & Associates LLC (investment consulting); Chairperson of the Audit Committee (since October 2006) and Director or Trustee of various Morgan Stanley Funds (since August 1994); formerly, Deputy Chairperson of the Audit Committee (July 2003-September 2006) and Chairperson of the Audit Committee of various Morgan Stanley Funds (since August 1994); CFO of the J. Paul Getty Trust. | | | 99 | | | Director of Electro Rent Corporation (equipment leasing). Prior to December 31, 2013, Director of The Ford Family Foundation. | |
36
Morgan Stanley Institutional Fund Trust
Annual Report — September 30, 2015
Trustee and Officer Information (unaudited) (cont'd)
Independent Trustees: (cont'd)
Name, Age and Address of
Independent Trustee | | Positions(s)
Held with
Registrant | | Length of Time
Served* | | Principal Occupation(s) During Past 5 Years
and Other Relevant Professional Experience | | Number of
Portfolios in
Fund Complex
Overseen by
Trustee** | | Other Directorships
Held by Independent
Trustee*** | |
Michael F. Klein (56)
c/o Kramer Levin Naftalis & Frankel LLP
Counsel to the Independent Trustees
1177 Avenue of the Americas
New York, NY 10036 | | Trustee | | Since
August
2006 | | Managing Director, Aetos Capital, LLC (since March 2000); Co-President, Aetos Alternatives Management, LLC (since January 2004); and Co-Chief Executive Officer of Aetos Capital LLC (since August 2013); Chairperson of the Fixed Income Sub-Committee of the Investment Committee (since October 2006) and Director or Trustee of various Morgan Stanley Funds (since August 2006); formerly, Managing Director, Morgan Stanley & Co. Inc. and Morgan Stanley Dean Witter Investment Management, President, various Morgan Stanley Funds (June1998-March 2000) and Principal, Morgan Stanley & Co. Inc. and Morgan Stanley Dean Witter Investment Management (August 1997-December 1999). | | | 96 | | | Director of certain investment funds managed or sponsored by Aetos Capital, LLC. Director of Sanitized AG and Sanitized Marketing AG (specialty chemicals). | |
Michael E. Nugent (79)
522 Fifth Avenue
New York, NY 10036 | | Chair of the
Board and
Trustee | | Chair of the
Boards since
July 2006 and
Trustee since
July 1991 | | Chair of the Boards of various Morgan Stanley Funds (since July 2006); Chairperson of the Closed-End Fund Committee (since June 2012) and Director or Trustee of various Morgan Stanley Funds (since July 1991); formerly, Chairperson of the Insurance Committee (until July 2006), General Partner, Triumph Capital, L.P. (private investment partnership) (1988-2013). | | | 98 | | | None. | |
W. Allen Reed (68)
c/o Kramer Levin Naftalis & Frankel LLP
Counsel to the Independent Trustees
1177 Avenue of the Americas
New York, NY 10036 | | Trustee | | Since
August
2006 | | Chairperson of the Equity Sub-Committee of the Investment Committee (since October 2006) and Director or Trustee of various Morgan Stanley Funds (since August 2006); formerly, President and CEO of General Motors Asset Management; Chairman and Chief Executive Officer of the GM Trust Bank and Corporate Vice President of General Motors Corporation (August 1994-December 2005). | | | 96 | | | Director of Temple-Inland Industries (packaging and forest products); Director of Legg Mason, Inc. and Director of the Auburn University Foundation. | |
Fergus Reid (83)
c/o Joe Pietryka, Inc.
85 Charles Colman Blvd.
Pawling, NY 12564 | | Trustee | | Since
June
1992 | | Chairman, Joe Pietryka, Inc.; Chairperson of the Governance Committee and Director or Trustee of various Morgan Stanley Funds (since June 1992). | | | 99 | | | Formerly, Trustee and Director of certain investment companies in the JP Morgan Fund Complex managed by JP Morgan Investment Management Inc. (1987-December 2012). | |
37
Morgan Stanley Institutional Fund Trust
Annual Report — September 30, 2015
Trustee and Officer Information (unaudited) (cont'd)
Interested Trustee:
Name, Age and Address of
Interested Trustee | | Positions(s) Held
with Registrant | | Length of Time
Served* | | Principal Occupation(s) During Past 5 Years | | Number of
Portfolios in
Fund Complex
Overseen by
Interested
Trustee** | | Other Directorships
Held by Interested
Trustee*** | |
James F. Higgins (67)
One New York Plaza,
New York, NY 10004 | | Trustee | | Since
June
2000 | | Director or Trustee of various Morgan Stanley Funds (since June 2000); Senior Advisor of Morgan Stanley (since August 2000). | | | 97 | | | Formerly, Director of AXA Financial, Inc. and AXA Equitable Life Insurance Company (2002-2011) and Director of AXA MONY Life Insurance Company and AXA MONY Life Insurance Company of America (2004-2011). | |
* This is the earliest date the Trustee began serving the Morgan Stanley Funds. Each Trustee serves an indefinite term, until his or her successor is elected.
** The Fund Complex includes (as of December 31, 2014) all open-end and closed-end funds (including all of their portfolios) advised by Morgan Stanley Investment Management Inc. (the "Adviser") and any funds that have an adviser that is an affiliated person of the Adviser (including, but not limited to, Morgan Stanley AIP GP LP).
*** This includes any directorships at public companies and registered investment companies held by the Trustee at any time during the past five years.
38
Morgan Stanley Institutional Fund Trust
Annual Report — September 30, 2015
Trustee and Officer Information (unaudited) (cont'd)
Executive Officers:
Name, Age and Address of Executive Officer | | Position(s) Held
with
Registrant | | Length of
Time Served* | | Principal Occupation(s) During Past 5 Years | |
John H. Gernon (52)
522 Fifth Avenue
New York, NY 10036 | | President and Principal Executive Officer | | Since
September
2013 | | President and Principal Executive Officer of the Equity and Fixed Income Funds and the Morgan Stanley AIP Funds (since September 2013) and the Liquidity Funds and various money market funds (since May 2014) in the Fund Complex, Managing Director of the Adviser; Head of Product (since 2006) and Global Portfolio Analysis and Reporting (since 2012); for MSIM's Long Only business. | |
Stefanie V. Chang Yu (48)
522 Fifth Avenue
New York, NY 10036 | | Chief Compliance Officer | | Since
December
1997 | | Managing Director of the Adviser and various entities affiliated with the Adviser; Chief Compliance Officer of various Morgan Stanley Funds and the Adviser (since January 2014); formerly, Vice President of various Morgan Stanley Funds (December 1997-January 2014). | |
Joseph C. Benedetti (50)
522 Fifth Avenue
New York, NY 10036 | | Vice President | | Since
January
2014 | | Managing Director of the Adviser and various entities affiliated with the Adviser; Vice President of various Morgan Stanley Funds (since January 2014); formerly, Assistant Secretary of various Morgan Stanley Funds (October 2004-January 2014). | |
Francis J. Smith (50)
522 Fifth Avenue
New York, NY 10036 | | Treasurer and Principal Financial Officer | | Treasurer since July 2003 and Principal Financial Officer since September 2002 | | Executive Director of the Adviser and various entities affiliated with the Adviser; Treasurer (since July 2003) and Principal Financial Officer of various Morgan Stanley Funds (since September 2002). | |
Mary E. Mullin (48)
522 Fifth Avenue
New York, NY 10036 | | Secretary | | Since
June
1999 | | Executive Director of the Adviser and various entities affiliated with the Adviser; Secretary of various Morgan Stanley Funds (since June 1999). | |
* This is the earliest date the officer began serving the Morgan Stanley Funds. Each officer serves a one-year term, until his or her successor is elected and has qualified.
39
Morgan Stanley Institutional Fund Trust
Annual Report — September 30, 2015
Adviser and Administrator
Morgan Stanley Investment Management Inc.
522 Fifth Avenue
New York, New York 10036
Distributor
Morgan Stanley Distribution, Inc.
522 Fifth Avenue
New York, New York 10036
Dividend Disbursing and Transfer Agent
Boston Financial Data Services, Inc.
2000 Crown Colony Drive
Quincy, Massachusetts 02169
Custodian
State Street Bank and Trust Company
One Lincoln Street
Boston, Massachusetts 02111
Legal Counsel
Dechert LLP
1095 Avenue of the Americas
New York, New York 10036
Counsel to the Independent Trustees
Kramer Levin Naftalis & Frankel LLP
1177 Avenue of the Americas
New York, New York 10036
Independent Registered Public Accounting Firm
Ernst & Young LLP
200 Clarendon Street
Boston, Massachusetts 02116
Reporting to Shareholders
Each Morgan Stanley fund provides a complete schedule of portfolio holdings in its semi-annual and annual reports within 60 days of the end of the fund's second and fourth fiscal quarters. The semi-annual and annual reports are filed electronically with the Securities and Exchange Commission (SEC) on Form N-CSRS and Form N-CSR, respectively. Morgan Stanley also delivers the semi-annual and annual reports to fund shareholders and makes these reports available on its public website, www.morganstanley.com/im. Each Morgan Stanley fund also files a complete schedule of portfolio holdings with the SEC for the fund's first and third fiscal quarters on Form N-Q. Morgan Stanley does not deliver the reports for the first and third fiscal quarters to shareholders, nor are the reports posted to the Morgan Stanley public website. You may, however, obtain the Form N-Q filings (as well as the Form N-CSR and N-CSRS filings) by accessing the SEC's website, www.sec.gov. You may also review and copy them at the SEC's Public Reference Room in Washington, DC. Information on the operation of the SEC's Public Reference Room may be obtained by calling the SEC toll free at 1 (800) SEC-0330. You can also request copies of these materials, upon payment of a duplicating fee, by electronic request at the SEC's email address (publicinfo@sec.gov) or by writing the Public Reference Room of the SEC, Washington, DC 20549-0102.
Proxy Voting Policies and Procedures and Proxy Voting Record
You may obtain a copy of the Fund's Proxy Voting Policy and Procedures and information regarding how the Fund voted proxies relating to portfolio securities during the most recent twelve-month period ended June 30, without charge, upon request, by calling toll free 1 (800) 548-7786 or by visiting our website at www.morganstanley.com/im. This information is also available on the SEC's website at www.sec.gov.
This report is authorized for distribution only when preceded or accompanied by a prospectus of the Morgan Stanley Institutional Fund Trust, which describes in detail each Portfolio's investment policies, risks, fees and expenses. Please read the prospectus carefully before you invest or send money. For additional information, including information regarding the investments comprising the Portfolio, please visit our website at www.morganstanley.com/im or call toll free 1 (800) 548-7786.
40
Printed in U.S.A.
This Report has been prepared for shareholders and may be distributed to others only if preceded or accompanied by a current prospectus.
Morgan Stanley Investment Management Inc.
522 Fifth Avenue
New York, New York 10036
© 2015 Morgan Stanley. Morgan Stanley Distribution, Inc.

IFTHYANN
1333184 EXP 11.30.16

Morgan Stanley Institutional Fund Trust
Corporate Bond Portfolio
Annual Report
September 30, 2015

Morgan Stanley Institutional Fund Trust
Annual Report — September 30, 2015
Shareholders' Letter | | | 2 | | |
Expense Example | | | 3 | | |
Investment Overview | | | 4 | | |
Portfolio of Investments | | | 7 | | |
Statement of Assets and Liabilities | | | 14 | | |
Statement of Operations | | | 16 | | |
Statements of Changes in Net Assets | | | 17 | | |
Financial Highlights | | | 18 | | |
Notes to Financial Statements | | | 22 | | |
Report of Independent Registered Public Accounting Firm | | | 31 | | |
Investment Advisory Agreement Approval | | | 32 | | |
U.S. Privacy Policy | | | 34 | | |
Trustee and Officer Information | | | 37 | | |
This report is authorized for distribution only when preceded or accompanied by prospectuses of the Morgan Stanley Institutional Fund Trust. To receive a prospectus and/or statement of additional information (SAI), which contains more complete information such as investment objectives, charges, expenses, policies for voting proxies, risk considerations, and describes in detail each of the Portfolio's investment policies to the prospective investor, please call toll free 1 (800) 548-7786. Please read the prospectuses carefully before you invest or send money.
Additionally, you can access portfolio information including performance, characteristics, and investment team commentary through Morgan Stanley Investment Management's website: www.morganstanley.com/im.
Market forecasts provided in this report may not necessarily come to pass. There is no guarantee that any sectors mentioned will continue to perform as discussed herein or that securities in such sectors will be held by the Portfolio in the future. There is no assurance that a Portfolio will achieve its investment objective. Portfolios are subject to market risk, which is the possibility that market values of securities owned by the Portfolio will decline and, therefore, the value of the Portfolio's shares may be less than what you paid for them. Accordingly, you can lose money investing in this Portfolio. Please see the prospectus for more complete information on investment risks.
1
Morgan Stanley Institutional Fund Trust
Annual Report — September 30, 2015
Shareholders' Letter (unaudited)
Dear Shareholders,
We are pleased to provide this Annual report, in which you will learn how your investment in Corporate Bond Portfolio (the "Portfolio") performed during the latest twelve-month period.
Morgan Stanley Investment Management is a client-centric, investor-led organization. Our global presence, intellectual capital, and breadth of products and services enable us to partner with investors to meet the evolving challenges of today's financial markets. We aim to deliver superior investment service and to empower our clients to make the informed decisions that help them reach their investment goals.
As always, we thank you for selecting Morgan Stanley Investment Management, and look forward to working with you in the months and years ahead.
Sincerely,

John H. Gernon
President and Principal Executive Officer
October 2015
2
Morgan Stanley Institutional Fund Trust
Annual Report — September 30, 2015
Expense Example (unaudited)
Corporate Bond Portfolio
As a shareholder of the Portfolio, you may incur two types of costs: (1) transactional costs, including sales charge (loads) on purchase payments; and (2) ongoing costs, including advisory fees, administration fees, distribution and shareholder services fees; and other Portfolio expenses. This example is intended to help you understand your ongoing costs (in dollars) of investing in the Portfolio and to compare these costs with the ongoing costs of investing in other mutual funds.
This example is based on an investment of $1,000 invested at the beginning of the six-month period ended September 30, 2015 and held for the entire six-month period (unless otherwise noted).
Actual Expenses
The table below provides information about actual account values and actual expenses. You may use the information in this table, together with the amount you invested, to estimate the expenses that you paid over the period. Simply divide your account value by $1,000 (for example, an $8,600 account value divided by $1,000 = 8.6), then multiply the result by the number in the table under the heading entitled "Actual Expenses Paid During Period" to estimate the expenses you paid on your account during this period.
Hypothetical Example for Comparison Purposes
The table below provides information about hypothetical account values and hypothetical expenses based on the Portfolio's actual expense ratio and an assumed rate of return of 5% per year before expenses, which is not the Portfolio's actual return. The hypothetical account values and expenses may not be used to estimate the actual ending account balance or expenses you paid for the period. You may use this information to compare the ongoing costs of investing in the Portfolio and other funds. To do so, compare this 5% hypothetical example with the 5% hypothetical examples that appear in the shareholder reports of the other funds.
Please note that the expenses shown in the table are meant to highlight your ongoing costs only and do not reflect any transactional costs, such as sales charges (loads, if applicable). Therefore, the information for each class in the table is useful in comparing ongoing costs only, and will not help you determine the relative total costs of owning different funds. In addition, if these transactional costs were included, your costs would have been higher.
| | | Beginning
Account
Value
4/1/15 | | Actual Ending
Account
Value
9/30/15 | | Hypothetical
Ending Account
Value | | Actual
Expenses
Paid
During
Period | | Hypothetical
Expenses Paid
During Period | | Net
Expense
Ratio
During
Period*** | |
Corporate Bond Portfolio Class I | | $ | 1,000.00 | | | $ | 963.60 | | | $ | 1,021.56 | | | $ | 3.45 | * | | $ | 3.55 | * | | | 0.70 | % | |
Corporate Bond Portfolio Class A | | | 1,000.00 | | | | 962.10 | | | | 1,019.80 | | | | 5.16 | * | | | 5.32 | * | | | 1.05 | | |
Corporate Bond Portfolio Class L | | | 1,000.00 | | | | 960.70 | | | | 1,018.40 | | | | 6.54 | * | | | 6.73 | * | | | 1.33 | | |
Corporate Bond Portfolio Class C | | | 1,000.00 | | | | 966.00 | | | | 1,013.41 | | | | 7.42 | ** | | | 7.60 | ** | | | 1.80 | | |
* Expenses are calculated using each Portfolio Class' annualized net expense ratio (as disclosed), multiplied by the average account value over the period, and multiplied by 183/365 (to reflect the most recent one-half year period).
** Expenses are calculated using the Portfolio Class' annualized net expense ratio (as disclosed), multiplied by the average account value over the period, and multiplied by 153/365 (to reflect the actual days in the period).
*** Annualized.
3
Morgan Stanley Institutional Fund Trust
Annual Report — September 30, 2015
Investment Overview (unaudited)
Corporate Bond Portfolio
The Corporate Bond Portfolio seeks above-average total return over a market cycle of three to five years.
Performance
For the fiscal year ended September 30, 2015, the Portfolio's Class I shares had a total return based on net asset value and reinvestment of distributions per share of -0.04%, net of fees. The Portfolio's Class I shares underperformed against the Portfolio's benchmark, the Barclays U.S. Corporate Index (the "Index"), which returned 1.66%.
Factors Affecting Performance
• Concerns over central bank policy around the world and global issues, such as Greece's debt crisis and China's economic slowdown, kept bond markets fairly turbulent during the period. Risk premia rose substantially in the latter months of the period and asset prices suffered. The rise in risk premia was driven by a continued tightening of financial conditions, catalyzed by a devaluation of the Chinese currency in August. This tightening of financial conditions resulted in falling business confidence and generally weaker-than-expected economic data. These factors drove "risk-off" sentiment and led to a widening of credit spreads, an equity market sell-off and a rally in U.S. Treasuries. Furthermore, to the surprise of many, the Federal Reserve (Fed) kept interest rates unchanged and delivered a more dovish-than-expected policy statement at its September 2015 meeting. As an unintended consequence, markets increasingly worried that the negative impact on the U.S. economy's growth dynamics would warrant a ratcheting down of global growth expectations. This fear drove risk premia even higher. The Fed has communicated that its decision to hike rates will be data dependent, which implies some uncertainty on whether a hike will happen this year. Only with a material recovery in labor market indicators over the next few months would a rate hike likely occur this year.
• Despite a general increase in yields in first half of the period, over the full 12-month period, 5-, 10-, and 30-year Treasury yields ended 41, 36 and 34 basis points lower, respectively.(i) U.S. 2-year yields
ended the period relatively flat at 2 basis points higher.
• Recovering from a volatile fourth quarter of 2014, high yield credit started 2015 on a positive note, as one of the few fixed income sectors to have positive performance in the first quarter of 2015. However, amid economic and geopolitical worries, the U.S. credit markets endured record amounts of new issuance, which eventually pressured yield spreads wider (and prices lower, as bond prices move inversely to yields). Over the course of 2015, credit spreads in all markets have widened materially and are currently at levels which are typically only seen in periods of economic recession or systemic stress. The spreads observable in the investment grade markets include a material risk premium, and spreads in the high yield market are compensating for a significant uptick in defaults. While it is clear that certain emerging markets are seeing a material risk of recession, the consensus is for the developed world to see moderate growth over the coming year. We believe this growth backdrop, combined with low inflation, is likely to lead to ongoing accommodative monetary policy from the central banks around the world, which should keep defaults low and support credit markets.
• Another driver of credit spreads is the technical balance between supply and demand. Supply volume has been elevated across many of the credit markets. This has been most apparent in the U.S. investment grade market, where a combination of increased merger and acquisition activity and the fear that an interest rate tightening cycle could increase the future cost of long-term debt financing has caused corporate treasurers to turn to the bond markets. As a result, year-to-date new issue volumes have been running at record pace. This is to a lesser extent also true in the U.S. high yield and European investment grade markets. Along with this high level of issuance, demand has been muted as many yield-oriented investors are awaiting higher yields before committing capital to the market. This mismatch between supply and demand has resulted in a higher liquidity premium, which has contributed to the wider credit spreads.
(i) Source for U.S. Treasury yields: Bloomberg L.P.
4
Morgan Stanley Institutional Fund Trust
Annual Report — September 30, 2015
Investment Overview (unaudited) (cont'd)
Corporate Bond Portfolio
• The Portfolio's investment grade credit exposure was a negative contributor to the Portfolio's returns. Weakness in the credit markets was broad based over the period, with spreads widening across all major segments of the investment grade market. Defensive positioning and positive security selection helped generate modest positive relative returns in a few select industries, such as consumer non-cyclicals and insurance, but these positions were overshadowed by the negative impact of overweights to other segments of the market where spreads widened. Bonds from the energy and metals subsectors of the markets performed the worst, as they were negatively impacted by falling commodity prices.
• An opportunistic allocation to below investment grade (high yield) credits also detracted from the Portfolio's performance. After outperforming investment grade bonds in prior periods, the high yield market underwent a significant repricing of risk over the last 12 months. As with the investment-grade market, given sharp declines in commodity prices, credits from the energy and metals sectors performed the worst.
• During the year, the Portfolio's defensive duration positioning detracted from returns as yields remained range bound during period. The duration and yield curve flattening positions were managed in part using futures and swaps.
Management Strategies
• Supported by a macro backdrop of sustained U.S. economic growth and low default risks, we see a significant value opportunity for investors in the U.S. corporate market. While macro developments may continue to create volatility in the short term, we believe current levels of investment grade corporate spreads present attractive value for long-term investors. After trading inside of long-term medians for much of 2014, spreads on the Barclays U.S. Investment Grade Corporate Index have reached levels that we believe compensate investors well given the risks present. We expect spreads to be further supported by an improving U.S. economy and gradually rising interest rates. Despite our view that investment grade corporates offer attractive valuation, we remain cognizant that the business cycle has matured. Company behavior in later-cycle environments is often tilted in favor of equity
holders at the expense of bond holders. As a result, we remain reliant upon our active, value-oriented approach and bottom-up credit research process to help identify the best value opportunities, while avoiding those companies where we believe there is limited scope to earn attractive returns.
• Given this outlook, we continue to position the Portfolio to be overweight credit risk, particularly in the financial sector, where we believe that the fundamental story remains one of secular de-risking as banks look to shore up their balance sheets, increase liquidity and reduce their risky activities. In the non-financial segment of the investment grade market, after entering the year more defensively positioned (in light of late-cycle behavior discussed above), we have moved the Portfolio to a modest overweight, given the significant repricing of risk that has taken place.
• The Portfolio continues to hold small allocations to high yield bonds, as we believe that both fundamentals and valuations may well compensate investors for bearing risk.

* Minimum Investment
In accordance with SEC regulations, the Portfolio's performance shown assumes that all recurring fees (including management fees) were deducted and all dividends and distributions were reinvested. The performance of Class A, Class L and Class C shares will vary from the performance of Class I shares based upon their different inception dates and will be negatively impacted by additional fees assessed to those classes.
5
Morgan Stanley Institutional Fund Trust
Annual Report — September 30, 2015
Investment Overview (unaudited) (cont'd)
Corporate Bond Portfolio
Performance Compared to the Barclays U.S. Corporate Index(1) and the Lipper Corporate Debt Funds BBB-Rated Index(2)
| | | Period Ended September 30, 2015
Total Returns(3) | |
| | | | | Average Annual | |
| | | One
Year | | Five
Years | | Ten
Years | | Since
Inception(8) | |
Portfolio — Class I Shares
w/o sales charges(4) | | | –0.04 | % | | | 4.49 | % | | | 3.66 | % | | | 6.25 | % | |
Portfolio — Class A Shares
w/o sales charges(5) | | | –0.37 | | | | 4.28 | | | | 3.48 | | | | 3.92 | | |
Portfolio — Class A Shares with
maximum 4.25% sales charges(5) | | | –4.58 | | | | 3.38 | | | | 3.03 | | | | 3.58 | | |
Portfolio — Class L Shares
w/o sales charges(6) | | | –0.65 | | | | 3.92 | | | | — | | | | 4.07 | | |
Portfolio — Class C Shares
w/o sales charges(7) | | | — | | | | — | | | | — | | | | –3.40 | | |
Portfolio — Class C Shares with
maximum 1.00% deferred
sales charges(7) | | | — | | | | — | | | | — | | | | –4.36 | | |
Barclays U.S. Corporate Index | | | 1.66 | | | | 4.32 | | | | 5.39 | | | | 7.08 | | |
Lipper Corporate Debt Funds
BBB-Rated Index | | | 0.18 | | | | 4.42 | | | | 5.18 | | | | 6.62 | | |
Performance data quoted represents past performance, which is no guarantee of future results, and current performance may be lower or higher than the figures shown. Performance assumes that all dividends and distributions, if any, were reinvested. Returns for period less than one year are not annualized. For the most recent month-end performance figures, please visit www.morganstanley.com/im. Investment returns and principal value will fluctuate so that Portfolio shares, when redeemed, may be worth more or less than their original cost. Total returns do not reflect the deduction of taxes that a shareholder would pay on Portfolio distributions or the redemption of Portfolio shares. Performance of share classes will vary due to differences in sales charges and expenses.
(1) The Barclays U.S. Corporate Index is a broad-based benchmark that measures the investment grade, U.S. dollar-denominated, fixed rate, taxable corporate bond market. It includes USD-denominated securities publicly issued by U.S. and non-U.S. industrial, utility and financial issuers that meet specified maturity, liquidity and quality requirements.The Index is unmanaged and its returns do not include any sales charges or fees. Such costs would lower performance. It is not possible to invest directly in an index.
(2) The Lipper Corporate Debt Funds BBB-Rated Index is an equally weighted performance index of the largest qualifying funds (based on net assets) in the Lipper Corporate Debt Funds BBB-Rated Funds classification. The Index, which is adjusted for capital gains distributions and income dividends, is unmanaged and should not be considered an investment. There are currently 30 funds represented in this Index. As of the date of this report, the Portfolio was in the Lipper Corporate Debt Funds BBB-Rated Funds classification.
(3) Total returns for the Portfolio reflect expenses waived and/or reimbursed, if applicable, by the Adviser and Distributor. Without such waivers and/or reimbursements, total returns would have been lower.
(4) Commenced operations on August 31, 1990.
(5) Commenced operations on May 20, 2002.
(6) Commenced operations on June 16, 2008.
(7) Commenced operations on April 30, 2015.
(8) For comparative purposes, average annual since inception returns listed for the Indexes refer to the inception date of Class I of the Portfolio, not the inception of the Indexes.
6
Morgan Stanley Institutional Fund Trust
Annual Report — September 30, 2015
Portfolio of Investments
Corporate Bond Portfolio
| | | Face
Amount
(000) | | Value
(000) | |
Fixed Income Securities (97.2%) | |
Asset-Backed Securities (0.8%) | |
CVS Pass-Through Trust, | |
6.04%, 12/10/28 | | $ | 112 | | | $ | 127 | | |
8.35%, 7/10/31 (a) | | | 130 | | | | 167 | | |
| | | | 294 | | |
Corporate Bonds (95.3%) | |
Finance (33.5%) | |
Abbey National Treasury Services PLC | |
3.05%, 8/23/18 | | | 120 | | | | 124 | | |
ABN AMRO Bank N.V. | |
4.75%, 7/28/25 (a) | | | 200 | | | | 199 | | |
ACE INA Holdings, Inc. | |
3.35%, 5/15/24 | | | 125 | | | | 125 | | |
AerCap Ireland Capital Ltd./AerCap Global
Aviation Trust | |
3.75%, 5/15/19 | | | 150 | | | | 148 | | |
Alexandria Real Estate Equities, Inc. | |
3.90%, 6/15/23 | | | 50 | | | | 50 | | |
Ally Financial, Inc. | |
4.13%, 3/30/20 | | | 100 | | | | 99 | | |
American Campus Communities Operating
Partnership LP | |
3.75%, 4/15/23 | | | 100 | | | | 99 | | |
American Express Co. | |
3.63%, 12/5/24 | | | 75 | | | | 74 | | |
American Express Credit Corp.,
MTN | |
2.38%, 5/26/20 | | | 200 | | | | 200 | | |
American International Group, Inc. | |
4.88%, 6/1/22 | | | 100 | | | | 111 | | |
Bank of America Corp., | |
MTN | |
4.00%, 4/1/24 - 1/22/25 | | | 350 | | | | 352 | | |
4.25%, 10/22/26 | | | 91 | | | | 90 | | |
4.75%, 4/21/45 | | | 50 | | | | 49 | | |
5.00%, 1/21/44 | | | 125 | | | | 132 | | |
Bank of New York Mellon Corp. (The), | |
MTN | |
3.65%, 2/4/24 | | | 60 | | | | 63 | | |
BBVA Bancomer SA | |
6.50%, 3/10/21 (a) | | | 150 | | | | 161 | | |
Bear Stearns Cos., LLC (The) | |
5.55%, 1/22/17 | | | 450 | | | | 473 | | |
BNP Paribas SA, | |
MTN | |
4.25%, 10/15/24 (b) | | | 200 | | | | 199 | | |
5.00%, 1/15/21 | | | 95 | | | | 107 | | |
Boston Properties LP | |
3.80%, 2/1/24 | | | 25 | | | | 25 | | |
| BPCE SA | |
5.15%, 7/21/24 (a)(b) | | | 200 | | | | 204 | | |
Capital One Bank, USA NA | |
3.38%, 2/15/23 | | | 342 | | | | 333 | | |
| | | Face
Amount
(000) | | Value
(000) | |
Capital One Financial Corp. | |
2.45%, 4/24/19 | | $ | 50 | | | $ | 50 | | |
Citigroup, Inc., | |
5.50%, 9/13/25 | | | 175 | | | | 191 | | |
6.68%, 9/13/43 | | | 50 | | | | 61 | | |
8.13%, 7/15/39 | | | 100 | | | | 144 | | |
CNA Financial Corp. | |
5.75%, 8/15/21 | | | 75 | | | | 86 | | |
Cooperatieve Centrale Raiffeisen-
Boerenleenbank BA | |
3.95%, 11/9/22 | | | 250 | | | | 251 | | |
Credit Agricole SA | |
3.88%, 4/15/24 (a)(b) | | | 250 | | | | 259 | | |
Credit Suisse, | |
MTN | |
3.63%, 9/9/24 | | | 250 | | | | 251 | | |
6.00%, 2/15/18 | | | 61 | | | | 66 | | |
DBS Group Holdings Ltd. | |
2.25%, 7/16/19 (a) | | | 225 | | | | 227 | | |
Discover Bank | |
2.00%, 2/21/18 | | | 250 | | | | 249 | | |
Discover Financial Services | |
3.95%, 11/6/24 | | | 75 | | | | 74 | | |
Five Corners Funding Trust | |
4.42%, 11/15/23 (a) | | | 200 | | | | 210 | | |
General Electric Capital Corp., | |
5.30%, 2/11/21 | | | 120 | | | | 138 | | |
MTN | |
5.88%, 1/14/38 | | | 230 | | | | 287 | | |
Goldman Sachs Group, Inc. (The), | |
MTN | |
4.80%, 7/8/44 | | | 125 | | | | 127 | | |
6.25%, 2/1/41 | | | 75 | | | | 91 | | |
6.75%, 10/1/37 | | | 205 | | | | 245 | | |
Goodman Funding Pty Ltd. | |
6.38%, 4/15/21 (a) | | | 250 | | | | 288 | | |
Hartford Financial Services Group, Inc. (The) | |
5.50%, 3/30/20 | | | 275 | | | | 310 | | |
Healthcare Trust of America Holdings LP | |
3.70%, 4/15/23 | | | 100 | | | | 98 | | |
HSBC Finance Corp. | |
6.68%, 1/15/21 | | | 135 | | | | 158 | | |
HSBC Holdings PLC | |
6.50%, 5/2/36 | | | 100 | | | | 119 | | |
HSBC USA, Inc. | |
3.50%, 6/23/24 (b) | | | 100 | | | | 102 | | |
Industrial & Commercial Bank of China Ltd., | |
MTN | |
3.23%, 11/13/19 | | | 250 | | | | 255 | | |
ING Bank N.V. | |
5.80%, 9/25/23 (a) | | | 100 | | | | 109 | | |
Intesa Sanpaolo SpA | |
5.25%, 1/12/24 | | | 200 | | | | 214 | | |
The accompanying notes are an integral part of the financial statements.
7
Morgan Stanley Institutional Fund Trust
Annual Report — September 30, 2015
Portfolio of Investments (cont'd)
Corporate Bond Portfolio
| | | Face
Amount
(000) | | Value
(000) | |
Finance (cont'd) | |
JPMorgan Chase & Co., | |
4.95%, 6/1/45 | | $ | 130 | | | $ | 131 | | |
5.50%, 10/15/40 | | | 150 | | | | 170 | | |
Liberty Mutual Group, Inc. | |
4.85%, 8/1/44 (a) | | | 50 | | | | 49 | | |
Lincoln National Corp. | |
7.00%, 6/15/40 | | | 75 | | | | 97 | | |
Lloyds Bank PLC | |
6.50%, 9/14/20 (a) | | | 320 | | | | 369 | | |
Massachusetts Mutual Life Insurance Co. | |
4.50%, 4/15/65 (a) | | | 50 | | | | 46 | | |
Metropolitan Life Global Funding I | |
2.00%, 4/14/20 (a) | | | 200 | | | | 199 | | |
Nationwide Building Society | |
6.25%, 2/25/20 (a) | | | 260 | | | | 305 | | |
Pacific LifeCorp | |
6.00%, 2/10/20 (a) | | | 150 | | | | 170 | | |
PNC Financial Services Group, Inc. (The) | |
3.90%, 4/29/24 (b) | | | 80 | | | | 81 | | |
Prudential Financial, Inc. | |
5.63%, 6/15/43 (c) | | | 170 | | | | 176 | | |
Realty Income Corp. | |
3.25%, 10/15/22 | | | 150 | | | | 147 | | |
TD Ameritrade Holding Corp. | |
3.63%, 4/1/25 | | | 100 | | | | 102 | | |
UBS AG | |
7.50%, 7/15/25 | | | 100 | | | | 126 | | |
UnitedHealth Group, Inc., | |
2.75%, 2/15/23 (b) | | | 55 | | | | 54 | | |
2.88%, 3/15/23 (b) | | | 255 | | | | 254 | | |
3.75%, 7/15/25 | | | 150 | | | | 155 | | |
Weingarten Realty Investors | |
3.38%, 10/15/22 | | | 150 | | | | 148 | | |
Wells Fargo & Co., | |
2.15%, 1/15/19 | | | 60 | | | | 60 | | |
Series M | |
3.45%, 2/13/23 | | | 125 | | | | 125 | | |
MTN | |
4.10%, 6/3/26 | | | 250 | | | | 253 | | |
4.13%, 8/15/23 | | | 130 | | | | 135 | | |
| | | | 11,429 | | |
Industrials (54.3%) | |
21st Century Fox America, Inc. | |
4.75%, 9/15/44 | | | 150 | | | | 148 | | |
ABB Treasury Center USA, Inc. | |
4.00%, 6/15/21 (a) | | | 50 | | | | 53 | | |
AbbVie, Inc., | |
3.60%, 5/14/25 | | | 50 | | | | 49 | | |
4.40%, 11/6/42 | | | 25 | | | | 23 | | |
| | | Face
Amount
(000) | | Value
(000) | |
Actavis Funding SCS, | |
3.80%, 3/15/25 | | $ | 10 | | | $ | 10 | | |
4.75%, 3/15/45 | | | 130 | | | | 118 | | |
4.85%, 6/15/44 | | | 50 | | | | 46 | | |
ADT Corp. (The) | |
3.50%, 7/15/22 | | | 125 | | | | 111 | | |
Alfa SAB de CV | |
5.25%, 3/25/24 (a)(b) | | | 200 | | | | 205 | | |
Alibaba Group Holding Ltd. | |
2.50%, 11/28/19 (a) | | | 200 | | | | 197 | | |
Altria Group, Inc., | |
2.85%, 8/9/22 | | | 115 | | | | 113 | | |
5.38%, 1/31/44 | | | 55 | | | | 60 | | |
Amazon.com, Inc., | |
3.80%, 12/5/24 | | | 75 | | | | 77 | | |
4.95%, 12/5/44 | | | 50 | | | | 51 | | |
American Airlines Pass-Through Trust | |
4.00%, 7/15/25 | | | 180 | | | | 184 | | |
Amgen, Inc. | |
5.15%, 11/15/41 | | | 98 | | | | 101 | | |
Anadarko Petroleum Corp. | |
6.45%, 9/15/36 | | | 100 | | | | 110 | | |
Anglo American Capital PLC | |
3.63%, 5/14/20 (a)(b) | | | 200 | | | | 175 | | |
Anheuser-Busch InBev Finance, Inc. | |
3.70%, 2/1/24 (b) | | | 200 | | | | 203 | | |
Apple, Inc., | |
3.85%, 5/4/43 | | | 50 | | | | 46 | | |
4.45%, 5/6/44 | | | 125 | | | | 125 | | |
APT Pipelines Ltd. | |
4.20%, 3/23/25 (a) | | | 200 | | | | 190 | | |
Aramark Services, Inc. | |
5.75%, 3/15/20 | | | 95 | | | | 99 | | |
Ashland, Inc. | |
6.88%, 5/15/43 | | | 50 | | | | 47 | | |
AstraZeneca PLC | |
6.45%, 9/15/37 | | | 125 | | | | 162 | | |
AT&T, Inc., | |
5.55%, 8/15/41 | | | 100 | | | | 102 | | |
6.30%, 1/15/38 | | | 225 | | | | 248 | | |
Automatic Data Processing, Inc. | |
3.38%, 9/15/25 | | | 50 | | | | 51 | | |
BAE Systems Holdings, Inc. | |
3.80%, 10/7/24 (a) | | | 100 | | | | 101 | | |
Baidu, Inc. | |
3.25%, 8/6/18 | | | 200 | | | | 204 | | |
Barrick Gold Corp. | |
4.10%, 5/1/23 | | | 100 | | | | 89 | | |
BAT International Finance PLC | |
3.50%, 6/15/22 (a) | | | 75 | | | | 77 | | |
Baxalta, Inc. | |
5.25%, 6/23/45 (a) | | | 100 | | | | 101 | | |
The accompanying notes are an integral part of the financial statements.
8
Morgan Stanley Institutional Fund Trust
Annual Report — September 30, 2015
Portfolio of Investments (cont'd)
Corporate Bond Portfolio
| | | Face
Amount
(000) | | Value
(000) | |
Industrials (cont'd) | |
Bayer US Finance LLC | |
3.38%, 10/8/24 (a) | | $ | 200 | | | $ | 201 | | |
BHP Billiton Finance USA Ltd., | |
3.85%, 9/30/23 (b) | | | 50 | | | | 50 | | |
5.00%, 9/30/43 | | | 75 | | | | 76 | | |
Biogen, Inc. | |
4.05%, 9/15/25 | | | 100 | | | | 101 | | |
Bombardier, Inc. | |
6.13%, 1/15/23 (a) | | | 116 | | | | 86 | | |
Boston Scientific Corp. | |
3.85%, 5/15/25 | | | 100 | | | | 99 | | |
BP Capital Markets PLC | |
3.51%, 3/17/25 | | | 125 | | | | 124 | | |
British Airways Pass-Through Trust | |
4.63%, 6/20/24 (a) | | | 166 | | | | 174 | | |
Buckeye Partners LP | |
4.15%, 7/1/23 (b) | | | 175 | | | | 161 | | |
Burlington Northern Santa Fe LLC, | |
4.40%, 3/15/42 | | | 75 | | | | 73 | | |
4.55%, 9/1/44 | | | 50 | | | | 49 | | |
Cardinal Health, Inc. | |
3.75%, 9/15/25 | | | 125 | | | | 127 | | |
Carrizo Oil & Gas, Inc. | |
6.25%, 4/15/23 | | | 75 | | | | 66 | | |
Caterpillar Financial Services Corp., | |
MTN | |
3.25%, 12/1/24 | | | 100 | | | | 98 | | |
Caterpillar, Inc. | |
3.80%, 8/15/42 | | | 50 | | | | 46 | | |
CBS Corp., | |
4.60%, 1/15/45 | | | 25 | | | | 22 | | |
4.90%, 8/15/44 | | | 50 | | | | 46 | | |
CCO Safari II LLC | |
4.91%, 7/23/25 (a) | | | 175 | | | | 174 | | |
Celgene Corp. | |
3.88%, 8/15/25 | | | 100 | | | | 100 | | |
CEVA Group PLC | |
7.00%, 3/1/21 (a) | | | 75 | | | | 67 | | |
Cimarex Energy Co. | |
5.88%, 5/1/22 | | | 150 | | | | 158 | | |
Coca-Cola Co. | |
3.20%, 11/1/23 | | | 125 | | | | 128 | | |
ConAgra Foods, Inc. | |
4.65%, 1/25/43 | | | 75 | | | | 69 | | |
ConocoPhillips Co. | |
2.20%, 5/15/20 | | | 100 | | | | 100 | | |
Continental Resources, Inc. | |
3.80%, 6/1/24 | | | 50 | | | | 41 | | |
Daimler Finance North America LLC | |
8.50%, 1/18/31 | | | 161 | | | | 229 | | |
DCP Midstream LLC | |
5.35%, 3/15/20 (a) | | | 40 | | | | 39 | | |
| | | Face
Amount
(000) | | Value
(000) | |
DCP Midstream Operating LP | |
3.88%, 3/15/23 | | $ | 150 | | | $ | 126 | | |
Deere & Co. | |
3.90%, 6/9/42 | | | 60 | | | | 57 | | |
Denbury Resources, Inc. | |
5.50%, 5/1/22 | | | 30 | | | | 18 | | |
Deutsche Telekom International Finance BV | |
8.75%, 6/15/30 | | | 75 | | | | 107 | | |
Devon Energy Corp. | |
4.75%, 5/15/42 | | | 100 | | | | 89 | | |
DirecTV Holdings LLC/DIRECTV
Financing Co., Inc. | |
5.15%, 3/15/42 | | | 75 | | | | 71 | | |
Dollar Tree, Inc. | |
5.75%, 3/1/23 (a) | | | 100 | | | | 104 | | |
Eastman Chemical Co. | |
3.80%, 3/15/25 | | | 100 | | | | 98 | | |
Eldorado Gold Corp. | |
6.13%, 12/15/20 (a) | | | 105 | | | | 92 | | |
Embraer Netherlands Finance BV | |
5.05%, 6/15/25 | | | 100 | | | | 93 | | |
EMD Finance LLC | |
3.25%, 3/19/25 (a) | | | 212 | | | | 206 | | |
Energy Transfer Partners LP | |
6.50%, 2/1/42 | | | 125 | | | | 115 | | |
EnLink Midstream Partners LP | |
5.60%, 4/1/44 | | | 50 | | | | 46 | | |
Ensco PLC | |
5.75%, 10/1/44 | | | 50 | | | | 35 | | |
Enterprise Products Operating LLC | |
4.45%, 2/15/43 | | | 175 | | | | 150 | | |
FedEx Corp. | |
3.20%, 2/1/25 | | | 100 | | | | 97 | | |
Ford Motor Credit Co., LLC | |
5.88%, 8/2/21 | | | 200 | | | | 227 | | |
Freeport-McMoRan, Inc. | |
3.88%, 3/15/23 | | | 120 | | | | 90 | | |
General Electric Co. | |
4.50%, 3/11/44 | | | 50 | | | | 52 | | |
General Motors Financial Co., Inc., | |
4.00%, 1/15/25 | | | 100 | | | | 95 | | |
4.30%, 7/13/25 | | | 55 | | | | 53 | | |
4.38%, 9/25/21 | | | 125 | | | | 128 | | |
Gilead Sciences, Inc., | |
3.65%, 3/1/26 | | | 25 | | | | 25 | | |
4.50%, 2/1/45 | | | 25 | | | | 24 | | |
4.80%, 4/1/44 | | | 50 | | | | 50 | | |
GlaxoSmithKline Capital, Inc. | |
6.38%, 5/15/38 | | | 75 | | | | 95 | | |
Glencore Funding LLC | |
4.13%, 5/30/23 (a) | | | 170 | | | | 134 | | |
Goldcorp, Inc. | |
5.45%, 6/9/44 | | | 50 | | | | 46 | | |
The accompanying notes are an integral part of the financial statements.
9
Morgan Stanley Institutional Fund Trust
Annual Report — September 30, 2015
Portfolio of Investments (cont'd)
Corporate Bond Portfolio
| | | Face
Amount
(000) | | Value
(000) | |
Industrials (cont'd) | |
HCA, Inc. | |
4.75%, 5/1/23 | | $ | 130 | | | $ | 131 | | |
Heathrow Funding Ltd. | |
4.88%, 7/15/21 (a) | | | 190 | | | | 209 | | |
Hilcorp Energy I LP/Hilcorp Finance Co. | |
5.75%, 10/1/25 (a) | | | 55 | | | | 49 | | |
Home Depot, Inc., | |
3.35%, 9/15/25 | | | 25 | | | | 25 | | |
5.88%, 12/16/36 | | | 109 | | | | 134 | | |
HP Enterprise Co. | |
4.90%, 10/15/25 | | | 125 | | | | 125 | | |
Hutchison Whampoa International 14 Ltd. | |
1.63%, 10/31/17 (a) | | | 200 | | | | 199 | | |
Intel Corp. | |
2.70%, 12/15/22 | | | 200 | | | | 197 | | |
Kinder Morgan Energy Partners LP | |
4.15%, 2/1/24 | | | 150 | | | | 136 | | |
Kinder Morgan, Inc., | |
4.30%, 6/1/25 (b) | | | 50 | | | | 45 | | |
5.55%, 6/1/45 | | | 200 | | | | 167 | | |
Koninklijke Philips N.V. | |
3.75%, 3/15/22 | | | 300 | | | | 305 | | |
Kroger Co. (The) | |
6.90%, 4/15/38 | | | 80 | | | | 101 | | |
Lundin Mining Corp. | |
7.50%, 11/1/20 (a) | | | 72 | | | | 70 | | |
LyondellBasell Industries N.V. | |
4.63%, 2/26/55 | | | 75 | | | | 64 | | |
Mallinckrodt International Finance SA/
Mallinckrodt CB LLC | |
5.50%, 4/15/25 (a) | | | 100 | | | | 90 | | |
Marathon Oil Corp. | |
2.70%, 6/1/20 | | | 200 | | | | 194 | | |
MasTec, Inc. | |
4.88%, 3/15/23 | | | 140 | | | | 116 | | |
McDonald's Corp., | |
MTN | |
4.60%, 5/26/45 | | | 100 | | | | 100 | | |
Medtronic, Inc. | |
4.63%, 3/15/45 | | | 200 | | | | 207 | | |
Merck & Co., Inc. | |
2.80%, 5/18/23 | | | 250 | | | | 249 | | |
Motorola Solutions, Inc. | |
4.00%, 9/1/24 | | | 200 | | | | 181 | | |
| MPLX LP | |
4.00%, 2/15/25 | | | 100 | | | | 92 | | |
NBC Universal Media LLC | |
5.95%, 4/1/41 | | | 275 | | | | 330 | | |
NetApp, Inc. | |
2.00%, 12/15/17 | | | 100 | | | | 100 | | |
Netflix, Inc. | |
5.50%, 2/15/22 (a) | | | 95 | | | | 96 | | |
| | | Face
Amount
(000) | | Value
(000) | |
Nexen Energy ULC | |
6.40%, 5/15/37 | | $ | 100 | | | $ | 118 | | |
Noble Energy, Inc., | |
5.05%, 11/15/44 | | | 50 | | | | 43 | | |
5.88%, 6/1/24 | | | 50 | | | | 50 | | |
NOVA Chemicals Corp. | |
5.25%, 8/1/23 (a) | | | 120 | | | | 117 | | |
Novartis Capital Corp. | |
4.40%, 5/6/44 | | | 75 | | | | 81 | | |
Omnicom Group, Inc., | |
3.63%, 5/1/22 | | | 95 | | | | 96 | | |
3.65%, 11/1/24 | | | 23 | | | | 23 | | |
Ooredoo International Finance Ltd. | |
3.25%, 2/21/23 (a) | | | 225 | | | | 219 | | |
Oracle Corp. | |
4.50%, 7/8/44 | | | 150 | | | | 152 | | |
Orange SA | |
9.00%, 3/1/31 | | | 50 | | | | 71 | | |
PepsiCo, Inc. | |
3.60%, 3/1/24 | | | 200 | | | | 208 | | |
Philip Morris International, Inc. | |
4.50%, 3/20/42 | | | 150 | | | | 151 | | |
Phillips 66 | |
5.88%, 5/1/42 | | | 25 | | | | 27 | | |
Phillips 66 Partners LP | |
4.68%, 2/15/45 | | | 25 | | | | 21 | | |
Plains All American Pipeline LP/
PAA Finance Corp. | |
6.70%, 5/15/36 | | | 61 | | | | 67 | | |
QUALCOMM, Inc. | |
4.80%, 5/20/45 | | | 120 | | | | 105 | | |
Quest Diagnostics, Inc. | |
2.70%, 4/1/19 (b) | | | 200 | | | | 202 | | |
QVC, Inc. | |
4.38%, 3/15/23 | | | 150 | | | | 146 | | |
Rowan Cos., Inc. | |
5.85%, 1/15/44 (b) | | | 75 | | | | 47 | | |
RR Donnelley & Sons Co. | |
7.88%, 3/15/21 | | | 75 | | | | 78 | | |
Ryder System, Inc., | |
MTN | |
2.65%, 3/2/20 | | | 50 | | | | 50 | | |
Shell International Finance BV | |
2.13%, 5/11/20 | | | 175 | | | | 175 | | |
SM Energy Co. | |
6.13%, 11/15/22 | | | 100 | | | | 93 | | |
Southern Copper Corp. | |
7.50%, 7/27/35 | | | 100 | | | | 98 | | |
Spectra Energy Capital LLC | |
7.50%, 9/15/38 | | | 100 | | | | 110 | | |
Spectrum Brands, Inc. | |
5.75%, 7/15/25 (a) | | | 25 | | | | 26 | | |
The accompanying notes are an integral part of the financial statements.
10
Morgan Stanley Institutional Fund Trust
Annual Report — September 30, 2015
Portfolio of Investments (cont'd)
Corporate Bond Portfolio
| | | Face
Amount
(000) | | Value
(000) | |
Industrials (cont'd) | |
T-Mobile USA, Inc. | |
6.73%, 4/28/22 | | $ | 75 | | | $ | 75 | | |
Target Corp. | |
4.00%, 7/1/42 | | | 75 | | | | 74 | | |
Telefonica Europe BV | |
8.25%, 9/15/30 | | | 84 | | | | 109 | | |
Telstra Corp., Ltd. | |
3.13%, 4/7/25 (a) | | | 65 | | | | 63 | | |
Teva Pharmaceutical Finance IV BV | |
3.65%, 11/10/21 | | | 27 | | | | 27 | | |
Tiffany & Co. | |
4.90%, 10/1/44 | | | 50 | | | | 49 | | |
Time Warner Cable, Inc., | |
4.50%, 9/15/42 | | | 100 | | | | 79 | | |
6.75%, 6/15/39 | | | 80 | | | | 80 | | |
Time Warner, Inc., | |
4.65%, 6/1/44 | | | 25 | | | | 24 | | |
7.70%, 5/1/32 | | | 141 | | | | 184 | | |
Toyota Motor Credit Corp., | |
MTN | |
2.75%, 5/17/21 | | | 125 | | | | 127 | | |
TransCanada PipeLines Ltd. | |
7.63%, 1/15/39 | | | 75 | | | | 96 | | |
Transocean, Inc., | |
4.30%, 10/15/22 | | | 75 | | | | 47 | | |
6.88%, 12/15/21 | | | 100 | | | | 75 | | |
Trinity Industries, Inc. | |
4.55%, 10/1/24 | | | 200 | | | | 189 | | |
Tyco International Finance SA | |
3.90%, 2/14/26 | | | 75 | | | | 76 | | |
Tyson Foods, Inc. | |
3.95%, 8/15/24 | | | 30 | | | | 31 | | |
Union Pacific Railroad Co., Pass-Through Trust | |
3.23%, 5/14/26 | | | 193 | | | | 192 | | |
United Airlines Pass-Through Trust, | |
Class A | |
4.30%, 8/15/25 | | | 214 | | | | 223 | | |
United Rentals North America, Inc. | |
5.75%, 11/15/24 | | | 80 | | | | 77 | | |
Vale Overseas Ltd. | |
6.88%, 11/21/36 (b) | | | 75 | | | | 59 | | |
Verizon Communications, Inc., | |
3.50%, 11/1/24 | | | 50 | | | | 49 | | |
4.67%, 3/15/55 | | | 278 | | | | 240 | | |
5.01%, 8/21/54 | | | 235 | | | | 215 | | |
Vodafone Group PLC | |
4.38%, 2/19/43 | | | 50 | | | | 44 | | |
Volkswagen Group of America Finance LLC | |
2.40%, 5/22/20 (a)(b) | | | 200 | | | | 186 | | |
Walgreens Boots Alliance, Inc. | |
3.80%, 11/18/24 | | | 25 | | | | 25 | | |
| | | Face
Amount
(000) | | Value
(000) | |
Williams Partners LP/ACMP Finance Corp. | |
4.88%, 5/15/23 | | $ | 125 | | | $ | 116 | | |
WM Wrigley Jr. Co. | |
2.90%, 10/21/19 (a) | | | 230 | | | | 237 | | |
Wynn Las Vegas LLC/Wynn Las Vegas
Capital Corp. | |
5.38%, 3/15/22 (b) | | | 115 | | | | 106 | | |
Yum! Brands, Inc. | |
3.88%, 11/1/20 | | | 125 | | | | 131 | | |
Zimmer Biomet Holdings, Inc. | |
5.75%, 11/30/39 | | | 50 | | | | 55 | | |
| | | | 18,549 | | |
Utilities (7.5%) | |
Alabama Power Co. | |
3.75%, 3/1/45 | | | 125 | | | | 113 | | |
Appalachian Power Co. | |
7.00%, 4/1/38 | | | 150 | | | | 194 | | |
Boston Gas Co. | |
4.49%, 2/15/42 (a) | | | 125 | | | | 128 | | |
CEZ AS | |
4.25%, 4/3/22 (a) | | | 200 | | | | 212 | | |
DTE Energy Co., | |
Series C | |
3.50%, 6/1/24 | | | 200 | | | | 203 | | |
Duke Energy Carolinas LLC | |
3.75%, 6/1/45 | | | 75 | | | | 71 | | |
Enel Finance International N.V. | |
6.00%, 10/7/39 (a) | | | 100 | | | | 114 | | |
Entergy Corp. | |
4.00%, 7/15/22 | | | 50 | | | | 52 | | |
Exelon Generation Co., LLC | |
6.25%, 10/1/39 | | | 145 | | | | 155 | | |
Jersey Central Power & Light Co. | |
4.70%, 4/1/24 (a)(b) | | | 200 | | | | 210 | | |
Nevada Power Co., | |
Series N | |
6.65%, 4/1/36 | | | 150 | | | | 191 | | |
Oncor Electric Delivery Co., LLC | |
2.95%, 4/1/25 (a) | | | 75 | | | | 72 | | |
Sempra Energy | |
6.00%, 10/15/39 | | | 125 | | | | 146 | | |
South Carolina Electric & Gas Co. | |
4.50%, 6/1/64 | | | 75 | | | | 72 | | |
TransAlta Corp. | |
4.50%, 11/15/22 | | | 235 | | | | 231 | | |
Virginia Electric & Power Co. | |
2.95%, 1/15/22 | | | 325 | | | | 328 | | |
WEC Energy Group, Inc. | |
3.55%, 6/15/25 | | | 75 | | | | 76 | | |
| | | | 2,568 | | |
| | | | 32,546 | | |
The accompanying notes are an integral part of the financial statements.
11
Morgan Stanley Institutional Fund Trust
Annual Report — September 30, 2015
Portfolio of Investments (cont'd)
Corporate Bond Portfolio
| | | Face
Amount
(000) | | Value
(000) | |
Sovereign (0.6%) | |
Sinopec Group Overseas Development 2015 Ltd. | |
2.50%, 4/28/20 (a) | | $ | 200 | | | $ | 197 | | |
Variable Rate Senior Loan Interests (0.5%) | |
Industrials (0.5%) | |
Aspect Software, Inc., | |
Term B | |
7.50%, 11/12/15 | | | 94 | | | | 92 | | |
Diamond Resorts Corp., | |
Term Loan | |
5.50%, 10/30/15 | | | 70 | | | | 70 | | |
| | | | 162 | | |
Total Fixed Income Securities (Cost $33,598) | | | 33,199 | | |
| | | Shares | | | |
Short-Term Investments (7.3%) | |
Securities held as Collateral on Loaned Securities (5.1%) | |
Investment Company (4.4%) | |
Morgan Stanley Institutional Liquidity
Funds — Money Market Portfolio —
Institutional Class (See Note G) | | | 1,511,169 | | | | 1,511 | | |
| | | Face
Amount
(000) | | | |
Repurchase Agreements (0.7%) | |
Barclays Capital, Inc., (0.10%,
dated 9/30/15, due 10/1/15; proceeds $127;
fully collateralized by a U.S. Government
obligation; 3.13% due 8/15/44;
valued at $129) | | $ | 127 | | | | 127 | | |
BNP Paribas Securities Corp., (0.09%, dated
9/30/15, due 10/1/15; proceeds $90; fully
collateralized by various U.S. Government
agency securities; 0.00% — 7.25% due
11/5/15 — 10/11/33 and U.S. Government
obligations; 0.00% — 1.88% due
10/15/15 — 9/30/17; valued at $92) | | | 90 | | | | 90 | | |
| | | | 217 | | |
Total Securities held as Collateral on Loaned
Securities (Cost $1,728) | | | 1,728 | | |
| | | Shares | | Value
(000) | |
Investment Company (1.2%) | |
Morgan Stanley Institutional Liquidity
Funds — Money Market Portfolio —
Institutional Class (See Note G)
(Cost $400) | | | 399,762 | | | $ | 400 | | |
| | | Face
Amount
(000) | | | |
U.S. Treasury Security (1.0%) | |
U.S. Treasury Bill | |
0.26%, 3/10/16 (d)(e)
(Cost $360) | | $ | 360 | | | | 360 | | |
Total Short-Term Investments (Cost $2,488) | | | 2,488 | | |
Total Investments (104.5%) (Cost $36,086)
Including $2,817 of Securities Loaned (f)(g) | | | 35,687 | | |
Liabilities in Excess of Other Assets (-4.5%) | | | (1,543 | ) | |
Net Assets (100.0%) | | $ | 34,144 | | |
(a) 144A security — Certain conditions for public sale may exist. Unless otherwise noted, these securities are deemed to be liquid.
(b) All or a portion of this security was on loan at September 30, 2015.
(c) Variable/Floating Rate Security — Interest rate changes on these instruments are based on changes in a designated base rate. The rates shown are those in effect on September 30, 2015.
(d) Rate shown is the yield to maturity at September 30, 2015.
(e) All or a portion of the security was pledged to cover margin requirements for futures contracts and swap agreements.
(f) Securities are available for collateral in connection with open futures contracts and swap agreements.
(g) At September 30, 2015, the aggregate cost for Federal income tax purposes is approximately $36,086,000. The aggregate gross unrealized appreciation is approximately $759,000 and the aggregate gross unrealized depreciation is approximately $1,158,000 resulting in net unrealized depreciation of approximately $399,000.
MTN Medium Term Note.
Futures Contracts:
The Portfolio had the following futures contracts open at September 30, 2015:
| | | Number
of
Contracts | | Value
(000) | | Expiration
Date | | Unrealized
Appreciation
(Depreciation)
(000) | |
Long: | |
U.S. Treasury 2 yr. Note | | | 24 | | | $ | 5,257 | | | Dec-15 | | $ | 8 | | |
U.S. Treasury 5 yr. Note | | | 19 | | | | 2,290 | | | Dec-15 | | | 17 | | |
U.S. Treasury Long Bond | | | 4 | | | | 629 | | | Dec-15 | | | 11 | | |
Short: | |
U.S. Treasury 10 yr. Note | | | 54 | | | | (6,952 | ) | | Dec-15 | | | (84 | ) | |
U.S. Treasury Ultra Long Bond | | | 6 | | | | (962 | ) | | Dec-15 | | | (13 | ) | |
| | | | | | | | | $ | (61 | ) | |
The accompanying notes are an integral part of the financial statements.
12
Morgan Stanley Institutional Fund Trust
Annual Report — September 30, 2015
Portfolio of Investments (cont'd)
Corporate Bond Portfolio
Credit Default Swap Agreements:
The Portfolio had the following credit default swap agreements open at September 30, 2015:
Swap Counterparty and
Reference Obligation | | Buy/Sell
Protection | | Notional
Amount
(000) | | Pay/Receive
Fixed Rate | | Termination
Date | | Upfront
Payment
Paid
(Received)
(000) | | Unrealized
Appreciation
(Depreciation)
(000) | | Value
(000) | | Credit
Rating of
Reference
Obligation†
(unaudited) | |
Barclays Bank PLC
Quest Diagnostics, Inc. | | Buy | | $ | 200 | | | | 1.00 | % | | 3/20/19 | | $ | 4 | | | $ | (7 | ) | | $ | (3 | ) | | BBB+ | |
Barclays Bank PLC
Yum! Brands, Inc. | | Buy | | | 200 | | | | 1.00 | | | 12/20/18 | | | (4 | ) | | | — | @ | | | (4 | ) | | BBB | |
Morgan Stanley & Co., LLC*
CDX.NA.HY.24 | | Buy | | | 173 | | | | 5.00 | | | 6/20/20 | | | (13 | ) | | | 8 | | | | (5 | ) | | NR | |
Morgan Stanley & Co., LLC*
CDX.NA.IG.24 | | Buy | | | 550 | | | | 1.00 | | | 6/20/20 | | | (10 | ) | | | 8 | | | | (2 | ) | | NR | |
| | | | | $ | 1,123 | | | | | | | $ | (23 | ) | | $ | 9 | | | $ | (14 | ) | | | |
Interest Rate Swap Agreements:
The Portfolio had the following interest rate swap agreements open at September 30, 2015:
Swap Counterparty | | Floating Rate
Index | | Pay/Receive
Floating Rate | | Fixed Rate | | Termination
Date | | Notional
Amount
(000) | | Unrealized
Depreciation
(000) | |
Morgan Stanley & Co., LLC* | | 3 Month LIBOR | | Receive | | | 1.59 | % | | 5/5/20 | | $ | 1,400 | | | $ | (25 | ) | |
Morgan Stanley & Co., LLC* | | 3 Month LIBOR | | Receive | | | 2.49 | | | 6/9/25 | | | 625 | | | | (32 | ) | |
| | | | | | | | | | | | | $ | (57 | ) | |
@ Value is less than $500.
† Credit rating as issued by Standard & Poor's.
* Cleared swap agreement, the broker is Morgan Stanley & Co., LLC.
LIBOR London Interbank Offered Rate.
NR Not rated.
Portfolio Composition**
Classification | | Percentage of
Total Investments | |
Industrials | | | 54.6 | % | |
Finance | | | 33.7 | | |
Utilities | | | 7.6 | | |
Other*** | | | 4.1 | | |
Total Investments | | | 100.0 | %**** | |
** Percentages indicated are based upon total investments (excluding Securities held as Collateral on Loaned Securities) as of September 30, 2015.
*** Industries and/or investment types representing less than 5% of total investments.
**** Does not include open long/short futures contracts with an underlying face amount of approximately $16,090,000 with net unrealized depreciation of approximately $61,000. Does not include open swap agreements with net unrealized depreciation of approximately $48,000.
The accompanying notes are an integral part of the financial statements.
13
Morgan Stanley Institutional Fund Trust
Annual Report — September 30, 2015
Statement of Assets and Liabilities | �� | September 30, 2015
(000) | |
Assets: | |
Investments in Securities of Unaffiliated Issuers, at Value(1) (Cost $34,175) | | $ | 33,776 | | |
Investment in Security of Affiliated Issuer, at Value (Cost $1,911) | | | 1,911 | | |
Total Investments in Securities, at Value (Cost $36,086) | | | 35,687 | | |
Interest Receivable | | | 364 | | |
Due from Adviser | | | 20 | | |
Premium Paid on Open Swap Agreements | | | 4 | | |
Receivable for Variation Margin on Futures Contracts | | | 4 | | |
Receivable for Investments Sold | | | 404 | | |
Receivable for Portfolio Shares Sold | | | 1 | | |
Receivable for Variation Margin on Swap Agreements | | | 1 | | |
Receivable from Affiliate | | | — | @ | |
Unrealized Appreciation on Swap Agreements | | | — | @ | |
Other Assets | | | 39 | | |
Total Assets | | | 36,524 | | |
Liabilities: | |
Collateral on Securities Loaned, at Value | | | 1,845 | | |
Bank overdraft | | | 285 | | |
Payable for Investments Purchased | | | 125 | | |
Payable for Portfolio Shares Redeemed | | | 35 | | |
Payable for Professional Fees | | | 24 | | |
Payable for Trustees' Fees and Expenses | | | 23 | | |
Payable for Custodian Fees | | | 7 | | |
Unrealized Depreciation on Swap Agreements | | | 7 | | |
Premium Received on Open Swap Agreements | | | 4 | | |
Payable for Transfer Agency Fees — Class I | | | 2 | | |
Payable for Transfer Agency Fees — Class A | | | 1 | | |
Payable for Transfer Agency Fees — Class L | | | — | @ | |
Payable for Transfer Agency Fees — Class C | | | — | @ | |
Payable for Sub Transfer Agency Fees — Class I | | | 2 | | |
Payable for Sub Transfer Agency Fees — Class A | | | — | @ | |
Payable for Sub Transfer Agency Fees — Class L | | | — | @ | |
Payable for Administration Fees | | | 2 | | |
Payable for Shareholder Services Fees — Class A | | | — | @ | |
Payable for Distribution and Shareholder Services Fees — Class L | | | 1 | | |
Payable for Distribution and Shareholder Services Fees — Class C | | | — | @ | |
Other Liabilities | | | 17 | | |
Total Liabilities | | | 2,380 | | |
Net Assets | | $ | 34,144 | | |
Net Assets Consist Of: | |
Paid-in-Capital | | $ | 90,366 | | |
Accumulated Undistributed Net Investment Income | | | 437 | | |
Accumulated Net Realized Loss | | | (56,151 | ) | |
Unrealized Appreciation (Depreciation) on: | |
Investments | | | (399 | ) | |
Futures Contracts | | | (61 | ) | |
Swap Agreements | | | (48 | ) | |
Net Assets | | $ | 34,144 | | |
The accompanying notes are an integral part of the financial statements.
14
Morgan Stanley Institutional Fund Trust
Annual Report — September 30, 2015
Statement of Assets and Liabilities (cont'd) | | September 30, 2015
(000) | |
CLASS I: | |
Net Assets | | $ | 31,427 | | |
| Shares Outstanding (unlimited number of shares authorized, no par value) (not in 000's) | | | 2,909,631 | | |
Net Asset Value, Offering and Redemption Price Per Share | | $ | 10.80 | | |
CLASS A: | |
Net Assets | | $ | 544 | | |
| Shares Outstanding (unlimited number of shares authorized, no par value) (not in 000's) | | | 50,316 | | |
Net Asset Value, Redemption Price Per Share | | $ | 10.81 | | |
Maximum Sales Load | | | 4.25 | % | |
Maximum Sales Charge | | $ | 0.48 | | |
Maximum Offering Price Per Share | | $ | 11.29 | | |
CLASS L: | |
Net Assets | | $ | 2,163 | | |
| Shares Outstanding (unlimited number of shares authorized, no par value) (not in 000's) | | | 200,430 | | |
Net Asset Value, Offering and Redemption Price Per Share | | $ | 10.79 | | |
CLASS C: | |
Net Assets | | $ | 10 | | |
| Shares Outstanding (unlimited number of shares authorized, no par value) (not in 000's) | | | 892 | | |
Net Asset Value, Offering and Redemption Price Per Share | | $ | 10.77 | | |
(1) Including:
Securities on Loan, at Value: | | $ | 2,817 | | |
@ Amount is less than $500.
The accompanying notes are an integral part of the financial statements.
15
Morgan Stanley Institutional Fund Trust
Annual Report — September 30, 2015
Statement of Operations | | Year Ended
September 30, 2015
(000) | |
Investment Income: | |
Interest from Securities of Unaffiliated Issuers | | $ | 1,518 | | |
Income from Securities Loaned — Net | | | 12 | | |
Dividends from Security of Affiliated Issuer (Note G) | | | 1 | | |
Total Investment Income | | | 1,531 | | |
Expenses: | |
Advisory Fees (Note B) | | | 143 | | |
Professional Fees | | | 105 | | |
Custodian Fees (Note F) | | | 41 | | |
Registration Fees | | | 41 | | |
Pricing Fees | | | 35 | | |
Administration Fees (Note C) | | | 30 | | |
Shareholder Services Fees — Class A (Note D) | | | 1 | | |
Distribution and Shareholder Services Fees — Class L (Note D) | | | 12 | | |
Distribution and Shareholder Services Fees — Class C (Note D) | | | — | @ | |
Transfer Agency Fees — Class I (Note E) | | | 8 | | |
Transfer Agency Fees — Class A (Note E) | | | 2 | | |
Transfer Agency Fees — Class L (Note E) | | | 2 | | |
Transfer Agency Fees — Class C (Note E) | | | 1 | | |
Shareholder Reporting Fees | | | 12 | | |
Sub Transfer Agency Fees — Class I | | | 2 | | |
Sub Transfer Agency Fees — Class A | | | 1 | | |
Sub Transfer Agency Fees — Class L | | | 1 | | |
Sub Transfer Agency Fees — Class C | | | 1 | | |
Trustees' Fees and Expenses | | | 2 | | |
Other Expenses | | | 18 | | |
Total Expenses | | | 458 | | |
Waiver of Advisory Fees (Note B) | | | (143 | ) | |
Expenses Reimbursed by Adviser (Note B) | | | (17 | ) | |
Reimbursement of Class Specific Expenses — Class I (Note B) | | | (10 | ) | |
Reimbursement of Class Specific Expenses — Class A (Note B) | | | (2 | ) | |
Reimbursement of Class Specific Expenses — Class C (Note B) | | | (1 | ) | |
Rebate from Morgan Stanley Affiliate (Note G) | | | (1 | ) | |
Waiver of Shareholder Servicing Fees — Class A (Note D) | | | (1 | ) | |
Net Expenses | | | 283 | | |
Net Investment Income | | | 1,248 | | |
Realized Gain (Loss): | |
Investments Sold | | | 805 | | |
Foreign Currency Transactions | | | (— | @) | |
Futures Contracts | | | 254 | | |
Swap Agreements | | | (325 | ) | |
Net Realized Gain | | | 734 | | |
Change in Unrealized Appreciation (Depreciation): | |
Investments | | | (1,699 | ) | |
Futures Contracts | | | (107 | ) | |
Swap Agreements | | | (132 | ) | |
Net Change in Unrealized Appreciation (Depreciation) | | | (1,938 | ) | |
Net Realized Gain and Change in Unrealized Appreciation (Depreciation) | | | (1,204 | ) | |
Net Increase in Net Assets Resulting from Operations | | $ | 44 | | |
@ Amount is less than $500.
The accompanying notes are an integral part of the financial statements.
16
Morgan Stanley Institutional Fund Trust
Annual Report — September 30, 2015
Statements of Changes in Net Assets | | Year Ended
September 30, 2015
(000) | | Year Ended
September 30, 2014
(000) | |
Increase (Decrease) in Net Assets: | |
Operations: | |
Net Investment Income | | $ | 1,248 | | | $ | 1,366 | | |
Net Realized Gain | | | 734 | | | | 1,225 | | |
Net Change in Unrealized Appreciation (Depreciation) | | | (1,938 | ) | | | 751 | | |
Net Increase in Net Assets Resulting from Operations | | | 44 | | | | 3,342 | | |
Distributions from and/or in Excess of: | |
Class I: | |
Net Investment Income | | | (1,021 | ) | | | (1,066 | ) | |
Class A: | |
Net Investment Income | | | (14 | ) | | | (33 | ) | |
Class L: | |
Net Investment Income | | | (54 | ) | | | (59 | ) | |
Class C: | |
Net Investment Income | | | (— | @)* | | | — | | |
Total Distributions | | | (1,089 | ) | | | (1,158 | ) | |
Capital Share Transactions:(1) | |
Class I: | |
Subscribed | | | 2,961 | | | | 3,095 | | |
Distributions Reinvested | | | 1,021 | | | | 1,066 | | |
Redeemed | | | (8,193 | ) | | | (5,724 | ) | |
Class A: | |
Subscribed | | | 427 | | | | 700 | | |
Distributions Reinvested | | | 12 | | | | 31 | | |
Redeemed | | | (281 | ) | | | (1,596 | ) | |
Class L: | |
Subscribed | | | 108 | | | | 23 | | |
Distributions Reinvested | | | 54 | | | | 59 | | |
Redeemed | | | (338 | ) | | | (459 | ) | |
Class C: | |
Subscribed | | | 10 | * | | | — | | |
Net Decrease in Net Assets Resulting from Capital Share Transactions | | | (4,219 | ) | | | (2,805 | ) | |
Total Decrease in Net Assets | | | (5,264 | ) | | | (621 | ) | |
Net Assets: | |
Beginning of Period | | | 39,408 | | | | 40,029 | | |
End of Period (Including Accumulated Undistributed Net Investment Income of $437 and $466) | | $ | 34,144 | | | $ | 39,408 | | |
(1) Capital Share Transactions: | |
Class I: | |
Shares Subscribed | | | 266 | | | | 282 | | |
Shares Issued on Distributions Reinvested | | | 92 | | | | 100 | | |
Shares Redeemed | | | (740 | ) | | | (527 | ) | |
Net Decrease in Class I Shares Outstanding | | | (382 | ) | | | (145 | ) | |
Class A: | |
Shares Subscribed | | | 38 | | | | 64 | | |
Shares Issued on Distributions Reinvested | | | 1 | | | | 3 | | |
Shares Redeemed | | | (25 | ) | | | (144 | ) | |
Net Increase (Decrease) in Class A Shares Outstanding | | | 14 | | | | (77 | ) | |
Class L: | |
Shares Subscribed | | | 10 | | | | 2 | | |
Shares Issued on Distributions Reinvested | | | 5 | | | | 6 | | |
Shares Redeemed | | | (31 | ) | | | (43 | ) | |
Net Decrease in Class L Shares Outstanding | | | (16 | ) | | | (35 | ) | |
Class C: | |
Shares Subscribed | | | 1 | * | | | — | | |
* For the period April 30, 2015 through September 30, 2015.
@ Amount is less than $500.
The accompanying notes are an integral part of the financial statements.
17
Morgan Stanley Institutional Fund Trust
Annual Report — September 30, 2015
Financial Highlights
Corporate Bond Portfolio
| | | Class I | |
| | | Year Ended September 30, | |
Selected Per Share Data and Ratios | | 2015 | | 2014 | | 2013 | | 2012 | | 2011 | |
Net Asset Value, Beginning of Period | | $ | 11.12 | | | $ | 10.53 | | | $ | 10.93 | | | $ | 10.27 | | | $ | 10.17 | | |
Income (Loss) from Investment Operations: | |
Net Investment Income† | | | 0.37 | | | | 0.38 | | | | 0.32 | | | | 0.36 | | | | 0.33 | | |
Net Realized and Unrealized Gain (Loss) | | | (0.37 | ) | | | 0.53 | | | | (0.40 | ) | | | 0.73 | | | | 0.07 | | |
Total from Investment Operations | | | — | | | | 0.91 | | | | (0.08 | ) | | | 1.09 | | | | 0.40 | | |
Distributions from and/or in Excess of: | |
Net Investment Income | | | (0.32 | ) | | | (0.32 | ) | | | (0.32 | ) | | | (0.43 | ) | | | (0.30 | ) | |
Net Asset Value, End of Period | | $ | 10.80 | | | $ | 11.12 | | | $ | 10.53 | | | $ | 10.93 | | | $ | 10.27 | | |
Total Return++ | | | (0.04 | )% | | | 8.79 | % | | | (0.77 | )% | | | 10.94 | % | | | 4.05 | % | |
Ratios and Supplemental Data: | |
Net Assets, End of Period (Thousands) | | $ | 31,427 | | | $ | 36,598 | | | $ | 36,186 | | | $ | 44,779 | | | $ | 62,410 | | |
Ratio of Expenses to Average Net Assets (1) | | | 0.70 | %+ | | | 0.70 | %+ | | | 1.18 | %+^ | | | 1.00 | %+ | | | 0.80 | %+ | |
Ratio of Net Investment Income to Average Net Assets (1) | | | 3.33 | %+ | | | 3.47 | %+ | | | 2.91 | %+^ | | | 3.41 | %+ | | | 3.27 | %+ | |
Ratio of Rebate from Morgan Stanley Affiliates to Average Net Assets | | | 0.00 | %§ | | | 0.00 | %§ | | | 0.00 | %§ | | | 0.00 | %§ | | | 0.00 | %§ | |
Portfolio Turnover Rate | | | 45 | % | | | 50 | % | | | 63 | % | | | 129 | % | | | 224 | % | |
(1) Supplemental Information on the Ratios to Average Net Assets: | |
Ratios Before Expense Limitation: | |
Expenses to Average Net Assets | | | 1.15 | % | | | 1.13 | % | | | 1.21 | % | | | N/A | | | | N/A | | |
Net Investment Income to Average Net Assets | | | 2.88 | % | | | 3.04 | % | | | 2.88 | % | | | N/A | | | | N/A | | |
† Per share amount is based on average shares outstanding.
++ Calculated based on the net asset value as of the last business day of the period.
+ The Ratios of Expenses and Net Investment Income reflect the rebate of certain Portfolio expenses in connection with the investments in Morgan Stanley affiliates during the period. The effect of the rebate on the ratios is disclosed in the above table as "Ratio of Rebate from Morgan Stanley Affiliates to Average Net Assets."
§ Amount is less than 0.005%.
^ Effective September 16, 2013, the Adviser has agreed to limit the ratio of expenses to average net assets to the maximum ratio of 0.70% for Class I shares.
The accompanying notes are an integral part of the financial statements.
18
Morgan Stanley Institutional Fund Trust
Annual Report — September 30, 2015
Financial Highlights
Corporate Bond Portfolio
| | | Class A | |
| | | Year Ended September 30, | |
Selected Per Share Data and Ratios | | 2015 | | 2014 | | 2013 | | 2012 | | 2011 | |
Net Asset Value, Beginning of Period | | $ | 11.12 | | | $ | 10.53 | | | $ | 10.92 | | | $ | 10.27 | | | $ | 10.16 | | |
Income (Loss) from Investment Operations: | |
Net Investment Income† | | | 0.33 | | | | 0.34 | | | | 0.30 | | | | 0.34 | | | | 0.31 | | |
Net Realized and Unrealized Gain (Loss) | | | (0.37 | ) | | | 0.53 | | | | (0.39 | ) | | | 0.73 | | | | 0.08 | | |
Total from Investment Operations | | | (0.04 | ) | | | 0.87 | | | | (0.09 | ) | | | 1.07 | | | | 0.39 | | |
Distributions from and/or in Excess of: | |
Net Investment Income | | | (0.27 | ) | | | (0.28 | ) | | | (0.30 | ) | | | (0.42 | ) | | | (0.28 | ) | |
Net Asset Value, End of Period | | $ | 10.81 | | | $ | 11.12 | | | $ | 10.53 | | | $ | 10.92 | | | $ | 10.27 | | |
Total Return++ | | | (0.37 | )% | | | 8.43 | % | | | (0.83 | )% | | | 10.69 | % | | | 3.99 | % | |
Ratios and Supplemental Data: | |
Net Assets, End of Period (Thousands) | | $ | 544 | | | $ | 405 | | | $ | 1,194 | | | $ | 961 | | | $ | 408 | | |
Ratio of Expenses to Average Net Assets (1) | | | 1.05 | %+ | | | 1.05 | %+ | | | 1.34 | %+^ | | | 1.15 | %+ | | | 0.95 | %+ | |
Ratio of Net Investment Income to Average Net Assets (1) | | | 2.98 | %+ | | | 3.12 | %+ | | | 2.76 | %+^ | | | 3.26 | %+ | | | 3.12 | %+ | |
Ratio of Rebate from Morgan Stanley Affiliates to Average Net Assets | | | 0.00 | %§ | | | 0.00 | %§ | | | 0.00 | %§ | | | 0.00 | %§ | | | 0.00 | %§ | |
Portfolio Turnover Rate | | | 45 | % | | | 50 | % | | | 63 | % | | | 129 | % | | | 224 | % | |
(1) Supplemental Information on the Ratios to Average Net Assets: | |
Ratios Before Expense Limitation: | |
Expenses to Average Net Assets | | | 1.88 | % | | | 1.60 | % | | | 1.47 | % | | | 1.25 | % | | | 1.05 | % | |
Net Investment Income to Average Net Assets | | | 2.15 | % | | | 2.57 | % | | | 2.63 | % | | | 3.16 | % | | | 3.02 | % | |
† Per share amount is based on average shares outstanding.
++ Calculated based on the net asset value which does not reflect sales charges, if applicable, as of the last business day of the period.
+ The Ratios of Expenses and Net Investment Income reflect the rebate of certain Portfolio expenses in connection with the investments in Morgan Stanley affiliates during the period. The effect of the rebate on the ratios is disclosed in the above table as "Ratio of Rebate from Morgan Stanley Affiliates to Average Net Assets."
^ Effective September 16, 2013, the Adviser has agreed to limit the ratio of expenses to average net assets to the maximum ratio of 1.05% for Class A shares.
§ Amount is less than 0.005%.
The accompanying notes are an integral part of the financial statements.
19
Morgan Stanley Institutional Fund Trust
Annual Report — September 30, 2015
Financial Highlights
Corporate Bond Portfolio
| | | Class L | |
| | | Year Ended September 30, | |
Selected Per Share Data and Ratios | | 2015 | | 2014 | | 2013 | | 2012 | | 2011 | |
Net Asset Value, Beginning of Period | | $ | 11.11 | | | $ | 10.52 | | | $ | 10.92 | | | $ | 10.26 | | | $ | 10.15 | | |
Income (Loss) from Investment Operations: | |
Net Investment Income† | | | 0.30 | | | | 0.31 | | | | 0.26 | | | | 0.30 | | | | 0.28 | | |
Net Realized and Unrealized Gain (Loss) | | | (0.37 | ) | | | 0.54 | | | | (0.40 | ) | | | 0.74 | | | | 0.08 | | |
Total from Investment Operations | | | (0.07 | ) | | | 0.85 | | | | (0.14 | ) | | | 1.04 | | | | 0.36 | | |
Distributions from and/or in Excess of: | |
Net Investment Income | | | (0.25 | ) | | | (0.26 | ) | | | (0.26 | ) | | | (0.38 | ) | | | (0.25 | ) | |
Net Asset Value, End of Period | | $ | 10.79 | | | $ | 11.11 | | | $ | 10.52 | | | $ | 10.92 | | | $ | 10.26 | | |
Total Return++ | | | (0.65 | )% | | | 8.15 | % | | | (1.28 | )% | | | 10.38 | % | | | 3.51 | % | |
Ratios and Supplemental Data: | |
Net Assets, End of Period (Thousands) | | $ | 2,163 | | | $ | 2,405 | | | $ | 2,649 | | | $ | 3,149 | | | $ | 4,080 | | |
Ratio of Expenses to Average Net Assets (1) | | | 1.31 | %+ | | | 1.30 | %+ | | | 1.69 | %+^ | | | 1.50 | %+ | | | 1.30 | %+ | |
Ratio of Net Investment Income to Average Net Assets (1) | | | 2.72 | %+ | | | 2.87 | %+ | | | 2.40 | %+^ | | | 2.91 | %+ | | | 2.77 | %+ | |
Ratio of Rebate from Morgan Stanley Affiliates to Average Net Assets | | | 0.00 | %§ | | | 0.00 | %§ | | | 0.00 | %§ | | | 0.00 | %§ | | | 0.00 | %§ | |
Portfolio Turnover Rate | | | 45 | % | | | 50 | % | | | 63 | % | | | 129 | % | | | 224 | % | |
(1) Supplemental Information on the Ratios to Average Net Assets: | |
Ratios Before Expense Limitation: | |
Expenses to Average Net Assets | | | 1.73 | % | | | 1.66 | % | | | 1.70 | % | | | N/A | | | | N/A | | |
Net Investment Income to Average Net Assets | | | 2.30 | % | | | 2.51 | % | | | 2.39 | % | | | N/A | | | | N/A | | |
† Per share amount is based on average shares outstanding.
++ Calculated based on the net asset value as of the last business day of the period.
+ The Ratios of Expenses and Net Investment Income reflect the rebate of certain Portfolio expenses in connection with the investments in Morgan Stanley affiliates during the period. The effect of the rebate on the ratios is disclosed in the above table as "Ratio of Rebate from Morgan Stanley Affiliates to Average Net Assets."
^ Effective September 16, 2013, the Adviser has agreed to limit the ratio of expenses to average net assets to the maximum ratio of 1.52% for Class L shares.
§ Amount is less than 0.005%.
The accompanying notes are an integral part of the financial statements.
20
Morgan Stanley Institutional Fund Trust
Annual Report — September 30, 2015
Financial Highlights
Corporate Bond Portfolio
| | | Class C | |
Selected Per Share Data and Ratios | | Period from April 30, 2015^
to September 30, 2015 | |
Net Asset Value, Beginning of Period | | $ | 11.21 | | |
Income (Loss) from Investment Operations: | |
Net Investment Income† | | | 0.10 | | |
Net Realized and Unrealized Loss | | | (0.48 | ) | |
Total from Investment Operations | | | (0.38 | ) | |
Distributions from and/or in Excess of: | |
Net Investment Income | | | (0.06 | ) | |
Net Asset Value, End of Period | | $ | 10.77 | | |
Total Return++ | | | (3.40 | )%# | |
Ratios and Supplemental Data: | |
Net Assets, End of Period, (Thousands) | | $ | 10 | | |
Ratios of Expenses to Average Net Assets Excluding Non Operating Expenses (1) | | | 1.80 | %+* | |
Ratio of Net Investment Income to Average Net Assets (1) | | | 2.25 | %+* | |
Ratio of Rebate from Morgan Stanley Affiliates to Average Net Assets | | | 0.00 | %§* | |
Portfolio Turnover Rate | | | 45 | %# | |
(1) Supplemental Information on the Ratios to Average Net Assets: | |
Ratios Before Expense Limitation: | |
Expense to Average Net Assets | | | 38.20 | %* | |
Net Investment Loss to Average Net Assets | | | (34.15 | )%* | |
^ Commencement of Operations.
† Per share amount is based on average shares outstanding.
++ Calculated based on the net asset value which does not reflect sales charges, if applicable, as of the last business day of the period.
+ The Ratios of Expenses and Net Investment Income reflect the rebate of certain Portfolio expenses in connection with the investments in Morgan Stanley affiliates during the period. The effect of the rebate on the ratios is disclosed in the above table as "Ratio of Rebate from Morgan Stanley Affiliates to Average Net Assets."
§ Amount is less than 0.005%.
# Not Annualized.
* Annualized.
The accompanying notes are an integral part of the financial statements.
21
Morgan Stanley Institutional Fund Trust
Annual Report — September 30, 2015
Notes to Financial Statements
Morgan Stanley Institutional Fund Trust ("MSIFT'' or the "Fund'') is registered under the Investment Company Act of 1940, as amended (the "Act''), as an open-end management investment company. The Fund is comprised of nine separate, active portfolios (individually referred to as a "Portfolio", collectively as the "Portfolios"). The Fund applies investment company accounting and reporting guidance. All Portfolios are considered diversified for purposes of the Act.
The accompanying financial statements relate to the Corporate Bond Portfolio. The Portfolio seeks above-average total return over a market cycle of three to five years. The Portfolio offers four classes of shares — Class I, Class A, Class L and Class C.
On April 30, 2015, the Portfolio commenced offering Class C shares.
A. Significant Accounting Policies: The following significant accounting policies are in conformity with U.S. generally accepted accounting principles ("GAAP"). Such policies are consistently followed by the Fund in the preparation of its financial statements. GAAP may require management to make estimates and assumptions that affect the reported amounts and disclosures in the financial statements. Actual results may differ from those estimates.
1. Security Valuation: (1) Certain portfolio securities may be valued by an outside pricing service approved by the Fund's Board of Trustees (the "Trustees"). The pricing service may utilize a matrix system or other model incorporating attributes such as security quality, maturity and coupon as the evaluation model parameters, and/or research evaluations by its staff, including review of broker-dealer market price quotations in determining what it believes is the fair valuation of the portfolios securities valued by such pricing service; (2) certain senior collateralized loans ("Senior Loans") are valued based on quotations received from an independent pricing service; (3) futures are valued at the latest price published by the commodities exchange on which they trade; (4) swaps are marked-to-market daily based upon quotations from market makers; (5) when market quotations are not readily available, including circumstances under which Morgan Stanley Investment Management Inc. (the "Adviser") determines that the closing price, last sale price or the mean between the last reported bid and asked prices are not reflective of a security's market value, portfolio securities are valued at their fair value as determined in good faith under procedures established by and under the general supervision of the Trustees. Occasionally, developments affecting the
closing prices of securities and other assets may occur between the times at which valuations of such securities are determined (that is, close of the foreign market on which the securities trade) and the close of business of the New York Stock Exchange ("NYSE"). If developments occur during such periods that are expected to materially affect the value of such securities, such valuations may be adjusted to reflect the estimated fair value of such securities as of the close of the NYSE, as determined in good faith by the Trustees or by the Adviser using a pricing service and/or procedures approved by the Trustees; (6) investments in mutual funds, including the Morgan Stanley Institutional Liquidity Funds, are valued at the net asset value ("NAV") as of the close of each business day; and (7) short-term taxable debt securities with remaining maturities of 60 days or less at the time of purchase may be valued at amortized cost, unless the Adviser determines such price does not reflect the securities' market value, in which case these securities will be valued at their fair market value determined by the Adviser. Other taxable short-term debt securities with maturities of more than 60 days will be valued on a mark-to-market basis until such time as they reach a maturity of 60 days, whereupon they will be valued at amortized cost using their value on the 61st day unless the Adviser determines such price does not reflect the securities' fair value, in which case these securities will be valued at their fair market value as determined by the Adviser.
The Trustees have responsibility for determining in good faith the fair value of the investments, and the Trustees may appoint others, such as the Fund's Adviser or a valuation committee, to assist the Trustees in determining fair value and to make the actual calculations pursuant to the fair valuation methodologies previously approved by the Trustees. Under procedures approved by the Trustees, the Fund's Adviser has formed a Valuation Committee whose members are approved by the Trustees. The Valuation Committee provides administration and oversight of the Fund's valuation policies and procedures, which are reviewed at least annually by the Trustees. These procedures allow the Fund to utilize independent pricing services, quotations from securities and financial instrument dealers, and other market sources to determine fair value.
The Fund has procedures to determine the fair value of securities and other financial instruments for which
22
Morgan Stanley Institutional Fund Trust
Annual Report — September 30, 2015
Notes to Financial Statements (cont'd)
market prices are not readily available. Under these procedures, the Valuation Committee convenes on a regular and ad hoc basis to review such securities and considers a number of factors, including valuation methodologies and significant unobservable valuation inputs, when arriving at fair value. The Valuation Committee may employ a market-based approach which may use related or comparable assets or liabilities, recent transactions, market multiples, book values, and other relevant information for the investment to determine the fair value of the investment. An income-based valuation approach may also be used in which the anticipated future cash flows of the investment are discounted to calculate fair value. Discounts may also be applied due to the nature or duration of any restrictions on the disposition of the investments. Due to the inherent uncertainty of valuations of such investments, the fair values may differ significantly from the values that would have been used had an active market existed. The Valuation Committee employs various methods for calibrating these valuation approaches including a regular review of valuation methodologies, key inputs and assumptions, transactional back-testing or disposition analysis, and reviews of any related market activity.
2. Fair Value Measurement: Financial Accounting Standards Board ("FASB") Accounting Standards CodificationTM ("ASC") 820, "Fair Value Measurement" ("ASC 820"), defines fair value as the value that the Fund would receive to sell an investment or pay to transfer a liability in a timely transaction with an independent buyer in the principal market, or in the absence of a principal market the most advantageous market for the investment or liability. ASC 820 establishes a three-tier hierarchy to distinguish between (1) inputs that reflect the assumptions market participants would use in valuing an asset or liability developed based on market data obtained from sources independent of the reporting entity (observable inputs) and (2) inputs that reflect the reporting entity's own assumptions about the assumptions market participants would use in valuing an asset or liability developed based on the best information available in the circumstances (unobservable inputs) and to establish classification of fair value measurements for disclosure purposes. Various inputs are used in determining the value of the Fund's investments. The inputs are summarized in the three broad levels listed below.
• Level 1 – unadjusted quoted prices in active markets for identical investments
• Level 2 – other significant observable inputs (including quoted prices for similar investments, interest rates, prepayment speeds, credit risk, etc.)
• Level 3 – significant unobservable inputs including the Fund's own assumptions in determining the fair value of investments. Factors considered in making this determination may include, but are not limited to, information obtained by contacting the issuer, analysts, or the appropriate stock exchange (for exchange-traded securities), analysis of the issuer's financial statements or other available documents and, if necessary, available information concerning other securities in similar circumstances
The inputs or methodology used for valuing securities are not necessarily an indication of the risk associated with investing in those securities and the determination of the significance of a particular input to the fair value measurement in its entirety requires judgment and considers factors specific to each security.
The following is a summary of the inputs used to value the Portfolio's investments as of September 30, 2015.
Investment Type | | Level 1
Unadjusted
quoted
prices
(000) | | Level 2
Other
significant
observable
inputs
(000) | | Level 3
Significant
unobservable
inputs
(000) | | Total
(000) | |
Assets: | |
Fixed Income Securities | |
Asset-Backed Securities | | $ | — | | | $ | 294 | | | $ | — | | | $ | 294 | | |
Corporate Bonds | | | — | | | | 32,546 | | | | — | | | | 32,546 | | |
Sovereign | | | — | | | | 197 | | | | — | | | | 197 | | |
Variable Rate Senior
Loan Interests | | | — | | | | 162 | | | | — | | | | 162 | | |
Total Fixed Income
Securities | | | — | | | | 33,199 | | | | — | | | | 33,199 | | |
Short-Term Investments | |
Investment Company | | | 1,911 | | | | — | | | | — | | | | 1,911 | | |
Repurchase Agreements | | | — | | | | 217 | | | | — | | | | 217 | | |
U.S Treasury Security | | | — | | | | 360 | | | | — | | | | 360 | | |
Total Short-Term
Investments | | | 1,911 | | | | 577 | | | | — | | | | 2,488 | | |
Futures Contracts | | | 36 | | | | — | | | | — | | | | 36 | | |
Credit Default Swap
Agreements | | | — | | | | 16 | | | | — | | | | 16 | | |
Total Assets | | | 1,947 | | | | 33,792 | | | | — | | | | 35,739 | | |
23
Morgan Stanley Institutional Fund Trust
Annual Report — September 30, 2015
Notes to Financial Statements (cont'd)
Investment Type | | Level 1
Unadjusted
quoted
prices
(000) | | Level 2
Other
significant
observable
inputs
(000) | | Level 3
Significant
unobservable
inputs
(000) | | Total
(000) | |
Liabilities: | |
Futures Contracts | | $ | (97 | ) | | $ | — | | | $ | — | | | $ | (97 | ) | |
Credit Default Swap
Agreement | | | — | | | | (7 | ) | | | — | | | | (7 | ) | |
Interest Rate Swap
Agreements | | | — | | | | (57 | ) | | | — | | | | (57 | ) | |
Total Liabilities | | | (97 | ) | | | (64 | ) | | | — | | | | (161 | ) | |
Total | | $ | 1,850 | | | $ | 33,728 | | | $ | — | | | $ | 35,578 | | |
Transfers between investment levels may occur as the markets fluctuate and/or the availability of data used in an investment's valuation changes. The Portfolio recognizes transfers between the levels as of the end of the period. As of September 30, 2015, the Portfolio did not have any investments transfer between investment levels.
3. Repurchase Agreements: The Portfolio may enter into repurchase agreements under which the Portfolio lends cash and takes possession of securities with an agreement that the counterparty will repurchase such securities. In connection with transactions in repurchase agreements, a bank as custodian for the Portfolio takes possession of the underlying securities which are held as collateral, with a market value at least equal to the amount of the repurchase transaction, including principal and accrued interest. To the extent that any repurchase transaction exceeds one business day, the value of the collateral is marked-to-market on a daily basis to determine that the value of the collateral does not decrease below the repurchase price plus accrued interest as earned. If such a decrease occurs, additional collateral will be requested and, when received, will be added to the account to maintain full collateralization. In the event of default on the obligation to repurchase, the Portfolio has the right to liquidate the collateral and apply the proceeds in satisfaction of the obligation. In the event of default or bankruptcy by the counterparty to the agreement, realization of the collateral proceeds may be subject to cost and delays. The Portfolio, along with other affiliated investment companies, may utilize a joint trading account for the purpose of entering into repurchase agreements.
4. Derivatives: The Portfolio may, but is not required to, use derivative instruments for a variety of purposes, including hedging, risk management, portfolio management or to earn income. Derivatives are financial instruments
whose value is based, in part, on the value of an underlying asset, interest rate, index or financial instrument. Prevailing interest rates and volatility levels, among other things, also affect the value of derivative instruments. A derivative instrument often has risks similar to its underlying asset and may have additional risks, including imperfect correlation between the value of the derivative and the underlying asset, risks of default by the counterparty to certain transactions, magnification of losses incurred due to changes in the market value of the securities, instruments, indices or interest rates to which the derivative instrument relates, risks that the transactions may not be liquid and risks arising from margin requirements. The use of derivatives involves risks that are different from, and possibly greater than, the risks associated with other portfolio investments. Derivatives may involve the use of highly specialized instruments that require investment techniques and risk analyses different from those associated with other portfolio investments. All of the Portfolio's holdings, including derivative instruments, are marked-to-market each day with the change in value reflected in unrealized appreciation (depreciation). Upon disposition, a realized gain or loss is recognized.
Certain derivative transactions may give rise to a form of leverage. Leverage magnifies the potential for gain and the risk of loss. Leverage associated with derivative transactions may cause the Portfolio to liquidate portfolio positions when it may not be advantageous to do so to satisfy its obligations or to meet earmarking or segregation requirements, pursuant to applicable Securities and Exchange Commission rules and regulations, or may cause the Portfolio to be more volatile than if the Portfolio had not been leveraged. Although the Adviser seeks to use derivatives to further the Portfolio's investment objectives, there is no assurance that the use of derivatives will achieve this result.
Following is a description of the derivative instruments and techniques that the Portfolio used during the period and their associated risks:
Futures: A futures contract is a standardized, exchange-traded agreement to buy or sell a specific quantity of an underlying asset, reference rate or index at a specific price at a specific future time. The value of a futures contract tends to increase and decrease in tandem with the value of the underlying instrument. Depending on the terms of the particular contract, futures contracts are
24
Morgan Stanley Institutional Fund Trust
Annual Report — September 30, 2015
Notes to Financial Statements (cont'd)
settled through either physical delivery of the underlying instrument on the settlement date or by payment of a cash settlement amount on the settlement date. During the period the futures contract is open, payments are received from or made to the broker based upon changes in the value of the contract (the variation margin). A decision as to whether, when and how to use futures contracts involves the exercise of skill and judgment and even a well-conceived futures transaction may be unsuccessful because of market behavior or unexpected events. In addition to the derivatives risks discussed above, the prices of futures contracts can be highly volatile, using futures contracts can lower total return, and the potential loss from futures contracts can exceed the Portfolio's initial investment in such contracts. No assurance can be given that a liquid market will exist for any particular futures contract at any particular time. There is also the risk of loss by the Portfolio of margin deposits in the event of bankruptcy of a broker with which the Portfolio has open positions in the futures contract.
Swaps: The Portfolio may enter into over-the-counter ("OTC") swap contracts or cleared swap transactions. A swap contract is an agreement between two parties pursuant to which the parties exchange payments at specified dates on the basis of a specified notional amount, with the payments calculated by reference to specified securities, indices, reference rates, currencies or other instruments. Typically swap agreements provide that when the period payment dates for both parties are the same, the payments are made on a net basis (i.e., the two payment streams are netted out, with only the net amount paid by one party to the other). The Portfolio's obligations or rights under a swap contract entered into on a net basis will generally be equal only to the net amount to be paid or received under the agreement, based on the relative values of the positions held by each party. Cleared swap transactions may help reduce counterparty credit risk. In a cleared swap, the Portfolio's ultimate counterparty is a clearinghouse rather than a swap dealer, bank or other financial institution. OTC swap agreements are not entered into or traded on exchanges and often there is no central clearing or guaranty function for OTC swaps. These OTC swaps are often subject to credit risk or the risk of default or non-performance by the counterparty. Both OTC and cleared swaps could result in losses if interest rates, foreign currency
exchange rates or other factors are not correctly anticipated by the Portfolio or if the reference index, security or investments do not perform as expected. During the period swap agreements are open, payments are received from or made to the clearinghouse or counterparty based upon changes in the value of the contract (variation margin). The Dodd-Frank Wall Street Reform and Consumer Protection Act and related regulatory developments require the clearing and exchange-trading of certain standardized swap transactions. Mandatory exchange-trading and clearing is occurring on a phased-in basis.
The Portfolio's use of swaps during the period included those based on the credit of an underlying security commonly referred to as "credit default swaps." The Portfolio may be either the buyer or seller in a credit default swap. Where the Portfolio is the buyer of a credit default swap contract, it would typically be entitled to receive the par (or other agreed-upon) value of a referenced debt obligation from the counterparty to the contract only in the event of a default or similar event by the issuer of the debt obligation. If no default occurs, the Portfolio would have paid to the counterparty a periodic stream of payments over the term of the contract and received no benefit from the contract. When the Portfolio is the seller of a credit default swap contract, it typically receives the stream of payments but is obligated to pay an amount equal to the par (or other agreed-upon) value of a referenced debt obligation upon the default or similar event by the issuer of the referenced debt obligation. The use of credit default swaps could result in losses to the Portfolio if the Adviser fails to correctly evaluate the creditworthiness of the issuer of the referenced debt obligation.
If the Portfolio is a seller of protection and a credit event occurs, as defined under the terms of that particular swap agreement, the Portfolio will either (i) pay to the buyer of protection an amount equal to the notional amount of the swap agreement and take delivery of the referenced obligation, other deliverable obligations or underlying securities comprising the referenced index or (ii) pay a net settlement amount in the form of cash or securities equal to the notional amount of the swap agreement less the recovery value of the referenced obligation or underlying securities comprising the referenced index. If the Portfolio is a buyer of protection and
25
Morgan Stanley Institutional Fund Trust
Annual Report — September 30, 2015
Notes to Financial Statements (cont'd)
a credit event occurs, as defined under the terms of that particular swap agreement, the Portfolio will either (i) receive from the seller of protection an amount equal to the notional amount of the swap agreement and deliver the referenced obligation, other deliverable obligations or underlying securities comprising the referenced index or (ii) receive a net settlement amount in the form of cash or securities equal to the notional amount of the swap agreement less the recovery value of the referenced obligation or underlying securities comprising the referenced index. Recovery values are estimated by market makers considering either industry standard recovery rates or entity specific factors and considerations until a credit event occurs. If a credit event has occurred, the recovery value is determined by a facilitated auction whereby a minimum number of allowable broker bids, together with a specified valuation method, are used to calculate the settlement value. The Portfolio's maximum risk of loss from counterparty risk, either as the protection seller or as the protection buyer, is the fair value of the swap agreement.
The current credit rating of each individual issuer is listed in the table following the Portfolio of Investments and serves as an indicator of the current status of the payment/performance risk of the credit derivative. Alternatively, for credit default swaps on an index of credits, the quoted market prices and current values serve as an indicator of the current status of the payment/performance risk of the credit derivative. Generally, lower credit ratings and increasing market values, in absolute terms, represent a deterioration of the credit and a greater likelihood of an adverse credit event of the issuer.
When the Portfolio has an unrealized loss on a swap agreement, the Portfolio has instructed the custodian to pledge cash or liquid securities as collateral with a value approximately equal to the amount of the unrealized loss. Collateral pledges are monitored and subsequently adjusted if and when the swap valuations fluctuate. If applicable, cash collateral is included with "Due from (to) Broker" in the Statement of Assets and Liabilities.
Upfront payments received or paid by the Portfolio will be reflected as an asset or liability, respectively, in the Statement of Assets and Liabilities.
FASB ASC 815, "Derivatives and Hedging" ("ASC 815"), is intended to improve financial reporting about derivative instruments by requiring enhanced disclosures to enable investors to better understand how and why the Portfolio uses derivative instruments, how these derivative instruments are accounted for and their effects on the Portfolio's financial position and results of operations.
The following tables set forth the fair value of the Portfolio's derivative contracts by primary risk exposure as of September 30, 2015.
| | | Asset Derivatives
Statement of Assets and
Liabilities Location | | Primary Risk
Exposure | | Value
(000) | |
Futures Contracts
| | Variation Margin on
Futures Contracts | |
Interest Rate Risk | | $ | 36 | (a) | |
Swap Agreement
| | Unrealized Appreciation on
Swap Agreement | | Credit Risk | | | — | @ | |
Swap Agreements
| | Variation Margin on
Swap Agreements | | Credit Risk | | | 16 | (a) | |
Total | | | | | | $ | 52 | | |
| | | Liability Derivatives
Statement of Assets and
Liabilities Location | | Primary Risk
Exposure | | Value
(000) | |
Futures Contracts
| | Variation Margin on
Futures Contracts | |
Interest Rate Risk | | $ | (97 | )(a) | |
Swap Agreement
| | Unrealized Depreciation on
Swap Agreement | | Credit Risk | | | (7 | ) | |
Swap Agreements
| | Variation Margin on
Swap Agreements | | Interest Rate Risk | | | (57 | )(a) | |
Total | | | | | | $ | (161 | ) | |
(a) This amount represents the cumulative appreciation (depreciation) as reported in the Portfolio of Investments. The Statement of Assets and Liabilities only reflects the current day's net variation margin.
@ Amount is less than $500.
The following tables set forth by primary risk exposure the Portfolio's realized gains (losses) and change in unrealized appreciation (depreciation) by type of derivative contract for the year ended September 30, 2015 in accordance with ASC 815.
Realized Gain (Loss) | |
Primary Risk Exposure | | Derivative Type | | Value
(000) | |
Interest Rate Risk | | Futures Contracts | | $ | 254 | | |
Credit Risk | | Swap Agreements | | | (19 | ) | |
Interest Rate Risk | | Swap Agreements | | | (306 | ) | |
Total | | | | $ | (71 | ) | |
Change in Unrealized Appreciation (Depreciation) | |
Primary Risk Exposure | | Derivative Type | | Value
(000) | |
Interest Rate Risk | | Futures Contracts | | $ | (107 | ) | |
Credit Risk | | Swap Agreements | | | 8 | | |
Interest Rate Risk | | Swap Agreements | | | (140 | ) | |
Total | | | | $ | (239 | ) | |
26
Morgan Stanley Institutional Fund Trust
Annual Report — September 30, 2015
Notes to Financial Statements (cont'd)
At September 30, 2015, the Portfolio's derivative assets and liabilities are as follows:
Gross Amounts of Assets and Liabilities
Presented in the Statement of Assets and Liabilities | |
Derivatives(b) | | Assets(c)
(000) | | Liabilities(c)
(000) | |
Swap Agreements | | $ | — | @ | | $ | (7 | ) | |
(b) Excludes exchange traded derivatives.
(c) Absent an event of default or early termination, OTC derivative assets and liabilities are presented gross and not offset in the Statement of Assets and Liabilities.
@ Amount is less than $500.
The Portfolio typically enters into International Swaps and Derivatives Association, Inc. Master Agreements ("ISDA Master Agreements") or similar master agreements (collectively, "Master Agreements") with its contract counterparties for certain OTC derivatives in order to, among other things, reduce its credit risk to counterparties. ISDA Master Agreements include provisions for general obligations, representations, collateral and events of default or termination. Under an ISDA Master Agreement, the Portfolio typically may offset with the counterparty certain OTC derivative financial instruments' payables and/or receivables with collateral held and/or posted and create one single net payment (close-out netting) in the event of default, termination and/or potential deterioration in the credit quality of the counterparty. Various Master Agreements govern the terms of certain transactions with counterparties, including transactions such as swap, forward, repurchase and reverse repurchase agreements. These Master Agreements typically attempt to reduce the counterparty risk associated with such transactions by specifying credit protection mechanisms and providing standardization that improves legal certainty. Cross-termination provisions under Master Agreements typically provide that a default in connection with one transaction between the Portfolio and a counterparty gives the non-defaulting party the right to terminate any other transactions in place with the defaulting party to create one single net payment due to/due from the defaulting party and may be a feature in certain Master Agreements. In the event the Portfolio exercises its right to terminate a Master Agreement after a counterparty experiences a termination event as defined in the Master Agreement, the return of collateral with market value in excess of the Portfolio's net liability may be delayed or denied.
The following tables present derivative financial instruments that are subject to enforceable netting arrangements as of September 30, 2015.
Gross Amounts Not Offset in the Statement of Assets and Liabilities | |
Counterparty | | Gross Asset
Derivatives
Presented in
Statement of
Assets and
Liabilities
(000) | | Financial
Instrument
(000) | | Collateral
Pledged
(000) | | Net Amount
(not less
than $0)
(000) | |
Barclays Bank PLC | | $ | — | @ | | $ | (— | @) | | $ | — | | | $ | 0 | | |
Gross Amounts Not Offset in the Statement of Assets and Liabilities | |
Counterparty | | Gross Liability
Derivatives
Presented in
Statement of
Assets and
Liabilities
(000) | | Financial
Instrument
(000) | | Collateral
Pledged
(000) | | Net Amount
(not less
than $0)
(000) | |
Barclays Bank PLC | | $ | 7 | | | $ | (— | @) | | $ | — | | | $ | 7 | | |
@ Amount is less than $500.
For the year ended September 30, 2015, the approximate average monthly amount outstanding for each derivative type is as follows:
Futures Contracts: | |
Average monthly original value | | $ | 37,834,000 | | |
Swap Agreements: | |
Average monthly notional amount | | $ | 15,425,000 | | |
5. Senior Loans: Senior Loans are typically structured by a syndicate of lenders ("Lenders"), one or more of which administers the Senior Loan on behalf of the Lenders ("Agent"). Lenders may sell interests in Senior Loans to third parties ("Participations") or may assign all or a portion of their interest in a Senior Loan to third parties ("Assignments"). Senior Loans are exempt from registration under the Securities Act of 1933. Presently, Senior Loans are not readily marketable and are often subject to restrictions on resale.
6. Securities Lending: The Portfolio lends securities to qualified financial institutions, such as broker-dealers, to earn additional income. Any increase or decrease in the fair value of the securities loaned that might occur and any interest earned or dividends declared on those securities during the term of the loan would remain in the Portfolio. The Portfolio would receive cash or securities as collateral in an amount equal to or exceeding 100% of the current fair value of the loaned securities. The collateral is marked-to-market daily by State Street Bank and Trust Company ("State Street"), the securities lending agent, to ensure that a minimum of 100% collateral coverage is maintained.
Based on pre-established guidelines, the securities lending agent invests any cash collateral that is received in an
27
Morgan Stanley Institutional Fund Trust
Annual Report — September 30, 2015
Notes to Financial Statements (cont'd)
affiliated money market portfolio and repurchase agreements. Securities lending income is generated from the earnings on the invested collateral and borrowing fees, less any rebates owed to the borrowers and compensation to the lending agent, and is recorded as "Income from Securities Loaned — Net" in the Portfolio's Statement of Operations. Risks in securities lending transactions are that a borrower may not provide additional collateral when required or return the securities when due, and that the value of the short-term investments will be less than the amount of cash collateral plus any rebate that is required to be returned to the borrower.
The Portfolio has the right under the lending agreement to recover the securities from the borrower on demand.
The following table presents securities on loan that are subject to enforceable netting arrangements as of September 30, 2015.
Gross Amounts Not Offset in the Statement of Assets and Liabilities | |
Gross Asset
Amounts
Presented in
Statement of
Assets and
Liabilities
(000) | | Financial
Instrument
(000) | | Collateral
Received
(000) | | Net Amount
(not less
than $0)
(000) | |
| $ | 2,817 | (d) | | $ | — | | | $ | (2,817 | )(e)(f) | | $ | 0 | | |
(d) Represents market value of loaned securities at period end.
(e) The Portfolio received cash collateral of approximately $1,845,000, of which approximately $1,728,000 was subsequently invested in Repurchase Agreements and Morgan Stanley Institutional Liquidity Funds as reported in the Portfolio of Investments. As of September 30, 2015, there was uninvested cash of approximately $117,000, which is not reflected in the Portfolio of Investments. In addition, the Portfolio received non-cash collateral of approximately $1,025,000 in the form of U.S. Government agency securities and U.S. Government obligations, which the Portfolio cannot sell or repledge, and accordingly are not reflected in the Portfolio of Investments.
(f) The actual collateral received is greater than the amount shown here due to overcollateralization.
7. Indemnifications: The Fund enters into contracts that contain a variety of indemnifications. The Fund's maximum exposure under these arrangements is unknown. However, the Fund has not had prior claims or losses pursuant to these contracts and expects the risk of loss to be remote.
8. Dividends and Distributions to Shareholders: Dividend income and distributions to shareholders are recorded on the ex-dividend date. Dividends from net investment income, if any, are declared and paid quarterly. Net realized capital gains, if any, are distributed at least annually.
9. Security Transactions, Income and Expenses: Security transactions are accounted for on the trade date (date the order to buy or sell is executed). Realized gains and losses on the sale of investment securities are determined on the specific identified cost method. When the Portfolio buys an interest in a Senior Loan, it may receive a commitment fee which is paid to lenders on an ongoing basis based upon the undrawn portion committed by the lenders of the underlying Senior Loan. The Portfolio accrues the commitment fee over the expected term of the loan. When the Portfolio sells interest in a Senior Loan, it may be required to pay fees or commissions to the purchaser of the interest. Fees received in connection with loan amendments are accrued as earned. Dividend income and other distributions are recorded on the ex-dividend date (except for certain foreign dividends which may be recorded as soon as the Portfolio is informed of such dividends) net of applicable withholding taxes. Interest income is recognized on the accrual basis except where collection is in doubt. Discounts are accreted and premiums are amortized over the life of the respective securities. Most expenses of the Fund can be directly attributed to a particular Portfolio. Expenses which cannot be directly attributed are apportioned among the Portfolios based upon relative net assets or other appropriate methods. Income, expenses (other than class specific expenses — distribution and shareholder services, transfer agency and sub transfer agency fees) and realized and unrealized gains or losses are allocated to each class of shares based upon their relative net assets.
B. Advisory Fees: The Adviser, a wholly-owned subsidiary of Morgan Stanley, provides the Portfolio with advisory services under the terms of an Investment Advisory Agreement, paid quarterly, at an annual rate of 0.375% of the average daily net assets of the Portfolio.
The Adviser has agreed to reduce its advisory fee and/or reimburse the Portfolio so that total annual portfolio operating expenses, excluding certain investment related expenses, taxes, interest and other extraordinary expenses (including litigation), will not exceed 0.70% for Class I shares, 1.05% for Class A shares, 1.52% for Class L shares and 1.80% for Class C shares. The fee waivers and/or expense reimbursements will continue for at least one year from the date of the Portfolio's prospectus or until such time that the Trustees act to discontinue all or a portion of such waivers and/or reimbursements when they deem such action is appropriate. For the year ended September 30, 2015, approximately $143,000 of advisory fees
28
Morgan Stanley Institutional Fund Trust
Annual Report — September 30, 2015
Notes to Financial Statements (cont'd)
were waived and approximately $30,000 of other expenses were reimbursed by the Adviser pursuant to this arrangement.
C. Administration Fees: The Adviser also serves as Administrator to the Fund and provides administrative services pursuant to an Administration Agreement for an annual fee, accrued daily and paid monthly, of 0.08% of the Portfolio's average daily net assets. Under a Sub-Administration Agreement between the Administrator and State Street, State Street provides certain administrative services to the Fund. For such services, the Administrator pays State Street a portion of the fee the Administrator receives from the Portfolio.
D. Distribution and Shareholder Services Fees: Morgan Stanley Distribution, Inc. ("MSDI" or the "Distributor"), a wholly-owned subsidiary of the Adviser, and an indirect subsidiary of Morgan Stanley, serves as the Fund's Distributor of Portfolio shares pursuant to a Distribution Agreement. The Fund has adopted a Shareholder Services Plan with respect to Class A shares pursuant to Rule 12b-1 under the Act. Under the Shareholder Services Plan, the Portfolio pays the Distributor a shareholder services fee, accrued daily and paid monthly, at an annual rate of 0.25% of the Portfolio's average daily net assets attributable to Class A shares. The Distributor has agreed to waive the 12b-1 fees on Class A shares of the Portfolio to the extent it exceeds 0.15% of the average daily net assets of such shares on an annualized basis. This waiver will continue for at least one year from the date of the Portfolio's prospectus or until such time that the Trustees act to discontinue all or a portion of such waiver when it deems such action is appropriate. For the year ended September 30, 2015, this waiver amounted to approximately $1,000.
The Fund has adopted a Distribution and Shareholder Services Plan with respect to Class L shares pursuant to Rule 12b-1 under the Act. Under the Distribution and Shareholder Services Plan, the Portfolio pays the Distributor a distribution fee, accrued daily and paid monthly, at an annual rate of 0.25% and a shareholder services fee, accrued daily and paid monthly, at an annual rate of 0.25% of the Portfolio's average daily net assets attributable to Class L shares.
The Fund has adopted a Distribution and Shareholder Services Plan with respect to Class C shares pursuant to Rule 12b-1 under the Act. Under the Distribution and Shareholder Services Plan, the Portfolio pays the Distributor a distribution fee, accrued daily and paid monthly, at an annual rate of 0.75% and a shareholder services fee, accrued daily and paid monthly, at an annual rate of 0.25% of the Portfolio's average daily net assets attributable to Class C shares.
The distribution and shareholder services fees are used to support the expenses associated with servicing and maintaining accounts. The Distributor may compensate other parties for providing shareholder support services to investors who purchase Class A, Class L and Class C shares.
E. Dividend Disbursing and Transfer Agent: The Fund's dividend disbursing and transfer agent is Boston Financial Data Services, Inc. ("BFDS"). Pursuant to a Transfer Agency Agreement, the Fund pays BFDS a fee based on the number of classes, accounts and transactions relating to the Portfolios of the Fund.
F. Custodian Fees: State Street (the "Custodian") serves as Custodian for the Fund in accordance with a Custodian Agreement. The Custodian holds cash, securities, and other assets of the Fund as required by the Act. Custody fees are payable monthly based on assets held in custody, investment purchases and sales activity and account maintenance fees, plus reimbursement for certain out-of-pocket expenses.
G. Security Transactions and Transactions with Affiliates: For the year ended September 30, 2015, purchases and sales of investment securities for the Portfolio, other than long-term U.S. Government securities and short-term investments, were approximately $16,379,000 and $20,135,000, respectively. There were no purchases and sales of long-term U.S. Government securities for the year ended September 30, 2015.
The Portfolio invests in the Institutional Class of the Morgan Stanley Institutional Liquidity Funds — Money Market Portfolio (the "Liquidity Funds"), an open-end management investment company managed by the Adviser, both directly and as a portion of the securities held as collateral on loaned securities. Advisory fees paid by the Portfolio are reduced by an amount equal to its pro-rata share of the advisory and administration fees paid by the Portfolio due to its investment in the Liquidity Funds. For the year ended September 30, 2015, advisory fees paid were reduced by approximately $1,000 relating to the Portfolio's investment in the Liquidity Funds.
A summary of the Portfolio's transactions in shares of the Liquidity Funds during the year ended September 30, 2015 is as follows:
Value
September 30,
2014
(000) | | Purchases
at Cost
(000) | | Sales
(000) | | Dividend
Income
(000) | | Value
September 30,
2015
(000) | |
| $ | 5,054 | | | $ | 13,658 | | | $ | 16,801 | | | $ | 1 | | | $ | 1,911 | | |
The Portfolio has an unfunded Deferred Compensation Plan (the "Compensation Plan"), which allows each independent
29
Morgan Stanley Institutional Fund Trust
Annual Report — September 30, 2015
Notes to Financial Statements (cont'd)
Trustee to defer payment of all, or a portion, of the fees he or she receives for serving on the Board of Trustees. Each eligible Trustee generally may elect to have the deferred amounts credited with a return equal to the total return on one or more of the Morgan Stanley funds that are offered as investment options under the Compensation Plan. Appreciation/depreciation and distributions received from these investments are recorded with an offsetting increase/decrease in the deferred compensation obligation and do not affect the NAV of the Portfolio.
H. Federal Income Taxes: It is the Portfolio's intention to continue to qualify as a regulated investment company and distribute all of its taxable and tax-exempt income. Accordingly, no provision for Federal income taxes is required in the financial statements.
The Portfolio may be subject to taxes imposed by countries in which it invests. Such taxes are generally based on income and/or capital gains earned or repatriated. Taxes are accrued based on net investment income, net realized gains and net unrealized appreciation as such income and/or gains are earned. Taxes may also be based on transactions in foreign currency and are accrued based on the value of investments denominated in such currency.
FASB ASC 740-10, "Income Taxes — Overall", sets forth a minimum threshold for financial statement recognition of the benefit of a tax position taken or expected to be taken in a tax return. Management has concluded there are no significant uncertain tax positions that would require recognition in the financial statements. If applicable, the Portfolio recognizes interest accrued related to unrecognized tax benefits in "Interest Expense" and penalties in "Other Expenses" in the Statement of Operations. The Portfolio files tax returns with the U.S. Internal Revenue Service, New York and various states. Each of the tax years in the four-year period ended September 30, 2015, remains subject to examination by taxing authorities.
The tax character of distributions paid may differ from the character of distributions shown in the Statements of Changes in Net Assets due to short-term capital gains being treated as ordinary income for tax purposes. The tax character of distributions paid during fiscal years 2015 and 2014 was as follows:
2015 Distributions
Paid From:
Ordinary Income
(000) | | 2014 Distributions
Paid From:
Ordinary Income
(000) | |
| $ | 1,089 | | | $ | 1,158 | | |
The amount and character of income and gains to be distributed are determined in accordance with income tax regulations which may differ from GAAP. These book/tax differences are either considered temporary or permanent in nature.
Temporary differences are attributable to differing book and tax treatments for the timing of the recognition of gains (losses) on certain investment transactions and the timing of the deductibility of certain expenses.
Permanent differences, primarily due to basis adjustments for swap transactions and paydown adjustments, resulted in the following reclassifications among the components of net assets at September 30, 2015:
Accumulated
Undistributed
Net Investment
Income
(000) | | Accumulated
Net Realized
Loss
(000) | | Paid-in-
Capital
(000) | |
| $ | (188 | ) | | $ | 188 | | | $ | — | | |
At September 30, 2015, the components of distributable earnings for the Portfolio on a tax basis were as follows:
Undistributed
Ordinary
Income
(000) | | Undistributed
Long-Term
Capital Gain
(000) | |
| $ | 453 | | | $ | — | | |
At September 30, 2015, the Portfolio had available for Federal income tax purposes unused capital losses, which will expire on the indicated dates:
Amount
(000) | | Expiration | |
| $ | 48,099 | | | September 30, 2017 | |
| | 8,130 | | | September 30, 2018 | |
To the extent that capital loss carryforwards are used to offset any future capital gains realized during the carryover period as provided by U.S. Federal income tax regulations, no capital gains tax liability will be incurred by the Portfolio for gains realized and not distributed. To the extent that capital gains are offset, such gains will not be distributed to the shareholders. During the year ended September 30, 2015, the Portfolio utilized capital loss carryforwards for U.S. Federal income tax purposes of approximately $825,000.
I. Other: At September 30, 2015, the Portfolio had otherwise unaffiliated record owners of 10% or greater. Investment activities of these shareholders could have a material impact on the Portfolio. The aggregate percentage of such owners was 88.5%.
30
Morgan Stanley Institutional Fund Trust
Annual Report — September 30, 2015
Report of Independent Registered Public Accounting Firm
To the Shareholders and Board of Trustees of
Morgan Stanley Institutional Fund Trust —
Corporate Bond Portfolio
We have audited the accompanying statement of assets and liabilities, including the portfolio of investments, of Corporate Bond Portfolio (one of the portfolios constituting Morgan Stanley Institutional Fund Trust) (the "Portfolio") as of September 30, 2015, and the related statement of operations for the year then ended, the statements of changes in net assets for each of the two years in the period then ended and the financial highlights for each of the years or periods indicated therein. These financial statements and financial highlights are the responsibility of the Portfolio's management. Our responsibility is to express an opinion on these financial statements and financial highlights based on our audits.
We conducted our audits in accordance with the standards of the Public Company Accounting Oversight Board (United States). Those standards require that we plan and perform the audit to obtain reasonable assurance about whether the financial statements and financial highlights are free of material misstatement. We were not engaged to perform an audit of the Portfolio's internal control over financial reporting. Our audits included consideration of internal control over financial reporting as a basis for designing audit procedures that are appropriate in the circumstances, but not for the purpose of expressing an opinion on the effectiveness of the Portfolio's internal control over financial reporting. Accordingly, we express no such opinion. An audit also includes examining, on a test basis, evidence supporting the amounts and disclosures in the financial statements and financial highlights, assessing the accounting principles used and significant estimates made by management, and evaluating the overall financial statement presentation. Our procedures included confirmationof securities owned as of September 30, 2015, by correspondence with the custodian and others or by other appropriate auditing procedures where replies from others were not received. We believe that our audits provide a reasonable basis for our opinion.
In our opinion, the financial statements and financial highlights referred to above present fairly, in all material respects, the financial position of Corporate Bond Portfolio (one of the portfolios constituting Morgan Stanley Institutional Fund Trust) at September 30, 2015, the results of its operations for the year then ended, the changes in its net assets for each of the two years in the period then ended and the financial highlights for each of the years or periods indicated therein, in conformity with U.S. generally accepted accounting principles.

Boston, Massachusetts
November 25, 2015
31
Morgan Stanley Institutional Fund Trust
Annual Report — September 30, 2015
Investment Advisory Agreement Approval (unaudited)
Nature, Extent and Quality of Services
The Board reviewed and considered the nature and extent of the investment advisory services provided by the Adviser (as defined herein) under the advisory agreement, including portfolio management, investment research and equity and fixed income securities trading. The Board also reviewed and considered the nature and extent of the non-advisory, administrative services provided by the Adviser under the administration agreement, including accounting, operations, clerical, bookkeeping, compliance, business management and planning, legal services and the provision of supplies, office space and utilities at the Adviser's expense. The Board also considered the Adviser's investment in personnel and infrastructure that benefits the Portfolio. (The advisory and administration agreements together are referred to as the "Management Agreement.") The Board also considered that the Adviser serves a variety of other investment advisory clients and has experience overseeing service providers. The Board also compared the nature of the services provided by the Adviser with similar services provided by non-affiliated advisers as reported to the Board by Lipper, Inc. ("Lipper").
The Board reviewed and considered the qualifications of the portfolio managers, the senior administrative managers and other key personnel of the Adviser who provide the administrative and advisory services to the Portfolio. The Board determined that the Adviser's portfolio managers and key personnel are well qualified by education and/or training and experience to perform the services in an efficient and professional manner. The Board concluded that the nature and extent of the advisory and administrative services provided were necessary and appropriate for the conduct of the business and investment activities of the Portfolio and supported its decision to approve the Management Agreement.
Performance, Fees and Expenses of the Portfolio
The Board reviewed the performance, fees and expenses of the Portfolio compared to its peers, as determined by Lipper, and to appropriate benchmarks where applicable. The Board discussed with the Adviser the performance goals and the actual results achieved in managing the Portfolio. When considering a fund's performance, the Board and the Adviser place emphasis on trends and longer-term returns (focusing on one-year, three-year and five-year performance, as of December 31, 2014, or since inception, as applicable). When a fund underperforms its benchmark and/or its peer group average, the Board and the Adviser discuss the causes of such underperformance and, where necessary, they discuss specific changes to investment strategy or investment personnel. The Board noted that the Portfolio's performance was better than its peer group average for the one- and three-year periods but below its peer group average for the five-year period. The Board discussed with the Adviser the level of the advisory and administration fees (together, the "management fee") for this Portfolio relative to comparable funds and/or other accounts advised by the Adviser and/or compared to its peers as determined by Lipper. In addition to the management fee, the Board also reviewed the Portfolio's total expense ratio. When a fund's management fee and/or its total expense ratio are higher than its peers, the Board and the Adviser discuss the reasons for this and, where appropriate, they discuss possible waivers and/or caps. The Board noted that while the Portfolio's management fee was lower than its peer group average, the total expense ratio was higher than its peer group average. After discussion, the Board concluded that the Portfolio's (i) performance was competitive with its peer group average; (ii) management fee was competitive with its peer group average; and (iii) total expense ratio was acceptable.
Economies of Scale
The Board considered the size and growth prospects of the Portfolio and how that relates to the Portfolio's total expense ratio and particularly the Portfolio's management fee rate, which does not include breakpoints. In conjunction with its review of the Adviser's profitability, the Board discussed with the Adviser how a change in assets can affect the efficiency or effectiveness of managing the Portfolio and whether the management fee level is appropriate relative to current and projected asset levels and/or whether the management fee structure reflects economies of scale as asset levels change. The Board has determined that its review of the actual and/or potential economies of scale of the Portfolio supports its decision to approve the Management Agreement.
Profitability of the Adviser and Affiliates
The Board considered information concerning the costs incurred and profits realized by the Adviser and its affiliates during the last year from their relationship with the Portfolio and during the last two years from their relationship with the Morgan Stanley Fund Complex and reviewed with the Adviser the cost allocation methodology used to determine the profitability of the Adviser and affiliates. The Board has determined that its review of the analysis of the Adviser's expenses and profitability supports its decision to approve the Management Agreement.
32
Morgan Stanley Institutional Fund Trust
Annual Report — September 30, 2015
Investment Advisory Agreement Approval (unaudited) (cont'd)
Other Benefits of the Relationship
The Board considered other direct and indirect benefits to the Adviser and/or its affiliates derived from their relationship with the Portfolio and other funds advised by the Adviser. These benefits may include, among other things, fees for trading, distribution and/or shareholder servicing and for transaction processing and reporting platforms used by securities lending agents, and research received by the Adviser generated from commission dollars spent on funds' portfolio trading. The Board reviewed with the Adviser these arrangements and the reasonableness of the Adviser's costs relative to the services performed. The Board has determined that its review of the other benefits received by the Adviser or its affiliates supports its decision to approve the Management Agreement.
Resources of the Adviser and Historical Relationship Between the Portfolio and the Adviser
The Board considered whether the Adviser is financially sound and has the resources necessary to perform its obligations under the Management Agreement. The Board also reviewed and considered the historical relationship between the Portfolio and the Adviser, including the organizational structure of the Adviser, the policies and procedures formulated and adopted by the Adviser for managing the Portfolio's operations and the Board's confidence in the competence and integrity of the senior managers and key personnel of the Adviser. The Board concluded that the Adviser has the financial resources necessary to fulfill its obligations under the Management Agreement and that it is beneficial for the Portfolio to continue its relationship with the Adviser.
Other Factors and Current Trends
The Board considered the controls and procedures adopted and implemented by the Adviser and monitored by the Fund's Chief Compliance Officer and concluded that the conduct of business by the Adviser indicates a good faith effort on its part to adhere to high ethical standards in the conduct of the Portfolio's business.
General Conclusion
After considering and weighing all of the above factors, with various written materials and verbal information presented by the Adviser, the Board concluded that it would be in the best interest of the Portfolio and its shareholders to approve renewal of the Management Agreement for another year. In reaching this conclusion the Board did not give particular weight to any single piece of information or factor referenced above. The Board considered these factors and information over the course of the year and in numerous meetings, some of which were in executive session with only the independent Board members and their counsel present. It is possible that individual Board members may have weighed these factors, and the information presented, differently in reaching their individual decisions to approve the Management Agreement.
33
Morgan Stanley Institutional Fund Trust
Annual Report — September 30, 2015
U.S. Privacy Policy (unaudited)
AN IMPORTANT NOTICE CONCERNING OUR U.S. PRIVACY POLICY
This privacy notice describes the U.S. privacy policy of Morgan Stanley Distribution, Inc., and the Morgan Stanley family of mutual funds ("us", "our", "we").
We are required by federal law to provide you with notice of our U.S. privacy policy ("Policy"). This Policy applies to both our current and former clients unless we state otherwise and is intended for individual clients who purchase products or receive services from us for personal, family or household purposes. This Policy is not applicable to partnerships, corporations, trusts or other non-individual clients or account holders, nor is this Policy applicable to individuals who are either beneficiaries of a trust for which we serve as trustee or participants in an employee benefit plan administered or advised by us. This Policy is, however, applicable to individuals who select us to be a custodian of securities or assets in individual retirement accounts, 401(k) accounts, or accounts subject to the Uniform Gifts to Minors Act.
This notice sets out our business practices to protect your privacy; how we collect and share personal information about you; and how you can limit our sharing or certain uses by others of this information. We may amend this Policy at any time, and will inform you of any changes to our Policy as required by law.
WE RESPECT YOUR PRIVACY
We appreciate that you have provided us with your personal financial information and understand your concerns about your information. We strive to safeguard the information our clients entrust to us. Protecting the confidentiality and security of client information is an important part of how we conduct our business.
This notice describes what personal information we collect about you, how we collect it, when we may share it with others, and how certain others may use it. It discusses the steps you may take to limit our sharing of certain information about you with our affiliated companies, including, but not limited to our affiliated banking businesses, brokerage firms and credit service affiliates. It also discloses how you may limit our affiliates' use of shared information for marketing purposes.
Throughout this Policy, we refer to the nonpublic information that personally identifies you as "personal information." We also use the term "affiliated company" in this notice. An affiliated company is a company in our family of companies and includes companies with the Morgan Stanley name. These affiliated companies are financial institutions such as broker-dealers, banks, investment advisers and credit card issuers. We refer to any company that is not an affiliated company as a nonaffiliated third party. For purposes of Section 5 of this notice, and your ability to limit certain uses of personal information by our affiliates, this notice applies to the use of personal information by our affiliated companies.
1. WHAT PERSONAL INFORMATION DO WE COLLECT FROM YOU?
We may collect the following types of information about you: (i) information provided by you, including information from applications and other forms we receive from you, (ii) information about your transactions with us or our affiliates, (iii) information about your transactions with nonaffiliated third parties, (iv) information from consumer reporting agencies, (v) information obtained from our websites, and (vi) information obtained from other sources. For example:
• We collect information such as your name, address, e-mail address, telephone/fax numbers, assets, income and investment objectives through applications and other forms you submit to us.
• We may obtain information about account balances, your use of account(s) and the types of products and services you prefer to receive from us through your dealings and transactions with us and other sources.
• We may obtain information about your creditworthiness and credit history from consumer reporting agencies.
• We may collect background information from and through third-party vendors to verify representations you have made and to comply with various regulatory requirements.
2. WHEN DO WE DISCLOSE PERSONAL INFORMATION WE COLLECT ABOUT YOU?
We may disclose personal information we collect about you in each of the categories listed above to affiliated and nonaffiliated third parties.
34
Morgan Stanley Institutional Fund Trust
Annual Report — September 30, 2015
U.S. Privacy Policy (unaudited) (cont'd)
a. Information We Disclose to Affiliated Companies.
We may disclose personal information that we collect about you to our affiliated companies to manage your account(s) effectively, to service and process your transactions, and to let you know about products and services offered by us and affiliated companies, to manage our business, and as otherwise required or permitted by law. Offers for products and services from affiliated companies are developed under conditions designed to safeguard your personal information.
b. Information We Disclose to Third Parties.
We may disclose personal information that we collect about you to nonaffiliated third parties to provide marketing services on our behalf or to other financial institutions with whom we have joint marketing agreements. We may also disclose all of the information we collect to other nonaffiliated third parties for our everyday business purposes, such as to process transactions, maintain account(s), respond to court orders and legal investigations, report to credit bureaus, offer our own products and services, protect against fraud, for institutional risk control, to perform services on our behalf, and as otherwise required or permitted by law.
When we share personal information about you with a nonaffiliated third party, they are required to limit their use of personal information about you to the particular purpose for which it was shared and they are not allowed to share personal information about you with others except to fulfill that limited purpose or as may be permitted or required by law.
3. HOW DO WE PROTECT THE SECURITY AND CONFIDENTIALITY OF PERSONAL INFORMATION WE COLLECT ABOUT YOU?
We maintain physical, electronic and procedural security measures that comply with applicable law and regulations to help safeguard the personal information we collect about you. We have internal policies governing the proper handling of client information by employees. Third parties that provide support or marketing services on our behalf may also receive personal information about you, and we require them to adhere to appropriate security standards with respect to such information.
4. HOW CAN YOU LIMIT OUR SHARING CERTAIN PERSONAL INFORMATION ABOUT YOU WITH OUR AFFILIATED COMPANIES FOR ELIGIBILITY DETERMINATION?
By following the opt-out procedures in Section 6 below, you may limit the extent to which we share with our affiliated companies, personal information that was collected to determine your eligibility for products and services such as your credit reports and other information that you have provided to us or that we may obtain from third parties ("eligibility information"). Eligibility information does not include your identification information or personal information pertaining to our transactions or experiences with you. Please note that, even if you direct us not to share eligibility information with our affiliated companies, we may still share your personal information, including eligibility information, with our affiliated companies under circumstances that are permitted under applicable law, such as to process transactions or to service your account.
5. HOW CAN YOU LIMIT THE USE OF CERTAIN PERSONAL INFORMATION ABOUT YOU BY OUR AFFILIATED COMPANIES FOR MARKETING?
By following the opt-out instructions in Section 6 below, you may limit our affiliated companies from marketing their products or services to you based on personal information we disclose to them. This information may include, for example, your income and account history with us. Please note that, even if you choose to limit our affiliated companies from using personal information about you that we may share with them for marketing their products and services to you, our affiliated companies may use your personal information that they obtain from us to market to you in circumstances permitted by law, such as if the affiliated party has its own relationship with you.
35
Morgan Stanley Institutional Fund Trust
Annual Report — September 30, 2015
U.S. Privacy Policy (unaudited) (cont'd)
6. HOW CAN YOU SEND US AN OPT-OUT INSTRUCTION?
If you wish to limit our sharing of eligibility information about you with our affiliated companies, or our affiliated companies' use of personal information for marketing purposes, as described in this notice, you may do so by:
• Calling us at (800) 548-7786
Monday–Friday between 8a.m. and 6p.m. (EST)
• Writing to us at the following address:
Boston Financial Data Services, Inc.
c/o Privacy Coordinator
P.O. Box 219804
Kansas City, Missouri 64121
If you choose to write to us, your request should include: your name, address, telephone number and account number(s) to which the opt-out applies and whether you are opting out with respect to sharing of eligibility information (Section 4 above), or information used for marketing (Section 5 above), or both. Written opt-out requests should not be sent with any other correspondence. In order to process your request, we require that the request be provided by you directly and not through a third party. Once you have informed us about your privacy preferences, your opt-out preference will remain in effect with respect to this Policy (as it may be amended) until you notify us otherwise. If you are a joint account owner, we will accept instructions from any one of you and apply those instructions to the entire account.
Please understand that if you limit our sharing or our affiliated companies' use of personal information, you and any joint account holder(s) may not receive information about our affiliated companies' products and services, including products or services that could help you manage your financial resources and achieve your investment objectives.
If you have more than one account or relationship with us, please specify the accounts to which you would like us to apply your privacy choices. If you have accounts or relationships with our affiliates, you may receive multiple privacy policies from them, and will need to separately notify those companies of your privacy choices for those accounts or relationships.
7. WHAT IF AN AFFILIATED COMPANY BECOMES A NONAFFILIATED THIRD PARTY?
If, at any time in the future, an affiliated company becomes a nonaffiliated third party, further disclosures of personal information made to the former affiliated company will be limited to those described in Section 2(b) above relating to nonaffiliated third parties. If you elected under Section 6 to limit disclosures we make to affiliated companies, or use of personal information by affiliated companies, your election will not apply to use by any former affiliated company of your personal information in their possession once it becomes a nonaffiliated third party.
SPECIAL NOTICE TO RESIDENTS OF VERMONT
The following section supplements our Policy with respect to our individual clients who have a Vermont address and supersedes anything to the contrary in the above Policy with respect to those clients only.
The State of Vermont requires financial institutions to obtain your consent prior to sharing personal information that they collect about you with nonaffiliated third parties, or eligibility information with affiliated companies, other than in certain limited circumstances. Except as permitted by law, we will not share personal information we collect about you with nonaffiliated third parties or eligibility information with affiliated companies, unless you provide us with your written consent to share such information.
SPECIAL NOTICE TO RESIDENTS OF CALIFORNIA
The following section supplements our Policy with respect to our individual clients who have a California address and supersedes anything to the contrary in the above Policy with respect to those clients only.
In response to a California law, if your account has a California home address, your personal information will not be disclosed to nonaffiliated third parties except as permitted by applicable California law, and we will limit sharing such personal information with our affiliates to comply with California privacy laws that apply to us.
36
Morgan Stanley Institutional Fund Trust
Annual Report — September 30, 2015
Trustee and Officer Information (unaudited)
Independent Trustees:
Name, Age and Address of
Independent Trustee | | Positions(s)
Held with
Registrant | | Length of Time
Served* | | Principal Occupation(s) During Past 5 Years and
Other Relevant Professional Experience | | Number of
Portfolios in
Fund Complex
Overseen by
Trustee** | | Other Directorships
Held by Independent
Trustee*** | |
Frank L. Bowman (70)
c/o Kramer Levin Naftalis & Frankel LLP
Counsel to the Independent Trustees
1177 Avenue of the Americas
New York, NY 10036 | | Trustee | | Since
August
2006 | | President, Strategic Decisions, LLC (consulting) (since February 2009); Director or Trustee of various Morgan Stanley Funds (since August 2006); Chairperson of the Compliance and Insurance Committee (since October 2015); Chairperson of the Insurance Sub-Committee of the Compliance and Insurance Committee (since February 2007); served as President and Chief Executive Officer of the Nuclear Energy Institute (policy organization) (February 2005-November 2008); retired as Admiral, U.S. Navy after serving over 38 years on active duty including 8 years as Director of the Naval Nuclear Propulsion Program in the Department of the Navy and the U.S. Department of Energy (1996-2004); served as Chief of Naval Personnel (July 1994-September 1996); and on the Joint Staff as Director of Political Military Affairs (June 1992-July1994); knighted as Honorary Knight Commander of the Most Excellent Order of the British Empire; awarded the Officier de l'Orde National du Mérite by the French Government; elected to the National Academy of Engineering (2009). | | | 96 | | | Director of BP p.l.c.; Director of Naval and Nuclear Technologies LLP; Director Emeritus of the Armed Services YMCA of the USA; Director of the U.S. Naval Submarine League; Member of the National Security Advisory Council of the Center for U.S. Global Engagement and a member of the CNA Military Advisory Board; Chairman of the Charity J Street Cup Golf; Trustee of Fairhaven United Methodist Church. | |
Kathleen A. Dennis (62)
c/o Kramer Levin Naftalis & Frankel LLP
Counsel to the Independent Trustees
1177 Avenue of the Americas
New York, NY 10036 | | Trustee | | Since
August
2006 | | President, Cedarwood Associates (mutual fund and investment management consulting) (since July 2006); Chairperson of the Money Market and Alternatives Sub-Committee of the Investment Committee (since October2006) and Director or Trustee of various Morgan Stanley Funds (since August 2006); formerly, Senior Managing Director of Victory Capital Management (1993-2006). | | | 96 | | | Director of various nonprofit organizations. | |
Nancy C. Everett (60)
c/o Kramer Levin Naftalis & Frankel LLP
Counsel to the Independent Trustees
1177 Avenue of the Americas
New York, NY 10036 | | Trustee | | Since
January
2015 | | Owner, OBIR, LLC (institutional investment management consulting) (since June 2014); formerly, Managing Director, BlackRock, Inc. (February 2011-December 2013); and Chief Executive Officer, General Motors Asset Management (a/k/a Promark Global Advisors, Inc.) (June 2005-May 2010). | | | 96 | | | Member of Virginia Commonwealth University Board of Visitors; Member of Virginia Commonwealth University School of Business Foundation; formerly, Member of Committee on Directors for Emerging Markets Growth Fund, Inc. (2007-2010); Chairperson of Performance Equity Management, LLC (2006-2010); and Chairperson, GMAM Absolute Return Strategies Fund, LLC (2006-2010). | |
37
Morgan Stanley Institutional Fund Trust
Annual Report — September 30, 2015
Trustee and Officer Information (unaudited) (cont'd)
Independent Trustees: (cont'd)
Name, Age and Address of
Independent Trustee | | Positions(s)
Held with
Registrant | | Length of Time
Served* | | Principal Occupation(s) During Past 5 Years and
Other Relevant Professional Experience | | Number of
Portfolios in
Fund Complex
Overseen by
Trustee** | | Other Directorships
Held by Independent
Trustee*** | |
Jakki L. Haussler (58)
c/o Kramer Levin Naftalis & Frankel LLP
Counsel to the
Independent Trustees
1177 Avenue of the Americas
New York, NY 10036 | | Trustee | | Since
January
2015 | | Chairman and Chief Executive Officer, Opus Capital Group (since January 1996); and formerly, Director, Capvest Venture Fund, LP (May 2000-December 2011); Partner, Adena Ventures, LP (July 1999-December 2010); Director, The Victory Funds (February 2005-July 2008). | | | 96 | | | Director of Cincinnati Bell Inc. and Member, Audit Committee and Compensation Committee; Director of Northern Kentucky University Foundation and Member, Investment Committee; Member of Chase College of Law Transactional Law Practice Center Board of Advisors; Director of Best Transport; Member, University of Cincinnati Foundation Investment Committee; formerly, Member, Miami University Board of Visitors (2008-2011); Trustee of Victory Funds (2005-2008) and Chairman, Investment Committee (2007-2008) and Member, Service Provider Committee (2005-2008). | |
Dr. Manuel H. Johnson (66)
c/o Johnson Smick International, Inc.
220 I Street, N.E. —
Suite 200
Washington, D.C. 20002 | | Trustee | | Since
July
1991 | | Senior Partner, Johnson Smick International, Inc. (consulting firm); Chairperson of the Investment Committee (since October 2006) and Director or Trustee of various Morgan Stanley Funds (since July 1991); Co-Chairman and a founder of the Group of Seven Council (G7C) (international economic commission); formerly Chairperson of the Audit Committee (July 1991-September 2006), Vice Chairman of the Board of Governors of the Federal Reserve System and Assistant Secretary of the U.S. Treasury. | | | 98 | | | Director of NVR, Inc. (home construction). | |
Joseph J. Kearns (73)
c/o Kearns & Associates LLC
23823 Malibu Road
S-50-440
Malibu, CA 90265 | | Trustee | | Since
August
1994 | | President, Kearns & Associates LLC (investment consulting); Chairperson of the Audit Committee (since October 2006) and Director or Trustee of various Morgan Stanley Funds (since August 1994); formerly, Deputy Chairperson of the Audit Committee (July 2003-September 2006) and Chairperson of the Audit Committee of various Morgan Stanley Funds (since August 1994); CFO of the J. Paul Getty Trust. | | | 99 | | | Director of Electro Rent Corporation (equipment leasing). Prior to December 31, 2013, Director of The Ford Family Foundation. | |
38
Morgan Stanley Institutional Fund Trust
Annual Report — September 30, 2015
Trustee and Officer Information (unaudited) (cont'd)
Independent Trustees: (cont'd)
Name, Age and Address of
Independent Trustee | | Positions(s)
Held with
Registrant | | Length of Time
Served* | | Principal Occupation(s) During Past 5 Years and
Other Relevant Professional Experience | | Number of
Portfolios in
Fund Complex
Overseen by
Trustee** | | Other Directorships
Held by Independent
Trustee*** | |
Michael F. Klein (56)
c/o Kramer Levin Naftalis & Frankel LLP
Counsel to the
Independent Trustees
1177 Avenue of the Americas
New York, NY 10036 | | Trustee | | Since
August
2006 | | Managing Director, Aetos Capital, LLC (since March 2000); Co-President, Aetos Alternatives Management, LLC (since January 2004); and Co-Chief Executive Officer of Aetos Capital LLC (since August 2013); Chairperson of the Fixed Income Sub-Committee of the Investment Committee (since October 2006) and Director or Trustee of various Morgan Stanley Funds (since August 2006); formerly, Managing Director, Morgan Stanley & Co. Inc. and Morgan Stanley Dean Witter Investment Management, President, various Morgan Stanley Funds (June1998-March 2000) and Principal, Morgan Stanley & Co. Inc. and Morgan Stanley Dean Witter Investment Management (August 1997-December 1999). | | | 96 | | | Director of certain investment funds managed or sponsored by Aetos Capital, LLC. Director of Sanitized AG and Sanitized Marketing AG (specialty chemicals). | |
Michael E. Nugent (79)
522 Fifth Avenue
New York, NY 10036 | | Chair of the
Board and
Trustee | | Chair of the
Boards since
July 2006 and
Trustee since
July 1991 | | Chair of the Boards of various Morgan Stanley Funds (since July 2006); Chairperson of the Closed-End Fund Committee (since June 2012) and Director or Trustee of various Morgan Stanley Funds (since July 1991); formerly, Chairperson of the Insurance Committee (until July 2006), General Partner, Triumph Capital, L.P. (private investment partnership) (1988-2013). | | | 98 | | | None. | |
W. Allen Reed (68)
c/o Kramer Levin Naftalis & Frankel LLP
Counsel to the
Independent Trustees
1177 Avenue of the Americas
New York, NY 10036 | | Trustee | | Since
August
2006 | | Chairperson of the Equity Sub-Committee of the Investment Committee (since October 2006) and Director or Trustee of various Morgan Stanley Funds (since August 2006); formerly, President and CEO of General Motors Asset Management; Chairman and Chief Executive Officer of the GM Trust Bank and Corporate Vice President of General Motors Corporation (August 1994-December 2005). | | | 96 | | | Director of Temple-Inland Industries (packaging and forest products); Director of Legg Mason, Inc. and Director of the Auburn University Foundation. | |
Fergus Reid (83)
c/o Joe Pietryka, Inc.
85 Charles Colman Blvd.
Pawling, NY 12564 | | Trustee | | Since
June
1992 | | Chairman, Joe Pietryka, Inc.; Chairperson of the Governance Committee and Director or Trustee of various Morgan Stanley Funds (since June 1992). | | | 99 | | | Formerly, Trustee and Director of certain investment companies in the JP Morgan Fund Complex managed by JP Morgan Investment Management Inc. (1987-December 2012). | |
39
Morgan Stanley Institutional Fund Trust
Annual Report — September 30, 2015
Trustee and Officer Information (unaudited) (cont'd)
Interested Trustee:
Name, Age and Address of
Interested Trustee | | Positions(s) Held
with Registrant | | Length of Time
Served* | | Principal Occupation(s) During Past 5 Years | | Number of
Portfolios in
Fund Complex
Overseen by
Interested
Trustee** | | Other Directorships
Held by Interested
Trustee*** | |
James F. Higgins (67)
One New York Plaza,
New York, NY 10004 | | Trustee | | Since
June
2000 | | Director or Trustee of various Morgan Stanley Funds (since June 2000); Senior Advisor of Morgan Stanley (since August 2000). | | | 97 | | | Formerly, Director of AXA Financial, Inc. and AXA Equitable Life Insurance Company (2002-2011) and Director of AXA MONY Life Insurance Company and AXA MONY Life Insurance Company of America (2004-2011). | |
* This is the earliest date the Trustee began serving the Morgan Stanley Funds. Each Trustee serves an indefinite term, until his or her successor is elected.
** The Fund Complex includes (as of December 31, 2014) all open-end and closed-end funds (including all of their portfolios) advised by Morgan Stanley Investment Management Inc. (the "Adviser") and any funds that have an adviser that is an affiliated person of the Adviser (including, but not limited to, Morgan Stanley AIP GP LP).
*** This includes any directorships at public companies and registered investment companies held by the Trustee at any time during the past five years.
40
Morgan Stanley Institutional Fund Trust
Annual Report — September 30, 2015
Trustee and Officer Information (unaudited) (cont'd)
Executive Officers:
Name, Age and Address of Executive Officer | | Position(s) Held
with
Registrant | | Length of Time
Served* | | Principal Occupation(s) During Past 5 Years | |
John H. Gernon (52)
522 Fifth Avenue
New York, NY 10036 | | President and Principal Executive Officer | | Since
September
2013 | | President and Principal Executive Officer of the Equity and Fixed Income Funds and the Morgan Stanley AIP Funds (since September 2013) and the Liquidity Funds and various money market funds (since May 2014) in the Fund Complex, Managing Director of the Adviser; Head of Product (since 2006) and Global Portfolio Analysis and Reporting (since 2012); for MSIM's Long Only business. | |
Stefanie V. Chang Yu (48)
522 Fifth Avenue
New York, NY 10036 | | Chief
Compliance
Officer | | Since
December
1997 | | Managing Director of the Adviser and various entities affiliated with the Adviser; Chief Compliance Officer of various Morgan Stanley Funds and the Adviser (since January 2014); formerly, Vice President of various Morgan Stanley Funds (December 1997-January 2014). | |
Joseph C. Benedetti (50)
522 Fifth Avenue
New York, NY 10036 | | Vice President | | Since
January
2014 | | Managing Director of the Adviser and various entities affiliated with the Adviser; Vice President of various Morgan Stanley Funds (since January 2014); formerly, Assistant Secretary of various Morgan Stanley Funds (October 2004-January 2014). | |
Francis J. Smith (50)
522 Fifth Avenue
New York, NY 10036 | | Treasurer and
Principal
Financial
Officer | | Treasurer
since July
2003 and
Principal
Financial
Officer since
September
2002 | | Executive Director of the Adviser and various entities affiliated with the Adviser; Treasurer (since July 2003) and Principal Financial Officer of various Morgan Stanley Funds (since September 2002). | |
Mary E. Mullin (48)
522 Fifth Avenue
New York, NY 10036 | | Secretary | | Since
June
1999 | | Executive Director of the Adviser and various entities affiliated with the Adviser; Secretary of various Morgan Stanley Funds (since June 1999). | |
* This is the earliest date the officer began serving the Morgan Stanley Funds. Each officer serves a one-year term, until his or her successor is elected and has qualified.
41
Morgan Stanley Institutional Fund Trust
Annual Report — September 30, 2015
Adviser and Administrator
Morgan Stanley Investment Management Inc.
522 Fifth Avenue
New York, New York 10036
Distributor
Morgan Stanley Distribution, Inc.
522 Fifth Avenue
New York, New York 10036
Dividend Disbursing and Transfer Agent
Boston Financial Data Services, Inc.
2000 Crown Colony Drive
Quincy, Massachusetts 02169
Custodian
State Street Bank and Trust Company
One Lincoln Street
Boston, Massachusetts 02111
Legal Counsel
Dechert LLP
1095 Avenue of the Americas
New York, New York 10036
Counsel to the Independent Trustees
Kramer Levin Naftalis & Frankel LLP
1177 Avenue of the Americas
New York, New York 10036
Independent Registered Public Accounting Firm
Ernst & Young LLP
200 Clarendon Street
Boston, Massachusetts 02116
Reporting to Shareholders
Each Morgan Stanley fund provides a complete schedule of portfolio holdings in its semi-annual and annual reports within 60 days of the end of the fund's second and fourth fiscal quarters. The semi-annual and annual reports are filed electronically with the Securities and Exchange Commission (SEC) on Form N-CSRS and Form N-CSR, respectively. Morgan Stanley also delivers the semi-annual and annual reports to fund shareholders and makes these reports available on its public website, www.morganstanley.com/im. Each Morgan Stanley fund also files a complete schedule of portfolio holdings with the SEC for the fund's first and third fiscal quarters on Form N-Q. Morgan Stanley does not deliver the reports for the first and third fiscal quarters to shareholders, nor are the reports posted to the Morgan Stanley public website. You may, however, obtain the Form N-Q filings (as well as the Form N-CSR and N-CSRS filings) by accessing the SEC's website, www.sec.gov. You may also review and copy them at the SEC's Public Reference Room in Washington, DC. Information on the operation of the SEC's Public Reference Room may be obtained by calling the SEC toll free at 1 (800) SEC-0330. You can also request copies of these materials, upon payment of a duplicating fee, by electronic request at the SEC's email address (publicinfo@sec.gov) or by writing the Public Reference Room of the SEC, Washington, DC 20549-0102.
Proxy Voting Policies and Procedures and Proxy Voting Record
You may obtain a copy of the Fund's Proxy Voting Policy and Procedures and information regarding how the Fund voted proxies relating to portfolio securities during the most recent twelve-month period ended June 30, without charge, upon request, by calling toll free 1 (800) 548-7786 or by visiting our website at www.morganstanley.com/im. This information is also available on the SEC's website at www.sec.gov.
This report is authorized for distribution only when preceded or accompanied by a prospectus of the Morgan Stanley Institutional Fund Trust, which describes in detail each Portfolio's investment policies, risks, fees and expenses. Please read the prospectus carefully before you invest or send money. For additional information, including information regarding the investments comprising the Portfolio, please visit our website at www.morganstanley.com/im or call toll free 1 (800) 548-7786.
42
(This Page has been left blank intentionally.)
(This Page has been left blank intentionally.)
Printed in U.S.A.
This Report has been prepared for shareholders and may be distributed to others only if preceded or accompanied by a current prospectus.
Morgan Stanley Investment Management Inc.
522 Fifth Avenue
New York, New York 10036
© 2015 Morgan Stanley. Morgan Stanley Distribution, Inc.

IFTCBANN
1332377 EXP 11.30.16

Morgan Stanley Institutional Fund Trust
Limited Duration Portfolio
Annual Report
September 30, 2015

Morgan Stanley Institutional Fund Trust
Annual Report — September 30, 2015
Shareholders' Letter | | | 2 | | |
Expense Example | | | 3 | | |
Investment Overview | | | 4 | | |
Portfolio of Investments | | | 7 | | |
Statement of Assets and Liabilities | | | 13 | | |
Statement of Operations | | | 15 | | |
Statements of Changes in Net Assets | | | 16 | | |
Financial Highlights | | | 17 | | |
Notes to Financial Statements | | | 21 | | |
Report of Independent Registered Public Accounting Firm | | | 31 | | |
Investment Advisory Agreement Approval | | | 32 | | |
U.S. Privacy Policy | | | 34 | | |
Trustee and Officer Information | | | 37 | | |
This report is authorized for distribution only when preceded or accompanied by prospectuses of the Morgan Stanley Institutional Fund Trust. To receive a prospectus and/or statement of additional information (SAI), which contains more complete information such as investment objectives, charges, expenses, policies for voting proxies, risk considerations, and describes in detail each of the Portfolio's investment policies to the prospective investor, please call toll free 1 (800) 548-7786. Please read the prospectuses carefully before you invest or send money.
Additionally, you can access portfolio information including performance, characteristics, and investment team commentary through Morgan Stanley Investment Management's website: www.morganstanley.com/im.
Market forecasts provided in this report may not necessarily come to pass. There is no guarantee that any sectors mentioned will continue to perform as discussed herein or that securities in such sectors will be held by the Portfolio in the future. There is no assurance that a Portfolio will achieve its investment objective. Portfolios are subject to market risk, which is the possibility that market values of securities owned by the Portfolio will decline and, therefore, the value of the Portfolio's shares may be less than what you paid for them. Accordingly, you can lose money investing in this Portfolio. Please see the prospectus for more complete information on investment risks.
1
Morgan Stanley Institutional Fund Trust
Annual Report — September 30, 2015
Shareholders' Letter (unaudited)
Dear Shareholders,
We are pleased to provide this Annual report, in which you will learn how your investment in Limited Duration Portfolio (the "Portfolio") performed during the latest twelve-month period.
Morgan Stanley Investment Management is a client-centric, investor-led organization. Our global presence, intellectual capital, and breadth of products and services enable us to partner with investors to meet the evolving challenges of today's financial markets. We aim to deliver superior investment service and to empower our clients to make the informed decisions that help them reach their investment goals.
As always, we thank you for selecting Morgan Stanley Investment Management, and look forward to working with you in the months and years ahead.
Sincerely,

John H. Gernon
President and Principal Executive Officer
October 2015
2
Morgan Stanley Institutional Fund Trust
Annual Report — September 30, 2015
Expense Example (unaudited)
Limited Duration Portfolio
As a shareholder of the Portfolio, you may incur two types of costs: (1) transactional costs, including sales charge (loads) on purchase payments; and (2) ongoing costs, including advisory fees, administration fees, distribution and shareholder services fees; and other Portfolio expenses. This example is intended to help you understand your ongoing costs (in dollars) of investing in the Portfolio and to compare these costs with the ongoing costs of investing in other mutual funds.
This example is based on an investment of $1,000 invested at the beginning of the six-month period ended September 30, 2015 and held for the entire six-month period (unless otherwise noted).
Actual Expenses
The table below provides information about actual account values and actual expenses. You may use the information in this table, together with the amount you invested, to estimate the expenses that you paid over the period. Simply divide your account value by $1,000 (for example, an $8,600 account value divided by $1,000 = 8.6), then multiply the result by the number in the table under the heading entitled "Actual Expenses Paid During Period" to estimate the expenses you paid on your account during this period.
Hypothetical Example for Comparison Purposes
The table below provides information about hypothetical account values and hypothetical expenses based on the Portfolio's actual expense ratio and an assumed rate of return of 5% per year before expenses, which is not the Portfolio's actual return. The hypothetical account values and expenses may not be used to estimate the actual ending account balance or expenses you paid for the period. You may use this information to compare the ongoing costs of investing in the Portfolio and other funds. To do so, compare this 5% hypothetical example with the 5% hypothetical examples that appear in the shareholder reports of the other funds.
Please note that the expenses shown in the table are meant to highlight your ongoing costs only and do not reflect any transactional costs, such as sales charges (loads, if applicable). Therefore, the information for each class in the table is useful in comparing ongoing costs only, and will not help you determine the relative total costs of owning different funds. In addition, if these transactional costs were included, your costs would have been higher.
| | | Beginning
Account
Value
4/1/15 | | Actual Ending
Account
Value
9/30/15 | | Hypothetical
Ending Account
Value | | Actual
Expenses
Paid
During
Period | | Hypothetical
Expenses Paid
During Period | | Net
Expense
Ratio
During
Period*** | |
Limited Duration Portfolio Class I | | $ | 1,000.00 | | | $ | 997.70 | | | $ | 1,022.36 | | | $ | 2.70 | * | | $ | 2.74 | * | | | 0.54 | % | |
Limited Duration Portfolio Class A | | | 1,000.00 | | | | 994.70 | | | | 1,020.66 | | | | 4.40 | * | | | 4.46 | * | | | 0.88 | | |
Limited Duration Portfolio Class L | | | 1,000.00 | | | | 993.10 | | | | 1,018.90 | | | | 6.15 | * | | | 6.23 | * | | | 1.23 | | |
Limited Duration Portfolio Class C | | | 1,000.00 | | | | 990.80 | | | | 1,014.13 | | | | 6.80 | ** | | | 6.88 | ** | | | 1.63 | | |
* Expenses are calculated using each Portfolio Class' annualized net expense ratio (as disclosed), multiplied by the average account value over the period, and multiplied by 183/365 (to reflect the most recent one-half year period).
** Expenses are calculated using the Portfolio Class' annualized net expense ratio (as disclosed), multiplied by the average account value over the period, and multiplied by 153/365 (to reflect the actual days in the period).
*** Annualized
3
Morgan Stanley Institutional Fund Trust
Annual Report — September 30, 2015
Investment Overview (unaudited)
Limited Duration Portfolio
The Limited Duration Portfolio seeks above-average total return over a market cycle of three to five years.
Performance
For the fiscal year ended September 30, 2015, the Portfolio's Class I shares had a total return based on net asset value and reinvestment of distributions per share of 0.06%, net of fees. The Portfolio's Class I shares underperformed against the Portfolio's benchmark Barclays 1-3 Year U.S. Government/Credit Index (the "Index"), which returned 1.19%.
Factors Affecting Performance
• Concerns over central bank policy around the world and global issues, such as Greece's debt crisis and China's economic slowdown, kept bond markets fairly turbulent during the period. Risk premia rose substantially in the latter months of the period and asset prices suffered. The rise in risk premia was driven by a continued tightening of financial conditions, catalyzed by a devaluation of the Chinese currency in August. This tightening of financial conditions resulted in falling business confidence and generally weaker-than-expected economic data. These factors drove "risk-off" sentiment and led to a widening of credit spreads, an equity market sell-off and a rally in U.S. Treasuries. Furthermore, to the surprise of many, the Federal Reserve (Fed) kept interest rates unchanged and delivered a more dovish-than-expected policy statement at its September 2015 meeting. As an unintended consequence, markets increasingly worried that the negative impact on the U.S. economy's growth dynamics would warrant a ratcheting down of global growth expectations. This fear drove risk premia even higher. The Fed has communicated that its decision to hike rates will be data dependent, which implies some uncertainty on whether a hike will happen this year. Only with a material recovery in labor market indicators over the next few months would a rate hike likely occur this year.
• Despite a general increase in yields in first half of the period, over the full 12-month period, 5-, 10-, and 30-year Treasury yields ended 41, 36 and 34 basis points lower, respectively.(i) U.S. 2-year yields ended the period relatively flat at 2 basis points higher.
• Recovering from a volatile fourth quarter of 2014, high yield credit started 2015 on a positive note, as one of the few fixed income sectors to have positive performance in the first quarter of 2015. However, amid economic and geopolitical worries, the U.S. credit markets endured record amounts of new issuance, which eventually pressured yield spreads wider (and prices lower, as bond prices move inversely to yields). Over the course of 2015, credit spreads in all markets have widened materially and are currently at levels which are typically only seen in periods of economic recession or systemic stress. The spreads observable in the investment grade markets include a material risk premium, and spreads in the high yield market are compensating for a significant uptick in defaults. While it is clear that certain emerging markets are seeing a material risk of recession, the consensus is for the developed world to see moderate growth over the coming year. We believe this growth backdrop, combined with low inflation, is likely to lead to ongoing accommodative monetary policy from the central banks around the world, which should keep defaults low and support credit markets.
• Another driver of credit spreads is the technical balance between supply and demand. Supply volume has been elevated across many of the credit markets. This has been most apparent in the U.S. investment grade market, where a combination of increased merger and acquisition activity and the fear that an interest rate tightening cycle could increase the future cost of long-term debt financing has caused corporate treasurers to turn to the bond markets. As a result, year-to-date new issue volumes have been running at record pace. This is to a lesser extent also true in the U.S. high yield and European investment grade markets. Along with this high level of issuance, demand has been muted as many yield-oriented investors are awaiting higher yields before committing capital to the market. This mismatch between supply and demand has resulted in a higher liquidity premium, which has contributed to the wider credit spreads.
(i) Source for U.S. Treasury yields: Bloomberg L.P.
4
Morgan Stanley Institutional Fund Trust
Annual Report — September 30, 2015
Investment Overview (unaudited) (cont'd)
Limited Duration Portfolio
• Despite widening in the latter part of the period, agency mortgage-backed securities (MBS) spreads remain historically expensive. Mortgage rates and prepayment speeds have been range-bound, helping support performance so far, but with the possibility of a Fed rate hike in the coming months, volatility and absolute rate levels could rise and MBS duration extension concerns could return. There is also the additional risk that at some point in 2016 the Fed could end their MBS purchase program, whereby it has been buying 25% to 30% of all new origination.
• Prior to September, non-agency MBS prices had been resilient to broader credit market declines and had traded more as a function of the strong U.S. housing market. However, prices finally began to weaken as relative spread differences became more pronounced at the end of September. In contrast to the price declines, the fundamental market conditions underlying the non-agency MBS market remain very strong. Home prices rose 0.6% in July (down 0.2% on a seasonally adjusted basis), and were up 5.0% year-on-year from July 2014.(ii) New home sales were up 5.7% in August and up 21.6% from August 2014.(iii) Existing home sales were down 1.4% in August, predominantly due to lack of supply, but were still up 6.1% from August 2014.(iv) The volume of outstanding homes for sale fell to a 4.7-month supply based on current sales volumes, down from 5.0-month supply in July and well below the six-month supply that is historically associated with a balanced housing market.(iii) The U.S. homebuilder confidence index climbed to the highest level since November 2005 as housing supply is historically low and housing demand is steadily improving.(v) U.S. household formation was up 2.25 million year-on-year as of June, roughly double the long-term average of roughly 1.15 million per year.(iii) Household formation had been depressed and substantially below historical norms for most for the past seven years, and we are now seeing some of this pent-up demand enter the market. Mortgage performance remains positive. Mortgage defaults were essentially unchanged in August at 0.8%, down 0.1% from August 2014 and well below the nearly 6% level in 2009.(vi)
• Commercial mortgage-backed securities (CMBS) spreads also widened significantly in the latter half
of the period. Fundamentally, the CMBS sector remains healthy. Retail sales continue to climb, with August numbers up 0.2% from July and up 2.2% from August 2014.(iii) Consumer confidence rose in September to the second highest level in the past eight years.(vii) Hotel occupancy rates are at their highest levels in more than 15 years, exceeding 65% occupancy so far in 2015.(viii) For comparison, the previous credit cycle peak of 2004-2006 averaged roughly 63% occupancy. These high occupancy rates are boosting the performance of the hotel sector of CMBS. The improving economy and employment numbers are also helping reduce office space vacancies. National office vacancy rates fell by 0.4% to 13.5% in the second quarter of 2015 and are expected to fall further this year.(ix) Office rental rates increased at roughly 1.1% in the second quarter of 2015, and this pace of increase is expected to continue based on the declining vacancy rates.(ix)
Management Strategies
• Throughout the period, the Portfolio was positioned with an overweight to investment grade credit, particularly in financials, as we believe valuations relative to fundamentals have been attractive. This detracted from relative performance as global volatility pushed spreads wider.
• The Portfolio has also been positioned with an allocation to short-maturity, high-quality ABS. This position is primarily in credit card, auto, and business and construction equipment securities. The position had a small positive effect on relative performance during the period.
(ii) S&P/Case-Shiller 20-City Composite Home Price Index, an index gauging the value of residential real estate in 20 major U.S. metropolitan areas.
(iii) U.S. Census Bureau
(iv) National Association of Realtors
(v) National Association of Home Builders
(vi) S&P/Experian First Mortgage Default Index, an index measuring default rates across first mortgages
(vii) The Conference Board
(viii) Statistica.com
(ix) CBRE Group, Inc.
5
Morgan Stanley Institutional Fund Trust
Annual Report — September 30, 2015
Investment Overview (unaudited) (cont'd)
Limited Duration Portfolio
• The Portfolio has allocations to riskier segments of the market, such as BB-rated high-yield corporates and non-agency mortgage securities, and these positions contributed positively to relative performance.
• We continue being overweight spread product (non-government bonds) in the Portfolio, as we believe the yield advantage could potentially provide a large part of returns over the near term.
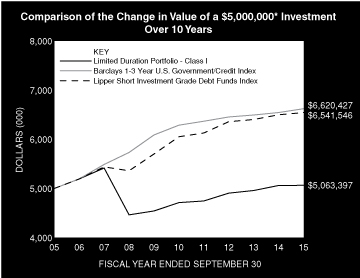
* Minimum Investment
In accordance with SEC regulations, the Portfolio's performance shown assumes that all recurring fees (including management fees) were deducted and all dividends and distributions were reinvested. The performance of Class A, Class L and Class C shares will vary from the performance of Class I shares based upon their different inception dates and will be negatively impacted by additional fees assessed to those classes.
Performance Compared to the Barclays 1-3 Year U.S. Government/Credit Index(1) and the Lipper Short Investment Grade Debt Funds Index(2)
| | | Period Ended September 30, 2015
Total Returns(3) | |
| | | | | Average Annual | |
| | | One
Year | | Five
Years | | Ten
Years | | Since
Inception(8) | |
Portfolio — Class I Shares
w/o sales charges(4) | | | 0.06 | % | | | 1.45 | % | | | 0.13 | % | | | 2.99 | % | |
Portfolio — Class A Shares
w/o sales charges(5) | | | –0.41 | | | | 1.17 | | | | — | | | | –1.10 | | |
Portfolio — Class A Shares with
maximum 4.25% sales charges(5) | | | –4.67 | | | | 0.28 | | | | — | | | | –1.63 | | |
Portfolio — Class L Shares
w/o sales charges(6) | | | –0.68 | | | | — | | | | — | | | | 0.65 | | |
Portfolio — Class C Shares
w/o sales charges(7) | | | — | | | | — | | | | — | | | | –0.92 | | |
Portfolio — Class C Shares with
maximum 1.00% deferred
sales charges(7) | | | — | | | | — | | | | — | | | | –1.91 | | |
Barclays 1-3 Year
U.S. Government/Credit Index | | | 1.19 | | | | 1.04 | | | | 2.85 | | | | 4.31 | | |
Lipper Short Investment Grade
Debt Funds Index | | | 0.68 | | | | 1.57 | | | | 2.72 | | | | 4.03 | | |
Performance data quoted represents past performance, which is no guarantee of future results, and current performance may be lower or higher than the figures shown. Performance assumes that all dividends and distributions, if any, were reinvested. Returns for period less than one year are not annualized. For the most recent month-end performance figures, please visit www.morganstanley.com/im. Investment returns and principal value will fluctuate so that Portfolio shares, when redeemed, may be worth more or less than their original cost. Total returns do not reflect the deduction of taxes that a shareholder would pay on Portfolio distributions or the redemption of Portfolio shares. Performance of share classes will vary due to differences in sales charges and expenses.
(1) The Barclays 1-3 Year U.S. Government/Credit Index tracks the securities in the 1-3 year maturity range of the Barclays U.S. Government/Credit Index which tracks investment-grade (BBB-/Baa3) or higher publicly traded fixedrate U.S. government, U.S. agency, and corporate issues. The Index is unmanaged and its returns do not include any sales charges or fees. Such costs would lower performance. It is not possible to invest directly in an index.
(2) The Lipper Short Investment Grade Debt Funds Index is an equally weighted performance index of the largest qualifying funds (based on net assets) in the Lipper Short Investment Grade Debt Funds classification. The Index, which is adjusted for capital gains distributions and income dividends, is unmanaged and should not be considered an investment. There are currently 30 funds represented in this Index. As of the date of this report, the Portfolio was in the Lipper Short Investment Grade Debt Funds classification.
(3) Total returns for the Portfolio reflect expenses waived and/or reimbursed, if applicable, by the Adviser. Without such waivers and/or reimbursements, total returns would have been lower.
(4) Commenced operations on March 31, 1992.
(5) Commenced operations on September 28, 2007.
(6) Commenced operations on April 27, 2012.
(7) Commenced operations on April 30, 2015.
(8) For comparative purposes, average annual since inception returns listed for the Indexes refer to the inception date of Class I of the Portfolio, not the inception of the Indexes.
6
Morgan Stanley Institutional Fund Trust
Annual Report — September 30, 2015
Portfolio of Investments
Limited Duration Portfolio
| | | Face
Amount
(000) | | Value
(000) | |
Fixed Income Securities (98.2%) | |
Agency Adjustable Rate Mortgages (2.5%) | |
Federal Home Loan Mortgage Corporation, | |
Conventional Pools: | |
2.35%, 6/1/36 | | $ | 421 | | | $ | 448 | | |
2.38%, 7/1/38 | | | 359 | | | | 381 | | |
2.49%, 9/1/35 | | | 530 | | | | 563 | | |
2.66%, 1/1/38 | | | 111 | | | | 119 | | |
Federal National Mortgage Association, | |
Conventional Pools: | |
2.39%, 5/1/39 | | | 428 | | | | 455 | | |
2.41%, 5/1/35 | | | 418 | | | | 443 | | |
Government National Mortgage Association, | |
Various Pool | |
1.75%, 2/20/40 | | | 146 | | | | 151 | | |
| | | | 2,560 | | |
Agency Fixed Rate Mortgages (0.4%) | |
Federal Home Loan Mortgage Corporation, | |
Gold Pools: | |
6.50%, 9/1/19 - 4/1/24 | | | 4 | | | | 4 | | |
7.50%, 11/1/19 | | | 1 | | | | 1 | | |
Federal National Mortgage Association, | |
Conventional Pools: | |
6.50%, 2/1/28 - 10/1/32 | | | 331 | | | | 380 | | |
7.00%, 7/1/29 - 12/1/33 | | | 58 | | | | 60 | | |
Government National Mortgage Association, | |
Various Pools: | |
9.00%, 11/15/16 - 12/15/16 | | | 10 | | | | 10 | | |
| | | | 455 | | |
Asset-Backed Securities (9.8%) | |
Ally Auto Receivables Trust | |
0.62%, 3/15/17 | | | 47 | | | | 47 | | |
American Homes 4 Rent | |
4.69%, 10/17/45 | | | 176 | | | | 179 | | |
AWAS Aviation Capital Ltd. | |
7.00%, 10/17/16 (a) | | | 249 | | | | 249 | | |
CAM Mortgage LLC | |
3.38%, 7/15/64 (a) | | | 381 | | | | 382 | | |
Chase Issuance Trust | |
0.54%, 10/16/17 | | | 1,125 | | | | 1,125 | | |
Citibank Credit Card Issuance Trust | |
2.88%, 1/23/23 | | | 450 | | | | 471 | | |
Colony American Homes | |
1.40%, 5/17/31 (a)(b) | | | 415 | | | | 411 | | |
Discover Card Execution Note Trust | |
0.64%, 7/15/21 (b) | | | 670 | | | | 672 | | |
Ford Credit Auto Owner Trust | |
2.26%, 11/15/25 (a) | | | 1,165 | | | | 1,183 | | |
Invitation Homes Trust, | |
1.40%, 12/17/30 (a)(b) | | | 598 | | | | 593 | | |
1.56%, 6/17/32 (a)(b) | | | 392 | | | | 389 | | |
2.96%, 8/17/32 (a)(b) | | | 666 | | | | 660 | | |
| | | Face
Amount
(000) | | Value
(000) | |
Nationstar HECM Loan Trust | |
3.84%, 5/25/18 (a) | | $ | 298 | | | $ | 300 | | |
North Carolina State Education Assistance Authority | |
1.08%, 7/25/25 (b) | | | 612 | | | | 608 | | |
Panhandle-Plains Higher Education Authority, Inc. | |
1.28%, 7/1/24 (b) | | | 190 | | | | 190 | | |
RMAT LLC | |
4.83%, 6/25/35 (a) | | | 544 | | | | 546 | | |
Sunset Mortgage Loan Co., LLC | |
3.72%, 11/16/44 (a) | | | 224 | | | | 223 | | |
Volkswagen Credit Auto Master Trust | |
1.40%, 7/22/19 (a) | | | 398 | | | | 397 | | |
VOLT NPL X LLC | |
4.75%, 10/26/54 (a) | | | 282 | | | | 279 | | |
VOLT XIX LLC | |
5.00%, 4/25/55 (a) | | | 200 | | | | 201 | | |
VOLT XXII LLC | |
4.25%, 2/25/55 (a) | | | 200 | | | | 198 | | |
VOLT XXX LLC | |
4.75%, 10/25/57 (a) | | | 200 | | | | 200 | | |
VOLT XXXI LLC | |
4.50%, 2/25/55 (a) | | | 200 | | | | 198 | | |
VOLT XXXIII LLC | |
4.25%, 3/25/55 (a) | | | 350 | | | | 346 | | |
World Omni Automobile Lease Securitization Trust | |
1.10%, 12/15/16 | | | 243 | | | | 244 | | |
| | | | 10,291 | | |
Collateralized Mortgage Obligations — Agency Collateral Series (1.2%) | |
Federal Home Loan Mortgage Corporation, | |
REMIC | |
7.50%, 9/15/29 | | | 890 | | | | 1,037 | | |
Government National Mortgage Association, | |
IO | |
6.01%, 3/20/43 (b) | | | 621 | | | | 109 | | |
6.28%, 5/20/40 (b) | | | 746 | | | | 140 | | |
| | | | 1,286 | | |
Commercial Mortgage-Backed Securities (2.1%) | |
BLCP Hotel Trust | |
1.16%, 8/15/29 (a)(b) | | | 581 | | | | 577 | | |
CDGJ Commercial Mortgage Trust | |
1.61%, 12/15/27 (a)(b) | | | 575 | | | | 573 | | |
Citigroup Commercial Mortgage Trust | |
2.11%, 1/12/30 (a) | | | 168 | | | | 170 | | |
Hilton USA Trust | |
1.20%, 11/5/30 (a)(b) | | | 168 | | | | 167 | | |
JP Morgan Chase Commercial Mortgage
Securities Trust, | |
1.19%, 7/15/31 (a)(b) | | | 285 | | | | 283 | | |
5.46%, 12/12/43 | | | 400 | | | | 407 | | |
| | | | 2,177 | | |
The accompanying notes are an integral part of the financial statements.
7
Morgan Stanley Institutional Fund Trust
Annual Report — September 30, 2015
Portfolio of Investments (cont'd)
Limited Duration Portfolio
| | | Face
Amount
(000) | | Value
(000) | |
Corporate Bonds (76.1%) | |
Finance (29.3%) | |
Abbey National Treasury Services PLC | |
3.05%, 8/23/18 | | $ | 370 | | | $ | 382 | | |
ABN Amro Bank N.V. | |
2.50%, 10/30/18 (a) | | | 630 | | | | 640 | | |
AerCap Ireland Capital Ltd./AerCap Global
Aviation Trust | |
3.75%, 5/15/19 | | | 345 | | | | 340 | | |
Ally Financial, Inc. | |
3.25%, 2/13/18 | | | 265 | | | | 261 | | |
American Express Credit Corp., | |
1.80%, 7/31/18 | | | 425 | | | | 425 | | |
Series G | |
2.25%, 8/15/19 | | | 675 | | | | 678 | | |
Bank of America Corp. | |
2.60%, 1/15/19 | | | 900 | | | | 910 | | |
Bank of Montreal | |
1.80%, 7/31/18 | | | 475 | | | | 477 | | |
Bank of Nova Scotia (The) | |
1.70%, 6/11/18 | | | 550 | | | | 549 | | |
BB&T Corp., | |
MTN | |
2.25%, 2/1/19 | | | 580 | | | | 586 | | |
BioMed Realty LP | |
2.63%, 5/1/19 | | | 310 | | | | 300 | | |
BNP Paribas SA, | |
MTN | |
2.70%, 8/20/18 | | | 610 | | | | 624 | | |
BNZ International Funding Ltd. | |
2.35%, 3/4/19 (a) | | | 650 | | | | 653 | | |
| BPCE SA, | |
MTN | |
2.25%, 1/27/20 | | | 600 | | | | 602 | | |
Canadian Imperial Bank of Commerce | |
1.55%, 1/23/18 | | | 310 | | | | 311 | | |
Capital One Financial Corp. | |
2.45%, 4/24/19 | | | 1,005 | | | | 1,003 | | |
CIT Group, Inc. | |
3.88%, 2/19/19 | | | 550 | | | | 548 | | |
Citigroup, Inc. | |
8.50%, 5/22/19 | | | 950 | | | | 1,148 | | |
Commonwealth Bank of Australia | |
2.50%, 9/20/18 | | | 600 | | | | 613 | | |
Compass Bank | |
1.85%, 9/29/17 | | | 600 | | | | 600 | | |
Cooperatieve Centrale Raiffeisen-Boerenleenbank BA | |
3.38%, 1/19/17 | | | 330 | | | | 339 | | |
Credit Agricole SA | |
2.13%, 4/17/18 (a) | | | 775 | | | | 782 | | |
Credit Suisse, | |
Series G | |
2.30%, 5/28/19 | | | 650 | | | | 653 | | |
| | | Face
Amount
(000) | | Value
(000) | |
DBS Group Holdings Ltd. | |
2.25%, 7/16/19 (a) | | $ | 650 | | | $ | 655 | | |
Discover Bank | |
2.00%, 2/21/18 | | | 665 | | | | 661 | | |
DNB Bank ASA | |
3.20%, 4/3/17 (a) | | | 610 | | | | 626 | | |
ERP Operating LP | |
2.38%, 7/1/19 | | | 550 | | | | 555 | | |
Goldman Sachs Group, Inc. (The) | |
2.38%, 1/22/18 | | | 880 | | | | 892 | | |
HSBC USA, Inc. | |
2.25%, 6/23/19 | | | 659 | | | | 661 | | |
Icahn Enterprises LP/Icahn Enterprises
Finance Corp., | |
Series WI | |
4.88%, 3/15/19 | | | 375 | | | | 376 | | |
ING Bank N.V. | |
2.05%, 8/17/18 (a) | | | 1,075 | | | | 1,080 | | |
Intesa Sanpaolo SpA | |
3.88%, 1/16/18 | | | 355 | | | | 366 | | |
JPMorgan Chase & Co. | |
2.20%, 10/22/19 | | | 325 | | | | 324 | | |
Lloyds Bank PLC | |
6.50%, 9/14/20 (a) | | | 325 | | | | 375 | | |
Macquarie Bank Ltd. | |
2.60%, 6/24/19 (a) | | | 605 | | | | 609 | | |
Manufacturers & Traders Trust Co. | |
2.10%, 2/6/20 | | | 560 | | | | 557 | | |
Metropolitan Life Global Funding I | |
2.00%, 4/14/20 (a) | | | 550 | | | | 547 | | |
Mizuho Bank Ltd. | |
1.85%, 3/21/18 (a) | | | 645 | | | | 646 | | |
National Australia Bank Ltd. | |
1.25%, 3/17/17 (a) | | | 400 | | | | 401 | | |
New York Life Global Funding | |
1.30%, 10/30/17 (a) | | | 475 | | | | 475 | | |
Principal Financial Group, Inc. | |
1.85%, 11/15/17 | | | 725 | | | | 730 | | |
QBE Insurance Group Ltd. | |
2.40%, 5/1/18 (a) | | | 200 | | | | 202 | | |
Santander Bank NA | |
2.00%, 1/12/18 | | | 525 | | | | 523 | | |
Skandinaviska Enskilda Banken AB | |
1.75%, 3/19/18 (a) | | | 380 | | | | 380 | | |
Standard Chartered PLC | |
1.50%, 9/8/17 (a) | | | 900 | | | | 903 | | |
Sumitomo Mitsui Banking Corp. | |
2.45%, 1/10/19 | | | 630 | | | | 635 | | |
Swedbank AB | |
1.75%, 3/12/18 (a) | | | 305 | | | | 307 | | |
Synchrony Financial | |
3.00%, 8/15/19 | | | 800 | | | | 807 | | |
The accompanying notes are an integral part of the financial statements.
8
Morgan Stanley Institutional Fund Trust
Annual Report — September 30, 2015
Portfolio of Investments (cont'd)
Limited Duration Portfolio
| | | Face
Amount
(000) | | Value
(000) | |
Finance (cont'd) | |
Toronto-Dominion Bank (The), | |
MTN | |
2.63%, 9/10/18 | | $ | 650 | | | $ | 668 | | |
UBS AG, | |
MTN | |
2.38%, 8/14/19 | | | 925 | | | | 929 | | |
UnitedHealth Group, Inc. | |
2.70%, 7/15/20 | | | 500 | | | | 512 | | |
WEA Finance LLC/Westfield UK & Europe
Finance PLC | |
2.70%, 9/17/19 (a) | | | 600 | | | | 598 | | |
Wells Fargo & Co. | |
2.15%, 1/15/19 | | | 360 | | | | 363 | | |
| | | | 30,787 | | |
Industrials (43.2%) | |
ABB Treasury Center USA, Inc. | |
2.50%, 6/15/16 (a) | | | 745 | | | | 752 | | |
AbbVie, Inc. | |
2.50%, 5/14/20 | | | 575 | | | | 572 | | |
Actavis Funding SCS | |
3.00%, 3/12/20 | | | 835 | | | | 838 | | |
Air Canada | |
6.75%, 10/1/19 (a) | | | 250 | | | | 263 | | |
Altera Corp. | |
2.50%, 11/15/18 | | | 300 | | | | 305 | | |
Altice Financing SA | |
7.88%, 12/15/19 (a) | | | 250 | | | | 259 | | |
Amazon.com, Inc. | |
2.60%, 12/5/19 | | | 525 | | | | 539 | | |
American Honda Finance Corp. | |
2.45%, 9/24/20 | | | 550 | | | | 550 | | |
Anadarko Petroleum Corp. | |
5.95%, 9/15/16 | | | 575 | | | | 598 | | |
Anglo American Capital PLC | |
3.63%, 5/14/20 (a) | | | 400 | | | | 349 | | |
Applied Materials, Inc. | |
2.65%, 6/15/16 | | | 455 | | | | 461 | | |
ArcelorMittal | |
5.25%, 2/25/17 | | | 375 | | | | 372 | | |
AT&T, Inc. | |
2.45%, 6/30/20 | | | 1,225 | | | | 1,207 | | |
Automatic Data Processing, Inc. | |
2.25%, 9/15/20 | | | 350 | | | | 352 | | |
Baidu, Inc. | |
3.25%, 8/6/18 | | | 225 | | | | 230 | | |
BAT International Finance PLC | |
2.75%, 6/15/20 (a) | | | 450 | | | | 459 | | |
Baxalta, Inc. | |
2.88%, 6/23/20 (a) | | | 550 | | | | 550 | | |
Bayer US Finance LLC | |
2.38%, 10/8/19 (a) | | | 600 | | | | 608 | | |
| | | Face
Amount
(000) | | Value
(000) | |
Becton Dickinson and Co. | |
2.68%, 12/15/19 | | $ | 300 | | | $ | 304 | | |
Biogen, Inc. | |
2.90%, 9/15/20 | | | 525 | | | | 531 | | |
Bombardier, Inc. | |
4.75%, 4/15/19 (a) | | | 300 | | | | 243 | | |
BW Group Ltd. | |
6.63%, 6/28/17 (a) | | | 325 | | | | 331 | | |
CBS Corp. | |
2.30%, 8/15/19 | | | 625 | | | | 621 | | |
Celgene Corp. | |
2.88%, 8/15/20 | | | 525 | | | | 530 | | |
Chesapeake Energy Corp. | |
6.50%, 8/15/17 | | | 350 | | | | 318 | | |
CNH Industrial Capital LLC | |
6.25%, 11/1/16 | | | 355 | | | | 363 | | |
Comcast Corp. | |
5.70%, 5/15/18 | | | 520 | | | | 576 | | |
CVS Health Corp. | |
1.90%, 7/20/18 | | | 550 | | | | 554 | | |
Daimler Finance North America LLC | |
2.38%, 8/1/18 (a) | | | 750 | | | | 751 | | |
DCP Midstream Operating LP | |
2.70%, 4/1/19 | | | 650 | | | | 583 | | |
DISH DBS Corp. | |
4.63%, 7/15/17 | | | 375 | | | | 375 | | |
Dominion Gas Holdings LLC | |
2.50%, 12/15/19 | | | 825 | | | | 834 | | |
Eaton Corp. | |
1.50%, 11/2/17 | | | 630 | | | | 630 | | |
Ecolab, Inc. | |
3.00%, 12/8/16 | | | 320 | | | | 326 | | |
EMD Finance LLC | |
2.40%, 3/19/20 (a) | | | 575 | | | | 576 | | |
Enbridge, Inc. | |
0.78%, 6/2/17 (b) | | | 175 | | | | 172 | | |
Energy Transfer Partners LP | |
2.50%, 6/15/18 | | | 575 | | | | 573 | | |
EnLink Midstream Partners LP | |
2.70%, 4/1/19 | | | 525 | | | | 519 | | |
Enterprise Products Operating LLC | |
2.55%, 10/15/19 | | | 325 | | | | 324 | | |
Experian Finance PLC | |
2.38%, 6/15/17 (a) | | | 600 | | | | 604 | | |
Ford Motor Credit Co., LLC | |
5.00%, 5/15/18 | | | 825 | | | | 878 | | |
General Motors Financial Co., Inc. | |
3.15%, 1/15/20 | | | 600 | | | | 595 | | |
Gilead Sciences, Inc. | |
2.55%, 9/1/20 | | | 500 | | | | 504 | | |
GlaxoSmithKline Capital PLC | |
1.50%, 5/8/17 | | | 1,100 | | | | 1,109 | | |
Glencore Funding LLC | |
2.88%, 4/16/20 (a) | | | 575 | | | | 461 | | |
The accompanying notes are an integral part of the financial statements.
9
Morgan Stanley Institutional Fund Trust
Annual Report — September 30, 2015
Portfolio of Investments (cont'd)
Limited Duration Portfolio
| | | Face
Amount
(000) | | Value
(000) | |
Industrials (cont'd) | |
Goldcorp, Inc. | |
2.13%, 3/15/18 | | $ | 520 | | | $ | 514 | | |
Harley-Davidson Financial Services, Inc., | |
1.55%, 11/17/17 (a) | | | 258 | | | | 257 | | |
2.15%, 2/26/20 (a) | | | 350 | | | | 349 | | |
HP Enterprise Co. | |
3.60%, 10/15/20 | | | 400 | | | | 400 | | |
Hutchison Whampoa International 14 Ltd. | |
1.63%, 10/31/17 (a) | | | 240 | | | | 239 | | |
Hyundai Capital America, | |
2.00%, 3/19/18 (a) | | | 525 | | | | 523 | | |
2.60%, 3/19/20 (a) | | | 325 | | | | 324 | | |
Ingersoll-Rand Global Holding Co., Ltd. | |
2.88%, 1/15/19 | | | 335 | | | | 341 | | |
Intel Corp. | |
2.45%, 7/29/20 | | | 550 | | | | 558 | | |
JM Smucker Co. (The) | |
2.50%, 3/15/20 (a) | | | 225 | | | | 226 | | |
Kinder Morgan, Inc. | |
3.05%, 12/1/19 | | | 650 | | | | 639 | | |
L-3 Communications Corp. | |
1.50%, 5/28/17 | | | 275 | | | | 273 | | |
LVMH Moet Hennessy Louis Vuitton SE | |
1.63%, 6/29/17 (a) | | | 525 | | | | 529 | | |
Marathon Oil Corp. | |
2.70%, 6/1/20 | | | 550 | | | | 534 | | |
Marathon Petroleum Corp. | |
3.50%, 3/1/16 | | | 595 | | | | 601 | | |
McDonald's Corp., | |
MTN | |
2.20%, 5/26/20 | | | 550 | | | | 551 | | |
McKesson Corp. | |
3.25%, 3/1/16 | | | 1,070 | | | | 1,080 | | |
Medtronic, Inc. | |
2.50%, 3/15/20 | | | 550 | | | | 558 | | |
Nissan Motor Acceptance Corp. | |
2.65%, 9/26/18 (a) | | | 720 | | | | 736 | | |
Orange SA | |
2.75%, 2/6/19 | | | 625 | | | | 643 | | |
Quest Diagnostics, Inc. | |
2.70%, 4/1/19 | | | 675 | | | | 681 | | |
Reynolds American, Inc. | |
2.30%, 6/12/18 | | | 525 | | | | 531 | | |
Rio Tinto Finance USA PLC | |
1.38%, 6/17/16 | | | 325 | | | | 325 | | |
RR Donnelley & Sons Co. | |
6.13%, 1/15/17 | | | 300 | | | | 308 | | |
Ryder System, Inc., | |
MTN | |
2.65%, 3/2/20 | | | 125 | | | | 125 | | |
| | | Face
Amount
(000) | | Value
(000) | |
Scripps Networks Interactive, Inc. | |
2.75%, 11/15/19 | | $ | 575 | | | $ | 576 | | |
Siemens Financieringsmaatschappij N.V. | |
2.15%, 5/27/20 (a) | | | 550 | | | | 551 | | |
Southwest Airlines Co. | |
2.75%, 11/6/19 | | | 600 | | | | 612 | | |
T-Mobile USA, Inc. | |
5.25%, 9/1/18 | | | 500 | | | | 510 | | |
Thomson Reuters Corp., | |
1.30%, 2/23/17 | | | 325 | | | | 324 | | |
1.65%, 9/29/17 | | | 150 | | | | 150 | | |
Time Warner Cable, Inc. | |
6.75%, 7/1/18 | | | 400 | | | | 445 | | |
Transocean, Inc. | |
3.00%, 10/15/17 | | | 350 | | | | 318 | | |
TSMC Global Ltd. | |
1.63%, 4/3/18 (a) | | | 800 | | | | 793 | | |
Tyson Foods, Inc. | |
2.65%, 8/15/19 | | | 600 | | | | 605 | | |
Union Pacific Corp. | |
2.25%, 6/19/20 | | | 550 | | | | 558 | | |
Verizon Communications, Inc. | |
2.55%, 6/17/19 | | | 1,250 | | | | 1,267 | | |
Viacom, Inc. | |
2.50%, 9/1/18 | | | 625 | | | | 629 | | |
Volkswagen Group of America Finance LLC | |
2.40%, 5/22/20 (a) | | | 550 | | | | 511 | | |
Waste Management, Inc. | |
2.60%, 9/1/16 | | | 725 | | | | 735 | | |
Wesfarmers Ltd. | |
2.98%, 5/18/16 (a) | | | 395 | | | | 400 | | |
Wm. Wrigley Jr. Co. | |
1.40%, 10/21/16 (a) | | | 600 | | | | 602 | | |
Yum! Brands, Inc. | |
3.88%, 11/1/20 | | | 450 | | | | 472 | | |
| | | | 45,352 | | |
Utilities (3.6%) | |
Engie | |
1.63%, 10/10/17 (a) | | | 650 | | | | 653 | | |
Eversource Energy | |
1.45%, 5/1/18 | | | 525 | | | | 521 | | |
NRG Energy, Inc. | |
7.63%, 1/15/18 | | | 275 | | | | 290 | | |
Origin Energy Finance Ltd. | |
3.50%, 10/9/18 (a) | | | 200 | | | | 194 | | |
PSEG Power LLC | |
5.50%, 12/1/15 | | | 570 | | | | 574 | | |
Sempra Energy | |
2.40%, 3/15/20 | | | 600 | | | | 600 | | |
Southern Co. (The) | |
2.15%, 9/1/19 | | | 725 | | | | 718 | | |
The accompanying notes are an integral part of the financial statements.
10
Morgan Stanley Institutional Fund Trust
Annual Report — September 30, 2015
Portfolio of Investments (cont'd)
Limited Duration Portfolio
| | | Face
Amount
(000) | | Value
(000) | |
Utilities (cont'd) | |
Xcel Energy, Inc. | |
1.20%, 6/1/17 | | $ | 275 | | | $ | 274 | | |
| | | | 3,824 | | |
| | | | 79,963 | | |
Mortgages — Other (4.5%) | |
Alternative Loan Trust, | |
5.50%, 10/25/35 - 11/25/35 | | | 890 | | | | 843 | | |
CHL Mortgage Pass-Through Trust | |
5.50%, 5/25/34 | | | 312 | | | | 321 | | |
Fannie Mae Connecticut Avenue Securities | |
1.34%, 5/25/25 (b) | | | 323 | | | | 322 | | |
FDIC Guaranteed Notes Trust | |
0.75%, 2/25/48 (a)(b) | | | 111 | | | | 111 | | |
Freddie Mac Structured Agency Credit Risk
Debt Notes, | |
1.09%, 10/25/27 (b) | | | 241 | | | | 239 | | |
1.19%, 2/25/24 (b) | | | 216 | | | | 216 | | |
HarborView Mortgage Loan Trust | |
0.41%, 1/19/38 (b) | | | 393 | | | | 335 | | |
JP Morgan Alternative Loan Trust | |
6.00%, 12/25/35 | | | 119 | | | | 115 | | |
Lehman Mortgage Trust | |
6.50%, 9/25/37 | | | 49 | | | | 40 | | |
New Residential Mortgage Loan Trust | |
3.75%, 4/25/52 (a)(b) | | | 304 | | | | 312 | | |
Opteum Mortgage Acceptance Corp. Trust | |
0.49%, 4/25/36 (b) | | | 470 | | | | 416 | | |
RALI Trust, | |
0.38%, 12/25/36 (b) | | | 548 | | | | 428 | | |
6.00%, 11/25/36 | | | 205 | | | | 170 | | |
Sequoia Mortgage Trust | |
0.84%, 8/20/34 (b) | | | 538 | | | | 511 | | |
Washington Mutual Mortgage Pass-Through
Certificates Trust, | |
1.16%, 8/25/46 (b) | | | 485 | | | | 334 | | |
1.19%, 6/25/46 (b) | | | 60 | | | | 43 | | |
| | | | 4,756 | | |
Sovereign (1.6%) | |
| EUROFIMA, | |
MTN | |
6.25%, 12/28/18 | | | 630 | | | | 493 | | |
Korea Development Bank (The) | |
1.50%, 1/22/18 | | | 690 | | | | 686 | | |
Spain Government International Bond | |
4.00%, 3/6/18 (a) | | | 500 | | | | 530 | | |
| | | | 1,709 | | |
Total Fixed Income Securities (Cost $102,868) | | | 103,197 | | |
| | | Shares | | Value
(000) | |
Short-Term Investments (1.5%) | |
Investment Company (0.7%) | |
Morgan Stanley Institutional Liquidity
Funds — Money Market Portfolio —
Institutional Class (See Note G)
(Cost $750) | | | 749,921 | | | $ | 750 | | |
| | | Face
Amount
(000) | | | |
U.S. Treasury Security (0.8%) | |
U.S. Treasury Bill | |
| 0.26%, 3/10/16 (c)(d) (Cost $863) | | $ | 864 | | | | 864 | | |
Total Short-Term Investments (Cost $1,613) | | | 1,614 | | |
Total Investments (99.7%) (Cost $104,481) (e)(f) | | | 104,811 | | |
Other Assets in Excess of Liabilities (0.3%) | | | 268 | | |
Net Assets (100.0%) | | $ | 105,079 | | |
(a) 144A security — Certain conditions for public sale may exist. Unless otherwise noted, these securities are deemed to be liquid.
(b) Variable/Floating Rate Security — Interest rate changes on these instruments are based on changes in a designated base rate. The rates shown are those in effect on September 30, 2015.
(c) Rate shown is the yield to maturity at September 30, 2015.
(d) All or a portion of the security was pledged to cover margin requirements for futures contracts and swap agreements.
(e) Securities are available for collateral in connection with an open foreign currency forward exchange contract, futures contracts and swap agreements.
(f) At September 30, 2015, the aggregate cost for Federal income tax purposes is approximately $104,481,000. The aggregate gross unrealized appreciation is approximately $1,088,000 and the aggregate gross unrealized depreciation is approximately $758,000 resulting in net unrealized appreciation of approximately $330,000.
FDIC Federal Deposit Insurance Corporation.
IO Interest Only.
MTN Medium Term Note.
REMIC Real Estate Mortgage Investment Conduit.
The accompanying notes are an integral part of the financial statements.
11
Morgan Stanley Institutional Fund Trust
Annual Report — September 30, 2015
Portfolio of Investments (cont'd)
Limited Duration Portfolio
Foreign Currency Forward Exchange Contract:
The Portfolio had the following foreign currency forward exchange contract open at September 30, 2015:
Counterparty | | Currency to
Deliver
(000) | | Value
(000) | | Settlement
Date | | In Exchange
For
(000) | | Value
(000) | | Unrealized
Appreciation
(000) | |
JPMorgan Chase Bank NA | | AUD | 700 | | | $ | 491 | | | 10/6/15 | | USD | 493 | | | $ | 493 | | | $ | 2 | | |
Futures Contracts:
The Portfolio had the following futures contracts open at September 30, 2015:
| | | Number
of
Contracts | | Value
(000) | | Expiration
Date | | Unrealized
Appreciation
(Depreciation)
(000) | |
Long: | |
U.S. Treasury 2 yr. Note | | | 174 | | | $ | 38,112 | | | Dec-15 | | $ | 40 | | |
U.S. Treasury Ultra Long Bond | | | 1 | | | | 160 | | | Dec-15 | | | 3 | | |
Short: | |
U.S. Treasury 5 yr. Note | | | 249 | | | | (30,009 | ) | | Dec-15 | | | (196 | ) | |
U.S. Treasury 10 yr. Note | | | 18 | | | | (2,317 | ) | | Dec-15 | | | (35 | ) | |
U.S. Treasury Long Bond | | | 1 | | | | (157 | ) | | Dec-15 | | | (4 | ) | |
| | | | | | | | | $ | (192 | ) | |
Credit Default Swap Agreements:
The Portfolio had the following credit default swap agreements open at September 30, 2015:
Swap Counterparty and
Reference Obligation | | Buy/Sell
Protection | | Notional
Amount
(000) | | Pay/Receive
Fixed Rate | | Termination
Date | | Upfront
Payment
Paid
(Received)
(000) | | Unrealized
Appreciation
(Depreciation)
(000) | | Value
(000) | | Credit
Rating of
Reference
Obligation†
(unaudited) | |
Barclays Bank PLC
Quest Diagnostics, Inc. | | Buy | | $ | 645 | | | | 1.00 | % | | 3/20/19 | | $ | 13 | | | $ | (23 | ) | | $ | (10 | ) | | BBB+ | |
Barclays Bank PLC
Yum! Brands, Inc. | | Buy | | | 625 | | | | 1.00 | | | 12/20/18 | | | (11 | ) | | | 1 | | | | (10 | ) | | BBB | |
| | | | | $ | 1,270 | | | | | | | $ | 2 | | | $ | (22 | ) | | $ | (20 | ) | | | |
Interest Rate Swap Agreement:
The Portfolio had the following interest rate swap agreement open at September 30, 2015:
Swap Counterparty | | Floating Rate
Index | | Pay/Receive
Floating Rate | | Fixed Rate | | Termination
Date | | Notional
Amount
(000) | | Unrealized
Depreciation
(000) | |
Morgan Stanley & Co., LLC* | | | 3 Month LIBOR | | | Receive | | | 1.58 | % | | 3/24/20 | | $ | 4,150 | | | $ | (51 | ) | |
† Credit rating as issued by Standard & Poor's.
* Cleared swap agreement, the broker is Morgan Stanley & Co., LLC.
LIBOR London Interbank Offered Rate.
AUD — Australian Dollar
USD — United States Dollar
Portfolio Composition
Classification | | Percentage of
Total Investments | |
Industrials | | | 43.3 | % | |
Finance | | | 29.4 | | |
Other** | | | 17.5 | | |
Asset-Backed Securities | | | 9.8 | | |
Total Investments | | | 100.0 | %*** | |
** Industries and/or investment types representing less than 5% of total investments.
*** Does not include open long/short futures contracts with an underlying face amount of approximately $70,755,000 with net unrealized depreciation of approximately $192,000. Does not include an open foreign currency forward exchange contract with unrealized appreciation of approximately $2,000 and does not include open swap agreements with net unrealized depreciation of approximately $73,000.
The accompanying notes are an integral part of the financial statements.
12
Morgan Stanley Institutional Fund Trust
Annual Report — September 30, 2015
Limited Duration Portfolio
Statement of Assets and Liabilities | | September 30, 2015
(000) | |
Assets: | |
Investments in Securities of Unaffiliated Issuers, at Value (Cost $103,731) | | $ | 104,061 | | |
Investment in Security of Affiliated Issuer, at Value (Cost $750) | | | 750 | | |
Total Investments in Securities, at Value (Cost $104,481) | | | 104,811 | | |
Cash | | | 8 | | |
Interest Receivable | | | 642 | | |
Receivable for Investments Sold | | | 304 | | |
Premium Paid on Open Swap Agreements | | | 13 | | |
Receivable for Variation Margin on Swap Agreements | | | 3 | | |
Unrealized Appreciation on Foreign Currency Forward Exchange Contracts | | | 2 | | |
Unrealized Appreciation on Swap Agreements | | | 1 | | |
Receivable from Affiliate | | | — | @ | |
Other Assets | | | 42 | | |
Total Assets | | | 105,826 | | |
Liabilities: | |
Payable for Investments Purchased | | | 400 | | |
Payable for Portfolio Shares Redeemed | | | 174 | | |
Payable for Advisory Fees | | | 67 | | |
Unrealized Depreciation on Swap Agreements | | | 23 | | |
Payable for Professional Fees | | | 16 | | |
Premium Received on Open Swap Agreements | | | 11 | | |
Payable for Custodian Fees | | | 7 | | |
Payable for Administration Fees | | | 7 | | |
Payable for Trustees' Fees and Expenses | | | 7 | | |
Payable for Sub Transfer Agency Fees — Class I | | | 6 | | |
Payable for Sub Transfer Agency Fees — Class A | | | 1 | | |
Payable for Sub Transfer Agency Fees — Class L | | | — | @ | |
Payable for Transfer Agency Fees — Class I | | | 1 | | |
Payable for Transfer Agency Fees — Class A | | | — | @ | |
Payable for Transfer Agency Fees — Class L | | | — | @ | |
Payable for Transfer Agency Fees — Class C | | | — | @ | |
Payable for Variation Margin on Futures Contracts | | | 1 | | |
Payable for Shareholder Services Fees — Class A | | | — | @ | |
Payable for Distribution and Shareholder Services Fees — Class L | | | — | @ | |
Payable for Distribution and Shareholder Services Fees — Class C | | | — | @ | |
Other Liabilities | | | 26 | | |
Total Liabilities | | | 747 | | |
Net Assets | | $ | 105,079 | | |
Net Assets Consist Of: | |
Paid-in-Capital | | $ | 339,848 | | |
Accumulated Undistributed Net Investment Income | | | 506 | | |
Accumulated Net Realized Loss | | | (235,342 | ) | |
Unrealized Appreciation (Depreciation) on: | |
Investments | | | 330 | | |
Futures Contracts | | | (192 | ) | |
Swap Agreements | | | (73 | ) | |
Foreign Currency Forward Exchange Contracts | | | 2 | | |
Foreign Currency Translations | | | (— | @) | |
Net Assets | | $ | 105,079 | | |
The accompanying notes are an integral part of the financial statements.
13
Morgan Stanley Institutional Fund Trust
Annual Report — September 30, 2015
Limited Duration Portfolio
Statement of Assets and Liabilities (cont'd) | | September 30, 2015
(000) | |
CLASS I: | |
Net Assets | | $ | 102,808 | | |
| Shares Outstanding (unlimited number of shares authorized, no par value) (not in 000's) | | | 13,332,405 | | |
Net Asset Value, Offering and Redemption Price Per Share | | $ | 7.71 | | |
CLASS A: | |
Net Assets | | $ | 1,761 | | |
| Shares Outstanding (unlimited number of shares authorized, no par value) (not in 000's) | | | 227,994 | | |
Net Asset Value, Redemption Price Per Share | | $ | 7.72 | | |
Maximum Sales Load | | | 4.25 | % | |
Maximum Sales Charge | | $ | 0.34 | | |
Maximum Offering Price Per Share | | $ | 8.06 | | |
CLASS L: | |
Net Assets | | $ | 439 | | |
| Shares Outstanding (unlimited number of shares authorized, no par value) (not in 000's) | | | 56,977 | | |
Net Asset Value, Offering and Redemption Price Per Share | | $ | 7.70 | | |
CLASS C: | |
Net Assets | | $ | 71 | | |
| Shares Outstanding (unlimited number of shares authorized, no par value) (not in 000's) | | | 9,209 | | |
Net Asset Value, Offering and Redemption Price Per Share | | $ | 7.69 | | |
@ Amount is less than $500.
The accompanying notes are an integral part of the financial statements.
14
Morgan Stanley Institutional Fund Trust
Annual Report — September 30, 2015
Limited Duration Portfolio
Statement of Operations | | Year Ended
September 30, 2015
(000) | |
Investment Income: | |
Interest from Securities of Unaffiliated Issuers | | $ | 2,490 | | |
Dividends from Security of Affiliated Issuer (Note G) | | | 2 | | |
Total Investment Income | | | 2,492 | | |
Expenses: | |
Advisory Fees (Note B) | | | 332 | | |
Professional Fees | | | 100 | | |
Administration Fees (Note C) | | | 88 | | |
Custodian Fees (Note F) | | | 46 | | |
Registration Fees | | | 45 | | |
Pricing Fees | | | 30 | | |
Shareholder Reporting Fees | | | 27 | | |
Transfer Agency Fees — Class I (Note E) | | | 5 | | |
Transfer Agency Fees — Class A (Note E) | | | 2 | | |
Transfer Agency Fees — Class L (Note E) | | | 2 | | |
Transfer Agency Fees — Class C (Note E) | | | 1 | | |
Shareholder Services Fees — Class A (Note D) | | | 4 | | |
Distribution and Shareholder Services Fees — Class L (Note D) | | | 1 | | |
Distribution and Shareholder Services Fees — Class C (Note D) | | | — | @ | |
Sub Transfer Agency Fees — Class A | | | 3 | | |
Sub Transfer Agency Fees — Class L | | | — | @ | |
Trustees' Fees and Expenses | | | 3 | | |
Other Expenses | | | 10 | | |
Total Expenses | | | 699 | | |
Waiver of Advisory Fees (Note B) | | | (103 | ) | |
Reimbursement of Class Specific Expenses — Class A (Note B) | | | (4 | ) | |
Reimbursement of Class Specific Expenses — Class L (Note B) | | | (1 | ) | |
Reimbursement of Class Specific Expenses — Class C (Note B) | | | (1 | ) | |
Rebate from Morgan Stanley Affiliate (Note G) | | | (2 | ) | |
Net Expenses | | | 588 | | |
Net Investment Income | | | 1,904 | | |
Realized Gain (Loss): | |
Investments Sold | | | 272 | | |
Futures Contracts | | | (505 | ) | |
Swap Agreements | | | (615 | ) | |
Foreign Currency Forward Exchange Contracts | | | 48 | | |
Foreign Currency Transactions | | | (4 | ) | |
Net Realized Loss | | | (804 | ) | |
Change in Unrealized Appreciation (Depreciation): | |
Investments | | | (570 | ) | |
Futures Contracts | | | (306 | ) | |
Swap Agreements | | | (156 | ) | |
Foreign Currency Forward Exchange Contracts | | | 2 | | |
Foreign Currency Translations | | | (— | @) | |
Net Change in Unrealized Appreciation (Depreciation) | | | (1,030 | ) | |
Net Realized Loss and Change in Unrealized Appreciation (Depreciation) | | | (1,834 | ) | |
Net Increase in Net Assets Resulting from Operations | | $ | 70 | | |
@ Amount is less than $500.
The accompanying notes are an integral part of the financial statements.
15
Morgan Stanley Institutional Fund Trust
Annual Report — September 30, 2015
Limited Duration Portfolio
Statements of Changes in Net Assets | | Year Ended
September 30, 2015
(000) | | Year Ended
September 30, 2014
(000) | |
Increase (Decrease) in Net Assets: | |
Operations: | |
Net Investment Income | | $ | 1,904 | | | $ | 1,825 | | |
Net Realized Gain (Loss) | | | (804 | ) | | | 1,041 | | |
Net Change in Unrealized Appreciation (Depreciation) | | | (1,030 | ) | | | (282 | ) | |
Net Increase in Net Assets Resulting from Operations | | | 70 | | | | 2,584 | | |
Distributions from and/or in Excess of: | |
Class I: | |
Net Investment Income | | | (1,478 | ) | | | (1,684 | ) | |
Class A: | |
Net Investment Income | | | (14 | ) | | | (18 | ) | |
Class L: | |
Net Investment Income | | | (2 | ) | | | (1 | ) | |
Class C: | |
Net Investment Income | | | (— | @)* | | | — | | |
Total Distributions | | | (1,494 | ) | | | (1,703 | ) | |
Capital Share Transactions:(1) | |
Class I: | |
Subscribed | | | 6,678 | | | | 14,035 | | |
Distributions Reinvested | | | 1,477 | | | | 1,682 | | |
Redeemed | | | (23,006 | ) | | | (20,486 | ) | |
Class A: | |
Subscribed | | | 2,156 | | | | 2,964 | | |
Distributions Reinvested | | | 14 | | | | 18 | | |
Redeemed | | | (1,330 | ) | | | (2,802 | ) | |
Class L: | |
Subscribed | | | 367 | | | | 110 | | |
Distributions Reinvested | | | 1 | | | | 1 | | |
Redeemed | | | (124 | ) | | | (6 | ) | |
Class C: | |
Subscribed | | | 72 | * | | | — | | |
Distributions Reinvested | | | — | @* | | | — | | |
Redeemed | | | (1 | )* | | | — | | |
Net Decrease in Net Assets Resulting from Capital Share Transactions | | | (13,696 | ) | | | (4,484 | ) | |
Total Decrease in Net Assets | | | (15,120 | ) | | | (3,603 | ) | |
Net Assets: | |
Beginning of Period | | | 120,199 | | | | 123,802 | | |
End of Period (Including Accumulated Undistributed Net Investment Income of $506 and $268) | | $ | 105,079 | | | $ | 120,199 | | |
(1) Capital Share Transactions: | |
Class I: | |
Shares Subscribed | | | 859 | | | | 1,797 | | |
Shares Issued on Distributions Reinvested | | | 190 | | | | 216 | | |
Shares Redeemed | | | (2,959 | ) | | | (2,624 | ) | |
Net Decrease in Class I Shares Outstanding | | | (1,910 | ) | | | (611 | ) | |
Class A: | |
Shares Subscribed | | | 277 | | | | 379 | | |
Shares Issued on Distributions Reinvested | | | 2 | | | | 2 | | |
Shares Redeemed | | | (171 | ) | | | (357 | ) | |
Net Increase in Class A Shares Outstanding | | | 108 | | | | 24 | | |
Class L: | |
Shares Subscribed | | | 47 | | | | 14 | | |
Shares Issued on Distributions Reinvested | | | — | @@ | | | — | @@ | |
Shares Redeemed | | | (16 | ) | | | (1 | ) | |
Net Increase in Class L Shares Outstanding | | | 31 | | | | 13 | | |
Class C: | |
Shares Subscribed | | | 9 | * | | | — | | |
Shares Issued on Distributions Reinvested | | | — | @@* | | | — | | |
Shares Redeemed | | | (— | @@)* | | | — | | |
Net Increase in Class C Shares Outstanding | | | 9 | | | | — | | |
* For the period April 30, 2015 through September 30, 2015.
@ Amount is less than $500.
@@ Amount is less than 500 shares.
The accompanying notes are an integral part of the financial statements.
16
Morgan Stanley Institutional Fund Trust
Annual Report — September 30, 2015
Financial Highlights
Limited Duration Portfolio
| | | Class I | |
| | | Year Ended September 30, | |
Selected Per Share Data and Ratios | | 2015 | | 2014 | | 2013 | | 2012 | | 2011 | |
Net Asset Value, Beginning of Period | | $ | 7.81 | | | $ | 7.76 | | | $ | 7.80 | | | $ | 7.71 | | | $ | 7.79 | | |
Income (Loss) from Investment Operations: | |
Net Investment Income† | | | 0.13 | | | | 0.12 | | | | 0.11 | | | | 0.15 | | | | 0.16 | | |
Net Realized and Unrealized Gain (Loss) | | | (0.12 | ) | | | 0.04 | | | | (0.03 | ) | | | 0.11 | | | | (0.10 | ) | |
Total from Investment Operations | | | 0.01 | | | | 0.16 | | | | 0.08 | | | | 0.26 | | | | 0.06 | | |
Distributions from and/or in Excess of: | |
Net Investment Income | | | (0.11 | ) | | | (0.11 | ) | | | (0.12 | ) | | | (0.17 | ) | | | (0.14 | ) | |
Net Asset Value, End of Period | | $ | 7.71 | | | $ | 7.81 | | | $ | 7.76 | | | $ | 7.80 | | | $ | 7.71 | | |
Total Return++ | | | 0.06 | % | | | 2.06 | % | | | 1.09 | % | | | 3.35 | % | | | 0.71 | % | |
Ratios and Supplemental Data: | |
Net Assets, End of Period (Thousands) | | $ | 102,808 | | | $ | 119,059 | | | $ | 122,958 | | | $ | 145,387 | | | $ | 167,811 | | |
Ratio of Expenses to Average Net Assets (1) | | | 0.53 | %+ | | | 0.53 | %+ | | | 0.71 | %+^ | | | 0.63 | %+ | | | 0.59 | %+ | |
Ratio of Net Investment Income to Average Net Assets (1) | | | 1.72 | %+ | | | 1.49 | %+ | | | 1.45 | %+^ | | | 1.92 | %+ | | | 2.12 | %+ | |
Ratio of Rebate from Morgan Stanley Affiliates to Average Net Assets | | | 0.00 | %§ | | | 0.00 | %§ | | | 0.00 | %§ | | | 0.00 | %§ | | | 0.00 | %§ | |
Portfolio Turnover Rate | | | 41 | % | | | 60 | % | | | 66 | % | | | 51 | % | | | 35 | % | |
(1) Supplemental Information on the Ratios to Average Net Assets: | |
Ratios Before Expense Limitation: | |
Expenses to Average Net Assets | | | 0.63 | % | | | 0.78 | % | | | 0.72 | % | | | N/A | | | | N/A | | |
Net Investment Income to Average Net Assets | | | 1.62 | % | | | 1.24 | % | | | 1.44 | % | | | N/A | | | | N/A | | |
† Per share amount is based on average shares outstanding.
++ Calculated based on the net asset value as of the last business day of the period.
+ The Ratios of Expenses and Net Investment Income reflect the rebate of certain Portfolio expenses in connection with the investments in Morgan Stanley affiliates during the period. The effect of the rebate on the ratios is disclosed in the above table as "Ratio of Rebate from Morgan Stanley Affiliates to Average Net Assets."
§ Amount is less than 0.005%.
^ Effective September 16, 2013, the Adviser has agreed to limit the ratio of expenses to average net assets to the maximum ratio of 0.53% for Class I shares.
The accompanying notes are an integral part of the financial statements.
17
Morgan Stanley Institutional Fund Trust
Annual Report — September 30, 2015
Financial Highlights
Limited Duration Portfolio
| | | Class A | |
| | | Year Ended September 30, | |
Selected Per Share Data and Ratios | | 2015 | | 2014 | | 2013 | | 2012 | | 2011 | |
Net Asset Value, Beginning of Period | | $ | 7.83 | | | $ | 7.77 | | | $ | 7.80 | | | $ | 7.71 | | | $ | 7.79 | | |
Income (Loss) from Investment Operations: | |
Net Investment Income† | | | 0.11 | | | | 0.09 | | | | 0.09 | | | | 0.13 | | | | 0.15 | | |
Net Realized and Unrealized Gain (Loss) | | | (0.14 | ) | | | 0.05 | | | | (0.01 | ) | | | 0.11 | | | | (0.12 | ) | |
Total from Investment Operations | | | (0.03 | ) | | | 0.14 | | | | 0.08 | | | | 0.24 | | | | 0.03 | | |
Distributions from and/or in Excess of: | |
Net Investment Income | | | (0.08 | ) | | | (0.08 | ) | | | (0.11 | ) | | | (0.15 | ) | | | (0.11 | ) | |
Net Asset Value, End of Period | | $ | 7.72 | | | $ | 7.83 | | | $ | 7.77 | | | $ | 7.80 | | | $ | 7.71 | | |
Total Return++ | | | (0.41 | )% | | | 1.78 | % | | | 0.84 | % | | | 3.22 | % | | | 0.45 | % | |
Ratios and Supplemental Data: | |
Net Assets, End of Period (Thousands) | | $ | 1,761 | | | $ | 940 | | | $ | 749 | | | $ | 145 | | | $ | 194 | | |
Ratio of Expenses to Average Net Assets (1) | | | 0.88 | %+ | | | 0.88 | %+ | | | 0.97 | %+^ | | | 0.88 | %+ | | | 0.84 | %+ | |
Ratio of Net Investment Income to Average Net Assets (1) | | | 1.40 | %+ | | | 1.14 | %+ | | | 1.15 | %+^ | | | 1.70 | %+ | | | 1.87 | %+ | |
Ratio of Rebate from Morgan Stanley Affiliates to Average Net Assets | | | 0.00 | %§ | | | 0.00 | %§ | | | 0.00 | %§ | | | 0.00 | %§ | | | 0.00 | %§ | |
Portfolio Turnover Rate | | | 41 | % | | | 60 | % | | | 66 | % | | | 51 | % | | | 35 | % | |
(1) Supplemental Information on the Ratios to Average Net Assets: | |
Ratios Before Expense Limitation: | |
Expenses to Average Net Assets | | | 1.22 | % | | | 1.10 | % | | | 1.00 | % | | | N/A | | | | N/A | | |
Net Investment Income to Average Net Assets | | | 1.06 | % | | | 0.92 | % | | | 1.12 | % | | | N/A | | | | N/A | | |
† Per share amount is based on average shares outstanding.
++ Calculated based on the net asset value which does not reflect sales charges, if applicable, as of the last business day of the period.
+ The Ratios of Expenses and Net Investment Income reflect the rebate of certain Portfolio expenses in connection with the investments in Morgan Stanley affiliates during the period. The effect of the rebate on the ratios is disclosed in the above table as "Ratio of Rebate from Morgan Stanley Affiliates to Average Net Assets."
^ Effective September 16, 2013, the Adviser has agreed to limit the ratio of expenses to average net assets to the maximum ratio of 0.88% for Class A shares.
§ Amount is less than 0.005%.
The accompanying notes are an integral part of the financial statements.
18
Morgan Stanley Institutional Fund Trust
Annual Report — September 30, 2015
Financial Highlights
Limited Duration Portfolio
| | | Class L | |
| | | Year Ended September 30, | | Period from
April 27, 2012^ to | |
Selected Per Share Data and Ratios | | 2015 | | 2014 | | 2013 | | September 30, 2012 | |
Net Asset Value, Beginning of Period | | $ | 7.80 | | | $ | 7.75 | | | $ | 7.80 | | | $ | 7.76 | | |
Income (Loss) from Investment Operations: | |
Net Investment Income† | | | 0.08 | | | | 0.06 | | | | 0.07 | | | | 0.04 | | |
Net Realized and Unrealized Gain (Loss) | | | (0.13 | ) | | | 0.05 | | | | (0.03 | ) | | | 0.04 | | |
Total from Investment Operations | | | (0.05 | ) | | | 0.11 | | | | 0.04 | | | | 0.08 | | |
Distributions from and/or in Excess of: | |
Net Investment Income | | | (0.05 | ) | | | (0.06 | ) | | | (0.09 | ) | | | (0.04 | ) | |
Net Asset Value, End of Period | | $ | 7.70 | | | $ | 7.80 | | | $ | 7.75 | | | $ | 7.80 | | |
Total Return++ | | | (0.68 | )% | | | 1.38 | % | | | 0.48 | % | | | 1.06 | %# | |
Ratios and Supplemental Data: | |
Net Assets, End of Period (Thousands) | | $ | 439 | | | $ | 200 | | | $ | 95 | | | $ | 10 | | |
Ratio of Expenses to Average Net Assets (1) | | | 1.23 | %+ | | | 1.23 | %+ | | | 1.24 | %+^^ | | | 1.21 | %+* | |
Ratio of Net Investment Income to Average Net Assets (1) | | | 1.05 | %+ | | | 0.79 | %+ | | | 0.85 | %+^^ | | | 1.14 | %+* | |
Ratio of Rebate from Morgan Stanley Affiliates to Average Net Assets | | | 0.00 | %§ | | | 0.00 | § | | | 0.00 | %§ | | | 0.00 | %*§ | |
Portfolio Turnover Rate | | | 41 | % | | | 60 | % | | | 66 | % | | | 51 | %# | |
(1) Supplemental Information on the Ratios to Average Net Assets: | |
Ratios Before Expense Limitation: | |
Expenses to Average Net Assets | | | 1.80 | % | | | 3.48 | % | | | 1.34 | % | | | N/A | | |
Net Investment Income (Loss) to Average Net Assets | | | 0.48 | % | | | (1.46 | )% | | | 0.75 | % | | | N/A | | |
^ Commencement of Operations.
† Per share amount is based on average shares outstanding.
++ Calculated based on the net asset value as of the last business day of the period.
+ The Ratios of Expenses and Net Investment Income reflect the rebate of certain Portfolio expenses in connection with the investments in Morgan Stanley affiliates during the period. The effect of the rebate on the ratios is disclosed in the above table as "Ratio of Rebate from Morgan Stanley Affiliates to Average Net Assets."
§ Amount is less than 0.005%.
^^ Effective September 16, 2013, the Adviser has agreed to limit the ratio of expenses to average net assets to the maximum ratio of 1.23% for Class L shares.
# Not Annualized.
* Annualized.
The accompanying notes are an integral part of the financial statements.
19
Morgan Stanley Institutional Fund Trust
Annual Report — September 30, 2015
Financial Highlights
Limited Duration Portfolio
| | | Class C | |
Selected Per Share Data and Ratios | | Period from
April 30, 2015^ to
September 30, 2015 | |
Net Asset Value, Beginning of Period | | $ | 7.78 | | |
Income (Loss) from Investment Operations: | |
Net Investment Income† | | | 0.02 | | |
Net Realized and Unrealized Loss | | | (0.09 | ) | |
Total from Investment Operations | | | (0.07 | ) | |
Distributions from and/or in Excess of: | |
Net Investment Income | | | (0.02 | ) | |
Net Asset Value, End of Period | | $ | 7.69 | | |
Total Return++ | | | (0.92 | )%# | |
Ratios and Supplemental Data: | |
Net Assets, End of Period, (Thousands) | | $ | 71 | | |
Ratios of Expenses to Average Net Assets (1) | | | 1.63 | %+* | |
Ratio of Net Investment Income to Average Net Assets (1) | | | 0.73 | %+* | |
Ratio of Rebate from Morgan Stanley Affiliates to Average Net Assets | | | 0.00 | %§ | |
Portfolio Turnover Rate | | | 41 | %# | |
(1) Supplemental Information on the Ratios to Average Net Assets: | |
Ratios Before Expense Limitation: | |
Expense to Average Net Assets | | | 6.73 | %* | |
Net Investment Loss to Average Net Assets | | | (4.37 | )%* | |
^ Commencement of Operations
† Per share amount is based on average shares outstanding.
++ Calculated based on the net asset value which does not reflect sales charges, if applicable, as of the last business day of the period.
+ The Ratios of Expenses and Net Investment Income reflect the rebate of certain Portfolio expenses in connection with the investments in Morgan Stanley affiliates during the period. The effect of the rebate on the ratios is disclosed in the above table as "Ratio of Rebate from Morgan Stanley Affiliates to Average Net Assets."
§ Amount is less than 0.005%.
# Not Annualized.
* Annualized.
The accompanying notes are an integral part of the financial statements.
20
Morgan Stanley Institutional Fund Trust
Annual Report — September 30, 2015
Notes to Financial Statements
Morgan Stanley Institutional Fund Trust ("MSIFT'' or the "Fund'') is registered under the Investment Company Act of 1940, as amended (the "Act''), as an open-end management investment company. The Fund is comprised of nine separate, active portfolios (individually referred to as a "Portfolio", collectively as the "Portfolios"). The Fund applies investment company accounting and reporting guidance. All Portfolios are considered diversified for purposes of the Act.
The accompanying financial statements relate to the Limited Duration Portfolio. The Portfolio seeks above-average total return over a market cycle of three to five years. The Portfolio offers four classes of shares — Class I, Class A, Class L and Class C.
On April 30, 2015, the Portfolio commenced offering Class C shares.
A. Significant Accounting Policies: The following significant accounting policies are in conformity with U.S. generally accepted accounting principles ("GAAP"). Such policies are consistently followed by the Fund in the preparation of its financial statements. GAAP may require management to make estimates and assumptions that affect the reported amounts and disclosures in the financial statements. Actual results may differ from those estimates.
1. Security Valuation: (1) Certain portfolio securities may be valued by an outside pricing service approved by the Fund's Board of Trustees (the "Trustees"). The pricing service may utilize a matrix system or other model incorporating attributes such as security quality, maturity and coupon as the evaluation model parameters, and/or research evaluations by its staff, including review of broker-dealer market price quotations in determining what it believes is the fair valuation of the portfolios securities valued by such pricing service; (2) futures are valued at the latest price published by the commodities exchange on which they trade; (3) swaps are marked-to-market daily based upon quotations from market makers; (4) when market quotations are not readily available, including circumstances under which Morgan Stanley Investment Management Inc. (the "Adviser") determines that the closing price, last sale price or the mean between the last reported bid and asked prices are not reflective of a security's market value, portfolio securities are valued at their fair value as determined in good faith under procedures established by and under the general supervision of the Trustees. Occasionally, developments affecting the closing prices of securities and other assets may occur between the times at which valuations of such securities are determined
(that is, close of the foreign market on which the securities trade) and the close of business of the New York Stock Exchange ("NYSE"). If developments occur during such periods that are expected to materially affect the value of such securities, such valuations may be adjusted to reflect the estimated fair value of such securities as of the close of the NYSE, as determined in good faith by the Trustees or by the Adviser using a pricing service and/or procedures approved by the Trustees; (5) quotations of foreign portfolio securities, other assets and liabilities and forward contracts stated in foreign currency are translated into U.S. dollar equivalents at the prevailing market rates prior to the close of the NYSE; (6) investments in mutual funds, including the Morgan Stanley Institutional Liquidity Funds, are valued at the net asset value ("NAV") as of the close of each business day; and (7) short-term taxable debt securities with remaining maturities of 60 days or less at the time of purchase may be valued at amortized cost, unless the Adviser determines such price does not reflect the securities' market value, in which case these securities will be valued at their fair market value determined by the Adviser. Other taxable short-term debt securities with maturities of more than 60 days will be valued on a mark-to-market basis until such time as they reach a maturity of 60 days, whereupon they will be valued at amortized cost using their value on the 61st day unless the Adviser determines such price does not reflect the securities' fair value, in which case these securities will be valued at their fair market value as determined by the Adviser.
The Trustees have responsibility for determining in good faith the fair value of the investments, and the Trustees may appoint others, such as the Fund's Adviser or a valuation committee, to assist the Trustees in determining fair value and to make the actual calculations pursuant to the fair valuation methodologies previously approved by the Trustees. Under procedures approved by the Trustees, the Fund's Adviser has formed a Valuation Committee whose members are approved by the Trustees. The Valuation Committee provides administration and oversight of the Fund's valuation policies and procedures, which are reviewed at least annually by the Trustees. These procedures allow the Fund to utilize independent pricing services, quotations from securities and financial instrument dealers, and other market sources to determine fair value.
The Fund has procedures to determine the fair value of securities and other financial instruments for which
21
Morgan Stanley Institutional Fund Trust
Annual Report — September 30, 2015
Notes to Financial Statements (cont'd)
market prices are not readily available. Under these procedures, the Valuation Committee convenes on a regular and ad hoc basis to review such securities and considers a number of factors, including valuation methodologies and significant unobservable valuation inputs, when arriving at fair value. The Valuation Committee may employ a market-based approach which may use related or comparable assets or liabilities, recent transactions, market multiples, book values, and other relevant information for the investment to determine the fair value of the investment. An income-based valuation approach may also be used in which the anticipated future cash flows of the investment are discounted to calculate fair value. Discounts may also be applied due to the nature or duration of any restrictions on the disposition of the investments. Due to the inherent uncertainty of valuations of such investments, the fair values may differ significantly from the values that would have been used had an active market existed. The Valuation Committee employs various methods for calibrating these valuation approaches including a regular review of valuation methodologies, key inputs and assumptions, transactional back-testing or disposition analysis, and reviews of any related market activity.
2. Fair Value Measurement: Financial Accounting Standards Board ("FASB") Accounting Standards CodificationTM ("ASC") 820, "Fair Value Measurement" ("ASC 820"), defines fair value as the value that the Fund would receive to sell an investment or pay to transfer a liability in a timely transaction with an independent buyer in the principal market, or in the absence of a principal market the most advantageous market for the investment or liability. ASC 820 establishes a three-tier hierarchy to distinguish between (1) inputs that reflect the assumptions market participants would use in valuing an asset or liability developed based on market data obtained from sources independent of the reporting entity (observable inputs) and (2) inputs that reflect the reporting entity's own assumptions about the assumptions market participants would use in valuing an asset or liability developed based on the best information available in the circumstances (unobservable inputs) and to establish classification of fair value measurements for disclosure purposes. Various inputs are used in determining the value of the Fund's investments. The inputs are summarized in the three broad levels listed below.
• Level 1 – unadjusted quoted prices in active markets for identical investments
• Level 2 – other significant observable inputs (including quoted prices for similar investments, interest rates, prepayment speeds, credit risk, etc.)
• Level 3 – significant unobservable inputs including the Fund's own assumptions in determining the fair value of investments. Factors considered in making this determination may include, but are not limited to, information obtained by contacting the issuer, analysts, or the appropriate stock exchange (for exchange-traded securities), analysis of the issuer's financial statements or other available documents and, if necessary, available information concerning other securities in similar circumstances
The inputs or methodology used for valuing securities are not necessarily an indication of the risk associated with investing in those securities and the determination of the significance of a particular input to the fair value measurement in its entirety requires judgment and considers factors specific to each security.
The following is a summary of the inputs used to value the Portfolio's investments as of September 30, 2015.
Investment Type | | Level 1
Unadjusted
quoted
prices
(000) | | Level 2
Other
significant
observable
inputs
(000) | | Level 3
Significant
unobservable
inputs
(000) | | Total
(000) | |
Assets: | |
Fixed Income Securities | |
Agency Adjustable Rate
Mortgages | | $ | — | | | $ | 2,560 | | | $ | — | | | $ | 2,560 | | |
Agency Fixed Rate
Mortgages | | | — | | | | 455 | | | | — | | | | 455 | | |
Asset-Backed Securities | | | — | | | | 10,291 | | | | — | | | | 10,291 | | |
Collateralized Mortgage
Obligations — Agency
Collateral Series | | | — | | | | 1,286 | | | | — | | | | 1,286 | | |
Commercial Mortgage-
Backed Securities | | | — | | | | 2,177 | | | | — | | | | 2,177 | | |
Corporate Bonds | | | — | | | | 79,963 | | | | — | | | | 79,963 | | |
Mortgages — Other | | | — | | | | 4,756 | | | | — | | | | 4,756 | | |
Sovereign | | | — | | | | 1,709 | | | | — | | | | 1,709 | | |
Total Fixed Income
Securities | | | — | | | | 103,197 | | | | — | | | | 103,197 | | |
Short-Term Investments | |
Investment Company | | | 750 | | | | — | | | | — | | | | 750 | | |
U.S Treasury Security | | | — | | | | 864 | | | | — | | | | 864 | | |
Total Short-Term
Investments | | | 750 | | | | 864 | | | | — | | | | 1,614 | | |
22
Morgan Stanley Institutional Fund Trust
Annual Report — September 30, 2015
Notes to Financial Statements (cont'd)
Investment Type | | Level 1
Unadjusted
quoted
prices
(000) | | Level 2
Other
significant
observable
inputs
(000) | | Level 3
Significant
unobservable
inputs
(000) | | Total
(000) | |
Foreign Currency
Forward Exchange
Contract | | $ | — | | | $ | 2 | | | $ | — | | | $ | 2 | | |
Futures Contracts | | | 43 | | | | — | | | | — | | | | 43 | | |
Credit Default Swap
Agreement | | | — | | | | 1 | | | | — | | | | 1 | | |
Total Assets | | | 793 | | | | 104,064 | | | | — | | | | 104,857 | | |
Liabilities: | |
Futures Contracts | | | (235 | ) | | | — | | | | — | | | | (235 | ) | |
Credit Default Swap
Agreement | | | — | | | | (23 | ) | | | — | | | | (23 | ) | |
Interest Rate Swap
Agreement | | | — | | | | (51 | ) | | | — | | | | (51 | ) | |
Total Liabilities | | | (235 | ) | | | (74 | ) | | | — | | | | (309 | ) | |
Total | | $ | 558 | | | $ | 103,990 | | | $ | — | | | $ | 104,548 | | |
Transfers between investment levels may occur as the markets fluctuate and/or the availability of data used in an investment's valuation changes. The Portfolio recognizes transfers between the levels as of the end of the period. As of September 30, 2015, the Portfolio did not have any investments transfer between investment levels.
3. Foreign Currency Translation and Foreign Investments: The books and records of the Portfolio are maintained in U.S. dollars. Foreign currency amounts are translated into U.S. dollars as follows:
– investments, other assets and liabilities at the prevailing rate of exchange on the valuation date;
– investment transactions and investment income at the prevailing rates of exchange on the dates of such transactions.
Although the net assets of the Portfolio are presented at the foreign exchange rates and market values at the close of the period, the Portfolio does not isolate that portion of the results of operations arising as a result of changes in the foreign exchange rates from the fluctuations arising from changes in the market prices of securities held at period end. Similarly, the Portfolio does not isolate the effect of changes in foreign exchange rates from the fluctuations arising from changes in the market prices of securities sold during the period. Accordingly, realized and unrealized foreign currency gains (losses) on investments in securities are included in the reported net realized and unrealized gains (losses) on investment transactions and balances. However, pursuant to U.S. Federal income tax regulations, gains and losses from
certain foreign currency transactions and the foreign currency portion of gains and losses realized on sales and maturities of foreign denominated debt securities are treated as ordinary income for U.S. Federal income tax purposes.
Net realized gains (losses) on foreign currency transactions represent net foreign exchange gains (losses) from currency gains (losses) realized between the trade and settlement dates on securities transactions, and the difference between the amount of investment income and foreign withholding taxes recorded on the Portfolio's books and the U.S. dollar equivalent amounts actually received or paid. Net unrealized currency gains (losses) from valuing foreign currency denominated assets and liabilities at period end exchange rates are reflected as a component of unrealized appreciation (depreciation) in the Statement of Assets and Liabilities. The change in unrealized currency gains (losses) on foreign currency translations on foreign currency translations for the period is reflected in the Statement of Operations.
Foreign security and currency transactions may involve certain considerations and risks not typically associated with those of U.S. dollar denominated transactions as a result of, among other factors, fluctuations of exchange rates in relation to the U.S. dollar, the possibility of lower levels of governmental supervision and regulation of foreign securities markets and the possibility of political or economic instability.
Governmental approval for foreign investments may be required in advance of making an investment under certain circumstances in some countries, and the extent of foreign investments in domestic companies may be subject to limitation in other countries. Foreign ownership limitations also may be imposed by the charters of individual companies to prevent, among other concerns, violations of foreign investment limitations. As a result, an additional class of shares (identified as "Foreign" in the Portfolio of Investments) may be created and offered for investment. The "local" and "foreign shares" market values may differ. In the absence of trading of the foreign shares in such markets, the Portfolio values the foreign shares at the closing exchange price of the local shares.
4. Derivatives: The Portfolio may, but is not required to, use derivative instruments for a variety of purposes, including hedging, risk management, portfolio management or to earn income. Derivatives are financial instruments whose
23
Morgan Stanley Institutional Fund Trust
Annual Report — September 30, 2015
Notes to Financial Statements (cont'd)
value is based, in part, on the value of an underlying asset, interest rate, index or financial instrument. Prevailing interest rates and volatility levels, among other things, also affect the value of derivative instruments. A derivative instrument often has risks similar to its underlying asset and may have additional risks, including imperfect correlation between the value of the derivative and the underlying asset, risks of default by the counterparty to certain transactions, magnification of losses incurred due to changes in the market value of the securities, instruments, indices or interest rates to which the derivative instrument relates, risks that the transactions may not be liquid and risks arising from margin requirements. The use of derivatives involves risks that are different from, and possibly greater than, the risks associated with other portfolio investments. Derivatives may involve the use of highly specialized instruments that require investment techniques and risk analyses different from those associated with other portfolio investments. All of the Portfolio's holdings, including derivative instruments, are marked-to-market each day with the change in value reflected in unrealized appreciation (depreciation). Upon disposition, a realized gain or loss is recognized.
Certain derivative transactions may give rise to a form of leverage. Leverage magnifies the potential for gain and the risk of loss. Leverage associated with derivative transactions may cause the Portfolio to liquidate portfolio positions when it may not be advantageous to do so to satisfy its obligations or to meet earmarking or segregation requirements, pursuant to applicable Securities and Exchange Commission rules and regulations, or may cause the Portfolio to be more volatile than if the Portfolio had not been leveraged. Although the Adviser seeks to use derivatives to further the Portfolio's investment objectives, there is no assurance that the use of derivatives will achieve this result.
Following is a description of the derivative instruments and techniques that the Portfolio used during the period and their associated risks:
Foreign Currency Forward Exchange Contracts: In connection with its investments in foreign securities, the Portfolio also entered into contracts with banks, brokers or dealers to purchase or sell securities or foreign currencies at a future date. A foreign currency forward exchange contract ("currency contract") is a negotiated agreement between the contracting parties to exchange a specified amount of currency at a specified future time
at a specified rate. The rate can be higher or lower than the spot rate between the currencies that are the subject of the contract. Currency contracts may be used to protect against uncertainty in the level of future foreign currency exchange rates or to gain or modify exposure to a particular currency. To the extent hedged by the use of currency contracts, the precise matching of the currency contract amounts and the value of the securities involved will not generally be possible because the future value of such securities in foreign currencies will change as a consequence of market movements in the value of those securities between the date on which the contract is entered into and the date it matures. Furthermore, such transactions may reduce or preclude the opportunity for gain if the value of the currency should move in the direction opposite to the position taken. There is additional risk to the extent that currency contracts create exposure to currencies in which the Portfolio's securities are not denominated. Unanticipated changes in currency prices may result in poorer overall performance for the Portfolio than if it had not entered into such contracts. The use of currency contracts involves the risk of loss from the insolvency or bankruptcy of the counterparty to the contract or the failure of the counterparty to make payments or otherwise comply with the terms of the contract. A currency contract is marked-to-market daily and the change in market value is recorded by the Portfolio as unrealized gain or loss. The Portfolio records realized gains (losses) when the currency contract is closed equal to the difference between the value of the currency contract at the time it was opened and the value at the time it was closed.
Futures: A futures contract is a standardized, exchange-traded agreement to buy or sell a specific quantity of an underlying asset, reference rate or index at a specific price at a specific future time. The value of a futures contract tends to increase and decrease in tandem with the value of the underlying instrument. Depending on the terms of the particular contract, futures contracts are settled through either physical delivery of the underlying instrument on the settlement date or by payment of a cash settlement amount on the settlement date. During the period the futures contract is open, payments are received from or made to the broker based upon changes in the value of the contract (the variation margin). A decision as to whether, when and how to use futures contracts involves the exercise of skill and
24
Morgan Stanley Institutional Fund Trust
Annual Report — September 30, 2015
Notes to Financial Statements (cont'd)
judgment and even a well-conceived futures transaction may be unsuccessful because of market behavior or unexpected events. In addition to the derivatives risks discussed above, the prices of futures contracts can be highly volatile, using futures contracts can lower total return, and the potential loss from futures contracts can exceed the Portfolio's initial investment in such contracts. No assurance can be given that a liquid market will exist for any particular futures contract at any particular time. There is also the risk of loss by the Portfolio of margin deposits in the event of bankruptcy of a broker with which the Portfolio has open positions in the futures contract.
Swaps: The Portfolio may enter into over-the-counter ("OTC") swap contracts or cleared swap transactions. A swap contract is an agreement between two parties pursuant to which the parties exchange payments at specified dates on the basis of a specified notional amount, with the payments calculated by reference to specified securities, indices, reference rates, currencies or other instruments. Typically swap agreements provide that when the period payment dates for both parties are the same, the payments are made on a net basis (i.e., the two payment streams are netted out, with only the net amount paid by one party to the other). The Portfolio's obligations or rights under a swap contract entered into on a net basis will generally be equal only to the net amount to be paid or received under the agreement, based on the relative values of the positions held by each party. Cleared swap transactions may help reduce counterparty credit risk. In a cleared swap, the Portfolio's ultimate counterparty is a clearinghouse rather than a swap dealer, bank or other financial institution. OTC swap agreements are not entered into or traded on exchanges and often there is no central clearing or guaranty function for OTC swaps. These OTC swaps are often subject to credit risk or the risk of default or non-performance by the counterparty. Both OTC and cleared swaps could result in losses if interest rates, foreign currency exchange rates or other factors are not correctly anticipated by the Portfolio or if the reference index, security or investments do not perform as expected. During the period swap agreements are open, payments are received from or made to the clearinghouse or counterparty based upon changes in the value of the contract (variation margin). The Dodd-Frank Wall Street Reform and
Consumer Protection Act and related regulatory developments require the clearing and exchange-trading of certain standardized swap transactions. Mandatory exchange-trading and clearing is occurring on a phased-in basis.
The Portfolio's use of swaps during the period included those based on the credit of an underlying security commonly referred to as "credit default swaps." The Portfolio may be either the buyer or seller in a credit default swap. Where the Portfolio is the buyer of a credit default swap contract, it would typically be entitled to receive the par (or other agreed-upon) value of a referenced debt obligation from the counterparty to the contract only in the event of a default or similar event by the issuer of the debt obligation. If no default occurs, the Portfolio would have paid to the counterparty a periodic stream of payments over the term of the contract and received no benefit from the contract. When the Portfolio is the seller of a credit default swap contract, it typically receives the stream of payments but is obligated to pay an amount equal to the par (or other agreed-upon) value of a referenced debt obligation upon the default or similar event by the issuer of the referenced debt obligation. The use of credit default swaps could result in losses to the Portfolio if the Adviser fails to correctly evaluate the creditworthiness of the issuer of the referenced debt obligation.
If the Portfolio is a seller of protection and a credit event occurs, as defined under the terms of that particular swap agreement, the Portfolio will either (i) pay to the buyer of protection an amount equal to the notional amount of the swap agreement and take delivery of the referenced obligation, other deliverable obligations or underlying securities comprising the referenced index or (ii) pay a net settlement amount in the form of cash or securities equal to the notional amount of the swap agreement less the recovery value of the referenced obligation or underlying securities comprising the referenced index. If the Portfolio is a buyer of protection and a credit event occurs, as defined under the terms of that particular swap agreement, the Portfolio will either (i) receive from the seller of protection an amount equal to the notional amount of the swap agreement and deliver the referenced obligation, other deliverable obligations or underlying securities comprising the referenced index or (ii) receive a net settlement amount in the form
25
Morgan Stanley Institutional Fund Trust
Annual Report — September 30, 2015
Notes to Financial Statements (cont'd)
of cash or securities equal to the notional amount of the swap agreement less the recovery value of the referenced obligation or underlying securities comprising the referenced index. Recovery values are estimated by market makers considering either industry standard recovery rates or entity specific factors and considerations until a credit event occurs. If a credit event has occurred, the recovery value is determined by a facilitated auction whereby a minimum number of allowable broker bids, together with a specified valuation method, are used to calculate the settlement value. The Portfolio's maximum risk of loss from counterparty risk, either as the protection seller or as the protection buyer, is the fair value of the swap agreement.
The current credit rating of each individual issuer is listed in the table following the Portfolio of Investments and serves as an indicator of the current status of the payment/performance risk of the credit derivative. Alternatively, for credit default swaps on an index of credits, the quoted market prices and current values serve as an indicator of the current status of the payment/performance risk of the credit derivative. Generally, lower credit ratings and increasing market values, in absolute terms, represent a deterioration of the credit and a greater likelihood of an adverse credit event of the issuer.
When the Portfolio has an unrealized loss on a swap agreement, the Portfolio has instructed the custodian to pledge cash or liquid securities as collateral with a value approximately equal to the amount of the unrealized loss. Collateral pledges are monitored and subsequently adjusted if and when the swap valuations fluctuate. If applicable, cash collateral is included with "Due from (to) Broker" in the Statement of Assets and Liabilities.
Upfront payments received or paid by the Portfolio will be reflected as an asset or liability, respectively, in the Statement of Assets and Liabilities.
FASB ASC 815, "Derivatives and Hedging" ("ASC 815"), is intended to improve financial reporting about derivative instruments by requiring enhanced disclosures to enable investors to better understand how and why the Portfolio uses derivative instruments, how these derivative instruments are accounted for and their effects on the Portfolio's financial position and results of operations.
The following tables set forth the fair value of the Portfolio's derivative contracts by primary risk exposure as of September 30, 2015.
| | | Asset Derivatives
Statement of Assets and
Liabilities Location | | Primary Risk
Exposure | | Value
(000) | |
Foreign Currency
Forward Exchange
Contract | | Unrealized Appreciation on
Foreign Currency
Forward Exchange Contract | |
Currency Risk | | $ | 2 | | |
Futures Contracts
| | Variation Margin on
Futures Contracts | | Interest Rate Risk | | | 43 | (a) | |
Swap Agreement
| | Unrealized Appreciation on
Swap Agreement | | Credit Risk | | | 1 | | |
Total | | | | | | $ | 46 | | |
| | | Liability Derivatives
Statement of Assets and
Liabilities Location | | Primary Risk
Exposure | | Value
(000) | |
Futures Contract
| | Variation Margin on
Futures Contract | |
Interest Rate Risk | | $ | (235 | )(a) | |
Swap Agreement
| | Unrealized Depreciation on
Swap Agreement | |
Credit Risk | | | (23 | ) | |
Swap Agreement
| | Variation Margin on
Swap Agreement | |
Interest Rate Risk | | | (51 | )(a) | |
Total | | | | | | $ | (309 | ) | |
(a) This amount represents the cumulative appreciation (depreciation) as reported in the Portfolio of Investments. The Statement of Assets and Liabilities only reflects the current day's net variation margin.
The following tables set forth by primary risk exposure the Portfolio's realized gains (losses) and change in unrealized appreciation (depreciation) by type of derivative contract for the year ended September 30, 2015 in accordance with ASC 815.
Realized Gain (Loss) | |
Primary Risk Exposure | | Derivative Type | | Value
(000) | |
Currency Risk
| | Foreign Currency
Forward Exchange Contract | | $ | 48 | | |
Interest Rate Risk | | Futures Contracts | | | (505 | ) | |
Credit Risk | | Swap Agreements | | | (11 | ) | |
Interest Rate Risk | | Swap Agreements | | | (604 | ) | |
Total | | | | $ | (1,072 | ) | |
Change in Unrealized Appreciation (Depreciation) | |
Primary Risk Exposure | | Derivative Type | | Value
(000) | |
Currency Risk
| | Foreign Currency
Forward Exchange Contract | | $ | 2 | | |
Interest Rate Risk | | Futures Contracts | | | (306 | ) | |
Credit Risk | | Swap Agreements | | | (12 | ) | |
Interest Rate Risk | | Swap Agreements | | | (144 | ) | |
Total | | | | $ | (460 | ) | |
26
Morgan Stanley Institutional Fund Trust
Annual Report — September 30, 2015
Notes to Financial Statements (cont'd)
At September 30, 2015, the Portfolio's derivative assets and liabilities are as follows:
Gross Amounts of Assets and Liabilities Presented in the
Statement of Assets and Liabilities | |
Derivatives(b) | | Assets(c)
(000) | | Liabilities(c)
(000) | |
Foreign Currency Forward Exchange Contract | | $ | 2 | | | $ | — | | |
Swap Agreements | | | 1 | | | | (23 | ) | |
Total | | $ | 3 | | | $ | (23 | ) | |
(b) Excludes exchange traded derivatives.
(c) Absent an event of default or early termination, OTC derivative assets and liabilities are presented gross and not offset in the Statement of Assets and Liabilities.
The Portfolio typically enters into International Swaps and Derivatives Association, Inc. Master Agreements ("ISDA Master Agreements") or similar master agreements (collectively, "Master Agreements") with its contract counterparties for certain OTC derivatives in order to, among other things, reduce its credit risk to counterparties. ISDA Master Agreements include provisions for general obligations, representations, collateral and events of default or termination. Under an ISDA Master Agreement, the Portfolio typically may offset with the counterparty certain OTC derivative financial instruments' payables and/or receivables with collateral held and/or posted and create one single net payment (close-out netting) in the event of default, termination and/or potential deterioration in the credit quality of the counterparty. Various Master Agreements govern the terms of certain transactions with counterparties, including transactions such as swap, forward, repurchase and reverse repurchase agreements. These Master Agreements typically attempt to reduce the counterparty risk associated with such transactions by specifying credit protection mechanisms and providing standardization that improves legal certainty. Cross-termination provisions under Master Agreements typically provide that a default in connection with one transaction between the Portfolio and a counterparty gives the non-defaulting party the right to terminate any other transactions in place with the defaulting party to create one single net payment due to/due from the defaulting party and may be a feature in certain Master Agreements. In the event the Portfolio exercises its right to terminate a Master Agreement after a counterparty experiences a termination event as defined in the Master Agreement, the return of collateral with market value in excess of the Portfolio's net liability may be delayed or denied.
The following tables present derivative financial instruments that are subject to enforceable netting arrangements as of September 30, 2015.
Gross Amounts Not Offset in the Statement of Assets and Liabilities | |
Counterparty | | Gross Asset
Derivatives
Presented in
Statement of
Assets and
Liabilities
(000) | | Financial
Instrument
(000) | | Collateral
Received
(000) | | Net Amount
(not less
than $0)
(000) | |
Barclays Bank PLC | | $ | 1 | | | $ | (1 | ) | | $ | — | | | $ | 0 | | |
JPMorgan Chase Bank NA | | | 2 | | | | — | | | | — | | | | 2 | | |
Total | | $ | 3 | | | $ | (1 | ) | | $ | — | | | $ | 2 | | |
Gross Amounts Not Offset in the Statement of Assets and Liabilities | |
Counterparty | | Gross Liability
Derivatives
Presented in
Statement of
Assets and
Liabilities
(000) | | Financial
Instrument
(000) | | Collateral
Pledged
(000) | | Net Amount
(not less
than $0)
(000) | |
Barclays Bank PLC | | $ | 23 | | | $ | (1 | ) | | $ | — | | | $ | 22 | | |
For the year ended September 30, 2015, the approximate average monthly amount outstanding for each derivative type is as follows:
Foreign Currency Forward Exchange Contracts: | |
Average monthly principal amount | | $ | 631,000 | | |
Futures Contracts: | |
Average monthly original value | | $ | 115,083,000 | | |
Swap Agreements: | |
Average monthly notional amount | | $ | 28,230,000 | | |
5. Indemnifications: The Fund enters into contracts that contain a variety of indemnifications. The Fund's maximum exposure under these arrangements is unknown. However, the Fund has not had prior claims or losses pursuant to these contracts and expects the risk of loss to be remote.
6. Dividends and Distributions to Shareholders: Dividend income and distributions to shareholders are recorded on the ex-dividend date. Dividends from net investment income, if any, are declared and paid monthly. Net realized capital gains, if any, are distributed at least annually.
7. Security Transactions, Income and Expenses: Security transactions are accounted for on the trade date (date the order to buy or sell is executed). Realized gains and losses on the sale of investment securities are determined on the specific identified cost method. Dividend income and other distributions are recorded on the ex-dividend date (except for certain foreign dividends which
27
Morgan Stanley Institutional Fund Trust
Annual Report — September 30, 2015
Notes to Financial Statements (cont'd)
may be recorded as soon as the Portfolio is informed of such dividends) net of applicable withholding taxes. Interest income is recognized on the accrual basis except where collection is in doubt. Discounts are accreted and premiums are amortized over the life of the respective securities. Most expenses of the Fund can be directly attributed to a particular Portfolio. Expenses which cannot be directly attributed are apportioned among the Portfolios based upon relative net assets or other appropriate methods. Income, expenses (other than class specific expenses — distribution and shareholder services, transfer agency and sub transfer agency fees) and realized and unrealized gains or losses are allocated to each class of shares based upon their relative net assets.
B. Advisory Fees: The Adviser, a wholly-owned subsidiary of Morgan Stanley, provides the Portfolio with advisory services under the terms of an Investment Advisory Agreement, paid quarterly, at an annual rate of 0.30% of the average daily net assets of the Portfolio.
The Adviser has agreed to reduce its advisory fee and/or reimburse the Portfolio so that total annual portfolio operating expenses, excluding certain investment related expenses, taxes, interest and other extraordinary expenses (including litigation), will not exceed 0.53% for Class I shares, 0.88% for Class A shares, 1.23% for Class L shares and 1.63% for Class C shares. The fee waivers and/or expense reimbursements will continue for at least one year from the date of the Portfolio's prospectus or until such time that the Trustees act to discontinue all or a portion of such waivers and/or reimbursements when they deem such action is appropriate. For the year ended September 30, 2015, approximately $103,000 of advisory fees were waived and approximately $6,000 of other expenses were reimbursed by the Adviser pursuant to this arrangement.
C. Administration Fees: The Adviser also serves as Administrator to the Fund and provides administrative services pursuant to an Administration Agreement for an annual fee, accrued daily and paid monthly, of 0.08% of the Portfolio's average daily net assets. Under a Sub-Administration Agreement between the Administrator and State Street Bank and Trust Company ("State Street"), State Street provides certain administrative services to the Fund. For such services, the Administrator pays State Street a portion of the fee the Administrator receives from the Portfolio.
D. Distribution and Shareholder Services Fees: Morgan Stanley Distribution, Inc. ("MSDI" or the "Distributor"),
a wholly-owned subsidiary of the Adviser, and an indirect subsidiary of Morgan Stanley, serves as the Fund's Distributor of Portfolio shares pursuant to a Distribution Agreement. The Fund has adopted a Shareholder Services Plan with respect to Class A shares pursuant to Rule 12b-1 under the Act. Under the Shareholder Services Plan, the Portfolio pays the Distributor a shareholder services fee, accrued daily and paid monthly, at an annual rate of 0.25% of the Portfolio's average daily net assets attributable to Class A shares.
The Fund has adopted a Distribution and Shareholder Services Plan with respect to Class L shares pursuant to Rule 12b-1 under the Act. Under the Distribution and Shareholder Services Plan, the Portfolio pays the Distributor a distribution fee, accrued daily and paid monthly, at an annual rate of 0.25% and a shareholder services fee, accrued daily and paid monthly, at an annual rate of 0.25% of the Portfolio's average daily net assets attributable to Class L shares.
The Fund has adopted a Distribution and Shareholder Services Plan with respect to Class C shares pursuant to Rule 12b-1 under the Act. Under the Distribution and Shareholder Services Plan, the Portfolio pays the Distributor a distribution fee, accrued daily and paid monthly, at an annual rate of 0.75% and a shareholder services fee, accrued daily and paid monthly, at an annual rate of 0.25% of the Portfolio's average daily net assets attributable to Class C shares.
The distribution and shareholder services fees are used to support the expenses associated with servicing and maintaining accounts. The Distributor may compensate other parties for providing shareholder support services to investors who purchase Class A, Class L and Class C shares.
E. Dividend Disbursing and Transfer Agent: The Fund's dividend disbursing and transfer agent is Boston Financial Data Services, Inc. ("BFDS"). Pursuant to a Transfer Agency Agreement, the Fund pays BFDS a fee based on the number of classes, accounts and transactions relating to the Portfolios of the Fund.
F. Custodian Fees: State Street (the "Custodian") serves as Custodian for the Fund in accordance with a Custodian Agreement. The Custodian holds cash, securities, and other assets of the Fund as required by the Act. Custody fees are payable monthly based on assets held in custody, investment purchases and sales activity and account maintenance fees, plus reimbursement for certain out-of-pocket expenses.
28
Morgan Stanley Institutional Fund Trust
Annual Report — September 30, 2015
Notes to Financial Statements (cont'd)
G. Security Transactions and Transactions with Affiliates: For the year ended September 30, 2015, purchases and sales of investment securities for the Portfolio, other than long-term U.S. Government securities and short-term investments, were approximately $44,627,000 and $49,527,000, respectively. For the year ended September 30, 2015, there were no purchases of long-term U.S. Government securities and sales of long-term U.S. Government securities were approximately $8,957,000.
The Portfolio invests in the Institutional Class of the Morgan Stanley Institutional Liquidity Funds — Money Market Portfolio (the "Liquidity Funds"), an open-end management investment company managed by the Adviser. Advisory fees paid by the Portfolio are reduced by an amount equal to its pro-rata share of the advisory and administration fees paid by the Portfolio due to its investment in the Liquidity Funds. For the year ended September 30, 2015, advisory fees paid were reduced by approximately $2,000 relating to the Portfolio's investment in the Liquidity Funds.
A summary of the Portfolio's transactions in shares of the Liquidity Funds during the year ended September 30, 2015 is as follows:
Value
September 30,
2014
(000) | | Purchases
at Cost
(000) | | Sales
(000) | | Dividend
Income
(000) | | Value
September 30,
2015
(000) | |
| $ | 936 | | | $ | 40,446 | | | $ | 40,632 | | | $ | 2 | | | $ | 750 | | |
The Portfolio has an unfunded Deferred Compensation Plan (the "Compensation Plan"), which allows each independent Trustee to defer payment of all, or a portion, of the fees he or she receives for serving on the Board of Trustees. Each eligible Trustee generally may elect to have the deferred amounts credited with a return equal to the total return on one or more of the Morgan Stanley funds that are offered as investment options under the Compensation Plan. Appreciation/depreciation and distributions received from these investments are recorded with an offsetting increase/decrease in the deferred compensation obligation and do not affect the NAV of the Portfolio.
H. Federal Income Taxes: It is the Portfolio's intention to continue to qualify as a regulated investment company and distribute all of its taxable and tax-exempt income. Accordingly, no provision for Federal income taxes is required in the financial statements.
The Portfolio may be subject to taxes imposed by countries in which it invests. Such taxes are generally based on income and/or capital gains earned or repatriated. Taxes are accrued
based on net investment income, net realized gains and net unrealized appreciation as such income and/or gains are earned. Taxes may also be based on transactions in foreign currency and are accrued based on the value of investments denominated in such currency.
FASB ASC 740-10, "Income Taxes — Overall", sets forth a minimum threshold for financial statement recognition of the benefit of a tax position taken or expected to be taken in a tax return. Management has concluded there are no significant uncertain tax positions that would require recognition in the financial statements. If applicable, the Portfolio recognizes interest accrued related to unrecognized tax benefits in "Interest Expense" and penalties in "Other Expenses" in the Statement of Operations. The Portfolio files tax returns with the U.S. Internal Revenue Service, New York and various states. Each of the tax years in the four-year period ended September 30, 2015, remains subject to examination by taxing authorities.
The tax character of distributions paid may differ from the character of distributions shown in the Statements of Changes in Net Assets due to short-term capital gains being treated as ordinary income for tax purposes. The tax character of distributions paid during fiscal years 2015 and 2014 was as follows:
2015 Distributions
Paid From:
Ordinary Income
(000) | | 2014 Distributions
Paid From:
Ordinary Income
(000) | |
| $ | 1,494 | | | $ | 1,703 | | |
The amount and character of income and gains to be distributed are determined in accordance with income tax regulations which may differ from GAAP. These book/tax differences are either considered temporary or permanent in nature.
Temporary differences are attributable to differing book and tax treatments for the timing of the recognition of gains (losses) on certain investment transactions and the timing of the deductibility of certain expenses.
Permanent differences, primarily due to differing treatments of gains (losses) related to foreign currency transactions, basis adjustments for swap transactions, paydown adjustments and an expired capital loss carryforward, resulted in the following reclassifications among the components of net assets at September 30, 2015:
Accumulated
Undistributed
Net Investment
Income
(000) | | Accumulated
Net Realized
Loss
(000) | | Paid-in-
Capital
(000) | |
| $ | (172 | ) | | $ | 7,240 | | | $ | (7,068 | ) | |
29
Morgan Stanley Institutional Fund Trust
Annual Report — September 30, 2015
Notes to Financial Statements (cont'd)
At September 30, 2015, the components of distributable earnings for the Portfolio on a tax basis were as follows:
Undistributed
Ordinary
Income
(000) | | Undistributed
Long-Term
Capital Gain
(000) | |
| $ | 490 | | | $ | — | | |
At September 30, 2015, the Portfolio had available for Federal income tax purposes unused short term and long term capital losses of approximately $485,000 and $416,000, respectively, that do not have an expiration date.
In addition, at September 30, 2015, the Portfolio had available for Federal income tax purposes unused capital losses, which will expire on the indicated dates:
Amount
(000) | | Expiration | |
| $ | 265 | | | September 30, 2016 | |
| | 200,864 | | | September 30, 2017 | |
| | 33,504 | | | September 30, 2018 | |
Capital loss carryforwards of approximately $7,068,000 expired during the year ended September 30, 2015.
To the extent that capital loss carryforwards are used to offset any future capital gains realized during the carryover period as provided by U.S. Federal income tax regulations, no capital gains tax liability will be incurred by the Portfolio for gains realized and not distributed. To the extent that capital gains are offset, such gains will not be distributed to the shareholders.
I. Other: At September 30, 2015, the Portfolio had otherwise unaffiliated record owners of 10% or greater. Investment activities of these shareholders could have a material impact on the Portfolio. The aggregate percentage of such owners was 94.9%.
J. Subsequent Event: Effective upon the consummation of a reorganization of Morgan Stanley Limited Duration U.S. Government Trust into the Portfolio or, if the reorganization is not consummated, tentatively scheduled for early to mid January 2016 (the "Effective Date"), the Board of Trustees of Morgan Stanley Institutional Fund Trust, on behalf of the Portfolio, has approved various changes with respect to the Portfolio, including (i) changing the Portfolio's name to Short Duration Income Portfolio; (ii) changing the Portfolio's principal investment policy as detailed below; (iii) changing the Portfolio's primary benchmark index to the Bank of America/Merrill Lynch 1-Year U.S. Treasury Note Index; (iv) reducing the advisory fee to 0.20% of the average daily net assets of the Portfolio; (v) removing the front-end sales load from the Portfolio's Class A shares; and (vi) decreasing the maximum expense ratios with re-
spect to Class I, Class A and Class L shares of the Portfolio to 0.30%, 0.55% and 0.80%, respectively.
30
Morgan Stanley Institutional Fund Trust
Annual Report — September 30, 2015
Report of Independent Registered Public Accounting Firm
To the Shareholders and Board of Trustees of
Morgan Stanley Institutional Fund Trust —
Limited Duration Portfolio
We have audited the accompanying statement of assets and liabilities, including the portfolio of investments, of Limited Duration Portfolio (one of the portfolios constituting Morgan Stanley Institutional Fund Trust) (the "Portfolio") as of September 30, 2015, and the related statement of operations for the year then ended, the statements of changes in net assets for each of the two years in the period then ended and the financial highlights for each of the years or periods indicated therein. These financial statements and financial highlights are the responsibility of the Portfolio's management. Our responsibility is to express an opinion on these financial statements and financial highlights based on our audits.
We conducted our audits in accordance with the standards of the Public Company Accounting Oversight Board (United States). Those standards require that we plan and perform the audit to obtain reasonable assurance about whether the financial statements and financial highlights are free of material misstatement. We were not engaged to perform an audit of the Portfolio's internal control over financial reporting. Our audits included consideration of internal control over financial reporting as a basis for designing audit procedures that are appropriate in the circumstances, but not for the purpose of expressing an opinion on the effectiveness of the Portfolio's internal control over financial reporting. Accordingly, we express no such opinion. An audit also includes examining, on a test basis, evidence supporting the amounts and disclosures in the financial statements and financial highlights, assessing the accounting principles used and significant estimates made by management, and evaluating the overall financial statement presentation. Our procedures included confirmation of securities owned as of September 30, 2015, by correspondence with the custodian and others or by other appropriate auditing procedures where replies from others were not received. We believe that our audits provide a reasonable basis for our opinion.
In our opinion, the financial statements and financial highlights referred to above present fairly, in all material respects, the financial position of Limited Duration Portfolio (one of the portfolios constituting Morgan Stanley Institutional Fund Trust) at September 30, 2015, the results of its operations for the year then ended, the changes in its net assets for each of the two years in the period then ended and the financial highlights for each of the years or periods indicated therein, in conformity with U.S. generally accepted accounting principles.

Boston, Massachusetts
November 25, 2015
31
Morgan Stanley Institutional Fund Trust
Annual Report — September 30, 2015
Investment Advisory Agreement Approval (unaudited)
Nature, Extent and Quality of Services
The Board reviewed and considered the nature and extent of the investment advisory services provided by the Adviser (as defined herein) under the advisory agreement, including portfolio management, investment research and equity and fixed income securities trading. The Board also reviewed and considered the nature and extent of the non-advisory, administrative services provided by the Adviser under the administration agreement, including accounting, operations, clerical, bookkeeping, compliance, business management and planning, legal services and the provision of supplies, office space and utilities at the Adviser's expense. The Board also considered the Adviser's investment in personnel and infrastructure that benefits the Portfolio. (The advisory and administration agreements together are referred to as the "Management Agreement.") The Board also considered that the Adviser serves a variety of other investment advisory clients and has experience overseeing service providers. The Board also compared the nature of the services provided by the Adviser with similar services provided by non-affiliated advisers as reported to the Board by Lipper, Inc. ("Lipper").
The Board reviewed and considered the qualifications of the portfolio managers, the senior administrative managers and other key personnel of the Adviser who provide the administrative and advisory services to the Portfolio. The Board determined that the Adviser's portfolio managers and key personnel are well qualified by education and/or training and experience to perform the services in an efficient and professional manner. The Board concluded that the nature and extent of the advisory and administrative services provided were necessary and appropriate for the conduct of the business and investment activities of the Portfolio and supported its decision to approve the Management Agreement.
Performance, Fees and Expenses of the Portfolio
The Board reviewed the performance, fees and expenses of the Portfolio compared to its peers, as determined by Lipper, and to appropriate benchmarks where applicable. The Board discussed with the Adviser the performance goals and the actual results achieved in managing the Portfolio. When considering a fund's performance, the Board and the Adviser place emphasis on trends and longer-term returns (focusing on one-year, three-year and five-year performance, as of December 31, 2014, or since inception, as applicable). When a fund underperforms its benchmark and/or its peer group average, the Board and the Adviser discuss the causes of such underperformance and, where necessary, they discuss specific changes to investment strategy or investment personnel. The Board noted that the Portfolio's performance was better than its peer group average for the one- and three-year periods but below its peer group average for the five-year period. The Board discussed with the Adviser the level of the advisory and administration fees (together, the "management fee") for this Portfolio relative to comparable funds and/or other accounts advised by the Adviser and/or compared to its peers as determined by Lipper. In addition to the management fee, the Board also reviewed the Portfolio's total expense ratio. The Board noted that while the Portfolio's management fee was lower than its peer group average, its total expense ratio was higher but close to its peer group average. After discussion, the Board concluded that the Portfolio's (i) performance was competitive with its peer group average; and (ii) management fee and total expense ratio were competitive with its peer group averages.
Economies of Scale
The Board considered the size and growth prospects of the Portfolio and how that relates to the Portfolio's total expense ratio and particularly the Portfolio's management fee rate, which does not include breakpoints. In conjunction with its review of the Adviser's profitability, the Board discussed with the Adviser how a change in assets can affect the efficiency or effectiveness of managing the Portfolio and whether the management fee level is appropriate relative to current and projected asset levels and/or whether the management fee structure reflects economies of scale as asset levels change. The Board has determined that its review of the actual and/or potential economies of scale of the Portfolio supports its decision to approve the Management Agreement.
Profitability of the Adviser and Affiliates
The Board considered information concerning the costs incurred and profits realized by the Adviser and its affiliates during the last year from their relationship with the Portfolio and during the last two years from their relationship with the Morgan Stanley Fund Complex and reviewed with the Adviser the cost allocation methodology used to determine the profitability of the Adviser and affiliates. The Board has determined that its review of the analysis of the Adviser's expenses and profitability supports its decision to approve the Management Agreement.
32
Morgan Stanley Institutional Fund Trust
Annual Report — September 30, 2015
Investment Advisory Agreement Approval (unaudited) (cont'd)
Other Benefits of the Relationship
The Board considered other direct and indirect benefits to the Adviser and/or its affiliates derived from their relationship with the Portfolio and other funds advised by the Adviser. These benefits may include, among other things, fees for trading, distribution and/or shareholder servicing and for transaction processing and reporting platforms used by securities lending agents, and research received by the Adviser generated from commission dollars spent on funds' portfolio trading. The Board reviewed with the Adviser these arrangements and the reasonableness of the Adviser's costs relative to the services performed. The Board has determined that its review of the other benefits received by the Adviser or its affiliates supports its decision to approve the Management Agreement.
Resources of the Adviser and Historical Relationship Between the Portfolio and the Adviser
The Board considered whether the Adviser is financially sound and has the resources necessary to perform its obligations under the Management Agreement. The Board also reviewed and considered the historical relationship between the Portfolio and the Adviser, including the organizational structure of the Adviser, the policies and procedures formulated and adopted by the Adviser for managing the Portfolio's operations and the Board's confidence in the competence and integrity of the senior managers and key personnel of the Adviser. The Board concluded that the Adviser has the financial resources necessary to fulfill its obligations under the Management Agreement and that it is beneficial for the Portfolio to continue its relationship with the Adviser.
Other Factors and Current Trends
The Board considered the controls and procedures adopted and implemented by the Adviser and monitored by the Fund's Chief Compliance Officer and concluded that the conduct of business by the Adviser indicates a good faith effort on its part to adhere to high ethical standards in the conduct of the Portfolio's business.
General Conclusion
After considering and weighing all of the above factors, with various written materials and verbal information presented by the Adviser, the Board concluded that it would be in the best interest of the Portfolio and its shareholders to approve renewal of the Management Agreement for another year. In reaching this conclusion the Board did not give particular weight to any single piece of information or factor referenced above. The Board considered these factors and information over the course of the year and in numerous meetings, some of which were in executive session with only the independent Board members and their counsel present. It is possible that individual Board members may have weighed these factors, and the information presented, differently in reaching their individual decisions to approve the Management Agreement.
33
Morgan Stanley Institutional Fund Trust
Annual Report — September 30, 2015
U.S. Privacy Policy (unaudited)
AN IMPORTANT NOTICE CONCERNING OUR U.S. PRIVACY POLICY
This privacy notice describes the U.S. privacy policy of Morgan Stanley Distribution, Inc., and the Morgan Stanley family of mutual funds ("us", "our", "we").
We are required by federal law to provide you with notice of our U.S. privacy policy ("Policy"). This Policy applies to both our current and former clients unless we state otherwise and is intended for individual clients who purchase products or receive services from us for personal, family or household purposes. This Policy is not applicable to partnerships, corporations, trusts or other non-individual clients or account holders, nor is this Policy applicable to individuals who are either beneficiaries of a trust for which we serve as trustee or participants in an employee benefit plan administered or advised by us. This Policy is, however, applicable to individuals who select us to be a custodian of securities or assets in individual retirement accounts, 401(k) accounts, or accounts subject to the Uniform Gifts to Minors Act.
This notice sets out our business practices to protect your privacy; how we collect and share personal information about you; and how you can limit our sharing or certain uses by others of this information. We may amend this Policy at any time, and will inform you of any changes to our Policy as required by law.
WE RESPECT YOUR PRIVACY
We appreciate that you have provided us with your personal financial information and understand your concerns about your information. We strive to safeguard the information our clients entrust to us. Protecting the confidentiality and security of client information is an important part of how we conduct our business.
This notice describes what personal information we collect about you, how we collect it, when we may share it with others, and how certain others may use it. It discusses the steps you may take to limit our sharing of certain information about you with our affiliated companies, including, but not limited to our affiliated banking businesses, brokerage firms and credit service affiliates. It also discloses how you may limit our affiliates' use of shared information for marketing purposes.
Throughout this Policy, we refer to the nonpublic information that personally identifies you as "personal information." We also use the term "affiliated company" in this notice. An affiliated company is a company in our family of companies and includes companies with the Morgan Stanley name. These affiliated companies are financial institutions such as broker-dealers, banks, investment advisers and credit card issuers. We refer to any company that is not an affiliated company as a nonaffiliated third party. For purposes of Section 5 of this notice, and your ability to limit certain uses of personal information by our affiliates, this notice applies to the use of personal information by our affiliated companies.
1. WHAT PERSONAL INFORMATION DO WE COLLECT FROM YOU?
We may collect the following types of information about you: (i) information provided by you, including information from applications and other forms we receive from you, (ii) information about your transactions with us or our affiliates, (iii) information about your transactions with nonaffiliated third parties, (iv) information from consumer reporting agencies, (v) information obtained from our websites, and (vi) information obtained from other sources. For example:
• We collect information such as your name, address, e-mail address, telephone/fax numbers, assets, income and investment objectives through applications and other forms you submit to us.
• We may obtain information about account balances, your use of account(s) and the types of products and services you prefer to receive from us through your dealings and transactions with us and other sources.
• We may obtain information about your creditworthiness and credit history from consumer reporting agencies.
• We may collect background information from and through third-party vendors to verify representations you have made and to comply with various regulatory requirements.
2. WHEN DO WE DISCLOSE PERSONAL INFORMATION WE COLLECT ABOUT YOU?
We may disclose personal information we collect about you in each of the categories listed above to affiliated and nonaffiliated third parties.
34
Morgan Stanley Institutional Fund Trust
Annual Report — September 30, 2015
U.S. Privacy Policy (unaudited) (cont'd)
a. Information We Disclose to Affiliated Companies.
We may disclose personal information that we collect about you to our affiliated companies to manage your account(s) effectively, to service and process your transactions, and to let you know about products and services offered by us and affiliated companies, to manage our business, and as otherwise required or permitted by law. Offers for products and services from affiliated companies are developed under conditions designed to safeguard your personal information.
b. Information We Disclose to Third Parties.
We may disclose personal information that we collect about you to nonaffiliated third parties to provide marketing services on our behalf or to other financial institutions with whom we have joint marketing agreements. We may also disclose all of the information we collect to other nonaffiliated third parties for our everyday business purposes, such as to process transactions, maintain account(s), respond to court orders and legal investigations, report to credit bureaus, offer our own products and services, protect against fraud, for institutional risk control, to perform services on our behalf, and as otherwise required or permitted by law.
When we share personal information about you with a nonaffiliated third party, they are required to limit their use of personal information about you to the particular purpose for which it was shared and they are not allowed to share personal information about you with others except to fulfill that limited purpose or as may be permitted or required by law.
3. HOW DO WE PROTECT THE SECURITY AND CONFIDENTIALITY OF PERSONAL INFORMATION WE COLLECT ABOUT YOU?
We maintain physical, electronic and procedural security measures that comply with applicable law and regulations to help safeguard the personal information we collect about you. We have internal policies governing the proper handling of client information by employees. Third parties that provide support or marketing services on our behalf may also receive personal information about you, and we require them to adhere to appropriate security standards with respect to such information.
4. HOW CAN YOU LIMIT OUR SHARING CERTAIN PERSONAL INFORMATION ABOUT YOU WITH OUR AFFILIATED COMPANIES FOR ELIGIBILITY DETERMINATION?
By following the opt-out procedures in Section 6 below, you may limit the extent to which we share with our affiliated companies, personal information that was collected to determine your eligibility for products and services such as your credit reports and other information that you have provided to us or that we may obtain from third parties ("eligibility information"). Eligibility information does not include your identification information or personal information pertaining to our transactions or experiences with you. Please note that, even if you direct us not to share eligibility information with our affiliated companies, we may still share your personal information, including eligibility information, with our affiliated companies under circumstances that are permitted under applicable law, such as to process transactions or to service your account.
5. HOW CAN YOU LIMIT THE USE OF CERTAIN PERSONAL INFORMATION ABOUT YOU BY OUR AFFILIATED COMPANIES FOR MARKETING?
By following the opt-out instructions in Section 6 below, you may limit our affiliated companies from marketing their products or services to you based on personal information we disclose to them. This information may include, for example, your income and account history with us. Please note that, even if you choose to limit our affiliated companies from using personal information about you that we may share with them for marketing their products and services to you, our affiliated companies may use your personal information that they obtain from us to market to you in circumstances permitted by law, such as if the affiliated party has its own relationship with you.
35
Morgan Stanley Institutional Fund Trust
Annual Report — September 30, 2015
U.S. Privacy Policy (unaudited) (cont'd)
6. HOW CAN YOU SEND US AN OPT-OUT INSTRUCTION?
If you wish to limit our sharing of eligibility information about you with our affiliated companies, or our affiliated companies' use of personal information for marketing purposes, as described in this notice, you may do so by:
• Calling us at (800) 548-7786
Monday–Friday between 8a.m. and 6p.m. (EST)
• Writing to us at the following address:
Boston Financial Data Services, Inc.
c/o Privacy Coordinator
P.O. Box 219804
Kansas City, Missouri 64121
If you choose to write to us, your request should include: your name, address, telephone number and account number(s) to which the opt-out applies and whether you are opting out with respect to sharing of eligibility information (Section 4 above), or information used for marketing (Section 5 above), or both. Written opt-out requests should not be sent with any other correspondence. In order to process your request, we require that the request be provided by you directly and not through a third party. Once you have informed us about your privacy preferences, your opt-out preference will remain in effect with respect to this Policy (as it may be amended) until you notify us otherwise. If you are a joint account owner, we will accept instructions from any one of you and apply those instructions to the entire account.
Please understand that if you limit our sharing or our affiliated companies' use of personal information, you and any joint account holder(s) may not receive information about our affiliated companies' products and services, including products or services that could help you manage your financial resources and achieve your investment objectives.
If you have more than one account or relationship with us, please specify the accounts to which you would like us to apply your privacy choices. If you have accounts or relationships with our affiliates, you may receive multiple privacy policies from them, and will need to separately notify those companies of your privacy choices for those accounts or relationships.
7. WHAT IF AN AFFILIATED COMPANY BECOMES A NONAFFILIATED THIRD PARTY?
If, at any time in the future, an affiliated company becomes a nonaffiliated third party, further disclosures of personal information made to the former affiliated company will be limited to those described in Section 2(b) above relating to nonaffiliated third parties. If you elected under Section 6 to limit disclosures we make to affiliated companies, or use of personal information by affiliated companies, your election will not apply to use by any former affiliated company of your personal information in their possession once it becomes a nonaffiliated third party.
SPECIAL NOTICE TO RESIDENTS OF VERMONT
The following section supplements our Policy with respect to our individual clients who have a Vermont address and supersedes anything to the contrary in the above Policy with respect to those clients only.
The State of Vermont requires financial institutions to obtain your consent prior to sharing personal information that they collect about you with nonaffiliated third parties, or eligibility information with affiliated companies, other than in certain limited circumstances. Except as permitted by law, we will not share personal information we collect about you with nonaffiliated third parties or eligibility information with affiliated companies, unless you provide us with your written consent to share such information.
SPECIAL NOTICE TO RESIDENTS OF CALIFORNIA
The following section supplements our Policy with respect to our individual clients who have a California address and supersedes anything to the contrary in the above Policy with respect to those clients only.
In response to a California law, if your account has a California home address, your personal information will not be disclosed to nonaffiliated third parties except as permitted by applicable California law, and we will limit sharing such personal information with our affiliates to comply with California privacy laws that apply to us.
36
Morgan Stanley Institutional Fund Trust
Annual Report — September 30, 2015
Trustee and Officer Information (unaudited)
Independent Trustees:
Name, Age and Address of
Independent Trustee | | Positions(s)
Held with
Registrant | | Length of Time
Served* | | Principal Occupation(s) During Past 5 Years
and Other Relevant Professional Experience | | Number of
Portfolios in
Fund Complex
Overseen by
Trustee** | | Other Directorships
Held by Independent
Trustee*** | |
Frank L. Bowman (70)
c/o Kramer Levin Naftalis & Frankel LLP
Counsel to the Independent Trustees
1177 Avenue of the Americas
New York, NY 10036 | | Trustee | | Since
August
2006 | | President, Strategic Decisions, LLC (consulting) (since February 2009); Director or Trustee of various Morgan Stanley Funds (since August 2006); Chairperson of the Compliance and Insurance Committee (since October 2015); Chairperson of the Insurance Sub-Committee of the Compliance and Insurance Committee (since February 2007); served as President and Chief Executive Officer of the Nuclear Energy Institute (policy organization) (February 2005-November 2008); retired as Admiral, U.S. Navy after serving over 38 years on active duty including 8 years as Director of the Naval Nuclear Propulsion Program in the Department of the Navy and the U.S. Department of Energy (1996-2004); served as Chief of Naval Personnel (July 1994-September 1996); and on the Joint Staff as Director of Political Military Affairs (June 1992-July1994); knighted as Honorary Knight Commander of the Most Excellent Order of the British Empire; awarded the Officier de l'Orde National du Mérite by the French Government; elected to the National Academy of Engineering (2009). | | | 96 | | | Director of BP p.l.c.; Director of Naval and Nuclear Technologies LLP; Director Emeritus of the Armed Services YMCA of the USA; Director of the U.S. Naval Submarine League; Member of the National Security Advisory Council of the Center for U.S. Global Engagement and a member of the CNA Military Advisory Board; Chairman of the Charity J Street Cup Golf ; Trustee of Fairhaven United Methodist Church. | |
Kathleen A. Dennis (62)
c/o Kramer Levin Naftalis & Frankel LLP
Counsel to the Independent Trustees
1177 Avenue of the Americas
New York, NY 10036 | | Trustee | | Since
August
2006 | | President, Cedarwood Associates (mutual fund and investment management consulting) (since July 2006); Chairperson of the Money Market and Alternatives Sub-Committee of the Investment Committee (since October2006) and Director or Trustee of various Morgan Stanley Funds (since August 2006); formerly, Senior Managing Director of Victory Capital Management (1993-2006). | | | 96 | | | Director of various nonprofit organizations. | |
Nancy C. Everett (60)
c/o Kramer Levin Naftalis & Frankel LLP
Counsel to the Independent Trustees
1177 Avenue of the Americas
New York, NY 10036 | | Trustee | | Since
January
2015 | | Owner, OBIR, LLC (institutional investment management consulting) (since June 2014); formerly, Managing Director, BlackRock, Inc. (February 2011-December 2013); and Chief Executive Officer, General Motors Asset Management (a/k/a Promark Global Advisors, Inc.) (June 2005-May 2010). | | | 96 | | | Member of Virginia Commonwealth University Board of Visitors; Member of Virginia Commonwealth University School of Business Foundation; formerly, Member of Committee on Directors for Emerging Markets Growth Fund, Inc. (2007-2010); Chairperson of Performance Equity Management, LLC (2006-2010); and Chairperson, GMAM Absolute Return Strategies Fund, LLC (2006-2010). | |
37
Morgan Stanley Institutional Fund Trust
Annual Report — September 30, 2015
Trustee and Officer Information (unaudited) (cont'd)
Independent Trustees: (cont'd)
Name, Age and Address of
Independent Trustee | | Positions(s)
Held with
Registrant | | Length of Time
Served* | | Principal Occupation(s) During Past 5 Years
and Other Relevant Professional Experience | | Number of
Portfolios in
Fund Complex
Overseen by
Trustee** | | Other Directorships
Held by Independent
Trustee*** | |
Jakki L. Haussler (58)
c/o Kramer Levin Naftalis & Frankel LLP
Counsel to the Independent Trustees
1177 Avenue of the Americas
New York, NY 10036 | | Trustee | | Since
January
2015 | | Chairman and Chief Executive Officer, Opus Capital Group (since January 1996); and formerly, Director, Capvest Venture Fund, LP (May 2000-December 2011); Partner, Adena Ventures, LP (July 1999-December 2010); Director, The Victory Funds (February 2005-July 2008). | | | 96 | | | Director of Cincinnati Bell Inc. and Member, Audit Committee and Compensation Committee; Director of Northern Kentucky University Foundation and Member, Investment Committee; Member of Chase College of Law Transactional Law Practice Center Board of Advisors; Director of Best Transport; Member, University of Cincinnati Foundation Investment Committee; formerly, Member, Miami University Board of Visitors (2008-2011); Trustee of Victory Funds (2005-2008) and Chairman, Investment Committee (2007-2008) and Member, Service Provider Committee (2005-2008). | |
Dr. Manuel H. Johnson (66)
c/o Johnson Smick International, Inc.
220 I Street, N.E. — Suite 200
Washington, D.C. 20002 | | Trustee | | Since
July
1991 | | Senior Partner, Johnson Smick International, Inc. (consulting firm); Chairperson of the Investment Committee (since October 2006) and Director or Trustee of various Morgan Stanley Funds (since July 1991); Co-Chairman and a founder of the Group of Seven Council (G7C) (international economic commission); formerly Chairperson of the Audit Committee (July 1991-September 2006), Vice Chairman of the Board of Governors of the Federal Reserve System and Assistant Secretary of the U.S. Treasury. | | | 98 | | | Director of NVR, Inc. (home construction). | |
Joseph J. Kearns (73)
c/o Kearns & Associates LLC
23823 Malibu Road
S-50-440
Malibu, CA 90265 | | Trustee | | Since
August
1994 | | President, Kearns & Associates LLC (investment consulting); Chairperson of the Audit Committee (since October 2006) and Director or Trustee of various Morgan Stanley Funds (since August 1994); formerly, Deputy Chairperson of the Audit Committee (July 2003-September 2006) and Chairperson of the Audit Committee of various Morgan Stanley Funds (since August 1994); CFO of the J. Paul Getty Trust. | | | 99 | | | Director of Electro Rent Corporation (equipment leasing). Prior to December 31, 2013, Director of The Ford Family Foundation. | |
38
Morgan Stanley Institutional Fund Trust
Annual Report — September 30, 2015
Trustee and Officer Information (unaudited) (cont'd)
Independent Trustees: (cont'd)
Name, Age and Address of
Independent Trustee | | Positions(s)
Held with
Registrant | | Length of Time
Served* | | Principal Occupation(s) During Past 5 Years
and Other Relevant Professional Experience | | Number of
Portfolios in
Fund Complex
Overseen by
Trustee** | | Other Directorships
Held by Independent
Trustee*** | |
Michael F. Klein (56)
c/o Kramer Levin Naftalis & Frankel LLP
Counsel to the Independent Trustees
1177 Avenue of the Americas
New York, NY 10036 | | Trustee | | Since
August
2006 | | Managing Director, Aetos Capital, LLC (since March 2000); Co-President, Aetos Alternatives Management, LLC (since January 2004); and Co-Chief Executive Officer of Aetos Capital LLC (since August 2013); Chairperson of the Fixed Income Sub-Committee of the Investment Committee (since October 2006) and Director or Trustee of various Morgan Stanley Funds (since August 2006); formerly, Managing Director, Morgan Stanley & Co. Inc. and Morgan Stanley Dean Witter Investment Management, President, various Morgan Stanley Funds (June1998-March 2000) and Principal, Morgan Stanley & Co. Inc. and Morgan Stanley Dean Witter Investment Management (August 1997-December 1999). | | | 96 | | | Director of certain investment funds managed or sponsored by Aetos Capital, LLC. Director of Sanitized AG and Sanitized Marketing AG (specialty chemicals). | |
Michael E. Nugent (79)
522 Fifth Avenue
New York, NY 10036 | | Chair of the
Board and
Trustee | | Chair of the
Boards since
July 2006 and
Trustee since
July 1991 | | Chair of the Boards of various Morgan Stanley Funds (since July 2006); Chairperson of the Closed-End Fund Committee (since June 2012) and Director or Trustee of various Morgan Stanley Funds (since July 1991); formerly, Chairperson of the Insurance Committee (until July 2006), General Partner, Triumph Capital, L.P. (private investment partnership) (1988-2013). | | | 98 | | | None. | |
W. Allen Reed (68)
c/o Kramer Levin Naftalis & Frankel LLP
Counsel to the Independent Trustees
1177 Avenue of the Americas
New York, NY 10036 | | Trustee | | Since
August
2006 | | Chairperson of the Equity Sub-Committee of the Investment Committee (since October 2006) and Director or Trustee of various Morgan Stanley Funds (since August 2006); formerly, President and CEO of General Motors Asset Management; Chairman and Chief Executive Officer of the GM Trust Bank and Corporate Vice President of General Motors Corporation (August 1994-December 2005). | | | 96 | | | Director of Temple-Inland Industries (packaging and forest products); Director of Legg Mason, Inc. and Director of the Auburn University Foundation. | |
Fergus Reid (83)
c/o Joe Pietryka, Inc.
85 Charles Colman Blvd.
Pawling, NY 12564 | | Trustee | | Since
June
1992 | | Chairman, Joe Pietryka, Inc.; Chairperson of the Governance Committee and Director or Trustee of various Morgan Stanley Funds (since June 1992). | | | 99 | | | Formerly, Trustee and Director of certain investment companies in the JP Morgan Fund Complex managed by JP Morgan Investment Management Inc. (1987-December 2012). | |
39
Morgan Stanley Institutional Fund Trust
Annual Report — September 30, 2015
Trustee and Officer Information (unaudited) (cont'd)
Interested Trustee:
Name, Age and Address of
Interested Trustee | | Positions(s) Held
with Registrant | | Length of Time
Served* | | Principal Occupation(s) During Past 5 Years | | Number of
Portfolios in
Fund Complex
Overseen by
Interested
Trustee** | | Other Directorships
Held by Interested
Trustee*** | |
James F. Higgins (67)
One New York Plaza,
New York, NY 10004 | | Trustee | | Since
June
2000 | | Director or Trustee of various Morgan Stanley Funds (since June 2000); Senior Advisor of Morgan Stanley (since August 2000). | | | 97 | | | Formerly, Director of AXA Financial, Inc. and AXA Equitable Life Insurance Company (2002-2011) and Director of AXA MONY Life Insurance Company and AXA MONY Life Insurance Company of America (2004-2011). | |
* This is the earliest date the Trustee began serving the Morgan Stanley Funds. Each Trustee serves an indefinite term, until his or her successor is elected.
** The Fund Complex includes (as of December 31, 2014) all open-end and closed-end funds (including all of their portfolios) advised by Morgan Stanley Investment Management Inc. (the "Adviser") and any funds that have an adviser that is an affiliated person of the Adviser (including, but not limited to, Morgan Stanley AIP GP LP).
*** This includes any directorships at public companies and registered investment companies held by the Trustee at any time during the past five years.
40
Morgan Stanley Institutional Fund Trust
Annual Report — September 30, 2015
Trustee and Officer Information (unaudited) (cont'd)
Executive Officers:
Name, Age and Address of Executive Officer | | Position(s) Held
with
Registrant | | Length of Time
Served* | | Principal Occupation(s) During Past 5 Years | |
John H. Gernon (52)
522 Fifth Avenue
New York, NY 10036 | | President and Principal Executive Officer | | Since
September
2013 | | President and Principal Executive Officer of the Equity and Fixed Income Funds and the Morgan Stanley AIP Funds (since September 2013) and the Liquidity Funds and various money market funds (since May 2014) in the Fund Complex, Managing Director of the Adviser; Head of Product (since 2006) and Global Portfolio Analysis and Reporting (since 2012); for MSIM's Long Only business. | |
Stefanie V. Chang Yu (48)
522 Fifth Avenue
New York, NY 10036 | | Chief
Compliance
Officer | | Since
December
1997 | | Managing Director of the Adviser and various entities affiliated with the Adviser; Chief Compliance Officer of various Morgan Stanley Funds and the Adviser (since January 2014); formerly, Vice President of various Morgan Stanley Funds (December 1997-January 2014). | |
Joseph C. Benedetti (50)
522 Fifth Avenue
New York, NY 10036 | | Vice President | | Since
January
2014 | | Managing Director of the Adviser and various entities affiliated with the Adviser; Vice President of various Morgan Stanley Funds (since January 2014); formerly, Assistant Secretary of various Morgan Stanley Funds (October 2004-January 2014). | |
Francis J. Smith (50)
522 Fifth Avenue
New York, NY 10036 | | Treasurer and
Principal
Financial
Officer | | Treasurer
since July
2003 and
Principal
Financial
Officer since
September
2002 | | Executive Director of the Adviser and various entities affiliated with the Adviser; Treasurer (since July 2003) and Principal Financial Officer of various Morgan Stanley Funds (since September 2002). | |
Mary E. Mullin (48)
522 Fifth Avenue
New York, NY 10036 | | Secretary | | Since
June
1999 | | Executive Director of the Adviser and various entities affiliated with the Adviser; Secretary of various Morgan Stanley Funds (since June 1999). | |
* This is the earliest date the officer began serving the Morgan Stanley Funds. Each officer serves a one-year term, until his or her successor is elected and has qualified.
41
Morgan Stanley Institutional Fund Trust
Annual Report — September 30, 2015
Adviser and Administrator
Morgan Stanley Investment Management Inc.
522 Fifth Avenue
New York, New York 10036
Distributor
Morgan Stanley Distribution, Inc.
522 Fifth Avenue
New York, New York 10036
Dividend Disbursing and Transfer Agent
Boston Financial Data Services, Inc.
2000 Crown Colony Drive
Quincy, Massachusetts 02169
Custodian
State Street Bank and Trust Company
One Lincoln Street
Boston, Massachusetts 02111
Legal Counsel
Dechert LLP
1095 Avenue of the Americas
New York, New York 10036
Counsel to the Independent Trustees
Kramer Levin Naftalis & Frankel LLP
1177 Avenue of the Americas
New York, New York 10036
Independent Registered Public Accounting Firm
Ernst & Young LLP
200 Clarendon Street
Boston, Massachusetts 02116
Reporting to Shareholders
Each Morgan Stanley fund provides a complete schedule of portfolio holdings in its semi-annual and annual reports within 60 days of the end of the fund's second and fourth fiscal quarters. The semi-annual and annual reports are filed electronically with the Securities and Exchange Commission (SEC) on Form N-CSRS and Form N-CSR, respectively. Morgan Stanley also delivers the semi-annual and annual reports to fund shareholders and makes these reports available on its public website, www.morganstanley.com/im. Each Morgan Stanley fund also files a complete schedule of portfolio holdings with the SEC for the fund's first and third fiscal quarters on Form N-Q. Morgan Stanley does not deliver the reports for the first and third fiscal quarters to shareholders, nor are the reports posted to the Morgan Stanley public website. You may, however, obtain the Form N-Q filings (as well as the Form N-CSR and N-CSRS filings) by accessing the SEC's website, www.sec.gov. You may also review and copy them at the SEC's Public Reference Room in Washington, DC. Information on the operation of the SEC's Public Reference Room may be obtained by calling the SEC toll free at 1 (800) SEC-0330. You can also request copies of these materials, upon payment of a duplicating fee, by electronic request at the SEC's email address (publicinfo@sec.gov) or by writing the Public Reference Room of the SEC, Washington, DC 20549-0102.
Proxy Voting Policies and Procedures and Proxy Voting Record
You may obtain a copy of the Fund's Proxy Voting Policy and Procedures and information regarding how the Fund voted proxies relating to portfolio securities during the most recent twelve-month period ended June 30, without charge, upon request, by calling toll free 1 (800) 548-7786 or by visiting our website at www.morganstanley.com/im. This information is also available on the SEC's website at www.sec.gov.
This report is authorized for distribution only when preceded or accompanied by a prospectus of the Morgan Stanley Institutional Fund Trust, which describes in detail each Portfolio's investment policies, risks, fees and expenses. Please read the prospectus carefully before you invest or send money. For additional information, including information regarding the investments comprising the Portfolio, please visit our website at www.morganstanley.com/im or call toll free 1 (800) 548-7786.
42
(This Page has been left blank intentionally.)
(This Page has been left blank intentionally.)
Printed in U.S.A.
This Report has been prepared for shareholders and may be distributed to others only if preceded or accompanied by a current prospectus.
Morgan Stanley Investment Management Inc.
522 Fifth Avenue
New York, New York 10036
© 2015 Morgan Stanley. Morgan Stanley Distribution, Inc.

IFTLDANN
1333170 EXP 11.30.16

Morgan Stanley Institutional Fund Trust
Mid Cap Growth Portfolio
Annual Report
September 30, 2015

Morgan Stanley Institutional Fund Trust
Annual Report — September 30, 2015
Shareholders' Letter | | | 2 | | |
Expense Example | | | 3 | | |
Investment Overview | | | 4 | | |
Portfolio of Investments | | | 6 | | |
Statement of Assets and Liabilities | | | 9 | | |
Statement of Operations | | | 11 | | |
Statements of Changes in Net Assets | | | 12 | | |
Financial Highlights | | | 13 | | |
Notes to Financial Statements | | | 17 | | |
Report of Independent Registered Public Accounting Firm | | | 28 | | |
Investment Advisory Agreement Approval | | | 29 | | |
Federal Tax Notice | | | 31 | | |
U.S. Privacy Policy | | | 32 | | |
Trustee and Officer Information | | | 35 | | |
This report is authorized for distribution only when preceded or accompanied by prospectuses of the Morgan Stanley Institutional Fund Trust. To receive a prospectus and/or statement of additional information (SAI), which contains more complete information such as investment objectives, charges, expenses, policies for voting proxies, risk considerations, and describes in detail each of the Portfolio's investment policies to the prospective investor, please call toll free 1 (800) 548-7786. Please read the prospectuses carefully before you invest or send money.
Additionally, you can access portfolio information including performance, characteristics, and investment team commentary through Morgan Stanley Investment Management's website: www.morganstanley.com/im.
Market forecasts provided in this report may not necessarily come to pass. There is no guarantee that any sectors mentioned will continue to perform as discussed herein or that securities in such sectors will be held by the Portfolio in the future. There is no assurance that a Portfolio will achieve its investment objective. Portfolios are subject to market risk, which is the possibility that market values of securities owned by the Portfolio will decline and, therefore, the value of the Portfolio's shares may be less than what you paid for them. Accordingly, you can lose money investing in this Portfolio. Please see the prospectus for more complete information on investment risks.
1
Morgan Stanley Institutional Fund Trust
Annual Report — September 30, 2015
Shareholders' Letter (unaudited)
Dear Shareholders,
We are pleased to provide this Annual report, in which you will learn how your investment in Mid Cap Growth Portfolio (the "Portfolio") performed during the latest twelve-month period.
Morgan Stanley Investment Management is a client-centric, investor-led organization. Our global presence, intellectual capital, and breadth of products and services enable us to partner with investors to meet the evolving challenges of today's financial markets. We aim to deliver superior investment service and to empower our clients to make the informed decisions that help them reach their investment goals.
As always, we thank you for selecting Morgan Stanley Investment Management, and look forward to working with you in the months and years ahead.
Sincerely,

John H. Gernon
President and Principal Executive Officer
October 2015
2
Morgan Stanley Institutional Fund Trust
Annual Report — September 30, 2015
Expense Example (unaudited)
Mid Cap Growth Portfolio
As a shareholder of the Portfolio, you may incur two types of costs: (1) transactional costs, including sales charge (loads) on purchase payments; and (2) ongoing costs, including advisory fees, administration fees, distribution and shareholder services fees; and other Portfolio expenses. This example is intended to help you understand your ongoing costs (in dollars) of investing in the Portfolio and to compare these costs with the ongoing costs of investing in other mutual funds.
This example is based on an investment of $1,000 invested at the beginning of the six-month period ended September 30, 2015 and held for the entire six-month period.
Actual Expenses
The table below provides information about actual account values and actual expenses. You may use the information in this table, together with the amount you invested, to estimate the expenses that you paid over the period. Simply divide your account value by $1,000 (for example, an $8,600 account value divided by $1,000 = 8.6), then multiply the result by the number in the table under the heading entitled "Actual Expenses Paid During Period" to estimate the expenses you paid on your account during this period.
Hypothetical Example for Comparison Purposes
The table below provides information about hypothetical account values and hypothetical expenses based on the Portfolio's actual expense ratio and an assumed rate of return of 5% per year before expenses, which is not the Portfolio's actual return. The hypothetical account values and expenses may not be used to estimate the actual ending account balance or expenses you paid for the period. You may use this information to compare the ongoing costs of investing in the Portfolio and other funds. To do so, compare this 5% hypothetical example with the 5% hypothetical examples that appear in the shareholder reports of the other funds.
Please note that the expenses shown in the table are meant to highlight your ongoing costs only and do not reflect any transactional costs, such as sales charges (loads, if applicable). Therefore, the information for each class in the table is useful in comparing ongoing costs only, and will not help you determine the relative total costs of owning different funds. In addition, if these transactional costs were included, your costs would have been higher.
| | | Beginning
Account
Value
4/1/15 | | Actual Ending
Account
Value
9/30/15 | | Hypothetical
Ending Account
Value | | Actual
Expenses
Paid
During
Period* | | Hypothetical
Expenses Paid
During Period* | | Net
Expense
Ratio
During
Period** | |
Mid Cap Growth Portfolio Class I | | $ | 1,000.00 | | | $ | 887.70 | | | $ | 1,021.31 | | | $ | 3.55 | | | $ | 3.80 | | | | 0.75 | % | |
Mid Cap Growth Portfolio Class A | | | 1,000.00 | | | | 886.50 | | | | 1,020.05 | | | | 4.73 | | | | 5.06 | | | | 1.00 | | |
Mid Cap Growth Portfolio Class L | | | 1,000.00 | | | | 884.00 | | | | 1,017.25 | | | | 7.37 | | | | 7.89 | | | | 1.56 | | |
Mid Cap Growth Portfolio Class IS | | | 1,000.00 | | | | 888.50 | | | | 1,022.01 | | | | 2.89 | | | | 3.09 | | | | 0.61 | | |
* Expenses are calculated using each Portfolio Class' annualized net expense ratio (as disclosed), multiplied by the average account value over the period, and multiplied by 183/365 (to reflect the most recent one-half year period).
** Annualized.
3
Morgan Stanley Institutional Fund Trust
Annual Report — September 30, 2015
Investment Overview (unaudited)
Mid Cap Growth Portfolio
The Mid Cap Growth Portfolio seeks long-term capital growth.
Performance
For the fiscal year ended September 30, 2015, the Portfolio's Class I shares had a total return based on net asset value and reinvestment of distributions per share of –6.18%, net of fees. The Portfolio's Class I shares underperformed against the Portfolio's benchmark the Russell Midcap® Growth Index (the "Index"), which returned 1.45%.
Factors Affecting Performance
• Although the U.S. economy continued to grow at a modest rate, concerns about the timing of the Federal Reserve's (Fed) interest rate hike and global economic weakness put downward pressure on U.S. stocks during the reporting period. With the Fed concluding its bond-buying stimulus program in October 2014, expectations were that the central bank would begin to normalize its main policy interest rate sometime in 2015. However, U.S. gross domestic product (GDP) growth was weaker than expected for the first quarter of 2015, leading the Fed and the markets to reassess the timing of a rate hike. The slowdown proved temporary, however, and the economy resumed a more moderate pace in the second quarter. While the overall GDP growth trend coupled with sustained improvements in the labor market argued for the Fed raising rates, other factors clouded the outlook, causing uncertainty for the market. The Fed left rates unchanged at its September 2015 meeting, citing low inflation levels and concerns that economic weakness abroad could put further downward pressure on inflation and restrain economic activity in the U.S. Headwinds outside the U.S. included Europe's fragile recovery, which looked particularly vulnerable when tense negotiations earlier in the summer between Greece's newly elected prime minster and its eurozone creditors reignited fears that the country could exit the euro. China also began dominating headlines, with its stock market crashing in July and August, and its economy continuing to slow despite a barrage of stimulus measures. In response, U.S. stock price volatility spiked in the final months of the period, reversing most of the gains made earlier in the reporting period.
• The Portfolio's relative underperformance was driven mainly by stock selection in the information technology (IT) and consumer staples sectors. Stock selection in the health care sector was also unfavorable during the period.
• Within the IT sector, a holding in a global communications platform was the largest detractor both in the sector and the overall Portfolio. Although the company reported results in July that met analysts' expectations, its comments regarding the expected pace of user growth weighed on investor sentiment. The timeline to appoint a new CEO for the company also remained an overhang on the stock. Nevertheless, we continue to believe the company is a valuable broadcasting platform with a substantial monetization opportunity.
• In the consumer staples sector, a position in a leading single-serve coffee provider was the main drag on performance. The company reported poor results and also lowered its outlook, which led the shares to decline sharply. The sales miss was in part due to price competition in the category, as well as the company's poor execution around the release of its new brewer systems earlier in 2015. We are monitoring the situation closely. We are attracted to the company because of its dominant share in the high-growth, single-serve segment within the coffee category — which is an attractive category overall given its habitual consumption trends and high brand loyalty. We also believe the company has a large opportunity to translate this expertise to the cold drink channel via its partnership with another dominant global beverage company.
• The Portfolio benefited from its significant underweight in the energy sector. Within the Index, the energy sector declined 42% over the 12-month period.(i) The Portfolio's energy weighting averaged less than 1% and comprised only one stock, which generated a positive return for the Portfolio and was sold before the end of the period. Similarly, the Portfolio had no exposure to the materials sector, another underperforming sector in the Index during this reporting period, which was advantageous to relative performance.
• Stock selection in the financials sector was another positive contributor to performance. The Portfolio's position in a global provider of performance, risk
(i) Data from FactSet and MSCI
4
Morgan Stanley Institutional Fund Trust
Annual Report — September 30, 2015
Investment Overview (unaudited) (cont'd)
Mid Cap Growth Portfolio
management, and corporate governance products added meaningfully to returns during the period. The company's shares advanced on news that a large activist shareholder is pushing for changes at the company to create value. We are attracted to the company as its indices and products have become the de facto standard in several areas of the financial services industry.
Management Strategies
• We look for high-quality growth companies that we believe have these attributes: sustainable competitive advantages, above-average business visibility, rising return on invested capital, strong free cash flow generation and a favorable risk/reward profile. We find these companies through intense fundamental research. Our emphasis is on secular growth, and as a result, short-term market events are not as meaningful in the stock selection process.
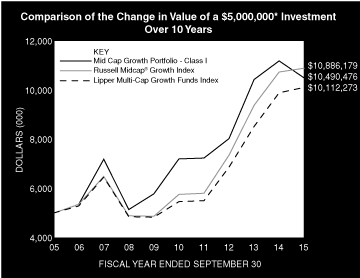
* Minimum Investment
In accordance with SEC regulations, the Portfolio's performance shown assumes that all recurring fees (including management fees) were deducted and all dividends and distributions were reinvested. The performance of Class A, Class L and Class IS shares will vary from the performance of Class I shares based upon their different inception dates and will be negatively impacted by additional fees assessed to those classes (where applicable).
Performance Compared to the Russell Midcap® Growth Index(1) and the Lipper Multi-Cap Growth Funds Index(2)
| | | Period Ended September 30, 2015
Total Returns(3) | |
| | | | | Average Annual | |
| | | One
Year | | Five
Years | | Ten
Years | | Since
Inception(8) | |
Portfolio — Class I Shares
w/o sales charges(4) | | | –6.18 | % | | | 7.82 | % | | | 7.69 | % | | | 12.12 | % | |
Portfolio — Class A Shares
w/o sales charges(5) | | | –6.40 | | | | 7.54 | | | | 7.42 | | | | 9.32 | | |
Portfolio — Class A Shares with
maximum 5.25% sales charges(5) | | | –11.33 | | | | 6.39 | | | | 6.84 | | | | 9.00 | | |
Portfolio — Class L Shares
w/o sales charges(6) | | | –6.94 | | | | — | | | | — | | | | 8.77 | | |
Portfolio — Class IS Shares
w/o sales charges(7) | | | –6.02 | | | | — | | | | — | | | | 1.02 | | |
Russell Midcap® Growth Index | | | 1.45 | | | | 13.58 | | | | 8.09 | | | | 10.12 | | |
Lipper Multi-Cap Growth Funds Index | | | 2.21 | | | | 13.11 | | | | 7.30 | | | | 8.91 | | |
Performance data quoted represents past performance, which is no guarantee of future results, and current performance may be lower or higher than the figures shown. Performance assumes that all dividends and distributions, if any, were reinvested. For the most recent month-end performance figures, please visit www.morganstanley.com/im. Investment returns and principal value will fluctuate so that Portfolio shares, when redeemed, may be worth more or less than their original cost. Total returns do not reflect the deduction of taxes that a shareholder would pay on Portfolio distributions or the redemption of Portfolio shares. Performance of share classes will vary due to differences in sales charges and expenses.
(1) The Russell Midcap® Growth Index measures the performance of the mid-cap growth segment of the U.S. equity universe. It includes those Russell Midcap® Index companies with higher price-to-book ratios and higher forecasted growth values. The Russell Midcap® Index is a subset of the Russell 1000® Index and includes approximately 800 of the smallest securities in the Russell 1000® Index, which in turn consists of approximately 1,000 of the largest U.S. securities based on a combination of market capitalization and current index membership. The Index is unmanaged and its returns do not include any sales charges or fees. Such costs would lower performance. It is not possible to invest directly in an index.
(2) The Lipper Multi-Cap Growth Funds Index is an equally weighted performance index of the largest qualifying funds (based on net assets) in the Lipper Multi-Cap Growth Funds classification. The index, which is adjusted for capital gains distributions and income dividends, is unmanaged and should not be considered an investment. There are currently 30 funds represented in this Index. As of the date of this report, the Portfolio was in the Lipper Multi-Cap Growth Funds classification.
(3) Total returns for the Portfolio reflect expenses waived and/or reimbursed, if applicable, by the Adviser. Without such waivers and/or reimbursements, total returns would have been lower.
(4) Commenced operations on March 30, 1990.
(5) Commenced operations on January 31, 1997.
(6) Commenced operations on June 14, 2012.
(7) Commenced operations on September 13, 2013.
(8) For comparative purposes, average annual since inception returns listed for the Indexes refer to the inception date of Class I of the Portfolio, not the inception of the Indexes.
5
Morgan Stanley Institutional Fund Trust
Annual Report — September 30, 2015
Portfolio of Investments
Mid Cap Growth Portfolio
| | | Shares | | Value
(000) | |
Common Stocks (94.1%) | |
Aerospace & Defense (1.1%) | |
TransDigm Group, Inc. (a) | | | 219,000 | | | $ | 46,518 | | |
Air Freight & Logistics (0.5%) | |
XPO Logistics, Inc. (a)(b) | | | 809,437 | | | | 19,289 | | |
Automobiles (5.0%) | |
Tesla Motors, Inc. (a) | | | 847,759 | | | | 210,583 | | |
Beverages (3.1%) | |
Monster Beverage Corp. (a) | | | 965,728 | | | | 130,509 | | |
Biotechnology (1.1%) | |
Alnylam Pharmaceuticals, Inc. (a) | | | 251,604 | | | | 20,219 | | |
Intrexon Corp. (a)(b) | | | 481,342 | | | | 15,306 | | |
Seattle Genetics, Inc. (a) | | | 317,266 | | | | 12,234 | | |
| | | | 47,759 | | |
Communications Equipment (1.1%) | |
Palo Alto Networks, Inc. (a) | | | 260,412 | | | | 44,791 | | |
Consumer Finance (2.4%) | |
LendingClub Corp. (a) | | | 7,685,013 | | | | 101,673 | | |
Diversified Financial Services (6.0%) | |
McGraw Hill Financial, Inc. | | | 1,360,337 | | | | 117,669 | | |
MSCI, Inc. | | | 2,297,264 | | | | 136,595 | | |
| | | | 254,264 | | |
Electrical Equipment (0.4%) | |
SolarCity Corp. (a)(b) | | | 428,625 | | | | 18,307 | | |
Food Products (3.8%) | |
Keurig Green Mountain, Inc. | | | 1,049,143 | | | | 54,703 | | |
Mead Johnson Nutrition Co. | | | 1,547,105 | | | | 108,916 | | |
| | | | 163,619 | | �� |
Health Care Equipment & Supplies (4.9%) | |
DexCom, Inc. (a) | | | 498,085 | | | | 42,765 | | |
Intuitive Surgical, Inc. (a) | | | 364,935 | | | | 167,717 | | |
| | | | 210,482 | | |
Health Care Technology (3.4%) | |
athenahealth, Inc. (a) | | | 1,083,670 | | | | 144,507 | | |
Hotels, Restaurants & Leisure (3.2%) | |
Chipotle Mexican Grill, Inc. (a) | | | 32,664 | | | | 23,526 | | |
Dunkin' Brands Group, Inc. | | | 2,300,333 | | | | 112,717 | | |
| | | | 136,243 | | |
Information Technology Services (4.5%) | |
FleetCor Technologies, Inc. (a) | | | 727,204 | | | | 100,078 | | |
Gartner, Inc. (a) | | | 1,112,253 | | | | 93,351 | | |
| | | | 193,429 | | |
Internet & Catalog Retail (2.6%) | |
TripAdvisor, Inc. (a) | | | 305,329 | | | | 19,242 | | |
Vipshop Holdings Ltd. ADR (China) (a) | | | 1,891,405 | | | | 31,775 | | |
Zalando SE (Germany) (a)(c) | | | 975,341 | | | | 32,305 | | |
zulily, Inc., Class A (a) | | | 1,652,817 | | | | 28,759 | | |
| | | | 112,081 | | |
| | | Shares | | Value
(000) | |
Internet Software & Services (18.0%) | |
Autohome, Inc. ADR (China) (a) | | | 1,451,858 | | | $ | 47,229 | | |
Dropbox, Inc. (a)(d)(e)(f)
(acquisition cost — $33,909;
acquired 5/1/12) | | | 3,747,173 | | | | 69,398 | | |
LinkedIn Corp., Class A (a) | | | 1,000,588 | | | | 190,242 | | |
MercadoLibre, Inc. (Brazil) | | | 361,120 | | | | 32,884 | | |
Pandora Media, Inc. (a) | | | 2,211,778 | | | | 47,199 | | |
Survey Monkey, Inc. (a)(d)(e)(f)
(acquisition cost — $28,952;
acquired 11/25/14) | | | 1,760,030 | | | | 28,864 | | |
Twitter, Inc. (a) | | | 6,357,773 | | | | 171,278 | | |
Yelp, Inc. (a) | | | 545,937 | | | | 11,825 | | |
Youku Tudou, Inc. ADR (China) (a) | | | 2,156,091 | | | | 38,012 | | |
Zillow Group, Inc., Class A (a)(b) | | | 1,572,682 | | | | 45,183 | | |
Zillow Group, Inc., Class C (a)(b) | | | 3,145,363 | | | | 84,925 | | |
| | | 767,039 | | |
Life Sciences Tools & Services (4.7%) | |
Illumina, Inc. (a) | | | 1,135,019 | | | | 199,559 | | |
Media (1.6%) | |
Legend Pictures LLC Ltd. (a)(d)(e)(f)
(acquisition cost — $38,812;
acquired 3/8/12) | | | 36,302 | | | | 66,960 | | |
Pharmaceuticals (5.7%) | |
Endo International PLC (a) | | | 1,706,329 | | | | 118,214 | | |
Zoetis, Inc. | | | 3,057,940 | | | | 125,926 | | |
| | | | 244,140 | | |
Professional Services (5.0%) | |
IHS, Inc., Class A (a) | | | 831,372 | | | | 96,439 | | |
Verisk Analytics, Inc., Class A (a) | | | 1,563,390 | | | | 115,550 | | |
| | | | 211,989 | | |
Software (11.3%) | |
FireEye, Inc. (a) | | | 1,234,156 | | | | 39,271 | | |
Mobileye N.V. (a) | | | 488,197 | | | | 22,203 | | |
NetSuite, Inc. (a) | | | 415,007 | | | | 34,819 | | |
ServiceNow, Inc. (a) | | | 1,575,249 | | | | 109,401 | | |
Splunk, Inc. (a) | | | 2,293,927 | | | | 126,969 | | |
Tableau Software, Inc., Class A (a) | | | 483,809 | | | | 38,598 | | |
Workday, Inc., Class A (a) | | | 1,621,254 | | | | 111,640 | | |
| | | | 482,901 | | |
Specialty Retail (1.0%) | |
Ulta Salon Cosmetics & Fragrance, Inc. (a) | | | 268,196 | | | | 43,810 | | |
Tech Hardware, Storage & Peripherals (0.3%) | |
3D Systems Corp. (a)(b) | | | 635,142 | | | | 7,336 | | |
Stratasys Ltd. (a)(b) | | | 220,802 | | | | 5,849 | | |
| | | | 13,185 | | |
Textiles, Apparel & Luxury Goods (3.4%) | |
Lululemon Athletica, Inc. (Canada) (a) | | | 973,316 | | | | 49,298 | | |
Michael Kors Holdings Ltd. (a) | | | 1,506,173 | | | | 63,621 | | |
Under Armour, Inc., Class A (a) | | | 338,890 | | | | 32,798 | | |
| | | | 145,717 | | |
| Total Common Stocks (Cost $3,417,822) | | | 4,009,354 | | |
The accompanying notes are an integral part of the financial statements.
6
Morgan Stanley Institutional Fund Trust
Annual Report — September 30, 2015
Portfolio of Investments (cont'd)
Mid Cap Growth Portfolio
| | | Shares | | Value
(000) | |
Convertible Preferred Stocks (0.2%) | |
Internet & Catalog Retail (0.0%) | |
Peixe Urbano, Inc. (Brazil) (a)(d)(e)(f)
(acquisition cost — $18,817;
acquired 12/2/11) | | | 571,575 | | | $ | 246 | | |
Internet Software & Services (0.2%) | |
Dropbox, Inc. Series A (a)(d)(e)(f)
(acquisition cost — $3,365;
acquired 5/25/12) | | | 371,814 | | | | 6,886 | | |
Total Convertible Preferred Stocks (Cost $22,182) | | | 7,132 | | |
Preferred Stocks (5.9%) | |
Internet & Catalog Retail (4.4%) | |
Airbnb, Inc. Series D (a)(d)(e)(f)
(acquisition cost — $47,799;
acquired 4/16/14) | | | 1,174,038 | | | | 109,296 | | |
Flipkart Online Services Pvt Ltd.
Series D (a)(d)(e)(f)
(acquisition cost — $13,007;
acquired 10/4/13) | | | 566,827 | | | | 76,987 | | |
| | | | 186,283 | | |
Software (1.5%) | |
Palantir Technologies, Inc.
Series G (a)(d)(e)(f)
(acquisition cost — $11,738;
acquired 7/19/12) | | | 3,835,908 | | | | 43,653 | | |
Palantir Technologies, Inc.
Series H (a)(d)(e)(f)
(acquisition cost — $3,519;
acquired 10/25/13) | | | 1,002,564 | | | | 11,409 | | |
Palantir Technologies, Inc.
Series H1 (a)(d)(e)(f)
(acquisition cost — $3,519;
acquired 10/25/13) | | | 1,002,564 | | | | 11,409 | | |
| | | | 66,471 | | |
| Total Preferred Stocks (Cost $79,582) | | | 252,754 | | |
| | | Notional
Amount | | | |
Call Options Purchased (0.3%) | |
Foreign Currency Options (0.3%) | |
USD/CNY June 2016 @ CNY 6.70 | | | 802,258,685 | | | | 10,442 | | |
USD/CNY November 2015 @ CNY 6.65 | | | 1,137,270,245 | | | | 2,622 | | |
Total Call Options Purchased (Cost $6,849) | | | 13,064 | | |
| | | Shares | | | |
Short-Term Investments (5.6%) | |
Securities held as Collateral on Loaned Securities (4.1%) | |
Investment Company (3.4%) | |
Morgan Stanley Institutional Liquidity
Funds — Treasury Securities Portfolio —
Institutional Class (See Note G) | | | 148,010,673 | | | | 148,011 | | |
| | | Face
Amount
(000) | | Value
(000) | |
Repurchase Agreements (0.7%) | |
Barclays Capital, Inc., (0.10%,
dated 9/30/15, due 10/1/15;
proceeds $20,645; fully collateralized
by various U.S. Government obligations;
1.50% — 2.75% due 5/31/19 — 2/15/24;
valued at $21,058) | | $ | 20,645 | | | $ | 20,645 | | |
BNP Paribas Securities Corp., (0.10%,
dated 9/30/15, due 10/1/15;
proceeds $8,602; fully collateralized
by various U.S. Government agency
securities; 1.63% — 6.00%
due 7/1/18 — 9/1/45; valued at $8,774) | | | 8,602 | | | | 8,602 | | |
| | | | 29,247 | | |
Total Securities held as Collateral on Loaned
Securities (Cost $177,258) | | | 177,258 | | |
| | | Shares | | | |
Investment Company (1.5%) | |
Morgan Stanley Institutional Liquidity
Funds — Money Market Portfolio —
Institutional Class (See Note G)
(Cost $62,131) | | | 62,130,917 | | | | 62,131 | | |
Total Short-Term Investments (Cost $239,389) | | | 239,389 | | |
Total Investments (106.1%) (Cost $3,765,824)
Including $173,144 of Securities Loaned (g)(h) | | | 4,521,693 | | |
Liabilities in Excess of Other Assets (-6.1%) | | | (260,363 | ) | |
Net Assets (100.0%) | | $ | 4,261,330 | | |
(a) Non-income producing security.
(b) All or a portion of this security was on loan at September 30, 2015.
(c) 144A security — Certain conditions for public sale may exist. Unless otherwise noted, these securities are deemed to be liquid.
(d) At September 30, 2015, the Portfolio held fair valued securities valued at approximately $425,108,000, representing 10.0% of net assets. These securities have been fair valued as determined in good faith under procedures established by and under the general supervision of the Fund's Trustees.
(e) Security cannot be offered for public resale without first being registered under the Securities Act of 1933 and related rules ("restricted security"). Acquisition date represents the day on which an enforceable right to acquire such security is obtained and is presented along with related cost in the security description. The Portfolio has registration rights for certain restricted securities. Any costs related to such registration are borne by the issuer. The aggregate value of restricted securities (excluding 144A holdings) at September 30, 2015 amounts to approximately $425,108,000 and represents 10.0% of net assets.
(f) Security has been deemed illiquid at September 30, 2015.
(g) The approximate fair value and percentage of net assets, $32,305,000 and 0.8%, respectively, represent the securities that have been fair valued under the fair valuation policy for international investments as described in Note A-1 within the Notes to the Financial Statements.
(h) At September 30, 2015, the aggregate cost for Federal income tax purposes is approximately $3,797,254,000. The aggregate gross unrealized appreciation is approximately $1,173,607,000 and the aggregate gross unrealized depreciation is approximately $449,168,000 resulting in net unrealized appreciation of approximately $724,439,000.
The accompanying notes are an integral part of the financial statements.
7
Morgan Stanley Institutional Fund Trust
Annual Report — September 30, 2015
Portfolio of Investments (cont'd)
Mid Cap Growth Portfolio
ADR American Depositary Receipt.
CNY — Chinese Yuan Renminbi
USD — United States Dollar
Portfolio Composition*
Classification | | Percentage of
Total Investments | |
Other** | | | 51.2 | % | |
Internet Software & Services | | | 17.8 | | |
Software | | | 12.6 | | |
Internet & Catalog Retail | | | 6.9 | | |
Diversified Financial Services | | | 5.9 | | |
Pharmaceuticals | | | 5.6 | | |
Total Investments | | | 100.0 | % | |
* Percentages indicated are based upon total investments (excluding Securities held as Collateral on Loaned Securities) as of September 30, 2015.
** Industries and/or investment types representing less than 5% of total investments.
The accompanying notes are an integral part of the financial statements.
8
Morgan Stanley Institutional Fund Trust
Annual Report — September 30, 2015
Statement of Assets and Liabilities | | September 30, 2015
(000) | |
Assets: | |
Investments in Securities of Unaffiliated Issuers, at Value(1) (Cost $3,555,682) | | $ | 4,311,551 | | |
Investment in Security of Affiliated Issuer, at Value (Cost $210,142) | | | 210,142 | | |
Total Investments in Securities, at Value (Cost $3,765,824) | | | 4,521,693 | | |
Cash | | | — | @ | |
Receivable for Investments Sold | | | 12,704 | | |
Receivable for Portfolio Shares Sold | | | 1,756 | | |
Dividends Receivable | | | 977 | | |
Receivable from Affiliate | | | 11 | | |
Other Assets | | | 311 | | |
Total Assets | | | 4,537,452 | | |
Liabilities: | |
Collateral on Securities Loaned, at Value | | | 177,258 | | |
Payable for Portfolio Shares Redeemed | | | 47,862 | | |
Payable for Investments Purchased | | | 25,311 | | |
Due to Broker | | | 16,640 | | |
Payable for Advisory Fees | | | 6,455 | | |
Payable for Sub Transfer Agency Fees — Class I | | | 941 | | |
Payable for Sub Transfer Agency Fees — Class A | | | 494 | | |
Payable for Sub Transfer Agency Fees — Class L | | | 11 | | |
Payable for Administration Fees | | | 301 | | |
Payable for Shareholder Services Fees — Class A | | | 223 | | |
Payable for Distribution and Shareholder Services Fees — Class L | | | 8 | | |
Payable for Trustees' Fees and Expenses | | | 50 | | |
Payable for Transfer Agency Fees — Class I | | | 12 | | |
Payable for Transfer Agency Fees — Class A | | | 19 | | |
Payable for Transfer Agency Fees — Class L | | | 1 | | |
Payable for Transfer Agency Fees — Class IS | | | — | @ | |
Payable for Professional Fees | | | 23 | | |
Payable for Custodian Fees | | | 17 | | |
Other Liabilities | | | 496 | | |
Total Liabilities | | | 276,122 | | |
Net Assets | | $ | 4,261,330 | | |
Net Assets Consist Of: | |
Paid-in-Capital | | $ | 3,153,279 | | |
Distributions in Excess of Net Investment Income | | | (32,212 | ) | |
Accumulated Undistributed Net Realized Gain | | | 384,394 | | |
Unrealized Appreciation (Depreciation) on: | |
Investments | | | 755,869 | | |
Foreign Currency Translations | | | (— | @) | |
Net Assets | | $ | 4,261,330 | | |
The accompanying notes are an integral part of the financial statements.
9
Morgan Stanley Institutional Fund Trust
Annual Report — September 30, 2015
Statement of Assets and Liabilities (cont'd) | | September 30, 2015
(000) | |
CLASS I: | |
Net Assets | | $ | 2,164,565 | | |
| Shares Outstanding (unlimited number of shares authorized, no par value) (not in 000's) | | | 60,193,686 | | |
Net Asset Value, Offering and Redemption Price Per Share | | $ | 35.96 | | |
CLASS A: | |
Net Assets | | $ | 996,553 | | |
| Shares Outstanding (unlimited number of shares authorized, no par value) (not in 000's) | | | 29,258,762 | | |
Net Asset Value, Redemption Price Per Share | | $ | 34.06 | | |
Maximum Sales Load | | | 5.25 | % | |
Maximum Sales Charge | | $ | 1.89 | | |
Maximum Offering Price Per Share | | $ | 35.95 | | |
CLASS L: | |
Net Assets | | $ | 12,600 | | |
| Shares Outstanding (unlimited number of shares authorized, no par value) (not in 000's) | | | 377,297 | | |
Net Asset Value, Offering and Redemption Price Per Share | | $ | 33.39 | | |
CLASS IS: | |
Net Assets | | $ | 1,087,612 | | |
| Shares Outstanding (unlimited number of shares authorized, no par value) (not in 000's) | | | 30,189,434 | | |
Net Asset Value, Offering and Redemption Price Per Share | | $ | 36.03 | | |
(1) Including:
Securities on Loan, at Value: | | $ | 173,144 | | |
@ Amount is less than $500.
The accompanying notes are an integral part of the financial statements.
10
Morgan Stanley Institutional Fund Trust
Annual Report — September 30, 2015
Statement of Operations | | Year Ended
September 30, 2015
(000) | |
Investment Income: | |
Dividends from Securities of Unaffiliated Issuers | | $ | 15,324 | | |
Income from Securities Loaned — Net | | | 6,632 | | |
Dividends from Security of Affiliated Issuer (Note G) | | | 206 | | |
Total Investment Income | | | 22,162 | | |
Expenses: | |
Advisory Fees (Note B) | | | 31,710 | | |
Sub Transfer Agency Fees — Class I | | | 5,352 | | |
Sub Transfer Agency Fees — Class A | | | 2,175 | | |
Sub Transfer Agency Fees — Class L | | | 24 | | |
Administration Fees (Note C) | | | 5,074 | | |
Shareholder Services Fees — Class A (Note D) | | | 3,815 | | |
Distribution and Shareholder Services Fees — Class L (Note D) | | | 117 | | |
Shareholder Reporting Fees | | | 852 | | |
Custodian Fees (Note F) | | | 361 | | |
Registration Fees | | | 255 | | |
Trustees' Fees and Expenses | | | 172 | | |
Professional Fees | | | 125 | | |
Transfer Agency Fees — Class I (Note E) | | | 49 | | |
Transfer Agency Fees — Class A (Note E) | | | 76 | | |
Transfer Agency Fees — Class L (Note E) | | | 6 | | |
Transfer Agency Fees — Class IS (Note E) | | | 2 | | |
Pricing Fees | | | 5 | | |
Other Expenses | | | 134 | | |
Total Expenses | | | 50,304 | | |
Rebate from Morgan Stanley Affiliate (Note G) | | | (171 | ) | |
Net Expenses | | | 50,133 | | |
Net Investment Loss | | | (27,971 | ) | |
Realized Gain: | |
Investments Sold | | | 462,381 | | |
Foreign Currency Transactions | | | 67 | | |
Net Realized Gain | | | 462,448 | | |
Change in Unrealized Appreciation (Depreciation): | |
Investments | | | (616,531 | ) | |
Foreign Currency Translations | | | 51 | | |
Net Change in Unrealized Appreciation (Depreciation) | | | (616,480 | ) | |
Net Realized Gain and Change in Unrealized Appreciation (Depreciation) | | | (154,032 | ) | |
Net Decrease in Net Assets Resulting from Operations | | $ | (182,003 | ) | |
The accompanying notes are an integral part of the financial statements.
11
Morgan Stanley Institutional Fund Trust
Annual Report — September 30, 2015
Statements of Changes in Net Assets | | Year Ended
September 30, 2015
(000) | | Year Ended
September 30, 2014
(000) | |
Increase (Decrease) in Net Assets: | |
Operations: | |
Net Investment Income (Loss) | | $ | (27,971 | ) | | $ | 9,697 | | |
Net Realized Gain | | | 462,448 | | | | 884,947 | | |
Net Change in Unrealized Appreciation (Depreciation) | | | (616,480 | ) | | | (387,167 | ) | |
Net Increase (Decrease) in Net Assets Resulting from Operations | | | (182,003 | ) | | | 507,477 | | |
Distributions from and/or in Excess of: | |
Class I: | |
Net Investment Income | | | (9,202 | ) | | | — | | |
Net Realized Gain | | | (622,473 | ) | | | (310,448 | ) | |
Class A: | |
Net Realized Gain | | | (246,534 | ) | | | (128,582 | ) | |
Class L: | |
Net Realized Gain | | | (2,378 | ) | | | (1,046 | ) | |
Class IS: | |
Net Investment Income | | | (2,208 | ) | | | — | | |
Net Realized Gain | | | (89,011 | ) | | | (1 | ) | |
Total Distributions | | | (971,806 | ) | | | (440,077 | ) | |
Capital Share Transactions:(1) | |
Class I: | |
Subscribed | | | 388,442 | | | | 916,673 | | |
Distributions Reinvested | | | 591,126 | | | | 297,048 | | |
Redeemed | | | (2,845,084 | ) | | | (1,755,132 | ) | |
Class A: | |
Subscribed | | | 96,465 | | | | 295,233 | | |
Distributions Reinvested | | | 243,008 | | | | 126,784 | | |
Redeemed | | | (908,512 | ) | | | (745,859 | ) | |
Class L: | |
Subscribed | | | 265 | | | | 1,469 | | |
Distributions Reinvested | | | 2,327 | | | | 1,024 | | |
Redeemed | | | (3,574 | ) | | | (2,856 | ) | |
Class IS: | |
Subscribed | | | 840,659 | | | | 725,627 | | |
Distributions Reinvested | | | 90,604 | | | | — | | |
Redeemed | | | (327,990 | ) | | | (43,141 | ) | |
Net Decrease in Net Assets Resulting from Capital Share Transactions | | | (1,832,264 | ) | | | (183,130 | ) | |
Total Decrease in Net Assets | | | (2,986,073 | ) | | | (115,730 | ) | |
Net Assets: | |
Beginning of Period | | | 7,247,403 | | | | 7,363,133 | | |
End of Period (Including Distributions in Excess of Net Investment Income and Accumulated Undistributed
Net Investment Income of $(32,212) and $11,125, respectively) | | $ | 4,261,330 | | | $ | 7,247,403 | | |
(1) Capital Share Transactions: | |
Class I: | |
Shares Subscribed | | | 9,353 | | | | 20,224 | | |
Shares Issued on Distributions Reinvested | | | 15,709 | | | | 6,827 | | |
Shares Redeemed | | | (70,154 | ) | | | (38,728 | ) | |
Net Decrease in Class I Shares Outstanding | | | (45,092 | ) | | | (11,677 | ) | |
Class A: | |
Shares Subscribed | | | 2,466 | | | | 6,761 | | |
Shares Issued on Distributions Reinvested | | | 6,803 | | | | 3,046 | | |
Shares Redeemed | | | (23,545 | ) | | | (17,415 | ) | |
Net Decrease in Class A Shares Outstanding | | | (14,276 | ) | | | (7,608 | ) | |
Class L: | |
Shares Subscribed | | | 6 | | | | 34 | | |
Shares Issued on Distributions Reinvested | | | 66 | | | | 24 | | |
Shares Redeemed | | | (94 | ) | | | (67 | ) | |
Net Decrease in Class L Shares Outstanding | | | (22 | ) | | | (9 | ) | |
Class IS: | |
Shares Subscribed | | | 21,050 | | | | 15,763 | | |
Shares Issued on Distributions Reinvested | | | 2,405 | | | | — | | |
Shares Redeemed | | | (8,054 | ) | | | (975 | ) | |
Net Increase in Class IS Shares Outstanding | | | 15,401 | | | | 14,788 | | |
The accompanying notes are an integral part of the financial statements.
12
Morgan Stanley Institutional Fund Trust
Annual Report — September 30, 2015
Financial Highlights
Mid Cap Growth Portfolio
| | | Class I | |
| | | Year Ended September 30, | |
Selected Per Share Data and Ratios | | 2015 | | 2014 | | 2013 | | 2012 | | 2011 | |
Net Asset Value, Beginning of Period | | $ | 44.73 | | | $ | 44.24 | | | $ | 35.34 | | | $ | 33.65 | | | $ | 33.58 | | |
Income (Loss) from Investment Operations: | |
Net Investment Income (Loss)† | | | (0.16 | ) | | | 0.09 | | | | 0.10 | | | | 0.17 | | | | 0.03 | | |
Net Realized and Unrealized Gain (Loss) | | | (2.33 | ) | | | 3.04 | | | | 10.10 | | | | 3.35 | | | | 0.14 | | |
Total from Investment Operations | | | (2.49 | ) | | | 3.13 | | | | 10.20 | | | | 3.52 | | | | 0.17 | | |
Distributions from and/or in Excess of: | |
Net Investment Income | | | (0.09 | ) | | | — | | | | (0.12 | ) | | | — | | | | (0.10 | ) | |
Net Realized Gain | | | (6.19 | ) | | | (2.64 | ) | | | (1.18 | ) | | | (1.83 | ) | | | — | | |
Total Distributions | | | (6.28 | ) | | | (2.64 | ) | | | (1.30 | ) | | | (1.83 | ) | | | (0.10 | ) | |
Net Asset Value, End of Period | | $ | 35.96 | | | $ | 44.73 | | | $ | 44.24 | | | $ | 35.34 | | | $ | 33.65 | | |
Total Return++ | | | (6.18 | )% | | | 7.25 | % | | | 29.92 | % | | | 10.91 | % | | | 0.47 | % | |
Ratios and Supplemental Data: | |
Net Assets, End of Period (Thousands) | | $ | 2,164,565 | | | $ | 4,708,900 | | | $ | 5,174,440 | | | $ | 4,219,528 | | | $ | 3,797,139 | | |
Ratio of Expenses to Average Net Assets | | | 0.74 | %+ | | | 0.75 | %+ | | | 0.70 | %+^ | | | 0.71 | %+ | | | 0.69 | %+ | |
Ratio of Expenses to Average Net Assets Excluding
Non Operating Expenses | | | N/A | | | | N/A | | | | 0.71 | %+^ | | | N/A | | | | N/A | | |
Ratio of Net Investment Income (Loss) to Average Net Assets | | | (0.39 | )%+ | | | 0.19 | %+ | | | 0.27 | %+^ | | | 0.48 | %+ | | | 0.07 | %+ | |
Ratio of Rebate from Morgan Stanley Affiliates to Average Net Assets | | | 0.00 | %§ | | | 0.00 | %§ | | | 0.00 | %§ | | | 0.00 | %§ | | | 0.01 | % | |
Portfolio Turnover Rate | | | 27 | % | | | 45 | % | | | 52 | % | | | 26 | % | | | 35 | % | |
† Per share amount is based on average shares outstanding.
++ Calculated based on the net asset value as of the last business day of the period.
+ The Ratios of Expenses and Net Investment Income (Loss) reflect the rebate of certain Portfolio expenses in connection with the investments in Morgan Stanley affiliates during the period. The effect of the rebate on the ratios is disclosed in the above table as "Ratio of Rebate from Morgan Stanley Affiliates to Average Net Assets."
^ Effective September 16, 2013, the Adviser has agreed to limit the ratio of expenses to average net assets to the maximum ratio of 0.80% for Class I shares.
§ Amount is less than 0.005%.
The accompanying notes are an integral part of the financial statements.
13
Morgan Stanley Institutional Fund Trust
Annual Report — September 30, 2015
Financial Highlights
Mid Cap Growth Portfolio
| | | Class A | |
| | | Year Ended September 30, | |
Selected Per Share Data and Ratios | | 2015 | | 2014 | | 2013 | | 2012 | | 2011 | |
Net Asset Value, Beginning of Period | | $ | 42.70 | | | $ | 42.46 | | | $ | 34.03 | | | $ | 32.55 | | | $ | 32.51 | | |
Income (Loss) from Investment Operations: | |
Net Investment Income (Loss)† | | | (0.26 | ) | | | (0.03 | ) | | | 0.01 | | | | 0.06 | | | | (0.07 | ) | |
Net Realized and Unrealized Gain (Loss) | | | (2.19 | ) | | | 2.91 | | | | 9.70 | | | | 3.25 | | | | 0.15 | | |
Total from Investment Operations | | | (2.45 | ) | | | 2.88 | | | | 9.71 | | | | 3.31 | | | | 0.08 | | |
Distributions from and/or in Excess of: | |
Net Investment Income | | | — | | | | — | | | | (0.10 | ) | | | — | | | | (0.04 | ) | |
Net Realized Gain | | | (6.19 | ) | | | (2.64 | ) | | | (1.18 | ) | | | (1.83 | ) | | | — | | |
Total Distributions | | | (6.19 | ) | | | (2.64 | ) | | | (1.28 | ) | | | (1.83 | ) | | | (0.04 | ) | |
Net Asset Value, End of Period | | $ | 34.06 | | | $ | 42.70 | | | $ | 42.46 | | | $ | 34.03 | | | $ | 32.55 | | |
Total Return++ | | | (6.40 | )% | | | 6.95 | % | | | 29.60 | % | | | 10.62 | % | | | 0.22 | % | |
Ratios and Supplemental Data: | |
Net Assets, End of Period (Thousands) | | $ | 996,553 | | | $ | 1,859,126 | | | $ | 2,171,493 | | | $ | 1,832,003 | | | $ | 2,595,397 | | |
Ratio of Expenses to Average Net Assets | | | 1.00 | %+ | | | 1.00 | %+ | | | 0.95 | %+^ | | | 0.96 | %+ | | | 0.94 | %+ | |
Ratio of Expenses to Average Net Assets Excluding
Non Operating Expenses | | | N/A | | | | N/A | | | | 0.96 | %+^ | | | N/A | | | | N/A | | |
Ratio of Net Investment Income (Loss) to Average Net Assets | | | (0.65 | )%+ | | | (0.07 | )%+ | | | 0.02 | %+^ | | | 0.17 | %+ | | | (0.18 | )%+ | |
Ratio of Rebate from Morgan Stanley Affiliates to Average Net Assets | | | 0.00 | %§ | | | 0.00 | %§ | | | 0.00 | %§ | | | 0.00 | %§ | | | 0.01 | % | |
Portfolio Turnover Rate | | | 27 | % | | | 45 | % | | | 52 | % | | | 26 | % | | | 35 | % | |
† Per share amount is based on average shares outstanding.
++ Calculated based on the net asset value which does not reflect sales charges, if applicable, as of the last business day of the period.
+ The Ratios of Expenses and Net Investment Income (Loss) reflect the rebate of certain Portfolio expenses in connection with the investments in Morgan Stanley affiliates during the period. The effect of the rebate on the ratios is disclosed in the above table as "Ratio of Rebate from Morgan Stanley Affiliates to Average Net Assets."
^ Effective September 16, 2013, the Adviser has agreed to limit the ratio of expenses to average net assets to the maximum ratio of 1.15% for Class A shares.
§ Amount is less than 0.005%.
The accompanying notes are an integral part of the financial statements.
14
Morgan Stanley Institutional Fund Trust
Annual Report — September 30, 2015
Financial Highlights
Mid Cap Growth Portfolio
| | | Class L | |
| | | Year Ended September 30, | | Period from
June 14, 2012^ to | |
Selected Per Share Data and Ratios | | 2015 | | 2014 | | 2013 | | September 30, 2012 | |
Net Asset Value, Beginning of Period | | $ | 42.20 | | | $ | 42.20 | | | $ | 33.97 | | | $ | 32.87 | | |
Income (Loss) from Investment Operations: | |
Net Investment Income (Loss)† | | | (0.46 | ) | | | (0.26 | ) | | | (0.15 | ) | | | 0.05 | | |
Net Realized and Unrealized Gain (Loss) | | | (2.16 | ) | | | 2.90 | | | | 9.63 | | | | 1.05 | | |
Total from Investment Operations | | | (2.62 | ) | | | 2.64 | | | | 9.48 | | | | 1.10 | | |
Distributions from and/or in Excess of: | |
Net Investment Income | | | — | | | | — | | | | (0.07 | ) | | | — | | |
Net Realized Gain | | | (6.19 | ) | | | (2.64 | ) | | | (1.18 | ) | | | — | | |
Total Distributions | | | (6.19 | ) | | | (2.64 | ) | | | (1.25 | ) | | | — | | |
Net Asset Value, End of Period | | $ | 33.39 | | | $ | 42.20 | | | $ | 42.20 | | | $ | 33.97 | | |
Total Return++ | | | (6.94 | )% | | | 6.40 | % | | | 28.92 | % | | | 3.35 | %# | |
Ratios and Supplemental Data: | |
Net Assets, End of Period (Thousands) | | $ | 12,600 | | | $ | 16,817 | | | $ | 17,190 | | | $ | 10 | | |
Ratio of Expenses to Average Net Assets | | | 1.55 | %+ | | | 1.55 | %+ | | | 1.46 | %+^^ | | | 1.50 | %+* | |
Ratio of Expenses to Average Net Assets Excluding Non Operating Expenses | | | N/A | | | | N/A | | | | 1.46 | %+^^ | | | N/A | | |
Ratio of Net Investment Income (Loss) to Average Net Assets | | | (1.20 | )%+ | | | (0.60 | )%+ | | | (0.41 | )%+^^ | | | 0.46 | %+* | |
Ratio of Rebate from Morgan Stanley Affiliates to Average Net Assets | | | 0.00 | %§ | | | 0.00 | %§ | | | 0.00 | %§ | | | 0.00 | %§* | |
Portfolio Turnover Rate | | | 27 | % | | | 45 | % | | | 52 | % | | | 26 | %# | |
^ Commencement of Operations.
† Per share amount is based on average shares outstanding.
++ Calculated based on the net asset value as of the last business day of the period.
+ The Ratios of Expenses and Net Investment Income (Loss) reflect the rebate of certain Portfolio expenses in connection with the investments in Morgan Stanley affiliates during the period. The effect of the rebate on the ratios is disclosed in the above table as "Ratio of Rebate from Morgan Stanley Affiliates to Average Net Assets."
^^ Effective September 16, 2013, the Adviser has agreed to limit the ratio of expenses to average net assets to the maximum ratio of 1.65% for Class L shares.
§ Amount is less than 0.005%.
# Not Annualized.
* Annualized.
The accompanying notes are an integral part of the financial statements.
15
Morgan Stanley Institutional Fund Trust
Annual Report — September 30, 2015
Financial Highlights
Mid Cap Growth Portfolio
| | | Class IS | |
| | | Year Ended September 30, | | Period from
September 13, 2013^ to | |
Selected Per Share Data and Ratios | | 2015 | | 2014 | | September 30, 2013 | |
Net Asset Value, Beginning of Period | | $ | 44.80 | | | $ | 44.25 | | | $ | 43.74 | | |
Income (Loss) from Investment Operations: | |
Net Investment Income (Loss)† | | | (0.10 | ) | | | 0.18 | | | | (0.00 | )‡ | |
Net Realized and Unrealized Gain (Loss) | | | (2.33 | ) | | | 3.01 | | | | 0.51 | | |
Total from Investment Operations | | | (2.43 | ) | | | 3.19 | | | | 0.51 | | |
Distributions from and/or in Excess of: | |
Net Investment Income | | | (0.15 | ) | | | — | | | | — | | |
Net Realized Gain | | | (6.19 | ) | | | (2.64 | ) | | | — | | |
Total Distributions | | | (6.34 | ) | | | (2.64 | ) | | | — | | |
Net Asset Value, End of Period | | $ | 36.03 | | | $ | 44.80 | | | $ | 44.25 | | |
Total Return++ | | | (6.02 | )% | | | 7.39 | % | | | 1.17 | %# | |
Ratios and Supplemental Data: | |
Net Assets, End of Period, in (Thousands) | | $ | 1,087,612 | | | $ | 662,560 | | | $ | 10 | | |
Ratio of Expenses to Average Net Assets | | | 0.61 | %+ | | | 0.61 | %+ | | | 0.49 | %+^^* | |
Ratio of Expenses to Average Net Assets Excluding Non Operating Expenses | | | N/A | | | | N/A | | | | 0.58 | %+^^* | |
Ratio of Net Investment Income (Loss) to Average Net Assets | | | (0.25 | )%+ | | | 0.41 | %+ | | | (0.22 | )%+^^* | |
Ratio of Rebate from Morgan Stanley Affiliates to Average Net Assets | | | 0.00 | %§ | | | 0.00 | %§ | | | 0.01 | %* | |
Portfolio Turnover Rate | | | 27 | % | | | 45 | % | | | 52 | %# | |
^ Commencement of Operations.
† Per share amount is based on average shares outstanding.
‡ Amount is less than $0.005 per share.
++ Calculated based on the net asset value as of the last business day of the period.
+ The Ratios of Expenses and Net Investment Income (Loss) reflect the rebate of certain Portfolio expenses in connection with the investments in Morgan Stanley affiliates during the period. The effect of the rebate on the ratios is disclosed in the above table as "Ratio of Rebate from Morgan Stanley Affiliates to Average Net Assets."
^^ Effective September 16, 2013, the Adviser has agreed to limit the ratio of expenses to average net assets to the maximum ratio of 0.73% for Class IS shares.
§ Amount is less than 0.005%.
# Not Annualized.
* Annualized.
The accompanying notes are an integral part of the financial statements.
16
Morgan Stanley Institutional Fund Trust
Annual Report — September 30, 2015
Notes to Financial Statements
Morgan Stanley Institutional Fund Trust ("MSIFT'' or the "Fund'') is registered under the Investment Company Act of 1940, as amended (the "Act''), as an open-end management investment company. The Fund is comprised of nine separate, active portfolios (individually referred to as a "Portfolio", collectively as the "Portfolios"). The Fund applies investment company accounting and reporting guidance. All Portfolios are considered diversified for purposes of the Act.
The accompanying financial statements relate to the Mid Cap Growth Portfolio. The Portfolio seeks long-term capital growth. The Portfolio offers four classes of shares — Class I, Class A, Class L and Class IS.
A. Significant Accounting Policies: The following significant accounting policies are in conformity with U.S. generally accepted accounting principles ("GAAP"). Such policies are consistently followed by the Fund in the preparation of its financial statements. GAAP may require management to make estimates and assumptions that affect the reported amounts and disclosures in the financial statements. Actual results may differ from those estimates.
1. Security Valuation: (1) An equity portfolio security listed or traded on an exchange is valued at its latest reported sales price (or at the exchange official closing price if such exchange reports an official closing price), if there were no sales on a given day, the security is valued at the mean between the last reported bid and asked prices; (2) all other equity portfolio securities for which over-the-counter ("OTC") market quotations are readily available are valued at its latest reported sales price. In cases where a security is traded on more than one exchange, the security is valued on the exchange designated as the primary market; (3) listed options are valued at the last reported sales price on the exchange on which they are listed (or at the exchange official closing price if such exchange reports an official closing price). If an official closing price or last reported sales price is unavailable, the listed option should be fair valued at the mean between their latest bid and asked price. Unlisted options are valued by an outside pricing service approved by the Fund's Board of Trustees (the "Trustees") or quotes from a broker or dealer; (4) when market quotations are not readily available, including circumstances under which Morgan Stanley Investment Management Inc. (the "Adviser") determines that the closing price, last sale price or the mean between the last reported bid and asked prices are not reflective of a
security's market value, portfolio securities are valued at their fair value as determined in good faith under procedures established by and under the general supervision of the Trustees. Occasionally, developments affecting the closing prices of securities and other assets may occur between the times at which valuations of such securities are determined (that is, close of the foreign market on which the securities trade) and the close of business of the New York Stock Exchange ("NYSE"). If developments occur during such periods that are expected to materially affect the value of such securities, such valuations may be adjusted to reflect the estimated fair value of such securities as of the close of the NYSE, as determined in good faith by the Trustees or by the Adviser using a pricing service and/or procedures approved by the Trustees; (5) quotations of foreign portfolio securities, other assets and liabilities and forward contracts stated in foreign currency are translated into U.S. dollar equivalents at the prevailing market rates prior to the close of the NYSE; (6) investments in mutual funds, including the Morgan Stanley Institutional Liquidity Funds, are valued at the net asset value ("NAV") as of the close of each business day; and (7) short-term debt securities with remaining maturities of 60 days or less at the time of purchase may be valued at amortized cost, unless the Adviser determines such valuation does not reflect the securities' market value, in which case these securities will be valued at their fair market value determined by the Adviser.
The Trustees have responsibility for determining in good faith the fair value of the investments, and the Trustees may appoint others, such as the Fund's Adviser or a valuation committee, to assist the Trustees in determining fair value and to make the actual calculations pursuant to the fair valuation methodologies previously approved by the Trustees. Under procedures approved by the Trustees, the Fund's Adviser has formed a Valuation Committee whose members are approved by the Trustees. The Valuation Committee provides administration and oversight of the Fund's valuation policies and procedures, which are reviewed at least annually by the Trustees. These procedures allow the Fund to utilize independent pricing services, quotations from securities and financial instrument dealers, and other market sources to determine fair value.
The Fund has procedures to determine the fair value of securities and other financial instruments for which
17
Morgan Stanley Institutional Fund Trust
Annual Report — September 30, 2015
Notes to Financial Statements (cont'd)
market prices are not readily available. Under these procedures, the Valuation Committee convenes on a regular and ad hoc basis to review such securities and considers a number of factors, including valuation methodologies and significant unobservable valuation inputs, when arriving at fair value. The Valuation Committee may employ a market-based approach which may use related or comparable assets or liabilities, recent transactions, market multiples, book values, and other relevant information for the investment to determine the fair value of the investment. An income-based valuation approach may also be used in which the anticipated future cash flows of the investment are discounted to calculate fair value. Discounts may also be applied due to the nature or duration of any restrictions on the disposition of the investments. Due to the inherent uncertainty of valuations of such investments, the fair values may differ significantly from the values that would have been used had an active market existed. The Valuation Committee employs various methods for calibrating these valuation approaches including a regular review of valuation methodologies, key inputs and assumptions, transactional back-testing or disposition analysis, and reviews of any related market activity.
2. Fair Value Measurement: Financial Accounting Standards Board ("FASB") Accounting Standards CodificationTM ("ASC") 820, "Fair Value Measurement" ("ASC 820"), defines fair value as the value that the Fund would receive to sell an investment or pay to transfer a liability in a timely transaction with an independent buyer in the principal market, or in the absence of a principal market the most advantageous market for the investment or liability. ASC 820 establishes a three-tier hierarchy to distinguish between (1) inputs that reflect the assumptions market participants would use in valuing an asset or liability developed based on market data obtained from sources independent of the reporting entity (observable inputs) and (2) inputs that reflect the reporting entity's own assumptions about the assumptions market participants would use in valuing an asset or liability developed based on the best information available in the circumstances (unobservable inputs) and to establish classification of fair value measurements for disclosure purposes. Various inputs are used in determining the value of the Fund's investments. The inputs are summarized in the three broad levels listed below.
• Level 1 – unadjusted quoted prices in active markets for identical investments
• Level 2 – other significant observable inputs (including quoted prices for similar investments, interest rates, prepayment speeds, credit risk, etc.)
• Level 3 – significant unobservable inputs including the Fund's own assumptions in determining the fair value of investments. Factors considered in making this determination may include, but are not limited to, information obtained by contacting the issuer, analysts, or the appropriate stock exchange (for exchange-traded securities), analysis of the issuer's financial statements or other available documents and, if necessary, available information concerning other securities in similar circumstances
The inputs or methodology used for valuing securities are not necessarily an indication of the risk associated with investing in those securities and the determination of the significance of a particular input to the fair value measurement in its entirety requires judgment and considers factors specific to each security.
The following is a summary of the inputs used to value the Portfolio's investments as of September 30, 2015.
Investment Type | | Level 1
Unadjusted
quoted
prices
(000) | | Level 2
Other
significant
observable
inputs
(000) | | Level 3
Significant
unobservable
inputs
(000) | | Total
(000) | |
Assets: | |
Common Stocks | |
Aerospace &
Defense | | $ | 46,518 | | | $ | — | | | $ | — | | | $ | 46,518 | | |
Air Freight &
Logistics | | | 19,289 | | | | — | | | | — | | | | 19,289 | | |
Automobiles | | | 210,583 | | | | — | | | | — | | | | 210,583 | | |
Beverages | | | 130,509 | | | | — | | | | — | | | | 130,509 | | |
Biotechnology | | | 47,759 | | | | — | | | | — | | | | 47,759 | | |
Communications
Equipment | | | 44,791 | | | | — | | | | — | | | | 44,791 | | |
Consumer Finance | | | 101,673 | | | | — | | | | — | | | | 101,673 | | |
Diversified Financial
Services | | | 254,264 | | | | — | | | | — | | | | 254,264 | | |
Electrical Equipment | | | 18,307 | | | | — | | | | — | | | | 18,307 | | |
Food Products | | | 163,619 | | | | — | | | | — | | | | 163,619 | | |
Health Care
Equipment &
Supplies | | | 210,482 | | | | — | | | | — | | | | 210,482 | | |
18
Morgan Stanley Institutional Fund Trust
Annual Report — September 30, 2015
Notes to Financial Statements (cont'd)
Investment Type | | Level 1
Unadjusted
quoted
prices
(000) | | Level 2
Other
significant
observable
inputs
(000) | | Level 3
Significant
unobservable
inputs
(000) | | Total
(000) | |
Common Stocks (cont'd) | |
Health Care
Technology | | $ | 144,507 | | | $ | — | | | $ | — | | | $ | 144,507 | | |
Hotels,
Restaurants &
Leisure | | | 136,243 | | | | — | | | | — | | | | 136,243 | | |
Information
Technology
Services | | | 193,429 | | | | — | | | | — | | | | 193,429 | | |
Internet & Catalog
Retail | | | 79,776 | | | | 32,305 | | | | — | | | | 112,081 | | |
Internet Software &
Services | | | 668,777 | | | | — | | | | 98,262 | | | | 767,039 | | |
Life Sciences Tools &
Services | | | 199,559 | | | | — | | | | — | | | | 199,559 | | |
Media | | | — | | | | — | | | | 66,960 | | | | 66,960 | | |
Pharmaceuticals | | | 244,140 | | | | — | | | | — | | | | 244,140 | | |
Professional Services | | | 211,989 | | | | — | | | | — | | | | 211,989 | | |
Software | | | 482,901 | | | | — | | | | — | | | | 482,901 | | |
Specialty Retail | | | 43,810 | | | | — | | | | — | | | | 43,810 | | |
Tech Hardware,
Storage &
Peripherals | | | 13,185 | | | | — | | | | — | | | | 13,185 | | |
Textiles, Apparel &
Luxury
Goods | | | 145,717 | | | | — | | | | — | | | | 145,717 | | |
Total Common
Stocks | | | 3,811,827 | | | | 32,305 | | | | 165,222 | | | | 4,009,354 | | |
Convertible
Preferred Stocks | | | — | | | | — | | | | 7,132 | | | | 7,132 | | |
Preferred Stocks | | | — | | | | — | | | | 252,754 | | | | 252,754 | | |
Call Options
Purchased | | | — | | | | 13,064 | | | | — | | | | 13,064 | | |
Short-Term
Investments | |
Investment
Company | | | 210,142 | | | | — | | | | — | | | | 210,142 | | |
Repurchase
Agreements | | | — | | | | 29,247 | | | | — | | | | 29,247 | | |
Total Short-Term
Investments | | | 210,142 | | | | 29,247 | | | | — | | | | 239,389 | | |
Total Assets | | $ | 4,021,969 | | | $ | 74,616 | | | $ | 425,108 | | | $ | 4,521,693 | | |
Transfers between investment levels may occur as the markets fluctuate and/or the availability of data used in an investment's valuation changes. The Portfolio recognizes transfers between the levels as of the end of the period. As of September 30, 2015, securities with a total value of approximately $32,305,000 transferred from Level 1 to Level 2. At September 30, 2015, the fair value of certain securities were adjusted due to developments which occurred between the time of the close of the foreign markets on which they trade and the close of business on the NYSE which resulted in their Level 2 classification.
Following is a reconciliation of investments in which significant unobservable inputs (Level 3) were used in determining fair value.
| | | Common
Stocks
(000) | | Convertible
Preferred
Stocks
(000) | | Preferred
Stocks
(000) | |
Beginning Balance | | $ | 132,566 | | | $ | 8,195 | | | $ | 123,480 | | |
Purchases | | | 28,952 | | | | — | | | | — | | |
Sales | | | — | | | | — | | | | — | | |
Amortization of discount | | | — | | | | — | | | | — | | |
Transfers in | | | — | | | | — | | | | — | | |
Transfers out | | | — | | | | — | | | | — | | |
Corporate actions | | | — | | | | — | | | | — | | |
Change in unrealized appreciation
(depreciation) | | | 3,704 | | | | (1,063 | ) | | | 129,274 | | |
Realized gains (losses) | | | — | | | | — | | | | — | | |
Ending Balance | | $ | 165,222 | | | $ | 7,132 | | | $ | 252,754 | | |
Net change in unrealized appreciation
(depreciation) from investments still
held as of September 30, 2015 | | $ | 3,704 | | | $ | (1,063 | ) | | $ | 129,274 | | |
The following table presents additional information about valuation techniques and inputs used for investments that are measured at fair value and categorized within Level 3 as of September 30, 2015. Various valuation techniques were used in the valuation of certain investments and weighted based on the level of significance.
| | | Fair Value at
September 30, 2015
(000) | | Valuation
Technique | | Unobservable
Input | | Range | | Weighted
Average/
Selected
Value | | Impact to
Valuation from an
Increase in Input | |
Internet & Catalog Retail | |
Convertible
Preferred Stock | | $ | 246 | | |
Market Transaction
Method | | Escrow Cash
Receivable from
Liquidation | | $ | 0.43 | | | $ | 0.43 | | | $ | 0.43 | | |
Increase | |
Preferred Stocks | | $ | 109,296 | | | Market Transaction
Method | | Issuance Price of
Financing | | $ | 93.09 | | | $ | 93.09 | | | $ | 93.09 | | | Increase | |
19
Morgan Stanley Institutional Fund Trust
Annual Report — September 30, 2015
Notes to Financial Statements (cont'd)
| | | Fair Value at
September 30, 2015
(000) | | Valuation
Technique | | Unobservable
Input | | Range | | Weighted
Average/
Selected
Value | | Impact to
Valuation from an
Increase in Input | |
Internet & Catalog Retail (cont'd) | |
| | | $ | 76,987 | | | Market Transaction
Method | | Precedent
Transaction | | $ | 142.24 | | | $ | 142.24 | | | $ | 142.24 | | | Increase | |
| | | | | Discounted Cash
Flow | | Weighted Average
Cost of Capital | | | 16.0 | % | | | 18.0 | % | | | 17.0 | % | | Decrease | |
| | | | | | | Perpetual Growth Rate | | | 3.5 | % | | | 4.5 | % | | | 4.0 | % | | Increase | |
| | | | | Market Comparable
Companies | | Enterprise
Value/Revenue | | | 3.6 | x | | | 6.0 | x | | | 4.8 | x | | Increase | |
| | | | | | | Discount for Lack of
Marketability | | | 15.0 | % | | | 15.0 | % | | | 15.0 | % | | Decrease | |
Internet Software & Services | |
Common Stocks | | $ | 69,398 | | | Market Transaction
Method | | Third Party Tender
Offer/Series C Preferred | | $ | 19.10 | | | $ | 19.10 | | | $ | 19.10 | | | Increase | |
| | $ | 28,864 | | | Market Transaction
Method | | Precedent
Transaction | | $ | 16.45 | | | $ | 16.45 | | | $ | 16.45 | | | Increase | |
| | | | Discounted Cash
Flow | | Weighted Average
Cost of Capital | | | 16.0 | % | | | 18.0 | % | | | 17.0 | % | | Decrease | |
| | | | | | Perpetual Growth
Rate | | | 3.0 | % | | | 4.0 | % | | | 3.5 | % | | Increase | |
| | | | Market Comparable
Companies | | Enterprise
Value/Revenue | | | 4.4 | x | | | 11.6 | x | | | 11.6 | x | | Increase | |
| | | | | | Discount for Lack of
Marketability | | | 15.0 | % | | | 15.0 | % | | | 15.0 | % | | Decrease | |
Convertible Preferred
Stock | | | $6,886 | | | Discounted Cash
Flow | | Weighted Average
Cost of Capital | | | 16.0% | | | | 18.0 | % | | | 17.0% | | | Decrease | |
| | | | | | | Perpetual Growth Rate | | | 2.5 | % | | | 3.5 | % | | | 3.0 | % | | Increase | |
| | | | | Market Comparable
Companies | | Enterprise
Value/Revenue | | | 7.9 | x | | | 18.2 | x | | | 12.8 | x | | Increase | |
| | | | | | | Discount for Lack of
Marketability | | | 15.0 | % | | | 15.0 | % | | | 15.0 | % | | Decrease | |
Media | |
Common Stock | | $ | 66,960 | | | Market Transaction
Method | | Precedent
Transaction | | $ | 2,119.29 | | | $ | 2,119.29 | | | $ | 2,119.29 | | | Increase | |
| | | | | Discounted Cash
Flow | | Weighted Average
Cost of Capital | | | 15.0 | % | | | 17.0 | % | | | 16.0 | % | | Decrease | |
| | | | | | | Perpetual Growth Rate | | | 3.0 | % | | | 5.0 | % | | | 4.0 | % | | Increase | |
| | | | | Market Comparable
Companies | | Enterprise
Value/Revenue | | | 3.5 | x | | | 7.2 | x | | | 5.9 | x | | Increase | |
| | | | | | | Discount for Lack of
Marketability | | | 15.0 | % | | | 15.0 | % | | | 15.0 | % | | Decrease | |
Software | |
Preferred Stocks | | $ | 66,471 | | | Market Transaction
Method | | Issuance Price of
Financing | | $ | 11.38 | | | $ | 11.38 | | | $ | 11.38 | | | Increase | |
20
Morgan Stanley Institutional Fund Trust
Annual Report — September 30, 2015
Notes to Financial Statements (cont'd)
3. Repurchase Agreements: The Portfolio may enter into repurchase agreements under which the Portfolio lends cash and takes possession of securities with an agreement that the counterparty will repurchase such securities. In connection with transactions in repurchase agreements, a bank as custodian for the Portfolio takes possession of the underlying securities which are held as collateral, with a market value at least equal to the amount of the repurchase transaction, including principal and accrued interest. To the extent that any repurchase transaction exceeds one business day, the value of the collateral is marked-to-market on a daily basis to determine that the value of the collateral does not decrease below the repurchase price plus accrued interest as earned. If such a decrease occurs, additional collateral will be requested and, when received, will be added to the account to maintain full collateralization. In the event of default on the obligation to repurchase, the Portfolio has the right to liquidate the collateral and apply the proceeds in satisfaction of the obligation. In the event of default or bankruptcy by the counterparty to the agreement, realization of the collateral proceeds may be subject to cost and delays. The Portfolio, along with other affiliated investment companies, may utilize a joint trading account for the purpose of entering into repurchase agreements.
4. Foreign Currency Translation and Foreign Investments: The books and records of the Portfolio are maintained in U.S. dollars. Foreign currency amounts are translated into U.S. dollars as follows:
– investments, other assets and liabilities at the prevailing rate of exchange on the valuation date;
– investment transactions and investment income at the prevailing rates of exchange on the dates of such transactions.
Although the net assets of the Portfolio are presented at the foreign exchange rates and market values at the close of the period, the Portfolio does not isolate that portion of the results of operations arising as a result of changes in the foreign exchange rates from the fluctuations arising from changes in the market prices of securities held at period end. Similarly, the Portfolio does not isolate the effect of changes in foreign exchange rates from the fluctuations arising from changes in the market prices of securities sold during the period. Accordingly, realized and unrealized foreign currency gains (losses) on investments in securities are included in the reported net
realized and unrealized gains (losses) on investment transactions and balances. However, pursuant to U.S. Federal income tax regulations, gains and losses from certain foreign currency transactions and the foreign currency portion of gains and losses realized on sales and maturities of foreign denominated debt securities are treated as ordinary income for U.S. Federal income tax purposes.
Net realized gains (losses) on foreign currency transactions represent net foreign exchange gains (losses) from foreign currency forward exchange contracts, disposition of foreign currencies, currency gains (losses) realized between the trade and settlement dates on securities transactions, and the difference between the amount of investment income and foreign withholding taxes recorded on the Portfolio's books and the U.S. dollar equivalent amounts actually received or paid. Net unrealized currency gains (losses) from valuing foreign currency denominated assets and liabilities at period end exchange rates are reflected as a component of unrealized appreciation (depreciation) in the Statement of Assets and Liabilities. The change in unrealized currency gains (losses) on foreign currency translations on foreign currency translations for the period is reflected in the Statement of Operations.
Foreign security and currency transactions may involve certain considerations and risks not typically associated with those of U.S. dollar denominated transactions as a result of, among other factors, fluctuations of exchange rates in relation to the U.S. dollar, the possibility of lower levels of governmental supervision and regulation of foreign securities markets and the possibility of political or economic instability.
Governmental approval for foreign investments may be required in advance of making an investment under certain circumstances in some countries, and the extent of foreign investments in domestic companies may be subject to limitation in other countries. Foreign ownership limitations also may be imposed by the charters of individual companies to prevent, among other concerns, violations of foreign investment limitations. As a result, an additional class of shares (identified as "Foreign" in the Portfolio of Investments) may be created and offered for investment. The "local" and "foreign shares" market values may differ. In the absence of trading of the foreign shares in such markets, the Portfolio values the foreign shares at the closing exchange price of the local shares.
21
Morgan Stanley Institutional Fund Trust
Annual Report — September 30, 2015
Notes to Financial Statements (cont'd)
5. Derivatives: The Portfolio may, but is not required to, use derivative instruments for a variety of purposes, including hedging, risk management, portfolio management or to earn income. Derivatives are financial instruments whose value is based, in part, on the value of an underlying asset, interest rate, index or financial instrument. Prevailing interest rates and volatility levels, among other things, also affect the value of derivative instruments. A derivative instrument often has risks similar to its underlying asset and may have additional risks, including imperfect correlation between the value of the derivative and the underlying asset, risks of default by the counterparty to certain transactions, magnification of losses incurred due to changes in the market value of the securities, instruments, indices or interest rates to which the derivative instrument relates, risks that the transactions may not be liquid and risks arising from margin requirements. The use of derivatives involves risks that are different from, and possibly greater than, the risks associated with other portfolio investments. Derivatives may involve the use of highly specialized instruments that require investment techniques and risk analyses different from those associated with other portfolio investments. All of the Portfolio's holdings, including derivative instruments, are marked-to-market each day with the change in value reflected in unrealized appreciation (depreciation). Upon disposition, a realized gain or loss is recognized.
Certain derivative transactions may give rise to a form of leverage. Leverage magnifies the potential for gain and the risk of loss. Leverage associated with derivative transactions may cause the Portfolio to liquidate portfolio positions when it may not be advantageous to do so to satisfy its obligations or to meet earmarking or segregation requirements, pursuant to applicable Securities and Exchange Commission rules and regulations, or may cause the Portfolio to be more volatile than if the Portfolio had not been leveraged. Although the Adviser seeks to use derivatives to further the Portfolio's investment objectives, there is no assurance that the use of derivatives will achieve this result.
Following is a description of the derivative instruments and techniques that the Portfolio used during the period and their associated risks:
Options: With respect to options, the Portfolio is subject to equity risk, interest rate risk and foreign currency
exchange risk in the normal course of pursuing its investment objectives. If the Portfolio buys an option, it buys a legal contract giving it the right to buy or sell a specific amount of the underlying instrument or futures contract on the underlying instrument, at an agreed-upon price typically in exchange for a premium paid by the Portfolio. The Portfolio may purchase and/or sell put and call options. Purchasing call options tends to increase the Portfolio's exposure to the underlying (or similar) instrument. Purchasing put options tends to decrease the Portfolio's exposure to the underlying (or similar) instrument. When entering into purchased option contracts, the Portfolio bears the risk of interest or exchange rates or securities prices moving unexpectedly, in which case, the Portfolio may not achieve the anticipated benefits of the purchased option contracts; however the risk of loss is limited to the premium paid. Purchased options are reported as part of "Total Investments in Securities" in the Statement of Assets and Liabilities. Premium paid for purchasing options which expired are treated as realized losses. If the Portfolio sells an option, it sells to another party the right to buy from or sell to the Portfolio a specific amount of the underlying instrument or futures contract on the underlying instrument at an agreed-upon price typically in exchange for a premium received by the Portfolio. When options are purchased OTC, the Portfolio bears the risk that the counterparty that wrote the option will be unable or unwilling to perform its obligations under the option contract. Options may also be illiquid and the Portfolio may have difficulty closing out its position. A decision as to whether, when and how to use options involves the exercise of skill and judgment and even a well-conceived option transaction may be unsuccessful because of market behavior or unexpected events. The prices of options can be highly volatile and the use of options can lower total returns.
FASB ASC 815, "Derivatives and Hedging" ("ASC 815"), is intended to improve financial reporting about derivative instruments by requiring enhanced disclosures to enable investors to better understand how and why the Portfolio uses derivative instruments, how these derivative instruments are accounted for and their effects on the Portfolio's financial position and results of operations.
22
Morgan Stanley Institutional Fund Trust
Annual Report — September 30, 2015
Notes to Financial Statements (cont'd)
The following table sets forth the fair value of the Portfolio's derivative contracts by primary risk exposure as of September 30, 2015.
| | | Asset Derivatives
Statement of Assets and
Liabilities Location | | Primary Risk
Exposure | | Value
(000) | |
Call Options Purchased
| | Investments, at Value
(Call Options Purchased) | |
Currency Risk | | $ | 13,064 | (a) | |
(a) Amounts are included in Investments in Securities in the Statement of Assets and Liabilities.
The following table sets forth by primary risk exposure the Portfolio's change in unrealized appreciation (depreciation) by type of derivative contract for the year ended September 30, 2015 in accordance with ASC 815.
Realized Gain (Loss) | |
Primary Risk Exposure | | Derivative Type | | Value
(000) | |
Currency Risk
| | Investments
(Call Options Purchased) | | $ | (11,193 | )(b) | |
(b) Amounts are included in Investments in the Statement of Operations.
Change in Unrealized Appreciation (Depreciation) | |
Primary Risk Exposure | | Derivative Type | | Value
(000) | |
Currency Risk
| | Investments
(Call Options Purchased) | | $ | 15,916 | (c) | |
(c) Amounts are included in Investments in the Statement of Operations.
At September 30, 2015, the Portfolio's derivative assets and liabilities are as follows:
Gross Amounts of Assets and Liabilities Presented in the
Statement of Assets and Liabilities | |
Derivatives | | Assets(d)
(000) | | Liabilities(d)
(000) | |
Call Options Purchased | | $ | 13,064 | (a) | | $ | — | | |
(a) Amounts are included in Investments in Securities in the Statement of Assets and Liabilities.
(d) Absent an event of default or early termination, OTC derivative assets and liabilities are presented gross and not offset in the Statement of Assets and Liabilities.
The Portfolio typically enters into International Swaps and Derivatives Association, Inc. Master Agreements ("ISDA Master Agreements") or similar master agreements (collectively, "Master Agreements") with its contract counterparties for certain OTC derivatives in order to, among other things, reduce its credit risk to counterparties. ISDA Master Agreements include provisions for general obligations, representations, collateral and events of default or termination. Under an ISDA Master Agreement, the Portfolio typically may offset with the counterparty certain OTC derivative financial instruments' payables and/or receivables with collateral held and/or posted and create one
single net payment (close-out netting) in the event of default, termination and/or potential deterioration in the credit quality of the counterparty. Various Master Agreements govern the terms of certain transactions with counterparties, including transactions such as swap, forward, repurchase and reverse repurchase agreements. These Master Agreements typically attempt to reduce the counterparty risk associated with such transactions by specifying credit protection mechanisms and providing standardization that improves legal certainty. Cross-termination provisions under Master Agreements typically provide that a default in connection with one transaction between the Portfolio and a counterparty gives the non-defaulting party the right to terminate any other transactions in place with the defaulting party to create one single net payment due to/due from the defaulting party and may be a feature in certain Master Agreements. In the event the Portfolio exercises its right to terminate a Master Agreement after a counterparty experiences a termination event as defined in the Master Agreement, the return of collateral with market value in excess of the Portfolio's net liability may be delayed or denied.
The following table presents derivative financial instruments that are subject to enforceable netting arrangements as of September 30, 2015.
Gross Amounts Not Offset in the Statement of Assets and Liabilities | |
Counterparty | | Gross Liability
Derivatives
Presented in
Statement of
Assets and
Liabilities
(000) | | Financial
Instrument
(000) | | Collateral
Received(e)
(000) | | Net Amount
(not less
than $0)
(000) | |
Royal Bank of Scotland | | $ | 13,064 | | | $ | — | | | $ | (13,064 | ) | | $ | 0 | | |
(e) In some instances, the actual collateral received may be more than the amount shown here due to overcollateralization.
For the year ended September 30, 2015, the approximate average monthly amount outstanding for each derivative type is as follows:
Call Options Purchased: | |
| Average monthly notional amount | | | 2,616,055,000 | | |
6. Securities Lending: The Portfolio lends securities to qualified financial institutions, such as broker-dealers, to earn additional income. Any increase or decrease in the fair value of the securities loaned that might occur and any interest earned or dividends declared on those securities during the term of the loan would remain in the Portfolio. The Portfolio would receive cash or securities as collateral
23
Morgan Stanley Institutional Fund Trust
Annual Report — September 30, 2015
Notes to Financial Statements (cont'd)
in an amount equal to or exceeding 100% of the current fair value of the loaned securities. The collateral is marked-to-market daily by State Street Bank and Trust Company ("State Street"), the securities lending agent, to ensure that a minimum of 100% collateral coverage is maintained.
Based on pre-established guidelines, the securities lending agent invests any cash collateral that is received in an affiliated money market portfolio and repurchase agreements. Securities lending income is generated from the earnings on the invested collateral and borrowing fees, less any rebates owed to the borrowers and compensation to the lending agent, and is recorded as "Income from Securities Loaned — Net" in the Portfolio's Statement of Operations. Risks in securities lending transactions are that a borrower may not provide additional collateral when required or return the securities when due, and that the value of the short-term investments will be less than the amount of cash collateral plus any rebate that is required to be returned to the borrower.
The Portfolio has the right under the lending agreement to recover the securities from the borrower on demand.
The following table presents securities on loan that are subject to enforceable netting arrangements as of September 30, 2015.
Gross Amounts Not Offset in the Statement of Assets and Liabilities | |
Gross Asset
Amounts
Presented in
Statement of
Assets and
Liabilities
(000) | | Financial
Instrument
(000) | | Collateral
Received
(000) | | Net Amount
(not less
than $0)
(000) | |
| $ | 173,144 | (f) | | $ | — | | | $ | (173,144 | )(g)(h) | | $ | 0 | | |
(f) Represents market value of loaned securities at period end.
(g) The Portfolio received cash collateral of approximately $177,258,000, which was subsequently invested in Repurchase Agreements and Morgan Stanley Institutional Liquidity Funds as reported in the Portfolio of Investments. In addition, the Portfolio received non-cash collateral of approximately $229,000 in the form of U.S. Government obligations, which the Portfolio cannot sell or repledge, and accordingly are not reflected in the Portfolio of Investments.
(h) The actual collateral received is greater than the amount shown here due to overcollateralization.
7. Restricted Securities: The Portfolio invests in unregistered or otherwise restricted securities. The term "restricted securities" refers to securities that are unregistered or are held by control persons of the issuer and securities that are subject to contractual restrictions on their resale. As a result, restricted securities may be more difficult to value and the Portfolio may have difficulty disposing of such
assets either in a timely manner or for a reasonable price. In order to dispose of an unregistered security, the Portfolio, where it has contractual rights to do so, may have to cause such security to be registered. A considerable period may elapse between the time the decision is made to sell the security and the time the security is registered so that the Portfolio could sell it. Contractual restrictions on the resale of securities vary in length and scope and are generally the result of a negotiation between the issuer and acquirer of the securities. The Portfolio would, in either case, bear market risks during that period. Restricted securities are identified in the Portfolio of Investments.
8. Indemnifications: The Fund enters into contracts that contain a variety of indemnifications. The Fund's maximum exposure under these arrangements is unknown. However, the Fund has not had prior claims or losses pursuant to these contracts and expects the risk of loss to be remote.
9. Dividends and Distributions to Shareholders: Dividend income and distributions to shareholders are recorded on the ex-dividend date. Dividends from net investment income, if any, are declared and paid annually. Net realized capital gains, if any, are distributed at least annually.
10. Security Transactions, Income and Expenses: Security transactions are accounted for on the trade date (date the order to buy or sell is executed). Realized gains and losses on the sale of investment securities are determined on the specific identified cost method. Dividend income and other distributions are recorded on the ex-dividend date (except for certain foreign dividends which may be recorded as soon as the Portfolio is informed of such dividends) net of applicable withholding taxes. Interest income is recognized on the accrual basis except where collection is in doubt. Discounts are accreted and premiums are amortized over the life of the respective securities. Most expenses of the Fund can be directly attributed to a particular Portfolio. Expenses which cannot be directly attributed are apportioned among the Portfolios based upon relative net assets or other appropriate methods. Income, expenses (other than class specific expenses — distribution and shareholder services, transfer agency and sub transfer agency fees) and realized and unrealized gains or losses are allocated to each class of shares based upon their relative net assets.
24
Morgan Stanley Institutional Fund Trust
Annual Report — September 30, 2015
Notes to Financial Statements (cont'd)
B. Advisory Fees: The Adviser, a wholly-owned subsidiary of Morgan Stanley, provides the Portfolio with advisory services under the terms of an Investment Advisory Agreement, paid quarterly, at an annual rate of 0.50% of the average daily net assets of the Portfolio.
The Adviser has agreed to reduce its advisory fee and/or reimburse the Portfolio so that total annual portfolio operating expenses, excluding certain investment related expenses, taxes, interest and other extraordinary expenses (including litigation), will not exceed 0.80% for Class I shares, 1.15% for Class A shares, 1.65% for Class L shares and 0.73% for Class IS shares. The fee waivers and/or expense reimbursements will continue for at least one year from the date of the Portfolio's prospectus or until such time that the Trustees act to discontinue all or a portion of such waivers and/or reimbursements when they deem such action is appropriate. This arrangement had no effect during the most recent reporting period.
C. Administration Fees: The Adviser also serves as Administrator to the Fund and provides administrative services pursuant to an Administration Agreement for an annual fee, accrued daily and paid monthly, of 0.08% of the Portfolio's average daily net assets. Under a Sub-Administration Agreement between the Administrator and State Street, State Street provides certain administrative services to the Fund. For such services, the Administrator pays State Street a portion of the fee the Administrator receives from the Portfolio.
D. Distribution and Shareholder Services Fees: Morgan Stanley Distribution, Inc. ("MSDI" or the "Distributor"), a wholly-owned subsidiary of the Adviser, and an indirect subsidiary of Morgan Stanley, serves as the Fund's Distributor of Portfolio shares pursuant to a Distribution Agreement. The Fund has adopted a Shareholder Services Plan with respect to Class A shares pursuant to Rule 12b-1 under the Act. Under the Shareholder Services Plan, the Portfolio pays the Distributor a shareholder services fee, accrued daily and paid monthly, at an annual rate of 0.25% of the Portfolio's average daily net assets attributable to Class A shares.
The Fund has adopted a Distribution and Shareholder Services Plan with respect to Class L shares pursuant to Rule 12b-1 under the Act. Under the Distribution and Shareholder Services Plan, the Portfolio pays the Distributor a distribution fee, accrued daily and paid monthly, at an annual rate of 0.50% and a shareholder services fee, accrued daily and paid monthly, at an annual rate of 0.25% of the Portfolio's average daily net assets attributable to Class L shares.
The distribution and shareholder services fees are used to support the expenses associated with servicing and maintaining accounts. The Distributor may compensate other parties for providing shareholder support services to investors who purchase Class A and Class L shares.
E. Dividend Disbursing and Transfer Agent: The Fund's dividend disbursing and transfer agent is Boston Financial Data Services, Inc. ("BFDS"). Pursuant to a Transfer Agency Agreement, the Fund pays BFDS a fee based on the number of classes, accounts and transactions relating to the Portfolios of the Fund.
F. Custodian Fees: State Street (the "Custodian") serves as Custodian for the Fund in accordance with a Custodian Agreement. The Custodian holds cash, securities, and other assets of the Fund as required by the Act. Custody fees are payable monthly based on assets held in custody, investment purchases and sales activity and account maintenance fees, plus reimbursement for certain out-of-pocket expenses.
G. Security Transactions and Transactions with Affiliates: For the year ended September 30, 2015, purchases and sales of investment securities for the Portfolio, other than long-term U.S. Government securities and short-term investments, were approximately $1,679,562,000 and $4,202,402,000, respectively. There were no purchases and sales of long-term U.S. Government securities for the year ended September 30, 2015.
The Portfolio invests in the Institutional Class of the Morgan Stanley Institutional Liquidity Funds (the "Liquidity Funds"), an open-end management investment company managed by the Adviser, both directly and as a portion of the securities held as collateral on loaned securities. Advisory fees paid by the Portfolio are reduced by an amount equal to its pro-rata share of the advisory and administration fees paid by the Portfolio due to its investment in the Liquidity Funds. For the year ended September 30, 2015, advisory fees paid were reduced by approximately $171,000 relating to the Portfolio's investment in the Liquidity Funds.
A summary of the Portfolio's transactions in shares of the Liquidity Funds during the year ended September 30, 2015 is as follows:
Value
September 30,
2014
(000) | | Purchases
at Cost
(000) | | Sales
(000) | | Dividend
Income
(000) | | Value
September 30,
2015
(000) | |
| $ | 337,526 | | | $ | 2,923,523 | | | $ | 3,050,907 | | | $ | 206 | | | $ | 210,142 | | |
25
Morgan Stanley Institutional Fund Trust
Annual Report — September 30, 2015
Notes to Financial Statements (cont'd)
During the year ended September 30, 2015, the Portfolio incurred approximately $2,000 in brokerage commissions with Morgan Stanley & Co., LLC, an affiliate of the Adviser/Administrator and Distributor, for portfolio transactions executed on behalf of the Portfolio.
The Portfolio has an unfunded Deferred Compensation Plan (the "Compensation Plan"), which allows each independent Trustee to defer payment of all, or a portion, of the fees he or she receives for serving on the Board of Trustees. Each eligible Trustee generally may elect to have the deferred amounts credited with a return equal to the total return on one or more of the Morgan Stanley funds that are offered as investment options under the Compensation Plan. Appreciation/depreciation and distributions received from these investments are recorded with an offsetting increase/decrease in the deferred compensation obligation and do not affect the NAV of the Portfolio.
H. Federal Income Taxes: It is the Portfolio's intention to continue to qualify as a regulated investment company and distribute all of its taxable and tax-exempt income. Accordingly, no provision for Federal income taxes is required in the financial statements.
The Portfolio may be subject to taxes imposed by countries in which it invests. Such taxes are generally based on income and/or capital gains earned or repatriated. Taxes are accrued based on net investment income, net realized gains and net unrealized appreciation as such income and/or gains are earned. Taxes may also be based on transactions in foreign currency and are accrued based on the value of investments denominated in such currency.
FASB ASC 740-10, "Income Taxes — Overall", sets forth a minimum threshold for financial statement recognition of the benefit of a tax position taken or expected to be taken in a tax return. Management has concluded there are no significant uncertain tax positions that would require recognition in the financial statements. If applicable, the Portfolio recognizes interest accrued related to unrecognized tax benefits in "Interest Expense" and penalties in "Other Expenses" in the Statement of Operations. The Portfolio files tax returns with the U.S. Internal Revenue Service, New York and various states. Each of
the tax years in the four-year period ended September 30, 2015, remains subject to examination by taxing authorities.
The tax character of distributions paid may differ from the character of distributions shown in the Statements of Changes in Net Assets due to short-term capital gains being treated as ordinary income for tax purposes. The tax character of distributions paid during fiscal years 2015 and 2014 was as follows:
2015
Distributions
Paid From: | | 2014
Distributions
Paid From: | |
Ordinary
Income
(000) | | Long-Term
Capital Gain
(000) | | Ordinary
Income
(000) | | Long-Term
Capital Gain
(000) | |
| $ | 69,051 | | | $ | 902,755 | | | $ | 70,823 | | | $ | 369,254 | | |
The amount and character of income and gains to be distributed are determined in accordance with income tax regulations which may differ from GAAP. These book/tax differences are either considered temporary or permanent in nature.
Temporary differences are attributable to differing book and tax treatments for the timing of the recognition of gains (losses) on certain investment transactions and the timing of the deductibility of certain expenses.
Permanent differences, primarily due to differing treatments of gains (losses) related to foreign currency transactions, nondeductible expenses, distribution redesignations, tax adjustments on partnership investments held and sold by the Portfolio and a net operating loss, resulted in the following reclassifications among the components of net assets at September 30, 2015:
Distributions
in Excess of
Net Investment
Income
(000) | | Accumulated
Undistributed
Net Realized
Gain
(000) | | Paid-in-
Capital
(000) | |
| $ | (3,956 | ) | | $ | 11,318 | | | $ | (7,362 | ) | |
At September 30, 2015, the components of distributable earnings for the Portfolio on a tax basis were as follows:
Undistributed
Ordinary
Income
(000) | | Undistributed
Long-Term
Capital Gain
(000) | |
| $ | — | | | $ | 415,821 | | |
26
Morgan Stanley Institutional Fund Trust
Annual Report — September 30, 2015
Notes to Financial Statements (cont'd)
Capital losses and specified ordinary losses, including currency losses, incurred after October 31 but within the taxable year are deemed to arise on the first day of the Portfolio's next taxable year. For the year ended September 30, 2015, the Portfolio deferred to October 1, 2015 for U.S. Federal income tax purposes the following losses:
Post-October
Currency And
Specified Ordinary
Losses
(000) | | Post-October
Capital Losses
(000) | |
| $ | 31,975 | | | | — | | |
I. Other: At September 30, 2015, the Portfolio had otherwise unaffiliated record owners of 10% or greater. Investment activities of these shareholders could have a material impact on the Portfolio. The aggregate percentage of such owners was 62.8%.
27
Morgan Stanley Institutional Fund Trust
Annual Report — September 30, 2015
Report of Independent Registered Public Accounting Firm
To the Shareholders and Board of Trustees of
Morgan Stanley Institutional Fund Trust —
Mid Cap Growth Portfolio
We have audited the accompanying statement of assets and liabilities, including the portfolio of investments, of Mid Cap Growth Portfolio (one of the portfolios constituting Morgan Stanley Institutional Fund Trust) (the "Portfolio") as of September 30, 2015, and the related statement of operations for the year then ended, the statements of changes in net assets for each of the two years in the period then ended and the financial highlights for each of the years or periods indicated therein. These financial statements and financial highlights are the responsibility of the Portfolio's management. Our responsibility is to express an opinion on these financial statements and financial highlights based on our audits.
We conducted our audits in accordance with the standards of the Public Company Accounting Oversight Board (United States). Those standards require that we plan and perform the audit to obtain reasonable assurance about whether the financial statements and financial highlights are free of material misstatement. We were not engaged to perform an audit of the Portfolio's internal control over financial reporting. Our audits included consideration of internal control over financial reporting as a basis for designing audit procedures that are appropriate in the circumstances, but not for the purpose of expressing an opinion on the effectiveness of the Portfolio's internal control over financial reporting. Accordingly, we express no such opinion. An audit also includes examining, on a test basis, evidence supporting the amounts and disclosures in the financial statements and financial highlights, assessing the accounting principles used and significant estimates made by management, and evaluating the overall financial statement presentation. Our procedures included confirmation of securities owned as of September 30, 2015, by correspondence with the custodian and others or by other appropriate auditing procedures where replies from others were not obtained. We believe that our audits provide a reasonable basis for our opinion.
In our opinion, the financial statements and financial highlights referred to above present fairly, in all material respects, the financial position of Mid Cap Growth Portfolio (one of the portfolios constituting Morgan Stanley Institutional Fund Trust) at September 30, 2015, the results of its operations for the year then ended, the changes in its net assets for each of the two years in the period then ended and the financial highlights for each of the years or periods indicated therein, in conformity with U.S. generally accepted accounting principles.

Boston, Massachusetts
November 25, 2015
28
Morgan Stanley Institutional Fund Trust
Annual Report — September 30, 2015
Investment Advisory Agreement Approval (unaudited)
Nature, Extent and Quality of Services
The Board reviewed and considered the nature and extent of the investment advisory services provided by the Adviser (as defined herein) under the advisory agreement, including portfolio management, investment research and equity and fixed income securities trading. The Board also reviewed and considered the nature and extent of the non-advisory, administrative services provided by the Adviser under the administration agreement, including accounting, operations, clerical, bookkeeping, compliance, business management and planning, legal services and the provision of supplies, office space and utilities at the Adviser's expense. The Board also considered the Adviser's investment in personnel and infrastructure that benefits the Portfolio. (The advisory and administration agreements together are referred to as the "Management Agreement.") The Board also considered that the Adviser serves a variety of other investment advisory clients and has experience overseeing service providers. The Board also compared the nature of the services provided by the Adviser with similar services provided by non-affiliated advisers as reported to the Board by Lipper, Inc. ("Lipper").
The Board reviewed and considered the qualifications of the portfolio managers, the senior administrative managers and other key personnel of the Adviser who provide the administrative and advisory services to the Portfolio. The Board determined that the Adviser's portfolio managers and key personnel are well qualified by education and/or training and experience to perform the services in an efficient and professional manner. The Board concluded that the nature and extent of the advisory and administrative services provided were necessary and appropriate for the conduct of the business and investment activities of the Portfolio and supported its decision to approve the Management Agreement.
Performance, Fees and Expenses of the Portfolio
The Board reviewed the performance, fees and expenses of the Portfolio compared to its peers, as determined by Lipper, and to appropriate benchmarks where applicable. The Board discussed with the Adviser the performance goals and the actual results achieved in managing the Portfolio. When considering a fund's performance, the Board and the Adviser place emphasis on trends and longer-term returns (focusing on one-year, three-year and five-year performance, as of December 31, 2014, or since inception, as applicable). When a fund underperforms its benchmark and/or its peer group average, the Board and the Adviser discuss the causes of such underperformance and, where necessary, they discuss specific changes to investment strategy or investment personnel. The Board noted that the Portfolio's performance was below its peer group average for the one-, three- and five-year periods. The Board discussed with the Adviser the level of the advisory and administration fees (together, the "management fee") for this Portfolio relative to comparable funds and/or other accounts advised by the Adviser and/or compared to its peers as determined by Lipper. In addition to the management fee, the Board also reviewed the Portfolio's total expense ratio. The Board noted that the Portfolio's management fee and total expense ratio were lower than its peer group averages. After discussion, the Board concluded that the Portfolio's (i) performance was acceptable; and (ii) management fee and total expense ratio were competitive with its peer group averages.
Economies of Scale
The Board considered the size and growth prospects of the Portfolio and how that relates to the Portfolio's total expense ratio and particularly the Portfolio's management fee rate, which does not include breakpoints. In conjunction with its review of the Adviser's profitability, the Board discussed with the Adviser how a change in assets can affect the efficiency or effectiveness of managing the Portfolio and whether the management fee level is appropriate relative to current and projected asset levels and/or whether the management fee structure reflects economies of scale as asset levels change. The Board has determined that its review of the actual and/or potential economies of scale of the Portfolio supports its decision to approve the Management Agreement.
Profitability of the Adviser and Affiliates
The Board considered information concerning the costs incurred and profits realized by the Adviser and its affiliates during the last year from their relationship with the Portfolio and during the last two years from their relationship with the Morgan Stanley Fund Complex and reviewed with the Adviser the cost allocation methodology used to determine the profitability of the Adviser and affiliates. The Board has determined that its review of the analysis of the Adviser's expenses and profitability supports its decision to approve the Management Agreement.
29
Morgan Stanley Institutional Fund Trust
Annual Report — September 30, 2015
Investment Advisory Agreement Approval (unaudited) (cont'd)
Other Benefits of the Relationship
The Board considered other direct and indirect benefits to the Adviser and/or its affiliates derived from their relationship with the Portfolio and other funds advised by the Adviser. These benefits may include, among other things, fees for trading, distribution and/or shareholder servicing and for transaction processing and reporting platforms used by securities lending agents, and research received by the Adviser generated from commission dollars spent on funds' portfolio trading. The Board reviewed with the Adviser these arrangements and the reasonableness of the Adviser's costs relative to the services performed. The Board has determined that its review of the other benefits received by the Adviser or its affiliates supports its decision to approve the Management Agreement.
Resources of the Adviser and Historical Relationship Between the Portfolio and the Adviser
The Board considered whether the Adviser is financially sound and has the resources necessary to perform its obligations under the Management Agreement. The Board also reviewed and considered the historical relationship between the Portfolio and the Adviser, including the organizational structure of the Adviser, the policies and procedures formulated and adopted by the Adviser for managing the Portfolio's operations and the Board's confidence in the competence and integrity of the senior managers and key personnel of the Adviser. The Board concluded that the Adviser has the financial resources necessary to fulfill its obligations under the Management Agreement and that it is beneficial for the Portfolio to continue its relationship with the Adviser.
Other Factors and Current Trends
The Board considered the controls and procedures adopted and implemented by the Adviser and monitored by the Fund's Chief Compliance Officer and concluded that the conduct of business by the Adviser indicates a good faith effort on its part to adhere to high ethical standards in the conduct of the Portfolio's business.
General Conclusion
After considering and weighing all of the above factors, with various written materials and verbal information presented by the Adviser, the Board concluded that it would be in the best interest of the Portfolio and its shareholders to approve renewal of the Management Agreement for another year. In reaching this conclusion the Board did not give particular weight to any single piece of information or factor referenced above. The Board considered these factors and information over the course of the year and in numerous meetings, some of which were in executive session with only the independent Board members and their counsel present. It is possible that individual Board members may have weighed these factors, and the information presented, differently in reaching their individual decisions to approve the Management Agreement.
30
Morgan Stanley Institutional Fund Trust
Annual Report — September 30, 2015
Federal Tax Notice (unaudited)
For Federal income tax purposes, the following information is furnished with respect to the distributions paid by the Portfolio during its taxable year ended September 30, 2015. For corporate shareholders 54.35% of the dividends qualified for the dividends received deduction.
The Portfolio designated and paid approximately $902,755,000 as a long-term capital gain distribution.
For Federal income tax purposes, the following information is furnished with respect to the Portfolio's earnings for its taxable year ended September 30, 2015. When distributed, certain earnings may be subject to a maximum tax rate of 15% as provided for by the Jobs and Growth Tax Relief Reconciliation Act of 2003. The Portfolio designated up to a maximum of approximately $15,103,000 as taxable at this lower rate.
In January, the Portfolio provides tax information to shareholders for the preceding calendar year.
31
Morgan Stanley Institutional Fund Trust
Annual Report — September 30, 2015
U.S. Privacy Policy (unaudited)
AN IMPORTANT NOTICE CONCERNING OUR U.S. PRIVACY POLICY
This privacy notice describes the U.S. privacy policy of Morgan Stanley Distribution, Inc., and the Morgan Stanley family of mutual funds ("us", "our", "we").
We are required by federal law to provide you with notice of our U.S. privacy policy ("Policy"). This Policy applies to both our current and former clients unless we state otherwise and is intended for individual clients who purchase products or receive services from us for personal, family or household purposes. This Policy is not applicable to partnerships, corporations, trusts or other non-individual clients or account holders, nor is this Policy applicable to individuals who are either beneficiaries of a trust for which we serve as trustee or participants in an employee benefit plan administered or advised by us. This Policy is, however, applicable to individuals who select us to be a custodian of securities or assets in individual retirement accounts, 401(k) accounts, or accounts subject to the Uniform Gifts to Minors Act.
This notice sets out our business practices to protect your privacy; how we collect and share personal information about you; and how you can limit our sharing or certain uses by others of this information. We may amend this Policy at any time, and will inform you of any changes to our Policy as required by law.
WE RESPECT YOUR PRIVACY
We appreciate that you have provided us with your personal financial information and understand your concerns about your information. We strive to safeguard the information our clients entrust to us. Protecting the confidentiality and security of client information is an important part of how we conduct our business.
This notice describes what personal information we collect about you, how we collect it, when we may share it with others, and how certain others may use it. It discusses the steps you may take to limit our sharing of certain information about you with our affiliated companies, including, but not limited to our affiliated banking businesses, brokerage firms and credit service affiliates. It also discloses how you may limit our affiliates' use of shared information for marketing purposes.
Throughout this Policy, we refer to the nonpublic information that personally identifies you as "personal information." We also use the term "affiliated company" in this notice. An affiliated company is a company in our family of companies and includes companies with the Morgan Stanley name. These affiliated companies are financial institutions such as broker-dealers, banks, investment advisers and credit card issuers. We refer to any company that is not an affiliated company as a nonaffiliated third party. For purposes of Section 5 of this notice, and your ability to limit certain uses of personal information by our affiliates, this notice applies to the use of personal information by our affiliated companies.
1. WHAT PERSONAL INFORMATION DO WE COLLECT FROM YOU?
We may collect the following types of information about you: (i) information provided by you, including information from applications and other forms we receive from you, (ii) information about your transactions with us or our affiliates, (iii) information about your transactions with nonaffiliated third parties, (iv) information from consumer reporting agencies, (v) information obtained from our websites, and (vi) information obtained from other sources. For example:
• We collect information such as your name, address, e-mail address, telephone/fax numbers, assets, income and investment objectives through applications and other forms you submit to us.
• We may obtain information about account balances, your use of account(s) and the types of products and services you prefer to receive from us through your dealings and transactions with us and other sources.
• We may obtain information about your creditworthiness and credit history from consumer reporting agencies.
• We may collect background information from and through third-party vendors to verify representations you have made and to comply with various regulatory requirements.
2. WHEN DO WE DISCLOSE PERSONAL INFORMATION WE COLLECT ABOUT YOU?
We may disclose personal information we collect about you in each of the categories listed above to affiliated and nonaffiliated third parties.
32
Morgan Stanley Institutional Fund Trust
Annual Report — September 30, 2015
U.S. Privacy Policy (unaudited) (cont'd)
a. Information We Disclose to Affiliated Companies.
We may disclose personal information that we collect about you to our affiliated companies to manage your account(s) effectively, to service and process your transactions, and to let you know about products and services offered by us and affiliated companies, to manage our business, and as otherwise required or permitted by law. Offers for products and services from affiliated companies are developed under conditions designed to safeguard your personal information.
b. Information We Disclose to Third Parties.
We may disclose personal information that we collect about you to nonaffiliated third parties to provide marketing services on our behalf or to other financial institutions with whom we have joint marketing agreements. We may also disclose all of the information we collect to other nonaffiliated third parties for our everyday business purposes, such as to process transactions, maintain account(s), respond to court orders and legal investigations, report to credit bureaus, offer our own products and services, protect against fraud, for institutional risk control, to perform services on our behalf, and as otherwise required or permitted by law.
When we share personal information about you with a nonaffiliated third party, they are required to limit their use of personal information about you to the particular purpose for which it was shared and they are not allowed to share personal information about you with others except to fulfill that limited purpose or as may be permitted or required by law.
3. HOW DO WE PROTECT THE SECURITY AND CONFIDENTIALITY OF PERSONAL INFORMATION WE COLLECT ABOUT YOU?
We maintain physical, electronic and procedural security measures that comply with applicable law and regulations to help safeguard the personal information we collect about you. We have internal policies governing the proper handling of client information by employees. Third parties that provide support or marketing services on our behalf may also receive personal information about you, and we require them to adhere to appropriate security standards with respect to such information.
4. HOW CAN YOU LIMIT OUR SHARING CERTAIN PERSONAL INFORMATION ABOUT YOU WITH OUR AFFILIATED COMPANIES FOR ELIGIBILITY DETERMINATION?
By following the opt-out procedures in Section 6 below, you may limit the extent to which we share with our affiliated companies, personal information that was collected to determine your eligibility for products and services such as your credit reports and other information that you have provided to us or that we may obtain from third parties ("eligibility information"). Eligibility information does not include your identification information or personal information pertaining to our transactions or experiences with you. Please note that, even if you direct us not to share eligibility information with our affiliated companies, we may still share your personal information, including eligibility information, with our affiliated companies under circumstances that are permitted under applicable law, such as to process transactions or to service your account.
5. HOW CAN YOU LIMIT THE USE OF CERTAIN PERSONAL INFORMATION ABOUT YOU BY OUR AFFILIATED COMPANIES FOR MARKETING?
By following the opt-out instructions in Section 6 below, you may limit our affiliated companies from marketing their products or services to you based on personal information we disclose to them. This information may include, for example, your income and account history with us. Please note that, even if you choose to limit our affiliated companies from using personal information about you that we may share with them for marketing their products and services to you, our affiliated companies may use your personal information that they obtain from us to market to you in circumstances permitted by law, such as if the affiliated party has its own relationship with you.
33
Morgan Stanley Institutional Fund Trust
Annual Report — September 30, 2015
U.S. Privacy Policy (unaudited) (cont'd)
6. HOW CAN YOU SEND US AN OPT-OUT INSTRUCTION?
If you wish to limit our sharing of eligibility information about you with our affiliated companies, or our affiliated companies' use of personal information for marketing purposes, as described in this notice, you may do so by:
• Calling us at (800) 548-7786
Monday–Friday between 8a.m. and 6p.m. (EST)
• Writing to us at the following address:
Boston Financial Data Services, Inc.
c/o Privacy Coordinator
P.O. Box 219804
Kansas City, Missouri 64121
If you choose to write to us, your request should include: your name, address, telephone number and account number(s) to which the opt-out applies and whether you are opting out with respect to sharing of eligibility information (Section 4 above), or information used for marketing (Section 5 above), or both. Written opt-out requests should not be sent with any other correspondence. In order to process your request, we require that the request be provided by you directly and not through a third party. Once you have informed us about your privacy preferences, your opt-out preference will remain in effect with respect to this Policy (as it may be amended) until you notify us otherwise. If you are a joint account owner, we will accept instructions from any one of you and apply those instructions to the entire account.
Please understand that if you limit our sharing or our affiliated companies' use of personal information, you and any joint account holder(s) may not receive information about our affiliated companies' products and services, including products or services that could help you manage your financial resources and achieve your investment objectives.
If you have more than one account or relationship with us, please specify the accounts to which you would like us to apply your privacy choices. If you have accounts or relationships with our affiliates, you may receive multiple privacy policies from them, and will need to separately notify those companies of your privacy choices for those accounts or relationships.
7. WHAT IF AN AFFILIATED COMPANY BECOMES A NONAFFILIATED THIRD PARTY?
If, at any time in the future, an affiliated company becomes a nonaffiliated third party, further disclosures of personal information made to the former affiliated company will be limited to those described in Section 2(b) above relating to nonaffiliated third parties. If you elected under Section 6 to limit disclosures we make to affiliated companies, or use of personal information by affiliated companies, your election will not apply to use by any former affiliated company of your personal information in their possession once it becomes a nonaffiliated third party.
SPECIAL NOTICE TO RESIDENTS OF VERMONT
The following section supplements our Policy with respect to our individual clients who have a Vermont address and supersedes anything to the contrary in the above Policy with respect to those clients only.
The State of Vermont requires financial institutions to obtain your consent prior to sharing personal information that they collect about you with nonaffiliated third parties, or eligibility information with affiliated companies, other than in certain limited circumstances. Except as permitted by law, we will not share personal information we collect about you with nonaffiliated third parties or eligibility information with affiliated companies, unless you provide us with your written consent to share such information.
SPECIAL NOTICE TO RESIDENTS OF CALIFORNIA
The following section supplements our Policy with respect to our individual clients who have a California address and supersedes anything to the contrary in the above Policy with respect to those clients only.
In response to a California law, if your account has a California home address, your personal information will not be disclosed to nonaffiliated third parties except as permitted by applicable California law, and we will limit sharing such personal information with our affiliates to comply with California privacy laws that apply to us.
34
Morgan Stanley Institutional Fund Trust
Annual Report — September 30, 2015
Trustee and Officer Information (unaudited)
Independent Trustees:
Name, Age and Address of
Independent Trustee | | Positions(s)
Held with
Registrant | | Length of Time
Served* | | Principal Occupation(s) During Past 5 Years
and Other Relevant Professional Experience | | Number of
Portfolios in
Fund Complex
Overseen by
Trustee** | | Other Directorships
Held by Independent
Trustee*** | |
Frank L. Bowman (70)
c/o Kramer Levin Naftalis & Frankel LLP
Counsel to the Independent Trustees
1177 Avenue of the Americas
New York, NY 10036 | | Trustee | | Since
August
2006 | | President, Strategic Decisions, LLC (consulting) (since February 2009); Director or Trustee of various Morgan Stanley Funds (since August 2006); Chairperson of the Compliance and Insurance Committee (since October 2015); Chairperson of the Insurance Sub-Committee of the Compliance and Insurance Committee (since February 2007); served as President and Chief Executive Officer of the Nuclear Energy Institute (policy organization) (February 2005-November 2008); retired as Admiral, U.S. Navy after serving over 38 years on active duty including 8 years as Director of the Naval Nuclear Propulsion Program in the Department of the Navy and the U.S. Department of Energy (1996-2004); served as Chief of Naval Personnel (July 1994-September 1996); and on the Joint Staff as Director of Political Military Affairs (June 1992-July1994); knighted as Honorary Knight Commander of the Most Excellent Order of the British Empire; awarded the Officier de l'Orde National du Mérite by the French Government; elected to the National Academy of Engineering (2009). | | | 96 | | | Director of BP p.l.c.; Director of Naval and Nuclear Technologies LLP; Director Emeritus of the Armed Services YMCA of the USA; Director of the U.S. Naval Submarine League; Member of the National Security Advisory Council of the Center for U.S. Global Engagement and a member of the CNA Military Advisory Board; Chairman of the Charity J Street Cup Golf ; Trustee of Fairhaven United Methodist Church. | |
Kathleen A. Dennis (62)
c/o Kramer Levin Naftalis & Frankel LLP
Counsel to the Independent Trustees
1177 Avenue of the Americas
New York, NY 10036 | | Trustee | | Since
August
2006 | | President, Cedarwood Associates (mutual fund and investment management consulting) (since July 2006); Chairperson of the Money Market and Alternatives Sub-Committee of the Investment Committee (since October2006) and Director or Trustee of various Morgan Stanley Funds (since August 2006); formerly, Senior Managing Director of Victory Capital Management (1993-2006). | | | 96 | | | Director of various nonprofit organizations. | |
Nancy C. Everett (60)
c/o Kramer Levin Naftalis & Frankel LLP
Counsel to the Independent Trustees
1177 Avenue of the Americas
New York, NY 10036 | | Trustee | | Since
January
2015 | | Owner, OBIR, LLC (institutional investment management consulting) (since June 2014); formerly, Managing Director, BlackRock, Inc. (February 2011-December 2013); and Chief Executive Officer, General Motors Asset Management (a/k/a Promark Global Advisors, Inc.) (June 2005-May 2010). | | | 96 | | | Member of Virginia Commonwealth University Board of Visitors; Member of Virginia Commonwealth University School of Business Foundation; formerly, Member of Committee on Directors for Emerging Markets Growth Fund, Inc. (2007-2010); Chairperson of Performance Equity Management, LLC (2006-2010); and Chairperson, GMAM Absolute Return Strategies Fund, LLC (2006-2010). | |
35
Morgan Stanley Institutional Fund Trust
Annual Report — September 30, 2015
Trustee and Officer Information (unaudited) (cont'd)
Independent Trustees: (cont'd)
Name, Age and Address of
Independent Trustee | | Positions(s)
Held with
Registrant | | Length of Time
Served* | | Principal Occupation(s) During Past 5 Years
and Other Relevant Professional Experience | | Number of
Portfolios in
Fund Complex
Overseen by
Trustee** | | Other Directorships
Held by Independent
Trustee*** | |
Jakki L. Haussler (58)
c/o Kramer Levin Naftalis & Frankel LLP
Counsel to the Independent Trustees
1177 Avenue of the Americas
New York, NY 10036 | | Trustee | | Since
January
2015 | | Chairman and Chief Executive Officer, Opus Capital Group (since January 1996); and formerly, Director, Capvest Venture Fund, LP (May 2000-December 2011); Partner, Adena Ventures, LP (July 1999-December 2010); Director, The Victory Funds (February 2005-July 2008). | | | 96 | | | Director of Cincinnati Bell Inc. and Member, Audit Committee and Compensation Committee; Director of Northern Kentucky University Foundation and Member, Investment Committee; Member of Chase College of Law Transactional Law Practice Center Board of Advisors; Director of Best Transport; Member, University of Cincinnati Foundation Investment Committee; formerly, Member, Miami University Board of Visitors (2008-2011); Trustee of Victory Funds (2005-2008) and Chairman, Investment Committee (2007-2008) and Member, Service Provider Committee (2005-2008). | |
Dr. Manuel H. Johnson (66)
c/o Johnson Smick International, Inc.
220 I Street, N.E. — Suite 200
Washington, D.C. 20002 | | Trustee | | Since
July
1991 | | Senior Partner, Johnson Smick International, Inc. (consulting firm); Chairperson of the Investment Committee (since October 2006) and Director or Trustee of various Morgan Stanley Funds (since July 1991); Co-Chairman and a founder of the Group of Seven Council (G7C) (international economic commission); formerly Chairperson of the Audit Committee (July 1991-September 2006), Vice Chairman of the Board of Governors of the Federal Reserve System and Assistant Secretary of the U.S. Treasury. | | | 98 | | | Director of NVR, Inc. (home construction). | |
Joseph J. Kearns (73)
c/o Kearns & Associates LLC
23823 Malibu Road
S-50-440
Malibu, CA 90265 | | Trustee | | Since
August
1994 | | President, Kearns & Associates LLC (investment consulting); Chairperson of the Audit Committee (since October 2006) and Director or Trustee of various Morgan Stanley Funds (since August 1994); formerly, Deputy Chairperson of the Audit Committee (July 2003-September 2006) and Chairperson of the Audit Committee of various Morgan Stanley Funds (since August 1994); CFO of the J. Paul Getty Trust. | | | 99 | | | Director of Electro Rent Corporation (equipment leasing). Prior to December 31, 2013, Director of The Ford Family Foundation. | |
36
Morgan Stanley Institutional Fund Trust
Annual Report — September 30, 2015
Trustee and Officer Information (unaudited) (cont'd)
Independent Trustees: (cont'd)
Name, Age and Address of
Independent Trustee | | Positions(s)
Held with
Registrant | | Length of Time
Served* | | Principal Occupation(s) During Past 5 Years
and Other Relevant Professional Experience | | Number of
Portfolios in
Fund Complex
Overseen by
Trustee** | | Other Directorships
Held by Independent
Trustee*** | |
Michael F. Klein (56)
c/o Kramer Levin Naftalis & Frankel LLP
Counsel to the Independent Trustees
1177 Avenue of the Americas
New York, NY 10036 | | Trustee | | Since
August
2006 | | Managing Director, Aetos Capital, LLC (since March 2000); Co-President, Aetos Alternatives Management, LLC (since January 2004); and Co-Chief Executive Officer of Aetos Capital LLC (since August 2013); Chairperson of the Fixed Income Sub-Committee of the Investment Committee (since October 2006) and Director or Trustee of various Morgan Stanley Funds (since August 2006); formerly, Managing Director, Morgan Stanley & Co. Inc. and Morgan Stanley Dean Witter Investment Management, President, various Morgan Stanley Funds (June1998-March 2000) and Principal, Morgan Stanley & Co. Inc. and Morgan Stanley Dean Witter Investment Management (August 1997-December 1999). | | | 96 | | | Director of certain investment funds managed or sponsored by Aetos Capital, LLC. Director of Sanitized AG and Sanitized Marketing AG (specialty chemicals). | |
Michael E. Nugent (79)
522 Fifth Avenue
New York, NY 10036 | | Chair of the
Board and
Trustee | | Chair of the
Boards since
July 2006 and
Trustee since
July 1991 | | Chair of the Boards of various Morgan Stanley Funds (since July 2006); Chairperson of the Closed-End Fund Committee (since June 2012) and Director or Trustee of various Morgan Stanley Funds (since July 1991); formerly, Chairperson of the Insurance Committee (until July 2006), General Partner, Triumph Capital, L.P. (private investment partnership) (1988-2013). | | | 98 | | | None. | |
W. Allen Reed (68)
c/o Kramer Levin Naftalis & Frankel LLP
Counsel to the Independent Trustees
1177 Avenue of the Americas
New York, NY 10036 | | Trustee | | Since
August
2006 | | Chairperson of the Equity Sub-Committee of the Investment Committee (since October 2006) and Director or Trustee of various Morgan Stanley Funds (since August 2006); formerly, President and CEO of General Motors Asset Management; Chairman and Chief Executive Officer of the GM Trust Bank and Corporate Vice President of General Motors Corporation (August 1994-December 2005). | | | 96 | | | Director of Temple-Inland Industries (packaging and forest products); Director of Legg Mason, Inc. and Director of the Auburn University Foundation. | |
Fergus Reid (83)
c/o Joe Pietryka, Inc.
85 Charles Colman Blvd.
Pawling, NY 12564 | | Trustee | | Since
June
1992 | | Chairman, Joe Pietryka, Inc.; Chairperson of the Governance Committee and Director or Trustee of various Morgan Stanley Funds (since June 1992). | | | 99 | | | Formerly, Trustee and Director of certain investment companies in the JP Morgan Fund Complex managed by JP Morgan Investment Management Inc. (1987-December 2012). | |
37
Morgan Stanley Institutional Fund Trust
Annual Report — September 30, 2015
Trustee and Officer Information (unaudited) (cont'd)
Interested Trustee:
Name, Age and Address of
Interested Trustee | | Positions(s) Held
with Registrant | | Length of Time
Served* | | Principal Occupation(s) During Past 5 Years | | Number of
Portfolios in
Fund Complex
Overseen by
Interested
Trustee** | | Other Directorships
Held by Interested
Trustee*** | |
James F. Higgins (67)
One New York Plaza,
New York, NY 10004 | | Trustee | | Since
June
2000 | | Director or Trustee of various Morgan Stanley Funds (since June 2000); Senior Advisor of Morgan Stanley (since August 2000). | | | 97 | | | Formerly, Director of AXA Financial, Inc. and AXA Equitable Life Insurance Company (2002-2011) and Director of AXA MONY Life Insurance Company and AXA MONY Life Insurance Company of America (2004-2011). | |
* This is the earliest date the Trustee began serving the Morgan Stanley Funds. Each Trustee serves an indefinite term, until his or her successor is elected.
** The Fund Complex includes (as of December 31, 2014) all open-end and closed-end funds (including all of their portfolios) advised by Morgan Stanley Investment Management Inc. (the "Adviser") and any funds that have an adviser that is an affiliated person of the Adviser (including, but not limited to, Morgan Stanley AIP GP LP).
*** This includes any directorships at public companies and registered investment companies held by the Trustee at any time during the past five years.
38
Morgan Stanley Institutional Fund Trust
Annual Report — September 30, 2015
Trustee and Officer Information (unaudited) (cont'd)
Executive Officers:
Name, Age and Address of Executive Officer | | Position(s) Held
with
Registrant | | Length of Time
Served* | | Principal Occupation(s) During Past 5 Years | |
John H. Gernon (52)
522 Fifth Avenue
New York, NY 10036 | | President and Principal Executive Officer | | Since
September
2013 | | President and Principal Executive Officer of the Equity and Fixed Income Funds and the Morgan Stanley AIP Funds (since September 2013) and the Liquidity Funds and various money market funds (since May 2014) in the Fund Complex, Managing Director of the Adviser; Head of Product (since 2006) and Global Portfolio Analysis and Reporting (since 2012); for MSIM's Long Only business. | |
Stefanie V. Chang Yu (48)
522 Fifth Avenue
New York, NY 10036 | | Chief
Compliance
Officer | | Since
December
1997 | | Managing Director of the Adviser and various entities affiliated with the Adviser; Chief Compliance Officer of various Morgan Stanley Funds and the Adviser (since January 2014); formerly, Vice President of various Morgan Stanley Funds (December 1997-January 2014). | |
Joseph C. Benedetti (50)
522 Fifth Avenue
New York, NY 10036 | | Vice President | | Since
January
2014 | | Managing Director of the Adviser and various entities affiliated with the Adviser; Vice President of various Morgan Stanley Funds (since January 2014); formerly, Assistant Secretary of various Morgan Stanley Funds (October 2004-January 2014). | |
Francis J. Smith (50)
522 Fifth Avenue
New York, NY 10036 | | Treasurer and
Principal
Financial
Officer | | Treasurer
since July
2003 and
Principal
Financial
Officer since
September
2002 | | Executive Director of the Adviser and various entities affiliated with the Adviser; Treasurer (since July 2003) and Principal Financial Officer of various Morgan Stanley Funds (since September 2002). | |
Mary E. Mullin (48)
522 Fifth Avenue
New York, NY 10036 | | Secretary | | Since
June
1999 | | Executive Director of the Adviser and various entities affiliated with the Adviser; Secretary of various Morgan Stanley Funds (since June 1999). | |
* This is the earliest date the officer began serving the Morgan Stanley Funds. Each officer serves a one-year term, until his or her successor is elected and has qualified.
39
Morgan Stanley Institutional Fund Trust
Annual Report — September 30, 2015
Adviser and Administrator
Morgan Stanley Investment Management Inc.
522 Fifth Avenue
New York, New York 10036
Distributor
Morgan Stanley Distribution, Inc.
522 Fifth Avenue
New York, New York 10036
Dividend Disbursing and Transfer Agent
Boston Financial Data Services, Inc.
2000 Crown Colony Drive
Quincy, Massachusetts 02169
Custodian
State Street Bank and Trust Company
One Lincoln Street
Boston, Massachusetts 02111
Legal Counsel
Dechert LLP
1095 Avenue of the Americas
New York, New York 10036
Counsel to the Independent Trustees
Kramer Levin Naftalis & Frankel LLP
1177 Avenue of the Americas
New York, New York 10036
Independent Registered Public Accounting Firm
Ernst & Young LLP
200 Clarendon Street
Boston, Massachusetts 02116
Reporting to Shareholders
Each Morgan Stanley fund provides a complete schedule of portfolio holdings in its semi-annual and annual reports within 60 days of the end of the fund's second and fourth fiscal quarters. The semi-annual and annual reports are filed electronically with the Securities and Exchange Commission (SEC) on Form N-CSRS and Form N-CSR, respectively. Morgan Stanley also delivers the semi-annual and annual reports to fund shareholders and makes these reports available on its public website, www.morganstanley.com/im. Each Morgan Stanley fund also files a complete schedule of portfolio holdings with the SEC for the fund's first and third fiscal quarters on Form N-Q. Morgan Stanley does not deliver the reports for the first and third fiscal quarters to shareholders, nor are the reports posted to the Morgan Stanley public website. You may, however, obtain the Form N-Q filings (as well as the Form N-CSR and N-CSRS filings) by accessing the SEC's website, www.sec.gov. You may also review and copy them at the SEC's Public Reference Room in Washington, DC. Information on the operation of the SEC's Public Reference Room may be obtained by calling the SEC toll free at 1 (800) SEC-0330. You can also request copies of these materials, upon payment of a duplicating fee, by electronic request at the SEC's email address (publicinfo@sec.gov) or by writing the Public Reference Room of the SEC, Washington, DC 20549-0102.
Proxy Voting Policies and Procedures and Proxy Voting Record
You may obtain a copy of the Fund's Proxy Voting Policy and Procedures and information regarding how the Fund voted proxies relating to portfolio securities during the most recent twelve-month period ended June 30, without charge, upon request, by calling toll free 1 (800) 548-7786 or by visiting our website at www.morganstanley.com/im. This information is also available on the SEC's website at www.sec.gov.
This report is authorized for distribution only when preceded or accompanied by a prospectus of the Morgan Stanley Institutional Fund Trust, which describes in detail each Portfolio's investment policies, risks, fees and expenses. Please read the prospectus carefully before you invest or send money. For additional information, including information regarding the investments comprising the Portfolio, please visit our website at www.morganstanley.com/im or call toll free 1 (800) 548-7786.
40
Printed in U.S.A.
This Report has been prepared for shareholders and may be distributed to others only if preceded or accompanied by a current prospectus.
Morgan Stanley Investment Management Inc.
522 Fifth Avenue
New York, New York 10036
© 2015 Morgan Stanley. Morgan Stanley Distribution, Inc.

IFTMCGANN
1333203 EXP 11.30.16

Morgan Stanley Institutional Fund Trust
Strategic Income Portfolio
Annual Report
September 30, 2015

Morgan Stanley Institutional Fund Trust
Annual Report — September 30, 2015
Shareholders' Letter | | | 2 | | |
Expense Example | | | 3 | | |
Investment Overview | | | 4 | | |
Portfolio of Investments | | | 7 | | |
Statement of Assets and Liabilities | | | 12 | | |
Statement of Operations | | | 14 | | |
Statement of Changes in Net Assets | | | 15 | | |
Financial Highlights | | | 16 | | |
Notes to Financial Statements | | | 20 | | |
Report of Independent Registered Public Accounting Firm | | | 29 | | |
U.S. Privacy Policy | | | 30 | | |
Trustee and Officer Information | | | 33 | | |
This report is authorized for distribution only when preceded or accompanied by prospectuses of the Morgan Stanley Institutional Fund Trust. To receive a prospectus and/or statement of additional information (SAI), which contains more complete information such as investment objectives, charges, expenses, policies for voting proxies, risk considerations, and describes in detail each of the Portfolio's investment policies to the prospective investor, please call toll free 1 (800) 548-7786. Please read the prospectuses carefully before you invest or send money.
Additionally, you can access portfolio information including performance, characteristics, and investment team commentary through Morgan Stanley Investment Management's website: www.morganstanley.com/im.
Market forecasts provided in this report may not necessarily come to pass. There is no guarantee that any sectors mentioned will continue to perform as discussed herein or that securities in such sectors will be held by the Portfolio in the future. There is no assurance that a Portfolio will achieve its investment objective. Portfolios are subject to market risk, which is the possibility that market values of securities owned by the Portfolio will decline and, therefore, the value of the Portfolio's shares may be less than what you paid for them. Accordingly, you can lose money investing in this Portfolio. Please see the prospectus for more complete information on investment risks.
1
Morgan Stanley Institutional Fund Trust
Annual Report — September 30, 2015
Shareholders' Letter (unaudited)
Dear Shareholders,
We are pleased to provide this Annual report, in which you will learn how your investment in Strategic Income Portfolio (the "Portfolio") performed during the period ended September 30, 2015.
Morgan Stanley Investment Management is a client-centric, investor-led organization. Our global presence, intellectual capital, and breadth of products and services enable us to partner with investors to meet the evolving challenges of today's financial markets. We aim to deliver superior investment service and to empower our clients to make the informed decisions that help them reach their investment goals.
As always, we thank you for selecting Morgan Stanley Investment Management, and look forward to working with you in the months and years ahead.
Sincerely,

John H. Gernon
President and Principal Executive Officer
October 2015
2
Morgan Stanley Institutional Fund Trust
Annual Report — September 30, 2015
Expense Example (unaudited)
Strategic Income Portfolio
As a shareholder of the Portfolio, you may incur two types of costs: (1) transactional costs, including sales charge (loads) on purchase payments; and (2) ongoing costs, including advisory fees, administration fees, distribution and shareholder services fees; and other Portfolio expenses. This example is intended to help you understand your ongoing costs (in dollars) of investing in the Portfolio and to compare these costs with the ongoing costs of investing in other mutual funds.
This example is based on an investment of $1,000 invested at the beginning of the six-month period ended September 30, 2015 and held for the entire six-month period (unless otherwise noted).
Actual Expenses
The table below provides information about actual account values and actual expenses. You may use the information in this table, together with the amount you invested, to estimate the expenses that you paid over the period. Simply divide your account value by $1,000 (for example, an $8,600 account value divided by $1,000 = 8.6), then multiply the result by the number in the table under the heading entitled "Actual Expenses Paid During Period" to estimate the expenses you paid on your account during this period.
Hypothetical Example for Comparison Purposes
The table below provides information about hypothetical account values and hypothetical expenses based on the Portfolio's actual expense ratio and an assumed rate of return of 5% per year before expenses, which is not the Portfolio's actual return. The hypothetical account values and expenses may not be used to estimate the actual ending account balance or expenses you paid for the period. You may use this information to compare the ongoing costs of investing in the Portfolio and other funds. To do so, compare this 5% hypothetical example with the 5% hypothetical examples that appear in the shareholder reports of the other funds.
Please note that the expenses shown in the table are meant to highlight your ongoing costs only and do not reflect any transactional costs, such as sales charges (loads, if applicable). Therefore, the information for each class in the table is useful in comparing ongoing costs only, and will not help you determine the relative total costs of owning different funds. In addition, if these transactional costs were included, your costs would have been higher.
| | | Beginning
Account
Value
4/1/15 | | Actual Ending
Account
Value
9/30/15 | | Hypothetical
Ending Account
Value | | Actual
Expenses
Paid
During
Period | | Hypothetical
Expenses Paid
During Period | | Net
Expense
Ratio
During
Period*** | |
Strategic Income Portfolio Class I | | $ | 1,000.00 | | | $ | 976.30 | | | $ | 1,020.10 | | | $ | 4.90 | * | | $ | 5.01 | * | | | 0.99 | % | |
Strategic Income Portfolio Class A | | | 1,000.00 | | | | 975.60 | | | | 1,018.35 | | | | 6.64 | * | | | 6.78 | * | | | 1.34 | | |
Strategic Income Portfolio Class C | | | 1,000.00 | | | | 972.90 | | | | 1,012.16 | | | | 8.68 | ** | | | 8.86 | ** | | | 2.10 | | |
Strategic Income Portfolio Class IS | | | 1,000.00 | | | | 976.60 | | | | 1,020.36 | | | | 4.66 | * | | | 4.76 | * | | | 0.94 | | |
* Expenses are calculated using each Portfolio Class' annualized net expense ratio (as disclosed), multiplied by the average account value over the period, and multiplied by 183/365 (to reflect the most recent one-half year period).
** Expenses are calculated using the Portfolio Class' annualized net expense ratio (as disclosed), multiplied by the average account value over the period, and multiplied by 153/365 (to reflect the actual days in the period).
*** Annualized.
3
Morgan Stanley Institutional Fund Trust
Annual Report — September 30, 2015
Investment Overview (unaudited)
Strategic Income Portfolio
The Strategic Income Portfolio (the "Portfolio") seeks total return comprised of income and capital appreciation.
Performance
For the period since the Portfolio's inception on December 30, 2014, through September 30, 2015, the Portfolio's Class I shares had a total return based on net asset value and reinvestment of distributions per share of -1.39%, net of fees. The Portfolio's Class I shares underperformed against the Portfolio's benchmark the Bank of America/Merrill Lynch 3-Month U.S. Treasury Bill Index (the "Index"), which returned 0.02%.
Factors Affecting Performance
• Since the Portfolio's launch at the end of 2014, concerns over central bank policy around the world and global issues, such as Greece's debt crisis and China's economic slowdown, kept bond markets fairly turbulent. Risk premia rose substantially in the latter months of the period and asset prices suffered. The rise in risk premia was driven by a continued tightening of financial conditions, catalyzed by a devaluation of the Chinese currency in August. This tightening of financial conditions resulted in falling business confidence and generally weaker-than-expected economic data. These factors drove "risk-off" sentiment and led to a widening of credit spreads, equity market sell-off and a rally in U.S. Treasuries. Furthermore, to the surprise of many, the Federal Reserve (Fed) kept interest rates unchanged and delivered a more dovish-than-expected policy statement at their September 2015 meeting. As an unintended consequence, markets increasingly worried that the negative impact on the U.S. economy's growth dynamics would warrant a ratcheting down of global growth expectations. This fear drove risk premia even higher. The Fed has communicated that its decision to hike rates will be data dependent, which implies some uncertainty on whether a hike will happen this year. Only if we see a material recovery in labor market indicators over the next few months would a rate hike likely occur this year.
• U.S. Treasury yields were volatile over the first nine months of 2015, ending the period generally lower than where they started.
• Recovering from a volatile fourth quarter of 2014, high yield credit started 2015 on a positive note, as
one of the few fixed income sectors to have positive performance in the first quarter of 2015. However, amid economic and geopolitical worries, the U.S. credit markets endured record amounts of new issuance, which eventually pressured yield spreads wider (and prices lower, as bond prices move inversely to yields). Over the course of 2015, credit spreads in all markets have widened materially and are currently at levels which are typically only seen in periods of economic recession or systemic stress. The spreads observable in the investment grade markets include a material risk premium, and spreads in the high yield market are compensating for a significant uptick in defaults. While it is clear that certain emerging markets are seeing a material risk of recession, the consensus is for the developed world to see moderate growth over the coming year. We believe this growth backdrop, combined with low inflation, is likely to lead to ongoing accommodative monetary policy from the central banks around the world, which should keep defaults low and support credit markets.
• Another driver of credit spreads is the technical balance between supply and demand. Supply volume has been elevated across many of the credit markets. This has been most apparent in the U.S. investment grade market, where a combination of increased merger and acquisition activity and the fear that an interest rate tightening cycle could increase the future cost of long-term debt financing has caused corporate treasurers to turn to the bond markets. As a result, year-to-date new issue volumes have been running at record pace. This is to a lesser extent also true in the U.S. high yield and European investment grade markets. Along with this high level of issuance, demand has been muted as many yield-oriented investors are awaiting higher yields before committing capital to the market. This mismatch between supply and demand has resulted in a higher liquidity premium, which has contributed to the wider credit spreads.
• Despite widening in the latter part of the period, agency mortgage-backed securities (MBS) spreads remain historically expensive. Mortgage rates and prepayment speeds have been range-bound, helping support performance so far, but with the possibility of a Fed rate hike in the coming months, volatility and absolute rate levels could rise and MBS duration extension concerns could return. There is also the
4
Morgan Stanley Institutional Fund Trust
Annual Report — September 30, 2015
Investment Overview (unaudited) (cont'd)
Strategic Income Portfolio
additional risk that at some point in 2016 the Fed could end their MBS purchase program, whereby it has been buying 25% to 30% of all new origination.
• Prior to September, non-agency MBS prices had been resilient to broader credit market declines and had traded more as a function of the strong U.S. housing market. However, prices finally began to weaken as relative spread differences became more pronounced at the end of September. In contrast to the price declines, the fundamental market conditions underlying the non-agency MBS market remain very strong. Home prices rose 0.6% in July (down 0.2% on a seasonally adjusted basis), and were up 5.0% year-on-year from July 2014.(i) New home sales were up 5.7% in August and up 21.6% from August 2014.(ii) Existing home sales were down 1.4% in August, predominantly due to lack of supply, but were still up 6.1% from August 2014.(iii) The volume of outstanding homes for sale fell to a 4.7-month supply based on current sales volumes, down from 5.0-month supply in July and well below the six-month supply that is historically associated with a balanced housing market.(ii) The U.S. homebuilder confidence index climbed to the highest level since November 2005 as housing supply is historically low and housing demand is steadily improving.(iv) U.S. household formation was up 2.25 million year-on-year as of June, roughly double the long-term average of roughly 1.15 million per year.(ii) Household formation had been depressed and substantially below historical norms for most for the past seven years, and we are now seeing some of this pent-up demand enter the market. Mortgage performance remains positive. Mortgage defaults were essentially unchanged in August at 0.8%, down 0.1% from August 2014 and well below the nearly 6% level in 2009.(v)
• Commercial mortgage-backed securities (CMBS) spreads also widened significantly in the latter half of the period. Fundamentally, the CMBS sector remains healthy. Retail sales continue to climb, with August numbers up 0.2% from July and up 2.2% from August 2014.(ii) Consumer confidence rose in September to the second highest level in the past eight years.(vi) Hotel occupancy rates are at their highest levels in more than 15 years, exceeding 65% occupancy so far in 2015.(vii) For comparison, the
previous credit cycle peak of 2004-2006 averaged roughly 63% occupancy. These high occupancy rates are boosting the performance of the hotel sector of CMBS. The improving economy and employment numbers are also helping reduce office space vacancies. National office vacancy rates fell by 0.4% to 13.5% in the second quarter of 2015 and are expected to fall further this year.(viii) Office rental rates increased at roughly 1.1% in the second quarter of 2015, and this pace of increase is expected to continue based on the declining vacancy rates.(viii)
Management Strategies
• Throughout the period, the Portfolio was positioned with exposure to the investment grade credit sector, primarily focused on financials, and to the high yield credit sector, as we believe valuations relative to fundamentals have been attractive for these segments. These positions detracted from performance during the period as volatility in global markets pushed spreads wider.
• The Portfolio also had allocations to non-agency mortgages and CMBS. Non-agency mortgage positions added to performance during the period as the sector remained mostly immune to global volatility; however, CMBS positioning detracted from performance.
• We continue being overweight spread product (non-government bonds) as we believe the yield advantage could provide attractive returns over the near term.
(i) S&P/Case-Shiller 20-City Composite Home Price Index, an index gauging the value of residential real estate in 20 major U.S. metropolitan areas.
(ii) U.S. Census Bureau
(iii) National Association of Realtors
(iv) National Association of Home Builders
(v) S&P/Experian First Mortgage Default Index, an index measuring default rates across first mortgages
(vi) The Conference Board
(vii) Statistica.com
(viii) CBRE Group, Inc.
5
Morgan Stanley Institutional Fund Trust
Annual Report — September 30, 2015
Investment Overview (unaudited) (cont'd)
Strategic Income Portfolio
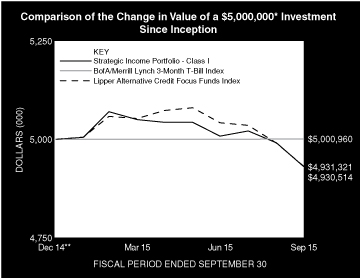
* Minimum Investment
** Commenced operations on December 30, 2014
In accordance with SEC regulations, the Portfolio's performance shown assumes that all recurring fees (including management fees) were deducted and all dividends and distributions were reinvested. The performance of Class A, Class C and Class IS shares will vary from the performance of Class I shares based upon their different inception dates and will be negatively impacted by additional fees assessed to those classes (where applicable).
Performance Compared to the Bank of America/Merrill Lynch 3-Month U.S. Treasury Bill Index(1) and Lipper Alternative Credit Focus Funds Index(2)
| | | Period Ended September 30, 2015
Total Returns(3) | |
| | | One
Year | | Five
Years | | Ten
Years | | Since
Inception(6) | |
Portfolio — Class I Shares
w/o sales charges(4) | | | — | | | | — | | | | — | | | | –1.39 | % | |
Portfolio — Class A Shares
w/o sales charges(4) | | | — | | | | — | | | | — | | | | –1.56 | | |
Portfolio — Class A Shares with
maximum 4.25% sales charges(4) | | | — | | | | — | | | | — | | | | –5.71 | | |
Portfolio — Class C Shares
w/o sales charges(5) | | | — | | | | — | | | | — | | | | –2.71 | | |
Portfolio — Class C Shares with
maximum 1.00% deferred
sales charges(5) | | | — | | | | — | | | | — | | | | –3.68 | | |
Portfolio — Class IS Shares
w/o sales charges(4) | | | — | | | | — | | | | — | | | | –1.37 | | |
Bank of America/Merrill Lynch
3-Month U.S. Treasury Bill Index | | | — | | | | — | | | | — | | | | 0.02 | | |
Lipper Alternative Credit Focus
Funds Index | | | — | | | | — | | | | — | | | | –1.37 | | |
Performance data quoted represents past performance, which is no guarantee of future results, and current performance may be lower or higher than the figures shown. Performance assumes that all dividends and distributions, if any, were reinvested. Returns for period less than one year are not annualized. For the most recent month-end performance figures, please visit www.morganstanley.com/im. Investment return and principal value will fluctuate so that Portfolio shares, when redeemed, may be worth more or less than their original cost. Total returns do not reflect the deduction of taxes that a shareholder would pay on Portfolio distributions or the redemption of Portfolio shares. Performance of share classes will vary due to differences in sales charges and expenses.
(1) Bank of America/Merrill Lynch 3-Month U.S. Treasury Bill Index tracks the performance of U.S. Treasury bills with a remaining maturity of three months. The Index is unmanaged and its returns do not include any sales charges or fees. Such costs would lower performance. It is not possible to invest directly in an index.
(2) The Lipper Alternative Credit Focus Funds Index is an equally weighted performance index of the largest qualifying funds (based on net assets) in the Lipper Alternative Credit Focus Funds classification. The Index, which is adjusted for capital gains distributions and income dividends, is unmanaged and should not be considered an investment. There are currently 30 funds represented in this Index. As of the date of this report, the Portfolio was in the Lipper Alternative Credit Focus Funds classification.
(3) Total returns for the Portfolio reflect expenses waived and/or reimbursed, if applicable, by the Adviser. Without such waivers and/or reimbursements, total returns would have been lower.
(4) Commenced operations on December 30, 2014.
(5) Commenced operations on April 30, 2015.
(6) For comparative purposes, average annual since inception returns listed for the Indexes refer to the inception date of Class I of the Portfolio, not the inception of the Indexes.
6
Morgan Stanley Institutional Fund Trust
Annual Report — September 30, 2015
Portfolio of Investments
Strategic Income Portfolio
| | | Face
Amount
(000) | | Value
(000) | |
Fixed Income Securities (96.2%) | |
Asset-Backed Securities (16.2%) | |
AMRESCO Residential Securities Corp.
Mortgage Loan Trust, | |
0.75%, 9/25/27 (a) | | $ | 19 | | | $ | 19 | | |
Bear Stearns Asset-Backed Securities I Trust, | |
0.51%, 3/25/37 (a) | | | 90 | | | | 49 | | |
Bear Stearns Asset-Backed Securities Trust, | |
0.54%, 5/25/37 (a) | | | 97 | | | | 61 | | |
BNC Mortgage Loan Trust, | |
0.35%, 3/25/37 (a) | | | 100 | | | | 73 | | |
Carrington Mortgage Loan Trust, | |
0.41%, 1/25/37 (a) | | | 100 | | | | 60 | | |
Countrywide Asset-Backed Certificates, | |
0.56%, 4/25/36 (a) | | | 100 | | | | 85 | | |
0.64%, 3/25/47 (a)(b) | | | 76 | | | | 56 | | |
4.98%, 7/25/36 | | | 127 | | | | 103 | | |
CWABS Asset-Backed Certificates Trust, | |
4.91%, 10/25/46 (a) | | | 87 | | | | 64 | | |
Ellington Loan Acquisition Trust, | |
1.29%, 5/25/37 (a)(b) | | | 100 | | | | 86 | | |
GSAA Home Equity Trust, | |
6.00%, 11/25/36 | | | 34 | | | | 23 | | |
GSAMP Trust, | |
0.51%, 3/25/46 (a) | | | 100 | | | | 83 | | |
Home Equity Asset Trust, | |
0.38%, 7/25/37 (a) | | | 32 | | | | 31 | | |
Home Equity Mortgage Loan Asset-Backed Trust, | |
0.31%, 4/25/37 (a) | | | 84 | | | | 56 | | |
Lehman ABS Manufactured Housing Contract Trust, | |
3.70%, 4/15/40 | | | 31 | | | | 31 | | |
Nationstar Home Equity Loan Trust, | |
0.44%, 4/25/37 (a) | | | 100 | | | | 87 | | |
Ownit Mortgage Loan Trust, | |
0.46%, 3/25/37 (a) | | | 61 | | | | 47 | | |
RAMP Trust, | |
0.48%, 2/25/36 (a) | | | 100 | | | | 88 | | |
0.51%, 11/25/35 (a) | | | 73 | | | | 60 | | |
RASC Trust, | |
0.35%, 11/25/36 (a) | | | 80 | | | | 69 | | |
RMAT LLC, | |
4.83%, 6/25/35 (b) | | | 99 | | | | 99 | | |
Truman Capital Mortgage Loan Trust, | |
1.89%, 1/25/34 (a)(b) | | | 89 | | | | 87 | | |
2.97%, 11/25/31 (a)(b) | | | 76 | | | | 72 | | |
VOLT XXXIII LLC, | |
4.25%, 3/25/55 (b) | | | 100 | | | | 99 | | |
| | | | 1,588 | | |
Collateralized Mortgage Obligation — Agency Collateral Series (0.2%) | |
Government National Mortgage Association, IO | |
0.83%, 8/20/58 (a) | | | 627 | | | | 20 | | |
| | | Face
Amount
(000) | | Value
(000) | |
Commercial Mortgage-Backed Securities (5.2%) | |
COMM Mortgage Trust, | |
2.87%, 2/10/48 (b) | | $ | 100 | | | $ | 78 | | |
3.70%, 6/11/27 (a)(b) | | | 100 | | | | 99 | | |
GA Mortgage Securities Trust, | |
4.47%, 2/10/48 (a)(b) | | | 100 | | | | 84 | | |
HILT Mortgage Trust, | |
3.95%, 7/15/29 (a)(b) | | | 100 | | | | 98 | | |
JPMBB Commercial Mortgage Securities Trust, | |
3.98%, 2/15/48 (a)(b) | | | 100 | | | | 82 | | |
Wells Fargo Commercial Mortgage Trust, | |
4.24%, 5/15/48 (a) | | | 75 | | | | 64 | | |
| | | | 505 | | |
Corporate Bonds (39.2%) | |
Finance (16.6%) | |
ABN Amro Bank N.V, | |
6.38%, 4/27/21 | | EUR | 100 | | | | 132 | | |
Ally Financial, Inc., | |
4.13%, 3/30/20 | | $ | 25 | | | | 25 | | |
Assicurazioni Generali SpA, | |
7.75%, 12/12/42 (a) | | EUR | 100 | | | | 131 | | |
Bank of America Corp., | |
4.25%, 10/22/26 | | $ | 50 | | | | 49 | | |
BNP Paribas SA, | |
4.25%, 10/15/24 | | | 200 | | | | 199 | | |
| BPCE SA, | |
5.15%, 7/21/24 (b) | | | 200 | | | | 204 | | |
Citigroup, Inc., | |
5.50%, 9/13/25 | | | 75 | | | | 82 | | |
Cooperatieve Centrale Raiffeisen-Boerenleenbank BA, | |
2.50%, 5/26/26 (a) | | EUR | 100 | | | | 111 | | |
Ctrip.com International Ltd., | |
1.25%, 10/15/18 | | $ | 50 | | | | 54 | | |
Discover Financial Services, | |
3.95%, 11/6/24 | | | 25 | | | | 25 | | |
Goldman Sachs Group, Inc. (The), | |
0.73%, 10/29/19 (a) | | EUR | 100 | | | | 112 | | |
JPMorgan Chase & Co., | |
3.88%, 2/1/24 | | $ | 50 | | | | 52 | | |
Kennedy-Wilson, Inc., | |
5.88%, 4/1/24 | | | 25 | | | | 24 | | |
Lloyds Bank PLC, | |
6.50%, 3/24/20 | | EUR | 50 | | | | 67 | | |
Muenchener Rueckversicherungs-Gesellschaft
AG in Muenchen, | |
6.00%, 5/26/41 (a) | | | 100 | | | | 130 | | |
Nationwide Building Society, | |
4.13%, 3/20/23 (a) | | | 100 | | | | 118 | | |
Vonovia Finance BV, | |
4.00%, 12/17/21 (a)(c) | | | 100 | | | | 107 | | |
| | | | 1,622 | | |
The accompanying notes are an integral part of the financial statements.
7
Morgan Stanley Institutional Fund Trust
Annual Report — September 30, 2015
Portfolio of Investments (cont'd)
Strategic Income Portfolio
| | | Face
Amount
(000) | | Value
(000) | |
Industrials (21.9%) | |
Actavis Funding SCS, | |
3.80%, 3/15/25 | | $ | 15 | | | $ | 15 | | |
ADT Corp. (The), | |
3.50%, 7/15/22 | | | 25 | | | | 22 | | |
Advanced Micro Devices, Inc., | |
6.75%, 3/1/19 | | | 25 | | | | 17 | | |
Air Canada, | |
6.75%, 10/1/19 (b) | | | 50 | | | | 53 | | |
Akamai Technologies, Inc., | |
0.00%, 2/15/19 | | | 50 | | | | 52 | | |
Aramark Services, Inc., | |
5.75%, 3/15/20 | | | 25 | | | | 26 | | |
ArcelorMittal, | |
5.13%, 6/1/20 | | | 25 | | | | 23 | | |
AT&T, Inc., | |
6.30%, 1/15/38 | | | 25 | | | | 28 | | |
Ball Corp., | |
4.00%, 11/15/23 | | | 25 | | | | 24 | | |
Baytex Energy Corp., | |
5.63%, 6/1/24 (b) | | | 25 | | | | 20 | | |
Bombardier, Inc., | |
6.13%, 1/15/23 (b) | | | 25 | | | | 19 | | |
Building Materials Corp. of America, | |
5.38%, 11/15/24 (b) | | | 50 | | | | 50 | | |
Carrizo Oil & Gas, Inc., | |
6.25%, 4/15/23 | | | 15 | | | | 13 | | |
CCO Safari II LLC, | |
4.91%, 7/23/25 (b) | | | 50 | | | | 50 | | |
Citrix Systems, Inc., | |
0.50%, 4/15/19 | | | 50 | | | | 53 | | |
Cobalt International Energy, Inc., | |
2.63%, 12/1/19 | | | 50 | | | | 36 | | |
Continental Airlines Pass-Thru Certificates, | |
6.13%, 4/29/18 | | | 25 | | | | 26 | | |
Crown Castle International Corp., | |
5.25%, 1/15/23 | | | 25 | | | | 27 | | |
CSC Holdings LLC, | |
5.25%, 6/1/24 | | | 25 | | | | 20 | | |
Denbury Resources, Inc., | |
4.63%, 7/15/23 | | | 25 | | | | 14 | | |
DISH DBS Corp., | |
5.00%, 3/15/23 | | | 25 | | | | 21 | | |
Dollar Tree, Inc., | |
5.75%, 3/1/23 (b) | | | 25 | | | | 26 | | |
Embraer Netherlands Finance BV, | |
5.05%, 6/15/25 | | | 25 | | | | 23 | | |
Energy Transfer Partners LP, | |
2.50%, 6/15/18 | | | 75 | | | | 75 | | |
First Data Corp., | |
5.38%, 8/15/23 (b) | | | 25 | | | | 25 | | |
General Motors Financial Co., Inc., | |
4.30%, 7/13/25 | | | 50 | | | | 48 | | |
| | | Face
Amount
(000) | | Value
(000) | |
Glencore Funding LLC, | |
4.00%, 4/16/25 (b) | | $ | 25 | | | $ | 19 | | |
Global Partners LP/GLP Finance Corp., | |
7.00%, 6/15/23 (b) | | | 25 | | | | 23 | | |
Harland Clarke Holdings Corp., | |
9.75%, 8/1/18 (b) | | | 25 | | | | 26 | | |
HCA, Inc., | |
4.75%, 5/1/23 | | | 25 | | | | 25 | | |
Hilcorp Energy I LP/Hilcorp Finance Co., | |
5.75%, 10/1/25 (b) | | | 15 | | | | 13 | | |
HomeAway, Inc., | |
0.13%, 4/1/19 | | | 50 | | | | 46 | | |
Kinder Morgan, Inc., | |
5.55%, 6/1/45 | | | 25 | | | | 21 | | |
Lamar Media Corp., | |
5.00%, 5/1/23 | | | 25 | | | | 25 | | |
Lear Corp., | |
5.25%, 1/15/25 | | | 50 | | | | 49 | | |
Lundin Mining Corp., | |
7.50%, 11/1/20 (b) | | | 25 | | | | 24 | | |
Mallinckrodt International Finance SA/Mallinckrodt CB LLC, | |
5.50%, 4/15/25 (b) | | | 25 | | | | 22 | | |
MasTec, Inc., | |
4.88%, 3/15/23 | | | 25 | | | | 21 | | |
MGM Resorts International, | |
6.00%, 3/15/23 | | | 25 | | | | 24 | | |
Midcontinent Communications & Midcontinent Finance Corp., | |
6.25%, 8/1/21 (b) | | | 25 | | | | 25 | | |
Motorola Solutions, Inc., | |
4.00%, 9/1/24 | | | 25 | | | | 23 | | |
| MPLX LP, | |
4.00%, 2/15/25 | | | 25 | | | | 23 | | |
Netflix, Inc., | |
5.50%, 2/15/22 (b) | | | 25 | | | | 25 | | |
ON Semiconductor Corp., | |
2.63%, 12/15/26 | | | 50 | | | | 56 | | |
OPE KAG Finance Sub, Inc., | |
7.88%, 7/31/23 (b) | | | 25 | | | | 25 | | |
Outfront Media Capital LLC/Outfront Media Capital Corp., | |
5.25%, 2/15/22 | | | 25 | | | | 25 | | |
Pittsburgh Glass Works LLC, | |
8.00%, 11/15/18 (b) | | | 50 | | | | 52 | | |
QUALCOMM, Inc., | |
4.80%, 5/20/45 | | | 30 | | | | 26 | | |
QVC, Inc., | |
4.85%, 4/1/24 | | | 25 | | | | 24 | | |
RR Donnelley & Sons Co., | |
7.88%, 3/15/21 | | | 25 | | | | 26 | | |
RSI Home Products, Inc., | |
6.50%, 3/15/23 (b) | | | 25 | | | | 25 | | |
Seminole Hard Rock Entertainment, Inc./Seminole
Hard Rock International LLC, | |
5.88%, 5/15/21 (b) | | | 50 | | | | 49 | | |
The accompanying notes are an integral part of the financial statements.
8
Morgan Stanley Institutional Fund Trust
Annual Report — September 30, 2015
Portfolio of Investments (cont'd)
Strategic Income Portfolio
| | | Face
Amount
(000) | | Value
(000) | |
Industrials (cont'd) | |
SM Energy Co., | |
6.13%, 11/15/22 | | $ | 25 | | | $ | 23 | | |
Starwood Property Trust, Inc., | |
4.55%, 3/1/18 | | | 50 | | | | 51 | | |
Suburban Propane Partners LP/Suburban Energy Finance Corp., | |
5.75%, 3/1/25 | | | 25 | | | | 24 | | |
Telefonica Europe BV, | |
5.88%, 3/31/24 (a)(c) | | EUR | 100 | | | | 112 | | |
Tesla Motors, Inc., | |
0.25%, 3/1/19 | | $ | 50 | | | | 49 | | |
Toll Brothers Finance Corp., | |
0.50%, 9/15/32 | | | 50 | | | | 52 | | |
Tops Holding LLC/Tops Markets II Corp., | |
8.00%, 6/15/22 (b) | | | 25 | | | | 25 | | |
Transocean, Inc., | |
4.30%, 10/15/22 | | | 50 | | | | 31 | | |
United Rentals North America, Inc., | |
5.75%, 11/15/24 | | | 25 | | | | 24 | | |
Williams Partners LP/ACMP Finance Corp., | |
4.88%, 5/15/23 | | | 25 | | | | 23 | | |
Wynn Las Vegas LLC/Wynn Las Vegas Capital Corp., | |
5.38%, 3/15/22 | | | 25 | | | | 23 | | |
XPO Logistics, Inc., | |
7.88%, 9/1/19 (b) | | | 50 | | | | 49 | | |
Yahoo!, Inc., | |
0.00%, 12/1/18 | | | 50 | | | | 49 | | |
Yandex N.V., | |
1.13%, 12/15/18 | | | 50 | | | | 43 | | |
Zachry Holdings, Inc., | |
7.50%, 2/1/20 (b) | | | 25 | | | | 25 | | |
| | | | 2,151 | | |
Utility (0.7%) | |
AES Corp., | |
4.88%, 5/15/23 | | | 75 | | | | 66 | | |
| | | | 3,839 | | |
Mortgages — Other (10.6%) | |
Alternative Loan Trust, | |
2.63%, 3/25/35 (a) | | | 115 | | | | 105 | | |
PAC | |
0.64%, 10/25/36 (a) | | | 80 | | | | 56 | | |
Banc of America Alternative Loan Trust, | |
0.64%, 11/25/36 (a) | | | 70 | | | | 44 | | |
5.71%, 10/25/36 (a) | | | 85 | | | | 54 | | |
Bear Stearns Structured Products, Inc. Trust, | |
2.54%, 1/26/36 (a) | | | 44 | | | | 36 | | |
Bear Stearns Trust, | |
0.57%, 5/25/36 (a) | | | 75 | | | | 62 | | |
2.36%, 2/25/36 (a) | | | 67 | | | | 56 | | |
2.91%, 4/25/35 (a) | | | 62 | | | | 49 | | |
2.95%, 3/25/36 (a) | | | 118 | | | | 91 | | |
| | | Face
Amount
(000) | | Value
(000) | |
Citigroup Mortgage Loan Trust, | |
2.47%, 6/25/36 (a) | | $ | 50 | | | $ | 40 | | |
First Horizon Mortgage Pass-Through Trust, | |
6.25%, 11/25/36 | | | 29 | | | | 28 | | |
Grifonas Finance PLC, | |
0.32%, 8/28/39 (a) | | EUR | 54 | | | | 44 | | |
GSMSC Pass-Through Trust, | |
7.50%, 9/25/36 (a)(b) | | $ | 39 | | | | 32 | | |
HarborView Mortgage Loan Trust, | |
0.41%, 1/19/38 (a) | | | 36 | | | | 31 | | |
IndyMac INDX Mortgage Loan Trust, | |
2.55%, 12/25/34 (a) | | | 56 | | | | 53 | | |
JP Morgan Mortgage Trust, | |
2.58%, 6/25/37 (a) | | | 49 | | | | 45 | | |
Lehman Mortgage Trust, | |
6.00%, 7/25/36 - 6/25/37 | | | 162 | | | | 118 | | |
Luminent Mortgage Trust, | |
0.42%, 5/25/37 (a) | | | 69 | | | | 50 | | |
MASTR Alternative Loan Trust, | |
6.25%, 7/25/36 | | | 56 | | | | 49 | | |
| | | | 1,043 | | |
Sovereign (18.0%) | |
Australia Government Bond, | |
2.75%, 4/21/24 | | AUD | 150 | | | | 107 | | |
Hungary Government Bond, | |
5.50%, 6/24/25 | | HUF | 16,000 | | | | 67 | | |
6.00%, 11/24/23 | | | 22,000 | | | | 94 | | |
Hungary Government International Bond, | |
5.38%, 3/25/24 | | $ | 100 | | | | 109 | | |
Indonesia Government International Bond, | |
5.88%, 1/15/24 (b) | | | 200 | | | | 212 | | |
Italy Buoni Poliennali Del Tesoro, | |
2.35%, 9/15/24 (b) | | EUR | 140 | | | | 178 | | |
Mexican Bonos, | |
8.00%, 6/11/20 | | MXN | 1,150 | | | | 76 | | |
New Zealand Government Bond, | |
5.50%, 4/15/23 | | NZD | 200 | | | | 150 | | |
Poland Government Bond, | |
5.75%, 10/25/21 | | PLN | 300 | | | | 93 | | |
Portugal Government International Bond, | |
5.13%, 10/15/24 (b) | | $ | 50 | | | | 53 | | |
5.13%, 10/15/24 | | | 130 | | | | 138 | | |
Portugal Obrigacoes do Tesouro OT, | |
2.88%, 10/15/25 (b) | | EUR | 120 | | | | 140 | | |
4.45%, 6/15/18 (b) | | | 75 | | | | 93 | | |
Select Medical Corp., | |
6.38%, 6/1/21 | | $ | 50 | | | | 49 | | |
South Africa Government Bond, | |
7.25%, 1/15/20 | | ZAR | 1,500 | | | | 106 | | |
Spain Government Bond, | |
4.20%, 1/31/37 (b) | | EUR | 30 | | | | 41 | | |
The accompanying notes are an integral part of the financial statements.
9
Morgan Stanley Institutional Fund Trust
Annual Report — September 30, 2015
Portfolio of Investments (cont'd)
Strategic Income Portfolio
| | | Face
Amount
(000) | | Value
(000) | |
Sovereign (cont'd) | |
Spain Government Inflation Linked Bond, | |
1.80%, 11/30/24 (b) | | EUR | 50 | | | $ | 60 | | |
| | | | 1,766 | | |
U.S. Treasury Securities (6.8%) | |
U.S. Treasury Bond, | |
3.50%, 2/15/39 | | $ | 230 | | | | 259 | | |
U.S. Treasury Inflation Indexed Bond, | |
0.25%, 1/15/25 | | | 222 | | | | 213 | | |
U.S. Treasury Notes, | |
0.88%, 7/31/19 | | | 100 | | | | 99 | | |
1.75%, 5/15/23 | | | 100 | | | | 99 | | |
| | | | 670 | | |
Total Fixed Income Securities (Cost $9,663) | | | 9,431 | | |
| | | Shares | | | |
Short-Term Investment (0.7%) | |
Investment Company (0.7%) | |
Morgan Stanley Institutional Liquidity
Funds — Money Market Portfolio —
Institutional Class (See Note G)
(Cost $65) | | | 65,350 | | | | 65 | | |
Total Investments (96.9%) (Cost $9,728) (d)(e) | | | 9,496 | | |
Other Assets in Excess of Liabilities (3.1%) | | | 309 | | |
Net Assets (100.0%) | | $ | 9,805 | | |
(a) Variable/Floating Rate Security — Interest rate changes on these instruments are based on changes in a designated base rate. The rates shown are those in effect on September 30, 2015.
(b) 144A security — Certain conditions for public sale may exist. Unless otherwise noted, these securities are deemed to be liquid.
(c) Perpetual — One or more securities do not have a predetermined maturity date. Rates for these securities are fixed for a period of time, after which they revert to a floating rate. Interest rates in effect are as of September 30, 2015.
(d) Securities are available for collateral in connection with open foreign currency forward exchange contracts, futures contracts and swap agreements.
(e) At September 30, 2015, the aggregate cost for Federal income tax purposes is approximately $9,737,000. The aggregate gross unrealized appreciation is approximately $93,000 and the aggregate gross unrealized depreciation is approximately $334,000 resulting in net unrealized depreciation of approximately $241,000.
IO Interest Only.
PAC Planned Amortization Class.
Foreign Currency Forward Exchange Contracts:
The Portfolio had the following foreign currency forward exchange contracts open at September 30, 2015:
Counterparty | | Currency to
Deliver
(000) | | Value
(000) | | Settlement
Date | | In Exchange
For
(000) | | Value
(000) | | Unrealized
Appreciation
(Depreciation)
(000) | |
JPMorgan Chase Bank NA | | CAD | 124 | | | $ | 93 | | | 10/5/15 | | USD | 94 | | | $ | 94 | | | $ | 1 | | |
JPMorgan Chase Bank NA | | CAD | 65 | | | | 49 | | | 10/5/15 | | USD | 49 | | | | 49 | | | | (— | @) | |
JPMorgan Chase Bank NA | | EUR | 1,491 | | | | 1,667 | | | 10/5/15 | | USD | 1,685 | | | | 1,685 | | | | 18 | | |
JPMorgan Chase Bank NA | | GBP | 38 | | | | 57 | | | 10/5/15 | | EUR | 51 | | | | 57 | | | | — | @ | |
JPMorgan Chase Bank NA | | HUF | 44,838 | | | | 160 | | | 10/5/15 | | USD | 161 | | | | 161 | | | | 1 | | |
JPMorgan Chase Bank NA | | MXN | 1,269 | | | | 75 | | | 10/5/15 | | USD | 75 | | | | 75 | | | | (— | @) | |
JPMorgan Chase Bank NA | | NOK | 404 | | | | 48 | | | 10/5/15 | | USD | 49 | | | | 49 | | | | 1 | | |
JPMorgan Chase Bank NA | | NZD | 310 | | | | 198 | | | 10/5/15 | | USD | 196 | | | | 196 | | | | (2 | ) | |
JPMorgan Chase Bank NA | | PLN | 366 | | | | 96 | | | 10/5/15 | | USD | 97 | | | | 97 | | | | 1 | | |
JPMorgan Chase Bank NA | | SEK | 424 | | | | 50 | | | 10/5/15 | | USD | 50 | | | | 50 | | | | (— | @) | |
JPMorgan Chase Bank NA | | USD | 2 | | | | 2 | | | 10/5/15 | | EUR | 2 | | | | 2 | | | | — | @ | |
JPMorgan Chase Bank NA | | USD | 49 | | | | 49 | | | 10/5/15 | | NOK | 417 | | | | 49 | | | | — | @ | |
JPMorgan Chase Bank NA | | ZAR | 1,521 | | | | 110 | | | 10/5/15 | | USD | 113 | | | | 113 | | | | 3 | | |
UBS AG | | USD | 146 | | | | 146 | | | 10/5/15 | | GBP | 96 | | | | 145 | | | | (1 | ) | |
JPMorgan Chase Bank NA | | AUD | 153 | | | | 107 | | | 10/6/15 | | USD | 107 | | | | 107 | | | | — | @ | |
| | | | | $ | 2,907 | | | | | | | $ | 2,929 | | | $ | 22 | | |
The accompanying notes are an integral part of the financial statements.
10
Morgan Stanley Institutional Fund Trust
Annual Report — September 30, 2015
Portfolio of Investments (cont'd)
Strategic Income Portfolio
Futures Contracts:
The Portfolio had the following futures contracts open at September 30, 2015:
| | | Number
of
Contracts | | Value
(000) | | Expiration
Date | | Unrealized
Depreciation
(000) | |
Short: | |
German Euro BOBL (Germany) | | | 5 | | | $ | (721 | ) | | Dec-15 | | $ | (5 | ) | |
German Euro BTP (Germany) | | | 1 | | | | (152 | ) | | Dec-15 | | | (4 | ) | |
German Euro Bund (Germany) | | | 4 | | | | (698 | ) | | Dec-15 | | | (13 | ) | |
U.S. Treasury 10 yr. Note (United States) | | | 23 | | | | (2,961 | ) | | Dec-15 | | | (32 | ) | |
U.S. Treasury 2 yr. Note (United States) | | | 1 | | | | (219 | ) | | Dec-15 | | | (— | @) | |
U.S. Treasury 5 yr. Note (United States) | | | 14 | | | | (1,687 | ) | | Dec-15 | | | (9 | ) | |
U.S. Treasury Long Bond (United States) | | | 1 | | | | (157 | ) | | Dec-15 | | | (3 | ) | |
U.S. Treasury Ultra Long Bond (United States) | | | 1 | | | | (161 | ) | | Dec-15 | | | (2 | ) | |
| | | | | | | | | $ | (68 | ) | |
Credit Default Swap Agreements:
The Portfolio had the following credit default swap agreements open at September 30, 2015:
Swap Counterparty and
Reference Obligation | | Buy/Sell
Protection | | Notional
Amount
(000) | | Pay/Receive
Fixed Rate | | Termination
Date | | Upfront
Payment
Paid
(Received)
(000) | | Unrealized
Depreciation
(000) | | Value
(000) | | Credit
Rating of
Reference
Obligation†
(Unaudited) | |
Deutsche Bank AG
CMBX.NA.BB.60 | | Sell | | $ | 28 | | | | 5.00 | % | | 5/11/63 | | $ | — | @ | | $ | (1 | ) | | $ | (1 | ) | | NR | |
Goldman Sachs International
CMBX.NA.BB.60 | | Sell | | | 20 | | | | 5.00 | | | 5/11/63 | | | (— | @) | | | (1 | ) | | | (1 | ) | | NR | |
| | | | | $ | 48 | | | | | | | $ | — | @ | | $ | (2 | ) | | $ | (2 | ) | | | |
@ Value is less than $500.
† Credit rating as issued by Standard & Poor's.
NR Not rated.
AUD — Australian Dollar
CAD — Canadian Dollar
EUR — Euro
GBP — British Pound
HUF — Hungarian Forint
MXN — Mexican Peso
NOK — Norwegian Krone
NZD — New Zealand Dollar
PLN — Polish Zloty
SEK — Swedish Krona
USD — United States Dollar
ZAR — South African Rand
Portfolio Composition
Classification | | Percentage of
Total Investments | |
Industrials | | | 22.6 | % | |
Sovereign | | | 18.6 | | |
Finance | | | 17.1 | | |
Asset-Backed Securities | | | 16.7 | | |
Mortgages — Other | | | 11.0 | | |
U.S. Treasury Securities | | | 7.1 | | |
Commercial Mortgage-Backed Securities | | | 5.3 | | |
Other* | | | 1.6 | | |
Total Investments | | | 100.0 | %** | |
* Industries and/or investment types representing less than 5% of total investments.
** Does not include open short futures contracts with an underlying face amount of approximately $6,756,000 with total unrealized depreciation of approximately $68,000. Does not include open foreign currency forward exchange contracts with net unrealized appreciation of approximately $22,000 and does not include open swap agreements with total unrealized depreciation of approximately $2,000.
The accompanying notes are an integral part of the financial statements.
11
Morgan Stanley Institutional Fund Trust
Annual Report — September 30, 2015
Strategic Income Portfolio
Statement of Assets and Liabilities | | September 30, 2015
(000) | |
Assets: | |
Investments in Securities of Unaffiliated Issuers, at Value (Cost $9,663) | | $ | 9,431 | | |
Investment in Security of Affiliated Issuer, at Value (Cost $65) | | | 65 | | |
Total Investments in Securities, at Value (Cost $9,728) | | | 9,496 | | |
Foreign Currency, at Value (Cost $—@) | | | — | @ | |
Receivable for Investments Sold | | | 108 | | |
Interest Receivable | | | 97 | | |
Due from Adviser | | | 90 | | |
Receivable for Variation Margin on Futures Contracts | | | 74 | | |
Prepaid Offering Costs | | | 42 | | |
Unrealized Appreciation on Foreign Currency Forward Exchange Contracts | | | 25 | | |
Tax Reclaim Receivable | | | 3 | | |
Premium Paid on Open Swap Agreements | | | — | @ | |
Receivable from Affiliate | | | — | @ | |
Other Assets | | | 18 | | |
Total Assets | | | 9,953 | | |
Liabilities: | |
Payable for Investments Purchased | | | 107 | | |
Payable for Professional Fees | | | 16 | | |
Payable for Custodian Fees | | | 7 | | |
Payable for Transfer Agency Fees — Class I | | | 1 | | |
Payable for Transfer Agency Fees — Class A | | | 1 | | |
Payable for Transfer Agency Fees — Class C | | | — | @ | |
Payable for Transfer Agency Fees — Class IS | | | 1 | | |
Unrealized Depreciation on Foreign Currency Forward Exchange Contracts | | | 3 | | |
Unrealized Depreciation on Swap Agreements | | | 2 | | |
Payable for Administration Fees | | | 1 | | |
Payable for Shareholder Services Fees — Class A | | | — | @ | |
Payable for Distribution and Shareholder Services Fees — Class C | | | — | @ | |
Premium Received on Open Swap Agreements | | | — | @ | |
Other Liabilities | | | 9 | | |
Total Liabilities | | | 148 | | |
Net Assets | | $ | 9,805 | | |
Net Assets Consist Of: | |
Paid-in-Capital | | $ | 10,005 | | |
Accumulated Undistributed Net Investment Income | | | 167 | | |
Accumulated Net Realized Loss | | | (86 | ) | |
Unrealized Appreciation (Depreciation) on: | |
Investments | | | (232 | ) | |
Futures Contracts | | | (68 | ) | |
Swap Agreements | | | (2 | ) | |
Foreign Currency Forward Exchange Contracts | | | 22 | | |
Foreign Currency Translations | | | (1 | ) | |
Net Assets | | $ | 9,805 | | |
The accompanying notes are an integral part of the financial statements.
12
Morgan Stanley Institutional Fund Trust
Annual Report — September 30, 2015
Strategic Income Portfolio
Statement of Assets and Liabilities (cont'd) | | September 30, 2015
(000) | |
CLASS I: | |
Net Assets | | $ | 10 | | |
| Shares Outstanding (unlimited number of shares authorized, no par value) (not in 000's) | | | 1,000 | | |
Net Asset Value, Offering and Redemption Price Per Share | | $ | 9.79 | | |
CLASS A: | |
Net Assets | | $ | 10 | | |
| Shares Outstanding (unlimited number of shares authorized, no par value) (not in 000's) | | | 1,000 | | |
Net Asset Value, Redemption Price Per Share | | $ | 9.79 | | |
Maximum Sales Load | | | 4.25 | % | |
Maximum Sales Charge | | $ | 0.43 | | |
Maximum Offering Price Per Share | | $ | 10.22 | | |
CLASS C: | |
Net Assets | | $ | 10 | | |
| Shares Outstanding (unlimited number of shares authorized, no par value) (not in 000's) | | | 994 | | |
Net Asset Value, Offering and Redemption Price Per Share | | $ | 9.76 | | |
CLASS IS: | |
Net Assets | | $ | 9,775 | | |
| Shares Outstanding (unlimited number of shares authorized, no par value) (not in 000's) | | | 998,000 | | |
Net Asset Value, Offering and Redemption Price Per Share | | $ | 9.79 | | |
@ Amount is less than $500.
The accompanying notes are an integral part of the financial statements.
13
Morgan Stanley Institutional Fund Trust
Annual Report — September 30, 2015
Strategic Income Portfolio
Statement of Operations | | Period from
December 30, 2014^
September 30, 2015
(000) | |
Investment Income: | |
Interest from Securities of Unaffiliated Issuers | | $ | 208 | | |
Dividends from Security of Affiliated Issuer (Note G) | | | 2 | | |
Total Investment Income | | | 210 | | |
Expenses: | |
Offering Costs | | | 101 | | |
Professional Fees | | | 99 | | |
Advisory Fees (Note B) | | | 30 | | |
Custodian Fees (Note F) | | | 30 | | |
Shareholder Reporting Fees | | | 14 | | |
Pricing Fees | | | 7 | | |
Administration Fees (Note C) | | | 6 | | |
Registration Fees | | | 6 | | |
Transfer Agency Fees — Class I (Note E) | | | 1 | | |
Transfer Agency Fees — Class A (Note E) | | | 1 | | |
Transfer Agency Fees — Class C (Note E) | | | 1 | | |
Transfer Agency Fees — Class IS (Note E) | | | 1 | | |
Shareholder Services Fees — Class A (Note D) | | | — | @ | |
Distribution and Shareholder Services Fees — Class C (Note D) | | | — | @ | |
Trustees' Fees and Expenses | | | — | @ | |
Other Expenses | | | 10 | | |
Total Expenses | | | 307 | | |
Expenses Reimbursed by Adviser (Note B) | | | (202 | ) | |
Waiver of Advisory Fees (Note B) | | | (30 | ) | |
Reimbursement of Class Specific Expenses — Class I (Note B) | | | (1 | ) | |
Reimbursement of Class Specific Expenses — Class A (Note B) | | | (1 | ) | |
Reimbursement of Class Specific Expenses — Class C (Note B) | | | (1 | ) | |
Reimbursement of Class Specific Expenses — Class IS (Note B) | | | (1 | ) | |
Rebate from Morgan Stanley Affiliate (Note G) | | | (1 | ) | |
Net Expenses | | | 70 | | |
Net Investment Income | | | 140 | | |
Realized Gain (Loss): | |
Investments Sold | | | (107 | ) | |
Futures Contracts | | | (31 | ) | |
Swap Agreements | | | — | @ | |
Foreign Currency Forward Exchange Contracts | | | 157 | | |
Foreign Currency Transactions | | | (8 | ) | |
Net Realized Gain | | | 11 | | |
Change in Unrealized Appreciation (Depreciation): | |
Investments | | | (232 | ) | |
Futures Contracts | | | (68 | ) | |
Swap Agreements | | | (2 | ) | |
Foreign Currency Forward Exchange Contracts | | | 22 | | |
Foreign Currency Translations | | | (1 | ) | |
Net Change in Unrealized Appreciation (Depreciation) | | | (281 | ) | |
Net Realized Gain and Change in Unrealized Appreciation (Depreciation) | | | (270 | ) | |
Net Decrease in Net Assets Resulting from Operations | | $ | (130 | ) | |
^ Commencement of Operations.
@ Amount is less than $500.
The accompanying notes are an integral part of the financial statements.
14
Morgan Stanley Institutional Fund Trust
Annual Report — September 30, 2015
Strategic Income Portfolio
Statement of Changes in Net Assets | | Period from
December 30, 2014^
September 30, 2015
(000) | |
Increase (Decrease) in Net Assets: | |
Operations: | |
Net Investment Income | | $ | 140 | | |
Net Realized Gain | | | 11 | | |
Net Change in Unrealized Appreciation (Depreciation) | | | (281 | ) | |
Net Decrease in Net Assets Resulting from Operations | | | (130 | ) | |
Distributions from and/or in Excess of: | |
Class I: | |
Net Investment Income | | | (— | @) | |
Class A: | |
Net Investment Income | | | (— | @) | |
Class C: | |
Net Investment Income | | | (— | @)* | |
Class IS: | |
Net Investment Income | | | (75 | ) | |
Total Distributions | | | (75 | ) | |
Capital Share Transactions:(1) | |
Class I: | |
Subscribed | | | 10 | | |
Class A: | |
Subscribed | | | 10 | | |
Class C: | |
Subscribed | | | 10 | * | |
Class IS: | |
Subscribed | | | 9,980 | | |
Net Increase in Net Assets Resulting from Capital Share Transactions | | | 10,010 | | |
Total Increase in Net Assets | | | 9,805 | | |
Net Assets: | |
Beginning of Period | | | — | | |
End of Period (Including Accumulated Undistributed Net Investment Income of $167) | | $ | 9,805 | | |
(1) Capital Share Transactions: | |
Class I: | |
Shares Subscribed | | | 1 | | |
Class A: | |
Shares Subscribed | | | 1 | | |
Class C: | |
Shares Subscribed | | | 1 | * | |
Class IS: | |
Shares Subscribed | | | 998 | | |
^ Commencement of Operations.
* For the period April 30, 2015 through September 30, 2015.
@ Amount is less than $500.
The accompanying notes are an integral part of the financial statements.
15
Morgan Stanley Institutional Fund Trust
Annual Report — September 30, 2015
Financial Highlights
Strategic Income Portfolio
| | | Class I | |
Selected Per Share Data and Ratios | | Period from
December 30, 2014^ to
September 30, 2015 | |
Net Asset Value, Beginning of Period | | $ | 10.00 | | |
Income (Loss) from Investment Operations: | |
Net Investment Income† | | | 0.14 | | |
Net Realized and Unrealized Loss | | | (0.28 | ) | |
Total from Investment Operations | | | (0.14 | ) | |
Distributions from and/or in Excess of: | |
Net Investment Income | | | (0.07 | ) | |
Net Asset Value, End of Period | | $ | 9.79 | | |
Total Return++ | | | (1.39 | )%# | |
Ratios and Supplemental Data: | |
Net Assets, End of Period (Thousands) | | $ | 10 | | |
Ratio of Expenses to Average Net Assets (1) | | | 0.98 | %+* | |
Ratio of Net Investment Income to Average Net Assets (1) | | | 1.81 | %+* | |
Ratio of Rebate from Morgan Stanley Affiliates to Average Net Assets | | | 0.02 | % | |
Portfolio Turnover Rate | | | 39 | %# | |
(1) Supplemental Information on the Ratios to Average Net Assets: | |
Ratios Before Expense Limitation: | |
Expenses to Average Net Assets | | | 17.80 | %* | |
Net Investment Loss to Average Net Assets | | | (15.01 | )%* | |
^ Commencement of Operations.
† Per share amount is based on average shares outstanding.
++ Calculated based on the net asset value as of the last business day of the period.
+ The Ratios of Expenses and Net Investment Income reflect the rebate of certain Portfolio expenses in connection with the investments in Morgan Stanley affiliates during the period. The effect of the rebate on the ratios is disclosed in the above table as "Ratio of Rebate from Morgan Stanley Affiliates to Average Net Assets."
# Not Annualized.
* Annualized.
The accompanying notes are an integral part of the financial statements.
16
Morgan Stanley Institutional Fund Trust
Annual Report — September 30, 2015
Financial Highlights
Strategic Income Portfolio
| | | Class A | |
Selected Per Share Data and Ratios | | Period from
December 30, 2014^ to
September 30, 2015 | |
Net Asset Value, Beginning of Period | | $ | 10.00 | | |
Income (Loss) from Investment Operations: | |
Net Investment Income† | | | 0.11 | | |
Net Realized and Unrealized Loss | | | (0.27 | ) | |
Total from Investment Operations | | | (0.16 | ) | |
Distributions from and/or in Excess of: | |
Net Investment Income | | | (0.05 | ) | |
Net Asset Value, End of Period | | $ | 9.79 | | |
Total Return++ | | | (1.56 | )%# | |
Ratios and Supplemental Data: | |
Net Assets, End of Period (Thousands) | | $ | 10 | | |
Ratio of Expenses to Average Net Assets (1) | | | 1.33 | %+* | |
Ratio of Net Investment Income to Average Net Assets (1) | | | 1.46 | %+* | |
Ratio of Rebate from Morgan Stanley Affiliates to Average Net Assets | | | 0.02 | % | |
Portfolio Turnover Rate | | | 39 | %# | |
(1) Supplemental Information on the Ratios to Average Net Assets: | |
Ratios Before Expense Limitation: | |
Expenses to Average Net Assets | | | 18.06 | %* | |
Net Investment Loss to Average Net Assets | | | (15.27 | )%* | |
^ Commencement of Operations.
† Per share amount is based on average shares outstanding.
++ Calculated based on the net asset value which does not reflect sales charges, if applicable, as of the last business day of the period.
+ The Ratios of Expenses and Net Investment Income reflect the rebate of certain Portfolio expenses in connection with the investments in Morgan Stanley affiliates during the period. The effect of the rebate on the ratios is disclosed in the above table as "Ratio of Rebate from Morgan Stanley Affiliates to Average Net Assets."
# Not Annualized.
* Annualized.
The accompanying notes are an integral part of the financial statements.
17
Morgan Stanley Institutional Fund Trust
Annual Report — September 30, 2015
Financial Highlights
Strategic Income Portfolio
| | | Class C | |
Selected Per Share Data and Ratios | | Period from
April 30, 2015^ to
September 30, 2015 | |
Net Asset Value, Beginning of Period | | $ | 10.06 | | |
Income (Loss) from Investment Operations: | |
Net Investment Income† | | | 0.05 | | |
Net Realized and Unrealized Loss | | | (0.32 | ) | |
Total from Investment Operations | | | (0.27 | ) | |
Distributions from and/or in Excess of: | |
Net Investment Income | | | (0.03 | ) | |
Net Asset Value, End of Period | | $ | 9.76 | | |
Total Return++ | | | (2.71 | )%# | |
Ratios and Supplemental Data: | |
Net Assets, End of Period, (Thousands) | | $ | 10 | | |
Ratio of Expenses to Average Net Assets (1) | | | 2.10 | %+* | |
Ratio of Net Investment Income to Average Net Assets (1) | | | 1.13 | %+* | |
Ratio of Rebate from Morgan Stanley Affiliates to Average Net Assets | | | 0.00 | %§* | |
Portfolio Turnover Rate | | | 39 | %# | |
(1) Supplemental Information on the Ratios to Average Net Assets: | |
Ratios Before Expense Limitation: | |
Expense to Average Net Assets | | | 19.28 | %* | |
Net Investment Loss to Average Net Assets | | | (16.05 | )%* | |
^ Commencement of Operations.
† Per share amount is based on average shares outstanding.
++ Calculated based on the net asset value which does not reflect sales charges, if applicable, as of the last business day of the period.
+ The Ratios of Expenses and Net Investment Income reflect the rebate of certain Portfolio expenses in connection with the investments in Morgan Stanley affiliates during the period. The effect of the rebate on the ratios is disclosed in the above table as "Ratio of Rebate from Morgan Stanley Affiliates to Average Net Assets."
§ Amount is less than 0.005%.
# Not Annualized.
* Annualized.
The accompanying notes are an integral part of the financial statements.
18
Morgan Stanley Institutional Fund Trust
Annual Report — September 30, 2015
Financial Highlights
Strategic Income Portfolio
| | | Class IS | |
Selected Per Share Data and Ratios | | Period from
December 30, 2014^ to
September 30, 2015 | |
Net Asset Value, Beginning of Period | | $ | 10.00 | | |
Income (Loss) from Investment Operations: | |
Net Investment Income† | | | 0.14 | | |
Net Realized and Unrealized Loss | | | (0.27 | ) | |
Total from Investment Operations | | | (0.13 | ) | |
Distributions from and/or in Excess of: | |
Net Investment Income | | | (0.08 | ) | |
Net Asset Value, End of Period | | $ | 9.79 | | |
Total Return++ | | | (1.37 | )%# | |
Ratios and Supplemental Data: | |
Net Assets, End of Period, in (Thousands) | | $ | 9,775 | | |
Ratio of Expenses to Average Net Assets (1) | | | 0.93 | %+* | |
Ratio of Net Investment Income to Average Net Assets (1) | | | 1.88 | %+* | |
Ratio of Rebate from Morgan Stanley Affiliates to Average Net Assets | | | 0.02 | %* | |
Portfolio Turnover Rate | | | 39 | %# | |
(1) Supplemental Information on the Ratios to Average Net Assets: | |
Ratios Before Expense Limitation: | |
Expenses to Average Net Assets | | | 4.04 | %* | |
Net Investment Loss to Average Net Assets | | | (1.23 | )%* | |
^ Commencement of Operations.
† Per share amount is based on average shares outstanding.
++ Calculated based on the net asset value as of the last business day of the period.
+ The Ratios of Expenses and Net Investment Income reflect the rebate of certain Portfolio expenses in connection with the investments in Morgan Stanley affiliates during the period. The effect of the rebate on the ratios is disclosed in the above table as "Ratio of Rebate from Morgan Stanley Affiliates to Average Net Assets."
# Not Annualized.
* Annualized.
The accompanying notes are an integral part of the financial statements.
19
Morgan Stanley Institutional Fund Trust
Annual Report — September 30, 2015
Notes to Financial Statements
Morgan Stanley Institutional Fund Trust ("MSIFT'' or the ''Fund'') is registered under the Investment Company Act of 1940, as amended (the "Act''), as an open-end management investment company. The Fund is comprised of nine separate, active portfolios (individually referred to as a "Portfolio", collectively as the "Portfolios"). The Fund applies investment company accounting and reporting guidance. All Portfolios are considered diversified for purposes of the Act.
The accompanying financial statements relate to the Strategic Income Portfolio. The Portfolio's adviser, Morgan Stanley Investment Management Inc. (the "Adviser") and sub-adviser, Morgan Stanley Investment Management Limited ("MSIM Limited") (the "Sub-Adviser"), seek a total return comprised of income and capital appreciation. The Portfolio commenced operations on December 30, 2014 and offers four classes of shares — Class I, Class A, Class C and Class IS.
On April 30, 2015, the Portfolio commenced offering Class C shares.
A. Significant Accounting Policies: The following significant accounting policies are in conformity with U.S. generally accepted accounting principles ("GAAP"). Such policies are consistently followed by the Fund in the preparation of its financial statements. GAAP may require management to make estimates and assumptions that affect the reported amounts and disclosures in the financial statements. Actual results may differ from those estimates.
1. Security Valuation: (1) Certain portfolio securities may be valued by an outside pricing service approved by the Fund's Board of Trustees (the "Trustees"). The pricing service may utilize a matrix system or other model incorporating attributes such as security quality, maturity and coupon as the evaluation model parameters, and/or research evaluations by its staff, including review of broker-dealer market price quotations in determining what it believes is the fair valuation of the portfolios securities valued by such pricing service; (2) futures are valued at the latest price published by the commodities exchange on which they trade; (3) swaps are marked-to-market daily based upon quotations from market makers; (4) when market quotations are not readily available, including circumstances under which the Adviser or Sub-Adviser determines that the closing price, last sale price or the mean between the last reported bid and asked prices are not reflective of a security's market value, portfolio securities are valued at their fair value as determined in good faith under
procedures established by and under the general supervision of the Trustees. Occasionally, developments affecting the closing prices of securities and other assets may occur between the times at which valuations of such securities are determined (that is, close of the foreign market on which the securities trade) and the close of business of the New York Stock Exchange ("NYSE"). If developments occur during such periods that are expected to materially affect the value of such securities, such valuations may be adjusted to reflect the estimated fair value of such securities as of the close of the NYSE, as determined in good faith by the Trustees or by the Adviser using a pricing service and/or procedures approved by the Trustees; (5) quotations of foreign portfolio securities, other assets and liabilities and forward contracts stated in foreign currency are translated into U.S. dollar equivalents at the prevailing market rates prior to the close of the NYSE; (6) investments in mutual funds, including the Morgan Stanley Institutional Liquidity Funds, are valued at the net asset value ("NAV") as of the close of each business day; and (7) short-term debt securities with remaining maturities of 60 days or less at the time of purchase may be valued at amortized cost, unless the Adviser determines such valuation does not reflect the securities' market value, in which case these securities will be valued at their fair market value determined by the Adviser.
The Trustees have responsibility for determining in good faith the fair value of the investments, and the Trustees may appoint others, such as the Fund's Adviser or a valuation committee, to assist the Trustees in determining fair value and to make the actual calculations pursuant to the fair valuation methodologies previously approved by the Trustees. Under procedures approved by the Trustees, the Fund's Adviser has formed a Valuation Committee whose members are approved by the Trustees. The Valuation Committee provides administration and oversight of the Fund's valuation policies and procedures, which are reviewed at least annually by the Trustees. These procedures allow the Fund to utilize independent pricing services, quotations from securities and financial instrument dealers, and other market sources to determine fair value.
The Fund has procedures to determine the fair value of securities and other financial instruments for which market prices are not readily available. Under these procedures, the Valuation Committee convenes on a regular and ad hoc basis to review such securities and considers
20
Morgan Stanley Institutional Fund Trust
Annual Report — September 30, 2015
Notes to Financial Statements (cont'd)
a number of factors, including valuation methodologies and significant unobservable valuation inputs, when arriving at fair value. The Valuation Committee may employ a market-based approach which may use related or comparable assets or liabilities, recent transactions, market multiples, book values, and other relevant information for the investment to determine the fair value of the investment. An income-based valuation approach may also be used in which the anticipated future cash flows of the investment are discounted to calculate fair value. Discounts may also be applied due to the nature or duration of any restrictions on the disposition of the investments. Due to the inherent uncertainty of valuations of such investments, the fair values may differ significantly from the values that would have been used had an active market existed. The Valuation Committee employs various methods for calibrating these valuation approaches including a regular review of valuation methodologies, key inputs and assumptions, transactional back-testing or disposition analysis, and reviews of any related market activity.
2. Fair Value Measurement: Financial Accounting Standards Board ("FASB") Accounting Standards CodificationTM ("ASC") 820, "Fair Value Measurement" ("ASC 820"), defines fair value as the value that the Fund would receive to sell an investment or pay to transfer a liability in a timely transaction with an independent buyer in the principal market, or in the absence of a principal market the most advantageous market for the investment or liability. ASC 820 establishes a three-tier hierarchy to distinguish between (1) inputs that reflect the assumptions market participants would use in valuing an asset or liability developed based on market data obtained from sources independent of the reporting entity (observable inputs) and (2) inputs that reflect the reporting entity's own assumptions about the assumptions market participants would use in valuing an asset or liability developed based on the best information available in the circumstances (unobservable inputs) and to establish classification of fair value measurements for disclosure purposes. Various inputs are used in determining the value of the Fund's investments. The inputs are summarized in the three broad levels listed below.
• Level 1 – unadjusted quoted prices in active markets for identical investments
• Level 2 – other significant observable inputs (including quoted prices for similar investments, interest rates, prepayment speeds, credit risk, etc.)
• Level 3 – significant unobservable inputs including the Fund's own assumptions in determining the fair value of investments. Factors considered in making this determination may include, but are not limited to, information obtained by contacting the issuer, analysts, or the appropriate stock exchange (for exchange-traded securities), analysis of the issuer's financial statements or other available documents and, if necessary, available information concerning other securities in similar circumstances
The inputs or methodology used for valuing securities are not necessarily an indication of the risk associated with investing in those securities and the determination of the significance of a particular input to the fair value measurement in its entirety requires judgment and considers factors specific to each security.
The following is a summary of the inputs used to value the Portfolio's investments as of September 30, 2015.
Investment Type | | Level 1
Unadjusted
quoted
prices
(000) | | Level 2
Other
significant
observable
inputs
(000) | | Level 3
Significant
unobservable
inputs
(000) | | Total
(000) | |
Assets: | |
Fixed Income Securities | |
Asset-Backed Securities | | $ | — | | | $ | 1,588 | | | $ | — | | | $ | 1,588 | | |
Collateralized Mortgage
Obligation — Agency
Collateral Series | | | — | | | | 20 | | | | — | | | | 20 | | |
Commercial
Mortgage-Backed
Securities | | | — | | | | 505 | | | | — | | | | 505 | | |
Corporate Bonds | | | — | | | | 3,839 | | | | — | | | | 3,839 | | |
Mortgages — Other | | | — | | | | 1,043 | | | | — | | | | 1,043 | | |
Sovereign | | | — | | | | 1,766 | | | | — | | | | 1,766 | | |
U.S. Treasury Securities | | | — | | | | 670 | | | | — | | | | 670 | | |
Total Fixed Income
Securities | | | — | | | | 9,431 | | | | — | | | | 9,431 | | |
Short-Term Investment | |
Investment Company | | | 65 | | | | — | | | | — | | | | 65 | | |
Foreign Currency Forward
Exchange Contracts | | | — | | | | 25 | | | | — | | | | 25 | | |
Total Assets | | | 65 | | | | 9,456 | | | | — | | | | 9,521 | | |
Liabilities: | |
Foreign Currency Forward
Exchange Contracts | | | — | | | | (3 | ) | | | — | | | | (3 | ) | |
Futures Contracts | | | (68 | ) | | | — | | | | — | | | | (68 | ) | |
Credit Default Swap
Agreements | | | — | | | | (2 | ) | | | — | | | | (2 | ) | |
Total Liabilities | | | (68 | ) | | | (5 | ) | | | — | | | | (73 | ) | |
Total | | $ | (3 | ) | | $ | 9,451 | | | $ | — | | | $ | 9,448 | | |
21
Morgan Stanley Institutional Fund Trust
Annual Report — September 30, 2015
Notes to Financial Statements (cont'd)
Transfers between investment levels may occur as the markets fluctuate and/or the availability of data used in an investment's valuation changes. The Portfolio recognizes transfers between the levels as of the end of the period. As of September 30, 2015, the Portfolio did not have any investments transfer between investment levels.
3. Foreign Currency Translation and Foreign Investments: The books and records of the Portfolio are maintained in U.S. dollars. Foreign currency amounts are translated into U.S. dollars as follows:
– investments, other assets and liabilities at the prevailing rate of exchange on the valuation date;
– investment transactions and investment income at the prevailing rates of exchange on the dates of such transactions.
Although the net assets of the Portfolio are presented at the foreign exchange rates and market values at the close of the period, the Portfolio does not isolate that portion of the results of operations arising as a result of changes in the foreign exchange rates from the fluctuations arising from changes in the market prices of securities held at period end. Similarly, the Portfolio does not isolate the effect of changes in foreign exchange rates from the fluctuations arising from changes in the market prices of securities sold during the period. Accordingly, realized and unrealized foreign currency gains (losses) on investments in securities are included in the reported net realized and unrealized gains (losses) on investment transactions and balances. However, pursuant to U.S. Federal income tax regulations, gains and losses from certain foreign currency transactions and the foreign currency portion of gains and losses realized on sales and maturities of foreign denominated debt securities are treated as ordinary income for U.S. Federal income tax purposes.
Net realized gains (losses) on foreign currency transactions represent net foreign exchange gains (losses) from currency gains (losses) realized between the trade and settlement dates on securities transactions, and the difference between the amount of investment income and foreign withholding taxes recorded on the Portfolio's books and the U.S. dollar equivalent amounts actually received or paid. Net unrealized currency gains (losses) from valuing foreign currency denominated assets and liabilities at period end exchange rates are reflected as a
component of unrealized appreciation (depreciation) in the Statement of Assets and Liabilities. The change in unrealized currency gains (losses) on foreign currency translations on foreign currency translations for the period is reflected in the Statement of Operations.
Foreign security and currency transactions may involve certain considerations and risks not typically associated with those of U.S. dollar denominated transactions as a result of, among other factors, fluctuations of exchange rates in relation to the U.S. dollar, the possibility of lower levels of governmental supervision and regulation of foreign securities markets and the possibility of political or economic instability.
Governmental approval for foreign investments may be required in advance of making an investment under certain circumstances in some countries, and the extent of foreign investments in domestic companies may be subject to limitation in other countries. Foreign ownership limitations also may be imposed by the charters of individual companies to prevent, among other concerns, violations of foreign investment limitations. As a result, an additional class of shares (identified as "Foreign" in the Portfolio of Investments) may be created and offered for investment. The "local" and "foreign shares" market values may differ. In the absence of trading of the foreign shares in such markets, the Portfolio values the foreign shares at the closing exchange price of the local shares.
4. Derivatives: The Portfolio may, but is not required to, use derivative instruments for a variety of purposes, including hedging, risk management, portfolio management or to earn income. Derivatives are financial instruments whose value is based, in part, on the value of an underlying asset, interest rate, index or financial instrument. Prevailing interest rates and volatility levels, among other things, also affect the value of derivative instruments. A derivative instrument often has risks similar to its underlying asset and may have additional risks, including imperfect correlation between the value of the derivative and the underlying asset, risks of default by the counterparty to certain transactions, magnification of losses incurred due to changes in the market value of the securities, instruments, indices or interest rates to which the derivative instrument relates, risks that the transactions may not be liquid and risks arising from margin requirements. The use of derivatives involves risks that are different from, and
22
Morgan Stanley Institutional Fund Trust
Annual Report — September 30, 2015
Notes to Financial Statements (cont'd)
possibly greater than, the risks associated with other portfolio investments. Derivatives may involve the use of highly specialized instruments that require investment techniques and risk analyses different from those associated with other portfolio investments. All of the Portfolio's holdings, including derivative instruments, are marked-to-market each day with the change in value reflected in unrealized appreciation (depreciation). Upon disposition, a realized gain or loss is recognized.
Certain derivative transactions may give rise to a form of leverage. Leverage magnifies the potential for gain and the risk of loss. Leverage associated with derivative transactions may cause the Portfolio to liquidate portfolio positions when it may not be advantageous to do so to satisfy its obligations or to meet earmarking or segregation requirements, pursuant to applicable Securities and Exchange Commission rules and regulations, or may cause the Portfolio to be more volatile than if the Portfolio had not been leveraged. Although the Adviser and/or Sub-Adviser seek to use derivatives to further the Portfolio's investment objectives, there is no assurance that the use of derivatives will achieve this result.
Following is a description of the derivative instruments and techniques that the Portfolio used during the period and their associated risks:
Futures: A futures contract is a standardized, exchange-traded agreement to buy or sell a specific quantity of an underlying asset, reference rate or index at a specific price at a specific future time. The value of a futures contract tends to increase and decrease in tandem with the value of the underlying instrument. Depending on the terms of the particular contract, futures contracts are settled through either physical delivery of the underlying instrument on the settlement date or by payment of a cash settlement amount on the settlement date. During the period the futures contract is open, payments are received from or made to the broker based upon changes in the value of the contract (the variation margin). A decision as to whether, when and how to use futures contracts involves the exercise of skill and judgment and even a well-conceived futures transaction may be unsuccessful because of market behavior or unexpected events. In addition to the derivatives risks discussed above, the prices of futures contracts can be highly volatile, using futures contracts can lower total return, and the potential loss from futures contracts can exceed the Portfolio's
initial investment in such contracts. No assurance can be given that a liquid market will exist for any particular futures contract at any particular time. There is also the risk of loss by the Portfolio of margin deposits in the event of bankruptcy of a broker with which the Portfolio has open positions in the futures contract.
Swaps: The Portfolio may enter into OTC swap contracts or cleared swap transactions. A swap contract is an agreement between two parties pursuant to which the parties exchange payments at specified dates on the basis of a specified notional amount, with the payments calculated by reference to specified securities, indices, reference rates, currencies or other instruments. Typically swap agreements provide that when the period payment dates for both parties are the same, the payments are made on a net basis (i.e., the two payment streams are netted out, with only the net amount paid by one party to the other). The Portfolio's obligations or rights under a swap contract entered into on a net basis will generally be equal only to the net amount to be paid or received under the agreement, based on the relative values of the positions held by each party. Cleared swap transactions may help reduce counterparty credit risk. In a cleared swap, the Portfolio's ultimate counterparty is a clearinghouse rather than a swap dealer, bank or other financial institution. OTC swap agreements are not entered into or traded on exchanges and often there is no central clearing or guaranty function for OTC swaps. These OTC swaps are often subject to credit risk or the risk of default or non-performance by the counterparty. Both OTC and cleared swaps could result in losses if interest rates, foreign currency exchange rates or other factors are not correctly anticipated by the Portfolio or if the reference index, security or investments do not perform as expected. During the period swap agreements are open, payments are received from or made to the clearinghouse or counterparty based upon changes in the value of the contract (variation margin). The Dodd-Frank Wall Street Reform and Consumer Protection Act and related regulatory developments require the clearing and exchange-trading of certain standardized swap transactions. Mandatory exchange-trading and clearing is occurring on a phased-in basis.
The Portfolio's use of swaps during the period included those based on the credit of an underlying security commonly referred to as "credit default swaps." The
23
Morgan Stanley Institutional Fund Trust
Annual Report — September 30, 2015
Notes to Financial Statements (cont'd)
Portfolio may be either the buyer or seller in a credit default swap. Where the Portfolio is the buyer of a credit default swap contract, it would typically be entitled to receive the par (or other agreed-upon) value of a referenced debt obligation from the counterparty to the contract only in the event of a default or similar event by the issuer of the debt obligation. If no default occurs, the Portfolio would have paid to the counterparty a periodic stream of payments over the term of the contract and received no benefit from the contract. When the Portfolio is the seller of a credit default swap contract, it typically receives the stream of payments but is obligated to pay an amount equal to the par (or other agreed-upon) value of a referenced debt obligation upon the default or similar event by the issuer of the referenced debt obligation. The use of credit default swaps could result in losses to the Portfolio if the Adviser fails to correctly evaluate the creditworthiness of the issuer of the referenced debt obligation.
If the Portfolio is a seller of protection and a credit event occurs, as defined under the terms of that particular swap agreement, the Portfolio will either (i) pay to the buyer of protection an amount equal to the notional amount of the swap agreement and take delivery of the referenced obligation, other deliverable obligations or underlying securities comprising the referenced index or (ii) pay a net settlement amount in the form of cash or securities equal to the notional amount of the swap agreement less the recovery value of the referenced obligation or underlying securities comprising the referenced index. If the Portfolio is a buyer of protection and a credit event occurs, as defined under the terms of that particular swap agreement, the Portfolio will either (i) receive from the seller of protection an amount equal to the notional amount of the swap agreement and deliver the referenced obligation, other deliverable obligations or underlying securities comprising the referenced index or (ii) receive a net settlement amount in the form of cash or securities equal to the notional amount of the swap agreement less the recovery value of the referenced obligation or underlying securities comprising the referenced index. Recovery values are estimated by market makers considering either industry standard recovery rates or entity specific factors and considerations until a credit event occurs. If a credit event has occurred, the recovery value is determined by a facilitated auction whereby a minimum number of allowable broker bids,
together with a specified valuation method, are used to calculate the settlement value. The Portfolio's maximum risk of loss from counterparty risk, either as the protection seller or as the protection buyer, is the fair value of the swap agreement.
The current credit rating of each individual issuer is listed in the table following the Portfolio of Investments and serves as an indicator of the current status of the payment/performance risk of the credit derivative. Alternatively, for credit default swaps on an index of credits, the quoted market prices and current values serve as an indicator of the current status of the payment/performance risk of the credit derivative. Generally, lower credit ratings and increasing market values, in absolute terms, represent a deterioration of the credit and a greater likelihood of an adverse credit event of the issuer.
When the Portfolio has an unrealized loss on a swap agreement, the Portfolio has instructed the custodian to pledge cash or liquid securities as collateral with a value approximately equal to the amount of the unrealized loss. Collateral pledges are monitored and subsequently adjusted if and when the swap valuations fluctuate. If applicable, cash collateral is included with "Due from (to) Broker" in the Statement of Assets and Liabilities.
Upfront payments received or paid by the Portfolio will be reflected as an asset or liability, respectively, in the Statement of Assets and Liabilities.
Foreign Currency Forward Exchange Contracts: In connection with its investments in foreign securities, the Portfolio also entered into contracts with banks, brokers or dealers to purchase or sell securities or foreign currencies at a future date. A foreign currency forward exchange contract ("currency contract") is a negotiated agreement between the contracting parties to exchange a specified amount of currency at a specified future time at a specified rate. The rate can be higher or lower than the spot rate between the currencies that are the subject of the contract. Currency contracts may be used to protect against uncertainty in the level of future foreign currency exchange rates or to gain or modify exposure to a particular currency. In addition, the Portfolio may use cross currency hedging or proxy hedging with respect to currencies in which the Portfolio has or expects to have portfolio or currency exposure. Cross currency hedges involve the sale of one currency against the positive
24
Morgan Stanley Institutional Fund Trust
Annual Report — September 30, 2015
Notes to Financial Statements (cont'd)
exposure to a different currency and may be used for hedging purposes or to establish an active exposure to the exchange rate between any two currencies. To the extent hedged by the use of currency contracts, the precise matching of the currency contract amounts and the value of the securities involved will not generally be possible because the future value of such securities in foreign currencies will change as a consequence of market movements in the value of those securities between the date on which the contract is entered into and the date it matures. Furthermore, such transactions may reduce or preclude the opportunity for gain if the value of the currency should move in the direction opposite to the position taken. There is additional risk to the extent that currency contracts create exposure to currencies in which the Portfolio's securities are not denominated. Unanticipated changes in currency prices may result in poorer overall performance for the Portfolio than if it had not entered into such contracts. The use of currency contracts involves the risk of loss from the insolvency or bankruptcy of the counterparty to the contract or the failure of the counterparty to make payments or otherwise comply with the terms of the contract. A currency contract is marked-to-market daily and the change in market value is recorded by the Portfolio as unrealized gain or loss. The Portfolio records realized gains (losses) when the currency contract is closed equal to the difference between the value of the currency contract at the time it was opened and the value at the time it was closed.
FASB ASC 815, "Derivatives and Hedging" ("ASC 815"), is intended to improve financial reporting about derivative instruments by requiring enhanced disclosures to enable investors to better understand how and why the Portfolio uses derivative instruments, how these derivative instruments are accounted for and their effects on the Portfolio's financial position and results of operations.
The following tables set forth the fair value of the Portfolio's derivative contracts by primary risk exposure as of September 30, 2015.
| | | Asset Derivatives
Statement of Assets and
Liabilities Location | | Primary Risk
Exposure | | Value
(000) | |
Foreign Currency
Forward Exchange
Contracts | | Unrealized Appreciation on
Foreign Currency Forward
Exchange Contracts | |
Currency Risk | | $ | 25 | | |
| | | Liability Derivatives
Statement of Assets and
Liabilities Location | | Primary Risk
Exposure | | Value
(000) | |
Foreign Currency
Forward Exchange
Contracts | | Unrealized Depreciation on
Foreign Currency Forward
Exchange Contracts | |
Currency Risk | | $ | (3 | ) | |
Futures Contracts
| | Variation Margin on
Futures Contracts | |
Interest Rate Risk | | | (68 | )(a) | |
Swap Agreements
| | Unrealized Depreciation on
Swap Agreements | |
Credit Risk | | | (2 | ) | |
Total | | | | | | $ | (73 | ) | |
(a) This amount represents the cumulative appreciation (depreciation) as reported in the Portfolio of Investments. The Statement of Assets and Liabilities only reflects the current day's net variation margin.
The following tables set forth by primary risk exposure the Portfolio's realized gains (losses) and change in unrealized appreciation (depreciation) by type of derivative contract for the period ended September 30, 2015 in accordance with ASC 815.
Realized Gain (Loss) | |
Primary Risk Exposure | | Derivative Type | | Value
(000) | |
| Currency Risk Foreign Currency | |
Forward Exchange Contracts | | $ | 157 | | |
Interest Rate Risk | | Futures Contracts | | | (31 | ) | |
Credit Risk | | Swap Agreements | | | — | @ | |
Total | | | | $ | 126 | | |
Change in Unrealized Appreciation (Depreciation) | |
Primary Risk Exposure | | Derivative Type | | Value
(000) | |
| Currency Risk Foreign Currency | |
Forward Exchange Contracts | | $ | 22 | | |
Interest Rate Risk | | Futures Contracts | | | (68 | ) | |
Credit Risk | | Swap Agreements | | | (2 | ) | |
Total | | | | $ | (48 | ) | |
@ Amount is less than $500.
At September 30, 2015, the Portfolio's derivative assets and liabilities are as follows:
Gross Amounts of Assets and Liabilities Presented in the
Statement of Assets and Liabilities | |
Derivatives(b) | | Assets(c)
(000) | | Liabilities(c)
(000) | |
Foreign Currency Forward Exchange Contracts | | $ | 25 | | | $ | (3 | ) | |
Swap Agreements | | | — | | | | (2 | ) | |
Total | | $ | 25 | | | $ | (5 | ) | |
(b) Excludes exchange traded derivatives.
(c) Absent an event of default or early termination, OTC derivative assets and liabilities are presented gross and not offset in the Statement of Assets and Liabilities.
The Portfolio typically enters into International Swaps and Derivatives Association, Inc. Master Agreements ("ISDA Master Agreements") or similar master agreements (collectively, "Master Agreements") with its contract counterparties for certain OTC derivatives in order to, among other things, reduce its credit risk to counterparties. ISDA
25
Morgan Stanley Institutional Fund Trust
Annual Report — September 30, 2015
Notes to Financial Statements (cont'd)
Master Agreements include provisions for general obligations, representations, collateral and events of default or termination. Under an ISDA Master Agreement, the Portfolio typically may offset with the counterparty certain OTC derivative financial instruments' payables and/or receivables with collateral held and/or posted and create one single net payment (close-out netting) in the event of default, termination and/or potential deterioration in the credit quality of the counterparty. Various Master Agreements govern the terms of certain transactions with counterparties, including transactions such as swap, forward, repurchase and reverse repurchase agreements. These Master Agreements typically attempt to reduce the counterparty risk associated with such transactions by specifying credit protection mechanisms and providing standardization that improves legal certainty. Cross-termination provisions under Master Agreements typically provide that a default in connection with one transaction between the Portfolio and a counterparty gives the non-defaulting party the right to terminate any other transactions in place with the defaulting party to create one single net payment due to/due from the defaulting party and may be a feature in certain Master Agreements. In the event the Portfolio exercises its right to terminate a Master Agreement after a counterparty experiences a termination event as defined in the Master Agreement, the return of collateral with market value in excess of the Portfolio's net liability may be delayed or denied.
The following tables present derivative financial instruments that are subject to enforceable netting arrangements as of September 30, 2015.
Gross Amounts Not Offset in the Statement of Assets and Liabilities | |
Counterparty | | Gross Asset
Derivatives
Presented in
Statement of
Assets and
Liabilities
(000) | | Financial
Instrument
(000) | | Collateral
Received
(000) | | Net Amount
(not less
than $0)
(000) | |
JPMorgan Chase Bank NA | | $ | 25 | | | $ | (2 | ) | | $ | — | | | $ | 23 | | |
Gross Amounts Not Offset in the Statement of Assets and Liabilities | |
Counterparty | | Gross Liability
Derivatives
Presented in
Statement of
Assets and
Liabilities
(000) | | Financial
Instrument
(000) | | Collateral
Pledged
(000) | | Net Amount
(not less
than $0)
(000) | |
Deutsche Bank AG | | $ | 1 | | | $ | — | | | $ | — | | | $ | 1 | | |
Goldman Sachs International | | | 1 | | | | — | | | | — | | | | 1 | | |
JPMorgan Chase Bank NA | | | 2 | | | | (2 | ) | | | — | | | | 0 | | |
UBS AG | | | 1 | | | | — | | | | — | | | | 1 | | |
Total | | $ | 5 | | | $ | (2 | ) | | $ | — | | | $ | 3 | | |
For the period ended September 30, 2015, the approximate average monthly amount outstanding for each derivative type is as follows:
Foreign Currency Forward Exchange Contracts: | |
Average monthly principal amount | | $ | 3,687,000 | | |
Futures Contracts: | |
Average monthly original value | | $ | 8,659,000 | | |
Swap Agreements: | |
Average monthly notional amount | | $ | 16,000 | | |
5. Indemnifications: The Fund enters into contracts that contain a variety of indemnifications. The Fund's maximum exposure under these arrangements is unknown. However, the Fund has not had prior claims or losses pursuant to these contracts and expects the risk of loss to be remote.
6. Dividends and Distributions to Shareholders: Dividend income and distributions to shareholders are recorded on the ex-dividend date. Dividends from net investment income, if any, are declared and paid quarterly. Net realized capital gains, if any, are distributed at least annually.
7. Security Transactions, Income and Expenses: Security transactions are accounted for on the trade date (date the order to buy or sell is executed). Realized gains and losses on the sale of investment securities are determined on the specific identified cost method. Dividend income and other distributions are recorded on the ex-dividend date (except for certain foreign dividends which may be recorded as soon as the Portfolio is informed of such dividends) net of applicable withholding taxes. Interest income is recognized on the accrual basis except where collection is in doubt. Discounts are accreted and premiums are amortized over the life of the respective securities. Most expenses of the Fund can be directly attributed to a particular Portfolio. Expenses which cannot be directly attributed are apportioned among the Portfolios based upon relative net assets or other appropriate methods. Income, expenses (other than class specific expenses — distribution and shareholder services, transfer agency and sub transfer agency fees) and realized and unrealized gains or losses are allocated to each class of shares based upon their relative net assets.
B. Advisory/Sub-Advisory Fees: The Adviser, a wholly-owned subsidiary of Morgan Stanley, provides the Portfolio with advisory services under the terms of an Investment
26
Morgan Stanley Institutional Fund Trust
Annual Report — September 30, 2015
Notes to Financial Statements (cont'd)
Advisory Agreement, paid quarterly, at the annual rate based on the average daily net assets as follows:
First $500
million | | Over $500
million | |
| | 0.40 | % | | | 0.35 | % | |
For the period ended September 30, 2015, the advisory fee rate (net of waivers/rebate) was equivalent to an annual effective rate of 0.00% of the Portfolio's average daily net assets.
The Adviser has agreed to reduce its advisory fee and/or reimburse the Portfolio so that total annual portfolio operating expenses, excluding certain investment related expenses, taxes, interest and other extraordinary expenses (including litigation), will not exceed 1.00% for Class I shares, 1.35% for Class A shares, 2.10% for Class C shares and 0.95% for Class IS shares. The fee waivers and/or expense reimbursements will continue for at least one year from the date of the Portfolio's prospectus or until such time that the Trustees act to discontinue all or a portion of such waivers and/or reimbursements when they deem such action is appropriate. For the period ended September 30, 2015, approximately $30,000 of advisory fees were waived and approximately $206,000 of other expenses were reimbursed by the Adviser pursuant to this arrangement.
The Adviser has entered into a Sub-Advisory Agreement with the Sub-Adviser, a wholly-owned subsidiary of Morgan Stanley. The Sub-Adviser provides the Portfolio with advisory services subject to the overall supervision of the Adviser and the Fund's Officers and Trustees. The Adviser pays the Sub-Adviser on a monthly basis a portion of the net advisory fees the Adviser receives from the Portfolio.
C. Administration Fees: The Adviser also serves as Administrator to the Fund and provides administrative services pursuant to an Administration Agreement for an annual fee, accrued daily and paid monthly, of 0.08% of the Portfolio's average daily net assets. Under a Sub-Administration Agreement between the Administrator and State Street Bank and Trust Company ("State Street"), State Street provides certain administrative services to the Fund. For such services, the Administrator pays State Street a portion of the fee the Administrator receives from the Portfolio.
D. Distribution and Shareholder Services Fees: Morgan Stanley Distribution, Inc. ("MSDI" or the "Distributor"), a wholly-owned subsidiary of the Adviser and Sub-Adviser, and an indirect subsidiary of Morgan Stanley, serves as the Fund's Distributor of Portfolio shares pursuant to a Distribution Agreement. The Fund has adopted a Shareholder
Services Plan with respect to Class A shares pursuant to Rule 12b-1 under the Act. Under the Shareholder Services Plan, the Portfolio pays the Distributor a shareholder services fee, accrued daily and paid monthly, at an annual rate of 0.25% of the Portfolio's average daily net assets attributable to Class A shares.
The Fund has adopted a Distribution and Shareholder Services Plan with respect to Class C shares pursuant to Rule 12b-1 under the Act. Under the Distribution and Shareholder Services Plan, the Portfolio pays the Distributor a distribution fee, accrued daily and paid monthly, at an annual rate of 0.75% and a shareholder services fee, accrued daily and paid monthly, at an annual rate of 0.25% of the Portfolio's average daily net assets attributable to Class C shares.
The distribution and shareholder services fees are used to support the expenses associated with servicing and maintaining accounts. The Distributor may compensate other parties for providing shareholder support services to investors who purchase Class A and Class C shares.
E. Dividend Disbursing and Transfer Agent: The Fund's dividend disbursing and transfer agent is Boston Financial Data Services, Inc. ("BFDS"). Pursuant to a Transfer Agency Agreement, the Fund pays BFDS a fee based on the number of classes, accounts and transactions relating to the Portfolios of the Fund.
F. Custodian Fees: State Street (the "Custodian") serves as Custodian for the Fund in accordance with a Custodian Agreement. The Custodian holds cash, securities, and other assets of the Fund as required by the Act. Custody fees are payable monthly based on assets held in custody, investment purchases and sales activity and account maintenance fees, plus reimbursement for certain out-of-pocket expenses.
G. Security Transactions and Transactions with Affiliates: For the period ended September 30, 2015, purchases and sales of investment securities for the Portfolio, other than long-term U.S. Government securities and short-term investments, were approximately $12,198,000 and $2,710,000, respectively. For the period September 30, 2015, purchases and sales of long-term U.S. Government securities were approximately $627,000 and $177,000, respectively.
The Portfolio invests in the Institutional Class of the Morgan Stanley Institutional Liquidity Funds — Money Market Portfolio (the "Liquidity Funds"), an open-end management investment company managed by the Adviser. Advisory fees paid
27
Morgan Stanley Institutional Fund Trust
Annual Report — September 30, 2015
Notes to Financial Statements (cont'd)
by the Portfolio are reduced by an amount equal to its pro-rata share of the advisory and administration fees paid by the Portfolio due to its investment in the Liquidity Funds. For the period ended September 30, 2015, advisory fees paid were reduced by approximately $1,000 relating to the Portfolio's investment in the Liquidity Funds.
A summary of the Portfolio's transactions in shares of the Liquidity Funds during the period September 30, 2015 is as follows:
Value
December 30,
2014
(000) | | Purchases
at Cost
(000) | | Sales
(000) | | Dividend
Income
(000) | | Value
September 30,
2015
(000) | |
| $ | — | | | $ | 12,003 | | | $ | 11,938 | | | $ | 2 | | | $ | 65 | | |
The Portfolio has an unfunded Deferred Compensation Plan (the "Compensation Plan"), which allows each independent Trustee to defer payment of all, or a portion, of the fees he or she receives for serving on the Board of Trustees. Each eligible Trustee generally may elect to have the deferred amounts credited with a return equal to the total return on one or more of the Morgan Stanley funds that are offered as investment options under the Compensation Plan. Appreciation/depreciation and distributions received from these investments are recorded with an offsetting increase/decrease in the deferred compensation obligation and do not affect the NAV of the Portfolio.
H. Federal Income Taxes: It is the Portfolio's intention to continue to qualify as a regulated investment company and distribute all of its taxable and tax-exempt income. Accordingly, no provision for Federal income taxes is required in the financial statements.
The Portfolio may be subject to taxes imposed by countries in which it invests. Such taxes are generally based on income and/or capital gains earned or repatriated. Taxes are accrued based on net investment income, net realized gains and net unrealized appreciation as such income and/or gains are earned. Taxes may also be based on transactions in foreign currency and are accrued based on the value of investments denominated in such currency.
FASB ASC 740-10, "Income Taxes — Overall", sets forth a minimum threshold for financial statement recognition of the benefit of a tax position taken or expected to be taken in a tax return. Management has concluded there are no significant uncertain tax positions that would require recognition in the financial statements. If applicable, the Portfolio recognizes interest accrued related to unrecognized tax benefits in "Interest Expense" and penalties in "Other Expenses" in the Statement of Operations. The Portfolio files tax returns with the
U.S. Internal Revenue Service, New York and various states. The tax period ended September 30, 2015, remains subject to examination by taxing authorities.
The tax character of distributions paid may differ from the character of distributions shown in the Statement of Changes in Net Assets due to short-term capital gains being treated as ordinary income for tax purposes. The tax character of distributions paid during fiscal year 2015 was as follows:
| 2015 Distributions Paid From: | |
| Ordinary Income (000) | |
| $ | 75 | | |
The amount and character of income and gains to be distributed are determined in accordance with income tax regulations which may differ from GAAP. These book/tax differences are either considered temporary or permanent in nature.
Temporary differences are attributable to differing book and tax treatments for the timing of the recognition of gains (losses) on certain investment transactions and the timing of the deductibility of certain expenses.
Permanent differences, primarily due to differing treatments of gains (losses) related to foreign currency transactions, basis adjustments for swap transactions, paydown adjustments and nondeductible expenses, resulted in the following reclassifications among the components of net assets at September 30, 2015:
Accumulated
Undistributed
Net Investment
Income
(000) | | Accumulated
Net Realized
Loss
(000) | | Paid-in-
Capital
(000) | |
| $ | 102 | | | $ | (97 | ) | | $ | (5 | ) | |
At September 30, 2015, the components of distributable earnings for the Portfolio on a tax basis were as follows:
Undistributed
Ordinary
Income
(000) | | Undistributed
Long-Term
Capital Gain
(000) | |
| $ | 322 | | | $ | — | | |
At September 30, 2015, the Portfolio had available for Federal income tax purposes unused short term and long term capital losses of approximately $85,000 and $55,000, respectively, that do not have an expiration date.
To the extent that capital loss carryforwards are used to offset any future capital gains realized during the carryover period as provided by U.S. Federal income tax regulations, no capital gains tax liability will be incurred by the Portfolio for gains realized and not distributed. To the extent that capital gains are offset, such gains will not be distributed to the shareholders.
28
Morgan Stanley Institutional Fund Trust
Annual Report — September 30, 2015
Report of Independent Registered Public Accounting Firm
To the Shareholders and Board of Trustees of
Morgan Stanley Institutional Fund Trust —
Strategic Income Portfolio
We have audited the accompanying statement of assets and liabilities, including the portfolio of investments, of Strategic Income Portfolio (one of the portfolios constituting Morgan Stanley Institutional Fund Trust) (the "Portfolio") as of September 30, 2015, the related statements of operations and changes in net assets for the period from December 30, 2014 (commencement of operations) to September 30, 2015 and the financial highlights for each of the periods indicated therein. These financial statements and financial highlights are the responsibility of the Portfolio's management. Our responsibility is to express an opinion on these financial statements and financial highlights based on our audit.
We conducted our audit in accordance with the standards of the Public Company Accounting Oversight Board (United States). Those standards require that we plan and perform the audit to obtain reasonable assurance about whether the financial statements and financial highlights are free of material misstatement. We were not engaged to perform an audit of the Portfolio's internal control over financial reporting. Our audit included consideration of internal control over financial reporting as a basis for designing audit procedures that are appropriate in the circumstances, but not for the purpose of expressing an opinion on the effectiveness of the Portfolio's internal control over financial reporting. Accordingly, we express no such opinion. An audit also includes examining, on a test basis, evidence supporting the amounts and disclosures in the financial statements and financial highlights, assessing the accounting principles used and significant estimates made by management, and evaluating the overall financial statement presentation. Our procedures included confirmation of securities owned as of September 30, 2015, by correspondence with the custodian and others or by other appropriate auditing procedures where replies from others were not received. We believe that our audit provides a reasonable basis for our opinion.
In our opinion, the financial statements and financial highlights referred to above present fairly, in all material respects, the financial position of Strategic Income Portfolio (one of the portfolios constituting Morgan Stanley Institutional Fund Trust) at September 30, 2015, the results of its operations, the changes in its net assets for the period from December 30, 2014 (commencement of operations) to September 30, 2015 and the financial highlights for each of the periods indicated therein, in conformity with U.S. generally accepted accounting principles.

Boston, Massachusetts
November 25, 2015
29
Morgan Stanley Institutional Fund Trust
Annual Report — September 30, 2015
U.S. Privacy Policy (unaudited)
AN IMPORTANT NOTICE CONCERNING OUR U.S. PRIVACY POLICY
This privacy notice describes the U.S. privacy policy of Morgan Stanley Distribution, Inc., and the Morgan Stanley family of mutual funds ("us", "our", "we").
We are required by federal law to provide you with notice of our U.S. privacy policy ("Policy"). This Policy applies to both our current and former clients unless we state otherwise and is intended for individual clients who purchase products or receive services from us for personal, family or household purposes. This Policy is not applicable to partnerships, corporations, trusts or other non-individual clients or account holders, nor is this Policy applicable to individuals who are either beneficiaries of a trust for which we serve as trustee or participants in an employee benefit plan administered or advised by us. This Policy is, however, applicable to individuals who select us to be a custodian of securities or assets in individual retirement accounts, 401(k) accounts, or accounts subject to the Uniform Gifts to Minors Act.
This notice sets out our business practices to protect your privacy; how we collect and share personal information about you; and how you can limit our sharing or certain uses by others of this information. We may amend this Policy at any time, and will inform you of any changes to our Policy as required by law.
WE RESPECT YOUR PRIVACY
We appreciate that you have provided us with your personal financial information and understand your concerns about your information. We strive to safeguard the information our clients entrust to us. Protecting the confidentiality and security of client information is an important part of how we conduct our business.
This notice describes what personal information we collect about you, how we collect it, when we may share it with others, and how certain others may use it. It discusses the steps you may take to limit our sharing of certain information about you with our affiliated companies, including, but not limited to our affiliated banking businesses, brokerage firms and credit service affiliates. It also discloses how you may limit our affiliates' use of shared information for marketing purposes.
Throughout this Policy, we refer to the nonpublic information that personally identifies you as "personal information." We also use the term "affiliated company" in this notice. An affiliated company is a company in our family of companies and includes companies with the Morgan Stanley name. These affiliated companies are financial institutions such as broker-dealers, banks, investment advisers and credit card issuers. We refer to any company that is not an affiliated company as a nonaffiliated third party. For purposes of Section 5 of this notice, and your ability to limit certain uses of personal information by our affiliates, this notice applies to the use of personal information by our affiliated companies.
1. WHAT PERSONAL INFORMATION DO WE COLLECT FROM YOU?
We may collect the following types of information about you: (i) information provided by you, including information from applications and other forms we receive from you, (ii) information about your transactions with us or our affiliates, (iii) information about your transactions with nonaffiliated third parties, (iv) information from consumer reporting agencies, (v) information obtained from our websites, and (vi) information obtained from other sources. For example:
• We collect information such as your name, address, e-mail address, telephone/fax numbers, assets, income and investment objectives through applications and other forms you submit to us.
• We may obtain information about account balances, your use of account(s) and the types of products and services you prefer to receive from us through your dealings and transactions with us and other sources.
• We may obtain information about your creditworthiness and credit history from consumer reporting agencies.
• We may collect background information from and through third-party vendors to verify representations you have made and to comply with various regulatory requirements.
2. WHEN DO WE DISCLOSE PERSONAL INFORMATION WE COLLECT ABOUT YOU?
We may disclose personal information we collect about you in each of the categories listed above to affiliated and nonaffiliated third parties.
30
Morgan Stanley Institutional Fund Trust
Annual Report — September 30, 2015
U.S. Privacy Policy (unaudited) (cont'd)
a. Information We Disclose to Affiliated Companies.
We may disclose personal information that we collect about you to our affiliated companies to manage your account(s) effectively, to service and process your transactions, and to let you know about products and services offered by us and affiliated companies, to manage our business, and as otherwise required or permitted by law. Offers for products and services from affiliated companies are developed under conditions designed to safeguard your personal information.
b. Information We Disclose to Third Parties.
We may disclose personal information that we collect about you to nonaffiliated third parties to provide marketing services on our behalf or to other financial institutions with whom we have joint marketing agreements. We may also disclose all of the information we collect to other nonaffiliated third parties for our everyday business purposes, such as to process transactions, maintain account(s), respond to court orders and legal investigations, report to credit bureaus, offer our own products and services, protect against fraud, for institutional risk control, to perform services on our behalf, and as otherwise required or permitted by law.
When we share personal information about you with a nonaffiliated third party, they are required to limit their use of personal information about you to the particular purpose for which it was shared and they are not allowed to share personal information about you with others except to fulfill that limited purpose or as may be permitted or required by law.
3. HOW DO WE PROTECT THE SECURITY AND CONFIDENTIALITY OF PERSONAL INFORMATION WE COLLECT ABOUT YOU?
We maintain physical, electronic and procedural security measures that comply with applicable law and regulations to help safeguard the personal information we collect about you. We have internal policies governing the proper handling of client information by employees. Third parties that provide support or marketing services on our behalf may also receive personal information about you, and we require them to adhere to appropriate security standards with respect to such information.
4. HOW CAN YOU LIMIT OUR SHARING CERTAIN PERSONAL INFORMATION ABOUT YOU WITH OUR AFFILIATED COMPANIES FOR ELIGIBILITY DETERMINATION?
By following the opt-out procedures in Section 6 below, you may limit the extent to which we share with our affiliated companies, personal information that was collected to determine your eligibility for products and services such as your credit reports and other information that you have provided to us or that we may obtain from third parties ("eligibility information"). Eligibility information does not include your identification information or personal information pertaining to our transactions or experiences with you. Please note that, even if you direct us not to share eligibility information with our affiliated companies, we may still share your personal information, including eligibility information, with our affiliated companies under circumstances that are permitted under applicable law, such as to process transactions or to service your account.
5. HOW CAN YOU LIMIT THE USE OF CERTAIN PERSONAL INFORMATION ABOUT YOU BY OUR AFFILIATED COMPANIES FOR MARKETING?
By following the opt-out instructions in Section 6 below, you may limit our affiliated companies from marketing their products or services to you based on personal information we disclose to them. This information may include, for example, your income and account history with us. Please note that, even if you choose to limit our affiliated companies from using personal information about you that we may share with them for marketing their products and services to you, our affiliated companies may use your personal information that they obtain from us to market to you in circumstances permitted by law, such as if the affiliated party has its own relationship with you.
31
Morgan Stanley Institutional Fund Trust
Annual Report — September 30, 2015
U.S. Privacy Policy (unaudited) (cont'd)
6. HOW CAN YOU SEND US AN OPT-OUT INSTRUCTION?
If you wish to limit our sharing of eligibility information about you with our affiliated companies, or our affiliated companies' use of personal information for marketing purposes, as described in this notice, you may do so by:
• Calling us at (800) 548-7786
Monday–Friday between 8a.m. and 6p.m. (EST)
• Writing to us at the following address:
Boston Financial Data Services, Inc.
c/o Privacy Coordinator
P.O. Box 219804
Kansas City, Missouri 64121
If you choose to write to us, your request should include: your name, address, telephone number and account number(s) to which the opt-out applies and whether you are opting out with respect to sharing of eligibility information (Section 4 above), or information used for marketing (Section 5 above), or both. Written opt-out requests should not be sent with any other correspondence. In order to process your request, we require that the request be provided by you directly and not through a third party. Once you have informed us about your privacy preferences, your opt-out preference will remain in effect with respect to this Policy (as it may be amended) until you notify us otherwise. If you are a joint account owner, we will accept instructions from any one of you and apply those instructions to the entire account.
Please understand that if you limit our sharing or our affiliated companies' use of personal information, you and any joint account holder(s) may not receive information about our affiliated companies' products and services, including products or services that could help you manage your financial resources and achieve your investment objectives.
If you have more than one account or relationship with us, please specify the accounts to which you would like us to apply your privacy choices. If you have accounts or relationships with our affiliates, you may receive multiple privacy policies from them, and will need to separately notify those companies of your privacy choices for those accounts or relationships.
7. WHAT IF AN AFFILIATED COMPANY BECOMES A NONAFFILIATED THIRD PARTY?
If, at any time in the future, an affiliated company becomes a nonaffiliated third party, further disclosures of personal information made to the former affiliated company will be limited to those described in Section 2(b) above relating to nonaffiliated third parties. If you elected under Section 6 to limit disclosures we make to affiliated companies, or use of personal information by affiliated companies, your election will not apply to use by any former affiliated company of your personal information in their possession once it becomes a nonaffiliated third party.
SPECIAL NOTICE TO RESIDENTS OF VERMONT
The following section supplements our Policy with respect to our individual clients who have a Vermont address and supersedes anything to the contrary in the above Policy with respect to those clients only.
The State of Vermont requires financial institutions to obtain your consent prior to sharing personal information that they collect about you with nonaffiliated third parties, or eligibility information with affiliated companies, other than in certain limited circumstances. Except as permitted by law, we will not share personal information we collect about you with nonaffiliated third parties or eligibility information with affiliated companies, unless you provide us with your written consent to share such information.
SPECIAL NOTICE TO RESIDENTS OF CALIFORNIA
The following section supplements our Policy with respect to our individual clients who have a California address and supersedes anything to the contrary in the above Policy with respect to those clients only.
In response to a California law, if your account has a California home address, your personal information will not be disclosed to nonaffiliated third parties except as permitted by applicable California law, and we will limit sharing such personal information with our affiliates to comply with California privacy laws that apply to us.
32
Morgan Stanley Institutional Fund Trust
Annual Report — September 30, 2015
Trustee and Officer Information (unaudited)
Independent Trustees:
Name, Age and Address of
Independent Trustee | | Positions(s)
Held with
Registrant | | Length of Time
Served* | | Principal Occupation(s) During Past 5 Years
and Other Relevant Professional Experience | | Number of
Portfolios in
Fund Complex
Overseen by
Trustee** | | Other Directorships
Held by Independent
Trustee*** | |
Frank L. Bowman (70)
c/o Kramer Levin Naftalis & Frankel LLP
Counsel to the Independent Trustees
1177 Avenue of the Americas
New York, NY 10036 | | Trustee | | Since
August
2006 | | President, Strategic Decisions, LLC (consulting) (since February 2009); Director or Trustee of various Morgan Stanley Funds (since August 2006); Chairperson of the Compliance and Insurance Committee (since October 2015); Chairperson of the Insurance Sub-Committee of the Compliance and Insurance Committee (since February 2007); served as President and Chief Executive Officer of the Nuclear Energy Institute (policy organization) (February 2005-November 2008); retired as Admiral, U.S. Navy after serving over 38 years on active duty including 8 years as Director of the Naval Nuclear Propulsion Program in the Department of the Navy and the U.S. Department of Energy (1996-2004); served as Chief of Naval Personnel (July 1994-September 1996); and on the Joint Staff as Director of Political Military Affairs (June 1992-July1994); knighted as Honorary Knight Commander of the Most Excellent Order of the British Empire; awarded the Officier de l'Orde National du Mérite by the French Government; elected to the National Academy of Engineering (2009). | | | 96 | | | Director of BP p.l.c.; Director of Naval and Nuclear Technologies LLP; Director Emeritus of the Armed Services YMCA of the USA; Director of the U.S. Naval Submarine League; Member of the National Security Advisory Council of the Center for U.S. Global Engagement and a member of the CNA Military Advisory Board; Chairman of the Charity J Street Cup Golf ; Trustee of Fairhaven United Methodist Church. | |
Kathleen A. Dennis (62)
c/o Kramer Levin Naftalis & Frankel LLP
Counsel to the Independent Trustees
1177 Avenue of the Americas
New York, NY 10036 | | Trustee | | Since
August
2006 | | President, Cedarwood Associates (mutual fund and investment management consulting) (since July 2006); Chairperson of the Money Market and Alternatives Sub-Committee of the Investment Committee (since October2006) and Director or Trustee of various Morgan Stanley Funds (since August 2006); formerly, Senior Managing Director of Victory Capital Management (1993-2006). | | | 96 | | | Director of various nonprofit organizations. | |
Nancy C. Everett (60)
c/o Kramer Levin Naftalis & Frankel LLP
Counsel to the Independent Trustees
1177 Avenue of the Americas
New York, NY 10036 | | Trustee | | Since
January
2015 | | Owner, OBIR, LLC (institutional investment management consulting) (since June 2014); formerly, Managing Director, BlackRock, Inc. (February 2011-December 2013); and Chief Executive Officer, General Motors Asset Management (a/k/a Promark Global Advisors, Inc.) (June 2005-May 2010). | | | 96 | | | Member of Virginia Commonwealth University Board of Visitors; Member of Virginia Commonwealth University School of Business Foundation; formerly, Member of Committee on Directors for Emerging Markets Growth Fund, Inc. (2007-2010); Chairperson of Performance Equity Management, LLC (2006-2010); and Chairperson, GMAM Absolute Return Strategies Fund, LLC (2006-2010). | |
33
Morgan Stanley Institutional Fund Trust
Annual Report — September 30, 2015
Trustee and Officer Information (unaudited) (cont'd)
Independent Trustees: (cont'd)
Name, Age and Address of
Independent Trustee | | Positions(s)
Held with
Registrant | | Length of Time
Served* | | Principal Occupation(s) During Past 5 Years
and Other Relevant Professional Experience | | Number of
Portfolios in
Fund Complex
Overseen by
Trustee** | | Other Directorships
Held by Independent
Trustee*** | |
Jakki L. Haussler (58)
c/o Kramer Levin Naftalis & Frankel LLP
Counsel to the Independent Trustees
1177 Avenue of the Americas
New York, NY 10036 | | Trustee | | Since
January
2015 | | Chairman and Chief Executive Officer, Opus Capital Group (since January 1996); and formerly, Director, Capvest Venture Fund, LP (May 2000-December 2011); Partner, Adena Ventures, LP (July 1999-December 2010); Director, The Victory Funds (February 2005-July 2008). | | | 96 | | | Director of Cincinnati Bell Inc. and Member, Audit Committee and Compensation Committee; Director of Northern Kentucky University Foundation and Member, Investment Committee; Member of Chase College of Law Transactional Law Practice Center Board of Advisors; Director of Best Transport; Member, University of Cincinnati Foundation Investment Committee; formerly, Member, Miami University Board of Visitors (2008-2011); Trustee of Victory Funds (2005-2008) and Chairman, Investment Committee (2007-2008) and Member, Service Provider Committee (2005-2008). | |
Dr. Manuel H. Johnson (66)
c/o Johnson Smick International, Inc.
220 I Street, N.E. —
Suite 200
Washington, D.C. 20002 | | Trustee | | Since
July
1991 | | Senior Partner, Johnson Smick International, Inc. (consulting firm); Chairperson of the Investment Committee (since October 2006) and Director or Trustee of various Morgan Stanley Funds (since July 1991); Co-Chairman and a founder of the Group of Seven Council (G7C) (international economic commission); formerly Chairperson of the Audit Committee (July 1991-September 2006), Vice Chairman of the Board of Governors of the Federal Reserve System and Assistant Secretary of the U.S. Treasury. | | | 98 | | | Director of NVR, Inc. (home construction). | |
Joseph J. Kearns (73)
c/o Kearns & Associates LLC
23823 Malibu Road
S-50-440
Malibu, CA 90265 | | Trustee | | Since
August
1994 | | President, Kearns & Associates LLC (investment consulting); Chairperson of the Audit Committee (since October 2006) and Director or Trustee of various Morgan Stanley Funds (since August 1994); formerly, Deputy Chairperson of the Audit Committee (July 2003-September 2006) and Chairperson of the Audit Committee of various Morgan Stanley Funds (since August 1994); CFO of the J. Paul Getty Trust. | | | 99 | | | Director of Electro Rent Corporation (equipment leasing). Prior to December 31, 2013, Director of The Ford Family Foundation. | |
34
Morgan Stanley Institutional Fund Trust
Annual Report — September 30, 2015
Trustee and Officer Information (unaudited) (cont'd)
Independent Trustees: (cont'd)
Name, Age and Address of
Independent Trustee | | Positions(s)
Held with
Registrant | | Length of Time
Served* | | Principal Occupation(s) During Past 5 Years
and Other Relevant Professional Experience | | Number of
Portfolios in
Fund Complex
Overseen by
Trustee** | | Other Directorships
Held by Independent
Trustee*** | |
Michael F. Klein (56)
c/o Kramer Levin Naftalis & Frankel LLP
Counsel to the Independent Trustees
1177 Avenue of the Americas
New York, NY 10036 | | Trustee | | Since
August
2006 | | Managing Director, Aetos Capital, LLC (since March 2000); Co-President, Aetos Alternatives Management, LLC (since January 2004); and Co-Chief Executive Officer of Aetos Capital LLC (since August 2013); Chairperson of the Fixed Income Sub-Committee of the Investment Committee (since October 2006) and Director or Trustee of various Morgan Stanley Funds (since August 2006); formerly, Managing Director, Morgan Stanley & Co. Inc. and Morgan Stanley Dean Witter Investment Management, President, various Morgan Stanley Funds (June1998-March 2000) and Principal, Morgan Stanley & Co. Inc. and Morgan Stanley Dean Witter Investment Management (August 1997-December 1999). | | | 96 | | | Director of certain investment funds managed or sponsored by Aetos Capital, LLC. Director of Sanitized AG and Sanitized Marketing AG (specialty chemicals). | |
Michael E. Nugent (79)
522 Fifth Avenue
New York, NY 10036 | | Chair of the
Board and
Trustee | | Chair of the
Boards since
July 2006 and
Trustee since
July 1991 | | Chair of the Boards of various Morgan Stanley Funds (since July 2006); Chairperson of the Closed-End Fund Committee (since June 2012) and Director or Trustee of various Morgan Stanley Funds (since July 1991); formerly, Chairperson of the Insurance Committee (until July 2006), General Partner, Triumph Capital, L.P. (private investment partnership) (1988-2013). | | | 98 | | | None. | |
W. Allen Reed (68)
c/o Kramer Levin Naftalis & Frankel LLP
Counsel to the Independent Trustees
1177 Avenue of the Americas
New York, NY 10036 | | Trustee | | Since
August
2006 | | Chairperson of the Equity Sub-Committee of the Investment Committee (since October 2006) and Director or Trustee of various Morgan Stanley Funds (since August 2006); formerly, President and CEO of General Motors Asset Management; Chairman and Chief Executive Officer of the GM Trust Bank and Corporate Vice President of General Motors Corporation (August 1994-December 2005). | | | 96 | | | Director of Temple-Inland Industries (packaging and forest products); Director of Legg Mason, Inc. and Director of the Auburn University Foundation. | |
Fergus Reid (83)
c/o Joe Pietryka, Inc.
85 Charles Colman Blvd.
Pawling, NY 12564 | | Trustee | | Since
June
1992 | | Chairman, Joe Pietryka, Inc.; Chairperson of the Governance Committee and Director or Trustee of various Morgan Stanley Funds (since June 1992). | | | 99 | | | Formerly, Trustee and Director of certain investment companies in the JP Morgan Fund Complex managed by JP Morgan Investment Management Inc. (1987-December 2012). | |
35
Morgan Stanley Institutional Fund Trust
Annual Report — September 30, 2015
Trustee and Officer Information (unaudited) (cont'd)
Interested Trustee:
Name, Age and Address of
Interested Trustee | | Positions(s) Held
with Registrant | | Length of Time
Served* | | Principal Occupation(s) During Past 5 Years | | Number of
Portfolios in
Fund Complex
Overseen by
Interested
Trustee** | | Other Directorships
Held by Interested
Trustee*** | |
James F. Higgins (67)
One New York Plaza,
New York, NY 10004 | | Trustee | | Since
June
2000 | | Director or Trustee of various Morgan Stanley Funds (since June 2000); Senior Advisor of Morgan Stanley (since August 2000). | | | 97 | | | Formerly, Director of AXA Financial, Inc. and AXA Equitable Life Insurance Company (2002-2011) and Director of AXA MONY Life Insurance Company and AXA MONY Life Insurance Company of America (2004-2011). | |
* This is the earliest date the Trustee began serving the Morgan Stanley Funds. Each Trustee serves an indefinite term, until his or her successor is elected.
** The Fund Complex includes (as of December 31, 2014) all open-end and closed-end funds (including all of their portfolios) advised by Morgan Stanley Investment Management Inc. (the "Adviser") and any funds that have an adviser that is an affiliated person of the Adviser (including, but not limited to, Morgan Stanley AIP GP LP).
*** This includes any directorships at public companies and registered investment companies held by the Trustee at any time during the past five years.
36
Morgan Stanley Institutional Fund Trust
Annual Report — September 30, 2015
Trustee and Officer Information (unaudited) (cont'd)
Executive Officers:
Name, Age and Address of Executive Officer | | Position(s) Held
with
Registrant | | Length of Time
Served* | | Principal Occupation(s) During Past 5 Years | |
John H. Gernon (52)
522 Fifth Avenue
New York, NY 10036 | | President and Principal Executive Officer | | Since
September
2013 | | President and Principal Executive Officer of the Equity and Fixed Income Funds and the Morgan Stanley AIP Funds (since September 2013) and the Liquidity Funds and various money market funds (since May 2014) in the Fund Complex, Managing Director of the Adviser; Head of Product (since 2006) and Global Portfolio Analysis and Reporting (since 2012); for MSIM's Long Only business. | |
Stefanie V. Chang Yu (48)
522 Fifth Avenue
New York, NY 10036 | | Chief
Compliance
Officer | | Since
December
1997 | | Managing Director of the Adviser and various entities affiliated with the Adviser; Chief Compliance Officer of various Morgan Stanley Funds and the Adviser (since January 2014); formerly, Vice President of various Morgan Stanley Funds (December 1997-January 2014). | |
Joseph C. Benedetti (50)
522 Fifth Avenue
New York, NY 10036 | | Vice President | | Since
January
2014 | | Managing Director of the Adviser and various entities affiliated with the Adviser; Vice President of various Morgan Stanley Funds (since January 2014); formerly, Assistant Secretary of various Morgan Stanley Funds (October 2004-January 2014). | |
Francis J. Smith (50)
522 Fifth Avenue
New York, NY 10036 | | Treasurer and
Principal
Financial
Officer | | Treasurer
since July
2003 and
Principal
Financial
Officer since
September
2002 | | Executive Director of the Adviser and various entities affiliated with the Adviser; Treasurer (since July 2003) and Principal Financial Officer of various Morgan Stanley Funds (since September 2002). | |
Mary E. Mullin (48)
522 Fifth Avenue
New York, NY 10036 | | Secretary | | Since
June
1999 | | Executive Director of the Adviser and various entities affiliated with the Adviser; Secretary of various Morgan Stanley Funds (since June 1999). | |
* This is the earliest date the officer began serving the Morgan Stanley Funds. Each officer serves a one-year term, until his or her successor is elected and has qualified.
37
Morgan Stanley Institutional Fund Trust
Annual Report — September 30, 2015
Adviser and Administrator
Morgan Stanley Investment Management Inc.
522 Fifth Avenue
New York, New York 10036
Custodian
State Street Bank and Trust Company
One Lincoln Street
Boston, Massachusetts 02111
Legal Counsel
Dechert LLP
1095 Avenue of the Americas
New York, New York 10036
Distributor
Morgan Stanley Distribution, Inc.
522 Fifth Avenue
New York, New York 10036
Dividend Disbursing and Transfer Agent
Boston Financial Data Services, Inc.
2000 Crown Colony Drive
Quincy, Massachusetts 02169
Sub-Adviser
Morgan Stanley Investment Management Limited
25 Cabot Square, Canary Wharf
London, E14 4QA, England
Counsel to the Independent Trustees
Kramer Levin Naftalis & Frankel LLP
1177 Avenue of the Americas
New York, New York 10036
Independent Registered Public Accounting Firm
Ernst & Young LLP
200 Clarendon Street
Boston, Massachusetts 02116
Reporting to Shareholders
Each Morgan Stanley fund provides a complete schedule of portfolio holdings in its semi-annual and annual reports within 60 days of the end of the fund's second and fourth fiscal quarters. The semi-annual and annual reports are filed electronically with the Securities and Exchange Commission (SEC) on Form N-CSRS and Form N-CSR, respectively. Morgan Stanley also delivers the semi-annual and annual reports to fund shareholders and makes these reports available on its public website, www.morganstanley.com/im. Each Morgan Stanley fund also files a complete schedule of portfolio holdings with the SEC for the fund's first and third fiscal quarters on Form N-Q. Morgan Stanley does not deliver the reports for the first and third fiscal quarters to shareholders, nor are the reports posted to the Morgan Stanley public website. You may, however, obtain the Form N-Q filings (as well as the Form N-CSR and N-CSRS filings) by accessing the SEC's website, www.sec.gov. You may also review and copy them at the SEC's Public Reference Room in Washington, DC. Information on the operation of the SEC's Public Reference Room may be obtained by calling the SEC toll free at 1 (800) SEC-0330. You can also request copies of these materials, upon payment of a duplicating fee, by electronic request at the SEC's email address (publicinfo@sec.gov) or by writing the Public Reference Room of the SEC, Washington, DC 20549-0102.
Proxy Voting Policies and Procedures and Proxy Voting Record
You may obtain a copy of the Fund's Proxy Voting Policy and Procedures and information regarding how the Fund voted proxies relating to portfolio securities during the most recent twelve-month period ended June 30, without charge, upon request, by calling toll free 1 (800) 548-7786 or by visiting our website at www.morganstanley.com/im. This information is also available on the SEC's website at www.sec.gov.
This report is authorized for distribution only when preceded or accompanied by a prospectus of the Morgan Stanley Institutional Fund Trust, which describes in detail each Portfolio's investment policies, risks, fees and expenses. Please read the prospectus carefully before you invest or send money. For additional information, including information regarding the investments comprising the Portfolio, please visit our website at www.morganstanley.com/im or call toll free 1 (800) 548-7786.
38
(This Page has been left blank intentionally.)
(This Page has been left blank intentionally.)
Printed in U.S.A.
This Report has been prepared for shareholders and may be distributed to others only if preceded or accompanied by a current prospectus.
Morgan Stanley Investment Management Inc.
522 Fifth Avenue
New York, New York 10036
© 2015 Morgan Stanley. Morgan Stanley Distribution, Inc.

IFTSIPANN
1334247 EXP 11.30.16

Morgan Stanley Institutional Fund Trust
Global Multi-Asset Income Portfolio
Annual Report
September 30, 2015

Morgan Stanley Institutional Fund Trust
Annual Report — September 30, 2015
Shareholders' Letter | | | 2 | | |
Expense Example | | | 3 | | |
Investment Overview | | | 4 | | |
Portfolio of Investments | | | 7 | | |
Statement of Assets and Liabilities | | | 21 | | |
Statement of Operations | | | 23 | | |
Statement of Changes in Net Assets | | | 24 | | |
Financial Highlights | | | 25 | | |
Notes to Financial Statements | | | 29 | | |
Report of Independent Registered Public Accounting Firm | | | 42 | | |
Investment Advisory Agreement Approval | | | 43 | | |
Federal Tax Notice | | | 45 | | |
U.S. Privacy Policy | | | 46 | | |
Trustee and Officer Information | | | 49 | | |
This report is authorized for distribution only when preceded or accompanied by prospectuses of the Morgan Stanley Institutional Fund Trust. To receive a prospectus and/or statement of additional information (SAI), which contains more complete information such as investment objectives, charges, expenses, policies for voting proxies, risk considerations, and describes in detail each of the Portfolio's investment policies to the prospective investor, please call toll free 1 (800) 548-7786. Please read the prospectuses carefully before you invest or send money.
Additionally, you can access portfolio information including performance, characteristics, and investment team commentary through Morgan Stanley Investment Management's website: www.morganstanley.com/im.
Market forecasts provided in this report may not necessarily come to pass. There is no guarantee that any sectors mentioned will continue to perform as discussed herein or that securities in such sectors will be held by the Portfolio in the future. There is no assurance that a Portfolio will achieve its investment objective. Portfolios are subject to market risk, which is the possibility that market values of securities owned by the Portfolio will decline and, therefore, the value of the Portfolio's shares may be less than what you paid for them. Accordingly, you can lose money investing in this Portfolio. Please see the prospectus for more complete information on investment risks.
1
Morgan Stanley Institutional Fund Trust
Annual Report — September 30, 2015
Shareholders' Letter (unaudited)
Dear Shareholders,
We are pleased to provide this Annual report, in which you will learn how your investment in Global Multi-Asset Income Portfolio (the "Portfolio") performed during the period ended September 30, 2015.
Morgan Stanley Investment Management is a client-centric, investor-led organization. Our global presence, intellectual capital, and breadth of products and services enable us to partner with investors to meet the evolving challenges of today's financial markets. We aim to deliver superior investment service and to empower our clients to make the informed decisions that help them reach their investment goals.
As always, we thank you for selecting Morgan Stanley Investment Management, and look forward to working with you in the months and years ahead.
Sincerely,

John H. Gernon
President and Principal Executive Officer
October 2015
2
Morgan Stanley Institutional Fund Trust
Annual Report — September 30, 2015
Expense Example (unaudited)
Global Multi-Asset Income Portfolio
As a shareholder of the Portfolio, you may incur two types of costs: (1) transactional costs, including sales charge (loads) on purchase payments; and (2) ongoing costs, including advisory fees, administration fees, distribution and shareholder services fees; and other Portfolio expenses. This example is intended to help you understand your ongoing costs (in dollars) of investing in the Portfolio and to compare these costs with the ongoing costs of investing in other mutual funds.
This example is based on an investment of $1,000 invested at the beginning of the period and held for the entire period 4/30/15 - 9/30/15 (unless otherwise noted).
Actual Expenses
The table below provides information about actual account values and actual expenses. You may use the information in this table, together with the amount you invested, to estimate the expenses that you paid over the period. Simply divide your account value by $1,000 (for example, an $8,600 account value divided by $1,000 = 8.6), then multiply the result by the number in the table under the heading entitled "Actual Expenses Paid During Period" to estimate the expenses you paid on your account during this period.
Hypothetical Example for Comparison Purposes
The table below provides information about hypothetical account values and hypothetical expenses based on the Portfolio's actual expense ratio and an assumed rate of return of 5% per year before expenses, which is not the Portfolio's actual return. The hypothetical account values and expenses may not be used to estimate the actual ending account balance or expenses you paid for the period. You may use this information to compare the ongoing costs of investing in the Portfolio and other funds. To do so, compare this 5% hypothetical example with the 5% hypothetical examples that appear in the shareholder reports of the other funds.
Please note that the expenses shown in the table are meant to highlight your ongoing costs only and do not reflect any transactional costs, such as sales charges (loads, if applicable). Therefore, the information for each class in the table is useful in comparing ongoing costs only, and will not help you determine the relative total costs of owning different funds. In addition, if these transactional costs were included, your costs would have been higher.
| | | Beginning
Account
Value
4/30/15 | | Actual Ending
Account
Value
9/30/15 | | Hypothetical
Ending Account
Value | | Actual
Expenses
Paid
During
Period | | Hypothetical
Expenses Paid
During Period | | Net
Expense
Ratio
During
Period*** | |
Global Multi-Asset Income Portfolio Class I | | $ | 1,000.00 | | | $ | 935.80 | | | $ | 1,017.06 | | | $ | 3.77 | * | | $ | 3.93 | * | | | 0.93 | % | |
Global Multi-Asset Income Portfolio Class A | | | 1,000.00 | | | | 933.60 | | | | 1,015.64 | | | | 5.15 | * | | | 5.37 | * | | | 1.27 | | |
Global Multi-Asset Income Portfolio Class C | | | 1,000.00 | | | | 931.40 | | | | 1,011.64 | | | | 7.68 | ** | | | 8.00 | ** | | | 2.03 | | |
Global Multi-Asset Income Portfolio Class IS | | | 1,000.00 | | | | 935.90 | | | | 1,017.31 | | | | 3.53 | * | | | 3.68 | * | | | 0.87 | | |
* Expenses are calculated using each Portfolio Class' annualized net expense ratio (as disclosed), multiplied by the average account value over the period, and multiplied by 153/365 (to reflect the actual days in the period).
** Expenses are calculated using the Portfolio Class' annualized net expense ratio (as disclosed), multiplied by the average account value over the period, and multiplied by 143/365 (to reflect the actual days in the period).
*** Annualized.
3
Morgan Stanley Institutional Fund Trust
Annual Report — September 30, 2015
Investment Overview (unaudited)
Global Multi-Asset Income Portfolio
The Global Multi-Asset Income Portfolio's investment objective is to maximize current income and to seek capital appreciation over time.
Performance
For the period since the Portfolio's inception on April 30, 2015, through September 30, 2015, the Portfolio's Class I shares had a total return based on net asset value and reinvestment of distributions per share of –6.42%, net of fees. The Portfolio's Class I shares underperformed against the Portfolio's benchmark, Barclays Global Aggregate Bond Index, which returned –1.38%.
Factors Affecting Performance(i)
• In the five months ended September 30, 2015, global equities underperformed bonds and outperformed commodities, with the MSCI All Country World Index down –11.7%, the Barclays Global Aggregate Bond Index down –1.4%, and the S&P GSCI Index, a broad index of commodity prices, falling –21.0%.(ii) (Except where noted, equity market returns are represented by the MSCI regional or country index and are calculated in U.S. dollars.)
• Within equities, the U.S. held up on a relative basis, with the S&P 500 Index falling –7.1% for the period, as the labor market continued to show signs of improvement while monetary policy remained easy. European equities underperformed global markets, losing –13.2% as disappointing economic data, a debt crisis in Greece and fears of a global growth slowdown led to a 'risk off' sentiment. Europe also tends to have a higher beta in a market sell-off. Emerging markets lost –24.4% on fears of a hard landing in China and its impact on the broader region. China sold off by –31.4% as the economy remained weak despite aggressive policy easing. Falling commodity prices, tensions surrounding Russia and a recession in Brazil also damaged sentiment for emerging market assets. Japanese equities were down –12.9%, as Japan appeared to enter a technical recession during the third quarter of 2015, and S&P downgraded its sovereign credit rating, citing disappointment with the effectiveness of the economic stimulus plan ('Abenomics').
• Within bonds, the yield curve flattened slightly as the normalization of U.S. monetary policy remained imminent, while the pace and moderation
of rate hikes were re-priced to be more subdued. The U.S. 2-year Treasury yield rose 6 basis points to 0.63%, and the U.S. 10-year Treasury yield rose 1 basis point to 2.04%. U.S. investment grade spreads rose 41 basis points to 1.7%, and high yield spreads rose 191 basis points to 6.3%, as weakness in China and the global energy sector led a flight to safe haven assets. Emerging market bond spreads widened by 98 basis points. In Europe, German bund yields rebounded from the all-time lows reached in April, with the German 10-year bund yield rising 22 basis points to 0.6%. Greek bond spreads spiked as the country's debt crisis escalated, with the 10-year yield reaching 13.1% in June before falling to 8.2% in September (rising only 219 basis points for the period) after a bailout package was approved.
• Within currencies, the U.S. dollar rallied by 1.9% on a trade-weighted basis. Emerging market currencies lost –11.2% versus the dollar as commodity prices fell sharply, with the greatest losses in the Russian ruble, which fell –21.1%. Both the euro and the yen depreciated by –0.4%.
• Active positions within equities detracted from performance. Overweight positions in eurozone relative to U.S. equities, U.S. energy stocks relative to U.S. equities, and global equities detracted from performance. Although China's market ended the period lower overall, strong price appreciation earlier in the period was disadvantageous to the Portfolio's underweight position in Chinese A-shares, which detracted from performance. An underweight in European consumer staples stocks relative to eurozone equities also detracted. Underweight positions in global machinery stocks relative to global equities and in U.S. equities contributed positively. Writing call options on broad global equity market indices also had a positive impact on performance.
(i) Certain of the Portfolio's investment themes may, in whole or part, be implemented through the use of derivatives, including the purchase and sale of futures, options, swaps, structured investments (including commodity-linked notes) and other related instruments and techniques. The Portfolio may also invest in foreign currency forward exchange contracts, which are also derivatives, in connection with its investments in foreign securities. The Portfolio may use derivative instruments for a variety of purposes, including hedging, risk management, portfolio management or to earn income. As a result, the use of derivatives had a material effect on the Portfolio's performance during the period.
(ii) Data sources used in preparation of this commentary include FactSet and Bloomberg LP. Data as of September 30, 2015.
4
Morgan Stanley Institutional Fund Trust
Annual Report — September 30, 2015
Investment Overview (unaudited) (cont'd)
Global Multi-Asset Income Portfolio
• Active positions within fixed income detracted from performance. Underweight positions in U.S. 5-year and 2-year Treasuries and an overweight position in U.S. 10-year Treasury inflation-protected securities (TIPS) relative to U.S. 10-year Treasuries detracted from performance. Overweight positions in Greek bonds and an underweight position in U.S. investment grade credit spreads contributed positively.
• Active positions within high yielding assets contributed positively to performance, due to gains from an underweight position in U.S. high yield credit spreads and an overweight position in European high yield credit spreads.
• Active positions within commodities (implemented via commodity futures) detracted from performance, as gains from an underweight position in copper were offset by losses from an overweight position in Brent oil.
• Active currency positions (implemented via currency forwards and futures) positively impacted performance. Underweight positions in China-sensitive currencies, the Australian dollar, and the Chinese renminbi contributed positively, as did an underweight position in the Swiss franc relative to the euro.
Management Strategies
• As of September 30, 2015, we are neutral on fixed income and tactically overweight global equities in the Portfolio. Heading into the fourth quarter of 2015, we believe that a short-term stabilization in China could lift global risky assets as the fear of an impending global recession subsides. We prefer European and emerging market equities over the U.S. and Japan. We believe that many yield-sensitive assets are overvalued globally, but re-pricing may continue to be delayed as the U.S. Federal Reserve (Fed) monitors the global economy. Given the dovish stance of the Fed, we are constructive on real and inflation-sensitive assets including gold and U.S. TIPS.
• We believe the eurozone recovery remains on track. We are overweight in eurozone equities versus the U.S., as eurozone equities are cheaper and likely to benefit from a cyclical earnings recovery versus the U.S.'s more mature profit cycle. We expect the
tailwinds of a weaker euro, lower corporate borrowing rates, and lower oil prices to support eurozone economic growth and drive robust earnings growth. While recent economic data has been marginally softer than our expectations, we believe the eurozone growth trajectory is still strong enough to support our view.
• We are tactically overweight in emerging market equities. In the medium-term, we expect a continued China slowdown to remain a headwind for broad emerging market growth as the excesses of China's investment and credit bubbles inevitably unwind. However, in the near-term, several leading indicators are pointing to the possibility that Chinese growth may stabilize or even accelerate in the coming quarters as a result of massive policy easing. Amidst bearish sentiment, we believe this could be enough to halt or even temporarily reverse the bear market in emerging market and commodity-related assets.
• We are underweight in Japanese equities. Japan is now likely in a technical recession, as domestic activity has been insufficient to offset external drags from slower growth in Asia. We expect the market to increasingly recognize that Abenomics has largely failed, much like S&P has begun to do in downgrading Japan's sovereign credit rating. Japanese equity valuations are not cheap enough to offset deteriorating fundamentals, and sentiment is bullish.
5
Morgan Stanley Institutional Fund Trust
Annual Report — September 30, 2015
Investment Overview (unaudited) (cont'd)
Global Multi-Asset Income Portfolio

* Minimum Investment
** Commenced operations on April 30, 2015
In accordance with SEC regulations, the Portfolio's performance shown assumes that all recurring fees (including management fees) were deducted and all dividends and distributions were reinvested. The performance of Class A, Class C and Class IS shares will vary from the performance of Class I shares based upon their different inception dates and will be negatively impacted by additional fees assessed to those classes (where applicable).
Performance Compared to the Barclays Global Aggregate Bond Index(1) and the Lipper Flexible Portfolio Funds Index(2)
| | | Period Ended September 30, 2015
Total Returns(3) | |
| | | One
Year | | Five
Years | | Ten
Years | | Since
Inception(6) | |
Portfolio — Class I Shares
w/o sales charges(4) | | | — | | | | — | | | | — | | | | –6.42 | % | |
Portfolio — Class A Shares
w/o sales charges(4) | | | — | | | | — | | | | — | | | | –6.64 | | |
Portfolio — Class A Shares with
maximum 5.25% sales charges(4) | | | — | | | | — | | | | — | | | | –11.51 | | |
Portfolio — Class C Shares
w/o sales charges(5) | | | — | | | | — | | | | — | | | | –6.86 | | |
Portfolio — Class C Shares with
maximum 1.00% deferred
sales charges(5) | | | — | | | | — | | | | — | | | | –7.79 | | |
Portfolio — Class IS Shares
w/o sales charges(4) | | | — | | | | — | | | | — | | | | –6.41 | | |
Barclays Global Aggregate Bond Index | | | — | | | | — | | | | — | | | | –1.38 | | |
Lipper Flexible Portfolio Funds Index | | | — | | | | — | | | | — | | | | –7.58 | | |
Performance data quoted represents past performance, which is no guarantee of future results, and current performance may be lower or higher than the figures shown. Performance assumes that all dividends and distributions, if any, were reinvested. Returns for period less than one year
are not annualized. For the most recent month-end performance figures, please visit www.morganstanley.com/im. Investment return and principal value will fluctuate so that Portfolio shares, when redeemed, may be worth more or less than their original cost. Total returns do not reflect the deduction of taxes that a shareholder would pay on Portfolio distributions or the redemption of Portfolio shares. Performance of share classes will vary due to differences in sales charges and expenses.
(1) The Barclays Global Aggregate Bond Index provides a broadbased measure of the global investment grade fixed-rate debt markets. Total Returns shown in unhedged USD.The Index is unmanaged and its returns do not include any sales charges or fees. Such costs would lower performance. It is not possible to invest directly in an index.
(2) The Lipper Flexible Portfolio Funds Index is an equally weighted performance index of the largest qualifying funds (based on net assets) in the Lipper Flexible Portfolio Funds classification. The Index, which is adjusted for capital gains distributions and income dividends, is unmanaged and should not be considered an investment. There are currently 30 funds represented in this Index. As of the date of this report, the Portfolio was in the Lipper Flexible Portfolio Funds classification.
(3) Total returns for the Portfolio reflect expenses waived and/or reimbursed, if applicable, by the Adviser. Without such waivers and/or reimbursements, total returns would have been lower.
(4) Commenced operations on April 30, 2015.
(5) Commenced operations on May 08, 2015.
(6) For comparative purposes, average annual since inception returns listed for the Indexes refer to the inception date of the Class I of the Portfolio, not the inception of the Indexes.
6
Morgan Stanley Institutional Fund Trust
Annual Report — September 30, 2015
Portfolio of Investments
Global Multi-Asset Income Portfolio
| | | Face
Amount
(000) | | Value
(000) | |
Fixed Income Securities (44.2%) | |
Agency Fixed Rate Mortgages (5.6%) | |
United States (5.6%) | |
Federal Home Loan Mortgage Corporation, | |
November TBA: | |
3.00%, 11/1/45 (a) | | $ | 140 | | | $ | 141 | | |
3.50%, 11/1/45 (a) | | | 280 | | | | 291 | | |
4.00%, 11/1/45 (a) | | | 150 | | | | 159 | | |
Federal National Mortgage Association, | |
Conventional Pools: | |
4.50%, 10/1/44 - 11/1/44 | | | 64 | | | | 71 | | |
October TBA: | |
3.00%, 10/1/30 (a) | | | 52 | | | | 54 | | |
Government National Mortgage Association, | |
3.50%, 10/20/45 (a) | | | 70 | | | | 73 | | |
| | | | 789 | | |
Commercial Mortgage-Backed Securities (1.3%) | |
United States (1.3%) | |
GS Mortgage Securities Trust, | |
4.93%, 8/10/46 (b)(c) | | | 70 | | | | 67 | | |
Wells Fargo Commercial Mortgage Trust, | |
4.24%, 5/15/48 (b) | | | 51 | | | | 43 | | |
WF-RBS Commercial Mortgage Trust, | |
4.28%, 5/15/45 (b)(c) | | | 40 | | | | 37 | | |
4.63%, 8/15/46 (b)(c) | | | 35 | | | | 33 | | |
| | | | 180 | | |
Corporate Bonds (12.2%) | |
Australia (0.5%) | |
Australia & New Zealand Banking Group Ltd., | |
5.13%, 9/10/19 | | EUR | 50 | | | | 64 | | |
Canada (0.3%) | |
Barrick Gold Corp., | |
4.10%, 5/1/23 | | $ | 50 | | | | 44 | | |
France (0.4%) | |
BNP Paribas SA, | |
5.00%, 1/15/21 | | | 50 | | | | 56 | | |
Italy (0.4%) | |
UniCredit SpA, | |
4.25%, 7/29/16 | | EUR | 50 | | | | 58 | | |
Netherlands (0.9%) | |
ABN Amro Bank N.V., | |
3.63%, 10/6/17 | | | 50 | | | | 59 | | |
Cooperatieve Centrale Raiffeisen-Boerenleenbank BA, | |
3.75%, 11/9/20 | | | 50 | | | | 61 | | |
| | | | 120 | | |
United Kingdom (0.8%) | |
Barclays Bank PLC, | |
6.00%, 1/23/18 | | | 50 | | | | 62 | | |
Diageo Capital PLC, | |
1.50%, 5/11/17 | | $ | 50 | | | | 50 | | |
| | | | 112 | | |
| | | Face
Amount
(000) | | Value
(000) | |
United States (8.9%) | |
Actavis Funding SCS, | |
3.80%, 3/15/25 | | $ | 50 | | | $ | 48 | | |
Apple, Inc., | |
4.45%, 5/6/44 | | | 50 | | | | 50 | | |
AT&T, Inc., | |
6.30%, 1/15/38 | | | 50 | | | | 55 | | |
Bank of America Corp., | |
5.70%, 1/24/22 | | | 50 | | | | 57 | | |
Baxalta, Inc., | |
4.00%, 6/23/25 (c) | | | 25 | | | | 25 | | |
Biogen, Inc., | |
4.05%, 9/15/25 | | | 25 | | | | 25 | | |
Boston Properties LP, | |
3.85%, 2/1/23 | | | 50 | | | | 51 | | |
CCO Safari II LLC, | |
4.91%, 7/23/25 (c) | | | 25 | | | | 25 | | |
Citigroup, Inc., | |
5.50%, 9/13/25 | | | 50 | | | | 55 | | |
General Motors Financial Co., Inc., | |
4.30%, 7/13/25 | | | 30 | | | | 29 | | |
Gilead Sciences, Inc., | |
3.65%, 3/1/26 | | | 25 | | | | 25 | | |
Goldman Sachs Group, Inc. (The), | |
6.75%, 10/1/37 | | | 50 | | | | 60 | | |
HP Enterprise Co., | |
3.60%, 10/15/20 | | | 25 | | | | 25 | | |
HSBC USA, Inc., | |
3.50%, 6/23/24 | | | 100 | | | | 102 | | |
JPMorgan Chase & Co., | |
4.63%, 5/10/21 | | | 50 | | | | 54 | | |
Kinder Morgan, Inc., | |
4.30%, 6/1/25 | | | 50 | | | | 45 | | |
McDonald's Corp., | |
3.38%, 5/26/25 | | | 50 | | | | 50 | | |
Merck & Co., Inc., | |
2.80%, 5/18/23 | | | 50 | | | | 50 | | |
Monongahela Power Co., | |
5.40%, 12/15/43 (c) | | | 50 | | | | 56 | | |
| MPLX LP, | |
4.00%, 2/15/25 | | | 50 | | | | 46 | | |
NBC Universal Media LLC, | |
4.38%, 4/1/21 | | | 50 | | | | 55 | | |
Omnicom Group, Inc., | |
3.63%, 5/1/22 | | | 50 | | | | 51 | | |
Prudential Financial, Inc., | |
6.63%, 12/1/37 | | | 50 | | | | 63 | | |
Target Corp., | |
3.50%, 7/1/24 | | | 50 | | | | 52 | | |
UnitedHealth Group, Inc., | |
2.88%, 3/15/23 | | | 25 | | | | 25 | | |
Verizon Communications, Inc., | |
3.50%, 11/1/24 | | | 25 | | | | 25 | | |
The accompanying notes are an integral part of the financial statements.
7
Morgan Stanley Institutional Fund Trust
Annual Report — September 30, 2015
Portfolio of Investments (cont'd)
Global Multi-Asset Income Portfolio
| | | Face
Amount
(000) | | Value
(000) | |
United States (cont'd) | |
Wells Fargo & Co., | |
3.45%, 2/13/23 | | $ | 50 | | | $ | 50 | | |
| | | | 1,254 | | |
| | | | 1,708 | | |
Sovereign (18.5%) | |
Australia (0.9%) | |
Australia Government Bond, | |
3.25%, 4/21/25 | | AUD | 170 | | | | 126 | | |
Belgium (0.4%) | |
Belgium Government Bond, | |
0.80%, 6/22/25 (c) | | EUR | 50 | | | | 55 | | |
Canada (1.7%) | |
Canadian Government Bond, | |
3.25%, 6/1/21 | | CAD | 280 | | | | 236 | | |
France (1.4%) | |
France Government Bond OAT, | |
3.25%, 5/25/45 | | EUR | 60 | | | | 88 | | |
5.50%, 4/25/29 | | | 60 | | | | 102 | | |
| | | | 190 | | |
Germany (0.9%) | |
Bundesrepublik Deutschland, | |
4.25%, 7/4/39 | | | 30 | | | | 54 | | |
4.75%, 7/4/34 | | | 40 | | | | 73 | | |
| | | | 127 | | |
Greece (0.2%) | |
Hellenic Republic Government Bond, | |
3.00%, 2/24/23 - 2/24/42 (d) | | | 40 | | | | 33 | | |
Hungary (0.4%) | |
Hungary Government International Bond, | |
5.75%, 11/22/23 | | $ | 50 | | | | 56 | | |
Ireland (0.1%) | |
Ireland Government Bond, | |
5.40%, 3/13/25 | | EUR | 10 | | | | 15 | | |
Italy (1.9%) | |
Italy Buoni Poliennali Del Tesoro, | |
1.50%, 6/1/25 | | | 20 | | | | 22 | | |
1.65%, 3/1/32 (c) | | | 80 | | | | 82 | | |
2.35%, 9/15/24 (c) | | | 130 | | | | 165 | | |
| | | | 269 | | |
Japan (3.5%) | |
Japan Government Ten Year Bond, | |
0.50%, 9/20/24 | | JPY | 36,000 | | | | 307 | | |
Japan Government Thirty Year Bond, | |
2.00%, 9/20/40 | | | 18,600 | | | | 178 | | |
| | | | 485 | | |
Mexico (0.2%) | |
Petroleos Mexicanos, | |
6.38%, 1/23/45 | | $ | 25 | | | | 23 | | |
| | | Face
Amount
(000) | | Value
(000) | |
Netherlands (0.4%) | |
Netherlands Government Bond, | |
0.25%, 7/15/25 (c) | | EUR | 50 | | | $ | 53 | | |
New Zealand (0.8%) | |
New Zealand Government Bond, | |
5.50%, 4/15/23 | | NZD | 160 | | | | 120 | | |
Poland (0.4%) | |
Poland Government Bond, | |
4.00%, 10/25/23 | | PLN | 210 | | | | 60 | | |
South Africa (0.6%) | |
South Africa Government Bond, | |
8.00%, 1/31/30 | | ZAR | 1,300 | | | | 88 | | |
Spain (1.3%) | |
Spain Government Bond, | |
4.20%, 1/31/37 (c) | | EUR | 80 | | | | 109 | | |
Spain Government Inflation Linked Bond, | |
1.00%, 11/30/30 (c) | | | 40 | | | | 43 | | |
1.80%, 11/30/24 (c) | | | 30 | | | | 36 | | |
| | | | 188 | | |
United Kingdom (3.4%) | |
United Kingdom Gilt, | |
2.75%, 9/7/24 | | GBP | 130 | | | | 214 | | |
4.25%, 6/7/32 - 9/7/39 | | | 130 | | | | 257 | | |
| | | | 471 | | |
| | | | 2,595 | | |
U.S. Treasury Securities (6.6%) | |
United States (6.6%) | |
U.S. Treasury Bond, | |
3.50%, 2/15/39 | | $ | 140 | | | | 158 | | |
U.S. Treasury Inflation Indexed Bond, | |
0.25%, 1/15/25 | | | 262 | | | | 251 | | |
U.S. Treasury Notes, | |
0.63%, 9/30/17 | | | 220 | | | | 220 | | |
2.38%, 6/30/18 | | | 290 | | | | 302 | | |
| | | | 931 | | |
Total Fixed Income Securities (Cost $6,310) | | | 6,203 | | |
| | | Shares | | | |
Common Stocks (37.1%) | |
Australia (1.6%) | |
Ansell Ltd. | | | 408 | | | | 5 | | |
APA Group | | | 600 | | | | 4 | | |
ARB Corp., Ltd. | | | 1,131 | | | | 11 | | |
AusNet Services | | | 921 | | | | 1 | | |
Automotive Holdings Group Ltd. | | | 3,150 | | | | 9 | | |
BlueScope Steel Ltd. | | | 2,800 | | | | 7 | | |
BWP Trust REIT | | | 4,527 | | | | 10 | | |
Challenger Ltd. | | | 2,164 | | | | 11 | | |
Downer EDI Ltd. | | | 2,531 | | | | 6 | | |
DUET Group | | | 6,148 | | | | 9 | | |
Evolution Mining Ltd. | | | 1,005 | | | | 1 | | |
Goodman Group REIT | | | 846 | | | | 3 | | |
The accompanying notes are an integral part of the financial statements.
8
Morgan Stanley Institutional Fund Trust
Annual Report — September 30, 2015
Portfolio of Investments (cont'd)
Global Multi-Asset Income Portfolio
| | | Shares | | Value
(000) | |
Australia (cont'd) | |
GPT Group REIT | | | 1,161 | | | $ | 4 | | |
GrainCorp Ltd. | | | 1,245 | | | | 8 | | |
Invocare Ltd. | | | 866 | | | | 7 | | |
IOOF Holdings Ltd. | | | 3,233 | | | | 20 | | |
JB Hi-Fi Ltd. | | | 601 | | | | 8 | | |
Macquarie Atlas Roads Group | | | 228 | | | | 1 | | |
Newcrest Mining Ltd. (e) | | | 463 | | | | 4 | | |
Northern Star Resources Ltd. | | | 627 | | | | 1 | | |
Oil Search Ltd. | | | 1,344 | | | | 7 | | |
Perpetual Ltd. | | | 563 | | | | 16 | | |
Primary Health Care Ltd. | | | 1,955 | | | | 5 | | |
Scentre Group REIT | | | 1,969 | | | | 5 | | |
Shopping Centres Australasia Property Group REIT | | | 7,252 | | | | 10 | | |
Sims Metal Management Ltd. | | | 934 | | | | 6 | | |
Spark Infrastructure Group | | | 5,806 | | | | 8 | | |
Stockland REIT | | | 1,304 | | | | 3 | | |
Sydney Airport | | | 595 | | | | 2 | | |
Transurban Group | | | 1,054 | | | | 7 | | |
Veda Group Ltd. | | | 8,420 | | | | 16 | | |
Westfield Corp. REIT | | | 694 | | | | 5 | | |
| | | | 220 | | |
Austria (0.1%) | |
Erste Group Bank AG (e) | | | 391 | | | | 11 | | |
Belgium (0.7%) | |
Anheuser-Busch InBev N.V. | | | 521 | | | | 55 | | |
Cofinimmo SA REIT | | | 43 | | | | 5 | | |
Elia System Operator SA | | | 19 | | | | 1 | | |
KBC Groep N.V. | | | 707 | | | | 45 | | |
Viohalco SA (e) | | | 25 | | | | — | @ | |
| | | | 106 | | |
Brazil (0.0%) | |
Cia de Saneamento Basico do Estado de
Sao Paulo ADR | | | 200 | | | | 1 | | |
Canada (1.6%) | |
Agnico-Eagle Mines Ltd. | | | 150 | | | | 4 | | |
Alimentation Couche-Tard, Inc. | | | 100 | | | | 5 | | |
ARC Resources Ltd. | | | 100 | | | | 1 | | |
Bank of Montreal | | | 100 | | | | 5 | | |
Bank of Nova Scotia | | | 200 | | | | 9 | | |
Barrick Gold Corp. | | | 600 | | | | 4 | | |
Barrick Gold Corp. | | | 200 | | | | 1 | | |
Blackberry Ltd. (e) | | | 100 | | | | 1 | | |
Brookfield Asset Management, Inc., Class A | | | 200 | | | | 6 | | |
Cameco Corp. | | | 100 | | | | 1 | | |
Canadian Imperial Bank of Commerce | | | 100 | | | | 7 | | |
Canadian National Railway Co. | | | 100 | | | | 6 | | |
Canadian Natural Resources Ltd. | | | 200 | | | | 4 | | |
Cenovus Energy, Inc. | | | 100 | | | | 1 | | |
Centerra Gold, Inc. | | | 300 | | | | 2 | | |
Cominar Real Estate Investment Trust REIT | | | 400 | | | | 5 | | |
Crescent Point Energy Corp. | | | 100 | | | | 1 | | |
Detour Gold Corp. (e) | | | 150 | | | | 2 | | |
| | | Shares | | Value
(000) | |
Eldorado Gold Corp. | | | 600 | | | $ | 2 | | |
Enbridge, Inc. | | | 600 | | | | 22 | | |
Encana Corp. | | | 200 | | | | 1 | | |
First Quantum Minerals Ltd. | | | 100 | | | | — | @ | |
Fortis, Inc. | | | 300 | | | | 9 | | |
Franco-Nevada Corp. | | | 150 | | | | 7 | | |
Goldcorp, Inc. | | | 300 | | | | 4 | | |
Goldcorp, Inc. | | | 200 | | | | 2 | | |
H&R Real Estate Investment Trust REIT | | | 200 | | | | 3 | | |
Husky Energy, Inc. | | | 100 | | | | 2 | | |
Imperial Oil Ltd. | | | 100 | | | | 3 | | |
Inter Pipeline Ltd. | | | 300 | | | | 6 | | |
Keyera Corp. | | | 100 | | | | 3 | | |
Kinross Gold Corp. (e) | | | 1,190 | | | | 2 | | |
Lululemon Athletica, Inc. (e) | | | 100 | | | | 5 | | |
Magna International, Inc. | | | 100 | | | | 5 | | |
Manulife Financial Corp. | | | 300 | | | | 5 | | |
New Gold, Inc. (e) | | | 600 | | | | 1 | | |
Osisko Gold Royalties Ltd. | | | 150 | | | | 2 | | |
Pan American Silver Corp. | | | 150 | | | | 1 | | |
Pembina Pipeline Corp. | | | 300 | | | | 7 | | |
Potash Corp. of Saskatchewan, Inc. | | | 100 | | | | 2 | | |
Power Corp. of Canada | | | 100 | | | | 2 | | |
RioCan REIT | | | 200 | | | | 4 | | |
Rogers Communications, Inc., Class B | | | 100 | | | | 3 | | |
Royal Bank of Canada | | | 200 | | | | 11 | | |
Shaw Communications, Inc., Class B | | | 100 | | | | 2 | | |
Silver Wheaton Corp. | | | 300 | | | | 4 | | |
Silver Wheaton Corp. | | | 100 | | | | 1 | | |
Sun Life Financial, Inc. | | | 100 | | | | 3 | | |
Suncor Energy, Inc. | | | 200 | | | | 5 | | |
Teck Resources Ltd., Class B | | | 100 | | | | — | @ | |
Thomson Reuters Corp. | | | 100 | | | | 4 | | |
Toronto-Dominion Bank (The) | | | 300 | | | | 12 | | |
TransCanada Corp. | | | 500 | | | | 16 | | |
Veresen, Inc. | | | 200 | | | | 2 | | |
Yamana Gold, Inc. | | | 740 | | | | 1 | | |
| | | | 229 | | |
China (0.1%) | |
Beijing Enterprises Holdings Ltd. (f) | | | 500 | | | | 3 | | |
China Gas Holdings Ltd. (f) | | | 2,000 | | | | 3 | | |
Hanergy Thin Film Power Group Ltd. (e)(f)(g)(h) | | | 2,000 | | | | — | @ | |
Hutchison Port Holdings Trust (Units) (i) | | | 3,100 | | | | 2 | | |
Zijin Mining Group Co., Ltd. H Shares (f) | | | 6,000 | | | | 1 | | |
| | | | 9 | | |
Denmark (0.0%) | |
Danske Bank A/S | | | 14 | | | | — | @ | |
Finland (0.4%) | |
Kone Oyj, Class B | | | 308 | | | | 12 | | |
Nokia Oyj | | | 2,622 | | | | 18 | | |
Sampo Oyj, Class A | | | 419 | | | | 20 | | |
UPM-Kymmene Oyj | | | 591 | | | | 9 | | |
| | | | 59 | | |
The accompanying notes are an integral part of the financial statements.
9
Morgan Stanley Institutional Fund Trust
Annual Report — September 30, 2015
Portfolio of Investments (cont'd)
Global Multi-Asset Income Portfolio
| | | Shares | | Value
(000) | |
France (6.8%) | |
Accor SA | | | 790 | | | $ | 37 | | |
Aeroports de Paris (ADP) | | | 18 | | | | 2 | | |
Air Liquide SA | | | 268 | | | | 32 | | |
Airbus Group SE | | | 388 | | | | 23 | | |
Alcatel-Lucent (e) | | | 2,245 | | | | 8 | | |
Atos SE | | | 220 | | | | 17 | | |
AXA SA | | | 1,184 | | | | 29 | | |
BNP Paribas SA | | | 703 | | | | 41 | | |
Bouygues SA | | | 674 | | | | 24 | | |
Cap Gemini SA | | | 557 | | | | 50 | | |
Carrefour SA | | | 459 | | | | 14 | | |
Cie de Saint-Gobain | | | 1,117 | | | | 49 | | |
Cie Generale des Etablissements Michelin | | | 152 | | | | 14 | | |
Credit Agricole SA | | | 3,394 | | | | 39 | | |
Danone SA | | | 428 | | | | 27 | | |
Engie | | | 993 | | | | 16 | | |
Essilor International SA | | | 169 | | | | 21 | | |
Eutelsat Communications SA | | | 91 | | | | 3 | | |
Gecina SA REIT | | | 30 | | | | 4 | | |
Groupe Eurotunnel SE | | | 832 | | | | 11 | | |
Kering | | | 62 | | | | 10 | | |
Klepierre REIT | | | 77 | | | | 3 | | |
L'Oreal SA | | | 157 | | | | 27 | | |
Legrand SA | | | 285 | | | | 15 | | |
LVMH Moet Hennessy Louis Vuitton SE | | | 174 | | | | 30 | | |
Orange SA | | | 1,290 | | | | 19 | | |
Pernod Ricard SA | | | 167 | | | | 17 | | |
Publicis Groupe SA | | | 191 | | | | 13 | | |
Renault SA | | | 144 | | | | 10 | | |
Rexel SA | | | 531 | | | | 7 | | |
Safran SA | | | 280 | | | | 21 | | |
Sanofi | | | 721 | | | | 69 | | |
Schneider Electric SE | | | 373 | | | | 21 | | |
SES SA | | | 548 | | | | 17 | | |
Societe Generale SA | | | 513 | | | | 23 | | |
Sodexo SA | | | 162 | | | | 13 | | |
Total SA | | | 1,317 | | | | 59 | | |
Unibail-Rodamco SE REIT | | | 107 | | | | 28 | | |
Valeo SA | | | 85 | | | | 11 | | |
Vinci SA | | | 901 | | | | 57 | | |
Vivendi SA | | | 876 | | | | 21 | | |
| | | | 952 | | |
Germany (5.0%) | |
Adidas AG | | | 173 | | | | 14 | | |
Allianz SE (Registered) | | | 278 | | | | 44 | | |
BASF SE | | | 563 | | | | 43 | | |
Bayer AG (Registered) | | | 501 | | | | 64 | | |
Bayerische Motoren Werke AG | | | 203 | | | | 18 | | |
Commerzbank AG (e) | | | 2,202 | | | | 23 | | |
Continental AG | | | 81 | | | | 17 | | |
Daimler AG (Registered) | | | 560 | | | | 41 | | |
| | | Shares | | Value
(000) | |
Deutsche Bank AG (Registered) | | | 952 | | | $ | 26 | | |
Deutsche Boerse AG | | | 586 | | | | 50 | | |
Deutsche Euroshop AG | | | 74 | | | | 3 | | |
Deutsche Post AG (Registered) | | | 689 | | | | 19 | | |
Deutsche Telekom AG (Registered) | | | 1,949 | | | | 35 | | |
Deutsche Wohnen AG | | | 133 | | | | 3 | | |
E.ON SE | | | 1,387 | | | | 12 | | |
Fraport AG Frankfurt Airport Services Worldwide | | | 21 | | | | 1 | | |
Fresenius Medical Care AG & Co., KGaA | | | 160 | | | | 12 | | |
Fresenius SE & Co., KGaA | | | 247 | | | | 17 | | |
Hamburger Hafen und Logistik AG | | | 13 | | | | — | @ | |
HeidelbergCement AG | | | 170 | | | | 12 | | |
Henkel AG & Co., KGaA | | | 105 | | | | 9 | | |
Henkel AG & Co., KGaA (Preference) | | | 136 | | | | 14 | | |
Infineon Technologies AG | | | 1,077 | | | | 12 | | |
Johnson Electric Holdings Ltd. (f) | | | 1,500 | | | | 5 | | |
Linde AG | | | 125 | | | | 20 | | |
Merck KGaA | | | 149 | | | | 13 | | |
Muenchener Rueckversicherungs AG (Registered) | | | 129 | | | | 24 | | |
Porsche Automobil Holding SE (Preference) | | | 146 | | | | 6 | | |
ProSiebenSat.1 Media SE (Registered) | | | 606 | | | | 30 | | |
RWE AG | | | 416 | | | | 5 | | |
SAP SE | | | 563 | | | | 36 | | |
Siemens AG (Registered) | | | 491 | | | | 44 | | |
ThyssenKrupp AG | | | 497 | | | | 9 | | |
Volkswagen AG (Preference) | | | 98 | | | | 11 | | |
Vonovia SE | | | 407 | | | | 13 | | |
| | | | 705 | | |
Greece (0.1%) | |
Aegean Airlines SA | | | 27 | | | | — | @ | |
Alpha Bank AE (e) | | | 1,946 | | | | — | @ | |
Athens Water Supply & Sewage Co., SA (The) | | | 18 | | | | — | @ | |
Attica Bank SA (e) | | | 1,136 | | | | — | @ | |
Ellaktor SA (e) | | | 85 | | | | — | @ | |
Eurobank Ergasias SA (e) | | | 4,737 | | | | — | @ | |
FF Group (e) | | | 29 | | | | 1 | | |
Fourlis Holdings SA (e) | | | 36 | | | | — | @ | |
Frigoglass SAIC (e) | | | 12 | | | | — | @ | |
GEK Terna Holding Real Estate Construction SA (e) | | | 73 | | | | — | @ | |
Grivalia Properties REIC AE REIT | | | 24 | | | | — | @ | |
Hellenic Exchanges - Athens Stock Exchange SA | | | 117 | | | | 1 | | |
Hellenic Petroleum SA (e) | | | 54 | | | | — | @ | |
Hellenic Telecommunications Organization SA | | | 143 | | | | 1 | | |
Intralot SA-Integrated Lottery Systems & Services (e) | | | 31 | | | | — | @ | |
JUMBO SA | | | 118 | | | | 1 | | |
Lamda Development SA (e) | | | 8 | | | | — | @ | |
Marfin Investment Group Holdings SA (e) | | | 491 | | | | — | @ | |
Metka SA | | | 17 | | | | — | @ | |
Motor Oil Hellas Corinth Refineries SA (e) | | | 35 | | | | 1 | | |
Mytilineos Holdings SA (e) | | | 96 | | | | 1 | | |
National Bank of Greece SA (e) | | | 871 | | | | 1 | | |
OPAP SA | | | 123 | | | | 1 | | |
The accompanying notes are an integral part of the financial statements.
10
Morgan Stanley Institutional Fund Trust
Annual Report — September 30, 2015
Portfolio of Investments (cont'd)
Global Multi-Asset Income Portfolio
| | | Shares | | Value
(000) | |
Greece (cont'd) | |
Piraeus Bank SA (e) | | | 1,072 | | | $ | — | @ | |
Piraeus Port Authority SA | | | 3 | | | | — | @ | |
Public Power Corp. SA | | | 203 | | | | 1 | | |
Sarantis SA | | | 4 | | | | — | @ | |
Terna Energy SA (e) | | | 22 | | | | — | @ | |
Thrace Plastics Co., SA | | | 15 | | | | — | @ | |
Titan Cement Co., SA | | | 20 | | | | 1 | | |
| | | | 10 | | |
Hong Kong (0.5%) | |
Beijing Enterprises Water Group Ltd. (e) | | | 2,000 | | | | 1 | | |
Champion REIT | | | 9,000 | | | | 5 | | |
Great Eagle Holdings Ltd. | | | 2,017 | | | | 6 | | |
Hang Lung Group Ltd. | | | 1,000 | | | | 3 | | |
Hang Lung Properties Ltd. | | | 1,000 | | | | 2 | | |
Hong Kong & China Gas Co., Ltd. | | | 4,400 | | | | 8 | | |
Hongkong & Shanghai Hotels Ltd. (The) | | | 3,032 | | | | 3 | | |
Hongkong Land Holdings Ltd. | | | 400 | | | | 3 | | |
Hopewell Holdings Ltd. | | | 1,500 | | | | 5 | | |
HSBC Holdings PLC | | | 1,208 | | | | 9 | | |
Kowloon Development Co., Ltd. REIT | | | 6,000 | | | | 7 | | |
Link REIT (The) | | | 1,000 | | | | 6 | | |
New World Development Co., Ltd. | | | 4,000 | | | | 4 | | |
Stella International Holdings Ltd. | | | 1,500 | | | | 4 | | |
| | | | 66 | | |
Ireland (0.5%) | |
Bank of Ireland (e) | | | 20,873 | | | | 8 | | |
Bank of Ireland (e) | | | 33,548 | | | | 13 | | |
CRH PLC | | | 1,502 | | | | 40 | | |
Kerry Group PLC, Class A | | | 107 | | | | 8 | | |
| | | | 69 | | |
Italy (2.5%) | |
Assicurazioni Generali SpA | | | 903 | | | | 17 | | |
Atlantia SpA | | | 1,923 | | | | 54 | | |
Banca Monte dei Paschi di Siena SpA (e) | | | 123 | | | | — | @ | |
Banco Popolare SC (e) | | | 347 | | | | 5 | | |
Enel SpA | | | 4,766 | | | | 21 | | |
Eni SpA | | | 1,766 | | | | 28 | | |
Intesa Sanpaolo SpA | | | 25,434 | | | | 90 | | |
Luxottica Group SpA | | | 184 | | | | 13 | | |
Mediobanca SpA | | | 2,888 | | | | 28 | | |
Snam SpA | | | 3,511 | | | | 18 | | |
Societa Iniziative Autostradali e Servizi SpA | | | 38 | | | | — | @ | |
Telecom Italia SpA (e) | | | 9,037 | | | | 11 | | |
Terna Rete Elettrica Nazionale SpA | | | 780 | | | | 4 | | |
UniCredit SpA | | | 9,587 | | | | 60 | | |
Unione di Banche Italiane SCPA | | | 952 | | | | 7 | | |
| | | | 356 | | |
Japan (0.2%) | |
Japan Real Estate Investment Corp. REIT | | | 1 | | | | 4 | | |
Japan Retail Fund Investment Corp. REIT | | | 2 | | | | 4 | | |
Mizuho Financial Group, Inc. | | | 400 | | | | 1 | | |
| | | Shares | | Value
(000) | |
Nippon Building Fund, Inc. REIT | | | 1 | | | $ | 5 | | |
Resona Holdings, Inc. | | | 100 | | | | 1 | | |
Tokyo Gas Co., Ltd. | | | 1,000 | | | | 5 | | |
United Urban Investment Corp. REIT | | | 2 | | | | 2 | | |
| | | | 22 | | |
Mexico (0.0%) | |
Empresas ICA SAB de CV ADR (e) | | | 100 | | | | — | @ | |
Netherlands (1.8%) | |
Aegon N.V. | | | 1,605 | | | | 9 | | |
Akzo Nobel N.V. | | | 245 | | | | 16 | | |
ArcelorMittal | | | 976 | | | | 5 | | |
ASML Holding N.V. | | | 211 | | | | 19 | | |
Fiat Chrysler Automobiles N.V. (e) | | | 670 | | | | 9 | | |
Heineken N.V. | | | 204 | | | | 17 | | |
ING Groep N.V. CVA | | | 2,480 | | | | 35 | | |
Koninklijke Ahold N.V. | | | 895 | | | | 17 | | |
Koninklijke KPN N.V. | | | 3,064 | | | | 11 | | |
Koninklijke Philips N.V. | | | 768 | | | | 18 | | |
Koninklijke Vopak N.V. | | | 39 | | | | 2 | | |
Randstad Holding N.V. | | | 440 | | | | 26 | | |
RELX N.V. | | | 1,056 | | | | 17 | | |
Unilever N.V. CVA | | | 1,001 | | | | 40 | | |
Wolters Kluwer N.V. | | | 440 | | | | 14 | | |
| | | | 255 | | |
New Zealand (0.0%) | |
Auckland International Airport Ltd. | | | 523 | | | | 2 | | |
Nicaragua (0.0%) | |
B2Gold Corp. (e) | | | 900 | | | | 1 | | |
Norway (0.0%) | |
DNB ASA | | | 43 | | | | 1 | | |
Peru (0.0%) | |
Cia de Minas Buenaventura SA ADR | | | 300 | | | | 2 | | |
Portugal (0.1%) | |
Banco Comercial Portugues SA (e) | | | 51,912 | | | | 2 | | |
EDP - Energias de Portugal SA | | | 3,523 | | | | 13 | | |
| | | | 15 | | |
Singapore (0.1%) | |
CapitaLand Ltd. | | | 1,500 | | | | 3 | | |
City Developments Ltd. | | | 500 | | | | 3 | | |
Global Logistic Properties Ltd. | | | 1,700 | | | | 2 | | |
| | | | 8 | | |
South Africa (0.1%) | |
AngloGold Ashanti Ltd. ADR (e) | | | 300 | | | | 3 | | |
Gold Fields Ltd. ADR | | | 900 | | | | 2 | | |
SABMiller PLC | | | 142 | | | | 8 | | |
| | | | 13 | | |
Spain (2.5%) | |
Abertis Infraestructuras SA | | | 217 | | | | 3 | | |
Amadeus IT Holding SA, Class A | | | 415 | | | | 18 | | |
Banco Bilbao Vizcaya Argentaria SA | | | 4,643 | | | | 39 | | |
Banco de Sabadell SA | | | 9,081 | | | | 17 | | |
The accompanying notes are an integral part of the financial statements.
11
Morgan Stanley Institutional Fund Trust
Annual Report — September 30, 2015
Portfolio of Investments (cont'd)
Global Multi-Asset Income Portfolio
| | | Shares | | Value
(000) | |
Spain (cont'd) | |
Banco Popular Espanol SA | | | 2,360 | | | $ | 9 | | |
Banco Santander SA | | | 8,873 | | | | 47 | | |
Bankia SA | | | 12,699 | | | | 16 | | |
Bankinter SA | | | 1,019 | | | | 8 | | |
CaixaBank SA | | | 9,462 | | | | 37 | | |
Enagas SA | | | 120 | | | | 3 | | |
Ferrovial SA | | | 234 | | | | 6 | | |
Iberdrola SA | | | 4,596 | | | | 31 | | |
Industria de Diseno Textil SA | | | 730 | | | | 24 | | |
International Consolidated Airlines Group SA (e) | | | 3,518 | | | | 31 | | |
Obrascon Huarte Lain SA | | | 21 | | | | — | @ | |
Red Electrica Corp., SA | | | 62 | | | | 5 | | |
Repsol SA | | | 1,143 | | | | 13 | | |
Telefonica SA | | | 3,008 | | | | 37 | | |
| | | | 344 | | |
Sweden (0.0%) | |
Castellum AB | | | 206 | | | | 3 | | |
Nordea Bank AB | | | 61 | | | | 1 | | |
Skandinaviska Enskilda Banken AB, Class A | | | 67 | | | | 1 | | |
Svenska Handelsbanken AB, Class A | | | 29 | | | | — | @ | |
Swedbank AB, Class A | | | 18 | | | | — | @ | |
| | | | 5 | | |
Switzerland (0.4%) | |
Adecco SA (Registered) (e) | | | 525 | | | | 38 | | |
Coca-Cola HBC AG (e) | | | 28 | | | | 1 | | |
Flughafen Zuerich AG (Registered) | | | 2 | | | | 1 | | |
LafargeHolcim Ltd. (Registered) (e) | | | 155 | | | | 8 | | |
Swiss Prime Site AG (Registered) (e) | | | 38 | | | | 3 | | |
| | | | 51 | | |
United Kingdom (2.5%) | |
ARM Holdings PLC | | | 304 | | | | 4 | | |
AstraZeneca PLC | | | 166 | | | | 11 | | |
Aviva PLC | | | 707 | | | | 5 | | |
BAE Systems PLC | | | 932 | | | | 6 | | |
Barclays PLC | | | 2,683 | | | | 10 | | |
BG Group PLC | | | 450 | | | | 7 | | |
BHP Billiton PLC | | | 312 | | | | 5 | | |
| BP PLC | | | 2,445 | | | | 12 | | |
British American Tobacco PLC | | | 248 | | | | 14 | | |
British Land Co., PLC REIT | | | 513 | | | | 7 | | |
BT Group PLC | | | 1,276 | | | | 8 | | |
Capital & Counties Properties PLC | | | 569 | | | | 4 | | |
Compass Group PLC | | | 488 | | | | 8 | | |
Diageo PLC | | | 351 | | | | 10 | | |
GlaxoSmithKline PLC | | | 633 | | | | 12 | | |
Glencore PLC (e) | | | 1,632 | | | | 2 | | |
Hammerson PLC REIT | | | 564 | | | | 5 | | |
Henderson Group PLC | | | 571 | | | | 2 | | |
HSBC Holdings PLC | | | 2,709 | | | | 21 | | |
Imperial Tobacco Group PLC | | | 166 | | | | 9 | | |
Land Securities Group PLC REIT | | | 369 | | | | 7 | | |
| | | Shares | | Value
(000) | |
Liberty Global PLC LiLAC Series C (e) | | | 5 | | | $ | — | @ | |
Lloyds Banking Group PLC | | | 9,000 | | | | 10 | | |
National Grid PLC | | | 2,949 | | | | 41 | | |
Next PLC | | | 47 | | | | 5 | | |
Pennon Group PLC | | | 221 | | | | 3 | | |
Prudential PLC | | | 462 | | | | 10 | | |
Reckitt Benckiser Group PLC | | | 103 | | | | 9 | | |
Rio Tinto PLC | | | 186 | | | | 6 | | |
Rolls-Royce Holdings PLC (e) | | | 304 | | | | 3 | | |
Royal Bank of Scotland Group PLC (e) | | | 144 | | | | 1 | | |
Royal Dutch Shell PLC, Class A | | | 757 | | | | 18 | | |
Severn Trent PLC | | | 134 | | | | 4 | | |
Shire PLC | | | 83 | | | | 6 | | |
Taylor Wimpey PLC | | | 1,417 | | | | 4 | | |
Tesco PLC | | | 1,173 | | | | 3 | | |
Unilever PLC | | | 218 | | | | 9 | | |
United Utilities Group PLC | | | 383 | | | | 5 | | |
Verizon Communications, Inc. | | | 400 | | | | 17 | | |
Vodafone Group PLC | | | 3,442 | | | | 11 | | |
Wolseley PLC | | | 107 | | | | 6 | | |
WPP PLC | | | 379 | | | | 8 | | |
| | | | 348 | | |
United States (9.5%) | |
Abbott Laboratories | | | 100 | | | | 4 | | |
AbbVie, Inc. | | | 200 | | | | 11 | | |
AGL Resources, Inc. | | | 100 | | | | 6 | | |
Alamos Gold, Inc., Class A (e) | | | 300 | | | | 1 | | |
Alcoa, Inc. | | | 100 | | | | 1 | | |
Alexandria Real Estate Equities, Inc. REIT | | | 100 | | | | 8 | | |
Altria Group, Inc. | | | 200 | | | | 11 | | |
American Campus Communities, Inc. REIT | | | 100 | | | | 4 | | |
American International Group, Inc. | | | 100 | | | | 6 | | |
American Tower Corp. REIT | | | 200 | | | | 18 | | |
American Water Works Co., Inc. | | | 100 | | | | 5 | | |
Annaly Capital Management, Inc. REIT | | | 100 | | | | 1 | | |
Apple, Inc. | | | 700 | | | | 77 | | |
Applied Materials, Inc. | | | 100 | | | | 1 | | |
Aqua America, Inc. | | | 100 | | | | 3 | | |
AT&T, Inc. | | | 500 | | | | 16 | | |
Atmos Energy Corp. | | | 100 | | | | 6 | | |
Bank of America Corp. | | | 1,700 | | | | 26 | | |
Bank of New York Mellon Corp. (The) | | | 100 | | | | 4 | | |
Bed Bath & Beyond, Inc. (e) | | | 100 | | | | 6 | | |
Berkshire Hathaway, Inc., Class B (e) | | | 100 | | | | 13 | | |
Best Buy Co., Inc. | | | 100 | | | | 4 | | |
Bloomin' Brands, Inc. | | | 100 | | | | 2 | | |
Boston Properties, Inc. REIT | | | 100 | | | | 12 | | |
Boston Scientific Corp. (e) | | | 100 | | | | 2 | | |
Bristol-Myers Squibb Co. | | | 200 | | | | 12 | | |
Care Capital Properties, Inc. REIT | | | 25 | | | | 1 | | |
CenterPoint Energy, Inc. | | | 200 | | | | 4 | | |
Charles Schwab Corp. (The) | | | 100 | | | | 3 | | |
The accompanying notes are an integral part of the financial statements.
12
Morgan Stanley Institutional Fund Trust
Annual Report — September 30, 2015
Portfolio of Investments (cont'd)
Global Multi-Asset Income Portfolio
| | | Shares | | Value
(000) | |
United States (cont'd) | |
Chemours Co. (The) | | | 20 | | | $ | — | @ | |
Cheniere Energy, Inc. (e) | | | 100 | | | | 5 | | |
Chevron Corp. | | | 200 | | | | 16 | | |
Cisco Systems, Inc. | | | 700 | | | | 18 | | |
Citigroup, Inc. | | | 400 | | | | 20 | | |
Coca-Cola Co. | | | 600 | | | | 24 | | |
Colgate-Palmolive Co. | | | 100 | | | | 6 | | |
Columbia Pipeline Group, Inc. | | | 200 | | | | 4 | | |
Comcast Corp., Class A | | | 200 | | | | 11 | | |
ConocoPhillips | | | 100 | | | | 5 | | |
Consolidated Edison, Inc. | | | 200 | | | | 13 | | |
Corning, Inc. | | | 100 | | | | 2 | | |
Crown Castle International Corp. REIT | | | 200 | | | | 16 | | |
CSX Corp. | | | 100 | | | | 3 | | |
CVS Health Corp. | | | 100 | | | | 10 | | |
Danaher Corp. | | | 17 | | | | 1 | | |
DDR Corp. REIT | | | 300 | | | | 5 | | |
Digital Realty Trust, Inc. REIT | | | 100 | | | | 6 | | |
Dollar General Corp. | | | 100 | | | | 7 | | |
Dollar Tree, Inc. (e) | | | 24 | | | | 2 | | |
Dominion Resources, Inc. | | | 100 | | | | 7 | | |
Duke Realty Corp. REIT | | | 200 | | | | 4 | | |
eBay, Inc. (e) | | | 100 | | | | 2 | | |
EMC Corp. | | | 200 | | | | 5 | | |
Equity Lifestyle Properties, Inc. REIT | | | 100 | | | | 6 | | |
Equity Residential REIT | | | 100 | | | | 7 | | |
Eversource Energy | | | 200 | | | | 10 | | |
Express Scripts Holding Co. (e) | | | 100 | | | | 8 | | |
Extra Space Storage, Inc. REIT | | | 100 | | | | 8 | | |
Exxon Mobil Corp. | | | 400 | | | | 30 | | |
Facebook, Inc., Class A (e) | | | 200 | | | | 18 | | |
Ford Motor Co. | | | 300 | | | | 4 | | |
Freeport-McMoRan, Inc. | | | 100 | | | | 1 | | |
Gap, Inc. (The) | | | 100 | | | | 3 | | |
General Electric Co. | | | 1,300 | | | | 33 | | |
General Growth Properties, Inc. REIT | | | 300 | | | | 8 | | |
General Motors Co. | | | 100 | | | | 3 | | |
Gilead Sciences, Inc. | | | 100 | | | | 10 | | |
H&R Block, Inc. | | | 100 | | | | 4 | | |
Hanesbrands, Inc. | | | 100 | | | | 3 | | |
HCP, Inc. REIT | | | 200 | | | | 7 | | |
Hecla Mining Co. | | | 450 | | | | 1 | | |
Hewlett-Packard Co. | | | 200 | | | | 5 | | |
Highwoods Properties, Inc. REIT | | | 100 | | | | 4 | | |
Home Depot, Inc. | | | 100 | | | | 11 | | |
Host Hotels & Resorts, Inc. REIT | | | 300 | | | | 5 | | |
Huntington Bancshares, Inc. | | | 100 | | | | 1 | | |
Intel Corp. | | | 600 | | | | 18 | | |
ITC Holdings Corp. | | | 100 | | | | 3 | | |
Johnson & Johnson | | | 300 | | | | 28 | | |
JPMorgan Chase & Co. | | | 400 | | | | 24 | | |
Kilroy Realty Corp. REIT | | | 100 | | | | 6 | | |
| | | Shares | | Value
(000) | |
Kimco Realty Corp. REIT | | | 200 | | | $ | 5 | | |
Kinder Morgan, Inc. | | | 1,100 | | | | 30 | | |
Kraft Heinz Co. (The) | | | 100 | | | | 7 | | |
L Brands, Inc. | | | 100 | | | | 9 | | |
Liberty Property Trust REIT | | | 100 | | | | 3 | | |
Macerich Co. (The) REIT | | | 100 | | | | 8 | | |
Macy's, Inc. | | | 100 | | | | 5 | | |
Marriott International, Inc., Class A | | | 100 | | | | 7 | | |
Medtronic PLC | | | 100 | | | | 7 | | |
Merck & Co., Inc. | | | 300 | | | | 15 | | |
MetLife, Inc. | | | 100 | | | | 5 | | |
Micron Technology, Inc. (e) | | | 100 | | | | 1 | | |
Microsoft Corp. | | | 1,100 | | | | 49 | | |
Mid-America Apartment Communities, Inc. REIT | | | 100 | | | | 8 | | |
Mondelez International, Inc., Class A | | | 200 | | | | 8 | | |
National Health Investors, Inc. REIT | | | 100 | | | | 6 | | |
National Retail Properties, Inc. REIT | | | 100 | | | | 4 | | |
NetScout Systems, Inc. (e) | | | 199 | | | | 7 | | |
Newmont Mining Corp. | | | 300 | | | | 5 | | |
NiSource, Inc. | | | 200 | | | | 4 | | |
ONEOK, Inc. | | | 100 | | | | 3 | | |
Oracle Corp. | | | 500 | | | | 18 | | |
PayPal Holdings, Inc. (e) | | | 100 | | | | 3 | | |
Pepco Holdings, Inc. | | | 100 | | | | 2 | | |
PepsiCo, Inc. | | | 100 | | | | 9 | | |
Pfizer, Inc. | | | 900 | | | | 28 | | |
PG&E Corp. | | | 300 | | | | 16 | | |
Philip Morris International, Inc. | | | 100 | | | | 8 | | |
Procter & Gamble Co. (The) | | | 300 | | | | 21 | | |
ProLogis, Inc. REIT | | | 200 | | | | 8 | | |
Public Storage REIT | | | 100 | | | | 21 | | |
QUALCOMM, Inc. | | | 200 | | | | 11 | | |
Realty Income Corp. REIT | | | 100 | | | | 5 | | |
Regency Centers Corp. REIT | | | 100 | | | | 6 | | |
Regions Financial Corp. | | | 100 | | | | 1 | | |
Ross Stores, Inc. | | | 100 | | | | 5 | | |
SBA Communications Corp., Class A (e) | | | 100 | | | | 10 | | |
Schlumberger Ltd. | | | 100 | | | | 7 | | |
Sempra Energy | | | 100 | | | | 10 | | |
Sibanye Gold Ltd. ADR | | | 300 | | | | 1 | | |
Simon Property Group, Inc. REIT | | | 100 | | | | 18 | | |
Sirius XM Holdings, Inc. (e) | | | 200 | | | | 1 | | |
Spectra Energy Corp. | | | 500 | | | | 13 | | |
Starbucks Corp. | | | 100 | | | | 6 | | |
Tahoe Resources, Inc. | | | 300 | | | | 2 | | |
Target Corp. | | | 300 | | | | 24 | | |
Texas Instruments, Inc. | | | 100 | | | | 5 | | |
TJX Cos., Inc. (The) | | | 200 | | | | 14 | | |
Twenty-First Century Fox, Inc., Class A | | | 100 | | | | 3 | | |
UDR, Inc. REIT | | | 100 | | | | 3 | | |
US Bancorp | | | 200 | | | | 8 | | |
Ventas, Inc. REIT | | | 100 | | | | 6 | | |
VEREIT, Inc. REIT | | | 400 | | | | 3 | | |
The accompanying notes are an integral part of the financial statements.
13
Morgan Stanley Institutional Fund Trust
Annual Report — September 30, 2015
Portfolio of Investments (cont'd)
Global Multi-Asset Income Portfolio
| | | Shares | | Value
(000) | |
United States (cont'd) | |
Visa, Inc., Class A | | | 200 | | | $ | 14 | | |
Vornado Realty Trust REIT | | | 100 | | | | 9 | | |
Wal-Mart Stores, Inc. | | | 200 | | | | 13 | | |
Walt Disney Co. (The) | | | 200 | | | | 20 | | |
Wells Fargo & Co. | | | 600 | | | | 31 | | |
Welltower, Inc. | | | 100 | | | | 7 | | |
Williams Cos., Inc. (The) | | | 400 | | | | 15 | | |
WP Carey, Inc. REIT | | | 100 | | | | 6 | | |
Xerox Corp. | | | 100 | | | | 1 | | |
Yahoo!, Inc. (e) | | | 100 | | | | 3 | | |
| | | | 1,340 | | |
Total Common Stocks (Cost $5,821) | | | 5,200 | | |
Investment Companies (7.0%) | |
United States (7.0%) | |
Morgan Stanley Institutional Fund Trust —
High Yield Portfolio (See Note G) | | | 57,692 | | | | 565 | | |
Morgan Stanley Institutional Fund, Inc. —
Emerging Markets Fixed Income
Opportunities Portfolio (See Note G) | | | 47,690 | | | | 417 | | |
Total Investment Companies (Cost $1,054) | | | 982 | | |
Short-Term Investments (14.7%) | |
Investment Company (12.4%) | |
Morgan Stanley Institutional Liquidity
Funds — Money Market Portfolio —
Institutional Class (See Note G)
(Cost $1,742) | | | 1,741,588 | | | | 1,742 | | |
| | | Face
Amount
(000) | | | |
U.S. Treasury Security (2.3%) | |
U.S. Treasury Bill, | |
| 0.26%, 3/10/16 (j)(k) (Cost $318) | | $ | 318 | | | | 318 | | |
Total Short-Term Investments (Cost $2,060) | | | 2,060 | | |
Total Investments (103.0%) (Cost $15,245) (l)(m)(n) | | | 14,445 | | |
Liabilities in Excess of Other Assets (-3.0%) | | | (414 | ) | |
Net Assets (100.0%) | | $ | 14,031 | | |
(a) Security is subject to delayed delivery.
(b) Variable/Floating Rate Security — Interest rate changes on these instruments are based on changes in a designated base rate. The rates shown are those in effect on September 30, 2015.
(c) 144A security — Certain conditions for public sale may exist. Unless otherwise noted, these securities are deemed to be liquid.
(d) Multi-step — Coupon rate changes in predetermined increments to maturity. Rate disclosed is as of September 30, 2015. Maturity date disclosed is the ultimate maturity date.
(e) Non-income producing security.
(f) Security trades on the Hong Kong exchange.
(g) At September 30, 2015, the Portfolio held a fair valued security valued at less than $500, representing less than 0.05% of net assets. This security has been fair valued as determined in good faith under procedures established by and under the general supervision of the Fund's Trustees.
(h) Security has been deemed illiquid at September 30, 2015.
(i) Consists of one or more classes of securities traded together as a unit; stocks with attached warrants.
(j) Rate shown is the yield to maturity at September 30, 2015.
(k) All or a portion of the security was pledged to cover margin requirements for swap agreements.
(l) Securities are available for collateral in connection with securities purchased on a forward commitment basis, open call options written, foreign currency forward exchange contracts, futures contracts and swap agreements.
(m) The approximate fair value and percentage of net assets, $3,605,000 and 25.7%, respectively, represent the securities that have been fair valued under the fair valuation policy for international investments as described in Note A-1 within the Notes to the Financial Statements.
(n) At September 30, 2015, the aggregate cost for Federal income tax purposes is approximately $15,293,000. The aggregate gross unrealized appreciation is approximately $173,000 and the aggregate gross unrealized depreciation is approximately $1,021,000 resulting in net unrealized depreciation of approximately $848,000.
ADR American Depositary Receipt.
CVA Certificaten Van Aandelen.
OAT Obligations Assimilables du Trésor (French Treasury Obligation).
REIT Real Estate Investment Trust.
TBA To Be Announced.
The accompanying notes are an integral part of the financial statements.
14
Morgan Stanley Institutional Fund Trust
Annual Report — September 30, 2015
Portfolio of Investments (cont'd)
Global Multi-Asset Income Portfolio
Call Options Written:
The Portfolio had the following call options written open at September 30, 2015:
Number of
Contracts | | Description | | Strike Price | | Expiration
Date | | Value
(000) | |
| EUR 110 | | Euro Stoxx 50 Index
(Premiums received $10) | | $ | 3,175.00 | | | |
Oct-15 | | | $ | (5 | ) | |
| JPY 3,000 | | NIKKEI Index
(Premiums received $10) | | | 18,375.00 | | | |
Oct-15 | | | | (2 | ) | |
| USD 120 | | iShares MSCI Emerging
Markets Index Fund
(Premiums received $10) | | | 34.50 | | | |
Oct-15 | | | | (2 | ) | |
| USD 3 | | S&P 500 Index
(Premiums received $11) | | | 1,975.00 | | | |
Oct-15 | | | | (3 | ) | |
| | | | | | | | | $ | (12 | ) | |
Foreign Currency Forward Exchange Contracts:
The Portfolio had the following foreign currency forward exchange contracts open at September 30, 2015:
Counterparty | | Currency to
Deliver
(000) | | Value
(000) | | Settlement
Date | | In Exchange
For
(000) | | Value
(000) | | Unrealized
Appreciation
(Depreciation)
(000) | |
Citibank NA | | NOK | 208 | | | $ | 24 | | | 10/5/15 | | USD | 25 | | | $ | 25 | | | $ | 1 | | |
Deutsche Bank AG | | EUR | 47 | | | | 52 | | | 10/5/15 | | USD | 52 | | | | 52 | | | | (— | @) | |
Deutsche Bank AG | | MXN | 1,299 | | | | 77 | | | 10/5/15 | | USD | 77 | | | | 77 | | | | (— | @) | |
Deutsche Bank AG | | PLN | 60 | | | | 16 | | | 10/5/15 | | USD | 16 | | | | 16 | | | | — | @ | |
Deutsche Bank AG | | USD | 54 | | | | 54 | | | 10/5/15 | | CHF | 52 | | | | 53 | | | | (1 | ) | |
Deutsche Bank AG | | USD | 518 | | | | 518 | | | 10/5/15 | | EUR | 460 | | | | 514 | | | | (4 | ) | |
Deutsche Bank AG | | USD | 58 | | | | 58 | | | 10/5/15 | | GBP | 38 | | | | 57 | | | | (1 | ) | |
HSBC Bank PLC | | NZD | 357 | | | | 228 | | | 10/5/15 | | USD | 226 | | | | 226 | | | | (2 | ) | |
JPMorgan Chase Bank NA | | CAD | 65 | | | | 49 | | | 10/5/15 | | USD | 49 | | | | 49 | | | | (— | @) | |
JPMorgan Chase Bank NA | | GBP | 4 | | | | 6 | | | 10/5/15 | | EUR | 5 | | | | 6 | | | | — | @ | |
JPMorgan Chase Bank NA | | KRW | 93,150 | | | | 79 | | | 10/5/15 | | USD | 79 | | | | 79 | | | | (— | @) | |
JPMorgan Chase Bank NA | | SEK | 24 | | | | 3 | | | 10/5/15 | | USD | 3 | | | | 3 | | | | (— | @) | |
JPMorgan Chase Bank NA | | USD | 5 | | | | 5 | | | 10/5/15 | | EUR | 4 | | | | 5 | | | | — | @ | |
JPMorgan Chase Bank NA | | USD | 2 | | | | 2 | | | 10/5/15 | | JPY | 276 | | | | 2 | | | | (— | @) | |
JPMorgan Chase Bank NA | | USD | 35 | | | | 35 | | | 10/5/15 | | NOK | 296 | | | | 35 | | | | — | @ | |
UBS AG | | CAD | 116 | | | | 87 | | | 10/5/15 | | USD | 88 | | | | 88 | | | | 1 | | |
UBS AG | | CHF | 52 | | | | 53 | | | 10/5/15 | | USD | 53 | | | | 53 | | | | (— | @) | |
UBS AG | | USD | 1 | | | | 1 | | | 10/5/15 | | EUR | 1 | | | | 1 | | | | (— | @) | |
UBS AG | | USD | 5 | | | | 5 | | | 10/5/15 | | GBP | 3 | | | | 5 | | | | (— | @) | |
UBS AG | | USD | 607 | | | | 607 | | | 10/5/15 | | JPY | 72,687 | | | | 606 | | | | (1 | ) | |
UBS AG | | USD | 79 | | | | 79 | | | 10/5/15 | | KRW | 93,150 | | | | 79 | | | | (— | @) | |
UBS AG | | USD | 77 | | | | 77 | | | 10/5/15 | | MXN | 1,303 | | | | 77 | | | | — | @ | |
UBS AG | | USD | 90 | | | | 90 | | | 10/5/15 | | NZD | 143 | | | | 91 | | | | 1 | | |
UBS AG | | USD | 11 | | | | 11 | | | 10/5/15 | | SGD | 15 | | | | 11 | | | | (— | @) | |
UBS AG | | USD | 17 | | | | 17 | | | 10/5/15 | | THB | 625 | | | | 17 | | | | (— | @) | |
UBS AG | | ZAR | 1,041 | | | | 75 | | | 10/5/15 | | USD | 77 | | | | 77 | | | | 2 | | |
JPMorgan Chase Bank NA | | AUD | 125 | | | | 88 | | | 10/6/15 | | USD | 88 | | | | 88 | | | | — | @ | |
JPMorgan Chase Bank NA | | USD | 45 | | | | 45 | | | 10/6/15 | | AUD | 64 | | | | 45 | | | | (— | @) | |
Bank of America NA | | EUR | 89 | | | | 100 | | | 10/15/15 | | USD | 101 | | | | 101 | | | | 1 | | |
Bank of America NA | | EUR | 56 | | | | 63 | | | 10/15/15 | | USD | 63 | | | | 63 | | | | — | @ | |
Bank of America NA | | JPY | 2,146 | | | | 18 | | | 10/15/15 | | USD | 18 | | | | 18 | | | | — | @ | |
Bank of America NA | | USD | 70 | | | | 70 | | | 10/15/15 | | GBP | 46 | | | | 69 | | | | (1 | ) | |
Bank of America NA | | USD | 109 | | | | 109 | | | 10/15/15 | | JPY | 12,944 | | | | 108 | | | | (1 | ) | |
Bank of Montreal | | AUD | 163 | | | | 115 | | | 10/15/15 | | USD | 116 | | | | 116 | | | | 1 | | |
Bank of Montreal | | NZD | 283 | | | | 181 | | | 10/15/15 | | USD | 178 | | | | 178 | | | | (3 | ) | |
Bank of Montreal | | USD | 102 | | | | 102 | | | 10/15/15 | | AUD | 145 | | | | 102 | | | | — | @ | |
Bank of Montreal | | USD | 41 | | | | 41 | | | 10/15/15 | | EUR | 36 | | | | 40 | | | | (1 | ) | |
Bank of Montreal | | USD | 101 | | | | 101 | | | 10/15/15 | | NZD | 159 | | | | 102 | | | | 1 | | |
Bank of Montreal | | USD | 10 | | | | 10 | | | 10/15/15 | | TRY | 32 | | | | 10 | | | | — | @ | |
Bank of New York Mellon | | CHF | 121 | | | | 124 | | | 10/15/15 | | USD | 124 | | | | 124 | | | | — | @ | |
Bank of New York Mellon | | USD | 144 | | | | 144 | | | 10/15/15 | | SEK | 1,190 | | | | 143 | | | | (1 | ) | |
Barclays Bank PLC | | AUD | 54 | | | | 38 | | | 10/15/15 | | USD | 38 | | | | 38 | | | | — | @ | |
The accompanying notes are an integral part of the financial statements.
15
Morgan Stanley Institutional Fund Trust
Annual Report — September 30, 2015
Portfolio of Investments (cont'd)
Global Multi-Asset Income Portfolio
Foreign Currency Forward Exchange Contracts: (cont'd)
Counterparty | | Currency to
Deliver
(000) | | Value
(000) | | Settlement
Date | | In Exchange
For
(000) | | Value
(000) | | Unrealized
Appreciation
(Depreciation)
(000) | |
Barclays Bank PLC | | BRL | 18 | | | $ | 5 | | | 10/15/15 | | USD | 5 | | | $ | 5 | | | $ | — | @ | |
Barclays Bank PLC | | USD | 16 | | | | 16 | | | 10/15/15 | | BRL | 64 | | | | 16 | | | | — | @ | |
Barclays Bank PLC | | USD | 62 | | | | 62 | | | 10/15/15 | | GBP | 41 | | | | 61 | | | | (1 | ) | |
Citibank NA | | EUR | 128 | | | | 143 | | | 10/15/15 | | USD | 144 | | | | 144 | | | | 1 | | |
Citibank NA | | EUR | 38 | | | | 43 | | | 10/15/15 | | USD | 43 | | | | 43 | | | | — | @ | |
Citibank NA | | GBP | 65 | | | | 98 | | | 10/15/15 | | USD | 101 | | | | 101 | | | | 3 | | |
Citibank NA | | GBP | 17 | | | | 26 | | | 10/15/15 | | USD | 26 | | | | 26 | | | | — | @ | |
Citibank NA | | THB | 5,167 | | | | 142 | | | 10/15/15 | | USD | 143 | | | | 143 | | | | 1 | | |
Citibank NA | | USD | 24 | | | | 24 | | | 10/15/15 | | KRW | 28,511 | | | | 24 | | | | — | @ | |
Citibank NA | | USD | 13 | | | | 13 | | | 10/15/15 | | MYR | 55 | | | | 13 | | | | (— | @) | |
Citibank NA | | USD | 8 | | | | 8 | | | 10/15/15 | | RUB | 578 | | | | 8 | | | | — | @ | |
Citibank NA | | USD | 15 | | | | 15 | | | 10/15/15 | | RUB | 1,018 | | | | 15 | | | | — | @ | |
Citibank NA | | USD | 76 | | | | 76 | | | 10/15/15 | | THB | 2,724 | | | | 75 | | | | (1 | ) | |
Citibank NA | | USD | 25 | | | | 25 | | | 10/15/15 | | THB | 908 | | | | 25 | | | | (— | @) | |
Commonwealth Bank of Australia | | AUD | 439 | | | | 308 | | | 10/15/15 | | USD | 311 | | | | 311 | | | | 3 | | |
Commonwealth Bank of Australia | | USD | 46 | | | | 46 | | | 10/15/15 | | AUD | 64 | | | | 45 | | | | (1 | ) | |
Commonwealth Bank of Australia | | USD | 162 | | | | 162 | | | 10/15/15 | | AUD | 226 | | | | 159 | | | | (3 | ) | |
Credit Suisse International | | NZD | 158 | | | | 101 | | | 10/15/15 | | USD | 99 | | | | 99 | | | | (2 | ) | |
Credit Suisse International | | USD | 217 | | | | 217 | | | 10/15/15 | | EUR | 190 | | | | 212 | | | | (5 | ) | |
Credit Suisse International | | USD | 103 | | | | 103 | | | 10/15/15 | | NZD | 162 | | | | 104 | | | | 1 | | |
Deutsche Bank AG | | CHF | 241 | | | | 248 | | | 10/15/15 | | USD | 248 | | | | 248 | | | | — | @ | |
Deutsche Bank AG | | USD | 63 | | | | 63 | | | 10/15/15 | | HKD | 491 | | | | 63 | | | | — | @ | |
Deutsche Bank AG | | USD | 25 | | | | 25 | | | 10/15/15 | | JPY | 3,061 | | | | 25 | | | | — | @ | |
Deutsche Bank AG | | USD | 288 | | | | 288 | | | 10/15/15 | | SEK | 2,383 | | | | 285 | | | | (3 | ) | |
Goldman Sachs International | | GBP | 41 | | | | 62 | | | 10/15/15 | | USD | 62 | | | | 62 | | | | — | @ | |
Goldman Sachs International | | USD | 2 | | | | 2 | | | 10/15/15 | | GBP | 1 | | | | 2 | | | | (— | @) | |
Goldman Sachs International | | USD | 108 | | | | 108 | | | 10/15/15 | | GBP | 69 | | | | 104 | | | | (4 | ) | |
JPMorgan Chase Bank NA | | EUR | 1,252 | | | | 1,400 | | | 10/15/15 | | USD | 1,413 | | | | 1,413 | | | | 13 | | |
JPMorgan Chase Bank NA | | GBP | 12 | | | | 18 | | | 10/15/15 | | USD | 18 | | | | 18 | | | | — | @ | |
JPMorgan Chase Bank NA | | INR | 2,088 | | | | 31 | | | 10/15/15 | | USD | 31 | | | | 31 | | | | (— | @) | |
JPMorgan Chase Bank NA | | INR | 1,183 | | | | 18 | | | 10/15/15 | | USD | 18 | | | | 18 | | | | — | @ | |
JPMorgan Chase Bank NA | | KRW | 237,652 | | | | 200 | | | 10/15/15 | | USD | 200 | | | | 200 | | | | (— | @) | |
JPMorgan Chase Bank NA | | PLN | 136 | | | | 36 | | | 10/15/15 | | USD | 37 | | | | 37 | | | | 1 | | |
JPMorgan Chase Bank NA | | USD | 58 | | | | 58 | | | 10/15/15 | | CAD | 78 | | | | 58 | | | | (— | @) | |
JPMorgan Chase Bank NA | | USD | 41 | | | | 41 | | | 10/15/15 | | DKK | 274 | | | | 41 | | | | (— | @) | |
JPMorgan Chase Bank NA | | USD | 29 | | | | 29 | | | 10/15/15 | | EUR | 26 | | | | 29 | | | | (— | @) | |
JPMorgan Chase Bank NA | | USD | 103 | | | | 103 | | | 10/15/15 | | GBP | 67 | | | | 102 | | | | (1 | ) | |
JPMorgan Chase Bank NA | | USD | 46 | | | | 46 | | | 10/15/15 | | INR | 3,089 | | | | 47 | | | | 1 | | |
JPMorgan Chase Bank NA | | USD | 262 | | | | 262 | | | 10/15/15 | | JPY | 31,528 | | | | 262 | | | | — | @ | |
JPMorgan Chase Bank NA | | USD | 47 | | | | 47 | | | 10/15/15 | | KRW | 54,844 | | | | 47 | | | | (— | @) | |
JPMorgan Chase Bank NA | | USD | 55 | | | | 55 | | | 10/15/15 | | KRW | 64,382 | | | | 54 | | | | (1 | ) | |
JPMorgan Chase Bank NA | | USD | 50 | | | | 50 | | | 10/15/15 | | KRW | 59,791 | | | | 50 | | | | — | @ | |
JPMorgan Chase Bank NA | | USD | 26 | | | | 26 | | | 10/15/15 | | MXN | 430 | | | | 26 | | | | (— | @) | |
JPMorgan Chase Bank NA | | USD | 76 | | | | 76 | | | 10/15/15 | | SEK | 627 | | | | 75 | | | | (1 | ) | |
JPMorgan Chase Bank NA | | USD | 34 | | | | 34 | | | 10/15/15 | | SGD | 48 | | | | 34 | | | | (— | @) | |
State Street Bank and Trust Co. | | CHF | 146 | | | | 150 | | | 10/15/15 | | USD | 151 | | | | 151 | | | | 1 | | |
State Street Bank and Trust Co. | | CHF | 61 | | | | 63 | | | 10/15/15 | | USD | 64 | | | | 64 | | | | 1 | | |
State Street Bank and Trust Co. | | CHF | 29 | | | | 30 | | | 10/15/15 | | USD | 30 | | | | 30 | | | | — | @ | |
State Street Bank and Trust Co. | | THB | 1,903 | | | | 53 | | | 10/15/15 | | USD | 53 | | | | 53 | | | | — | @ | |
State Street Bank and Trust Co. | | THB | 597 | | | | 16 | | | 10/15/15 | | USD | 16 | | | | 16 | | | | (— | @) | |
State Street Bank and Trust Co. | | USD | 13 | | | | 13 | | | 10/15/15 | | CHF | 13 | | | | 13 | | | | — | @ | |
State Street Bank and Trust Co. | | USD | 151 | | | | 151 | | | 10/15/15 | | SEK | 1,242 | | | | 149 | | | | (2 | ) | |
State Street Bank and Trust Co. | | USD | 64 | | | | 64 | | | 10/15/15 | | SEK | 520 | | | | 63 | | | | (1 | ) | |
State Street Bank and Trust Co. | | USD | 50 | | | | 50 | | | 10/15/15 | | THB | 1,816 | | | | 50 | | | | (— | @) | |
UBS AG | | CHF | 7 | | | | 7 | | | 10/15/15 | | USD | 7 | | | | 7 | | | | — | @ | |
UBS AG | | CHF | 20 | | | | 20 | | | 10/15/15 | | USD | 20 | | | | 20 | | | | — | @ | |
UBS AG | | CHF | 26 | | | | 27 | | | 10/15/15 | | USD | 27 | | | | 27 | | | | — | @ | |
UBS AG | | EUR | 58 | | | | 64 | | | 10/15/15 | | USD | 65 | | | | 65 | | | | 1 | | |
UBS AG | | EUR | 113 | | | | 126 | | | 10/15/15 | | USD | 128 | | | | 128 | | | | 2 | | |
The accompanying notes are an integral part of the financial statements.
16
Morgan Stanley Institutional Fund Trust
Annual Report — September 30, 2015
Portfolio of Investments (cont'd)
Global Multi-Asset Income Portfolio
Foreign Currency Forward Exchange Contracts: (cont'd)
Counterparty | | Currency to
Deliver
(000) | | Value
(000) | | Settlement
Date | | In Exchange
For
(000) | | Value
(000) | | Unrealized
Appreciation
(Depreciation)
(000) | |
UBS AG | | EUR | 46 | | | $ | 51 | | | 10/15/15 | | USD | 52 | | | $ | 52 | | | $ | 1 | | |
UBS AG | | GBP | 6 | | | | 10 | | | 10/15/15 | | USD | 10 | | | | 10 | | | | — | @ | |
UBS AG | | GBP | 2 | | | | 2 | | | 10/15/15 | | USD | 2 | | | | 2 | | | | — | @ | |
UBS AG | | TWD | 93 | | | | 3 | | | 10/15/15 | | USD | 3 | | | | 3 | | | | — | @ | |
UBS AG | | ZAR | 15 | | | | 1 | | | 10/15/15 | | USD | 1 | | | | 1 | | | | — | @ | |
JPMorgan Chase Bank NA | | USD | 78 | | | | 78 | | | 11/4/15 | | KRW | 93,150 | | | | 78 | | | | — | @ | |
UBS AG | | USD | 53 | | | | 53 | | | 11/4/15 | | CHF | 52 | | | | 53 | | | | — | @ | |
Citibank NA | | CNY | 289 | | | | 44 | | | 5/19/16 | | USD | 46 | | | | 46 | | | | 2 | | |
Citibank NA | | CNY | 847 | | | | 132 | | | 5/19/16 | | USD | 136 | | | | 136 | | | | 4 | | |
Deutsche Bank AG | | CNY | 565 | | | | 87 | | | 5/19/16 | | USD | 90 | | | | 90 | | | | 3 | | |
| | | | | $ | 9,911 | | | | | | | $ | 9,916 | | | $ | 5 | | |
Futures Contracts:
The Portfolio had the following futures contracts open at September 30, 2015:
| | | Number
of
Contracts | | Value
(000) | | Expiration
Date | | Unrealized
Appreciation
(Depreciation)
(000) | |
Long: | |
Gold Futures (United States) | | | 2 | | | $ | 223 | | | Dec-15 | | $ | (5 | ) | |
MSCI Emerging Market E Mini (United States) | | | 19 | | | | 752 | | | Dec-15 | | | (16 | ) | |
NIKKEI 225 (United States) | | | 7 | | | | 510 | | | Dec-15 | | | (14 | ) | |
S&P 500 E MINI Index (United States) | | | 14 | | | | 1,336 | | | Dec-15 | | | (16 | ) | |
U.S. Treasury 10 yr. Note (United States) | | | 2 | | | | 258 | | | Dec-15 | | | 3 | | |
U.S. Treasury 5 yr. Note (United States) | | | 2 | | | | 241 | | | Dec-15 | | | 1 | | |
U.S. Treasury Long Bond (United States) | | | 1 | | | | 157 | | | Dec-15 | | | 3 | | |
Short: | |
Copper Futures (United States) | | | 1 | | | | (58 | ) | | Dec-15 | | | (2 | ) | |
Euro Stoxx 50 Index (Germany) | | | 16 | | | | (553 | ) | | Dec-15 | | | 14 | | |
SPI 200 Index (Australia) | | | 1 | | | | (88 | ) | | Dec-15 | | | (— | @) | |
TOPIX Index (Japan) | | | 1 | | | | (118 | ) | | Dec-15 | | | 5 | | |
U.S. Treasury 10 yr. Note (United States) | | | 9 | | | | (1,159 | ) | | Dec-15 | | | (12 | ) | |
U.S. Treasury 2 yr. Note (United States) | | | 1 | | | | (219 | ) | | Dec-15 | | | (— | @) | |
U.S. Treasury Long Bond (United States) | | | 1 | | | | (157 | ) | | Dec-15 | | | (3 | ) | |
UK Long Gilt Bond (United Kingdom) | | | 1 | | | | (180 | ) | | Dec-15 | | | (3 | ) | |
| | | | | | | | | $ | (45 | ) | |
Credit Default Swap Agreements:
The Portfolio had the following credit default swap agreements open at September 30, 2015:
Swap Counterparty and
Reference Obligation | | Buy/Sell
Protection | | Notional
Amount
(000) | | Pay/Receive
Fixed Rate | | Termination
Date | | Upfront
Payment
Paid
(Received)
(000) | | Unrealized
Appreciation
(Depreciation)
(000) | | Value
(000) | | Credit
Rating of
Reference
Obligation†
(unaudited) | |
Goldman Sachs International
People's Republic of China | | Buy | | $ | 220 | | | | 1.00 | % | | 12/20/20 | | $ | 3 | | | $ | (— | @) | | $ | 3 | | | AA- | |
Goldman Sachs International
Australian Government | | Buy | | | 190 | | | | 1.00 | | | 12/20/20 | | | (5 | ) | | | 1 | | | | (4 | ) | | AAA | |
JPMorgan Chase Bank NA
Russian Federation | | Sell | | | 120 | | | | 1.00 | | | 12/20/20 | | | (15 | ) | | | 1 | | | | (14 | ) | | BB+ | |
Morgan Stanley & Co., LLC*
CDX.NA.HY.24 | | Sell | | | 98 | | | | 5.00 | | | 6/20/20 | | | 3 | | | | (— | @) | | | 3 | | | NR | |
Morgan Stanley & Co., LLC*
ITRAXX.XO.23 | | Sell | | EUR | 26 | | | | 5.00 | | | 6/20/20 | | | 3 | | | | (1 | ) | | | 2 | | | NR | |
| | | | | $ | 654 | | | | | | | $ | (11 | ) | | $ | 1 | | | $ | (10 | ) | | | |
The accompanying notes are an integral part of the financial statements.
17
Morgan Stanley Institutional Fund Trust
Annual Report — September 30, 2015
Portfolio of Investments (cont'd)
Global Multi-Asset Income Portfolio
Interest Rate Swap Agreements:
The Portfolio had the following interest rate swap agreements open at September 30, 2015:
Swap Counterparty | | Floating Rate
Index | | Pay/Receive
Floating Rate | | Fixed Rate | | Termination
Date | | Notional
Amount
(000) | | Unrealized
Appreciation
(Depreciation)
(000) | |
Bank of America NA | | 1 Month TIIE | | Receive | | | 4.32 | % | | 7/27/17 | | MXN | 2,772 | | | $ | (1 | ) | |
Bank of America NA | | 1 Month TIIE | | Receive | | | 4.33 | | | 7/27/17 | | | 1,526 | | | | (— | @) | |
Bank of America NA | | 1 Month TIIE | | Receive | | | 4.39 | | | 7/28/17 | | | 893 | | | | (— | @) | |
Bank of America NA | | 1 Month TIIE | | Pay | | | 6.30 | | | 7/17/25 | | | 514 | | | | (— | @) | |
Bank of America NA | | 1 Month TIIE | | Pay | | | 6.32 | | | 7/17/25 | | | 352 | | | | (— | @) | |
Bank of America NA | | 1 Month TIIE | | Pay | | | 6.32 | | | 7/18/25 | | | 219 | | | | (— | @) | |
Citibank NA | | 1 Month TIIE | | Receive | | | 4.29 | | | 7/25/17 | | | 1,534 | | | | (— | @) | |
Citibank NA | | 1 Month TIIE | | Receive | | | 4.35 | | | 7/28/17 | | | 3,382 | | | | — | | |
Citibank NA | | 1 Month TIIE | | Receive | | | 4.38 | | | 7/28/17 | | | 952 | | | | (— | @) | |
Citibank NA | | 1 Month TIIE | | Receive | | | 4.48 | | | 8/24/17 | | | 20 | | | | (— | @) | |
Citibank NA | | 1 Month TIIE | | Pay | | | 6.36 | | | 7/15/25 | | | 373 | | | | (— | @) | |
Citibank NA | | 1 Month TIIE | | Pay | | | 6.34 | | | 7/16/25 | | | 162 | | | | (— | @) | |
Citibank NA | | 1 Month TIIE | | Pay | | | 6.33 | | | 7/18/25 | | | 285 | | | | — | @ | |
Citibank NA | | 1 Month TIIE | | Pay | | | 6.40 | | | 8/14/25 | | | 60 | | | | (— | @) | |
Deutsche Bank AG | | 1 Month TIIE | | Receive | | | 4.38 | | | 7/28/17 | | | 1,408 | | | | (1 | ) | |
Deutsche Bank AG | | 1 Month TIIE | | Pay | | | 6.33 | | | 7/18/25 | | | 292 | | | | (— | @) | |
Goldman Sachs International | | 1 Month TIIE | | Receive | | | 4.29 | | | 7/26/17 | | | 1,372 | | | | (— | @) | |
Goldman Sachs International | | 1 Month TIIE | | Receive | | | 4.38 | | | 7/28/17 | | | 1,404 | | | | (— | @) | |
Goldman Sachs International | | 1 Month TIIE | | Pay | | | 6.33 | | | 7/16/25 | | | 333 | | | | (— | @) | |
Goldman Sachs International | | 1 Month TIIE | | Pay | | | 6.32 | | | 7/18/25 | | | 292 | | | | (— | @) | |
JPMorgan Chase Bank NA | | 1 Month TIIE | | Receive | | | 4.34 | | | 7/27/17 | | | 850 | | | | (— | @) | |
JPMorgan Chase Bank NA | | 1 Month TIIE | | Pay | | | 6.33 | | | 7/17/25 | | | 383 | | | | (— | @) | |
JPMorgan Chase Bank NA | | 1 Month TIIE | | Pay | | | 6.39 | | | 9/18/25 | | | 676 | | | | (— | @) | |
UBS AG | | 1 Month TIIE | | Receive | | | 4.31 | | | 7/25/17 | | | 1,572 | | | | (— | @) | |
UBS AG | | 1 Month TIIE | | Pay | | | 6.37 | | | 7/15/25 | | | 382 | | | | — | @ | |
| | | | | | | | | | | | | $ | (2 | ) | |
Total Return Swap Agreements:
The Portfolio had the following total return swap agreements open at September 30, 2015:
Swap Counterparty | | Index | | Notional
Amount
(000) | | Floating
Rate | | Pay/Receive
Total Return
of Referenced
Index | | Maturity
Date | | Unrealized
Appreciation
(Depreciation)
(000) | |
Citibank NA | | Citi Australia Bank
Custom Basket†† | | $ | 2 | | | 3 Month USD LIBOR minus
0.20% | | Pay | | 8/23/16 | | $ | — | @ | |
Citibank NA | | Citi Australia Bank
Custom Basket†† | | | 45 | | | 3 Month USD LIBOR minus
0.20% | | Pay | | 8/23/16 | | | 5 | | |
JPMorgan Chase
Bank NA | | JPM Global Machinery
Index†† | | | 52 | | | 3 Month USD LIBOR minus
0.55% | | Pay | | 11/6/15 | | | 8 | | |
JPMorgan Chase
Bank NA | | JPM U.S. Machinery
Index†† | | | 65 | | | 3 Month USD LIBOR minus
0.30% | | Pay | | 11/9/15 | | | 9 | | |
JPMorgan Chase
Bank NA | | JPM Global Auto
Components Index†† | | | 54 | | | 3 Month USD LIBOR minus
0.33% | | Pay | | 12/17/15 | | | — | @ | |
JPMorgan Chase
Bank NA | | JPM Global Auto
Components Index†† | | | 8 | | | 3 Month USD LIBOR minus
0.33% | | Pay | | 12/17/15 | | | — | @ | |
JPMorgan Chase
Bank NA | | JPMorgan U.S. Refineries
Custom Basket†† | | | 50 | | | 3 Month USD LIBOR minus
0.06% | | Pay | | 9/1/16 | | | (1 | ) | |
JPMorgan Chase
Bank NA | | JPM Aerospace
Index†† | | | 163 | | | 3 Month USD LIBOR minus
0.26% | | Pay | | 9/8/16 | | | 4 | | |
JPMorgan Chase
Bank NA | | JPM Aerospace
Index†† | | | 160 | | | 3 Month USD LIBOR minus
0.36% | | Pay | | 9/8/16 | | | (1 | ) | |
| | | | | | | | | | | | | $ | 24 | | |
†† See tables below for details of the equity basket holdings underlying the swap.
The accompanying notes are an integral part of the financial statements.
18
Morgan Stanley Institutional Fund Trust
Annual Report — September 30, 2015
Portfolio of Investments (cont'd)
Global Multi-Asset Income Portfolio
The following table represents the equity basket holdings underlying the total return swap with Citi Australia Bank Custom Basket as of September 30, 2015.
Security Description | | Index Weight | |
Citi Australia Bank Custom Basket | |
Australia & New Zealand Banking Group Ltd. | | | 19.80 | % | |
Bank of Queensland Ltd. | | | 1.14 | | |
Bendigo & Adelaide Bank Ltd. | | | 1.19 | | |
Commonwealth Bank of Australia | | | 32.65 | | |
National Australia Bank Ltd. | | | 20.72 | | |
Westpac Banking Corp. | | | 24.50 | | |
| | | | 100.00 | % | |
The following table represents the equity basket holdings underlying the total return swap with JPM Global Machinery Index as of September 30, 2015.
Security Description | | Index Weight | |
JPM Global Machinery Index | |
Alfa Laval AB | | | 2.85 | % | |
Atlas Copco AB | | | 8.26 | | |
Atlas Copco AB | | | 4.48 | | |
CNH Industrial N.V. | | | 3.64 | | |
CRRC Corp., Ltd. | | | 1.32 | | |
Daewoo Shipbuilding & Marine Engineering | | | 0.32 | | |
Doosan Infracore Co., Ltd. | | | 0.40 | | |
GEA Group AG | | | 3.74 | | |
Hino Motors Ltd. | | | 1.34 | | |
Hitachi Construction Machinery Co., Ltd. | | | 0.71 | | |
Hiwin Technologies Corp. | | | 0.56 | | |
Hyundai Heavy Industries Co., Ltd. | | | 1.74 | | |
Hyundai Mipo Dockyard Co., Ltd. | | | 0.30 | | |
IMI PLC | | | 2.17 | | |
JTEKT Corp. | | | 1.43 | | |
Kawasaki Heavy Industries Ltd. | | | 2.36 | | |
Komatsu Ltd. | | | 6.76 | | |
Kone Oyj | | | 6.25 | | |
Kubota Corp. | | | 7.49 | | |
MAN SE | | | 1.91 | | |
Melrose Industries PLC | | | 2.57 | | |
Metso Oyj | | | 1.26 | | |
NGK Insulators Ltd. | | | 2.70 | | |
Samsung Heavy Industries Co., Ltd. | | | 0.94 | | |
Sandvik AB | | | 5.07 | | |
Schindler Holding AG | | | 3.47 | | |
Schindler Holding AG | | | 1.66 | | |
Sembcorp Marine Ltd. | | | 0.74 | | |
SMC Corp. | | | 5.91 | | |
Sulzer AG | | | 1.23 | | |
Sumitomo Heavy Industries Ltd. | | | 1.04 | | |
Vallourec SA | | | 0.47 | | |
Volvo AB | | | 8.26 | | |
Wartsila Oyj Abp | | | 3.27 | | |
Weichai Power Co., Ltd. | | | 0.26 | | |
Weir Group PLC (The) | | | 2.06 | | |
Yangzijiang Shipbuilding Holdings Ltd. | | | 0.78 | | |
Zoomlion Heavy Industry Science & Technology | | | 0.28 | | |
| | | 100.00 | % | |
The following table represents the equity basket holdings underlying the total return swap with JPM U.S. Machinery Index as of September 30, 2015.
Security Description | | Index Weight | |
JPM U.S. Machinery Index | |
AGCO Corp. | | | 2.05 | % | |
Caterpillar, Inc. | | | 20.99 | | |
Cummins, Inc. | | | 9.58 | | |
Deere & Co. | | | 12.19 | | |
Dover Corp. | | | 4.78 | | |
Flowserve Corp. | | | 2.76 | | |
Illinois Tool Works, Inc. | | | 15.57 | | |
Ingersoll-Rand PLC | | | 6.86 | | |
Joy Global, Inc. | | | 0.78 | | |
PACCAR, Inc. | | | 9.14 | | |
Parker-Hannifin Corp. | | | 6.79 | | |
Pentair PLC | | | 4.81 | | |
SPX Corp. | | | 0.22 | | |
SPX FLOW, Inc. | | | 0.64 | | |
Xylem, Inc. | | | 2.84 | | |
| | | | 100.00 | % | |
The following table represents the equity basket holdings underlying the total return swap with JPM Global Auto Components Index as of September 30, 2015.
Security Description | | Index Weight | |
JPM Global Auto Components Index | |
Aisin Seiki Co., Ltd. | | | 2.42 | % | |
Autoliv, Inc. | | | 3.83 | | |
BorgWarner, Inc. | | | 3.62 | | |
Bridgestone Corp. | | | 8.49 | | |
Cheng Shin Rubber Industry Co., Ltd. | | | 1.00 | | |
Cie Generale des Etablissements Michelin | | | 6.40 | | |
Continental AG | | | 8.83 | | |
Delphi Automotive PLC | | | 8.66 | | |
Denso Corp. | | | 7.75 | | |
GKN PLC | | | 2.52 | | |
Hankook Tire Co., Ltd. | | | 0.94 | | |
Hanon Systems | | | 0.46 | | |
Hyundai Mobis Co., Ltd. | | | 5.01 | | |
Hyundai Wia Corp. | | | 0.67 | | |
Johnson Controls, Inc. | | | 10.47 | | |
Koito Manufacturing Co., Ltd. | | | 1.18 | | |
Magna International, Inc. | | | 7.75 | | |
NGK Spark Plug Co., Ltd. | | | 1.54 | | |
NHK Spring Co., Ltd. | | | 0.58 | | |
NOK Corp. | | | 0.78 | | |
Nokian Renkaat Oyj | | | 1.39 | | |
Pirelli & C. SpA | | | 1.51 | | |
Stanley Electric Co., Ltd. | | | 1.07 | | |
Sumitomo Electric Industries Ltd. | | | 3.63 | | |
Sumitomo Rubber Industries Ltd. | | | 0.89 | | |
Toyoda Gosei Co., Ltd. | | | 0.48 | | |
Toyota Industries Corp. | | | 2.92 | | |
Valeo SA | | | 3.85 | | |
Yokohama Rubber Co., Ltd. (The) | | | 1.36 | | |
| | | 100.00 | % | |
The accompanying notes are an integral part of the financial statements.
19
Morgan Stanley Institutional Fund Trust
Annual Report — September 30, 2015
Portfolio of Investments (cont'd)
Global Multi-Asset Income Portfolio
The following table represents the equity basket holdings underlying the total return swap with JPMorgan U.S. Refineries Custom Basket as of September 30, 2015.
Security Description | | Index Weight | |
JPMorgan U.S. Refineries Custom Basket | |
Delek U.S. Holdings, Inc. | | | 1.30 | % | |
HollyFrontier Corp. | | | 6.45 | | |
Marathon Petroleum Corp. | | | 19.52 | | |
PBF Energy, Inc. | | | 2.81 | | |
Phillips 66 | | | 23.97 | | |
Tesoro Corp. | | | 16.33 | | |
Valero Energy Corp. | | | 26.23 | | |
Western Refining, Inc. | | | 3.39 | | |
| | | | 100.00 | % | |
The following table represents the equity basket holdings underlying the total return swap with JPM Aerospace Index as of September 30, 2015.
Security Description | | Index Weight | |
JPM Aerospace Index | |
Airbus Group SE | | | 13.75 | % | |
B/E Aerospace, Inc. | | | 1.50 | | |
Boeing Co. (The) | | | 33.15 | | |
Bombardier, Inc. | | | 0.72 | | |
KLX, Inc. | | | 0.61 | | |
Precision Castparts Corp. | | | 12.23 | | |
Rolls-Royce Holdings PLC | | | 5.86 | | |
Safran SA | | | 9.41 | | |
Textron, Inc. | | | 4.86 | | |
Thales SA | | | 2.84 | | |
TransDigm Group, Inc. | | | 3.69 | | |
United Technologies Corp. | | | 9.39 | | |
Zodiac Aerospace | | | 1.99 | | |
| | | | 100.00 | % | |
@ Value is less than $500.
† Credit rating as issued by Standard & Poor's.
* Cleared swap agreement, the broker is Morgan Stanley & Co., LLC.
LIBOR London Interbank Offered Rate.
TIIE Interbank Equilibrium Interest Rate.
NR Not rated.
AUD — Australian Dollar
BRL — Brazilian Real
CAD — Canadian Dollar
CHF — Swiss Franc
CNY — Chinese Yuan Renminbi
DKK — Danish Krone
EUR — Euro
GBP — British Pound
HKD — Hong Kong Dollar
INR — Indian Rupee
JPY — Japanese Yen
KRW — South Korean Won
MXN — Mexican Peso
MYR — Malaysian Ringgit
NOK — Norwegian Krone
NZD — New Zealand Dollar
PLN — Polish Zloty
RUB — Russian Ruble
SEK — Swedish Krona
SGD — Singapore Dollar
THB — Thai Baht
TRY — Turkish Lira
TWD — Taiwan Dollar
USD — United States Dollar
ZAR — South African Rand
Portfolio Composition
Classification | | Percentage of
Total Investments | |
Fixed Income Securities | | | 42.9 | % | |
Common Stocks | | | 36.0 | | |
Short-Term Investments | | | 14.3 | | |
Investment Companies | | | 6.8 | | |
Total Investments | | | 100.0 | %** | |
** Does not include open call options written with a value of approximately $12,000. Does not include open long/short futures contracts with an underlying face amount of approximately $6,009,000 with net unrealized depreciation of approximately $45,000. Does not include open foreign currency forward exchange contracts with net unrealized appreciation of approximately $5,000 and does not include open swap agreements with net unrealized appreciation of approximately $23,000.
The accompanying notes are an integral part of the financial statements.
20
Morgan Stanley Institutional Fund Trust
Annual Report — September 30, 2015
Global Multi-Asset Income Portfolio
Statement of Assets and Liabilities | | September 30, 2015
(000) | |
Assets: | |
Investments in Securities of Unaffiliated Issuers, at Value (Cost $12,449) | | $ | 11,721 | | |
Investment in Security of Affiliated Issuer, at Value (Cost $2,796) | | | 2,724 | | |
Total Investments in Securities, at Value (Cost $15,245) | | | 14,445 | | |
Foreign Currency, at Value (Cost $54) | | | 54 | | |
Receivable for Investments Sold | | | 1,458 | | |
Receivable for Variation Margin on Futures Contracts | | | 265 | | |
Due from Adviser | | | 168 | | |
Prepaid Offering Costs | | | 93 | | |
Unrealized Appreciation on Foreign Currency Forward Exchange Contracts | | | 47 | | |
Interest Receivable | | | 47 | | |
Unrealized Appreciation on Swap Agreements | | | 28 | | |
Dividends Receivable | | | 7 | | |
Premium Paid on Open Swap Agreements | | | 3 | | |
Tax Reclaim Receivable | | | 3 | | |
Receivable from Affiliate | | | — | @ | |
Receivable for Variation Margin on Swap Agreements | | | — | @ | |
Other Assets | | | 8 | | |
Total Assets | | | 16,626 | | |
Liabilities: | |
Payable for Investments Purchased | | | 2,304 | | |
Payable for Offering Costs | | | 82 | | |
Payable for Custodian Fees | | | 53 | | |
Unrealized Depreciation on Foreign Currency Forward Exchange Contracts | | | 42 | | |
Premium Received on Open Swap Agreements | | | 20 | | |
Payable for Professional Fees | | | 19 | | |
Options Written, at Value (Premiums received $41) | | | 12 | | |
Unrealized Depreciation on Swap Agreements | | | 4 | | |
Payable for Transfer Agency Fees — Class I | | | 1 | | |
Payable for Transfer Agency Fees — Class A | | | 1 | | |
Payable for Transfer Agency Fees — Class C | | | 1 | | |
Payable for Transfer Agency Fees — Class IS | | | — | @ | |
Payable for Administration Fees | | | 1 | | |
Payable for Shareholder Services Fees — Class A | | | — | @ | |
Payable for Distribution and Shareholder Services Fees — Class C | | | — | @ | |
Other Liabilities | | | 55 | | |
Total Liabilities | | | 2,595 | | |
Net Assets | | $ | 14,031 | | |
Net Assets Consist Of: | |
Paid-in-Capital | | $ | 15,036 | | |
Accumulated Undistributed Net Investment Income | | | 56 | | |
Accumulated Net Realized Loss | | | (272 | ) | |
Unrealized Appreciation (Depreciation) on: | |
Investments | | | (728 | ) | |
Investments in Affiliates | | | (72 | ) | |
Futures Contracts | | | (45 | ) | |
Options Written | | | 29 | | |
Swap Agreements | | | 23 | | |
Foreign Currency Forward Exchange Contracts | | | 5 | | |
Foreign Currency Translations | | | (1 | ) | |
Net Assets | | $ | 14,031 | | |
The accompanying notes are an integral part of the financial statements.
21
Morgan Stanley Institutional Fund Trust
Annual Report — September 30, 2015
Global Multi-Asset Income Portfolio
Statement of Assets and Liabilities (cont'd) | | September 30, 2015
(000) | |
CLASS I: | |
Net Assets | | $ | 9 | | |
| Shares Outstanding (unlimited number of shares authorized, no par value) (not in 000's) | | | 1,000 | | |
Net Asset Value, Offering and Redemption Price Per Share | | $ | 9.33 | | |
CLASS A: | |
Net Assets | | $ | 44 | | |
| Shares Outstanding (unlimited number of shares authorized, no par value) (not in 000's) | | | 4,754 | | |
Net Asset Value, Redemption Price Per Share | | $ | 9.32 | | |
Maximum Sales Load | | | 5.25 | % | |
Maximum Sales Charge | | $ | 0.52 | | |
Maximum Offering Price Per Share | | $ | 9.84 | | |
CLASS C: | |
Net Assets | | $ | 9 | | |
| Shares Outstanding (unlimited number of shares authorized, no par value) (not in 000's) | | | 1,000 | | |
Net Asset Value, Offering and Redemption Price Per Share | | $ | 9.30 | | |
CLASS IS: | |
Net Assets | | $ | 13,969 | | |
| Shares Outstanding (unlimited number of shares authorized, no par value) (not in 000's) | | | 1,497,000 | | |
Net Asset Value, Offering and Redemption Price Per Share | | $ | 9.33 | | |
@ Amount is less than $500.
The accompanying notes are an integral part of the financial statements.
22
Morgan Stanley Institutional Fund Trust
Annual Report — September 30, 2015
Global Multi-Asset Income Portfolio
Statement of Operations | | Period from
April 30, 2015^ to
September 30, 2015
(000) | |
Investment Income: | |
Dividends from Securities of Unaffiliated Issuers (Net of $11 of Foreign Taxes Withheld) | | $ | 86 | | |
Interest from Securities of Unaffiliated Issuers | | | 59 | | |
Dividends from Security of Affiliated Issuer (Note G) | | | 15 | | |
Total Investment Income | | | 160 | | |
Expenses: | |
Professional Fees | | | 103 | | |
Custodian Fees (Note F) | | | 71 | | |
Offering Costs | | | 67 | | |
Pricing Fees | | | 53 | | |
Advisory Fees (Note B) | | | 40 | | |
Shareholder Reporting Fees | | | 19 | | |
Administration Fees (Note C) | | | 5 | | |
Transfer Agency Fees — Class I (Note E) | | | 1 | | |
Transfer Agency Fees — Class A (Note E) | | | 1 | | |
Transfer Agency Fees — Class C (Note E) | | | 1 | | |
Transfer Agency Fees — Class IS (Note E) | | | 1 | | |
Shareholder Services Fees — Class A (Note D) | | | — | @ | |
Distribution and Shareholder Services Fees — Class C (Note D) | | | — | @ | |
Trustees' Fees and Expenses | | | — | @ | |
Registration Fees | | | — | @ | |
Other Expenses | | | 5 | | |
Total Expenses | | | 367 | | |
Expenses Reimbursed by Adviser (Note B) | | | (269 | ) | |
Waiver of Advisory Fees (Note B) | | | (40 | ) | |
Reimbursement of Class Specific Expenses — Class I (Note B) | | | (1 | ) | |
Reimbursement of Class Specific Expenses — Class A (Note B) | | | (1 | ) | |
Reimbursement of Class Specific Expenses — Class C (Note B) | | | (1 | ) | |
Reimbursement of Class Specific Expenses — Class IS (Note B) | | | (1 | ) | |
Rebate from Morgan Stanley Affiliate (Note G) | | | (2 | ) | |
Net Expenses | | | 52 | | |
Net Investment Income | | | 108 | | |
Realized Gain (Loss): | |
Investments Sold | | | (136 | ) | |
Investments in Affiliates | | | (10 | ) | |
Foreign Currency Forward Exchange Contracts | | | 42 | | |
Foreign Currency Transactions | | | 21 | | |
Futures Contracts | | | (227 | ) | |
Options Written | | | (— | @) | |
Swap Agreements | | | 31 | | |
Net Realized Loss | | | (279 | ) | |
Change in Unrealized Appreciation (Depreciation): | |
Investments | | | (728 | ) | |
Investments in Affiliates | | | (72 | ) | |
Foreign Currency Forward Exchange Contracts | | | 5 | | |
Foreign Currency Translations | | | (1 | ) | |
Futures Contracts | | | (45 | ) | |
Swap Agreements | | | 23 | | |
Options Written | | | 29 | | |
Net Change in Unrealized Appreciation (Depreciation) | | | (789 | ) | |
Net Realized Loss and Change in Unrealized Appreciation (Depreciation) | | | (1,068 | ) | |
Net Decrease in Net Assets Resulting from Operations | | $ | (960 | ) | |
^ Commencement of Operations.
@ Amount is less than $500.
The accompanying notes are an integral part of the financial statements.
23
Morgan Stanley Institutional Fund Trust
Annual Report — September 30, 2015
Global Multi-Asset Income Portfolio
Statements of Changes in Net Assets | | Period from
April 30, 2015^ to
September 30, 2015
(000) | |
Increase (Decrease) in Net Assets: | |
Operations: | |
Net Investment Income | | $ | 108 | | |
Net Realized Loss | | | (279 | ) | |
Net Change in Unrealized Appreciation (Depreciation) | | | (789 | ) | |
Net Decrease in Net Assets Resulting from Operations | | | (960 | ) | |
Distributions from and/or in Excess of: | |
Class I: | |
Net Investment Income | | | (— | @) | |
Class A: | |
Net Investment Income | | | (— | @) | |
Class C: | |
Net Investment Income | | | (— | @)* | |
Class IS: | |
Net Investment Income | | | (45 | ) | |
Total Distributions | | | (45 | ) | |
Capital Share Transactions:(1) | |
Class I: | |
Subscribed | | | 10 | | |
Class A: | |
Subscribed | | | 46 | | |
Distributions Reinvested | | | — | @ | |
Class C: | |
Subscribed | | | 10 | * | |
Class IS: | |
Subscribed | | | 14,970 | | |
Net Increase in Net Assets Resulting from Capital Share Transactions | | | 15,036 | | |
Total Increase in Net Assets | | | 14,031 | | |
Net Assets: | |
Beginning of Period | | | — | | |
End of Period (Including Accumulated Undistributed Net Investment Income of $56) | | $ | 14,031 | | |
(1) Capital Share Transactions: | |
Class I: | |
Shares Subscribed | | | 1 | | |
Class A: | |
Shares Subscribed | | | 5 | | |
Shares Issued on Distributions Reinvested | | | — | @@ | |
Net Increase in Class A Shares Outstanding | | | 5 | | |
Class C: | |
Shares Subscribed | | | 1 | * | |
Class IS: | |
Shares Subscribed | | | 1,497 | | |
^ Commencement of Operations.
* For the period May 8, 2015 through September 30, 2015.
@ Amount is less than $500.
@@ Amount is less than 500 shares.
The accompanying notes are an integral part of the financial statements.
24
Morgan Stanley Institutional Fund Trust
Annual Report — September 30, 2015
Financial Highlights
Global Multi-Asset Income Portfolio
| | | Class I | |
Selected Per Share Data and Ratios | | Period from
April 30, 2015^ to
September 30, 2015 | |
Net Asset Value, Beginning of Period | | $ | 10.00 | | |
Income (Loss) from Investment Operations: | |
Net Investment Income† | | | 0.07 | | |
Net Realized and Unrealized Loss | | | (0.71 | ) | |
Total from Investment Operations | | | (0.64 | ) | |
Distributions from and/or in Excess of: | |
Net Investment Income | | | (0.03 | ) | |
Net Asset Value, End of Period | | $ | 9.33 | | |
Total Return++ | | | (6.42 | )%# | |
Ratios and Supplemental Data: | |
Net Assets, End of Period (Thousands) | | $ | 9 | | |
Ratio of Expenses to Average Net Assets (1) | | | 0.93 | %+* | |
Ratio of Net Investment Income to Average Net Assets (1) | | | 1.72 | %+* | |
Ratio of Rebate from Morgan Stanley Affiliates to Average Net Assets | | | 0.01 | %* | |
Portfolio Turnover Rate | | | 139 | %# | |
(1) Supplemental Information on the Ratios to Average Net Assets: | |
Ratios Before Expense Limitation: | |
Expenses to Average Net Assets | | | 20.20 | %* | |
Net Investment Loss to Average Net Assets | | | (17.55 | )%* | |
^ Commencement of Operations.
† Per share amount is based on average shares outstanding.
++ Calculated based on the net asset value as of the last business day of the period.
+ The Ratios of Expenses and Net Investment Income reflect the rebate of certain Portfolio expenses in connection with the investments in Morgan Stanley affiliates during the period. The effect of the rebate on the ratios is disclosed in the above table as "Ratio of Rebate from Morgan Stanley Affiliates to Average Net Assets."
# Not Annualized.
* Annualized.
The accompanying notes are an integral part of the financial statements.
25
Morgan Stanley Institutional Fund Trust
Annual Report — September 30, 2015
Financial Highlights
Global Multi-Asset Income Portfolio
| | | Class A | |
Selected Per Share Data and Ratios | | Period from
April 30, 2015^ to
September 30, 2015 | |
Net Asset Value, Beginning of Period | | $ | 10.00 | | |
Income (Loss) from Investment Operations: | |
Net Investment Income† | | | 0.04 | | |
Net Realized and Unrealized Loss | | | (0.69 | ) | |
Total from Investment Operations | | | (0.65 | ) | |
Distributions from and/or in Excess of: | |
Net Investment Income | | | (0.03 | ) | |
Net Asset Value, End of Period | | $ | 9.32 | | |
Total Return++ | | | (6.64 | )%# | |
Ratios and Supplemental Data: | |
Net Assets, End of Period (Thousands) | | $ | 44 | | |
Ratio of Expenses to Average Net Assets (1) | | | 1.27 | %+* | |
Ratio of Net Investment Income to Average Net Assets (1) | | | 1.02 | %+* | |
Ratio of Rebate from Morgan Stanley Affiliates to Average Net Assets | | | 0.01 | %* | |
Portfolio Turnover Rate | | | 139 | %# | |
(1) Supplemental Information on the Ratios to Average Net Assets: | |
Ratios Before Expense Limitation: | |
Expenses to Average Net Assets | | | 12.75 | %* | |
Net Investment Loss to Average Net Assets | | | (10.46 | )%* | |
^ Commencement of Operations.
† Per share amount is based on average shares outstanding.
++ Calculated based on the net asset value which does not reflect sales charges, if applicable, as of the last business day of the period.
+ The Ratios of Expenses and Net Investment Income reflect the rebate of certain Portfolio expenses in connection with the investments in Morgan Stanley affiliates during the period. The effect of the rebate on the ratios is disclosed in the above table as "Ratio of Rebate from Morgan Stanley Affiliates to Average Net Assets."
# Not Annualized.
* Annualized.
The accompanying notes are an integral part of the financial statements.
26
Morgan Stanley Institutional Fund Trust
Annual Report — September 30, 2015
Financial Highlights
Global Multi-Asset Income Portfolio
| | | Class C | |
Selected Per Share Data and Ratios | | Period from
May 8, 2015^ to
September 30, 2015 | |
Net Asset Value, Beginning of Period | | $ | 10.00 | | |
Income (Loss) from Investment Operations: | |
Net Investment Income† | | | 0.02 | | |
Net Realized and Unrealized Loss | | | (0.71 | ) | |
Total from Investment Operations | | | (0.69 | ) | |
Distributions from and/or in Excess of: | |
Net Investment Income | | | (0.01 | ) | |
Net Asset Value, End of Period | | $ | 9.30 | | |
Total Return++ | | | (6.86 | )%# | |
Ratios and Supplemental Data: | |
Net Assets, End of Period, (Thousands) | | $ | 9 | | |
Ratios of Expenses to Average Net Assets (1) | | | 2.03 | %+* | |
Ratio of Net Investment Income to Average Net Assets (1) | | | 0.56 | %+* | |
Ratio of Rebate from Morgan Stanley Affiliates to Average Net Assets | | | 0.01 | %* | |
Portfolio Turnover Rate | | | 139 | %# | |
(1) Supplemental Information on the Ratios to Average Net Assets: | |
Ratios Before Expense Limitation: | |
Expense to Average Net Assets | | | 21.28 | %* | |
Net Investment Loss to Average Net Assets | | | (18.69 | )%* | |
^ Commencement of Operations.
† Per share amount is based on average shares outstanding.
++ Calculated based on the net asset value which does not reflect sales charges, if applicable, as of the last business day of the period.
+ The Ratios of Expenses and Net Investment Income reflect the rebate of certain Portfolio expenses in connection with the investments in Morgan Stanley affiliates during the period. The effect of the rebate on the ratios is disclosed in the above table as "Ratio of Rebate from Morgan Stanley Affiliates to Average Net Assets."
# Not Annualized.
* Annualized.
The accompanying notes are an integral part of the financial statements.
27
Morgan Stanley Institutional Fund Trust
Annual Report — September 30, 2015
Financial Highlights
Global Multi-Asset Income Portfolio
| | | Class IS | |
Selected Per Share Data and Ratios | | Period from
April 30, 2015^ to
September 30, 2015 | |
Net Asset Value, Beginning of Period | | $ | 10.00 | | |
Income (Loss) from Investment Operations: | |
Net Investment Income† | | | 0.07 | | |
Net Realized and Unrealized Loss | | | (0.71 | ) | |
Total from Investment Operations | | | (0.64 | ) | |
Distributions from and/or in Excess of: | |
Net Investment Income | | | (0.03 | ) | |
Net Asset Value, End of Period | | $ | 9.33 | | |
Total Return++ | | | (6.41 | )%# | |
Ratios and Supplemental Data: | |
Net Assets, End of Period, in (Thousands) | | $ | 13,969 | | |
Ratio of Expenses to Average Net Assets (1) | | | 0.87 | %+* | |
Ratio of Net Investment Income to Average Net Assets (1) | | | 1.76 | %+* | |
Ratio of Rebate from Morgan Stanley Affiliates to Average Net Assets | | | 0.01 | %* | |
Portfolio Turnover Rate | | | 139 | %# | |
(1) Supplemental Information on the Ratios to Average Net Assets: | |
Ratios Before Expense Limitation | |
Expenses to Average Net Assets | | | 5.97 | %* | |
Net Investment Loss to Average Net Assets | | | (3.34 | )%* | |
^ Commencement of Operations.
† Per share amount is based on average shares outstanding.
++ Calculated based on the net asset value as of the last business day of the period.
+ The Ratios of Expenses and Net Investment Income reflect the rebate of certain Portfolio expenses in connection with the investments in Morgan Stanley affiliates during the period. The effect of the rebate on the ratios is disclosed in the above table as "Ratio of Rebate from Morgan Stanley Affiliates to Average Net Assets."
# Not Annualized.
* Annualized.
The accompanying notes are an integral part of the financial statements.
28
Morgan Stanley Institutional Fund Trust
Annual Report — September 30, 2015
Notes to Financial Statements
Morgan Stanley Institutional Fund Trust ("MSIFT'' or the "Fund'') is registered under the Investment Company Act of 1940, as amended (the "Act''), as an open-end management investment company. The Fund is comprised of nine separate, active portfolios (individually referred to as a "Portfolio", collectively as the "Portfolios"). The Fund applies investment company accounting and reporting guidance. All Portfolios are considered diversified for purposes of the Act.
The accompanying financial statements relate to the Global Multi-Asset Income Portfolio. The Portfolio seeks to maximize current income and to seek capital appreciation over time. The Portfolio commenced operations on April 30, 2015 and offers four classes of shares — Class I, Class A, Class C and Class IS.
On May 8, 2015, the Portfolio commenced offering Class C shares.
A. Significant Accounting Policies: The following significant accounting policies are in conformity with U.S. generally accepted accounting principles ("GAAP"). Such policies are consistently followed by the Fund in the preparation of its financial statements. GAAP may require management to make estimates and assumptions that affect the reported amounts and disclosures in the financial statements. Actual results may differ from those estimates.
1. Security Valuation: (1) Certain portfolio securities may be valued by an outside pricing service approved by the Fund's Board of Trustees (the "Trustees"). The pricing service may utilize a matrix system or other model incorporating attributes such as security quality, maturity and coupon as the evaluation model parameters, and/or research evaluations by its staff, including review of broker-dealer market price quotations in determining what it believes is the fair valuation of the portfolios securities valued by such pricing service; (2) an equity portfolio security listed or traded on an exchange is valued at its latest reported sales price (or at the exchange official closing price if such exchange reports an official closing price), if there were no sales on a given day, the security is valued at the mean between the last reported bid and asked prices; (3) all other equity portfolio securities for which over-the-counter ("OTC") market quotations are readily available are valued at its latest reported sales price. In cases where a security is traded on more than one exchange, the security is valued on the exchange designated as the primary market; (4) futures are valued at the latest price published by the commodities exchange on which they trade; (5) swaps are marked-to-market daily based upon quotations from market makers; (6) listed
options are valued at the last reported sales price on the exchange on which they are listed (or at the exchange official closing price if such exchange reports an official closing price). If an official closing price or last reported sales price is unavailable, the listed option should be fair valued at the mean between their latest bid and asked price. Unlisted options are valued by an outside pricing service approved by the Trustees or quotes from a broker or dealer; (7) when market quotations are not readily available, including circumstances under which Morgan Stanley Investment Management Inc. (the "Adviser") determines that the closing price, last sale price or the mean between the last reported bid and asked prices are not reflective of a security's market value, portfolio securities are valued at their fair value as determined in good faith under procedures established by and under the general supervision of the Trustees. Occasionally, developments affecting the closing prices of securities and other assets may occur between the times at which valuations of such securities are determined (that is, close of the foreign market on which the securities trade) and the close of business of the New York Stock Exchange ("NYSE"). If developments occur during such periods that are expected to materially affect the value of such securities, such valuations may be adjusted to reflect the estimated fair value of such securities as of the close of the NYSE, as determined in good faith by the Trustees or by the Adviser using a pricing service and/or procedures approved by the Trustees; (8) quotations of foreign portfolio securities, other assets and liabilities and forward contracts stated in foreign currency are translated into U.S. dollar equivalents at the prevailing market rates prior to the close of the NYSE; (9) investments in mutual funds, including the Morgan Stanley Institutional Liquidity Funds, are valued at the net asset value ("NAV") as of the close of each business day; and (10) short-term taxable debt securities with remaining maturities of 60 days or less at the time of purchase may be valued at amortized cost, unless the Adviser determines such price does not reflect the securities' market value, in which case these securities will be valued at their fair market value determined by the Adviser. Other taxable short-term debt securities with maturities of more than 60 days will be valued on a mark-to-market basis until such time as they reach a maturity of 60 days, whereupon they will be valued at amortized cost using their value on the 61st day unless the Adviser determines such price does not reflect the securities' fair value, in which case these securities will be valued at their fair market value as determined by the Adviser.
29
Morgan Stanley Institutional Fund Trust
Annual Report — September 30, 2015
Notes to Financial Statements (cont'd)
The Trustees have responsibility for determining in good faith the fair value of the investments, and the Trustees may appoint others, such as the Fund's Adviser or a valuation committee, to assist the Trustees in determining fair value and to make the actual calculations pursuant to the fair valuation methodologies previously approved by the Trustees. Under procedures approved by the Trustees, the Fund's Adviser has formed a Valuation Committee whose members are approved by the Trustees. The Valuation Committee provides administration and oversight of the Fund's valuation policies and procedures, which are reviewed at least annually by the Trustees. These procedures allow the Fund to utilize independent pricing services, quotations from securities and financial instrument dealers, and other market sources to determine fair value.
The Fund has procedures to determine the fair value of securities and other financial instruments for which market prices are not readily available. Under these procedures, the Valuation Committee convenes on a regular and ad hoc basis to review such securities and considers a number of factors, including valuation methodologies and significant unobservable valuation inputs, when arriving at fair value. The Valuation Committee may employ a market-based approach which may use related or comparable assets or liabilities, recent transactions, market multiples, book values, and other relevant information for the investment to determine the fair value of the investment. An income-based valuation approach may also be used in which the anticipated future cash flows of the investment are discounted to calculate fair value. Discounts may also be applied due to the nature or duration of any restrictions on the disposition of the investments. Due to the inherent uncertainty of valuations of such investments, the fair values may differ significantly from the values that would have been used had an active market existed. The Valuation Committee employs various methods for calibrating these valuation approaches including a regular review of valuation methodologies, key inputs and assumptions, transactional back-testing or disposition analysis, and reviews of any related market activity.
2. Fair Value Measurement: Financial Accounting Standards Board ("FASB") Accounting Standards CodificationTM ("ASC") 820, "Fair Value Measurement"
("ASC 820"), defines fair value as the value that the Fund would receive to sell an investment or pay to transfer a liability in a timely transaction with an independent buyer in the principal market, or in the absence of a principal market the most advantageous market for the investment or liability. ASC 820 establishes a three-tier hierarchy to distinguish between (1) inputs that reflect the assumptions market participants would use in valuing an asset or liability developed based on market data obtained from sources independent of the reporting entity (observable inputs) and (2) inputs that reflect the reporting entity's own assumptions about the assumptions market participants would use in valuing an asset or liability developed based on the best information available in the circumstances (unobservable inputs) and to establish classification of fair value measurements for disclosure purposes. Various inputs are used in determining the value of the Fund's investments. The inputs are summarized in the three broad levels listed below.
• Level 1 – unadjusted quoted prices in active markets for identical investments
• Level 2 – other significant observable inputs (including quoted prices for similar investments, interest rates, prepayment speeds, credit risk, etc.)
• Level 3 – significant unobservable inputs including the Fund's own assumptions in determining the fair value of investments. Factors considered in making this determination may include, but are not limited to, information obtained by contacting the issuer, analysts, or the appropriate stock exchange (for exchange-traded securities), analysis of the issuer's financial statements or other available documents and, if necessary, available information concerning other securities in similar circumstances
The inputs or methodology used for valuing securities are not necessarily an indication of the risk associated with investing in those securities and the determination of the significance of a particular input to the fair value measurement in its entirety requires judgment and considers factors specific to each security.
30
Morgan Stanley Institutional Fund Trust
Annual Report — September 30, 2015
Notes to Financial Statements (cont'd)
The following is a summary of the inputs used to value the Portfolio's investments as of September 30, 2015.
Investment Type | | Level 1
Unadjusted
quoted
prices
(000) | | Level 2
Other
significant
observable
inputs
(000) | | Level 3
Significant
unobservable
inputs
(000) | | Total
(000) | |
Assets: | |
Fixed Income Securities | |
Agency Fixed Rate
Mortgages | | $ | — | | | $ | 789 | | | $ | — | | | $ | 789 | | |
Commercial
Mortgage-Backed
Securities | | | — | | | | 180 | | | | — | | | | 180 | | |
Corporate Bonds | | | — | | | | 1,708 | | | | — | | | | 1,708 | | |
Sovereign | | | — | | | | 2,595 | | | | — | | | | 2,595 | | |
U.S. Treasury Securities | | | — | | | | 931 | | | | — | | | | 931 | | |
Total Fixed Income
Securities | | | — | | | | 6,203 | | | | — | | | | 6,203 | | |
Common Stocks | |
Aerospace & Defense | | | — | | | | 53 | | | | — | | | | 53 | | |
Air Freight & Logistics | | | — | | | | 19 | | | | — | | | | 19 | | |
Airlines | | | — | | | | 31 | | | | — | | | | 31 | | |
Auto Components | | | 5 | | | | 53 | | | | — | | | | 58 | | |
Automobiles | | | 7 | | | | 95 | | | | — | | | | 102 | | |
Banks | | | 155 | | | | 632 | | | | — | | | | 787 | | |
Beverages | | | 33 | | | | 108 | | | | — | | | | 141 | | |
Biotechnology | | | 10 | | | | — | | | | — | | | | 10 | | |
Building Products | | | — | | | | 49 | | | | — | | | | 49 | | |
Capital Markets | | | 7 | | | | 92 | | | | — | | | | 99 | | |
Chemicals | | | 2 | | | | 111 | | | | — | | | | 113 | | |
Commercial Services &
Supplies | | | — | | | | 6 | | | | — | | | | 6 | | |
Communications
Equipment | | | 36 | | | | 26 | | | | — | | | | 62 | | |
Construction &
Engineering | | | — | @ | | | 87 | | | | — | | | | 87 | | |
Construction Materials | | | — | | | | 61 | | | | — | | | | 61 | | |
Diversified Consumer
Services | | | 4 | | | | 7 | | | | — | | | | 11 | | |
Diversified Financial
Services | | | 13 | | | | 62 | | | | — | | | | 75 | | |
Diversified
Telecommunication
Services | | | 33 | | | | 122 | | | | — | | | | 155 | | |
Electric Utilities | | | 24 | | | | 85 | | | | — | | | | 109 | | |
Electrical Equipment | | | — | | | | 41 | | | | — | | | | 41 | | |
Electronic Equipment,
Instruments &
Components | | | 2 | | | | — | | | | — | | | | 2 | | |
Energy Equipment &
Services | | | 7 | | | | — | | | | — | | | | 7 | | |
Food & Staples Retailing | | | 28 | | | | 34 | | | | — | | | | 62 | | |
Food Products | | | 15 | | | | 43 | | | | — | | | | 58 | | |
Gas Utilities | | | 12 | | | | 41 | | | | — | | | | 53 | | |
Health Care
Equipment & Supplies | | | 13 | | | | 26 | | | | — | | | | 39 | | |
Health Care
Providers & Services | | | 8 | | | | 34 | | | | — | | | | 42 | | |
Hotels, Restaurants &
Leisure | | | 15 | | | | 62 | | | | — | | | | 77 | | |
Household Durables | | | — | | | | 4 | | | | — | | | | 4 | | |
Household Products | | | 27 | | | | 32 | | | | — | | | | 59 | | |
Investment Type | | Level 1
Unadjusted
quoted
prices
(000) | | Level 2
Other
significant
observable
inputs
(000) | | Level 3
Significant
unobservable
inputs
(000) | | Total
(000) | |
Common Stocks (cont'd) | |
Independent Power
Producers & Energy
Traders | | $ | — | | | $ | — | @ | | $ | — | | | $ | — | @ | |
Industrial Conglomerates | | | 34 | | | | 70 | | | | — | | | | 104 | | |
Information Technology
Services | | | 18 | | | | 85 | | | | — | | | | 103 | | |
Insurance | | | 21 | | | | 158 | | | | — | | | | 179 | | |
Internet Software &
Services | | | 23 | | | | — | | | | — | | | | 23 | | |
Machinery | | | — | | | | 12 | | | | — | | | | 12 | | |
Media | | | 41 | | | | 123 | | | | — | | | | 164 | | |
Metals & Mining | | | 60 | | | | 48 | | | | — | | | | 108 | | |
Multi-Utilities | | | 54 | | | | 83 | | | | — | | | | 137 | | |
Multi-line Retail | | | 38 | | | | 5 | | | | — | | | | 43 | | |
Oil, Gas & Consumable
Fuels | | | 196 | | | | 147 | | | | — | | | | 343 | | |
Paper & Forest
Products | | | — | | | | 9 | | | | — | | | | 9 | | |
Personal Products | | | — | | | | 76 | | | | — | | | | 76 | | |
Pharmaceuticals | | | 94 | | | | 175 | | | | — | | | | 269 | | |
Professional Services | | | — | | | | 80 | | | | — | | | | 80 | | |
Real Estate Investment
Trusts (REITs) | | | 264 | | | | 125 | | | | — | | | | 389 | | |
Real Estate
Management &
Development | | | 6 | | | | 62 | | | | — | | | | 68 | | |
Road & Rail | | | 9 | | | | — | | | | — | | | | 9 | | |
Semiconductors &
Semiconductor
Equipment | | | 25 | | | | 35 | | | | — | @ | | | 60 | | |
Software | | | 67 | | | | 36 | | | | — | | | | 103 | | |
Specialty Retail | | | 52 | | | | 43 | | | | — | | | | 95 | | |
Tech Hardware,
Storage &
Peripherals | | | 88 | | | | — | | | | — | | | | 88 | | |
Textiles, Apparel &
Luxury Goods | | | 8 | | | | 71 | | | | — | | | | 79 | | |
Tobacco | | | 19 | | | | 23 | | | | — | | | | 42 | | |
Trading Companies &
Distributors | | | — | | | | 13 | | | | — | | | | 13 | | |
Transportation
Infrastructure | | | — | | | | 86 | | | | — | | | | 86 | | |
Water Utilities | | | 9 | | | | 13 | | | | — | | | | 22 | | |
Wireless
Telecommunication
Services | | | 13 | | | | 11 | | | | — | | | | 24 | | |
Total Common Stocks | | | 1,595 | | | | 3,605 | | | | — | @ | | | 5,200 | | |
Investment Companies | | | 982 | | | | — | | | | — | | | | 982 | | |
Short-Term Investments | |
Investment Company | | | 1,742 | | | | — | | | | — | | | | 1,742 | | |
U.S Treasury Security | | | — | | | | 318 | | | | — | | | | 318 | | |
Total Short-Term
Investments | | | 1,742 | | | | 318 | | | | — | | | | 2,060 | | |
Foreign Currency
Forward Exchange
Contracts | | | — | | | | 47 | | | | — | | | | 47 | | |
Futures Contracts | | | 26 | | | | — | | | | — | | | | 26 | | |
Credit Default
Swap Agreements | | | — | | | | 2 | | | | — | | | | 2 | | |
31
Morgan Stanley Institutional Fund Trust
Annual Report — September 30, 2015
Notes to Financial Statements (cont'd)
Investment Type | | Level 1
Unadjusted
quoted
prices
(000) | | Level 2
Other
significant
observable
inputs
(000) | | Level 3
Significant
unobservable
inputs
(000) | | Total
(000) | |
Common Stocks (cont'd) | |
Interest Rate
Swap Agreements | | $ | — | | | $ | — | @ | | $ | — | | | $ | — | @ | |
Total Return
Swap Agreements | | | — | | | | 26 | | | | — | | | | 26 | | |
Total Assets | | | 4,345 | | | | 10,201 | | | | — | | | | 14,546 | | |
Liabilities: | |
Call Options Written | | | (5 | ) | | | (7 | ) | | | — | | | | (12 | ) | |
Foreign Currency
Forward Exchange
Contracts | | | — | | | | (42 | ) | | | — | | | | (42 | ) | |
Futures Contracts | | | (71 | ) | | | — | | | | — | | | | (71 | ) | |
Credit Default
Swap Agreements | | | — | | | | (1 | ) | | | — | | | | (1 | ) | |
Interest Rate
Swap Agreements | | | — | | | | (2 | ) | | | — | | | | (2 | ) | |
Total Return
Swap Agreements | | | — | | | | (2 | ) | | | — | | | | (2 | ) | |
Total Liabilities | | | (76 | ) | | | (54 | ) | | | — | | | | (130 | ) | |
Total | | $ | 4,269 | | | $ | 10,147 | | | $ | — | @ | | $ | 14,416 | | |
@ Value is less than $500.
Transfers between investment levels may occur as the markets fluctuate and/or the availability of data used in an investment's valuation changes. The Portfolio recognizes transfers between the levels as of the end of the period. As of September 30, 2015, the Portfolio did not have any investments transfer between investment levels.
Following is a reconciliation of investments in which significant unobservable inputs (Level 3) were used in determining fair value.
| | | Common
Stock
(000) | |
Beginning Balance | | $ | — | | |
Purchases | | | 2 | | |
Sales | | | — | | |
Amortization of discount | | | — | | |
Transfers in | | | — | | |
Transfers out | | | — | | |
Corporate actions | | | — | | |
Change in unrealized appreciation (depreciation) | | | (2 | ) | |
Realized gains (losses) | | | — | | |
Ending Balance | | $ | — | @ | |
Net change in unrealized appreciation (depreciation) from investments
still held as of September 30, 2015 | | $ | (2 | ) | |
@ Value is less than $500.
3. Foreign Currency Translation and Foreign Investments: The books and records of the Portfolio are maintained in U.S. dollars. Foreign currency amounts are translated into U.S. dollars as follows:
– investments, other assets and liabilities at the prevailing rate of exchange on the valuation date;
– investment transactions and investment income at the prevailing rates of exchange on the dates of such transactions.
Although the net assets of the Portfolio are presented at the foreign exchange rates and market values at the close of the period, the Portfolio does not isolate that portion of the results of operations arising as a result of changes in the foreign exchange rates from the fluctuations arising from changes in the market prices of securities held at period end. Similarly, the Portfolio does not isolate the effect of changes in foreign exchange rates from the fluctuations arising from changes in the market prices of securities sold during the period. Accordingly, realized and unrealized foreign currency gains (losses) on investments in securities are included in the reported net realized and unrealized gains (losses) on investment transactions and balances. However, pursuant to U.S. Federal income tax regulations, gains and losses from certain foreign currency transactions and the foreign currency portion of gains and losses realized on sales and maturities of foreign denominated debt securities are treated as ordinary income for U.S. Federal income tax purposes.
Net realized gains (losses) on foreign currency transactions represent net foreign exchange gains (losses) from foreign currency forward exchange contracts, disposition of foreign currencies, currency gains (losses) realized between the trade and settlement dates on securities transactions, and the difference between the amount of investment income and foreign withholding taxes recorded on the Portfolio's books and the U.S. dollar equivalent amounts actually received or paid. Net unrealized currency gains (losses) from valuing foreign currency denominated assets and liabilities at period end exchange rates are reflected as a component of unrealized appreciation (depreciation) in the Statement of Assets and Liabilities. The change in unrealized currency gains (losses) on foreign currency translations on foreign currency translations for the period is reflected in the Statement of Operations.
32
Morgan Stanley Institutional Fund Trust
Annual Report — September 30, 2015
Notes to Financial Statements (cont'd)
Foreign security and currency transactions may involve certain considerations and risks not typically associated with those of U.S. dollar denominated transactions as a result of, among other factors, fluctuations of exchange rates in relation to the U.S. dollar, the possibility of lower levels of governmental supervision and regulation of foreign securities markets and the possibility of political or economic instability.
Governmental approval for foreign investments may be required in advance of making an investment under certain circumstances in some countries, and the extent of foreign investments in domestic companies may be subject to limitation in other countries. Foreign ownership limitations also may be imposed by the charters of individual companies to prevent, among other concerns, violations of foreign investment limitations. As a result, an additional class of shares (identified as "Foreign" in the Portfolio of Investments) may be created and offered for investment. The "local" and "foreign shares" market values may differ. In the absence of trading of the foreign shares in such markets, the Portfolio values the foreign shares at the closing exchange price of the local shares.
4. Derivatives: The Portfolio may, but is not required to, use derivative instruments for a variety of purposes, including hedging, risk management, portfolio management or to earn income. Derivatives are financial instruments whose value is based, in part, on the value of an underlying asset, interest rate, index or financial instrument. Prevailing interest rates and volatility levels, among other things, also affect the value of derivative instruments. A derivative instrument often has risks similar to its underlying asset and may have additional risks, including imperfect correlation between the value of the derivative and the underlying asset, risks of default by the counterparty to certain transactions, magnification of losses incurred due to changes in the market value of the securities, instruments, indices or interest rates to which the derivative instrument relates, risks that the transactions may not be liquid and risks arising from margin requirements. The use of derivatives involves risks that are different from, and possibly greater than, the risks associated with other portfolio investments. Derivatives may involve the use of highly specialized instruments that require investment techniques and risk analyses different from those associated with other portfolio investments. All of the
Portfolio's holdings, including derivative instruments, are marked-to-market each day with the change in value reflected in unrealized appreciation (depreciation). Upon disposition, a realized gain or loss is recognized.
Certain derivative transactions may give rise to a form of leverage. Leverage magnifies the potential for gain and the risk of loss. Leverage associated with derivative transactions may cause the Portfolio to liquidate portfolio positions when it may not be advantageous to do so to satisfy its obligations or to meet earmarking or segregation requirements, pursuant to applicable Securities and Exchange Commission rules and regulations, or may cause the Portfolio to be more volatile than if the Portfolio had not been leveraged. Although the Adviser seeks to use derivatives to further the Portfolio's investment objectives, there is no assurance that the use of derivatives will achieve this result.
Following is a description of the derivative instruments and techniques that the Portfolio used during the period and their associated risks:
Futures: A futures contract is a standardized, exchange-traded agreement to buy or sell a specific quantity of an underlying asset, reference rate or index at a specific price at a specific future time. The value of a futures contract tends to increase and decrease in tandem with the value of the underlying instrument. Depending on the terms of the particular contract, futures contracts are settled through either physical delivery of the underlying instrument on the settlement date or by payment of a cash settlement amount on the settlement date. During the period the futures contract is open, payments are received from or made to the broker based upon changes in the value of the contract (the variation margin). A decision as to whether, when and how to use futures contracts involves the exercise of skill and judgment and even a well-conceived futures transaction may be unsuccessful because of market behavior or unexpected events. In addition to the derivatives risks discussed above, the prices of futures contracts can be highly volatile, using futures contracts can lower total return, and the potential loss from futures contracts can exceed the Portfolio's initial investment in such contracts. No assurance can be given that a liquid market will exist for any particular futures contract at any particular time. There is also the risk of loss by the Portfolio of margin deposits in the
33
Morgan Stanley Institutional Fund Trust
Annual Report — September 30, 2015
Notes to Financial Statements (cont'd)
event of bankruptcy of a broker with which the Portfolio has open positions in the futures contract.
Swaps: The Portfolio may enter into OTC swap contracts or cleared swap transactions. A swap contract is an agreement between two parties pursuant to which the parties exchange payments at specified dates on the basis of a specified notional amount, with the payments calculated by reference to specified securities, indices, reference rates, currencies or other instruments. Typically swap agreements provide that when the period payment dates for both parties are the same, the payments are made on a net basis (i.e., the two payment streams are netted out, with only the net amount paid by one party to the other). The Portfolio's obligations or rights under a swap contract entered into on a net basis will generally be equal only to the net amount to be paid or received under the agreement, based on the relative values of the positions held by each party. Cleared swap transactions may help reduce counterparty credit risk. In a cleared swap, the Portfolio's ultimate counterparty is a clearinghouse rather than a swap dealer, bank or other financial institution. OTC swap agreements are not entered into or traded on exchanges and often there is no central clearing or guaranty function for OTC swaps. These OTC swaps are often subject to credit risk or the risk of default or non-performance by the counterparty. Both OTC and cleared swaps could result in losses if interest rates, foreign currency exchange rates or other factors are not correctly anticipated by the Portfolio or if the reference index, security or investments do not perform as expected. During the period swap agreements are open, payments are received from or made to the clearinghouse or counterparty based upon changes in the value of the contract (variation margin). The Dodd-Frank Wall Street Reform and Consumer Protection Act and related regulatory developments require the clearing and exchange-trading of certain standardized swap transactions. Mandatory exchange-trading and clearing is occurring on a phased-in basis.
The Portfolio's use of swaps during the period included those based on the credit of an underlying security commonly referred to as "credit default swaps." The Portfolio may be either the buyer or seller in a credit default swap. Where the Portfolio is the buyer of a credit default swap contract, it would typically be entitled to receive the par (or other agreed-upon) value of a refer-
enced debt obligation from the counterparty to the contract only in the event of a default or similar event by the issuer of the debt obligation. If no default occurs, the Portfolio would have paid to the counterparty a periodic stream of payments over the term of the contract and received no benefit from the contract. When the Portfolio is the seller of a credit default swap contract, it typically receives the stream of payments but is obligated to pay an amount equal to the par (or other agreed-upon) value of a referenced debt obligation upon the default or similar event by the issuer of the referenced debt obligation. The use of credit default swaps could result in losses to the Portfolio if the Adviser fails to correctly evaluate the creditworthiness of the issuer of the referenced debt obligation.
If the Portfolio is a seller of protection and a credit event occurs, as defined under the terms of that particular swap agreement, the Portfolio will either (i) pay to the buyer of protection an amount equal to the notional amount of the swap agreement and take delivery of the referenced obligation, other deliverable obligations or underlying securities comprising the referenced index or (ii) pay a net settlement amount in the form of cash or securities equal to the notional amount of the swap agreement less the recovery value of the referenced obligation or underlying securities comprising the referenced index. If the Portfolio is a buyer of protection and a credit event occurs, as defined under the terms of that particular swap agreement, the Portfolio will either (i) receive from the seller of protection an amount equal to the notional amount of the swap agreement and deliver the referenced obligation, other deliverable obligations or underlying securities comprising the referenced index or (ii) receive a net settlement amount in the form of cash or securities equal to the notional amount of the swap agreement less the recovery value of the referenced obligation or underlying securities comprising the referenced index. Recovery values are estimated by market makers considering either industry standard recovery rates or entity specific factors and considerations until a credit event occurs. If a credit event has occurred, the recovery value is determined by a facilitated auction whereby a minimum number of allowable broker bids, together with a specified valuation method, are used to calculate the settlement value. The Portfolio's maximum risk of loss from counterparty risk, either as the protection seller or as the protection buyer, is the fair value of the swap agreement.
34
Morgan Stanley Institutional Fund Trust
Annual Report — September 30, 2015
Notes to Financial Statements (cont'd)
The current credit rating of each individual issuer is listed in the table following the Portfolio of Investments and serves as an indicator of the current status of the payment/performance risk of the credit derivative. Alternatively, for credit default swaps on an index of credits, the quoted market prices and current values serve as an indicator of the current status of the payment/performance risk of the credit derivative. Generally, lower credit ratings and increasing market values, in absolute terms, represent a deterioration of the credit and a greater likelihood of an adverse credit event of the issuer.
When the Portfolio has an unrealized loss on a swap agreement, the Portfolio has instructed the custodian to pledge cash or liquid securities as collateral with a value approximately equal to the amount of the unrealized loss. Collateral pledges are monitored and subsequently adjusted if and when the swap valuations fluctuate. If applicable, cash collateral is included with "Due from (to) Broker" in the Statement of Assets and Liabilities.
Upfront payments received or paid by the Portfolio will be reflected as an asset or liability, respectively, in the Statement of Assets and Liabilities.
Foreign Currency Forward Exchange Contracts: In connection with its investments in foreign securities, the Portfolio also entered into contracts with banks, brokers or dealers to purchase or sell securities or foreign currencies at a future date. A foreign currency forward exchange contract ("currency contract") is a negotiated agreement between the contracting parties to exchange a specified amount of currency at a specified future time at a specified rate. The rate can be higher or lower than the spot rate between the currencies that are the subject of the contract. Currency contracts may be used to protect against uncertainty in the level of future foreign currency exchange rates or to gain or modify exposure to a particular currency. In addition, the Portfolio may use cross currency hedging or proxy hedging with respect to currencies in which the Portfolio has or expects to have portfolio or currency exposure. Cross currency hedges involve the sale of one currency against the positive exposure to a different currency and may be used for hedging purposes or to establish an active exposure to the exchange rate between any two currencies. To the extent hedged by the use of currency contracts, the precise matching of the currency contract amounts and the
value of the securities involved will not generally be possible because the future value of such securities in foreign currencies will change as a consequence of market movements in the value of those securities between the date on which the contract is entered into and the date it matures. Furthermore, such transactions may reduce or preclude the opportunity for gain if the value of the currency should move in the direction opposite to the position taken. There is additional risk to the extent that currency contracts create exposure to currencies in which the Portfolio's securities are not denominated. Unanticipated changes in currency prices may result in poorer overall performance for the Portfolio than if it had not entered into such contracts. The use of currency contracts involves the risk of loss from the insolvency or bankruptcy of the counterparty to the contract or the failure of the counterparty to make payments or otherwise comply with the terms of the contract. A currency contract is marked-to-market daily and the change in market value is recorded by the Portfolio as unrealized gain or loss. The Portfolio records realized gains (losses) when the currency contract is closed equal to the difference between the value of the currency contract at the time it was opened and the value at the time it was closed.
Options: With respect to options, the Portfolio is subject to equity risk, interest rate risk and foreign currency exchange risk in the normal course of pursuing its investment objectives. If the Portfolio buys an option, it buys a legal contract giving it the right to buy or sell a specific amount of the underlying instrument or futures contract on the underlying instrument, at an agreed-upon price typically in exchange for a premium paid by the Portfolio. The Portfolio may purchase and/or sell put and call options. Purchasing call options tends to increase the Portfolio's exposure to the underlying (or similar) instrument. Purchasing put options tends to decrease the Portfolio's exposure to the underlying (or similar) instrument. When entering into purchased option contracts, the Portfolio bears the risk of interest or exchange rates or securities prices moving unexpectedly, in which case, the Portfolio may not achieve the anticipated benefits of the purchased option contracts; however the risk of loss is limited to the premium paid. Purchased options are reported as part of "Total Investments in Securities" in the Statement of Assets and Liabilities. Premium paid for purchasing options which
35
Morgan Stanley Institutional Fund Trust
Annual Report — September 30, 2015
Notes to Financial Statements (cont'd)
expired are treated as realized losses. If the Portfolio sells an option, it sells to another party the right to buy from or sell to the Portfolio a specific amount of the underlying instrument or futures contract on the underlying instrument at an agreed-upon price typically in exchange for a premium received by the Portfolio. The Portfolio may write call and put options on stock indexes, futures, securities or currencies it owns or in which it may invest. Writing put options tend to increase the Portfolio's exposure to the underlying instrument. Writing call options tend to decrease the Portfolio's exposure to the underlying instruments. When the Portfolio writes a call or put option, an amount equal to the premium received is recorded as a liability. Any liability recorded is subsequently adjusted to reflect the current value of the options written. Premiums received from writing options which expire are treated as realized gains. Premiums received from writing options which are exercised or are closed are added to or offset against the proceeds or amount paid on the transaction to determine the net realized gain or loss. The Portfolio as a writer of an option has no control over whether the underlying future, security or currency may be sold (call) or purchased (put) and as a result bears the market risk of an unfavorable change in the price of the future, security or currency underlying the written option. When options are purchased OTC, the Portfolio bears the risk that the counterparty that wrote the option will be unable or unwilling to perform its obligations under the option contract. Options may also be illiquid and the Portfolio may have difficulty closing out its position. A decision as to whether, when and how to use options involves the exercise of skill and judgment and even a well-conceived option transaction may be unsuccessful because of market behavior or unexpected events. The prices of options can be highly volatile and the use of options can lower total returns.
Transactions in written options for the period ended September 30, 2015 were as follows:
Written Options | | Number of
Contracts | | Premiums
Received
(000) | |
Options outstanding at April 30, 2015 | | | — | | | $ | — | | |
Options written | | | 16,246 | | | | 180 | | |
Options closed | | | (291 | ) | | | (18 | ) | |
Options exercised | | | (5,102 | ) | | | (34 | ) | |
Options expired | | | (7,620 | ) | | | (87 | ) | |
Options outstanding at September 30, 2015 | | | 3,233 | | | $ | 41 | | |
FASB ASC 815, "Derivatives and Hedging" ("ASC 815"), is intended to improve financial reporting about derivative instruments by requiring enhanced disclosures to enable investors to better understand how and why the Portfolio uses derivative instruments, how these derivative instruments are accounted for and their effects on the Portfolio's financial position and results of operations.
The following tables set forth the fair value of the Portfolio's derivative contracts by primary risk exposure as of September 30, 2015.
| | | Asset Derivatives
Statement of Assets and
Liabilities Location | | Primary Risk
Exposure | | Value
(000) | |
Foreign Currency
Forward Exchange
Contracts | | Unrealized Appreciation on
Foreign Currency Forward
Exchange Contracts | |
Currency Risk | | $ | 47 | | |
Futures Contracts
| | Variation Margin on
Futures Contracts | |
Equity Risk | | | 19 | (a) | |
Futures Contracts
| | Variation Margin on
Futures Contracts | |
Interest Rate Risk | | | 7 | (a) | |
Swap Agreements
| | Unrealized Appreciation on
Swap Agreements | |
Credit Risk | | | 2 | | |
Swap Agreements
| | Unrealized Appreciation on
Swap Agreements | |
Equity Risk | | | 26 | | |
Swap Agreements
| | Unrealized Appreciation on
Swap Agreements | |
Interest Rate Risk | | | — | @ | |
Total | | | | | | $ | 101 | | |
| | | Liability Derivatives
Statement of Assets and
Liabilities Location | | Primary Risk
Exposure | | Value
(000) | |
Call Options Written | | Options Written, at Value | | Currency Risk | | $ | (12 | ) | |
Foreign Currency
Forward Exchange
Contracts | | Unrealized Depreciation on
Foreign Currency Forward
Exchange Contracts | |
Currency Risk | | | (42 | ) | |
Futures Contracts | | Variation Margin on | | | | | |
| | Futures Contracts | | Commodity Risk | | | (7 | )(a) | |
Futures Contracts | | Variation Margin on | | | | | |
| | Futures Contracts | | Equity Risk | | | (46 | )(a) | |
Futures Contracts | | Variation Margin on | | | | | |
| | Futures Contracts | | Interest Rate Risk | | | (18 | )(a) | |
Swap Agreement | | Unrealized Depreciation on | | | | | |
| | Swap Agreement | | Credit Risk | | | (— | @) | |
Swap Agreements | | Variation Margin on | | | | | |
| | Swap Agreements | | Credit Risk | | | (1 | )(a) | |
Swap Agreements | | Unrealized Depreciation on | | | | | |
| | Swap Agreements | | Equity Risk | | | (2 | ) | |
Swap Agreements | | Unrealized Depreciation on | | | | | |
| | Swap Agreements | | Interest Rate Risk | | | (2 | ) | |
Total | | | | | | $ | (130 | ) | |
@ Amount is less than $500.
(a) This amount represents the cumulative appreciation (depreciation) as reported in the Portfolio of Investments. The Statement of Assets and Liabilities only reflects the current day's net variation margin.
The following tables set forth by primary risk exposure the Portfolio's realized gains (losses) and change in unrealized appreciation (depreciation) by type of derivative contract
36
Morgan Stanley Institutional Fund Trust
Annual Report — September 30, 2015
Notes to Financial Statements (cont'd)
for the period ended September 30, 2015 in accordance with ASC 815.
Realized Gain (Loss) | |
Primary Risk Exposure | | Derivative Type | | Value
(000) | |
Currency Risk | | Options Written | | $ | (— | @) | |
Currency Risk
| | Foreign Currency Forward
Exchange Contracts | | |
42 | | |
Commodity Risk | | Futures Contracts | | | (7 | ) | |
Equity Risk | | Futures Contracts | | | (224 | ) | |
Interest Rate Risk | | Futures Contracts | | | 4 | | |
Credit Risk | | Swap Agreements | | | 13 | | |
Equity Risk | | Swap Agreements | | | (71 | ) | |
Interest Rate Risk | | Swap Agreements | | | 89 | | |
Total | | | | $ | (154 | ) | |
@ Amount is less than $500.
Change in Unrealized Appreciation (Depreciation) | |
Primary Risk Exposure | | Derivative Type | | Value
(000) | |
Currency Risk | | Options Written | | $ | 29 | | |
Currency Risk
| | Foreign Currency Forward
Exchange Contracts | | |
5 | | |
Commodity Risk | | Futures Contracts | | | (7 | ) | |
Equity Risk | | Futures Contracts | | | (27 | ) | |
Interest Rate Risk | | Futures Contracts | | | (11 | ) | |
Credit Risk | | Swap Agreements | | | 1 | | |
Equity Risk | | Swap Agreements | | | 24 | | |
Interest Rate Risk | | Swap Agreements | | | (2 | ) | |
Total | | | | $ | 12 | | |
At September 30, 2015, the Portfolio's derivative assets and liabilities are as follows:
Gross Amounts of Assets and Liabilities Presented in the
Statement of Assets and Liabilities | |
Derivatives(b) | | Assets(c)
(000) | | Liabilities(c)
(000) | |
Foreign Currency Forward Exchange Contracts | | $ | 47 | | | $ | (42 | ) | |
Swap Agreements | | | 28 | | | | (4 | ) | |
Total | | $ | 75 | | | $ | (46 | ) | |
(b) Excludes exchange traded derivatives.
(c) Absent an event of default or early termination, OTC derivative assets and liabilities are presented gross and not offset in the Statement of Assets and Liabilities.
The Portfolio typically enters into International Swaps and Derivatives Association, Inc. Master Agreements ("ISDA Master Agreements") or similar master agreements (collectively, "Master Agreements") with its contract counterparties for certain OTC derivatives in order to, among other things, reduce its credit risk to counterparties. ISDA Master Agreements include provisions for general obligations, representations, collateral and events of default or termination. Under an ISDA Master Agreement, the Portfolio typically may offset with the counterparty certain OTC derivative financial instruments' payables and/or receivables with collateral held and/or posted and create one
single net payment (close-out netting) in the event of default, termination and/or potential deterioration in the credit quality of the counterparty. Various Master Agreements govern the terms of certain transactions with counterparties, including transactions such as swap, forward, repurchase and reverse repurchase agreements. These Master Agreements typically attempt to reduce the counterparty risk associated with such transactions by specifying credit protection mechanisms and providing standardization that improves legal certainty. Cross-termination provisions under Master Agreements typically provide that a default in connection with one transaction between the Portfolio and a counterparty gives the non-defaulting party the right to terminate any other transactions in place with the defaulting party to create one single net payment due to/due from the defaulting party and may be a feature in certain Master Agreements. In the event the Portfolio exercises its right to terminate a Master Agreement after a counterparty experiences a termination event as defined in the Master Agreement, the return of collateral with market value in excess of the Portfolio's net liability may be delayed or denied.
The following tables present derivative financial instruments that are subject to enforceable netting arrangements as of September 30, 2015.
Gross Amounts Not Offset in the Statement of Assets and Liabilities | |
Counterparty | | Gross Asset
Presented in
Statement of
Assets and
Liabilities
(000) | | Financial
Instrument
(000) | | Collateral
Received
(000) | | Derivatives
Net Amount
(not less
than $0)
(000) | |
Bank of America NA | | $ | 1 | | | $ | (1 | ) | | $ | — | | | $ | 0 | | |
Bank of Montreal | | | 2 | | | | (2 | ) | | | — | | | | 0 | | |
Bank of New York Mellon | | | — | @ | | | (— | @) | | | — | | | | 0 | | |
Barclays Bank PLC | | | — | @ | | | (— | @) | | | — | | | | 0 | | |
Citibank NA | | | 17 | | | | (1 | ) | | | — | | | | 16 | | |
Commonwealth Bank of Australia | | | 3 | | | | (3 | ) | | | — | | | | 0 | | |
Credit Suisse International | | | 1 | | | | (1 | ) | | | — | | | | 0 | | |
Deutsche Bank AG | | | 3 | | | | (3 | ) | | | — | | | | 0 | | |
Goldman Sachs International | | | 1 | | | | (1 | ) | | | — | | | | 0 | | |
JPMorgan Chase Bank NA | | | 37 | | | | (5 | ) | | | — | | | | 32 | | |
State Street Bank and Trust Co. | | | 2 | | | | (2 | ) | | | — | | | | 0 | | |
UBS AG | | | 8 | | | | (1 | ) | | | — | | | | 7 | | |
Total | | $ | 75 | | | $ | (20 | ) | | $ | — | | | $ | 55 | | |
37
Morgan Stanley Institutional Fund Trust
Annual Report — September 30, 2015
Notes to Financial Statements (cont'd)
Gross Amounts Not Offset in the Statement of Assets and Liabilities | |
Counterparty | | Gross Liability
Derivatives
Presented in
Statement of
Assets and
Liabilities
(000) | | Financial
Instrument
(000) | | Collateral
Pledged
(000) | | Net Amount
(not less
than $0)
(000) | |
Bank of America NA | | $ | 3 | | | $ | (1 | ) | | $ | — | | | $ | 2 | | |
Bank of Montreal | | | 4 | | | | (2 | ) | | | — | | | | 2 | | |
Bank of New York Mellon | | | 1 | | | | (— | @) | | | — | | | | 1 | | |
Barclays Bank PLC | | | 1 | | | | (— | @) | | | — | | | | 1 | | |
Citibank NA | | | 1 | | | | (1 | ) | | | — | | | | 0 | | |
Commonwealth Bank of Australia | | | 4 | | | | (3 | ) | | | — | | | | 1 | | |
Credit Suisse International | | | 7 | | | | (1 | ) | | | — | | | | 6 | | |
Deutsche Bank AG | | | 10 | | | | (3 | ) | | | — | | | | 7 | | |
Goldman Sachs International | | | 4 | | | | (1 | ) | | | — | | | | 3 | | |
HSBC Bank PLC | | | 2 | | | | — | | | | — | | | | 2 | | |
JPMorgan Chase Bank NA | | | 5 | | | | (5 | ) | | | — | | | | 0 | | |
State Street Bank and Trust Co. | | | 3 | | | | (2 | ) | | | — | | | | 1 | | |
UBS AG | | | 1 | | | | (1 | ) | | | — | | | | 0 | | |
Total | | $ | 46 | | | $ | (20 | ) | | $ | — | | | $ | 26 | | |
@ Amount is less than $500.
For the period ended September 30, 2015, the approximate average monthly amount outstanding for each derivative type is as follows:
Foreign Currency Forward Exchange Contracts: | |
Average monthly principal amount | | $ | 8,048,000 | | |
Futures Contracts: | |
Average monthly original value | | $ | 15,619,000 | | |
Swap Agreements: | |
Average monthly notional amount | | $ | 9,386,000 | | |
Call Options Written: | |
Average monthly currency amount | | $ | 3,000 | | |
5. When-Issued/Delayed Delivery Securities: The Portfolio purchases and sells when-issued and delayed delivery securities. Securities purchased on a when-issued or delayed delivery basis are purchased for delivery beyond the normal settlement date at a stated price and yield, and no income accrues to the Portfolio on such securities prior to delivery date. Payment and delivery for when-issued and delayed delivery securities can take place a month or more after the date of the transaction. When the Portfolio enters into a purchase transaction on a when-issued or delayed delivery basis, securities are available for collateral in an amount at least equal in value to the Portfolio's commitments to purchase such securities. Purchasing securities on a when-issued or delayed delivery basis may involve a risk that the market price at the time of delivery may be lower than the agreed upon purchase price, in which case
there could be an unrealized loss at the time of delivery. Purchasing investments on a when-issued or delayed delivery basis may be considered a form of leverage which may increase the impact that gains (losses) may have on the Portfolio.
6. Indemnifications: The Fund enters into contracts that contain a variety of indemnifications. The Fund's maximum exposure under these arrangements is unknown. However, the Fund has not had prior claims or losses pursuant to these contracts and expects the risk of loss to be remote.
7. Dividends and Distributions to Shareholders: Dividend income and distributions to shareholders are recorded on the ex-dividend date. Dividends from net investment income, if any, are declared and paid quarterly. Net realized capital gains, if any, are distributed at least annually.
8. Security Transactions, Income and Expenses: Security transactions are accounted for on the trade date (date the order to buy or sell is executed). Realized gains and losses on the sale of investment securities are determined on the specific identified cost method. Dividend income and other distributions are recorded on the ex-dividend date (except for certain foreign dividends which may be recorded as soon as the Portfolio is informed of such dividends) net of applicable withholding taxes. Interest income is recognized on the accrual basis except where collection is in doubt. Discounts are accreted and premiums are amortized over the life of the respective securities. Most expenses of the Fund can be directly attributed to a particular Portfolio. Expenses which cannot be directly attributed are apportioned among the Portfolios based upon relative net assets or other appropriate methods. Income, expenses (other than class specific expenses — distribution, transfer agency and sub transfer agency fees) and realized and unrealized gains or losses are allocated to each class of shares based upon their relative net assets.
The Portfolio owns shares of real estate investment trusts ("REITs") which report information on the source of their distributions annually in the following calendar year. A portion of distributions received from REITs during the year is estimated to be a return of capital and is recorded as a reduction of their cost.
38
Morgan Stanley Institutional Fund Trust
Annual Report — September 30, 2015
Notes to Financial Statements (cont'd)
B. Advisory Fees: The Adviser, a wholly-owned subsidiary of Morgan Stanley, provides the Portfolio with advisory services under the terms of an Investment Advisory Agreement, paid quarterly, at an annual rate of 0.65% of the average daily net assets of the Portfolio.
The Adviser has agreed to reduce its advisory fee and/or reimburse the Portfolio so that total annual portfolio operating expenses, excluding certain investment related expenses, taxes, interest and other extraordinary expenses (including litigation), will not exceed 0.95% for Class I shares, 1.30% for Class A shares, 2.05% for Class C shares and 0.90% for Class IS shares. The fee waivers and/or expense reimbursements will continue for at least one year from the date of the Portfolio's prospectus or until such time that the Trustees act to discontinue all or a portion of such waivers and/or reimbursements when they deem such action is appropriate. For the period ended September 30, 2015, approximately $40,000 of advisory fees were waived and approximately $273,000 of other expenses were reimbursed by the Adviser pursuant to this arrangement.
C. Administration Fees: The Adviser also serves as Administrator to the Fund and provides administrative services pursuant to an Administration Agreement for an annual fee, accrued daily and paid monthly, of 0.08% of the Portfolio's average daily net assets. Under a Sub-Administration Agreement between the Administrator and State Street Bank and Trust Company ("State Street"), State Street provides certain administrative services to the Fund. For such services, the Administrator pays State Street a portion of the fee the Administrator receives from the Portfolio.
D. Distribution and Shareholder Services Fees: Morgan Stanley Distribution, Inc. ("MSDI" or the "Distributor"), a wholly-owned subsidiary of the Adviser, and an indirect subsidiary of Morgan Stanley, serves as the Fund's Distributor of Portfolio shares pursuant to a Distribution Agreement. The Fund has adopted a Shareholder Services Plan with respect to Class A shares pursuant to Rule 12b-1 under the Act. Under the Shareholder Services Plan, the Portfolio pays the Distributor a shareholder services fee, accrued daily and paid monthly, at an annual rate of 0.25% of the Portfolio's average daily net assets attributable to Class A shares.
The Fund has adopted a Distribution and Shareholder Services Plan with respect to Class C shares pursuant to Rule 12b-1 under the Act. Under the Distribution and Shareholder Services Plan, the Portfolio pays the Distributor a distribution fee, accrued daily and paid monthly, at an annual rate of 0.75% and
a shareholder services fee, accrued daily and paid monthly, at an annual rate of 0.25% of the Portfolio's average daily net assets attributable to Class C shares.
The distribution and shareholder services fees are used to support the expenses associated with servicing and maintaining accounts. The Distributor may compensate other parties for providing shareholder support services to investors who purchase Class A and Class C shares.
E. Dividend Disbursing and Transfer Agent: The Fund's dividend disbursing and transfer agent is Boston Financial Data Services, Inc. ("BFDS"). Pursuant to a Transfer Agency Agreement, the Fund pays BFDS a fee based on the number of classes, accounts and transactions relating to the Portfolios of the Fund.
F. Custodian Fees: State Street (the "Custodian") serves as Custodian for the Fund in accordance with a Custodian Agreement. The Custodian holds cash, securities, and other assets of the Fund as required by the Act. Custody fees are payable monthly based on assets held in custody, investment purchases and sales activity and account maintenance fees, plus reimbursement for certain out-of-pocket expenses.
G. Security Transactions and Transactions with Affiliates: For the period ended September 30, 2015, purchases and sales of investment securities for the Portfolio, other than long-term U.S. Government securities and short-term investments, were approximately $16,342,000 and $4,316,000, respectively. For the period ended September 30, 2015, purchases and sales of long-term U.S. Government securities were approximately $5,821,000 and $4,356,000, respectively.
The Portfolio invests in the Institutional Class of the Morgan Stanley Institutional Liquidity Funds — Money Market Portfolio (the "Liquidity Funds"), an open-end management investment company managed by the Adviser. Advisory fees paid by the Portfolio are reduced by an amount equal to its pro-rata share of the advisory and administration fees paid by the Portfolio due to its investment in the Liquidity Funds. For the period ended September 30, 2015, advisory fees paid were reduced by approximately $1,000 relating to the Portfolio's investment in the Liquidity Funds.
39
Morgan Stanley Institutional Fund Trust
Annual Report — September 30, 2015
Notes to Financial Statements (cont'd)
A summary of the Portfolio's transactions in shares of the Liquidity Funds during the period ended September 30, 2015 is as follows:
Value
April 30,
2015
(000) | | Purchases
at Cost
(000) | | Sales
(000) | | Dividend
Income
(000) | | Value
September 30,
2015
(000) | |
| $ | — | | | $ | 17,896 | | | $ | 16,154 | | | $ | 1 | | | $ | 1,742 | | |
The Portfolio invests in Morgan Stanley Institutional Fund, Inc. — Emerging Markets Fixed Income Opportunities Portfolio ("Emerging Markets Fixed Income Opportunities Portfolio"), an open-end management investment company advised by an affiliate of the Adviser. Advisory fees paid by the Portfolio are reduced by an amount equal to its pro-rata share of the advisory and administration fees paid by the Emerging Markets Fixed Income Opportunities Portfolio. For the period ended September 30, 2015, advisory fees paid were reduced by approximately $1,000 relating to the Portfolio's investment in the Emerging Markets Fixed Income Opportunities Portfolio. The Emerging Markets Fixed Income Opportunities Portfolio has a cost basis of approximately $454,000 at September 30, 2015.
A summary of the Portfolio's transactions in shares of the Emerging Markets Fixed Income Opportunities Portfolio during the period ended September 30, 2015 is as follows:
Value
April 30,
2015
(000) | | Purchases
at Cost
(000) | | Sales
(000) | | Realized
Loss
(000) | | Dividend
Income
(000) | | Value
September 30,
2015
(000) | |
| $ | — | | | $ | 750 | | | $ | 285 | | | $ | (10 | ) | | $ | 5 | | | $ | 417 | | |
The Portfolio invests in Morgan Stanley Institutional Fund Trust — High Yield Portfolio ("High Yield Portfolio"), an open-end management investment company advised by an affiliate of the Adviser. Advisory fees paid by the Portfolio are reduced by an amount equal to its pro-rata share of the advisory and administration fees paid by the High Yield Portfolio. For the period ended September 30, 2015, advisory fees paid were reduced by less than $500 relating to the Portfolio's investment in the High Yield Portfolio. The High Yield Portfolio has a cost basis of approximately $600,000 at September 30, 2015.
A summary of the Portfolio's transactions in shares of the High Yield Portfolio during the period ended September 30, 2015 is as follows:
Value
April 30,
2015
(000) | | Purchases
at Cost
(000) | | Sales
(000) | | Dividend
Income
(000) | | Value
September 30,
2015
(000) | |
| $ | — | | | $ | — | | | $ | — | | | $ | 9 | | | $ | 565 | | |
The Portfolio has an unfunded Deferred Compensation Plan (the "Compensation Plan"), which allows each independent Trustee to defer payment of all, or a portion, of the fees he or she receives for serving on the Board of Trustees. Each eligible Trustee generally may elect to have the deferred amounts credited with a return equal to the total return on one or more of the Morgan Stanley funds that are offered as investment options under the Compensation Plan. Appreciation/depreciation and distributions received from these investments are recorded with an offsetting increase/decrease in the deferred compensation obligation and do not affect the NAV of the Portfolio.
H. Federal Income Taxes: It is the Portfolio's intention to continue to qualify as a regulated investment company and distribute all of its taxable and tax-exempt income. Accordingly, no provision for Federal income taxes is required in the financial statements.
The Portfolio may be subject to taxes imposed by countries in which it invests. Such taxes are generally based on income and/or capital gains earned or repatriated. Taxes are accrued based on net investment income, net realized gains and net unrealized appreciation as such income and/or gains are earned. Taxes may also be based on transactions in foreign currency and are accrued based on the value of investments denominated in such currency.
FASB ASC 740-10, "Income Taxes — Overall", sets forth a minimum threshold for financial statement recognition of the benefit of a tax position taken or expected to be taken in a tax return. Management has concluded there are no significant uncertain tax positions that would require recognition in the financial statements. If applicable, the Portfolio recognizes interest accrued related to unrecognized tax benefits in "Interest Expense" and penalties in "Other Expenses" in the Statement of Operations. The Portfolio files tax returns with the U.S. Internal Revenue Service, New York and various states. The tax period ended September 30, 2015, remains subject to examination by taxing authorities.
The tax character of distributions paid may differ from the character of distributions shown in the Statement of Changes in Net Assets due to short-term capital gains being treated as ordinary income for tax purposes. The tax character of distributions paid during fiscal year 2015 was as follows:
2015 Distributions
Paid From:
Ordinary Income
(000) | |
| $ | 45 | | |
40
Morgan Stanley Institutional Fund Trust
Annual Report — September 30, 2015
Notes to Financial Statements (cont'd)
The amount and character of income and gains to be distributed are determined in accordance with income tax regulations which may differ from GAAP. These book/tax differences are either considered temporary or permanent in nature.
Temporary differences are attributable to differing book and tax treatments for the timing of the recognition of gains (losses) on certain investment transactions and the timing of the deductibility of certain expenses.
Permanent differences, primarily due to differing treatments of gains (losses) related to foreign currency transactions and basis adjustments for swap transactions, resulted in the following reclassifications among the components of net assets at September 30, 2015:
Accumulated
Undistributed
Net Investment
Income
(000) | | Accumulated
Net Realized
Loss
(000) | | Paid-in-
Capital
(000) | |
| $ | (7 | ) | | $ | 7 | | | $ | — | | |
At September 30, 2015, the components of distributable earnings for the Portfolio on a tax basis were as follows:
Undistributed
Ordinary
Income
(000) | | Undistributed
Long-Term
Capital Gain
(000) | |
| $ | 238 | | | $ | — | | |
At September 30, 2015, the Portfolio had available for Federal income tax purposes unused short term and long term capital losses of approximately $149,000 and $111,000, respectively, that do not have an expiration date.
To the extent that capital loss carryforwards are used to offset any future capital gains realized during the carryover period as provided by U.S. Federal income tax regulations, no capital gains tax liability will be incurred by the Portfolio for gains realized and not distributed. To the extent that capital gains are offset, such gains will not be distributed to the shareholders.
I. Other: At September 30, 2015, the Portfolio had otherwise unaffiliated record owners of 10% or greater. Investment activities of these shareholders could have a material impact on the Portfolio. The aggregate percentage of such owners was 79.0%.
41
Morgan Stanley Institutional Fund Trust
Annual Report — September 30, 2015
Report of Independent Registered Public Accounting Firm
To the Shareholders and Board of Trustees of
Morgan Stanley Institutional Fund Trust —
Global Multi-Asset Income Portfolio
We have audited the accompanying statement of assets and liabilities, including the portfolio of investments, of Global Multi-Asset Income Portfolio (one of the portfolios constituting Morgan Stanley Institutional Fund Trust) (the "Portfolio") as of September 30, 2015, the related statements of operations and changes in net assets for the period from April 30, 2015 (commencement of operations) to September 30, 2015 and the financial highlights for each of the periods indicated therein. These financial statements and financial highlights are the responsibility of the Portfolio's management. Our responsibility is to express an opinion on these financial statements and financial highlights based on our audit.
We conducted our audit in accordance with the standards of the Public Company Accounting Oversight Board (United States). Those standards require that we plan and perform the audit to obtain reasonable assurance about whether the financial statements and financial highlights are free of material misstatement. We were not engaged to perform an audit of the Portfolio's internal control over financial reporting. Our audit included consideration of internal control over financial reporting as a basis for designing audit procedures that are appropriate in the circumstances, but not for the purpose of expressing an opinion on the effectiveness of the Portfolio's internal control over financial reporting. Accordingly, we express no such opinion. An audit also includes examining, on a test basis, evidence supporting the amounts and disclosures in the financial statements and financial highlights, assessing the accounting principles used and significant estimates made by management, and evaluating the overall financial statement presentation. Our procedures included confirmation of securities owned as of September 30, 2015, by correspondence with the custodian and others or by other appropriate auditing procedures where replies from others were not received. We believe that our audit provides a reasonable basis for our opinion.
In our opinion, the financial statements and financial highlights referred to above present fairly, in all material respects, the financial position of Global Multi-Asset Income Portfolio (one of the portfolios constituting Morgan Stanley Institutional Fund Trust) at September 30, 2015, the results of its operations, changes in its net assets for the period from April 30, 2015 (commencement of operations) to September 30, 2015 and the financial highlights for each of the periods indicated therein, in conformity with U.S. generally accepted accounting principles.

Boston, Massachusetts
November 25, 2015
42
Morgan Stanley Institutional Fund Trust
Annual Report — September 30, 2015
Investment Advisory Agreement Approval (unaudited)
The Board considered the following factors at the time of approval of the contracts which occurred prior to commencement of operations.
Nature, Extent and Quality of Services
The Board reviewed and considered the nature and extent of the investment advisory services to be provided by the Adviser (as defined herein) under the advisory agreement, including portfolio management, investment research and equity and fixed income securities trading. The Board also reviewed and considered the nature and extent of the non-advisory, administrative services to be provided by the Adviser under the administration agreement, including accounting, operations, clerical, bookkeeping, compliance, business management and planning, legal services and the provision of supplies, office space and utilities at the Adviser's expense. The Board also considered the Adviser's investment in personnel and infrastructure that benefits the Portfolio. (The advisory and administration agreements together are referred to as the "Management Agreement.") The Board also considered that the Adviser serves a variety of other investment advisory clients and has experience overseeing service providers.
The Board reviewed and considered the qualifications of the portfolio managers, the senior administrative managers and other key personnel of the Adviser who will provide the administrative and advisory services to the Portfolio. The Board determined that the Adviser's portfolio managers and key personnel are well qualified by education and/or training and experience to perform the services in an efficient and professional manner. The Board concluded that the nature and extent of the advisory and administrative services to be provided were necessary and appropriate for the conduct of the business and investment activities of the Portfolio and supported its decision to approve the Management Agreement.
Performance, Fees and Expenses of the Portfolio
The Board considered that the Adviser plans to arrange for a public offering of shares of the Portfolio to raise assets for investment and that the offering had not yet begun and concluded that, since the Portfolio currently had no assets to invest (other than seed capital required under the Investment Company Act) and had no track record of performance, this was not a factor it needed to address at the present time.
The Board reviewed the advisory and administrative fee rates (the "management fee rates") proposed to be paid by the Portfolio under the Management Agreement relative to comparable funds advised by the Adviser, when applicable, and compared to their peers as determined by the Adviser, and reviewed the anticipated total expense ratio of the Portfolio. The Board considered that the Portfolio requires the Adviser to develop processes, invest in additional resources and incur additional risks to successfully manage the Portfolio and concluded that the proposed management fee rate would be competitive with its peer group average and the anticipated total expense ratio would be acceptable.
Economies of Scale
The Board considered the growth prospects of the Portfolio and the structure of the proposed management fee schedule, which does not include breakpoints for the Portfolio. The Board considered that the Portfolio's potential growth was uncertain and concluded that it would be premature to consider economies of scale as a factor in approving the Management Agreement at the present time.
Profitability of the Adviser and Affiliates
Since the Portfolio had not begun operations and had not paid any fees to the Adviser, the Board concluded that this was not a factor that needed to be considered at the present time.
Other Benefits of the Relationship
The Board considered other direct and indirect benefits to the Adviser and/or its affiliates to be derived from their relationship with the Portfolio and other funds advised by the Adviser. These benefits may include, among other things, fees for trading, distribution and/or shareholder servicing and for transaction processing and reporting platforms used by securities lending agents, and research received by the Adviser generated from commission dollars spent on funds' portfolio trading. Since the Portfolio had not begun operations and had not paid any fees to the Adviser, the Board concluded that these benefits were not a factor that needed to be considered at the present time.
43
Morgan Stanley Institutional Fund Trust
Annual Report — September 30, 2015
Investment Advisory Agreement Approval (unaudited) (cont'd)
Resources of the Adviser and Historical Relationship Between the Portfolio and the Adviser
The Board considered whether the Adviser is financially sound and has the resources necessary to perform its obligations under the Management Agreement. The Board also reviewed and considered the organizational structure of the Adviser, the policies and procedures formulated and adopted by the Adviser for managing the Portfolio's operations and the Board's confidence in the competence and integrity of the senior managers and key personnel of the Adviser. The Board concluded that the Adviser has the financial resources necessary to fulfill its obligations under the Management Agreement and that it is beneficial for the Portfolio to enter into this relationship with the Adviser.
Other Factors and Current Trends
The Board considered the controls and procedures adopted and implemented by the Adviser and monitored by the Fund's Chief Compliance Officer and concluded that the conduct of business by the Adviser indicates a good faith effort on its part to adhere to high ethical standards in the conduct of the Portfolio's business.
General Conclusion
After considering and weighing all of the above factors, with various written materials and verbal information presented by the Adviser, the Board concluded that it would be in the best interest of the Portfolio and its future shareholders to approve the Management Agreement, which will remain in effect for two years and thereafter must be approved annually by the Board of the Portfolio if it is to continue in effect. In reaching this conclusion the Board did not give particular weight to any single piece of information or factor referenced above. It is possible that individual Board members may have weighed these factors, and the information presented, differently in reaching their individual decisions to approve the Management Agreement.
44
Morgan Stanley Institutional Fund Trust
Annual Report — September 30, 2015
Federal Tax Notice (unaudited)
For Federal income tax purposes, the following information is furnished with respect to the distributions paid by the Portfolio during its taxable year ended September 30, 2015. For corporate shareholders 4.80% of the dividends qualified for the dividends received deduction.
For Federal income tax purposes, the following information is furnished with respect to the Portfolio's earnings for its taxable year ended September 30, 2015. When distributed, certain earnings may be subject to a maximum tax rate of 15% as provided for by the Jobs and Growth Tax Relief Reconciliation Act of 2003. The Portfolio designated up to a maximum of approximately $78,000 as taxable at this lower rate.
In January, the Portfolio provides tax information to shareholders for the preceding calendar year.
45
Morgan Stanley Institutional Fund Trust
Annual Report — September 30, 2015
U.S. Privacy Policy (unaudited)
AN IMPORTANT NOTICE CONCERNING OUR U.S. PRIVACY POLICY
This privacy notice describes the U.S. privacy policy of Morgan Stanley Distribution, Inc., and the Morgan Stanley family of mutual funds ("us", "our", "we").
We are required by federal law to provide you with notice of our U.S. privacy policy ("Policy"). This Policy applies to both our current and former clients unless we state otherwise and is intended for individual clients who purchase products or receive services from us for personal, family or household purposes. This Policy is not applicable to partnerships, corporations, trusts or other non-individual clients or account holders, nor is this Policy applicable to individuals who are either beneficiaries of a trust for which we serve as trustee or participants in an employee benefit plan administered or advised by us. This Policy is, however, applicable to individuals who select us to be a custodian of securities or assets in individual retirement accounts, 401(k) accounts, or accounts subject to the Uniform Gifts to Minors Act.
This notice sets out our business practices to protect your privacy; how we collect and share personal information about you; and how you can limit our sharing or certain uses by others of this information. We may amend this Policy at any time, and will inform you of any changes to our Policy as required by law.
WE RESPECT YOUR PRIVACY
We appreciate that you have provided us with your personal financial information and understand your concerns about your information. We strive to safeguard the information our clients entrust to us. Protecting the confidentiality and security of client information is an important part of how we conduct our business.
This notice describes what personal information we collect about you, how we collect it, when we may share it with others, and how certain others may use it. It discusses the steps you may take to limit our sharing of certain information about you with our affiliated companies, including, but not limited to our affiliated banking businesses, brokerage firms and credit service affiliates. It also discloses how you may limit our affiliates' use of shared information for marketing purposes.
Throughout this Policy, we refer to the nonpublic information that personally identifies you as "personal information." We also use the term "affiliated company" in this notice. An affiliated company is a company in our family of companies and includes companies with the Morgan Stanley name. These affiliated companies are financial institutions such as broker-dealers, banks, investment advisers and credit card issuers. We refer to any company that is not an affiliated company as a nonaffiliated third party. For purposes of Section 5 of this notice, and your ability to limit certain uses of personal information by our affiliates, this notice applies to the use of personal information by our affiliated companies.
1. WHAT PERSONAL INFORMATION DO WE COLLECT FROM YOU?
We may collect the following types of information about you: (i) information provided by you, including information from applications and other forms we receive from you, (ii) information about your transactions with us or our affiliates, (iii) information about your transactions with nonaffiliated third parties, (iv) information from consumer reporting agencies, (v) information obtained from our websites, and (vi) information obtained from other sources. For example:
• We collect information such as your name, address, e-mail address, telephone/fax numbers, assets, income and investment objectives through applications and other forms you submit to us.
• We may obtain information about account balances, your use of account(s) and the types of products and services you prefer to receive from us through your dealings and transactions with us and other sources.
• We may obtain information about your creditworthiness and credit history from consumer reporting agencies.
• We may collect background information from and through third-party vendors to verify representations you have made and to comply with various regulatory requirements.
2. WHEN DO WE DISCLOSE PERSONAL INFORMATION WE COLLECT ABOUT YOU?
We may disclose personal information we collect about you in each of the categories listed above to affiliated and nonaffiliated third parties.
46
Morgan Stanley Institutional Fund Trust
Annual Report — September 30, 2015
U.S. Privacy Policy (unaudited) (cont'd)
a. Information We Disclose to Affiliated Companies.
We may disclose personal information that we collect about you to our affiliated companies to manage your account(s) effectively, to service and process your transactions, and to let you know about products and services offered by us and affiliated companies, to manage our business, and as otherwise required or permitted by law. Offers for products and services from affiliated companies are developed under conditions designed to safeguard your personal information.
b. Information We Disclose to Third Parties.
We may disclose personal information that we collect about you to nonaffiliated third parties to provide marketing services on our behalf or to other financial institutions with whom we have joint marketing agreements. We may also disclose all of the information we collect to other nonaffiliated third parties for our everyday business purposes, such as to process transactions, maintain account(s), respond to court orders and legal investigations, report to credit bureaus, offer our own products and services, protect against fraud, for institutional risk control, to perform services on our behalf, and as otherwise required or permitted by law.
When we share personal information about you with a nonaffiliated third party, they are required to limit their use of personal information about you to the particular purpose for which it was shared and they are not allowed to share personal information about you with others except to fulfill that limited purpose or as may be permitted or required by law.
3. HOW DO WE PROTECT THE SECURITY AND CONFIDENTIALITY OF PERSONAL INFORMATION WE COLLECT ABOUT YOU?
We maintain physical, electronic and procedural security measures that comply with applicable law and regulations to help safeguard the personal information we collect about you. We have internal policies governing the proper handling of client information by employees. Third parties that provide support or marketing services on our behalf may also receive personal information about you, and we require them to adhere to appropriate security standards with respect to such information.
4. HOW CAN YOU LIMIT OUR SHARING CERTAIN PERSONAL INFORMATION ABOUT YOU WITH OUR AFFILIATED COMPANIES FOR ELIGIBILITY DETERMINATION?
By following the opt-out procedures in Section 6 below, you may limit the extent to which we share with our affiliated companies, personal information that was collected to determine your eligibility for products and services such as your credit reports and other information that you have provided to us or that we may obtain from third parties ("eligibility information"). Eligibility information does not include your identification information or personal information pertaining to our transactions or experiences with you. Please note that, even if you direct us not to share eligibility information with our affiliated companies, we may still share your personal information, including eligibility information, with our affiliated companies under circumstances that are permitted under applicable law, such as to process transactions or to service your account.
5. HOW CAN YOU LIMIT THE USE OF CERTAIN PERSONAL INFORMATION ABOUT YOU BY OUR AFFILIATED COMPANIES FOR MARKETING?
By following the opt-out instructions in Section 6 below, you may limit our affiliated companies from marketing their products or services to you based on personal information we disclose to them. This information may include, for example, your income and account history with us. Please note that, even if you choose to limit our affiliated companies from using personal information about you that we may share with them for marketing their products and services to you, our affiliated companies may use your personal information that they obtain from us to market to you in circumstances permitted by law, such as if the affiliated party has its own relationship with you.
47
Morgan Stanley Institutional Fund Trust
Annual Report — September 30, 2015
U.S. Privacy Policy (unaudited) (cont'd)
6. HOW CAN YOU SEND US AN OPT-OUT INSTRUCTION?
If you wish to limit our sharing of eligibility information about you with our affiliated companies, or our affiliated companies' use of personal information for marketing purposes, as described in this notice, you may do so by:
• Calling us at (800) 548-7786
Monday–Friday between 8a.m. and 6p.m. (EST)
• Writing to us at the following address:
Boston Financial Data Services, Inc.
c/o Privacy Coordinator
P.O. Box 219804
Kansas City, Missouri 64121
If you choose to write to us, your request should include: your name, address, telephone number and account number(s) to which the opt-out applies and whether you are opting out with respect to sharing of eligibility information (Section 4 above), or information used for marketing (Section 5 above), or both. Written opt-out requests should not be sent with any other correspondence. In order to process your request, we require that the request be provided by you directly and not through a third party. Once you have informed us about your privacy preferences, your opt-out preference will remain in effect with respect to this Policy (as it may be amended) until you notify us otherwise. If you are a joint account owner, we will accept instructions from any one of you and apply those instructions to the entire account.
Please understand that if you limit our sharing or our affiliated companies' use of personal information, you and any joint account holder(s) may not receive information about our affiliated companies' products and services, including products or services that could help you manage your financial resources and achieve your investment objectives.
If you have more than one account or relationship with us, please specify the accounts to which you would like us to apply your privacy choices. If you have accounts or relationships with our affiliates, you may receive multiple privacy policies from them, and will need to separately notify those companies of your privacy choices for those accounts or relationships.
7. WHAT IF AN AFFILIATED COMPANY BECOMES A NONAFFILIATED THIRD PARTY?
If, at any time in the future, an affiliated company becomes a nonaffiliated third party, further disclosures of personal information made to the former affiliated company will be limited to those described in Section 2(b) above relating to nonaffiliated third parties. If you elected under Section 6 to limit disclosures we make to affiliated companies, or use of personal information by affiliated companies, your election will not apply to use by any former affiliated company of your personal information in their possession once it becomes a nonaffiliated third party.
SPECIAL NOTICE TO RESIDENTS OF VERMONT
The following section supplements our Policy with respect to our individual clients who have a Vermont address and supersedes anything to the contrary in the above Policy with respect to those clients only.
The State of Vermont requires financial institutions to obtain your consent prior to sharing personal information that they collect about you with nonaffiliated third parties, or eligibility information with affiliated companies, other than in certain limited circumstances. Except as permitted by law, we will not share personal information we collect about you with nonaffiliated third parties or eligibility information with affiliated companies, unless you provide us with your written consent to share such information.
SPECIAL NOTICE TO RESIDENTS OF CALIFORNIA
The following section supplements our Policy with respect to our individual clients who have a California address and supersedes anything to the contrary in the above Policy with respect to those clients only.
In response to a California law, if your account has a California home address, your personal information will not be disclosed to nonaffiliated third parties except as permitted by applicable California law, and we will limit sharing such personal information with our affiliates to comply with California privacy laws that apply to us.
48
Morgan Stanley Institutional Fund Trust
Annual Report — September 30, 2015
Trustee and Officer Information (unaudited)
Independent Trustees:
Name, Age and Address of
Independent Trustee | | Positions(s)
Held with
Registrant | | Length of Time
Served* | | Principal Occupation(s) During Past 5 Years
and Other Relevant Professional Experience | | Number of
Portfolios in
Fund Complex
Overseen by
Trustee** | | Other Directorships
Held by Independent
Trustee*** | |
Frank L. Bowman (70)
c/o Kramer Levin Naftalis & Frankel LLP
Counsel to the Independent Trustees
1177 Avenue of the Americas
New York, NY 10036 | | Trustee | | Since
August
2006 | | President, Strategic Decisions, LLC (consulting) (since February 2009); Director or Trustee of various Morgan Stanley Funds (since August 2006); Chairperson of the Compliance and Insurance Committee (since October 2015); Chairperson of the Insurance Sub-Committee of the Compliance and Insurance Committee (since February 2007); served as President and Chief Executive Officer of the Nuclear Energy Institute (policy organization) (February 2005-November 2008); retired as Admiral, U.S. Navy after serving over 38 years on active duty including 8 years as Director of the Naval Nuclear Propulsion Program in the Department of the Navy and the U.S. Department of Energy (1996-2004); served as Chief of Naval Personnel (July 1994-September 1996); and on the Joint Staff as Director of Political Military Affairs (June 1992-July1994); knighted as Honorary Knight Commander of the Most Excellent Order of the British Empire; awarded the Officier de l'Orde National du Mérite by the French Government; elected to the National Academy of Engineering (2009). | | | 96 | | | Director of BP p.l.c.; Director of Naval and Nuclear Technologies LLP; Director Emeritus of the Armed Services YMCA of the USA; Director of the U.S. Naval Submarine League; Member of the National Security Advisory Council of the Center for U.S. Global Engagement and a member of the CNA Military Advisory Board; Chairman of the Charity J Street Cup Golf; Trustee of Fairhaven United Methodist Church. | |
Kathleen A. Dennis (62)
c/o Kramer Levin Naftalis & Frankel LLP
Counsel to the Independent Trustees
1177 Avenue of the Americas
New York, NY 10036 | | Trustee | | Since
August
2006 | | President, Cedarwood Associates (mutual fund and investment management consulting) (since July 2006); Chairperson of the Money Market and Alternatives Sub-Committee of the Investment Committee (since October2006) and Director or Trustee of various Morgan Stanley Funds (since August 2006); formerly, Senior Managing Director of Victory Capital Management (1993-2006). | | | 96 | | | Director of various nonprofit organizations. | |
Nancy C. Everett (60)
c/o Kramer Levin Naftalis & Frankel LLP
Counsel to the Independent Trustees
1177 Avenue of the Americas
New York, NY 10036 | | Trustee | | Since
January
2015 | | Owner, OBIR, LLC (institutional investment management consulting) (since June 2014); formerly, Managing Director, BlackRock, Inc. (February 2011-December 2013); and Chief Executive Officer, General Motors Asset Management (a/k/a Promark Global Advisors, Inc.) (June 2005-May 2010). | | | 96 | | | Member of Virginia Commonwealth University Board of Visitors; Member of Virginia Commonwealth University School of Business Foundation; formerly, Member of Committee on Directors for Emerging Markets Growth Fund, Inc. (2007-2010); Chairperson of Performance Equity Management, LLC (2006-2010); and Chairperson, GMAM Absolute Return Strategies Fund, LLC (2006-2010). | |
49
Morgan Stanley Institutional Fund Trust
Annual Report — September 30, 2015
Trustee and Officer Information (unaudited) (cont'd)
Independent Trustees: (cont'd)
Name, Age and Address of
Independent Trustee | | Positions(s)
Held with
Registrant | | Length of Time
Served* | | Principal Occupation(s) During Past 5 Years
and Other Relevant Professional Experience | | Number of
Portfolios in
Fund Complex
Overseen by
Trustee** | | Other Directorships
Held by Independent
Trustee*** | |
Jakki L. Haussler (58)
c/o Kramer Levin Naftalis & Frankel LLP
Counsel to the Independent Trustees
1177 Avenue of the Americas
New York, NY 10036 | | Trustee | | Since
January
2015 | | Chairman and Chief Executive Officer, Opus Capital Group (since January 1996); and formerly, Director, Capvest Venture Fund, LP (May 2000-December 2011); Partner, Adena Ventures, LP (July 1999-December 2010); Director, The Victory Funds (February 2005-July 2008). | | | 96 | | | Director of Cincinnati Bell Inc. and Member, Audit Committee and Compensation Committee; Director of Northern Kentucky University Foundation and Member, Investment Committee; Member of Chase College of Law Transactional Law Practice Center Board of Advisors; Director of Best Transport; Member, University of Cincinnati Foundation Investment Committee; formerly, Member, Miami University Board of Visitors (2008-2011); Trustee of Victory Funds (2005-2008) and Chairman, Investment Committee (2007-2008) and Member, Service Provider Committee (2005-2008). | |
Dr. Manuel H. Johnson (66)
c/o Johnson Smick International, Inc.
220 I Street, N.E. — Suite 200
Washington, D.C. 20002 | | Trustee | | Since
July
1991 | | Senior Partner, Johnson Smick International, Inc. (consulting firm); Chairperson of the Investment Committee (since October 2006) and Director or Trustee of various Morgan Stanley Funds (since July 1991); Co-Chairman and a founder of the Group of Seven Council (G7C) (international economic commission); formerly Chairperson of the Audit Committee (July 1991-September 2006), Vice Chairman of the Board of Governors of the Federal Reserve System and Assistant Secretary of the U.S. Treasury. | | | 98 | | | Director of NVR, Inc. (home construction). | |
Joseph J. Kearns (73)
c/o Kearns & Associates LLC
23823 Malibu Road
S-50-440
Malibu, CA 90265 | | Trustee | | Since
August
1994 | | President, Kearns & Associates LLC (investment consulting); Chairperson of the Audit Committee (since October 2006) and Director or Trustee of various Morgan Stanley Funds (since August 1994); formerly, Deputy Chairperson of the Audit Committee (July 2003-September 2006) and Chairperson of the Audit Committee of various Morgan Stanley Funds (since August 1994); CFO of the J. Paul Getty Trust. | | | 99 | | | Director of Electro Rent Corporation (equipment leasing). Prior to December 31, 2013, Director of The Ford Family Foundation. | |
50
Morgan Stanley Institutional Fund Trust
Annual Report — September 30, 2015
Trustee and Officer Information (unaudited) (cont'd)
Independent Trustees: (cont'd)
Name, Age and Address of
Independent Trustee | | Positions(s)
Held with
Registrant | | Length of Time
Served* | | Principal Occupation(s) During Past 5 Years
and Other Relevant Professional Experience | | Number of
Portfolios in
Fund Complex
Overseen by
Trustee** | | Other Directorships
Held by Independent
Trustee*** | |
Michael F. Klein (56)
c/o Kramer Levin Naftalis & Frankel LLP
Counsel to the Independent Trustees
1177 Avenue of the Americas
New York, NY 10036 | | Trustee | | Since
August
2006 | | Managing Director, Aetos Capital, LLC (since March 2000); Co-President, Aetos Alternatives Management, LLC (since January 2004); and Co-Chief Executive Officer of Aetos Capital LLC (since August 2013); Chairperson of the Fixed Income Sub-Committee of the Investment Committee (since October 2006) and Director or Trustee of various Morgan Stanley Funds (since August 2006); formerly, Managing Director, Morgan Stanley & Co. Inc. and Morgan Stanley Dean Witter Investment Management, President, various Morgan Stanley Funds (June1998-March 2000) and Principal, Morgan Stanley & Co. Inc. and Morgan Stanley Dean Witter Investment Management (August 1997-December 1999). | | | 96 | | | Director of certain investment funds managed or sponsored by Aetos Capital, LLC. Director of Sanitized AG and Sanitized Marketing AG (specialty chemicals). | |
Michael E. Nugent (79)
522 Fifth Avenue
New York, NY 10036 | | Chair of the
Board and
Trustee | | Chair of the
Boards since
July 2006 and
Trustee since
July 1991 | | Chair of the Boards of various Morgan Stanley Funds (since July 2006); Chairperson of the Closed-End Fund Committee (since June 2012) and Director or Trustee of various Morgan Stanley Funds (since July 1991); formerly, Chairperson of the Insurance Committee (until July 2006), General Partner, Triumph Capital, L.P. (private investment partnership) (1988-2013). | | | 98 | | | None. | |
W. Allen Reed (68)
c/o Kramer Levin Naftalis & Frankel LLP
Counsel to the Independent Trustees
1177 Avenue of the Americas
New York, NY 10036 | | Trustee | | Since
August
2006 | | Chairperson of the Equity Sub-Committee of the Investment Committee (since October 2006) and Director or Trustee of various Morgan Stanley Funds (since August 2006); formerly, President and CEO of General Motors Asset Management; Chairman and Chief Executive Officer of the GM Trust Bank and Corporate Vice President of General Motors Corporation (August 1994-December 2005). | | | 96 | | | Director of Temple-Inland Industries (packaging and forest products); Director of Legg Mason, Inc. and Director of the Auburn University Foundation. | |
Fergus Reid (83)
c/o Joe Pietryka, Inc.
85 Charles Colman Blvd.
Pawling, NY 12564 | | Trustee | | Since
June
1992 | | Chairman, Joe Pietryka, Inc.; Chairperson of the Governance Committee and Director or Trustee of various Morgan Stanley Funds (since June 1992). | | | 99 | | | Formerly, Trustee and Director of certain investment companies in the JP Morgan Fund Complex managed by JP Morgan Investment Management Inc. (1987-December 2012). | |
51
Morgan Stanley Institutional Fund Trust
Annual Report — September 30, 2015
Trustee and Officer Information (unaudited) (cont'd)
Interested Trustee:
Name, Age and Address of
Interested Trustee | | Positions(s) Held
with Registrant | | Length of Time
Served* | | Principal Occupation(s) During Past 5 Years | | Number of
Portfolios in
Fund Complex
Overseen by
Interested
Trustee** | | Other Directorships
Held by Interested
Trustee*** | |
James F. Higgins (67)
One New York Plaza,
New York, NY 10004 | | Trustee | | Since
June
2000 | | Director or Trustee of various Morgan Stanley Funds (since June 2000); Senior Advisor of Morgan Stanley (since August 2000). | | | 97 | | | Formerly, Director of AXA Financial, Inc. and AXA Equitable Life Insurance Company (2002-2011) and Director of AXA MONY Life Insurance Company and AXA MONY Life Insurance Company of America (2004-2011). | |
* This is the earliest date the Trustee began serving the Morgan Stanley Funds. Each Trustee serves an indefinite term, until his or her successor is elected.
** The Fund Complex includes (as of December 31, 2014) all open-end and closed-end funds (including all of their portfolios) advised by Morgan Stanley Investment Management Inc. (the "Adviser") and any funds that have an adviser that is an affiliated person of the Adviser (including, but not limited to, Morgan Stanley AIP GP LP).
*** This includes any directorships at public companies and registered investment companies held by the Trustee at any time during the past five years.
52
Morgan Stanley Institutional Fund Trust
Annual Report — September 30, 2015
Trustee and Officer Information (unaudited) (cont'd)
Executive Officers:
Name, Age and Address of Executive Officer | | Position(s) Held
with
Registrant | | Length of Time
Served* | | Principal Occupation(s) During Past 5 Years | |
John H. Gernon (52)
522 Fifth Avenue
New York, NY 10036 | | President and Principal Executive Officer | | Since
September
2013 | | President and Principal Executive Officer of the Equity and Fixed Income Funds and the Morgan Stanley AIP Funds (since September 2013) and the Liquidity Funds and various money market funds (since May 2014) in the Fund Complex, Managing Director of the Adviser; Head of Product (since 2006) and Global Portfolio Analysis and Reporting (since 2012); for MSIM's Long Only business. | |
Stefanie V. Chang Yu (48)
522 Fifth Avenue
New York, NY 10036 | | Chief
Compliance
Officer | | Since
December
1997 | | Managing Director of the Adviser and various entities affiliated with the Adviser; Chief Compliance Officer of various Morgan Stanley Funds and the Adviser (since January 2014); formerly, Vice President of various Morgan Stanley Funds (December 1997-January 2014). | |
Joseph C. Benedetti (50)
522 Fifth Avenue
New York, NY 10036 | | Vice President | | Since
January
2014 | | Managing Director of the Adviser and various entities affiliated with the Adviser; Vice President of various Morgan Stanley Funds (since January 2014); formerly, Assistant Secretary of various Morgan Stanley Funds (October 2004-January 2014). | |
Francis J. Smith (50)
522 Fifth Avenue
New York, NY 10036 | | Treasurer and
Principal
Financial
Officer | | Treasurer
since July
2003 and
Principal
Financial
Officer since
September
2002 | | Executive Director of the Adviser and various entities affiliated with the Adviser; Treasurer (since July 2003) and Principal Financial Officer of various Morgan Stanley Funds (since September 2002). | |
Mary E. Mullin (48)
522 Fifth Avenue
New York, NY 10036 | | Secretary | | Since
June
1999 | | Executive Director of the Adviser and various entities affiliated with the Adviser; Secretary of various Morgan Stanley Funds (since June 1999). | |
* This is the earliest date the officer began serving the Morgan Stanley Funds. Each officer serves a one-year term, until his or her successor is elected and has qualified.
53
Morgan Stanley Institutional Fund Trust
Annual Report — September 30, 2015
Adviser and Administrator
Morgan Stanley Investment Management Inc.
522 Fifth Avenue
New York, New York 10036
Distributor
Morgan Stanley Distribution, Inc.
522 Fifth Avenue
New York, New York 10036
Dividend Disbursing and Transfer Agent
Boston Financial Data Services, Inc.
2000 Crown Colony Drive
Quincy, Massachusetts 02169
Custodian
State Street Bank and Trust Company
One Lincoln Street
Boston, Massachusetts 02111
Legal Counsel
Dechert LLP
1095 Avenue of the Americas
New York, New York 10036
Counsel to the Independent Trustees
Kramer Levin Naftalis & Frankel LLP
1177 Avenue of the Americas
New York, New York 10036
Independent Registered Public Accounting Firm
Ernst & Young LLP
200 Clarendon Street
Boston, Massachusetts 02116
Reporting to Shareholders
Each Morgan Stanley fund provides a complete schedule of portfolio holdings in its semi-annual and annual reports within 60 days of the end of the fund's second and fourth fiscal quarters. The semi-annual and annual reports are filed electronically with the Securities and Exchange Commission (SEC) on Form N-CSRS and Form N-CSR, respectively. Morgan Stanley also delivers the semi-annual and annual reports to fund shareholders and makes these reports available on its public website, www.morganstanley.com/im. Each Morgan Stanley fund also files a complete schedule of portfolio holdings with the SEC for the fund's first and third fiscal quarters on Form N-Q. Morgan Stanley does not deliver the reports for the first and third fiscal quarters to shareholders, nor are the reports posted to the Morgan Stanley public website. You may, however, obtain the Form N-Q filings (as well as the Form N-CSR and N-CSRS filings) by accessing the SEC's website, www.sec.gov. You may also review and copy them at the SEC's Public Reference Room in Washington, DC. Information on the operation of the SEC's Public Reference Room may be obtained by calling the SEC toll free at 1 (800) SEC-0330. You can also request copies of these materials, upon payment of a duplicating fee, by electronic request at the SEC's email address (publicinfo@sec.gov) or by writing the Public Reference Room of the SEC, Washington, DC 20549-0102.
Proxy Voting Policies and Procedures and Proxy Voting Record
You may obtain a copy of the Fund's Proxy Voting Policy and Procedures and information regarding how the Fund voted proxies relating to portfolio securities during the most recent twelve-month period ended June 30, without charge, upon request, by calling toll free 1 (800) 548-7786 or by visiting our website at www.morganstanley.com/im. This information is also available on the SEC's website at www.sec.gov.
This report is authorized for distribution only when preceded or accompanied by a prospectus of the Morgan Stanley Institutional Funds Trust, which describes in detail each Portfolio's investment policies, risks, fees and expenses. Please read the prospectus carefully before you invest or send money. For additional information, including information regarding the investments comprising the Portfolio, please visit our website at www.morganstanley.com/im or call toll free 1 (800) 548-7786.
54
(This Page has been left blank intentionally.)
(This Page has been left blank intentionally.)
Printed in U.S.A.
This Report has been prepared for shareholders and may be distributed to others only if preceded or accompanied by a current prospectus.
Morgan Stanley Investment Management Inc.
522 Fifth Avenue
New York, New York 10036
© 2015 Morgan Stanley. Morgan Stanley Distribution, Inc.

IFGMAPANN
1347122 EXP 11.30.16
Item 2. Code of Ethics.
(a) The Fund has adopted a code of ethics (the “Code of Ethics”) that applies to its principal executive officer, principal financial officer, principal accounting officer or controller, or persons performing similar functions, regardless of whether these individuals are employed by the Fund or a third party.
(b) No information need be disclosed pursuant to this paragraph.
(c) Not applicable.
(d) Not applicable.
(e) �� Not applicable.
(f)
(1) The Fund’s Code of Ethics is attached hereto as Exhibit 12 A.
(2) Not applicable.
(3) Not applicable.
Item 3. Audit Committee Financial Expert.
The Fund’s Board of Trustees has determined that Joseph J. Kearns, an “independent” Trustee, is an “audit committee financial expert” serving on its audit committee. Under applicable securities laws, a person who is determined to be an audit committee financial expert will not be deemed an “expert” for any purpose, including without limitation for the purposes of Section 11 of the Securities Act of 1933, as a result of being designated or identified as an audit committee financial expert. The designation or identification of a person as an audit committee financial expert does not impose on such person any duties, obligations, or liabilities that are greater than the duties, obligations, and liabilities imposed on such person as a member of the audit committee and Board of Trustees in the absence of such designation or identification.
Item 4. Principal Accountant Fees and Services.
(a)(b)(c)(d) and (g). Based on fees billed for the periods shown:
2015
| | Registrant | | Covered Entities(1) | |
Audit Fees | | $ | 517,677 | | N/A | |
| | | | | |
Non-Audit Fees | | | | | |
Audit-Related Fees | | $ | — | (2) | $ | — | (2) |
Tax Fees | | $ | 40,000 | (3) | $ | 7,968,463 | (4) |
All Other Fees | | $ | | | $ | 212,000 | (5) |
Total Non-Audit Fees | | $ | 40,000 | | $ | 8,180,463 | |
| | | | | |
Total | | $ | 557,677 | | $ | 8,180,463 | |
2014
| | Registrant | | Covered Entities(1) | |
Audit Fees | | $ | 355,677 | | N/A | |
| | | | | |
Non-Audit Fees | | | | | |
Audit-Related Fees | | $ | — | (2) | $ | — | (2) |
Tax Fees | | $ | 27,807 | (3) | $ | 8,152,733 | (4) |
All Other Fees | | $ | | | $ | 280,341 | (5) |
Total Non-Audit Fees | | $ | 27,807 | | $ | 8,433,074 | |
| | | | | |
Total | | $ | 383,484 | | $ | 8,433,074 | |
N/A- Not applicable, as not required by Item 4.
(1) Covered Entities include the Adviser (excluding sub-advisors) and any entity controlling, controlled by or under common control with the Adviser that provides ongoing services to the Registrant.
(2) Audit-Related Fees represent assurance and related services provided that are reasonably related to the performance of the audit of the financial statements of the Covered Entities’ and funds advised by the Adviser or its affiliates, specifically data verification and agreed-upon procedures related to asset securitizations and agreed-upon procedures engagements.
(3) Tax Fees represent tax compliance, tax planning and tax advice services provided in connection with the preparation and review of the Registrant’s tax returns.
(4) Tax Fees represent tax compliance, tax planning and tax advice services provided in connection with the review of Covered Entities’ tax returns.
(5) All other fees represent project management for future business applications and improving business and operational processes.
(e)(1) The audit committee’s pre-approval policies and procedures are as follows:
APPENDIX A
AUDIT COMMITTEE
AUDIT AND NON-AUDIT SERVICES
PRE-APPROVAL POLICY AND PROCEDURES
OF THE
MORGAN STANLEY RETAIL AND INSTITUTIONAL FUNDS
AS ADOPTED AND AMENDED JULY 23, 2004,(1)
1. Statement of Principles
The Audit Committee of the Board is required to review and, in its sole discretion, pre-approve all Covered Services to be provided by the Independent Auditors to the Fund and Covered Entities in order to assure that services performed by the Independent Auditors do not impair the auditor’s independence from the Fund.
The SEC has issued rules specifying the types of services that an independent auditor may not provide to its audit client, as well as the audit committee’s administration of the engagement of the independent auditor. The SEC’s rules establish two different approaches to pre-approving services, which the SEC considers to be equally valid. Proposed services either: may be pre-approved without consideration of specific case-by-case services by the Audit Committee (“general pre-approval”); or require the specific pre-approval of the Audit Committee or its delegate (“specific pre-approval”). The Audit Committee believes that the combination of these two approaches in this Policy will result in an effective and efficient procedure to pre-approve services performed by the Independent Auditors. As set forth in this Policy, unless a type of service has received general pre-approval, it will require specific pre-approval by the Audit Committee (or by any member of the Audit Committee to which pre-approval authority has been delegated) if it is to be provided by the Independent Auditors. Any proposed services exceeding pre-approved cost levels or budgeted amounts will also require specific pre-approval by the Audit Committee.
The appendices to this Policy describe the Audit, Audit-related, Tax and All Other services that have the general pre-approval of the Audit Committee. The term of any general pre-approval is 12 months from the date of pre-approval, unless the Audit Committee considers and provides a different period and states otherwise. The Audit Committee will annually review and pre-approve the services that may be provided by the Independent Auditors without obtaining specific pre-approval from the Audit Committee. The Audit Committee will add to or subtract from the list of general pre-approved services from time to time, based on subsequent determinations.
(1) This Audit Committee Audit and Non-Audit Services Pre-Approval Policy and Procedures (the “Policy”), adopted as of the date above, supersedes and replaces all prior versions that may have been adopted from time to time.
The purpose of this Policy is to set forth the policy and procedures by which the Audit Committee intends to fulfill its responsibilities. It does not delegate the Audit Committee’s responsibilities to pre-approve services performed by the Independent Auditors to management.
The Fund’s Independent Auditors have reviewed this Policy and believes that implementation of the Policy will not adversely affect the Independent Auditors’ independence.
2. Delegation
As provided in the Act and the SEC’s rules, the Audit Committee may delegate either type of pre-approval authority to one or more of its members. The member to whom such authority is delegated must report, for informational purposes only, any pre-approval decisions to the Audit Committee at its next scheduled meeting.
3. Audit Services
The annual Audit services engagement terms and fees are subject to the specific pre-approval of the Audit Committee. Audit services include the annual financial statement audit and other procedures required to be performed by the Independent Auditors to be able to form an opinion on the Fund’s financial statements. These other procedures include information systems and procedural reviews and testing performed in order to understand and place reliance on the systems of internal control, and consultations relating to the audit. The Audit Committee will approve, if necessary, any changes in terms, conditions and fees resulting from changes in audit scope, Fund structure or other items.
In addition to the annual Audit services engagement approved by the Audit Committee, the Audit Committee may grant general pre-approval to other Audit services, which are those services that only the Independent Auditors reasonably can provide. Other Audit services may include statutory audits and services associated with SEC registration statements (on Forms N-1A, N-2, N-3, N-4, etc.), periodic reports and other documents filed with the SEC or other documents issued in connection with securities offerings.
The Audit Committee has pre-approved the Audit services in Appendix B.1. All other Audit services not listed in Appendix B.1 must be specifically pre-approved by the Audit Committee (or by any member of the Audit Committee to which pre-approval has been delegated).
4. Audit-related Services
Audit-related services are assurance and related services that are reasonably related to the performance of the audit or review of the Fund’s financial statements and, to the extent they are Covered Services, the Covered Entities or that are traditionally performed by the Independent Auditors. Because the Audit Committee believes that the provision of Audit-related services does not impair the independence of the auditor and is consistent with the SEC’s rules on auditor independence, the Audit Committee may grant general pre-approval to Audit-related services. Audit-related services include, among others, accounting consultations related to accounting, financial reporting or disclosure matters
not classified as “Audit services”; assistance with understanding and implementing new accounting and financial reporting guidance from rulemaking authorities; agreed-upon or expanded audit procedures related to accounting and/or billing records required to respond to or comply with financial, accounting or regulatory reporting matters; and assistance with internal control reporting requirements under Forms N-SAR and/or N-CSR.
The Audit Committee has pre-approved the Audit-related services in Appendix B.2. All other Audit-related services not listed in Appendix B.2 must be specifically pre-approved by the Audit Committee (or by any member of the Audit Committee to which pre-approval has been delegated).
5. Tax Services
The Audit Committee believes that the Independent Auditors can provide Tax services to the Fund and, to the extent they are Covered Services, the Covered Entities, such as tax compliance, tax planning and tax advice without impairing the auditor’s independence, and the SEC has stated that the Independent Auditors may provide such services.
Pursuant to the preceding paragraph, the Audit Committee has pre-approved the Tax Services in Appendix B.3. All Tax services in Appendix B.3 must be specifically pre-approved by the Audit Committee (or by any member of the Audit Committee to which pre-approval has been delegated).
6. All Other Services
The Audit Committee believes, based on the SEC’s rules prohibiting the Independent Auditors from providing specific non-audit services, that other types of non-audit services are permitted. Accordingly, the Audit Committee believes it may grant general pre-approval to those permissible non-audit services classified as All Other services that it believes are routine and recurring services, would not impair the independence of the auditor and are consistent with the SEC’s rules on auditor independence.
The Audit Committee has pre-approved the All Other services in Appendix B.4. Permissible All Other services not listed in Appendix B.4 must be specifically pre-approved by the Audit Committee (or by any member of the Audit Committee to which pre-approval has been delegated).
7. Pre-Approval Fee Levels or Budgeted Amounts
Pre-approval fee levels or budgeted amounts for all services to be provided by the Independent Auditors will be established annually by the Audit Committee. Any proposed services exceeding these levels or amounts will require specific pre-approval by the Audit Committee. The Audit Committee is mindful of the overall relationship of fees for audit and non-audit services in determining whether to pre-approve any such services.
8. Procedures
All requests or applications for services to be provided by the Independent Auditors that do not require specific approval by the Audit Committee will be submitted to the Fund’s Chief Financial Officer and must include a detailed description of the services to be
rendered. The Fund’s Chief Financial Officer will determine whether such services are included within the list of services that have received the general pre-approval of the Audit Committee. The Audit Committee will be informed on a timely basis of any such services rendered by the Independent Auditors. Requests or applications to provide services that require specific approval by the Audit Committee will be submitted to the Audit Committee by both the Independent Auditors and the Fund’s Chief Financial Officer, and must include a joint statement as to whether, in their view, the request or application is consistent with the SEC’s rules on auditor independence.
The Audit Committee has designated the Fund’s Chief Financial Officer to monitor the performance of all services provided by the Independent Auditors and to determine whether such services are in compliance with this Policy. The Fund’s Chief Financial Officer will report to the Audit Committee on a periodic basis on the results of its monitoring. Both the Fund’s Chief Financial Officer and management will immediately report to the chairman of the Audit Committee any breach of this Policy that comes to the attention of the Fund’s Chief Financial Officer or any member of management.
9. Additional Requirements
The Audit Committee has determined to take additional measures on an annual basis to meet its responsibility to oversee the work of the Independent Auditors and to assure the auditor’s independence from the Fund, such as reviewing a formal written statement from the Independent Auditors delineating all relationships between the Independent Auditors and the Fund, consistent with Independence Standards Board No. 1, and discussing with the Independent Auditors its methods and procedures for ensuring independence.
10. Covered Entities
Covered Entities include the Fund’s investment adviser(s) and any entity controlling, controlled by or under common control with the Fund’s investment adviser(s) that provides ongoing services to the Fund(s). Beginning with non-audit service contracts entered into on or after May 6, 2003, the Fund’s audit committee must pre-approve non-audit services provided not only to the Fund but also to the Covered Entities if the engagements relate directly to the operations and financial reporting of the Fund. This list of Covered Entities would include:
Morgan Stanley Retail Funds
Morgan Stanley Investment Advisors Inc.
Morgan Stanley & Co. Incorporated
Morgan Stanley DW Inc.
Morgan Stanley Investment Management Inc.
Morgan Stanley Investment Management Limited
Morgan Stanley Investment Management Private Limited
Morgan Stanley Asset & Investment Trust Management Co., Limited
Morgan Stanley Investment Management Company
Morgan Stanley Services Company, Inc.
Morgan Stanley Distributors Inc.
Morgan Stanley Trust FSB
Morgan Stanley Institutional Funds
Morgan Stanley Investment Management Inc.
Morgan Stanley Investment Advisors Inc.
Morgan Stanley Investment Management Limited
Morgan Stanley Investment Management Private Limited
Morgan Stanley Asset & Investment Trust Management Co., Limited
Morgan Stanley Investment Management Company
Morgan Stanley & Co. Incorporated
Morgan Stanley Distribution, Inc.
Morgan Stanley AIP GP LP
Morgan Stanley Alternative Investment Partners LP
(e)(2) Beginning with non-audit service contracts entered into on or after May 6, 2003, the audit committee also is required to pre-approve services to Covered Entities to the extent that the services are determined to have a direct impact on the operations or financial reporting of the Registrant. 100% of such services were pre-approved by the audit committee pursuant to the Audit Committee’s pre-approval policies and procedures (attached hereto).
(f) Not applicable.
(g) See table above.
(h) The audit committee of the Board of Trustees has considered whether the provision of services other than audit services performed by the auditors to the Registrant and Covered Entities is compatible with maintaining the auditors’ independence in performing audit services.
Item 5. Audit Committee of Listed Registrants.
(a) The Fund has a separately-designated standing audit committee established in accordance with Section 3(a)(58)(A) of the Exchange Act whose members are: Joseph J. Kearns, Jakki L. Haussler, Michael F. Klein and Allen W. Reed.
(b) Not applicable.
Item 6. Schedule of Investments
(a) Refer to Item 1.
(b) Not applicable.
Item 7. Disclosure of Proxy Voting Policies and Procedures for Closed-End Management Investment Companies.
Applicable only to reports filed by closed-end funds.
Item 8. Portfolio Managers of Closed-End Management Investment Companies
Applicable only to reports filed by closed-end funds.
Item 9. Closed-End Fund Repurchases
Applicable only to reports filed by closed-end funds.
Item 10. Submission of Matters to a Vote of Security Holders
Not applicable.
Item 11. Controls and Procedures
(a) The Fund’s principal executive officer and principal financial officer have concluded that the Fund’s disclosure controls and procedures are sufficient to ensure that information required to be disclosed by the Fund in this Form N-CSR was recorded, processed, summarized and reported within the time periods specified in the Securities and Exchange Commission’s rules and forms, based upon such officers’ evaluation of these controls and procedures as of a date within 90 days of the filing date of the report.
(b) There were no changes in the registrant’s internal control over financial reporting that occurred during the second fiscal quarter of the period covered by this report that has materially affected, or is reasonably likely to materially affect, the registrant’s internal control over financial reporting.
Item 12. Exhibits
(a) The Code of Ethics for Principal Executive and Senior Financial Officers is attached hereto.
(b) A separate certification for each principal executive officer and principal financial officer of the registrant are attached hereto as part of EX-99.CERT.
SIGNATURES
Pursuant to the requirements of the Securities Exchange Act of 1934 and the Investment Company Act of 1940, the registrant has duly caused this report to be signed on its behalf by the undersigned, thereunto duly authorized.
Morgan Stanley Institutional Fund Trust
/s/ John H. Gernon | |
John H. Gernon | |
Principal Executive Officer | |
November 19, 2015 | |
Pursuant to the requirements of the Securities Exchange Act of 1934 and the Investment Company Act of 1940, this report has been signed by the following persons on behalf of the registrant and in the capacities and on the dates indicated.
/s/ John H. Gernon | |
John H. Gernon | |
Principal Executive Officer | |
November 19, 2015 | |
| |
/s/ Francis Smith | |
Francis Smith | |
Principal Financial Officer | |
November 19, 2015 | |