UNITED STATES
SECURITIES AND EXCHANGE COMMISSION
Washington, D.C. 20549
FORM N-CSR
CERTIFIED SHAREHOLDER REPORT OF REGISTERED
MANAGEMENT INVESTMENT COMPANIES
Investment Company Act file number | 811-03980 |
|
Morgan Stanley Institutional Fund Trust |
(Exact name of registrant as specified in charter) |
|
522 Fifth Avenue, New York, New York | | 10036 |
(Address of principal executive offices) | | (Zip code) |
|
John H. Gernon 522 Fifth Avenue, New York, New York 10036 |
(Name and address of agent for service) |
|
Registrant’s telephone number, including area code: | 212-296-0289 | |
|
Date of fiscal year end: | September 30, | |
|
Date of reporting period: | September 30, 2017 | |
| | | | | | | | |
Item 1 - Report to Shareholders

Morgan Stanley Institutional Fund Trust
Core Plus Fixed Income Portfolio
Annual Report
September 30, 2017

Morgan Stanley Institutional Fund Trust
Annual Report — September 30, 2017
Shareholders' Letter | | | 2 | | |
Expense Example | | | 3 | | |
Investment Overview | | | 4 | | |
Portfolio of Investments | | | 6 | | |
Statement of Assets and Liabilities | | | 16 | | |
Statement of Operations | | | 18 | | |
Statements of Changes in Net Assets | | | 19 | | |
Financial Highlights | | | 20 | | |
Notes to Financial Statements | | | 24 | | |
Report of Independent Registered Public Accounting Firm | | | 36 | | |
Investment Advisory Agreement Approval | | | 37 | | |
Privacy Notice | | | 39 | | |
Trustee and Officer Information | | | 42 | | |
This report is authorized for distribution only when preceded or accompanied by a prospectus or summary prospectus of the applicable Fund of the Morgan Stanley Institutional Fund Trust. To receive a prospectus and/or statement of additional information (SAI), which contains more complete information such as investment objectives, charges, expenses, policies for voting proxies, risk considerations, and describes in detail each of the Fund's investment policies to the prospective investor, please call toll free 1 (800) 548-7786. Please read the prospectuses carefully before you invest or send money.
Additionally, you can access information about the Fund, including performance, characteristics, and investment team commentary, through Morgan Stanley Investment Management's website: www.morganstanley.com/im.
Market forecasts provided in this report may not necessarily come to pass. There is no guarantee that any sectors mentioned will continue to perform as discussed herein or that securities in such sectors will be held by the Fund in the future. There is no assurance that a fund will achieve its investment objective. Funds are subject to market risk, which is the possibility that market values of securities owned by the Fund will decline and, therefore, the value of the Fund's shares may be less than what you paid for them. Accordingly, you can lose money investing in this Fund. Please see the prospectus for more complete information on investment risks.
1
Morgan Stanley Institutional Fund Trust
Annual Report — September 30, 2017
Shareholders' Letter (unaudited)
Dear Shareholders,
We are pleased to provide this Annual report, in which you will learn how your investment in Core Plus Fixed Income Portfolio (the "Fund") performed during the latest twelve-month period.
Morgan Stanley Investment Management is a client-centric, investor-led organization. Our global presence, intellectual capital, and breadth of products and services enable us to partner with investors to meet the evolving challenges of today's financial markets. We aim to deliver superior investment service and to empower our clients to make the informed decisions that help them reach their investment goals.
As always, we thank you for selecting Morgan Stanley Investment Management, and look forward to working with you in the months and years ahead.
Sincerely,

John H. Gernon
President and Principal Executive Officer
October 2017
2
Morgan Stanley Institutional Fund Trust
Annual Report — September 30, 2017
Expense Example (unaudited)
Core Plus Fixed Income Portfolio
As a shareholder of the Fund, you may incur two types of costs: (1) transactional costs, including sales charge (loads) on purchase payments; and (2) ongoing costs, which may include advisory fees, administration fees, distribution and shareholder services fees; and other Fund expenses. This example is intended to help you understand your ongoing costs (in dollars) of investing in the Fund and to compare these costs with the ongoing costs of investing in other mutual funds.
This example is based on an investment of $1,000 invested at the beginning of the six-month period ended September 30, 2017 and held for the entire six-month period.
Actual Expenses
The table below provides information about actual account values and actual expenses. You may use the information in this table, together with the amount you invested, to estimate the expenses that you paid over the period. Simply divide your account value by $1,000 (for example, an $8,600 account value divided by $1,000 = 8.6), then multiply the result by the number in the table under the heading entitled "Actual Expenses Paid During Period" to estimate the expenses you paid on your account during this period.
Hypothetical Example for Comparison Purposes
The table below provides information about hypothetical account values and hypothetical expenses based on the Fund's actual expense ratio and an assumed rate of return of 5% per year before expenses, which is not the Fund's actual return. The hypothetical account values and expenses may not be used to estimate the actual ending account balance or expenses you paid for the period. You may use this information to compare the ongoing costs of investing in the Fund and other funds. To do so, compare this 5% hypothetical example with the 5% hypothetical examples that appear in the shareholder reports of the other funds.
Please note that the expenses shown in the table are meant to highlight your ongoing costs only and do not reflect any transactional costs, such as sales charges (loads, if applicable). Therefore, the information for each class in the table is useful in comparing ongoing costs only, and will not help you determine the relative total costs of owning different funds. In addition, if these transactional costs were included, your costs would have been higher.
| | | Beginning
Account
Value
4/1/17 | | Actual Ending
Account
Value
9/30/17 | | Hypothetical
Ending Account
Value | | Actual
Expenses
Paid
During
Period* | | Hypothetical
Expenses Paid
During Period* | | Net
Expense
Ratio
During
Period** | |
Core Plus Fixed Income Portfolio Class I | | $ | 1,000.00 | | | $ | 1,040.30 | | | $ | 1,023.06 | | | $ | 2.05 | | | $ | 2.03 | | | | 0.40 | % | |
Core Plus Fixed Income Portfolio Class A | | | 1,000.00 | | | | 1,038.30 | | | | 1,021.31 | | | | 3.83 | | | | 3.80 | | | | 0.75 | | |
Core Plus Fixed Income Portfolio Class L | | | 1,000.00 | | | | 1,037.40 | | | | 1,020.05 | | | | 5.11 | | | | 5.06 | | | | 1.00 | | |
Core Plus Fixed Income Portfolio Class C | | | 1,000.00 | | | | 1,034.10 | | | | 1,017.50 | | | | 7.70 | | | | 7.64 | | | | 1.51 | | |
* Expenses are calculated using each Fund Class' annualized net expense ratio (as disclosed), multiplied by the average account value over the period, and multiplied by 183/365 (to reflect the most recent one-half year period).
** Annualized.
3
Morgan Stanley Institutional Fund Trust
Annual Report — September 30, 2017
Investment Overview (unaudited)
Core Plus Fixed Income Portfolio
The Fund seeks above-average total return over a market cycle of three to five years.
Performance
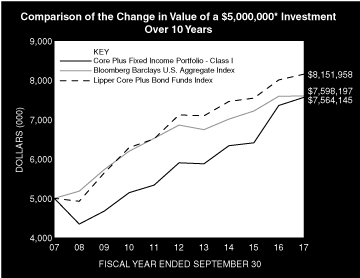
For the fiscal year ended September 30, 2017, the Fund's Class I shares had a total return based on net asset value and reinvestment of distributions per share of 2.79%, net of fees. The Fund's Class I shares outperformed against the Fund's benchmark, the Bloomberg Barclays U.S. Aggregate Index (the "Index"), which returned 0.07%.
Factors Affecting Performance
• Benign economic performance of major countries and low interest rates, due to continued aggressive central bank actions, led to strong demand for bonds that offer additional yields over government securities. The result was strong performance in most credit sectors. The Fund benefited from overweights to these better-performing credit sectors — namely, investment-grade and high-yield corporates, convertibles, emerging market debt, asset-backed securities, and non-agency residential and commercial mortgage-backed securities. The Fund's underweight to agency mortgage-backed securities slightly detracted from relative performance. The Fund's credit exposures are managed, in part, using credit-default swaps.
• U.S. Treasury yields rose over the period. They initially jumped after the election. Shorter maturities continued to rise as the Federal Reserve (Fed) increased the target fed funds rate by 75 basis points over the period. Longer maturity yields fluctuated in a relatively narrow band post-election. The impact on the Fund was small, as it only had a small short duration exposure. The Fund did benefit from an exposure to inflation-linked bonds, which performed well early in the period. The Fund's U.S. interest rate exposures are managed, in part, using interest-rate futures and swaps.
• Non-U.S. interest rate exposures helped performance over the period. The Portfolio has exposure to emerging markets, where rates mostly fell. It also was overweight peripheral Europe relative to Germany, which also helped as these spreads narrowed. Currency positioning, in both developed and emerging markets, also helped performance. The Fund's non-U.S. interest rate exposures are managed, in part, using interest-rate futures. The Fund's currency exposures are managed, in part, using foreign exchange forwards.
• The Fund also benefited from the receipt of proceeds from legal settlements, as described below.
• During fiscal year 2017, the Fund received monies related to certain nonrecurring litigation settlements. If these monies were not received, any period returns which include these settlement monies would have been lower. For example, the 2017 fiscal year total return would have been 2.33% for Class I shares as of September 30, 2017. The returns on the other Share Classes would also have been similarly impacted. These were one-time settlements, and as a result, the impact on the net asset value and consequently the performance will not likely be repeated in the future. Please call 1-800-548-7786 for additional information.
Management Strategies
• Though we are still overweight credit sectors, we have been reducing overall portfolio risk recently. The Fed has appeared to shift its reaction function, i.e., how its policy decisions will be made based on the economic climate. The big change is that the Fed is underweighting the sharp drop in inflation since February 2017, calling it "noise" and overweighting market indicators such as equities, credit spreads, level of the U.S. dollar and level of Treasury yields (a.k.a. financial conditions) under the guise of financial stability. Financial conditions have been loosening for most of 2017 despite hikes by the Fed, which would suggest that Fed policy should be even tighter.
• We expect more clarity in the near future on tax reform. The White House's tax proposals provided broad directions, but details remains to be hashed out. Since Congress will likely use reconciliation to pass tax reform, the debate must solidify soon so that major tax measures could be passed with the budget bill in November 2017. Market odds of tax reform passage have declined substantially.
• Either event — a change in Fed reaction function or a surprisingly strong tax bill — could lead to higher Treasury yields and a stronger U.S. dollar. This could also lead to wider spreads, especially for sectors that are dollar-sensitive, such as emerging market debt and export-dependent corporates. As a result, we think it is best to approach risk-taking cautiously.
4
Morgan Stanley Institutional Fund Trust
Annual Report — September 30, 2017
Investment Overview (unaudited) (cont'd)
Core Plus Fixed Income Portfolio
* Minimum Investment
In accordance with SEC regulations, the Fund's performance shown assumes that all recurring fees (including management fees) were deducted and all dividends and distributions were reinvested. The performance of Class A, Class L and Class C shares will vary from the performance of Class I shares based upon their different inception dates and will be negatively impacted by additional fees assessed to those classes.
Performance Compared to the Bloomberg Barclays U.S. Aggregate Index(1) and the Lipper Core Plus Bond Funds Index(2)
| | | Period Ended September 30, 2017
Total Returns(3) | |
| | | | | Average Annual | |
| | | One
Year | | Five
Years | | Ten
Years | | Since
Inception(8) | |
Fund — Class I Shares
w/o sales charges(4) | | | 2.79 | % | | | 5.09 | % | | | 4.23 | % | | | 7.32 | % | |
Fund — Class A Shares
w/o sales charges(5) | | | 2.43 | | | | 4.72 | | | | 3.93 | | | | 4.92 | | |
Fund — Class A Shares with
maximum 4.25% sales charges(5) | | | –1.93 | | | | 3.81 | | | | 3.47 | | | | 4.71 | | |
Fund — Class L Shares
w/o sales charges(6) | | | 2.16 | | | | 4.48 | | | | — | | | | 4.98 | | |
Fund — Class C Shares
w/o sales charges(7) | | | 1.57 | | | | — | | | | — | | | | 5.17 | | |
Fund — Class C Shares
with maximum 1.00% deferred
sales charges(7) | | | 0.58 | | | | — | | | | — | | | | 5.17 | | |
Bloomberg Barclays U.S.
Aggregate Index | | | 0.07 | | | | 2.06 | | | | 4.27 | | | | 7.05 | | |
Lipper Core Plus Bond Funds Index | | | 1.80 | | | | 2.74 | | | | 5.01 | | | | — | | |
Performance data quoted represents past performance, which is no guarantee of future results, and current performance may be lower or higher than the figures shown. Performance assumes that all dividends and distributions, if any, were reinvested. For the most recent month-end performance figures, please visit www.morganstanley.com/im. Investment returns and principal value will fluctuate so that Fund shares, when redeemed, may be worth more or less than their original cost. Total returns do not reflect the deduction of taxes that a shareholder would pay on Fund distributions or the redemption of Fund shares. Performance of share classes will vary due to differences in sales charges and expenses.
(1) The Bloomberg Barclays U.S. Aggregate Index tracks the performance of U.S. government agency and Treasury securities, investment-grade corporate debt securities, agency mortgage-backed securities, asset-backed securities and commercial mortgage-backed securities. The Index is unmanaged and its returns do not include any sales charges or fees. Such costs would lower performance. It is not possible to invest directly in an index.
(2) The Lipper Core Plus Bond Funds Index is an equally weighted performance index of the largest qualifying funds (based on net assets) in the Lipper Core Plus Bond Funds classification. The Index, which is adjusted for capital gains distributions and income dividends, is unmanaged and should not be considered an investment. There are currently 30 funds represented in this Index. As of the date of this report, the Fund was in the Lipper Core Plus Bond Funds classification.
(3) Total returns for the Fund reflect expenses waived and/or reimbursed, if applicable, by the Adviser. Without such waivers and/or reimbursements, total returns would have been lower.
(4) Commenced operations on November 14, 1984.
(5) Commenced operations on November 7, 1996.
(6) Commenced operations on April 27, 2012.
(7) Commenced operations on April 30, 2015.
(8) For comparative purposes, average annual since inception returns listed for the Indexes refer to the inception date of Class I of the Fund, not the inception of the Indexes.
5
Morgan Stanley Institutional Fund Trust
Annual Report — September 30, 2017
Portfolio of Investments
Core Plus Fixed Income Portfolio
| | | Face
Amount
(000) | | Value
(000) | |
Fixed Income Securities (89.8%) | |
Agency Adjustable Rate Mortgage (0.1%) | |
Federal Home Loan Mortgage Corporation,
Conventional Pool:
12 Month USD LIBOR + 1.62%,
2.51%, 7/1/45 | | $ | 171 | | | $ | 175 | | |
Agency Fixed Rate Mortgages (18.5%) | |
Federal Home Loan Mortgage Corporation, | |
Gold Pools: | |
3.00%, 3/1/47 | | | 2,701 | | | | 2,714 | | |
3.50%, 1/1/44 - 2/1/45 | | | 2,079 | | | | 2,157 | | |
4.00%, 6/1/44 - 10/1/44 | | | 1,047 | | | | 1,103 | | |
5.41%, 7/1/37 - 8/1/37 | | | 23 | | | | 25 | | |
5.44%, 1/1/37 - 6/1/38 | | | 87 | | | | 98 | | |
5.46%, 5/1/37 - 1/1/38 | | | 94 | | | | 103 | | |
5.48%, 8/1/37 - 10/1/37 | | | 62 | | | | 67 | | |
5.50%, 8/1/37 - 4/1/38 | | | 110 | | | | 122 | | |
5.52%, 9/1/37 - 1/1/38 | | | 28 | | | | 31 | | |
5.62%, 12/1/36 - 12/1/37 | | | 90 | | | | 99 | | |
6.00%, 10/1/36 - 8/1/38 | | | 247 | | | | 277 | | |
6.50%, 12/1/25 - 8/1/33 | | | 162 | | | | 179 | | |
7.00%, 6/1/28 - 11/1/31 | | | 52 | | | | 56 | | |
Federal National Mortgage Association, | |
Conventional Pools: | |
3.00%, 5/1/30 - 11/1/46 | | | 5,478 | | | | 5,515 | | |
3.50%, 8/1/45 - 3/1/47 | | | 4,736 | | | | 4,910 | | |
4.00%, 11/1/41 - 8/1/46 | | | 5,937 | | | | 6,282 | | |
4.50%, 3/1/41 - 11/1/44 | | | 2,064 | | | | 2,255 | | |
5.00%, 3/1/41 | | | 296 | | | | 324 | | |
5.50%, 6/1/35 - 1/1/37 | | | 87 | | | | 98 | | |
5.62%, 12/1/36 | | | 34 | | | | 36 | | |
6.50%, 4/1/24 - 1/1/34 | | | 1,202 | | | | 1,334 | | |
7.00%, 11/1/17 - 12/1/33 | | | 224 | | | | 239 | | |
9.50%, 4/1/30 | | | 158 | | | | 184 | | |
November TBA: | |
3.50%, 11/1/47 (a) | | | 15,109 | | | | 15,549 | | |
October TBA: | |
3.00%, 10/1/32 (a) | | | 2,260 | | | | 2,322 | | |
4.00%, 10/1/47 (a) | | | 6,370 | | | | 6,707 | | |
4.50%, 10/1/47 (a) | | | 2,870 | | | | 3,081 | | |
Government National Mortgage Association, | |
October TBA: | |
3.50%, 10/20/47 (a) | | | 680 | | | | 707 | | |
Various Pools: | |
3.50%, 11/20/40 - 7/20/46 | | | 3,205 | | | | 3,337 | | |
4.00%, 8/20/41 - 3/20/43 | | | 726 | | | | 771 | | |
5.48%, 9/20/37 | | | 9 | | | | 10 | | |
6.50%, 5/15/40 | | | 784 | | | | 932 | | |
| | | | 61,624 | | |
Asset-Backed Securities (6.8%) | |
2010 U-Haul S Fleet LLC, | |
4.90%, 10/25/23 (b) | | | 571 | | | | 571 | | |
| | | Face
Amount
(000) | | Value
(000) | |
Accredited Mortgage Loan Trust, | |
1 Month USD LIBOR + 0.60%, 1.84%,
4/25/34 (c) | | $ | 1,133 | | | $ | 1,096 | | |
American Homes 4 Rent Trust, | |
6.07%, 10/17/45 (b) | | | 601 | | | | 675 | | |
AMSR Trust, | |
1 Month LIBOR + 1.40%, 2.63%,
11/17/33 (b)(c) | | | 1,000 | | | | 1,010 | | |
Blackbird Capital Aircraft Lease
Securitization Ltd., | |
5.68%, 12/16/41 (b) | | | 719 | | | | 725 | | |
CAM Mortgage Trust, | |
4.00%, 1/15/56 (b) | | | 76 | | | | 76 | | |
ContiMortgage Home Equity Loan Trust, | |
8.10%, 8/15/25 | | | 25 | | | | 18 | | |
CVS Pass-Through Trust, | |
6.04%, 12/10/28 | | | 658 | | | | 745 | | |
GMAT Trust, | |
4.25%, 9/25/20 (b) | | | 650 | | | | 650 | | |
Green Tree Agency Advance Funding Trust I, | |
2.38%, 10/15/48 (b) | | | 800 | | | | 796 | | |
Invitation Homes Trust, | |
1 Month LIBOR + 4.00%, 5.23%,
9/17/31 (b)(c) | | | 1,000 | | | | 1,005 | | |
1 Month LIBOR + 4.75%, 5.98%,
8/17/32 (b)(c) | | | 997 | | | | 1,021 | | |
Labrador Aviation Finance Ltd., | |
5.68%, 1/15/42 (b) | | | 555 | | | | 565 | | |
Nationstar HECM Loan Trust, | |
3.97%, 9/25/27 (b)(c) | | | 1,000 | | | | 1,000 | | |
4.70%, 5/25/27 (b) | | | 800 | | | | 810 | | |
5.68%, 8/25/26 (b) | | | 475 | | | | 486 | | |
6.54%, 6/25/26 (b)(c) | | | 450 | | | | 457 | | |
OnDeck Asset Securitization Trust II LLC, | |
4.21%, 5/17/20 (b) | | | 450 | | | | 453 | | |
PNMAC GMSR Issuer Trust, | |
5.24%, 8/25/23 (b)(c) | | | 400 | | | | 401 | | |
1 Month USD LIBOR + 4.75%, 5.99%,
2/25/50 (b)(c) | | | 900 | | | | 903 | | |
Pretium Mortgage Credit Partners I LLC, | |
3.25%, 8/27/32 - 3/28/57 (b) | | | 1,716 | | | | 1,718 | | |
3.50%, 10/27/31 - 4/29/32 (b) | | | 1,374 | | | | 1,382 | | |
PRPM LLC, | |
4.00%, 9/27/21 (b) | | | 397 | | | | 397 | | |
RCO Mortgage LLC, | |
3.38%, 8/25/22 (b) | | | 1,079 | | | | 1,083 | | |
S-Jets Ltd., | |
7.02%, 8/15/42 (b) | | | 1,484 | | | | 1,485 | | |
Skopos Auto Receivables Trust, | |
3.10%, 12/15/23 (b) | | | 15 | | | | 15 | | |
3.55%, 2/15/20 (b) | | | 47 | | | | 47 | | |
Tricon American Homes Trust, | |
5.15%, 9/17/34 (b) | | | 450 | | | | 448 | | |
5.77%, 11/17/33 (b) | | | 630 | | | | 651 | | |
The accompanying notes are an integral part of the financial statements.
6
Morgan Stanley Institutional Fund Trust
Annual Report — September 30, 2017
Portfolio of Investments (cont'd)
Core Plus Fixed Income Portfolio
| | | Face
Amount
(000) | | Value
(000) | |
Asset-Backed Securities (cont'd) | |
VOLT LIV LLC, | |
3.50%, 2/25/47 (b) | | $ | 504 | | | $ | 508 | | |
VOLT LIX LLC, | |
3.25%, 5/25/47 (b) | | | 602 | | | | 605 | | |
VOLT NPL X LLC, | |
4.75%, 10/26/54 (b) | | | 64 | | | | 65 | | |
VOLT XIX LLC, | |
5.00%, 4/25/55 (b) | | | 300 | | | | 301 | | |
VOLT XXII LLC, | |
4.25%, 2/25/55 (b) | | | 299 | | | | 301 | | |
| | | | 22,469 | | |
Collateralized Mortgage Obligations — Agency Collateral Series (1.2%) | |
Federal Home Loan Mortgage Corporation, | |
4.09%, 10/25/48 (b)(c) | | | 750 | | | | 705 | | |
1 Month LIBOR + 4.35%, 5.58%,
12/25/26 (b)(c) | | | 300 | | | | 304 | | |
1 Month LIBOR + 5.05%, 6.29%, 7/25/23 (c) | | | 364 | | | | 368 | | |
1 Month LIBOR + 5.25%, 6.48%,
7/25/26 (b)(c) | | | 268 | | | | 274 | | |
IO REMIC | |
6.00% - 1 Month LIBOR, 4.77%, 11/15/43 (c) | | | 1,375 | | | | 185 | | |
6.05% - 1 Month LIBOR, 4.82%, 4/15/39 (c) | | | 1,189 | | | | 98 | | |
IO STRIPS | |
7.50%, 12/15/29 | | | 36 | | | | 10 | | |
PAC REMIC | |
9.50%, 4/15/20 | | | — | @ | | | — | @ | |
Federal National Mortgage Association, | |
IO | |
6.39% - 1 Month LIBOR, 5.15%, 9/25/20 (c) | | | 4,201 | | | | 422 | | |
IO PAC REMIC | |
8.00%, 9/18/27 | | | 137 | | | | 30 | | |
IO REMIC | |
6.00%, 7/25/33 | | | 87 | | | | 17 | | |
IO STRIPS | |
6.50%, 9/25/29 - 12/25/29 | | | 536 | | | | 93 | | |
8.00%, 4/25/24 | | | 126 | | | | 18 | | |
8.50%, 10/25/25 | | | 48 | | | | 10 | | |
9.00%, 11/25/26 | | | 44 | | | | 9 | | |
REMIC | |
7.00%, 9/25/32 | | | 265 | | | | 309 | | |
56.76%, 9/25/20 (d) | | | — | @ | | | — | @ | |
Government National Mortgage Association, | |
IO | |
3.50%, 5/20/43 | | | 1,570 | | | | 333 | | |
6.05% - 1 Month LIBOR, 4.82%, 11/16/40 (c) | | | 1,888 | | | | 332 | | |
6.10% - 1 Month LIBOR, 4.87%, 7/16/33 (c) | | | 1,716 | | | | 85 | | |
6.23% - 1 Month LIBOR, 4.99%, 3/20/43 (c) | | | 669 | | | | 113 | | |
5.00%, 2/16/41 | | | 301 | | | | 67 | | |
6.50% - 1 Month LIBOR, 5.26%, 5/20/40 (c) | | | 816 | | | | 154 | | |
IO PAC | |
6.15% - 1 Month LIBOR, 4.91%, 10/20/41 (c) | | | 2,131 | | | | 194 | | |
| | | | 4,130 | | |
| | | Face
Amount
(000) | | Value
(000) | |
Commercial Mortgage-Backed Securities (6.3%) | |
BBCCRE Trust, | |
4.71%, 8/10/33 (b)(c) | | $ | 750 | | | $ | 636 | | |
BBCMS Trust, | |
4.43%, 9/10/28 (b)(c) | | | 1,037 | | | | 1,016 | | |
CGDB Commercial Mortgage Trust, | |
1 Month LIBOR + 2.50%, 3.73%,
5/15/30 (b)(c) | | | 290 | | | | 291 | | |
Citigroup Commercial Mortgage Trust, | |
1 Month LIBOR + 2.94%, 4.17%,
9/15/27 (b)(c) | | | 650 | | | | 641 | | |
IO | |
1.04%, 11/10/48 (c) | | | 2,808 | | | | 139 | | |
1.12%, 9/10/58 (c) | | | 9,764 | | | | 569 | | |
COMM Mortgage Trust, | |
5.21%, 8/10/46 (b)(c) | | | 800 | | | | 786 | | |
IO | |
0.25%, 7/10/45 (c) | | | 14,899 | | | | 90 | | |
1.11%, 10/10/47 (c) | | | 4,578 | | | | 175 | | |
1.39%, 7/15/47 (c) | | | 4,119 | | | | 208 | | |
Commercial Mortgage Pass-Through
Certificates, | |
4.75%, 2/10/47 (b)(c) | | | 575 | | | | 537 | | |
Cosmopolitan Hotel Trust, | |
1 Month LIBOR + 3.50%, 4.73%,
11/15/33 (b)(c) | | | 400 | | | | 403 | | |
CSMC Trust, | |
1 Month LIBOR + 4.15%, 5.38%,
3/15/28 (b)(c) | | | 200 | | | | 201 | | |
1 Month LIBOR + 4.60%, 5.83%,
11/15/33 (b)(c) | | | 777 | | | | 784 | | |
1 Month LIBOR + 4.75%, 5.98%,
4/15/29 (b)(c) | | | 1,000 | | | | 1,008 | | |
GS Mortgage Securities Trust, | |
4.92%, 8/10/46 (b)(c) | | | 500 | | | | 475 | | |
IO | |
0.98%, 9/10/47 (c) | | | 5,811 | | | | 242 | | |
1.40%, 10/10/49 (c) | | | 8,143 | | | | 683 | | |
1.52%, 10/10/48 (c) | | | 5,379 | | | | 436 | | |
HILT Mortgage Trust, | |
3.75% - 1 Month LIBOR, 3.23%,
7/15/29 (b)(c) | | | 600 | | | | 576 | | |
HMH Trust, | |
6.29%, 7/5/31 (b) | | | 450 | | | | 450 | | |
JP Morgan Chase Commercial Mortgage
Securities Trust, | |
4.72%, 7/15/47 (b)(c) | | | 1,135 | | | | 934 | | |
IO | |
0.69%, 4/15/46 (c) | | | 6,956 | | | | 189 | | |
0.96%, 12/15/49 (c) | | | 4,593 | | | | 213 | | |
1.27%, 7/15/47 (c) | | | 10,433 | | | | 438 | | |
JPMBB Commercial Mortgage Securities Trust, | |
4.11%, 9/15/47 (b)(c) | | | 1,105 | | | | 949 | | |
4.82%, 4/15/47 (b)(c) | | | 775 | | | | 696 | | |
The accompanying notes are an integral part of the financial statements.
7
Morgan Stanley Institutional Fund Trust
Annual Report — September 30, 2017
Portfolio of Investments (cont'd)
Core Plus Fixed Income Portfolio
| | | Face
Amount
(000) | | Value
(000) | |
Commercial Mortgage-Backed Securities (cont'd) | |
IO | |
1.23%, 8/15/47 (c) | | $ | 4,483 | | | $ | 246 | | |
LB-UBS Commercial Mortgage Trust, | |
6.39%, 9/15/45 (c) | | | 550 | | | | 559 | | |
Morgan Stanley Bank of America Merrill Lynch
Trust, | |
4.75%, 12/15/46 (b) | | | 835 | | | | 827 | | |
Wells Fargo Commercial Mortgage Trust, | |
3.94%, 8/15/50 (b) | | | 625 | | | | 515 | | |
4.65%, 9/15/58 (b)(c) | | | 471 | | | | 415 | | |
IO | |
1.19%, 12/15/49 (c) | | | 6,838 | | | | 394 | | |
1.80%, 11/15/49 (c) | | | 6,925 | | | | 693 | | |
WFRBS Commercial Mortgage Trust, | |
3.50%, 8/15/47 (b) | | | 1,400 | | | | 1,104 | | |
3.80%, 11/15/47 (b)(c) | | | 950 | | | | 722 | | |
3.99%, 5/15/47 (b) | | | 580 | | | | 446 | | |
4.27%, 5/15/45 (b)(c) | | | 425 | | | | 395 | | |
5.15%, 9/15/46 (b)(c) | | | 805 | | | | 770 | | |
| | | | 20,851 | | |
Corporate Bonds (33.1%) | |
Finance (14.8%) | |
AerCap Ireland Capital DAC/AerCap Global
Aviation Trust, | |
3.75%, 5/15/19 | | | 380 | | | | 389 | | |
Alexandria Real Estate Equities, Inc., | |
3.95%, 1/15/27 | | | 175 | | | | 179 | | |
Ally Financial, Inc., | |
3.25%, 2/13/18 | | | 10 | | | | 10 | | |
4.25%, 4/15/21 | | | 525 | | | | 545 | | |
American International Group, Inc., | |
4.88%, 6/1/22 | | | 375 | | | | 412 | | |
AvalonBay Communities, Inc., | |
Series G | |
2.95%, 5/11/26 | | | 375 | | | | 370 | | |
Bank of America Corp., | |
4.24%, 4/24/38 | | | 225 | | | | 238 | | |
6.11%, 1/29/37 | | | 250 | | | | 314 | | |
MTN | |
4.00%, 1/22/25 | | | 1,055 | | | | 1,093 | | |
4.25%, 10/22/26 | | | 1,088 | | | | 1,140 | | |
Bank of New York Mellon Corp. (The), | |
MTN | |
3.65%, 2/4/24 | | | 525 | | | | 550 | | |
BNP Paribas SA, | |
3.80%, 1/10/24 (b)(e) | | | 500 | | | | 520 | | |
5.00%, 1/15/21 | | | 175 | | | | 190 | | |
Boston Properties LP, | |
3.80%, 2/1/24 | | | 700 | | | | 733 | | |
| BPCE SA, | |
5.15%, 7/21/24 (b) | | | 1,075 | | | | 1,161 | | |
| | | Face
Amount
(000) | | Value
(000) | |
Brighthouse Financial, Inc., | |
3.70%, 6/22/27 (b) | | $ | 1,175 | | | $ | 1,156 | | |
Brookfield Finance LLC, | |
4.00%, 4/1/24 | | | 775 | | | | 804 | | |
Capital One Bank USA NA, | |
3.38%, 2/15/23 | | | 1,625 | | | | 1,651 | | |
Citigroup, Inc., | |
3.89%, 1/10/28 | | | 1,500 | | | | 1,542 | | |
6.68%, 9/13/43 | | | 120 | | | | 163 | | |
8.13%, 7/15/39 | | | 350 | | | | 555 | | |
Citizens Bank NA, | |
MTN | |
2.55%, 5/13/21 | | | 250 | | | | 251 | | |
Colony NorthStar, Inc., | |
5.00%, 4/15/23 | | | 375 | | | | 386 | | |
Cooperatieve Rabobank UA, | |
3.95%, 11/9/22 | | | 650 | | | | 683 | | |
Credit Agricole SA, | |
3.88%, 4/15/24 (b) | | | 500 | | | | 531 | | |
Credit Suisse Group AG, | |
3.57%, 1/9/23 (b) | | | 250 | | | | 256 | | |
Credit Suisse Group Funding Guernsey Ltd., | |
4.55%, 4/17/26 | | | 1,150 | | | | 1,235 | | |
Deutsche Bank AG, | |
2.70%, 7/13/20 | | | 625 | | | | 628 | | |
Discover Bank, | |
7.00%, 4/15/20 | | | 250 | | | | 276 | | |
Discover Financial Services, | |
3.95%, 11/6/24 | | | 750 | | | | 769 | | |
Extra Space Storage LP, | |
3.13%, 10/1/35 (b) | | | 250 | | | | 273 | | |
Federal Realty Investment Trust, | |
3.63%, 8/1/46 | | | 250 | | | | 227 | | |
Five Corners Funding Trust, | |
4.42%, 11/15/23 (b) | | | 500 | | | | 542 | | |
GE Capital International Funding Co.,
Unlimited Co., | |
4.42%, 11/15/35 | | | 615 | | | | 670 | | |
Goldman Sachs Group, Inc. (The), | |
6.75%, 10/1/37 | | | 615 | | | | 813 | | |
MTN | |
4.80%, 7/8/44 | | | 350 | | | | 393 | | |
Guardian Life Insurance Co. of America (The), | |
4.85%, 1/24/77 (b) | | | 475 | | | | 509 | | |
Hartford Financial Services Group, Inc. (The), | |
5.50%, 3/30/20 | | | 295 | | | | 318 | | |
HBOS PLC, | |
Series G | |
6.75%, 5/21/18 (b) | | | 813 | | | | 837 | | |
Healthcare Trust of America Holdings LP, | |
3.70%, 4/15/23 | | | 350 | | | | 359 | | |
HSBC Finance Corp., | |
6.68%, 1/15/21 | | | 237 | | | | 268 | | |
The accompanying notes are an integral part of the financial statements.
8
Morgan Stanley Institutional Fund Trust
Annual Report — September 30, 2017
Portfolio of Investments (cont'd)
Core Plus Fixed Income Portfolio
| | | Face
Amount
(000) | | Value
(000) | |
Finance (cont'd) | |
HSBC Holdings PLC, | |
4.25%, 3/14/24 | | $ | 1,900 | | | $ | 1,989 | | |
HSBC USA, Inc., | |
3.50%, 6/23/24 | | | 225 | | | | 232 | | |
Humana, Inc., | |
3.95%, 3/15/27 | | | 350 | | | | 366 | | |
ING Bank N.V., | |
5.80%, 9/25/23 (b) | | | 770 | | | | 880 | | |
ING Groep N.V., | |
6.00%, 4/16/20 (e)(f) | | | 200 | | | | 206 | | |
Intesa Sanpaolo SpA, | |
5.25%, 1/12/24 | | | 610 | | | | 673 | | |
Jefferies Finance LLC/JFIN Co-Issuer Corp., | |
7.38%, 4/1/20 (b) | | | 380 | | | | 393 | | |
JPMorgan Chase & Co., | |
3.78%, 2/1/28 | | | 1,525 | | | | 1,571 | | |
4.13%, 12/15/26 | | | 1,075 | | | | 1,123 | | |
LeasePlan Corp N.V., | |
2.88%, 1/22/19 (b) | | | 475 | | | | 476 | | |
Liberty Mutual Group, Inc., | |
4.85%, 8/1/44 (b) | | | 150 | | | | 164 | | |
Macquarie Bank Ltd., | |
6.63%, 4/7/21 (b) | | | 490 | | | | 551 | | |
MetLife, Inc. (See Note G), | |
5.70%, 6/15/35 | | | 175 | | | | 217 | | |
Mizuho Financial Group, Inc., | |
2.63%, 4/12/21 (b) | | | 600 | | | | 600 | | |
MPT Operating Partnership LP/MPT
Finance Corp., | |
5.00%, 10/15/27 | | | 800 | | | | 822 | | |
Nationwide Building Society, | |
3.90%, 7/21/25 (b)(e) | | | 400 | | | | 420 | | |
6.25%, 2/25/20 (b) | | | 645 | | | | 706 | | |
New York Life Global Funding, | |
1.70%, 9/14/21 (b) | | | 600 | | | | 588 | | |
PNC Financial Services Group, Inc. (The), | |
3.15%, 5/19/27 | | | 825 | | | | 826 | | |
3.90%, 4/29/24 | | | 360 | | | | 378 | | |
Realty Income Corp., | |
3.25%, 10/15/22 | | | 400 | | | | 410 | | |
Royal Bank of Scotland Group PLC, | |
3.88%, 9/12/23 | | | 875 | | | | 897 | | |
Santander Issuances SAU, | |
5.18%, 11/19/25 | | | 600 | | | | 647 | | |
Santander UK Group Holdings PLC, | |
3.57%, 1/10/23 | | | 1,125 | | | | 1,152 | | |
Shutterfly, Inc., | |
0.25%, 5/15/18 | | | 400 | | | | 398 | | |
Skandinaviska Enskilda Banken AB, | |
2.63%, 11/17/20 (b)(e) | | | 500 | | | | 507 | | |
Spirit Realty Capital, Inc., | |
3.75%, 5/15/21 (e) | | | 375 | | | | 384 | | |
| | | Face
Amount
(000) | | Value
(000) | |
Standard Chartered PLC, | |
3.05%, 1/15/21 (b) | | $ | 325 | | | $ | 330 | | |
Swedbank AB, | |
2.38%, 2/27/19 (b) | | | 525 | | | | 529 | | |
Synchrony Bank, | |
3.00%, 6/15/22 | | | 625 | | | | 624 | | |
TD Ameritrade Holding Corp., | |
3.63%, 4/1/25 | | | 500 | | | | 518 | | |
Toronto-Dominion Bank (The), | |
3.63%, 9/15/31 | | | 725 | | | | 723 | | |
Travelers Cos., Inc. (The), | |
3.75%, 5/15/46 | | | 275 | | | | 273 | | |
UBS Group Funding Switzerland AG, | |
2.95%, 9/24/20 (b) | | | 525 | | | | 533 | | |
UnitedHealth Group, Inc., | |
2.88%, 3/15/23 | | | 1,025 | | | | 1,046 | | |
3.75%, 7/15/25 | | | 475 | | | | 505 | | |
WEA Finance LLC/Westfield UK & Europe
Finance PLC, | |
3.25%, 10/5/20 (b) | | | 450 | | | | 460 | | |
Wells Fargo & Co., | |
3.00%, 10/23/26 | | | 1,950 | | | | 1,909 | | |
5.61%, 1/15/44 | | | 250 | | | | 303 | | |
| | | | 49,268 | | |
Industrials (17.4%) | |
21st Century Fox America, Inc., | |
4.75%, 9/15/44 | | | 375 | | | | 402 | | |
Abbott Laboratories, | |
3.75%, 11/30/26 | | | 1,025 | | | | 1,054 | | |
Air Liquide Finance SA, | |
1.75%, 9/27/21 (b) | | | 450 | | | | 440 | | |
Akamai Technologies, Inc., | |
0.00%, 2/15/19 | | | 375 | | | | 365 | | |
Amazon.com, Inc., | |
2.80%, 8/22/24 (b) | | | 975 | | | | 980 | | |
3.80%, 12/5/24 | | | 600 | | | | 642 | | |
Amgen, Inc., | |
4.66%, 6/15/51 | | | 750 | | | | 826 | | |
Anadarko Petroleum Corp., | |
5.55%, 3/15/26 (e) | | | 600 | | | | 671 | | |
Anheuser-Busch InBev Finance, Inc., | |
3.70%, 2/1/24 | | | 575 | | | | 604 | | |
4.90%, 2/1/46 | | | 575 | | | | 652 | | |
Apple, Inc., | |
2.45%, 8/4/26 | | | 400 | | | | 386 | | |
4.45%, 5/6/44 | | | 750 | | | | 818 | | |
AT&T, Inc., | |
4.25%, 3/1/27 | | | 1,250 | | | | 1,289 | | |
4.50%, 3/9/48 | | | 900 | | | | 833 | | |
4.90%, 8/14/37 | | | 300 | | | | 304 | | |
Baidu, Inc., | |
2.75%, 6/9/19 | | | 650 | | | | 658 | | |
The accompanying notes are an integral part of the financial statements.
9
Morgan Stanley Institutional Fund Trust
Annual Report — September 30, 2017
Portfolio of Investments (cont'd)
Core Plus Fixed Income Portfolio
| | | Face
Amount
(000) | | Value
(000) | |
Industrials (cont'd) | |
Becton Dickinson and Co., | |
2.89%, 6/6/22 | | $ | 600 | | | $ | 603 | | |
BHP Billiton Finance USA Ltd., | |
5.00%, 9/30/43 | | | 250 | | | | 296 | | |
BP Capital Markets PLC, | |
3.12%, 5/4/26 | | | 825 | | | | 826 | | |
3.25%, 5/6/22 | | | 625 | | | | 648 | | |
Charter Communications Operating LLC/
Charter Communications Operating Capital, | |
4.91%, 7/23/25 | | | 425 | | | | 455 | | |
6.48%, 10/23/45 | | | 450 | | | | 530 | | |
CNH Industrial Capital LLC, | |
4.38%, 11/6/20 | | | 625 | | | | 658 | | |
CNOOC Finance 2013 Ltd., | |
3.00%, 5/9/23 | | | 540 | | | | 542 | | |
Coca-Cola Co. (The), | |
3.20%, 11/1/23 | | | 375 | | | | 392 | | |
Comcast Corp., | |
4.60%, 8/15/45 | | | 380 | | | | 419 | | |
ConocoPhillips Co., | |
4.95%, 3/15/26 (e) | | | 600 | | | | 677 | | |
Daimler Finance North America LLC, | |
2.25%, 7/31/19 (b) | | | 700 | | | | 703 | | |
Darden Restaurants, Inc., | |
3.85%, 5/1/27 | | | 450 | | | | 458 | | |
DCP Midstream Operating LP, | |
5.35%, 3/15/20 (b) | | | 169 | | | | 177 | | |
Delta Air Lines, Inc., | |
2.88%, 3/13/20 | | | 475 | | | | 481 | | |
Deutsche Telekom International Finance BV, | |
3.60%, 1/19/27 (b)(e) | | | 750 | | | | 760 | | |
Discovery Communications LLC, | |
3.95%, 3/20/28 | | | 425 | | | | 423 | | |
Dollar General Corp., | |
1.88%, 4/15/18 | | | 550 | | | | 551 | | |
3.25%, 4/15/23 | | | 400 | | | | 409 | | |
Eldorado Gold Corp., | |
6.13%, 12/15/20 (b) | | | 380 | | | | 388 | | |
Enable Midstream Partners LP, | |
3.90%, 5/15/24 | | | 425 | | | | 428 | | |
Equifax, Inc., | |
3.30%, 12/15/22 | | | 300 | | | | 299 | | |
Express Scripts Holding Co., | |
4.50%, 2/25/26 (e) | | | 500 | | | | 536 | | |
4.80%, 7/15/46 (e) | | | 325 | | | | 345 | | |
Exxon Mobil Corp., | |
4.11%, 3/1/46 | | | 775 | | | | 839 | | |
Ford Motor Credit Co., LLC, | |
3.20%, 1/15/21 | | | 400 | | | | 408 | | |
General Motors Co., | |
6.60%, 4/1/36 | | | 200 | | | | 238 | | |
| | | Face
Amount
(000) | | Value
(000) | |
GlaxoSmithKline Capital, Inc., | |
6.38%, 5/15/38 | | $ | 175 | | | $ | 240 | | |
Goldcorp, Inc., | |
3.70%, 3/15/23 | | | 293 | | | | 305 | | |
HCA, Inc., | |
4.75%, 5/1/23 | | | 645 | | | | 682 | | |
Heathrow Funding Ltd., | |
4.88%, 7/15/21 (b) | | | 525 | | | | 564 | | |
Home Depot, Inc. (The), | |
5.88%, 12/16/36 | | | 625 | | | | 813 | | |
Illumina, Inc., | |
0.00%, 6/15/19 | | | 328 | | | | 348 | | |
International Paper Co., | |
3.00%, 2/15/27 | | | 925 | | | | 900 | | |
J Sainsbury PLC, | |
Series SBRY | |
1.25%, 11/21/19 | | GBP | 300 | | | | 408 | | |
Johnson Controls International PLC, | |
3.90%, 2/14/26 | | $ | 500 | | | | 527 | | |
Kinder Morgan Energy Partners LP, | |
3.95%, 9/1/22 | | | 1,175 | | | | 1,221 | | |
Kraft Heinz Foods Co., | |
4.38%, 6/1/46 | | | 675 | | | | 669 | | |
Lockheed Martin Corp., | |
3.10%, 1/15/23 | | | 725 | | | | 748 | | |
LVMH Moet Hennessy Louis Vuitton SE, | |
Series MCFP | |
0.00%, 2/16/21 | | | 150 | | | | 445 | | |
LyondellBasell Industries N.V., | |
4.63%, 2/26/55 | | | 450 | | | | 466 | | |
Macquarie Infrastructure Corp., | |
2.00%, 10/1/23 | | | 850 | | | | 828 | | |
MasTec, Inc., | |
4.88%, 3/15/23 | | | 540 | | | | 555 | | |
McDonald's Corp., | |
MTN | |
4.60%, 5/26/45 | | | 400 | | | | 438 | | |
Medtronic, Inc., | |
4.63%, 3/15/45 | | | 325 | | | | 371 | | |
Microsoft Corp., | |
3.13%, 11/3/25 | | | 325 | | | | 334 | | |
4.45%, 11/3/45 | | | 800 | | | | 903 | | |
| MPLX LP, | |
4.88%, 6/1/25 | | | 250 | | | | 268 | | |
5.20%, 3/1/47 | | | 350 | | | | 368 | | |
NBCUniversal Media LLC, | |
5.95%, 4/1/41 | | | 325 | | | | 421 | | |
Netflix, Inc., | |
4.38%, 11/15/26 (b)(e) | | | 325 | | | | 327 | | |
NOVA Chemicals Corp., | |
5.25%, 8/1/23 (b) | | | 463 | | | | 479 | | |
Novartis Capital Corp., | |
4.40%, 5/6/44 | | | 375 | | | | 425 | | |
The accompanying notes are an integral part of the financial statements.
10
Morgan Stanley Institutional Fund Trust
Annual Report — September 30, 2017
Portfolio of Investments (cont'd)
Core Plus Fixed Income Portfolio
| | | Face
Amount
(000) | | Value
(000) | |
Industrials (cont'd) | |
Nuance Communications, Inc., | |
1.00%, 12/15/35 | | $ | 425 | | | $ | 400 | | |
ON Semiconductor Corp., | |
1.00%, 12/1/20 | | | 625 | | | | 749 | | |
Ooredoo International Finance Ltd., | |
3.25%, 2/21/23 (b) | | | 450 | | | | 451 | | |
Oracle Corp., | |
2.95%, 5/15/25 | | | 381 | | | | 385 | | |
PepsiCo, Inc., | |
3.60%, 3/1/24 | | | 625 | | | | 661 | | |
Philip Morris International, Inc., | |
2.50%, 8/22/22 | | | 270 | | | | 270 | | |
Phillips 66 Partners LP, | |
4.68%, 2/15/45 | | | 150 | | | | 146 | | |
Priceline Group, Inc. (The), | |
0.90%, 9/15/21 (e) | | | 275 | | | | 316 | | |
QUALCOMM, Inc., | |
2.10%, 5/20/20 | | | 575 | | | | 580 | | |
Shell International Finance BV, | |
3.25%, 5/11/25 | | | 400 | | | | 410 | | |
Siemens Financieringsmaatschappij N.V., | |
2.35%, 10/15/26 (b) | | | 800 | | | | 755 | | |
SK Telecom Co., Ltd., | |
2.13%, 5/1/18 (b) | | | 200 | | | | 200 | | |
Southern Copper Corp., | |
5.25%, 11/8/42 | | | 600 | | | | 639 | | |
Spectra Energy Capital LLC, | |
3.30%, 3/15/23 | | | 475 | | | | 477 | | |
Sprint Corp., | |
7.13%, 6/15/24 | | | 500 | | | | 564 | | |
Sprint Spectrum Co., LLC/Sprint Spectrum
Co., II LLC/Sprint Spectrum Co., III LLC, | |
3.36%, 3/20/23 (b) | | | 1,437 | | | | 1,462 | | |
Telefonica Emisiones SAU, | |
4.10%, 3/8/27 | | | 850 | | | | 881 | | |
Telenor East Holding II AS, | |
Series VIP | |
0.25%, 9/20/19 | | | 600 | | | | 669 | | |
Teva Pharmaceutical Finance Netherlands III BV, | |
3.15%, 10/1/26 (e) | | | 1,175 | | | | 1,085 | | |
Thermo Fisher Scientific, Inc., | |
2.95%, 9/19/26 | | | 900 | | | | 883 | | |
Time Warner, Inc., | |
3.80%, 2/15/27 | | | 400 | | | | 401 | | |
Total Capital International SA, | |
2.88%, 2/17/22 | | | 500 | | | | 511 | | |
Transurban Finance Co., Pty Ltd., | |
3.38%, 3/22/27 (b) | | | 550 | | | | 541 | | |
Tyson Foods, Inc., | |
4.88%, 8/15/34 | | | 375 | | | | 415 | | |
| | | Face
Amount
(000) | | Value
(000) | |
United Airlines Pass-Through Trust, | |
Series A | |
4.00%, 4/11/26 | | $ | 599 | | | $ | 636 | | |
United Technologies Corp., | |
4.50%, 6/1/42 | | | 165 | | | | 178 | | |
Verizon Communications, Inc., | |
4.67%, 3/15/55 | | | 575 | | | | 550 | | |
5.01%, 8/21/54 | | | 300 | | | | 303 | | |
Viavi Solutions, Inc., | |
0.63%, 8/15/33 | | | 375 | | | | 394 | | |
Visa, Inc., | |
3.15%, 12/14/25 | | | 1,125 | | | | 1,154 | | |
Volkswagen Group of America Finance LLC, | |
2.40%, 5/22/20 (b) | | | 800 | | | | 804 | | |
Wal-Mart Stores, Inc., | |
5.25%, 9/1/35 | | | 615 | | | | 757 | | |
Woodside Finance Ltd., | |
3.70%, 9/15/26 (b) | | | 675 | | | | 677 | | |
ZF North America Capital, Inc., | |
4.50%, 4/29/22 (b) | | | 250 | | | | 264 | | |
| | | | 58,034 | | |
Utilities (0.9%) | |
Duke Energy Corp., | |
2.65%, 9/1/26 | | | 760 | | | | 728 | | |
Enel Finance International N.V., | |
3.63%, 5/25/27 (b) | | | 350 | | | | 351 | | |
Entergy Louisiana LLC, | |
3.05%, 6/1/31 | | | 525 | | | | 509 | | |
Southern Power Co., | |
Series D | |
1.95%, 12/15/19 | | | 550 | | | | 549 | | |
Trans-Allegheny Interstate Line Co., | |
3.85%, 6/1/25 (b) | | | 775 | | | | 812 | | |
| | | | 2,949 | | |
| | | | 110,251 | | |
Mortgages — Other (5.2%) | |
Adjustable Rate Mortgage Trust, | |
3.57%, 6/25/35 (c) | | | 458 | | | | 453 | | |
Alternative Loan Trust, | |
1 Month USD LIBOR + 0.18%, 1.42%,
5/25/47 (c) | | | 166 | | | | 161 | | |
Banc of America Alternative Loan Trust, | |
1 Month USD LIBOR + 0.65%, 1.89%,
7/25/46 (c) | | | 262 | | | | 198 | | |
5.86%, 10/25/36 | | | 652 | | | | 406 | | |
6.00%, 4/25/36 | | | 116 | | | | 117 | | |
Banc of America Funding Trust, | |
5.25%, 7/25/37 | | | 360 | | | | 361 | | |
ChaseFlex Trust, | |
6.00%, 2/25/37 | | | 961 | | | | 758 | | |
The accompanying notes are an integral part of the financial statements.
11
Morgan Stanley Institutional Fund Trust
Annual Report — September 30, 2017
Portfolio of Investments (cont'd)
Core Plus Fixed Income Portfolio
| | | Face
Amount
(000) | | Value
(000) | |
Mortgages (cont'd) | |
Eurosail PLC, | |
3 Month GBP LIBOR + 0.95%, 1.25%,
6/13/45 (c) | | GBP | 600 | | | $ | 781 | | |
Farringdon Mortgages No. 2 PLC, | |
3 Month GBP LIBOR + 1.50%, 1.79%,
7/15/47 (c) | | | 275 | | | | 358 | | |
Federal Home Loan Mortgage Corporation, | |
3.00%, 7/25/46 - 5/25/47 | | $ | 1,785 | | | | 1,773 | | |
3.50%, 5/25/45 - 5/25/47 | | | 3,317 | | | | 3,373 | | |
3.88%, 5/25/45 (b)(c) | | | 201 | | | | 200 | | |
4.00%, 5/25/45 | | | 102 | | | | 105 | | |
1 Month USD LIBOR + 3.30%, 4.54%,
10/25/27 (c) | | | 400 | | | | 444 | | |
1 Month USD LIBOR + 3.75%, 4.99%,
9/25/24 (c) | | | 602 | | | | 675 | | |
1 Month USD LIBOR + 4.00%, 5.24%,
8/25/24 (c) | | | 306 | | | | 326 | | |
1 Month USD LIBOR + 5.15%, 6.39%,
10/25/29 (c) | | | 300 | | | | 318 | | |
Grifonas Finance PLC, | |
6 Month EURIBOR + 0.28%, 0.01%,
8/28/39 (c) | | EUR | 493 | | | | 511 | | |
HarborView Mortgage Loan Trust, | |
1 Month USD LIBOR + 0.19%, 1.43%,
1/19/38 (c) | | $ | 463 | | | | 438 | | |
IM Pastor 3 FTH, | |
3 Month EURIBOR + 0.14%, 0.00%,
3/22/43 (c) | | EUR | 493 | | | | 481 | | |
Impac CMB Trust, | |
1 Month USD LIBOR + 0.74%, 1.97%, | |
4/25/35 (c) | | $ | 232 | | | | 208 | | |
JP Morgan Mortgage Trust, | |
3.57%, 6/25/37 (c) | | | 205 | | | | 194 | | |
6.00%, 6/25/37 | | | 210 | | | | 208 | | |
Lehman Mortgage Trust, | |
5.50%, 11/25/35 - 2/25/36 | | | 907 | | | | 918 | | |
6.50%, 9/25/37 | | | 1,048 | | | | 801 | | |
Paragon Mortgages No. 13 PLC, | |
3 Month GBP LIBOR + 0.40%, 0.69%,
1/15/39 (c) | | GBP | 300 | | | | 370 | | |
Paragon Mortgages No. 15 PLC, | |
3 Month EURIBOR + 0.54%, 0.21%,
12/15/39 (c) | | EUR | 800 | | | | 823 | | |
RALI Trust, | |
5.50%, 12/25/34 | | $ | 710 | | | | 697 | | |
6.00%, 11/25/36 | | | 271 | | | | 239 | | |
Seasoned Credit Risk Transfer Trust, | |
4.00%, 8/25/56 (b)(c) | | | 600 | | | | 526 | | |
| | | | 17,221 | | |
Municipal Bonds (0.7%) | |
Chicago O'Hare International Airport, IL,
O'Hare International Airport Revenue | |
6.40%, 1/1/40 | | | 255 | | | | 349 | | |
| | | Face
Amount
(000) | | Value
(000) | |
City of New York, NY,Series G-1 | |
5.97%, 3/1/36 | | $ | 270 | | | $ | 351 | | |
Illinois State Toll Highway Authority, IL, | |
Highway Revenue, Build America Bonds | |
6.18%, 1/1/34 | | | 477 | | | | 609 | | |
Municipal Electric Authority of Georgia, GA, | |
6.64%, 4/1/57 | | | 283 | | | | 358 | | |
6.66%, 4/1/57 | | | 320 | | | | 400 | | |
New York City Transitional Finance Authority
Future Tax Secured Revenue, NY, | |
Transitional Finance Authority Future Tax
Secured Revenue | |
5.27%, 5/1/27 | | | 320 | | | | 374 | | |
| | | | 2,441 | | |
Sovereign (5.6%) | |
Argentine Republic Government
International Bond, | |
7.50%, 4/22/26 (e) | | | 1,181 | | | | 1,330 | | |
Brazil Notas do Tesouro Nacional, Series F | |
10.00%, 1/1/23 | | BRL | 10,700 | | | | 3,488 | | |
Cyprus Government International Bond, | |
3.88%, 5/6/22 | | EUR | 1,525 | | | | 2,032 | | |
Indonesia Treasury Bond, | |
8.25%, 7/15/21 | | IDR | 29,773,000 | | | | 2,370 | | |
Mexican Bonos, | |
Series M | |
6.50%, 6/10/21 | | MXN | 74,900 | | | | 4,092 | | |
Mexico Government International Bond, | |
3.60%, 1/30/25 | | $ | 704 | | | | 723 | | |
Petroleos Mexicanos, | |
6.38%, 1/23/45 | | | 329 | | | | 336 | | |
6.88%, 8/4/26 | | | 150 | | | | 171 | | |
Portugal Obrigacoes do Tesouro OT, | |
5.65%, 2/15/24 (b) | | EUR | 1,951 | | | | 2,881 | | |
Ukraine Government International Bond, | |
7.75%, 9/1/26 | | $ | 1,261 | | | | 1,300 | | |
| | | | 18,723 | | |
U.S. Agency Security (0.6%) | |
Federal Home Loan Bank, | |
0.88%, 10/1/18 (e) | | | 2,070 | | | | 2,061 | | |
U.S. Treasury Securities (11.7%) | |
U.S. Treasury Bond, | |
3.75%, 11/15/43 | | | 5,825 | | | | 6,830 | | |
U.S. Treasury Note, | |
0.38%, 1/15/27 | | | 3,015 | | | | 2,981 | | |
1.13%, 2/28/21 | | | 15,400 | | | | 15,101 | | |
1.50%, 5/31/19 - 8/15/26 | | | 6,225 | | | | 5,968 | | |
1.75%, 9/30/19 - 11/30/21 | | | 7,300 | | | | 7,331 | | |
2.25%, 2/15/27 | | | 675 | | | | 671 | | |
| | | | 38,882 | | |
Total Fixed Income Securities (Cost $295,175) | | | 298,828 | | |
The accompanying notes are an integral part of the financial statements.
12
Morgan Stanley Institutional Fund Trust
Annual Report — September 30, 2017
Portfolio of Investments (cont'd)
Core Plus Fixed Income Portfolio
| | | Shares | | Value
(000) | |
Short-Term Investments (20.1%) | |
Securities held as Collateral on Loaned Securities (1.8%) | |
Investment Company (1.8%) | |
Morgan Stanley Institutional Liquidity
Funds — Government Portfolio —
Institutional Class (See Note G)
(Cost $6,005) | | | 6,005,305 | | | $ | 6,005 | | |
Investment Company (18.1%) | |
Morgan Stanley Institutional Liquidity
Funds — Government Portfolio —
Institutional Class (See Note G)
(Cost $60,265) | | | 60,265,417 | | | | 60,265 | | |
| | | Face
Amount
(000) | | Value
(000) | |
U.S. Treasury Securities (0.2%) | |
U.S. Treasury Bills, | |
1.17%, 4/26/18 (g)(h) | | $ | 115 | | | | 114 | | |
1.19%, 4/26/18 (g)(h) | | | 687 | | | | 683 | | |
Total U.S. Treasury Securities (Cost $797) | | | 797 | | |
Total Short-Term Investments (Cost $67,067) | | | 67,067 | | |
Total Investments (109.9%) (Cost $362,242)
Including $7,858 of Securities Loaned (i)(j) | | | 365,895 | | |
Liabilities in Excess of Other Assets (–9.9%) | | | (33,035 | ) | |
Net Assets (100.0%) | | $ | 332,860 | | |
(a) Security is subject to delayed delivery.
(b) 144A security — Certain conditions for public sale may exist. Unless otherwise noted, these securities are deemed to be liquid.
(c) Floating or Variable rate securities: The rates disclosed are as of September 30, 2017. For securities based on a published reference rate and spread, the reference rate and spread are indicated in the description in the Portfolio of Investments. Certain variable rate securities are not based on a published reference rate and spread but are determined by the issuer or agent and are based on current market conditions. These securities do not indicate a reference rate and spread in their description in the Portfolio of Investments.
(d) Inverse Floating Rate Security — Interest rate fluctuates with an inverse relationship to an associated interest rate. Indicated rate is the effective rate at September 30, 2017.
(e) All or a portion of this security was on loan at September 30, 2017.
(f) Perpetual — One or more securities do not have a predetermined maturity date. Rates for these securities are fixed for a period of time, after which they revert to a floating rate. Interest rates in effect are as of September 30, 2017.
(g) Rate shown is the yield to maturity at September 30, 2017.
(h) All or a portion of the security was pledged to cover margin requirements for swap agreements.
(i) Securities are available for collateral in connection with securities purchased on a forward commitment basis, open foreign currency forward exchange contracts, futures contracts and swap agreements.
(j) At September 30, 2017, the aggregate cost for federal income tax purposes is approximately $361,587,000. The aggregate gross unrealized appreciation is approximately $7,641,000 and the aggregate gross unrealized depreciation is approximately $3,994,000, resulting in net unrealized appreciation of approximately $3,647,000.
@ Value is less than $500.
EURIBOR Euro Interbank Offered Rate.
IO Interest Only.
LIBOR London Interbank Offered Rate.
MTN Medium Term Note.
PAC Planned Amortization Class.
REMIC Real Estate Mortgage Investment Conduit.
STRIPS Separate Trading of Registered Interest and Principal of Securities.
TBA To Be Announced.
Foreign Currency Forward Exchange Contracts:
The Fund had the following foreign currency forward exchange contracts open at September 30, 2017:
Counterparty | | Contracts to
Deliver
(000) | | In Exchange
For
(000) | | Delivery
Date | | Unrealized
Appreciation
(Depreciation)
(000) | |
Australia and New Zealand Banking Group | | AUD | 2,760 | | | $ | 2,201 | | | 10/6/17 | | $ | 36 | | |
Australia and New Zealand Banking Group | | MXN | 4,814 | | | $ | 265 | | | 10/6/17 | | | — | @ | |
Australia and New Zealand Banking Group | | SEK | 12,295 | | | $ | 1,510 | | | 10/6/17 | | | (— | @) | |
Australia and New Zealand Banking Group | | $ | 1,645 | | | NOK | 12,991 | | | 10/6/17 | | | (13 | ) | |
Barclays Bank PLC | | MXN | 56,452 | | | $ | 3,147 | | | 10/6/17 | | | 48 | | |
Citibank NA | | BRL | 7,657 | | | $ | 2,438 | | | 10/6/17 | | | 21 | | |
Citibank NA | | EUR | 5,754 | | | $ | 6,874 | | | 10/6/17 | | | 73 | | |
Citibank NA | | IDR | 31,480,044 | | | $ | 2,360 | | | 10/6/17 | | | 23 | | |
Citibank NA | | $ | 1 | | | EUR | — | @ | | 10/6/17 | | | (— | @) | |
Citibank NA | | $ | 3 | | | GBP | 2 | | | 10/6/17 | | | — | @ | |
HSBC Bank PLC | | EUR | 701 | | | $ | 827 | | | 10/6/17 | | | (2 | ) | |
HSBC Bank PLC | | GBP | 1,374 | | | $ | 1,796 | | | 10/6/17 | | | (46 | ) | |
HSBC Bank PLC | | $ | 31 | | | EUR | 26 | | | 10/6/17 | | | (— | @) | |
HSBC Bank PLC | | $ | 1,437 | | | PLN | 5,113 | | | 10/6/17 | | | (36 | ) | |
JPMorgan Chase Bank NA | | JPY | 162,471 | | | $ | 1,494 | | | 10/6/17 | | | 50 | | |
JPMorgan Chase Bank NA | | $ | 19 | | | EUR | 16 | | | 10/6/17 | | | (— | @) | |
JPMorgan Chase Bank NA | | $ | 1,539 | | | SEK | 12,242 | | | 10/6/17 | | | (36 | ) | |
| | | | | | | | | $ | 118 | | |
The accompanying notes are an integral part of the financial statements.
13
Morgan Stanley Institutional Fund Trust
Annual Report — September 30, 2017
Portfolio of Investments (cont'd)
Core Plus Fixed Income Portfolio
Futures Contracts:
The Fund had the following futures contracts open at September 30, 2017:
| | | Number
of
Contracts | | Expiration
Date | | Notional
Amount
(000) | | Value
(000) | | Unrealized
Appreciation
(Depreciation)
(000) | |
Long: | |
U.S. Treasury 2 yr. Note | | | 171 | | | Dec-17 | | | 34,200 | | | $ | 36,885 | | | $ | (101 | ) | |
U.S. Treasury 30 yr. Bond | | | 22 | | | Dec-17 | | | 2,200 | | | | 3,362 | | | | (65 | ) | |
U.S. Treasury 5 yr. Note | | | 210 | | | Dec-17 | | | 21,000 | | | | 24,675 | | | | (181 | ) | |
U.S. Treasury Ultra Bond | | | 125 | | | Dec-17 | | | 12,500 | | | | 20,641 | | | | (403 | ) | |
Short: | |
German Euro Bund | | | 27 | | | Dec-17 | | | (2,700 | ) | | | (5,138 | ) | | | 55 | | |
U.S. Treasury 10 yr. Note | | | 95 | | | Dec-17 | | | (9,500 | ) | | | (11,905 | ) | | | 103 | | |
U.S. Treasury 10 yr. Ultra Long Bond | | | 25 | | | Dec-17 | | | (2,500 | ) | | | (3,358 | ) | | | 42 | | |
| | | | | | | | | | | $ | (550 | ) | |
Credit Default Swap Agreements:
The Fund had the following credit default swap agreements open at September 30, 2017:
Swap Counterparty and
Reference Obligation | | Credit
Rating of
Reference
Obligation†
(Unaudited) | | Buy/Sell
Protection | | Pay/Receive
Fixed Rate | | Payment
Frequency | | Maturity
Date | | Notional
Amount
(000) | | Value
(000) | | Upfront
Payment
Paid
(Received)
(000) | | Unrealized
Depreciation
(000) | |
Barclays Bank PLC
Quest Diagnostics, Inc. | | BBB+ | | Buy | | | 1.00 | % | | Quarterly | | 3/20/19 | | $ | 995 | | | $ | (14 | ) | | $ | 19 | | | $ | (33 | ) | |
Deutsche Bank AG
CMBX.NA.BB.60 | | NR | | Sell | | | 5.00 | | | Monthly | | 5/11/63 | | | 230 | | | | (56 | ) | | | 1 | | | | (57 | ) | |
Goldman Sachs International
CMBX.NA.BB.60 | | NR | | Sell | | | 5.00 | | | Monthly | | 5/11/63 | | | 286 | | | | (69 | ) | | | (41 | ) | | | (28 | ) | |
| | | | | | | | | | | | | $ | 1,511 | | | $ | (139 | ) | | $ | (21 | ) | | $ | (118 | ) | |
Interest Rate Swap Agreements:
The Fund had the following interest rate swap agreements open at September 30, 2017:
Swap Counterparty | | Floating
Rate Index | | Pay/Receive
Floating Rate | | Fixed Rate | | Payment
Frequency
Paid/
Received | | Maturity
Date | | Notional
Amount
(000) | | Value
(000) | | Upfront
Payment
Paid
(000) | | Unrealized
Appreciation
(Depreciation)
(000) | |
Morgan Stanley & 3 Month Semi-Annual/
Co., LLC* | | LIBOR | | Receive | | | 2.26 | % | | Quarterly | | 12/7/26 | | $ | 3,656 | | | $ | (19 | ) | | $ | — | | | $ | (19 | ) | |
Morgan Stanley & 3 Month Semi-Annual/
Co., LLC* | | LIBOR | | Receive | | | 2.48 | | | Quarterly | | 12/21/26 | | | 3,683 | | | | (89 | ) | | | — | | | | (89 | ) | |
Morgan Stanley & 3 Month Semi-Annual/
Co., LLC* | | LIBOR | | Receive | | | 2.48 | | | Quarterly | | 5/23/47 | | | 3,237 | | | | 41 | | | | — | | | | 41 | | |
| | | | | | | | | | | | | $ | 10,576 | | | $ | (67 | ) | | $ | — | | | $ | (67 | ) | |
@ Value is less than $500.
† Credit rating as issued by Standard & Poor's.
* Cleared swap agreement, the broker is Morgan Stanley & Co., LLC.
LIBOR London Interbank Offered Rate.
NR Not rated.
AUD — Australian Dollar
BRL — Brazilian Real
EUR — Euro
GBP — British Pound
IDR — Indonesian Rupiah
JPY — Japanese Yen
MXN — Mexican Peso
NOK — Norwegian Krone
PLN — Polish Zloty
SEK — Swedish Krona
The accompanying notes are an integral part of the financial statements.
14
Morgan Stanley Institutional Fund Trust
Annual Report — September 30, 2017
Portfolio of Investments (cont'd)
Core Plus Fixed Income Portfolio
Portfolio Composition**
| Classification | | Percentage of
Total Investments | |
Agency Fixed Rate Mortgages | | | 17.1 | % | |
Short-Term Investments | | | 17.0 | | |
Industrials | | | 16.1 | | |
Finance | | | 13.7 | | |
U.S. Treasury Securities | | | 10.8 | | |
Other*** | | | 8.1 | | |
Asset-Backed Securities | | | 6.2 | | |
Commercial Mortgage-Backed Securities | | | 5.8 | | |
Sovereign | | | 5.2 | | |
Total Investments | | | 100.0 | %**** | |
** Percentages indicated are based upon total investments (excluding Securities held as Collateral on Loaned Securities) as of September 30, 2017.
*** Industries and/or investment types representing less than 5% of total investments.
**** Does not include open long/short futures contracts with an underlying face amount of approximately $105,964,000 with net unrealized depreciation of approximately $550,000. Does not include open foreign currency forward exchange contracts with net unrealized appreciation of approximately $118,000 and does not include open swap agreements with net unrealized depreciation of approximately $185,000.
The accompanying notes are an integral part of the financial statements.
15
Morgan Stanley Institutional Fund Trust
Annual Report — September 30, 2017
Core Plus Fixed Income Portfolio
Statement of Assets and Liabilities | | September 30, 2017
(000) | |
Assets: | |
Investments in Securities of Unaffiliated Issuers, at Value(1) (Cost $295,972) | | $ | 299,625 | | |
Investment in Security of Affiliated Issuer, at Value (Cost $66,270) | | | 66,270 | | |
Total Investments in Securities, at Value (Cost $362,242) | | | 365,895 | | |
Receivable for Investments Sold | | | 16,465 | | |
Interest and Paydown Receivable | | | 1,971 | | |
Receivable for Variation Margin on Futures Contracts | | | 804 | | |
Unrealized Appreciation on Foreign Currency Forward Exchange Contracts | | | 251 | | |
Receivable for Fund Shares Sold | | | 223 | | |
Receivable from Affiliate | | | 46 | | |
Due from Adviser | | | 40 | | |
Tax Reclaim Receivable | | | 21 | | |
Premium Paid on Open Swap Agreements | | | 20 | | |
Receivable for Variation Margin on Swap Agreements | | | 1 | | |
Dividends Receivable | | | — | @ | |
Other Assets | | | 72 | | |
Total Assets | | | 385,809 | | |
Liabilities: | |
Payable for Investments Purchased | | | 46,203 | | |
Collateral on Securities Loaned, at Value | | | 6,005 | | |
Payable for Trustees' Fees and Expenses | | | 164 | | |
Unrealized Depreciation on Foreign Currency Forward Exchange Contracts | | | 133 | | |
Unrealized Depreciation on Swap Agreements | | | 118 | | |
Payable for Fund Shares Redeemed | | | 76 | | |
Payable for Sub Transfer Agency Fees — Class I | | | 36 | | |
Payable for Sub Transfer Agency Fees — Class A | | | 8 | | |
Payable for Sub Transfer Agency Fees — Class L | | | — | @ | |
Payable for Sub Transfer Agency Fees — Class C | | | — | @ | |
Premium Received on Open Swap Agreements | | | 41 | | |
Payable for Custodian Fees | | | 26 | | |
Payable for Professional Fees | | | 22 | | |
Payable for Administration Fees | | | 21 | | |
Payable for Shareholder Services Fees — Class A | | | 12 | | |
Payable for Distribution and Shareholder Services Fees — Class L | | | — | @ | |
Payable for Distribution and Shareholder Services Fees — Class C | | | 4 | | |
Deferred Capital Gain Country Tax | | | 10 | | |
Payable for Transfer Agency Fees — Class I | | | 2 | | |
Payable for Transfer Agency Fees — Class A | | | 1 | | |
Payable for Transfer Agency Fees — Class L | | | 1 | | |
Payable for Transfer Agency Fees — Class C | | | 1 | | |
Other Liabilities | | | 65 | | |
Total Liabilities | | | 52,949 | | |
Net Assets | | $ | 332,860 | | |
Net Assets Consist of: | |
Paid-in-Capital | | $ | 529,207 | | |
Accumulated Undistributed Net Investment Income | | | 1,537 | | |
Accumulated Net Realized Loss | | | (200,913 | ) | |
Unrealized Appreciation (Depreciation) on: | |
Investments (Net of $10 of Deferred Capital Gain Country Tax) | | | 3,643 | | |
Futures Contracts | | | (550 | ) | |
Swap Agreements | | | (185 | ) | |
Foreign Currency Forward Exchange Contracts | | | 118 | | |
Foreign Currency Translations | | | 3 | | |
Net Assets | | $ | 332,860 | | |
The accompanying notes are an integral part of the financial statements.
16
Morgan Stanley Institutional Fund Trust
Annual Report — September 30, 2017
Core Plus Fixed Income Portfolio
Statement of Assets and Liabilities (cont'd) | | September 30, 2017
(000) | |
CLASS I: | |
Net Assets | | $ | 265,958 | | |
| Shares Outstanding (unlimited number of shares authorized, no par value) (not in 000's) | | | 23,816,526 | | |
Net Asset Value, Offering and Redemption Price Per Share | | $ | 11.17 | | |
CLASS A: | |
Net Assets | | $ | 60,874 | | |
| Shares Outstanding (unlimited number of shares authorized, no par value) (not in 000's) | | | 5,444,707 | | |
Net Asset Value, Redemption Price Per Share | | $ | 11.18 | | |
Maximum Sales Load | | | 4.25 | % | |
Maximum Sales Charge | | $ | 0.50 | | |
Maximum Offering Price Per Share | | $ | 11.68 | | |
CLASS L: | |
Net Assets | | $ | 1,138 | | |
| Shares Outstanding (unlimited number of shares authorized, no par value) (not in 000's) | | | 101,889 | | |
Net Asset Value, Offering and Redemption Price Per Share | | $ | 11.17 | | |
CLASS C: | |
Net Assets | | $ | 4,890 | | |
| Shares Outstanding (unlimited number of shares authorized, no par value) (not in 000's) | | | 440,402 | | |
Net Asset Value, Offering and Redemption Price Per Share | | $ | 11.10 | | |
(1) Including: | |
Securities on Loan, at Value: | | $ | 7,858 | | |
@ Amount is less than $500.
The accompanying notes are an integral part of the financial statements.
17
Morgan Stanley Institutional Fund Trust
Annual Report — September 30, 2017
Core Plus Fixed Income Portfolio
Statement of Operations | | Year Ended
September 30, 2017
(000) | |
Investment Income: | |
Interest from Securities of Unaffiliated Issuers (Net of $10 of Foreign Taxes Withheld) | | $ | 9,131 | | |
Dividends from Security of Affiliated Issuer (Note G) | | | 232 | | |
Income from Securities Loaned — Net | | | 26 | | |
Total Investment Income | | | 9,389 | | |
Expenses: | |
Advisory Fees (Note B) | | | 1,055 | | |
Sub Transfer Agency Fees — Class I | | | 232 | | |
Sub Transfer Agency Fees — Class A | | | 58 | | |
Sub Transfer Agency Fees — Class L | | | — | @ | |
Sub Transfer Agency Fees — Class C | | | 2 | | |
Administration Fees (Note C) | | | 225 | | |
Shareholder Services Fees — Class A (Note D) | | | 110 | | |
Distribution and Shareholder Services Fees — Class L (Note D) | | | 5 | | |
Distribution and Shareholder Services Fees — Class C (Note D) | | | 42 | | |
Professional Fees | | | 154 | | |
Registration Fees | | | 77 | | |
Custodian Fees (Note F) | | | 67 | | |
Shareholder Reporting Fees | | | 55 | | |
Pricing Fees | | | 55 | | |
Transfer Agency Fees — Class I (Note E) | | | 6 | | |
Transfer Agency Fees — Class A (Note E) | | | 4 | | |
Transfer Agency Fees — Class L (Note E) | | | 2 | | |
Transfer Agency Fees — Class C (Note E) | | | 3 | | |
Trustees' Fees and Expenses | | | 10 | | |
Other Expenses | | | 59 | | |
Total Expenses | | | 2,221 | | |
Waiver of Advisory Fees (Note B) | | | (576 | ) | |
Reimbursement of Class Specific Expenses — Class I (Note B) | | | (239 | ) | |
Reimbursement of Class Specific Expenses — Class A (Note B) | | | (18 | ) | |
Reimbursement of Class Specific Expenses — Class L (Note B) | | | (1 | ) | |
Reimbursement of Class Specific Expenses — Class C (Note B) | | | (1 | ) | |
Rebate from Morgan Stanley Affiliate (Note G) | | | (60 | ) | |
Net Expenses | | | 1,326 | | |
Net Investment Income | | | 8,063 | | |
Realized Gain (Loss): | |
Investments Sold | | | (256 | ) | |
Foreign Currency Forward Exchange Contracts | | | (440 | ) | |
Foreign Currency Transactions | | | (78 | ) | |
Futures Contracts | | | 482 | | |
Swap Agreements | | | (174 | ) | |
Net Realized Loss | | | (466 | ) | |
Change in Unrealized Appreciation (Depreciation): | |
Investments (Net of Increase in Deferred Capital Gain Country Tax of $10) | | | (1 | ) | |
Foreign Currency Forward Exchange Contracts | | | 23 | | |
Foreign Currency Translations | | | 9 | | |
Futures Contracts | | | (347 | ) | |
Swap Agreements | | | (52 | ) | |
Net Change in Unrealized Appreciation (Depreciation) | | | (368 | ) | |
Net Realized Loss and Change in Unrealized Appreciation (Depreciation) | | | (834 | ) | |
Net Increase in Net Assets Resulting from Operations | | $ | 7,229 | | |
@ Amount is less than $500.
The accompanying notes are an integral part of the financial statements.
18
Morgan Stanley Institutional Fund Trust
Annual Report — September 30, 2017
Core Plus Fixed Income Portfolio
Statements of Changes in Net Assets | | Year Ended
September 30, 2017
(000) | | Year Ended
September 30, 2016
(000) | |
Increase (Decrease) in Net Assets: | |
Operations: | |
Net Investment Income | | $ | 8,063 | | | $ | 6,334 | | |
Net Realized Gain (Loss) | | | (466 | ) | | | 14,178 | | |
Net Change in Unrealized Appreciation (Depreciation) | | | (368 | ) | | | 5,082 | | |
Net Increase in Net Assets Resulting from Operations | | | 7,229 | | | | 25,594 | | |
Distributions from and/or in Excess of: | |
Class I: | |
Net Investment Income | | | (6,968 | ) | | | (7,381 | ) | |
Class A: | |
Net Investment Income | | | (1,021 | ) | | | (245 | ) | |
Class L: | |
Net Investment Income | | | (26 | ) | | | (12 | ) | |
Class C: | |
Net Investment Income | | | (89 | ) | | | (25 | ) | |
Total Distributions | | | (8,104 | ) | | | (7,663 | ) | |
Capital Share Transactions:(1) | |
Class I: | |
Subscribed | | | 145,610 | | | | 49,744 | | |
Distributions Reinvested | | | 6,832 | | | | 7,372 | | |
Redeemed | | | (79,520 | ) | | | (76,546 | ) | |
Class A: | |
Subscribed | | | 68,634 | | | | 26,992 | | |
Distributions Reinvested | | | 1,021 | | | | 245 | | |
Redeemed | | | (32,914 | ) | | | (8,071 | ) | |
Class L: | |
Exchanged | | | 329 | | | | 517 | | |
Distributions Reinvested | | | 26 | | | | 11 | | |
Redeemed | | | (62 | ) | | | (70 | ) | |
Class C: | |
Subscribed | | | 2,739 | | | | 3,299 | | |
Distributions Reinvested | | | 87 | | | | 24 | | |
Redeemed | | | (1,463 | ) | | | (24 | ) | |
Net Increase in Net Assets Resulting from Capital Share Transactions | | | 111,319 | | | | 3,493 | | |
Total Increase in Net Assets | | | 110,444 | | | | 21,424 | | |
Net Assets: | |
Beginning of Period | | | 222,416 | | | | 200,992 | | |
End of Period (Including Accumulated Undistributed Net Investment Income of $1,537 and $2,646) | | $ | 332,860 | | | $ | 222,416 | | |
(1) Capital Share Transactions: | |
Class I: | |
Shares Subscribed | | | 13,189 | | | | 4,712 | | |
Shares Issued on Distributions Reinvested | | | 627 | | | | 721 | | |
Shares Redeemed | | | (7,289 | ) | | | (7,510 | ) | |
Net Increase (Decrease) in Class I Shares Outstanding | | | 6,527 | | | | (2,077 | ) | |
Class A: | |
Shares Subscribed | | | 6,217 | | | | 2,520 | | |
Shares Issued on Distributions Reinvested | | | 94 | | | | 23 | | |
Shares Redeemed | | | (3,009 | ) | | | (749 | ) | |
Net Increase in Class A Shares Outstanding | | | 3,302 | | | | 1,794 | | |
Class L: | |
Shares Exchanged | | | 30 | | | | 48 | | |
Shares Issued on Distributions Reinvested | | | 2 | | | | 1 | | |
Shares Redeemed | | | (5 | ) | | | (7 | ) | |
Net Increase in Class L Shares Outstanding | | | 27 | | | | 42 | | |
Class C: | |
Shares Subscribed | | | 250 | | | | 311 | | |
Shares Issued on Distributions Reinvested | | | 8 | | | | 2 | | |
Shares Redeemed | | | (134 | ) | | | (2 | ) | |
Net Increase in Class C Shares Outstanding | | | 124 | | | | 311 | | |
The accompanying notes are an integral part of the financial statements.
19
Morgan Stanley Institutional Fund Trust
Annual Report — September 30, 2017
Financial Highlights
Core Plus Fixed Income Portfolio
| | | Class I | |
| | | Year Ended September 30, | |
Selected Per Share Data and Ratios | | 2017 | | 2016(1) | | 2015 | | 2014 | | 2013 | |
Net Asset Value, Beginning of Period | | $ | 11.22 | | | $ | 10.18 | | | $ | 10.36 | | | $ | 9.91 | | | $ | 10.48 | | |
Income (Loss) from Investment Operations: | |
Net Investment Income(2) | | | 0.32 | | | | 0.34 | | | | 0.33 | | | | 0.31 | | | | 0.32 | | |
Net Realized and Unrealized Gain (Loss) | | | (0.02 | ) | | | 1.11 | | | | (0.20 | ) | | | 0.45 | | | | (0.36 | ) | |
Total from Investment Operations | | | 0.30 | | | | 1.45 | | | | 0.13 | | | | 0.76 | | | | (0.04 | ) | |
Distributions from and/or in Excess of: | |
Net Investment Income | | | (0.35 | ) | | | (0.41 | ) | | | (0.31 | ) | | | (0.31 | ) | | | (0.53 | ) | |
Net Asset Value, End of Period | | $ | 11.17 | | | $ | 11.22 | | | $ | 10.18 | | | $ | 10.36 | | | $ | 9.91 | | |
Total Return(3) | | | 2.79 | %(4) | | | 14.80 | %(5) | | | 1.15 | % | | | 7.82 | % | | | (0.42 | )% | |
Ratios and Supplemental Data: | |
Net Assets, End of Period (Thousands) | | $ | 265,958 | | | $ | 193,976 | | | $ | 197,057 | | | $ | 192,868 | | | $ | 187,014 | | |
Ratio of Expenses to Average Net Assets(10) | | | 0.40 | %(6) | | | 0.43 | %(6)(7) | | | 0.51 | %(6)(8) | | | 0.61 | %(6) | | | 0.71 | %(6)(9) | |
Ratio of Net Investment Income to Average Net Assets(10) | | | 2.94 | %(6) | | | 3.31 | %(6)(7) | | | 3.24 | %(6)(8) | | | 3.02 | %(6) | | | 3.14 | %(6)(9) | |
Ratio of Rebate from Morgan Stanley Affiliates to Average Net Assets | | | 0.02 | % | | | 0.01 | % | | | 0.01 | % | | | 0.01 | % | | | 0.01 | % | |
Portfolio Turnover Rate | | | 350 | % | | | 262 | % | | | 348 | % | | | 296 | % | | | 226 | % | |
(10) Supplemental Information on the Ratios to Average Net Assets: | |
Ratios Before Expense Limitation: | |
Expenses to Average Net Assets | | | 0.73 | % | | | 0.74 | % | | | 0.73 | % | | | 0.81 | % | | | 0.73 | % | |
Net Investment Income to Average Net Assets | | | 2.61 | % | | | 3.00 | % | | | 3.02 | % | | | 2.82 | % | | | 3.12 | % | |
(1) Reflects prior period custodian out-of-pocket expenses that were reimbursed in September 2016. The amount of the reimbursement was immaterial on a per share basis and did not impact the total return of Class I shares. The Ratio of Expenses to Average Net Assets and the Ratio of Net Investment Income to Average Net Assets would be unchanged as the reimbursement of custodian fees was offset against expense waivers/reimbursements with no impact to net expenses or net investment income.
(2) Per share amount is based on average shares outstanding.
(3) Calculated based on the net asset value as of the last business day of the period.
(4) Performance was positively impacted by approximately 0.46% due to the receipt of proceeds from the settlement of class action suits involving the Fund's past holdings. These were one-time settlements, and as a result, the impact on the NAV and consequently the performance will not likely be repeated in the future. Had these settlements not occurred, the total return for Class I shares would have been approximately 2.33%.
(5) Performance was positively impacted by approximately 7.72% due to the receipt of proceeds from the settlement of class action suits involving the Fund's past holdings. These were one-time settlements, and as a result, the impact on the NAV and consequently the performance will not likely be repeated in the future. Had these settlements not occurred, the total return for Class I shares would have been approximately 7.08%.
(6) The Ratios of Expenses and Net Investment Income reflect the rebate of certain Fund expenses in connection with the investments in Morgan Stanley affiliates during the period. The effect of the rebate on the ratios is disclosed in the above table as "Ratio of Rebate from Morgan Stanley Affiliates to Average Net Assets."
(7) Effective January 4, 2016, the Adviser has agreed to limit the ratio of expenses to average net assets to the maximum ratio of 0.42% for Class I shares. Prior to January 4, 2016, the maximum ratio was 0.52% for Class I shares.
(8) Effective October 6, 2014, the Adviser has agreed to limit the ratio of expenses to average net assets to the maximum ratio of 0.52% for Class I shares. Prior to October 6, 2014, the maximum ratio was 0.62% for Class I shares.
(9) Effective September 16, 2013, the Adviser has agreed to limit the ratio of expenses to average net assets to the maximum ratio of 0.62% for Class I shares.
The accompanying notes are an integral part of the financial statements.
20
Morgan Stanley Institutional Fund Trust
Annual Report — September 30, 2017
Financial Highlights
Core Plus Fixed Income Portfolio
| | | Class A | |
| | | Year Ended September 30, | |
Selected Per Share Data and Ratios | | 2017 | | 2016(1) | | 2015 | | 2014 | | 2013 | |
Net Asset Value, Beginning of Period | | $ | 11.23 | | | $ | 10.19 | | | $ | 10.37 | | | $ | 9.93 | | | $ | 10.50 | | |
Income (Loss) from Investment Operations: | |
Net Investment Income(2) | | | 0.28 | | | | 0.30 | | | | 0.30 | | | | 0.27 | | | | 0.29 | | |
Net Realized and Unrealized Gain (Loss) | | | (0.02 | ) | | | 1.12 | | | | (0.21 | ) | | | 0.45 | | | | (0.36 | ) | |
Total from Investment Operations | | | 0.26 | | | | 1.42 | | | | 0.09 | | | | 0.72 | | | | (0.07 | ) | |
Distributions from and/or in Excess of: | |
Net Investment Income | | | (0.31 | ) | | | (0.38 | ) | | | (0.27 | ) | | | (0.28 | ) | | | (0.50 | ) | |
Net Asset Value, End of Period | | $ | 11.18 | | | $ | 11.23 | | | $ | 10.19 | | | $ | 10.37 | | | $ | 9.93 | | |
Total Return(3) | | | 2.43 | %(4) | | | 14.31 | %(5) | | | 0.90 | % | | | 7.35 | % | | | (0.68 | )% | |
Ratios and Supplemental Data: | |
Net Assets, End of Period (Thousands) | | $ | 60,874 | | | $ | 24,071 | | | $ | 3,553 | | | $ | 2,941 | | | $ | 3,152 | | |
Ratio of Expenses to Average Net Assets(10) | | | 0.75 | %(6) | | | 0.76 | %(6)(7) | | | 0.86 | %(6)(8) | | | 0.96 | %(6) | | | 0.96 | %(6)(9) | |
Ratio of Net Investment Income to Average Net Assets(10) | | | 2.58 | %(6) | | | 2.82 | %(6)(7) | | | 2.87 | %(6)(8) | | | 2.67 | %(6) | | | 2.89 | %(6)(9) | |
Ratio of Rebate from Morgan Stanley Affiliates to Average Net Assets | | | 0.02 | % | | | 0.02 | % | | | 0.01 | % | | | 0.01 | % | | | 0.01 | % | |
Portfolio Turnover Rate | | | 350 | % | | | 262 | % | | | 348 | % | | | 296 | % | | | 226 | % | |
(10) Supplemental Information on the Ratios to Average Net Assets: | |
Ratios Before Expense Limitation: | |
Expenses to Average Net Assets | | | 1.02 | % | | | 1.15 | % | | | 1.07 | % | | | 1.11 | % | | | 0.98 | % | |
Net Investment Income to Average Net Assets | | | 2.31 | % | | | 2.43 | % | | | 2.66 | % | | | 2.52 | % | | | 2.87 | % | |
(1) Reflects prior period custodian out-of-pocket expenses that were reimbursed in September 2016. The amount of the reimbursement was immaterial on a per share basis and did not impact the total return of Class A shares. The Ratio of Expenses to Average Net Assets and the Ratio of Net Investment Income to Average Net Assets would be unchanged as the reimbursement of custodian fees was offset against expense waivers/reimbursements with no impact to net expenses or net investment income.
(2) Per share amount is based on average shares outstanding.
(3) Calculated based on the net asset value which does not reflect sales charges, if applicable, as of the last business day of the period.
(4) Performance was positively impacted by approximately 0.46% due to the receipt of proceeds from the settlement of class action suit involving the Fund's past holdings. This was a one-time settlement, and as a result, the impact on the NAV and consequently the performance will not likely be repeated in the future. Had these settlements not occurred, the total return for Class A shares would have been approximately 1.97%.
(5) Performance was positively impacted by approximately 7.76% due to the receipt of proceeds from the settlement of class action suits involving the Fund's past holdings. These were one-time settlements, and as a result, the impact on the NAV and consequently the performance will not likely be repeated in the future. Had these settlements not occurred, the total return for Class A shares would have been approximately 6.55%.
(6) The Ratios of Expenses and Net Investment Income reflect the rebate of certain Fund expenses in connection with the investments in Morgan Stanley affiliates during the period. The effect of the rebate on the ratios is disclosed in the above table as "Ratio of Rebate from Morgan Stanley Affiliates to Average Net Assets."
(7) Effective January 4, 2016, the Adviser has agreed to limit the ratio of expenses to average net assets to the maximum ratio of 0.77% for Class A shares. Prior to January 4, 2016, the maximum ratio was 0.87% for Class A shares.
(8) Effective October 6, 2014, the Adviser has agreed to limit the ratio of expenses to average net assets to the maximum ratio of 0.87% for Class A shares. Prior to October 6, 2014, the maximum ratio was 0.97% for Class A shares.
(9) Effective September 16, 2013, the Adviser has agreed to limit the ratio of expenses to average net assets to the maximum ratio of 0.97% for Class A shares.
The accompanying notes are an integral part of the financial statements.
21
Morgan Stanley Institutional Fund Trust
Annual Report — September 30, 2017
Financial Highlights
Core Plus Fixed Income Portfolio
| | | Class L | |
| | | Year Ended September 30, | |
Selected Per Share Data and Ratios | | 2017 | | 2016(1) | | 2015 | | 2014 | | 2013 | |
Net Asset Value, Beginning of Period | | $ | 11.23 | | | $ | 10.18 | | | $ | 10.37 | | | $ | 9.92 | | | $ | 10.49 | | |
Income (Loss) from Investment Operations: | |
Net Investment Income(2) | | | 0.26 | | | | 0.28 | | | | 0.27 | | | | 0.25 | | | | 0.27 | | |
Net Realized and Unrealized Gain (Loss) | | | (0.03 | ) | | | 1.12 | | | | (0.21 | ) | | | 0.45 | | | | (0.36 | ) | |
Total from Investment Operations | | | 0.23 | | | | 1.40 | | | | 0.06 | | | | 0.70 | | | | (0.09 | ) | |
Distributions from and/or in Excess of: | |
Net Investment Income | | | (0.29 | ) | | | (0.35 | ) | | | (0.25 | ) | | | (0.25 | ) | | | (0.48 | ) | |
Net Asset Value, End of Period | | $ | 11.17 | | | $ | 11.23 | | | $ | 10.18 | | | $ | 10.37 | | | $ | 9.92 | | |
Total Return(3) | | | 2.16 | %(4) | | | 14.10 | %(5) | | | 0.59 | % | | | 7.19 | % | | | (0.95 | )% | |
Ratios and Supplemental Data: | |
Net Assets, End of Period (Thousands) | | $ | 1,138 | | | $ | 841 | | | $ | 333 | | | $ | 108 | | | $ | 88 | | |
Ratio of Expenses to Average Net Assets(10) | | | 1.00 | %(6) | | | 1.03 | %(6)(7) | | | 1.11 | %(6)(8) | | | 1.21 | %(6) | | | 1.21 | %(6)(9) | |
Ratio of Net Investment Income to Average Net Assets(10) | | | 2.37 | %(6) | | | 2.65 | %(6)(7) | | | 2.65 | %(6)(8) | | | 2.42 | %(6) | | | 2.64 | %(6)(9) | |
Ratio of Rebate from Morgan Stanley Affiliates to Average Net Assets | | | 0.02 | % | | | 0.01 | % | | | 0.02 | % | | | 0.01 | % | | | 0.01 | % | |
Portfolio Turnover Rate | | | 350 | % | | | 262 | % | | | 348 | % | | | 296 | % | | | 226 | % | |
(10) Supplemental Information on the Ratios to Average Net Assets: | |
Ratios Before Expense Limitation: | |
Expenses to Average Net Assets | | | 1.35 | % | | | 1.82 | % | | | 1.76 | % | | | 3.10 | % | | | 1.27 | % | |
Net Investment Income to Average Net Assets | | | 2.02 | % | | | 1.86 | % | | | 2.00 | % | | | 0.53 | % | | | 2.58 | % | |
(1) Reflects prior period custodian out-of-pocket expenses that were reimbursed in September 2016. The amount of the reimbursement was immaterial on a per share basis and did not impact the total return of Class L shares. The Ratio of Expenses to Average Net Assets and the Ratio of Net Investment Income to Average Net Assets would be unchanged as the reimbursement of custodian fees was offset against expense waivers/reimbursements with no impact to net expenses or net investment income.
(2) Per share amount is based on average shares outstanding.
(3) Calculated based on the net asset value as of the last business day of the period.
(4) Performance was positively impacted by approximately 0.46% due to the receipt of proceeds from the settlement of class action suits involving the Fund's past holdings. These were one-time settlements, and as a result, the impact on the NAV and consequently the performance will not likely be repeated in the future. Had these settlements not occurred, the total return for Class L shares would have been approximately 1.70%.
(5) Performance was positively impacted by approximately 7.76% due to the receipt of proceeds from the settlement of class action suits involving the Fund's past holdings. These were one-time settlements, and as a result, the impact on the NAV and consequently the performance will not likely be repeated in the future. Had these settlements not occurred, the total return for Class L shares would have been approximately 6.34%.
(6) The Ratios of Expenses and Net Investment Income reflect the rebate of certain Fund expenses in connection with the investments in Morgan Stanley affiliates during the period. The effect of the rebate on the ratios is disclosed in the above table as "Ratio of Rebate from Morgan Stanley Affiliates to Average Net Assets."
(7) Effective January 4, 2016, the Adviser has agreed to limit the ratio of expenses to average net assets to the maximum ratio of 1.02% for Class L shares. Prior to January 4, 2016, the maximum ratio was 1.12% for Class L shares.
(8) Effective October 6, 2014, the Adviser has agreed to limit the ratio of expenses to average net assets to the maximum ratio of 1.12% for Class L shares. Prior to October 6, 2014, the maximum ratio was 1.22% for Class L shares.
(9) Effective September 16, 2013, the Adviser has agreed to limit the ratio of expenses to average net assets to the maximum ratio of 1.22% for Class L shares.
The accompanying notes are an integral part of the financial statements.
22
Morgan Stanley Institutional Fund Trust
Annual Report — September 30, 2017
Financial Highlights
Core Plus Fixed Income Portfolio
| | | Class C | |
| | | Year Ended September 30, | | Period from
April 30, 2015(2) to | |
Selected Per Share Data and Ratios | | 2017 | | 2016(1) | | September 30, 2015 | |
Net Asset Value, Beginning of Period | | $ | 11.17 | | | $ | 10.16 | | | $ | 10.44 | | |
Income (Loss) from Investment Operations: | |
Net Investment Income(3) | | | 0.20 | | | | 0.22 | | | | 0.10 | | |
Net Realized and Unrealized Gain (Loss) | | | (0.03 | ) | | | 1.12 | | | | (0.31 | ) | |
Total from Investment Operations | | | 0.17 | | | | 1.34 | | | | (0.21 | ) | |
Distributions from and/or in Excess of: | |
Net Investment Income | | | (0.24 | ) | | | (0.33 | ) | | | (0.07 | ) | |
Net Asset Value, End of Period | | $ | 11.10 | | | $ | 11.17 | | | $ | 10.16 | | |
Total Return(4) | | | 1.57 | %(5) | | | 13.52 | %(6) | | | (2.02 | )%(9) | |
Ratios and Supplemental Data: | |
Net Assets, End of Period (Thousands) | | $ | 4,890 | | | $ | 3,528 | | | $ | 49 | | |
Ratio of Expenses to Average Net Assets(11) | | | 1.50 | %(7) | | | 1.51 | %(7)(8) | | | 1.61 | %(7)(10) | |
Ratio of Net Investment Income to Average Net Assets(11) | | | 1.86 | %(7) | | | 2.04 | %(7)(8) | | | 2.23 | %(7)(10) | |
Ratio of Rebate from Morgan Stanley Affiliates to Average Net Assets | | | 0.02 | % | | | 0.02 | % | | | 0.01 | %(10) | |
Portfolio Turnover Rate | | | 350 | % | | | 262 | % | | | 348 | %(9) | |
(11) Supplemental Information on the Ratios to Average Net Assets: | |
Ratios Before Expense Limitation: | |
Expenses to Average Net Assets | | | 1.74 | % | | | 2.00 | % | | | 14.06 | %(10) | |
Net Investment Income (Loss) to Average Net Assets | | | 1.62 | % | | | 1.55 | % | | | (10.22 | )%(10) | |
(1) Reflects prior period custodian out-of-pocket expenses that were reimbursed in September 2016. The amount of the reimbursement was immaterial on a per share basis and did not impact the total return of Class C shares. The Ratio of Expenses to Average Net Assets and the Ratio of Net Investment Income to Average Net Assets would be unchanged as the reimbursement of custodian fees was offset against expense waivers/reimbursements with no impact to net expenses or net investment income.
(2) Commencement of Offering.
(3) Per share amount is based on average shares outstanding.
(4) Calculated based on the net asset value which does not reflect sales charges, if applicable, as of the last business day of the period.
(5) Performance was positively impacted by approximately 0.46% due to the receipt of proceeds from the settlement of class action suit involving the Fund's past holdings. This was a one-time settlement, and as a result, the impact on the NAV and consequently the performance will not likely be repeated in the future. Had these settlements not occurred, the total return for Class C shares would have been approximately 1.11%.
(6) Performance was positively impacted by approximately 7.75% due to the receipt of proceeds from the settlement of class action suits involving the Fund's past holdings. These were one-time settlements, and as a result, the impact on the NAV and consequently the performance will not likely be repeated in the future. Had these settlements not occurred, the total return for Class C shares would have been approximately 5.77%.
(7) The Ratios of Expenses and Net Investment Income reflect the rebate of certain Fund expenses in connection with the investments in Morgan Stanley affiliates during the period. The effect of the rebate on the ratios is disclosed in the above table as "Ratio of Rebate from Morgan Stanley Affiliates to Average Net Assets."
(8) Effective January 4, 2016, the Adviser has agreed to limit the ratio of expenses to average net assets to the maximum ratio of 1.52% for Class C shares. Prior to January 4, 2016, the maximum ratio was 1.62% for Class C shares.
(9) Not annualized.
(10) Annualized.
The accompanying notes are an integral part of the financial statements.
23
Morgan Stanley Institutional Fund Trust
Annual Report — September 30, 2017
Notes to Financial Statements
Morgan Stanley Institutional Fund Trust ("Trust'') is registered under the Investment Company Act of 1940, as amended (the "Act''), as an open-end management investment company. The Trust is comprised of nine separate, active funds (individually referred to as a "Fund", collectively as the "Funds"). The Trust applies investment company accounting and reporting guidance. All Funds are considered diversified for purposes of the Act.
The accompanying financial statements relate to the Core Plus Fixed Income Portfolio. The Fund seeks above-average total return over a market cycle of three to five years. The Fund offers four classes of shares — Class I, Class A, Class L and Class C.
The Fund has suspended offering Class L shares for sale to all investors. Class L shareholders of the Fund do not have the option of purchasing additional Class L shares. However, existing Class L shareholders may invest in additional Class L shares through reinvestment of dividends and distributions.
A. Significant Accounting Policies: The following significant accounting policies are in conformity with U.S. generally accepted accounting principles ("GAAP"). Such policies are consistently followed by the Trust in the preparation of its financial statements. GAAP may require management to make estimates and assumptions that affect the reported amounts and disclosures in the financial statements. Actual results may differ from those estimates.
1. Security Valuation: (1) Certain portfolio securities may be valued by an outside pricing service/vendor approved by the Trust's Board of Trustees (the "Trustees"). The pricing service/vendor may employ a pricing model that takes into account, among other things, bids, yield spreads, and/or other market data and specific security characteristics. Alternatively, if a valuation is not available from an outside pricing service/vendor, and the security trades on an exchange, the security may be valued at its latest reported sale price (or at the exchange official closing price if such exchange reports an official closing price), prior to the time when assets are valued. If there are no sales on a given day and if there is no official exchange closing price for that day, the security is valued at the mean between the last reported bid and asked prices if such bid and asked prices are available in the relevant exchanges; (2) futures are valued at the settlement price on the exchange on which they trade or, if a settlement price is unavailable, at the last sale price on the exchange; (3) over-the-counter ("OTC") swaps may be valued by an outside pricing serv-
ice approved by the Trustees or quotes from a broker or dealer. Swaps cleared on a clearinghouse or exchange may be valued using the closing price provided by the clearinghouse or exchange; (4) when market quotations are not readily available, including circumstances under which Morgan Stanley Investment Management Inc. (the "Adviser") determines that the closing price, last sale price or the mean between the last reported bid and asked prices are not reflective of a security's market value, portfolio securities are valued at their fair value as determined in good faith under procedures established by and under the general supervision of the Trustees. Occasionally, developments affecting the closing prices of securities and other assets may occur between the times at which valuations of such securities are determined (that is, close of the foreign market on which the securities trade) and the close of business of the New York Stock Exchange ("NYSE"). If developments occur during such periods that are expected to materially affect the value of such securities, such valuations may be adjusted to reflect the estimated fair value of such securities as of the close of the NYSE, as determined in good faith by the Trustees or by the Adviser using a pricing service and/or procedures approved by the Trustees; (5) quotations of foreign portfolio securities, other assets and liabilities and forward contracts stated in foreign currency are translated into U.S. dollar equivalents at the prevailing market rates prior to the close of the NYSE; and (6) investments in mutual funds, including the Morgan Stanley Institutional Liquidity Funds, are valued at the net asset value ("NAV") as of the close of each business day.
The Trustees have responsibility for determining in good faith the fair value of the investments, and the Trustees may appoint others, such as the Trust's Adviser or a valuation committee, to assist the Trustees in determining fair value and to make the actual calculations pursuant to the fair valuation methodologies previously approved by the Trustees. Under procedures approved by the Trustees, the Trust's Adviser has formed a Valuation Committee whose members are approved by the Trustees. The Valuation Committee provides administration and oversight of the Trust's valuation policies and procedures, which are reviewed at least annually by the Trustees. These procedures allow the Trust to utilize independent pricing services, quotations from securities
24
Morgan Stanley Institutional Fund Trust
Annual Report — September 30, 2017
Notes to Financial Statements (cont'd)
and financial instrument dealers, and other market sources to determine fair value.
The Trust has procedures to determine the fair value of securities and other financial instruments for which market prices are not readily available. Under these procedures, the Valuation Committee convenes on a regular and ad hoc basis to review such securities and considers a number of factors, including valuation methodologies and significant unobservable valuation inputs, when arriving at fair value. The Valuation Committee may employ a market-based approach which may use related or comparable assets or liabilities, recent transactions, market multiples, book values, and other relevant information for the investment to determine the fair value of the investment. An income-based valuation approach may also be used in which the anticipated future cash flows of the investment are discounted to calculate fair value. Discounts may also be applied due to the nature or duration of any restrictions on the disposition of the investments. Due to the inherent uncertainty of valuations of such investments, the fair values may differ significantly from the values that would have been used had an active market existed. The Valuation Committee employs various methods for calibrating these valuation approaches including a regular review of valuation methodologies, key inputs and assumptions, transactional back-testing or disposition analysis, and reviews of any related market activity.
2. Fair Value Measurement: Financial Accounting Standards Board ("FASB") Accounting Standards CodificationTM ("ASC") 820, "Fair Value Measurement" ("ASC 820"), defines fair value as the value that the Fund would receive to sell an investment or pay to transfer a liability in a timely transaction with an independent buyer in the principal market, or in the absence of a principal market, the most advantageous market for the investment or liability. ASC 820 establishes a three-tier hierarchy to distinguish between (1) inputs that reflect the assumptions market participants would use in valuing an asset or liability developed based on market data obtained from sources independent of the reporting entity (observable inputs) and (2) inputs that reflect the reporting entity's own assumptions about the assumptions market participants would use in valuing an asset or liability developed based on the best information available in the circumstances (unobservable inputs) and to establish classification of fair
value measurements for disclosure purposes. Various inputs are used in determining the value of the Fund's investments. The inputs are summarized in the three broad levels listed below.
• Level 1 – unadjusted quoted prices in active markets for identical investments
• Level 2 – other significant observable inputs (including quoted prices for similar investments, interest rates, prepayment speeds, credit risk, etc.)
• Level 3 – significant unobservable inputs including the Fund's own assumptions in determining the fair value of investments. Factors considered in making this determination may include, but are not limited to, information obtained by contacting the issuer, analysts, or the appropriate stock exchange (for exchange-traded securities), analysis of the issuer's financial statements or other available documents and, if necessary, available information concerning other securities in similar circumstances
The inputs or methodology used for valuing securities are not necessarily an indication of the risk associated with investing in those securities and the determination of the significance of a particular input to the fair value measurement in its entirety requires judgment and considers factors specific to each security.
The following is a summary of the inputs used to value the Fund's investments as of September 30, 2017.
Investment Type | | Level 1
Unadjusted
quoted
prices
(000) | | Level 2
Other
significant
observable
inputs
(000) | | Level 3
Significant
unobservable
inputs
(000) | | Total
(000) | |
Assets: | |
Fixed Income Securities | |
Agency Adjustable
Rate Mortgages | | $ | — | | | $ | 175 | | | $ | — | | | $ | 175 | | |
Agency Fixed Rate
Mortgages | | | — | | | | 61,624 | | | | — | | | | 61,624 | | |
Asset-Backed Securities | | | — | | | | 22,469 | | | | — | | | | 22,469 | | |
Collateralized Mortgage
Obligations — Agency
Collateral Series | | | — | | | | 4,130 | | | | — | | | | 4,130 | | |
Commercial Mortgage-
Backed Securities | | | — | | | | 20,851 | | | | — | | | | 20,851 | | |
Corporate Bonds | | | — | | | | 110,251 | | | | — | | | | 110,251 | | |
Mortgages — Other | | | — | | | | 17,221 | | | | — | | | | 17,221 | | |
Municipal Bonds | | | — | | | | 2,441 | | | | — | | | | 2,441 | | |
25
Morgan Stanley Institutional Fund Trust
Annual Report — September 30, 2017
Notes to Financial Statements (cont'd)
Investment Type | | Level 1
Unadjusted
quoted
prices
(000) | | Level 2
Other
significant
observable
inputs
(000) | | Level 3
Significant
unobservable
inputs
(000) | | Total
(000) | |
Fixed Income Securities (cont'd) | |
Sovereign | | $ | — | | | $ | 18,723 | | | $ | — | | | $ | 18,723 | | |
U.S. Agency Securities | | | — | | | | 2,061 | | | | — | | | | 2,061 | | |
U.S. Treasury Securities | | | — | | | | 38,882 | | | | — | | | | 38,882 | | |
Total Fixed Income
Securities | | | — | | | | 298,828 | | | | — | | | | 298,828 | | |
Short-Term Investments | |
Investment Company | | | 66,270 | | | | — | | | | — | | | | 66,270 | | |
U.S. Treasury Securities | | | — | | | | 797 | | | | — | | | | 797 | | |
Total Short-Term
Investments | | | 66,270 | | | | 797 | | | | — | | | | 67,067 | | |
Foreign Currency
Forward Exchange
Contracts | | | — | | | | 251 | | | | — | | | | 251 | | |
Futures Contracts | | | 200 | | | | — | | | | — | | | | 200 | | |
Interest Rate Swap
Agreements | | | — | | | | 41 | | | | — | | | | 41 | | |
Total Assets | | | 66,470 | | | | 299,917 | | | | — | | | | 366,387 | | |
Liabilities: | |
Foreign Currency
Forward Exchange
Contracts | | | — | | | | (133 | ) | | | — | | | | (133 | ) | |
Futures Contracts | | | (750 | ) | | | — | | | | — | | | | (750 | ) | |
Credit Default Swap
Agreements | | | — | | | | (118 | ) | | | — | | | | (118 | ) | |
Interest Rate Swap
Agreements | | | — | | | | (108 | ) | | | — | | | | (108 | ) | |
Total Liabilities | | | (750 | ) | | | (359 | ) | | | — | | | | (1,109 | ) | |
Total | | $ | 65,720 | | | $ | 299,558 | | | $ | — | | | $ | 365,278 | | |
Transfers between investment levels may occur as the markets fluctuate and/or the availability of data used in an investment's valuation changes. The Fund recognizes transfers between the levels as of the end of the period. As of September 30, 2017, the Fund did not have any investments transfer between investment levels.
3. Foreign Currency Translation and Foreign Investments: The books and records of the Fund are maintained in U.S. dollars. Foreign currency amounts are translated into U.S. dollars as follows:
– investments, other assets and liabilities at the prevailing rate of exchange on the valuation date;
– investment transactions and investment income at the prevailing rates of exchange on the dates of such transactions.
Although the net assets of the Fund are presented at the foreign exchange rates and market values at the close of the period, the Fund does not isolate that portion of the results of operations arising as a result of changes in the
foreign exchange rates from the fluctuations arising from changes in the market prices of securities held at period end. Similarly, the Fund does not isolate the effect of changes in foreign exchange rates from the fluctuations arising from changes in the market prices of securities sold during the period. Accordingly, realized and unrealized foreign currency gains (losses) on investments in securities are included in the reported net realized and unrealized gains (losses) on investment transactions and balances. However, pursuant to U.S. federal income tax regulations, gains and losses from certain foreign currency transactions and the foreign currency portion of gains and losses realized on sales and maturities of foreign denominated debt securities are treated as ordinary income for U.S. federal income tax purposes.
Net realized gains (losses) on foreign currency transactions represent net foreign exchange gains (losses) from foreign currency forward exchange contracts, disposition of foreign currencies, currency gains (losses) realized between the trade and settlement dates on securities transactions, and the difference between the amount of investment income and foreign withholding taxes recorded on the Fund's books and the U.S. dollar equivalent amounts actually received or paid. Net unrealized currency gains (losses) from valuing foreign currency denominated assets and liabilities at period end exchange rates are reflected as a component of unrealized appreciation (depreciation) in the Statement of Assets and Liabilities. The change in unrealized currency gains (losses) on foreign currency translations for the period is reflected in the Statement of Operations.
Foreign security and currency transactions may involve certain considerations and risks not typically associated with those of U.S. dollar denominated transactions as a result of, among other factors, fluctuations of exchange rates in relation to the U.S. dollar, the possibility of lower levels of governmental supervision and regulation of foreign securities markets and the possibility of political or economic instability.
Governmental approval for foreign investments may be required in advance of making an investment under certain circumstances in some countries, and the extent of foreign investments in domestic companies may be subject to limitation in other countries. Foreign ownership limitations also may be imposed by the charters of individual companies to prevent, among other concerns,
26
Morgan Stanley Institutional Fund Trust
Annual Report — September 30, 2017
Notes to Financial Statements (cont'd)
violations of foreign investment limitations. As a result, an additional class of shares (identified as "Foreign" in the Portfolio of Investments) may be created and offered for investment. The "local" and "foreign shares" market values may differ. In the absence of trading of the foreign shares in such markets, the Fund values the foreign shares at the closing exchange price of the local shares.
4. Derivatives: The Fund may, but is not required to, use derivative instruments for a variety of purposes, including hedging, risk management, portfolio management or to earn income. Derivatives are financial instruments whose value is based, in part, on the value of an underlying asset, interest rate, index or financial instrument. Prevailing interest rates and volatility levels, among other things, also affect the value of derivative instruments. A derivative instrument often has risks similar to its underlying asset and may have additional risks, including imperfect correlation between the value of the derivative and the underlying asset, risks of default by the counterparty to certain transactions, magnification of losses incurred due to changes in the market value of the securities, instruments, indices or interest rates to which the derivative instrument relates, risks that the transactions may not be liquid and risks arising from margin requirements. The use of derivatives involves risks that are different from, and possibly greater than, the risks associated with other portfolio investments. Derivatives may involve the use of highly specialized instruments that require investment techniques and risk analyses different from those associated with other portfolio investments. All of the Fund's holdings, including derivative instruments, are marked-to-market each day with the change in value reflected in unrealized appreciation (depreciation). Upon disposition, a realized gain or loss is recognized.
Certain derivative transactions may give rise to a form of leverage. Leverage magnifies the potential for gain and the risk of loss. Leverage associated with derivative transactions may cause the Fund to liquidate portfolio positions when it may not be advantageous to do so to satisfy its obligations or to meet earmarking or segregation requirements, pursuant to applicable Securities and Exchange Commission ("SEC") rules and regulations, or may cause the Fund to be more volatile than if the Fund had not been leveraged. Although the Adviser seeks to use derivatives to further the Fund's investment objec-
tives, there is no assurance that the use of derivatives will achieve this result.
Following is a description of the derivative instruments and techniques that the Fund used during the period and their associated risks:
Futures: A futures contract is a standardized, exchange-traded agreement to buy or sell a specific quantity of an underlying asset, reference rate or index at a specific price at a specific future time. The value of a futures contract tends to increase and decrease in tandem with the value of the underlying instrument. Depending on the terms of the particular contract, futures contracts are settled through either physical delivery of the underlying instrument on the settlement date or by payment of a cash settlement amount on the settlement date. During the period the futures contract is open, payments are received from or made to the broker based upon changes in the value of the contract (the variation margin). A decision as to whether, when and how to use futures contracts involves the exercise of skill and judgment and even a well-conceived futures transaction may be unsuccessful because of market behavior or unexpected events. In addition to the derivatives risks discussed above, the prices of futures contracts can be highly volatile, using futures contracts can lower total return, and the potential loss from futures contracts can exceed the Fund's initial investment in such contracts. No assurance can be given that a liquid market will exist for any particular futures contract at any particular time. There is also the risk of loss by the Fund of margin deposits in the event of bankruptcy of a broker with which the Fund has open positions in the futures contract.
Swaps: The Fund may enter into OTC swap contracts or cleared swap transactions. A swap contract is an agreement between two parties pursuant to which the parties exchange payments at specified dates on the basis of a specified notional amount, with the payments calculated by reference to specified securities, indices, reference rates, currencies or other instruments. Typically swap agreements provide that when the period payment dates for both parties are the same, the payments are made on a net basis (i.e., the two payment streams are netted out, with only the net amount paid by one party to the other). The Fund's obligations or rights under a swap contract entered into on a net basis will generally be equal only to the net amount to be paid or received
27
Morgan Stanley Institutional Fund Trust
Annual Report — September 30, 2017
Notes to Financial Statements (cont'd)
under the agreement, based on the relative values of the positions held by each party. Cleared swap transactions may help reduce counterparty credit risk. In a cleared swap, the Fund's ultimate counterparty is a clearinghouse rather than a swap dealer, bank or other financial institution. OTC swap agreements are not entered into or traded on exchanges and often there is no central clearing or guaranty function for OTC swaps. These OTC swaps are often subject to credit risk or the risk of default or non-performance by the counterparty. Both OTC and cleared swaps could result in losses if interest rates, foreign currency exchange rates or other factors are not correctly anticipated by the Fund or if the reference index, security or investments do not perform as expected. During the period swap agreements are open, payments are received from or made to the clearinghouse or counterparty based upon changes in the value of the contract (variation margin). The Dodd-Frank Wall Street Reform and Consumer Protection Act and related regulatory developments require the clearing and exchange-trading of certain standardized swap transactions. Mandatory exchange-trading and clearing is occurring on a phased-in basis.
The Fund's use of swaps during the period included those based on the credit of an underlying security commonly referred to as "credit default swaps." The Fund may be either the buyer or seller in a credit default swap. Where the Fund is the buyer of a credit default swap contract, it would typically be entitled to receive the par (or other agreed-upon) value of a referenced debt obligation from the counterparty to the contract only in the event of a default or similar event by the issuer of the debt obligation. If no default occurs, the Fund would have paid to the counterparty a periodic stream of payments over the term of the contract and received no benefit from the contract. When the Fund is the seller of a credit default swap contract, it typically receives the stream of payments but is obligated to pay an amount equal to the par (or other agreed-upon) value of a referenced debt obligation upon the default or similar event by the issuer of the referenced debt obligation. The use of credit default swaps could result in losses to the Fund if the Adviser fails to correctly evaluate the creditworthiness of the issuer of the referenced debt obligation.
If the Fund is a seller of protection and a credit event occurs, as defined under the terms of that particular
swap agreement, the Fund will either (i) pay to the buyer of protection an amount equal to the notional amount of the swap agreement and take delivery of the referenced obligation, other deliverable obligations or underlying securities comprising the referenced index or (ii) pay a net settlement amount in the form of cash or securities equal to the notional amount of the swap agreement less the recovery value of the referenced obligation or underlying securities comprising the referenced index. If the Fund is a buyer of protection and a credit event occurs, as defined under the terms of that particular swap agreement, the Fund will either (i) receive from the seller of protection an amount equal to the notional amount of the swap agreement and deliver the referenced obligation, other deliverable obligations or underlying securities comprising the referenced index or (ii) receive a net settlement amount in the form of cash or securities equal to the notional amount of the swap agreement less the recovery value of the referenced obligation or underlying securities comprising the referenced index. Recovery values are estimated by market makers considering either industry standard recovery rates or entity specific factors and considerations until a credit event occurs. If a credit event has occurred, the recovery value is determined by a facilitated auction whereby a minimum number of allowable broker bids, together with a specified valuation method, are used to calculate the settlement value. The Fund's maximum risk of loss from counterparty risk, either as the protection seller or as the protection buyer, is the fair value of the swap agreement.
The current credit rating of each individual issuer is listed in the table following the Portfolio of Investments and serves as an indicator of the current status of the payment/performance risk of the credit derivative. Alternatively, for credit default swaps on an index of credits, the quoted market prices and current values serve as an indicator of the current status of the payment/performance risk of the credit derivative. Generally, lower credit ratings and increasing market values, in absolute terms, represent a deterioration of the credit and a greater likelihood of an adverse credit event of the issuer.
When the Fund has an unrealized loss on a swap agreement, the Fund has instructed the custodian to pledge cash or liquid securities as collateral with a value approximately equal to the amount of the unrealized loss.
28
Morgan Stanley Institutional Fund Trust
Annual Report — September 30, 2017
Notes to Financial Statements (cont'd)
Collateral pledges are monitored and subsequently adjusted if and when the swap valuations fluctuate. If applicable, cash collateral is included with "Due from (to) Broker" in the Statement of Assets and Liabilities.
Upfront payments paid or received by the Fund will be reflected as an asset or liability, respectively, in the Statement of Assets and Liabilities.
Foreign Currency Forward Exchange Contracts: In connection with its investments in foreign securities, the Fund also entered into contracts with banks, brokers or dealers to purchase or sell securities or foreign currencies at a future date. A foreign currency forward exchange contract ("currency contract") is a negotiated agreement between the contracting parties to exchange a specified amount of currency at a specified future time at a specified rate. The rate can be higher or lower than the spot rate between the currencies that are the subject of the contract. Currency contracts may be used to protect against uncertainty in the level of future foreign currency exchange rates or to gain or modify exposure to a particular currency. In addition, the Fund may use cross currency hedging or proxy hedging with respect to currencies in which the Fund has or expects to have portfolio or currency exposure. Cross currency hedges involve the sale of one currency against the positive exposure to a different currency and may be used for hedging purposes or to establish an active exposure to the exchange rate between any two currencies. To the extent hedged by the use of currency contracts, the precise matching of the currency contract amounts and the value of the securities involved will not generally be possible because the future value of such securities in foreign currencies will change as a consequence of market movements in the value of those securities between the date on which the contract is entered into and the date it matures. Furthermore, such transactions may reduce or preclude the opportunity for gain if the value of the currency should move in the direction opposite to the position taken. There is additional risk to the extent that currency contracts create exposure to currencies in which the Fund's securities are not denominated. Unanticipated changes in currency prices may result in poorer overall performance for the Fund than if it had not entered into such contracts. The use of currency contracts involves the risk of loss from the insolvency or bankruptcy of the counterparty to the contract or the failure of the counter-
party to make payments or otherwise comply with the terms of the contract. A currency contract is marked-to-market daily and the change in market value is recorded by the Fund as unrealized gain or loss. The Fund records realized gains (losses) when the currency contract is closed equal to the difference between the value of the currency contract at the time it was opened and the value at the time it was closed.
FASB ASC 815, "Derivatives and Hedging" ("ASC 815"), is intended to improve financial reporting about derivative instruments by requiring enhanced disclosures to enable investors to better understand how and why the Fund uses derivative instruments, how these derivative instruments are accounted for and their effects on the Fund's financial position and results of operations.
The following tables set forth the fair value of the Fund's derivative contracts by primary risk exposure as of September 30, 2017.
| | | Asset Derivatives
Statement of Assets and
Liabilities Location | | Primary Risk
Exposure | | Value
(000) | |
Foreign Currency
Forward Exchange
Contracts | | Unrealized Appreciation on
Foreign Currency Forward
Exchange Contracts | | Currency Risk | | $ | 251 | | |
Futures Contracts | | Variation Margin on
Futures Contracts | | Interest Rate Risk | | | 200 | (a) | |
Swap Agreements | | Variation Margin on
Swap Agreements | | Interest Rate Risk | | | 41 | (a) | |
Total | | | | | | $ | 492 | | |
| | | Liability Derivatives
Statement of Assets and
Liabilities Location | | Primary Risk
Exposure | | Value
(000) | |
Foreign Currency
Forward Exchange
Contracts | | Unrealized Depreciation on
Foreign Currency Forward
Exchange Contracts | | Currency Risk | | $ | (133 | ) | |
Futures Contracts | | Variation Margin on
Futures Contracts | | Interest Rate Risk | | | (750 | )(a) | |
Swap Agreements | | Unrealized Depreciation on
Swap Agreements | | Credit Risk | | | (118 | ) | |
Swap Agreements | | Variation Margin on
Swap Agreements | | Interest Rate Risk | | | (108 | )(a) | |
Total | | | | | | $ | (1,109 | ) | |
(a) This amount represents the cumulative appreciation (depreciation) as reported in the Portfolio of Investments. The Statement of Assets and Liabilities only reflects the current day's net variation margin.
The following tables set forth by primary risk exposure the Fund's realized gains (losses) and change in unrealized appreciation (depreciation) by type of derivative
29
Morgan Stanley Institutional Fund Trust
Annual Report — September 30, 2017
Notes to Financial Statements (cont'd)
contract for the year ended September 30, 2017 in accordance with ASC 815.
Realized Gain (Loss) | |
Primary Risk Exposure | | Derivative Type | | Value
(000) | |
Currency Risk
| | Foreign Currency Forward
Exchange Contracts | | $ | (440 | ) | |
Interest Rate Risk | | Futures Contracts | | | 482 | | |
Credit Risk | | Swap Agreements | | | (28 | ) | |
Interest Rate Risk | | Swap Agreements | | | (146 | ) | |
| | | Total | | $ | (132 | ) | |
Change in Unrealized Appreciation (Depreciation) | |
Primary Risk Exposure | | Derivative Type | | Value
(000) | |
Currency Risk
| | Foreign Currency Forward
Exchange Contracts | | $ | 23 | | |
Interest Rate Risk | | Futures Contracts | | | (347 | ) | |
Credit Risk | | Swap Agreements | | | 15 | | |
Interest Rate Risk | | Swap Agreements | | | (67 | ) | |
| | | Total | | $ | (376 | ) | |
At September 30, 2017, the Fund's derivative assets and liabilities are as follows:
Gross Amounts of Assets and Liabilities Presented in the
Statement of Assets and Liabilities | |
Derivatives(b) | | Assets(c)
(000) | | Liabilities(c)
(000) | |
Foreign Currency Forward Exchange Contracts | | $ | 251 | | | $ | (133 | ) | |
Swap Agreements | | | — | | | | (118 | ) | |
Total | | $ | 251 | | | $ | (251 | ) | |
(b) Excludes exchange traded derivatives.
(c) Absent an event of default or early termination, OTC derivative assets and liabilities are presented gross and not offset in the Statement of Assets and Liabilities.
The Fund typically enters into International Swaps and Derivatives Association, Inc. Master Agreements ("ISDA Master Agreements") or similar master agreements (collectively, "Master Agreements") with its contract counterparties for certain OTC derivatives in order to, among other things, reduce its credit risk to counterparties. ISDA Master Agreements include provisions for general obligations, representations, collateral and events of default or termination. Under an ISDA Master Agreement, the Fund typically may offset with the counterparty certain OTC derivative financial instruments' payables and/or receivables with collateral held and/or posted and create one single net payment (close-out netting) in the event of default, termination and/or potential deterioration in the credit quality of the counterparty. Various Master Agreements govern the terms of certain transactions with counterparties, including transactions such as swap, forward, repurchase and reverse repurchase agreements. These Master Agreements typically attempt to reduce the counterparty risk associated with such transactions by specifying credit
protection mechanisms and providing standardization that improves legal certainty. Cross-termination provisions under Master Agreements typically provide that a default in connection with one transaction between the Fund and a counterparty gives the non-defaulting party the right to terminate any other transactions in place with the defaulting party to create one single net payment due to/due from the defaulting party and may be a feature in certain Master Agreements. In the event the Fund exercises its right to terminate a Master Agreement after a counterparty experiences a termination event as defined in the Master Agreement, the return of collateral with market value in excess of the Fund's net liability may be delayed or denied.
The following tables present derivative financial instruments that are subject to enforceable netting arrangements as of September 30, 2017.
Gross Amounts Not Offset in the Statement of Assets and Liabilities | |
Counterparty | | Gross Asset
Derivatives
Presented in
Statement of
Assets and
Liabilities
(000) | | Financial
Instrument
(000) | | Collateral
Received
(000) | | Net Amount
(not less
than $0)
(000) | |
Australia and New Zealand
Banking Group | | $ | 36 | | | $ | (13 | ) | | $ | — | | | $ | 23 | | |
Barclays Bank PLC | | | 48 | | | | — | | | | — | | | | 48 | | |
Citibank NA | | | 117 | | | | — | | | | — | | | | 117 | | |
JPMorgan Chase Bank NA | | | 50 | | | | (36 | ) | | | — | | | | 14 | | |
Total | | $ | 251 | | | $ | (49 | ) | | $ | — | | | $ | 202 | | |
Gross Amounts Not Offset in the Statement of Assets and Liabilities | |
Counterparty | | Gross Liability
Derivatives
Presented in
Statement of
Assets and
Liabilities
(000) | | Financial
Instrument
(000) | | Collateral
Pledged
(000) | | Net Amount
(not less
than $0)
(000) | |
Australia and New Zealand
Banking Group | | $ | 13 | | | $ | (13 | ) | | $ | — | | | $ | 0 | | |
Barclays Bank PLC | | | 33 | | | | — | | | | — | | | | 33 | | |
Deutsche Bank AG | | | 57 | | | | — | | | | — | | | | 57 | | |
Goldman Sachs International | | | 28 | | | | — | | | | — | | | | 28 | | |
HSBC Bank PLC | | | 84 | | | | — | | | | — | | | | 84 | | |
JPMorgan Chase Bank NA | | | 36 | | | | (36 | ) | | | — | | | | 0 | | |
Total | | $ | 251 | | | $ | (49 | ) | | $ | — | | | $ | 202 | | |
30
Morgan Stanley Institutional Fund Trust
Annual Report — September 30, 2017
Notes to Financial Statements (cont'd)
For the year ended September 30, 2017, the approximate average monthly amount outstanding for each derivative type is as follows:
Foreign Currency Forward Exchange Contracts: | |
Average monthly principal amount | | $ | 51,555,000 | | |
Futures Contracts: | |
Average monthly original value | | $ | 103,475,000 | | |
Swap Agreements: | |
Average monthly notional amount | | $ | 14,741,000 | | |
5. Securities Lending: The Fund lends securities to qualified financial institutions, such as broker-dealers, to earn additional income. Any increase or decrease in the fair value of the securities loaned that might occur and any interest earned or dividends declared on those securities during the term of the loan would remain in the Fund. The Fund would receive cash or securities as collateral in an amount equal to or exceeding 100% of the current fair value of the loaned securities. The collateral is marked-to-market daily by State Street Bank and Trust Company ("State Street"), the securities lending agent, to ensure that a minimum of 100% collateral coverage is maintained.
Based on pre-established guidelines, the securities lending agent invests any cash collateral that is received in an affiliated money market portfolio and repurchase agreements. Securities lending income is generated from the earnings on the invested collateral and borrowing fees, less any rebates owed to the borrowers and compensation to the lending agent, and is recorded as "Income from Securities Loaned — Net" in the Fund's Statement of Operations. Risks in securities lending transactions are that a borrower may not provide additional collateral when required or return the securities when due, and that the value of the short-term investments will be less than the amount of cash collateral plus any rebate that is required to be returned to the borrower.
The Fund has the right under the lending agreement to recover the securities from the borrower on demand.
The following table presents financial instruments that are subject to enforceable netting arrangements as of September 30, 2017.
Gross Amounts Not Offset in the Statement of Assets and Liabilities | |
Gross Asset
Amounts
Presented in
Statement of
Assets and
Liabilities
(000) | | Financial
Instrument
(000) | | Collateral
Received
(000) | | Net Amount
(not less
than $0)
(000) | |
| $ | 7,858 | (d) | | $ | — | | | $ | (7,858 | )(e)(f) | | $ | 0 | | |
(d) Represents market value of loaned securities at period end.
(e) The Fund received cash collateral of approximately $6,005,000, which was subsequently invested in Morgan Stanley Institutional Liquidity Funds as reported in the Portfolio of Investments. In addition, the Fund received non-cash collateral of approximately $2,024,000 in the form of U.S. Government obligations, which the Fund cannot sell or repledge, and accordingly are not reflected in the Portfolio of Investments.
(f) The actual collateral received is greater than the amount shown here due to overcollateralization.
FASB ASC 860, "Transfers & Servicing: Repurchase-to-Maturity Transactions, Repurchase Financings, and Disclosures", is intended to provide increased transparency about the types of collateral pledged in securities lending transactions and other similar transactions that are accounted for as secured borrowing.
The following table displays a breakdown of transactions accounted for as secured borrowings, the gross obligations by class of collateral pledged, and the remaining contractual maturity of those transactions as of September 30, 2017.
Remaining Contractual Maturity of the Agreements | |
| | | Overnight and
Continuous
(000) | | <30 days
(000) | | Between
30 &
90 days
(000) | | >90 days
(000) | | Total
(000) | |
Securities Lending
Transactions | |
Corporate Bonds | | $ | 3,762 | | | $ | — | | | $ | — | | | $ | — | | | $ | 3,762 | | |
Sovereign | | | 194 | | | | — | | | | — | | | | — | | | | 194 | | |
U.S. Agency Securities | | | 2,049 | | | | — | | | | — | | | | — | | | | 2,049 | | |
Total | | $ | 6,005 | | | $ | — | | | $ | — | | | $ | — | | | $ | 6,005 | | |
Total Borrowings | | $ | 6,005 | | | $ | — | | | $ | — | | | $ | — | | | $ | 6,005 | | |
Gross amount of
recognized liabilities
for securities lending
transactions | | | | | | | | | | $ | 6,005 | | |
6. When-Issued/Delayed Delivery Securities: The Fund purchases and sells when-issued and delayed delivery securities. Securities purchased on a when-issued or delayed delivery basis are purchased for delivery beyond the normal settlement date at a stated price and yield, and no income accrues to the Fund on such securities prior to delivery date. Payment and delivery for when-issued and delayed delivery securities can take place a month or more after the date of the transaction. When the Fund enters
31
Morgan Stanley Institutional Fund Trust
Annual Report — September 30, 2017
Notes to Financial Statements (cont'd)
into a purchase transaction on a when-issued or delayed delivery basis, securities are available for collateral in an amount at least equal in value to the Fund's commitments to purchase such securities. Purchasing securities on a when-issued or delayed delivery basis may involve a risk that the market price at the time of delivery may be lower than the agreed upon purchase price, in which case there could be an unrealized loss at the time of delivery. Purchasing investments on a when-issued or delayed delivery basis may be considered a form of leverage which may increase the impact that gains (losses) may have on the Fund.
7. Indemnifications: The Trust enters into contracts that contain a variety of indemnifications. The Trust's maximum exposure under these arrangements is unknown. However, the Trust has not had prior claims or losses pursuant to these contracts and expects the risk of loss to be remote.
8. Dividends and Distributions to Shareholders: Dividends and distributions to shareholders are recorded on the ex-dividend date. Dividends from net investment income, if any, are declared and paid quarterly. Net realized capital gains, if any, are distributed at least annually.
9. Security Transactions, Income and Expenses: Security transactions are accounted for on the trade date (date the order to buy or sell is executed). Realized gains and losses on the sale of investment securities are determined on the specific identified cost method. Dividend income and other distributions are recorded on the ex-dividend date (except for certain foreign dividends which may be recorded as soon as the Fund is informed of such dividends) net of applicable withholding taxes. Interest income is recognized on the accrual basis except where collection is in doubt. Discounts are accreted and premiums are amortized over the life of the respective securities. Most expenses of the Trust can be directly attributed to a particular Fund. Expenses which cannot be directly attributed are apportioned among the Funds based upon relative net assets or other appropriate methods. Income, expenses (other than class specific expenses — distribution and shareholder services, transfer agency and sub transfer agency fees) and realized and unrealized gains or losses are allocated to each class of shares based upon their relative net assets. Included in Realized Gain (Loss) on Investments Sold are proceeds from the one-time settlements
of class action lawsuits involving the Fund's past holdings of approximately $1,353,000, the impact of which is on the Fund's performance is disclosed in the Financial Highlights.
B. Advisory Fees: The Adviser, a wholly-owned subsidiary of Morgan Stanley, provides the Fund with advisory services under the terms of an Investment Advisory Agreement, paid quarterly, at the annual rate based on the average daily net assets as follows:
First $1
billion | | Over $1
billion | |
| | 0.375 | % | | | 0.300 | % | |
For the year ended September 30, 2017, the advisory fee rate (net of waivers/rebate) was equivalent to an annual effective rate of 0.15% of the Fund's average daily net assets.
The Adviser has agreed to reduce its advisory fee and/or reimburse the Fund so that total annual portfolio operating expenses, excluding certain investment related expenses, taxes, interest and other extraordinary expenses (including litigation), will not exceed 0.42% for Class I shares, 0.77% for Class A shares, 1.02% for Class L shares and 1.52% for Class C shares. The fee waivers and/or expense reimbursements will continue for at least one year from the date of the Fund's prospectus or until such time as the Trustees act to discontinue all or a portion of such waivers and/or reimbursements when they deem such action is appropriate. For the year ended September 30, 2017, approximately $576,000 of advisory fees were waived and approximately $259,000 of other expenses were reimbursed by the Adviser pursuant to this arrangement.
C. Administration Fees: The Adviser also serves as Administrator to the Trust and provides administrative services pursuant to an Administration Agreement for an annual fee, accrued daily and paid monthly, of 0.08% of the Fund's average daily net assets. Under a Sub-Administration Agreement between the Administrator and State Street, State Street provides certain administrative services to the Trust. For such services, the Administrator pays State Street a portion of the fee the Administrator receives from the Fund.
D. Distribution and Shareholder Services Fees: Morgan Stanley Distribution, Inc. ("MSDI" or the "Distributor"), a wholly-owned subsidiary of the Adviser, and an indirect subsidiary of Morgan Stanley, serves as the Trust's Distributor of Fund shares pursuant to a Distribution Agreement. The Trust has adopted a Shareholder Services Plan with respect to Class A shares pursuant to Rule 12b-1 under
32
Morgan Stanley Institutional Fund Trust
Annual Report — September 30, 2017
Notes to Financial Statements (cont'd)
the Act. Under the Shareholder Services Plan, the Fund pays the Distributor a shareholder services fee, accrued daily and paid monthly, at an annual rate of 0.25% of the Fund's average daily net assets attributable to Class A shares.
The Trust has adopted a Distribution and Shareholder Services Plan with respect to Class L shares pursuant to Rule 12b-1 under the Act. Under the Distribution and Shareholder Services Plan, the Fund pays the Distributor a distribution fee, accrued daily and paid monthly, at an annual rate of 0.25% and a shareholder services fee, accrued daily and paid monthly, at an annual rate of 0.25% of the Fund's average daily net assets attributable to Class L shares.
The Trust has adopted a Distribution and Shareholder Services Plan with respect to Class C shares pursuant to Rule 12b-1 under the Act. Under the Distribution and Shareholder Services Plan, the Fund pays the Distributor a distribution fee, accrued daily and paid monthly, at an annual rate of 0.75% and a shareholder services fee, accrued daily and paid monthly, at an annual rate of 0.25% of the Fund's average daily net assets attributable to Class C shares.
The distribution and shareholder services fees are used to support the expenses associated with servicing and maintaining accounts. The Distributor may compensate other parties for providing shareholder support services to investors who purchase Class A, Class L and Class C shares.
E. Dividend Disbursing and Transfer Agent: The Trust's dividend disbursing and transfer agent is Boston Financial Data Services, Inc. ("BFDS"). Pursuant to a Transfer Agency Agreement, the Trust pays BFDS a fee based on the number of classes, accounts and transactions relating to the Funds of the Trust.
F. Custodian Fees: State Street (the "Custodian") serves as Custodian for the Trust in accordance with a Custodian Agreement. The Custodian holds cash, securities, and other assets of the Trust as required by the Act. Custody fees are payable monthly based on assets held in custody, investment purchases and sales activity and account maintenance fees, plus reimbursement for certain out-of-pocket expenses.
G. Security Transactions and Transactions with Affiliates: For the year ended September 30, 2017, purchases and sales of investment securities for the Fund, other than long-term U.S. Government securities and short-term investments, were approximately $140,275,000 and $78,003,000, respectively. For the year ended September 30, 2017, purchases
and sales of long-term U.S. Government securities were approximately $885,117,000 and $850,797,000, respectively.
The Fund invests in the Institutional Class of the Morgan Stanley Institutional Liquidity Funds — Government Portfolio (the "Liquidity Funds"), an open-end management investment company managed by the Adviser, both directly and as a portion of the securities held as collateral on loaned securities. Advisory fees paid by the Fund are reduced by an amount equal to its pro-rata share of the advisory and administration fees paid by the Fund due to its investment in the Liquidity Funds. For the year ended September 30, 2017, advisory fees paid were reduced by approximately $60,000 relating to the Fund's investment in the Liquidity Funds.
A summary of the Fund's transactions in shares of the Liquidity Funds during the year ended September 30, 2017 is as follows:
Affiliated
Investment Company | | Value
September 30,
2016
(000) | | Purchases
at Cost
(000) | | Proceeds
from Sales
(000) | | Dividend
Income
(000) | |
Liquidity Funds | | $ | 28,592 | | | $ | 236,219 | | | $ | 198,541 | | | $ | 232 | | |
Affiliated
Investment Company (cont'd) | | Realized
Gain (Loss)
(000) | | Change in
Unrealized
Appreciation
(Depreciation)
(000) | | Value
September 30,
2017
(000) | |
Liquidity Funds | | $ | — | | | $ | — | | | $ | 66,270 | | |
The Fund is permitted to purchase and sell securities ("cross-trade") from and to other Morgan Stanley Funds as well as other funds and client accounts for which the Adviser or an affiliate of the Adviser serves as investment adviser, pursuant to procedures approved by the Trustees in compliance with Rule 17a-7 under the Act (the "Rule"). Each cross-trade is executed at the current market price in compliance with provisions of the Rule. For the year ended September 30, 2017, the Fund did not engage in any cross-trade transactions.
The Fund has an unfunded Deferred Compensation Plan (the "Compensation Plan"), which allows each independent Trustee to defer payment of all, or a portion, of the fees he or she receives for serving on the Board of Trustees. Each eligible Trustee generally may elect to have the deferred amounts credited with a return equal to the total return on one or more of the Morgan Stanley funds that are offered as investment options under the Compensation Plan. Appreciation/depreciation and distributions received from these investments are recorded with an offsetting increase/decrease in the deferred compensation obligation and do not affect the NAV of the Fund.
33
Morgan Stanley Institutional Fund Trust
Annual Report — September 30, 2017
Notes to Financial Statements (cont'd)
H. Federal Income Taxes: It is the Fund's intention to continue to qualify as a regulated investment company and distribute all of its taxable and tax-exempt income. Accordingly, no provision for federal income taxes is required in the financial statements.
The Fund may be subject to taxes imposed by countries in which it invests. Such taxes are generally based on income and/or capital gains earned or repatriated. Taxes are accrued based on net investment income, net realized gains and net unrealized appreciation as such income and/or gains are earned. Taxes may also be based on transactions in foreign currency and are accrued based on the value of investments denominated in such currency.
FASB ASC 740-10, "Income Taxes — Overall", sets forth a minimum threshold for financial statement recognition of the benefit of a tax position taken or expected to be taken in a tax return. Management has concluded there are no significant uncertain tax positions that would require recognition in the financial statements. If applicable, the Fund recognizes interest accrued related to unrecognized tax benefits in "Interest Expense" and penalties in "Other Expenses" in the Statement of Operations. The Fund files tax returns with the U.S. Internal Revenue Service, New York and various states. Each of the tax years in the four-year period ended September 30, 2017, remains subject to examination by taxing authorities.
The tax character of distributions paid may differ from the character of distributions shown in the Statements of Changes in Net Assets due to short-term capital gains being treated as ordinary income for tax purposes. The tax character of distributions paid during fiscal years 2017 and 2016 was as follows:
2017 Distributions
Paid From:
Ordinary Income
(000) | | 2016 Distributions
Paid From:
Ordinary Income
(000) | |
| $ | 8,104 | | | $ | 7,663 | | |
The amount and character of income and gains to be distributed are determined in accordance with income tax regulations which may differ from GAAP. These book/tax differences are either considered temporary or permanent in nature.
Temporary differences are attributable to differing book and tax treatments for the timing of the recognition of gains (losses) on certain investment transactions and the timing of the deductibility of certain expenses.
Permanent differences, primarily due to differing treatments of gains (losses) related to foreign currency transactions, basis adjustments for swap transactions, paydown adjustments and an
expired capital loss carryforward, resulted in the following reclassifications among the components of net assets at September 30, 2017:
Accumulated
Undistributed
Net Investment
Income
(000) | | Accumulated
Net Realized
Loss
(000) | | Paid-in-
Capital
(000) | |
| $ | (1,068 | ) | | $ | 245,871 | | | $ | (244,803 | ) | |
At September 30, 2017, the components of distributable earnings for the Fund on a tax basis were as follows:
Undistributed
Ordinary
Income
(000) | | Undistributed
Long-Term
Capital Gain
(000) | |
| $ | 1,532 | | | $ | — | | |
At September 30, 2017, the Fund had available for federal income tax purposes unused capital losses which will expire on the indicated dates:
Amount
(000) | | Expiration | |
| $ | 201,462 | | | September 30, 2018 | |
Capital loss carryforwards of approximately $244,803,000 expired during the year ended September 30, 2017.
To the extent that capital loss carryforwards are used to offset any future capital gains realized during the carryover period as provided by U.S. federal income tax regulations, no capital gains tax liability will be incurred by the Fund for gains realized and not distributed. To the extent that capital gains are offset, such gains will not be distributed to the shareholders. During the year ended September 30, 2017, the Fund utilized capital loss carryforwards for U.S. federal income tax purposes of approximately $188,000.
I. Credit Facility: The Trust and other Morgan Stanley funds participate in a $150,000,000 committed, unsecured revolving line of credit facility (the "facility") with State Street. This facility is to be used for temporary emergency purposes or funding of shareholder redemption requests. The interest rate on borrowings is based on the federal funds rate or one month libor rate plus a spread. The facility also has a commitment fee of 0.25% per annum based on the unused portion of the facility. During the year ended September 30, 2017, the Fund did not have any borrowings under the facility.
J. Other: At September 30, 2017, the Fund had record owners of 10% or greater. Investment activities of these shareholders could have a material impact on the Fund. The aggregate percentage of such owners was 53.9%.
34
Morgan Stanley Institutional Fund Trust
Annual Report — September 30, 2017
Notes to Financial Statements (cont'd)
K. Accounting Pronouncement: In March 2017, FASB issued an Accounting Standard Update, ASU 2017-08, Receivables-Nonrefundable Fees and Other Costs (Subtopic 310-20), Premium Amortization on Purchased Callable Debt Securities (the "ASU") which amends the amortization period for certain purchased callable debt securities held at a premium, shortening such period to the earliest call date. The ASU does not require any accounting change for debt securities held at a discount; the discount continues to be amortized to maturity. The ASU is effective for fiscal years, and interim periods within those fiscal years, beginning after December 15, 2018. At this time, management is evaluating the implications of these changes on the financial statements.
35
Morgan Stanley Institutional Fund Trust
Annual Report — September 30, 2017
Report of Independent Registered Public Accounting Firm
To the Shareholders and Board of Trustees of
Morgan Stanley Institutional Fund Trust —
Core Plus Fixed Income Portfolio
We have audited the accompanying statement of assets and liabilities, including the portfolio of investments, of Core Plus Fixed Income Portfolio (one of the funds constituting Morgan Stanley Institutional Fund Trust) (the "Fund") as of September 30, 2017, and the related statement of operations for the year then ended, the statements of changes in net assets for each of the two years in the period then ended and the financial highlights for each of the years or periods indicated therein. These financial statements and financial highlights are the responsibility of the Fund's management. Our responsibility is to express an opinion on these financial statements and financial highlights based on our audits.
We conducted our audits in accordance with the standards of the Public Company Accounting Oversight Board (United States). Those standards require that we plan and perform the audit to obtain reasonable assurance about whether the financial statements and financial highlights are free of material misstatement. We were not engaged to perform an audit of the Fund's internal control over financial reporting. Our audits included consideration of internal control over financial reporting as a basis for designing audit procedures that are appropriate in the circumstances, but not for the purpose of expressing an opinion on the effectiveness of the Fund's internal control over financial reporting. Accordingly, we express no such opinion. An audit also includes examining, on a test basis, evidence supporting the amounts and disclosures in the financial statements and financial highlights, assessing the accounting principles used and significant estimates made by management, and evaluating the overall financial statement presentation. Our procedures included confirmation of securities owned as of September 30, 2017, by correspondence with the custodian and others or by other appropriate auditing procedures where replies from others were not received. We believe that our audits provide a reasonable basis for our opinion.
In our opinion, the financial statements and financial highlights referred to above present fairly, in all material respects, the financial position of Core Plus Fixed Income Portfolio (one of the funds constituting Morgan Stanley Institutional Fund Trust) at September 30, 2017, the results of its operations for the year then ended, the changes in its net assets for each of the two years in the period then ended and the financial highlights for each of the years or periods indicated therein, in conformity with U.S. generally accepted accounting principles.

Boston, Massachusetts
November 22, 2017
36
Morgan Stanley Institutional Fund Trust
Annual Report — September 30, 2017
Investment Advisory Agreement Approval (unaudited)
Nature, Extent and Quality of Services
The Board reviewed and considered the nature and extent of the investment advisory services provided by the Adviser (as defined herein) under the advisory agreement, including portfolio management, investment research and equity and fixed income securities trading. The Board also reviewed and considered the nature and extent of the non-advisory, administrative services provided by the Adviser under the administration agreement, including accounting, operations, clerical, bookkeeping, compliance, business management and planning, legal services and the provision of supplies, office space and utilities at the Adviser's expense. The Board also considered the Adviser's investment in personnel and infrastructure that benefits the Fund. (The advisory and administration agreements together are referred to as the "Management Agreement.") The Board also considered that the Adviser serves a variety of other investment advisory clients and has experience overseeing service providers. The Board also compared the nature of the services provided by the Adviser with similar services provided by non-affiliated advisers as presented to the Board by Broadridge Financial Solutions, Inc. ("Broadridge").
The Board reviewed and considered the qualifications of the portfolio managers, the senior administrative managers and other key personnel of the Adviser who provide the administrative and advisory services to the Fund. The Board determined that the Adviser's portfolio managers and key personnel are well qualified by education and/or training and experience to perform the services in an efficient and professional manner. The Board concluded that the nature and extent of the advisory and administrative services provided were necessary and appropriate for the conduct of the business and investment activities of the Fund and supported its decision to approve the Management Agreement.
Performance, Fees and Expenses of the Fund
The Board reviewed the performance, fees and expenses of the Fund compared to its peers, as presented by Broadridge, and to appropriate benchmarks where applicable. The Board discussed with the Adviser the performance goals and the actual results achieved in managing the Fund. When considering a fund's performance, the Board and the Adviser place emphasis on trends and longer-term returns (focusing on one-year, three-year and five-year performance, as of December 31, 2016, or since inception, as applicable). When a fund underperforms its benchmark and/or its peer group average, the Board and the Adviser discuss the causes of such underperformance and, where necessary, they discuss specific changes to investment strategy or investment personnel. The Board noted that the Fund's performance was better than its peer group average for the one-, three- and five-year periods. The Board discussed with the Adviser the level of the advisory and administration fees (together, the "management fee") for this Fund relative to comparable funds and/or other accounts advised by the Adviser and/or compared to its peers as presented by Broadridge. In addition to the management fee, the Board also reviewed the Fund's total expense ratio. The Board noted that the Fund's management fee and total expense ratio were lower than its peer group averages. After discussion, the Board concluded that the Fund's performance (i) was competitive with its peer group average; and (ii) management fee and total expense ratio were competitive with its peer group averages.
Economies of Scale
The Board considered the size and growth prospects of the Fund and how that relates to the Fund's total expense ratio and particularly the Fund's management fee rate, which includes a breakpoint. In conjunction with its review of the Adviser's profitability, the Board discussed with the Adviser how a change in assets can affect the efficiency or effectiveness of managing the Fund and whether the management fee level is appropriate relative to current and projected asset levels and/or whether the management fee structure reflects economies of scale as asset levels change. The Board has determined that its review of the actual and/or potential economies of scale of the Fund supports its decision to approve the Management Agreement.
Profitability of the Adviser and Affiliates
The Board considered information concerning the costs incurred and profits realized by the Adviser and its affiliates during the last year from their relationship with the Fund and during the last two years from their relationship with the Morgan Stanley Fund Complex and reviewed with the Adviser the cost allocation methodology used to determine the profitability of the Adviser and affiliates. The Board has determined that its review of the analysis of the Adviser's expenses and profitability supports its decision to approve the Management Agreement.
37
Morgan Stanley Institutional Fund Trust
Annual Report — September 30, 2017
Investment Advisory Agreement Approval (unaudited) (cont'd)
Other Benefits of the Relationship
The Board considered other direct and indirect benefits to the Adviser and/or its affiliates derived from their relationship with the Fund and other funds advised by the Adviser. These benefits may include, among other things, fees for trading, distribution and/or shareholder servicing and for transaction processing and reporting platforms used by securities lending agents, and research received by the Adviser generated from commission dollars spent on funds' portfolio trading. The Board reviewed with the Adviser these arrangements and the reasonableness of the Adviser's costs relative to the services performed. The Board has determined that its review of the other benefits received by the Adviser or its affiliates supports its decision to approve the Management Agreement.
Resources of the Adviser and Historical Relationship Between the Fund and the Adviser
The Board considered whether the Adviser is financially sound and has the resources necessary to perform its obligations under the Management Agreement. The Board also reviewed and considered the historical relationship between the Fund and the Adviser, including the organizational structure of the Adviser, the policies and procedures formulated and adopted by the Adviser for managing the Fund's operations and the Board's confidence in the competence and integrity of the senior managers and key personnel of the Adviser. The Board concluded that the Adviser has the financial resources necessary to fulfill its obligations under the Management Agreement and that it is beneficial for the Fund to continue its relationship with the Adviser.
Other Factors and Current Trends
The Board considered the controls and procedures adopted and implemented by the Adviser and monitored by the Fund's Chief Compliance Officer and concluded that the conduct of business by the Adviser indicates a good faith effort on its part to adhere to high ethical standards in the conduct of the Fund's business.
General Conclusion
After considering and weighing all of the above factors, with various written materials and verbal information presented by the Adviser, the Board concluded that it would be in the best interest of the Fund and its shareholders to approve renewal of the Management Agreement for another year. In reaching this conclusion the Board did not give particular weight to any single piece of information or factor referenced above. The Board considered these factors and information over the course of the year and in numerous meetings, some of which were in executive session with only the independent Board members and their counsel present. It is possible that individual Board members may have weighed these factors, and the information presented, differently in reaching their individual decisions to approve the Management Agreement.
38
Morgan Stanley Institutional Fund Trust
Annual Report — September 30, 2017
Privacy Notice (unaudited)
MORGAN STANLEY INVESTMENT MANAGEMENT INC.
AN IMPORTANT NOTICE CONCERNING OUR U.S. PRIVACY POLICY
We are required by federal law to provide you with a copy of our privacy policy annually. This policy applies to current and former individual investors in funds managed or sponsored by Morgan Stanley Investment Management Inc. ("MSIM") as well as current and former individual clients of MSIM. This policy is not applicable to partnerships, corporations, trusts or other non-individual clients or investors. Please note that we may amend this policy at any time, and will inform you of any changes as required by law.
WE RESPECT YOUR PRIVACY
We appreciate that you have provided us with your personal financial information. We strive to maintain the privacy of such information while we help you achieve your financial objectives. This Notice describes what non-public personal information we collect about you, why we collect it, when we may share it with others and how certain others may use it. It discusses the steps you may take to limit our sharing of certain information about you to affiliated companies in the Morgan Stanley family of companies ("other Morgan Stanley companies"). It also discloses how you may limit use of certain shared information for marketing purposes by other Morgan Stanley branded companies. Throughout this policy, we refer to the non-public information that personally identifies you or your accounts as "personal information.''
1. WHAT PERSONAL INFORMATION DO WE COLLECT ABOUT YOU?
We obtain personal information from applications and other forms you submit to us, from your dealings with us, from consumer reporting agencies, from our Web sites and from third parties and other sources.
For example:
• We may collect information such as your name, address, e-mail address, telephone/fax numbers, assets, income and investment objectives through subscription documents, applications and other forms you submit to us.
• We may obtain information about account balances, your use of account(s) and the types of products and services you prefer to receive from us through your dealings and transactions with us and other sources.
• We may obtain information about your creditworthiness and credit history from consumer reporting agencies.
• We may collect background information from and through third-party vendors to verify representations you have made and to comply with various regulatory requirements.
• If you interact with us through our public and private Web sites, we may collect information that you provide directly through online communications (such as an e-mail address). We may also collect information about your Internet service provider, your domain name, your computer's operating system and Web browser, your use of our Web sites and your product and service preferences, through the use of "cookies." Please consult the Terms of Use of these sites for more details.
2. WHEN DO WE DISCLOSE PERSONAL INFORMATION WE COLLECT ABOUT YOU?
We may disclose personal information we collect about you to other Morgan Stanley companies and to non-affiliated third parties.
a. Information We Disclose to Other Morgan Stanley Companies.
We may disclose personal information to other Morgan Stanley companies for a variety of reasons, including to manage your account(s) effectively, to service and process your transactions, to let you know about products and services offered by us and other Morgan Stanley companies, to manage our business, and as otherwise required or permitted by law. Offers for products and services from other Morgan Stanley companies are developed under conditions designed to safeguard your personal information.
39
Morgan Stanley Institutional Fund Trust
Annual Report — September 30, 2017
Privacy Notice (unaudited) (cont'd)
b. Information We Disclose to Non-affiliated Third Parties.
We do not disclose personal information that we collect about you to non-affiliated third parties except to those who provide marketing services on our behalf, to financial institutions with whom we have joint marketing agreements, and as otherwise required or permitted by law. For example, we may disclose personal information to non-affiliated third parties for servicing and processing transactions, to offer our own products and services, to protect against fraud, for institutional risk control, to respond to judicial process or to perform services on our behalf. When we share personal information with a non-affiliated third party, they are required to limit their use of personal information to the particular purpose for which it was shared and they are not allowed to share personal information with others except to fulfill that limited purpose or as may be permitted or required by law.
3. HOW DO WE PROTECT THE SECURITY AND CONFIDENTIALITY OF PERSONAL INFORMATION WE COLLECT ABOUT YOU?
We maintain physical, electronic and procedural security measures to help safeguard the personal information we collect about you. We have internal policies governing the proper handling of client information. Third parties that provide support or marketing services on our behalf may also receive personal information, and we require them to adhere to confidentiality standards with respect to such information.
4. HOW CAN YOU LIMIT THE SHARING OF CERTAIN TYPES OF PERSONAL INFORMATION WITH OTHER MORGAN STANLEY COMPANIES?
We offer you choices as to whether we share with other Morgan Stanley companies the personal information that was collected to determine your eligibility for products and services you request ("eligibility information"). Eligibility information does not include your identification information or personal information pertaining to our transactions or experiences with you. Please note that, even if you direct us not to share eligibility information with other Morgan Stanley companies ("opt-out"), we may still share personal information, including eligibility information, with those companies in circumstances excluded from the opt-out under applicable law, such as to process transactions or to service your account.
5. HOW CAN YOU LIMIT THE USE OF CERTAIN TYPES OF PERSONAL INFORMATION BY OTHER MORGAN STANLEY COMPANIES FOR MARKETING?
By following the opt-out instructions in Section 6 below, you may limit other Morgan Stanley branded companies from marketing their products or services to you based on personal information we disclose to them. This information may include, for example, your income and account history with us. Please note that, even if you choose to limit Other Morgan Stanley Companies from using personal information about you that we may share with them for marketing their products and services to you, Other Morgan Stanley Companies may use your personal information that they obtain from us to market to you in circumstances permitted by law, such as if the Other Morgan Stanley Company has its own relationship with you.
6. HOW CAN YOU SEND US AN OPT-OUT INSTRUCTION?
If you wish to limit our sharing of eligibility information about you with other Morgan Stanley companies or other Morgan Stanley companies' use of personal information for marketing purposes, as described in this notice, you may do so by:
• Calling us at (800) 548-7786
Monday–Friday between 8a.m. and 6p.m.(EST)
• Writing to us at the following address:
Boston Financial Data Services, Inc.
c/o Privacy Coordinator
P.O. Box 219804
Kansas City, Missouri 64121
40
Morgan Stanley Institutional Fund Trust
Annual Report — September 30, 2017
Privacy Notice (unaudited) (cont'd)
Your written request should include your name, address, telephone number and account number(s) to which the opt-out applies and whether you are opting out with respect to sharing of eligibility information (Section 4 above), or if information used for Marketing (Section 5 above) or both. Written opt-out requests should not be sent with any other correspondence. In order to process your request, we require that the request be provided by you directly and not through a third party.
Your opt-out preference will remain in effect with respect to this policy (as it may be amended) until you notify us otherwise. If you have a joint account, your direction for us not to share this information with other Morgan Stanley companies and for those other Morgan Stanley companies not to use your personal information for marketing will be applied to all account holders on that account. Please understand that if you limit our sharing or our affiliated companies' use of personal information, you and any joint account holder(s) may not receive information about Morgan Stanley products and services, including products or services that could help you manage your financial resources and achieve your investment objectives.
7. WHAT IF AN AFFILIATED COMPANY BECOMES A NON-AFFILIATED THIRD PARTY?
If, at any time in the future, an affiliated company becomes a non-affiliated third party, further disclosures of personal information made to the former affiliated company will be limited to those described in Section 2(b) above relating to non-affiliated third parties. If you elected under Section 6 to limit disclosures we make to affiliated companies, or use of personal information by affiliated companies, your election will not apply to use by any former affiliated company of your personal information in their possession once it becomes a non-affiliated third party.
SPECIAL NOTICE TO RESIDENTS OF VERMONT
The following section supplements our policy with respect to our individual clients who have a Vermont address and supersedes anything to the contrary in the above policy with respect to those clients only.
The state of Vermont requires financial institutions to obtain your consent prior to sharing personal information that they collect about you with affiliated companies and non-affiliated third parties other than in certain limited circumstances. Except as permitted by law, we will not share personal information we collect about you with non-affiliated third parties or other Morgan Stanley companies unless you provide us with your written consent to share such information ("opt-in").
If you wish to receive offers for investment products and services offered by or through other Morgan Stanley companies, please notify us in writing at the following address:
Boston Financial Data Services, Inc.
c/o Privacy Coordinator
P.O. Box 219804
Kansas City, Missouri 64121
Your authorization should include your name, address, telephone number and account number(s) to which the opt-in applies and should not be sent with any other correspondence. In order to process your authorization, we require that the authorization be provided by you directly and not through a third party.
SPECIAL NOTICE TO RESIDENTS OF CALIFORNIA
The following section supplements our policy with respect to our individual clients who have a California address and supersedes anything to the contrary in the above policy with respect to those clients only.
In response to a California law, if your account has a California home address, your personal information will not be disclosed to non-affiliated third parties except as permitted by applicable California law, and we will limit sharing such information with our affiliates to comply with California privacy laws that apply to us.
41
Morgan Stanley Institutional Fund Trust
Annual Report — September 30, 2017
Trustee and Officer Information (unaudited)
Independent Trustees:
Name, Age and Address of
Independent Trustee | | Position(s)
Held with
Registrant | | Length of Time
Served* | | Principal Occupation(s) During Past 5 Years
and Other Relevant Professional Experience | | Number of
Portfolios in
Fund Complex
Overseen by
Independent
Trustee** | | Other Directorships
Held by Independent
Trustee*** | |
Frank L. Bowman (72)
c/o Perkins Coie LLP
Counsel to the Independent Trustees
30 Rockefeller
Plaza New York, NY 10112 | | Trustee | | Since
August
2006 | | President, Strategic Decisions, LLC (consulting) (since February 2009); Director or Trustee of various Morgan Stanley Funds (since August 2006); Chairperson of the Compliance and Insurance Committee (since October 2015); formerly, Chairperson of the Insurance Sub-Committee of the Compliance and Insurance Committee (2007-2015); served as President and Chief Executive Officer of the Nuclear Energy Institute (policy organization) (February 2005-November 2008); retired as Admiral, U.S. Navy after serving over 38 years on active duty including 8 years as Director of the Naval Nuclear Propulsion Program in the Department of the Navy and the U.S. Department of Energy (1996-2004); served as Chief of Naval Personnel (July 1994-September 1996) and on the Joint Staff as Director of Political Military Affairs (June 1992-July 1994); knighted as Honorary Knight Commander of the Most Excellent Order of the British Empire; awarded the Officier de l'Orde National du Mérite by the French Government; elected to the National Academy of Engineering (2009). | | | 90 | | | Director of BP p.l.c.; Director of Naval and Nuclear Technologies LLP; Director Emeritus of the Armed Services YMCA; Director of the U.S. Naval Submarine League; Member of the National Security Advisory Council of the Center for U.S. Global Engagement and a member of the CNA Military Advisory Board; Chairman of the charity J Street Cup Golf; Trustee of Fairhaven United Methodist Church; and Director of other various non-profit organizations. | |
Kathleen A. Dennis (64)
c/o Perkins Coie LLP
Counsel to the Independent Trustees
30 Rockefeller Plaza
New York, NY 10112 | | Trustee | | Since
August
2006 | | President, Cedarwood Associates (mutual fund and investment management consulting) (since July 2006); Chairperson of the Liquidity and Alternatives Sub-Committee of the Investment Committee (since October 2006) and Director or Trustee of various Morgan Stanley Funds (since August 2006); formerly, Senior Managing Director of Victory Capital Management (1993-2006). | | | 91 | | | Director of various non-profit organizations. | |
Nancy C. Everett (62)
c/o Perkins Coie LLP
Counsel to the Independent Trustees
30 Rockefeller Plaza
New York, NY 10112 | | Trustee | | Since
January
2015 | | Chief Executive Officer, Virginia Commonwealth University Investment Company (since November 2015); Owner OBIR, LLC (institutional investment management consulting) (since June 2014); formerly, Managing Director, BlackRock, Inc. (February 2011-December 2013); and Chief Executive Officer, General Motors Asset Management (a/k/a Promark Global Advisors, Inc.) (June 2005-May 2010). | | | 91 | | | Formerly, Member of Virginia Commonwealth University School of Business Foundation (2005-2016); Member of Virginia Commonwealth University Board of Visitors (2013-2015); Member of Committee on Directors for Emerging Markets Growth Fund, Inc. (2007-2010); Chairperson of Performance Equity Management, LLC (2006-2010); and Chairperson, GMAM Absolute Return Strategies Fund, LLC (2006-2010). | |
42
Morgan Stanley Institutional Fund Trust
Annual Report — September 30, 2017
Trustee and Officer Information (unaudited) (cont'd)
Name, Age and Address of
Independent Trustee | | Position(s)
Held with
Registrant | | Length of Time
Served* | | Principal Occupation(s) During Past 5 Years
and Other Relevant Professional Experience | | Number of
Portfolios in
Fund Complex
Overseen by
Independent
Trustee** | | Other Directorships
Held by Independent
Trustee*** | |
Jakki L. Haussler (60)
c/o Perkins Coie LLP
Counsel to the Independent Trustees
30 Rockefeller Plaza
New York, NY 10112 | | Trustee | | Since
January
2015 | | Chairman and Chief Executive Officer, Opus Capital Group (since January 1996); formerly, Director, Capvest Venture Fund, LP (May 2000-December 2011); Partner, Adena Ventures, LP (July 1999-December 2010); Director, The Victory Funds (February 2005-July 2008). | | | 91 | | | Director of Cincinnati Bell Inc. and Member, Audit Committee and Compensation Committee; Director of Northern Kentucky University Foundation and Member, Investment Committee; Member of Chase College of Law Transactional Law Practice Center Board of Advisors; Director of Best Transport; Director of Chase College of Law Board of Visitors; formerly, Member, University of Cincinnati Foundation Investment Committee; Member, Miami University Board of Visitors (2008-2011); Trustee of Victory Funds (2005-2008) and Chairman, Investment Committee (2007-2008) and Member, Service Provider Committee (2005-2008). | |
Dr. Manuel H. Johnson (68)
c/o Johnson Smick International, Inc.
220 I Street, NE — Suite 200
Washington, D.C. 20002 | | Trustee | | Since
July
1991 | | Senior Partner, Johnson Smick International, Inc. (consulting firm); Chairperson of the Investment Committee (since October 2006) and Director or Trustee of various Morgan Stanley Funds (since July 1991); Co-Chairman and a founder of the Group of Seven Council (G7C) (international economic commission); formerly, Chairperson of the Audit Committee (July 1991-September 2006), Vice Chairman of the Board of Governors of the Federal Reserve System and Assistant Secretary of the U.S. Treasury. | | | 91 | | | Director of NVR, Inc. (home construction). | |
Joseph J. Kearns (75)
c/o Kearns & Associates LLC
46 E Peninsula Center #385
Rolling Hills Estates, CA 90274-3712 | | Trustee | | Since
August
1994 | | President, Kearns & Associates LLC (investment consulting); Chairperson of the Audit Committee (since October 2006) and Director or Trustee of various Morgan Stanley Funds (since August 1994); formerly, Deputy Chairperson of the Audit Committee (July 2003-September 2006) and Chairperson of the Audit Committee of various Morgan Stanley Funds (since August 1994); CFO of the J. Paul Getty Trust. | | | 93 | | | Director of Electro Rent Corporation (equipment leasing). Prior to December 31, 2013, Director of The Ford Family Foundation. | |
Michael F. Klein (58)
c/o Perkins Coie LLP
Counsel to the Independent Trustees
30 Rockefeller Plaza
New York, NY 10112 | | Trustee | | Since
August
2006 | | Managing Director, Aetos Capital, LLC (since March 2000); Co-President, Aetos Alternatives Management, LLC (since January 2004) and Co-Chief Executive Officer of Aetos Capital LLC (since August 2013); Chairperson of the Fixed Income Sub-Committee of the Investment Committee (since October 2006) and Director or Trustee of various Morgan Stanley Funds (since August 2006); formerly, Managing Director, Morgan Stanley & Co. Inc. and Morgan Stanley Dean Witter Investment Management, President, various Morgan Stanley Funds (June 1998-March 2000) and Principal, Morgan Stanley & Co. Inc. and Morgan Stanley Dean Witter Investment Management (August 1997-December 1999). | | | 90 | | | Director of certain investment funds managed or sponsored by Aetos Capital, LLC; Director of Sanitized AG and Sanitized Marketing AG (specialty chemicals). | |
43
Morgan Stanley Institutional Fund Trust
Annual Report — September 30, 2017
Trustee and Officer Information (unaudited) (cont'd)
Name, Age and Address of
Independent Trustee | | Position(s)
Held with
Registrant | | Length of Time
Served* | | Principal Occupation(s) During Past 5 Years
and Other Relevant Professional Experience | | Number of
Portfolios in
Fund Complex
Overseen by
Independent
Trustee** | | Other Directorships
Held by Independent
Trustee*** | |
Patricia Maleski (57)
c/o Perkins Coie LLP
Counsel to the Independent Trustees
30 Rockefeller Plaza
New York, NY 10112 | | Trustee | | Since January 2017 | | Managing Director, JPMorgan Asset Management (2004-2016); Oversight and Control Head of Fiduciary and Conflicts of Interest Program(2015-2016); Chief Control Officer-Global Asset Management (2013-2015); President, JPMorgan Funds (2010-2013); Chief Administrative Officer (2004-2013); various other positions including Treasurer and Board Liaison (since 2001). | | | 91 | | | None. | |
Michael E. Nugent (81)
522 Fifth Avenue
New York, NY 10036 | | Chair of the
Board and
Trustee | | Chair of the Boards since
July 2006 and Trustee since
July 1991 | | Chair of the Boards of various Morgan Stanley Funds (since July 2006); Chairperson of the Closed-End Fund Committee (since June 2012) and Director or Trustee of various Morgan Stanley Funds (since July 1991); formerly, Chairperson of the Insurance Committee (until July 2006); General Partner, Triumph Capital, L.P. (private investment partnership) (1988-2013). | | | 92 | | | None. | |
W. Allen Reed (70)
c/o Perkins Coie LLP
Counsel to the Independent Trustees
30 Rockefeller Plaza
New York, NY 10112 | | Trustee | | Since
August
2006 | | Chairperson of the Equity Sub-Committee of the Investment Committee (since October 2006) and Director or Trustee of various Morgan Stanley Funds (since August 2006); formerly, President and CEO of General Motors Asset Management; Chairman and Chief Executive Officer of the GM Trust Bank and Corporate Vice President of General Motors Corporation (August 1994-December 2005). | | | 91 | | | Director of Legg Mason, Inc.; formerly, Director of the Auburn University Foundation (2010-2015). | |
Fergus Reid (85)
c/o Joe Pietryka, Inc.
85 Charles Colman Blvd.
Pawling, NY 12564 | | Trustee | | Since
June
1992 | | Chairman, Joe Pietryka, Inc.; Chairperson of the Governance Committee and Director or Trustee of various Morgan Stanley Funds (since June 1992). | | | 92 | | | Formerly, Trustee and Director of certain investment companies in the JP Morgan Fund Complex managed by JP Morgan Investment Management Inc. (1987-2012). | |
* This is the earliest date the Trustee began serving the Morgan Stanley Funds. Each Trustee serves an indefinite term, until his or her successor is elected.
** The Fund Complex includes (as of December 31, 2016) all open-end and closed-end funds (including all of their portfolios) advised by Morgan Stanley Investment Management Inc. (the "Adviser") and any funds that have an adviser that is an affiliated person of the Adviser (including, but not limited to, Morgan Stanley AIP GP LP).
*** This includes any directorships at public companies and registered investment companies held by the Trustee at any time during the past five years.
44
Morgan Stanley Institutional Fund Trust
Annual Report — September 30, 2017
Trustee and Officer Information (unaudited) (cont'd)
Executive Officers:
Name, Age and Address of Executive Officer | | Position(s) Held
with
Registrant | | Length of
Time Served* | | Principal Occupation(s) During Past 5 Years | |
John H. Gernon (54)
522 Fifth Avenue
New York, NY 10036 | | President and Principal Executive Officer | | Since September 2013 | | President and Principal Executive Officer of the Equity and Fixed Income Funds and the Morgan Stanley AIP Funds (since September 2013) and the Liquidity Funds and various money market funds (since May 2014) in the Fund Complex; Managing Director of the Adviser; Head of Product (since 2006). | |
Timothy J. Knierim (58)
522 Fifth Avenue
New York, NY 10036 | | Chief Compliance Officer | | Since December
2016 | | Managing Director of the Adviser and various entities affiliated with the Adviser; Chief Compliance Officer of various Morgan Stanley Funds and the Adviser (since December 2016) and Chief Compliance Officer of Morgan Stanley AIP GP LP (since 2014). Formerly, Managing Director and Deputy Chief Compliance Officer of the Adviser (2014-2016); and formerly, Chief Compliance Officer of Prudential Investment Management, Inc. (2007-2014). | |
Francis J. Smith (52)
522 Fifth Avenue
New York, NY 10036 | | Treasurer and Principal Financial Officer | | Treasurer since July 2003 and Principal Financial Officer since September
2002 | | Manging Director of the Adviser and various entities affiliated with the Adviser; Treasurer (since July 2003) and Principal Financial Officer of various Morgan Stanley Funds (since September 2002). | |
Mary E. Mullin (50)
522 Fifth Avenue
New York, NY 10036 | | Secretary | | Since
June
1999 | | Executive Director of the Adviser; Secretary of various Morgan Stanley Funds (since June 1999). | |
Michael J. Key (38)
522 Fifth Avenue
New York, NY 10036 | | Vice President | | Since
June
2017 | | Vice President of the Equity and Fixed Income Funds, Liquidity Funds, various money market funds and the Morgan Stanley AIP Funds in the Fund Complex (since June 2017); Executive Director of the Adviser; Head of Product Development for Equity and Fixed Income Funds (since August 2013). | |
* This is the earliest date the officer began serving the Morgan Stanley Funds. Each officer serves a one-year term, until his or her successor is elected and qualifies.
45
Morgan Stanley Institutional Fund Trust
Annual Report — September 30, 2017
Adviser and Administrator
Morgan Stanley Investment Management Inc.
522 Fifth Avenue
New York, New York 10036
Distributor
Morgan Stanley Distribution, Inc.
522 Fifth Avenue
New York, New York 10036
Dividend Disbursing and Transfer Agent
Boston Financial Data Services, Inc.
2000 Crown Colony Drive
Quincy, Massachusetts 02169
Custodian
State Street Bank and Trust Company
One Lincoln Street
Boston, Massachusetts 02111
Legal Counsel
Dechert LLP
1095 Avenue of the Americas
New York, New York 10036
Counsel to the Independent Trustees
Perkins Coie LLP
30 Rockefeller Plaza
New York, New York 10112
Independent Registered Public Accounting Firm
Ernst & Young LLP
200 Clarendon Street
Boston, Massachusetts 02116
Reporting to Shareholders
Each Morgan Stanley Fund provides a complete schedule of portfolio holdings in its semi-annual and annual reports within 60 days of the end of the fund's second and fourth fiscal quarters. The semi-annual and annual reports are filed electronically with the Securities and Exchange Commission (SEC) on Form N-CSRS and Form N-CSR, respectively. Morgan Stanley also delivers the semi-annual and annual reports to fund shareholders and makes these reports available on its public website, www.morganstanley.com/im. Each Morgan Stanley fund also files a complete schedule of portfolio holdings with the SEC for the fund's first and third fiscal quarters on Form N-Q. Morgan Stanley does not deliver the reports for the first and third fiscal quarters to shareholders, nor are the reports posted to the Morgan Stanley public website. You may, however, obtain the Form N-Q filings (as well as the Form N-CSR and N-CSRS filings) by accessing the SEC's website, www.sec.gov. You may also review and copy them at the SEC's Public Reference Room in Washington, DC. Information on the operation of the SEC's Public Reference Room may be obtained by calling the SEC toll free at 1 (800) SEC-0330. You can also request copies of these materials, upon payment of a duplicating fee, by electronic request at the SEC's email address (publicinfo@sec.gov) or by writing to the SEC's Public Reference Section, Washington, D.C. 20549-1520.
Proxy Voting Policies and Procedures and Proxy Voting Record
You may obtain a copy of the Trust's Proxy Voting Policy and Procedures and information regarding how the Trust voted proxies relating to portfolio securities during the most recent twelve-month period ended June 30, without charge, upon request, by calling toll free 1 (800) 548-7786 or by visiting our website at www.morganstanley.com/im. This information is also available on the SEC's website at www.sec.gov.
This report is authorized for distribution only when preceded or accompanied by a prospectus or summary prospectus of the applicable Fund of Morgan Stanley Institutional Fund Trust, which describes in detail the Fund's investment policies, risks, fees and expenses. Please read the prospectus carefully before you invest or send money. For additional information, including information regarding the investments comprising the Fund, please visit our website at www.morganstanley.com/im or call toll free 1 (800) 548-7786.
46
(This Page has been left blank intentionally.)
(This Page has been left blank intentionally.)
(This Page has been left blank intentionally.)
Printed in U.S.A.
This Report has been prepared for shareholders and may be distributed to others only if preceded or accompanied by a current prospectus.
Morgan Stanley Investment Management Inc.
522 Fifth Avenue
New York, New York 10036
© 2017 Morgan Stanley. Morgan Stanley Distribution, Inc.

IFTCPFIANN
1933983 EXP 11.30.18

Morgan Stanley Institutional Fund Trust
Corporate Bond Portfolio
Annual Report
September 30, 2017

Morgan Stanley Institutional Fund Trust
Annual Report — September 30, 2017
Shareholders' Letter | | | 2 | | |
Expense Example | | | 3 | | |
Investment Overview | | | 4 | | |
Portfolio of Investments | | | 7 | | |
Statement of Assets and Liabilities | | | 15 | | |
Statement of Operations | | | 17 | | |
Statements of Changes in Net Assets | | | 18 | | |
Financial Highlights | | | 19 | | |
Notes to Financial Statements | | | 23 | | |
Report of Independent Registered Public Accounting Firm | | | 33 | | |
Investment Advisory Agreement Approval | | | 34 | | |
Privacy Notice | | | 36 | | |
Trustee and Officer Information | | | 39 | | |
This report is authorized for distribution only when preceded or accompanied by a prospectus or summary prospectus of the applicable Fund of the Morgan Stanley Institutional Fund Trust. To receive a prospectus and/or statement of additional information (SAI), which contains more complete information such as investment objectives, charges, expenses, policies for voting proxies, risk considerations, and describes in detail each of the Fund's investment policies to the prospective investor, please call toll free 1 (800) 548-7786. Please read the prospectuses carefully before you invest or send money.
Additionally, you can access information about the Fund, including performance, characteristics, and investment team commentary, through Morgan Stanley Investment Management's website: www.morganstanley.com/im.
Market forecasts provided in this report may not necessarily come to pass. There is no guarantee that any sectors mentioned will continue to perform as discussed herein or that securities in such sectors will be held by the Fund in the future. There is no assurance that a fund will achieve its investment objective. Funds are subject to market risk, which is the possibility that market values of securities owned by the Fund will decline and, therefore, the value of the Fund's shares may be less than what you paid for them. Accordingly, you can lose money investing in this Fund. Please see the prospectus for more complete information on investment risks.
1
Morgan Stanley Institutional Fund Trust
Annual Report — September 30, 2017
Shareholders' Letter (unaudited)
Dear Shareholders,
We are pleased to provide this Annual report, in which you will learn how your investment in Corporate Bond Portfolio (the "Fund") performed during the latest twelve-month period.
Morgan Stanley Investment Management is a client-centric, investor-led organization. Our global presence, intellectual capital, and breadth of products and services enable us to partner with investors to meet the evolving challenges of today's financial markets. We aim to deliver superior investment service and to empower our clients to make the informed decisions that help them reach their investment goals.
As always, we thank you for selecting Morgan Stanley Investment Management, and look forward to working with you in the months and years ahead.
Sincerely,

John H. Gernon
President and Principal Executive Officer
October 2017
2
Morgan Stanley Institutional Fund Trust
Annual Report — September 30, 2017
Expense Example (unaudited)
Corporate Bond Portfolio
As a shareholder of the Fund, you may incur two types of costs: (1) transactional costs, including sales charge (loads) on purchase payments; and (2) ongoing costs, which may include advisory fees, administration fees, distribution and shareholder services fees; and other Fund expenses. This example is intended to help you understand your ongoing costs (in dollars) of investing in the Fund and to compare these costs with the ongoing costs of investing in other mutual funds.
This example is based on an investment of $1,000 invested at the beginning of the six-month period ended September 30, 2017 and held for the entire six-month period.
Actual Expenses
The table below provides information about actual account values and actual expenses. You may use the information in this table, together with the amount you invested, to estimate the expenses that you paid over the period. Simply divide your account value by $1,000 (for example, an $8,600 account value divided by $1,000 = 8.6), then multiply the result by the number in the table under the heading entitled "Actual Expenses Paid During Period" to estimate the expenses you paid on your account during this period.
Hypothetical Example for Comparison Purposes
The table below provides information about hypothetical account values and hypothetical expenses based on the Fund's actual expense ratio and an assumed rate of return of 5% per year before expenses, which is not the Fund's actual return. The hypothetical account values and expenses may not be used to estimate the actual ending account balance or expenses you paid for the period. You may use this information to compare the ongoing costs of investing in the Fund and other funds. To do so, compare this 5% hypothetical example with the 5% hypothetical examples that appear in the shareholder reports of the other funds.
Please note that the expenses shown in the table are meant to highlight your ongoing costs only and do not reflect any transactional costs, such as sales charges (loads, if applicable). Therefore, the information for each class in the table is useful in comparing ongoing costs only, and will not help you determine the relative total costs of owning different funds. In addition, if these transactional costs were included, your costs would have been higher.
| | | Beginning
Account
Value
4/1/17 | | Actual Ending
Account
Value
9/30/17 | | Hypothetical
Ending Account
Value | | Actual
Expenses
Paid
During
Period* | | Hypothetical
Expenses Paid
During Period* | | Net
Expense
Ratio
During
Period** | |
Corporate Bond Portfolio Class I | | $ | 1,000.00 | | | $ | 1,042.10 | | | $ | 1,021.56 | | | $ | 3.58 | | | $ | 3.55 | | | | 0.70 | % | |
Corporate Bond Portfolio Class A | | | 1,000.00 | | | | 1,039.20 | | | | 1,019.75 | | | | 5.42 | | | | 5.37 | | | | 1.06 | | |
Corporate Bond Portfolio Class L | | | 1,000.00 | | | | 1,037.90 | | | | 1,018.20 | | | | 7.00 | | | | 6.93 | | | | 1.37 | | |
Corporate Bond Portfolio Class C | | | 1,000.00 | | | | 1,036.10 | | | | 1,016.04 | | | | 9.19 | | | | 9.10 | | | | 1.80 | | |
* Expenses are calculated using each Fund Class' annualized net expense ratio (as disclosed), multiplied by the average account value over the period, and multiplied by 183/365 (to reflect the most recent one-half year period).
** Annualized.
3
Morgan Stanley Institutional Fund Trust
Annual Report — September 30, 2017
Investment Overview (unaudited)
Corporate Bond Portfolio
The Portfolio seeks above-average total return over a market cycle of three to five years.
Performance
For the fiscal year ended September 30, 2017, the Fund's Class I shares had a total return based on net asset value and reinvestment of distributions per share of 2.95%, net of fees. The Fund's Class I shares outperformed against the Fund's benchmark, the Bloomberg Barclays U.S. Corporate Index (the "Index"), which returned 2.21%.
Factors Affecting Performance
• The 12-month reporting period was characterized by a steady grind tighter in credit markets, despite pockets of intra-year volatility as concerns about global growth, monetary policy, geopolitical tensions, and commodities caused temporary market weaknesses. All of these periods, however, were brief and have resulted in positive performance in credit spreads over the period, as strong technicals and demand for the asset class mitigated any potential softness in the market.
• In the final quarter of 2016, the surprise Trump win in the United States dominated the news flow in November and pervasively impacted global rates, credit spreads, and equity markets. Financial market conditions changed rapidly as investors priced in the inflationary impact of anticipated fiscal stimulus, reduced trade, and a more aggressive Federal Reserve (Fed). Pro-growth rhetoric, higher inflation expectations, and continued demand for U.S. credit created a bullish environment for U.S. credit in November 2016.
• In the first quarter of 2017, U.S. investment grade spreads traded tighter as low global yields, high cash balances, and government support of credit markets around the globe created a positive environment for credit markets. During this quarter, we saw the global fixed income markets price in significant relaxation of U.S. fiscal policy, as well as economic growth, a stronger U.S. dollar, and a steeper Treasury curve.
• In the second quarter of 2017, we saw continued tensions between fundamentals, valuations, and technicals in the investment grade market. U.S. banking and other financial companies' fundamentals remained strong, while industrial
companies' fundamentals continued to deteriorate as the pace of leverage continued its course. Valuations remained stretched for industrials in this quarter, while financials continued to present attractive relative value opportunities. Technicals remained strong across the market. This quarter was characterized by low volatility, with spreads trading in a narrow range.
• The third quarter of 2017 was positive for risk assets. Global credit traded stronger over the period, as spreads tightened across the investment grade and high yield markets. While August 2017 reset valuations in the market, due to heightened geopolitical risks, the remainder of the quarter was defined by a steady grind tighter in credit fueled by strong technicals, a positive macroeconomic backdrop, low volatility, and strong equity performance.
• Over the 12-month reporting period, Treasury yields were higher and the Treasury curve flattened. Specifically, the 2-, 5-, 10- and 30-year Treasury yields ended 72, 79, 74 and 54 basis points higher, respectively.(1)
• Credit spreads ended the period tighter. The corporate sector as a whole was 37 basis points tighter over the 12-month period.(2) In aggregate, BBB corporate spreads contracted 47 basis points, while single A corporate spreads were 32 basis points tighter.(2) Financials outperformed non-financials, with industrials spreads narrowing 35 basis points and financials tightening 44 basis points.(2)
• The Fund's investment grade exposure was a positive contributor to the Fund's returns. Strength in the credit market over the period resulted in tighter spreads across all major segments of the investment grade market. The Fund's emphasis on financial institutions, specifically the banking sector, was particularly advantageous for performance over the reporting period. The Fund has an underweight to industrials, attributable to relatively weaker fundamentals and less favorable relative value within the industrials segment of the market. The industrials underweight detracted from performance over the period, driven mainly by positioning in capital goods and technology.
(1) Source for U.S. Treasury yields: Bloomberg L.P.
(2) Source for credit spread data: Barclays
4
Morgan Stanley Institutional Fund Trust
Annual Report — September 30, 2017
Investment Overview (unaudited) (cont'd)
Corporate Bond Portfolio
• An opportunistic allocation to below investment grade (or high yield) credits also contributed to the Fund's performance. As with the investment grade market, the high yield market benefited from spread tightening and yield advantages that led to positive returns.
• During fiscal year 2017, the Fund received monies related to certain nonrecurring litigation settlements. If these monies were not received, any period returns which include these settlement monies would have been lower. For example, the 2017 fiscal year total return would have been 2.10% for Class I shares as of September 30, 2017. The returns on the other Share Classes would also have been similarly impacted. These were one-time settlements, and as a result, the impact on the net asset value and consequently the performance will not likely be repeated in the future. Please call 1-800-548-7786 for additional information.
Management Strategies
• Accommodative policy and low global yields remain supportive of global credit, particularly U.S. credit, and we continue to believe the strong technical environment in global credit markets suggests modest tightening into year-end.
• Technicals continue to support the asset class, and fundamentals remain positive in certain sectors of the market. At current valuations, we do not anticipate a drastic move tighter in spreads; however, we believe spreads could continue to grind tighter into year-end if the current backdrop persists. As we head into year-end, we are vigilant of global political headlines and will continue to monitor their potential impact on credit markets.
• Despite our favorable outlook on investment grade corporates, we remain cognizant that the business cycle is maturing. Company behavior in later-cycle environments is often tilted in favor of equity holders at the expense of bond holders. As a result, we remain reliant upon our active, value-oriented approach and bottom-up credit research process to help identify the best value opportunities, while avoiding those companies where we believe there is limited scope to earn attractive returns.
• Given this view, the Fund is positioned to be underweight credit risk as a whole, driven by an underweight to industrials, while we remain overweight financials. We continue to believe that the fundamental story in the financial sector remains strong, as banks have spent years shoring up balance sheets, increasing their liquidity profiles, and reducing risky activities. In the non-financial segment of the investment grade market, the Portfolio is underweight, due to relatively weaker fundamentals and stretched valuations.
• The Fund continues to hold small allocations to high yield bonds, as we believe that both fundamentals and valuations may well compensate investors for bearing risk.

* Minimum Investment
In accordance with SEC regulations, the Fund's performance shown assumes that all recurring fees (including management fees) were deducted and all dividends and distributions were reinvested. The performance of Class A, Class L and Class C shares will vary from the performance of Class I shares based upon their different inception dates and will be negatively impacted by additional fees assessed to those classes.
5
Morgan Stanley Institutional Fund Trust
Annual Report — September 30, 2017
Investment Overview (unaudited) (cont'd)
Corporate Bond Portfolio
Performance Compared to the Bloomberg Barclays U.S. Corporate Index(1) and the Lipper Corporate Debt Funds BBB-Rated Index(2)
| | | Period Ended September 30, 2017
Total Returns(3) | |
| | | | | Average Annual | |
| | | One
Year | | Five
Years | | Ten
Years | | Since
Inception(8) | |
Fund — Class I Shares
w/o sales charges(4) | | | 2.95 | % | | | 5.53 | % | | | 4.80 | % | | | 6.54 | % | |
Fund — Class A Shares
w/o sales charges(5) | | | 2.54 | | | | 5.22 | | | | 4.58 | | | | 4.66 | | |
Fund — Class A Shares with
maximum 4.25% sales charges(5) | | | –1.84 | | | | 4.32 | | | | 4.13 | | | | 4.36 | | |
Fund — Class L Shares
w/o sales charges(6) | | | 2.20 | | | | 4.88 | | | | — | | | | 5.19 | | |
Fund — Class C Shares
w/o sales charges(7) | | | 1.81 | | | | — | | | | — | | | | 5.77 | | |
Fund — Class C Shares with
maximum 1.00% deferred
sales charges(7) | | | 0.81 | | | | — | | | | — | | | | 5.77 | | |
Bloomberg Barclays U.S.
Corporate Index | | | 2.21 | | | | 3.46 | | | | 5.74 | | | | 6.95 | | |
Lipper Corporate Debt Funds
BBB-Rated Index | | | 1.99 | | | | 3.46 | | | | 5.36 | | | | 6.54 | | |
Performance data quoted represents past performance, which is no guarantee of future results, and current performance may be lower or higher than the figures shown. Performance assumes that all dividends and distributions, if any, were reinvested. For the most recent month-end performance figures, please visit www.morganstanley.com/im. Investment returns and principal value will fluctuate so that Fund shares, when redeemed, may be worth more or less than their original cost. Total returns do not reflect the deduction of taxes that a shareholder would pay on Fund distributions or the redemption of Fund shares. Performance of share classes will vary due to differences in sales charges and expenses.
(1) The Bloomberg Barclays U.S. Corporate Index is a broad-based benchmark that measures the investment grade, U.S. dollar-denominated, fixed rate, taxable corporate bond market. It includes USD-denominated securities publicly issued by U.S. and non-U.S. industrial, utility and financial issuers that meet specified maturity, liquidity and quality requirements.The Index is unmanaged and its returns do not include any sales charges or fees. Such costs would lower performance. It is not possible to invest directly in an index.
(2) The Lipper Corporate Debt Funds BBB-Rated Index is an equally weighted performance index of the largest qualifying funds (based on net assets) in the Lipper Corporate Debt Funds BBB-Rated Funds classification. The Index, which is adjusted for capital gains distributions and income dividends, is unmanaged and should not be considered an investment. There are currently 30 funds represented in this Index. As of the date of this report, the Fund was in the Lipper Corporate Debt Funds BBB-Rated Funds classification.
(3) Total returns for the Fund reflect expenses waived and/or reimbursed, if applicable, by the Adviser and Distributor. Without such waivers and/or reimbursements, total returns would have been lower.
(4) Commenced operations on August 31, 1990.
(5) Commenced operations on May 20, 2002.
(6) Commenced operations on June 16, 2008.
(7) Commenced operations on April 30, 2015.
(8) For comparative purposes, average annual since inception returns listed for the Indexes refer to the inception date of Class I of the Fund, not the inception of the Indexes.
6
Morgan Stanley Institutional Fund Trust
Annual Report — September 30, 2017
Portfolio of Investments
Corporate Bond Portfolio
| | | Face
Amount
(000) | | Value
(000) | |
Fixed Income Securities (97.3%) | |
Asset-Backed Securities (0.6%) | |
CVS Pass-Through Trust, | |
6.04%, 12/10/28 | | $ | 100 | | | $ | 113 | | |
8.35%, 7/10/31 (a) | | | 121 | | | | 158 | | |
| | | | 271 | | |
Corporate Bonds (96.7%) | |
Finance (35.1%) | |
ABN Amro Bank N.V. | |
4.75%, 7/28/25 (a) | | | 200 | | | | 213 | | |
AerCap Ireland Capital DAC/AerCap Global
Aviation Trust | |
3.75%, 5/15/19 | | | 150 | | | | 154 | | |
Air Lease Corp., | |
2.63%, 7/1/22 | | | 150 | | | | 149 | | |
3.38%, 6/1/21 | | | 75 | | | | 77 | | |
Alexandria Real Estate Equities, Inc. | |
3.95%, 1/15/27 | | | 75 | | | | 77 | | |
Ally Financial, Inc. | |
4.25%, 4/15/21 | | | 75 | | | | 78 | | |
American Express Credit Corp., | |
MTN | |
3.30%, 5/3/27 | | | 150 | | | | 152 | | |
American International Group, Inc. | |
4.88%, 6/1/22 | | | 175 | | | | 192 | | |
AvalonBay Communities, Inc., | |
Series G | |
2.95%, 5/11/26 | | | 100 | | | | 99 | | |
Bank of America Corp., | |
3.09%, 10/1/25 | | | 100 | | | | 100 | | |
Series G | |
3.50%, 4/19/26 | | | 275 | | | | 280 | | |
MTN | |
4.00%, 1/22/25 | | | 180 | | | | 186 | | |
4.24%, 4/24/38 | | | 275 | | | | 291 | | |
MTN | |
4.25%, 10/22/26 | | | 100 | | | | 105 | | |
Bank of New York Mellon Corp. (The), | |
MTN | |
3.65%, 2/4/24 | | | 60 | | | | 63 | | |
BNP Paribas SA, | |
3.80%, 1/10/24 (a)(b) | | | 250 | | | | 260 | | |
5.00%, 1/15/21 | | | 95 | | | | 103 | | |
Boston Properties LP, | |
3.65%, 2/1/26 | | | 100 | | | | 102 | | |
3.80%, 2/1/24 | | | 25 | | | | 26 | | |
| BPCE SA | |
5.15%, 7/21/24 (a) | | | 200 | | | | 216 | | |
Brighthouse Financial, Inc. | |
3.70%, 6/22/27 (a) | | | 200 | | | | 197 | | |
Brixmor Operating Partnership LP | |
4.13%, 6/15/26 | | | 150 | | | | 151 | | |
| | | Face
Amount
(000) | | Value
(000) | |
Brookfield Finance, Inc. | |
4.25%, 6/2/26 | | $ | 150 | | | $ | 155 | | |
Capital One Financial Corp., | |
2.50%, 5/12/20 | | | 50 | | | | 50 | | |
3.20%, 2/5/25 | | | 275 | | | | 275 | | |
3.75%, 3/9/27 (b) | | | 25 | | | | 25 | | |
Chubb INA Holdings, Inc. | |
3.35%, 5/15/24 | | | 125 | | | | 129 | | |
Citigroup, Inc., | |
3.89%, 1/10/28 | | | 225 | | | | 231 | | |
4.45%, 9/29/27 | | | 225 | | | | 238 | | |
6.68%, 9/13/43 | | | 50 | | | | 68 | | |
8.13%, 7/15/39 | | | 100 | | | | 159 | | |
Citizens Bank NA, | |
MTN | |
2.55%, 5/13/21 | | | 250 | | | | 251 | | |
CNA Financial Corp. | |
5.75%, 8/15/21 | | | 75 | | | | 83 | | |
Credit Suisse AG, | |
MTN | |
3.63%, 9/9/24 | | | 250 | | | | 260 | | |
6.00%, 2/15/18 | | | 61 | | | | 62 | | |
CubeSmart LP | |
3.13%, 9/1/26 | | | 50 | | | | 48 | | |
Deutsche Bank AG | |
2.70%, 7/13/20 | | | 200 | | | | 201 | | |
Digital Realty Trust LP | |
3.70%, 8/15/27 | | | 150 | | | | 152 | | |
Discover Bank | |
2.00%, 2/21/18 | | | 250 | | | | 250 | | |
Discover Financial Services | |
3.95%, 11/6/24 | | | 75 | | | | 77 | | |
Federal Realty Investment Trust | |
3.63%, 8/1/46 | | | 75 | | | | 68 | | |
Five Corners Funding Trust | |
4.42%, 11/15/23 (a) | | | 200 | | | | 217 | | |
GE Capital International Funding Co., Unlimited Co., | |
2.34%, 11/15/20 | | | 200 | | | | 202 | | |
4.42%, 11/15/35 | | | 211 | | | | 230 | | |
Goldman Sachs Group, Inc. (The), | |
2.91%, 6/5/23 | | | 125 | | | | 125 | | |
MTN | |
4.80%, 7/8/44 | | | 125 | | | | 140 | | |
6.25%, 2/1/41 | | | 75 | | | | 99 | | |
6.75%, 10/1/37 | | | 230 | | | | 304 | | |
Guardian Life Insurance Co. of America (The) | |
4.85%, 1/24/77 (a) | | | 100 | | | | 107 | | |
Hartford Financial Services Group, Inc. (The) | |
5.50%, 3/30/20 | | | 275 | | | | 296 | | |
Healthcare Trust of America Holdings LP | |
3.70%, 4/15/23 | | | 100 | | | | 103 | | |
HSBC Finance Corp. | |
6.68%, 1/15/21 | | | 68 | | | | 77 | | |
The accompanying notes are an integral part of the financial statements.
7
Morgan Stanley Institutional Fund Trust
Annual Report — September 30, 2017
Portfolio of Investments (cont'd)
Corporate Bond Portfolio
| | | Face
Amount
(000) | | Value
(000) | |
Finance (cont'd) | |
HSBC Holdings PLC, | |
2.65%, 1/5/22 | | $ | 200 | | | $ | 201 | | |
4.38%, 11/23/26 | | | 200 | | | | 209 | | |
HSBC USA, Inc. | |
3.50%, 6/23/24 | | | 100 | | | | 103 | | |
Humana, Inc. | |
4.80%, 3/15/47 | | | 100 | | | | 112 | | |
ING Bank N.V. | |
5.80%, 9/25/23 (a) | | | 100 | | | | 114 | | |
Intesa Sanpaolo SpA | |
3.88%, 1/16/18 | | | 200 | | | | 201 | | |
Jackson National Life Global Funding | |
2.20%, 1/30/20 (a) | | | 300 | | | | 300 | | |
JPMorgan Chase & Co., | |
3.78%, 2/1/28 | | | 225 | | | | 232 | | |
4.13%, 12/15/26 | | | 650 | | | | 679 | | |
KeyBank NA | |
1.60%, 8/22/19 | | | 250 | | | | 249 | | |
LeasePlan Corp N.V. | |
2.88%, 1/22/19 (a) | | | 200 | | | | 200 | | |
Liberty Mutual Group, Inc. | |
4.85%, 8/1/44 (a) | | | 50 | | | | 55 | | |
Lincoln National Corp. | |
7.00%, 6/15/40 | | | 75 | | | | 101 | | |
Lloyds Banking Group PLC | |
3.10%, 7/6/21 | | | 200 | | | | 204 | | |
Massachusetts Mutual Life Insurance Co. | |
4.50%, 4/15/65 (a) | | | 50 | | | | 51 | | |
Metropolitan Life Global Funding I | |
2.00%, 4/14/20 (a) | | | 200 | | | | 200 | | |
Mizuho Financial Group, Inc. | |
2.63%, 4/12/21 (a) | | | 225 | | | | 225 | | |
MPT Operating Partnership LP/MPT Finance Corp. | |
5.00%, 10/15/27 | | | 125 | | | | 128 | | |
Nationwide Building Society | |
6.25%, 2/25/20 (a) | | | 260 | | | | 285 | | |
New York Life Global Funding | |
2.90%, 1/17/24 (a) | | | 225 | | | | 228 | | |
Northern Trust Corp. | |
3.38%, 5/8/32 | | | 125 | | | | 125 | | |
Pacific LifeCorp | |
6.00%, 2/10/20 (a) | | | 150 | | | | 162 | | |
PNC Financial Services Group, Inc. (The), | |
3.15%, 5/19/27 | | | 275 | | | | 275 | | |
3.90%, 4/29/24 | | | 80 | | | | 84 | | |
Prudential Financial, Inc., | |
MTN | |
4.60%, 5/15/44 | | | 75 | | | | 83 | | |
5.63%, 6/15/43 | | | 170 | | | | 185 | | |
Realty Income Corp. | |
3.25%, 10/15/22 | | | 150 | | | | 154 | | |
| | | Face
Amount
(000) | | Value
(000) | |
Royal Bank of Scotland Group PLC | |
3.88%, 9/12/23 | | $ | 200 | | | $ | 205 | | |
Santander UK Group Holdings PLC | |
3.57%, 1/10/23 | | | 200 | | | | 205 | | |
Santander UK PLC | |
5.00%, 11/7/23 (a) | | | 200 | | | | 217 | | |
Simon Property Group LP | |
2.50%, 7/15/21 | | | 125 | | | | 126 | | |
Skandinaviska Enskilda Banken AB | |
2.63%, 11/17/20 (a)(b) | | | 200 | | | | 203 | | |
Standard Chartered PLC | |
2.10%, 8/19/19 (a) | | | 225 | | | | 225 | | |
State Street Corp. | |
1.95%, 5/19/21 | | | 175 | | | | 174 | | |
Swedbank AB | |
2.80%, 3/14/22 (a) | | | 300 | | | | 304 | | |
Synchrony Bank | |
3.00%, 6/15/22 | | | 250 | | | | 250 | | |
TD Ameritrade Holding Corp., | |
3.30%, 4/1/27 | | | 75 | | | | 76 | | |
3.63%, 4/1/25 | | | 100 | | | | 103 | | |
Toronto-Dominion Bank (The) | |
3.63%, 9/15/31 | | | 175 | | | | 174 | | |
Travelers Cos., Inc. (The) | |
3.75%, 5/15/46 | | | 50 | | | | 50 | | |
UBS Group Funding Switzerland AG | |
3.49%, 5/23/23 (a) | | | 225 | | | | 231 | | |
UnitedHealth Group, Inc., | |
2.75%, 2/15/23 | | | 55 | | | | 56 | | |
2.88%, 3/15/23 | | | 255 | | | | 260 | | |
3.75%, 7/15/25 | | | 150 | | | | 159 | | |
Wells Fargo & Co., | |
3.00%, 10/23/26 | | | 575 | | | | 563 | | |
3.07%, 1/24/23 | | | 200 | | | | 204 | | |
MTN | |
4.10%, 6/3/26 | | | 100 | | | | 104 | | |
Westpac Banking Corp. | |
2.85%, 5/13/26 | | | 150 | | | | 147 | | |
| | | | 17,134 | | |
Industrials (52.9%) | |
21st Century Fox America, Inc. | |
4.75%, 9/15/44 | | | 150 | | | | 161 | | |
ABB Treasury Center USA, Inc. | |
4.00%, 6/15/21 (a) | | | 50 | | | | 53 | | |
Abbott Laboratories, | |
3.40%, 11/30/23 | | | 250 | | | | 258 | | |
4.90%, 11/30/46 | | | 100 | | | | 112 | | |
AbbVie, Inc., | |
3.20%, 5/14/26 | | | 50 | | | | 50 | | |
4.70%, 5/14/45 | | | 75 | | | | 82 | | |
Air Liquide Finance SA | |
2.25%, 9/27/23 (a) | | | 200 | | | | 194 | | |
The accompanying notes are an integral part of the financial statements.
8
Morgan Stanley Institutional Fund Trust
Annual Report — September 30, 2017
Portfolio of Investments (cont'd)
Corporate Bond Portfolio
| | | Face
Amount
(000) | | Value
(000) | |
Industrials (cont'd) | |
Alfa SAB de CV | |
5.25%, 3/25/24 (a) | | $ | 200 | | | $ | 218 | | |
Alibaba Group Holding Ltd. | |
2.50%, 11/28/19 | | | 200 | | | | 202 | | |
Alimentation Couche-Tard, Inc. | |
3.55%, 7/26/27 (a) | | | 125 | | | | 126 | | |
Allergan Funding SCS | |
4.75%, 3/15/45 | | | 94 | | | | 102 | | |
Altria Group, Inc. | |
5.38%, 1/31/44 | | | 55 | | | | 66 | | |
Amazon.com, Inc., | |
3.80%, 12/5/24 | | | 75 | | | | 80 | | |
4.25%, 8/22/57 (a) | | | 125 | | | | 129 | | |
4.95%, 12/5/44 | | | 50 | | | | 58 | | |
American Airlines Pass-Through Trust | |
4.00%, 1/15/27 | | | 160 | | | | 168 | | |
Amgen, Inc., | |
2.60%, 8/19/26 | | | 125 | | | | 119 | | |
4.66%, 6/15/51 | | | 109 | | | | 120 | | |
Anadarko Petroleum Corp. | |
5.55%, 3/15/26 | | | 150 | | | | 168 | | |
Andeavor | |
4.75%, 12/15/23 (a) | | | 225 | | | | 243 | | |
Anheuser-Busch InBev Finance, Inc., | |
3.65%, 2/1/26 | | | 125 | | | | 130 | | |
3.70%, 2/1/24 | | | 200 | | | | 210 | | |
4.90%, 2/1/46 | | | 175 | | | | 198 | | |
Apple, Inc., | |
3.35%, 2/9/27 | | | 200 | | | | 206 | | |
3.85%, 5/4/43 - 8/4/46 | | | 150 | | | | 152 | | |
4.50%, 2/23/36 | | | 125 | | | | 141 | | |
Applied Materials, Inc. | |
3.30%, 4/1/27 | | | 150 | | | | 153 | | |
APT Pipelines Ltd. | |
4.20%, 3/23/25 (a) | | | 200 | | | | 208 | | |
Aramark Services, Inc. | |
4.75%, 6/1/26 | | | 100 | | | | 106 | | |
Ashtead Capital, Inc. | |
4.13%, 8/15/25 (a) | | | 200 | | | | 206 | | |
AstraZeneca PLC | |
6.45%, 9/15/37 | | | 125 | | | | 168 | | |
AT&T, Inc., | |
4.25%, 3/1/27 | | | 300 | | | | 309 | | |
4.50%, 3/9/48 | | | 287 | | | | 266 | | |
4.55%, 3/9/49 | | | 75 | | | | 69 | | |
4.90%, 8/14/37 | | | 175 | | | | 177 | | |
5.15%, 3/15/42 | | | 75 | | | | 76 | | |
Automatic Data Processing, Inc. | |
3.38%, 9/15/25 | | | 50 | | | | 52 | | |
Baidu, Inc., | |
2.88%, 7/6/22 | | | 200 | | | | 201 | | |
3.25%, 8/6/18 | | | 200 | | | | 202 | | |
| | | Face
Amount
(000) | | Value
(000) | |
Baxalta, Inc. | |
5.25%, 6/23/45 | | $ | 50 | | | $ | 58 | | |
Becton Dickinson and Co., | |
2.89%, 6/6/22 | | | 100 | | | | 100 | | |
4.69%, 12/15/44 | | | 75 | | | | 80 | | |
BHP Billiton Finance USA Ltd. | |
5.00%, 9/30/43 | | | 75 | | | | 89 | | |
BMW US Capital LLC | |
2.70%, 4/6/22 (a) | | | 250 | | | | 252 | | |
Boston Scientific Corp. | |
3.85%, 5/15/25 | | | 100 | | | | 104 | | |
BP Capital Markets PLC, | |
3.02%, 1/16/27 | | | 100 | | | | 99 | | |
3.12%, 5/4/26 | | | 125 | | | | 125 | | |
Brambles USA, Inc. | |
4.13%, 10/23/25 (a) | | | 150 | | | | 156 | | |
British Airways Pass-Through Trust | |
4.63%, 12/20/25 (a) | | | 149 | | | | 160 | | |
Buckeye Partners LP | |
4.15%, 7/1/23 | | | 175 | | | | 182 | | |
Burlington Northern Santa Fe LLC, | |
4.40%, 3/15/42 | | | 75 | | | | 82 | | |
4.55%, 9/1/44 | | | 50 | | | | 56 | | |
Caterpillar, Inc. | |
3.80%, 8/15/42 | | | 50 | | | | 51 | | |
Charter Communications Operating LLC/Charter
Communications Operating Capital, | |
4.20%, 3/15/28 (a) | | | 150 | | | | 152 | | |
4.91%, 7/23/25 | | | 75 | | | | 80 | | |
6.48%, 10/23/45 | | | 150 | | | | 177 | | |
Cimarex Energy Co. | |
3.90%, 5/15/27 | | | 225 | | | | 230 | | |
Cisco Systems, Inc. | |
1.85%, 9/20/21 | | | 275 | | | | 272 | | |
Comcast Corp. | |
3.15%, 2/15/28 | | | 575 | | | | 574 | | |
Concho Resources, Inc. | |
3.75%, 10/1/27 | | | 200 | | | | 201 | | |
ConocoPhillips Co., | |
2.20%, 5/15/20 | | | 100 | | | | 101 | | |
4.95%, 3/15/26 (b) | | | 200 | | | | 226 | | |
Crown Castle International Corp., | |
3.40%, 2/15/21 | | | 100 | | | | 103 | | |
4.45%, 2/15/26 | | | 75 | | | | 80 | | |
CSX Corp. | |
2.60%, 11/1/26 | | | 125 | | | | 120 | | |
CVS Health Corp. | |
2.13%, 6/1/21 | | | 75 | | | | 74 | | |
Danone SA | |
1.69%, 10/30/19 (a) | | | 200 | | | | 199 | | |
Darden Restaurants, Inc. | |
3.85%, 5/1/27 | | | 150 | | | | 153 | | |
The accompanying notes are an integral part of the financial statements.
9
Morgan Stanley Institutional Fund Trust
Annual Report — September 30, 2017
Portfolio of Investments (cont'd)
Corporate Bond Portfolio
| | | Face
Amount
(000) | | Value
(000) | |
Industrials (cont'd) | |
DCP Midstream Operating LP | |
5.35%, 3/15/20 (a) | | $ | 38 | | | $ | 40 | | |
Dell International LLC/EMC Corp. | |
8.10%, 7/15/36 (a) | | | 75 | | | | 94 | | |
Delphi Automotive PLC | |
3.15%, 11/19/20 | | | 125 | | | | 128 | | |
Delta Air Lines, Inc. | |
3.63%, 3/15/22 | | | 200 | | | | 206 | | |
Deutsche Telekom International Finance BV | |
8.75%, 6/15/30 | | | 75 | | | | 110 | | |
Discovery Communications LLC | |
3.95%, 3/20/28 | | | 150 | | | | 149 | | |
Dollar General Corp., | |
1.88%, 4/15/18 | | | 100 | | | | 100 | | |
3.25%, 4/15/23 | | | 125 | | | | 128 | | |
Eastman Chemical Co. | |
3.80%, 3/15/25 | | | 100 | | | | 103 | | |
eBay, Inc., | |
2.15%, 6/5/20 | | | 125 | | | | 125 | | |
2.50%, 3/9/18 | | | 100 | | | | 100 | | |
EI du Pont de Nemours & Co. | |
2.20%, 5/1/20 | | | 200 | | | | 201 | | |
Eldorado Gold Corp. | |
6.13%, 12/15/20 (a) | | | 105 | | | | 107 | | |
Embraer Netherlands Finance BV | |
5.40%, 2/1/27 | | | 65 | | | | 71 | | |
Enable Midstream Partners LP, | |
3.90%, 5/15/24 | | | 125 | | | | 126 | | |
4.40%, 3/15/27 | | | 25 | | | | 25 | | |
Endeavor Energy Resources LP/EER Finance, Inc. | |
7.00%, 8/15/21 (a) | | | 75 | | | | 78 | | |
Energy Transfer LP | |
6.50%, 2/1/42 | | | 125 | | | | 142 | | |
Enterprise Products Operating LLC | |
4.45%, 2/15/43 | | | 125 | | | | 127 | | |
Equifax, Inc. | |
3.30%, 12/15/22 | | | 25 | | | | 25 | | |
Express Scripts Holding Co., | |
4.50%, 2/25/26 (b) | | | 100 | | | | 107 | | |
4.80%, 7/15/46 (b) | | | 50 | | | | 53 | | |
Exxon Mobil Corp. | |
4.11%, 3/1/46 | | | 100 | | | | 108 | | |
FedEx Corp. | |
3.20%, 2/1/25 | | | 100 | | | | 102 | | |
Ford Motor Credit Co., LLC | |
3.10%, 5/4/23 | | | 400 | | | | 397 | | |
General Motors Co., | |
6.60%, 4/1/36 | | | 25 | | | | 30 | | |
6.75%, 4/1/46 | | | 25 | | | | 30 | | |
General Motors Financial Co., Inc. | |
3.95%, 4/13/24 | | | 100 | | | | 103 | | |
| | | Face
Amount
(000) | | Value
(000) | |
Gilead Sciences, Inc., | |
4.50%, 2/1/45 | | $ | 25 | | | $ | 27 | | |
4.80%, 4/1/44 | | | 50 | | | | 56 | | |
GlaxoSmithKline Capital, Inc. | |
6.38%, 5/15/38 | | | 75 | | | | 103 | | |
Goldcorp, Inc. | |
5.45%, 6/9/44 | | | 50 | | | | 56 | | |
Hanesbrands, Inc., | |
4.63%, 5/15/24 (a) | | | 40 | | | | 42 | | |
4.88%, 5/15/26 (a) | | | 60 | | | | 63 | | |
Harris Corp. | |
4.85%, 4/27/35 | | | 75 | | | | 83 | | |
HCA, Inc. | |
4.75%, 5/1/23 | | | 130 | | | | 137 | | |
Heathrow Funding Ltd. | |
4.88%, 7/15/21 (a) | | | 190 | | | | 204 | | |
Hewlett Packard Enterprise Co. | |
2.10%, 10/4/19 (a) | | | 150 | | | | 150 | | |
Hilcorp Energy I LP/Hilcorp Finance Co. | |
5.75%, 10/1/25 (a) | | | 55 | | | | 56 | | |
Home Depot, Inc. (The), | |
2.13%, 9/15/26 | | | 50 | | | | 47 | | |
3.35%, 9/15/25 | | | 25 | | | | 26 | | |
5.88%, 12/16/36 | | | 159 | | | | 207 | | |
Hutchison Whampoa International 14 Ltd. | |
1.63%, 10/31/17 (a) | | | 200 | | | | 200 | | |
International Paper Co. | |
3.00%, 2/15/27 | | | 250 | | | | 243 | | |
John Deere Capital Corp., | |
MTN | |
1.25%, 10/9/19 | | | 225 | | | | 223 | | |
Johnson Controls International PLC | |
3.90%, 2/14/26 | | | 75 | | | | 79 | | |
KFC Holding Co./Pizza Hut Holdings LLC/Taco
Bell of America LLC | |
5.25%, 6/1/26 (a) | | | 100 | | | | 106 | | |
Kinder Morgan Energy Partners LP, | |
3.95%, 9/1/22 | | | 75 | | | | 78 | | |
4.15%, 2/1/24 | | | 150 | | | | 156 | | |
Kinder Morgan, Inc. | |
5.55%, 6/1/45 | | | 50 | | | | 54 | | |
Kraft Heinz Foods Co. | |
4.38%, 6/1/46 | | | 175 | | | | 174 | | |
Kroger Co. (The) | |
6.90%, 4/15/38 | | | 80 | | | | 100 | | |
Lockheed Martin Corp. | |
3.55%, 1/15/26 | | | 125 | | | | 129 | | |
Lowe's Cos., Inc. | |
2.50%, 4/15/26 | | | 175 | | | | 168 | | |
LyondellBasell Industries N.V. | |
4.63%, 2/26/55 | | | 75 | | | | 78 | | |
Macy's Retail Holdings, Inc. | |
2.88%, 2/15/23 (b) | | | 150 | | | | 142 | | |
The accompanying notes are an integral part of the financial statements.
10
Morgan Stanley Institutional Fund Trust
Annual Report — September 30, 2017
Portfolio of Investments (cont'd)
Corporate Bond Portfolio
| | | Face
Amount
(000) | | Value
(000) | |
Industrials (cont'd) | |
MasTec, Inc. | |
4.88%, 3/15/23 | | $ | 90 | | | $ | 92 | | |
McDonald's Corp., | |
MTN | |
4.60%, 5/26/45 | | | 100 | | | | 110 | | |
Mead Johnson Nutrition Co. | |
3.00%, 11/15/20 | | | 75 | | | | 77 | | |
Medtronic, Inc. | |
4.63%, 3/15/45 | | | 200 | | | | 228 | | |
Merck & Co., Inc. | |
2.80%, 5/18/23 | | | 125 | | | | 128 | | |
Microsoft Corp., | |
1.55%, 8/8/21 | | | 75 | | | | 74 | | |
3.13%, 11/3/25 | | | 50 | | | | 51 | | |
4.45%, 11/3/45 | | | 325 | | | | 367 | | |
Molson Coors Brewing Co. | |
2.25%, 3/15/20 (a) | | | 175 | | | | 175 | | |
| MPLX LP, | |
4.00%, 2/15/25 | | | 100 | | | | 102 | | |
4.88%, 6/1/25 | | | 25 | | | | 27 | | |
5.20%, 3/1/47 | | | 50 | | | | 53 | | |
NetApp, Inc. | |
2.00%, 12/15/17 | | | 100 | | | | 100 | | |
Netflix, Inc. | |
4.38%, 11/15/26 (a)(b) | | | 50 | | | | 50 | | |
Newcastle Coal Infrastructure Group Pty Ltd. | |
4.40%, 9/29/27 (a) | | | 250 | | | | 250 | | |
Nissan Motor Acceptance Corp. | |
2.55%, 3/8/21 (a) | | | 150 | | | | 151 | | |
Noble Energy, Inc. | |
5.05%, 11/15/44 | | | 50 | | | | 52 | | |
NOVA Chemicals Corp. | |
5.25%, 8/1/23 (a) | | | 120 | | | | 124 | | |
Novartis Capital Corp. | |
4.40%, 5/6/44 | | | 75 | | | | 85 | | |
Omnicom Group, Inc., | |
3.60%, 4/15/26 | | | 50 | | | | 51 | | |
3.63%, 5/1/22 | | | 95 | | | | 99 | | |
3.65%, 11/1/24 | | | 23 | | | | 24 | | |
Ooredoo International Finance Ltd. | |
3.25%, 2/21/23 (a) | | | 225 | | | | 225 | | |
Oracle Corp. | |
4.50%, 7/8/44 | | | 150 | | | | 166 | | |
PepsiCo, Inc., | |
1.70%, 10/6/21 | | | 200 | | | | 197 | | |
3.60%, 3/1/24 | | | 100 | | | | 106 | | |
Pfizer, Inc. | |
3.00%, 12/15/26 | | | 100 | | | | 101 | | |
Philip Morris International, Inc., | |
2.00%, 2/21/20 | | | 125 | | | | 125 | | |
4.50%, 3/20/42 | | | 75 | | | | 81 | | |
| | | Face
Amount
(000) | | Value
(000) | |
Phillips 66 | |
5.88%, 5/1/42 | | $ | 25 | | | $ | 31 | | |
Phillips 66 Partners LP | |
4.68%, 2/15/45 | | | 25 | | | | 24 | | |
Plains All American Pipeline LP/PAA Finance Corp. | |
4.50%, 12/15/26 | | | 75 | | | | 76 | | |
QUALCOMM, Inc. | |
2.60%, 1/30/23 | | | 250 | | | | 251 | | |
Reckitt Benckiser Treasury Services PLC | |
2.38%, 6/24/22 (a) | | | 350 | | | | 349 | | |
Rockies Express Pipeline LLC | |
6.88%, 4/15/40 (a) | | | 75 | | | | 84 | | |
Rockwell Collins, Inc. | |
2.80%, 3/15/22 | | | 125 | | | | 126 | | |
Ryder System, Inc., | |
MTN | |
2.65%, 3/2/20 | | | 50 | | | | 51 | | |
Sabine Pass Liquefaction LLC | |
4.20%, 3/15/28 | | | 225 | | | | 227 | | |
Shell International Finance BV | |
4.38%, 5/11/45 | | | 225 | | | | 242 | | |
Sherwin-Williams Co. (The) | |
2.75%, 6/1/22 | | | 250 | | | | 252 | | |
Smithfield Foods, Inc. | |
2.65%, 10/3/21 (a)(c) | | | 100 | | | | 100 | | |
Southern Copper Corp. | |
7.50%, 7/27/35 | | | 100 | | | | 130 | | |
Sprint Corp. | |
7.13%, 6/15/24 | | | 75 | | | | 85 | | |
Sprint Spectrum Co., LLC/Sprint Spectrum
Co., II LLC/Sprint Spectrum Co., III LLC | |
3.36%, 3/20/23 (a) | | | 200 | | | | 204 | | |
Telefonica Emisiones SAU | |
4.10%, 3/8/27 | | | 150 | | | | 156 | | |
Telefonica Europe BV | |
8.25%, 9/15/30 | | | 84 | | | | 118 | | |
Teva Pharmaceutical Finance Netherlands III BV | |
3.15%, 10/1/26 (b) | | | 325 | | | | 300 | | |
Thermo Fisher Scientific, Inc. | |
2.95%, 9/19/26 | | | 125 | | | | 123 | | |
Time Warner, Inc. | |
3.80%, 2/15/27 | | | 225 | | | | 226 | | |
TransCanada PipeLines Ltd. | |
7.63%, 1/15/39 | | | 75 | | | | 110 | | |
Transurban Finance Co., Pty Ltd., | |
3.38%, 3/22/27 (a) | | | 75 | | | | 74 | | |
4.13%, 2/2/26 (a) | | | 95 | | | | 99 | | |
Tyco Electronics Group SA | |
3.13%, 8/15/27 | | | 50 | | | | 50 | | |
Tyson Foods, Inc. | |
4.88%, 8/15/34 | | | 75 | | | | 83 | | |
The accompanying notes are an integral part of the financial statements.
11
Morgan Stanley Institutional Fund Trust
Annual Report — September 30, 2017
Portfolio of Investments (cont'd)
Corporate Bond Portfolio
| | | Face
Amount
(000) | | Value
(000) | |
Industrials (cont'd) | |
United Airlines Pass-Through Trust, | |
Class A | |
4.30%, 2/15/27 | | $ | 192 | | | $ | 204 | | |
Vale Overseas Ltd. | |
6.88%, 11/21/36 | | | 75 | | | | 86 | | |
Verizon Communications, Inc., | |
4.67%, 3/15/55 | | | 228 | | | | 218 | | |
5.01%, 8/21/54 | | | 285 | | | | 288 | | |
Viacom, Inc. | |
5.85%, 9/1/43 | | | 50 | | | | 52 | | |
Visa, Inc. | |
4.30%, 12/14/45 | | | 125 | | | | 139 | | |
Vodafone Group PLC | |
4.38%, 2/19/43 | | | 125 | | | | 126 | | |
Volkswagen Group of America Finance LLC | |
2.40%, 5/22/20 (a) | | | 200 | | | | 201 | | |
Wal-Mart Stores, Inc., | |
3.30%, 4/22/24 | | | 150 | | | | 157 | | |
5.25%, 9/1/35 | | | 75 | | | | 92 | | |
Walgreens Boots Alliance, Inc., | |
3.45%, 6/1/26 | | | 50 | | | | 50 | | |
3.80%, 11/18/24 | | | 25 | | | | 26 | | |
WM Wrigley Jr. Co. | |
2.90%, 10/21/19 (a) | | | 230 | | | | 234 | | |
Wolverine World Wide, Inc. | |
5.00%, 9/1/26 (a) | | | 125 | | | | 125 | | |
Woodside Finance Ltd. | |
3.70%, 9/15/26 (a) | | | 150 | | | | 150 | | |
| | | | 25,767 | | |
Utilities (8.7%) | |
Abu Dhabi National Energy Co., PJSC | |
4.38%, 6/22/26 (a) | | | 200 | | | | 207 | | |
Alabama Power Co. | |
3.75%, 3/1/45 | | | 125 | | | | 126 | | |
Baltimore Gas & Electric Co. | |
2.40%, 8/15/26 | | | 75 | | | | 71 | | |
Black Hills Corp. | |
3.15%, 1/15/27 | | | 75 | | | | 73 | | |
Boston Gas Co. | |
4.49%, 2/15/42 (a) | | | 125 | | | | 135 | | |
CenterPoint Energy Houston Electric LLC, | |
1.85%, 6/1/21 | | | 150 | | | | 148 | | |
Series AA | |
3.00%, 2/1/27 | | | 225 | | | | 224 | | |
CMS Energy Corp. | |
6.25%, 2/1/20 | | | 200 | | | | 218 | | |
Consolidated Edison, Inc., | |
Series A | |
2.00%, 3/15/20 | | | 75 | | | | 75 | | |
DTE Energy Co., | |
1.50%, 10/1/19 | | | 100 | | | | 98 | | |
3.80%, 3/15/27 | | | 125 | | | | 129 | | |
| | | Face
Amount
(000) | | Value
(000) | |
Duke Energy Carolinas LLC | |
3.75%, 6/1/45 | | $ | 75 | | | $ | 76 | | |
Duke Energy Corp. | |
2.65%, 9/1/26 | | | 150 | | | | 144 | | |
Emera US Finance LP | |
3.55%, 6/15/26 | | | 225 | | | | 227 | | |
Enel Finance International N.V. | |
6.00%, 10/7/39 (a) | | | 100 | | | | 124 | | |
Entergy Arkansas, Inc. | |
3.50%, 4/1/26 | | | 75 | | | | 77 | | |
Entergy Louisiana LLC | |
3.05%, 6/1/31 | | | 75 | | | | 73 | | |
Fortis, Inc., | |
Series WI | |
2.10%, 10/4/21 | | | 100 | | | | 98 | | |
Nevada Power Co., | |
Series N | |
6.65%, 4/1/36 | | | 150 | | | | 203 | | |
NextEra Energy Capital Holdings, Inc. | |
3.55%, 5/1/27 | | | 200 | | | | 206 | | |
Oncor Electric Delivery Co., LLC | |
2.95%, 4/1/25 | | | 75 | | | | 75 | | |
Public Service Electric & Gas Co., | |
MTN | |
2.25%, 9/15/26 | | | 150 | | | | 142 | | |
Public Service Enterprise Group, Inc. | |
1.60%, 11/15/19 | | | 75 | | | | 74 | | |
Sempra Energy | |
6.00%, 10/15/39 | | | 125 | | | | 158 | | |
South Carolina Electric & Gas Co. | |
4.50%, 6/1/64 | | | 75 | | | | 80 | | |
Southern Power Co., | |
Series D | |
1.95%, 12/15/19 | | | 50 | | | | 50 | | |
Trans-Allegheny Interstate Line Co. | |
3.85%, 6/1/25 (a) | | | 200 | | | | 209 | | |
TransAlta Corp. | |
4.50%, 11/15/22 | | | 213 | | | | 217 | | |
Virginia Electric & Power Co. | |
2.95%, 1/15/22 | | | 325 | | | | 332 | | |
WEC Energy Group, Inc. | |
3.55%, 6/15/25 | | | 75 | | | | 77 | | |
Xcel Energy, Inc. | |
3.30%, 6/1/25 | | | 75 | | | | 76 | | |
| | | | 4,222 | | |
| | | | 47,123 | | |
Total Fixed Income Securities (Cost $46,108) | | | 47,394 | | |
The accompanying notes are an integral part of the financial statements.
12
Morgan Stanley Institutional Fund Trust
Annual Report — September 30, 2017
Portfolio of Investments (cont'd)
Corporate Bond Portfolio
| | | Shares | | Value
(000) | |
Short-Term Investments (3.3%) | |
Securities held as Collateral on Loaned Securities (1.6%) | |
Investment Company (1.6%) | |
Morgan Stanley Institutional Liquidity
Funds — Government Portfolio —
Institutional Class (See Note G)
(Cost $788) | | | 787,688 | | | $ | 788 | | |
Investment Company (1.0%) | |
Morgan Stanley Institutional Liquidity
Funds — Government Portfolio —
Institutional Class (See Note G)
(Cost $498) | | | 497,586 | | | | 498 | | |
| | | Face
Amount
(000) | | | |
U.S. Treasury Security (0.7%) | |
U.S. Treasury Bill | |
1.19%, 4/26/18 (d)(e)
(Cost $357) | | $ | 360 | | | | 357 | | |
Total Short-Term Investments (Cost $1,643) | | | 1,643 | | |
Total Investments (100.6%) (Cost $47,751)
Including $1,376 of Securities Loaned (f)(g) | | | 49,037 | | |
Liabilities in Excess of Other Assets (–0.6%) | | | (300 | ) | |
Net Assets (100.0%) | | $ | 48,737 | | |
(a) 144A security — Certain conditions for public sale may exist. Unless otherwise noted, these securities are deemed to be liquid.
(b) All or a portion of this security was on loan at September 30, 2017.
(c) When-issued security.
(d) Rate shown is the yield to maturity at September 30, 2017.
(e) All or a portion of the security was pledged to cover margin requirements for futures contracts and swap agreements.
(f) Securities are available for collateral in connection with purchase of a when-issued security, open futures contracts and swap agreements.
(g) At September 30, 2017, the aggregate cost for federal income tax purposes is approximately $47,767,000. The aggregate gross unrealized appreciation is approximately $1,424,000 and the aggregate gross unrealized depreciation is approximately $162,000, resulting in net unrealized appreciation of approximately $1,262,000.
LIBOR London Interbank Offered Rate.
MTN Medium Term Note.
PJSC Public Joint Stock Company.
Futures Contracts:
The Fund had the following futures contracts open at September 30, 2017:
| | | Number
of
Contracts | | Expiration
Date | | Notional
Amount
(000) | | Value
(000) | | Unrealized
Appreciation
(Depreciation)
(000) | |
Long: | |
U.S. Treasury 2 yr. Note | | | 27 | | | Dec-17 | | | 5,400 | | | $ | 5,824 | | | $ | (13 | ) | |
U.S. Treasury 30 yr. Bond | | | 13 | | | Dec-17 | | | 1,300 | | | | 1,987 | | | | (33 | ) | |
U.S. Treasury Ultra Bond | | | 10 | | | Dec-17 | | | 1,000 | | | | 1,651 | | | | (26 | ) | |
Short: | |
U.S. Treasury 10 yr. Note | | | 13 | | | Dec-17 | | | (1,300 | ) | | | (1,629 | ) | | | 17 | | |
U.S. Treasury 10 yr. Ultra Long Bond | | | 33 | | | Dec-17 | | | (3,300 | ) | | | (4,433 | ) | | | 53 | | |
U.S. Treasury 5 yr. Note | | | 10 | | | Dec-17 | | | (1,000 | ) | | | (1,175 | ) | | | 8 | | |
| | | | | | | | | | | $ | 6 | | |
Credit Default Swap Agreement:
The Fund had the following credit default swap agreement open at September 30, 2017:
Swap Counterparty and
Reference Obligation | | Credit
Rating of
Reference
Obligation†
(Unaudited) | | Buy/Sell
Protection | | Pay/Receive
Fixed Rate | | Payment
Frequency | | Maturity
Date | | Notional
Amount
(000) | | Value
(000) | | Upfront
Payment
Paid
(000) | | Unrealized
Depreciation
(000) | |
Barclays Bank PLC
Quest Diagnostics, Inc. | | BBB+ | | Buy | | | 1.00 | % | | Quarterly | | 3/20/19 | | $ | 200 | | | $ | (3 | ) | | $ | 4 | | | $ | (7 | ) | |
The accompanying notes are an integral part of the financial statements.
13
Morgan Stanley Institutional Fund Trust
Annual Report — September 30, 2017
Portfolio of Investments (cont'd)
Corporate Bond Portfolio
Interest Rate Swap Agreement:
The Fund had the following interest rate swap agreement open at September 30, 2017:
Swap Counterparty | | Floating Rate
Index | | Pay/Receive
Floating Rate | | Fixed
Rate | | Payment
Frequency
Paid/Received | | Maturity
Date | | Notional
Amount
(000) | | Value
(000) | | Upfront
Payment
Paid
(000) | | Unrealized
Depreciation
(000) | |
Morgan Stanley &
Co., LLC* | | | 3 Month LIBOR | | | |
Receive | | | | 2.48 | % | | Semi-Annual/
Quarterly | | |
12/21/26 | | | $ | 680 | | | $ | (12 | ) | | $ | — | | | $ | (16 | ) | |
† Credit rating as issued by Standard & Poor's.
* Cleared swap agreement, the broker is Morgan Stanley & Co., LLC.
LIBOR London Interbank Offered Rate.
Portfolio Composition**
Classification | | Percentage of
Total Investments | |
Industrials | | | 53.4 | % | |
Finance | | | 35.5 | | |
Utilities | | | 8.7 | | |
Short-Term Investments | | | 1.8 | | |
Other*** | | | 0.6 | | |
Total Investments | | | 100.0 | %**** | |
** Percentages indicated are based upon total investments (excluding Securities held as Collateral on Loaned Securities) as of September 30, 2017.
*** Industries and/or investment types representing less than 5% of total investments.
**** Does not include open long/short futures contracts with an underlying face amount of approximately $16,699,000 with net unrealized appreciation of approximately $6,000. Does not include open swap agreements with total unrealized depreciation of approximately $23,000.
The accompanying notes are an integral part of the financial statements.
14
Morgan Stanley Institutional Fund Trust
Annual Report — September 30, 2017
| Statement of Assets and Liabilities | | September 30, 2017
(000) | |
Assets: | |
Investments in Securities of Unaffiliated Issuers, at Value(1) (Cost $46,465) | | $ | 47,751 | | |
Investment in Security of Affiliated Issuer, at Value (Cost $1,286) | | | 1,286 | | |
Total Investments in Securities, at Value (Cost $47,751) | | | 49,037 | | |
Interest Receivable | | | 416 | | |
Receivable for Investments Sold | | | 321 | | |
Due from Adviser | | | 66 | | |
Receivable for Fund Shares Sold | | | 53 | | |
Receivable for Variation Margin on Futures Contracts | | | 11 | | |
Premium Paid on Open Swap Agreements | | | 4 | | |
Receivable from Affiliate | | | 1 | | |
Receivable for Variation Margin on Swap Agreements | | | 1 | | |
Other Assets | | | 45 | | |
Total Assets | | | 49,955 | | |
Liabilities: | |
Collateral on Securities Loaned, at Value | | | 788 | | |
Payable for Investments Purchased | | | 313 | | |
Payable for Trustees' Fees and Expenses | | | 27 | | |
Payable for Professional Fees | | | 21 | | |
Payable for Sub Transfer Agency Fees — Class I | | | 7 | | |
Payable for Sub Transfer Agency Fees — Class A | | | 2 | | |
Payable for Sub Transfer Agency Fees — Class L | | | — | @ | |
Payable for Sub Transfer Agency Fees — Class C | | | — | @ | |
Payable for Custodian Fees | | | 7 | | |
Unrealized Depreciation on Swap Agreements | | | 7 | | |
Payable for Transfer Agency Fees — Class I | | | 4 | | |
Payable for Transfer Agency Fees — Class A | | | 1 | | |
Payable for Transfer Agency Fees — Class L | | | 1 | | |
Payable for Transfer Agency Fees — Class C | | | 1 | | |
Payable for Administration Fees | | | 3 | | |
Payable for Shareholder Services Fees — Class A | | | 1 | | |
Payable for Distribution and Shareholder Services Fees — Class L | | | 1 | | |
Payable for Distribution and Shareholder Services Fees — Class C | | | 1 | | |
Payable for Fund Shares Redeemed | | | 2 | | |
Other Liabilities | | | 31 | | |
Total Liabilities | | | 1,218 | | |
Net Assets | | $ | 48,737 | | |
Net Assets Consist of: | |
Paid-in-Capital | | $ | 55,181 | | |
Accumulated Undistributed Net Investment Income | | | 433 | | |
Accumulated Net Realized Loss | | | (8,146 | ) | |
Unrealized Appreciation (Depreciation) on: | |
Investments | | | 1,286 | | |
Futures Contracts | | | 6 | | |
Swap Agreements | | | (23 | ) | |
Net Assets | | $ | 48,737 | | |
The accompanying notes are an integral part of the financial statements.
15
Morgan Stanley Institutional Fund Trust
Annual Report — September 30, 2017
Statement of Assets and Liabilities (cont'd) | | September 30, 2017
(000) | |
CLASS I: | |
Net Assets | | $ | 37,993 | | |
| Shares Outstanding (unlimited number of shares authorized, no par value) (not in 000's) | | | 3,084,654 | | |
Net Asset Value, Offering and Redemption Price Per Share | | $ | 12.32 | | |
CLASS A: | |
Net Assets | | $ | 7,911 | | |
| Shares Outstanding (unlimited number of shares authorized, no par value) (not in 000's) | | | 641,921 | | |
Net Asset Value, Redemption Price Per Share | | $ | 12.32 | | |
Maximum Sales Load | | | 4.25 | % | |
Maximum Sales Charge | | $ | 0.55 | | |
Maximum Offering Price Per Share | | $ | 12.87 | | |
CLASS L: | |
Net Assets | | $ | 1,749 | | |
| Shares Outstanding (unlimited number of shares authorized, no par value) (not in 000's) | | | 142,158 | | |
Net Asset Value, Offering and Redemption Price Per Share | | $ | 12.30 | | |
CLASS C: | |
Net Assets | | $ | 1,084 | | |
Shares Outstanding (unlimited number of shares authorized, no par value) (not in 000's) | | | 88,512 | | |
Net Asset Value, Offering and Redemption Price Per Share | | $ | 12.25 | | |
(1) Including:
Securities on Loan, at Value: | | $ | 1,376 | | |
@ Amount is less than $500.
The accompanying notes are an integral part of the financial statements.
16
Morgan Stanley Institutional Fund Trust
Annual Report — September 30, 2017
Statement of Operations | | Year Ended
September 30, 2017
(000) | |
Investment Income: | |
Interest from Securities of Unaffiliated Issuers | | $ | 1,534 | | |
Dividends from Security of Affiliated Issuer (Note G) | | | 7 | | |
Income from Securities Loaned — Net | | | 5 | | |
Total Investment Income | | | 1,546 | | |
Expenses: | |
Advisory Fees (Note B) | | | 164 | | |
Professional Fees | | | 136 | | |
Registration Fees | | | 53 | | |
Sub Transfer Agency Fees — Class I | | | 28 | | |
Sub Transfer Agency Fees — Class A | | | 14 | | |
Sub Transfer Agency Fees — Class L | | | 1 | | |
Sub Transfer Agency Fees — Class C | | | — | @ | |
Pricing Fees | | | 40 | | |
Administration Fees (Note C) | | | 35 | | |
Shareholder Services Fees — Class A (Note D) | | | 19 | | |
Distribution and Shareholder Services Fees — Class L (Note D) | | | 9 | | |
Distribution and Shareholder Services Fees — Class C (Note D) | | | 4 | | |
Shareholder Reporting Fees | | | 26 | | |
Custodian Fees (Note F) | | | 19 | | |
Transfer Agency Fees — Class I (Note E) | | | 10 | | |
Transfer Agency Fees — Class A (Note E) | | | 3 | | |
Transfer Agency Fees — Class L (Note E) | | | 2 | | |
Transfer Agency Fees — Class C (Note E) | | | 2 | | |
Trustees' Fees and Expenses | | | 4 | | |
Other Expenses | | | 26 | | |
Total Expenses | | | 595 | | |
Waiver of Advisory Fees (Note B) | | | (164 | ) | |
Reimbursement of Class Specific Expenses — Class I (Note B) | | | (38 | ) | |
Reimbursement of Class Specific Expenses — Class A (Note B) | | | (2 | ) | |
Reimbursement of Class Specific Expenses — Class C (Note B) | | | (2 | ) | |
Expenses Reimbursed by Adviser (Note B) | | | (33 | ) | |
Waiver of Shareholder Services Fees — Class A (Note D) | | | (8 | ) | |
Rebate from Morgan Stanley Affiliate (Note G) | | | (2 | ) | |
Net Expenses | | | 346 | | |
Net Investment Income | | | 1,200 | | |
Realized Gain (Loss): | |
Investments Sold | | | 620 | | |
Futures Contracts | | | 129 | | |
Swap Agreements | | | (11 | ) | |
Net Realized Gain | | | 738 | | |
Change in Unrealized Appreciation (Depreciation): | |
Investments | | | (608 | ) | |
Futures Contracts | | | 13 | | |
Swap Agreements | | | (14 | ) | |
Net Change in Unrealized Appreciation (Depreciation) | | | (609 | ) | |
Net Realized Gain and Change in Unrealized Appreciation (Depreciation) | | | 129 | | |
Net Increase in Net Assets Resulting from Operations | | $ | 1,329 | | |
@ Amount is less than $500.
The accompanying notes are an integral part of the financial statements.
17
Morgan Stanley Institutional Fund Trust
Annual Report — September 30, 2017
Statements of Changes in Net Assets | | Year Ended
September 30, 2017
(000) | | Year Ended
September 30, 2016
(000) | |
Increase (Decrease) in Net Assets: | |
Operations: | |
Net Investment Income | | $ | 1,200 | | | $ | 1,129 | | |
Net Realized Gain | | | 738 | | | | 2,314 | | |
Net Change in Unrealized Appreciation (Depreciation) | | | (609 | ) | | | 2,386 | | |
Net Increase in Net Assets Resulting from Operations | | | 1,329 | | | | 5,829 | | |
Distributions from and/or in Excess of: | |
Class I: | |
Net Investment Income | | | (987 | ) | | | (954 | ) | |
Class A: | |
Net Investment Income | | | (198 | ) | | | (59 | ) | |
Class L: | |
Net Investment Income | | | (46 | ) | | | (51 | ) | |
Class C: | |
Net Investment Income | | | (6 | ) | | | (1 | ) | |
Total Distributions | | | (1,237 | ) | | | (1,065 | ) | |
Capital Share Transactions:(1) | |
Class I: | |
Subscribed | | | 11,336 | | | | 3,997 | | |
Distributions Reinvested | | | 981 | | | | 952 | | |
Redeemed | | | (6,291 | ) | | | (8,505 | ) | |
Class A: | |
Subscribed | | | 5,810 | | | | 6,507 | | |
Distributions Reinvested | | | 198 | | | | 57 | | |
Redeemed | | | (5,019 | ) | | | (676 | ) | |
Class L: | |
Exchanged | | | — | | | | 12 | | |
Distributions Reinvested | | | 46 | | | | 51 | | |
Redeemed | | | (432 | ) | | | (345 | ) | |
Class C: | |
Subscribed | | | 971 | | | | 211 | | |
Distributions Reinvested | | | 5 | | | | 1 | | |
Redeemed | | | (26 | ) | | | (104 | ) | |
Net Increase in Net Assets Resulting from Capital Share Transactions | | | 7,579 | | | | 2,158 | | |
Total Increase in Net Assets | | | 7,671 | | | | 6,922 | | |
Net Assets: | |
Beginning of Period | | | 41,066 | | | | 34,144 | | |
End of Period (Including Accumulated Undistributed Net Investment Income of $433 and $486) | | $ | 48,737 | | | $ | 41,066 | | |
(1) Capital Share Transactions: | |
Class I: | |
Shares Subscribed | | | 941 | | | | 357 | | |
Shares Issued on Distributions Reinvested | | | 82 | | | | 86 | | |
Shares Redeemed | | | (524 | ) | | | (767 | ) | |
Net Increase (Decrease) in Class I Shares Outstanding | | | 499 | | | | (324 | ) | |
Class A: | |
Shares Subscribed | | | 483 | | | | 564 | | |
Shares Issued on Distributions Reinvested | | | 16 | | | | 5 | | |
Shares Redeemed | | | (418 | ) | | | (59 | ) | |
Net Increase in Class A Shares Outstanding | | | 81 | | | | 510 | | |
Class L: | |
Shares Exchanged | | | — | | | | 1 | | |
Shares Issued on Distributions Reinvested | | | 4 | | | | 5 | | |
Shares Redeemed | | | (36 | ) | | | (32 | ) | |
Net Decrease in Class L Shares Outstanding | | | (32 | ) | | | (26 | ) | |
Class C: | |
Shares Subscribed | | | 80 | | | | 18 | | |
Shares Issued on Distributions Reinvested | | | — | @@ | | | — | @@ | |
Shares Redeemed | | | (2 | ) | | | (9 | ) | |
Net Increase in Class C Shares Outstanding | | | 78 | | | | 9 | | |
@@ Amount is less than 500 shares.
The accompanying notes are an integral part of the financial statements.
18
Morgan Stanley Institutional Fund Trust
Annual Report — September 30, 2017
Financial Highlights
Corporate Bond Portfolio
| | | Class I | |
| | | Year Ended September 30, | |
Selected Per Share Data and Ratios | | 2017 | | 2016(1) | | 2015 | | 2014 | | 2013 | |
Net Asset Value, Beginning of Period | | $ | 12.33 | | | $ | 10.80 | | | $ | 11.12 | | | $ | 10.53 | | | $ | 10.93 | | |
Income (Loss) from Investment Operations: | |
Net Investment Income(2) | | | 0.34 | | | | 0.37 | | | | 0.37 | | | | 0.38 | | | | 0.32 | | |
Net Realized and Unrealized Gain (Loss) | | | 0.01 | | | | 1.51 | | | | (0.37 | ) | | | 0.53 | | | | (0.40 | ) | |
Total from Investment Operations | | | 0.35 | | | | 1.88 | | | | — | | | | 0.91 | | | | (0.08 | ) | |
Distributions from and/or in Excess of: | |
Net Investment Income | | | (0.36 | ) | | | (0.35 | ) | | | (0.32 | ) | | | (0.32 | ) | | | (0.32 | ) | |
Net Asset Value, End of Period | | $ | 12.32 | | | $ | 12.33 | | | $ | 10.80 | | | $ | 11.12 | | | $ | 10.53 | | |
Total Return(3) | | | 2.95 | %(4) | | | 17.79 | %(5) | | | (0.04 | )% | | | 8.79 | % | | | (0.77 | )% | |
Ratios and Supplemental Data: | |
Net Assets, End of Period (Thousands) | | $ | 37,993 | | | $ | 31,873 | | | $ | 31,427 | | | $ | 36,598 | | | $ | 36,186 | | |
Ratio of Expenses to Average Net Assets(9) | | | 0.70 | %(6) | | | 0.69 | %(6) | | | 0.70 | %(6) | | | 0.70 | %(6) | | | 1.18 | %(6)(7) | |
Ratio of Net Investment Income to Average Net Assets(9) | | | 2.85 | %(6) | | | 3.28 | %(6) | | | 3.33 | %(6) | | | 3.47 | %(6) | | | 2.91 | %(6)(7) | |
Ratio of Rebate from Morgan Stanley Affiliates to Average Net Assets | | | 0.00 | %(8) | | | 0.01 | % | | | 0.00 | %(8) | | | 0.00 | %(8) | | | 0.00 | %(8) | |
Portfolio Turnover Rate | | | 33 | % | | | 41 | % | | | 45 | % | | | 50 | % | | | 63 | % | |
(9) Supplemental Information on the Ratios to Average Net Assets: | |
Ratios Before Expense Limitation: | |
Expenses to Average Net Assets | | | 1.26 | % | | | 1.28 | % | | | 1.15 | % | | | 1.13 | % | | | 1.21 | % | |
Net Investment Income to Average Net Assets | | | 2.29 | % | | | 2.69 | % | | | 2.88 | % | | | 3.04 | % | | | 2.88 | % | |
(1) Reflects prior period custodian out-of-pocket expenses that were reimbursed in September 2016. The amount of the reimbursement was immaterial on a per share basis and did not impact the total return of Class I shares. The Ratio of Expenses to Average Net Assets and the Ratio of Net Investment Income to Average Net Assets would be unchanged as the reimbursement of custodian fees was offset against expense waivers/reimbursements with no impact to net expenses or net investment income.
(2) Per share amount is based on average shares outstanding.
(3) Calculated based on the net asset value as of the last business day of the period.
(4) Performance was positively impacted by approximately 0.85% due to the receipt of proceeds from the settlement of class action suits involving the Fund's past holdings. These were one-time settlements, and as a result, the impact on the NAV and consequently the performance will not likely be repeated in the future. Had these settlements not occurred, the total return for Class I shares would have been approximately 2.10%.
(5) Performance was positively impacted by approximately 9.01% due to the receipt of proceeds from the settlement of class action suits involving the Fund's past holdings. These were one-time settlements, and as a result, the impact on the NAV and consequently the performance will not likely be repeated in the future. Had these settlements not occurred, the total return for Class I shares would have been approximately 8.78%.
(6) The Ratios of Expenses and Net Investment Income reflect the rebate of certain Fund expenses in connection with the investments in Morgan Stanley affiliates during the period. The effect of the rebate on the ratios is disclosed in the above table as "Ratio of Rebate from Morgan Stanley Affiliates to Average Net Assets."
(7) Effective September 16, 2013, the Adviser has agreed to limit the ratio of expenses to average net assets to the maximum ratio of 0.70% for Class I shares.
(8) Amount is less than 0.005%.
The accompanying notes are an integral part of the financial statements.
19
Morgan Stanley Institutional Fund Trust
Annual Report — September 30, 2017
Financial Highlights
Corporate Bond Portfolio
| | | Class A | |
| | | Year Ended September 30, | |
Selected Per Share Data and Ratios | | 2017 | | 2016(1) | | 2015 | | 2014 | | 2013 | |
Net Asset Value, Beginning of Period | | $ | 12.34 | | | $ | 10.81 | | | $ | 11.12 | | | $ | 10.53 | | | $ | 10.92 | | |
Income (Loss) from Investment Operations: | |
Net Investment Income(2) | | | 0.30 | | | | 0.32 | | | | 0.33 | | | | 0.34 | | | | 0.30 | | |
Net Realized and Unrealized Gain (Loss) | | | (0.00 | )(3) | | | 1.53 | | | | (0.37 | ) | | | 0.53 | | | | (0.39 | ) | |
Total from Investment Operations | | | 0.30 | | | | 1.85 | | | | (0.04 | ) | | | 0.87 | | | | (0.09 | ) | |
Distributions from and/or in Excess of: | |
Net Investment Income | | | (0.32 | ) | | | (0.32 | ) | | | (0.27 | ) | | | (0.28 | ) | | | (0.30 | ) | |
Net Asset Value, End of Period | | $ | 12.32 | | | $ | 12.34 | | | $ | 10.81 | | | $ | 11.12 | | | $ | 10.53 | | |
Total Return(4) | | | 2.54 | %(5) | | | 17.41 | %(6) | | | (0.37 | )% | | | 8.43 | % | | | (0.83 | )% | |
Ratios and Supplemental Data: | |
Net Assets, End of Period (Thousands) | | $ | 7,911 | | | $ | 6,916 | | | $ | 544 | | | $ | 405 | | | $ | 1,194 | | |
Ratio of Expenses to Average Net Assets(10) | | | 1.05 | %(7) | | | 0.99 | %(7) | | | 1.05 | %(7) | | | 1.05 | %(7) | | | 1.34 | %(7)(8) | |
Ratio of Net Investment Income to Average Net Assets(10) | | | 2.50 | %(7) | | | 2.78 | %(7) | | | 2.98 | %(7) | | | 3.12 | %(7) | | | 2.76 | %(7)(8) | |
Ratio of Rebate from Morgan Stanley Affiliates to Average Net Assets | | | 0.00 | %(9) | | | 0.01 | % | | | 0.00 | %(9) | | | 0.00 | %(9) | | | 0.00 | %(9) | |
Portfolio Turnover Rate | | | 33 | % | | | 41 | % | | | 45 | % | | | 50 | % | | | 63 | % | |
(10) Supplemental Information on the Ratios to Average Net Assets: | |
Ratios Before Expense Limitation: | |
Expenses to Average Net Assets | | | 1.62 | % | | | 1.51 | % | | | 1.88 | % | | | 1.60 | % | | | 1.47 | % | |
Net Investment Income to Average Net Assets | | | 1.93 | % | | | 2.26 | % | | | 2.15 | % | | | 2.57 | % | | | 2.63 | % | |
(1) Reflects prior period custodian out-of-pocket expenses that were reimbursed in September 2016. The amount of the reimbursement was immaterial on a per share basis and did not impact the total return of Class A shares. The Ratio of Expenses to Average Net Assets and the Ratio of Net Investment Income to Average Net Assets would be unchanged as the reimbursement of custodian fees was offset against expense waivers/reimbursements with no impact to net expenses or net investment income.
(2) Per share amount is based on average shares outstanding.
(3) Amount is less than $0.005 per share.
(4) Calculated based on the net asset value which does not reflect sales charges, if applicable, as of the last business day of the period.
(5) Performance was positively impacted by approximately 0.85% due to the receipt of proceeds from the settlement of class action suits involving the Fund's past holdings. These were one-time settlements, and as a result, the impact on the NAV and consequently the performance will not likely be repeated in the future. Had these settlements not occurred, the total return for Class A shares would have been approximately 1.69%.
(6) Performance was positively impacted by approximately 8.97% due to the receipt of proceeds from the settlement of class action suits involving the Fund's past holdings. These were one-time settlements, and as a result, the impact on the NAV and consequently the performance will not likely be repeated in the future. Had these settlements not occurred, the total return for Class A shares would have been approximately 8.44%.
(7) The Ratios of Expenses and Net Investment Income reflect the rebate of certain Fund expenses in connection with the investments in Morgan Stanley affiliates during the period. The effect of the rebate on the ratios is disclosed in the above table as "Ratio of Rebate from Morgan Stanley Affiliates to Average Net Assets."
(8) Effective September 16, 2013, the Adviser has agreed to limit the ratio of expenses to average net assets to the maximum ratio of 1.05% for Class A shares.
(9) Amount is less than 0.005%.
The accompanying notes are an integral part of the financial statements.
20
Morgan Stanley Institutional Fund Trust
Annual Report — September 30, 2017
Financial Highlights
Corporate Bond Portfolio
| | | Class L | |
| | | Year Ended September 30, | |
Selected Per Share Data and Ratios | | 2017 | | 2016(1) | | 2015 | | 2014 | | 2013 | |
Net Asset Value, Beginning of Period | | $ | 12.32 | | | $ | 10.79 | | | $ | 11.11 | | | $ | 10.52 | | | $ | 10.92 | | |
Income (Loss) from Investment Operations: | |
Net Investment Income(2) | | | 0.26 | | | | 0.30 | | | | 0.30 | | | | 0.31 | | | | 0.26 | | |
Net Realized and Unrealized Gain (Loss) | | | (0.00 | )(3) | | | 1.51 | | | | (0.37 | ) | | | 0.54 | | | | (0.40 | ) | |
Total from Investment Operations | | | 0.26 | | | | 1.81 | | | | (0.07 | ) | | | 0.85 | | | | (0.14 | ) | |
Distributions from and/or in Excess of: | |
Net Investment Income | | | (0.28 | ) | | | (0.28 | ) | | | (0.25 | ) | | | (0.26 | ) | | | (0.26 | ) | |
Net Asset Value, End of Period | | $ | 12.30 | | | $ | 12.32 | | | $ | 10.79 | | | $ | 11.11 | | | $ | 10.52 | | |
Total Return(4) | | | 2.20 | %(5) | | | 17.06 | %(6) | | | (0.65 | )% | | | 8.15 | % | | | (1.28 | )% | |
Ratios and Supplemental Data: | |
Net Assets, End of Period (Thousands) | | $ | 1,749 | | | $ | 2,151 | | | $ | 2,163 | | | $ | 2,405 | | | $ | 2,649 | | |
Ratio of Expenses to Average Net Assets(10) | | | 1.34 | %(7) | | | 1.33 | %(7) | | | 1.31 | %(7) | | | 1.30 | %(7) | | | 1.69 | %(7)(8) | |
Ratio of Net Investment Income to Average Net Assets(10) | | | 2.20 | %(7) | | | 2.64 | %(7) | | | 2.72 | %(7) | | | 2.87 | %(7) | | | 2.40 | %(7)(8) | |
Ratio of Rebate from Morgan Stanley Affiliates to Average Net Assets | | | 0.01 | % | | | 0.01 | % | | | 0.00 | %(9) | | | 0.00 | %(9) | | | 0.00 | %(9) | |
Portfolio Turnover Rate | | | 33 | % | | | 41 | % | | | 45 | % | | | 50 | % | | | 63 | % | |
(10) Supplemental Information on the Ratios to Average Net Assets: | |
Ratios Before Expense Limitation: | |
Expenses to Average Net Assets | | | 1.80 | % | | | 1.75 | % | | | 1.73 | % | | | 1.66 | % | | | 1.70 | % | |
Net Investment Income to Average Net Assets | | | 1.74 | % | | | 2.22 | % | | | 2.30 | % | | | 2.51 | % | | | 2.39 | % | |
(1) Reflects prior period custodian out-of-pocket expenses that were reimbursed in September 2016. The amount of the reimbursement was immaterial on a per share basis and did not impact the total return of Class L shares. The Ratio of Expenses to Average Net Assets and the Ratio of Net Investment Income to Average Net Assets would be unchanged as the reimbursement of custodian fees was offset against expense waivers/reimbursements with no impact to net expenses or net investment income.
(2) Per share amount is based on average shares outstanding.
(3) Amount is less than $0.005 per share.
(4) Calculated based on the net asset value as of the last business day of the period.
(5) Performance was positively impacted by approximately 0.84% due to the receipt of proceeds from the settlement of class action suits involving the Fund's past holdings. These were one-time settlements, and as a result, the impact on the NAV and consequently the performance will not likely be repeated in the future. Had these settlements not occurred, the total return for Class L shares would have been approximately 1.36%.
(6) Performance was positively impacted by approximately 9.05% due to the receipt of proceeds from the settlement of class action suits involving the Fund's past holdings. These were one-time settlements, and as a result, the impact on the NAV and consequently the performance will not likely be repeated in the future. Had these settlements not occurred, the total return for Class L shares would have been approximately 8.01%.
(7) The Ratios of Expenses and Net Investment Income reflect the rebate of certain Fund expenses in connection with the investments in Morgan Stanley affiliates during the period. The effect of the rebate on the ratios is disclosed in the above table as "Ratio of Rebate from Morgan Stanley Affiliates to Average Net Assets."
(8) Effective September 16, 2013, the Adviser has agreed to limit the ratio of expenses to average net assets to the maximum ratio of 1.52% for Class L shares.
(9) Amount is less than 0.005%.
The accompanying notes are an integral part of the financial statements.
21
Morgan Stanley Institutional Fund Trust
Annual Report — September 30, 2017
Financial Highlights
Corporate Bond Portfolio
| | | Class C | |
| | | Year Ended September 30, | | Period from
April 30, 2015(2) to | |
Selected Per Share Data and Ratios | | 2017 | | 2016(1) | | September 30, 2015 | |
Net Asset Value, Beginning of Period | | $ | 12.27 | | | $ | 10.77 | | | $ | 11.21 | | |
Income (Loss) from Investment Operations: | |
Net Investment Income(3) | | | 0.21 | | | | 0.22 | | | | 0.10 | | |
Net Realized and Unrealized Gain (Loss) | | | 0.00 | (4) | | | 1.53 | | | | (0.48 | ) | |
Total from Investment Operations | | | 0.21 | | | | 1.75 | | | | (0.38 | ) | |
Distributions from and/or in Excess of: | |
Net Investment Income | | | (0.23 | ) | | | (0.25 | ) | | | (0.06 | ) | |
Net Asset Value, End of Period | | $ | 12.25 | | | $ | 12.27 | | | $ | 10.77 | | |
Total Return(5) | | | 1.81 | %(6) | | | 16.47 | %(7) | | | (3.40 | )%(10) | |
Ratios and Supplemental Data: | |
Net Assets, End of Period (Thousands) | | $ | 1,084 | | | $ | 126 | | | $ | 10 | | |
Ratio of Expenses to Average Net Assets(12) | | | 1.80 | %(8) | | | 1.79 | %(8) | | | 1.80 | %(8)(11) | |
Ratio of Net Investment Income to Average Net Assets(12) | | | 1.71 | %(8) | | | 1.90 | %(8) | | | 2.25 | %(8)(11) | |
Ratio of Rebate from Morgan Stanley Affiliates to Average Net Assets | | | 0.00 | %(9) | | | 0.01 | % | | | 0.00 | %(9)(11) | |
Portfolio Turnover Rate | | | 33 | % | | | 41 | % | | | 45 | %(10) | |
(12) Supplemental Information on the Ratios to Average Net Assets: | |
Ratios Before Expense Limitation: | |
Expenses to Average Net Assets | | | 2.82 | % | | | 4.45 | % | | | 38.20 | %(11) | |
Net Investment Income (Loss) to Average Net Assets | | | 0.69 | % | | | (0.76 | )% | | | (34.15 | )%(11) | |
(1) Reflects prior period custodian out-of-pocket expenses that were reimbursed in September 2016. The amount of the reimbursement was immaterial on a per share basis and did not impact the total return of Class C shares. The Ratio of Expenses to Average Net Assets and the Ratio of Net Investment Income to Average Net Assets would be unchanged as the reimbursement of custodian fees was offset against expense waivers/reimbursements with no impact to net expenses or net investment income.
(2) Commencement of Offering.
(3) Per share amount is based on average shares outstanding.
(4) Amount is less than $0.005 per share.
(5) Calculated based on the net asset value which does not reflect sales charges, if applicable, as of the last business day of the period.
(6) Performance was positively impacted by approximately 0.85% due to the receipt of proceeds from the settlement of class action suits involving the Fund's past holdings. These were one-time settlements, and as a result, the impact on the NAV and consequently the performance will not likely be repeated in the future. Had these settlements not occurred, the total return for Class C shares would have been approximately 0.96%.
(7) Performance was positively impacted by approximately 8.85% due to the receipt of proceeds from the settlement of class action suits involving the Fund's past holdings. These were one-time settlements, and as a result, the impact on the NAV and consequently the performance will not likely be repeated in the future. Had these settlements not occurred, the total return for Class C shares would have been approximately 7.62%.
(8) The Ratios of Expenses and Net Investment Income reflect the rebate of certain Fund expenses in connection with the investments in Morgan Stanley affiliates during the period. The effect of the rebate on the ratios is disclosed in the above table as "Ratio of Rebate from Morgan Stanley Affiliates to Average Net Assets."
(9) Amount is less than 0.005%.
(10) Not annualized.
(11) Annualized.
The accompanying notes are an integral part of the financial statements.
22
Morgan Stanley Institutional Fund Trust
Annual Report — September 30, 2017
Notes to Financial Statements
Morgan Stanley Institutional Fund Trust ("Trust'') is registered under the Investment Company Act of 1940, as amended (the "Act''), as an open-end management investment company. The Trust is comprised of nine separate, active funds (individually referred to as a "Fund", collectively as the "Funds"). The Trust applies investment company accounting and reporting guidance. All Funds are considered diversified for purposes of the Act.
The accompanying financial statements relate to the Corporate Bond Portfolio. The Portfolio seeks above-average total return over a market cycle of three to five years. The Portfolio offers four classes of shares — Class I, Class A, Class L and Class C.
The Fund has suspended offering Class L shares for sale to all investors. Class L shareholders of the Fund do not have the option of purchasing additional Class L shares. However, existing Class L shareholders may invest in additional Class L shares through reinvestment of dividends and distributions.
A. Significant Accounting Policies: The following significant accounting policies are in conformity with U.S. generally accepted accounting principles ("GAAP"). Such policies are consistently followed by the Trust in the preparation of its financial statements. GAAP may require management to make estimates and assumptions that affect the reported amounts and disclosures in the financial statements. Actual results may differ from those estimates.
1. Security Valuation: (1) Certain portfolio securities may be valued by an outside pricing service/vendor approved by the Trust's Board of Trustees (the "Trustees"). The pricing service/vendor may employ a pricing model that takes into account, among other things, bids, yield spreads, and/or other market data and specific security characteristics. Alternatively, if a valuation is not available from an outside pricing service/vendor, and the security trades on an exchange, the security may be valued at its latest reported sale price (or at the exchange official closing price if such exchange reports an official closing price), prior to the time when assets are valued. If there are no sales on a given day and if there is no official exchange closing price for that day, the security is valued at the mean between the last reported bid and asked prices if such bid and asked prices are available in the relevant exchanges; (2) futures are valued at the settlement price on the exchange on which they trade or, if a settlement price is unavailable, at the last sale price on the exchange; (3) over-the-counter ("OTC") swaps may be valued by an outside pricing service approved by the Trustees or quotes from a broker or dealer. Swaps cleared
on a clearinghouse or exchange may be valued using the closing price provided by the clearinghouse or exchange; (4) when market quotations are not readily available, including circumstances under which Morgan Stanley Investment Management Inc. (the "Adviser") determines that the closing price, last sale price or the mean between the last reported bid and asked prices are not reflective of a security's market value, portfolio securities are valued at their fair value as determined in good faith under procedures established by and under the general supervision of the Trustees. Occasionally, developments affecting the closing prices of securities and other assets may occur between the times at which valuations of such securities are determined (that is, close of the foreign market on which the securities trade) and the close of business of the New York Stock Exchange ("NYSE"). If developments occur during such periods that are expected to materially affect the value of such securities, such valuations may be adjusted to reflect the estimated fair value of such securities as of the close of the NYSE, as determined in good faith by the Trustees or by the Adviser using a pricing service and/or procedures approved by the Trustees; and (5) investments in mutual funds, including the Morgan Stanley Institutional Liquidity Funds, are valued at the net asset value ("NAV") as of the close of each business day.
The Trustees have responsibility for determining in good faith the fair value of the investments, and the Trustees may appoint others, such as the Trust's Adviser or a valuation committee, to assist the Trustees in determining fair value and to make the actual calculations pursuant to the fair valuation methodologies previously approved by the Trustees. Under procedures approved by the Trustees, the Trust's Adviser has formed a Valuation Committee whose members are approved by the Trustees. The Valuation Committee provides administration and oversight of the Trust's valuation policies and procedures, which are reviewed at least annually by the Trustees. These procedures allow the Trust to utilize independent pricing services, quotations from securities and financial instrument dealers, and other market sources to determine fair value.
The Trust has procedures to determine the fair value of securities and other financial instruments for which market prices are not readily available. Under these procedures, the Valuation Committee convenes on a regular and ad hoc basis to review such securities and considers
23
Morgan Stanley Institutional Fund Trust
Annual Report — September 30, 2017
Notes to Financial Statements (cont'd)
a number of factors, including valuation methodologies and significant unobservable valuation inputs, when arriving at fair value. The Valuation Committee may employ a market-based approach which may use related or comparable assets or liabilities, recent transactions, market multiples, book values, and other relevant information for the investment to determine the fair value of the investment. An income-based valuation approach may also be used in which the anticipated future cash flows of the investment are discounted to calculate fair value. Discounts may also be applied due to the nature or duration of any restrictions on the disposition of the investments. Due to the inherent uncertainty of valuations of such investments, the fair values may differ significantly from the values that would have been used had an active market existed. The Valuation Committee employs various methods for calibrating these valuation approaches including a regular review of valuation methodologies, key inputs and assumptions, transactional back-testing or disposition analysis, and reviews of any related market activity.
2. Fair Value Measurement: Financial Accounting Standards Board ("FASB") Accounting Standards CodificationTM ("ASC") 820, "Fair Value Measurement" ("ASC 820"), defines fair value as the value that the Fund would receive to sell an investment or pay to transfer a liability in a timely transaction with an independent buyer in the principal market, or in the absence of a principal market, the most advantageous market for the investment or liability. ASC 820 establishes a three-tier hierarchy to distinguish between (1) inputs that reflect the assumptions market participants would use in valuing an asset or liability developed based on market data obtained from sources independent of the reporting entity (observable inputs) and (2) inputs that reflect the reporting entity's own assumptions about the assumptions market participants would use in valuing an asset or liability developed based on the best information available in the circumstances (unobservable inputs) and to establish classification of fair value measurements for disclosure purposes. Various inputs are used in determining the value of the Fund's investments. The inputs are summarized in the three broad levels listed below.
• Level 1 – unadjusted quoted prices in active markets for identical investments
• Level 2 – other significant observable inputs (including quoted prices for similar investments, interest rates, prepayment speeds, credit risk, etc.)
• Level 3 – significant unobservable inputs including the Fund's own assumptions in determining the fair value of investments. Factors considered in making this determination may include, but are not limited to, information obtained by contacting the issuer, analysts, or the appropriate stock exchange (for exchange-traded securities), analysis of the issuer's financial statements or other available documents and, if necessary, available information concerning other securities in similar circumstances
The inputs or methodology used for valuing securities are not necessarily an indication of the risk associated with investing in those securities and the determination of the significance of a particular input to the fair value measurement in its entirety requires judgment and considers factors specific to each security.
The following is a summary of the inputs used to value the Fund's investments as of September 30, 2017.
Investment Type | | Level 1
Unadjusted
quoted
prices
(000) | | Level 2
Other
significant
observable
inputs
(000) | | Level 3
Significant
unobservable
inputs
(000) | | Total
(000) | |
Assets: | |
Fixed Income Securities | |
Asset-Backed Securities | | $ | — | | | $ | 271 | | | $ | — | | | $ | 271 | | |
Corporate Bonds | | | — | | | | 47,123 | | | | — | | | | 47,123 | | |
Total Fixed Income
Securities | | | — | | | | 47,394 | | | | — | | | | 47,394 | | |
Short-Term Investments | |
Investment Company | | | 1,286 | | | | — | | | | — | | | | 1,286 | | |
U.S. Treasury Security | | | — | | | | 357 | | | | — | | | | 357 | | |
Total Short-Term
Investments | | | 1,286 | | | | 357 | | | | — | | | | 1,643 | | |
Futures Contracts | | | 78 | | | | — | | | | — | | | | 78 | | |
Total Assets | | | 1,364 | | | | 47,751 | | | | — | | | | 49,115 | | |
Liabilities: | |
Futures Contracts | | | (72 | ) | | | — | | | | — | | | | (72 | ) | |
Credit Default Swap
Agreement | | | — | | | | (7 | ) | | | — | | | | (7 | ) | |
Interest Rate Swap
Agreement | | | — | | | | (16 | ) | | | — | | | | (16 | ) | |
Total Liabilities | | | (72 | ) | | | (23 | ) | | | — | | | | (95 | ) | |
Total | | $ | 1,292 | | | $ | 47,728 | | | $ | — | | | $ | 49,020 | | |
24
Morgan Stanley Institutional Fund Trust
Annual Report — September 30, 2017
Notes to Financial Statements (cont'd)
Transfers between investment levels may occur as the markets fluctuate and/or the availability of data used in an investment's valuation changes. The Fund recognizes transfers between the levels as of the end of the period. As of September 30, 2017, the Fund did not have any investments transfer between investment levels.
3. Derivatives: The Fund may, but is not required to, use derivative instruments for a variety of purposes, including hedging, risk management, portfolio management or to earn income. Derivatives are financial instruments whose value is based, in part, on the value of an underlying asset, interest rate, index or financial instrument. Prevailing interest rates and volatility levels, among other things, also affect the value of derivative instruments. A derivative instrument often has risks similar to its underlying asset and may have additional risks, including imperfect correlation between the value of the derivative and the underlying asset, risks of default by the counterparty to certain transactions, magnification of losses incurred due to changes in the market value of the securities, instruments, indices or interest rates to which the derivative instrument relates, risks that the transactions may not be liquid and risks arising from margin requirements. The use of derivatives involves risks that are different from, and possibly greater than, the risks associated with other portfolio investments. Derivatives may involve the use of highly specialized instruments that require investment techniques and risk analyses different from those associated with other portfolio investments. All of the Fund's holdings, including derivative instruments, are marked-to-market each day with the change in value reflected in unrealized appreciation (depreciation). Upon disposition, a realized gain or loss is recognized.
Certain derivative transactions may give rise to a form of leverage. Leverage magnifies the potential for gain and the risk of loss. Leverage associated with derivative transactions may cause the Fund to liquidate portfolio positions when it may not be advantageous to do so to satisfy its obligations or to meet earmarking or segregation requirements, pursuant to applicable Securities and Exchange Commission ("SEC") rules and regulations, or may cause the Fund to be more volatile than if the Fund had not been leveraged. Although the Adviser seeks to use derivatives to further the Fund's investment objectives, there is no assurance that the use of derivatives will achieve this result.
Following is a description of the derivative instruments and techniques that the Fund used during the period and their associated risks:
Futures: A futures contract is a standardized, exchange-traded agreement to buy or sell a specific quantity of an underlying asset, reference rate or index at a specific price at a specific future time. The value of a futures contract tends to increase and decrease in tandem with the value of the underlying instrument. Depending on the terms of the particular contract, futures contracts are settled through either physical delivery of the underlying instrument on the settlement date or by payment of a cash settlement amount on the settlement date. During the period the futures contract is open, payments are received from or made to the broker based upon changes in the value of the contract (the variation margin). A decision as to whether, when and how to use futures contracts involves the exercise of skill and judgment and even a well-conceived futures transaction may be unsuccessful because of market behavior or unexpected events. In addition to the derivatives risks discussed above, the prices of futures contracts can be highly volatile, using futures contracts can lower total return, and the potential loss from futures contracts can exceed the Fund's initial investment in such contracts. No assurance can be given that a liquid market will exist for any particular futures contract at any particular time. There is also the risk of loss by the Fund of margin deposits in the event of bankruptcy of a broker with which the Fund has open positions in the futures contract.
Swaps: The Fund may enter into OTC swap contracts or cleared swap transactions. A swap contract is an agreement between two parties pursuant to which the parties exchange payments at specified dates on the basis of a specified notional amount, with the payments calculated by reference to specified securities, indices, reference rates, currencies or other instruments. Typically swap agreements provide that when the period payment dates for both parties are the same, the payments are made on a net basis (i.e., the two payment streams are netted out, with only the net amount paid by one party to the other). The Fund's obligations or rights under a swap contract entered into on a net basis will generally be equal only to the net amount to be paid or received under the agreement, based on the relative values of the positions held by each party. Cleared swap transactions
25
Morgan Stanley Institutional Fund Trust
Annual Report — September 30, 2017
Notes to Financial Statements (cont'd)
may help reduce counterparty credit risk. In a cleared swap, the Fund's ultimate counterparty is a clearinghouse rather than a swap dealer, bank or other financial institution. OTC swap agreements are not entered into or traded on exchanges and often there is no central clearing or guaranty function for OTC swaps. These OTC swaps are often subject to credit risk or the risk of default or non-performance by the counterparty. Both OTC and cleared swaps could result in losses if interest rates, foreign currency exchange rates or other factors are not correctly anticipated by the Fund or if the reference index, security or investments do not perform as expected. During the period swap agreements are open, payments are received from or made to the clearinghouse or counterparty based upon changes in the value of the contract (variation margin). The Dodd-Frank Wall Street Reform and Consumer Protection Act and related regulatory developments require the clearing and exchange-trading of certain standardized swap transactions. Mandatory exchange-trading and clearing is occurring on a phased-in basis.
The Fund's use of swaps during the period included those based on the credit of an underlying security commonly referred to as "credit default swaps." The Fund may be either the buyer or seller in a credit default swap. Where the Fund is the buyer of a credit default swap contract, it would typically be entitled to receive the par (or other agreed-upon) value of a referenced debt obligation from the counterparty to the contract only in the event of a default or similar event by the issuer of the debt obligation. If no default occurs, the Fund would have paid to the counterparty a periodic stream of payments over the term of the contract and received no benefit from the contract. When the Fund is the seller of a credit default swap contract, it typically receives the stream of payments but is obligated to pay an amount equal to the par (or other agreed-upon) value of a referenced debt obligation upon the default or similar event by the issuer of the referenced debt obligation. The use of credit default swaps could result in losses to the Fund if the Adviser fails to correctly evaluate the creditworthiness of the issuer of the referenced debt obligation.
If the Fund is a seller of protection and a credit event occurs, as defined under the terms of that particular swap agreement, the Fund will either (i) pay to the buyer of protection an amount equal to the notional
amount of the swap agreement and take delivery of the referenced obligation, other deliverable obligations or underlying securities comprising the referenced index or (ii) pay a net settlement amount in the form of cash or securities equal to the notional amount of the swap agreement less the recovery value of the referenced obligation or underlying securities comprising the referenced index. If the Fund is a buyer of protection and a credit event occurs, as defined under the terms of that particular swap agreement, the Fund will either (i) receive from the seller of protection an amount equal to the notional amount of the swap agreement and deliver the referenced obligation, other deliverable obligations or underlying securities comprising the referenced index or (ii) receive a net settlement amount in the form of cash or securities equal to the notional amount of the swap agreement less the recovery value of the referenced obligation or underlying securities comprising the referenced index. Recovery values are estimated by market makers considering either industry standard recovery rates or entity specific factors and considerations until a credit event occurs. If a credit event has occurred, the recovery value is determined by a facilitated auction whereby a minimum number of allowable broker bids, together with a specified valuation method, are used to calculate the settlement value. The Fund's maximum risk of loss from counterparty risk, either as the protection seller or as the protection buyer, is the fair value of the swap agreement.
The current credit rating of each individual issuer is listed in the table following the Portfolio of Investments and serves as an indicator of the current status of the payment/performance risk of the credit derivative. Alternatively, for credit default swaps on an index of credits, the quoted market prices and current values serve as an indicator of the current status of the payment/performance risk of the credit derivative. Generally, lower credit ratings and increasing market values, in absolute terms, represent a deterioration of the credit and a greater likelihood of an adverse credit event of the issuer.
When the Fund has an unrealized loss on a swap agreement, the Fund has instructed the custodian to pledge cash or liquid securities as collateral with a value approximately equal to the amount of the unrealized loss. Collateral pledges are monitored and subsequently adjusted if and when the swap valuations fluctuate. If applicable,
26
Morgan Stanley Institutional Fund Trust
Annual Report — September 30, 2017
Notes to Financial Statements (cont'd)
cash collateral is included with "Due from (to) Broker" in the Statement of Assets and Liabilities.
Upfront payments paid or received by the Fund will be reflected as an asset or liability, respectively, in the Statement of Assets and Liabilities.
FASB ASC 815, "Derivatives and Hedging" ("ASC 815"), is intended to improve financial reporting about derivative instruments by requiring enhanced disclosures to enable investors to better understand how and why the Fund uses derivative instruments, how these derivative instruments are accounted for and their effects on the Fund's financial position and results of operations.
The following tables set forth the fair value of the Fund's derivative contracts by primary risk exposure as of September 30, 2017.
| | | Asset Derivatives
Statement of Assets and
Liabilities Location | | Primary Risk
Exposure | | Value
(000) | |
Futures Contracts | | Variation Margin on
Futures Contracts | |
Interest Rate Risk | | $ | 78 | (a) | |
| | | Liability Derivatives
Statement of Assets and
Liabilities Location | | Primary Risk
Exposure | | Value
(000) | |
Futures Contracts | | Variation Margin on
Futures Contracts | |
Interest Rate Risk | | $ | (72 | )(a) | |
Swap Agreement | | Unrealized Depreciation on
Swap Agreement | |
Credit Risk | | | (7 | ) | |
Swap Agreement | | Variation Margin on
Swap Agreement | |
Interest Rate Risk | | | (16 | )(a) | |
Total | | | | | | $ | (95 | ) | |
(a) This amount represents the cumulative appreciation (depreciation) as reported in the Portfolio of Investments. The Statement of Assets and Liabilities only reflects the current day's net variation margin.
The following tables set forth by primary risk exposure the Fund's realized gains (losses) and change in unrealized appreciation (depreciation) by type of derivative contract for the year ended September 30, 2017 in accordance with ASC 815.
Realized Gain (Loss) | |
Primary Risk Exposure | | Derivative Type | | Value
(000) | |
Interest Rate Risk | | Futures Contracts | | $ | 129 | | |
Credit Risk | | Swap Agreements | | | (3 | ) | |
Interest Rate Risk | | Swap Agreements | | | (8 | ) | |
Total | | | | $ | 118 | | |
Change in Unrealized Appreciation (Depreciation) | |
Primary Risk Exposure | | Derivative Type | | Value
(000) | |
Interest Rate Risk | | Futures Contracts | | $ | 13 | | |
Credit Risk | | Swap Agreements | | | 2 | | |
Interest Rate Risk | | Swap Agreements | | | (16 | ) | |
Total | | | | $ | (1 | ) | |
At September 30, 2017, the Fund's derivative assets and liabilities are as follows:
Gross Amounts of Assets and Liabilities
Presented in the Statement of Assets and Liabilities | |
Derivatives(b) | | Assets(c)
(000) | | Liabilities(c)
(000) | |
Swap Agreement | | $ | — | | | $ | (7 | ) | |
(b) Excludes exchange traded derivatives.
(c) Absent an event of default or early termination, OTC derivative assets and liabilities are presented gross and not offset in the Statement of Assets and Liabilities.
The Fund typically enters into International Swaps and Derivatives Association, Inc. Master Agreements ("ISDA Master Agreements") or similar master agreements (collectively, "Master Agreements") with its contract counterparties for certain OTC derivatives in order to, among other things, reduce its credit risk to counterparties. ISDA Master Agreements include provisions for general obligations, representations, collateral and events of default or termination. Under an ISDA Master Agreement, the Fund typically may offset with the counterparty certain OTC derivative financial instruments' payables and/or receivables with collateral held and/or posted and create one single net payment (close-out netting) in the event of default, termination and/or potential deterioration in the credit quality of the counterparty. Various Master Agreements govern the terms of certain transactions with counterparties, including transactions such as swap, forward, repurchase and reverse repurchase agreements. These Master Agreements typically attempt to reduce the counterparty risk associated with such transactions by specifying credit protection mechanisms and providing standardization that improves legal certainty. Cross-termination provisions under Master Agreements typically provide that a default in connection with one transaction between the Fund and a counterparty gives the non-defaulting party the right to terminate any other transactions in place with the defaulting party to create one single net payment due to/due from the defaulting party and may be a feature in certain Master Agreements. In the event the Fund exercises its right to terminate a Master Agreement after a counterparty experiences a termination event as defined in the Master Agreement, the return of collateral with market value in excess of the Fund's net liability may be delayed or denied.
27
Morgan Stanley Institutional Fund Trust
Annual Report — September 30, 2017
Notes to Financial Statements (cont'd)
The following tables present derivative financial instruments that are subject to enforceable netting arrangements as of September 30, 2017.
Gross Amounts Not Offset in the Statement of Assets and Liabilities | |
Counterparty | | Gross Liability
Derivatives
Presented in
Statement of
Assets and
Liabilities
(000) | | Financial
Instrument
(000) | | Collateral
Pledged
(000) | | Net Amount
(not less
than $0)
(000) | |
Barclays Bank PLC | | $ | 7 | | | $ | — | | | $ | — | | | $ | 7 | | |
For the year ended September 30, 2017, the approximate average monthly amount outstanding for each derivative type is as follows:
Futures Contracts: | |
Average monthly original value | | $ | 12,899,000 | | |
Swap Agreements: | |
Average monthly notional amount | | $ | 1,423,000 | | |
4. Securities Lending: The Fund lends securities to qualified financial institutions, such as broker-dealers, to earn additional income. Any increase or decrease in the fair value of the securities loaned that might occur and any interest earned or dividends declared on those securities during the term of the loan would remain in the Fund. The Fund would receive cash or securities as collateral in an amount equal to or exceeding 100% of the current fair value of the loaned securities. The collateral is marked-to-market daily by State Street Bank and Trust Company ("State Street"), the securities lending agent, to ensure that a minimum of 100% collateral coverage is maintained.
Based on pre-established guidelines, the securities lending agent invests any cash collateral that is received in an affiliated money market portfolio and repurchase agreements. Securities lending income is generated from the earnings on the invested collateral and borrowing fees, less any rebates owed to the borrowers and compensation to the lending agent, and is recorded as "Income from Securities Loaned — Net" in the Fund's Statement of Operations. Risks in securities lending transactions are that a borrower may not provide additional collateral when required or return the securities when due, and that the value of the short-term investments will be less than the amount of cash collateral plus any rebate that is required to be returned to the borrower.
The Fund has the right under the lending agreement to recover the securities from the borrower on demand.
The following table presents financial instruments that are subject to enforceable netting arrangements as of September 30, 2017.
Gross Amounts Not Offset in the Statement of Assets and Liabilities | |
Gross Asset
Amounts
Presented in
Statement of
Assets and
Liabilities
(000) | | Financial
Instrument
(000) | | Collateral
Received
(000) | | Net Amount
(not less
than $0)
(000) | |
| $ | 1,376 | (d) | | $ | — | | | $ | (1,376 | )(e)(f) | | $ | 0 | | |
(d) Represents market value of loaned securities at period end.
(e) The Fund received cash collateral of approximately $788,000, which was subsequently invested in Morgan Stanley Institutional Liquidity Funds as reported in the Portfolio of Investments. In addition, the Fund received non-cash collateral of approximately $618,000 in the form of U.S. Government obligations, which the Fund cannot sell or repledge, and accordingly are not reflected in the Portfolio of Investments.
(f) The actual collateral received is greater than the amount shown here due to overcollateralization.
FASB ASC 860, "Transfers & Servicing: Repurchase-to-Maturity Transactions, Repurchase Financings, and Disclosures", is intended to provide increased transparency about the types of collateral pledged in securities lending transactions and other similar transactions that are accounted for as secured borrowing.
The following table displays a breakdown of transactions accounted for as secured borrowings, the gross obligations by class of collateral pledged, and the remaining contractual maturity of those transactions as of September 30, 2017.
Remaining Contractual Maturity of the Agreements | |
| | | Overnight and
Continuous
(000) | | <30 days
(000) | | Between
30 &
90 days
(000) | | >90 days
(000) | | Total
(000) | |
Securities Lending
Transactions | |
Corporate Bonds | | $ | 788 | | | $ | — | | | $ | — | | | $ | — | | | $ | 788 | | |
Total Borrowings | | $ | 788 | | | $ | — | | | $ | — | | | $ | — | | | $ | 788 | | |
Gross amount of
recognized liabilities
for securities lending
transactions | | | | | | | | | | $ | 788 | | |
5. When-Issued/Delayed Delivery Securities: The Fund purchases and sells when-issued and delayed delivery securities. Securities purchased on a when-issued or delayed delivery basis are purchased for delivery beyond the normal settlement date at a stated price and yield, and no income accrues to the Fund on such securities prior to delivery date. Payment and delivery for when-issued and delayed
28
Morgan Stanley Institutional Fund Trust
Annual Report — September 30, 2017
Notes to Financial Statements (cont'd)
delivery securities can take place a month or more after the date of the transaction. When the Fund enters into a purchase transaction on a when-issued or delayed delivery basis, securities are available for collateral in an amount at least equal in value to the Fund's commitments to purchase such securities. Purchasing securities on a when-issued or delayed delivery basis may involve a risk that the market price at the time of delivery may be lower than the agreed upon purchase price, in which case there could be an unrealized loss at the time of delivery. Purchasing investments on a when-issued or delayed delivery basis may be considered a form of leverage which may increase the impact that gains (losses) may have on the Fund.
6. Indemnifications: The Trust enters into contracts that contain a variety of indemnifications. The Trust's maximum exposure under these arrangements is unknown. However, the Trust has not had prior claims or losses pursuant to these contracts and expects the risk of loss to be remote.
7. Dividends and Distributions to Shareholders: Dividends and distributions to shareholders are recorded on the ex-dividend date. Dividends from net investment income, if any, are declared and paid quarterly. Net realized capital gains, if any, are distributed at least annually.
8. Security Transactions, Income and Expenses: Security transactions are accounted for on the trade date (date the order to buy or sell is executed). Realized gains and losses on the sale of investment securities are determined on the specific identified cost method. Dividend income and other distributions are recorded on the ex-dividend date (except for certain foreign dividends which may be recorded as soon as the Fund is informed of such dividends) net of applicable withholding taxes. Interest income is recognized on the accrual basis except where collection is in doubt. Discounts are accreted and premiums are amortized over the life of the respective securities. Most expenses of the Trust can be directly attributed to a particular Fund. Expenses which cannot be directly attributed are apportioned among the Funds based upon relative net assets or other appropriate methods. Income, expenses (other than class specific expenses — distribution and shareholder services, transfer agency and sub transfer agency fees) and realized and unrealized gains or losses are allocated to each class of shares based upon their relative net assets. Included in Realized Gain (Loss) on Investments Sold are proceeds from the one-time settlements of class ac-
tion lawsuits involving the Fund's past holdings of approximately $365,000, the impact of which on the Fund's performance is disclosed in the Financial Highlights.
B. Advisory Fees: The Adviser, a wholly-owned subsidiary of Morgan Stanley, provides the Fund with advisory services under the terms of an Investment Advisory Agreement, paid quarterly, at an annual rate of 0.375% of the average daily net assets of the Fund.
The Adviser has agreed to reduce its advisory fee and/or reimburse the Fund so that total annual portfolio operating expenses, excluding certain investment related expenses, taxes, interest and other extraordinary expenses (including litigation), will not exceed 0.70% for Class I shares, 1.05% for Class A shares, 1.52% for Class L shares and 1.80% for Class C shares. The fee waivers and/or expense reimbursements will continue for at least one year from the date of the Fund's prospectus or until such time as the Trustees act to discontinue all or a portion of such waivers and/or reimbursements when they deem such action is appropriate. For the year ended September 30, 2017, approximately $164,000 of advisory fees were waived and approximately $75,000 of other expenses were reimbursed by the Adviser pursuant to this arrangement.
C. Administration Fees: The Adviser also serves as Administrator to the Trust and provides administrative services pursuant to an Administration Agreement for an annual fee, accrued daily and paid monthly, of 0.08% of the Fund's average daily net assets. Under a Sub-Administration Agreement between the Administrator and State Street, State Street provides certain administrative services to the Trust. For such services, the Administrator pays State Street a portion of the fee the Administrator receives from the Fund.
D. Distribution and Shareholder Services Fees: Morgan Stanley Distribution, Inc. ("MSDI" or the "Distributor"), a wholly-owned subsidiary of the Adviser, and an indirect subsidiary of Morgan Stanley, serves as the Trust's Distributor of Fund shares pursuant to a Distribution Agreement. The Trust has adopted a Shareholder Services Plan with respect to Class A shares pursuant to Rule 12b-1 under the Act. Under the Shareholder Services Plan, the Fund pays the Distributor a shareholder services fee, accrued daily and paid monthly, at an annual rate of 0.25% of the Fund's average daily net assets attributable to Class A shares. The Distributor has agreed to waive the 12b-1 fees on Class A shares of the Portfolio to the extent it exceeds 0.15% of the average daily net assets of such
29
Morgan Stanley Institutional Fund Trust
Annual Report — September 30, 2017
Notes to Financial Statements (cont'd)
shares on an annualized basis. For the year ended September 30, 2017, this waiver amounted to approximately $8,000.
The Trust has adopted a Distribution and Shareholder Services Plan with respect to Class L shares pursuant to Rule 12b-1 under the Act. Under the Distribution and Shareholder Services Plan, the Fund pays the Distributor a distribution fee, accrued daily and paid monthly, at an annual rate of 0.25% and a shareholder services fee, accrued daily and paid monthly, at an annual rate of 0.25% of the Fund's average daily net assets attributable to Class L shares.
The Trust has adopted a Distribution and Shareholder Services Plan with respect to Class C shares pursuant to Rule 12b-1 under the Act. Under the Distribution and Shareholder Services Plan, the Fund pays the Distributor a distribution fee, accrued daily and paid monthly, at an annual rate of 0.75% and a shareholder services fee, accrued daily and paid monthly, at an annual rate of 0.25% of the Fund's average daily net assets attributable to Class C shares.
The distribution and shareholder services fees are used to support the expenses associated with servicing and maintaining accounts. The Distributor may compensate other parties for providing shareholder support services to investors who purchase Class A, Class L and Class C shares.
E. Dividend Disbursing and Transfer Agent: The Trust's dividend disbursing and transfer agent is Boston Financial Data Services, Inc. ("BFDS"). Pursuant to a Transfer Agency Agreement, the Trust pays BFDS a fee based on the number of classes, accounts and transactions relating to the Funds of the Trust.
F. Custodian Fees: State Street (the "Custodian") serves as Custodian for the Trust in accordance with a Custodian Agreement. The Custodian holds cash, securities, and other assets of the Trust as required by the Act. Custody fees are payable monthly based on assets held in custody, investment purchases and sales activity and account maintenance fees, plus reimbursement for certain out-of-pocket expenses.
G. Security Transactions and Transactions with Affiliates: For the year ended September 30, 2017, purchases and sales of investment securities for the Fund, other than long-term U.S. Government securities and short-term investments, were approximately $22,633,000 and $13,266,000, respectively. For the year ended September 30, 2017, purchases and sales of long-term U.S. Government securities were $0 and $370,000, respectively.
The Fund invests in the Institutional Class of the Morgan Stanley Institutional Liquidity Funds — Government Portfolio (the "Liquidity Funds"), an open-end management investment company managed by the Adviser, both directly and as a portion of the securities held as collateral on loaned securities. Advisory fees paid by the Fund are reduced by an amount equal to its pro-rata share of the advisory and administration fees paid by the Fund due to its investment in the Liquidity Funds. For the year ended September 30, 2017, advisory fees paid were reduced by approximately $2,000 relating to the Fund's investment in the Liquidity Funds.
A summary of the Fund's transactions in shares of the Liquidity Funds during the year ended September 30, 2017 is as follows:
Affiliated
Investment
Company | | Value
September 30,
2016
(000) | | Purchases
at Cost
(000) | | Proceeds
from Sales
(000) | | Dividend
Income
(000) | |
Liquidity Funds | | $ | 3,066 | | | $ | 16,538 | | | $ | 18,318 | | | $ | 7 | | |
Affiliated
Investment
Company (cont'd) | | Realized
Gain (Loss)
(000) | | Change in
Unrealized
Appreciation
(Depreciation)
(000) | | Value
September 30,
2017
(000) | |
Liquidity Funds | | $ | — | | | $ | — | | | $ | 1,286 | | |
The Fund is permitted to purchase and sell securities ("cross-trade") from and to other Morgan Stanley Funds as well as other funds and client accounts for which the Adviser or an affiliate of the Adviser serves as investment adviser, pursuant to procedures approved by the Trustees in compliance with Rule 17a-7 under the Act (the "Rule"). Each cross-trade is executed at the current market price in compliance with provisions of the Rule. For the year ended September 30, 2017, the Fund did not engage in any cross-trade transactions.
The Fund has an unfunded Deferred Compensation Plan (the "Compensation Plan"), which allows each independent Trustee to defer payment of all, or a portion, of the fees he or she receives for serving on the Board of Trustees. Each eligible Trustee generally may elect to have the deferred amounts credited with a return equal to the total return on one or more of the Morgan Stanley funds that are offered as investment options under the Compensation Plan. Appreciation/depreciation and distributions received from these investments are recorded with an offsetting increase/decrease in the deferred compensation obligation and do not affect the NAV of the Fund.
30
Morgan Stanley Institutional Fund Trust
Annual Report — September 30, 2017
Notes to Financial Statements (cont'd)
H. Federal Income Taxes: It is the Fund's intention to continue to qualify as a regulated investment company and distribute all of its taxable and tax-exempt income. Accordingly, no provision for federal income taxes is required in the financial statements.
The Fund may be subject to taxes imposed by countries in which it invests. Such taxes are generally based on income and/or capital gains earned or repatriated. Taxes are accrued based on net investment income, net realized gains and net unrealized appreciation as such income and/or gains are earned. Taxes may also be based on transactions in foreign currency and are accrued based on the value of investments denominated in such currency.
FASB ASC 740-10, "Income Taxes — Overall", sets forth a minimum threshold for financial statement recognition of the benefit of a tax position taken or expected to be taken in a tax return. Management has concluded there are no significant uncertain tax positions that would require recognition in the financial statements. If applicable, the Fund recognizes interest accrued related to unrecognized tax benefits in "Interest Expense" and penalties in "Other Expenses" in the Statement of Operations. The Fund files tax returns with the U.S. Internal Revenue Service, New York and various states. Each of the tax years in the four-year period ended September 30, 2017, remains subject to examination by taxing authorities.
The tax character of distributions paid may differ from the character of distributions shown in the Statements of Changes in Net Assets due to short-term capital gains being treated as ordinary income for tax purposes. The tax character of distributions paid during fiscal years 2017 and 2016 was as follows:
2017 Distributions
Paid From:
Ordinary Income
(000) | | 2016 Distributions
Paid From:
Ordinary Income
(000) | |
| $ | 1,237 | | | $ | 1,065 | | |
The amount and character of income and gains to be distributed are determined in accordance with income tax regulations which may differ from GAAP. These book/tax differences are either considered temporary or permanent in nature.
Temporary differences are attributable to differing book and tax treatments for the timing of the recognition of gains (losses) on certain investment transactions and the timing of the deductibility of certain expenses.
Permanent differences, primarily due to basis adjustments for swap transactions and an expired capital loss carryforward, re-
sulted in the following reclassifications among the components of net assets at September 30, 2017:
Accumulated
Undistributed
Net Investment
Income
(000) | | Accumulated
Net Realized
Loss
(000) | | Paid-in-
Capital
(000) | |
| $ | (16 | ) | | $ | 44,938 | | | $ | (44,922 | ) | |
At September 30, 2017, the components of distributable earnings for the Fund on a tax basis were as follows:
Undistributed
Ordinary
Income (000) | | Undistributed
Long-Term
Capital Gain (000) | |
| $ | 433 | | | $ | — | | |
At September 30, 2017, the Fund had available for federal income tax purposes unused capital losses which will expire on the indicated dates:
Amount
(000) | | Expiration | |
| $ | 8,130 | | | September 30, 2018 | |
Capital loss carryforwards of approximately $44,922,000 expired during the year ended September 30, 2017.
To the extent that capital loss carryforwards are used to offset any future capital gains realized during the carryover period as provided by U.S. federal income tax regulations, no capital gains tax liability will be incurred by the Fund for gains realized and not distributed. To the extent that capital gains are offset, such gains will not be distributed to the shareholders. During the year ended September 30, 2017, the Fund utilized capital loss carryforwards for U.S. federal income tax purposes of approximately $448,000.
I. Credit Facility: The Trust and other Morgan Stanley funds participate in a $150,000,000 committed, unsecured revolving line of credit facility (the "facility") with State Street. This facility is to be used for temporary emergency purposes or funding of shareholder redemption requests. The interest rate on borrowings is based on the federal funds rate or one month libor rate plus a spread. The facility also has a commitment fee of 0.25% per annum based on the unused portion of the facility. During the year ended September 30, 2017, the Fund did not have any borrowings under the facility.
J. Other: At September 30, 2017, the Fund had record owners of 10% or greater. Investment activities of these shareholders could have a material impact on the Fund. The aggregate percentage of such owners was 60.0%.
K. Accounting Pronouncement: In March 2017, FASB issued an Accounting Standard Update, ASU 2017-08,
31
Morgan Stanley Institutional Fund Trust
Annual Report — September 30, 2017
Notes to Financial Statements (cont'd)
Receivables-Nonrefundable Fees and Other Costs (Subtopic 310-20), Premium Amortization on Purchased Callable Debt Securities (the "ASU") which amends the amortization period for certain purchased callable debt securities held at a premium, shortening such period to the earliest call date. The ASU does not require any accounting change for debt securities held at a discount; the discount continues to be amortized to maturity. The ASU is effective for fiscal years, and interim periods within those fiscal years, beginning after December 15, 2018. At this time, management is evaluating the implications of these changes on the financial statements.
32
Morgan Stanley Institutional Fund Trust
Annual Report — September 30, 2017
Report of Independent Registered Public Accounting Firm
To the Shareholders and Board of Trustees of
Morgan Stanley Institutional Fund Trust —
Corporate Bond Portfolio
We have audited the accompanying statement of assets and liabilities, including the portfolio of investments, of Corporate Bond Portfolio (one of the funds constituting Morgan Stanley Institutional Fund Trust) (the "Fund") as of September 30, 2017, and the related statement of operations for the year then ended, the statements of changes in net assets for each of the two years in the period then ended and the financial highlights for each of the years or periods indicated therein. These financial statements and financial highlights are the responsibility of the Fund's management. Our responsibility is to express an opinion on these financial statements and financial highlights based on our audits.
We conducted our audits in accordance with the standards of the Public Company Accounting Oversight Board (United States). Those standards require that we plan and perform the audit to obtain reasonable assurance about whether the financial statements and financial highlights are free of material misstatement. We were not engaged to perform an audit of the Fund's internal control over financial reporting. Our audits included consideration of internal control over financial reporting as a basis for designing audit procedures that are appropriate in the circumstances, but not for the purpose of expressing an opinion on the effectiveness of the Fund's internal control over financial reporting. Accordingly, we express no such opinion. An audit also includes examining, on a test basis, evidence supporting the amounts and disclosures in the financial statements and financial highlights, assessing the accounting principles used and significant estimates made by management, and evaluating the overall financial statement presentation. Our procedures included confirmation of securities owned as of September 30, 2017, by correspondence with the custodian and others or by other appropriate auditing procedures where replies from others were not received. We believe that our audits provide a reasonable basis for our opinion.
In our opinion, the financial statements and financial highlights referred to above present fairly, in all material respects, the financial position of Corporate Bond Portfolio (one of the funds constituting Morgan Stanley Institutional Fund Trust) at September 30, 2017, the results of its operations for the year then ended, the changes in its net assets for each of the two years in the period then ended and the financial highlights for each of the years or periods indicated therein, in conformity with U.S. generally accepted accounting principles.

Boston, Massachusetts
November 22, 2017
33
Morgan Stanley Institutional Fund Trust
Annual Report — September 30, 2017
Investment Advisory Agreement Approval (unaudited)
Nature, Extent and Quality of Services
The Board reviewed and considered the nature and extent of the investment advisory services provided by the Adviser (as defined herein) under the advisory agreement, including portfolio management, investment research and equity and fixed income securities trading. The Board also reviewed and considered the nature and extent of the non-advisory, administrative services provided by the Adviser under the administration agreement, including accounting, operations, clerical, bookkeeping, compliance, business management and planning, legal services and the provision of supplies, office space and utilities at the Adviser's expense. The Board also considered the Adviser's investment in personnel and infrastructure that benefits the Fund. (The advisory and administration agreements together are referred to as the "Management Agreement.") The Board also considered that the Adviser serves a variety of other investment advisory clients and has experience overseeing service providers. The Board also compared the nature of the services provided by the Adviser with similar services provided by non-affiliated advisers as presented to the Board by Broadridge Financial Solutions, Inc. ("Broadridge").
The Board reviewed and considered the qualifications of the portfolio managers, the senior administrative managers and other key personnel of the Adviser who provide the administrative and advisory services to the Fund. The Board determined that the Adviser's portfolio managers and key personnel are well qualified by education and/or training and experience to perform the services in an efficient and professional manner. The Board concluded that the nature and extent of the advisory and administrative services provided were necessary and appropriate for the conduct of the business and investment activities of the Fund and supported its decision to approve the Management Agreement.
Performance, Fees and Expenses of the Fund
The Board reviewed the performance, fees and expenses of the Fund compared to its peers, as presented by Broadridge, and to appropriate benchmarks where applicable. The Board discussed with the Adviser the performance goals and the actual results achieved in managing the Fund. When considering a fund's performance, the Board and the Adviser place emphasis on trends and longer-term returns (focusing on one-year, three-year and five-year performance, as of December 31, 2016, or since inception, as applicable). When a fund underperforms its benchmark and/or its peer group average, the Board and the Adviser discuss the causes of such underperformance and, where necessary, they discuss specific changes to investment strategy or investment personnel. The Board noted that the Fund's performance was better than its peer group average for the one-, three- and five-year periods. The Board discussed with the Adviser the level of the advisory and administration fees (together, the "management fee") for this Fund relative to comparable funds and/or other accounts advised by the Adviser and/or compared to its peers as presented by Broadridge. In addition to the management fee, the Board also reviewed the Fund's total expense ratio. When a fund's management fee and/or its total expense ratio are higher than its peers, the Board and the Adviser discuss the reasons for this and, where appropriate, they discuss possible waivers and/or caps. The Board noted that the Fund's management fee was lower than its peer group average but its total expense ratio was higher than its peer group average. After discussion, the Board concluded that the Fund's (i) performance was competitive with its peer group average; (ii) management fee was competitive with its peer group average; and (iii) total expense ratio was acceptable.
Economies of Scale
The Board considered the size and growth prospects of the Fund and how that relates to the Fund's total expense ratio and particularly the Fund's management fee rate, which does not include breakpoints. In conjunction with its review of the Adviser's profitability, the Board discussed with the Adviser how a change in assets can affect the efficiency or effectiveness of managing the Fund and whether the management fee level is appropriate relative to current and projected asset levels and/or whether the management fee structure reflects economies of scale as asset levels change. The Board has determined that its review of the actual and/or potential economies of scale of the Fund supports its decision to approve the Management Agreement.
Profitability of the Adviser and Affiliates
The Board considered information concerning the costs incurred and profits realized by the Adviser and its affiliates during the last year from their relationship with the Fund and during the last two years from their relationship with the Morgan Stanley Fund Complex and reviewed with the Adviser the cost allocation methodology used to determine the profitability of the Adviser and affiliates. The Board has determined that its review of the analysis of the Adviser's expenses and profitability supports its decision to approve the Management Agreement.
34
Morgan Stanley Institutional Fund Trust
Annual Report — September 30, 2017
Investment Advisory Agreement Approval (unaudited) (cont'd)
Other Benefits of the Relationship
The Board considered other direct and indirect benefits to the Adviser and/or its affiliates derived from their relationship with the Fund and other funds advised by the Adviser. These benefits may include, among other things, fees for trading, distribution and/or shareholder servicing and for transaction processing and reporting platforms used by securities lending agents, and research received by the Adviser generated from commission dollars spent on funds' portfolio trading. The Board reviewed with the Adviser these arrangements and the reasonableness of the Adviser's costs relative to the services performed. The Board has determined that its review of the other benefits received by the Adviser or its affiliates supports its decision to approve the Management Agreement.
Resources of the Adviser and Historical Relationship Between the Fund and the Adviser
The Board considered whether the Adviser is financially sound and has the resources necessary to perform its obligations under the Management Agreement. The Board also reviewed and considered the historical relationship between the Fund and the Adviser, including the organizational structure of the Adviser, the policies and procedures formulated and adopted by the Adviser for managing the Fund's operations and the Board's confidence in the competence and integrity of the senior managers and key personnel of the Adviser. The Board concluded that the Adviser has the financial resources necessary to fulfill its obligations under the Management Agreement and that it is beneficial for the Fund to continue its relationship with the Adviser.
Other Factors and Current Trends
The Board considered the controls and procedures adopted and implemented by the Adviser and monitored by the Fund's Chief Compliance Officer and concluded that the conduct of business by the Adviser indicates a good faith effort on its part to adhere to high ethical standards in the conduct of the Fund's business.
General Conclusion
After considering and weighing all of the above factors, with various written materials and verbal information presented by the Adviser, the Board concluded that it would be in the best interest of the Fund and its shareholders to approve renewal of the Management Agreement for another year. In reaching this conclusion the Board did not give particular weight to any single piece of information or factor referenced above. The Board considered these factors and information over the course of the year and in numerous meetings, some of which were in executive session with only the independent Board members and their counsel present. It is possible that individual Board members may have weighed these factors, and the information presented, differently in reaching their individual decisions to approve the Management Agreement.
35
Morgan Stanley Institutional Fund Trust
Annual Report — September 30, 2017
Privacy Notice (unaudited)
MORGAN STANLEY INVESTMENT MANAGEMENT INC.
AN IMPORTANT NOTICE CONCERNING OUR U.S. PRIVACY POLICY
We are required by federal law to provide you with a copy of our privacy policy annually. This policy applies to current and former individual investors in funds managed or sponsored by Morgan Stanley Investment Management Inc. ("MSIM") as well as current and former individual clients of MSIM. This policy is not applicable to partnerships, corporations, trusts or other non-individual clients or investors. Please note that we may amend this policy at any time, and will inform you of any changes as required by law.
WE RESPECT YOUR PRIVACY
We appreciate that you have provided us with your personal financial information. We strive to maintain the privacy of such information while we help you achieve your financial objectives. This Notice describes what non-public personal information we collect about you, why we collect it, when we may share it with others and how certain others may use it. It discusses the steps you may take to limit our sharing of certain information about you to affiliated companies in the Morgan Stanley family of companies ("other Morgan Stanley companies"). It also discloses how you may limit use of certain shared information for marketing purposes by other Morgan Stanley branded companies. Throughout this policy, we refer to the non-public information that personally identifies you or your accounts as "personal information.''
1. WHAT PERSONAL INFORMATION DO WE COLLECT ABOUT YOU?
We obtain personal information from applications and other forms you submit to us, from your dealings with us, from consumer reporting agencies, from our Web sites and from third parties and other sources.
For example:
• We may collect information such as your name, address, e-mail address, telephone/fax numbers, assets, income and investment objectives through subscription documents, applications and other forms you submit to us.
• We may obtain information about account balances, your use of account(s) and the types of products and services you prefer to receive from us through your dealings and transactions with us and other sources.
• We may obtain information about your creditworthiness and credit history from consumer reporting agencies.
• We may collect background information from and through third-party vendors to verify representations you have made and to comply with various regulatory requirements.
• If you interact with us through our public and private Web sites, we may collect information that you provide directly through online communications (such as an e-mail address). We may also collect information about your Internet service provider, your domain name, your computer's operating system and Web browser, your use of our Web sites and your product and service preferences, through the use of "cookies." Please consult the Terms of Use of these sites for more details.
2. WHEN DO WE DISCLOSE PERSONAL INFORMATION WE COLLECT ABOUT YOU?
We may disclose personal information we collect about you to other Morgan Stanley companies and to non-affiliated third parties.
a. Information We Disclose to Other Morgan Stanley Companies.
We may disclose personal information to other Morgan Stanley companies for a variety of reasons, including to manage your account(s) effectively, to service and process your transactions, to let you know about products and services offered by us and other Morgan Stanley companies, to manage our business, and as otherwise required or permitted by law. Offers for products and services from other Morgan Stanley companies are developed under conditions designed to safeguard your personal information.
36
Morgan Stanley Institutional Fund Trust
Annual Report — September 30, 2017
Privacy Notice (unaudited) (cont'd)
b. Information We Disclose to Non-affiliated Third Parties.
We do not disclose personal information that we collect about you to non-affiliated third parties except to those who provide marketing services on our behalf, to financial institutions with whom we have joint marketing agreements, and as otherwise required or permitted by law. For example, we may disclose personal information to non-affiliated third parties for servicing and processing transactions, to offer our own products and services, to protect against fraud, for institutional risk control, to respond to judicial process or to perform services on our behalf. When we share personal information with a non-affiliated third party, they are required to limit their use of personal information to the particular purpose for which it was shared and they are not allowed to share personal information with others except to fulfill that limited purpose or as may be permitted or required by law.
3. HOW DO WE PROTECT THE SECURITY AND CONFIDENTIALITY OF PERSONAL INFORMATION WE COLLECT ABOUT YOU?
We maintain physical, electronic and procedural security measures to help safeguard the personal information we collect about you. We have internal policies governing the proper handling of client information. Third parties that provide support or marketing services on our behalf may also receive personal information, and we require them to adhere to confidentiality standards with respect to such information.
4. HOW CAN YOU LIMIT THE SHARING OF CERTAIN TYPES OF PERSONAL INFORMATION WITH OTHER MORGAN STANLEY COMPANIES?
We offer you choices as to whether we share with other Morgan Stanley companies the personal information that was collected to determine your eligibility for products and services you request ("eligibility information"). Eligibility information does not include your identification information or personal information pertaining to our transactions or experiences with you. Please note that, even if you direct us not to share eligibility information with other Morgan Stanley companies ("opt-out"), we may still share personal information, including eligibility information, with those companies in circumstances excluded from the opt-out under applicable law, such as to process transactions or to service your account.
5. HOW CAN YOU LIMIT THE USE OF CERTAIN TYPES OF PERSONAL INFORMATION BY OTHER MORGAN STANLEY COMPANIES FOR MARKETING?
By following the opt-out instructions in Section 6 below, you may limit other Morgan Stanley branded companies from marketing their products or services to you based on personal information we disclose to them. This information may include, for example, your income and account history with us. Please note that, even if you choose to limit Other Morgan Stanley Companies from using personal information about you that we may share with them for marketing their products and services to you, Other Morgan Stanley Companies may use your personal information that they obtain from us to market to you in circumstances permitted by law, such as if the Other Morgan Stanley Company has its own relationship with you.
6. HOW CAN YOU SEND US AN OPT-OUT INSTRUCTION?
If you wish to limit our sharing of eligibility information about you with other Morgan Stanley companies or other Morgan Stanley companies' use of personal information for marketing purposes, as described in this notice, you may do so by:
• Calling us at (800) 548-7786
Monday–Friday between 8a.m. and 6p.m.(EST)
• Writing to us at the following address:
Boston Financial Data Services, Inc.
c/o Privacy Coordinator
P.O. Box 219804
Kansas City, Missouri 64121
37
Morgan Stanley Institutional Fund Trust
Annual Report — September 30, 2017
Privacy Notice (unaudited) (cont'd)
Your written request should include your name, address, telephone number and account number(s) to which the opt-out applies and whether you are opting out with respect to sharing of eligibility information (Section 4 above), or if information used for Marketing (Section 5 above) or both. Written opt-out requests should not be sent with any other correspondence. In order to process your request, we require that the request be provided by you directly and not through a third party.
Your opt-out preference will remain in effect with respect to this policy (as it may be amended) until you notify us otherwise. If you have a joint account, your direction for us not to share this information with other Morgan Stanley companies and for those other Morgan Stanley companies not to use your personal information for marketing will be applied to all account holders on that account. Please understand that if you limit our sharing or our affiliated companies' use of personal information, you and any joint account holder(s) may not receive information about Morgan Stanley products and services, including products or services that could help you manage your financial resources and achieve your investment objectives.
7. WHAT IF AN AFFILIATED COMPANY BECOMES A NON-AFFILIATED THIRD PARTY?
If, at any time in the future, an affiliated company becomes a non-affiliated third party, further disclosures of personal information made to the former affiliated company will be limited to those described in Section 2(b) above relating to non-affiliated third parties. If you elected under Section 6 to limit disclosures we make to affiliated companies, or use of personal information by affiliated companies, your election will not apply to use by any former affiliated company of your personal information in their possession once it becomes a non-affiliated third party.
SPECIAL NOTICE TO RESIDENTS OF VERMONT
The following section supplements our policy with respect to our individual clients who have a Vermont address and supersedes anything to the contrary in the above policy with respect to those clients only.
The state of Vermont requires financial institutions to obtain your consent prior to sharing personal information that they collect about you with affiliated companies and non-affiliated third parties other than in certain limited circumstances. Except as permitted by law, we will not share personal information we collect about you with non-affiliated third parties or other Morgan Stanley companies unless you provide us with your written consent to share such information ("opt-in").
If you wish to receive offers for investment products and services offered by or through other Morgan Stanley companies, please notify us in writing at the following address:
Boston Financial Data Services, Inc.
c/o Privacy Coordinator
P.O. Box 219804
Kansas City, Missouri 64121
Your authorization should include your name, address, telephone number and account number(s) to which the opt-in applies and should not be sent with any other correspondence. In order to process your authorization, we require that the authorization be provided by you directly and not through a third party.
SPECIAL NOTICE TO RESIDENTS OF CALIFORNIA
The following section supplements our policy with respect to our individual clients who have a California address and supersedes anything to the contrary in the above policy with respect to those clients only.
In response to a California law, if your account has a California home address, your personal information will not be disclosed to non-affiliated third parties except as permitted by applicable California law, and we will limit sharing such information with our affiliates to comply with California privacy laws that apply to us.
38
Morgan Stanley Institutional Fund Trust
Annual Report — September 30, 2017
Trustee and Officer Information (unaudited)
Independent Trustees:
Name, Age and Address of
Independent Trustee | | Position(s)
Held with
Registrant | | Length of Time
Served* | | Principal Occupation(s) During Past 5 Years
and Other Relevant Professional Experience | | Number of
Portfolios in
Fund Complex
Overseen by
Independent
Trustee** | | Other Directorships
Held by Independent
Trustee*** | |
Frank L. Bowman (72)
c/o Perkins Coie LLP
Counsel to the Independent Trustees
30 Rockefeller Plaza
New York, NY 10112 | | Trustee | | Since
August
2006 | | President, Strategic Decisions, LLC (consulting) (since February 2009); Director or Trustee of various Morgan Stanley Funds (since August 2006); Chairperson of the Compliance and Insurance Committee (since October 2015); formerly, Chairperson of the Insurance Sub-Committee of the Compliance and Insurance Committee (2007-2015); served as President and Chief Executive Officer of the Nuclear Energy Institute (policy organization) (February 2005-November 2008); retired as Admiral, U.S. Navy after serving over 38 years on active duty including 8 years as Director of the Naval Nuclear Propulsion Program in the Department of the Navy and the U.S. Department of Energy (1996-2004); served as Chief of Naval Personnel (July 1994-September 1996) and on the Joint Staff as Director of Political Military Affairs (June 1992-July 1994); knighted as Honorary Knight Commander of the Most Excellent Order of the British Empire; awarded the Officier de l'Orde National du Mérite by the French Government; elected to the National Academy of Engineering (2009). | | | 90 | | | Director of BP p.l.c.; Director of Naval and Nuclear Technologies LLP; Director Emeritus of the Armed Services YMCA; Director of the U.S. Naval Submarine League; Member of the National Security Advisory Council of the Center for U.S. Global Engagement and a member of the CNA Military Advisory Board; Chairman of the charity J Street Cup Golf; Trustee of Fairhaven United Methodist Church; and Director of other various non-profit organizations. | |
Kathleen A. Dennis (64)
c/o Perkins Coie LLP
Counsel to the Independent Trustees
30 Rockefeller Plaza
New York, NY 10112 | | Trustee | | Since
August
2006 | | President, Cedarwood Associates (mutual fund and investment management consulting) (since July 2006); Chairperson of the Liquidity and Alternatives Sub-Committee of the Investment Committee (since October 2006) and Director or Trustee of various Morgan Stanley Funds (since August 2006); formerly, Senior Managing Director of Victory Capital Management (1993-2006). | | | 91 | | | Director of various non-profit organizations. | |
Nancy C. Everett (62)
c/o Perkins Coie LLP
Counsel to the Independent Trustees
30 Rockefeller Plaza
New York, NY 10112 | | Trustee | | Since
January
2015 | | Chief Executive Officer, Virginia Commonwealth University Investment Company (since November 2015); Owner OBIR, LLC (institutional investment management consulting) (since June 2014); formerly, Managing Director, BlackRock, Inc. (February 2011-December 2013); and Chief Executive Officer, General Motors Asset Management (a/k/a Promark Global Advisors, Inc.) (June 2005-May 2010). | | | 91 | | | Formerly, Member of Virginia Commonwealth University School of Business Foundation (2005-2016); Member of Virginia Commonwealth University Board of Visitors (2013-2015); Member of Committee on Directors for Emerging Markets Growth Fund, Inc. (2007-2010); Chairperson of Performance Equity Management, LLC (2006-2010); and Chairperson, GMAM Absolute Return Strategies Fund, LLC (2006-2010). | |
39
Morgan Stanley Institutional Fund Trust
Annual Report — September 30, 2017
Trustee and Officer Information (unaudited) (cont'd)
Independent Trustees: (cont'd)
Name, Age and Address of
Independent Trustee | | Position(s)
Held with
Registrant | | Length of Time
Served* | | Principal Occupation(s) During Past 5 Years
and Other Relevant Professional Experience | | Number of
Portfolios in
Fund Complex
Overseen by
Independent
Trustee** | | Other Directorships
Held by Independent
Trustee*** | |
Jakki L. Haussler (60)
c/o Perkins Coie LLP
Counsel to the Independent Trustees
30 Rockefeller Plaza
New York, NY 10112 | | Trustee | | Since
January
2015 | | Chairman and Chief Executive Officer, Opus Capital Group (since January 1996); formerly, Director, Capvest Venture Fund, LP (May 2000-December 2011); Partner, Adena Ventures, LP (July 1999-December 2010); Director, The Victory Funds (February 2005-July 2008). | | | 91 | | | Director of Cincinnati Bell Inc. and Member, Audit Committee and Compensation Committee; Director of Northern Kentucky University Foundation and Member, Investment Committee; Member of Chase College of Law Transactional Law Practice Center Board of Advisors; Director of Best Transport; Director of Chase College of Law Board of Visitors; formerly, Member, University of Cincinnati Foundation Investment Committee; Member, Miami University Board of Visitors (2008-2011); Trustee of Victory Funds (2005-2008) and Chairman, Investment Committee (2007-2008) and Member, Service Provider Committee (2005-2008). | |
Dr. Manuel H. Johnson (68)
c/o Johnson Smick
International, Inc.
220 I Street, NE — Suite 200
Washington, D.C. 20002 | | Trustee | | Since
July
1991 | | Senior Partner, Johnson Smick International, Inc. (consulting firm); Chairperson of the Investment Committee (since October 2006) and Director or Trustee of various Morgan Stanley Funds (since July 1991); Co-Chairman and a founder of the Group of Seven Council (G7C) (international economic commission); formerly, Chairperson of the Audit Committee (July 1991-September 2006), Vice Chairman of the Board of Governors of the Federal Reserve System and Assistant Secretary of the U.S. Treasury. | | | 91 | | | Director of NVR, Inc. (home construction). | |
Joseph J. Kearns (75)
c/o Kearns & Associates LLC
46 E Peninsula Center #385
Rolling Hills Estates, CA 90274-3712 | | Trustee | | Since
August
1994 | | President, Kearns & Associates LLC (investment consulting); Chairperson of the Audit Committee (since October 2006) and Director or Trustee of various Morgan Stanley Funds (since August 1994); formerly, Deputy Chairperson of the Audit Committee (July 2003-September 2006) and Chairperson of the Audit Committee of various Morgan Stanley Funds (since August 1994); CFO of the J. Paul Getty Trust. | | | 93 | | | Director of Electro Rent Corporation (equipment leasing). Prior to December 31, 2013, Director of The Ford Family Foundation. | |
40
Morgan Stanley Institutional Fund Trust
Annual Report — September 30, 2017
Trustee and Officer Information (unaudited) (cont'd)
Independent Trustees: (cont'd)
Name, Age and Address of
Independent Trustee | | Position(s)
Held with
Registrant | | Length of Time
Served* | | Principal Occupation(s) During Past 5 Years
and Other Relevant Professional Experience | | Number of
Portfolios in
Fund Complex
Overseen by
Independent
Trustee** | | Other Directorships
Held by Independent
Trustee*** | |
Michael F. Klein (58)
c/o Perkins Coie LLP
Counsel to the Independent Trustees
30 Rockefeller Plaza
New York, NY 10112 | | Trustee | | Since
August
2006 | | Managing Director, Aetos Capital, LLC (since March 2000); Co-President, Aetos Alternatives Management, LLC (since January 2004) and Co-Chief Executive Officer of Aetos Capital LLC (since August 2013); Chairperson of the Fixed Income Sub-Committee of the Investment Committee (since October 2006) and Director or Trustee of various Morgan Stanley Funds (since August 2006); formerly, Managing Director, Morgan Stanley & Co. Inc. and Morgan Stanley Dean Witter Investment Management, President, various Morgan Stanley Funds (June 1998-March 2000) and Principal, Morgan Stanley & Co. Inc. and Morgan Stanley Dean Witter Investment Management (August 1997-December 1999). | | | 90 | | | Director of certain investment funds managed or sponsored by Aetos Capital, LLC; Director of Sanitized AG and Sanitized Marketing AG (specialty chemicals). | |
Patricia Maleski (57)
c/o Perkins Coie LLP
Counsel to the Independent Trustees
30 Rockefeller Plaza
New York, NY 10112 | | Trustee | | Since
January
2017 | | Managing Director, JPMorgan Asset Management (2004-2016); Oversight and Control Head of Fiduciary and Conflicts of Interest Program (2015-2016); Chief Control Officer-Global Asset Management (2013-2015); President, JPMorgan Funds (2010-2013); Chief Administrative Officer (2004-2013); various other positions including Treasurer and Board Liaison (since 2001). | | | 91 | | | None. | |
Michael E. Nugent (81)
522 Fifth Avenue
New York, NY 10036 | | Chair of the Board and Trustee | | Chair of the Boards since
July 2006 and Trustee since
July 1991 | | Chair of the Boards of various Morgan Stanley Funds (since July 2006); Chairperson of the Closed-End Fund Committee (since June 2012) and Director or Trustee of various Morgan Stanley Funds (since July 1991); formerly, Chairperson of the Insurance Committee (until July 2006); General Partner, Triumph Capital, L.P. (private investment partnership) (1988-2013). | | | 92 | | | None. | |
W. Allen Reed (70)
c/o Perkins Coie LLP
Counsel to the Independent Trustees
30 Rockefeller Plaza
New York, NY 10112 | | Trustee | | Since
August
2006 | | Chairperson of the Equity Sub-Committee of the Investment Committee (since October 2006) and Director or Trustee of various Morgan Stanley Funds (since August 2006); formerly, President and CEO of General Motors Asset Management; Chairman and Chief Executive Officer of the GM Trust Bank and Corporate Vice President of General Motors Corporation (August 1994-December 2005). | | | 91 | | | Director of Legg Mason, Inc.; formerly, Director of the Auburn University Foundation (2010-2015). | |
Fergus Reid (85)
c/o Joe Pietryka, Inc.
85 Charles Colman Blvd.
Pawling, NY 12564 | | Trustee | | Since
June
1992 | | Chairman, Joe Pietryka, Inc.; Chairperson of the Governance Committee and Director or Trustee of various Morgan Stanley Funds (since June 1992). | | | 92 | | | Formerly, Trustee and Director of certain investment companies in the JP Morgan Fund Complex managed by JP Morgan Investment Management Inc. (1987-2012). | |
* This is the earliest date the Trustee began serving the Morgan Stanley Funds. Each Trustee serves an indefinite term, until his or her successor is elected.
** The Fund Complex includes (as of December 31, 2016) all open-end and closed-end funds (including all of their portfolios) advised by Morgan Stanley Investment Management Inc. (the "Adviser") and any funds that have an adviser that is an affiliated person of the Adviser (including, but not limited to, Morgan Stanley AIP GP LP).
*** This includes any directorships at public companies and registered investment companies held by the Trustee at any time during the past five years.
41
Morgan Stanley Institutional Fund Trust
Annual Report — September 30, 2017
Trustee and Officer Information (unaudited) (cont'd)
Executive Officers:
Name, Age and Address of Executive Officer | | Position(s) Held
with
Registrant | | Length of
Time Served* | | Principal Occupation(s) During Past 5 Years | |
John H. Gernon (54)
522 Fifth Avenue
New York, NY 10036 | | President and Principal Executive Officer | | Since
September
2013 | | President and Principal Executive Officer of the Equity and Fixed Income Funds and the Morgan Stanley AIP Funds (since September 2013) and the Liquidity Funds and various money market funds (since May 2014) in the Fund Complex; Managing Director of the Adviser; Head of Product (since 2006). | |
Timothy J. Knierim (58)
522 Fifth Avenue
New York, NY 10036 | | Chief
Compliance
Officer | | Since
December
2016 | | Managing Director of the Adviser and various entities affiliated with the Adviser; Chief Compliance Officer of various Morgan Stanley Funds and the Adviser (since December 2016) and Chief Compliance Officer of Morgan Stanley AIP GP LP (since 2014). Formerly, Managing Director and Deputy Chief Compliance Officer of the Adviser (2014-2016); and formerly, Chief Compliance Officer of Prudential Investment Management, Inc. (2007-2014). | |
Francis J. Smith (52)
522 Fifth Avenue
New York, NY 10036 | | Treasurer and Principal Financial Officer | | Treasurer since July 2003 and Principal Financial Officer since September
2002 | | Manging Director of the Adviser and various entities affiliated with the Adviser; Treasurer (since July 2003) and Principal Financial Officer of various Morgan Stanley Funds (since September 2002). | |
Mary E. Mullin (50)
522 Fifth Avenue
New York, NY 10036 | | Secretary | | Since
June
1999 | | Executive Director of the Adviser; Secretary of various Morgan Stanley Funds (since June 1999). | |
Michael J. Key (38)
522 Fifth Avenue
New York, NY 10036 | | Vice President | | Since
June
2017 | | Vice President of the Equity and Fixed Income Funds, Liquidity Funds, various money market funds and the Morgan Stanley AIP Funds in the Fund Complex (since June 2017); Executive Director of the Adviser; Head of Product Development for Equity and Fixed Income Funds (since August 2013). | |
* This is the earliest date the officer began serving the Morgan Stanley Funds. Each officer serves a one-year term, until his or her successor is elected and qualifies.
42
Morgan Stanley Institutional Fund Trust
Annual Report — September 30, 2017
Adviser and Administrator
Morgan Stanley Investment Management Inc.
522 Fifth Avenue
New York, New York 10036
Distributor
Morgan Stanley Distribution, Inc.
522 Fifth Avenue
New York, New York 10036
Dividend Disbursing and Transfer Agent
Boston Financial Data Services, Inc.
2000 Crown Colony Drive
Quincy, Massachusetts 02169
Custodian
State Street Bank and Trust Company
One Lincoln Street
Boston, Massachusetts 02111
Legal Counsel
Dechert LLP
1095 Avenue of the Americas
New York, New York 10036
Counsel to the Independent Trustees
Perkins Coie LLP
30 Rockefeller Plaza
New York, New York 10112
Independent Registered Public Accounting Firm
Ernst & Young LLP
200 Clarendon Street
Boston, Massachusetts 02116
Reporting to Shareholders
Each Morgan Stanley Fund provides a complete schedule of portfolio holdings in its semi-annual and annual reports within 60 days of the end of the fund's second and fourth fiscal quarters. The semi-annual and annual reports are filed electronically with the Securities and Exchange Commission (SEC) on Form N-CSRS and Form N-CSR, respectively. Morgan Stanley also delivers the semi-annual and annual reports to fund shareholders and makes these reports available on its public website, www.morganstanley.com/im. Each Morgan Stanley fund also files a complete schedule of portfolio holdings with the SEC for the fund's first and third fiscal quarters on Form N-Q. Morgan Stanley does not deliver the reports for the first and third fiscal quarters to shareholders, nor are the reports posted to the Morgan Stanley public website. You may, however, obtain the Form N-Q filings (as well as the Form N-CSR and N-CSRS filings) by accessing the SEC's website, www.sec.gov. You may also review and copy them at the SEC's Public Reference Room in Washington, DC. Information on the operation of the SEC's Public Reference Room may be obtained by calling the SEC toll free at 1 (800) SEC-0330. You can also request copies of these materials, upon payment of a duplicating fee, by electronic request at the SEC's email address (publicinfo@sec.gov) or by writing to the SEC's Public Reference Section, Washington, D.C. 20549-1520.
Proxy Voting Policies and Procedures and Proxy Voting Record
You may obtain a copy of the Trust's Proxy Voting Policy and Procedures and information regarding how the Trust voted proxies relating to portfolio securities during the most recent twelve-month period ended June 30, without charge, upon request, by calling toll free 1 (800) 548-7786 or by visiting our website at www.morganstanley.com/im. This information is also available on the SEC's website at www.sec.gov.
This report is authorized for distribution only when preceded or accompanied by a prospectus or summary prospectus of the applicable Fund of Morgan Stanley Institutional Fund Trust, which describes in detail the Fund's investment policies, risks, fees and expenses. Please read the prospectus carefully before you invest or send money. For additional information, including information regarding the investments comprising the Fund, please visit our website at www.morganstanley.com/im or call toll free 1 (800) 548-7786.
43
(This Page has been left blank intentionally.)
(This Page has been left blank intentionally.)
Printed in U.S.A.
This Report has been prepared for shareholders and may be distributed to others only if preceded or accompanied by a current prospectus.
Morgan Stanley Investment Management Inc.
522 Fifth Avenue
New York, New York 10036
© 2017 Morgan Stanley. Morgan Stanley Distribution, Inc.

IFTCBANN
1934001 EXP 11.30.18

Morgan Stanley Institutional Fund Trust
Global Multi-Asset Income Portfolio
Annual Report
September 30, 2017

Morgan Stanley Institutional Fund Trust
Annual Report — September 30, 2017
Shareholders' Letter | | | 2 | | |
Consolidated Expense Example | | | 3 | | |
Investment Overview | | | 4 | | |
Consolidated Portfolio of Investments | | | 8 | | |
Consolidated Statement of Assets and Liabilities | | | 28 | | |
Consolidated Statement of Operations | | | 30 | | |
Consolidated Statements of Changes in Net Assets | | | 31 | | |
Consolidated Financial Highlights | | | 32 | | |
Notes to Consolidated Financial Statements | | | 36 | | |
Report of Independent Registered Public Accounting Firm | | | 50 | | |
Investment Advisory Agreement Approval | | | 51 | | |
Federal Tax Notice | | | 53 | | |
Privacy Notice | | | 54 | | |
Trustee and Officer Information | | | 57 | | |
This report is authorized for distribution only when preceded or accompanied by a prospectus or summary prospectus of the applicable Fund of the Morgan Stanley Institutional Fund Trust. To receive a prospectus and/or statement of additional information (SAI), which contains more complete information such as investment objectives, charges, expenses, policies for voting proxies, risk considerations, and describes in detail each of the Fund's investment policies to the prospective investor, please call toll free 1 (800) 548-7786. Please read the prospectuses carefully before you invest or send money.
Additionally, you can access information about the Fund, including performance, characteristics, and investment team commentary, through Morgan Stanley Investment Management's website: www.morganstanley.com/im.
Market forecasts provided in this report may not necessarily come to pass. There is no guarantee that any sectors mentioned will continue to perform as discussed herein or that securities in such sectors will be held by the Fund in the future. There is no assurance that a fund will achieve its investment objective. Funds are subject to market risk, which is the possibility that market values of securities owned by the Fund will decline and, therefore, the value of the Fund's shares may be less than what you paid for them. Accordingly, you can lose money investing in this Fund. Please see the prospectus for more complete information on investment risks.
1
Morgan Stanley Institutional Fund Trust
Annual Report — September 30, 2017
Shareholders' Letter (unaudited)
Dear Shareholders,
We are pleased to provide this Annual report, in which you will learn how your investment in Global Multi-Asset Income Portfolio (the "Fund") performed during the latest twelve-month period.
Morgan Stanley Investment Management is a client-centric, investor-led organization. Our global presence, intellectual capital, and breadth of products and services enable us to partner with investors to meet the evolving challenges of today's financial markets. We aim to deliver superior investment service and to empower our clients to make the informed decisions that help them reach their investment goals.
As always, we thank you for selecting Morgan Stanley Investment Management, and look forward to working with you in the months and years ahead.
Sincerely,

John H. Gernon
President and Principal Executive Officer
October 2017
2
Morgan Stanley Institutional Fund Trust
Annual Report — September 30, 2017
Consolidated Expense Example (unaudited)
Global Multi-Asset Income Portfolio
As a shareholder of the Fund, you may incur two types of costs: (1) transactional costs, including sales charge (loads) on purchase payments; and (2) ongoing costs, which may include advisory fees, administration fees, distribution and shareholder services fees; and other Fund expenses. This example is intended to help you understand your ongoing costs (in dollars) of investing in the Fund and to compare these costs with the ongoing costs of investing in other mutual funds.
This example is based on an investment of $1,000 invested at the beginning of the six-month period ended September 30, 2017 and held for the entire six-month period.
Actual Expenses
The table below provides information about actual account values and actual expenses. You may use the information in this table, together with the amount you invested, to estimate the expenses that you paid over the period. Simply divide your account value by $1,000 (for example, an $8,600 account value divided by $1,000 = 8.6), then multiply the result by the number in the table under the heading entitled "Actual Expenses Paid During Period" to estimate the expenses you paid on your account during this period.
Hypothetical Example for Comparison Purposes
The table below provides information about hypothetical account values and hypothetical expenses based on the Fund's actual expense ratio and an assumed rate of return of 5% per year before expenses, which is not the Fund's actual return. The hypothetical account values and expenses may not be used to estimate the actual ending account balance or expenses you paid for the period. You may use this information to compare the ongoing costs of investing in the Fund and other funds. To do so, compare this 5% hypothetical example with the 5% hypothetical examples that appear in the shareholder reports of the other funds.
Please note that the expenses shown in the table are meant to highlight your ongoing costs only and do not reflect any transactional costs, such as sales charges (loads, if applicable). Therefore, the information for each class in the table is useful in comparing ongoing costs only, and will not help you determine the relative total costs of owning different funds. In addition, if these transactional costs were included, your costs would have been higher.
| | | Beginning
Account
Value
4/1/17 | | Actual Ending
Account
Value
9/30/17 | | Hypothetical
Ending Account
Value | | Actual
Expenses
Paid
During
Period* | | Hypothetical
Expenses Paid
During Period* | | Net
Expense
Ratio
During
Period** | |
Global Multi-Asset Income Portfolio Class I | | $ | 1,000.00 | | | $ | 1,061.60 | | | $ | 1,020.41 | | | $ | 4.81 | | | $ | 4.71 | | | | 0.93 | % | |
Global Multi-Asset Income Portfolio Class A | | | 1,000.00 | | | | 1,058.90 | | | | 1,018.70 | | | | 6.55 | | | | 6.43 | | | | 1.27 | | |
Global Multi-Asset Income Portfolio Class C | | | 1,000.00 | | | | 1,056.10 | | | | 1,014.89 | | | | 10.46 | | | | 10.25 | | | | 2.03 | | |
Global Multi-Asset Income Portfolio Class IS | | | 1,000.00 | | | | 1,061.80 | | | | 1,020.71 | | | | 4.50 | | | | 4.41 | | | | 0.87 | | |
* Expenses are calculated using each Fund Class' annualized net expense ratio (as disclosed), multiplied by the average account value over the period, and multiplied by 183/365 (to reflect the most recent one-half year period).
** Annualized.
3
Morgan Stanley Institutional Fund Trust
Annual Report — September 30, 2017
Investment Overview (unaudited)
Global Multi-Asset Income Portfolio
The Global Multi-Asset Income Portfolio's investment objective is to maximize current income and to seek capital appreciation over time.
Performance
For the fiscal year ended September 30, 2017, the Fund's Class I shares had a total return based on net asset value and reinvestment of distributions per share of 5.24%, net of fees. The Fund's Class I shares outperformed against the Fund's benchmark, the Bloomberg Barclays Global Aggregate Index, which returned –1.26%, but underperformed the Customized MSIM Global Allocation Income Index (the "Customized Index", which is comprised of 30% MSCI All Country World Index, 50% Bloomberg Barclays Global Aggregate Index, 5% Dow Jones Brookfield Global Infrastructure Index, 5% FTSE EPRA/NAREIT Developed Index, 5% Barclays Global High Yield Index, and 5% JP Morgan EMBI Global Index), which returned 5.89%.
Factors Affecting Performance1
• In the 12 months ended September 30, 2017, global equities outperformed bonds and commodities, with the MSCI All Country World Index up +18.7%, the Bloomberg Barclays Global Aggregate Index down –1.3%, and the S&P GSCI Index, a broad index of commodity prices, rising +1.8%.2 (Except where noted, equity market returns are represented by the MSCI regional or country index and are calculated in U.S. dollars [USD].)
• A benign macroeconomic backdrop and low global interest rates fueled a preference for risk assets in the reporting period. Moderate growth in the U.S., improving growth in Europe, a sustained expansion in Japan and stable growth in China, coupled with low interest rates and muted inflation, provided a supportive environment for global equities, particularly emerging market equities, and the credit sectors of the fixed income markets, including U.S. high yield corporates and emerging market bonds.
• Global equities rose +18.7% (MSCI All Country World Index, USD) as above-trend global growth, low inflation, and accommodative global central banks helped risky assets rally during the period. U.S. equities performed in line with the MSCI All Country World Index, with the S&P 500 Index up +18.6%. U.S. economic growth data was strong, with an average quarterly gross domestic product (GDP) growth rate of +2.3%.3 In addition, toward the end of the period, optimism rose that the Trump administration would be able to pass pro-growth tax reform. Eurozone equities rose (Euro Stoxx 50 Index +22.8% in euros, +29.1% USD), on strong economic data and declining political risks in the region. The European Central Bank (ECB) gave indications it would start unwinding the quantitative easing (QE) program in 2018. Emerging markets (MSCI Emerging Markets Index +22.5% USD, 21.8% local currency) performed strongly, supported by the lower U.S. dollar (DXY –2.5%), a recovery in commodity prices and stable Chinese data. Japanese equities rose (MSCI Japan Index +27.2% local, +14.1% USD) on improving inflation and economic data, as well as indications of continued central bank support for the economy. Later in September 2017, equities rose over the optimism ahead of a snap election in October, where markets expected a majority win by the ruling coalition.
• Within bonds, global government yields rose during the period. In the U.S., the 10-year yield rose +74 basis points (bps) to 2.33%, while the 2-year yield rose +72 bps to 1.48%. The Federal Open Market Committee (FOMC) raised the policy rate by an aggregate +75 bps during the period at the December 2016, March 2017 and June 2017 meetings. In addition, the Federal Reserve (Fed) confirmed it would commence balance sheet reduction beginning in October 2017. U.S. credit spreads tightened against a backdrop of strong growth, low volatility and stabilization in oil prices (West Texas Intermediate oil price rose to $52 per
1 Certain of the Fund's investment themes may, in whole or part, be implemented through the use of derivatives, including the purchase and sale of futures, options, swaps, structured investments (including commodity-linked notes) and other related instruments and techniques. The Fund may also invest in foreign currency forward exchange contracts, which are also derivatives, in connection with its investments in foreign securities. The Fund may use derivative instruments for a variety of purposes, including hedging, risk management, portfolio management or to earn income. As a result, the use of derivatives had a material effect on the Fund's performance during the period.
2 Data sources used in preparation of this commentary include FactSet and Bloomberg LP. Data as of September 30, 2017.
3 U.S. GDP data from the Bureau of Economic Analysis, October 27, 2017.
4
Morgan Stanley Institutional Fund Trust
Annual Report — September 30, 2017
Investment Overview (unaudited) (cont'd)
Global Multi-Asset Income Portfolio
barrel by the end of the period). U.S. investment grade credit spreads fell –37 bps to 1.01%, and U.S. high yield spreads fell –133 bps to 3.47%. Elsewhere in developed markets, German 10-year yields rose +58 bps to 0.46% on better economic data in the region and indications the ECB would start unwinding its QE in 2018. Japanese 10-year yields rose +16 bps to +0.07%. The U.K. 10-year yield rose +62 bps to 1.37%, as economic data showed a resilient labor market and accelerating incomes. Brexit negotiations also increasingly suggested a softer approach, which would minimize disruption to the U.K. economy. Emerging sovereign spreads fell –52 bps to 3.08%, as emerging market growth and commodity prices rebounded.
• Within currencies, the U.S. dollar fell –2.5% on a trade-weighted basis. Trump's failure to implement health care policy at the beginning of 2017 raised doubts about Republicans' ability to pass pro-growth tax and infrastructure policies. In addition, bond markets started pricing in a lower probability of rate hikes as inflation disappointed expectations. Among the strongest gainers versus the USD was the Mexican peso, which rose +6.2%, as the U.S. administration signaled that changes to the North American Free Trade Agreement (NAFTA) might be less dramatic than initially anticipated, and Mexico's central bank took steps to boost the currency, raising rates in March 2017. Energy-sensitive currencies like the Russian ruble (+9.4%), Canadian dollar (+5.3%) and Brazilian real (+3.1%) outperformed USD as Brent oil rallied +17% during this period. In addition, the euro strengthened on the back of encouraging eurozone economic data, and as the ECB gave indications it would start unwinding the QE in 2018.
• Active positions within equities contributed positively to performance. Overweight positions in eurozone domestically focused equities relative to U.S. equities and eurozone banks relative to eurozone equities were the top contributors, in addition to overweight positions in U.S. banks and U.S. airlines, all hedged. However, these gains were partially offset by losses from underweight positions in global aerospace, China H-shares and global iron ore mining stocks, all relative to global equities. Writing call options on broad global equity market indexes had a significant negative impact on performance.
• Active positions within fixed income strongly contributed to performance. Underweight positions in U.S. and German 10-year rates and an overweight position in U.S. 10-year inflation breakevens contributed to performance. In addition, a directional overweight position in Brazilian bonds, and an overweight position in Portuguese bonds relative to both German and Italian 10-year bonds contributed to performance. Detractors during the period included an overweight position in Australian 10-year bonds relative to German 10-year bunds.
• Active positions within high-yielding assets had a negligible impact on performance.
• Active currency positions (implemented via currency forwards and futures) positively impacted performance. Underweight positions in the Japanese yen relative to U.S. dollar and euro relative to the Czech koruna contributed to performance. Other contributors included overweight positions in the Mexican peso and Turkish lira, both relative to U.S. dollar. These gains were partially offset by losses from overweight positions in oil-sensitive currencies (Norwegian krone, Canadian dollar, and Russian ruble) and in British pound sterling relative to euro.
Management Strategies
• As of September 30, 2017, the Fund was neutral global equities and underweight global fixed income. We expect the global economic recovery to continue to sustain a steady above-trend pace of growth; however, equity valuations are high, particularly in the U.S. In emerging markets ex-China, the modest post-commodity-boom recovery will likely continue after a five-year slowdown.
• We are underweight fixed income via U.S. 10-year Treasuries. The U.S. 10-year Treasury yield, currently at 2.23%, is 27 basis points below our estimate of year-end fair value (2.5%). Bond markets are extrapolating recent disappointments in U.S. inflation, and pricing in less than one full rate hike per year in the next three years. In contrast, we expect three Fed hikes before end-2018 — or one every six months — based on extremely easy financial conditions, solid growth in most regions globally, further improvement in the U.S. labor market, and modestly rising inflation (we forecast core personal consumption expenditures at 1.8% by end-2018, 2.0% by end-2019). Elsewhere in fixed
5
Morgan Stanley Institutional Fund Trust
Annual Report — September 30, 2017
Investment Overview (unaudited) (cont'd)
Global Multi-Asset Income Portfolio
income, we hold an overweight position in Greek, Portuguese, and U.S. bonds relative to German bunds, which are expensive given ongoing improvements in global and eurozone growth.
• We are underweight U.S. equities. U.S. equity valuations are high, trading at 17.8x 12-month forward earnings, more than 30% above the 70-year average. U.S. equities are in the sweet spot of above-trend growth and low inflation; however, we believe that policy hikes and quantitative tightening in 2018 will be a negative catalyst for equities that leads to a liquidity reduction and growth slowdown.
• We are overweight European Economic and Monetary Union (EMU) equities via domestically oriented stocks and overweight banks. EMU PMIs (Purchasing Managers Indexes) imply growth is running at a 2.5% pace, above the consensus expectation for 2.1-2.2% year-over-year in the second half of 2017. Core inflation also appears to have bottomed in the eurozone, and we expect it to continue trending slowly upward. EMU domestic stocks are 12% undervalued based on relative earnings growth, and we expect EMU domestic earnings per share growth to continue to outpace the U.S. by an additional 4% over the next 12 months. We expect EMU banks to re-rate as profitability normalizes.
• We are neutral emerging market equities. Chinese growth has been more resilient than expected, but we think a slowdown is still likely in the next six to 12 months. In emerging markets ex-China, valuation is neutral. Structurally, we believe that emerging market economies have entered into a "new normal" phase of slower growth, given declining working age populations, a transition from investment-led to consumption-led growth, declining total factor productivity, and the end of a commodity and credit cycle. Cyclically, emerging market GDP growth is in a recovery phase, mainly driven by China's stimulus from 2015-16 and a recovery in commodity prices. We are overweight Russian stocks relative to a basket of developed market energy stocks. We believe the Russian economy is in the early stages of a recovery with improvement in consumption and investment, and with non-performing loan growth peaking.
• We are overweight Japanese equities and underweight the yen. We expect Japan's economy to grow at around 1% in 2018, with core inflation accelerating to nearly 1% by the first half of 2018. As the Bank of Japan has effectively capped nominal rates, we expect accelerating inflation to drive depreciation in the yen. On relative price-to-book ratios, Japanese equities are trading at a 56% discount, or 16% below the historical median discount of 48% to U.S. equities.
• In currencies, we are overweight regional inflation plays in Sweden and the Czech Republic. The Swedish krona remains 15-20% cheap versus fair value and sentiment is neutral. With Swedish growth accelerating and a potential positive output gap, the Riksbank will be forced to tighten policy soon in our view. The Czech economy is growing strongly, and the output gap will likely turn positive in the third quarter 2017. We expect sterling to appreciate by 15%. Sterling is cheap versus the euro, and investors are bearish. We believe the markets have overestimated the potential negative effects of leaving the European Union.
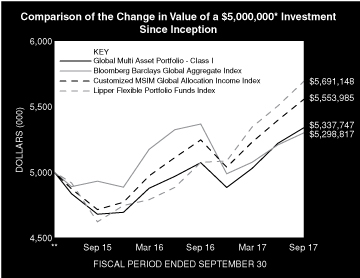
* Minimum Investment
** Commenced operations on April 30 2015.
In accordance with SEC regulations, the Fund's performance shown assumes that all recurring fees (including management fees) were deducted and all dividends and distributions were reinvested. The performance of Class A, Class C and Class IS shares will vary from the performance of Class I shares based upon their different inception dates and will be negatively impacted by additional fees assessed to those classes (where applicable).
6
Morgan Stanley Institutional Fund Trust
Annual Report — September 30, 2017
Investment Overview (unaudited) (cont'd)
Global Multi-Asset Income Portfolio
Performance Compared to the Bloomberg Barclays Global Aggregate Index(1), the Customized MSIM Global Allocation Income Index(2), and the Lipper Flexible Portfolio Funds Index(3)
| | | Period Ended September 30, 2017
Total Returns(4) | |
| | | | | Average Annual | |
| | | One
Year | | Five
Years | | Ten
Years | | Since
Inception(7) | |
Fund — Class I Shares
w/o sales charges(5) | | | 5.24 | % | | | — | | | | — | | | | 2.74 | % | |
Fund — Class A Shares
w/o sales charges(5) | | | 4.89 | | | | — | | | | — | | | | 2.38 | | |
Fund — Class A Shares
with maximum 5.25%
sales charges(5) | | | –0.64 | | | | — | | | | — | | | | 0.14 | | |
Fund — Class C Shares
w/o sales charges(6) | | | 4.21 | | | | — | | | | — | | | | 1.63 | | |
Fund — Class C Shares
with maximum 1.00%
deferred sales charges(6) | | | 3.21 | | | | — | | | | — | | | | 1.63 | | |
Fund — Class IS Shares
w/o sales charges(5) | | | 5.40 | | | | — | | | | — | | | | 2.83 | | |
Bloomberg Barclays Global
Aggregate Index | | | –1.26 | | | | — | | | | — | | | | 2.43 | | |
Customized MSIM Global
Allocation Income Index | | | 5.89 | | | | — | | | | — | | | | 4.44 | | |
Lipper Flexible Portfolio Funds Index | | | 12.17 | | | | — | | | | — | | | | 5.50 | | |
Performance data quoted represents past performance, which is no guarantee of future results, and current performance may be lower or higher than the figures shown. Performance assumes that all dividends and distributions, if any, were reinvested. For the most recent month-end performance figures, please visit www.morganstanley.com/im. Investment returns and principal value will fluctuate so that Fund shares, when redeemed, may be worth more or less than their original cost. Total returns do not reflect the deduction of taxes that a shareholder would pay on Fund distributions or the redemption of Fund shares. Performance of share classes will vary due to differences in sales charges and expenses.
(1) The Bloomberg Barclays Global Aggregate Index provides a broadbased measure of the global investment grade fixed-rate debt markets. Total Returns shown in unhedged USD. The Index is unmanaged and its returns do not include any sales charges or fees. Such costs would lower performance. It is not possible to invest directly in an index.
(2) The Customized MSIM Global Allocation Income Index is comprised of 30% MSCI All Country World Index (benchmark that measures the equity market performance of developed and emerging markets), 50% Bloomberg Barclays Global Aggregate Index (benchmark that provides a broadbased measure of the global investment grade fixed-rate debt markets), 5% Dow Jones Brookfield Global Infrastructure Index (benchmark that measures the stock performance of companies that exhibit strong infrastructure charateristics), 5% FTSE EPRA/NAREIT Developed Index (benchmark that is designed to reflect stock performance of companies engaged in North American, European, and Asian real estate markets), 5% Bloomberg Barclays Global High Yield Index (benchmark that is a multi currency flagship measure of global high yield debt market), 5% JP Morgan EMBI Global Index (benchmark that tracks returns for U.S. dollar-denominated debt instruments issued by emerging market sovereign and quasi
sovereign entities). The Index is unmanaged and its returns do not include any sales charges or fees. Such costs would lower performance. It is not possible to invest directly in an index.
(3) The Lipper Flexible Portfolio Funds Index is an equally weighted performance index of the largest qualifying funds (based on net assets) in the Lipper Flexible Portfolio Funds classification. The Index, which is adjusted for capital gains distributions and income dividends, is unmanaged and should not be considered an investment. There are currently 30 funds represented in this Index. As of the date of this report, the Fund was in the Lipper Flexible Portfolio Funds classification.
(4) Total returns for the Fund reflect expenses waived and/or reimbursed, if applicable, by the Adviser. Without such waivers and/or reimbursements, total returns would have been lower.
(5) Commenced operations on April 30, 2015.
(6) Commenced operations on May 08, 2015.
(7) For comparative purposes, average annual since inception returns listed for the Indexes refer to the inception date of Class I of the Fund, not the inception of the Indexes.
7
Morgan Stanley Institutional Fund Trust
Annual Report — September 30, 2017
Consolidated Portfolio of Investments
Global Multi-Asset Income Portfolio
| | | Face
Amount
(000) | | Value
(000) | |
Fixed Income Securities (49.4%) | |
Agency Fixed Rate Mortgages (3.8%) | |
United States (3.8%) | |
Federal Home Loan Mortgage Corporation, | |
Gold Pools: | |
3.50%, 2/1/45 | | $ | 45 | | | $ | 46 | | |
Federal National Mortgage Association, | |
Conventional Pools: | |
4.50%, 10/1/44 - 11/1/44 | | | 43 | | | | 47 | | |
November TBA: | |
3.50%, 11/1/47 (a) | | | 204 | | | | 210 | | |
October TBA: | |
3.00%, 10/1/32 (a) | | | 62 | | | | 64 | | |
4.00%, 10/1/47 (a) | | | 140 | | | | 147 | | |
4.50%, 10/1/47 (a) | | | 60 | | | | 64 | | |
| | | | 578 | | |
Commercial Mortgage-Backed Securities (1.5%) | |
United States (1.5%) | |
GS Mortgage Securities Trust, | |
4.92%, 8/10/46 (b)(c) | | | 70 | | | | 67 | | |
Wells Fargo Commercial Mortgage Trust, | |
4.24%, 5/15/48 (b) | | | 51 | | | | 45 | | |
WFCG Commercial Mortgage Trust, | |
1 Month LIBOR + 3.14%, 4.38%, 11/15/29 (b)(c) | | | 40 | | | | 40 | | |
WFRBS Commercial Mortgage Trust, | |
4.27%, 5/15/45 (b)(c) | | | 40 | | | | 37 | | |
4.63%, 8/15/46 (b)(c) | | | 25 | | | | 22 | | |
5.15%, 9/15/46 (b)(c) | | | 25 | | | | 24 | | |
| | | | 235 | | |
Corporate Bonds (10.7%) | |
Australia (0.7%) | |
Australia & New Zealand Banking Group Ltd., | |
5.13%, 9/10/19 | | EUR | 50 | | | | 65 | | |
Commonwealth Bank of Australia, | |
1.75%, 11/7/19 (c) | | $ | 25 | | | | 25 | | |
Transurban Finance Co., Pty Ltd., | |
4.13%, 2/2/26 (c) | | | 25 | | | | 26 | | |
| | | | 116 | | |
Belgium (0.2%) | |
Anheuser-Busch InBev Finance, Inc., | |
4.70%, 2/1/36 | | | 25 | | | | 28 | | |
Canada (0.2%) | |
Royal Bank of Canada, | |
2.75%, 2/1/22 | | | 25 | | | | 25 | | |
France (0.3%) | |
BNP Paribas SA, | |
5.00%, 1/15/21 | | | 50 | | | | 54 | | |
Germany (0.1%) | |
Deutsche Bank AG, | |
2.70%, 7/13/20 | | | 25 | | | | 25 | | |
| | | Face
Amount
(000) | | Value
(000) | |
Israel (0.1%) | |
Teva Pharmaceutical Finance Netherlands III BV, | |
2.20%, 7/21/21 | | $ | 10 | | | $ | 10 | | |
Netherlands (0.8%) | |
ABN Amro Bank N.V., | |
3.63%, 10/6/17 | | EUR | 50 | | | | 59 | | |
Cooperatieve Rabobank UA, | |
3.75%, 11/9/20 | | | 50 | | | | 66 | | |
| | | | 125 | | |
United Kingdom (0.4%) | |
Barclays Bank PLC, | |
6.00%, 1/23/18 | | | 50 | | | | 60 | | |
United States (7.9%) | |
Abbott Laboratories, | |
3.40%, 11/30/23 | | $ | 25 | | | | 26 | | |
Air Lease Corp., | |
2.13%, 1/15/20 | | | 25 | | | | 25 | | |
Amazon.com, Inc., | |
2.80%, 8/22/24 (c) | | | 25 | | | | 25 | | |
American Express Credit Corp., | |
1.88%, 5/3/19 | | | 10 | | | | 10 | | |
Apple, Inc., | |
2.50%, 2/9/22 | | | 50 | | | | 51 | | |
4.45%, 5/6/44 | | | 25 | | | | 27 | | |
AT&T, Inc., | |
4.13%, 2/17/26 | | | 50 | | | | 51 | | |
4.25%, 3/1/27 | | | 25 | | | | 26 | | |
Bank of America Corp., | |
Series G | |
3.50%, 4/19/26 | | | 25 | | | | 25 | | |
Boston Properties LP, | |
3.85%, 2/1/23 | | | 50 | | | | 53 | | |
Charter Communications Operating LLC/
Charter Communications Operating Capital, | |
4.91%, 7/23/25 | | | 25 | | | | 27 | | |
Citigroup, Inc., | |
5.50%, 9/13/25 | | | 50 | | | | 56 | | |
Discovery Communications LLC, | |
2.95%, 3/20/23 | | | 25 | | | | 25 | | |
General Motors Financial Co., Inc., | |
4.30%, 7/13/25 | | | 5 | | | | 5 | | |
Goldman Sachs Group, Inc. (The), | |
6.75%, 10/1/37 | | | 50 | | | | 66 | | |
HSBC USA, Inc., | |
3.50%, 6/23/24 | | | 100 | | | | 103 | | |
JPMorgan Chase & Co., | |
3.78%, 2/1/28 | | | 25 | | | | 26 | | |
McDonald's Corp., | |
MTN | |
3.38%, 5/26/25 | | | 50 | | | | 51 | | |
The accompanying notes are an integral part of the consolidated financial statements.
8
Morgan Stanley Institutional Fund Trust
Annual Report — September 30, 2017
Consolidated Portfolio of Investments (cont'd)
Global Multi-Asset Income Portfolio
| | | Face
Amount
(000) | | Value
(000) | |
United States (cont'd) | |
Merck & Co., Inc., | |
2.80%, 5/18/23 | | $ | 50 | | | $ | 51 | | |
Microsoft Corp., | |
1.55%, 8/8/21 | | | 25 | | | | 25 | | |
Monongahela Power Co., | |
5.40%, 12/15/43 (c) | | | 50 | | | | 61 | | |
| MPLX LP, | |
4.00%, 2/15/25 | | | 50 | | | | 51 | | |
NBC Universal Media LLC, | |
4.38%, 4/1/21 | | | 50 | | | | 54 | | |
Omnicom Group, Inc., | |
3.63%, 5/1/22 | | | 50 | | | | 52 | | |
PepsiCo, Inc., | |
1.70%, 10/6/21 | | | 25 | | | | 25 | | |
Prudential Financial, Inc., | |
MTN | |
6.63%, 12/1/37 | | | 50 | | | | 67 | | |
UnitedHealth Group, Inc., | |
2.88%, 3/15/23 | | | 25 | | | | 26 | | |
Verizon Communications, Inc., | |
3.50%, 11/1/24 | | | 25 | | | | 26 | | |
Visa, Inc., | |
3.15%, 12/14/25 | | | 25 | | | | 26 | | |
Wal-Mart Stores, Inc., | |
2.55%, 4/11/23 | | | 25 | | | | 25 | | |
Wells Fargo & Co., | |
3.00%, 10/23/26 | | | 50 | | | | 49 | | |
| | | | 1,216 | | |
| | | | 1,659 | | |
Sovereign (28.4%) | |
Australia (1.0%) | |
Australia Government Bond, | |
2.75%, 11/21/27 | | AUD | 120 | | | | 93 | | |
3.25%, 4/21/25 | | | 80 | | | | 65 | | |
| | | | 158 | | |
Austria (0.4%) | |
Republic of Austria Government Bond, | |
1.20%, 10/20/25 (c) | | EUR | 50 | | | | 63 | | |
Belgium (1.5%) | |
Kingdom of Belgium Government Bond, | |
0.80%, 6/22/25 (c) | | | 185 | | | | 226 | | |
Canada (1.4%) | |
Canadian Government Bond, | |
0.50%, 3/1/22 | | CAD | 95 | | | | 72 | | |
1.50%, 6/1/26 | | | 180 | | | | 138 | | |
| | | | 210 | | |
Denmark (0.1%) | |
Denmark Government Bond, | |
0.50%, 11/15/27 | | DKK | 100 | | | | 16 | | |
| | | Face
Amount
(000) | | Value
(000) | |
France (0.8%) | |
French Republic Government Bond OAT, | |
0.50%, 5/25/25 | | EUR | 70 | | | $ | 84 | | |
3.25%, 5/25/45 | | | 25 | | | | 39 | | |
| | | | 123 | | |
Germany (3.4%) | |
Bundesrepublik Deutschland, | |
1.00%, 8/15/25 | | | 113 | | | | 143 | | |
2.50%, 1/4/21 | | | 200 | | | | 260 | | |
4.25%, 7/4/39 | | | 45 | | | | 86 | | |
4.75%, 7/4/34 | | | 15 | | | | 29 | | |
| | | | 518 | | |
Greece (0.9%) | |
Hellenic Republic Government Bond, | |
3.00%, 2/24/23 - 2/24/42 (d) | | | 152 | | | | 142 | | |
Hungary (0.1%) | |
Hungary Government International Bond, | |
5.75%, 11/22/23 | | $ | 20 | | | | 23 | | |
Ireland (0.1%) | |
Ireland Government Bond, | |
5.40%, 3/13/25 | | EUR | 10 | | | | 16 | | |
Italy (1.7%) | |
Italy Buoni Poliennali Del Tesoro, | |
1.45%, 9/15/22 | | | 70 | | | | 85 | | |
2.20%, 6/1/27 | | | 45 | | | | 54 | | |
2.35%, 9/15/24 (c) | | | 81 | | | | 109 | | |
5.00%, 9/1/40 | | | 10 | | | | 15 | | |
| | | | 263 | | |
Japan (8.0%) | |
Japan Government Ten Year Bond, | |
0.10%, 6/20/26 | | JPY | 2,000 | | | | 18 | | |
0.50%, 9/20/24 | | | 40,000 | | | | 369 | | |
1.10%, 6/20/21 | | | 21,000 | | | | 195 | | |
1.70%, 6/20/18 | | | 31,000 | | | | 279 | | |
Japan Government Thirty Year Bond, | |
0.30%, 6/20/46 | | | 4,900 | | | | 37 | | |
1.70%, 6/20/33 | | | 16,400 | | | | 176 | | |
2.00%, 9/20/40 | | | 15,000 | | | | 170 | | |
| | | | 1,244 | | |
Mexico (1.6%) | |
Mexican Bonos, | |
Series M | |
5.75%, 3/5/26 | | MXN | 400 | | | | 21 | | |
6.50%, 6/10/21 | | | 2,600 | | | | 142 | | |
7.50%, 6/3/27 | | | 1,000 | | | | 57 | | |
Petroleos Mexicanos, | |
4.88%, 1/18/24 | | $ | 20 | | | | 21 | | |
6.38%, 1/23/45 | | | 10 | | | | 10 | | |
| | | | 251 | | |
Netherlands (0.5%) | |
Netherlands Government Bond, | |
0.25%, 7/15/25 (c) | | EUR | 70 | | | | 83 | | |
The accompanying notes are an integral part of the consolidated financial statements.
9
Morgan Stanley Institutional Fund Trust
Annual Report — September 30, 2017
Consolidated Portfolio of Investments (cont'd)
Global Multi-Asset Income Portfolio
| | | Face
Amount
(000) | | Value
(000) | |
Norway (0.1%) | |
Norway Government Bond, | |
2.00%, 5/24/23 (c) | | NOK | 100 | | | $ | 13 | | |
Poland (0.1%) | |
Republic of Poland Government Bond, | |
4.00%, 10/25/23 | | PLN | 40 | | | | 12 | | |
Portugal (2.1%) | |
Portugal Obrigacoes do Tesouro OT, | |
2.88%, 7/21/26 (c) | | EUR | 134 | | | | 167 | | |
4.13%, 4/14/27 (c) | | | 119 | | | | 161 | | |
| | | | 328 | | |
Russia (0.5%) | |
Russian Federal Bond - OFZ, | |
7.00%, 8/16/23 | | RUB | 4,200 | | | | 71 | | |
South Africa (0.1%) | |
Republic of South Africa Government Bond, | |
8.00%, 1/31/30 | | ZAR | 200 | | | | 13 | | |
Spain (1.2%) | |
Spain Government Bond, | |
0.40%, 4/30/22 | | EUR | 40 | | | | 48 | | |
1.30%, 10/31/26 (c) | | | 5 | | | | 6 | | |
1.95%, 7/30/30 (c) | | | 60 | | | | 71 | | |
Spain Government Inflation Linked Bond, | |
1.00%, 11/30/30 (c) | | | 40 | | | | 49 | | |
1.80%, 11/30/24 (c) | | | 10 | | | | 14 | | |
| | | | 188 | | |
Sweden (0.1%) | |
Sweden Government Bond, | |
1.00%, 11/12/26 | | SEK | 70 | | | | 9 | | |
United Kingdom (2.7%) | |
United Kingdom Gilt, | |
1.50%, 1/22/21 | | GBP | 30 | | | | 41 | | |
2.75%, 9/7/24 | | | 115 | | | | 172 | | |
4.25%, 6/7/32 - 9/7/39 | | | 112 | | | | 206 | | |
| | | | 419 | | |
| | | | 4,389 | | |
U.S. Treasury Securities (5.0%) | |
United States (5.0%) | |
U.S. Treasury Bonds, | |
2.50%, 2/15/45 | | $ | 250 | | | | 233 | | |
3.50%, 2/15/39 | | | 40 | | | | 45 | | |
U.S. Treasury Notes, | |
0.38%, 1/15/27 | | | 81 | | | | 80 | | |
1.38%, 1/31/21 | | | 130 | | | | 129 | | |
1.75%, 4/30/22 | | | 80 | | | | 80 | | |
2.13%, 5/15/25 | | | 100 | | | | 99 | | |
2.25%, 2/15/27 | | | 110 | | | | 109 | | |
| | | | 775 | | |
Total Fixed Income Securities (Cost $7,385) | | | 7,636 | | |
| | | Shares | | Value
(000) | |
Common Stocks (28.1%) | |
Australia (1.2%) | |
AGL Energy Ltd. | | | 77 | | | $ | 1 | | |
Alumina Ltd. | | | 272 | | | | — | @ | |
Amcor Ltd. | | | 130 | | | | 2 | | |
AMP Ltd. | | | 328 | | | | 1 | | |
APA Group | | | 1,120 | | | | 7 | | |
Aristocrat Leisure Ltd. | | | 60 | | | | 1 | | |
ASX Ltd. | | | 21 | | | | 1 | | |
Aurizon Holdings Ltd. | | | 229 | | | | 1 | | |
AusNet Services | | | 1,706 | | | | 2 | | |
Australia & New Zealand Banking Group Ltd. | | | 338 | | | | 8 | | |
Bank of Queensland Ltd. | | | 44 | | | | — | @ | |
Bendigo & Adelaide Bank Ltd. | | | 53 | | | | 1 | | |
BHP Billiton Ltd. | | | 349 | | | | 7 | | |
Boral Ltd. | | | 130 | | | | 1 | | |
Brambles Ltd. | | | 178 | | | | 1 | | |
BWP Trust REIT | | | 257 | | | | 1 | | |
Caltex Australia Ltd. | | | 30 | | | | 1 | | |
Challenger Ltd. | | | 64 | | | | 1 | | |
Charter Hall Retail REIT | | | 179 | | | | 1 | | |
CIMIC Group Ltd. | | | 11 | | | | — | @ | |
Coca-Cola Amatil Ltd. | | | 64 | | | | — | @ | |
Cochlear Ltd. | | | 6 | | | | 1 | | |
Commonwealth Bank of Australia | | | 195 | | | | 12 | | |
Computershare Ltd. | | | 52 | | | | 1 | | |
Cromwell Property Group | | | 784 | | | | 1 | | |
Crown Resorts Ltd. | | | 40 | | | | — | @ | |
CSL Ltd. | | | 50 | | | | 5 | | |
Dexus REIT | | | 621 | | | | 5 | | |
Domino's Pizza Enterprises Ltd. | | | 7 | | | | — | @ | |
Flight Centre Travel Group Ltd. | | | 6 | | | | — | @ | |
Fortescue Metals Group Ltd. | | | 169 | | | | 1 | | |
Goodman Group REIT | | | 1,144 | | | | 7 | | |
GPT Group (The) REIT | | | 1,152 | | | | 4 | | |
Harvey Norman Holdings Ltd. | | | 61 | | | | — | @ | |
Healthscope Ltd. | | | 188 | | | | — | @ | |
Incitec Pivot Ltd. | | | 188 | | | | 1 | | |
Insurance Australia Group Ltd. | | | 270 | | | | 1 | | |
Investa Office Fund REIT | | | 299 | | | | 1 | | |
James Hardie Industries PLC CDI | | | 50 | | | | 1 | | |
Lend Lease Group REIT | | | 62 | | | | 1 | | |
Macquarie Atlas Roads Group | | | 401 | | | | 2 | | |
Macquarie Group Ltd. | | | 34 | | | | 2 | | |
Medibank Pvt Ltd. | | | 307 | | | | 1 | | |
Mirvac Group REIT | | | 2,374 | | | | 4 | | |
National Australia Bank Ltd. | | | 307 | | | | 8 | | |
Newcrest Mining Ltd. | | | 83 | | | | 1 | | |
Oil Search Ltd. | | | 151 | | | | 1 | | |
Orica Ltd. | | | 42 | | | | 1 | | |
Origin Energy Ltd. (e) | | | 195 | | | | 1 | | |
Qantas Airways Ltd. | | | 54 | | | | — | @ | |
QBE Insurance Group Ltd. | | | 160 | | | | 1 | | |
The accompanying notes are an integral part of the consolidated financial statements.
10
Morgan Stanley Institutional Fund Trust
Annual Report — September 30, 2017
Consolidated Portfolio of Investments (cont'd)
Global Multi-Asset Income Portfolio
| | | Shares | | Value
(000) | |
Australia (cont'd) | |
Ramsay Health Care Ltd. | | | 16 | | | $ | 1 | | |
REA Group Ltd. | | | 6 | | | | — | @ | |
Rio Tinto Ltd. | | | 46 | | | | 2 | | |
Santos Ltd. (e) | | | 200 | | | | 1 | | |
Scentre Group REIT | | | 3,303 | | | | 10 | | |
Seek Ltd. | | | 37 | | | | 1 | | |
Shopping Centres Australasia Property Group REIT | | | 656 | | | | 1 | | |
Sonic Healthcare Ltd. | | | 45 | | | | 1 | | |
South32 Ltd. | | | 580 | | | | 2 | | |
Spark Infrastructure Group | | | 1,496 | | | | 3 | | |
Stockland REIT | | | 1,612 | | | | 5 | | |
Suncorp Group Ltd. | | | 143 | | | | 1 | | |
Sydney Airport | | | 1,111 | | | | 6 | | |
Tabcorp Holdings Ltd. | | | 92 | | | | — | @ | |
Tatts Group Ltd. | | | 161 | | | | 1 | | |
Telstra Corp., Ltd. | | | 474 | | | | 1 | | |
TPG Telecom Ltd. | | | 38 | | | | — | @ | |
Transurban Group | | | 2,012 | | | | 19 | | |
Treasury Wine Estates Ltd. | | | 82 | | | | 1 | | |
Vicinity Centres REIT | | | 2,115 | | | | 4 | | |
Vocus Group Ltd. | | | 58 | | | | — | @ | |
Wesfarmers Ltd. | | | 125 | | | | 4 | | |
Westfield Corp. REIT | | | 1,252 | | | | 8 | | |
Westpac Banking Corp. | | | 384 | | | | 10 | | |
Woodside Petroleum Ltd. | | | 85 | | | | 2 | | |
Woolworths Ltd. | | | 142 | | | | 3 | | |
| | | | 189 | | |
Austria (0.1%) | |
BUWOG AG (e) | | | 49 | | | | 2 | | |
CA Immobilien Anlagen AG | | | 38 | | | | 1 | | |
Erste Group Bank AG (e) | | | 138 | | | | 6 | | |
Raiffeisen Bank International AG (e) | | | 58 | | | | 2 | | |
| | | | 11 | | |
Belgium (0.2%) | |
Aedifica SA REIT | | | 7 | | | | 1 | | |
Anheuser-Busch InBev N.V. | | | 122 | | | | 15 | | |
Befimmo SA REIT | | | 10 | | | | 1 | | |
Cofinimmo SA REIT | | | 11 | | | | 1 | | |
Elia System Operator SA | | | 26 | | | | 1 | | |
Intervest Offices & Warehouses REIT | | | 8 | | | | — | @ | |
KBC Group N.V. | | | 189 | | | | 16 | | |
Leasinvest Real Estate SCA | | | 1 | | | | — | @ | |
Warehouses De Pauw CVA | | | 9 | | | | 1 | | |
Wereldhave Belgium | | | 1 | | | | — | @ | |
| | | | 36 | | |
Brazil (0.0%) | |
Cia de Saneamento Basico do Estado
de Sao Paulo ADR | | | 300 | | | | 3 | | |
Canada (2.1%) | |
Alimentation Couche-Tard, Inc., Class B | | | 100 | | | | 5 | | |
ARC Resources Ltd. | | | 100 | | | | 1 | | |
| | | Shares | | Value
(000) | |
Artis Real Estate Investment Trust REIT | | | 100 | | | $ | 1 | | |
Bank of Montreal | | | 100 | | | | 8 | | |
Bank of Nova Scotia (The) | | | 200 | | | | 13 | | |
Barrick Gold Corp. | | | 100 | | | | 2 | | |
Blackberry Ltd. (e) | | | 100 | | | | 1 | | |
Brookfield Asset Management, Inc., Class A | | | 100 | | | | 4 | | |
Brookfield Business Partners LP | | | 2 | | | | — | @ | |
Cameco Corp. | | | 100 | | | | 1 | | |
Canadian Apartment Properties REIT | | | 100 | | | | 3 | | |
Canadian Imperial Bank of Commerce | | | 100 | | | | 9 | | |
Canadian National Railway Co. | | | 100 | | | | 8 | | |
Canadian Natural Resources Ltd. | | | 200 | | | | 7 | | |
Cenovus Energy, Inc. | | | 100 | | | | 1 | | |
Chartwell Retirement Residences REIT (Units) (f) | | | 100 | | | | 1 | | |
Cominar Real Estate Investment Trust REIT | | | 100 | | | | 1 | | |
Dream Global Real Estate Investment Trust REIT | | | 100 | | | | 1 | | |
Dream Office Real Estate Investment Trust REIT | | | 100 | | | | 2 | | |
Enbridge Income Fund Holdings, Inc. | | | 100 | | | | 3 | | |
Enbridge, Inc. | | | 590 | | | | 25 | | |
Enbridge, Inc. | | | 900 | | | | 38 | | |
Encana Corp. | | | 200 | | | | 2 | | |
First Capital Realty, Inc. | | | 100 | | | | 2 | | |
First Quantum Minerals Ltd. | | | 100 | | | | 1 | | |
Fortis, Inc. | | | 500 | | | | 18 | | |
Goldcorp, Inc. | | | 200 | | | | 3 | | |
H&R Real Estate Investment Trust REIT | | | 200 | | | | 3 | | |
Husky Energy, Inc. (e) | | | 102 | | | | 1 | | |
Hydro One Ltd. (c) | | | 100 | | | | 2 | | |
Imperial Oil Ltd. | | | 100 | | | | 3 | | |
Inter Pipeline Ltd. | | | 400 | | | | 8 | | |
Keyera Corp. | | | 200 | | | | 6 | | |
Magna International, Inc. | | | 100 | | | | 5 | | |
Manulife Financial Corp. | | | 300 | | | | 6 | | |
Pembina Pipeline Corp. | | | 500 | | | | 18 | | |
Potash Corp. of Saskatchewan, Inc. | | | 100 | | | | 2 | | |
Power Corp. of Canada | | | 100 | | | | 2 | | |
PrairieSky Royalty Ltd. | | | 104 | | | | 3 | | |
Pure Industrial Real Estate Trust REIT | | | 100 | | | | 1 | | |
RioCan Real Estate Investment Trust REIT | | | 200 | | | | 4 | | |
Rogers Communications, Inc., Class B | | | 100 | | | | 5 | | |
Royal Bank of Canada | | | 200 | | | | 15 | | |
Shaw Communications, Inc., Class B | | | 100 | | | | 2 | | |
Smart Real Estate Investment Trust REIT | | | 100 | | | | 2 | | |
Sun Life Financial, Inc. | | | 100 | | | | 4 | | |
Suncor Energy, Inc. | | | 200 | | | | 7 | | |
Teck Resources Ltd., Class B | | | 100 | | | | 2 | | |
Toronto-Dominion Bank (The) | | | 100 | | | | 6 | | |
TransCanada Corp. | | | 900 | | | | 44 | | |
Veresen, Inc. | | | 300 | | | | 4 | | |
Westshore Terminals Investment Corp. | | | 100 | | | | 2 | | |
Wheaton Precious Metals Corp. | | | 100 | | | | 2 | | |
| | | | 320 | | |
The accompanying notes are an integral part of the consolidated financial statements.
11
Morgan Stanley Institutional Fund Trust
Annual Report — September 30, 2017
Consolidated Portfolio of Investments (cont'd)
Global Multi-Asset Income Portfolio
| | | Shares | | Value
(000) | |
China (0.1%) | |
Beijing Capital International Airport Co., Ltd.
H Shares (g) | | | 2,000 | | | $ | 3 | | |
Beijing Enterprises Holdings Ltd. (g) | | | 500 | | | | 3 | | |
Beijing Enterprises Water Group Ltd. (e)(g) | | | 4,000 | | | | 3 | | |
China Gas Holdings Ltd. (g) | | | 2,000 | | | | 6 | | |
China Merchants Port Holdings Co., Ltd. (g) | | | 20 | | | | — | @ | |
Hopewell Highway Infrastructure Ltd. (g) | | | 1,000 | | | | 1 | | |
Jiangsu Expressway Co., Ltd. H Shares (g) | | | 2,000 | | | | 3 | | |
Towngas China Co., Ltd. (e)(g) | | | 1,000 | | | | 1 | | |
Zhejiang Expressway Co., Ltd. (g) | | | 2,000 | | | | 2 | | |
| | | | 22 | | |
Denmark (0.4%) | |
AP Moller - Maersk A/S Series B | | | 1 | | | | 2 | | |
Carlsberg A/S Series B | | | 12 | | | | 1 | | |
Chr Hansen Holding A/S | | | 11 | | | | 1 | | |
Coloplast A/S Series B | | | 13 | | | | 1 | | |
Danske Bank A/S | | | 76 | | | | 3 | | |
DONG Energy A/S (c) | | | 16 | | | | 1 | | |
DSV A/S | | | 360 | | | | 27 | | |
Genmab A/S (e) | | | 6 | | | | 1 | | |
ISS A/S | | | 361 | | | | 15 | | |
Novo Nordisk A/S Series B | | | 212 | | | | 10 | | |
Novozymes A/S Series B | | | 26 | | | | 1 | | |
Pandora A/S | | | 13 | | | | 1 | | |
TDC A/S | | | 90 | | | | 1 | | |
Tryg A/S | | | 12 | | | | — | @ | |
Vestas Wind Systems A/S | | | 25 | | | | 2 | | |
William Demant Holding A/S (e) | | | 13 | | | | 1 | | |
| | | | 68 | | |
Finland (0.1%) | |
Citycon Oyj | | | 209 | | | | 1 | | |
Kone Oyj, Class B | | | 72 | | | | 4 | | |
Nokia Oyj | | | 607 | | | | 3 | | |
Sampo Oyj, Class A | | | 97 | | | | 5 | | |
Technopolis Oyj | | | 75 | | | | — | @ | |
UPM-Kymmene Oyj | | | 137 | | | | 4 | | |
| | | | 17 | | |
France (4.8%) | |
Accor SA | | | 971 | | | | 48 | | |
Aeroports de Paris (ADP) | | | 67 | | | | 11 | | |
Affine SA REIT | | | 4 | | | | — | @ | |
Air Liquide SA | | | 49 | | | | 7 | | |
Airbus SE | | | 71 | | | | 7 | | |
ANF Immobilier REIT | | | 4 | | | | — | @ | |
ArcelorMittal (e) | | | 60 | | | | 2 | | |
Atos SE | | | 269 | | | | 42 | | |
AXA SA | | | 221 | | | | 7 | | |
BNP Paribas SA | | | 654 | | | | 53 | | |
Bouygues SA | | | 729 | | | | 35 | | |
Capgemini SE | | | 525 | | | | 62 | | |
Carrefour SA | | | 86 | | | | 2 | | |
| | | Shares | | Value
(000) | |
Cie de Saint-Gobain | | | 763 | | | $ | 45 | | |
Cie Generale des Etablissements Michelin | | | 29 | | | | 4 | | |
Credit Agricole SA | | | 681 | | | | 12 | | |
Danone SA | | | 80 | | | | 6 | | |
Engie SA | | | 183 | | | | 3 | | |
Essilor International SA | | | 32 | | | | 4 | | |
Eutelsat Communications SA | | | 154 | | | | 5 | | |
Fonciere Des Regions REIT | | | 19 | | | | 2 | | |
Gecina SA REIT | | | 21 | | | | 3 | | |
Groupe Eurotunnel SE | | | 1,341 | | | | 16 | | |
ICADE REIT | | | 19 | | | | 2 | | |
Kering | | | 11 | | | | 4 | | |
Klepierre SA REIT | | | 110 | | | | 4 | | |
L'Oreal SA | | | 29 | | | | 6 | | |
Legrand SA | | | 52 | | | | 4 | | |
LVMH Moet Hennessy Louis Vuitton SE | | | 32 | | | | 9 | | |
Mercialys SA REIT | | | 22 | | | | — | @ | |
Metropole Television SA | | | 56 | | | | 1 | | |
Natixis SA | | | 468 | | | | 4 | | |
Orange SA | | | 241 | | | | 4 | | |
Pernod Ricard SA | | | 32 | | | | 4 | | |
Peugeot SA | | | 3,465 | | | | 82 | | |
Publicis Groupe SA | | | 34 | | | | 2 | | |
Renault SA | | | 29 | | | | 3 | | |
Rexel SA | | | 803 | | | | 14 | | |
Safran SA | | | 52 | | | | 5 | | |
Sanofi | | | 135 | | | | 13 | | |
Schneider Electric SE (e) | | | 69 | | | | 6 | | |
SES SA | | | 393 | | | | 9 | | |
Societe Generale SA | | | 476 | | | | 28 | | |
Sodexo SA | | | 32 | | | | 4 | | |
Television Francaise 1 | | | 175 | | | | 3 | | |
TOTAL SA | | | 244 | | | | 13 | | |
Unibail-Rodamco SE REIT | | | 66 | | | | 16 | | |
Valeo SA | | | 45 | | | | 3 | | |
Vinci SA | | | 1,238 | | | | 118 | | |
Vivendi SA | | | 160 | | | | 4 | | |
| | | | 741 | | |
Germany (1.6%) | |
Adidas AG | | | 31 | | | | 7 | | |
ADLER Real Estate AG (e) | | | 14 | | | | — | @ | |
ADO Properties SA (c) | | | 16 | | | | 1 | | |
Allianz SE (Registered) | | | 50 | | | | 11 | | |
Alstria Office AG REIT | | | 70 | | | | 1 | | |
BASF SE | | | 100 | | | | 11 | | |
Bayer AG (Registered) | | | 91 | | | | 12 | | |
Bayerische Motoren Werke AG | | | 36 | | | | 4 | | |
Commerzbank AG (e) | | | 703 | | | | 10 | | |
Continental AG | | | 14 | | | | 4 | | |
Daimler AG (Registered) | | | 100 | | | | 8 | | |
Deutsche Bank AG (Registered) | | | 172 | | | | 3 | | |
Deutsche Boerse AG | | | 458 | | | | 50 | | |
The accompanying notes are an integral part of the consolidated financial statements.
12
Morgan Stanley Institutional Fund Trust
Annual Report — September 30, 2017
Consolidated Portfolio of Investments (cont'd)
Global Multi-Asset Income Portfolio
| | | Shares | | Value
(000) | |
Germany (cont'd) | |
Deutsche EuroShop AG | | | 24 | | | $ | 1 | | |
Deutsche Post AG (Registered) | | | 122 | | | | 5 | | |
Deutsche Telekom AG (Registered) | | | 350 | | | | 6 | | |
Deutsche Wohnen AG | | | 177 | | | | 7 | | |
DIC Asset AG | | | 23 | | | | — | @ | |
E.ON SE | | | 250 | | | | 3 | | |
Fraport AG Frankfurt Airport Services Worldwide | | | 143 | | | | 14 | | |
Fresenius Medical Care AG & Co., KGaA | | | 31 | | | | 3 | | |
Fresenius SE & Co., KGaA | | | 44 | | | | 4 | | |
Grand City Properties SA | | | 53 | | | | 1 | | |
Hamborner AG REIT | | | 41 | | | | — | @ | |
HeidelbergCement AG | | | 31 | | | | 3 | | |
Henkel AG & Co., KGaA | | | 19 | | | | 2 | | |
Henkel AG & Co., KGaA (Preference) | | | 25 | | | | 3 | | |
Infineon Technologies AG | | | 192 | | | | 5 | | |
LEG Immobilien AG | | | 34 | | | | 3 | | |
Linde AG | | | 22 | | | | 5 | | |
Merck KGaA | | | 28 | | | | 3 | | |
Muenchener Rueckversicherungs-Gesellschaft AG
in Muenchen (Registered) | | | 22 | | | | 5 | | |
Porsche Automobil Holding SE (Preference) | | | 28 | | | | 2 | | |
ProSiebenSat.1 Media SE (Registered) | | | 250 | | | | 8 | | |
RWE AG (e) | | | 75 | | | | 2 | | |
SAP SE | | | 100 | | | | 11 | | |
Siemens AG (Registered) | | | 89 | | | | 12 | | |
Stroeer SE & Co. KGaA | | | 37 | | | | 2 | | |
TAG Immobilien AG | | | 76 | | | | 1 | | |
thyssenkrupp AG | | | 89 | | | | 3 | | |
TLG Immobilien AG | | | 29 | | | | 1 | | |
Uniper SE | | | 25 | | | | 1 | | |
Volkswagen AG (Preference) | | | 17 | | | | 3 | | |
Vonovia SE | | | 300 | | | | 13 | | |
WCM Beteiligungs & Grundbesitz-AG | | | 47 | | | | — | @ | |
| | | | 254 | | |
Greece (0.1%) | |
Alpha Bank AE (e) | | | 1,352 | | | | 2 | | |
Eurobank Ergasias SA (e) | | | 1,914 | | | | 2 | | |
National Bank of Greece SA (e) | | | 8,011 | | | | 3 | | |
Piraeus Bank SA (e) | | | 382 | | | | 1 | | |
| | | | 8 | | |
Hong Kong (0.9%) | |
Champion REIT | | | 10,000 | | | | 7 | | |
CK Asset Holdings Ltd. | | | 1,500 | | | | 12 | | |
Great Eagle Holdings Ltd. | | | 2,017 | | | | 11 | | |
Hanergy Thin Film Power Group Ltd. (e)(h)(i) | | | 2,000 | | | | — | @ | |
Hang Lung Group Ltd. | | | 1,000 | | | | 4 | | |
Hang Lung Properties Ltd. | | | 1,000 | | | | 2 | | |
Henderson Land Development Co., Ltd. | | | 1,100 | | | | 7 | | |
Hong Kong & China Gas Co., Ltd. | | | 7,524 | | | | 14 | | |
Hongkong & Shanghai Hotels Ltd. (The) | | | 3,163 | | | | 5 | | |
Hongkong Land Holdings Ltd. | | | 600 | | | | 4 | | |
| | | Shares | | Value
(000) | |
Hopewell Holdings Ltd. | | | 1,500 | | | $ | 6 | | |
I-CABLE Communications Ltd. (e) | | | 766 | | | | — | @ | |
Johnson Electric Holdings Ltd. | | | 1,500 | | | | 6 | | |
Kerry Properties Ltd. | | | 500 | | | | 2 | | |
Kowloon Development Co., Ltd. REIT | | | 6,000 | | | | 7 | | |
Link REIT | | | 1,000 | | | | 8 | | |
New World Development Co., Ltd. | | | 3,441 | | | | 5 | | |
Sino Land Co., Ltd. | | | 2,019 | | | | 4 | | |
Stella International Holdings Ltd. | | | 1,500 | | | | 3 | | |
Sun Hung Kai Properties Ltd. | | | 1,000 | | | | 16 | | |
Swire Properties Ltd. | | | 600 | | | | 2 | | |
Wharf Holdings Ltd. (The) | | | 1,000 | | | | 9 | | |
| | | | 134 | | |
Ireland (0.2%) | |
Bank of Ireland Group PLC (e) | | | 659 | | | | 5 | | |
CRH PLC | | | 392 | | | | 15 | | |
Green PLC REIT | | | 362 | | | | 1 | | |
Hibernia PLC REIT | | | 365 | | | | 1 | | |
Irish Residential Properties PLC REIT | | | 188 | | | | — | @ | |
Kerry Group PLC, Class A | | | 30 | | | | 3 | | |
| | | | 25 | | |
Italy (1.5%) | |
ACEA SpA | | | 40 | | | | 1 | | |
Assicurazioni Generali SpA | | | 178 | | | | 3 | | |
Atlantia SpA | | | 2,066 | | | | 65 | | |
Beni Stabili SpA SIIQ REIT | | | 560 | | | | — | @ | |
Ei Towers SpA | | | 15 | | | | 1 | | |
Enel SpA | | | 941 | | | | 6 | | |
Eni SpA | | | 348 | | | | 6 | | |
Ferrari N.V. | | | 14 | | | | 2 | | |
Fiat Chrysler Automobiles N.V. (e) | | | 132 | | | | 2 | | |
Immobiliare Grande Distribuzione SIIQ SpA | | | 193 | | | | — | @ | |
Infrastrutture Wireless Italiane SpA (c) | | | 213 | | | | 1 | | |
Intesa Sanpaolo SpA | | | 464 | | | | 2 | | |
Intesa Sanpaolo SpA | | | 7,998 | | | | 28 | | |
Italgas SpA | | | 529 | | | | 3 | | |
Luxottica Group SpA | | | 37 | | | | 2 | | |
Mediaset SpA (e) | | | 1,592 | | | | 5 | | |
Mediobanca SpA | | | 5,302 | | | | 57 | | |
Rizzoli Corriere Della Sera Mediagroup SpA (e) | | | 11 | | | | — | @ | |
Snam SpA | | | 2,602 | | | | 13 | | |
Societa Iniziative Autostradali e Servizi SpA | | | 60 | | | | 1 | | |
Telecom Italia SpA (e) | | | 1,781 | | | | 2 | | |
Terna Rete Elettrica Nazionale SpA | | | 1,255 | | | | 7 | | |
UniCredit SpA (e) | | | 1,119 | | | | 24 | | |
Unione di Banche Italiane SpA | | | 440 | | | | 2 | | |
| | | | 233 | | |
Japan (0.6%) | |
Advance Residence Investment Corp. REIT | | | 1 | | | | 2 | | |
AEON Investment Corp. REIT | | | 1 | | | | 1 | | |
Aeon Mall Co., Ltd. | | | 100 | | | | 2 | | |
The accompanying notes are an integral part of the consolidated financial statements.
13
Morgan Stanley Institutional Fund Trust
Annual Report — September 30, 2017
Consolidated Portfolio of Investments (cont'd)
Global Multi-Asset Income Portfolio
| | | Shares | | Value
(000) | |
Japan (cont'd) | |
Daiwa House Investment Corp. REIT | | | 1 | | | $ | 2 | | |
GLP J-REIT | | | 1 | | | | 1 | | |
Hulic Co., Ltd. | | | 200 | | | | 2 | | |
Invincible Investment Corp. REIT | | | 2 | | | | 1 | | |
Japan Airport Terminal Co., Ltd. | | | 100 | | | | 4 | | |
Japan Excellent, Inc. REIT | | | 1 | | | | 1 | | |
Japan Hotel Investment Corp. REIT | | | 2 | | | | 1 | | |
Japan Real Estate Investment Corp. REIT | | | 1 | | | | 5 | | |
Japan Rental Housing Investments, Inc. REIT | | | 1 | | | | 1 | | |
Japan Retail Fund Investment Corp. REIT | | | 1 | | | | 2 | | |
Mitsubishi Estate Co., Ltd. | | | 1,000 | | | | 17 | | |
Mitsui Fudosan Co., Ltd. | | | 1,000 | | | | 22 | | |
Mori Hills Investment Corp. REIT | | | 1 | | | | 1 | | |
Mori Trust Sogo, Inc. REIT | | | 1 | | | | 2 | | |
Nippon Building Fund, Inc. REIT | | | 1 | | | | 5 | | |
Nippon Prologis, Inc. REIT | | | 1 | | | | 2 | | |
Nomura Real Estate Holdings, Inc. | | | 100 | | | | 2 | | |
Nomura Real Estate Master Fund, Inc. REIT | | | 2 | | | | 3 | | |
NTT Urban Development Corp. | | | 100 | | | | 1 | | |
Orix, Inc. J-REIT | | | 1 | | | | 1 | | |
Premier Investment Corp. REIT | | | 1 | | | | 1 | | |
Sekisui House Residential Investment Corp. REIT | | | 1 | | | | 1 | | |
Tokyo Gas Co., Ltd. | | | 400 | | | | 10 | | |
Tokyo Tatemono Co., Ltd. | | | 100 | | | | 1 | | |
United Urban Investment Corp. REIT | | | 2 | | | | 3 | | |
| | | | 97 | | |
Netherlands (0.9%) | |
ABN AMRO Group N.V. CVA (c) | | | 118 | | | | 4 | | |
Aegon N.V. | | | 318 | | | | 2 | | |
Akzo Nobel N.V. | | | 49 | | | | 4 | | |
ASML Holding N.V. | | | 39 | | | | 7 | | |
Eurocommercial Properties N.V. CVA REIT | | | 23 | | | | 1 | | |
Heineken N.V. | | | 39 | | | | 4 | | |
ING Groep N.V. | | | 2,399 | | | | 44 | | |
Koninklijke Ahold Delhaize N.V. | | | 165 | | | | 3 | | |
Koninklijke KPN N.V. | | | 606 | | | | 2 | | |
Koninklijke Philips N.V. | | | 150 | | | | 6 | | |
Koninklijke Vopak N.V. | | | 59 | | | | 3 | | |
Randstad Holding N.V. | | | 652 | | | | 40 | | |
RELX N.V. | | | 211 | | | | 4 | | |
Unilever N.V. CVA | | | 196 | | | | 12 | | |
Vastned Retail N.V. REIT | | | 10 | | | | — | @ | |
Wereldhave N.V. REIT | | | 21 | | | | 1 | | |
Wolters Kluwer N.V. | | | 85 | | | | 4 | | |
| | | | 141 | | |
New Zealand (0.1%) | |
Auckland International Airport Ltd. | | | 938 | | | | 4 | | |
Contact Energy Ltd. | | | 93 | | | | — | @ | |
Fletcher Building Ltd. | | | 88 | | | | 1 | | |
Kiwi Property Group Ltd. | | | 684 | | | | 1 | | |
Mercury NZ Ltd. | | | 90 | | | | — | @ | |
| | | Shares | | Value
(000) | |
Meridian Energy Ltd. | | | 167 | | | $ | — | @ | |
Ryman Healthcare Ltd. | | | 49 | | | | — | @ | |
Spark New Zealand Ltd. | | | 232 | | | | 1 | | |
| | | | 7 | | |
Norway (0.0%) | |
Entra ASA (c) | | | 50 | | | | 1 | | |
Norwegian Property ASA | | | 87 | | | | — | @ | |
| | | | 1 | | |
Portugal (0.0%) | |
EDP - Energias de Portugal SA | | | 816 | | | | 3 | | |
Russia (0.8%) | |
Gazprom PJSC ADR | | | 4,568 | | | | 19 | | |
LUKOIL PJSC ADR | | | 361 | | | | 19 | | |
Magnit PJSC GDR | | | 260 | | | | 11 | | |
MMC Norilsk Nickel PJSC ADR | | | 531 | | | | 9 | | |
Mobile TeleSystems PJSC ADR | | | 400 | | | | 4 | | |
Novatek PJSC (Registered GDR) | | | 75 | | | | 9 | | |
PhosAgro PJSC GDR | | | 99 | | | | 1 | | |
Rosneft Oil Co., PJSC (Registered GDR) | | | 980 | | | | 6 | | |
Rostelecom PJSC ADR | | | 14 | | | | — | @ | |
RusHydro PJSC ADR | | | 581 | | | | 1 | | |
Sberbank of Russia PJSC ADR | | | 2,132 | | | | 30 | | |
Severstal PJSC GDR | | | 141 | | | | 2 | | |
Sistema PJSC FC GDR | | | 147 | | | | 1 | | |
Surgutneftegas OJSC ADR | | | 652 | | | | 3 | | |
Tatneft PJSC ADR | | | 138 | | | | 6 | | |
VTB Bank PJSC (Registered GDR) | | | 1,398 | | | | 3 | | |
X5 Retail Group N.V. GDR (e) | | | 84 | | | | 4 | | |
| | | | 128 | | |
Singapore (0.3%) | |
Ascendas Real Estate Investment Trust REIT | | | 1,500 | | | | 3 | | |
CapitaLand Commercial Trust REIT | | | 1,300 | | | | 2 | | |
CapitaLand Ltd. | | | 1,700 | | | | 5 | | |
CapitaLand Mall Trust REIT | | | 1,700 | | | | 3 | | |
CDL Hospitality Trusts REIT | | | 300 | | | | — | @ | |
City Developments Ltd. | | | 300 | | | | 3 | | |
ComfortDelGro Corp., Ltd. | | | 200 | | | | — | @ | |
DBS Group Holdings Ltd. | | | 200 | | | | 3 | | |
Fortune Real Estate Investment Trust REIT | | | 1,000 | | | | 1 | | |
Genting Singapore PLC | | | 700 | | | | 1 | | |
Golden Agri-Resources Ltd. | | | 800 | | | | — | @ | |
Hutchison Port Holdings Trust (Units) (f) | | | 5,200 | | | | 2 | | |
Keppel REIT | | | 1,000 | | | | 1 | | |
Keppel Corp., Ltd. | | | 200 | | | | 1 | | |
Mapletree Commercial Trust REIT | | | 1,000 | | | | 1 | | |
Mapletree Industrial Trust REIT | | | 700 | | | | 1 | | |
Mapletree Logistics Trust REIT | | | 800 | | | | 1 | | |
Oversea-Chinese Banking Corp., Ltd. | | | 400 | | | | 3 | | |
SATS Ltd. | | | 100 | | | | — | @ | |
Sembcorp Industries Ltd. | | | 100 | | | | — | @ | |
Singapore Airlines Ltd. | | | 100 | | | | 1 | | |
Singapore Exchange Ltd. | | | 100 | | | | 1 | | |
The accompanying notes are an integral part of the consolidated financial statements.
14
Morgan Stanley Institutional Fund Trust
Annual Report — September 30, 2017
Consolidated Portfolio of Investments (cont'd)
Global Multi-Asset Income Portfolio
| | | Shares | | Value
(000) | |
Singapore (cont'd) | |
Singapore Technologies Engineering Ltd. | | | 200 | | | $ | 1 | | |
Singapore Telecommunications Ltd. | | | 900 | | | | 2 | | |
StarHub Ltd. | | | 100 | | | | — | @ | |
Suntec Real Estate Investment Trust REIT | | | 1,600 | | | | 2 | | |
United Overseas Bank Ltd. | | | 100 | | | | 2 | | |
UOL Group Ltd. | | | 400 | | | | 2 | | |
Wilmar International Ltd. | | | 200 | | | | — | @ | |
Yangzijiang Shipbuilding Holdings Ltd. | | | 200 | | | | — | @ | |
| | | | 42 | | |
Spain (1.4%) | |
Abertis Infraestructuras SA | | | 524 | | | | 11 | | |
Aena SME SA (c) | | | 66 | | | | 12 | | |
Amadeus IT Group SA, Class A | | | 85 | | | | 6 | | |
Axiare Patrimonio SOCIMI SA REIT | | | 31 | | | | 1 | | |
Banco Bilbao Vizcaya Argentaria SA | | | 4,150 | | | | 37 | | |
Banco de Sabadell SA | | | 3,580 | | | | 7 | | |
Banco Santander SA | | | 8,913 | | | | 62 | | |
Bankia SA | | | 572 | | | | 3 | | |
Bankinter SA | | | 334 | | | | 3 | | |
CaixaBank SA | | | 1,844 | | | | 9 | | |
Cellnex Telecom SA (c) | | | 138 | | | | 3 | | |
Enagas SA | | | 202 | | | | 6 | | |
Ferrovial SA | | | 482 | | | | 11 | | |
Hispania Activos Inmobiliarios SOCIMI SA REIT | | | 48 | | | | 1 | | |
Iberdrola SA | | | 931 | | | | 7 | | |
Industria de Diseno Textil SA | | | 148 | | | | 6 | | |
Inmobiliaria Colonial Socimi SA | | | 124 | | | | 1 | | |
Lar Espana Real Estate Socimi SA REIT | | | 46 | | | | — | @ | |
Mediaset Espana Comunicacion SA | | | 444 | | | | 5 | | |
Merlin Properties Socimi SA REIT | | | 174 | | | | 2 | | |
Red Electrica Corp., SA | | | 385 | | | | 8 | | |
Repsol SA | | | 233 | | | | 4 | | |
Telefonica SA | | | 610 | | | | 7 | | |
| | | | 212 | | |
Sweden (0.1%) | |
Castellum AB | | | 141 | | | | 2 | | |
D Carnegie & Co. AB (e) | | | 24 | | | | — | @ | |
Dios Fastigheter AB | | | 25 | | | | — | @ | |
Fabege AB | | | 71 | | | | 2 | | |
Fastighets AB Balder (e) | | | 50 | | | | 1 | | |
Hemfosa Fastigheter AB | | | 50 | | | | 1 | | |
Hufvudstaden AB, Class A | | | 59 | | | | 1 | | |
Klovern AB, Class B | | | 295 | | | | — | @ | |
Kungsleden AB | | | 84 | | | | 1 | | |
Pandox AB | | | 28 | | | | 1 | | |
Wallenstam AB, Class B | | | 105 | | | | 1 | | |
Wihlborgs Fastigheter AB | | | 35 | | | | 1 | | |
| | | | 11 | | |
Switzerland (1.3%) | |
ABB Ltd. (Registered) | | | 217 | | | | 5 | | |
Adecco Group AG (Registered) | | | 837 | | | | 65 | | |
| | | Shares | | Value
(000) | |
Allreal Holding AG (Registered) (e) | | | 5 | | | $ | 1 | | |
Aryzta AG (e) | | | 9 | | | | — | @ | |
Baloise Holding AG (Registered) | | | 6 | | | | 1 | | |
Cie Financiere Richemont SA (Registered) | | | 60 | | | | 6 | | |
Credit Suisse Group AG (Registered) (e) | | | 225 | | | | 4 | | |
Dufry AG (Registered) (e) | | | 5 | | | | 1 | | |
EMS-Chemie Holding AG (Registered) | | | 1 | | | | 1 | | |
Flughafen Zurich AG (Registered) | | | 17 | | | | 4 | | |
Geberit AG (Registered) | | | 4 | | | | 2 | | |
Givaudan SA (Registered) | | | 1 | | | | 2 | | |
Idorsia Ltd. (e) | | | 11 | | | | — | @ | |
Julius Baer Group Ltd. (e) | | | 26 | | | | 2 | | |
Kuehne + Nagel International AG (Registered) | | | 6 | | | | 1 | | |
LafargeHolcim Ltd. (Registered) (e) | | | 53 | | | | 3 | | |
Lonza Group AG (Registered) (e) | | | 7 | | | | 2 | | |
Mobimo Holding AG (Registered) (e) | | | 3 | | | | 1 | | |
Nestle SA (Registered) | | | 359 | | | | 30 | | |
Novartis AG (Registered) | | | 257 | | | | 22 | | |
Pargesa Holding SA | | | 4 | | | | — | @ | |
Partners Group Holding AG | | | 2 | | | | 1 | | |
PSP Swiss Property AG (Registered) | | | 21 | | | | 2 | | |
Roche Holding AG (Genusschein) | | | 81 | | | | 21 | | |
Schindler Holding AG | | | 5 | | | | 1 | | |
Schindler Holding AG (Registered) | | | 2 | | | | — | @ | |
SGS SA (Registered) | | | 1 | | | | 2 | | |
Sonova Holding AG (Registered) | | | 6 | | | | 1 | | |
Swatch Group AG (The) | | | 4 | | | | 2 | | |
Swatch Group AG (The) (Registered) | | | 6 | | | | 1 | | |
Swiss Life Holding AG (Registered) (e) | | | 4 | | | | 1 | | |
Swiss Prime Site AG (Registered) (e) | | | 42 | | | | 4 | | |
Swiss Re AG | | | 38 | | | | 3 | | |
Swisscom AG (Registered) | | | 3 | | | | 2 | | |
UBS Group AG (Registered) (e) | | | 423 | | | | 7 | | |
Zurich Insurance Group AG | | | 17 | | | | 5 | | |
| | | | 206 | | |
United Kingdom (2.4%) | |
Assura PLC REIT | | | 877 | | | | 1 | | |
AstraZeneca PLC | | | 166 | | | | 11 | | |
Aviva PLC | | | 707 | | | | 5 | | |
BAE Systems PLC | | | 932 | | | | 8 | | |
Barclays PLC | | | 2,356 | | | | 6 | | |
BHP Billiton PLC | | | 312 | | | | 5 | | |
Big Yellow Group PLC REIT | | | 76 | | | | 1 | | |
| BP PLC | | | 2,445 | | | | 16 | | |
British American Tobacco PLC | | | 248 | | | | 16 | | |
British Land Co., PLC (The) REIT | | | 548 | | | | 4 | | |
BT Group PLC | | | 1,276 | | | | 5 | | |
Capital & Counties Properties PLC | | | 396 | | | | 1 | | |
Capital & Regional PLC REIT | | | 283 | | | | — | @ | |
Compass Group PLC | | | 469 | | | | 10 | | |
Daejan Holdings PLC | | | 3 | | | | — | @ | |
Derwent London PLC REIT | | | 53 | | | | 2 | | |
The accompanying notes are an integral part of the consolidated financial statements.
15
Morgan Stanley Institutional Fund Trust
Annual Report — September 30, 2017
Consolidated Portfolio of Investments (cont'd)
Global Multi-Asset Income Portfolio
| | | Shares | | Value
(000) | |
United Kingdom (cont'd) | |
Diageo PLC | | | 351 | | | $ | 12 | | |
Empiric Student Property PLC REIT | | | 269 | | | | — | @ | |
Ferguson PLC | | | 107 | | | | 7 | | |
GlaxoSmithKline PLC | | | 633 | | | | 13 | | |
Glencore PLC (e) | | | 1,632 | | | | 7 | | |
Grainger PLC | | | 219 | | | | 1 | | |
Great Portland Estates PLC REIT | | | 174 | | | | 1 | | |
Hammerson PLC REIT | | | 426 | | | | 3 | | |
Hansteen Holdings PLC | | | 396 | | | | 1 | | |
Helical PLC | | | 53 | | | | — | @ | |
HSBC Holdings PLC | | | 2,327 | | | | 23 | | |
Imperial Brands PLC | | | 166 | | | | 7 | | |
Intu Properties PLC REIT | | | 467 | | | | 1 | | |
Kennedy Wilson Europe Real Estate PLC | | | 53 | | | | 1 | | |
Land Securities Group PLC REIT | | | 394 | | | | 5 | | |
Lloyds Banking Group PLC | | | 7,870 | | | | 7 | | |
LondonMetric Property PLC REIT | | | 311 | | | | 1 | | |
National Grid PLC | | | 3,946 | | | | 49 | | |
NewRiver PLC REIT | | | 124 | | | | 1 | | |
Next PLC | | | 47 | | | | 3 | | |
Pennon Group PLC | | | 365 | | | | 4 | | |
Primary Health Properties PLC REIT | | | 301 | | | | — | @ | |
Prudential PLC | | | 462 | | | | 11 | | |
Reckitt Benckiser Group PLC | | | 103 | | | | 9 | | |
Redefine International PLC | | | 634 | | | | — | @ | |
Regional Ltd. REIT (c) | | | 120 | | | | — | @ | |
Rio Tinto PLC | | | 186 | | | | 9 | | |
Rolls-Royce Holdings PLC (e) | | | 304 | | | | 4 | | |
Royal Dutch Shell PLC, Class A | | | 957 | | | | 29 | | |
Safestore Holdings PLC REIT | | | 110 | | | | 1 | | |
Schroder Real Estate Investment Trust Ltd. REIT | | | 276 | | | | — | @ | |
Segro PLC REIT | | | 442 | | | | 3 | | |
Severn Trent PLC | | | 212 | | | | 6 | | |
Shaftesbury PLC REIT | | | 127 | | | | 2 | | |
Shire PLC | | | 83 | | | | 4 | | |
Target Healthcare Ltd. REIT | | | 128 | | | | — | @ | |
Taylor Wimpey PLC | | | 1,417 | | | | 4 | | |
TechnipFMC PLC (e) | | | 1 | | | | — | @ | |
Tesco PLC (e) | | | 1,173 | | | | 3 | | |
Tritax Big Box PLC REIT | | | 584 | | | | 1 | | |
Unilever PLC | | | 218 | | | | 13 | | |
UNITE Group PLC (The) REIT | | | 118 | | | | 1 | | |
United Utilities Group PLC | | | 608 | | | | 7 | | |
Vodafone Group PLC | | | 3,442 | | | | 10 | | |
Workspace Group PLC REIT | | | 63 | | | | 1 | | |
WPP PLC | | | 379 | | | | 7 | | |
| | | | 363 | | |
United States (6.9%) | |
3M Co. | | | 1 | | | | — | @ | |
Abbott Laboratories | | | 3 | | | | — | @ | |
AbbVie, Inc. | | | 3 | | | | — | @ | |
| | | Shares | | Value
(000) | |
Accenture PLC, Class A | | | 1 | | | $ | — | @ | |
Activision Blizzard, Inc. | | | 1 | | | | — | @ | |
Adobe Systems, Inc. (e) | | | 1 | | | | — | @ | |
Advanced Micro Devices, Inc. (e) | | | 2 | | | | — | @ | |
Aetna, Inc. | | | 1 | | | | — | @ | |
Aflac, Inc. | | | 1 | | | | — | @ | |
Agilent Technologies, Inc. | | | 1 | | | | — | @ | |
Allergan PLC | | | 1 | | | | — | @ | |
Allstate Corp. (The) | | | 1 | | | | — | @ | |
Altria Group, Inc. | | | 3 | | | | — | @ | |
Amazon.com, Inc. (e) | | | 1 | | | | 1 | | |
American Campus Communities, Inc. REIT | | | 100 | | | | 5 | | |
American Electric Power Co., Inc. | | | 1 | | | | — | @ | |
American Express Co. | | | 1 | | | | — | @ | |
American Homes 4 Rent, Class A REIT | | | 100 | | | | 2 | | |
American International Group, Inc. | | | 2 | | | | — | @ | |
American Tower Corp. REIT | | | 401 | | | | 55 | | |
American Water Works Co., Inc. | | | 200 | | | | 16 | | |
Amgen, Inc. | | | 1 | | | | — | @ | |
Amphenol Corp., Class A | | | 1 | | | | — | @ | |
Anadarko Petroleum Corp. | | | 1 | | | | — | @ | |
Analog Devices, Inc. | | | 1 | | | | — | @ | |
Aon PLC | | | 1 | | | | — | @ | |
Apache Corp. | | | 1 | | | | — | @ | |
Apartment Investment & Management Co.,
Class A REIT | | | 100 | | | | 5 | | |
Apple Hospitality, Inc. REIT | | | 100 | | | | 2 | | |
Apple, Inc. | | | 9 | | | | 2 | | |
Applied Materials, Inc. | | | 2 | | | | — | @ | |
Aqua America, Inc. | | | 200 | | | | 7 | | |
Archer-Daniels-Midland Co. | | | 1 | | | | — | @ | |
Arconic, Inc. | | | 1 | | | | — | @ | |
AT&T, Inc. | | | 10 | | | | 1 | | |
Atmos Energy Corp. | | | 100 | | | | 9 | | |
Automatic Data Processing, Inc. | | | 1 | | | | — | @ | |
AvalonBay Communities, Inc. REIT | | | 100 | | | | 18 | | |
Baker Hughes a GE Co. | | | 1 | | | | — | @ | |
Ball Corp. | | | 2 | | | | — | @ | |
Bank of America Corp. | | | 1,046 | | | | 27 | | |
Bank of New York Mellon Corp. (The) | | | 2 | | | | — | @ | |
Baxter International, Inc. | | | 1 | | | | — | @ | |
BB&T Corp. | | | 86 | | | | 4 | | |
Berkshire Hathaway, Inc., Class B (e) | | | 2 | | | | 1 | | |
Best Buy Co., Inc. | | | 1 | | | | — | @ | |
Boeing Co. (The) | | | 1 | | | | — | @ | |
Boston Properties, Inc. REIT | | | 100 | | | | 12 | | |
Boston Scientific Corp. (e) | | | 3 | | | | — | @ | |
Brandywine Realty Trust REIT | | | 100 | | | | 2 | | |
Bristol-Myers Squibb Co. | | | 3 | | | | — | @ | |
Brixmor Property Group, Inc. REIT | | | 200 | | | | 4 | | |
Broadcom Ltd. | | | 1 | | | | — | @ | |
Cabot Oil & Gas Corp. | | | 1 | | | | — | @ | |
Capital One Financial Corp. | | | 622 | | | | 53 | | |
The accompanying notes are an integral part of the consolidated financial statements.
16
Morgan Stanley Institutional Fund Trust
Annual Report — September 30, 2017
Consolidated Portfolio of Investments (cont'd)
Global Multi-Asset Income Portfolio
| | | Shares | | Value
(000) | |
United States (cont'd) | |
Cardinal Health, Inc. | | | 1 | | | $ | — | @ | |
CarMax, Inc. (e) | | | 1 | | | | — | @ | |
Carnival Corp. | | | 1 | | | | — | @ | |
Caterpillar, Inc. | | | 1 | | | | — | @ | |
CBS Corp., Class B | | | 1 | | | | — | @ | |
Celgene Corp. (e) | | | 1 | | | | — | @ | |
CenterPoint Energy, Inc. | | | 400 | | | | 12 | | |
CenturyLink, Inc. | | | 2 | | | | — | @ | |
Cerner Corp. (e) | | | 1 | | | | — | @ | |
Charles Schwab Corp. (The) | | | 2 | | | | — | @ | |
Cheniere Energy, Inc. (e) | | | 200 | | | | 9 | | |
Chevron Corp. | | | 3 | | | | 1 | | |
Chubb Ltd. | | | 1 | | | | — | @ | |
Cisco Systems, Inc. | | | 8 | | | | — | @ | |
CIT Group, Inc. | | | 15 | | | | 1 | | |
Citigroup, Inc. | | | 289 | | | | 21 | | |
Citizens Financial Group, Inc. | | | 53 | | | | 2 | | |
Citrix Systems, Inc. (e) | | | 1 | | | | — | @ | |
CME Group, Inc. | | | 1 | | | | — | @ | |
Coca-Cola Co. (The) | | | 6 | | | | — | @ | |
Cognizant Technology Solutions Corp., Class A | | | 1 | | | | — | @ | |
Colgate-Palmolive Co. | | | 2 | | | | — | @ | |
Columbia Property Trust, Inc. REIT | | | 100 | | | | 2 | | |
Comcast Corp., Class A | | | 8 | | | | — | @ | |
Comerica, Inc. | | | 18 | | | | 2 | | |
Conagra Brands, Inc. | | | 1 | | | | — | @ | |
ConocoPhillips | | | 2 | | | | — | @ | |
Consolidated Edison, Inc. | | | 301 | | | | 24 | | |
Corning, Inc. | | | 2 | | | | — | @ | |
Corporate Office Properties Trust REIT | | | 100 | | | | 3 | | |
Costco Wholesale Corp. | | | 1 | | | | — | @ | |
Cousins Properties, Inc. REIT | | | 200 | | | | 2 | | |
Crown Castle International Corp. REIT | | | 301 | | | | 30 | | |
CSX Corp. | | | 2 | | | | — | @ | |
CubeSmart REIT | | | 100 | | | | 3 | | |
CVS Health Corp. | | | 2 | | | | — | @ | |
Danaher Corp. | | | 1 | | | | — | @ | |
DDR Corp. REIT | | | 200 | | | | 2 | | |
Deere & Co. | | | 1 | | | | — | @ | |
Delphi Automotive PLC | | | 1 | | | | — | @ | |
Delta Air Lines, Inc. | | | 1 | | | | — | @ | |
Devon Energy Corp. | | | 1 | | | | — | @ | |
DiamondRock Hospitality Co. REIT | | | 100 | | | | 1 | | |
Digital Realty Trust, Inc. REIT | | | 100 | | | | 12 | | |
Discover Financial Services | | | 821 | | | | 53 | | |
DISH Network Corp. (e) | | | 1 | | | | — | @ | |
Dollar General Corp. | | | 1 | | | | — | @ | |
Dollar Tree, Inc. (e) | | | 1 | | | | — | @ | |
Dominion Energy, Inc. | | | 1 | | | | — | @ | |
Douglas Emmett, Inc. REIT | | | 100 | | | | 4 | | |
DowDuPont, Inc. | | | 3 | | | | — | @ | |
DR Horton, Inc. | | | 1 | | | | — | @ | |
| | | Shares | | Value
(000) | |
Duke Energy Corp. | | | 1 | | | $ | — | @ | |
Duke Realty Corp. REIT | | | 200 | | | | 6 | | |
East West Bancorp, Inc. | | | 15 | | | | 1 | | |
Eaton Corp., PLC | | | 1 | | | | — | @ | |
eBay, Inc. (e) | | | 2 | | | | — | @ | |
Ecolab, Inc. | | | 1 | | | | — | @ | |
Edison International | | | 301 | | | | 23 | | |
Electronic Arts, Inc. (e) | | | 1 | | | | — | @ | |
Eli Lilly & Co. | | | 2 | | | | — | @ | |
Emerson Electric Co. | | | 1 | | | | — | @ | |
Empire State Realty Trust, Inc., Class A REIT | | | 100 | | | | 2 | | |
Enbridge Energy Management LLC (e) | | | 108 | | | | 2 | | |
EnLink Midstream LLC | | | 100 | | | | 2 | | |
EOG Resources, Inc. | | | 1 | | | | — | @ | |
Equity Commonwealth REIT (e) | | | 100 | | | | 3 | | |
Equity Residential REIT | | | 201 | | | | 13 | | |
Estee Lauder Cos., Inc. (The), Class A | | | 1 | | | | — | @ | |
Eversource Energy | | | 300 | | | | 18 | | |
Exelon Corp. | | | 2 | | | | — | @ | |
Express Scripts Holding Co. (e) | | | 1 | | | | — | @ | |
Extra Space Storage, Inc. REIT | | | 100 | | | | 8 | | |
Exxon Mobil Corp. | | | 7 | | | | 1 | | |
Facebook, Inc., Class A (e) | | | 4 | | | | 1 | | |
Fastenal Co. | | | 1 | | | | — | @ | |
Fidelity National Information Services, Inc. | | | 1 | | | | — | @ | |
Fifth Third Bancorp | | | 79 | | | | 2 | | |
First Industrial Realty Trust, Inc. REIT | | | 100 | | | | 3 | | |
First Republic Bank | | | 16 | | | | 2 | | |
Fiserv, Inc. (e) | | | 1 | | | | — | @ | |
Ford Motor Co. | | | 7 | | | | — | @ | |
Forest City Realty Trust, Inc. REIT | | | 100 | | | | 3 | | |
Fortive Corp. | | | 1 | | | | — | @ | |
Franklin Street Properties Corp. REIT | | | 100 | | | | 1 | | |
Freeport-McMoRan, Inc. (e) | | | 2 | | | | — | @ | |
Gaming and Leisure Properties, Inc. REIT | | | 100 | | | | 4 | | |
General Electric Co. | | | 14 | | | | 1 | | |
General Mills, Inc. | | | 1 | | | | — | @ | |
General Motors Co. | | | 3 | | | | — | @ | |
GGP, Inc. REIT | | | 300 | | | | 6 | | |
Gilead Sciences, Inc. | | | 2 | | | | — | @ | |
Goldman Sachs Group, Inc. (The) | | | 1 | | | | — | @ | |
Gramercy Property Trust REIT | | | 66 | | | | 2 | | |
Halliburton Co. | | | 2 | | | | — | @ | |
Hartford Financial Services Group, Inc. (The) | | | 1 | | | | — | @ | |
HCA Healthcare, Inc. (e) | | | 1 | | | | — | @ | |
HCP, Inc. REIT | | | 201 | | | | 6 | | |
Healthcare Realty Trust, Inc. REIT | | | 100 | | | | 3 | | |
Healthcare Trust of America, Inc., Class A REIT | | | 100 | | | | 3 | | |
Hess Corp. | | | 1 | | | | — | @ | |
Hewlett Packard Enterprise Co. | | | 3 | | | | — | @ | |
Highwoods Properties, Inc. REIT | | | 100 | | | | 5 | | |
Home Depot, Inc. (The) | | | 2 | | | | — | @ | |
Honeywell International, Inc. | | | 1 | | | | — | @ | |
The accompanying notes are an integral part of the consolidated financial statements.
17
Morgan Stanley Institutional Fund Trust
Annual Report — September 30, 2017
Consolidated Portfolio of Investments (cont'd)
Global Multi-Asset Income Portfolio
| | | Shares | | Value
(000) | |
United States (cont'd) | |
Hospitality Properties Trust REIT | | | 100 | | | $ | 3 | | |
Host Hotels & Resorts, Inc. REIT | | | 400 | | | | 8 | | |
HP, Inc. | | | 3 | | | | — | @ | |
Hudson Pacific Properties, Inc. REIT | | | 100 | | | | 4 | | |
Huntington Bancshares, Inc. | | | 117 | | | | 2 | | |
Illinois Tool Works, Inc. | | | 1 | | | | — | @ | |
Ingersoll-Rand PLC | | | 1 | | | | — | @ | |
Intel Corp. | | | 7 | | | | — | @ | |
Intercontinental Exchange, Inc. | | | 1 | | | | — | @ | |
International Business Machines Corp. | | | 1 | | | | — | @ | |
International Paper Co. | | | 1 | | | | — | @ | |
Intuit, Inc. | | | 1 | | | | — | @ | |
Investors Real Estate Trust REIT | | | 100 | | | | 1 | | |
JBG SMITH Properties (e) | | | 50 | | | | 2 | | |
Johnson & Johnson | | | 4 | | | | 1 | | |
Johnson Controls International PLC | | | 2 | | | | — | @ | |
JPMorgan Chase & Co. | | | 375 | | | | 36 | | |
KeyCorp | | | 116 | | | | 2 | | |
Kilroy Realty Corp. REIT | | | 100 | | | | 7 | | |
Kimberly-Clark Corp. | | | 1 | | | | — | @ | |
Kimco Realty Corp. REIT | | | 200 | | | | 4 | | |
Kinder Morgan, Inc. | | | 1,703 | | | | 33 | | |
Kraft Heinz Co. (The) | | | 1 | | | | — | @ | |
Kroger Co. (The) | | | 2 | | | | — | @ | |
L Brands, Inc. | | | 1 | | | | — | @ | |
Las Vegas Sands Corp. | | | 1 | | | | — | @ | |
LaSalle Hotel Properties REIT | | | 100 | | | | 3 | | |
Lennar Corp., Class A | | | 1 | | | | — | @ | |
Level 3 Communications, Inc. (e) | | | 1 | | | | — | @ | |
Lexington Realty Trust REIT | | | 100 | | | | 1 | | |
Liberty Global PLC, Class A (e) | | | 2 | | | | — | @ | |
Liberty Property Trust REIT | | | 100 | | | | 4 | | |
Lincoln National Corp. | | | 1 | | | | — | @ | |
Lowe's Cos., Inc. | | | 2 | | | | — | @ | |
LyondellBasell Industries N.V., Class A | | | 1 | | | | — | @ | |
M&T Bank Corp. | | | 14 | | | | 2 | | |
Macerich Co. (The) REIT | | | 100 | | | | 6 | | |
Macy's, Inc. | | | 1 | | | | — | @ | |
Marathon Oil Corp. | | | 2 | | | | — | @ | |
Marathon Petroleum Corp. | | | 1 | | | | — | @ | |
Marriott International, Inc., Class A | | | 1 | | | | — | @ | |
Marsh & McLennan Cos., Inc. | | | 1 | | | | — | @ | |
Mastercard, Inc., Class A | | | 2 | | | | — | @ | |
McDonald's Corp. | | | 1 | | | | — | @ | |
Medical Properties Trust, Inc. REIT | | | 200 | | | | 3 | | |
Medtronic PLC | | | 2 | | | | — | @ | |
Merck & Co., Inc. | | | 4 | | | | — | @ | |
MetLife, Inc. | | | 2 | | | | — | @ | |
MGM Resorts International | | | 1 | | | | — | @ | |
Microchip Technology, Inc. | | | 1 | | | | — | @ | |
Micron Technology, Inc. (e) | | | 2 | | | | — | @ | |
Microsoft Corp. | | | 12 | | | | 1 | | |
| | | Shares | | Value
(000) | |
Mid-America Apartment Communities, Inc. REIT | | | 100 | | | $ | 11 | | |
Molson Coors Brewing Co., Class B | | | 1 | | | | — | @ | |
Mondelez International, Inc., Class A | | | 3 | | | | — | @ | |
Monsanto Co. | | | 1 | | | | — | @ | |
Monster Beverage Corp. (e) | | | 1 | | | | — | @ | |
Motorola Solutions, Inc. | | | 1 | | | | — | @ | |
Mylan N.V. (e) | | | 1 | | | | — | @ | |
National Oilwell Varco, Inc. | | | 1 | | | | — | @ | |
National Retail Properties, Inc. REIT | | | 100 | | | | 4 | | |
Netflix, Inc. (e) | | | 1 | | | | — | @ | |
New Jersey Resources Corp. | | | 100 | | | | 4 | | |
New York, Inc. REIT | | | 100 | | | | 1 | | |
Newell Brands, Inc. | | | 1 | | | | — | @ | |
Newmont Mining Corp. | | | 1 | | | | — | @ | |
NextEra Energy, Inc. | | | 1 | | | | — | @ | |
Nielsen Holdings PLC | | | 1 | | | | — | @ | |
NIKE, Inc., Class B | | | 2 | | | | — | @ | |
NiSource, Inc. | | | 300 | | | | 8 | | |
Noble Energy, Inc. | | | 1 | | | | — | @ | |
Norfolk Southern Corp. | | | 1 | | | | — | @ | |
Northern Trust Corp. | | | 1 | | | | — | @ | |
Nucor Corp. | | | 1 | | | | — | @ | |
NVIDIA Corp. | | | 1 | | | | — | @ | |
Occidental Petroleum Corp. | | | 1 | | | | — | @ | |
Omega Healthcare Investors, Inc. REIT | | | 100 | | | | 3 | | |
Omnicom Group, Inc. | | | 1 | | | | — | @ | |
ONEOK, Inc. | | | 200 | | | | 11 | | |
Oracle Corp. | | | 5 | | | | — | @ | |
PACCAR, Inc. | | | 1 | | | | — | @ | |
Paramount Group, Inc. REIT | | | 100 | | | | 2 | | |
Paychex, Inc. | | | 1 | | | | — | @ | |
PayPal Holdings, Inc. (e) | | | 2 | | | | — | @ | |
People's United Financial, Inc. | | | 36 | | | | 1 | | |
PepsiCo, Inc. | | | 2 | | | | — | @ | |
Pfizer, Inc. | | | 10 | | | | 1 | | |
PG&E Corp. | | | 401 | | | | 27 | | |
Philip Morris International, Inc. | | | 2 | | | | — | @ | |
Phillips 66 | | | 1 | | | | — | @ | |
Physicians Realty Trust REIT | | | 100 | | | | 2 | | |
Piedmont Office Realty Trust, Inc., Class A REIT | | | 100 | | | | 2 | | |
PNC Financial Services Group, Inc. (The) | | | 51 | | | | 7 | | |
PPG Industries, Inc. | | | 1 | | | | — | @ | |
PPL Corp. | | | 2 | | | | — | @ | |
Praxair, Inc. | | | 1 | | | | — | @ | |
Principal Financial Group, Inc. | | | 1 | | | | — | @ | |
Procter & Gamble Co. (The) | | | 4 | | | | 1 | | |
Progressive Corp. (The) | | | 1 | | | | — | @ | |
Prologis, Inc. REIT | | | 301 | | | | 19 | | |
Prudential Financial, Inc. | | | 1 | | | | — | @ | |
Public Service Enterprise Group, Inc. | | | 2 | | | | — | @ | |
Public Storage REIT | | | 100 | | | | 22 | | |
QUALCOMM, Inc. | | | 2 | | | | — | @ | |
Quality Care Properties, Inc. REIT (e) | | | 40 | | | | 1 | | |
The accompanying notes are an integral part of the consolidated financial statements.
18
Morgan Stanley Institutional Fund Trust
Annual Report — September 30, 2017
Consolidated Portfolio of Investments (cont'd)
Global Multi-Asset Income Portfolio
| | | Shares | | Value
(000) | |
United States (cont'd) | |
Raytheon Co. | | | 1 | | | $ | — | @ | |
Realty Income Corp. REIT | | | 101 | | | | 6 | | |
Red Hat, Inc. (e) | | | 1 | | | | — | @ | |
Regency Centers Corp. REIT | | | 100 | | | | 6 | | |
Regions Financial Corp. | | | 128 | | | | 2 | | |
Retail Opportunity Investments Corp. REIT | | | 100 | | | | 2 | | |
Retail Properties of America, Inc., Class A REIT | | | 100 | | | | 1 | | |
RLJ Lodging Trust REIT | | | 136 | | | | 3 | | |
Ross Stores, Inc. | | | 1 | | | | — | @ | |
S&P Global, Inc. | | | 1 | | | | — | @ | |
Sabra Health Care, Inc. REIT | | | 28 | | | | 1 | | |
salesforce.com, Inc. (e) | | | 1 | | | | — | @ | |
SBA Communications Corp. REIT (e) | | | 100 | | | | 15 | | |
Schlumberger Ltd. | | | 2 | | | | — | @ | |
Seagate Technology PLC | | | 1 | | | | — | @ | |
Sempra Energy | | | 201 | | | | 23 | | |
Senior Housing Properties Trust REIT | | | 100 | | | | 2 | | |
Signature Bank (e) | | | 6 | | | | 1 | | |
Simon Property Group, Inc. REIT | | | 201 | | | | 33 | | |
SL Green Realty Corp. REIT | | | 100 | | | | 10 | | |
Southern Co. (The) | | | 2 | | | | — | @ | |
Spirit Realty Capital, Inc. REIT | | | 200 | | | | 2 | | |
Starbucks Corp. | | | 2 | | | | — | @ | |
State Street Corp. | | | 1 | | | | — | @ | |
STORE Capital Corp. REIT | | | 100 | | | | 3 | | |
Stryker Corp. | | | 1 | | | | — | @ | |
Sunstone Hotel Investors, Inc. REIT | | | 100 | | | | 2 | | |
SunTrust Banks, Inc. | | | 51 | | | | 3 | | |
SVB Financial Group (e) | | | 5 | | | | 1 | | |
Symantec Corp. | | | 1 | | | | — | @ | |
Synchrony Financial | | | 1,781 | | | | 55 | | |
Sysco Corp. | | | 1 | | | | — | @ | |
T Rowe Price Group, Inc. | | | 1 | | | | — | @ | |
Tanger Factory Outlet Centers, Inc. REIT | | | 100 | | | | 3 | | |
Targa Resources Corp. | | | 200 | | | | 10 | | |
Target Corp. | | | 1 | | | | — | @ | |
TE Connectivity Ltd. | | | 1 | | | | — | @ | |
Texas Instruments, Inc. | | | 2 | | | | — | @ | |
Thermo Fisher Scientific, Inc. | | | 1 | | | | — | @ | |
Time Warner, Inc. | | | 1 | | | | — | @ | |
TJX Cos., Inc. (The) | | | 1 | | | | — | @ | |
Travelers Cos., Inc. (The) | | | 1 | | | | — | @ | |
Twenty-First Century Fox, Inc., Class A | | | 3 | | | | — | @ | |
Tyson Foods, Inc., Class A | | | 1 | | | | — | @ | |
UDR, Inc. REIT | | | 100 | | | | 4 | | |
Union Pacific Corp. | | | 1 | | | | — | @ | |
United Parcel Service, Inc., Class B | | | 1 | | | | — | @ | |
United Technologies Corp. | | | 1 | | | | — | @ | |
UnitedHealth Group, Inc. | | | 2 | | | | 1 | | |
US Bancorp | | | 178 | | | | 10 | | |
Valero Energy Corp. | | | 1 | | | | — | @ | |
Ventas, Inc. REIT | | | 201 | | | | 13 | | |
| | | Shares | | Value
(000) | |
VEREIT, Inc. REIT | | | 500 | | | $ | 4 | | |
Verizon Communications, Inc. | | | 6 | | | | — | @ | |
VF Corp. | | | 1 | | | | — | @ | |
Viacom, Inc., Class B | | | 1 | | | | — | @ | |
Visa, Inc., Class A | | | 3 | | | | — | @ | |
Vornado Realty Trust REIT | | | 100 | | | | 8 | | |
Wal-Mart Stores, Inc. | | | 2 | | | | — | @ | |
Walgreens Boots Alliance, Inc. | | | 2 | | | | — | @ | |
Walt Disney Co. (The) | | | 2 | | | | — | @ | |
Washington Prime Group, Inc. REIT | | | 100 | | | | 1 | | |
Waste Management, Inc. | | | 1 | | | | — | @ | |
WEC Energy Group, Inc. | | | 1 | | | | — | @ | |
Weingarten Realty Investors REIT | | | 100 | | | | 3 | | |
Wells Fargo & Co. | | | 499 | | | | 28 | | |
Welltower, Inc. REIT | | | 201 | | | | 14 | | |
Western Digital Corp. | | | 1 | | | | — | @ | |
Weyerhaeuser Co. REIT | | | 2 | | | | — | @ | |
Williams Cos., Inc. (The) | | | 602 | | | | 18 | | |
Xenia Hotels & Resorts, Inc. REIT | | | 100 | | | | 2 | | |
Yum! Brands, Inc. | | | 1 | | | | — | @ | |
Zions Bancorporation | | | 21 | | | | 1 | | |
Zoetis, Inc. | | | 1 | | | | — | @ | |
| | | | 1,072 | | |
Total Common Stocks (Cost $3,696) | | | 4,344 | | |
Investment Companies (8.5%) | |
United Kingdom (0.0%) | |
HICL Infrastructure Co., Ltd. (United Kingdom) | | | 1,299 | | | | 3 | | |
Picton Property Income Ltd. (The) REIT
(United Kingdom) | | | 289 | | | | — | @ | |
| | | | 3 | | |
United States (8.5%) | |
Morgan Stanley Institutional Fund Trust —
High Yield Portfolio (See Note G) | | | 54,303 | | | | 551 | | |
Morgan Stanley Institutional Fund, Inc. —
Emerging Markets Fixed Income
Opportunities Portfolio (See Note G) | | | 76,964 | | | | 762 | | |
| | | | 1,313 | | |
Total Investment Companies (Cost $1,264) | | | 1,316 | | |
| | | No. of
Rights | | | |
Rights (0.0%) | |
Singapore (0.0%) | |
CapitaLand Commercial Trust (e) | | | 216 | | | | — | @ | |
Mapletree Logistics Trust (e) | | | 80 | | | | — | @ | |
Total Rights (Cost $—) | | | — | @ | |
Short-Term Investments (14.9%) | |
Investment Company (12.4%) | |
Morgan Stanley Institutional Liquidity
Funds — Government Portfolio —
Institutional Class (See Note G)
(Cost $1,909) | | | 1,908,784 | | | | 1,909 | | |
The accompanying notes are an integral part of the consolidated financial statements.
19
Morgan Stanley Institutional Fund Trust
Annual Report — September 30, 2017
Consolidated Portfolio of Investments (cont'd)
Global Multi-Asset Income Portfolio
| | | Face
Amount
(000) | | Value
(000) | |
U.S. Treasury Security (2.5%) | |
U.S. Treasury Bill, | |
| 1.19%, 4/26/18 (j)(k) (Cost $379) | | $ | 382 | | | $ | 379 | | |
Total Short-Term Investments (Cost $2,288) | | | 2,288 | | |
Total Investments (100.9%) (Cost $14,633) (l)(m) | | | 15,584 | | |
Liabilities in Excess of Other Assets (-0.9%) | | | (133 | ) | |
Net Assets (100.0%) | | $ | 15,451 | | |
Country assignments and aggregations are based generally on third party vendor classifications and information, and may be different from the assignments and aggregations under the policies set forth in the Fund's prospectus and/or statement of additional information relating to geographic classifications.
(a) Security is subject to delayed delivery.
(b) Floating or Variable rate securities: The rates disclosed are as of September 30, 2017. For securities based on a published reference rate and spread, the reference rate and spread are indicated in the description in the Consolidated Portfolio of Investments. Certain variable rate securities are not based on a published reference rate and spread but are determined by the issuer or agent and are based on current market conditions. These securities do not indicate a reference rate and spread in their description in the Consolidated Portfolio of Investments.
(c) 144A security — Certain conditions for public sale may exist. Unless otherwise noted, these securities are deemed to be liquid.
(d) Multi-step — Coupon rate changes in predetermined increments to maturity. Rate disclosed is as of September 30, 2017. Maturity date disclosed is the ultimate maturity date.
(e) Non-income producing security.
(f) Consists of one or more classes of securities traded together as a unit; stocks with attached warrants.
(g) Security trades on the Hong Kong exchange.
(h) At September 30, 2017, the Fund held a fair valued security valued at less than $500, representing less than 0.05% of net assets. This security has been fair valued as determined in good faith under procedures established by and under the general supervision of the Trust's Trustees.
(i) Security has been deemed illiquid at September 30, 2017.
(j) Rate shown is the yield to maturity at September 30, 2017.
(k) All or a portion of the security was pledged to cover margin requirements for swap agreements.
(l) Securities are available for collateral in connection with purchase on a forward commitment basis, foreign currency forward exchange contracts, futures contracts and swap agreements.
(m) At September 30, 2017, the aggregate cost for federal income tax purposes is approximately $14,802,000. The aggregate gross unrealized appreciation is approximately $1,169,000 and the aggregate gross unrealized depreciation is approximately $268,000, resulting in net unrealized appreciation of approximately $901,000.
@ Value is less than $500.
ADR American Depositary Receipt.
CDI CHESS Depositary Interest.
CVA Certificaten Van Aandelen.
GDR Global Depositary Receipt.
LIBOR London Interbank Offered Rate.
MTN Medium Term Note.
OAT Obligations Assimilables du Trésor (French Treasury Obligation).
OFZ Obilgatsyi Federal'novo Zaima (Russian Federal Loan Obligation).
OJSC Open Joint Stock Company.
PJSC Public Joint Stock Company.
REIT Real Estate Investment Trust.
TBA To Be Announced.
The accompanying notes are an integral part of the consolidated financial statements.
20
Morgan Stanley Institutional Fund Trust
Annual Report — September 30, 2017
Consolidated Portfolio of Investments (cont'd)
Global Multi-Asset Income Portfolio
Foreign Currency Forward Exchange Contracts:
The Fund had the following foreign currency forward exchange contracts open at September 30, 2017:
Counterparty | | Contracts to
Deliver
(000) | | In Exchange
For
(000) | | Delivery
Date | | Unrealized
Appreciation
(Depreciation)
(000) | |
Australia and New Zealand Banking Group | | AUD | 153 | | | $ | 122 | | | 10/6/17 | | $ | 2 | | |
Australia and New Zealand Banking Group | | MXN | 267 | | | $ | 15 | | | 10/6/17 | | | (— | @) | |
Barclays Bank PLC | | MXN | 3,079 | | | $ | 172 | | | 10/6/17 | | | 3 | | |
Barclays Bank PLC | | $ | 2 | | | JPY | 250 | | | 10/6/17 | | | (— | @) | |
Citibank NA | | $ | 72 | | | EUR | 61 | | | 10/6/17 | | | (1 | ) | |
Citibank NA | | $ | 2 | | | EUR | 1 | | | 10/6/17 | | | (— | @) | |
HSBC Bank PLC | | CAD | 27 | | | $ | 22 | | | 10/6/17 | | | — | @ | |
HSBC Bank PLC | | NOK | 36 | | | $ | 5 | | | 10/6/17 | | | — | @ | |
HSBC Bank PLC | | $ | — | @ | | CAD | — | @ | | 10/6/17 | | | (— | @) | |
HSBC Bank PLC | | $ | 3 | | | EUR | 2 | | | 10/6/17 | | | (— | @) | |
HSBC Bank PLC | | $ | 3 | | | EUR | 3 | | | 10/6/17 | | | (— | @) | |
HSBC Bank PLC | | $ | 4 | | | GBP | 3 | | | 10/6/17 | | | — | @ | |
HSBC Bank PLC | | $ | 10 | | | NZD | 14 | | | 10/6/17 | | | — | @ | |
HSBC Bank PLC | | $ | 44 | | | PLN | 156 | | | 10/6/17 | | | (1 | ) | |
JPMorgan Chase Bank NA | | GBP | 28 | | | $ | 36 | | | 10/6/17 | | | (1 | ) | |
JPMorgan Chase Bank NA | | JPY | 8,232 | | | $ | 76 | | | 10/6/17 | | | 3 | | |
JPMorgan Chase Bank NA | | SEK | 300 | | | $ | 37 | | | 10/6/17 | | | — | @ | |
JPMorgan Chase Bank NA | | $ | 36 | | | EUR | 30 | | | 10/6/17 | | | (— | @) | |
JPMorgan Chase Bank NA | | $ | 1 | | | MXN | 12 | | | 10/6/17 | | | (— | @) | |
JPMorgan Chase Bank NA | | $ | 37 | | | NOK | 290 | | | 10/6/17 | | | (— | @) | |
JPMorgan Chase Bank NA | | $ | 62 | | | SEK | 489 | | | 10/6/17 | | | (1 | ) | |
JPMorgan Chase Bank NA | | $ | 11 | | | SGD | 15 | | | 10/6/17 | | | (— | @) | |
JPMorgan Chase Bank NA | | $ | 19 | | | THB | 625 | | | 10/6/17 | | | (— | @) | |
State Street Bank and Trust Co. | | RUB | 3,700 | | | $ | 64 | | | 10/6/17 | | | (— | @) | |
State Street Bank and Trust Co. | | $ | 19 | | | MYR | 79 | | | 10/6/17 | | | — | @ | |
UBS AG | | EUR | 9 | | | $ | 11 | | | 10/6/17 | | | (— | @) | |
UBS AG | | GBP | 5 | | | $ | 7 | | | 10/6/17 | | | — | @ | |
UBS AG | | $ | 54 | | | CHF | 52 | | | 10/6/17 | | | (1 | ) | |
UBS AG | | $ | 6 | | | DKK | 39 | | | 10/6/17 | | | (— | @) | |
UBS AG | | $ | 1 | | | ZAR | 8 | | | 10/6/17 | | | (— | @) | |
State Street Bank and Trust Co. | | KRW | 93,150 | | | $ | 81 | | | 10/10/17 | | | (— | @) | |
State Street Bank and Trust Co. | | $ | 83 | | | KRW | 93,150 | | | 10/10/17 | | | (1 | ) | |
Bank of America NA | | EUR | 92 | | | $ | 109 | | | 11/9/17 | | | (— | @) | |
Bank of America NA | | ILS | 9 | | | $ | 3 | | | 11/9/17 | | | (— | @) | |
Bank of America NA | | PLN | 375 | | | $ | 103 | | | 11/9/17 | | | 1 | | |
Bank of America NA | | PLN | 37 | | | $ | 10 | | | 11/9/17 | | | (— | @) | |
Bank of America NA | | $ | 5 | | | PLN | 18 | | | 11/9/17 | | | (— | @) | |
Bank of America NA | | $ | 12 | | | PLN | 42 | | | 11/9/17 | | | (— | @) | |
Bank of Montreal | | HUF | 8,791 | | | $ | 34 | | | 11/9/17 | | | 1 | | |
Bank of Montreal | | $ | 5 | | | HUF | 1,291 | | | 11/9/17 | | | (— | @) | |
Bank of Montreal | | $ | 12 | | | HUF | 3,013 | | | 11/9/17 | | | (— | @) | |
Bank of Montreal | | $ | 3 | | | HUF | 882 | | | 11/9/17 | | | (— | @) | |
Barclays Bank PLC | | AUD | 57 | | | $ | 45 | | | 11/9/17 | | | — | @ | |
Barclays Bank PLC | | CHF | 35 | | | $ | 36 | | | 11/9/17 | | | (— | @) | |
Barclays Bank PLC | | EUR | 552 | | | $ | 651 | | | 11/9/17 | | | (3 | ) | |
Barclays Bank PLC | | EUR | 50 | | | $ | 60 | | | 11/9/17 | | | 1 | | |
Barclays Bank PLC | | EUR | 50 | | | $ | 60 | | | 11/9/17 | | | 1 | | |
Barclays Bank PLC | | SGD | 47 | | | $ | 34 | | | 11/9/17 | | | (— | @) | |
Barclays Bank PLC | | SGD | 14 | | | $ | 10 | | | 11/9/17 | | | (— | @) | |
Barclays Bank PLC | | $ | 26 | | | EUR | 22 | | | 11/9/17 | | | — | @ | |
Barclays Bank PLC | | $ | 60 | | | GBP | 44 | | | 11/9/17 | | | (1 | ) | |
Barclays Bank PLC | | $ | 60 | | | GBP | 44 | | | 11/9/17 | | | (1 | ) | |
Barclays Bank PLC | | $ | 121 | | | GBP | 93 | | | 11/9/17 | | | 4 | | |
Barclays Bank PLC | | $ | 5 | | | SGD | 7 | | | 11/9/17 | | | — | @ | |
Barclays Bank PLC | | $ | 12 | | | SGD | 16 | | | 11/9/17 | | | — | @ | |
Citibank NA | | AUD | 14 | | | $ | 11 | | | 11/9/17 | | | — | @ | |
Citibank NA | | CZK | 237 | | | $ | 11 | | | 11/9/17 | | | (— | @) | |
Citibank NA | | EUR | 57 | | | $ | 67 | | | 11/9/17 | | | (— | @) | |
The accompanying notes are an integral part of the consolidated financial statements.
21
Morgan Stanley Institutional Fund Trust
Annual Report — September 30, 2017
Consolidated Portfolio of Investments (cont'd)
Global Multi-Asset Income Portfolio
Counterparty | | Contracts to
Deliver
(000) | | In Exchange
For
(000) | | Delivery
Date | | Unrealized
Appreciation
(Depreciation)
(000) | |
Citibank NA | | EUR | 143 | | | $ | 169 | | | 11/9/17 | | $ | — | @ | |
Citibank NA | | EUR | 33 | | | $ | 39 | | | 11/9/17 | | | (— | @) | |
Citibank NA | | GBP | 132 | | | $ | 170 | | | 11/9/17 | | | (7 | ) | |
Citibank NA | | ILS | 35 | | | $ | 10 | | | 11/9/17 | | | — | @ | |
Citibank NA | | THB | 1,793 | | | $ | 54 | | | 11/9/17 | | | — | @ | |
Citibank NA | | THB | 334 | | | $ | 10 | | | 11/9/17 | | | (— | @) | |
Citibank NA | | TRY | 36 | | | $ | 10 | | | 11/9/17 | | | — | @ | |
Citibank NA | | TRY | 275 | | | $ | 78 | | | 11/9/17 | | | 2 | | |
Citibank NA | | TRY | 642 | | | $ | 182 | | | 11/9/17 | | | 3 | | |
Citibank NA | | $ | 13 | | | CAD | 16 | | | 11/9/17 | | | — | @ | |
Citibank NA | | $ | 46 | | | EUR | 38 | | | 11/9/17 | | | (— | @) | |
Citibank NA | | $ | 171 | | | EUR | 143 | | | 11/9/17 | | | (2 | ) | |
Citibank NA | | $ | 168 | | | GBP | 129 | | | 11/9/17 | | | 5 | | |
Citibank NA | | $ | 5 | | | THB | 169 | | | 11/9/17 | | | (— | @) | |
Citibank NA | | $ | 12 | | | THB | 394 | | | 11/9/17 | | | (— | @) | |
Citibank NA | | $ | 232 | | | TRY | 841 | | | 11/9/17 | | | 1 | | |
Commonwealth Bank of Australia | | EUR | 134 | | | $ | 159 | | | 11/9/17 | | | (1 | ) | |
Commonwealth Bank of Australia | | $ | 64 | | | GBP | 49 | | | 11/9/17 | | | 2 | | |
Credit Suisse International | | ILS | 71 | | | $ | 20 | | | 11/9/17 | | | (— | @) | |
Credit Suisse International | | $ | 5 | | | GBP | 4 | | | 11/9/17 | | | — | @ | |
Credit Suisse International | | $ | 12 | | | ILS | 42 | | | 11/9/17 | | | — | @ | |
Credit Suisse International | | $ | 5 | | | ILS | 18 | | | 11/9/17 | | | — | @ | |
Goldman Sachs International | | AUD | 204 | | | $ | 161 | | | 11/9/17 | | | 1 | | |
Goldman Sachs International | | AUD | 48 | | | $ | 39 | | | 11/9/17 | | | 1 | | |
Goldman Sachs International | | CNH | 254 | | | $ | 38 | | | 11/9/17 | | | (1 | ) | |
Goldman Sachs International | | CNH | 67 | | | $ | 10 | | | 11/9/17 | | | (— | @) | |
Goldman Sachs International | | EUR | 139 | | | $ | 164 | | | 11/9/17 | | | (1 | ) | |
Goldman Sachs International | | EUR | 20 | | | $ | 24 | | | 11/9/17 | | | (— | @) | |
Goldman Sachs International | | EUR | 4 | | | $ | 5 | | | 11/9/17 | | | — | @ | |
Goldman Sachs International | | EUR | 14 | | | $ | 17 | | | 11/9/17 | | | — | @ | |
Goldman Sachs International | | EUR | 19 | | | $ | 23 | | | 11/9/17 | | | — | @ | |
Goldman Sachs International | | EUR | 55 | | | $ | 66 | | | 11/9/17 | | | 1 | | |
Goldman Sachs International | | EUR | 20 | | | $ | 23 | | | 11/9/17 | | | — | @ | |
Goldman Sachs International | | HKD | 16 | | | $ | 2 | | | 11/9/17 | | | — | @ | |
Goldman Sachs International | | HKD | 45 | | | $ | 6 | | | 11/9/17 | | | — | @ | |
Goldman Sachs International | | HUF | 2,973 | | | $ | 12 | | | 11/9/17 | | | — | @ | |
Goldman Sachs International | | HUF | 2,640 | | | $ | 10 | | | 11/9/17 | | | (— | @) | |
Goldman Sachs International | | JPY | 1,596 | | | $ | 15 | | | 11/9/17 | | | — | @ | |
Goldman Sachs International | | JPY | 327 | | | $ | 3 | | | 11/9/17 | | | — | @ | |
Goldman Sachs International | | JPY | 1,094 | | | $ | 10 | | | 11/9/17 | | | — | @ | |
Goldman Sachs International | | JPY | 1,508 | | | $ | 14 | | | 11/9/17 | | | — | @ | |
Goldman Sachs International | | $ | 12 | | | CNH | 79 | | | 11/9/17 | | | (— | @) | |
Goldman Sachs International | | $ | 5 | | | CNH | 34 | | | 11/9/17 | | | (— | @) | |
Goldman Sachs International | | $ | 110 | | | EUR | 92 | | | 11/9/17 | | | (1 | ) | |
Goldman Sachs International | | $ | 14 | | | EUR | 11 | | | 11/9/17 | | | (— | @) | |
Goldman Sachs International | | $ | 13 | | | EUR | 11 | | | 11/9/17 | | | (— | @) | |
Goldman Sachs International | | $ | 1 | | | GBP | 1 | | | 11/9/17 | | | — | @ | |
Goldman Sachs International | | ZAR | 319 | | | $ | 24 | | | 11/9/17 | | | — | @ | |
JPMorgan Chase Bank NA | | AUD | 21 | | | $ | 16 | | | 11/9/17 | | | — | @ | |
JPMorgan Chase Bank NA | | AUD | 14 | | | $ | 11 | | | 11/9/17 | | | — | @ | |
JPMorgan Chase Bank NA | | CAD | 69 | | | $ | 55 | | | 11/9/17 | | | (1 | ) | |
JPMorgan Chase Bank NA | | CAD | 138 | | | $ | 109 | | | 11/9/17 | | | (1 | ) | |
JPMorgan Chase Bank NA | | CAD | 24 | | | $ | 19 | | | 11/9/17 | | | (— | @) | |
JPMorgan Chase Bank NA | | CAD | 69 | | | $ | 55 | | | 11/9/17 | | | (— | @) | |
JPMorgan Chase Bank NA | | JPY | 3,384 | | | $ | 31 | | | 11/9/17 | | | 1 | | |
JPMorgan Chase Bank NA | | JPY | 13,912 | | | $ | 128 | | | 11/9/17 | | | 4 | | |
JPMorgan Chase Bank NA | | JPY | 3,165 | | | $ | 28 | | | 11/9/17 | | | (— | @) | |
JPMorgan Chase Bank NA | | RUB | 580 | | | $ | 10 | | | 11/9/17 | | | (— | @) | |
JPMorgan Chase Bank NA | | $ | 8 | | | CNY | 52 | | | 11/9/17 | | | — | @ | |
JPMorgan Chase Bank NA | | $ | 13 | | | JPY | 1,475 | | | 11/9/17 | | | (— | @) | |
The accompanying notes are an integral part of the consolidated financial statements.
22
Morgan Stanley Institutional Fund Trust
Annual Report — September 30, 2017
Consolidated Portfolio of Investments (cont'd)
Global Multi-Asset Income Portfolio
Counterparty | | Contracts to
Deliver
(000) | | In Exchange
For
(000) | | Delivery
Date | | Unrealized
Appreciation
(Depreciation)
(000) | |
JPMorgan Chase Bank NA | | $ | 40 | | | MXN | 729 | | | 11/9/17 | | $ | (— | @) | |
JPMorgan Chase Bank NA | | $ | 18 | | | MXN | 329 | | | 11/9/17 | | | (— | @) | |
JPMorgan Chase Bank NA | | $ | 111 | | | RUB | 6,556 | | | 11/9/17 | | | 2 | | |
JPMorgan Chase Bank NA | | $ | 56 | | | RUB | 3,278 | | | 11/9/17 | | | 1 | | |
JPMorgan Chase Bank NA | | $ | 55 | | | RUB | 3,278 | | | 11/9/17 | | | 1 | | |
JPMorgan Chase Bank NA | | $ | 9 | | | TRY | 32 | | | 11/9/17 | | | (— | @) | |
JPMorgan Chase Bank NA | | $ | 254 | | | TRY | 920 | | | 11/9/17 | | | 1 | | |
JPMorgan Chase Bank NA | | $ | 5 | | | ZAR | 67 | | | 11/9/17 | | | (— | @) | |
JPMorgan Chase Bank NA | | $ | 12 | | | ZAR | 156 | | | 11/9/17 | | | (— | @) | |
JPMorgan Chase Bank NA | | ZAR | 385 | | | $ | 29 | | | 11/9/17 | | | — | @ | |
JPMorgan Chase Bank NA | | ZAR | 135 | | | $ | 10 | | | 11/9/17 | | | — | @ | |
State Street Bank and Trust Co. | | ARS | 315 | | | $ | 17 | | | 11/9/17 | | | (1 | ) | |
State Street Bank and Trust Co. | | BRL | 694 | | | $ | 219 | | | 11/9/17 | | | 1 | | |
State Street Bank and Trust Co. | | BRL | 32 | | | $ | 10 | | | 11/9/17 | | | (— | @) | |
State Street Bank and Trust Co. | | CLP | 25,149 | | | $ | 39 | | | 11/9/17 | | | (1 | ) | |
State Street Bank and Trust Co. | | CLP | 6,366 | | | $ | 10 | | | 11/9/17 | | | — | @ | |
State Street Bank and Trust Co. | | COP | 57,924 | | | $ | 19 | | | 11/9/17 | | | (— | @) | |
State Street Bank and Trust Co. | | EUR | 9 | | | $ | 11 | | | 11/9/17 | | | (— | @) | |
State Street Bank and Trust Co. | | IDR | 966,742 | | | $ | 72 | | | 11/9/17 | | | — | @ | |
State Street Bank and Trust Co. | | IDR | 135,150 | | | $ | 10 | | | 11/9/17 | | | (— | @) | |
State Street Bank and Trust Co. | | INR | 2,400 | | | $ | 37 | | | 11/9/17 | | | 1 | | |
State Street Bank and Trust Co. | | INR | 331 | | | $ | 5 | | | 11/9/17 | | | — | @ | |
State Street Bank and Trust Co. | | INR | 655 | | | $ | 10 | | | 11/9/17 | | | (— | @) | |
State Street Bank and Trust Co. | | KRW | 32,516 | | | $ | 29 | | | 11/9/17 | | | — | @ | |
State Street Bank and Trust Co. | | KRW | 11,458 | | | $ | 10 | | | 11/9/17 | | | (— | @) | |
State Street Bank and Trust Co. | | RUB | 2,972 | | | $ | 48 | | | 11/9/17 | | | (3 | ) | |
State Street Bank and Trust Co. | | TWD | 1,123 | | | $ | 37 | | | 11/9/17 | | | — | @ | |
State Street Bank and Trust Co. | | TWD | 304 | | | $ | 10 | | | 11/9/17 | | | (— | @) | |
State Street Bank and Trust Co. | | $ | 12 | | | BRL | 38 | | | 11/9/17 | | | (— | @) | |
State Street Bank and Trust Co. | | $ | 138 | | | BRL | 430 | | | 11/9/17 | | | (3 | ) | |
State Street Bank and Trust Co. | | $ | 5 | | | BRL | 16 | | | 11/9/17 | | | — | @ | |
State Street Bank and Trust Co. | | $ | 5 | | | CLP | 3,198 | | | 11/9/17 | | | (— | @) | |
State Street Bank and Trust Co. | | $ | 12 | | | CLP | 7,463 | | | 11/9/17 | | | (— | @) | |
State Street Bank and Trust Co. | | $ | 5 | | | IDR | 68,495 | | | 11/9/17 | | | (— | @) | |
State Street Bank and Trust Co. | | $ | 12 | | | IDR | 159,823 | | | 11/9/17 | | | (— | @) | |
State Street Bank and Trust Co. | | $ | 5 | | | INR | 329 | | | 11/9/17 | | | (— | @) | |
State Street Bank and Trust Co. | | $ | 12 | | | INR | 769 | | | 11/9/17 | | | (— | @) | |
State Street Bank and Trust Co. | | $ | 5 | | | INR | 308 | | | 11/9/17 | | | — | @ | |
State Street Bank and Trust Co. | | $ | 5 | | | KRW | 5,740 | | | 11/9/17 | | | (— | @) | |
State Street Bank and Trust Co. | | $ | 12 | | | KRW | 13,393 | | | 11/9/17 | | | (— | @) | |
State Street Bank and Trust Co. | | $ | 6 | | | KRW | 6,633 | | | 11/9/17 | | | — | @ | |
State Street Bank and Trust Co. | | $ | 5 | | | MXN | 91 | | | 11/9/17 | | | (— | @) | |
State Street Bank and Trust Co. | | $ | 12 | | | MXN | 212 | | | 11/9/17 | | | (— | @) | |
State Street Bank and Trust Co. | | $ | 58 | | | MXN | 1,046 | | | 11/9/17 | | | (— | @) | |
State Street Bank and Trust Co. | | $ | 5 | | | RUB | 304 | | | 11/9/17 | | | — | @ | |
State Street Bank and Trust Co. | | $ | 12 | | | RUB | 709 | | | 11/9/17 | | | — | @ | |
State Street Bank and Trust Co. | | $ | 5 | | | TWD | 153 | | | 11/9/17 | | | (— | @) | |
State Street Bank and Trust Co. | | $ | 12 | | | TWD | 358 | | | 11/9/17 | | | (— | @) | |
UBS AG | | AUD | 236 | | | $ | 186 | | | 11/9/17 | | | 1 | | |
UBS AG | | CHF | 12 | | | $ | 12 | | | 11/9/17 | | | (— | @) | |
UBS AG | | CHF | 8 | | | $ | 9 | | | 11/9/17 | | | (— | @) | |
UBS AG | | DKK | 165 | | | $ | 26 | | | 11/9/17 | | | (— | @) | |
UBS AG | | EUR | 133 | | | $ | 156 | | | 11/9/17 | | | (1 | ) | |
UBS AG | | EUR | 125 | | | $ | 148 | | | 11/9/17 | | | (— | @) | |
UBS AG | | HKD | 136 | | | $ | 17 | | | 11/9/17 | | | (— | @) | |
UBS AG | | NOK | 276 | | | $ | 35 | | | 11/9/17 | | | (— | @) | |
UBS AG | | SEK | 69 | | | $ | 9 | | | 11/9/17 | | | — | @ | |
UBS AG | | $ | 12 | | | CAD | 15 | | | 11/9/17 | | | — | @ | |
UBS AG | | $ | 19 | | | EUR | 16 | | | 11/9/17 | | | (— | @) | |
UBS AG | | $ | 10 | | | NOK | 77 | | | 11/9/17 | | | (— | @) | |
The accompanying notes are an integral part of the consolidated financial statements.
23
Morgan Stanley Institutional Fund Trust
Annual Report — September 30, 2017
Consolidated Portfolio of Investments (cont'd)
Global Multi-Asset Income Portfolio
Counterparty | | Contracts to
Deliver
(000) | | In Exchange
For
(000) | | Delivery
Date | | Unrealized
Appreciation
(Depreciation)
(000) | |
UBS AG | | $ | 47 | | | SEK | 385 | | | 11/9/17 | | $ | — | @ | |
UBS AG | | $ | 148 | | | SEK | 1,204 | | | 11/9/17 | | | — | @ | |
UBS AG | | $ | 378 | | | SEK | 3,077 | | | 11/9/17 | | | 1 | | |
UBS AG | | ZAR | 43 | | | $ | 3 | | | 11/9/17 | | | — | @ | |
State Street Bank and Trust Co. | | $ | 81 | | | KRW | 93,150 | | | 11/10/17 | | | — | @ | |
Citibank NA | | CZK | 349 | | | $ | 15 | | | 2/1/18 | | | (1 | ) | |
Citibank NA | | CZK | 600 | | | $ | 27 | | | 2/1/18 | | | (1 | ) | |
Citibank NA | | CZK | 278 | | | $ | 13 | | | 2/1/18 | | | — | @ | |
Citibank NA | | CZK | 280 | | | $ | 13 | | | 2/1/18 | | | — | @ | |
Citibank NA | | EUR | 118 | | | $ | 128 | | | 2/1/18 | | | (12 | ) | |
Citibank NA | | EUR | 135 | | | $ | 147 | | | 2/1/18 | | | (14 | ) | |
Citibank NA | | EUR | 153 | | | $ | 167 | | | 2/1/18 | | | (15 | ) | |
Citibank NA | | EUR | 51 | | | $ | 56 | | | 2/1/18 | | | (5 | ) | |
Citibank NA | | EUR | 52 | | | $ | 57 | | | 2/1/18 | | | (5 | ) | |
Citibank NA | | EUR | 182 | | | $ | 215 | | | 2/1/18 | | | (1 | ) | |
Citibank NA | | EUR | 8 | | | $ | 9 | | | 2/1/18 | | | (— | @) | |
Citibank NA | | $ | 163 | | | CZK | 4,018 | | | 2/1/18 | | | 21 | | |
Citibank NA | | $ | 54 | | | CZK | 1,339 | | | 2/1/18 | | | 7 | | |
Citibank NA | | $ | 56 | | | CZK | 1,371 | | | 2/1/18 | | | 7 | | |
Citibank NA | | $ | 130 | | | CZK | 3,185 | | | 2/1/18 | | | 16 | | |
Citibank NA | | $ | 148 | | | CZK | 3,641 | | | 2/1/18 | | | 19 | | |
Citibank NA | | $ | 19 | | | CZK | 406 | | | 2/1/18 | | | — | @ | |
Citibank NA | | $ | 216 | | | CZK | 4,746 | | | 2/1/18 | | | 1 | | |
Citibank NA | | $ | 9 | | | EUR | 8 | | | 2/1/18 | | | — | @ | |
Citibank NA | | $ | 11 | | | EUR | 9 | | | 2/1/18 | | | — | @ | |
Citibank NA | | $ | 17 | | | EUR | 14 | | | 2/1/18 | | | (— | @) | |
Citibank NA | | $ | 5 | | | EUR | 4 | | | 2/1/18 | | | (— | @) | |
| | | | | | | | | $ | 28 | | |
Futures Contracts:
The Fund had the following futures contracts open at September 30, 2017:
| | | Number
of
Contracts | | Expiration
Date | | Notional Amount
(000) | | Value
(000) | | Unrealized
Appreciation
(Depreciation)
(000) | |
Long: | |
German Euro BOBL (Germany) | | | 1 | | | Dec-17 | | | 100 | | | $ | 155 | | | $ | (1 | ) | |
MSCI Emerging Market (United States) | | | 10 | | | Dec-17 | | | 1 | | | | 545 | | | | (1 | ) | |
NIKKEI 225 Index (United States) | | | 4 | | | Dec-17 | | | 2 | | | | 362 | | | | 20 | | |
OMXS 30 (Sweden) | | | 2 | | | Oct-17 | | | — | @ | | | 40 | | | | 2 | | |
S&P 500 E MINI Index (United States) | | | 7 | | | Dec-17 | | | — | @ | | | 881 | | | | 7 | | |
TOPIX Index (Japan) | | | 3 | | | Dec-17 | | | 30 | | | | 447 | | | | 26 | | |
U.S. Treasury 10 yr. Note (United States) | | | 5 | | | Dec-17 | | | 500 | | | | 626 | | | | (7 | ) | |
U.S. Treasury 2 yr. Note (United States) | | | 3 | | | Dec-17 | | | 600 | | | | 647 | | | | (2 | ) | |
Short: | |
Brent Crude Futures (United Kingdom) | | | 1 | | | Oct-17 | | | (1 | ) | | | (57 | ) | | | 1 | | |
Euro Stoxx 50 Index (Germany) | | | 3 | | | Dec-17 | | | (— | @) | | | (127 | ) | | | (2 | ) | |
German Euro BTP (Germany) | | | 1 | | | Dec-17 | | | (100 | ) | | | (159 | ) | | | — | @ | |
German Euro Bund (Germany) | | | 7 | | | Dec-17 | | | (700 | ) | | | (1,332 | ) | | | 10 | | |
U.S. Treasury 10 yr. Note (United States) | | | 2 | | | Dec-17 | | | (200 | ) | | | (251 | ) | | | 3 | | |
U.S. Treasury 5 yr. Note (United States) | | | 6 | | | Dec-17 | | | (600 | ) | | | (705 | ) | | | 6 | | |
| | | | | | | | | | | $ | 62 | | |
The accompanying notes are an integral part of the consolidated financial statements.
24
Morgan Stanley Institutional Fund Trust
Annual Report — September 30, 2017
Consolidated Portfolio of Investments (cont'd)
Global Multi-Asset Income Portfolio
Credit Default Swap Agreements:
The Fund had the following credit default swap agreements open at September 30, 2017:
Swap Counterparty and
Reference Obligation | | Credit
Rating of
Reference
Obligation†
(Unaudited) | | Buy/Sell
Protection | | Pay/Receive
Fixed Rate | | Payment
Frequency | | Maturity
Date | | Notional
Amount
(000) | | Value
(000) | | Upfront
Payment
Paid
(000) | | Unrealized
Appreciation
(000) | |
Morgan
Stanley & Co., LLC*
CDX.NA.HY.27 | | NR | | Sell | | | 5.00 | % | | Quarterly | | 12/20/21 | | $ | 37 | | | $ | 3 | | | $ | 1 | | | $ | 2 | | |
Morgan
Stanley & Co., LLC*
ITRAXX.XO.27 | | NR | | Sell | | | 5.00 | | | Quarterly | | 6/20/22 | | EUR | 138 | | | | 21 | | | | 14 | | | | 7 | | |
| | | | | | | | | | | | | | | | | | | | | | | | | $ | 175 | | | $ | 24 | | | $ | 15 | | | $ | 9 | | |
Interest Rate Swap Agreements:
The Fund had the following interest rate swap agreements open at September 30, 2017:
Swap Counterparty | | Floating Rate
Index | | Pay/Receive
Floating Rate | | Fixed Rate | | Payment
Frequency
Paid/
Received | | Maturity
Date | | Notional
Amount
(000) | | Value
(000) | | Upfront
Payment
Paid
(000) | | Unrealized
Appreciation
(Depreciation)
(000) | |
JPMorgan Chase 3 Month Quarterly/
Bank NA | | KORIBOR | | Pay | | | 1.83 | % | | Quarterly | | 6/14/27 | | KRW | 73,000 | | | $ | (1 | ) | | $ | — | | | $ | (1 | ) | |
Morgan Stanley & 6 Month Annual/
Co., LLC* | | PRIBOR | | Receive | | | 1.11 | | | Semi-Annual | | 8/7/22 | | CZK | 737 | | | | — | @ | | | — | | | | — | @ | |
Morgan Stanley & 6 Month Annual/
Co., LLC* | | PRIBOR | | Receive | | | 1.12 | | | Semi-Annual | | 8/7/22 | | | 6,349 | | | | 3 | | | | — | | | | 3 | | |
Morgan Stanley & 6 Month Annual/
Co., LLC* | | PRIBOR | | Receive | | | 1.06 | | | Semi-Annual | | 8/8/22 | | | 1,788 | | | | 1 | | | | — | | | | 1 | | |
Morgan Stanley & 6 Month Annual/
Co., LLC* | | PRIBOR | | Receive | | | 1.07 | | | Semi-Annual | | 8/14/22 | | | 1,781 | | | | 1 | | | | — | | | | 1 | | |
Morgan Stanley & 6 Month Annual/
Co., LLC* | | PRIBOR | | Receive | | | 1.07 | | | Semi-Annual | | 8/14/22 | | | 1,781 | | | | 1 | | | | — | | | | 1 | | |
Morgan Stanley & 6 Month Annual/
Co., LLC* | | PRIBOR | | Receive | | | 1.06 | | | Semi-Annual | | 8/15/22 | | | 1,780 | | | | 1 | | | | — | | | | 1 | | |
Morgan Stanley & 6 Month Annual/
Co., LLC* | | PRIBOR | | Receive | | | 1.09 | | | Semi-Annual | | 8/15/22 | | | 3,671 | | | | 2 | | | | — | | | | 2 | | |
Morgan Stanley & 6 Month Annual/
Co., LLC* | | PRIBOR | | Receive | | | 1.12 | | | Semi-Annual | | 8/22/22 | | | 899 | | | | — | @ | | | — | | | | — | @ | |
Morgan Stanley & 6 Month Annual/
Co., LLC* | | PRIBOR | | Receive | | | 1.10 | | | Semi-Annual | | 8/23/22 | | | 1,798 | | | | 1 | | | | — | | | | 1 | | |
Morgan Stanley & 6 Month Annual/
Co., LLC* | | PRIBOR | | Receive | | | 1.10 | | | Semi-Annual | | 8/23/22 | | | 1,798 | | | | 1 | | | | — | | | | 1 | | |
Morgan Stanley & 6 Month Annual/
Co., LLC* | | PRIBOR | | Receive | | | 1.10 | | | Semi-Annual | | 8/23/22 | | | 1,798 | | | | 1 | | | | — | | | | 1 | | |
Morgan Stanley & 6 Month Annual/
Co., LLC* | | PRIBOR | | Receive | | | 1.12 | | | Semi-Annual | | 8/24/22 | | | 1,798 | | | | 1 | | | | — | | | | 1 | | |
Morgan Stanley & 6 Month Annual/
Co., LLC* | | PRIBOR | | Receive | | | 1.12 | | | Semi-Annual | | 8/24/22 | | | 815 | | | | — | @ | | | — | | | | — | @ | |
Morgan Stanley & 3 Month Semi-Annual/
Co., LLC* | | LIBOR | | Receive | | | 2.28 | | | Quarterly | | 12/8/26 | | $ | 116 | | | | (1 | ) | | | — | | | | (1 | ) | |
Morgan Stanley & 3 Month Semi-Annual/
Co., LLC* | | LIBOR | | Receive | | | 2.48 | | | Quarterly | | 12/21/26 | | | 77 | | | | (2 | ) | | | — | | | | (2 | ) | |
Morgan Stanley & 3 Month Semi-Annual/
Co., LLC* | | LIBOR | | Receive | | | 2.59 | | | Quarterly | | 12/8/46 | | | 16 | | | | (— | @) | | | — | | | | (— | @) | |
Morgan Stanley & 3 Month Semi-Annual/
Co., LLC* | | LIBOR | | Receive | | | 2.74 | | | Quarterly | | 12/21/46 | | | 32 | | | | (1 | ) | | | — | | | | (1 | ) | |
Morgan Stanley & 3 Month Semi-Annual/
Co., LLC* | | LIBOR | | Receive | | | 2.48 | | | Quarterly | | 5/23/47 | | | 30 | | | | — | @ | | | — | | | | — | @ | |
| | | | | | | | | | | | | | | | | | | | | | | | | $ | 100,063 | | | $ | 8 | | | $ | — | | | $ | 8 | | |
The accompanying notes are an integral part of the consolidated financial statements.
25
Morgan Stanley Institutional Fund Trust
Annual Report — September 30, 2017
Consolidated Portfolio of Investments (cont'd)
Global Multi-Asset Income Portfolio
Total Return Swap Agreements:
The Fund had the following total return swap agreements open at September 30, 2017:
Swap Counterparty | | Index | | Pay/Receive
Total Return of
Referenced
Index | | Floating
Rate | | Payment
Frequency | | Maturity
Date | | Notional
Amount
(000) | | Value
(000) | | Upfront
Payment
Paid
(000) | | Unrealized
Appreciation
(Depreciation)
(000) | |
JPMorgan Chase
Bank NA | | JPM Custom China
Tier 2 Banks Index†† | | |
Pay | | | 3 Month USD
LIBOR plus 0.10% | | |
Quarterly | | | |
3/15/18 | | | $ | 107 | | | $ | 5 | | | $ | — | | | $ | 5 | | |
JPMorgan Chase
Bank NA | | JPM Custom China
Tier 2 Banks Index†† | | |
Pay | | | 3 Month USD
LIBOR minus 0.10% | | |
Quarterly | | | |
3/15/18 | | | | 28 | | | | 1 | | | | — | | | | 1 | | |
JPMorgan Chase
Bank NA | | JPM Custom China
Tier 2 Banks Index†† | | |
Pay | | | 3 Month USD
LIBOR minus 0.10% | | |
Quarterly | | | |
3/15/18 | | | | 27 | | | | 1 | | | | — | | | | 1 | | |
JPMorgan Chase
Bank NA | | BNP European
Staples Index†† | | |
Pay | | | 3 Month USD
LIBOR plus 0.13% | | |
Quarterly | | | |
7/17/18 | | | | 112 | | | | (2 | ) | | | — | | | | (2 | ) | |
JPMorgan Chase
Bank NA | | MSCI World Energy
Equipment & Services | | |
Pay | | | 3 Month USD
LIBOR plus 0.05% | | |
Quarterly | | | |
9/6/18 | | | | 120 | | | | (11 | ) | | | — | | | | (11 | ) | |
| | | | | | | | | | | | | $ | 394 | | | $ | (6 | ) | | $ | — | | | $ | (6 | ) | |
†† See tables below for details of the equity basket holdings underlying the swap.
The following table represents the equity basket holdings underlying the total return swap with JPM Custom China Tier 2 Banks Index as of September 30, 2017.
| Security Description | | Shares | | Value
(000) | | Index Weight | |
JPM Custom China Tier 2 Banks Index | |
Bank of Communications Co., Ltd. | | | 230,551 | | | $ | 1,314 | | | | 12.65 | % | |
China CITIC Bank Corp., Ltd. | | | 743,160 | | | | 3,686 | | | | 35.48 | | |
China Everbright Bank Co., Ltd. | | | 57,105 | | | | 206 | | | | 1.99 | | |
China Merchants Bank Co., Ltd. | | | 131,691 | | | | 3,615 | | | | 34.80 | | |
China Minsheng Banking Corp., Ltd. | | | 165,248 | | | | 1,183 | | | | 11.39 | | |
Chongqing Rural Commercial Bank Co., Ltd. | | | 77,532 | | | | 384 | | | | 3.69 | | |
| | | | | $ | 10,388 | | | | 100.00 | % | |
The following table represents the equity basket holdings underlying the total return swap with BNP European Staples Index as of September 30, 2017.
| Security Description | | Shares | | Value
(000) | | Index Weight | |
BNP European Staples Index | |
Anheuser-Busch InBev SA | | | 69,961 | | | $ | 7,087 | | | | 8.21 | % | |
Associated British Foods PLC | | | 32,052 | | | | 102,342 | | | | 1.35 | | |
Barry Callebaut AG | | | 203 | | | | 301 | | | | 0.31 | | |
Beiersdorf AG | | | 9,390 | | | | 855 | | | | 0.99 | | |
British American Tobacco PLC | | | 172,978 | | | | 808,153 | | | | 10.63 | | |
Carlsberg A/S | | | 9,952 | | | | 6,857 | | | | 1.07 | | |
Carrefour SA | | | 53,431 | | | | 913 | | | | 1.06 | | |
Casino Guichard Perrachon SA | | | 5,244 | | | | 263 | | | | 0.31 | | |
CECONOMY AG | | | 16,826 | | | | 168 | | | | 0.19 | | |
Chocoladefabriken Lindt & Spruengli AG | | | 9 | | | | 604 | | | | 0.61 | | |
Chocoladefabriken Lindt & Spruengli AG | | | 94 | | | | 519 | | | | 0.53 | | |
Coca-Cola European Partners PLC | | | 20,250 | | | | 718 | | | | 0.83 | | |
Coca-Cola HBC AG | | | 16,739 | | | | 42,266 | | | | 0.56 | | |
Colruyt SA | | | 5,611 | | | | 243 | | | | 0.28 | | |
Danone SA | | | 54,517 | | | | 3,618 | | | | 4.19 | | |
Diageo PLC | | | 232,819 | | | | 571,105 | | | | 7.51 | | |
Distribuidora Internacional de Alimentac | | | 58,467 | | | | 289 | | | | 0.33 | | |
Essity AB | | | 56,520 | | | | 12,525 | | | | 1.51 | | |
Heineken Holding N.V. | | | 9,364 | | | | 744 | | | | 0.86 | | |
Heineken N.V. | | | 21,438 | | | | 1,793 | | | | 2.08 | | |
Henkel AG & Co., KGaA | | | 16,543 | | | | 1,905 | | | | 2.21 | | |
Henkel AG & Co., KGaA | | | 9,649 | | | | 993 | | | | 1.15 | | |
ICA Gruppen AB | | | 7,519 | | | | 2,302 | | | | 0.28 | | |
The accompanying notes are an integral part of the consolidated financial statements.
26
Morgan Stanley Institutional Fund Trust
Annual Report — September 30, 2017
Consolidated Portfolio of Investments (cont'd)
Global Multi-Asset Income Portfolio
| Security Description | | Shares | | Value
(000) | | Index Weight | |
BNP European Staples Index (cont'd) | |
Imperial Brands PLC | | | 88,701 | | | $ | 282,424 | | | | 3.71 | % | |
J Sainsbury PLC | | | 151,841 | | | | 36,123 | | | | 0.48 | | |
Jeronimo Martins SGPS SA | | | 23,480 | | | | 392 | | | | 0.45 | | |
Kerry Group PLC | | | 14,795 | | | | 1,203 | | | | 1.39 | | |
Koninklijke Ahold Delhaize N.V. | | | 121,876 | | | | 1,928 | | | | 2.23 | | |
L'Oreal SA | | | 23,493 | | | | 4,226 | | | | 4.90 | | |
Marine Harvest ASA | | | 35,710 | | | | 5,624 | | | | 0.69 | | |
METRO AG | | | 16,826 | | | | 301 | | | | 0.35 | | |
Nestle SA | | | 126,608 | | | | 10,268 | | | | 10.40 | | |
Orkla ASA | | | 74,904 | | | | 6,120 | | | | 0.75 | | |
Pernod Ricard SA | | | 19,721 | | | | 2,308 | | | | 2.67 | | |
Reckitt Benckiser Group PLC | | | 61,558 | | | | 419,395 | | | | 5.51 | | |
Remy Cointreau SA | | | 2,071 | | | | 208 | | | | 0.24 | | |
Swedish Match AB | | | 17,513 | | | | 5,003 | | | | 0.60 | | |
Tate & Lyle PLC | | | 42,755 | | | | 27,727 | | | | 0.36 | | |
Tesco PLC | | | 763,910 | | | | 142,966 | | | | 1.88 | | |
Unilever N.V. | | | 152,816 | | | | 7,647 | | | | 8.86 | | |
Unilever PLC | | | 120,520 | | | | 520,526 | | | | 6.84 | | |
Wm Morrison Supermarkets PLC | | | 208,285 | | | | 48,760 | | | | 0.64 | | |
Total | | | | $ | 3,089,712 | | | | 100.00 | % | |
@ Value is less than $500.
† Credit rating as issued by Standard & Poor's.
* Cleared swap agreement, the broker is Morgan Stanley & Co., LLC.
NR Not rated.
KORIBOR Korea Interbank Offered Rate.
LIBOR London Interbank Offered Rate.
PRIBOR Prague Interbank Offered Rate.
ARS — Argentine Peso
AUD — Australian Dollar
BRL — Brazilian Real
CAD — Canadian Dollar
CHF — Swiss Franc
CLP — Chilean Peso
CNH — Chinese Yuan Renminbi Offshore
CNY — Chinese Yuan Renminbi
COP — Colombian Peso
CZK — Czech Koruna
DKK — Danish Krone
EUR — Euro
GBP — British Pound
HKD — Hong Kong Dollar
HUF — Hungarian Forint
IDR — Indonesian Rupiah
ILS — Israeli Shekel
INR — Indian Rupee
JPY — Japanese Yen
KRW — South Korean Won
MXN — Mexican Peso
MYR — Malaysian Ringgit
NOK — Norwegian Krone
NZD — New Zealand Dollar
PLN — Polish Zloty
RUB — Russian Ruble
SEK — Swedish Krona
SGD — Singapore Dollar
THB — Thai Baht
TRY — Turkish Lira
TWD — Taiwan Dollar
USD — United States Dollar
ZAR — South African Rand
Portfolio Composition
Classification | | Percentage of
Total Investments | |
Other** | | | 33.1 | % | |
Sovereign | | | 28.2 | | |
Short-Term Investments | | | 14.7 | | |
Corporate Bonds | | | 10.6 | | |
Investment Companies | | | 8.4 | | |
U.S. Treasury Securities | | | 5.0 | | |
Total Investments | | | 100.0 | %*** | |
** Industries and/or investment types representing less than 5% of total investments.
*** Does not include open long/short futures contracts with an underlying face amount of approximately $6,334,000 with net unrealized appreciation of approximately $62,000. Does not include open foreign currency forward exchange contracts with net unrealized appreciation of approximately $28,000 and does not include open swap agreements with net unrealized appreciation of approximately $11,000.
The accompanying notes are an integral part of the consolidated financial statements.
27
Morgan Stanley Institutional Fund Trust
Annual Report — September 30, 2017
Global Multi-Asset Income Portfolio
Consolidated Statement of Assets and Liabilities | | September 30, 2017
(000) | |
Assets: | |
Investments in Securities of Unaffiliated Issuers, at Value (Cost $11,463) | | $ | 12,362 | | |
Investment in Security of Affiliated Issuer, at Value (Cost $3,170) | | | 3,222 | | |
Total Investments in Securities, at Value (Cost $14,633) | | | 15,584 | | |
Foreign Currency, at Value (Cost $24) | | | 25 | | |
Receivable for Investments Sold | | | 459 | | |
Receivable for Variation Margin on Futures Contracts | | | 179 | | |
Due from Adviser | | | 154 | | |
Unrealized Appreciation on Foreign Currency Forward Exchange Contracts | | | 117 | | |
Interest Receivable | | | 53 | | |
Unrealized Appreciation on Swap Agreements | | | 7 | | |
Dividends Receivable | | | 7 | | |
Tax Reclaim Receivable | | | 4 | | |
Receivable from Affiliate | | | 1 | | |
Receivable for Variation Margin on Swap Agreements | | | 1 | | |
Other Assets | | | 39 | | |
Total Assets | | | 16,630 | | |
Liabilities: | |
Payable for Investments Purchased | | | 934 | | |
Unrealized Depreciation on Foreign Currency Forward Exchange Contracts | | | 89 | | |
Payable for Custodian Fees | | | 70 | | |
Payable for Professional Fees | | | 19 | | |
Unrealized Depreciation on Swap Agreements | | | 14 | | |
Payable for Transfer Agency Fees — Class I | | | 1 | | |
Payable for Transfer Agency Fees — Class A | | | 1 | | |
Payable for Transfer Agency Fees — Class C | | | 1 | | |
Payable for Transfer Agency Fees — Class IS | | | 1 | | |
Payable for Administration Fees | | | 1 | | |
Payable for Shareholder Services Fees — Class A | | | — | @ | |
Payable for Distribution and Shareholder Services Fees — Class C | | | — | @ | |
Payable for Sub Transfer Agency Fees — Class A | | | — | @ | |
Other Liabilities | | | 48 | | |
Total Liabilities | | | 1,179 | | |
Net Assets | | $ | 15,451 | | |
Net Assets Consist of: | |
Paid-in-Capital | | $ | 15,056 | | |
Distributions in Excess of Net Investment Income | | | (240 | ) | |
Accumulated Net Realized Loss | | | (418 | ) | |
Unrealized Appreciation (Depreciation) on: | |
Investments | | | 899 | | |
Investments in Affiliates | | | 52 | | |
Futures Contracts | | | 62 | | |
Swap Agreements | | | 11 | | |
Foreign Currency Forward Exchange Contracts | | | 28 | | |
Foreign Currency Translations | | | 1 | | |
Net Assets | | $ | 15,451 | | |
The accompanying notes are an integral part of the consolidated financial statements.
28
Morgan Stanley Institutional Fund Trust
Annual Report — September 30, 2017
Global Multi-Asset Income Portfolio
Consolidated Statement of Assets and Liabilities (cont'd) | | September 30, 2017
(000) | |
CLASS I: | |
Net Assets | | $ | 10 | | |
| Shares Outstanding (unlimited number of shares authorized, no par value) (not in 000's) | | | 1,000 | | |
Net Asset Value, Offering and Redemption Price Per Share | | $ | 10.25 | | |
CLASS A: | |
Net Assets | | $ | 77 | | |
| Shares Outstanding (unlimited number of shares authorized, no par value) (not in 000's) | | | 7,490 | | |
Net Asset Value, Redemption Price Per Share | | $ | 10.23 | | |
Maximum Sales Load | | | 5.25 | % | |
Maximum Sales Charge | | $ | 0.57 | | |
Maximum Offering Price Per Share | | $ | 10.80 | | |
CLASS C: | |
Net Assets | | $ | 10 | | |
| Shares Outstanding (unlimited number of shares authorized, no par value) (not in 000's) | | | 1,000 | | |
Net Asset Value, Offering and Redemption Price Per Share | | $ | 10.19 | | |
CLASS IS: | |
Net Assets | | $ | 15,354 | | |
| Shares Outstanding (unlimited number of shares authorized, no par value) (not in 000's) | | | 1,497,000 | | |
Net Asset Value, Offering and Redemption Price Per Share | | $ | 10.26 | | |
@ Amount is less than $500.
The accompanying notes are an integral part of the consolidated financial statements.
29
Morgan Stanley Institutional Fund Trust
Annual Report — September 30, 2017
Global Multi-Asset Income Portfolio
Consolidated Statement of Operations | | Year Ended
September 30, 2017
(000) | |
Investment Income: | |
Interest from Securities of Unaffiliated Issuers | | $ | 185 | | |
Dividends from Securities of Unaffiliated Issuers (Net of $12 of Foreign Taxes Withheld) | | | 150 | | |
Dividends from Securities of Affiliated Issuer (Note G) | | | 89 | | |
Total Investment Income | | | 424 | | |
Expenses: | |
Custodian Fees (Note F) | | | 205 | | |
Professional Fees | | | 194 | | |
Advisory Fees (Note B) | | | 96 | | |
Pricing Fees | | | 81 | | |
Registration Fees | | | 48 | | |
Shareholder Reporting Fees | | | 24 | | |
Administration Fees (Note C) | | | 12 | | |
Transfer Agency Fees — Class I (Note E) | | | 2 | | |
Transfer Agency Fees — Class A (Note E) | | | 2 | | |
Transfer Agency Fees — Class C (Note E) | | | 2 | | |
Transfer Agency Fees — Class IS (Note E) | | | 2 | | |
Trustees' Fees and Expenses | | | 4 | | |
Organization Costs for Subsidiary | | | 3 | | |
Shareholder Services Fees — Class A (Note D) | | | — | @ | |
Distribution and Shareholder Services Fees — Class C (Note D) | | | — | @ | |
Sub Transfer Agency Fees — Class A | | | — | @ | |
Other Expenses | | | 27 | | |
Total Expenses | | | 702 | | |
Expenses Reimbursed by Adviser (Note B) | | | (464 | ) | |
Waiver of Advisory Fees (Note B) | | | (96 | ) | |
Reimbursement of Class Specific Expenses — Class I (Note B) | | | (2 | ) | |
Reimbursement of Class Specific Expenses — Class A (Note B) | | | (2 | ) | |
Reimbursement of Class Specific Expenses — Class C (Note B) | | | (2 | ) | |
Reimbursement of Class Specific Expenses — Class IS (Note B) | | | (2 | ) | |
Rebate from Morgan Stanley Affiliate (Note G) | | | (4 | ) | |
Net Expenses | | | 130 | | |
Net Investment Income | | | 294 | | |
Realized Gain (Loss): | |
Investments Sold (Net of $6 of Capital Gain Country Tax) | | | (30 | ) | |
Investments in Affiliates | | | (8 | ) | |
Foreign Currency Forward Exchange Contracts | | | (131 | ) | |
Foreign Currency Transactions | | | 2 | | |
Futures Contracts | | | 302 | | |
Options Written | | | (194 | ) | |
Swap Agreements | | | (127 | ) | |
Net Realized Loss | | | (186 | ) | |
Change in Unrealized Appreciation (Depreciation): | |
Investments | | | 596 | | |
Investments in Affiliates | | | 35 | | |
Foreign Currency Forward Exchange Contracts | | | 18 | | |
Foreign Currency Translations | | | 1 | | |
Futures Contracts | | | 48 | | |
Swap Agreements | | | (25 | ) | |
Options Written | | | 4 | | |
Net Change in Unrealized Appreciation (Depreciation) | | | 677 | | |
Net Realized Loss and Change in Unrealized Appreciation (Depreciation) | | | 491 | | |
Net Increase in Net Assets Resulting from Operations | | $ | 785 | | |
@ Amount is less than $500.
The accompanying notes are an integral part of the consolidated financial statements.
30
Morgan Stanley Institutional Fund Trust
Annual Report — September 30, 2017
Global Multi-Asset Income Portfolio
Consolidated Statements of Changes in Net Assets | | Year Ended
September 30, 2017
(000) | | Year Ended
September 30, 2016*
(000) | |
Increase (Decrease) in Net Assets: | |
Operations: | |
Net Investment Income | | $ | 294 | | | $ | 240 | | |
Net Realized Loss | | | (186 | ) | | | (241 | ) | |
Net Change in Unrealized Appreciation (Depreciation) | | | 677 | | | | 1,165 | | |
Net Increase in Net Assets Resulting from Operations | | | 785 | | | | 1,164 | | |
Distributions from and/or in Excess of: | |
Class I: | |
Net Investment Income | | | (— | @) | | | (— | @) | |
Class A: | |
Net Investment Income | | | (1 | ) | | | (1 | ) | |
Class C: | |
Net Investment Income | | | (— | @) | | | (— | @) | |
Class IS: | |
Net Investment Income | | | (246 | ) | | | (307 | ) | |
Total Distributions | | | (247 | ) | | | (308 | ) | |
Capital Share Transactions: (1) | |
Class A: | |
Subscribed | | | — | | | | 25 | | |
Distributions Reinvested | | | — | @ | | | 1 | | |
Net Increase in Net Assets Resulting from Capital Share Transactions | | | — | @ | | | 26 | | |
Total Increase in Net Assets | | | 538 | | | | 882 | | |
Net Assets: | |
Beginning of Period | | | 14,913 | | | | 14,031 | | |
End of Period (Including Distributions in Excess of Net Investment Income of $(240) and $(29)) | | $ | 15,451 | | | $ | 14,913 | | |
(1) Capital Share Transactions: | |
Class A: | |
Shares Subscribed | | | — | | | | 3 | | |
Shares Issued on Distributions Reinvested | | | — | @@ | | | — | @@ | |
Net Increase in Class A Shares Outstanding | | | — | @@ | | | 3 | | |
* Not consolidated.
@ Amount is less than $500.
@@ Amount is less than 500 shares.
The accompanying notes are an integral part of the consolidated financial statements.
31
Morgan Stanley Institutional Fund Trust
Annual Report — September 30, 2017
Consolidated Financial Highlights
Global Multi-Asset Income Portfolio
| | | Class I | |
| | | Year Ended September 30, | | Period from
April 30, 2015(2) to | |
Selected Per Share Data and Ratios | | 2017 | | 2016(1)(3) | | September 30, 2015(3) | |
Net Asset Value, Beginning of Period | | $ | 9.90 | | | $ | 9.33 | | | $ | 10.00 | | |
Income (Loss) from Investment Operations: | |
Net Investment Income(4) | | | 0.19 | | | | 0.15 | | | | 0.07 | | |
Net Realized and Unrealized Gain (Loss) | | | 0.32 | | | | 0.62 | | | | (0.71 | ) | |
Total from Investment Operations | | | 0.51 | | | | 0.77 | | | | (0.64 | ) | |
Distributions from and/or in Excess of: | |
Net Investment Income | | | (0.16 | ) | | | (0.20 | ) | | | (0.03 | ) | |
Net Asset Value, End of Period | | $ | 10.25 | | | $ | 9.90 | | | $ | 9.33 | | |
Total Return(5) | | | 5.24 | % | | | 8.39 | % | | | (6.42 | )%(7) | |
Ratios and Supplemental Data: | |
Net Assets, End of Period (Thousands) | | $ | 10 | | | $ | 10 | | | $ | 9 | | |
Ratio of Expenses to Average Net Assets(9) | | | 0.93 | %(6) | | | 0.92 | %(6) | | | 0.93 | %(6)(8) | |
Ratio of Net Investment Income to Average Net Assets(9) | | | 1.92 | %(6) | | | 1.62 | %(6) | | | 1.72 | %(6)(8) | |
Ratio of Rebate from Morgan Stanley Affiliates to Average Net Assets | | | 0.02 | % | | | 0.03 | % | | | 0.01 | %(8) | |
Portfolio Turnover Rate | | | 218 | % | | | 236 | % | | | 139 | %(7) | |
(9) Supplemental Information on the Ratios to Average Net Assets: | |
Ratios Before Expense Limitation: | |
Expenses to Average Net Assets | | | 28.13 | % | | | 6.73 | % | | | 20.20 | %(8) | |
Net Investment Loss to Average Net Assets | | | (25.28 | )% | | | (4.19 | )% | | | (17.55 | )%(8) | |
(1) Reflects prior period custodian out-of-pocket expenses that were reimbursed in September 2016. The amount of the reimbursement was immaterial on a per share basis and did not impact the total return of Class I shares. The Ratio of Expenses to Average Net Assets and the Ratio of Net Investment Income to Average Net Assets would be unchanged as the reimbursement of custodian fees was offset against expense waivers/reimbursements with no impact to net expenses or net investment income.
(2) Commencement of Operations.
(3) Not consolidated.
(4) Per share amount is based on average shares outstanding.
(5) Calculated based on the net asset value as of the last business day of the period.
(6) The Ratios of Expenses and Net Investment Income reflect the rebate of certain Fund expenses in connection with the investments in Morgan Stanley affiliates during the period. The effect of the rebate on the ratios is disclosed in the above table as "Ratio of Rebate from Morgan Stanley Affiliates to Average Net Assets."
(7) Not annualized.
(8) Annualized.
The accompanying notes are an integral part of the consolidated financial statements.
32
Morgan Stanley Institutional Fund Trust
Annual Report — September 30, 2017
Consolidated Financial Highlights
Global Multi-Asset Income Portfolio
| | | Class A | |
| | | Year Ended September 30, | | Period from
April 30, 2015(2) to | |
Selected Per Share Data and Ratios | | 2017 | | 2016(1)(3) | | September 30, 2015(3) | |
Net Asset Value, Beginning of Period | | $ | 9.88 | | | $ | 9.32 | | | $ | 10.00 | | |
Income (Loss) from Investment Operations: | |
Net Investment Income(4) | | | 0.16 | | | | 0.12 | | | | 0.04 | | |
Net Realized and Unrealized Gain (Loss) | | | 0.32 | | | | 0.61 | | | | (0.69 | ) | |
Total from Investment Operations | | | 0.48 | | | | 0.73 | | | | (0.65 | ) | |
Distributions from and/or in Excess of: | |
Net Investment Income | | | (0.13 | ) | | | (0.17 | ) | | | (0.03 | ) | |
Net Asset Value, End of Period | | $ | 10.23 | | | $ | 9.88 | | | $ | 9.32 | | |
Total Return(5) | | | 4.89 | % | | | 8.10 | % | | | (6.64 | )%(7) | |
Ratios and Supplemental Data: | |
Net Assets, End of Period (Thousands) | | $ | 77 | | | $ | 73 | | | $ | 44 | | |
Ratio of Expenses to Average Net Assets(9) | | | 1.27 | %(6) | | | 1.26 | %(6) | | | 1.27 | %(6)(8) | |
Ratio of Net Investment Income to Average Net Assets(9) | | | 1.59 | %(6) | | | 1.27 | %(6) | | | 1.02 | %(6)(8) | |
Ratio of Rebate from Morgan Stanley Affiliates to Average Net Assets | | | 0.03 | % | | | 0.04 | % | | | 0.01 | %(8) | |
Portfolio Turnover Rate | | | 218 | % | | | 236 | % | | | 139 | %(7) | |
(9) Supplemental Information on the Ratios to Average Net Assets: | |
Ratios Before Expense Limitation: | |
Expenses to Average Net Assets | | | 8.12 | % | | | 4.74 | % | | | 12.75 | %(8) | |
Net Investment Loss to Average Net Assets | | | (5.26 | )% | | | (2.21 | )% | | | (10.46 | )%(8) | |
(1) Reflects prior period custodian out-of-pocket expenses that were reimbursed in September 2016. The amount of the reimbursement was immaterial on a per share basis and did not impact the total return of Class A shares. The Ratio of Expenses to Average Net Assets and the Ratio of Net Investment Income to Average Net Assets would be unchanged as the reimbursement of custodian fees was offset against expense waivers/reimbursements with no impact to net expenses or net investment income.
(2) Commencement of Operations.
(3) Not consolidated.
(4) Per share amount is based on average shares outstanding.
(5) Calculated based on the net asset value which does not reflect sales charges, if applicable, as of the last business day of the period.
(6) The Ratios of Expenses and Net Investment Income reflect the rebate of certain Fund expenses in connection with the investments in Morgan Stanley affiliates during the period. The effect of the rebate on the ratios is disclosed in the above table as "Ratio of Rebate from Morgan Stanley Affiliates to Average Net Assets."
(7) Not annualized.
(8) Annualized.
The accompanying notes are an integral part of the consolidated financial statements.
33
Morgan Stanley Institutional Fund Trust
Annual Report — September 30, 2017
Consolidated Financial Highlights
Global Multi-Asset Income Portfolio
| | | Class C | |
| | | Year Ended September 30, | | Period from
May 8, 2015(2) to | |
Selected Per Share Data and Ratios | | 2017 | | 2016(1)(3) | | September 30, 2015(3) | |
Net Asset Value, Beginning of Period | | $ | 9.84 | | | $ | 9.30 | | | $ | 10.00 | | |
Income (Loss) from Investment Operations: | |
Net Investment Income(4) | | | 0.08 | | | | 0.04 | | | | 0.02 | | |
Net Realized and Unrealized Gain (Loss) | | | 0.33 | | | | 0.61 | | | | (0.71 | ) | |
Total from Investment Operations | | | 0.41 | | | | 0.65 | | | | (0.69 | ) | |
Distributions from and/or in Excess of: | |
Net Investment Income | | | (0.06 | ) | | | (0.11 | ) | | | (0.01 | ) | |
Net Asset Value, End of Period | | $ | 10.19 | | | $ | 9.84 | | | $ | 9.30 | | |
Total Return(5) | | | 4.21 | % | | | 7.11 | % | | | (6.86 | )%(7) | |
Ratios and Supplemental Data: | |
Net Assets, End of Period (Thousands) | | $ | 10 | | | $ | 10 | | | $ | 9 | | |
Ratio of Expenses to Average Net Assets(9) | | | 2.03 | %(6) | | | 2.02 | %(6) | | | 2.03 | %(6)(8) | |
Ratio of Net Investment Income to Average Net Assets(9) | | | 0.80 | %(6) | | | 0.41 | %(6) | | | 0.56 | %(6)(8) | |
Ratio of Rebate from Morgan Stanley Affiliates to Average Net Assets | | | 0.02 | % | | | 0.03 | % | | | 0.01 | %(8) | |
Portfolio Turnover Rate | | | 218 | % | | | 236 | % | | | 139 | %(7) | |
(9) Supplemental Information on the Ratios to Average Net Assets: | |
Ratios Before Expense Limitation: | |
Expenses to Average Net Assets | | | 26.46 | % | | | 14.16 | % | | | 21.28 | %(8) | |
Net Investment Loss to Average Net Assets | | | (23.63 | )% | | | (11.73 | )% | | | (18.68 | )%(8) | |
(1) Reflects prior period custodian out-of-pocket expenses that were reimbursed in September 2016. The amount of the reimbursement was immaterial on a per share basis and did not impact the total return of Class C shares. The Ratio of Expenses to Average Net Assets and the Ratio of Net Investment Income to Average Net Assets would be unchanged as the reimbursement of custodian fees was offset against expense waivers/reimbursements with no impact to net expenses or net investment income.
(2) Commencement of Offering.
(3) Not consolidated.
(4) Per share amount is based on average shares outstanding.
(5) Calculated based on the net asset value which does not reflect sales charges, if applicable, as of the last business day of the period.
(6) The Ratios of Expenses and Net Investment Income reflect the rebate of certain Fund expenses in connection with the investments in Morgan Stanley affiliates during the period. The effect of the rebate on the ratios is disclosed in the above table as "Ratio of Rebate from Morgan Stanley Affiliates to Average Net Assets."
(7) Not annualized.
(8) Annualized.
The accompanying notes are an integral part of the consolidated financial statements.
34
Morgan Stanley Institutional Fund Trust
Annual Report — September 30, 2017
Consolidated Financial Highlights
Global Multi-Asset Income Portfolio
| | | Class IS | |
| | | Year Ended September 30, | | Period from
April 30, 2015(2) to | |
Selected Per Share Data and Ratios | | 2017 | | 2016(1)(3) | | September 30, 2015(3) | |
Net Asset Value, Beginning of Period | | $ | 9.90 | | | $ | 9.33 | | | $ | 10.00 | | |
Income (Loss) from Investment Operations: | |
Net Investment Income(4) | | | 0.20 | | | | 0.16 | | | | 0.07 | | |
Net Realized and Unrealized Gain (Loss) | | | 0.32 | | | | 0.61 | | | | (0.71 | ) | |
Total from Investment Operations | | | 0.52 | | | | 0.77 | | | | (0.64 | ) | |
Distributions from and/or in Excess of: | |
Net Investment Income | | | (0.16 | ) | | | (0.20 | ) | | | (0.03 | ) | |
Net Asset Value, End of Period | | $ | 10.26 | | | $ | 9.90 | | | $ | 9.33 | | |
Total Return(5) | | | 5.40 | % | | | 8.44 | % | | | (6.41 | )%(7) | |
Ratios and Supplemental Data: | |
Net Assets, End of Period (Thousands) | | $ | 15,354 | | | $ | 14,820 | | | $ | 13,969 | | |
Ratio of Expenses to Average Net Assets(9) | | | 0.87 | %(6) | | | 0.86 | %(6) | | | 0.87 | %(6)(8) | |
Ratio of Net Investment Income to Average Net Assets(9) | | | 2.00 | %(6) | | | 1.68 | %(6) | | | 1.76 | %(6)(8) | |
Ratio of Rebate from Morgan Stanley Affiliates to Average Net Assets | | | 0.03 | % | | | 0.04 | % | | | 0.01 | %(8) | |
Portfolio Turnover Rate | | | 218 | % | | | 236 | % | | | 139 | %(7) | |
(9) Supplemental Information on the Ratios to Average Net Assets: | |
Ratios Before Expense Limitation: | |
Expenses to Average Net Assets | | | 4.70 | % | | | 3.99 | % | | | 5.97 | %(8) | |
Net Investment Loss to Average Net Assets | | | (1.83 | )% | | | (1.45 | )% | | | (3.34 | )%(8) | |
(1) Reflects prior period custodian out-of-pocket expenses that were reimbursed in September 2016. The amount of the reimbursement was immaterial on a per share basis and did not impact the total return of Class IS shares. The Ratio of Expenses to Average Net Assets and the Ratio of Net Investment Income to Average Net Assets would be unchanged as the reimbursement of custodian fees was offset against expense waivers/reimbursements with no impact to net expenses or net investment income.
(2) Commencement of Operations.
(3) Not consolidated.
(4) Per share amount is based on average shares outstanding.
(5) Calculated based on the net asset value as of the last business day of the period.
(6) The Ratios of Expenses and Net Investment Income reflect the rebate of certain Fund expenses in connection with the investments in Morgan Stanley affiliates during the period. The effect of the rebate on the ratios is disclosed in the above table as "Ratio of Rebate from Morgan Stanley Affiliates to Average Net Assets."
(7) Not annualized.
(8) Annualized.
The accompanying notes are an integral part of the consolidated financial statements.
35
Morgan Stanley Institutional Fund Trust
Annual Report — September 30, 2017
Notes to Consolidated Financial Statements
Morgan Stanley Institutional Fund Trust ("Trust'') is registered under the Investment Company Act of 1940, as amended (the "Act''), as an open-end management investment company. The Trust is comprised of nine separate, active funds (individually referred to as a "Fund", collectively as the "Funds"). The Trust applies investment company accounting and reporting guidance. All Funds are considered diversified for purposes of the Act.
The accompanying consolidated financial statements relate to the Global Multi-Asset Income Portfolio. The Fund seeks to maximize current income and to seek capital appreciation over time. The Fund offers four classes of shares — Class I, Class A, Class C and Class IS.
A. Significant Accounting Policies: The following significant accounting policies are in conformity with U.S. generally accepted accounting principles ("GAAP"). Such policies are consistently followed by the Trust in the preparation of its consolidated financial statements. GAAP may require management to make estimates and assumptions that affect the reported amounts and disclosures in the consolidated financial statements. Actual results may differ from those estimates.
Effective October 3, 2016, the Fund may, consistent with its principal investment strategies, invest up to 25% of its total assets in a wholly-owned subsidiary of the Fund organized as a company under the laws of the Cayman Islands, Global Multi-Asset Cayman Portfolio, Ltd. (the "Subsidiary"). The Subsidiary may invest, directly or indirectly through the use of derivatives, in securities, commodities, commodity-related instruments and other investments, primarily futures, swaps and notes. The Fund is the sole shareholder of the Subsidiary, and it is not currently expected that shares of the Subsidiary will be sold or offered to other investors. The consolidated portfolio of investments and consolidated financial statements include the positions and accounts of the Fund and the Subsidiary. All intercompany accounts and transactions of the Fund and the Subsidiary have been eliminated in consolidation. As of September 30, 2017, the Subsidiary represented approximately $693,000 or approximately 4.49% of the total assets of the Fund.
Investments in the Subsidiary are expected to provide the Fund with exposure to the commodity markets within the limitations of Subchapter M of the Code and recent Internal Revenue Service ("IRS") revenue rulings, which require that a mutual fund receive no more than ten percent of its gross income from such investments in order to receive favorable tax
treatment as a regulated investment company ("RIC"). Tax treatment of the income received from the Subsidiary may potentially be affected by changes in legislation, regulations or other legally binding authority, which could affect the character, timing and amount of the Fund's taxable income and distributions. If such changes occur, the Fund may need to significantly change its investment strategy and recognize unrealized gains in order to remain qualified for taxation as a RIC, which could adversely affect the Fund.
1. Security Valuation: (1) Certain portfolio securities may be valued by an outside pricing service/vendor approved by the Trust's Board of Trustees (the "Trustees"). The pricing service/vendor may employ a pricing model that takes into account, among other things, bids, yield spreads, and/or other market data and specific security characteristics. Alternatively, if a valuation is not available from an outside pricing service/vendor, and the security trades on an exchange, the security may be valued at its latest reported sale price (or at the exchange official closing price if such exchange reports an official closing price), prior to the time when assets are valued. If there are no sales on a given day and if there is no official exchange closing price for that day, the security is valued at the mean between the last reported bid and asked prices if such bid and asked prices are available in the relevant exchanges; (2) an equity portfolio security listed or traded on an exchange is valued at its latest reported sales price (or at the exchange official closing price if such exchange reports an official closing price), and if there were no sales on a given day and if there is no official exchange closing price for that day, the security is valued at the mean between the last reported bid and asked prices if such bid and asked prices are available on the relevant exchanges. Listed equity securities not traded on the valuation date with no reported bid and asked prices available on the exchange are valued at the mean between the current bid and asked prices obtained from one or more reputable brokers or dealers. In cases where a security is traded on more than one exchange, the security is valued on the exchange designated as the primary market; (3) all other equity portfolio securities for which over-the-counter ("OTC") market quotations are readily available are valued at the latest reported sales price (or at the market official closing price if such market reports an official closing price), and if there was no trading in the security on a given day and if there is no official closing price from relevant markets for that day, the
36
Morgan Stanley Institutional Fund Trust
Annual Report — September 30, 2017
Notes to Consolidated Financial Statements (cont'd)
security is valued at the mean between the last reported bid and asked prices if such bid and asked prices are available on the relevant markets. An unlisted equity security that does not trade on the valuation date and for which bid and asked prices from the relevant markets are unavailable is valued at the mean between the current bid and asked prices obtained from one or more reputable brokers or dealers; (4) futures are valued at the settlement price on the exchange on which they trade or, if a settlement price is unavailable, at the last sale price on the exchange; (5) OTC swaps may be valued by an outside pricing service approved by the Trustees or quotes from a broker or dealer. Swaps cleared on a clearinghouse or exchange may be valued using the closing price provided by the clearinghouse or exchange; (6) listed options are valued at the last reported sales price on the exchange on which they are listed (or at the exchange official closing price if such exchange reports an official closing price). If an official closing price or last reported sales price is unavailable, the listed option should be fair valued at the mean between its latest bid and ask prices. Unlisted options are valued at the mean between their latest bid and ask prices from a broker/dealer or valued by a pricing service/vendor; (7) when market quotations are not readily available, including circumstances under which Morgan Stanley Investment Management Inc. (the "Adviser") determines that the closing price, last sale price or the mean between the last reported bid and asked prices are not reflective of a security's market value, portfolio securities are valued at their fair value as determined in good faith under procedures established by and under the general supervision of the Trustees. Occasionally, developments affecting the closing prices of securities and other assets may occur between the times at which valuations of such securities are determined (that is, close of the foreign market on which the securities trade) and the close of business of the New York Stock Exchange ("NYSE"). If developments occur during such periods that are expected to materially affect the value of such securities, such valuations may be adjusted to reflect the estimated fair value of such securities as of the close of the NYSE, as determined in good faith by the Trustees or by the Adviser using a pricing service and/or procedures approved by the Trustees; (8) quotations of foreign portfolio securities, other assets and liabilities and forward contracts stated in foreign currency are translated into U.S. dollar equivalents at the prevailing market rates prior to the close of the NYSE; and (9) in-
vestments in mutual funds, including the Morgan Stanley Institutional Liquidity Funds, are valued at the net asset value ("NAV") as of the close of each business day.
The Trustees have responsibility for determining in good faith the fair value of the investments, and the Trustees may appoint others, such as the Trust's Adviser or a valuation committee, to assist the Trustees in determining fair value and to make the actual calculations pursuant to the fair valuation methodologies previously approved by the Trustees. Under procedures approved by the Trustees, the Trust's Adviser has formed a Valuation Committee whose members are approved by the Trustees. The Valuation Committee provides administration and oversight of the Trust's valuation policies and procedures, which are reviewed at least annually by the Trustees. These procedures allow the Trust to utilize independent pricing services, quotations from securities and financial instrument dealers, and other market sources to determine fair value.
The Trust has procedures to determine the fair value of securities and other financial instruments for which market prices are not readily available. Under these procedures, the Valuation Committee convenes on a regular and ad hoc basis to review such securities and considers a number of factors, including valuation methodologies and significant unobservable valuation inputs, when arriving at fair value. The Valuation Committee may employ a market-based approach which may use related or comparable assets or liabilities, recent transactions, market multiples, book values, and other relevant information for the investment to determine the fair value of the investment. An income-based valuation approach may also be used in which the anticipated future cash flows of the investment are discounted to calculate fair value. Discounts may also be applied due to the nature or duration of any restrictions on the disposition of the investments. Due to the inherent uncertainty of valuations of such investments, the fair values may differ significantly from the values that would have been used had an active market existed. The Valuation Committee employs various methods for calibrating these valuation approaches including a regular review of valuation methodologies, key inputs and assumptions, transactional back-testing or disposition analysis, and reviews of any related market activity.
37
Morgan Stanley Institutional Fund Trust
Annual Report — September 30, 2017
Notes to Consolidated Financial Statements (cont'd)
2. Fair Value Measurement: Financial Accounting Standards Board ("FASB") Accounting Standards CodificationTM ("ASC") 820, "Fair Value Measurement" ("ASC 820"), defines fair value as the value that the Fund would receive to sell an investment or pay to transfer a liability in a timely transaction with an independent buyer in the principal market, or in the absence of a principal market, the most advantageous market for the investment or liability. ASC 820 establishes a three-tier hierarchy to distinguish between (1) inputs that reflect the assumptions market participants would use in valuing an asset or liability developed based on market data obtained from sources independent of the reporting entity (observable inputs) and (2) inputs that reflect the reporting entity's own assumptions about the assumptions market participants would use in valuing an asset or liability developed based on the best information available in the circumstances (unobservable inputs) and to establish classification of fair value measurements for disclosure purposes. Various inputs are used in determining the value of the Fund's investments. The inputs are summarized in the three broad levels listed below.
• Level 1 – unadjusted quoted prices in active markets for identical investments
• Level 2 – other significant observable inputs (including quoted prices for similar investments, interest rates, prepayment speeds, credit risk, etc.)
• Level 3 – significant unobservable inputs including the Fund's own assumptions in determining the fair value of investments. Factors considered in making this determination may include, but are not limited to, information obtained by contacting the issuer, analysts, or the appropriate stock exchange (for exchange-traded securities), analysis of the issuer's financial statements or other available documents and, if necessary, available information concerning other securities in similar circumstances
The inputs or methodology used for valuing securities are not necessarily an indication of the risk associated with investing in those securities and the determination of the significance of a particular input to the fair value measurement in its entirety requires judgment and considers factors specific to each security.
The following is a summary of the inputs used to value the Fund's investments as of September 30, 2017.
Investment Type | | Level 1
Unadjusted
quoted
prices
(000) | | Level 2
Other
significant
observable
inputs
(000) | | Level 3
Significant
unobservable
inputs
(000) | | Total
(000) | |
Assets: | |
Fixed Income Securities | |
Agency Fixed Rate
Mortgages | | $ | — | | | $ | 578 | | | $ | — | | | $ | 578 | | |
Commercial
Mortgage-Backed
Securities | | | — | | | | 235 | | | | — | | | | 235 | | |
Corporate Bonds | | | — | | | | 1,659 | | | | — | | | | 1,659 | | |
Sovereign | | | — | | | | 4,389 | | | | — | | | | 4,389 | | |
U.S. Treasury Securities | | | — | | | | 775 | | | | — | | | | 775 | | |
Total Fixed Income Securities | | | — | | | | 7,636 | | | | — | | | | 7,636 | | |
Common Stocks | |
Aerospace & Defense | | | 25 | | | | — | | | | — | | | | 25 | | |
Air Freight & Logistics | | | 5 | | | | — | | | | — | | | | 5 | | |
Airlines | | | 1 | | | | — | | | | — | | | | 1 | | |
Auto Components | | | 16 | | | | — | | | | — | | | | 16 | | |
Automobiles | | | 106 | | | | — | | | | — | | | | 106 | | |
Banks | | | 750 | | | | — | | | | — | | | | 750 | | |
Beverages | | | 37 | | | | — | | | | — | | | | 37 | | |
Biotechnology | | | 10 | | | | — | | | | — | | | | 10 | | |
Building Products | | | 47 | | | | — | | | | — | | | | 47 | | |
Capital Markets | | | 79 | | | | — | | | | — | | | | 79 | | |
Chemicals | | | 37 | | | | — | | | | — | | | | 37 | | |
Commercial Services &
Supplies | | | 16 | | | | — | | | | — | | | | 16 | | |
Communications
Equipment | | | 3 | | | | — | | | | — | | | | 3 | | |
Construction & Engineering | | | 164 | | | | — | | | | — | | | | 164 | | |
Construction Materials | | | 24 | | | | — | | | | — | | | | 24 | | |
Consumer Finance | | | 161 | | | | — | | | | — | | | | 161 | | |
Containers & Packaging | | | 2 | | | | — | | | | — | | | | 2 | | |
Diversified Financial
Services | | | 3 | | | | — | | | | — | | | | 3 | | |
Diversified
Telecommunication
Services | | | 39 | | | | — | | | | — | | | | 39 | | |
Electric Utilities | | | 127 | | | | — | | | | — | | | | 127 | | |
Electrical Equipment | | | 23 | | | | — | | | | — | | | | 23 | | |
Electronic Equipment,
Instruments &
Components | | | — | @ | | | — | | | | — | | | | — | @ | |
Energy Equipment &
Services | | | — | @ | | | — | | | | — | | | | — | @ | |
Equity Real Estate
Investment Trusts (REITs) | | | 685 | | | | — | | | | — | | | | 685 | | |
Food & Staples Retailing | | | 35 | | | | — | | | | — | | | | 35 | | |
38
Morgan Stanley Institutional Fund Trust
Annual Report — September 30, 2017
Notes to Consolidated Financial Statements (cont'd)
Investment Type | | Level 1
Unadjusted
quoted
prices
(000) | | Level 2
Other
significant
observable
inputs
(000) | | Level 3
Significant
unobservable
inputs
(000) | | Total
(000) | |
Common Stocks (cont'd) | |
Food Products | | $ | 39 | | | $ | — | | | $ | — | | | $ | 39 | | |
Gas Utilities | | | 54 | | | | — | | | | — | | | | 54 | | |
Health Care Equipment &
Supplies | | | 14 | | | | — | | | | — | | | | 14 | | |
Health Care Providers &
Services | | | 11 | | | | — | | | | — | | | | 11 | | |
Health Care Technology | | | — | @ | | | — | | | | — | | | | — | @ | |
Hotels, Restaurants &
Leisure | | | 71 | | | | — | | | | — | | | | 71 | | |
Household Durables | | | 4 | | | | — | | | | — | | | | 4 | | |
Household Products | | | 15 | | | | — | | | | — | | | | 15 | | |
Independent Power and
Renewable Electricity
Producers | | | 1 | | | | — | | | | — | | | | 1 | | |
Industrial Conglomerates | | | 23 | | | | — | | | | — | | | | 23 | | |
Information Technology
Services | | | 111 | | | | — | | | | — | | | | 111 | | |
Insurance | | | 75 | | | | — | | | | — | | | | 75 | | |
Internet & Direct
Marketing Retail | | | 1 | | | | — | | | | — | | | | 1 | | |
Internet Software &
Services | | | 1 | | | | — | | | | — | | | | 1 | | |
Life Sciences Tools &
Services | | | 2 | | | | — | | | | — | | | | 2 | | |
Machinery | | | 5 | | | | — | | | | — | | | | 5 | | |
Marine | | | 3 | | | | — | | | | — | | | | 3 | | |
Media | | | 53 | | | | — | | | | — | | | | 53 | | |
Metals & Mining | | | 60 | | | | — | | | | — | | | | 60 | | |
Multi-Line Retail | | | 3 | | | | — | | | | — | | | | 3 | | |
Multi-Utilities | | | 126 | | | | — | | | | — | | | | 126 | | |
Oil, Gas & Consumable
Fuels | | | 417 | | | | — | | | | — | | | | 417 | | |
Paper & Forest Products | | | 4 | | | | — | | | | — | | | | 4 | | |
Personal Products | | | 31 | | | | — | | | | — | | | | 31 | | |
Pharmaceuticals | | | 107 | | | | — | | | | — | | | | 107 | | |
Professional Services | | | 116 | | | | — | | | | — | | | | 116 | | |
Real Estate Management &
Development | | | 205 | | | | — | | | | — | | | | 205 | | |
Road & Rail | | | 36 | | | | — | | | | — | | | | 36 | | |
Semiconductors &
Semiconductor
Equipment | | | 12 | | | | — | | | | — | @ | | | 12 | | |
Software | | | 12 | | | | — | | | | — | | | | 12 | | |
Specialty Retail | | | 7 | | | | — | | | | — | | | | 7 | | |
Tech Hardware, Storage &
Peripherals | | | 3 | | | | — | | | | — | | | | 3 | | |
Textiles, Apparel &
Luxury Goods | | | 35 | | | | — | | | | — | | | | 35 | | |
Tobacco | | | 23 | | | | — | | | | — | | | | 23 | | |
Trading Companies &
Distributors | | | 21 | | | | — | | | | — | | | | 21 | | |
Transportation
Infrastructure | | | 182 | | | | — | | | | — | | | | 182 | | |
Water Utilities | | | 46 | | | | — | | | | — | | | | 46 | | |
Wireless
Telecommunication
Services | | | 20 | | | | — | | | | — | | | | 20 | | |
Total Common Stocks | | | 4,344 | | | | — | | | | — | @ | | | 4,344 | | |
Investment Type | | Level 1
Unadjusted
quoted
prices
(000) | | Level 2
Other
significant
observable
inputs
(000) | | Level 3
Significant
unobservable
inputs
(000) | | Total
(000) | |
Investment Companies | | $ | 1,316 | | | $ | — | | | $ | — | | | $ | 1,316 | | |
Rights | | | — | | | | — | @ | | | — | | | | — | @ | |
Short-Term Investments | |
Investment Company | | | 1,909 | | | | — | | | | — | | | | 1,909 | | |
U.S. Treasury Security | | | — | | | | 379 | | | | — | | | | 379 | | |
Total Short-Term
Investments | | | 1,909 | | | | 379 | | | | — | | | | 2,288 | | |
Foreign Currency
Forward Exchange
Contracts | | | — | | | | 117 | | | | — | | | | 117 | | |
Futures Contracts | | | 75 | | | | — | | | | — | | | | 75 | | |
Credit Default Swap
Agreements | | | — | | | | 9 | | | | — | | | | 9 | | |
Interest Rate Swap
Agreements | | | — | | | | 13 | | | | — | | | | 13 | | |
Total Return Swap
Agreements | | | — | | | | 7 | | | | — | | | | 7 | | |
Total Assets | | | 7,644 | | | | 8,161 | | | | — | | | | 15,805 | | |
Liabilities: | |
Foreign Currency Forward
Exchange
Contracts | | | — | | | | (89 | ) | | | — | | | | (89 | ) | |
Futures Contracts | | | (13 | ) | | | — | | | | — | | | | (13 | ) | |
Interest Rate Swap
Agreements | | | — | | | | (5 | ) | | | — | | | | (5 | ) | |
Total Return Swap
Agreements | | | — | | | | (13 | ) | | | — | | | | (13 | ) | |
Total Liabilities | | | (13 | ) | | | (107 | ) | | | — | | | | (120 | ) | |
Total | | $ | 7,631 | | | $ | 8,054 | | | $ | — | @ | | $ | 15,685 | | |
@ Value is less than $500.
Transfers between investment levels may occur as the markets fluctuate and/or the availability of data used in an investment's valuation changes. The Fund recognizes transfers between the levels as of the end of the period. As of September 30, 2017, the Fund did not have any investments transfer between investment levels.
39
Morgan Stanley Institutional Fund Trust
Annual Report — September 30, 2017
Notes to Consolidated Financial Statements (cont'd)
Following is a reconciliation of investments in which significant unobservable inputs (Level 3) were used in determining fair value.
| | | Common
Stocks
(000) | |
Beginning Balance | | $ | — | @ | |
Purchases | | | — | | |
Sales | | | — | | |
Amortization of discount | | | — | | |
Transfers in | | | — | | |
Transfers out | | | — | | |
Corporate actions | | | — | | |
Change in unrealized appreciation (depreciation) | | | (— | @) | |
Realized gains (losses) | | | — | | |
Ending Balance | | $ | — | @ | |
Net change in unrealized appreciation (depreciation) from investments
still held as of September 30, 2017 | | $ | (— | @) | |
@ Value is less than $500.
3. Foreign Currency Translation and Foreign Investments: The books and records of the Fund are maintained in U.S. dollars. Foreign currency amounts are translated into U.S. dollars as follows:
– investments, other assets and liabilities at the prevailing rate of exchange on the valuation date;
– investment transactions and investment income at the prevailing rates of exchange on the dates of such transactions.
Although the net assets of the Fund are presented at the foreign exchange rates and market values at the close of the period, the Fund does not isolate that portion of the results of operations arising as a result of changes in the foreign exchange rates from the fluctuations arising from changes in the market prices of securities held at period end. Similarly, the Fund does not isolate the effect of changes in foreign exchange rates from the fluctuations arising from changes in the market prices of securities sold during the period. Accordingly, realized and unrealized foreign currency gains (losses) on investments in securities are included in the reported net realized and unrealized gains (losses) on investment transactions and balances. However, pursuant to U.S. federal income tax regulations, gains and losses from certain foreign currency transactions and the foreign currency portion of gains and losses realized on sales and maturities of foreign denominated debt securities are treated as ordinary income for U.S. federal income tax purposes.
Net realized gains (losses) on foreign currency transactions represent net foreign exchange gains (losses) from foreign currency forward exchange contracts, disposition of foreign currencies, currency gains (losses) realized between the trade and settlement dates on securities transactions, and the difference between the amount of investment income and foreign withholding taxes recorded on the Fund's books and the U.S. dollar equivalent amounts actually received or paid. Net unrealized currency gains (losses) from valuing foreign currency denominated assets and liabilities at period end exchange rates are reflected as a component of unrealized appreciation (depreciation) in the Consolidated Statement of Assets and Liabilities. The change in unrealized currency gains (losses) on foreign currency translations for the period is reflected in the Consolidated Statement of Operations.
Foreign security and currency transactions may involve certain considerations and risks not typically associated with those of U.S. dollar denominated transactions as a result of, among other factors, fluctuations of exchange rates in relation to the U.S. dollar, the possibility of lower levels of governmental supervision and regulation of foreign securities markets and the possibility of political or economic instability.
Governmental approval for foreign investments may be required in advance of making an investment under certain circumstances in some countries, and the extent of foreign investments in domestic companies may be subject to limitation in other countries. Foreign ownership limitations also may be imposed by the charters of individual companies to prevent, among other concerns, violations of foreign investment limitations. As a result, an additional class of shares (identified as "Foreign" in the Consolidated Portfolio of Investments) may be created and offered for investment. The "local" and "foreign shares" market values may differ. In the absence of trading of the foreign shares in such markets, the Fund values the foreign shares at the closing exchange price of the local shares.
4. Derivatives: The Fund may, but is not required to, use derivative instruments for a variety of purposes, including hedging, risk management, portfolio management or to earn income. Derivatives are financial instruments whose value is based, in part, on the value of an underlying asset, interest rate, index or financial instrument. Prevailing
40
Morgan Stanley Institutional Fund Trust
Annual Report — September 30, 2017
Notes to Consolidated Financial Statements (cont'd)
interest rates and volatility levels, among other things, also affect the value of derivative instruments. A derivative instrument often has risks similar to its underlying asset and may have additional risks, including imperfect correlation between the value of the derivative and the underlying asset, risks of default by the counterparty to certain transactions, magnification of losses incurred due to changes in the market value of the securities, instruments, indices or interest rates to which the derivative instrument relates, risks that the transactions may not be liquid and risks arising from margin requirements. The use of derivatives involves risks that are different from, and possibly greater than, the risks associated with other portfolio investments. Derivatives may involve the use of highly specialized instruments that require investment techniques and risk analyses different from those associated with other portfolio investments. All of the Fund's holdings, including derivative instruments, are marked-to-market each day with the change in value reflected in unrealized appreciation (depreciation). Upon disposition, a realized gain or loss is recognized.
Certain derivative transactions may give rise to a form of leverage. Leverage magnifies the potential for gain and the risk of loss. Leverage associated with derivative transactions may cause the Fund to liquidate portfolio positions when it may not be advantageous to do so to satisfy its obligations or to meet earmarking or segregation requirements, pursuant to applicable Securities and Exchange Commission ("SEC") rules and regulations, or may cause the Fund to be more volatile than if the Fund had not been leveraged. Although the Adviser seeks to use derivatives to further the Fund's investment objectives, there is no assurance that the use of derivatives will achieve this result.
Following is a description of the derivative instruments and techniques that the Fund used during the period and their associated risks:
Futures: A futures contract is a standardized, exchange-traded agreement to buy or sell a specific quantity of an underlying asset, reference rate or index at a specific price at a specific future time. The value of a futures contract tends to increase and decrease in tandem with the value of the underlying instrument. Depending on the terms of the particular contract, futures contracts are settled through either physical delivery of the underlying instrument on the settlement date or by payment of a
cash settlement amount on the settlement date. During the period the futures contract is open, payments are received from or made to the broker based upon changes in the value of the contract (the variation margin). A decision as to whether, when and how to use futures contracts involves the exercise of skill and judgment and even a well-conceived futures transaction may be unsuccessful because of market behavior or unexpected events. In addition to the derivatives risks discussed above, the prices of futures contracts can be highly volatile, using futures contracts can lower total return, and the potential loss from futures contracts can exceed the Fund's initial investment in such contracts. No assurance can be given that a liquid market will exist for any particular futures contract at any particular time. There is also the risk of loss by the Fund of margin deposits in the event of bankruptcy of a broker with which the Fund has open positions in the futures contract.
Swaps: The Fund may enter into OTC swap contracts or cleared swap transactions. A swap contract is an agreement between two parties pursuant to which the parties exchange payments at specified dates on the basis of a specified notional amount, with the payments calculated by reference to specified securities, indices, reference rates, currencies or other instruments. Typically swap agreements provide that when the period payment dates for both parties are the same, the payments are made on a net basis (i.e., the two payment streams are netted out, with only the net amount paid by one party to the other). The Fund's obligations or rights under a swap contract entered into on a net basis will generally be equal only to the net amount to be paid or received under the agreement, based on the relative values of the positions held by each party. Cleared swap transactions may help reduce counterparty credit risk. In a cleared swap, the Fund's ultimate counterparty is a clearinghouse rather than a swap dealer, bank or other financial institution. OTC swap agreements are not entered into or traded on exchanges and often there is no central clearing or guaranty function for OTC swaps. These OTC swaps are often subject to credit risk or the risk of default or non-performance by the counterparty. Both OTC and cleared swaps could result in losses if interest rates, foreign currency exchange rates or other factors are not correctly anticipated by the Fund or if the reference index, security or investments do not perform as
41
Morgan Stanley Institutional Fund Trust
Annual Report — September 30, 2017
Notes to Consolidated Financial Statements (cont'd)
expected. During the period swap agreements are open, payments are received from or made to the clearinghouse or counterparty based upon changes in the value of the contract (variation margin). The Dodd-Frank Wall Street Reform and Consumer Protection Act and related regulatory developments require the clearing and exchange-trading of certain standardized swap transactions. Mandatory exchange-trading and clearing is occurring on a phased-in basis.
The Fund's use of swaps during the period included those based on the credit of an underlying security commonly referred to as "credit default swaps." The Fund may be either the buyer or seller in a credit default swap. Where the Fund is the buyer of a credit default swap contract, it would typically be entitled to receive the par (or other agreed-upon) value of a referenced debt obligation from the counterparty to the contract only in the event of a default or similar event by the issuer of the debt obligation. If no default occurs, the Fund would have paid to the counterparty a periodic stream of payments over the term of the contract and received no benefit from the contract. When the Fund is the seller of a credit default swap contract, it typically receives the stream of payments but is obligated to pay an amount equal to the par (or other agreed-upon) value of a referenced debt obligation upon the default or similar event by the issuer of the referenced debt obligation. The use of credit default swaps could result in losses to the Fund if the Adviser fails to correctly evaluate the creditworthiness of the issuer of the referenced debt obligation.
If the Fund is a seller of protection and a credit event occurs, as defined under the terms of that particular swap agreement, the Fund will either (i) pay to the buyer of protection an amount equal to the notional amount of the swap agreement and take delivery of the referenced obligation, other deliverable obligations or underlying securities comprising the referenced index or (ii) pay a net settlement amount in the form of cash or securities equal to the notional amount of the swap agreement less the recovery value of the referenced obligation or underlying securities comprising the referenced index. If the Fund is a buyer of protection and a credit event occurs, as defined under the terms of that particular swap agreement, the Fund will either (i) receive from the seller of protection an amount equal to the notional amount of the swap agreement and deliver
the referenced obligation, other deliverable obligations or underlying securities comprising the referenced index or (ii) receive a net settlement amount in the form of cash or securities equal to the notional amount of the swap agreement less the recovery value of the referenced obligation or underlying securities comprising the referenced index. Recovery values are estimated by market makers considering either industry standard recovery rates or entity specific factors and considerations until a credit event occurs. If a credit event has occurred, the recovery value is determined by a facilitated auction whereby a minimum number of allowable broker bids, together with a specified valuation method, are used to calculate the settlement value. The Fund's maximum risk of loss from counterparty risk, either as the protection seller or as the protection buyer, is the fair value of the swap agreement.
The current credit rating of each individual issuer is listed in the table following the Consolidated Portfolio of Investments and serves as an indicator of the current status of the payment/performance risk of the credit derivative. Alternatively, for credit default swaps on an index of credits, the quoted market prices and current values serve as an indicator of the current status of the payment/performance risk of the credit derivative. Generally, lower credit ratings and increasing market values, in absolute terms, represent a deterioration of the credit and a greater likelihood of an adverse credit event of the issuer.
When the Fund has an unrealized loss on a swap agreement, the Fund has instructed the custodian to pledge cash or liquid securities as collateral with a value approximately equal to the amount of the unrealized loss. Collateral pledges are monitored and subsequently adjusted if and when the swap valuations fluctuate. If applicable, cash collateral is included with "Due from (to) Broker" in the Consolidated Statement of Assets and Liabilities.
Upfront payments paid or received by the Fund will be reflected as an asset or liability, respectively, in the Consolidated Statement of Assets and Liabilities.
Foreign Currency Forward Exchange Contracts: In connection with its investments in foreign securities, the Fund also entered into contracts with banks, brokers or dealers to purchase or sell securities or foreign currencies at a future date. A foreign currency forward exchange
42
Morgan Stanley Institutional Fund Trust
Annual Report — September 30, 2017
Notes to Consolidated Financial Statements (cont'd)
contract ("currency contract") is a negotiated agreement between the contracting parties to exchange a specified amount of currency at a specified future time at a specified rate. The rate can be higher or lower than the spot rate between the currencies that are the subject of the contract. Currency contracts may be used to protect against uncertainty in the level of future foreign currency exchange rates or to gain or modify exposure to a particular currency. In addition, the Fund may use cross currency hedging or proxy hedging with respect to currencies in which the Fund has or expects to have portfolio or currency exposure. Cross currency hedges involve the sale of one currency against the positive exposure to a different currency and may be used for hedging purposes or to establish an active exposure to the exchange rate between any two currencies. To the extent hedged by the use of currency contracts, the precise matching of the currency contract amounts and the value of the securities involved will not generally be possible because the future value of such securities in foreign currencies will change as a consequence of market movements in the value of those securities between the date on which the contract is entered into and the date it matures. Furthermore, such transactions may reduce or preclude the opportunity for gain if the value of the currency should move in the direction opposite to the position taken. There is additional risk to the extent that currency contracts create exposure to currencies in which the Fund's securities are not denominated. Unanticipated changes in currency prices may result in poorer overall performance for the Fund than if it had not entered into such contracts. The use of currency contracts involves the risk of loss from the insolvency or bankruptcy of the counterparty to the contract or the failure of the counterparty to make payments or otherwise comply with the terms of the contract. A currency contract is marked-to-market daily and the change in market value is recorded by the Fund as unrealized gain or loss. The Fund records realized gains (losses) when the currency contract is closed equal to the difference between the value of the currency contract at the time it was opened and the value at the time it was closed.
Options: With respect to options, the Fund is subject to equity risk, interest rate risk and foreign currency exchange risk in the normal course of pursuing its investment objectives. If the Fund buys an option, it buys a
legal contract giving it the right to buy or sell a specific amount of the underlying instrument or foreign currency, or futures contract on the underlying instrument or foreign currency, at an agreed-upon price during a period of time or on a specified date typically in exchange for a premium paid by the Fund. The Fund may purchase and/or sell put and call options. Purchasing call options tends to increase the Fund's exposure to the underlying (or similar) instrument. Purchasing put options tends to decrease the Fund's exposure to the underlying (or similar) instrument. When entering into purchased option contracts, the Fund bears the risk of interest or exchange rates or securities prices moving unexpectedly, in which case, the Fund may not achieve the anticipated benefits of the purchased option contracts; however the risk of loss is limited to the premium paid. Purchased options are reported as part of "Total Investments in Securities" in the Consolidated Statement of Assets and Liabilities. Premium paid for purchasing options which expired are treated as realized losses. If the Fund sells an option, it sells to another party the right to buy from or sell to the Fund a specific amount of the underlying instrument or foreign currency, or futures contract on the underlying instrument or foreign currency, at an agreed-upon price during a period of time or on a specified date typically in exchange for a premium received by the Fund. The Fund may write call and put options on stock indexes, futures, securities or currencies it owns or in which it may invest. Writing put options tend to increase the Fund's exposure to the underlying instrument. Writing call options tend to decrease the Fund's exposure to the underlying instruments. When the Fund writes a call or put option, an amount equal to the premium received is recorded as a liability. Any liability recorded is subsequently adjusted to reflect the current value of the options written. Premiums received from writing options which expire are treated as realized gains. Premiums received from writing options which are exercised or are closed are added to or offset against the proceeds or amount paid on the transaction to determine the net realized gain or loss. The Fund as a writer of an option has no control over whether the underlying future, security or currency may be sold (call) or purchased (put) and as a result bears the market risk of an unfavorable change in the price of the future, security or currency underlying the written option. When options are purchased OTC, the Fund bears the risk that the
43
Morgan Stanley Institutional Fund Trust
Annual Report — September 30, 2017
Notes to Consolidated Financial Statements (cont'd)
counterparty that wrote the option will be unable or unwilling to perform its obligations under the option contract. Options may also be illiquid and the Fund may have difficulty closing out its position. A decision as to whether, when and how to use options involves the exercise of skill and judgment and even a well-conceived option transaction may be unsuccessful because of market behavior or unexpected events. The prices of options can be highly volatile and the use of options can lower total returns.
As of September 30, 2017, the Fund did not have any outstanding purchased or written options.
FASB ASC 815, "Derivatives and Hedging" ("ASC 815"), is intended to improve financial reporting about derivative instruments by requiring enhanced disclosures to enable investors to better understand how and why the Fund uses derivative instruments, how these derivative instruments are accounted for and their effects on the Fund's financial position and results of operations.
The following tables set forth the fair value of the Fund's derivative contracts by primary risk exposure as of September 30, 2017.
| | | Asset Derivatives
Consolidated
Statement of Assets and
Liabilities Location | | Primary Risk
Exposure | | Value
(000) | |
Foreign Currency
Forward Exchange
Contracts | | Unrealized Appreciation on
Foreign Currency Forward
Exchange Contracts | |
Currency Risk | | $ | 117 | | |
Futures Contract
| | Variation Margin on
Futures Contracts | | Commodity Risk | | | 1 | (a) | |
Futures Contracts
| | Variation Margin on
Futures Contracts | | Equity Risk | | | 55 | (a) | |
Futures Contracts
| | Variation Margin on
Futures Contracts | | Interest Rate Risk | | | 19 | (a) | |
Swap Agreements
| | Unrealized Appreciation on
Swap Agreements | | Equity Risk | | | 7 | | |
Swap Agreements
| | Variation Margin on
Swap Agreements | | Credit Risk | | | 9 | (a) | |
Swap Agreements
| | Variation Margin on
Swap Agreements | | Interest Rate Risk | | | 13 | (a) | |
Total | | | | | | $ | 221 | | |
| | | Liability Derivatives
Consolidated
Statement of Assets and
Liabilities Location | | Primary Risk
Exposure | | Value
(000) | |
Foreign Currency
Forward Exchange
Contracts | | Unrealized Depreciation on
Foreign Currency Forward
Exchange Contracts | |
Currency Risk | | $ | (89 | ) | |
Futures Contracts
| | Variation Margin on
Futures Contracts | | Equity Risk | | | (3 | )(a) | |
Futures Contracts
| | Variation Margin on
Futures Contracts | | Interest Rate Risk | | | (10 | )(a) | |
Swap Agreements
| | Unrealized Depreciation on
Swap Agreements | | Equity Risk | | | (13 | ) | |
Swap Agreements
| | Unrealized Depreciation on
Swap Agreements | | Interest Rate Risk | | | (1 | ) | |
Swap Agreements
| | Variation Margin on
Swap Agreements | | Interest Rate Risk | | | (4 | )(a) | |
Total | | | | | | $ | (120 | ) | |
(a) This amount represents the cumulative appreciation (depreciation) as reported in the Consolidated Portfolio of Investments. The Consolidated Statement of Assets and Liabilities only reflects the current day's net variation margin.
The following tables set forth by primary risk exposure the Fund's realized gains (losses) and change in unrealized appreciation (depreciation) by type of derivative contract for the year ended September 30, 2017 in accordance with ASC 815.
Realized Gain (Loss) | |
Primary Risk Exposure | | Derivative Type | | Value
(000) | |
Currency Risk | | Options Purchased | | $ | 2 | (b) | |
Equity Risk | | Options Written | | | (194 | ) | |
Currency Risk
| | Foreign Currency Forward
Exchange Contracts | | |
(131 | ) | |
Commodity Risk | | Futures Contracts | | | (27 | ) | |
Equity Risk | | Futures Contracts | | | 283 | | |
Interest Rate Risk | | Futures Contracts | | | 46 | | |
Credit Risk | | Swap Agreements | | | 33 | | |
Equity Risk | | Swap Agreements | | | (17 | ) | |
Interest Rate Risk | | Swap Agreements | | | (143 | ) | |
Total | | | | $ | (148 | ) | |
Change in Unrealized Appreciation (Depreciation) | |
Primary Risk Exposure | | Derivative Type | | Value
(000) | |
Currency Risk | | Options Written | | $ | 4 | | |
Currency Risk
| | Foreign Currency Forward
Exchange Contracts | | |
18 | | |
Commodity Risk | | Futures Contracts | | | (5 | ) | |
Equity Risk | | Futures Contracts | | | 42 | | |
Interest Rate Risk | | Futures Contracts | | | 11 | | |
Equity Risk | | Swap Agreements | | | (1 | ) | |
Credit Risk | | Swap Agreements | | | — | @ | |
Interest Rate Risk | | Swap Agreements | | | (24 | ) | |
Total | | | | $ | 45 | | |
(b) Amounts are included in Investments in the Consolidated Statement of Operations
@ Value is less than $500.
44
Morgan Stanley Institutional Fund Trust
Annual Report — September 30, 2017
Notes to Consolidated Financial Statements (cont'd)
At September 30, 2017, the Fund's derivative assets and liabilities are as follows:
Gross Amounts of Assets and Liabilities Presented in the
Consolidated Statement of Assets and Liabilities | |
Derivatives(c) | | Assets(d)
(000) | | Liabilities(d)
(000) | |
Foreign Currency Forward Exchange Contracts | | $ | 117 | | | $ | (89 | ) | |
Swap Agreements | | | 7 | | | | (14 | ) | |
Total | | $ | 124 | | | $ | (103 | ) | |
(c) Excludes exchange traded derivatives.
(d) Absent an event of default or early termination, OTC derivative assets and liabilities are presented gross and not offset in the Consolidated Statement of Assets and Liabilities.
The Fund typically enters into International Swaps and Derivatives Association, Inc. Master Agreements ("ISDA Master Agreements") or similar master agreements (collectively, "Master Agreements") with its contract counterparties for certain OTC derivatives in order to, among other things, reduce its credit risk to counterparties. ISDA Master Agreements include provisions for general obligations, representations, collateral and events of default or termination. Under an ISDA Master Agreement, the Fund typically may offset with the counterparty certain OTC derivative financial instruments' payables and/or receivables with collateral held and/or posted and create one single net payment (close-out netting) in the event of default, termination and/or potential deterioration in the credit quality of the counterparty. Various Master Agreements govern the terms of certain transactions with counterparties, including transactions such as swap, forward, repurchase and reverse repurchase agreements. These Master Agreements typically attempt to reduce the counterparty risk associated with such transactions by specifying credit protection mechanisms and providing standardization that improves legal certainty. Cross-termination provisions under Master Agreements typically provide that a default in connection with one transaction between the Fund and a counterparty gives the non-defaulting party the right to terminate any other transactions in place with the defaulting party to create one single net payment due to/due from the defaulting party and may be a feature in certain Master Agreements. In the event the Fund exercises its right to terminate a Master Agreement after a counterparty experiences a termination event as defined in the Master Agreement, the return of collateral with market value in excess of the Fund's net liability may be delayed or denied.
The following tables present derivative financial instruments that are subject to enforceable netting arrangements as of September 30, 2017.
Gross Amounts Not Offset in the Consolidated Statement of Assets and Liabilities | |
Counterparty | | Gross Asset
Derivatives
Presented in
Consolidated
Statement of
Assets and
Liabilities
(000) | | Financial
Instrument
(000) | | Collateral
Received
(000) | | Net Amount
(not less
than $0)
(000) | |
Australia and New Zealand
Banking Group | | $ | 2 | | | $ | (— | @) | | $ | — | | | $ | 2 | | |
Bank of America NA | | | 1 | | | | (— | @) | | | — | | | | 1 | | |
Bank of Montreal | | | 1 | | | | (— | @) | | | — | | | | 1 | | |
Barclays Bank PLC | | | 9 | | | | (5 | ) | | | — | | | | 4 | | |
Citibank NA | | | 82 | | | | (64 | ) | | | — | | | | 18 | | |
Commonwealth Bank of Australia | | | 2 | | | | (1 | ) | | | — | | | | 1 | | |
Credit Suisse International | | | — | @ | | | (— | @) | | | — | | | | 0 | | |
Goldman Sachs International | | | 3 | | | | (3 | ) | | | — | | | | 0 | | |
HSBC Bank PLC | | | — | @ | | | (— | @) | | | — | | | | 0 | | |
JPMorgan Chase Bank NA | | | 20 | | | | (18 | ) | | | — | | | | 2 | | |
State Street Bank and Trust Co. | | | 2 | | | | (2 | ) | | | — | | | | 0 | | |
UBS AG | | | 2 | | | | (2 | ) | | | — | | | | 0 | | |
Total | | $ | 124 | | | $ | (95 | ) | | $ | — | | | $ | 29 | | |
Gross Amounts Not Offset in the Consolidated Statement of Assets and Liabilities | |
Counterparty | | Gross Liability
Derivatives
Presented in
Consolidated
Statement of
Assets and
Liabilities
(000) | | Financial
Instrument
(000) | | Collateral
Pledged
(000) | | Net Amount
(not less
than $0)
(000) | |
Australia and New Zealand
Banking Group | | $ | — | @ | | $ | (— | @) | | $ | — | | | $ | 0 | | |
Bank of America NA | | | — | @ | | | (— | @) | | | — | | | | 0 | | |
Bank of Montreal | | | — | @ | | | (— | @) | | | — | | | | 0 | | |
Barclays Bank PLC | | | 5 | | | | (5 | ) | | | — | | | | 0 | | |
Citibank NA | | | 64 | | | | (64 | ) | | | — | | | | 0 | | |
Commonwealth Bank of Australia | | | 1 | | | | (1 | ) | | | — | | | | 0 | | |
Credit Suisse International | | | — | @ | | | (— | @) | | | — | | | | 0 | | |
Goldman Sachs International | | | 3 | | | | (3 | ) | | | — | | | | 0 | | |
HSBC Bank PLC | | | 1 | | | | (— | @) | | | — | | | | 1 | | |
JPMorgan Chase Bank NA | | | 18 | | | | (18 | ) | | | — | | | | 0 | | |
State Street Bank and Trust Co. | | | 9 | | | | (2 | ) | | | — | | | | 7 | | |
UBS AG | | | 2 | | | | (2 | ) | | | — | | | | 0 | | |
Total | | $ | 103 | | | $ | (95 | ) | | $ | — | | | $ | 8 | | |
@ Amount is less than $500.
45
Morgan Stanley Institutional Fund Trust
Annual Report — September 30, 2017
Notes to Consolidated Financial Statements (cont'd)
For the year ended September 30, 2017, the approximate average monthly amount outstanding for each derivative type is as follows:
Foreign Currency Forward Exchange Contracts: | |
Average monthly principal amount | | $ | 9,508,000 | | |
Futures Contracts: | |
Average monthly original value | | $ | 9,641,000 | | |
Swap Agreements: | |
Average monthly notional amount | | $ | 2,263,000 | | |
Options Purchased: | |
Average monthly notional amount | | | — | @@ | |
Options Written: | |
Average monthly notional amount | | | 3,000 | | |
@@ Amount is less than 500.
5. When-Issued/Delayed Delivery Securities: The Fund purchases and sells when-issued and delayed delivery securities. Securities purchased on a when-issued or delayed delivery basis are purchased for delivery beyond the normal settlement date at a stated price and yield, and no income accrues to the Fund on such securities prior to delivery date. Payment and delivery for when-issued and delayed delivery securities can take place a month or more after the date of the transaction. When the Fund enters into a purchase transaction on a when-issued or delayed delivery basis, securities are available for collateral in an amount at least equal in value to the Fund's commitments to purchase such securities. Purchasing securities on a when-issued or delayed delivery basis may involve a risk that the market price at the time of delivery may be lower than the agreed upon purchase price, in which case there could be an unrealized loss at the time of delivery. Purchasing investments on a when-issued or delayed delivery basis may be considered a form of leverage which may increase the impact that gains (losses) may have on the Fund.
6. Indemnifications: The Trust enters into contracts that contain a variety of indemnifications. The Trust's maximum exposure under these arrangements is unknown. However, the Trust has not had prior claims or losses pursuant to these contracts and expects the risk of loss to be remote.
7. Dividends and Distributions to Shareholders: Dividends and distributions to shareholders are recorded on the ex-dividend date. Dividends from net investment income, if any, are declared and paid quarterly. Net realized capital gains, if any, are distributed at least annually.
8. Security Transactions, Income and Expenses: Security transactions are accounted for on the trade date (date the order to buy or sell is executed). Realized gains and losses on the sale of investment securities are determined on the specific identified cost method. Dividend income and other distributions are recorded on the ex-dividend date (except for certain foreign dividends which may be recorded as soon as the Fund is informed of such dividends) net of applicable withholding taxes. Interest income is recognized on the accrual basis except where collection is in doubt. Discounts are accreted and premiums are amortized over the life of the respective securities. Most expenses of the Trust can be directly attributed to a particular Fund. Expenses which cannot be directly attributed are apportioned among the Funds based upon relative net assets or other appropriate methods. Income, expenses (other than class specific expenses — distribution and shareholder services, transfer agency and sub transfer agency fees) and realized and unrealized gains or losses are allocated to each class of shares based upon their relative net assets.
The Fund owns shares of real estate investment trusts ("REITs") which report information on the source of their distributions annually in the following calendar year. A portion of distributions received from REITs during the year is estimated to be a return of capital and is recorded as a reduction of their cost.
B. Advisory Fees: The Adviser, a wholly-owned subsidiary of Morgan Stanley, provides the Fund with advisory services under the terms of an Investment Advisory Agreement, paid quarterly, at an annual rate of 0.65% of the average daily net assets of the Fund.
The Adviser has agreed to reduce its advisory fee and/or reimburse the Fund so that total annual portfolio operating expenses, excluding certain investment related expenses, taxes, interest and other extraordinary expenses (including litigation), will not exceed 0.95% for Class I shares, 1.30% for Class A shares, 2.05% for Class C shares and 0.90% for Class IS shares. The fee waivers and/or expense reimbursements will continue for at least one year from the date of the Fund's prospectus or until such time as the Trustees act to discontinue all or a portion of such waivers and/or reimbursements when they deem such action is appropriate. For the year ended September 30, 2017, approximately $96,000 of advisory fees were waived and approximately $472,000 of other expenses were reimbursed by the Adviser pursuant to this arrangement.
46
Morgan Stanley Institutional Fund Trust
Annual Report — September 30, 2017
Notes to Consolidated Financial Statements (cont'd)
C. Administration Fees: The Adviser also serves as Administrator to the Trust and provides administrative services pursuant to an Administration Agreement for an annual fee, accrued daily and paid monthly, of 0.08% of the Fund's average daily net assets. Under a Sub-Administration Agreement between the Administrator and State Street Bank and Trust Company ("State Street"), State Street provides certain administrative services to the Trust. For such services, the Administrator pays State Street a portion of the fee the Administrator receives from the Fund.
D. Distribution and Shareholder Services Fees: Morgan Stanley Distribution, Inc. ("MSDI" or the "Distributor"), a wholly-owned subsidiary of the Adviser, and an indirect subsidiary of Morgan Stanley, serves as the Trust's Distributor of Fund shares pursuant to a Distribution Agreement. The Trust has adopted a Shareholder Services Plan with respect to Class A shares pursuant to Rule 12b-1 under the Act. Under the Shareholder Services Plan, the Fund pays the Distributor a shareholder services fee, accrued daily and paid monthly, at an annual rate of 0.25% of the Fund's average daily net assets attributable to Class A shares.
The Trust has adopted a Distribution and Shareholder Services Plan with respect to Class C shares pursuant to Rule 12b-1 under the Act. Under the Distribution and Shareholder Services Plan, the Fund pays the Distributor a distribution fee, accrued daily and paid monthly, at an annual rate of 0.75% and a shareholder services fee, accrued daily and paid monthly, at an annual rate of 0.25% of the Fund's average daily net assets attributable to Class C shares.
The distribution and shareholder services fees are used to support the expenses associated with servicing and maintaining accounts. The Distributor may compensate other parties for providing shareholder support services to investors who purchase Class A and Class C shares.
E. Dividend Disbursing and Transfer Agent: The Trust's dividend disbursing and transfer agent is Boston Financial Data Services, Inc. ("BFDS"). Pursuant to a Transfer Agency Agreement, the Trust pays BFDS a fee based on the number of classes, accounts and transactions relating to the Funds of the Trust.
F. Custodian Fees: State Street (the "Custodian") serves as Custodian for the Trust in accordance with a Custodian Agreement. The Custodian holds cash, securities, and other assets of the Trust as required by the Act. Custody fees are payable monthly based on assets held in custody, investment purchases
and sales activity and account maintenance fees, plus reimbursement for certain out-of-pocket expenses.
G. Security Transactions and Transactions with Affiliates: For the year ended September 30, 2017, purchases and sales of investment securities for the Fund, other than long-term U.S. Government securities and short-term investments, were approximately $11,999,000 and $12,771,000, respectively. For the year ended September 30, 2017, purchases and sales of long-term U.S. Government securities were approximately $16,561,000 and $16,739,000, respectively.
The Fund invests in the Institutional Class of the Morgan Stanley Institutional Liquidity Funds — Government Portfolio (the "Liquidity Funds"), an open-end management investment company managed by the Adviser. Advisory fees paid by the Fund are reduced by an amount equal to its pro-rata share of the advisory and administration fees paid by the Fund due to its investment in the Liquidity Funds. For the year ended September 30, 2017, advisory fees paid were reduced by approximately $2,000 relating to the Fund's investment in the Liquidity Funds.
The Fund invests in Morgan Stanley Institutional Fund, Inc. — Emerging Markets Fixed Income Opportunities Portfolio ("Emerging Markets Fixed Income Opportunities Portfolio"), an open-end management investment company advised by an affiliate of the Adviser. Advisory fees paid by the Fund are reduced by an amount equal to its pro-rata share of the advisory and administration fees paid by the Emerging Markets Fixed Income Opportunities Portfolio. For the year ended September 30, 2017, advisory fees paid were reduced by approximately $1,000 relating to the Fund's investment in the Emerging Markets Fixed Income Opportunities Portfolio. The Emerging Markets Fixed Income Opportunities Portfolio has a cost basis of approximately $711,000 at September 30, 2017.
The Fund invests in Morgan Stanley Institutional Fund Trust — High Yield Portfolio ("High Yield Portfolio"), an open-end management investment company advised by an affiliate of the Adviser. Advisory fees paid by the Fund are reduced by an amount equal to its pro-rata share of the advisory and administration fees paid by the High Yield Portfolio. For the year ended September 30, 2017, advisory fees paid were reduced by approximately $1,000 relating to the Fund's investment in the High Yield Portfolio. The High Yield Portfolio has a cost basis of approximately $550,000 at September 30, 2017.
47
Morgan Stanley Institutional Fund Trust
Annual Report — September 30, 2017
Notes to Consolidated Financial Statements (cont'd)
A summary of the Fund's transactions in share of the affiliated investments companies during the year ended September 30, 2017 are as follows:
Affiliated
Investment
Company | | Value
September 30,
2016
(000) | | Purchases
at Cost
(000) | | Proceeds
from Sales
(000) | | Dividend
Income
(000) | |
Liquidity Funds | | $ | 1,103 | | | $ | 10,649 | | | $ | 9,843 | | | $ | 9 | | |
Emerging Markets
Fixed Income
Opportunities
Portfolio | | | 747 | | | | — | | | | — | | | | 42 | | |
High Yield Portfolio | | | 690 | | | | — | | | | 150 | | | | 38 | | |
| | | $ | 2,540 | | | $ | 10,649 | | | $ | 9,993 | | | $ | 89 | | |
Affiliated
Investment
Company (cont'd) | | Realized
Loss
(000) | | Change in
Unrealized
Appreciation
(Depreciation)
(000) | | Value
September 30,
2017
(000) | |
Liquidity Funds | | $ | — | | | $ | — | | | $ | 1,909 | | |
Emerging Markets
Fixed Income
Opportunities
Portfolio | | | — | | | | 15 | | | | 762 | | |
High Yield Portfolio | | | (8 | ) | | | 20 | | | | 551 | | |
| | | $ | (8 | ) | | $ | 35 | | | $ | 3,222 | | |
The Fund is permitted to purchase and sell securities ("cross-trade") from and to other Morgan Stanley Funds as well as other funds and client accounts for which the Adviser or an affiliate of the Adviser serves as investment adviser, pursuant to procedures approved by the Trustees in compliance with Rule 17a-7 under the Act (the "Rule"). Each cross-trade is executed at the current market price in compliance with provisions of the Rule. For the year ended September 30, 2017, the Fund did not engage in any cross-trade transactions.
The Fund has an unfunded Deferred Compensation Plan (the "Compensation Plan"), which allows each independent Trustee to defer payment of all, or a portion, of the fees he or she receives for serving on the Board of Trustees. Each eligible Trustee generally may elect to have the deferred amounts credited with a return equal to the total return on one or more of the Morgan Stanley funds that are offered as investment options under the Compensation Plan. Appreciation/depreciation and distributions received from these investments are recorded with an offsetting increase/decrease in the deferred compensation obligation and do not affect the NAV of the Fund.
H. Federal Income Taxes: It is the Fund's intention to continue to qualify as a regulated investment company and distribute all of its taxable and tax-exempt income. Accordingly,
no provision for federal income taxes is required in the financial statements.
The Fund may be subject to taxes imposed by countries in which it invests. Such taxes are generally based on income and/or capital gains earned or repatriated. Taxes are accrued based on net investment income, net realized gains and net unrealized appreciation as such income and/or gains are earned. Taxes may also be based on transactions in foreign currency and are accrued based on the value of investments denominated in such currency.
FASB ASC 740-10, "Income Taxes — Overall", sets forth a minimum threshold for financial statement recognition of the benefit of a tax position taken or expected to be taken in a tax return. Management has concluded there are no significant uncertain tax positions that would require recognition in the financial statements. If applicable, the Fund recognizes interest accrued related to unrecognized tax benefits in "Interest Expense" and penalties in "Other Expenses" in the Statement of Operations. The Fund files tax returns with the U.S. Internal Revenue Service, New York and various states. Each of the tax years in the three-year period ended September 30, 2017, remains subject to examination by taxing authorities.
The tax character of distributions paid may differ from the character of distributions shown in the Statements of Changes in Net Assets due to short-term capital gains being treated as ordinary income for tax purposes. The tax character of distributions paid during fiscal years 2017 and 2016 was as follows:
2017
Distributions
Paid From: | | 2016
Distributions
Paid From: | |
Ordinary
Income
(000) | | Ordinary
Income
(000) | |
| $ | 247 | | | $ | 308 | | |
The amount and character of income and gains to be distributed are determined in accordance with income tax regulations which may differ from GAAP. These book/tax differences are either considered temporary or permanent in nature.
Temporary differences are attributable to differing book and tax treatments for the timing of the recognition of gains (losses) on certain investment transactions and the timing of the deductibility of certain expenses.
Permanent differences, primarily due to differing treatments of gains (losses) related to foreign currency transactions, basis adjustments for swap transactions, paydown adjustments,
48
Morgan Stanley Institutional Fund Trust
Annual Report — September 30, 2017
Notes to Consolidated Financial Statements (cont'd)
nondeductible expenses and tax adjustments on passive foreign investment companies sold by the Fund, resulted in the following reclassifications among the components of net assets at September 30, 2017:
Distributions
in Excess of Net
Investment
Income
(000) | | Accumulated
Net Realized
Loss
(000) | | Paid-in-
Capital
(000) | |
| $ | (258 | ) | | $ | 264 | | | $ | (6 | ) | |
At September 30, 2017, the Fund had no distributable earnings on a tax basis.
At September 30, 2017, the Fund had available for federal income tax purposes unused short term capital losses of approximately $300,000 that do not have an expiration date.
To the extent that capital loss carryforwards are used to offset any future capital gains realized during the carryover period as provided by U.S. federal income tax regulations, no capital gains tax liability will be incurred by the Fund for gains realized and not distributed. To the extent that capital gains are offset, such gains will not be distributed to the shareholders. During the year ended September 30, 2017, the Fund utilized capital loss carryforwards for U.S. federal income tax purposes of approximately $86,000.
Qualified late year losses are capital losses and specified ordinary losses, including currency losses, incurred after October 31 but within the taxable year that, if elected, are deemed to arise on the first day of the Fund's next taxable year. These also include non-specified ordinary losses incurred after December 31 but within the same taxable year. For the year ended September 30, 2017, the Fund deferred to October 1, 2017 for U.S. federal income tax purposes the following losses:
Qualified Late
Year Ordinary
Losses
(000) | | Post-October
Capital Losses
(000) | |
| $ | 68 | | | $ | — | | |
I. Credit Facility: The Trust and other Morgan Stanley funds participate in a $150,000,000 committed, unsecured revolving line of credit facility (the "facility") with State Street. This facility is to be used for temporary emergency purposes or funding of shareholder redemption requests. The interest rate on borrowings is based on the federal funds rate or one month libor rate plus a spread. The facility also has a commitment fee of 0.25% per annum based on the unused portion of the facility.
During the year ended September 30, 2017, the Fund did not have any borrowings under the facility.
J. Other: At September 30, 2017, the Fund did not have record owners of 10% or greater.
K. Accounting Pronouncement: In March 2017, FASB issued an Accounting Standard Update, ASU 2017-08, Receivables-Nonrefundable Fees and Other Costs (Subtopic 310-20), Premium Amortization on Purchased Callable Debt Securities (the "ASU") which amends the amortization period for certain purchased callable debt securities held at a premium, shortening such period to the earliest call date. The ASU does not require any accounting change for debt securities held at a discount; the discount continues to be amortized to maturity. The ASU is effective for fiscal years, and interim periods within those fiscal years, beginning after December 15, 2018. At this time, management is evaluating the implications of these changes on the financial statements.
49
Morgan Stanley Institutional Fund Trust
Annual Report — September 30, 2017
Report of Independent Registered Public Accounting Firm
To the Shareholders and Board of Trustees of
Morgan Stanley Institutional Fund Trust —
Global Multi-Asset Income Portfolio
We have audited the accompanying consolidated statement of assets and liabilities, including the consolidated portfolio of investments, of Global Multi-Asset Income Portfolio (one of the funds constituting Morgan Stanley Institutional Fund Trust) (the "Fund") as of September 30, 2017, the related consolidated statement of operations for the year then ended, the consolidated statements of changes in net assets for each of the two years in the period then ended and the consolidated financial highlights for the years or periods indicated therein. These consolidated financial statements and financial highlights are the responsibility of the Fund's management. Our responsibility is to express an opinion on these consolidated financial statements and financial highlights based on our audits.
We conducted our audits in accordance with the standards of the Public Company Accounting Oversight Board (United States). Those standards require that we plan and perform the audit to obtain reasonable assurance about whether the consolidated financial statements and financial highlights are free of material misstatement. We were not engaged to perform an audit of the Fund's internal control over financial reporting. Our audits included consideration of internal control over financial reporting as a basis for designing audit procedures that are appropriate in the circumstances, but not for the purpose of expressing an opinion on the effectiveness of the Fund's internal control over financial reporting. Accordingly, we express no such opinion. An audit also includes examining, on a test basis, evidence supporting the amounts and disclosures in the consolidated financial statements and financial highlights, assessing the accounting principles used and significant estimates made by management, and evaluating the overall financial statement presentation. Our procedures included confirmation of securities owned as of September 30, 2017, by correspondence with the custodian and others or by other appropriate auditing procedures where replies from others were not received. We believe that our audits provide a reasonable basis for our opinion.
In our opinion, the consolidated financial statements and financial highlights referred to above present fairly, in all material respects, the consolidated financial position of Global Multi-Asset Income Portfolio (one of the funds constituting Morgan Stanley Institutional Fund Trust) at September 30, 2017, the consolidated results of its operations for the year then ended, the consolidated changes in its net assets for each of the two years in the period then ended and the consolidated financial highlights for each of the years or periods indicated therein, in conformity with U.S. generally accepted accounting principles.

Boston, Massachusetts
November 22, 2017
50
Morgan Stanley Institutional Fund Trust
Annual Report — September 30, 2017
Investment Advisory Agreement Approval (unaudited)
Nature, Extent and Quality of Services
The Board reviewed and considered the nature and extent of the investment advisory services provided by the Adviser (as defined herein) under the advisory agreement, including portfolio management, investment research and equity and fixed income securities trading. The Board also reviewed and considered the nature and extent of the non-advisory, administrative services provided by the Adviser under the administration agreement, including accounting, operations, clerical, bookkeeping, compliance, business management and planning, legal services and the provision of supplies, office space and utilities at the Adviser's expense. The Board also considered the Adviser's investment in personnel and infrastructure that benefits the Fund. (The advisory and administration agreements together are referred to as the "Management Agreement.") The Board also considered that the Adviser serves a variety of other investment advisory clients and has experience overseeing service providers. The Board also compared the nature of the services provided by the Adviser with similar services provided by non-affiliated advisers as presented to the Board by Broadridge Financial Solutions, Inc. ("Broadridge").
The Board reviewed and considered the qualifications of the portfolio managers, the senior administrative managers and other key personnel of the Adviser who provide the administrative and advisory services to the Fund. The Board determined that the Adviser's portfolio managers and key personnel are well qualified by education and/or training and experience to perform the services in an efficient and professional manner. The Board concluded that the nature and extent of the advisory and administrative services provided were necessary and appropriate for the conduct of the business and investment activities of the Fund and supported its decision to approve the Management Agreement.
Performance, Fees and Expenses of the Fund
The Board reviewed the performance, fees and expenses of the Fund compared to its peers, as presented by Broadridge, and to appropriate benchmarks where applicable. The Board discussed with the Adviser the performance goals and the actual results achieved in managing the Fund. When considering a fund's performance, the Board and the Adviser place emphasis on trends and longer-term returns (focusing on one-year, three-year and five-year performance, as of December 31, 2016, or since inception, as applicable). When a fund underperforms its benchmark and/or its peer group average, the Board and the Adviser discuss the causes of such underperformance and, where necessary, they discuss specific changes to investment strategy or investment personnel. The Board noted that the Fund's performance was below its peer group average for the one-year period and for the period since the end of April 2015, the month of the Fund's inception. The Board discussed with the Adviser the level of the advisory and administration fees (together, the "management fee") for this Fund relative to comparable funds and/or other accounts advised by the Adviser and/or compared to its peers as presented by Broadridge. In addition to the management fee, the Board also reviewed the Fund's total expense ratio. The Board noted that the Fund's management fee and total expense ratio were lower than its peer group averages. After discussion, the Board concluded that the Fund's (i) performance was acceptable; and (ii) management fee and total expense ratio were competitive with its peer group averages.
Economies of Scale
The Board considered the size and growth prospects of the Fund and how that relates to the Fund's total expense ratio and particularly the Fund's management fee rate, which does not include breakpoints. In conjunction with its review of the Adviser's profitability, the Board discussed with the Adviser how a change in assets can affect the efficiency or effectiveness of managing the Fund and whether the management fee level is appropriate relative to current and projected asset levels and/or whether the management fee structure reflects economies of scale as asset levels change. The Board has determined that its review of the actual and/or potential economies of scale of the Fund supports its decision to approve the Management Agreement.
Profitability of the Adviser and Affiliates
The Board considered information concerning the costs incurred and profits realized by the Adviser and its affiliates during the last year from their relationship with the Fund and during the last two years from their relationship with the Morgan Stanley Fund Complex and reviewed with the Adviser the cost allocation methodology used to determine the profitability of the Adviser and affiliates. The Board has determined that its review of the analysis of the Adviser's expenses and profitability supports its decision to approve the Management Agreement.
51
Morgan Stanley Institutional Fund Trust
Annual Report — September 30, 2017
Investment Advisory Agreement Approval (unaudited) (cont'd)
Other Benefits of the Relationship
The Board considered other direct and indirect benefits to the Adviser and/or its affiliates derived from their relationship with the Fund and other funds advised by the Adviser. These benefits may include, among other things, fees for trading, distribution and/or shareholder servicing and for transaction processing and reporting platforms used by securities lending agents, and research received by the Adviser generated from commission dollars spent on funds' portfolio trading. The Board reviewed with the Adviser these arrangements and the reasonableness of the Adviser's costs relative to the services performed. The Board has determined that its review of the other benefits received by the Adviser or its affiliates supports its decision to approve the Management Agreement.
Resources of the Adviser and Historical Relationship Between the Fund and the Adviser
The Board considered whether the Adviser is financially sound and has the resources necessary to perform its obligations under the Management Agreement. The Board also reviewed and considered the historical relationship between the Fund and the Adviser, including the organizational structure of the Adviser, the policies and procedures formulated and adopted by the Adviser for managing the Fund's operations and the Board's confidence in the competence and integrity of the senior managers and key personnel of the Adviser. The Board concluded that the Adviser has the financial resources necessary to fulfill its obligations under the Management Agreement and that it is beneficial for the Fund to continue its relationship with the Adviser.
Other Factors and Current Trends
The Board considered the controls and procedures adopted and implemented by the Adviser and monitored by the Fund's Chief Compliance Officer and concluded that the conduct of business by the Adviser indicates a good faith effort on its part to adhere to high ethical standards in the conduct of the Fund's business.
General Conclusion
After considering and weighing all of the above factors, with various written materials and verbal information presented by the Adviser, the Board concluded that it would be in the best interest of the Fund and its shareholders to approve renewal of the Management Agreement for another year. In reaching this conclusion the Board did not give particular weight to any single piece of information or factor referenced above. The Board considered these factors and information over the course of the year and in numerous meetings, some of which were in executive session with only the independent Board members and their counsel present. It is possible that individual Board members may have weighed these factors, and the information presented, differently in reaching their individual decisions to approve the Management Agreement.
52
Morgan Stanley Institutional Fund Trust
Annual Report — September 30, 2017
Federal Tax Notice (unaudited)
For federal income tax purposes, the following information is furnished with respect to the distributions paid by the Fund during its taxable year ended September 30, 2017. For corporate shareholders 14.63% of the dividends qualified for the dividends received deduction.
For federal income tax purposes, the following information is furnished with respect to the Fund's earnings for its taxable year ended September 30, 2017. When distributed, certain earnings may be subject to a maximum tax rate of 15% as provided for by the Jobs and Growth Tax Relief Reconciliation Act of 2003. The Fund designated up to a maximum of approximately $128,000 as taxable at this lower rate.
In January, the Fund provides tax information to shareholders for the preceding calendar year.
53
Morgan Stanley Institutional Fund Trust
Annual Report — September 30, 2017
Privacy Notice (unaudited)
MORGAN STANLEY INVESTMENT MANAGEMENT INC.
AN IMPORTANT NOTICE CONCERNING OUR U.S. PRIVACY POLICY
We are required by federal law to provide you with a copy of our privacy policy annually. This policy applies to current and former individual investors in funds managed or sponsored by Morgan Stanley Investment Management Inc. ("MSIM") as well as current and former individual clients of MSIM. This policy is not applicable to partnerships, corporations, trusts or other non-individual clients or investors. Please note that we may amend this policy at any time, and will inform you of any changes as required by law.
WE RESPECT YOUR PRIVACY
We appreciate that you have provided us with your personal financial information. We strive to maintain the privacy of such information while we help you achieve your financial objectives. This Notice describes what non-public personal information we collect about you, why we collect it, when we may share it with others and how certain others may use it. It discusses the steps you may take to limit our sharing of certain information about you to affiliated companies in the Morgan Stanley family of companies ("other Morgan Stanley companies"). It also discloses how you may limit use of certain shared information for marketing purposes by other Morgan Stanley branded companies. Throughout this policy, we refer to the non-public information that personally identifies you or your accounts as "personal information.''
1. WHAT PERSONAL INFORMATION DO WE COLLECT ABOUT YOU?
We obtain personal information from applications and other forms you submit to us, from your dealings with us, from consumer reporting agencies, from our Web sites and from third parties and other sources.
For example:
• We may collect information such as your name, address, e-mail address, telephone/fax numbers, assets, income and investment objectives through subscription documents, applications and other forms you submit to us.
• We may obtain information about account balances, your use of account(s) and the types of products and services you prefer to receive from us through your dealings and transactions with us and other sources.
• We may obtain information about your creditworthiness and credit history from consumer reporting agencies.
• We may collect background information from and through third-party vendors to verify representations you have made and to comply with various regulatory requirements.
• If you interact with us through our public and private Web sites, we may collect information that you provide directly through online communications (such as an e-mail address). We may also collect information about your Internet service provider, your domain name, your computer's operating system and Web browser, your use of our Web sites and your product and service preferences, through the use of "cookies." Please consult the Terms of Use of these sites for more details.
2. WHEN DO WE DISCLOSE PERSONAL INFORMATION WE COLLECT ABOUT YOU?
We may disclose personal information we collect about you to other Morgan Stanley companies and to non-affiliated third parties.
a. Information We Disclose to Other Morgan Stanley Companies.
We may disclose personal information to other Morgan Stanley companies for a variety of reasons, including to manage your account(s) effectively, to service and process your transactions, to let you know about products and services offered by us and other Morgan Stanley companies, to manage our business, and as otherwise required or permitted by law. Offers for products and services from other Morgan Stanley companies are developed under conditions designed to safeguard your personal information.
54
Morgan Stanley Institutional Fund Trust
Annual Report — September 30, 2017
Privacy Notice (unaudited) (cont'd)
b. Information We Disclose to Non-affiliated Third Parties.
We do not disclose personal information that we collect about you to non-affiliated third parties except to those who provide marketing services on our behalf, to financial institutions with whom we have joint marketing agreements, and as otherwise required or permitted by law. For example, we may disclose personal information to non-affiliated third parties for servicing and processing transactions, to offer our own products and services, to protect against fraud, for institutional risk control, to respond to judicial process or to perform services on our behalf. When we share personal information with a non-affiliated third party, they are required to limit their use of personal information to the particular purpose for which it was shared and they are not allowed to share personal information with others except to fulfill that limited purpose or as may be permitted or required by law.
3. HOW DO WE PROTECT THE SECURITY AND CONFIDENTIALITY OF PERSONAL INFORMATION WE COLLECT ABOUT YOU?
We maintain physical, electronic and procedural security measures to help safeguard the personal information we collect about you. We have internal policies governing the proper handling of client information. Third parties that provide support or marketing services on our behalf may also receive personal information, and we require them to adhere to confidentiality standards with respect to such information.
4. HOW CAN YOU LIMIT THE SHARING OF CERTAIN TYPES OF PERSONAL INFORMATION WITH OTHER MORGAN STANLEY COMPANIES?
We offer you choices as to whether we share with other Morgan Stanley companies the personal information that was collected to determine your eligibility for products and services you request ("eligibility information"). Eligibility information does not include your identification information or personal information pertaining to our transactions or experiences with you. Please note that, even if you direct us not to share eligibility information with other Morgan Stanley companies ("opt-out"), we may still share personal information, including eligibility information, with those companies in circumstances excluded from the opt-out under applicable law, such as to process transactions or to service your account.
5. HOW CAN YOU LIMIT THE USE OF CERTAIN TYPES OF PERSONAL INFORMATION BY OTHER MORGAN STANLEY COMPANIES FOR MARKETING?
By following the opt-out instructions in Section 6 below, you may limit other Morgan Stanley branded companies from marketing their products or services to you based on personal information we disclose to them. This information may include, for example, your income and account history with us. Please note that, even if you choose to limit Other Morgan Stanley Companies from using personal information about you that we may share with them for marketing their products and services to you, Other Morgan Stanley Companies may use your personal information that they obtain from us to market to you in circumstances permitted by law, such as if the Other Morgan Stanley Company has its own relationship with you.
6. HOW CAN YOU SEND US AN OPT-OUT INSTRUCTION?
If you wish to limit our sharing of eligibility information about you with other Morgan Stanley companies or other Morgan Stanley companies' use of personal information for marketing purposes, as described in this notice, you may do so by:
• Calling us at (800) 548-7786
Monday–Friday between 8a.m. and 6p.m.(EST)
• Writing to us at the following address:
Boston Financial Data Services, Inc.
c/o Privacy Coordinator
P.O. Box 219804
Kansas City, Missouri 64121
55
Morgan Stanley Institutional Fund Trust
Annual Report — September 30, 2017
Privacy Notice (unaudited) (cont'd)
Your written request should include your name, address, telephone number and account number(s) to which the opt-out applies and whether you are opting out with respect to sharing of eligibility information (Section 4 above), or if information used for Marketing (Section 5 above) or both. Written opt-out requests should not be sent with any other correspondence. In order to process your request, we require that the request be provided by you directly and not through a third party.
Your opt-out preference will remain in effect with respect to this policy (as it may be amended) until you notify us otherwise. If you have a joint account, your direction for us not to share this information with other Morgan Stanley companies and for those other Morgan Stanley companies not to use your personal information for marketing will be applied to all account holders on that account. Please understand that if you limit our sharing or our affiliated companies' use of personal information, you and any joint account holder(s) may not receive information about Morgan Stanley products and services, including products or services that could help you manage your financial resources and achieve your investment objectives.
7. WHAT IF AN AFFILIATED COMPANY BECOMES A NON-AFFILIATED THIRD PARTY?
If, at any time in the future, an affiliated company becomes a non-affiliated third party, further disclosures of personal information made to the former affiliated company will be limited to those described in Section 2(b) above relating to non-affiliated third parties. If you elected under Section 6 to limit disclosures we make to affiliated companies, or use of personal information by affiliated companies, your election will not apply to use by any former affiliated company of your personal information in their possession once it becomes a non-affiliated third party.
SPECIAL NOTICE TO RESIDENTS OF VERMONT
The following section supplements our policy with respect to our individual clients who have a Vermont address and supersedes anything to the contrary in the above policy with respect to those clients only.
The state of Vermont requires financial institutions to obtain your consent prior to sharing personal information that they collect about you with affiliated companies and non-affiliated third parties other than in certain limited circumstances. Except as permitted by law, we will not share personal information we collect about you with non-affiliated third parties or other Morgan Stanley companies unless you provide us with your written consent to share such information ("opt-in").
If you wish to receive offers for investment products and services offered by or through other Morgan Stanley companies, please notify us in writing at the following address:
Boston Financial Data Services, Inc.
c/o Privacy Coordinator
P.O. Box 219804
Kansas City, Missouri 64121
Your authorization should include your name, address, telephone number and account number(s) to which the opt-in applies and should not be sent with any other correspondence. In order to process your authorization, we require that the authorization be provided by you directly and not through a third party.
SPECIAL NOTICE TO RESIDENTS OF CALIFORNIA
The following section supplements our policy with respect to our individual clients who have a California address and supersedes anything to the contrary in the above policy with respect to those clients only.
In response to a California law, if your account has a California home address, your personal information will not be disclosed to non-affiliated third parties except as permitted by applicable California law, and we will limit sharing such information with our affiliates to comply with California privacy laws that apply to us.
56
Morgan Stanley Institutional Fund Trust
Annual Report — September 30, 2017
Trustee and Officer Information (unaudited)
Independent Trustees:
Name, Age and Address of
Independent Trustee | | Position(s)
Held with
Registrant | | Length of Time
Served* | | Principal Occupation(s) During Past 5 Years
and Other Relevant Professional Experience | | Number of
Portfolios in
Fund Complex
Overseen by
Independent
Trustee** | | Other Directorships
Held by Independent
Trustee*** | |
Frank L. Bowman (72)
c/o Perkins Coie LLP
Counsel to the Independent Trustees
30 Rockefeller Plaza
New York, NY 10112 | | Trustee | | Since
August
2006 | | President, Strategic Decisions, LLC (consulting) (since February 2009); Director or Trustee of various Morgan Stanley Funds (since August 2006); Chairperson of the Compliance and Insurance Committee (since October 2015); formerly, Chairperson of the Insurance Sub-Committee of the Compliance and Insurance Committee (2007-2015); served as President and Chief Executive Officer of the Nuclear Energy Institute (policy organization) (February 2005-November 2008); retired as Admiral, U.S. Navy after serving over 38 years on active duty including 8 years as Director of the Naval Nuclear Propulsion Program in the Department of the Navy and the U.S. Department of Energy (1996-2004); served as Chief of Naval Personnel (July 1994-September 1996) and on the Joint Staff as Director of Political Military Affairs (June 1992-July 1994); knighted as Honorary Knight Commander of the Most Excellent Order of the British Empire; awarded the Officier de l'Orde National du Mérite by the French Government; elected to the National Academy of Engineering (2009). | | | 90 | | | Director of BP p.l.c.; Director of Naval and Nuclear Technologies LLP; Director Emeritus of the Armed Services YMCA; Director of the U.S. Naval Submarine League; Member of the National Security Advisory Council of the Center for U.S. Global Engagement and a member of the CNA Military Advisory Board; Chairman of the charity J Street Cup Golf; Trustee of Fairhaven United Methodist Church; and Director of other various non-profit organizations. | |
Kathleen A. Dennis (64)
c/o Perkins Coie LLP
Counsel to the Independent Trustees
30 Rockefeller Plaza
New York, NY 10112 | | Trustee | | Since
August
2006 | | President, Cedarwood Associates (mutual fund and investment management consulting) (since July 2006); Chairperson of the Liquidity and Alternatives Sub-Committee of the Investment Committee (since October 2006) and Director or Trustee of various Morgan Stanley Funds (since August 2006); formerly, Senior Managing Director of Victory Capital Management (1993-2006). | | | 91 | | | Director of various non-profit organizations. | |
Nancy C. Everett (62)
c/o Perkins Coie LLP
Counsel to the Independent Trustees
30 Rockefeller Plaza
New York, NY 10112 | | Trustee | | Since
January
2015 | | Chief Executive Officer, Virginia Commonwealth University Investment Company (since November 2015); Owner OBIR, LLC (institutional investment management consulting) (since June 2014); formerly, Managing Director, BlackRock, Inc. (February 2011-December 2013); and Chief Executive Officer, General Motors Asset Management (a/k/a Promark Global Advisors, Inc.) (June 2005-May 2010). | | | 91 | | | Formerly, Member of Virginia Commonwealth University School of Business Foundation (2005-2016); Member of Virginia Commonwealth University Board of Visitors (2013-2015); Member of Committee on Directors for Emerging Markets Growth Fund, Inc. (2007-2010); Chairperson of Performance Equity Management, LLC (2006-2010); and Chairperson, GMAM Absolute Return Strategies Fund, LLC (2006-2010). | |
57
Morgan Stanley Institutional Fund Trust
Annual Report — September 30, 2017
Trustee and Officer Information (unaudited) (cont'd)
Independent Trustees: (cont'd)
Name, Age and Address of
Independent Trustee | | Position(s)
Held with
Registrant | | Length of Time
Served* | | Principal Occupation(s) During Past 5 Years
and Other Relevant Professional Experience | | Number of
Portfolios in
Fund Complex
Overseen by
Independent
Trustee** | | Other Directorships
Held by Independent
Trustee*** | |
Jakki L. Haussler (60)
c/o Perkins Coie LLP
Counsel to the Independent Trustees
30 Rockefeller Plaza
New York, NY 10112 | | Trustee | | Since
January
2015 | | Chairman and Chief Executive Officer, Opus Capital Group (since January 1996); formerly, Director, Capvest Venture Fund, LP (May 2000-December 2011); Partner, Adena Ventures, LP (July 1999-December 2010); Director, The Victory Funds (February 2005-July 2008). | | | 91 | | | Director of Cincinnati Bell Inc. and Member, Audit Committee and Compensation Committee; Director of Northern Kentucky University Foundation and Member, Investment Committee; Member of Chase College of Law Transactional Law Practice Center Board of Advisors; Director of Best Transport; Director of Chase College of Law Board of Visitors; formerly, Member, University of Cincinnati Foundation Investment Committee; Member, Miami University Board of Visitors (2008-2011); Trustee of Victory Funds (2005-2008) and Chairman, Investment Committee (2007-2008) and Member, Service Provider Committee (2005-2008). | |
Dr. Manuel H. Johnson (68)
c/o Johnson Smick International, Inc.
220 I Street, NE — Suite 200
Washington, D.C. 20002 | | Trustee | | Since
July
1991 | | Senior Partner, Johnson Smick International, Inc. (consulting firm); Chairperson of the Investment Committee (since October 2006) and Director or Trustee of various Morgan Stanley Funds (since July 1991); Co-Chairman and a founder of the Group of Seven Council (G7C) (international economic commission); formerly, Chairperson of the Audit Committee (July 1991-September 2006), Vice Chairman of the Board of Governors of the Federal Reserve System and Assistant Secretary of the U.S. Treasury. | | | 91 | | | Director of NVR, Inc. (home construction). | |
Joseph J. Kearns (75)
c/o Kearns & Associates LLC
46 E Peninsula Center #385
Rolling Hills Estates, CA 90274-3712 | | Trustee | | Since
August
1994 | | President, Kearns & Associates LLC (investment consulting); Chairperson of the Audit Committee (since October 2006) and Director or Trustee of various Morgan Stanley Funds (since August 1994); formerly, Deputy Chairperson of the Audit Committee (July 2003-September 2006) and Chairperson of the Audit Committee of various Morgan Stanley Funds (since August 1994); CFO of the J. Paul Getty Trust. | | | 93 | | | Director of Electro Rent Corporation (equipment leasing). Prior to December 31, 2013, Director of The Ford Family Foundation. | |
58
Morgan Stanley Institutional Fund Trust
Annual Report — September 30, 2017
Trustee and Officer Information (unaudited) (cont'd)
Independent Trustees: (cont'd)
Name, Age and Address of
Independent Trustee | | Position(s)
Held with
Registrant | | Length of Time
Served* | | Principal Occupation(s) During Past 5 Years
and Other Relevant Professional Experience | | Number of
Portfolios in
Fund Complex
Overseen by
Independent
Trustee** | | Other Directorships
Held by Independent
Trustee*** | |
Michael F. Klein (58)
c/o Perkins Coie LLP
Counsel to the Independent Trustees
30 Rockefeller Plaza
New York, NY 10112 | | Trustee | | Since
August
2006 | | Managing Director, Aetos Capital, LLC (since March 2000); Co-President, Aetos Alternatives Management, LLC (since January 2004) and Co-Chief Executive Officer of Aetos Capital LLC (since August 2013); Chairperson of the Fixed Income Sub-Committee of the Investment Committee (since October 2006) and Director or Trustee of various Morgan Stanley Funds (since August 2006); formerly, Managing Director, Morgan Stanley & Co. Inc. and Morgan Stanley Dean Witter Investment Management, President, various Morgan Stanley Funds (June 1998-March 2000) and Principal, Morgan Stanley & Co. Inc. and Morgan Stanley Dean Witter Investment Management (August 1997-December 1999). | | | 90 | | | Director of certain investment funds managed or sponsored by Aetos Capital, LLC; Director of Sanitized AG and Sanitized Marketing AG (specialty chemicals). | |
Patricia Maleski (57)
c/o Perkins Coie LLP
Counsel to the Independent Trustees
30 Rockefeller Plaza
New York, NY 10112 | | Trustee | | Since
January
2017 | | Managing Director, JPMorgan Asset Management (2004-2016); Oversight and Control Head of Fiduciary and Conflicts of Interest Program (2015-2016); Chief Control Officer-Global Asset Management (2013-2015); President, JPMorgan Funds (2010-2013); Chief Administrative Officer (2004-2013); various other positions including Treasurer and Board Liaison (since 2001). | | | 91 | | | None. | |
Michael E. Nugent (81)
522 Fifth Avenue
New York, NY 10036 | | Chair of the Board and Trustee | | Chair of the Boards since
July 2006 and Trustee since
July 1991 | | Chair of the Boards of various Morgan Stanley Funds (since July 2006); Chairperson of the Closed-End Fund Committee (since June 2012) and Director or Trustee of various Morgan Stanley Funds (since July 1991); formerly, Chairperson of the Insurance Committee (until July 2006); General Partner, Triumph Capital, L.P. (private investment partnership) (1988-2013). | | | 92 | | | None. | |
W. Allen Reed (70)
c/o Perkins Coie LLP
Counsel to the Independent Trustees
30 Rockefeller Plaza
New York, NY 10112 | | Trustee | | Since
August
2006 | | Chairperson of the Equity Sub-Committee of the Investment Committee (since October 2006) and Director or Trustee of various Morgan Stanley Funds (since August 2006); formerly, President and CEO of General Motors Asset Management; Chairman and Chief Executive Officer of the GM Trust Bank and Corporate Vice President of General Motors Corporation (August 1994-December 2005). | | | 91 | | | Director of Legg Mason, Inc.; formerly, Director of the Auburn University Foundation (2010-2015). | |
Fergus Reid (85)
c/o Joe Pietryka, Inc.
85 Charles Colman Blvd.
Pawling, NY 12564 | | Trustee | | Since
June
1992 | | Chairman, Joe Pietryka, Inc.; Chairperson of the Governance Committee and Director or Trustee of various Morgan Stanley Funds (since June 1992). | | | 92 | | | Formerly, Trustee and Director of certain investment companies in the JP Morgan Fund Complex managed by JP Morgan Investment Management Inc. (1987-2012). | |
* This is the earliest date the Trustee began serving the Morgan Stanley Funds. Each Trustee serves an indefinite term, until his or her successor is elected.
** The Fund Complex includes (as of December 31, 2016) all open-end and closed-end funds (including all of their portfolios) advised by Morgan Stanley Investment Management Inc. (the "Adviser") and any funds that have an adviser that is an affiliated person of the Adviser (including, but not limited to, Morgan Stanley AIP GP LP).
*** This includes any directorships at public companies and registered investment companies held by the Trustee at any time during the past five years.
59
Morgan Stanley Institutional Fund Trust
Annual Report — September 30, 2017
Trustee and Officer Information (unaudited) (cont'd)
Executive Officers:
Name, Age and Address of Executive Officer | | Position(s) Held
with
Registrant | | Length of
Time Served* | | Principal Occupation(s) During Past 5 Years | |
John H. Gernon (54)
522 Fifth Avenue
New York, NY 10036 | | President and Principal Executive Officer | | Since
September
2013 | | President and Principal Executive Officer of the Equity and Fixed Income Funds and the Morgan Stanley AIP Funds (since September 2013) and the Liquidity Funds and various money market funds (since May 2014) in the Fund Complex; Managing Director of the Adviser; Head of Product (since 2006). | |
Timothy J. Knierim (58)
522 Fifth Avenue
New York, NY 10036 | | Chief
Compliance
Officer | | Since
December
2016 | | Managing Director of the Adviser and various entities affiliated with the Adviser; Chief Compliance Officer of various Morgan Stanley Funds and the Adviser (since December 2016) and Chief Compliance Officer of Morgan Stanley AIP GP LP (since 2014). Formerly, Managing Director and Deputy Chief Compliance Officer of the Adviser (2014-2016); and formerly, Chief Compliance Officer of Prudential Investment Management, Inc. (2007-2014). | |
Francis J. Smith (52)
522 Fifth Avenue
New York, NY 10036 | | Treasurer and Principal Financial Officer | | Treasurer since July 2003 and Principal Financial Officer since September
2002 | | Manging Director of the Adviser and various entities affiliated with the Adviser; Treasurer (since July 2003) and Principal Financial Officer of various Morgan Stanley Funds (since September 2002). | |
Mary E. Mullin (50)
522 Fifth Avenue
New York, NY 10036 | | Secretary | | Since
June
1999 | | Executive Director of the Adviser; Secretary of various Morgan Stanley Funds (since June 1999). | |
Michael J. Key (38)
522 Fifth Avenue
New York, NY 10036 | | Vice President | | Since
June
2017 | | Vice President of the Equity and Fixed Income Funds, Liquidity Funds, various money market funds and the Morgan Stanley AIP Funds in the Fund Complex (since June 2017); Executive Director of the Adviser; Head of Product Development for Equity and Fixed Income Funds (since August 2013). | |
* This is the earliest date the officer began serving the Morgan Stanley Funds. Each officer serves a one-year term, until his or her successor is elected and qualifies.
60
Morgan Stanley Institutional Fund Trust
Annual Report — September 30, 2017
Adviser and Administrator
Morgan Stanley Investment Management Inc.
522 Fifth Avenue
New York, New York 10036
Distributor
Morgan Stanley Distribution, Inc.
522 Fifth Avenue
New York, New York 10036
Dividend Disbursing and Transfer Agent
Boston Financial Data Services, Inc.
2000 Crown Colony Drive
Quincy, Massachusetts 02169
Custodian
State Street Bank and Trust Company
One Lincoln Street
Boston, Massachusetts 02111
Legal Counsel
Dechert LLP
1095 Avenue of the Americas
New York, New York 10036
Counsel to the Independent Trustees
Perkins Coie LLP
30 Rockefeller Plaza
New York, New York 10112
Independent Registered Public Accounting Firm
Ernst & Young LLP
200 Clarendon Street
Boston, Massachusetts 02116
Reporting to Shareholders
Each Morgan Stanley Fund provides a complete schedule of portfolio holdings in its semi-annual and annual reports within 60 days of the end of the fund's second and fourth fiscal quarters. The semi-annual and annual reports are filed electronically with the Securities and Exchange Commission (SEC) on Form N-CSRS and Form N-CSR, respectively. Morgan Stanley also delivers the semi-annual and annual reports to fund shareholders and makes these reports available on its public website, www.morganstanley.com/im. Each Morgan Stanley fund also files a complete schedule of portfolio holdings with the SEC for the fund's first and third fiscal quarters on Form N-Q. Morgan Stanley does not deliver the reports for the first and third fiscal quarters to shareholders, nor are the reports posted to the Morgan Stanley public website. You may, however, obtain the Form N-Q filings (as well as the Form N-CSR and N-CSRS filings) by accessing the SEC's website, www.sec.gov. You may also review and copy them at the SEC's Public Reference Room in Washington, DC. Information on the operation of the SEC's Public Reference Room may be obtained by calling the SEC toll free at 1 (800) SEC-0330. You can also request copies of these materials, upon payment of a duplicating fee, by electronic request at the SEC's email address (publicinfo@sec.gov) or by writing to the SEC's Public Reference Section, Washington, D.C. 20549-1520.
Proxy Voting Policies and Procedures and Proxy Voting Record
You may obtain a copy of the Trust's Proxy Voting Policy and Procedures and information regarding how the Trust voted proxies relating to portfolio securities during the most recent twelve-month period ended June 30, without charge, upon request, by calling toll free 1 (800) 548-7786 or by visiting our website at www.morganstanley.com/im. This information is also available on the SEC's website at www.sec.gov.
This report is authorized for distribution only when preceded or accompanied by a prospectus or summary prospectus of the applicable Fund of Morgan Stanley Institutional Fund Trust, which describes in detail the Fund's investment policies, risks, fees and expenses. Please read the prospectus carefully before you invest or send money. For additional information, including information regarding the investments comprising the Fund, please visit our website at www.morganstanley.com/im or call toll free 1 (800) 548-7786.
61
Printed in U.S.A.
This Report has been prepared for shareholders and may be distributed to others only if preceded or accompanied by a current prospectus.
Morgan Stanley Investment Management Inc.
522 Fifth Avenue
New York, New York 10036
© 2017 Morgan Stanley. Morgan Stanley Distribution, Inc.

IFGMAPANN
1942302 EXP 11.30.18

Morgan Stanley Institutional Fund Trust
Global Strategist Portfolio
Annual Report
September 30, 2017

Morgan Stanley Institutional Fund Trust
Annual Report — September 30, 2017
Shareholders' Letter | | | 2 | | |
Consolidated Expense Example | | | 3 | | |
Investment Overview | | | 4 | | |
Consolidated Portfolio of Investments | | | 9 | | |
Consolidated Statement of Assets and Liabilities | | | 35 | | |
Consolidated Statement of Operations | | | 37 | | |
Consolidated Statements of Changes in Net Assets | | | 38 | | |
Consolidated Financial Highlights | | | 40 | | |
Notes to Consolidated Financial Statements | | | 45 | | |
Report of Independent Registered Public Accounting Firm | | | 59 | | |
Investment Advisory Agreement Approval | | | 60 | | |
Federal Tax Notice | | | 62 | | |
Privacy Notice | | | 63 | | |
Trustee and Officer Information | | | 66 | | |
This report is authorized for distribution only when preceded or accompanied by a prospectus or summary prospectus of the applicable Fund of the Morgan Stanley Institutional Fund Trust. To receive a prospectus and/or statement of additional information (SAI), which contains more complete information such as investment objectives, charges, expenses, policies for voting proxies, risk considerations, and describes in detail each of the Fund's investment policies to the prospective investor, please call toll free 1 (800) 548-7786. Please read the prospectuses carefully before you invest or send money.
Additionally, you can access information about the Fund, including performance, characteristics, and investment team commentary, through Morgan Stanley Investment Management's website: www.morganstanley.com/im.
Market forecasts provided in this report may not necessarily come to pass. There is no guarantee that any sectors mentioned will continue to perform as discussed herein or that securities in such sectors will be held by the Fund in the future. There is no assurance that a fund will achieve its investment objective. Funds are subject to market risk, which is the possibility that market values of securities owned by the Fund will decline and, therefore, the value of the Fund's shares may be less than what you paid for them. Accordingly, you can lose money investing in this Fund. Please see the prospectus for more complete information on investment risks.
1
Morgan Stanley Institutional Fund Trust
Annual Report — September 30, 2017
Shareholders' Letter (unaudited)
Dear Shareholders,
We are pleased to provide this Annual report, in which you will learn how your investment in Global Strategist Portfolio (the "Fund") performed during the latest twelve-month period.
Morgan Stanley Investment Management is a client-centric, investor-led organization. Our global presence, intellectual capital, and breadth of products and services enable us to partner with investors to meet the evolving challenges of today's financial markets. We aim to deliver superior investment service and to empower our clients to make the informed decisions that help them reach their investment goals.
As always, we thank you for selecting Morgan Stanley Investment Management, and look forward to working with you in the months and years ahead.
Sincerely,

John H. Gernon
President and Principal Executive Officer
October 2017
2
Morgan Stanley Institutional Fund Trust
Annual Report — September 30, 2017
Consolidated Expense Example (unaudited)
Global Strategist Portfolio
As a shareholder of the Fund, you may incur two types of costs: (1) transactional costs, including sales charge (loads) on purchase payments; and (2) ongoing costs, which may include advisory fees, administration fees, distribution and shareholder services fees; and other Fund expenses. This example is intended to help you understand your ongoing costs (in dollars) of investing in the Fund and to compare these costs with the ongoing costs of investing in other mutual funds.
This example is based on an investment of $1,000 invested at the beginning of the six-month period ended September 30, 2017 and held for the entire six-month period.
Actual Expenses
The table below provides information about actual account values and actual expenses. You may use the information in this table, together with the amount you invested, to estimate the expenses that you paid over the period. Simply divide your account value by $1,000 (for example, an $8,600 account value divided by $1,000 = 8.6), then multiply the result by the number in the table under the heading entitled "Actual Expenses Paid During Period" to estimate the expenses you paid on your account during this period.
Hypothetical Example for Comparison Purposes
The table below provides information about hypothetical account values and hypothetical expenses based on the Fund's actual expense ratio and an assumed rate of return of 5% per year before expenses, which is not the Fund's actual return. The hypothetical account values and expenses may not be used to estimate the actual ending account balance or expenses you paid for the period. You may use this information to compare the ongoing costs of investing in the Fund and other funds. To do so, compare this 5% hypothetical example with the 5% hypothetical examples that appear in the shareholder reports of the other funds.
Please note that the expenses shown in the table are meant to highlight your ongoing costs only and do not reflect any transactional costs, such as sales charges (loads, if applicable). Therefore, the information for each class in the table is useful in comparing ongoing costs only, and will not help you determine the relative total costs of owning different funds. In addition, if these transactional costs were included, your costs would have been higher.
| | | Beginning
Account
Value
4/1/17 | | Actual Ending
Account
Value
9/30/17 | | Hypothetical
Ending Account
Value | | Actual
Expenses
Paid
During
Period* | | Hypothetical
Expenses Paid
During Period* | | Net
Expense
Ratio
During
Period** | |
Global Strategist Portfolio Class I | | $ | 1,000.00 | | | $ | 1,078.30 | | | $ | 1,021.46 | | | $ | 3.75 | | | $ | 3.65 | | | | 0.72 | % | |
Global Strategist Portfolio Class A | | | 1,000.00 | | | | 1,076.40 | | | | 1,019.85 | | | | 5.41 | | | | 5.27 | | | | 1.04 | | |
Global Strategist Portfolio Class L | | | 1,000.00 | | | | 1,073.90 | | | | 1,017.20 | | | | 8.16 | | | | 7.94 | | | | 1.57 | | |
Global Strategist Portfolio Class C | | | 1,000.00 | | | | 1,072.90 | | | | 1,015.94 | | | | 9.46 | | | | 9.20 | | | | 1.82 | | |
Global Strategist Portfolio Class IS | | | 1,000.00 | | | | 1,079.00 | | | | 1,021.61 | | | | 3.60 | | | | 3.50 | | | | 0.69 | | |
* Expenses are calculated using each Fund Class' annualized net expense ratio (as disclosed), multiplied by the average account value over the period, and multiplied by 183/365 (to reflect the most recent one-half year period).
** Annualized.
3
Morgan Stanley Institutional Fund Trust
Annual Report — September 30, 2017
Investment Overview (unaudited)
Global Strategist Portfolio
The Global Strategist Portfolio seeks above-average total return over a market cycle of three to five years.
Performance
For the fiscal year ended September 30, 2017, the Fund's Class I shares had a total return based on net asset value and reinvestment of distributions per share of 11.98%, net of fees. The Fund's Class I shares underperformed against the Fund's benchmark, the MSCI All Country World Index, which returned 18.65%, and outperformed the Customized MSIM Global Allocation Index1 (the "Customized Index") which returned 10.7%.
Factors Affecting Performance2
• In the 12 months ended September 30, 2017, global equities outperformed bonds and commodities, with the MSCI All Country World Index up +18.7%, the Bloomberg Barclays Global Aggregate Index down –1.3%, and the S&P GSCI Index, a broad index of commodity prices, rising +1.8%.3 (Except where noted, equity market returns are represented by the MSCI regional or country index and are calculated in U.S. dollars [USD].)
• A benign macroeconomic backdrop and low global interest rates fueled a preference for risk assets in the reporting period. Moderate growth in the U.S., improving growth in Europe, a sustained expansion in Japan and stable growth in China, coupled with low interest rates and muted inflation, provided a supportive environment for global equities, particularly emerging market equities, and the credit sectors of the fixed income markets, including U.S. high yield corporates and emerging market bonds.
• Global equities rose +18.7% (MSCI All Country World Index, USD) as above-trend global growth,
low inflation, and accommodative global central banks helped risky assets rally during the period. U.S. equities performed in line with the MSCI All Country World Index, with the S&P 500 Index up +18.6%. U.S. economic growth data was strong, with an average quarterly gross domestic product (GDP) growth rate of +2.3%.4 In addition, toward the end of the period, optimism rose that the Trump administration would be able to pass pro-growth tax reform. Eurozone equities rose (Euro Stoxx 50 Index +22.8% in euros, +29.1% USD), on strong economic data and declining political risks in the region. The European Central Bank (ECB) gave indications it would start unwinding the quantitative easing (QE) program in 2018. Emerging markets (MSCI Emerging Markets Index +22.5% USD, 21.8% local currency), performed strongly, supported by the lower U.S. dollar (DXY –2.5%), a recovery in commodity prices and stable Chinese data. Japanese equities rose (MSCI Japan Index +27.2% local, +14.1% USD) on improving inflation and economic data, as well as indications of continued central bank support for the economy. Later in September 2017, equities rose over the optimism ahead of a snap election in October, where markets expected a majority win by the ruling coalition.
• Within bonds, global government yields rose during the period. In the U.S., the 10-year yield rose +74 basis points (bps) to 2.33%, while the 2-year yield rose +72 bps to 1.48%. The Federal Open Market Committee (FOMC) raised the policy rate by an aggregate +75 bps during the period at the December 2016, March 2017 and June 2017 meetings. In addition, the Federal Reserve (Fed) confirmed it would commence balance sheet reduction beginning in October 2017. U.S. credit
(1) Effective May 31, 2017, the Customized Index, the Fund's secondary benchmark, consists of 60% MSCI All Country World Index and 40% Bloomberg Barclays Global Aggregate Bond Index. Prior to May 31, 2017, the Customized Index consisted of 60% MSCI All Country World Index, 30% Bloomberg Barclays Global Aggregate Bond Index, 5% S&P GSCI Light Energy Index, and 5% ICE BofAML U.S. Dollar 1-Month LIBID Average Index.
(2) Certain of the Fund's investment themes may, in whole or part, be implemented through the use of derivatives, including the purchase and sale of futures, options, swaps, structured investments (including commodity-linked notes) and other related instruments and techniques. The Fund may also invest in foreign currency forward exchange contracts, which are also derivatives, in connection with its investments in foreign securities. The Fund may use derivative instruments for a variety of purposes, including hedging, risk management, portfolio management or to earn income. As a result, the use of derivatives had a material effect on the Fund's performance during the period.
(3) Data sources used in preparation of this commentary include FactSet and Bloomberg LP. Data as of September 30, 2017.
(4) U.S. GDP data from the Bureau of Economic Analysis, October 27, 2017.
4
Morgan Stanley Institutional Fund Trust
Annual Report — September 30, 2017
Investment Overview (unaudited) (cont'd)
Global Strategist Portfolio
spreads tightened against a backdrop of strong growth, low volatility and stabilization in oil prices (West Texas Intermediate oil price rose to $52 per barrel by the end of the period). U.S. investment grade credit spreads fell –37 bps to 1.01%, and U.S. high yield spreads fell –133 bps to 3.47%. Elsewhere in developed markets, German 10-year yields rose +58 bps to 0.46% on better economic data in the region and indications the ECB would start unwinding its QE in 2018. Japanese 10-year yields rose +16 bps to +0.07%. The U.K. 10-year yield rose +62 bps to 1.37%, as economic data showed a resilient labor market and accelerating incomes. Brexit negotiations also increasingly suggested a softer approach, which would minimize disruption to the U.K. economy. Emerging sovereign spreads fell –52 bps to 3.08%, as emerging market growth and commodity prices rebounded.
• Within currencies, the U.S. dollar fell –2.5% on a trade-weighted basis. Trump's failure to implement health care policy at the beginning of 2017 raised doubts about Republicans' ability to pass pro-growth tax and infrastructure policies. In addition, bond markets started pricing in a lower probability of rate hikes as inflation disappointed expectations. Among the strongest gainers versus the USD was the Mexican peso, which rose +6.2%, as the U.S. administration signaled that changes to the North American Free Trade Agreement (NAFTA) might be less dramatic than initially anticipated, and Mexico's central bank took steps to boost the currency, raising rates in March 2017. Energy-sensitive currencies like the Russian ruble (+9.4%), Canadian dollar (+5.3%) and Brazilian real (+3.1%) outperformed USD as Brent oil rallied +17% during this period. In addition, the euro strengthened on the back of encouraging eurozone economic data, and as the ECB gave indications it would start unwinding the QE in 2018.
• Regarding the Fund's overall performance relative to the Customized Index, the Fund's asset allocation mix of an average underweights in equities and commodities, an average overweight in cash, and a modest underweight in fixed income (the Fund was tactically underweight fixed income between September 2016 and January 2017 and between July 2017 and September 2017, and overweight
fixed income between February 2017 and June 2017) had a negative impact on performance.
• Active positions within equities contributed positively to performance. Overweight positions in eurozone domestically focused equities relative to U.S. equities and eurozone banks relative to eurozone equities were the top contributors, in addition to overweight positions in U.S. banks and U.S. airlines, all hedged. However, these gains were partially offset by losses from underweight positions in global aerospace, China H-shares and global iron ore mining stocks, all relative to global equities.
• Active positions within fixed income strongly contributed to performance. Underweight positions in U.S. and German 10-year rates and an overweight position in U.S. 10-year inflation breakevens contributed to performance. In addition, a directional overweight position in Brazilian bonds, and an overweight position in Portuguese bonds relative to both German and Italian 10-year bonds contributed to performance. Detractors during the period included an overweight position in Australian 10-year bonds relative to German 10-year bunds.
• Active positions within commodities (implemented via commodity futures) had a negative impact on performance, as underweight positions in copper and Brent crude oil detracted from performance.
• Active currency positions (implemented via currency forwards and futures) positively impacted performance. Underweight positions in the Japanese yen relative to U.S. dollar and euro relative to the Czech koruna contributed to performance. Other contributors included overweight positions in the Mexican peso and Turkish lira, both relative to U.S. dollar. These gains were partially offset by losses from overweight positions in oil-sensitive currencies (Norwegian krone, Canadian dollar, and Russian ruble) and in British pound sterling relative to euro.
Management Strategies
• As of September 30, 2017, the Fund was neutral global equities and underweight global fixed income. We expect the global economic recovery to continue to sustain a steady above-trend pace of growth; however, equity valuations are high, particularly in the U.S. In emerging markets
5
Morgan Stanley Institutional Fund Trust
Annual Report — September 30, 2017
Investment Overview (unaudited) (cont'd)
Global Strategist Portfolio
ex-China, the modest post-commodity-boom recovery will likely continue after a five-year slowdown.
• We are underweight fixed income via U.S. 10-year Treasuries. The U.S. 10-year Treasury yield, currently at 2.23%, is 27 basis points below our estimate of year-end fair value (2.5%). Bond markets are extrapolating recent disappointments in U.S. inflation, and pricing in less than one full rate hike per year in the next three years. In contrast, we expect three Fed hikes before end-2018 — or one every six months — based on extremely easy financial conditions, solid growth in most regions globally, further improvement in the U.S. labor market, and modestly rising inflation (we forecast core price consumption expenditures at 1.8% by end-2018, 2.0% by end-2019). Elsewhere in fixed income, we hold an overweight position in Greek, Portuguese, and U.S. bonds relative to German bunds, which are expensive given ongoing improvements in global and eurozone growth.
• We are underweight U.S. equities. U.S. equity valuations are high, trading at 17.8x 12-month forward earnings, more than 30% above the 70-year average. U.S. equities are in the sweet spot of above-trend growth and low inflation; however, we believe that policy hikes and quantitative tightening in 2018 will be a negative catalyst for equities that leads to a liquidity reduction and growth slowdown.
• We are overweight European Economic and Monetary Union (EMU) equities via domestically oriented stocks and overweight banks. EMU PMIs (Purchasing Managers Indexes) imply growth is running at a 2.5% pace, above the consensus expectation for 2.1-2.2% year-over-year in the second half of 2017. Core inflation also appears to have bottomed in the eurozone, and we expect it to continue trending slowly upward. EMU domestic stocks are 12% undervalued based on relative earnings growth, and we expect EMU domestic earnings per share growth to continue to outpace the U.S. by an additional 4% over the next 12 months. We expect EMU banks to re-rate as profitability normalizes.
• We are neutral emerging market equities. Chinese growth has been more resilient than expected, but we think a slowdown is still likely in the next six to
12 months. In emerging markets ex-China, valuation is neutral. Structurally, we believe that emerging market economies have entered into a "new normal" phase of slower growth, given declining working age populations, a transition from investment-led to consumption-led growth, declining total factor productivity, and the end of a commodity and credit cycle. Cyclically, emerging market GDP growth is in a recovery phase, mainly driven by China's stimulus from 2015-16 and a recovery in commodity prices. We are overweight Russian stocks relative to a basket of developed market energy stocks. We believe the Russian economy is in the early stages of a recovery with improvement in consumption and investment, and with non-performing loan growth peaking.
• We are overweight Japanese equities and underweight the yen. We expect Japan's economy to grow at around 1% in 2018, with core inflation accelerating to nearly 1% by the first half of 2018. As the Bank of Japan has effectively capped nominal rates, we expect accelerating inflation to drive depreciation in the yen. On relative price-to-book ratios, Japanese equities are trading at a 56% discount, or 16% below the historical median discount of 48% to U.S. equities.
• In currencies, we are overweight regional inflation plays in Sweden and the Czech Republic. The Swedish krona remains 15-20% cheap versus fair value and sentiment is neutral. With Swedish growth accelerating and a potential positive output gap, the Riksbank will be forced to tighten policy soon in our view. The Czech economy is growing strongly, and the output gap will likely turn positive in the third quarter 2017. We expect sterling to appreciate by 15%. Sterling is cheap versus the euro, and investors are bearish. We believe the markets have overestimated the potential negative effects of leaving the European Union.
6
Morgan Stanley Institutional Fund Trust
Annual Report — September 30, 2017
Investment Overview (unaudited) (cont'd)
Global Strategist Portfolio
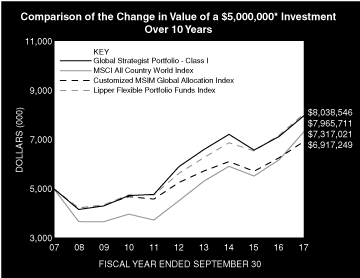
* Minimum Investment
In accordance with SEC regulations, the Fund's performance shown assumes that all recurring fees (including management fees) were deducted and all dividends and distributions were reinvested. The performance of Class A, Class L, Class C and Class IS shares will vary from the performance of Class I shares based upon their different inception dates and will be negatively impacted by additional fees assessed to those classes (where applicable).
Performance Compared to the MSCI All Country World Index(1), Customized MSIM Global Allocation Index(2) and the Lipper Flexible Portfolio Funds Index(3)
| | | Period Ended September 30, 2017
Total Returns(4) | |
| | | | | Average Annual | |
| | | One
Year | | Five
Years | | Ten
Years | | Since
Inception(10) | |
Fund — Class I Shares
w/o sales charges(5) | | | 11.98 | % | | | 6.23 | % | | | 4.77 | % | | | 7.39 | % | |
Fund — Class A Shares
w/o sales charges(6) | | | 11.64 | | | | 5.88 | | | | 4.46 | | | | 6.30 | | |
Fund — Class A Shares with
maximum 5.25% sales charges(6) | | | 5.76 | | | | 4.75 | | | | 3.90 | | | | 6.03 | | |
Fund — Class L Shares
w/o sales charges(7) | | | 11.07 | | | | 5.35 | | | | — | | | | 5.92 | | |
Fund — Class C Shares
w/o sales charges(8) | | | 10.77 | | | | — | | | | — | | | | 2.70 | | |
Fund — Class C Shares with
maximum 1.00% deferred
sales charges(8) | | | 9.77 | | | | — | | | | — | | | | 2.70 | | |
Fund — Class IS Shares
w/o sales charges(9) | | | 12.08 | | | | — | | | | — | | | | 4.54 | | |
MSCI All Country World Index | | | 18.65 | | | | 10.20 | | | | 3.88 | | | | 7.74 | | |
Customized MSIM Global
Allocation Index | | | 10.70 | | | | 5.70 | | | | 3.30 | | | | — | | |
Lipper Flexible Portfolio Funds Index | | | 12.17 | | | | 7.43 | | | | 4.86 | | | | 6.93 | | |
Performance data quoted represents past performance, which is no guarantee of future results, and current performance may be lower or higher than the figures shown. Performance assumes that all dividends and distributions, if any, were reinvested. For the most recent month-end performance figures, please visit www.morganstanley.com/im. Investment returns and principal value will fluctuate so that Fund shares, when redeemed, may be worth more or less than their original cost. Total returns do not reflect the deduction of taxes that a shareholder would pay on Fund distributions or the redemption of Fund shares. Performance of share classes will vary due to differences in sales charges and expenses.
(1) The MSCI All Country World Index (ACWI) is a free float-adjusted market capitalization weighted index designed to measure the equity market performance of developed and emerging markets. The term "free float" represents the portion of shares outstanding that are deemed to be available for purchase in the public equity markets by investors. The performance of the Index is listed in U.S. dollars and assumes reinvestment of net dividends. "Net dividends" reflects a reduction in dividends after taking into account withholding of taxes by any foreign countries represented in the Index. Returns, including periods prior to January 1, 2001, are calculated using the return data of the MSCI All Country World Index (gross dividends) through December 31, 2000 and the return data of the MSCI All Country World Index (net dividends) after December 31, 2000. The Index is unmanaged and its returns do not include any sales charges or fees. Such costs would lower performance. It is not possible to invest directly in an index.
7
Morgan Stanley Institutional Fund Trust
Annual Report — September 30, 2017
Investment Overview (unaudited) (cont'd)
Global Strategist Portfolio
(2) The Customized MSIM Global Allocation Index is a performance linked benchmark comprised of 60% MSCI All Country World Index and 40% Bloomberg Barclays Global Aggregate Index for periods after May 31, 2017. Prior to May 31, 2017, the Customized MSIM Global Allocation Index consisted of 60% MSCI All Country World Index (benchmark that measures the equity market performance of developed and emerging markets), 30% Bloomberg Barclays Global Aggregate Index (benchmark that provides a broadbased measure of the global investment grade fixed-rate debt markets), 5% S&P GSCI Light Energy Index (benchmark for investment performance in the energy commodity market) and 5% ICE BofAML US Dollar 1-Month LIBID Average Index (benchmark that tracks the performance of a basket of synthetic assets paying LIBID to a stated maturity). The Customized MSIM Global Allocation Index was added as the Fund benchmark on October 2, 2013 and is provided for comparative purposes only. The Index is unmanaged and its returns do not include any sales charges or fees. Such costs would lower performance. It is not possible to invest directly in an index.
(3) The Lipper Flexible Portfolio Funds Index is an equally weighted performance index of the largest qualifying funds (based on net assets) in the Lipper Flexible Portfolio Funds classification. The Index, which is adjusted for capital gains distributions and income dividends, is unmanaged and should not be considered an investment. There are currently 30 funds represented in this Index. As of the date of this report, the Fund was in the Lipper Flexible Portfolio Funds classification.
(4) Total returns for the Fund reflect expenses waived and/or reimbursed, if applicable, by the Adviser. Without such waivers and/or reimbursements, total returns would have been lower.
(5) Commenced operations on December 31, 1992.
(6) Commenced operations on November 1, 1996.
(7) Commenced operations on April 27, 2012.
(8) Commenced operations on April 30, 2015.
(9) Commenced operations on May 29, 2015.
(10) For comparative purposes, average annual since inception returns listed for the Indexes refer to the inception date of Class I of the Fund, not the inception of the Indexes.
8
Morgan Stanley Institutional Fund Trust
Annual Report — September 30, 2017
Consolidated Portfolio of Investments
Global Strategist Portfolio
| | | Face
Amount
(000) | | Value
(000) | |
Fixed Income Securities (41.9%) | |
Agency Adjustable Rate Mortgage (0.1%) | |
United States (0.1%) | |
Federal Home Loan Mortgage Corporation, | |
Conventional Pool: | |
12 Month USD LIBOR + 1.62%,
2.51%, 7/1/45 | | $ | 218 | | | $ | 222 | | |
Agency Fixed Rate Mortgages (2.7%) | |
United States (2.7%) | |
Federal Home Loan Mortgage Corporation, | |
Gold Pools: | |
3.50%, 1/1/44 - 6/1/45 | | | 1,347 | | | | 1,397 | | |
6.50%, 5/1/32 - 7/1/32 | | | 54 | | | | 60 | | |
7.50%, 5/1/35 | | | 5 | | | | 6 | | |
Federal National Mortgage Association, | |
Conventional Pools: | |
3.00%, 3/1/30 - 5/1/30 | | | 330 | | | | 341 | | |
3.50%, 3/1/47 | | | 214 | | | | 221 | | |
4.00%, 4/1/45 - 9/1/45 | | | 1,368 | | | | 1,452 | | |
4.50%, 3/1/41 - 11/1/44 | | | 331 | | | | 359 | | |
5.00%, 1/1/41 - 3/1/41 | | | 794 | | | | 873 | | |
6.00%, 1/1/38 | | | 7 | | | | 8 | | |
6.50%, 12/1/29 | | | 18 | | | | 20 | | |
7.00%, 2/1/31 | | | 221 | | | | 243 | | |
7.50%, 8/1/37 | | | 11 | | | | 13 | | |
November TBA: | |
3.50%, 11/1/47 (a) | | | 1,654 | | | | 1,702 | | |
October TBA: | |
3.00%, 10/1/32 (a) | | | 250 | | | | 257 | | |
4.00%, 10/1/47 (a) | | | 1,134 | | | | 1,194 | | |
4.50%, 10/1/47 (a) | | | 500 | | | | 537 | | |
Government National Mortgage Association, | |
Various Pools: | |
4.00%, 8/20/41 - 11/20/42 | | | 463 | | | | 491 | | |
5.50%, 8/15/39 | | | 56 | | | | 63 | | |
| | | | 9,237 | | |
Asset-Backed Securities (0.1%) | |
United States (0.1%) | |
CVS Pass-Through Trust, | |
6.04%, 12/10/28 | | | 314 | | | | 355 | | |
Collateralized Mortgage Obligations — Agency Collateral Series (0.1%) | |
United States (0.1%) | |
Federal Home Loan Mortgage Corporation, | |
2.79%, 1/25/22 | | | 75 | | | | 77 | | |
2.97%, 10/25/21 | | | 90 | | | | 92 | | |
IO REMIC | |
6.05% - 1 Month LIBOR,
4.82%, 4/15/39 (b) | | | 75 | | | | 6 | | |
| | | | 175 | | |
Commercial Mortgage-Backed Securities (1.1%) | |
United States (1.1%) | |
CGDB Commercial Mortgage Trust, | |
1 Month LIBOR + 2.50%,
3.73%, 5/15/30 (b)(c) | | | 100 | | | | 100 | | |
| | | Face
Amount
(000) | | Value
(000) | |
COMM Mortgage Trust, | |
2.87%, 2/10/48 (c) | | $ | 450 | | | $ | 366 | | |
3.28%, 1/10/46 | | | 305 | | | | 310 | | |
4.89%, 7/15/47 (b)(c) | | | 152 | | | | 133 | | |
JP Morgan Chase Commercial Mortgage
Securities Trust, | |
4.39%, 7/15/46 (c) | | | 100 | | | | 106 | | |
4.72%, 7/15/47 (b)(c) | | | 745 | | | | 614 | | |
JPMBB Commercial Mortgage Securities Trust, | |
4.11%, 9/15/47 (b)(c) | | | 205 | | | | 176 | | |
4.71%, 9/15/47 (b)(c) | | | 263 | | | | 226 | | |
4.82%, 8/15/47 (b)(c) | | | 361 | | | | 310 | | |
UBS-Barclays Commercial Mortgage Trust, | |
3.53%, 5/10/63 | | | 255 | | | | 266 | | |
WFCG Commercial Mortgage Trust, | |
1 Month LIBOR + 3.14%,
4.38%, 11/15/29 (b)(c) | | | 321 | | | | 322 | | |
WFRBS Commercial Mortgage Trust, | |
4.14%, 10/15/57 (b)(c) | | | 362 | | | | 292 | | |
5.15%, 9/15/46 (b)(c) | | | 375 | | | | 359 | | |
| | | | 3,580 | | |
Corporate Bonds (11.1%) | |
Australia (0.4%) | |
Australia & New Zealand Banking Group Ltd., | |
5.13%, 9/10/19 | | EUR | 400 | | | | 519 | | |
Commonwealth Bank of Australia, | |
1.75%, 11/7/19 (c) | | $ | 350 | | | | 348 | | |
Macquarie Bank Ltd., | |
6.63%, 4/7/21 (c) | | | 270 | | | | 304 | | |
Transurban Finance Co., Pty Ltd., | |
4.13%, 2/2/26 (c) | | | 170 | | | | 177 | | |
| | | | 1,348 | | |
Belgium (0.1%) | |
Anheuser-Busch InBev Finance, Inc., | |
3.70%, 2/1/24 | | | 300 | | | | 315 | | |
Canada (0.7%) | |
Goldcorp, Inc., | |
3.70%, 3/15/23 | | | 198 | | | | 206 | | |
Province of Alberta Canada, | |
1.75%, 8/26/20 | | | 700 | | | | 695 | | |
Province of British Columbia Canada, | |
2.00%, 10/23/22 | | | 700 | | | | 693 | | |
Royal Bank of Canada, | |
2.75%, 2/1/22 | | | 625 | | | | 638 | | |
| | | | 2,232 | | |
China (0.1%) | |
Baidu, Inc., | |
2.88%, 7/6/22 | | | 200 | | | | 201 | | |
3.25%, 8/6/18 | | | 225 | | | | 227 | | |
| | | | 428 | | |
Colombia (0.2%) | |
Ecopetrol SA, | |
5.88%, 9/18/23 | | | 630 | | | | 701 | | |
The accompanying notes are an integral part of the consolidated financial statements.
9
Morgan Stanley Institutional Fund Trust
Annual Report — September 30, 2017
Consolidated Portfolio of Investments (cont'd)
Global Strategist Portfolio
| | | Face
Amount
(000) | | Value
(000) | |
France (0.9%) | |
Air Liquide Finance SA, | |
1.75%, 9/27/21 (c) | | $ | 200 | | | $ | 196 | | |
Banque Federative du Credit Mutuel SA, | |
2.00%, 9/19/19 | | EUR | 500 | | | | 615 | | |
BNP Paribas SA, | |
3.80%, 1/10/24 (c) | | $ | 525 | | | | 546 | | |
5.00%, 1/15/21 | | | 95 | | | | 103 | | |
| BPCE SA, | |
5.15%, 7/21/24 (c) | | | 450 | | | | 486 | | |
Danone SA, | |
1.69%, 10/30/19 (c) | | | 475 | | | | 472 | | |
Electricite de France SA, | |
5.00%, 1/22/26 (d) | | EUR | 300 | | | | 387 | | |
TOTAL SA, | |
2.25%, 2/26/21 (d) | | | 100 | | | | 122 | | |
3.88%, 5/18/22 (d) | | | 100 | | | | 130 | | |
| | | | 3,057 | | |
Germany (0.7%) | |
BMW US Capital LLC, | |
2.15%, 4/6/20 (c) | | $ | 525 | | | | 528 | | |
Daimler Finance North America LLC, | |
1.50%, 7/5/19 (c) | | | 300 | | | | 297 | | |
Deutsche Bank AG, | |
2.70%, 7/13/20 | | | 625 | | | | 628 | | |
Deutsche Telekom International Finance BV, | |
3.60%, 1/19/27 (c) | | | 150 | | | | 152 | | |
Muenchener Rueckversicherungs-Gesellschaft
AG in Muenchen, | |
6.00%, 5/26/41 | | EUR | 400 | | | | 562 | | |
Siemens Financieringsmaatschappij N.V., | |
1.30%, 9/13/19 (c) | | $ | 250 | | | | 247 | | |
Vier Gas Transport GmbH, | |
3.13%, 7/10/23 | | EUR | 100 | | | | 136 | | |
| | | | 2,550 | | |
Hong Kong (0.1%) | |
CK Hutchison International 16 Ltd., | |
1.88%, 10/3/21 (c) | | $ | 200 | | | | 195 | | |
Israel (0.1%) | |
Teva Pharmaceutical Finance Netherlands III BV, | |
2.20%, 7/21/21 | | | 315 | | | | 304 | | |
Italy (0.1%) | |
FCA Bank SpA, | |
1.38%, 4/17/20 | | EUR | 250 | | | | 304 | | |
Telecom Italia Finance SA, | |
7.75%, 1/24/33 | | | 80 | | | | 144 | | |
| | | | 448 | | |
Korea, Republic of (0.1%) | |
SK Telecom Co., Ltd., | |
2.13%, 5/1/18 (c) | | $ | 200 | | | | 200 | | |
| | | Face
Amount
(000) | | Value
(000) | |
Malaysia (0.2%) | |
Petronas Capital Ltd., | |
3.50%, 3/18/25 (c) | | $ | 675 | | | $ | 697 | | |
Netherlands (0.4%) | |
ABN AMRO Bank N.V., | |
2.88%, 6/30/25 | | EUR | 250 | | | | 313 | | |
Cooperatieve Rabobank UA, | |
3.95%, 11/9/22 | | $ | 250 | | | | 263 | | |
Series G | |
3.75%, 11/9/20 | | EUR | 300 | | | | 393 | | |
ING Bank N.V., | |
5.80%, 9/25/23 (c) | | $ | 240 | | | | 274 | | |
| | | | 1,243 | | |
Spain (0.3%) | |
Santander Issuances SAU, | |
5.18%, 11/19/25 | | | 600 | | | | 647 | | |
Telefonica Emisiones SAU, | |
4.71%, 1/20/20 | | EUR | 300 | | | | 393 | | |
| | | | 1,040 | | |
Sweden (0.1%) | |
Skandinaviska Enskilda Banken AB, | |
2.30%, 3/11/20 | | $ | 525 | | | | 528 | | |
Switzerland (0.5%) | |
Credit Suisse AG, | |
0.63%, 11/20/18 | | EUR | 550 | | | | 656 | | |
6.00%, 2/15/18 | | $ | 90 | | | | 91 | | |
Credit Suisse Group AG, | |
3.57%, 1/9/23 (c) | | | 325 | | | | 333 | | |
UBS Group Funding Switzerland AG, | |
3.49%, 5/23/23 (c) | | | 500 | | | | 513 | | |
| | | | 1,593 | | |
United Kingdom (0.9%) | |
BP Capital Markets PLC, | |
2.50%, 11/6/22 | | | 275 | | | | 275 | | |
GlaxoSmithKline Capital, Inc., | |
6.38%, 5/15/38 | | | 100 | | | | 137 | | |
Heathrow Funding Ltd., | |
4.60%, 2/15/18 | | EUR | 300 | | | | 361 | | |
Lloyds Bank PLC, | |
6.50%, 3/24/20 | | | 450 | | | | 613 | | |
Nationwide Building Society, | |
3.90%, 7/21/25 (c) | | $ | 200 | | | | 210 | | |
6.25%, 2/25/20 (c) | | | 300 | | | | 329 | | |
NGG Finance PLC, | |
5.63%, 6/18/73 | | GBP | 200 | | | | 305 | | |
Royal Bank of Scotland Group PLC, | |
3.88%, 9/12/23 | | $ | 550 | | | | 563 | | |
Standard Chartered PLC, | |
2.10%, 8/19/19 (c) | | | 300 | | | | 300 | | |
| | | | 3,093 | | |
The accompanying notes are an integral part of the consolidated financial statements.
10
Morgan Stanley Institutional Fund Trust
Annual Report — September 30, 2017
Consolidated Portfolio of Investments (cont'd)
Global Strategist Portfolio
| | | Face
Amount
(000) | | Value
(000) | |
United States (5.2%) | |
Abbott Laboratories, | |
3.40%, 11/30/23 | | $ | 325 | | | $ | 336 | | |
Air Lease Corp., | |
2.13%, 1/15/20 | | | 400 | | | | 400 | | |
Amazon.com, Inc., | |
2.80%, 8/22/24 (c) | | | 375 | | | | 377 | | |
American Express Credit Corp., | |
MTN | |
2.20%, 3/3/20 | | | 375 | | | | 377 | | |
3.30%, 5/3/27 | | | 350 | | | | 354 | | |
Amgen, Inc., | |
2.65%, 5/11/22 | | | 425 | | | | 429 | | |
Apple, Inc., | |
2.50%, 2/9/22 | | | 500 | | | | 507 | | |
AT&T, Inc., | |
4.25%, 3/1/27 | | | 450 | | | | 464 | | |
4.50%, 3/9/48 | | | 191 | | | | 177 | | |
Bank of America Corp., | |
4.24%, 4/24/38 | | | 325 | | | | 344 | | |
MTN | |
4.00%, 1/22/25 | | | 375 | | | | 388 | | |
Becton Dickinson and Co., | |
2.89%, 6/6/22 | | | 375 | | | | 377 | | |
Burlington Northern Santa Fe LLC, | |
4.55%, 9/1/44 | | | 195 | | | | 217 | | |
Capital One Financial Corp., | |
2.50%, 5/12/20 | | | 250 | | | | 251 | | |
Capital One NA, | |
1.85%, 9/13/19 | | | 400 | | | | 397 | | |
Charter Communications Operating LLC/Charter
Communications Operating Capital, | |
4.91%, 7/23/25 | | | 100 | | | | 107 | | |
6.48%, 10/23/45 | | | 150 | | | | 177 | | |
Citigroup, Inc., | |
5.50%, 9/13/25 | | | 250 | | | | 281 | | |
8.13%, 7/15/39 | | | 175 | | | | 278 | | |
Coca-Cola Co. (The), | |
3.20%, 11/1/23 | | | 250 | | | | 261 | | |
Comcast Corp., | |
4.60%, 8/15/45 | | | 130 | | | | 143 | | |
ConocoPhillips Co., | |
4.95%, 3/15/26 | | | 200 | | | | 226 | | |
Discover Bank, | |
3.10%, 6/4/20 | | | 525 | | | | 538 | | |
Discovery Communications LLC, | |
2.95%, 3/20/23 | | | 250 | | | | 251 | | |
Duke Energy Corp., | |
1.80%, 9/1/21 | | | 275 | | | | 270 | | |
Five Corners Funding Trust, | |
4.42%, 11/15/23 (c) | | | 350 | | | | 380 | | |
| | | Face
Amount
(000) | | Value
(000) | |
Ford Motor Credit Co., LLC, | |
2.68%, 1/9/20 | | $ | 300 | | | $ | 303 | | |
GE Capital International Funding Co.,
Unlimited Co., | |
4.42%, 11/15/35 | | | 250 | | | | 272 | | |
General Motors Financial Co., Inc., | |
2.35%, 10/4/19 | | | 200 | | | | 201 | | |
Goldman Sachs Group, Inc. (The), | |
2.30%, 12/13/19 | | | 340 | | | | 342 | | |
MTN | |
4.80%, 7/8/44 | | | 275 | | | | 309 | | |
Home Depot, Inc. (The), | |
5.88%, 12/16/36 | | | 100 | | | | 130 | | |
HSBC Finance Corp., | |
6.68%, 1/15/21 | | | 130 | | | | 147 | | |
HSBC USA, Inc., | |
3.50%, 6/23/24 | | | 100 | | | | 103 | | |
Johnson Controls International PLC, | |
3.90%, 2/14/26 | | | 175 | | | | 185 | | |
JPMorgan Chase & Co., | |
2.25%, 1/23/20 | | | 900 | | | | 905 | | |
3.78%, 2/1/28 | | | 325 | | | | 335 | | |
Liberty Mutual Group, Inc., | |
4.85%, 8/1/44 (c) | | | 100 | | | | 109 | | |
Lockheed Martin Corp., | |
3.55%, 1/15/26 | | | 250 | | | | 258 | | |
McDonald's Corp., | |
MTN | |
3.38%, 5/26/25 | | | 275 | | | | 283 | | |
Medtronic, Inc., | |
3.63%, 3/15/24 | | | 250 | | | | 264 | | |
Merck & Co., Inc., | |
2.80%, 5/18/23 | | | 250 | | | | 257 | | |
Microsoft Corp., | |
1.55%, 8/8/21 | | | 525 | | | | 516 | | |
Monongahela Power Co., | |
5.40%, 12/15/43 (c) | | | 100 | | | | 122 | | |
NBC Universal Media LLC, | |
4.38%, 4/1/21 | | | 175 | | | | 188 | | |
NextEra Energy Capital Holdings, Inc., | |
3.55%, 5/1/27 | | | 350 | | | | 360 | | |
Oracle Corp., | |
3.40%, 7/8/24 | | | 175 | | | | 182 | | |
PepsiCo, Inc., | |
3.60%, 3/1/24 | | | 250 | | | | 264 | | |
PNC Financial Services Group, Inc. (The), | |
3.15%, 5/19/27 | | | 350 | | | | 350 | | |
QUALCOMM, Inc., | |
2.60%, 1/30/23 | | | 275 | | | | 276 | | |
Rockwell Collins, Inc., | |
1.95%, 7/15/19 | | | 525 | | | | 525 | | |
The accompanying notes are an integral part of the consolidated financial statements.
11
Morgan Stanley Institutional Fund Trust
Annual Report — September 30, 2017
Consolidated Portfolio of Investments (cont'd)
Global Strategist Portfolio
| | | Face
Amount
(000) | | Value
(000) | |
United States (cont'd) | |
Thermo Fisher Scientific, Inc., | |
2.95%, 9/19/26 | | $ | 275 | | | $ | 270 | | |
UnitedHealth Group, Inc., | |
2.88%, 3/15/23 | | | 250 | | | | 255 | | |
4.25%, 3/15/43 | | | 150 | | | | 161 | | |
Verizon Communications, Inc., | |
4.67%, 3/15/55 | | | 231 | | | | 221 | | |
Visa, Inc., | |
3.15%, 12/14/25 | | | 200 | | | | 205 | | |
Wal-Mart Stores, Inc., | |
2.55%, 4/11/23 | | | 200 | | | | 203 | | |
Wells Fargo & Co., | |
3.00%, 10/23/26 | | | 850 | | | | 832 | | |
| | | | 17,640 | | |
| | | | 37,612 | | |
Mortgages — Other (0.5%) | |
United Kingdom (0.1%) | |
Holmes Master Issuer PLC, | |
3 Month GBP LIBOR + 1.55%,
1.84%, 10/15/54 (b)(c) | | GBP | 212 | | | | 284 | | |
United States (0.4%) | |
Banc of America Alternative Loan Trust, | |
5.86%, 10/25/36 | | $ | 36 | | | | 22 | | |
6.00%, 4/25/36 | | | 10 | | | | 10 | | |
ChaseFlex Trust, | |
6.00%, 2/25/37 | | | 33 | | | | 26 | | |
Federal Home Loan Mortgage Corporation, | |
3.00%, 9/25/45 - 7/25/46 | | | 549 | | | | 541 | | |
3.50%, 5/25/45 - 7/25/46 | | | 723 | | | | 732 | | |
4.00%, 5/25/45 | | | 61 | | | | 63 | | |
GSR Mortgage Loan Trust, | |
5.75%, 1/25/37 | | | 22 | | | | 21 | | |
Lehman Mortgage Trust, | |
5.50%, 11/25/35 | | | 8 | | | | 7 | | |
6.50%, 9/25/37 | | | 29 | | | | 22 | | |
| | | | 1,444 | | |
| | | | 1,728 | | |
Sovereign (22.8%) | |
Australia (0.9%) | |
Australia Government Bond, | |
2.75%, 11/21/27 | | AUD | 2,590 | | | | 2,016 | | |
3.25%, 4/21/25 | | | 1,140 | | | | 929 | | |
| | | | 2,945 | | |
Austria (0.3%) | |
Republic of Austria Government Bond, | |
1.20%, 10/20/25 (c) | | EUR | 900 | | | | 1,135 | | |
Belgium (1.2%) | |
Kingdom of Belgium Government Bond, | |
0.80%, 6/22/25 (c) | | EUR | 3,440 | | | | 4,196 | | |
| | | Face
Amount
(000) | | Value
(000) | |
Bermuda (0.1%) | |
Bermuda Government International Bond, | |
4.85%, 2/6/24 (c) | | $ | 390 | | | $ | 426 | | |
Canada (1.2%) | |
Canadian Government Bond, | |
0.50%, 3/1/22 | | CAD | 1,802 | | | | 1,369 | | |
1.50%, 6/1/26 | | | 3,390 | | | | 2,593 | | |
| | | | 3,962 | | |
China (0.3%) | |
Sinopec Group Overseas Development
2013 Ltd., | |
2.63%, 10/17/20 | | EUR | 300 | | | | 379 | | |
Sinopec Group Overseas Development
2015 Ltd., | |
2.50%, 4/28/20 (c) | | $ | 575 | | | | 577 | | |
| | | | 956 | | |
Denmark (0.1%) | |
Denmark Government Bond, | |
0.50%, 11/15/27 | | DKK | 1,820 | | | | 288 | | |
France (0.8%) | |
French Republic Government Bond OAT, | |
1.75%, 5/25/23 | | EUR | 1,590 | | | | 2,066 | | |
3.25%, 5/25/45 | | | 440 | | | | 693 | | |
| | | | 2,759 | | |
Germany (0.8%) | |
Bundesrepublik Deutschland, | |
1.00%, 8/15/25 | | | 440 | | | | 555 | | |
4.25%, 7/4/39 | | | 820 | | | | 1,574 | | |
4.75%, 7/4/34 | | | 240 | | | | 456 | | |
| | | | 2,585 | | |
Greece (0.9%) | |
Hellenic Republic Government Bond, | |
3.00%, 2/24/23 - 2/24/42 (e) | | | 3,357 | | | | 3,132 | | |
Hungary (0.1%) | |
Hungary Government International Bond, | |
5.75%, 11/22/23 | | $ | 360 | | | | 418 | | |
Indonesia (0.1%) | |
Indonesia Government International Bond, | |
5.88%, 1/15/24 | | | 360 | | | | 414 | | |
Ireland (0.1%) | |
Ireland Government Bond, | |
5.40%, 3/13/25 | | EUR | 210 | | | | 337 | | |
Italy (1.4%) | |
Italy Buoni Poliennali Del Tesoro, | |
1.45%, 9/15/22 | | | 1,280 | | | | 1,557 | | |
2.20%, 6/1/27 | | | 680 | | | | 811 | | |
2.35%, 9/15/24 (c) | | | 1,464 | | | | 1,956 | | |
5.00%, 9/1/40 | | | 260 | | | | 399 | | |
| | | | 4,723 | | |
The accompanying notes are an integral part of the consolidated financial statements.
12
Morgan Stanley Institutional Fund Trust
Annual Report — September 30, 2017
Consolidated Portfolio of Investments (cont'd)
Global Strategist Portfolio
| | | Face
Amount
(000) | | Value
(000) | |
Japan (6.4%) | |
Japan Finance Organization for Municipalities, | |
1.90%, 6/22/18 | | JPY | 60,000 | | | $ | 540 | | |
Japan Government Ten Year Bond, | |
0.10%, 6/20/26 | | | 346,000 | | | | 3,097 | | |
0.50%, 9/20/24 | | | 349,000 | | | | 3,216 | | |
1.10%, 3/20/21 - 6/20/21 | | | 540,000 | | | | 5,008 | | |
1.70%, 6/20/18 | | | 294,000 | | | | 2,647 | | |
Japan Government Thirty Year Bond, | |
0.30%, 6/20/46 | | | 113,000 | | | | 868 | | |
1.70%, 6/20/33 | | | 327,000 | | | | 3,504 | | |
2.00%, 9/20/40 | | | 256,000 | | | | 2,902 | | |
| | | | 21,782 | | |
Mexico (1.4%) | |
Mexican Bonos, | |
Series M | |
5.75%, 3/5/26 | | MXN | 8,000 | | | | 410 | | |
6.50%, 6/10/21 | | | 48,000 | | | | 2,622 | | |
7.50%, 6/3/27 | | | 20,000 | | | | 1,147 | | |
Petroleos Mexicanos, | |
4.88%, 1/18/24 | | $ | 530 | | | | 551 | | |
6.38%, 1/23/45 | | | 140 | | | | 143 | | |
| | | | 4,873 | | |
Netherlands (0.5%) | |
Netherlands Government Bond, | |
0.25%, 7/15/25 (c) | | EUR | 1,260 | | | | 1,488 | | |
Norway (0.1%) | |
Norway Government Bond, | |
2.00%, 5/24/23 (c) | | NOK | 2,000 | | | | 263 | | |
Poland (0.1%) | |
Republic of Poland Government Bond, | |
4.00%, 10/25/23 | | PLN | 860 | | | | 250 | | |
Portugal (2.1%) | |
Portugal Obrigacoes do Tesouro OT, | |
2.88%, 7/21/26 (c) | | EUR | 2,866 | | | | 3,581 | | |
4.13%, 4/14/27 (c) | | | 2,670 | | | | 3,621 | | |
| | | | 7,202 | | |
Russia (0.4%) | |
Russian Federal Bond - OFZ, | |
7.00%, 8/16/23 | | RUB | 79,090 | | | | 1,346 | | |
South Africa (0.1%) | |
Republic of South Africa Government Bond, | |
8.00%, 1/31/30 | | ZAR | 4,040 | | | | 275 | | |
Spain (1.0%) | |
Spain Government Bond, | |
0.40%, 4/30/22 | | EUR | 890 | | | | 1,059 | | |
1.95%, 7/30/30 (c) | | | 1,200 | | | | 1,419 | | |
Spain Government Inflation Linked Bond, | |
1.00%, 11/30/30 (c) | | | 848 | | | | 1,040 | | |
| | | | 3,518 | | |
| | | Face
Amount
(000) | | Value
(000) | |
Sweden (0.1%) | |
Sweden Government Bond, | |
1.00%, 11/12/26 | | SEK | 1,270 | | | $ | 160 | | |
United Kingdom (2.3%) | |
United Kingdom Gilt, | |
1.50%, 1/22/21 - 7/22/26 | | GBP | 610 | | | | 841 | | |
2.75%, 9/7/24 | | | 2,320 | | | | 3,469 | | |
4.25%, 6/7/32 - 9/7/39 | | | 1,850 | | | | 3,455 | | |
| | | | 7,765 | | |
| | | | 77,198 | | |
U.S. Treasury Securities (3.4%) | |
United States (3.4%) | |
U.S. Treasury Bonds, | |
2.50%, 2/15/45 | | $ | 2,820 | | | | 2,631 | | |
3.50%, 2/15/39 | | | 1,890 | | | | 2,135 | | |
U.S. Treasury Notes, | |
0.38%, 1/15/27 | | | 1,520 | | | | 1,503 | | |
1.75%, 4/30/22 | | | 4,250 | | | | 4,224 | | |
2.25%, 2/15/27 | | | 1,180 | | | | 1,173 | | |
| | | | 11,666 | | |
Total Fixed Income Securities (Cost $137,193) | | | 141,773 | | |
| | | Shares | | | |
Common Stocks (44.5%) | |
Australia (1.4%) | |
ACN 004 410 833 Ltd. (f)(g) | | | 14,100 | | | | — | @ | |
AGL Energy Ltd. | | | 3,321 | | | | 61 | | |
Alumina Ltd. | | | 11,796 | | | | 20 | | |
Amcor Ltd. | | | 5,632 | | | | 67 | | |
AMP Ltd. | | | 14,204 | | | | 54 | | |
APA Group | | | 5,353 | | | | 35 | | |
Aristocrat Leisure Ltd. | | | 2,588 | | | | 43 | | |
ASX Ltd. | | | 929 | | | | 38 | | |
Aurizon Holdings Ltd. | | | 9,931 | | | | 38 | | |
AusNet Services | | | 8,580 | | | | 11 | | |
Australia & New Zealand Banking Group Ltd. | | | 14,694 | | | | 341 | | |
Bank of Queensland Ltd. | | | 1,912 | | | | 19 | | |
Bendigo & Adelaide Bank Ltd. | | | 2,363 | | | | 22 | | |
BHP Billiton Ltd. | | | 15,110 | | | | 306 | | |
Boral Ltd. | | | 5,645 | | | | 30 | | |
Brambles Ltd. | | | 7,720 | | | | 55 | | |
Caltex Australia Ltd. | | | 1,293 | | | | 33 | | |
Challenger Ltd. | | | 2,754 | | | | 27 | | |
CIMIC Group Ltd. | | | 470 | | | | 16 | | |
Coca-Cola Amatil Ltd. | | | 2,766 | | | | 17 | | |
Cochlear Ltd. | | | 274 | | | | 34 | | |
Commonwealth Bank of Australia | | | 8,503 | | | | 502 | | |
Computershare Ltd. | | | 2,260 | | | | 26 | | |
Crown Resorts Ltd. | | | 1,733 | | | | 15 | | |
CSL Ltd. | | | 2,182 | | | | 229 | | |
Dexus REIT | | | 4,685 | | | | 35 | | |
Domino's Pizza Enterprises Ltd. | | | 298 | | | | 11 | | |
The accompanying notes are an integral part of the consolidated financial statements.
13
Morgan Stanley Institutional Fund Trust
Annual Report — September 30, 2017
Consolidated Portfolio of Investments (cont'd)
Global Strategist Portfolio
| | | Shares | | Value
(000) | |
Australia (cont'd) | |
Flight Centre Travel Group Ltd. | | | 279 | | | $ | 10 | | |
Fortescue Metals Group Ltd. | | | 7,312 | | | | 29 | | |
Goodman Group REIT | | | 8,730 | | | | 56 | | |
GPT Group (The) REIT | | | 8,703 | | | | 34 | | |
Harvey Norman Holdings Ltd. | | | 2,645 | | | | 8 | | |
Healthscope Ltd. | | | 8,141 | | | | 11 | | |
Incitec Pivot Ltd. | | | 8,130 | | | | 23 | | |
Insurance Australia Group Ltd. | | | 11,698 | | | | 58 | | |
James Hardie Industries PLC CDI | | | 2,164 | | | | 30 | | |
Lend Lease Group REIT | | | 2,666 | | | | 37 | | |
Macquarie Group Ltd. | | | 1,480 | | | | 106 | | |
Medibank Pvt Ltd. | | | 13,288 | | | | 30 | | |
Mirvac Group REIT | | | 18,005 | | | | 32 | | |
National Australia Bank Ltd. | | | 13,356 | | | | 330 | | |
Newcrest Mining Ltd. | | | 3,617 | | | | 60 | | |
Oil Search Ltd. | | | 6,565 | | | | 36 | | |
Orica Ltd. | | | 1,806 | | | | 28 | | |
Origin Energy Ltd. (f) | | | 8,441 | | | | 50 | | |
Qantas Airways Ltd. | | | 2,325 | | | | 11 | | |
QBE Insurance Group Ltd. | | | 6,970 | | | | 55 | | |
Ramsay Health Care Ltd. | | | 672 | | | | 33 | | |
REA Group Ltd. | | | 254 | | | | 13 | | |
Rio Tinto Ltd. | | | 2,013 | | | | 105 | | |
Santos Ltd. (f) | | | 8,689 | | | | 27 | | |
Scentre Group REIT | | | 25,817 | | | | 80 | | |
Seek Ltd. | | | 1,611 | | | | 21 | | |
Shopping Centres Australasia Property
Group REIT | | | 67 | | | | — | @ | |
Sonic Healthcare Ltd. | | | 1,959 | | | | 32 | | |
South32 Ltd. | | | 25,134 | | | | 64 | | |
Stockland REIT | | | 12,754 | | | | 43 | | |
Suncorp Group Ltd. | | | 6,201 | | | | 63 | | |
Sydney Airport (f) | | | 5,313 | | | | 30 | | |
Tabcorp Holdings Ltd. | | | 4,000 | | | | 13 | | |
Tatts Group Ltd. | | | 6,975 | | | | 22 | | |
Telstra Corp., Ltd. | | | 20,549 | | | | 56 | | |
TPG Telecom Ltd. | | | 1,630 | | | | 6 | | |
Transurban Group | | | 9,833 | | | | 92 | | |
Treasury Wine Estates Ltd. | | | 3,536 | | | | 38 | | |
Vicinity Centres REIT | | | 16,082 | | | | 34 | | |
Vocus Group Ltd. | | | 2,565 | | | | 5 | | |
Wesfarmers Ltd. | | | 5,414 | | | | 176 | | |
Westfield Corp. REIT | | | 9,542 | | | | 59 | | |
Westpac Banking Corp. | | | 16,690 | | | | 418 | | |
Woodside Petroleum Ltd. | | | 3,686 | | | | 84 | | |
Woolworths Ltd. | | | 6,176 | | | | 122 | | |
| | | | 4,755 | | |
Austria (0.1%) | |
BUWOG AG (f) | | | 172 | | | | 5 | | |
Erste Group Bank AG (f) | | | 3,015 | | | | 130 | | |
IMMOFINANZ AG (f) | | | 3,441 | | | | 9 | | |
| | | Shares | | Value
(000) | |
Raiffeisen Bank International AG (f) | | | 1,261 | | | $ | 42 | | |
voestalpine AG | | | 1,248 | | | | 64 | | |
| | | | 250 | | |
Belgium (0.5%) | |
Ageas | | | 2,822 | | | | 133 | | |
Anheuser-Busch InBev N.V. | | | 6,337 | | | | 759 | | |
Colruyt SA | | | 850 | | | | 43 | | |
Groupe Bruxelles Lambert SA | | | 1,368 | | | | 144 | | |
KBC Group N.V. | | | 5,548 | | | | 470 | | |
Umicore SA | | | 1,472 | | | | 122 | | |
| | | | 1,671 | | |
Canada (1.9%) | |
Agnico Eagle Mines Ltd. | | | 1,000 | | | | 45 | | |
Agrium, Inc. | | | 700 | | | | 75 | | |
Alimentation Couche-Tard, Inc., Class B | | | 2,100 | | | | 96 | | |
AltaGas Ltd. | | | 800 | | | | 18 | | |
ARC Resources Ltd. | | | 1,700 | | | | 23 | | |
Atco Ltd., Class I | | | 400 | | | | 15 | | |
Bank of Montreal | | | 3,100 | | | | 235 | | |
Bank of Nova Scotia (The) | | | 5,800 | | | | 373 | | |
Barrick Gold Corp. | | | 5,400 | | | | 87 | | |
BCE, Inc. | | | 800 | | | | 37 | | |
Blackberry Ltd. (f) | | | 2,400 | | | | 27 | | |
Bombardier, Inc. (f) | | | 9,200 | | | | 17 | | |
Brookfield Asset Management, Inc., Class A | | | 4,150 | | | | 171 | | |
CAE, Inc. | | | 1,200 | | | | 21 | | |
Cameco Corp. | | | 2,000 | | | | 19 | | |
Canadian Imperial Bank of Commerce | | | 1,900 | | | | 166 | | |
Canadian National Railway Co. | | | 3,800 | | | | 315 | | |
Canadian Natural Resources Ltd. | | | 5,300 | | | | 178 | | |
Canadian Pacific Railway Ltd. | | | 800 | | | | 134 | | |
Canadian Tire Corp., Ltd., Class A | | | 400 | | | | 50 | | |
Canadian Utilities Ltd., Class A | | | 700 | | | | 22 | | |
CCL Industries, Inc., Class B | | | 900 | | | | 44 | | |
Cenovus Energy, Inc. | | | 4,000 | | | | 40 | | |
CGI Group, Inc., Class A (f) | | | 1,100 | | | | 57 | | |
CI Financial Corp. | | | 1,100 | | | | 24 | | |
Constellation Software, Inc. | | | 100 | | | | 55 | | |
Crescent Point Energy Corp. | | | 2,600 | | | | 21 | | |
Dollarama, Inc. | | | 600 | | | | 66 | | |
Eldorado Gold Corp. | | | 3,300 | | | | 7 | | |
Element Fleet Management Corp. | | | 1,900 | | | | 14 | | |
Emera, Inc. | | | 300 | | | | 11 | | |
Empire Co., Ltd., Class A | | | 800 | | | | 14 | | |
Enbridge, Inc. | | | 4,600 | | | | 192 | | |
Encana Corp. | | | 4,700 | | | | 55 | | |
Fairfax Financial Holdings Ltd. | | | 100 | | | | 52 | | |
Finning International, Inc. | | | 800 | | | | 18 | | |
First Capital Realty, Inc. | | | 700 | | | | 11 | | |
First Quantum Minerals Ltd. | | | 3,300 | | | | 37 | | |
Fortis, Inc. | | | 2,000 | | | | 72 | | |
Franco-Nevada Corp. | | | 800 | | | | 62 | | |
The accompanying notes are an integral part of the consolidated financial statements.
14
Morgan Stanley Institutional Fund Trust
Annual Report — September 30, 2017
Consolidated Portfolio of Investments (cont'd)
Global Strategist Portfolio
| | | Shares | | Value
(000) | |
Canada (cont'd) | |
George Weston Ltd. | | | 300 | | | $ | 26 | | |
Gildan Activewear, Inc. | | | 1,000 | | | | 31 | | |
Goldcorp, Inc. | | | 3,900 | | | | 51 | | |
Great-West Lifeco, Inc. | | | 1,400 | | | | 40 | | |
H&R Real Estate Investment Trust REIT | | | 800 | | | | 14 | | |
Husky Energy, Inc. (f) | | | 1,755 | | | | 22 | | |
Hydro One Ltd. (c) | | | 900 | | | | 16 | | |
IGM Financial, Inc. | | | 500 | | | | 17 | | |
Imperial Oil Ltd. | | | 1,400 | | | | 45 | | |
Industrial Alliance Insurance & Financial
Services, Inc. | | | 600 | | | | 27 | | |
Intact Financial Corp. | | | 700 | | | | 58 | | |
Inter Pipeline Ltd. | | | 1,700 | | | | 35 | | |
Jean Coutu Group PJC, Inc. (The), Class A | | | 400 | | | | 8 | | |
Keyera Corp. | | | 900 | | | | 28 | | |
Kinross Gold Corp. (f) | | | 5,700 | | | | 24 | | |
Lightstream Resources Ltd. (f)(g)(h) | | | 1,136 | | | | — | | |
Linamar Corp. | | | 300 | | | | 18 | | |
Loblaw Cos., Ltd. | | | 1,073 | | | | 59 | | |
Magna International, Inc. | | | 1,900 | | | | 101 | | |
Manulife Financial Corp. | | | 9,700 | | | | 197 | | |
Methanex Corp. | | | 500 | | | | 25 | | |
Metro, Inc. | | | 1,100 | | | | 38 | | |
National Bank of Canada | | | 1,600 | | | | 77 | | |
Onex Corp. | | | 500 | | | | 39 | | |
Open Text Corp. | | | 1,200 | | | | 39 | | |
Pembina Pipeline Corp. | | | 1,900 | | | | 67 | | |
Peyto Exploration & Development Corp. | | | 800 | | | | 13 | | |
Potash Corp. of Saskatchewan, Inc. | | | 4,000 | | | | 77 | | |
Power Corp. of Canada | | | 1,800 | | | | 46 | | |
Power Financial Corp. | | | 1,200 | | | | 33 | | |
PrairieSky Royalty Ltd. | | | 906 | | | | 23 | | |
Restaurant Brands International, Inc. | | | 1,100 | | | | 70 | | |
RioCan Real Estate Investment Trust REIT | | | 800 | | | | 15 | | |
Rogers Communications, Inc., Class B | | | 1,800 | | | | 93 | | |
Royal Bank of Canada | | | 7,100 | | | | 549 | | |
Saputo, Inc. | | | 1,200 | | | | 42 | | |
Seven Generations Energy Ltd., Class A (f) | | | 1,200 | | | | 19 | | |
Shaw Communications, Inc., Class B | | | 2,000 | | | | 46 | | |
Smart Real Estate Investment Trust REIT | | | 400 | | | | 9 | | |
SNC-Lavalin Group, Inc. | | | 800 | | | | 36 | | |
Sun Life Financial, Inc. | | | 2,900 | | | | 115 | | |
Suncor Energy, Inc. | | | 8,156 | | | | 286 | | |
Teck Resources Ltd., Class B | | | 2,700 | | | | 57 | | |
TELUS Corp. | | | 1,000 | | | | 36 | | |
Thomson Reuters Corp. | | | 1,600 | | | | 73 | | |
Toronto-Dominion Bank (The) | | | 8,900 | | | | 501 | | |
Tourmaline Oil Corp. (f) | | | 1,000 | | | | 20 | | |
TransCanada Corp. | | | 4,200 | | | | 208 | | |
Trisura Group Ltd. (f) | | | 27 | | | | 1 | | |
Turquoise Hill Resources Ltd. (f) | | | 4,900 | | | | 15 | | |
Valeant Pharmaceuticals International, Inc. (f) | | | 1,600 | | | | 23 | | |
| | | Shares | | Value
(000) | |
Veresen, Inc. | | | 1,500 | | | $ | 23 | | |
Vermilion Energy, Inc. | | | 600 | | | | 21 | | |
West Fraser Timber Co., Ltd. | | | 400 | | | | 23 | | |
Wheaton Precious Metals Corp. | | | 2,100 | | | | 40 | | |
Yamana Gold, Inc. | | | 4,200 | | | | 11 | | |
| | | | 6,602 | | |
China (0.0%) | |
Yum China Holdings, Inc. (f) | | | 573 | | | | 23 | | |
Denmark (0.6%) | |
AP Moller - Maersk A/S Series A | | | 18 | | | | 33 | | |
AP Moller - Maersk A/S Series B | | | 34 | | | | 64 | | |
Carlsberg A/S Series B | | | 61 | | | | 7 | | |
Coloplast A/S Series B | | | 75 | | | | 6 | | |
Danske Bank A/S | | | 3,772 | | | | 151 | | |
DSV A/S | | | 9,634 | | | | 729 | | |
ISS A/S | | | 7,550 | | | | 303 | | |
Novo Nordisk A/S Series B | | | 12,152 | | | | 581 | | |
Novozymes A/S Series B | | | 1,729 | | | | 89 | | |
TDC A/S | | | 335 | | | | 2 | | |
Vestas Wind Systems A/S | | | 2,175 | | | | 195 | | |
| | | | 2,160 | | |
Finland (0.3%) | |
Fortum Oyj | | | 5,723 | | | | 114 | | |
Kone Oyj, Class B | | | 4,765 | | | | 252 | | |
Nokia Oyj | | | 32,678 | | | | 196 | | |
Nokian Renkaat Oyj | | | 1,316 | | | | 59 | | |
Sampo Oyj, Class A | | | 3,364 | | | | 178 | | |
UPM-Kymmene Oyj | | | 10,953 | | | | 297 | | |
| | | | 1,096 | | |
France (6.6%) | |
Accor SA | | | 21,804 | | | | 1,083 | | |
Aeroports de Paris (ADP) (f) | | | 1,284 | | | | 208 | | |
Air Liquide SA | | | 2,883 | | | | 385 | | |
Alstom SA | | | 3,867 | | | | 164 | | |
ArcelorMittal (f) | | | 3,812 | | | | 98 | | |
Atos SE | | | 5,934 | | | | 921 | | |
AXA SA | | | 15,856 | | | | 480 | | |
BNP Paribas SA | | | 20,806 | | | | 1,678 | | |
Bouygues SA | | | 18,591 | | | | 882 | | |
Bureau Veritas SA | | | 2,183 | | | | 56 | | |
Capgemini SE | | | 12,721 | | | | 1,491 | | |
Carrefour SA | | | 5,203 | | | | 105 | | |
CGG SA (f) | | | 59 | | | | — | @ | |
Cie de Saint-Gobain | | | 17,455 | | | | 1,040 | | |
Cie Generale des Etablissements Michelin | | | 1,742 | | | | 254 | | |
Credit Agricole SA | | | 19,001 | | | | 345 | | |
Danone SA | | | 6,265 | | | | 491 | | |
Edenred | | | 1,712 | | | | 47 | | |
Electricite de France SA | | | 3,973 | | | | 48 | | |
Engie SA | | | 11,492 | | | | 195 | | |
Essilor International SA | | | 1,435 | | | | 178 | | |
Eutelsat Communications SA | | | 750 | | | | 22 | | |
The accompanying notes are an integral part of the consolidated financial statements.
15
Morgan Stanley Institutional Fund Trust
Annual Report — September 30, 2017
Consolidated Portfolio of Investments (cont'd)
Global Strategist Portfolio
| | | Shares | | Value
(000) | |
France (cont'd) | |
Groupe Eurotunnel SE (f) | | | 25,791 | | | $ | 311 | | |
Hermes International | | | 249 | | | | 126 | | |
ICADE REIT | | | 81 | | | | 7 | | |
JCDecaux SA | | | 611 | | | | 23 | | |
Kering | | | 1,274 | | | | 508 | | |
L'Oreal SA | | | 2,260 | | | | 481 | | |
LVMH Moet Hennessy Louis Vuitton SE | | | 2,157 | | | | 595 | | |
Metropole Television SA | | | 1,232 | | | | 28 | | |
Natixis SA | | | 10,132 | | | | 81 | | |
Orange SA | | | 18,237 | | | | 299 | | |
Pernod Ricard SA | | | 1,742 | | | | 241 | | |
Peugeot SA | | | 77,446 | | | | 1,844 | | |
Publicis Groupe SA | | | 983 | | | | 69 | | |
Renault SA | | | 1,782 | | | | 175 | | |
Rexel SA | | | 17,677 | | | | 306 | | |
Sanofi | | | 10,884 | | | | 1,081 | | |
SES SA (f) | | | 2,269 | | | | 50 | | |
Societe Generale SA | | | 14,754 | | | | 864 | | |
Sodexo SA | | | 1,149 | | | | 143 | | |
Suez | | | 3,938 | | | | 72 | | |
Television Francaise 1 | | | 4,951 | | | | 72 | | |
Thales SA | | | 1,185 | | | | 134 | | |
TOTAL SA | | | 19,681 | | | | 1,057 | | |
Unibail-Rodamco SE REIT | | | 1,518 | | | | 369 | | |
Vallourec SA (f) | | | 2,270 | | | | 13 | | |
Veolia Environnement SA | | | 5,271 | | | | 122 | | |
Vinci SA | | | 30,229 | | | | 2,873 | | |
Vivendi SA | | | 15,248 | | | | 386 | | |
| | | | 22,501 | | |
Germany (3.4%) | |
Adidas AG | | | 1,632 | | | | 369 | | |
Allianz SE (Registered) | | | 3,812 | | | | 856 | | |
Axel Springer SE | | | 158 | | | | 10 | | |
BASF SE | | | 9,651 | | | | 1,027 | | |
Bayer AG (Registered) | | | 6,343 | | | | 864 | | |
Bayerische Motoren Werke AG | | | 2,629 | | | | 267 | | |
Beiersdorf AG | | | 799 | | | | 86 | | |
CECONOMY AG | | | 997 | | | | 12 | | |
Commerzbank AG (f) | | | 15,127 | | | | 206 | | |
Continental AG | | | 501 | | | | 127 | | |
Daimler AG (Registered) | | | 5,812 | | | | 464 | | |
Deutsche Bank AG (Registered) | | | 11,045 | | | | 191 | | |
Deutsche Boerse AG | | | 10,440 | | | | 1,132 | | |
Deutsche Lufthansa AG (Registered) | | | 3,055 | | | | 85 | | |
Deutsche Post AG (Registered) | | | 4,704 | | | | 209 | | |
Deutsche Telekom AG (Registered) | | | 24,414 | | | | 456 | | |
E.ON SE | | | 15,003 | | | | 170 | | |
Fraport AG Frankfurt Airport Services Worldwide | | | 2,673 | | | | 254 | | |
Fresenius Medical Care AG & Co., KGaA | | | 1,462 | | | | 143 | | |
Fresenius SE & Co., KGaA | | | 2,950 | | | | 238 | | |
Henkel AG & Co., KGaA | | | 1,334 | | | | 162 | | |
| | | Shares | | Value
(000) | |
Henkel AG & Co., KGaA (Preference) | | | 1,920 | | | $ | 261 | | |
Infineon Technologies AG | | | 10,042 | | | | 252 | | |
K+S AG (Registered) | | | 1,227 | | | | 33 | | |
LANXESS AG | | | 777 | | | | 61 | | |
Linde AG | | | 1,276 | | | | 266 | | |
Merck KGaA | | | 984 | | | | 109 | | |
METRO AG (f) | | | 997 | | | | 21 | | |
Muenchener Rueckversicherungs-Gesellschaft
AG in Muenchen (Registered) | | | 1,614 | | | | 345 | | |
OSRAM Licht AG | | | 718 | | | | 57 | | |
Porsche Automobil Holding SE (Preference) | | | 732 | | | | 47 | | |
ProSiebenSat.1 Media SE (Registered) | | | 5,046 | | | | 172 | | |
QIAGEN N.V. (f) | | | 2,273 | | | | 72 | | |
RWE AG (f) | | | 3,195 | | | | 73 | | |
SAP SE | | | 8,658 | | | | 949 | | |
Siemens AG (Registered) | | | 7,184 | | | | 1,012 | | |
Stroeer SE & Co. KGaA | | | 803 | | | | 53 | | |
Suedzucker AG | | | 385 | | | | 8 | | |
thyssenkrupp AG | | | 4,602 | | | | 136 | | |
Uniper SE | | | 1,597 | | | | 44 | | |
Volkswagen AG | | | 272 | | | | 46 | | |
Volkswagen AG (Preference) | | | 1,362 | | | | 222 | | |
| | | | 11,567 | | |
Greece (0.1%) | |
Alpha Bank AE (f) | | | 35,159 | | | | 69 | | |
Eurobank Ergasias SA (f) | | | 49,773 | | | | 44 | | |
National Bank of Greece SA (f) | | | 208,371 | | | | 71 | | |
Piraeus Bank SA (f) | | | 9,945 | | | | 34 | | |
| | | | 218 | | |
Hong Kong (0.7%) | |
AIA Group Ltd. | | | 57,800 | | | | 426 | | |
ASM Pacific Technology Ltd. | | | 1,100 | | | | 16 | | |
Bank of East Asia Ltd. (The) | | | 5,877 | | | | 25 | | |
BOC Hong Kong Holdings Ltd. | | | 18,000 | | | | 87 | | |
Cathay Pacific Airways Ltd. (f) | | | 5,000 | | | | 8 | | |
CK Asset Holdings Ltd. | | | 12,864 | | | | 107 | | |
CK Hutchison Holdings Ltd. | | | 12,864 | | | | 164 | | |
CK Infrastructure Holdings Ltd. | | | 3,500 | | | | 30 | | |
CLP Holdings Ltd. | | | 8,000 | | | | 82 | | |
First Pacific Co., Ltd. | | | 10,000 | | | | 8 | | |
Galaxy Entertainment Group Ltd. | | | 11,000 | | | | 78 | | |
Hanergy Thin Film Power Group Ltd. (f)(g)(h) | | | 42,000 | | | | — | @ | |
Hang Lung Group Ltd. | | | 4,000 | | | | 14 | | |
Hang Lung Properties Ltd. | | | 11,000 | | | | 26 | | |
Hang Seng Bank Ltd. | | | 3,700 | | | | 90 | | |
Henderson Land Development Co., Ltd. | | | 5,491 | | | | 36 | | |
HK Electric Investments & HK Electric
Investments Ltd. (c) | | | 13,000 | | | | 12 | | |
HKT Trust & HKT Ltd. | | | 12,000 | | | | 15 | | |
Hong Kong & China Gas Co., Ltd. | | | 40,951 | | | | 77 | | |
Hong Kong Exchanges & Clearing Ltd. | | | 5,657 | | | | 152 | | |
Hongkong Land Holdings Ltd. | | | 5,600 | | | | 40 | | |
Hysan Development Co., Ltd. | | | 3,000 | | | | 14 | | |
The accompanying notes are an integral part of the consolidated financial statements.
16
Morgan Stanley Institutional Fund Trust
Annual Report — September 30, 2017
Consolidated Portfolio of Investments (cont'd)
Global Strategist Portfolio
| | | Shares | | Value
(000) | |
Hong Kong (cont'd) | |
I-CABLE Communications Ltd. (f) | | | 7,555 | | | $ | — | @ | |
Jardine Matheson Holdings Ltd. | | | 1,100 | | | | 70 | | |
Kerry Properties Ltd. | | | 3,000 | | | | 12 | | |
Li & Fung Ltd. | | | 28,000 | | | | 14 | | |
Link REIT | | | 10,533 | | | | 85 | | |
Melco Resorts & Entertainment Ltd. ADR | | | 900 | | | | 22 | | |
MGM China Holdings Ltd. | | | 4,400 | | | | 11 | | |
MTR Corp., Ltd. | | | 7,279 | | | | 43 | | |
New World Development Co., Ltd. | | | 29,097 | | | | 42 | | |
NWS Holdings Ltd. | | | 7,000 | | | | 14 | | |
PCCW Ltd. | | | 20,000 | | | | 11 | | |
Power Assets Holdings Ltd. | | | 6,500 | | | | 56 | | |
Sands China Ltd. | | | 11,600 | | | | 60 | | |
Shangri-La Asia Ltd. | | | 6,000 | | | | 11 | | |
Sino Land Co., Ltd. | | | 15,245 | | | | 27 | | |
SJM Holdings Ltd. | | | 10,000 | | | | 9 | | |
Sun Hung Kai Properties Ltd. | | | 6,504 | | | | 106 | | |
Swire Pacific Ltd., Class A | | | 2,500 | | | | 24 | | |
Swire Properties Ltd. | | | 5,550 | | | | 19 | | |
Techtronic Industries Co., Ltd. | | | 6,500 | | | | 35 | | |
WH Group Ltd. (c) | | | 38,500 | | | | 41 | | |
Wharf Holdings Ltd. (The) | | | 6,200 | | | | 55 | | |
Wheelock & Co., Ltd. | | | 4,000 | | | | 28 | | |
Wynn Macau Ltd. | | | 7,600 | | | | 21 | | |
Yue Yuen Industrial Holdings Ltd. | | | 3,500 | | | | 13 | | |
| | | | 2,336 | | |
Ireland (0.1%) | |
Bank of Ireland Group PLC (f) | | | 10,058 | | | | 82 | | |
CRH PLC | | | 8,622 | | | | 329 | | |
| | | | 411 | | |
Italy (1.7%) | |
Assicurazioni Generali SpA | | | 10,900 | | | | 203 | | |
Atlantia SpA | | | 37,233 | | | | 1,175 | | |
Banco BPM SpA (f) | | | 1,913 | | | | 8 | | |
CNH Industrial N.V. | | | 6,254 | | | | 75 | | |
Enel SpA | | | 59,837 | | | | 360 | | |
Eni SpA | | | 20,963 | | | | 347 | | |
Ferrari N.V. | | | 938 | | | | 104 | | |
Fiat Chrysler Automobiles N.V. (f) | | | 9,388 | | | | 168 | | |
Intesa Sanpaolo SpA | | | 229,047 | | | | 807 | | |
Italgas SpA (f) | | | 3,902 | | | | 22 | | |
Leonardo SpA | | | 1,132 | | | | 21 | | |
Luxottica Group SpA | | | 1,055 | | | | 59 | | |
Mediaset SpA (f) | | | 35,046 | | | | 121 | | |
Mediobanca SpA | | | 116,650 | | | | 1,252 | | |
Prysmian SpA | | | 1,136 | | | | 38 | | |
Rizzoli Corriere Della Sera Mediagroup SpA (f) | | | 636 | | | | 1 | | |
Saipem SpA (f) | | | 202 | | | | 1 | | |
Snam SpA | | | 19,513 | | | | 94 | | |
Telecom Italia SpA | | | 60,436 | | | | 46 | | |
Telecom Italia SpA (f) | | | 85,439 | | | | 80 | | |
| | | Shares | | Value
(000) | |
Tenaris SA | | | 3,918 | | | $ | 56 | | |
Terna Rete Elettrica Nazionale SpA (f) | | | 8,893 | | | | 52 | | |
UniCredit SpA (f) | | | 29,428 | | | | 627 | | |
Unione di Banche Italiane SpA | | | 14,394 | | | | 75 | | |
| | | | 5,792 | | |
Japan (5.9%) | |
Advantest Corp. | | | 1,200 | | | | 22 | | |
Aeon Co., Ltd. | | | 6,300 | | | | 93 | | |
Aisin Seiki Co., Ltd. | | | 2,100 | | | | 111 | | |
Ajinomoto Co., Inc. | | | 8,300 | | | | 162 | | |
Asahi Glass Co., Ltd. | | | 1,800 | | | | 67 | | |
Asahi Group Holdings Ltd. | | | 2,800 | | | | 113 | | |
Asahi Kasei Corp. | | | 14,000 | | | | 172 | | |
Astellas Pharma, Inc. | | | 14,400 | | | | 183 | | |
Bridgestone Corp. | | | 5,000 | | | | 227 | | |
Canon, Inc. | | | 7,900 | | | | 270 | | |
Central Japan Railway Co. | | | 1,300 | | | | 228 | | |
Chiba Bank Ltd. (The) | | | 8,000 | | | | 57 | | |
Chubu Electric Power Co., Inc. | | | 4,400 | | | | 55 | | |
Chugai Pharmaceutical Co., Ltd. | | | 2,600 | | | | 108 | | |
Chugoku Electric Power Co., Inc. (The) | | | 2,000 | | | | 21 | | |
Concordia Financial Group Ltd. | | | 11,300 | | | | 56 | | |
Dai Nippon Printing Co., Ltd. | | | 3,000 | | | | 72 | | |
Dai-ichi Life Holdings, Inc. | | | 800 | | | | 14 | | |
Daiichi Sankyo Co., Ltd. | | | 5,100 | | | | 115 | | |
Daikin Industries Ltd. | | | 2,100 | | | | 213 | | |
Daito Trust Construction Co., Ltd. | | | 800 | | | | 146 | | |
Daiwa House Industry Co., Ltd. | | | 6,000 | | | | 207 | | |
Daiwa Securities Group, Inc. | | | 16,000 | | | | 91 | | |
Denso Corp. | | | 4,600 | | | | 233 | | |
Dentsu, Inc. | | | 1,700 | | | | 75 | | |
East Japan Railway Co. | | | 2,700 | | | | 249 | | |
Eisai Co., Ltd. | | | 2,100 | | | | 108 | | |
Electric Power Development Co., Ltd. | | | 1,400 | | | | 35 | | |
FANUC Corp. | | | 1,400 | | | | 284 | | |
Fast Retailing Co., Ltd. | | | 400 | | | | 118 | | |
FUJIFILM Holdings Corp. | | | 4,300 | | | | 167 | | |
Fujitsu Ltd. | | | 14,000 | | | | 104 | | |
Hankyu Hanshin Holdings, Inc. | | | 3,600 | | | | 137 | | |
Hitachi Ltd. | | | 36,000 | | | | 254 | | |
Hokkaido Electric Power Co., Inc. | | | 2,200 | | | | 16 | | |
Hokuriku Electric Power Co. | | | 2,000 | | | | 17 | | |
Honda Motor Co., Ltd. | | | 800 | | | | 24 | | |
Honda Motor Co., Ltd. ADR | | | 10,395 | | | | 307 | | |
Hoya Corp. | | | 3,200 | | | | 173 | | |
Ibiden Co., Ltd. | | | 1,100 | | | | 18 | | |
Inpex Corp. | | | 3,200 | | | | 34 | | |
Isetan Mitsukoshi Holdings Ltd. | | | 2,800 | | | | 29 | | |
Isuzu Motors Ltd. | | | 400 | | | | 5 | | |
ITOCHU Corp. | | | 11,700 | | | | 192 | | |
Japan Real Estate Investment Corp. REIT | | | 9 | | | | 43 | | |
Japan Steel Works Ltd. (The) | | | 400 | | | | 9 | | |
The accompanying notes are an integral part of the consolidated financial statements.
17
Morgan Stanley Institutional Fund Trust
Annual Report — September 30, 2017
Consolidated Portfolio of Investments (cont'd)
Global Strategist Portfolio
| | | Shares | | Value
(000) | |
Japan (cont'd) | |
Japan Tobacco, Inc. | | | 8,700 | | | $ | 285 | | |
JFE Holdings, Inc. | | | 3,500 | | | | 68 | | |
JGC Corp. | | | 2,000 | | | | 32 | | |
JSR Corp. | | | 1,600 | | | | 30 | | |
JXTG Holdings, Inc. | | | 2,100 | | | | 11 | | |
Kansai Electric Power Co., Inc. (The) | | | 3,700 | | | | 47 | | |
Kao Corp. | | | 4,500 | | | | 265 | | |
Kawasaki Heavy Industries Ltd. | | | 2,000 | | | | 66 | | |
KDDI Corp. | | | 17,000 | | | | 448 | | |
Keikyu Corp. | | | 2,500 | | | | 51 | | |
Keio Corp. | | | 1,000 | | | | 41 | | |
Keyence Corp. | | | 800 | | | | 425 | | |
Kintetsu Group Holdings Co., Ltd. | | | 2,200 | | | | 82 | | |
Kirin Holdings Co., Ltd. | | | 7,600 | | | | 179 | | |
Kobe Steel Ltd. | | | 3,700 | | | | 42 | | |
Komatsu Ltd. | | | 7,400 | | | | 211 | | |
Konica Minolta, Inc. | | | 2,600 | | | | 21 | | |
Kubota Corp. | | | 9,800 | | | | 178 | | |
Kuraray Co., Ltd. | | | 2,600 | | | | 49 | | |
Kyocera Corp. | | | 2,400 | | | | 149 | | |
Kyushu Electric Power Co., Inc. | | | 2,000 | | | | 21 | | |
LIXIL Group Corp. | | | 2,900 | | | | 77 | | |
Makita Corp. | | | 1,600 | | | | 65 | | |
Marubeni Corp. | | | 15,900 | | | | 109 | | |
Mazda Motor Corp. | | | 2,600 | | | | 40 | | |
Mitsubishi Chemical Holdings Corp. | | | 11,700 | | | | 111 | | |
Mitsubishi Corp. | | | 9,700 | | | | 225 | | |
Mitsubishi Electric Corp. | | | 14,000 | | | | 219 | | |
Mitsubishi Estate Co., Ltd. | | | 9,000 | | | | 157 | | |
Mitsubishi Heavy Industries Ltd. | | | 2,800 | | | | 111 | | |
Mitsubishi Motors Corp. | | | 4,800 | | | | 38 | | |
Mitsui & Co., Ltd. | | | 14,600 | | | | 216 | | |
Mitsui Fudosan Co., Ltd. | | | 7,000 | | | | 152 | | |
Mitsui OSK Lines Ltd. | | | 900 | | | | 27 | | |
Mizuho Financial Group, Inc. | | | 109,300 | | | | 191 | | |
MS&AD Insurance Group Holdings, Inc. | | | 3,000 | | | | 97 | | |
Murata Manufacturing Co., Ltd. | | | 1,700 | | | | 250 | | |
NGK Insulators Ltd. | | | 2,000 | | | | 37 | | |
Nidec Corp. | | | 1,700 | | | | 209 | | |
Nikon Corp. | | | 2,600 | | | | 45 | | |
Nintendo Co., Ltd. | | | 800 | | | | 295 | | |
Nippon Building Fund, Inc. REIT | | | 9 | | | | 45 | | |
Nippon Electric Glass Co., Ltd. | | | 600 | | | | 23 | | |
Nippon Express Co., Ltd. | | | 1,100 | | | | 72 | | |
Nippon Steel & Sumitomo Metal Corp. | | | 6,000 | | | | 138 | | |
Nippon Telegraph & Telephone Corp. | | | 8,500 | | | | 390 | | |
Nippon Yusen KK (f) | | | 1,800 | | | | 37 | | |
Nissan Motor Co., Ltd. | | | 18,100 | | | | 179 | | |
Nitto Denko Corp. | | | 1,300 | | | | 108 | | |
Nomura Holdings, Inc. | | | 27,300 | | | | 153 | | |
NSK Ltd. | | | 5,300 | | | | 71 | | |
NTT Data Corp. | | | 8,000 | | | | 86 | | |
| | | Shares | | Value
(000) | |
NTT DOCOMO, Inc. | | | 11,100 | | | $ | 254 | | |
Odakyu Electric Railway Co., Ltd. | | | 4,500 | | | | 85 | | |
Oji Holdings Corp. | | | 7,000 | | | | 38 | | |
Olympus Corp. | | | 1,800 | | | | 61 | | |
Omron Corp. | | | 1,400 | | | | 71 | | |
Ono Pharmaceutical Co., Ltd. | | | 3,800 | | | | 86 | | |
Oriental Land Co., Ltd. | | | 300 | | | | 23 | | |
ORIX Corp. | | | 7,900 | | | | 127 | | |
Osaka Gas Co., Ltd. | | | 4,400 | | | | 82 | | |
Otsuka Holdings Co., Ltd. | | | 300 | | | | 12 | | |
Panasonic Corp. | | | 14,100 | | | | 204 | | |
Rakuten, Inc. | | | 7,600 | | | | 83 | | |
Resona Holdings, Inc. | | | 5,500 | | | | 28 | | |
Ricoh Co., Ltd. | | | 6,000 | | | | 58 | | |
Rohm Co., Ltd. | | | 600 | | | | 51 | | |
Secom Co., Ltd. | | | 1,600 | | | | 117 | | |
Sekisui House Ltd. | | | 6,000 | | | | 101 | | |
Seven & i Holdings Co., Ltd. | | | 6,300 | | | | 243 | | |
Sharp Corp. (f) | | | 800 | | | | 24 | | |
Shikoku Electric Power Co., Inc. | | | 2,900 | | | | 34 | | |
Shin-Etsu Chemical Co., Ltd. | | | 2,500 | | | | 224 | | |
Shionogi & Co., Ltd. | | | 3,300 | | | | 180 | | |
Shiseido Co., Ltd. | | | 3,400 | | | | 136 | | |
Shizuoka Bank Ltd. (The) | | | 8,000 | | | | 72 | | |
SMC Corp. | | | 500 | | | | 176 | | |
SoftBank Group Corp. | | | 5,600 | | | | 452 | | |
Sompo Holdings, Inc. | | | 300 | | | | 12 | | |
Sony Corp. | | | 700 | | | | 26 | | |
Sony Corp. ADR | | | 6,835 | | | | 255 | | |
Sumitomo Chemical Co., Ltd. | | | 11,000 | | | | 69 | | |
Sumitomo Corp. | | | 8,800 | | | | 127 | | |
Sumitomo Electric Industries Ltd. | | | 12,500 | | | | 204 | | |
Sumitomo Metal Mining Co., Ltd. | | | 2,500 | | | | 80 | | |
Sumitomo Mitsui Financial Group, Inc. | | | 9,800 | | | | 376 | | |
Sumitomo Mitsui Trust Holdings, Inc. | | | 2,300 | | | | 83 | | |
Sumitomo Realty & Development Co., Ltd. | | | 5,000 | | | | 151 | | |
Suzuki Motor Corp. | | | 3,200 | | | | 168 | | |
T&D Holdings, Inc. | | | 4,400 | | | | 64 | | |
Takeda Pharmaceutical Co., Ltd. | | | 5,600 | | | | 309 | | |
TDK Corp. | | | 800 | | | | 54 | | |
Terumo Corp. | | | 3,500 | | | | 138 | | |
Tobu Railway Co., Ltd. | | | 3,400 | | | | 93 | | |
Tohoku Electric Power Co., Inc. | | | 3,500 | | | | 45 | | |
Tokio Marine Holdings, Inc. | | | 3,700 | | | | 145 | | |
Tokyo Electric Power Co. Holdings, Inc. (f) | | | 7,200 | | | | 29 | | |
Tokyo Electron Ltd. | | | 1,100 | | | | 169 | | |
Tokyo Gas Co., Ltd. | | | 4,000 | | | | 98 | | |
Tokyu Corp. | | | 4,500 | | | | 64 | | |
Toppan Printing Co., Ltd. | | | 6,000 | | | | 60 | | |
Toray Industries, Inc. | | | 14,000 | | | | 136 | | |
Toshiba Corp. (f) | | | 32,000 | | | | 90 | | |
Toyota Industries Corp. | | | 1,900 | | | | 109 | | |
Toyota Motor Corp. | | | 20,600 | | | | 1,228 | | |
The accompanying notes are an integral part of the consolidated financial statements.
18
Morgan Stanley Institutional Fund Trust
Annual Report — September 30, 2017
Consolidated Portfolio of Investments (cont'd)
Global Strategist Portfolio
| | | Shares | | Value
(000) | |
Japan (cont'd) | |
Trend Micro, Inc. | | | 900 | | | $ | 44 | | |
Unicharm Corp. | | | 4,100 | | | | 94 | | |
West Japan Railway Co. | | | 1,700 | | | | 118 | | |
Yahoo Japan Corp. | | | 14,400 | | | | 68 | | |
Yamada Denki Co., Ltd. | | | 7,200 | | | | 39 | | |
Yamato Holdings Co., Ltd. | | | 5,000 | | | | 101 | | |
| | | | 19,976 | | |
Netherlands (1.7%) | |
ABN AMRO Group N.V. CVA (c) | | | 2,539 | | | | 76 | | |
Akzo Nobel N.V. | | | 3,884 | | | | 359 | | |
ASML Holding N.V. | | | 2,235 | | | | 380 | | |
Fugro N.V. CVA (f) | | | 617 | | | | 9 | | |
Heineken N.V. | | | 3,302 | | | | 326 | | |
ING Groep N.V. | | | 84,648 | | | | 1,561 | | |
Koninklijke Ahold Delhaize N.V. | | | 23,895 | | | | 447 | | |
Koninklijke DSM N.V. | | | 2,992 | | | | 245 | | |
Koninklijke KPN N.V. | | | 5,801 | | | | 20 | | |
Koninklijke Philips N.V. | | | 10,727 | | | | 443 | | |
Koninklijke Vopak N.V. | | | 945 | | | | 41 | | |
PostNL N.V. | | | 4,371 | | | | 19 | | |
Randstad Holding N.V. | | | 15,484 | | | | 958 | | |
Unilever N.V. CVA | | | 13,508 | | | | 799 | | |
| | | | 5,683 | | |
New Zealand (0.0%) | |
Auckland International Airport Ltd. | | | 4,487 | | | | 21 | | |
Contact Energy Ltd. | | | 3,355 | | | | 13 | | |
Fletcher Building Ltd. | | | 3,166 | | | | 18 | | |
Mercury NZ Ltd. | | | 3,250 | | | | 8 | | |
Meridian Energy Ltd. | | | 6,024 | | | | 13 | | |
Ryman Healthcare Ltd. | | | 1,773 | | | | 12 | | |
Spark New Zealand Ltd. | | | 8,402 | | | | 22 | | |
| | | | 107 | | |
Norway (0.4%) | |
Akastor ASA (f) | | | 1,833 | | | | 4 | | |
Aker Solutions ASA (f) | | | 1,833 | | | | 10 | | |
DNB ASA | | | 11,838 | | | | 239 | | |
Kvaerner ASA (f) | | | 1,677 | | | | 3 | | |
Norsk Hydro ASA | | | 13,781 | | | | 100 | | |
Orkla ASA | | | 10,248 | | | | 105 | | |
REC Silicon ASA (f) | | | 6,482 | | | | 1 | | |
Seadrill Ltd. (f) | | | 328 | | | | — | @ | |
Statoil ASA | | | 13,168 | | | | 263 | | |
Subsea 7 SA | | | 3,127 | | | | 51 | | |
Telenor ASA | | | 16,272 | | | | 344 | | |
Yara International ASA | | | 2,039 | | | | 91 | | |
| | | | 1,211 | | |
Poland (0.0%) | |
Jeronimo Martins SGPS SA | | | 2,885 | | | | 57 | | |
| | | Shares | | Value
(000) | |
Portugal (0.0%) | |
Galp Energia SGPS SA | | | 2,692 | | | $ | 48 | | |
Pharol SGPS SA (Registered) (f) | | | 11,120 | | | | 5 | | |
| | | | 53 | | |
Russia (0.8%) | |
Gazprom PJSC ADR | | | 98,205 | | | | 411 | | |
LUKOIL PJSC ADR | | | 7,756 | | | | 411 | | |
Magnit PJSC GDR | | | 5,591 | | | | 229 | | |
MMC Norilsk Nickel PJSC ADR | | | 11,427 | | | | 197 | | |
Mobile TeleSystems PJSC ADR | | | 8,800 | | | | 92 | | |
Novatek PJSC (Registered GDR) | | | 1,619 | | | | 190 | | |
PhosAgro PJSC GDR | | | 2,138 | | | | 30 | | |
Rosneft Oil Co., PJSC (Registered GDR) | | | 21,077 | | | | 117 | | |
Rostelecom PJSC ADR | | | 303 | | | | 2 | | |
RusHydro PJSC ADR | | | 12,497 | | | | 18 | | |
Sberbank of Russia PJSC ADR | | | 45,834 | | | | 652 | | |
Severstal PJSC GDR | | | 3,028 | | | | 45 | | |
Sistema PJSC FC GDR | | | 3,163 | | | | 15 | | |
Surgutneftegas OJSC ADR | | | 14,018 | | | | 71 | | |
Tatneft PJSC ADR | | | 2,970 | | | | 127 | | |
VTB Bank PJSC (Registered GDR) | | | 30,049 | | | | 65 | | |
X5 Retail Group N.V. GDR (f) | | | 1,816 | | | | 82 | | |
| | | | 2,754 | | |
Spain (1.5%) | |
Abertis Infraestructuras SA | | | 4,351 | | | | 88 | | |
ACS Actividades de Construccion y Servicios SA | | | 1,236 | | | | 46 | | |
Amadeus IT Group SA, Class A | | | 1,901 | | | | 124 | | |
Banco Bilbao Vizcaya Argentaria SA | | | 116,699 | | | | 1,043 | | |
Banco de Sabadell SA | | | 74,215 | | | | 155 | | |
Banco Santander SA | | | 240,561 | | | | 1,679 | | |
Bankia SA | | | 12,407 | | | | 60 | | |
Bankinter SA | | | 7,269 | | | | 69 | | |
CaixaBank SA | | | 38,136 | | | | 191 | | |
Distribuidora Internacional de Alimentacion SA | | | 6,513 | | | | 38 | | |
Enagas SA | | | 1,570 | | | | 44 | | |
Ferrovial SA (f) | | | 2,422 | | | | 53 | | |
Gas Natural SDG SA | | | 2,094 | | | | 46 | | |
Grifols SA | | | 1,782 | | | | 52 | | |
Grifols SA (Preference) Class B | | | 252 | | | | 6 | | |
Iberdrola SA | | | 36,309 | | | | 282 | | |
Industria de Diseno Textil SA | | | 9,727 | | | | 367 | | |
International Consolidated Airlines Group SA | | | 4,904 | | | | 39 | | |
Mediaset Espana Comunicacion SA | | | 9,760 | | | | 110 | | |
Red Electrica Corp., SA | | | 4,530 | | | | 95 | | |
Repsol SA | | | 5,825 | | | | 107 | | |
Telefonica SA | | | 25,110 | | | | 273 | | |
| | | | 4,967 | | |
Sweden (1.2%) | |
Assa Abloy AB, Class B | | | 8,860 | | | | 202 | | |
Atlas Copco AB, Class A | | | 8,941 | | | | 379 | | |
Atlas Copco AB, Class B | | | 6,462 | | | | 251 | | |
Electrolux AB, Class B | | | 2,657 | | | | 90 | | |
The accompanying notes are an integral part of the consolidated financial statements.
19
Morgan Stanley Institutional Fund Trust
Annual Report — September 30, 2017
Consolidated Portfolio of Investments (cont'd)
Global Strategist Portfolio
| | | Shares | | Value
(000) | |
Sweden (cont'd) | |
Essity AB, Class B (f) | | | 7,733 | | | $ | 210 | | |
Hennes & Mauritz AB, Class B | | | 9,334 | | | | 242 | | |
Husqvarna AB, Class B | | | 4,909 | | | | 50 | | |
Investor AB, Class B | | | 10,619 | | | | 524 | | |
Millicom International Cellular SA SDR | | | 1,195 | | | | 79 | | |
Modern Times Group MTG AB, Class B | | | 399 | | | | 14 | | |
Nordea Bank AB | | | 23,464 | | | | 318 | | |
Sandvik AB | | | 13,778 | | | | 238 | | |
Skandinaviska Enskilda Banken AB, Class A | | | 12,774 | | | | 168 | | |
Skanska AB, Class B | | | 2,956 | | | | 68 | | |
| SKF AB, Class B | | | 5,673 | | | | 124 | | |
Svenska Cellulosa AB SCA, Class B | | | 7,733 | | | | 66 | | |
Svenska Handelsbanken AB, Class A | | | 14,806 | | | | 223 | | |
Swedbank AB, Class A | | | 4,412 | | | | 122 | | |
Swedish Match AB | | | 3,784 | | | | 133 | | |
Telefonaktiebolaget LM Ericsson, Class B | | | 23,266 | | | | 134 | | |
Telia Co., AB | | | 28,307 | | | | 133 | | |
Volvo AB, Class B | | | 7,451 | | | | 144 | | |
| | | | 3,912 | | |
Switzerland (2.1%) | |
ABB Ltd. (Registered) | | | 17,024 | | | | 421 | | |
Adecco Group AG (Registered) | | | 18,626 | | | | 1,450 | | |
Cie Financiere Richemont SA (Registered) | | | 2,421 | | | | 221 | | |
Credit Suisse Group AG (Registered) (f) | | | 7,419 | | | | 117 | | |
Geberit AG (Registered) | | | 407 | | | | 192 | | |
Givaudan SA (Registered) | | | 45 | | | | 98 | | |
Idorsia Ltd. (f) | | | 480 | | | | 9 | | |
Julius Baer Group Ltd. (f) | | | 1,049 | | | | 62 | | |
Kuehne + Nagel International AG (Registered) | | | 333 | | | | 62 | | |
LafargeHolcim Ltd. (Registered) (f) | | | 155 | | | | 9 | | |
LafargeHolcim Ltd. (Registered) (f) | | | 1,921 | | | | 112 | | |
Lonza Group AG (Registered) (f) | | | 237 | | | | 62 | | |
Nestle SA (Registered) | | | 17,304 | | | | 1,449 | | |
Novartis AG (Registered) | | | 10,709 | | | | 917 | | |
Roche Holding AG (Genusschein) | | | 2,914 | | | | 744 | | |
SGS SA (Registered) | | | 27 | | | | 65 | | |
Sonova Holding AG (Registered) | | | 434 | | | | 74 | | |
Swatch Group AG (The) | | | 160 | | | | 67 | | |
Swiss Re AG | | | 607 | | | | 55 | | |
Swisscom AG (Registered) | | | 338 | | | | 173 | | |
Transocean Ltd. (f) | | | 1,475 | | | | 16 | | |
UBS Group AG (Registered) (f) | | | 13,830 | | | | 236 | | |
Zurich Insurance Group AG | | | 1,148 | | | | 350 | | |
| | | | 6,961 | | |
United Kingdom (3.5%) | |
| 3i Group PLC | | | 4,460 | | | | 55 | | |
Admiral Group PLC | | | 926 | | | | 23 | | |
Anglo American PLC | | | 6,220 | | | | 112 | | |
Antofagasta PLC | | | 1,840 | | | | 23 | | |
Ashtead Group PLC | | | 2,311 | | | | 56 | | |
Associated British Foods PLC | | | 1,638 | | | | 70 | | |
| | | Shares | | Value
(000) | |
AstraZeneca PLC | | | 5,916 | | | $ | 393 | | |
Auto Trader Group PLC (c) | | | 4,590 | | | | 24 | | |
Aviva PLC | | | 18,803 | | | | 130 | | |
Babcock International Group PLC | | | 1,155 | | | | 13 | | |
BAE Systems PLC | | | 14,616 | | | | 124 | | |
Barclays PLC | | | 79,291 | | | | 205 | | |
Barratt Developments PLC | | | 4,615 | | | | 38 | | |
Berkeley Group Holdings PLC | | | 596 | | | | 30 | | |
BHP Billiton PLC | | | 9,854 | | | | 174 | | |
| BP PLC | | | 91,182 | | | | 583 | | |
British American Tobacco PLC (f) | | | 10,501 | | | | 657 | | |
British American Tobacco PLC ADR | | | 693 | | | | 43 | | |
British Land Co., PLC (The) REIT | | | 4,517 | | | | 36 | | |
BT Group PLC | | | 39,218 | | | | 149 | | |
Bunzl PLC | | | 1,558 | | | | 47 | | |
Burberry Group PLC | | | 2,027 | | | | 48 | | |
Capita PLC | | | 3,057 | | | | 23 | | |
Carnival PLC | | | 907 | | | | 58 | | |
Centrica PLC | | | 25,340 | | | | 63 | | |
Cobham PLC | | | 11,137 | | | | 22 | | |
Coca-Cola European Partners PLC | | | 414 | | | | 17 | | |
Coca-Cola HBC AG (f) | | | 848 | | | | 29 | | |
Compass Group PLC | | | 7,321 | | | | 155 | | |
ConvaTec Group PLC (c) | | | 6,412 | | | | 23 | | |
Croda International PLC | | | 609 | | | | 31 | | |
DCC PLC | | | 415 | | | | 40 | | |
Diageo PLC | | | 11,604 | | | | 381 | | |
Direct Line Insurance Group PLC | | | 6,397 | | | | 31 | | |
Dixons Carphone PLC | | | 4,458 | | | | 12 | | |
easyJet PLC | | | 728 | | | | 12 | | |
Experian PLC | | | 4,367 | | | | 88 | | |
Ferguson PLC | | | 1,198 | | | | 79 | | |
Fresnillo PLC | | | 1,033 | | | | 19 | | |
G4S PLC | | | 7,220 | | | | 27 | | |
GKN PLC | | | 7,840 | | | | 36 | | |
GlaxoSmithKline PLC | | | 22,913 | | | | 457 | | |
Glencore PLC (f) | | | 57,186 | | | | 262 | | |
Hammerson PLC REIT | | | 3,662 | | | | 26 | | |
Hargreaves Lansdown PLC | | | 1,204 | | | | 24 | | |
Hikma Pharmaceuticals PLC | | | 658 | | | | 11 | | |
HSBC Holdings PLC | | | 93,612 | | | | 925 | | |
IMI PLC | | | 1,271 | | | | 21 | | |
Imperial Brands PLC (f) | | | 4,319 | | | | 184 | | |
Inmarsat PLC | | | 2,122 | | | | 18 | | |
InterContinental Hotels Group PLC | | | 845 | | | | 45 | | |
International Game Technology PLC | | | 146 | | | | 4 | | |
Intertek Group PLC | | | 753 | | | | 50 | | |
Intu Properties PLC REIT | | | 4,067 | | | | 13 | | |
Investec PLC | | | 3,090 | | | | 23 | | |
ITV PLC | | | 16,420 | | | | 38 | | |
J Sainsbury PLC | | | 7,592 | | | | 24 | | |
Johnson Matthey PLC | | | 886 | | | | 41 | | |
Kingfisher PLC | | | 10,195 | | | | 41 | | |
The accompanying notes are an integral part of the consolidated financial statements.
20
Morgan Stanley Institutional Fund Trust
Annual Report — September 30, 2017
Consolidated Portfolio of Investments (cont'd)
Global Strategist Portfolio
| | | Shares | | Value
(000) | |
United Kingdom (cont'd) | |
Land Securities Group PLC REIT | | | 3,439 | | | $ | 45 | | |
Legal & General Group PLC | | | 27,631 | | | | 96 | | |
Lloyds Banking Group PLC | | | 333,967 | | | | 303 | | |
London Stock Exchange Group PLC | | | 1,444 | | | | 74 | | |
Marks & Spencer Group PLC | | | 7,499 | | | | 35 | | |
Mediclinic International PLC | | | 1,705 | | | | 15 | | |
Meggitt PLC | | | 3,628 | | | | 25 | | |
Merlin Entertainments PLC (c) | | | 3,334 | | | | 20 | | |
Micro Focus International PLC | | | 2,034 | | | | 65 | | |
Micro Focus International PLC ADR (f) | | | 404 | | | | 13 | | |
Mondi PLC | | | 1,703 | | | | 46 | | |
National Grid PLC | | | 15,787 | | | | 196 | | |
Next PLC | | | 666 | | | | 47 | | |
Old Mutual PLC | | | 22,961 | | | | 60 | | |
Paragon Offshore PLC (f)(g)(h) | | | 303 | | | | — | | |
Pearson PLC | | | 3,865 | | | | 32 | | |
Persimmon PLC | | | 1,413 | | | | 49 | | |
Provident Financial PLC | | | 704 | | | | 8 | | |
Prudential PLC (f) | | | 12,023 | | | | 288 | | |
Randgold Resources Ltd. | | | 432 | | | | 42 | | |
Reckitt Benckiser Group PLC | | | 3,131 | | | | 286 | | |
RELX PLC | | | 4,965 | | | | 109 | | |
Rio Tinto PLC | | | 5,723 | | | | 266 | | |
Rolls-Royce Holdings PLC (f) | | | 7,749 | | | | 92 | | |
Royal Bank of Scotland Group PLC (f) | | | 16,524 | | | | 59 | | |
Royal Dutch Shell PLC, Class A | | | 20,859 | | | | 628 | | |
Royal Dutch Shell PLC, Class B | | | 17,471 | | | | 537 | | |
Royal Mail PLC | | | 4,130 | | | | 21 | | |
RSA Insurance Group PLC | | | 4,755 | | | | 40 | | |
Sage Group PLC (The) | | | 5,035 | | | | 47 | | |
Schroders PLC | | | 579 | | | | 26 | | |
Segro PLC REIT | | | 4,609 | | | | 33 | | |
Severn Trent PLC (f) | | | 1,083 | | | | 31 | | |
Shire PLC | | | 4,203 | | | | 213 | | |
Shire PLC ADR | | | 164 | | | | 25 | | |
Sky PLC | | | 4,733 | | | | 58 | | |
Smith & Nephew PLC | | | 4,069 | | | | 73 | | |
Smiths Group PLC | | | 1,839 | | | | 39 | | |
SSE PLC | | | 4,660 | | | | 87 | | |
St. James's Place PLC | | | 2,454 | | | | 38 | | |
Standard Chartered PLC (f) | | | 15,366 | | | | 153 | | |
Standard Life Aberdeen PLC | | | 12,438 | | | | 72 | | |
Tate & Lyle PLC | | | 2,143 | | | | 19 | | |
Taylor Wimpey PLC | | | 15,064 | | | | 39 | | |
Tesco PLC (f) | | | 37,739 | | | | 95 | | |
Travis Perkins PLC | | | 1,164 | | | | 23 | | |
TUI AG | | | 2,048 | | | | 35 | | |
Unilever PLC | | | 5,911 | | | | 342 | | |
United Utilities Group PLC | | | 3,131 | | | | 36 | | |
Vodafone Group PLC | | | 124,245 | | | | 348 | | |
Weir Group PLC (The) | | | 1,025 | | | | 27 | | |
Whitbread PLC | | | 846 | | | | 43 | | |
| | | Shares | | Value
(000) | |
Wm Morrison Supermarkets PLC | | | 10,078 | | | $ | 32 | | |
Worldpay Group PLC (c) | | | 9,424 | | | | 51 | | |
WPP PLC | | | 5,933 | | | | 110 | | |
| | | | 11,978 | | |
United States (10.0%) | |
3M Co. | | | 386 | | | | 81 | | |
Abbott Laboratories | | | 1,584 | | | | 85 | | |
AbbVie, Inc. | | | 1,134 | | | | 101 | | |
Abercrombie & Fitch Co., Class A | | | 189 | | | | 3 | | |
Accenture PLC, Class A | | | 759 | | | | 103 | | |
ACCO Brands Corp. (f) | | | 86 | | | | 1 | | |
Adient PLC | | | 75 | | | | 6 | | |
Adobe Systems, Inc. (f) | | | 782 | | | | 117 | | |
Adtalem Global Education, Inc. | | | 17 | | | | 1 | | |
Advance Auto Parts, Inc. | | | 189 | | | | 19 | | |
Advanced Micro Devices, Inc. (f) | | | 656 | | | | 8 | | |
AdvanSix, Inc. (f) | | | 80 | | | | 3 | | |
AES Corp. | | | 225 | | | | 2 | | |
Aetna, Inc. | | | 480 | | | | 76 | | |
Aflac, Inc. | | | 132 | | | | 11 | | |
Agilent Technologies, Inc. | | | 459 | | | | 29 | | |
Air Products & Chemicals, Inc. | | | 212 | | | | 32 | | |
Akamai Technologies, Inc. (f) | | | 281 | | | | 14 | | |
Alcoa Corp. | | | 121 | | | | 6 | | |
Alexion Pharmaceuticals, Inc. (f) | | | 272 | | | | 38 | | |
Allegheny Technologies, Inc. | | | 160 | | | | 4 | | |
Allegion PLC | | | 191 | | | | 17 | | |
Allergan PLC | | | 188 | | | | 39 | | |
Allstate Corp. (The) | | | 166 | | | | 15 | | |
Alphabet, Inc., Class A (f) | | | 305 | | | | 297 | | |
Alphabet, Inc., Class C (f) | | | 409 | | | | 392 | | |
Altria Group, Inc. | | | 1,810 | | | | 115 | | |
Amazon.com, Inc. (f) | | | 403 | | | | 387 | | |
AMC Networks, Inc., Class A (f) | | | 17 | | | | 1 | | |
Ameren Corp. | | | 544 | | | | 31 | | |
American Electric Power Co., Inc. | | | 874 | | | | 61 | | |
American Express Co. | | | 814 | | | | 74 | | |
American Tower Corp. REIT | | | 788 | | | | 108 | | |
Ameriprise Financial, Inc. | | | 450 | | | | 67 | | |
AmerisourceBergen Corp. | | | 632 | | | | 52 | | |
AMETEK, Inc. | | | 228 | | | | 15 | | |
Amgen, Inc. | | | 1,064 | | | | 198 | | |
Amphenol Corp., Class A | | | 141 | | | | 12 | | |
Anadarko Petroleum Corp. | | | 559 | | | | 27 | | |
Analog Devices, Inc. | | | 899 | | | | 77 | | |
Annaly Capital Management, Inc. REIT | | | 524 | | | | 6 | | |
Anthem, Inc. | | | 409 | | | | 78 | | |
Aon PLC | | | 165 | | | | 24 | | |
Apache Corp. | | | 520 | | | | 24 | | |
Apple, Inc. | | | 10,086 | | | | 1,554 | | |
Applied Materials, Inc. | | | 1,345 | | | | 70 | | |
Archer-Daniels-Midland Co. | | | 561 | | | | 24 | | |
The accompanying notes are an integral part of the consolidated financial statements.
21
Morgan Stanley Institutional Fund Trust
Annual Report — September 30, 2017
Consolidated Portfolio of Investments (cont'd)
Global Strategist Portfolio
| | | Shares | | Value
(000) | |
United States (cont'd) | |
Arconic, Inc. | | | 265 | | | $ | 7 | | |
AT&T, Inc. | | | 8,305 | | | | 325 | | |
Automatic Data Processing, Inc. | | | 403 | | | | 44 | | |
AutoZone, Inc. (f) | | | 195 | | | | 116 | | |
AvalonBay Communities, Inc. REIT | | | 318 | | | | 57 | | |
Avery Dennison Corp. | | | 385 | | | | 38 | | |
Avon Products, Inc. (f) | | | 1,374 | | | | 3 | | |
Baker Hughes, a GE Co. | | | 817 | | | | 30 | | |
Ball Corp. | | | 360 | | | | 15 | | |
Bank of America Corp. | | | 39,236 | | | | 994 | | |
Bank of New York Mellon Corp. (The) | | | 1,955 | | | | 104 | | |
Baxter International, Inc. | | | 821 | | | | 52 | | |
BB&T Corp. | | | 3,101 | | | | 146 | | |
Becton Dickinson and Co. | | | 412 | | | | 81 | | |
Bed Bath & Beyond, Inc. | | | 329 | | | | 8 | | |
Berkshire Hathaway, Inc., Class B (f) | | | 175 | | | | 32 | | |
Best Buy Co., Inc. | | | 301 | | | | 17 | | |
Biogen, Inc. (f) | | | 365 | | | | 114 | | |
Bioverativ, Inc. (f) | | | 132 | | | | 8 | | |
Blackhawk Network Holdings, Inc. (f) | | | 44 | | | | 2 | | |
BlackRock, Inc. | | | 186 | | | | 83 | | |
Boeing Co. (The) | | | 589 | | | | 150 | | |
Boston Properties, Inc. REIT | | | 284 | | | | 35 | | |
Boston Scientific Corp. (f) | | | 2,040 | | | | 60 | | |
Brighthouse Financial, Inc. (f) | | | 24 | | | | 1 | | |
Bristol-Myers Squibb Co. | | | 1,541 | | | | 98 | | |
Broadcom Ltd. | | | 402 | | | | 98 | | |
Brown-Forman Corp., Class B | | | 51 | | | | 3 | | |
Bunge Ltd. | | | 169 | | | | 12 | | |
CA, Inc. | | | 373 | | | | 12 | | |
California Resources Corp. (f) | | | 182 | | | | 2 | | |
Campbell Soup Co. | | | 183 | | | | 9 | | |
Capital One Financial Corp. | | | 14,696 | | | | 1,244 | | |
Cardinal Health, Inc. | | | 525 | | | | 35 | | |
CarMax, Inc. (f) | | | 212 | | | | 16 | | |
Carnival Corp. | | | 401 | | | | 26 | | |
Cars.com, Inc. (f) | | | 64 | | | | 2 | | |
Caterpillar, Inc. | | | 842 | | | | 105 | | |
CBRE Group, Inc., Class A (f) | | | 1,041 | | | | 39 | | |
CBS Corp., Class B | | | 1,125 | | | | 65 | | |
CDK Global, Inc. | | | 223 | | | | 14 | | |
Celanese Corp. Series A | | | 181 | | | | 19 | | |
Celgene Corp. (f) | | | 994 | | | | 145 | | |
CenterPoint Energy, Inc. | | | 833 | | | | 24 | | |
CenturyLink, Inc. | | | 747 | | | | 14 | | |
Cerner Corp. (f) | | | 486 | | | | 35 | | |
CF Industries Holdings, Inc. | | | 491 | | | | 17 | | |
CH Robinson Worldwide, Inc. | | | 219 | | | | 17 | | |
Charles Schwab Corp. (The) | | | 1,191 | | | | 52 | | |
Charter Communications, Inc., Class A (f) | | | 309 | | | | 112 | | |
Chemours Co. (The) | | | 142 | | | | 7 | | |
Chesapeake Energy Corp. (f) | | | 889 | | | | 4 | | |
| | | Shares | | Value
(000) | |
Chevron Corp. | | | 1,751 | | | $ | 206 | | |
Chipotle Mexican Grill, Inc. (f) | | | 184 | | | | 57 | | |
Chubb Ltd. | | | 130 | | | | 19 | | |
Cigna Corp. | | | 530 | | | | 99 | | |
Cintas Corp. | | | 274 | | | | 40 | | |
Cisco Systems, Inc. | | | 8,182 | | | | 275 | | |
CIT Group, Inc. | | | 722 | | | | 35 | | |
Citigroup, Inc. | | | 9,214 | | | | 670 | | |
Citizens Financial Group, Inc. | | | 1,149 | | | | 44 | | |
Citrix Systems, Inc. (f) | | | 302 | | | | 23 | | |
Cleveland-Cliffs, Inc. (f) | | | 178 | | | | 1 | | |
Clorox Co. (The) | | | 245 | | | | 32 | | |
CME Group, Inc. | | | 174 | | | | 24 | | |
Coach, Inc. | | | 389 | | | | 16 | | |
Coca-Cola Co. (The) | | | 5,473 | | | | 246 | | |
Cognizant Technology Solutions Corp., Class A | | | 990 | | | | 72 | | |
Colgate-Palmolive Co. | | | 1,653 | | | | 120 | | |
Comcast Corp., Class A | | | 6,169 | | | | 237 | | |
Comerica, Inc. | | | 582 | | | | 44 | | |
Conagra Brands, Inc. | | | 577 | | | | 19 | | |
Concho Resources, Inc. (f) | | | 197 | | | | 26 | | |
Conduent, Inc. (f) | | | 219 | | | | 3 | | |
ConocoPhillips | | | 1,284 | | | | 64 | | |
CONSOL Energy, Inc. (f) | | | 402 | | | | 7 | | |
Consolidated Edison, Inc. | | | 464 | | | | 37 | | |
Constellation Brands, Inc., Class A | | | 192 | | | | 38 | | |
Corning, Inc. | | | 840 | | | | 25 | | |
Costco Wholesale Corp. | | | 1,092 | | | | 179 | | |
CR Bard, Inc. | | | 173 | | | | 55 | | |
Crimson Wine Group Ltd. (f) | | | 149 | | | | 2 | | |
Crown Castle International Corp. REIT | | | 539 | | | | 54 | | |
Crown Holdings, Inc. (f) | | | 131 | | | | 8 | | |
CSX Corp. | | | 1,279 | | | | 69 | | |
Cummins, Inc. | | | 345 | | | | 58 | | |
CVS Health Corp. | | | 329 | | | | 27 | | |
Danaher Corp. | | | 145 | | | | 12 | | |
Darden Restaurants, Inc. | | | 151 | | | | 12 | | |
DaVita, Inc. (f) | | | 273 | | | | 16 | | |
Deere & Co. | | | 557 | | | | 70 | | |
Dell Technologies, Inc., Class V (f) | | | 337 | | | | 26 | | |
Denbury Resources, Inc. (f) | | | 151 | | | | — | @ | |
Devon Energy Corp. | | | 412 | | | | 15 | | |
Diamond Offshore Drilling, Inc. (f) | | | 35 | | | | 1 | | |
Discover Financial Services | | | 19,119 | | | | 1,233 | | |
Discovery Communications, Inc., Class A (f) | | | 380 | | | | 8 | | |
Discovery Communications, Inc., Class C (f) | | | 762 | | | | 15 | | |
Dollar General Corp. | | | 153 | | | | 12 | | |
Dollar Tree, Inc. (f) | | | 175 | | | | 15 | | |
Dominion Energy, Inc. | | | 1,069 | | | | 82 | | |
Donnelley Financial Solutions, Inc. (f) | | | 153 | | | | 3 | | |
Dover Corp. | | | 186 | | | | 17 | | |
DowDuPont, Inc. | | | 1,005 | | | | 70 | | |
Dr Pepper Snapple Group, Inc. | | | 206 | | | | 18 | | |
The accompanying notes are an integral part of the consolidated financial statements.
22
Morgan Stanley Institutional Fund Trust
Annual Report — September 30, 2017
Consolidated Portfolio of Investments (cont'd)
Global Strategist Portfolio
| | | Shares | | Value
(000) | |
United States (cont'd) | |
DTE Energy Co. | | | 337 | | | $ | 36 | | |
Duke Energy Corp. | | | 922 | | | | 77 | | |
Dun & Bradstreet Corp. (The) | | | 152 | | | | 18 | | |
DXC Technology Co. | | | 153 | | | | 13 | | |
East West Bancorp, Inc. | | | 326 | | | | 19 | | |
Eastman Chemical Co. | | | 216 | | | | 20 | | |
Eaton Corp., PLC | | | 516 | | | | 40 | | |
eBay, Inc. (f) | | | 1,434 | | | | 55 | | |
Ecolab, Inc. | | | 319 | | | | 41 | | |
Edison International | | | 761 | | | | 59 | | |
Edwards Lifesciences Corp. (f) | | | 182 | | | | 20 | | |
Eli Lilly & Co. | | | 880 | | | | 75 | | |
Emerson Electric Co. | | | 924 | | | | 58 | | |
Engility Holdings, Inc. (f) | | | 15 | | | | 1 | | |
Entergy Corp. | | | 271 | | | | 21 | | |
EOG Resources, Inc. | | | 847 | | | | 82 | | |
EQT Corp. | | | 163 | | | | 11 | | |
Equifax, Inc. | | | 313 | | | | 33 | | |
Equity Residential REIT | | | 569 | | | | 38 | | |
ESC Seventy Seven (f)(h) | | | 275 | | | | — | | |
Estee Lauder Cos., Inc. (The), Class A | | | 574 | | | | 62 | | |
Exelon Corp. | | | 1,337 | | | | 50 | | |
Expedia, Inc. | | | 191 | | | | 27 | | |
Expeditors International of Washington, Inc. | | | 177 | | | | 11 | | |
Express Scripts Holding Co. (f) | | | 1,211 | | | | 77 | | |
Exxon Mobil Corp. | | | 4,402 | | | | 361 | | |
Fastenal Co. | | | 404 | | | | 18 | | |
FedEx Corp. | | | 339 | | | | 76 | | |
Fidelity National Information Services, Inc. | | | 92 | | | | 9 | | |
Fifth Third Bancorp | | | 3,317 | | | | 93 | | |
First Republic Bank | | | 358 | | | | 37 | | |
First Solar, Inc. (f) | | | 227 | | | | 10 | | |
FirstEnergy Corp. | | | 554 | | | | 17 | | |
Fiserv, Inc. (f) | | | 292 | | | | 38 | | |
Flowserve Corp. | | | 214 | | | | 9 | | |
Fluor Corp. | | | 152 | | | | 6 | | |
FMC Corp. | | | 182 | | | | 16 | | |
Ford Motor Co. | | | 1,804 | | | | 22 | | |
Fortive Corp. | | | 163 | | | | 12 | | |
Four Corners Property Trust, Inc. REIT | | | 226 | | | | 6 | | |
Franklin Resources, Inc. | | | 589 | | | | 26 | | |
Freeport-McMoRan, Inc. (f) | | | 509 | | | | 7 | | |
Frontier Communications Corp. | | | 158 | | | | 2 | | |
GameStop Corp., Class A | | | 160 | | | | 3 | | |
Gannett Co., Inc. | | | 96 | | | | 1 | | |
Gap, Inc. (The) | | | 342 | | | | 10 | | |
General Dynamics Corp. | | | 231 | | | | 47 | | |
General Electric Co. | | | 4,036 | | | | 98 | | |
General Mills, Inc. | | | 906 | | | | 47 | | |
Genuine Parts Co. | | | 92 | | | | 9 | | |
GGP, Inc. REIT | | | 235 | | | | 5 | | |
Gilead Sciences, Inc. | | | 1,615 | | | | 131 | | |
| | | Shares | | Value
(000) | |
Goldman Sachs Group, Inc. (The) | | | 913 | | | $ | 217 | | |
H&R Block, Inc. | | | 604 | | | | 16 | | |
Halliburton Co. | | | 1,195 | | | | 55 | | |
Halyard Health, Inc. (f) | | | 176 | | | | 8 | | |
Harris Corp. | | | 19 | | | | 3 | | |
Hartford Financial Services Group, Inc. (The) | | | 188 | | | | 10 | | |
Hasbro, Inc. | | | 145 | | | | 14 | | |
HCP, Inc. REIT | | | 316 | | | | 9 | | |
Helmerich & Payne, Inc. | | | 180 | | | | 9 | | |
Henry Schein, Inc. (f) | | | 428 | | | | 35 | | |
Hershey Co. (The) | | | 170 | | | | 19 | | |
Hess Corp. | | | 295 | | | | 14 | | |
Hewlett Packard Enterprise Co. | | | 2,048 | | | | 30 | | |
Hologic, Inc. (f) | | | 342 | | | | 13 | | |
Home Depot, Inc. (The) | | | 222 | | | | 36 | | |
Honeywell International, Inc. | | | 869 | | | | 123 | | |
Host Hotels & Resorts, Inc. REIT | | | 1,568 | | | | 29 | | |
HP, Inc. | | | 2,048 | | | | 41 | | |
Humana, Inc. | | | 134 | | | | 33 | | |
Huntington Bancshares, Inc. | | | 2,603 | | | | 36 | | |
Huntington Ingalls Industries, Inc. | | | 49 | | | | 11 | | |
IHS Markit Ltd. (f) | | | 548 | | | | 24 | | |
ILG, Inc. | | | 164 | | | | 4 | | |
Illinois Tool Works, Inc. | | | 529 | | | | 78 | | |
Illumina, Inc. (f) | | | 165 | | | | 33 | | |
Ingersoll-Rand PLC | | | 137 | | | | 12 | | |
Ingevity Corp. (f) | | | 25 | | | | 2 | | |
Intel Corp. | | | 3,566 | | | | 136 | | |
Intercontinental Exchange, Inc. | | | 763 | | | | 52 | | |
International Business Machines Corp. | | | 1,437 | | | | 208 | | |
International Flavors & Fragrances, Inc. | | | 192 | | | | 27 | | |
International Paper Co. | | | 156 | | | | 9 | | |
Interpublic Group of Cos., Inc. (The) | | | 928 | | | | 19 | | |
Intuit, Inc. | | | 544 | | | | 77 | | |
Intuitive Surgical, Inc. (f) | | | 160 | | | | 167 | | |
Invesco Ltd. | | | 805 | | | | 28 | | |
Iron Mountain, Inc. REIT | | | 524 | | | | 20 | | |
ITT, Inc. | | | 181 | | | | 8 | | |
Jabil, Inc. | | | 183 | | | | 5 | | |
Jacobs Engineering Group, Inc. | | | 156 | | | | 9 | | |
Janus Henderson Group PLC | | | 52 | | | | 2 | | |
JB Hunt Transport Services, Inc. | | | 188 | | | | 21 | | |
JBG SMITH Properties REIT (f) | | | 86 | | | | 3 | | |
JC Penney Co., Inc. (f) | | | 183 | | | | 1 | | |
JM Smucker Co. (The) | | | 196 | | | | 21 | | |
Johnson & Johnson | | | 2,690 | | | | 350 | | |
Johnson Controls International PLC | | | 555 | | | | 22 | | |
JPMorgan Chase & Co. | | | 15,516 | | | | 1,482 | | |
Juniper Networks, Inc. | | | 1,075 | | | | 30 | | |
KBR, Inc. | | | 216 | | | | 4 | | |
Kellogg Co. | | | 344 | | | | 21 | | |
KeyCorp | | | 4,449 | | | | 84 | | |
Keysight Technologies, Inc. (f) | | | 188 | | | | 8 | | |
The accompanying notes are an integral part of the consolidated financial statements.
23
Morgan Stanley Institutional Fund Trust
Annual Report — September 30, 2017
Consolidated Portfolio of Investments (cont'd)
Global Strategist Portfolio
| | | Shares | | Value
(000) | |
United States (cont'd) | |
Kimberly-Clark Corp. | | | 777 | | | $ | 91 | | |
Kimco Realty Corp. REIT | | | 492 | | | | 10 | | |
KLA-Tencor Corp. | | | 335 | | | | 36 | | |
Knowles Corp. (f) | | | 93 | | | | 1 | | |
Kohl's Corp. | | | 368 | | | | 17 | | |
Kraft Heinz Co. (The) | | | 571 | | | | 44 | | |
Kroger Co. (The) | | | 2,403 | | | | 48 | | |
L Brands, Inc. | | | 419 | | | | 17 | | |
L3 Technologies, Inc. | | | 92 | | | | 17 | | |
Laboratory Corp. of America Holdings (f) | | | 171 | | | | 26 | | |
Lam Research Corp. | | | 165 | | | | 31 | | |
Lamb Weston Holdings, Inc. | | | 159 | | | | 7 | | |
Las Vegas Sands Corp. | | | 340 | | | | 22 | | |
Legg Mason, Inc. | | | 398 | | | | 16 | | |
Leucadia National Corp. | | | 486 | | | | 12 | | |
Liberty Global PLC, Class A (f) | | | 510 | | | | 17 | | |
Liberty Global PLC Series C (f) | | | 1,057 | | | | 35 | | |
Liberty Global PLC LiLAC, Class A (f) | | | 207 | | | | 5 | | |
Liberty Global PLC LiLAC Series C (f) | | | 172 | | | | 4 | | |
Liberty Property Trust REIT | | | 155 | | | | 6 | | |
Lockheed Martin Corp. | | | 183 | | | | 57 | | |
Loews Corp. | | | 202 | | | | 10 | | |
LogMeIn, Inc. | | | 86 | | | | 9 | | |
Lowe's Cos., Inc. | | | 1,258 | | | | 101 | | |
LSC Communications, Inc. | | | 153 | | | | 3 | | |
LyondellBasell Industries N.V., Class A | | | 159 | | | | 16 | | |
M&T Bank Corp. | | | 456 | | | | 73 | | |
Macerich Co. (The) REIT | | | 220 | | | | 12 | | |
Macy's, Inc. | | | 143 | | | | 3 | | |
Mallinckrodt PLC (f) | | | 185 | | | | 7 | | |
ManpowerGroup, Inc. | | | 295 | | | | 35 | | |
Marathon Oil Corp. | | | 743 | | | | 10 | | |
Marathon Petroleum Corp. | | | 810 | | | | 45 | | |
Marriott International, Inc., Class A | | | 489 | | | | 54 | | |
Marriott Vacations Worldwide Corp. | | | 160 | | | | 20 | | |
Marsh & McLennan Cos., Inc. | | | 202 | | | | 17 | | |
Marvell Technology Group Ltd. | | | 566 | | | | 10 | | |
Mastercard, Inc., Class A | | | 1,772 | | | | 250 | | |
Mattel, Inc. | | | 316 | | | | 5 | | |
Maxim Integrated Products, Inc. | | | 303 | | | | 14 | | |
McDonald's Corp. | | | 987 | | | | 155 | | |
McKesson Corp. | | | 361 | | | | 55 | | |
Medtronic PLC | | | 1,584 | | | | 123 | | |
Merck & Co., Inc. | | | 2,979 | | | | 191 | | |
MetLife, Inc. | | | 172 | | | | 9 | | |
MGM Resorts International | | | 504 | | | | 16 | | |
Microchip Technology, Inc. | | | 133 | | | | 12 | | |
Micron Technology, Inc. (f) | | | 972 | | | | 38 | | |
Microsoft Corp. | | | 7,203 | | | | 537 | | |
Molson Coors Brewing Co., Class B | | | 268 | | | | 22 | | |
Mondelez International, Inc., Class A | | | 1,541 | | | | 63 | | |
Monsanto Co. | | | 530 | | | | 64 | | |
| | | Shares | | Value
(000) | |
Moody's Corp. | | | 242 | | | $ | 34 | | |
Mosaic Co. (The) | | | 352 | | | | 8 | | |
Motorola Solutions, Inc. | | | 270 | | | | 23 | | |
Murphy Oil Corp. | | | 226 | | | | 6 | | |
Murphy USA, Inc. (f) | | | 188 | | | | 13 | | |
Mylan N.V. (f) | | | 428 | | | | 13 | | |
Nasdaq, Inc. | | | 535 | | | | 42 | | |
National Oilwell Varco, Inc. | | | 804 | | | | 29 | | |
Navient Corp. | | | 926 | | | | 14 | | |
NetApp, Inc. | | | 587 | | | | 26 | | |
Netflix, Inc. (f) | | | 407 | | | | 74 | | |
NetScout Systems, Inc. (f) | | | 1,290 | | | | 42 | | |
New York Community Bancorp, Inc. | | | 855 | | | | 11 | | |
Newfield Exploration Co. (f) | | | 160 | | | | 5 | | |
Newmont Mining Corp. | | | 526 | | | | 20 | | |
News Corp., Class A | | | 814 | | | | 11 | | |
News Corp., Class B | | | 151 | | | | 2 | | |
NextEra Energy, Inc. | | | 515 | | | | 75 | | |
NIKE, Inc., Class B | | | 1,241 | | | | 64 | | |
NiSource, Inc. | | | 53 | | | | 1 | | |
Noble Corp., PLC (f) | | | 173 | | | | 1 | | |
Noble Energy, Inc. | | | 534 | | | | 15 | | |
Nordstrom, Inc. | | | 173 | | | | 8 | | |
Norfolk Southern Corp. | | | 763 | | | | 101 | | |
Northern Trust Corp. | | | 27 | | | | 2 | | |
Northrop Grumman Corp. | | | 155 | | | | 45 | | |
NOW, Inc. (f) | | | 153 | | | | 2 | | |
Nucor Corp. | | | 169 | | | | 9 | | |
NVIDIA Corp. | | | 620 | | | | 111 | | |
O'Reilly Automotive, Inc. (f) | | | 142 | | | | 31 | | |
Occidental Petroleum Corp. | | | 1,326 | | | | 85 | | |
Omnicom Group, Inc. | | | 444 | | | | 33 | | |
ONE Gas, Inc. | | | 165 | | | | 12 | | |
ONEOK, Inc. | | | 517 | | | | 29 | | |
Oracle Corp. | | | 4,414 | | | | 213 | | |
Owens-Illinois, Inc. (f) | | | 199 | | | | 5 | | |
PACCAR, Inc. | | | 563 | | | | 41 | | |
Patterson Cos., Inc. | | | 145 | | | | 6 | | |
Paychex, Inc. | | | 389 | | | | 23 | | |
PayPal Holdings, Inc. (f) | | | 1,434 | | | | 92 | | |
Pentair PLC | | | 156 | | | | 11 | | |
People's United Financial, Inc. | | | 970 | | | | 18 | | |
PepsiCo, Inc. | | | 1,261 | | | | 141 | | |
Perrigo Co., PLC | | | 182 | | | | 15 | | |
Pfizer, Inc. | | | 5,545 | | | | 198 | | |
PG&E Corp. | | | 522 | | | | 36 | | |
Philip Morris International, Inc. | | | 1,567 | | | | 174 | | |
Phillips 66 | | | 815 | | | | 75 | | |
Pioneer Natural Resources Co. | | | 132 | | | | 19 | | |
Pitney Bowes, Inc. | | | 526 | | | | 7 | | |
PNC Financial Services Group, Inc. (The) | | | 1,963 | | | | 265 | | |
PPG Industries, Inc. | | | 167 | | | | 18 | | |
PPL Corp. | | | 856 | | | | 32 | | |
The accompanying notes are an integral part of the consolidated financial statements.
24
Morgan Stanley Institutional Fund Trust
Annual Report — September 30, 2017
Consolidated Portfolio of Investments (cont'd)
Global Strategist Portfolio
| | | Shares | | Value
(000) | |
United States (cont'd) | |
Praxair, Inc. | | | 369 | | | $ | 52 | | |
Priceline Group, Inc. (The) (f) | | | 196 | | | | 359 | | |
Procter & Gamble Co. (The) | | | 3,689 | | | | 336 | | |
Progressive Corp. (The) | | | 197 | | | | 10 | | |
Prologis, Inc. REIT | | | 812 | | | | 52 | | |
Prudential Financial, Inc. | | | 165 | | | | 18 | | |
Public Service Enterprise Group, Inc. | | | 874 | | | | 40 | | |
Public Storage REIT | | | 514 | | | | 110 | | |
QEP Resources, Inc. (f) | | | 249 | | | | 2 | | |
QUALCOMM, Inc. | | | 2,309 | | | | 120 | | |
Quality Care Properties, Inc. REIT (f) | | | 103 | | | | 2 | | |
Quest Diagnostics, Inc. | | | 172 | | | | 16 | | |
Ralph Lauren Corp. | | | 39 | | | | 3 | | |
Range Resources Corp. | | | 268 | | | | 5 | | |
Rayonier Advanced Materials, Inc. | | | 144 | | | | 2 | | |
Rayonier, Inc. REIT | | | 151 | | | | 4 | | |
Raytheon Co. | | | 175 | | | | 33 | | |
Regency Centers Corp. REIT | | | 190 | | | | 12 | | |
Regions Financial Corp. | | | 5,576 | | | | 85 | | |
Republic Services, Inc. | | | 573 | | | | 38 | | |
Robert Half International, Inc. | | | 395 | | | | 20 | | |
Rockwell Automation, Inc. | | | 396 | | | | 71 | | |
Rockwell Collins, Inc. | | | 149 | | | | 19 | | |
Roper Technologies, Inc. | | | 195 | | | | 47 | | |
Ross Stores, Inc. | | | 534 | | | | 34 | | |
Royal Caribbean Cruises Ltd. | | | 409 | | | | 48 | | |
RR Donnelley & Sons Co. | | | 146 | | | | 2 | | |
S&P Global, Inc. | | | 538 | | | | 84 | | |
Sabra Health Care, Inc. REIT | | | 149 | | | | 3 | | |
salesforce.com, Inc. (f) | | | 875 | | | | 82 | | |
Schlumberger Ltd. | | | 2,322 | | | | 162 | | |
Scripps Networks Interactive, Inc., Class A | | | 215 | | | | 18 | | |
Sealed Air Corp. | | | 220 | | | | 9 | | |
Sempra Energy | | | 478 | | | | 55 | | |
Sherwin-Williams Co. (The) | | | 50 | | | | 18 | | |
Signature Bank (f) | | | 126 | | | | 16 | | |
Simon Property Group, Inc. REIT | | | 876 | | | | 141 | | |
SLM Corp. (f) | | | 926 | | | | 11 | | |
Southern Co. (The) | | | 1,189 | | | | 58 | | |
Southwest Airlines Co. | | | 195 | | | | 11 | | |
Southwestern Energy Co. (f) | | | 542 | | | | 3 | | |
Sprint Corp. (f) | | | 4,311 | | | | 34 | | |
Stanley Black & Decker, Inc. | | | 196 | | | | 30 | | |
Starbucks Corp. | | | 1,619 | | | | 87 | | |
State Street Corp. | | | 481 | | | | 46 | | |
Stericycle, Inc. (f) | | | 145 | | | | 10 | | |
Stryker Corp. | | | 481 | | | | 68 | | |
SunTrust Banks, Inc. | | | 2,027 | | | | 121 | | |
SVB Financial Group (f) | | | 118 | | | | 22 | | |
Symantec Corp. | | | 1,241 | | | | 41 | | |
Synchrony Financial | | | 37,984 | | | | 1,179 | | |
Sysco Corp. | | | 1,256 | | | | 68 | | |
| | | Shares | | Value
(000) | |
T Rowe Price Group, Inc. | | | 551 | | | $ | 50 | | |
T-Mobile US, Inc. (f) | | | 96 | | | | 6 | | |
Target Corp. | | | 458 | | | | 27 | | |
TE Connectivity Ltd. | | | 542 | | | | 45 | | |
TechnipFMC PLC (f) | | | 444 | | | | 12 | | |
TEGNA, Inc. | | | 192 | | | | 3 | | |
Tenet Healthcare Corp. (f) | | | 108 | | | | 2 | | |
Texas Instruments, Inc. | | | 2,047 | | | | 184 | | |
Textron, Inc. | | | 346 | | | | 19 | | |
Thermo Fisher Scientific, Inc. | | | 545 | | | | 103 | | |
Tiffany & Co. | | | 199 | | | | 18 | | |
Time Warner, Inc. | | | 1,280 | | | | 131 | | |
Time, Inc. | | | 173 | | | | 2 | | |
TJX Cos., Inc. (The) | | | 838 | | | | 62 | | |
Travelers Cos., Inc. (The) | | | 154 | | | | 19 | | |
TripAdvisor, Inc. (f) | | | 191 | | | | 8 | | |
Twenty-First Century Fox, Inc., Class A | | | 2,918 | | | | 77 | | |
Twenty-First Century Fox, Inc., Class B | | | 509 | | | | 13 | | |
Tyson Foods, Inc., Class A | | | 516 | | | | 36 | | |
Union Pacific Corp. | | | 862 | | | | 100 | | |
United Parcel Service, Inc., Class B | | | 673 | | | | 81 | | |
United States Steel Corp. | | | 165 | | | | 4 | | |
United Technologies Corp. | | | 520 | | | | 60 | | |
UnitedHealth Group, Inc. | | | 937 | | | | 184 | | |
Urban Edge Properties REIT | | | 127 | | | | 3 | | |
Urban Outfitters, Inc. (f) | | | 153 | | | | 4 | | |
US Bancorp | | | 6,598 | | | | 354 | | |
Valero Energy Corp. | | | 715 | | | | 55 | | |
Varex Imaging Corp. (f) | | | 97 | | | | 3 | | |
Varian Medical Systems, Inc. (f) | | | 145 | | | | 15 | | |
Vectrus, Inc. (f) | | | 10 | | | | — | @ | |
Ventas, Inc. REIT | | | 170 | | | | 11 | | |
Verisk Analytics, Inc. (f) | | | 418 | | | | 35 | | |
Veritiv Corp. (f) | | | 12 | | | | — | @ | |
Verizon Communications, Inc. | | | 18,514 | | | | 916 | | |
Versum Materials, Inc. | | | 106 | | | | 4 | | |
Vertex Pharmaceuticals, Inc. (f) | | | 165 | | | | 25 | | |
VF Corp. | | | 560 | | | | 36 | | |
Viacom, Inc., Class B | | | 791 | | | | 22 | | |
Visa, Inc., Class A | | | 2,263 | | | | 238 | | |
Vornado Realty Trust REIT | | | 172 | | | | 13 | | |
Wal-Mart Stores, Inc. | | | 4,030 | | | | 315 | | |
Walgreens Boots Alliance, Inc. | | | 1,959 | | | | 151 | | |
Walt Disney Co. (The) | | | 1,890 | | | | 186 | | |
Washington Prime Group, Inc. REIT | | | 520 | | | | 4 | | |
Waste Management, Inc. | | | 763 | | | | 60 | | |
Waters Corp. (f) | | | 182 | | | | 33 | | |
Weatherford International PLC (f) | | | 833 | | | | 4 | | |
WEC Energy Group, Inc. | | | 483 | | | | 30 | | |
Wells Fargo & Co. | | | 18,338 | | | | 1,011 | | |
Welltower, Inc. REIT | | | 145 | | | | 10 | | |
Western Digital Corp. | | | 212 | | | | 18 | | |
Western Union Co. (The) | | | 1,024 | | | | 20 | | |
The accompanying notes are an integral part of the consolidated financial statements.
25
Morgan Stanley Institutional Fund Trust
Annual Report — September 30, 2017
Consolidated Portfolio of Investments (cont'd)
Global Strategist Portfolio
| | | Shares | | Value
(000) | |
United States (cont'd) | |
WestRock Co. | | | 148 | | | $ | 8 | | |
Weyerhaeuser Co. REIT | | | 622 | | | | 21 | | |
Williams Cos., Inc. (The) | | | 1,486 | | | | 45 | | |
WPX Energy, Inc. (f) | | | 743 | | | | 9 | | |
WW Grainger, Inc. | | | 221 | | | | 40 | | |
Wyndham Worldwide Corp. | | | 171 | | | | 18 | | |
Wynn Resorts Ltd. | | | 164 | | | | 24 | | |
Xcel Energy, Inc. | | | 818 | | | | 39 | | |
Xerox Corp. | | | 299 | | | | 10 | | |
Xilinx, Inc. | | | 334 | | | | 24 | | |
Xylem, Inc. | | | 359 | | | | 22 | | |
Yum! Brands, Inc. | | | 573 | | | | 42 | | |
Zimmer Biomet Holdings, Inc. | | | 358 | | | | 42 | | |
Zions Bancorporation | | | 640 | | | | 30 | | |
Zoetis, Inc. | | | 1,668 | | | | 106 | | |
| | | | 33,700 | | |
Total Common Stocks (Cost $106,609) | | | 150,741 | | |
Short-Term Investments (12.8%) | |
Investment Company (11.8%) | |
Morgan Stanley Institutional Liquidity
Funds — Government Portfolio —
Institutional Class (See Note G)
(Cost $39,976) | | | 39,975,617 | | | | 39,976 | | |
| | | Face
Amount
(000) | | | |
U.S. Treasury Securities (1.0%) | |
U.S. Treasury Bills, | |
1.17%, 4/26/18 (i)(j) | | $ | 574 | | | | 570 | | |
1.19%, 4/26/18 (i)(j) | | | 2,866 | | | | 2,847 | | |
Total U.S. Treasury Securities (Cost $3,417) | | | 3,417 | | |
Total Short-Term Investments (Cost $43,393) | | | 43,393 | | |
Total Investments (99.2%) (Cost $287,195) (k)(l) | | | 335,907 | | |
Other Assets in Excess of Liabilities (0.8%) | | | 2,721 | | |
Net Assets (100.0%) | | $ | 338,628 | | |
Country assignments and aggregations are based generally on third party vendor classifications and information, and may be different from the assignments and aggregations under the policies set forth in the Fund's prospectus and/or statement of additional information relating to geographic classifications.
(a) Security is subject to delayed delivery.
(b) Floating or Variable rate securities: The rates disclosed are as of September 30, 2017. For securities based on a published reference rate and spread, the reference rate and spread are indicated in the description in the Consolidated Portfolio of Investments. Certain variable rate securities are not based on a published reference rate and spread but are determined by the issuer or agent and are based on current market conditions. These securities do not indicate a reference rate and spread in their description in the Consolidated Portfolio of Investments.
(c) 144A security — Certain conditions for public sale may exist. Unless otherwise noted, these securities are deemed to be liquid.
(d) Perpetual — One or more securities do not have a predetermined maturity date. Rates for these securities are fixed for a period of time, after which they revert to a floating rate. Interest rates in effect are as of September 30, 2017.
(e) Multi-step — Coupon rate changes in predetermined increments to maturity. Rate disclosed is as of September 30, 2017. Maturity date disclosed is the ultimate maturity date.
(f) Non-income producing security.
(g) Security has been deemed illiquid at September 30, 2017.
(h) At September 30, 2017, the Fund held fair valued securities valued at less than $500, representing less than 0.05% of net assets. These securities have been fair valued as determined in good faith under procedures established by and under the general supervision of the Trust's Trustees.
(i) Rate shown is the yield to maturity at September 30, 2017.
(j) All or a portion of the security was pledged to cover margin requirements for swap agreements.
(k) Securities are available for collateral in connection with securities purchased on a forward commitment basis, foreign currency forward exchange contracts, futures contracts and swap agreements.
(l) At September 30, 2017, the aggregate cost for federal income tax purposes is approximately $291,810,000. The aggregate gross unrealized appreciation is approximately $54,588,000 and the aggregate gross unrealized depreciation is approximately $9,148,000, resulting in net unrealized appreciation of approximately $45,440,000.
@ Value is less than $500.
ADR American Depositary Receipt.
CDI CHESS Depositary Interest.
CVA Certificaten Van Aandelen.
EURIBOR Euro Interbank Offered Rate.
GDR Global Depositary Receipt.
IO Interest Only.
LIBOR London Interbank Offered Rate.
MTN Medium Term Note.
OAT Obligations Assimilables du Trésor (French Treasury Obligation).
OFZ Obilgatsyi Federal'novo Zaima (Russian Federal Loan Obligation).
OJSC Open Joint Stock Company.
PJSC Public Joint Stock Company.
REIT Real Estate Investment Trust.
REMIC Real Estate Mortgage Investment Conduit.
SDR Swedish Depositary Receipt.
TBA To Be Announced.
The accompanying notes are an integral part of the consolidated financial statements.
26
Morgan Stanley Institutional Fund Trust
Annual Report — September 30, 2017
Consolidated Portfolio of Investments (cont'd)
Global Strategist Portfolio
Foreign Currency Forward Exchange Contracts:
The Fund had the following foreign currency forward exchange contracts open at September 30, 2017:
Counterparty | | Contracts to
Deliver
(000) | | In Exchange
For
(000) | | Delivery
Date | | Unrealized
Appreciation
(Depreciation)
(000) | |
Australia and New Zealand Banking Group | | AUD | 2,840 | | | $ | 2,265 | | | 10/6/17 | | $ | 37 | | |
Australia and New Zealand Banking Group | | MXN | 1,792 | | | $ | 98 | | | 10/6/17 | | | (— | @) | |
Barclays Bank PLC | | MXN | 61,649 | | | $ | 3,436 | | | 10/6/17 | | | 53 | | |
Barclays Bank PLC | | $ | 39 | | | JPY | 4,379 | | | 10/6/17 | | | (— | @) | |
Citibank NA | | $ | 8,703 | | | EUR | 7,284 | | | 10/6/17 | | | (92 | ) | |
Citibank NA | | $ | 32 | | | EUR | 27 | | | 10/6/17 | | | (— | @) | |
HSBC Bank PLC | | CAD | 443 | | | $ | 358 | | | 10/6/17 | | | 3 | | |
HSBC Bank PLC | | GBP | 743 | | | $ | 970 | | | 10/6/17 | | | (25 | ) | |
HSBC Bank PLC | | NOK | 982 | | | $ | 126 | | | 10/6/17 | | | 3 | | |
HSBC Bank PLC | | $ | 4 | | | CAD | 5 | | | 10/6/17 | | | (— | @) | |
HSBC Bank PLC | | $ | 8 | | | EUR | 7 | | | 10/6/17 | | | (— | @) | |
HSBC Bank PLC | | $ | 25 | | | EUR | 21 | | | 10/6/17 | | | (— | @) | |
HSBC Bank PLC | | $ | 78 | | | GBP | 60 | | | 10/6/17 | | | 2 | | |
HSBC Bank PLC | | $ | 162 | | | NZD | 224 | | | 10/6/17 | | | — | @ | |
HSBC Bank PLC | | $ | 840 | | | PLN | 2,988 | | | 10/6/17 | | | (21 | ) | |
JPMorgan Chase Bank NA | | SEK | 5,840 | | | $ | 719 | | | 10/6/17 | | | 2 | | |
JPMorgan Chase Bank NA | | $ | 12 | | | EUR | 10 | | | 10/6/17 | | | (— | @) | |
JPMorgan Chase Bank NA | | $ | 695 | | | JPY | 75,517 | | | 10/6/17 | | | (23 | ) | |
JPMorgan Chase Bank NA | | $ | 13 | | | MXN | 233 | | | 10/6/17 | | | (— | @) | |
JPMorgan Chase Bank NA | | $ | 706 | | | NOK | 5,565 | | | 10/6/17 | | | (7 | ) | |
JPMorgan Chase Bank NA | | $ | 1,197 | | | SEK | 9,521 | | | 10/6/17 | | | (28 | ) | |
JPMorgan Chase Bank NA | | $ | 251 | | | SGD | 340 | | | 10/6/17 | | | (1 | ) | |
JPMorgan Chase Bank NA | | $ | 377 | | | THB | 12,474 | | | 10/6/17 | | | (3 | ) | |
State Street Bank and Trust Co. | | RUB | 69,401 | | | $ | 1,204 | | | 10/6/17 | | | (1 | ) | |
State Street Bank and Trust Co. | | $ | 376 | | | MYR | 1,600 | | | 10/6/17 | | | 3 | | |
UBS AG | | EUR | 169 | | | $ | 199 | | | 10/6/17 | | | (— | @) | |
UBS AG | | GBP | 127 | | | $ | 171 | | | 10/6/17 | | | — | @ | |
UBS AG | | $ | 930 | | | CHF | 888 | | | 10/6/17 | | | (13 | ) | |
UBS AG | | $ | 108 | | | DKK | 671 | | | 10/6/17 | | | (1 | ) | |
UBS AG | | $ | 12 | | | ZAR | 162 | | | 10/6/17 | | | (1 | ) | |
State Street Bank and Trust Co. | | KRW | 1,911,008 | | | $ | 1,668 | | | 10/10/17 | | | (1 | ) | |
State Street Bank and Trust Co. | | $ | 1,695 | | | KRW | 1,911,008 | | | 10/10/17 | | | (26 | ) | |
Bank of America NA | | CHF | 187 | | | $ | 193 | | | 11/9/17 | | | (1 | ) | |
Bank of America NA | | EUR | 3,169 | | | $ | 3,737 | | | 11/9/17 | | | (16 | ) | |
Bank of America NA | | ILS | 2,019 | | | $ | 562 | | | 11/9/17 | | | (10 | ) | |
Bank of America NA | | PLN | 842 | | | $ | 230 | | | 11/9/17 | | | (1 | ) | |
Bank of America NA | | PLN | 5,883 | | | $ | 1,622 | | | 11/9/17 | | | 10 | | |
Bank of America NA | | $ | 114 | | | ILS | 408 | | | 11/9/17 | | | 2 | | |
Bank of America NA | | $ | 266 | | | ILS | 953 | | | 11/9/17 | | | 4 | | |
Bank of America NA | | $ | 89 | | | ILS | 316 | | | 11/9/17 | | | 1 | | |
Bank of America NA | | $ | 114 | | | PLN | 406 | | | 11/9/17 | | | (2 | ) | |
Bank of America NA | | $ | 264 | | | PLN | 948 | | | 11/9/17 | | | (4 | ) | |
Bank of Montreal | | AUD | 58 | | | $ | 45 | | | 11/9/17 | | | — | @ | |
Bank of Montreal | | HUF | 209,475 | | | $ | 811 | | | 11/9/17 | | | 15 | | |
Bank of Montreal | | JPY | 207,939 | | | $ | 1,885 | | | 11/9/17 | | | 34 | | |
Bank of Montreal | | $ | 113 | | | HUF | 29,017 | | | 11/9/17 | | | (3 | ) | |
Bank of Montreal | | $ | 263 | | | HUF | 67,707 | | | 11/9/17 | | | (6 | ) | |
Bank of Montreal | | $ | 111 | | | HUF | 28,421 | | | 11/9/17 | | | (3 | ) | |
Bank of New York Mellon | | CHF | 28 | | | $ | 29 | | | 11/9/17 | | | (— | @) | |
Barclays Bank PLC | | AUD | 742 | | | $ | 585 | | | 11/9/17 | | | 3 | | |
Barclays Bank PLC | | EUR | 8,810 | | | $ | 10,390 | | | 11/9/17 | | | (43 | ) | |
Barclays Bank PLC | | EUR | 1,048 | | | $ | 1,254 | | | 11/9/17 | | | 13 | | |
Barclays Bank PLC | | EUR | 1,040 | | | $ | 1,248 | | | 11/9/17 | | | 17 | | |
Barclays Bank PLC | | SGD | 22 | | | $ | 16 | | | 11/9/17 | | | (— | @) | |
Barclays Bank PLC | | SGD | 313 | | | $ | 230 | | | 11/9/17 | | | (— | @) | |
Barclays Bank PLC | | $ | 425 | | | EUR | 360 | | | 11/9/17 | | | 1 | | |
Barclays Bank PLC | | $ | 437 | | | GBP | 336 | | | 11/9/17 | | | 14 | | |
Barclays Bank PLC | | $ | 2,568 | | | GBP | 1,890 | | | 11/9/17 | | | (33 | ) | |
The accompanying notes are an integral part of the consolidated financial statements.
27
Morgan Stanley Institutional Fund Trust
Annual Report — September 30, 2017
Consolidated Portfolio of Investments (cont'd)
Global Strategist Portfolio
Foreign Currency Forward Exchange Contracts: (cont'd)
Counterparty | | Contracts to
Deliver
(000) | | In Exchange
For
(000) | | Delivery
Date | | Unrealized
Appreciation
(Depreciation)
(000) | |
Barclays Bank PLC | | $ | 1,255 | | | GBP | 923 | | | 11/9/17 | | $ | (17 | ) | |
Barclays Bank PLC | | $ | 1,242 | | | GBP | 916 | | | 11/9/17 | | | (13 | ) | |
Barclays Bank PLC | | $ | 114 | | | SGD | 155 | | | 11/9/17 | | | — | @ | |
Barclays Bank PLC | | $ | 266 | | | SGD | 361 | | | 11/9/17 | | | — | @ | |
Barclays Bank PLC | | $ | 73 | | | SGD | 99 | | | 11/9/17 | | | (— | @) | |
BNP Paribas SA | | CAD | 189 | | | $ | 149 | | | 11/9/17 | | | (2 | ) | |
BNP Paribas SA | | CAD | 1,532 | | | $ | 1,214 | | | 11/9/17 | | | (14 | ) | |
BNP Paribas SA | | CAD | 3,064 | | | $ | 2,432 | | | 11/9/17 | | | (24 | ) | |
BNP Paribas SA | | CAD | 1,532 | | | $ | 1,221 | | | 11/9/17 | | | (7 | ) | |
BNP Paribas SA | | CAD | 170 | | | $ | 136 | | | 11/9/17 | | | (— | @) | |
BNP Paribas SA | | CHF | 55 | | | $ | 56 | | | 11/9/17 | | | (— | @) | |
BNP Paribas SA | | CHF | 202 | | | $ | 209 | | | 11/9/17 | | | (— | @) | |
BNP Paribas SA | | JPY | 32,263 | | | $ | 292 | | | 11/9/17 | | | 5 | | |
BNP Paribas SA | | RUB | 13,334 | | | $ | 228 | | | 11/9/17 | | | (2 | ) | |
BNP Paribas SA | | $ | 1,233 | | | RUB | 73,009 | | | 11/9/17 | | | 28 | | |
BNP Paribas SA | | $ | 2,467 | | | RUB | 146,019 | | | 11/9/17 | | | 54 | | |
BNP Paribas SA | | $ | 1,238 | | | RUB | 73,009 | | | 11/9/17 | | | 23 | | |
Citibank NA | | AUD | 274 | | | $ | 216 | | | 11/9/17 | | | 1 | | |
Citibank NA | | AUD | 250 | | | $ | 196 | | | 11/9/17 | | | (— | @) | |
Citibank NA | | CHF | 479 | | | $ | 494 | | | 11/9/17 | | | (2 | ) | |
Citibank NA | | CLP | 579,573 | | | $ | 893 | | | 11/9/17 | | | (12 | ) | |
Citibank NA | | CLP | 146,799 | | | $ | 230 | | | 11/9/17 | | | 1 | | |
Citibank NA | | EUR | 3,037 | | | $ | 3,582 | | | 11/9/17 | | | (15 | ) | |
Citibank NA | | EUR | 3,133 | | | $ | 3,713 | | | 11/9/17 | | | 3 | | |
Citibank NA | | EUR | 911 | | | $ | 1,078 | | | 11/9/17 | | | (— | @) | |
Citibank NA | | GBP | 2,865 | | | $ | 3,697 | | | 11/9/17 | | | (146 | ) | |
Citibank NA | | ILS | 813 | | | $ | 231 | | | 11/9/17 | | | — | @ | |
Citibank NA | | JPY | 201,855 | | | $ | 1,830 | | | 11/9/17 | | | 33 | | |
Citibank NA | | KRW | 966,321 | | | $ | 857 | | | 11/9/17 | | | 13 | | |
Citibank NA | | KRW | 263,534 | | | $ | 230 | | | 11/9/17 | | | (— | @) | |
Citibank NA | | RUB | 25,914 | | | $ | 422 | | | 11/9/17 | | | (25 | ) | |
Citibank NA | | RUB | 22,125 | | | $ | 360 | | | 11/9/17 | | | (22 | ) | |
Citibank NA | | THB | 30,186 | | | $ | 908 | | | 11/9/17 | | | 2 | | |
Citibank NA | | THB | 7,684 | | | $ | 230 | | | 11/9/17 | | | (1 | ) | |
Citibank NA | | TRY | 832 | | | $ | 231 | | | 11/9/17 | | | — | @ | |
Citibank NA | | TRY | 6,047 | | | $ | 1,717 | | | 11/9/17 | | | 38 | | |
Citibank NA | | TRY | 14,110 | | | $ | 3,993 | | | 11/9/17 | | | 77 | | |
Citibank NA | | $ | 114 | | | CLP | 71,866 | | | 11/9/17 | | | (1 | ) | |
Citibank NA | | $ | 266 | | | CLP | 167,687 | | | 11/9/17 | | | (4 | ) | |
Citibank NA | | $ | 105 | | | CLP | 65,719 | | | 11/9/17 | | | (2 | ) | |
Citibank NA | | $ | 3,714 | | | EUR | 3,102 | | | 11/9/17 | | | (40 | ) | |
Citibank NA | | $ | 1,138 | | | EUR | 953 | | | 11/9/17 | | | (10 | ) | |
Citibank NA | | $ | 3,688 | | | GBP | 2,834 | | | 11/9/17 | | | 114 | | |
Citibank NA | | $ | 115 | | | KRW | 128,979 | | | 11/9/17 | | | (2 | ) | |
Citibank NA | | $ | 268 | | | KRW | 300,951 | | | 11/9/17 | | | (5 | ) | |
Citibank NA | | $ | 115 | | | RUB | 6,830 | | | 11/9/17 | | | 3 | | |
Citibank NA | | $ | 270 | | | RUB | 15,937 | | | 11/9/17 | | | 5 | | |
Citibank NA | | $ | 114 | | | THB | 3,799 | | | 11/9/17 | | | (1 | ) | |
Citibank NA | | $ | 267 | | | THB | 8,865 | | | 11/9/17 | | | (1 | ) | |
Citibank NA | | $ | 5,881 | | | TRY | 21,310 | | | 11/9/17 | | | 34 | | |
Commonwealth Bank of Australia | | EUR | 4,652 | | | $ | 5,486 | | | 11/9/17 | | | (23 | ) | |
Commonwealth Bank of Australia | | GBP | 186 | | | $ | 241 | | | 11/9/17 | | | (9 | ) | |
Commonwealth Bank of Australia | | NZD | 19 | | | $ | 14 | | | 11/9/17 | | | — | @ | |
Commonwealth Bank of Australia | | $ | 15 | | | GBP | 11 | | | 11/9/17 | | | — | @ | |
Commonwealth Bank of Australia | | $ | 295 | | | GBP | 220 | | | 11/9/17 | | | — | @ | |
Credit Suisse International | | CHF | 30 | | | $ | 31 | | | 11/9/17 | | | (— | @) | |
Credit Suisse International | | EUR | 3,230 | | | $ | 3,814 | | | 11/9/17 | | | (11 | ) | |
Goldman Sachs International | | AUD | 1,062 | | | $ | 847 | | | 11/9/17 | | | 14 | | |
Goldman Sachs International | | AUD | 4,610 | | | $ | 3,635 | | | 11/9/17 | | | 21 | | |
The accompanying notes are an integral part of the consolidated financial statements.
28
Morgan Stanley Institutional Fund Trust
Annual Report — September 30, 2017
Consolidated Portfolio of Investments (cont'd)
Global Strategist Portfolio
Foreign Currency Forward Exchange Contracts: (cont'd)
Counterparty | | Contracts to
Deliver
(000) | | In Exchange
For
(000) | | Delivery
Date | | Unrealized
Appreciation
(Depreciation)
(000) | |
Goldman Sachs International | | BRL | 7,886 | | | $ | 2,490 | | | 11/9/17 | | $ | 13 | | |
Goldman Sachs International | | BRL | 733 | | | $ | 229 | | | 11/9/17 | | | (1 | ) | |
Goldman Sachs International | | BRL | 253 | | | $ | 79 | | | 11/9/17 | | | — | @ | |
Goldman Sachs International | | CHF | 222 | | | $ | 229 | | | 11/9/17 | | | (1 | ) | |
Goldman Sachs International | | CNH | 5,604 | | | $ | 829 | | | 11/9/17 | | | (13 | ) | |
Goldman Sachs International | | CNH | 1,532 | | | $ | 230 | | | 11/9/17 | | | (— | @) | |
Goldman Sachs International | | EUR | 116 | | | $ | 140 | | | 11/9/17 | | | 2 | | |
Goldman Sachs International | | EUR | 116 | | | $ | 140 | | | 11/9/17 | | | 2 | | |
Goldman Sachs International | | EUR | 116 | | | $ | 139 | | | 11/9/17 | | | 1 | | |
Goldman Sachs International | | EUR | 116 | | | $ | 139 | | | 11/9/17 | | | 1 | | |
Goldman Sachs International | | EUR | 1,222 | | | $ | 1,464 | | | 11/9/17 | | | 17 | | |
Goldman Sachs International | | EUR | 8,466 | | | $ | 9,984 | | | 11/9/17 | | | (41 | ) | |
Goldman Sachs International | | EUR | 472 | | | $ | 558 | | | 11/9/17 | | | (1 | ) | |
Goldman Sachs International | | EUR | 94 | | | $ | 112 | | | 11/9/17 | | | — | @ | |
Goldman Sachs International | | EUR | 316 | | | $ | 376 | | | 11/9/17 | | | 2 | | |
Goldman Sachs International | | HUF | 60,726 | | | $ | 230 | | | 11/9/17 | | | (— | @) | |
Goldman Sachs International | | IDR | 11,400,936 | | | $ | 845 | | | 11/9/17 | | | 2 | | |
Goldman Sachs International | | IDR | 3,108,450 | | | $ | 230 | | | 11/9/17 | | | (— | @) | |
Goldman Sachs International | | INR | 55,510 | | | $ | 864 | | | 11/9/17 | | | 18 | | |
Goldman Sachs International | | INR | 15,193 | | | $ | 231 | | | 11/9/17 | | | (— | @) | |
Goldman Sachs International | | JPY | 8,885 | | | $ | 82 | | | 11/9/17 | | | 2 | | |
Goldman Sachs International | | JPY | 8,885 | | | $ | 81 | | | 11/9/17 | | | 2 | | |
Goldman Sachs International | | JPY | 8,885 | | | $ | 81 | | | 11/9/17 | | | 1 | | |
Goldman Sachs International | | JPY | 8,885 | | | $ | 80 | | | 11/9/17 | | | 1 | | |
Goldman Sachs International | | JPY | 9,894 | | | $ | 90 | | | 11/9/17 | | | 2 | | |
Goldman Sachs International | | JPY | 37,060 | | | $ | 337 | | | 11/9/17 | | | 7 | | |
Goldman Sachs International | | JPY | 7,246 | | | $ | 66 | | | 11/9/17 | | | 2 | | |
Goldman Sachs International | | JPY | 24,257 | | | $ | 223 | | | 11/9/17 | | | 7 | | |
Goldman Sachs International | | $ | 3,161 | | | BRL | 9,839 | | | 11/9/17 | | | (71 | ) | |
Goldman Sachs International | | $ | 115 | | | CNH | 759 | | | 11/9/17 | | | (1 | ) | |
Goldman Sachs International | | $ | 267 | | | CNH | 1,771 | | | 11/9/17 | | | (1 | ) | |
Goldman Sachs International | | $ | 1,040 | | | EUR | 869 | | | 11/9/17 | | | (12 | ) | |
Goldman Sachs International | | $ | 15 | | | GBP | 11 | | | 11/9/17 | | | — | @ | |
Goldman Sachs International | | $ | 338 | | | GBP | 260 | | | 11/9/17 | | | 10 | | |
Goldman Sachs International | | $ | 115 | | | IDR | 1,539,131 | | | 11/9/17 | | | (1 | ) | |
Goldman Sachs International | | $ | 268 | | | IDR | 3,591,306 | | | 11/9/17 | | | (2 | ) | |
Goldman Sachs International | | $ | 115 | | | INR | 7,401 | | | 11/9/17 | | | (2 | ) | |
Goldman Sachs International | | $ | 268 | | | INR | 17,270 | | | 11/9/17 | | | (5 | ) | |
Goldman Sachs International | | ZAR | 5,508 | | | $ | 410 | | | 11/9/17 | | | 6 | | |
JPMorgan Chase Bank NA | | AUD | 290 | | | $ | 229 | | | 11/9/17 | | | 1 | | |
JPMorgan Chase Bank NA | | BRL | 4,452 | | | $ | 1,405 | | | 11/9/17 | | | 6 | | |
JPMorgan Chase Bank NA | | CHF | 95 | | | $ | 97 | | | 11/9/17 | | | (— | @) | |
JPMorgan Chase Bank NA | | JPY | 1,083,253 | | | $ | 9,819 | | | 11/9/17 | | | 176 | | |
JPMorgan Chase Bank NA | | JPY | 305,727 | | | $ | 2,813 | | | 11/9/17 | | | 92 | | |
JPMorgan Chase Bank NA | | JPY | 85,918 | | | $ | 764 | | | 11/9/17 | | | (1 | ) | |
JPMorgan Chase Bank NA | | NOK | 5,069 | | | $ | 639 | | | 11/9/17 | | | 2 | | |
JPMorgan Chase Bank NA | | NOK | 6,340 | | | $ | 797 | | | 11/9/17 | | | — | @ | |
JPMorgan Chase Bank NA | | TWD | 25,769 | | | $ | 855 | | | 11/9/17 | | | 4 | | |
JPMorgan Chase Bank NA | | TWD | 6,946 | | | $ | 229 | | | 11/9/17 | | | (1 | ) | |
JPMorgan Chase Bank NA | | $ | 115 | | | BRL | 367 | | | 11/9/17 | | | — | @ | |
JPMorgan Chase Bank NA | | $ | 270 | | | BRL | 856 | | | 11/9/17 | | | (1 | ) | |
JPMorgan Chase Bank NA | | $ | 2,146 | | | MXN | 39,043 | | | 11/9/17 | | | (15 | ) | |
JPMorgan Chase Bank NA | | $ | 116 | | | MXN | 2,074 | | | 11/9/17 | | | (2 | ) | |
JPMorgan Chase Bank NA | | $ | 269 | | | MXN | 4,840 | | | 11/9/17 | | | (5 | ) | |
JPMorgan Chase Bank NA | | $ | 956 | | | MXN | 17,492 | | | 11/9/17 | | | (2 | ) | |
JPMorgan Chase Bank NA | | $ | 132 | | | MXN | 2,405 | | | 11/9/17 | | | (— | @) | |
JPMorgan Chase Bank NA | | $ | 5,346 | | | TRY | 19,365 | | | 11/9/17 | | | 30 | | |
JPMorgan Chase Bank NA | | $ | 115 | | | TWD | 3,447 | | | 11/9/17 | | | (1 | ) | |
JPMorgan Chase Bank NA | | $ | 268 | | | TWD | 8,043 | | | 11/9/17 | | | (2 | ) | |
The accompanying notes are an integral part of the consolidated financial statements.
29
Morgan Stanley Institutional Fund Trust
Annual Report — September 30, 2017
Consolidated Portfolio of Investments (cont'd)
Global Strategist Portfolio
Foreign Currency Forward Exchange Contracts: (cont'd)
Counterparty | | Contracts to
Deliver
(000) | | In Exchange
For
(000) | | Delivery
Date | | Unrealized
Appreciation
(Depreciation)
(000) | |
JPMorgan Chase Bank NA | | $ | 114 | | | ZAR | 1,505 | | | 11/9/17 | | $ | (4 | ) | |
JPMorgan Chase Bank NA | | $ | 267 | | | ZAR | 3,512 | | | 11/9/17 | | | (9 | ) | |
JPMorgan Chase Bank NA | | ZAR | 3,115 | | | $ | 229 | | | 11/9/17 | | | — | @ | |
JPMorgan Chase Bank NA | | ZAR | 5,886 | | | $ | 439 | | | 11/9/17 | | | 6 | | |
State Street Bank and Trust Co. | | DKK | 435 | | | $ | 69 | | | 11/9/17 | | | (— | @) | |
State Street Bank and Trust Co. | | EUR | 729 | | | $ | 860 | | | 11/9/17 | | | (4 | ) | |
UBS AG | | AUD | 6,231 | | | $ | 4,914 | | | 11/9/17 | | | 28 | | |
UBS AG | | DKK | 3,155 | | | $ | 500 | | | 11/9/17 | | | (2 | ) | |
UBS AG | | EUR | 4,186 | | | $ | 4,937 | | | 11/9/17 | | | (21 | ) | |
UBS AG | | EUR | 2,755 | | | $ | 3,258 | | | 11/9/17 | | | (4 | ) | |
UBS AG | | HKD | 1,169 | | | $ | 150 | | | 11/9/17 | | | (— | @) | |
UBS AG | | HKD | 4,022 | | | $ | 515 | | | 11/9/17 | | | (— | @) | |
UBS AG | | SEK | 2,153 | | | $ | 271 | | | 11/9/17 | | | 6 | | |
UBS AG | | $ | 425 | | | EUR | 355 | | | 11/9/17 | | | (5 | ) | |
UBS AG | | $ | 547 | | | HKD | 4,275 | | | 11/9/17 | | | — | @ | |
UBS AG | | $ | 5,458 | | | SEK | 44,469 | | | 11/9/17 | | | 13 | | |
UBS AG | | $ | 1,002 | | | SEK | 8,164 | | | 11/9/17 | | | 2 | | |
UBS AG | | $ | 3,266 | | | SEK | 26,583 | | | 11/9/17 | | | 4 | | |
State Street Bank and Trust Co. | | $ | 1,668 | | | KRW | 1,911,008 | | | 11/10/17 | | | 1 | | |
Citibank NA | | CZK | 8,875 | | | $ | 394 | | | 2/1/18 | | | (14 | ) | |
Citibank NA | | CZK | 16,578 | | | $ | 761 | | | 2/1/18 | | | 1 | | |
Citibank NA | | CZK | 8,156 | | | $ | 376 | | | 2/1/18 | | | 2 | | |
Citibank NA | | CZK | 11,440 | | | $ | 496 | | | 2/1/18 | | | (29 | ) | |
Citibank NA | | EUR | 2,785 | | | $ | 3,036 | | | 2/1/18 | | | (279 | ) | |
Citibank NA | | EUR | 3,184 | | | $ | 3,464 | | | 2/1/18 | | | (325 | ) | |
Citibank NA | | EUR | 3,456 | | | $ | 3,768 | | | 2/1/18 | | | (346 | ) | |
Citibank NA | | EUR | 1,152 | | | $ | 1,256 | | | 2/1/18 | | | (115 | ) | |
Citibank NA | | EUR | 1,179 | | | $ | 1,281 | | | 2/1/18 | | | (123 | ) | |
Citibank NA | | EUR | 3,987 | | | $ | 4,722 | | | 2/1/18 | | | (23 | ) | |
Citibank NA | | EUR | 258 | | | $ | 307 | | | 2/1/18 | | | (— | @) | |
Citibank NA | | $ | 3,071 | | | CZK | 75,235 | | | 2/1/18 | | | 380 | | |
Citibank NA | | $ | 3,504 | | | CZK | 86,013 | | | 2/1/18 | | | 441 | | |
Citibank NA | | $ | 3,753 | | | CZK | 92,309 | | | 2/1/18 | | | 481 | | |
Citibank NA | | $ | 4,747 | | | CZK | 104,098 | | | 2/1/18 | | | 28 | | |
Citibank NA | | $ | 1,252 | | | CZK | 30,770 | | | 2/1/18 | | | 160 | | |
Citibank NA | | $ | 1,275 | | | CZK | 31,493 | | | 2/1/18 | | | 169 | | |
Citibank NA | | $ | 170 | | | CZK | 3,724 | | | 2/1/18 | | | — | @ | |
Citibank NA | | $ | 352 | | | EUR | 309 | | | 2/1/18 | | | 16 | | |
Citibank NA | | $ | 211 | | | EUR | 182 | | | 2/1/18 | | | 6 | | |
Citibank NA | | $ | 204 | | | EUR | 170 | | | 2/1/18 | | | (2 | ) | |
Citibank NA | | $ | 861 | | | EUR | 721 | | | 2/1/18 | | | (4 | ) | |
| | | | | | | | | $ | 572 | | |
Futures Contracts:
The Fund had the following futures contracts open at September 30, 2017:
| | | Number
of
Contracts | | Expiration
Date | | Notional
Amount
(000) | | Value
(000) | | Unrealized
Appreciation
(Depreciation)
(000) | |
Long: | |
Amsterdam Index (Netherlands) | | | 3 | | | Oct-17 | | | 1 | | | $ | 381 | | | $ | 6 | | |
CAC 40 Index (France) | | | 7 | | | Oct-17 | | | — | @ | | | 441 | | | | 12 | | |
German Euro BOBL (Germany) | | | 31 | | | Dec-17 | | | 3,100 | | | | 4,806 | | | | (21 | ) | |
MSCI Emerging Market E Mini (United States) | | | 447 | | | Dec-17 | | | 22 | | | | 24,346 | | | | (56 | ) | |
MSCI Singapore Free Index (Singapore) | | | 37 | | | Oct-17 | | | 4 | | | | 981 | | | | 7 | | |
S&P 500 E Mini Index (United States) | | | 387 | | | Dec-17 | | | 19 | | | | 48,686 | | | | 680 | | |
TOPIX Index (Japan) | | | 57 | | | Dec-17 | | | 570 | | | | 8,485 | | | | 488 | | |
U.S. Treasury 10 yr. Note (United States) | | | 5 | | | Dec-17 | | | 500 | | | | 626 | | | | — | @ | |
The accompanying notes are an integral part of the consolidated financial statements.
30
Morgan Stanley Institutional Fund Trust
Annual Report — September 30, 2017
Consolidated Portfolio of Investments (cont'd)
Global Strategist Portfolio
Futures Contracts: (cont'd)
| | | Number
of
Contracts | | Expiration
Date | | Notional
Amount
(000) | | Value
(000) | | Unrealized
Appreciation
(Depreciation)
(000) | |
U.S. Treasury 10 yr. Ultra Long Bond (United States) | | | 2 | | | Dec-17 | | | 200 | | | $ | 269 | | | $ | (3 | ) | |
U.S. Treasury 2 yr. Note (United States) | | | 51 | | | Dec-17 | | | 10,200 | | | | 11,001 | | | | (26 | ) | |
U.S. Treasury 30 yr. Bond (United States) | | | 5 | | | Dec-17 | | | 500 | | | | 764 | | | | (12 | ) | |
U.S. Treasury Ultra Bond (United States) | | | 9 | | | Dec-17 | | | 900 | | | | 1,486 | | | | (26 | ) | |
Short: | |
Brent Crude Futures (United Kingdom) | | | 32 | | | Oct-17 | | | (32 | ) | | | (1,817 | ) | | | 24 | | |
Euro Stoxx 50 Index (Germany) | | | 348 | | | Dec-17 | | | (3 | ) | | | (14,708 | ) | | | (364 | ) | |
German Euro BTP (Germany) | | | 14 | | | Dec-17 | | | (1,400 | ) | | | (2,233 | ) | | | 4 | | |
German Euro Bund (Germany) | | | 50 | | | Dec-17 | | | (5,000 | ) | | | (9,515 | ) | | | 51 | | |
NIKKEI 225 Index (United States) | | | 46 | | | Dec-17 | | | (23 | ) | | | (4,160 | ) | | | (155 | ) | |
OMXS 30 (Sweden) | | | 96 | | | Oct-17 | | | (10 | ) | | | (1,929 | ) | | | (90 | ) | |
U.S. Treasury 10 yr. Note (United States) | | | 21 | | | Dec-17 | | | (2,100 | ) | | | (2,632 | ) | | | 27 | | |
U.S. Treasury 10 yr. Ultra Long Bond (United States) | | | 9 | | | Dec-17 | | | (900 | ) | | | (1,209 | ) | | | 20 | | |
U.S. Treasury 5 yr. Note (United States) | | | 191 | | | Dec-17 | | | (19,100 | ) | | | (22,442 | ) | | | 175 | | |
| | | | | | | | | | | $ | 741 | | |
Interest Rate Swap Agreements:
The Fund had the following interest rate swap agreements open at September 30, 2017:
Swap Counterparty | | Floating Rate
Index | | Pay/
Receive
Floating
Rate | | Fixed
Rate | | Payment
Frequency
Paid/
Received | | Maturity
Date | | Notional
Amount
(000) | | Value
(000) | | Upfront
Payment
Paid
(Received)
(000) | | Unrealized
Appreciation
(Depreciation)
(000) | |
JPMorgan Chase
Bank NA | | 3 Month KORIBOR | | Pay | | | 1.83 | % | | Quarterly/Quarterly | | 6/14/27 | | KRW | 1,400,000 | | | $ | (23 | ) | | $ | — | | | $ | (23 | ) | |
Morgan Stanley &
Co., LLC* | | 6 Month PRIBOR | | Receive | | | 1.11 | | | Annual/Semi-Annual | | 8/7/22 | | CZK | 16,265 | | | | 7 | | | | — | | | | 7 | | |
Morgan Stanley &
Co., LLC* | | 6 Month PRIBOR | | Receive | | | 1.12 | | | Annual/Semi-Annual | | 8/7/22 | | | 140,121 | | | | 61 | | | | — | | | | 61 | | |
Morgan Stanley &
Co., LLC* | | 6 Month PRIBOR | | Receive | | | 1.06 | | | Annual/Semi-Annual | | 8/8/22 | | | 39,466 | | | | 23 | | | | — | | | | 23 | | |
Morgan Stanley &
Co., LLC* | | 6 Month PRIBOR | | Receive | | | 1.07 | | | Annual/Semi-Annual | | 8/14/22 | | | 39,076 | | | | 22 | | | | — | | | | 22 | | |
Morgan Stanley &
Co., LLC* | | 6 Month PRIBOR | | Receive | | | 1.07 | | | Annual/Semi-Annual | | 8/14/22 | | | 39,076 | | | | 22 | | | | — | | | | 22 | | |
Morgan Stanley &
Co., LLC* | | 6 Month PRIBOR | | Receive | | | 1.06 | | | Annual/Semi-Annual | | 8/15/22 | | | 39,075 | | | | 23 | | | | — | | | | 23 | | |
Morgan Stanley &
Co., LLC* | | 6 Month PRIBOR | | Receive | | | 1.09 | | | Annual/Semi-Annual | | 8/15/22 | | | 80,491 | | | | 43 | | | | — | | | | 43 | | |
Morgan Stanley &
Co., LLC* | | 6 Month PRIBOR | | Receive | | | 1.12 | | | Annual/Semi-Annual | | 8/22/22 | | | 19,734 | | | | 10 | | | | — | | | | 10 | | |
Morgan Stanley &
Co., LLC* | | 6 Month PRIBOR | | Receive | | | 1.10 | | | Annual/Semi-Annual | | 8/23/22 | | | 39,469 | | | | 20 | | | | — | | | | 20 | | |
Morgan Stanley &
Co., LLC* | | 6 Month PRIBOR | | Receive | | | 1.10 | | | Annual/Semi-Annual | | 8/23/22 | | | 39,469 | | | | 20 | | | | — | | | | 20 | | |
Morgan Stanley &
Co., LLC* | | 6 Month PRIBOR | | Receive | | | 1.10 | | | Annual/Semi-Annual | | 8/23/22 | | | 39,469 | | | | 20 | | | | — | | | | 20 | | |
Morgan Stanley &
Co., LLC* | | 6 Month PRIBOR | | Receive | | | 1.12 | | | Annual/Semi-Annual | | 8/24/22 | | | 17,896 | | | | 9 | | | | — | | | | 9 | | |
Morgan Stanley &
Co., LLC* | | 6 Month PRIBOR | | Receive | | | 1.12 | | | Annual/Semi-Annual | | 8/24/22 | | | 39,469 | | | | 19 | | | | — | | | | 19 | | |
Morgan Stanley &
Co., LLC* | | 3 Month LIBOR | | Receive | | | 2.45 | | | Semi-Annual/Quarterly | | 7/17/25 | | $ | 3,400 | | | | (69 | ) | | | — | @ | | | (69 | ) | |
The accompanying notes are an integral part of the consolidated financial statements.
31
Morgan Stanley Institutional Fund Trust
Annual Report — September 30, 2017
Consolidated Portfolio of Investments (cont'd)
Global Strategist Portfolio
Interest Rate Swap Agreements: (cont'd)
Swap Counterparty | | Floating Rate
Index | | Pay/
Receive
Floating
Rate | | Fixed
Rate | | Payment
Frequency
Paid/
Received | | Maturity
Date | | Notional
Amount
(000) | | Value
(000) | | Upfront
Payment
Paid
(Received)
(000) | | Unrealized
Appreciation
(Depreciation)
(000) | |
Morgan Stanley &
Co., LLC* | | 6 Month EURIBOR | | Receive | | | 0.46 | % | | Annual/Semi-Annual | | 6/14/26 | | EUR | 1,052 | | | $ | 29 | | | $ | (52 | ) | | $ | 81 | | |
Morgan Stanley &
Co., LLC* | | 6 Month EURIBOR | | Receive | | | 0.40 | | | Annual/Semi-Annual | | 10/26/26 | | | 505 | | | | 19 | | | | — | | | | 19 | | |
Morgan Stanley &
Co., LLC* | | 6 Month EURIBOR | | Receive | | | 0.64 | | | Annual/Semi-Annual | | 11/24/26 | | | 646 | | | | 7 | | | | — | | | | 7 | | |
Morgan Stanley &
Co., LLC* | | 6 Month EURIBOR | | Receive | | | 0.81 | | | Annual/Semi-Annual | | 1/30/27 | | | 1,220 | | | | (6 | ) | | | — | | | | (6 | ) | |
Morgan Stanley &
Co., LLC* | | 6 Month EURIBOR | | Receive | | | 0.73 | | | Annual/Semi-Annual | | 6/23/27 | | | 2,130 | | | | 27 | | | | — | | | | 27 | | |
Morgan Stanley &
Co., LLC* | | 6 Month EURIBOR | | Receive | | | 0.99 | | | Annual/Semi-Annual | | 7/11/27 | | | 7,427 | | | | (108 | ) | | | — | | | | (108 | ) | |
Morgan Stanley &
Co., LLC* | | 3 Month LIBOR | | Receive | | | 2.74 | | | Semi-Annual/Quarterly | | 12/21/46 | | $ | 640 | | | | (28 | ) | | | — | | | | (28 | ) | |
Morgan Stanley &
Co., LLC* | | 3 Month LIBOR | | Receive | | | 2.48 | | | Semi-Annual/Quarterly | | 5/23/47 | | | 730 | | | | 9 | | | | — | | | | 9 | | |
| | | | | | | | | | | | | $ | 2,006,826 | | | $ | 156 | | | $ | (52 | ) | | $ | 208 | | |
Total Return Swap Agreements:
The Fund had the following total return swap agreements open at September 30, 2017:
Swap Counterparty | | Index | | Pay/
Receive
Total
Return of
Referenced
Index | | Floating
Rate | | Payment
Frequency | | Maturity
Date | | Notional
Amount
(000) | | Value
(000) | | Upfront
Payment
Paid
(000) | | Unrealized
Appreciation
(Depreciation)
(000) | |
BNP Paribas SA
| | BNP European
Staples Index†† | | Pay | | 3 Month USD LIBOR
plus 0.15% | | Quarterly | | 7/17/18 | | $ | 2,589 | | | $ | (47 | ) | | $ | — | | | $ | (47 | ) | |
BNP Paribas SA
| | MSCI World
Energy
Equipment &
Services Index | | Pay | | 3 Month USD LIBOR
plus 0.03% | | Quarterly | | 9/6/18 | | | 2,579 | | | | (244 | ) | | | — | | | | (244 | ) | |
JPMorgan Chase
Bank NA
| | JPM Custom
China Tier 2
Banks Index†† | | Pay | | 3 Month USD LIBOR
plus 0.10% | | Quarterly | | 3/15/18 | | | 2,451 | | | | 108 | | | | — | | | | 108 | | |
JPMorgan Chase
Bank NA
| | JPM Custom
China Tier 2
Banks Index†† | | Pay | | 3 Month USD LIBOR
minus 0.10% | | Quarterly | | 3/15/18 | | | 662 | | | | 29 | | | | — | | | | 29 | | |
JPMorgan Chase
Bank NA
| | JPM Custom
China Tier 2
Banks Index†† | | Pay | | 3 Month USD LIBOR
minus 0.10% | | Quarterly | | 3/15/18 | | | 639 | | | | 28 | | | | — | | | | 28 | | |
| | | | | | | | | | | | | $ | 8,920 | | | $ | (126 | ) | | $ | — | | | $ | (126 | ) | |
†† See tables below for details of the equity basket holdings underlying the swap.
The accompanying notes are an integral part of the consolidated financial statements.
32
Morgan Stanley Institutional Fund Trust
Annual Report — September 30, 2017
Consolidated Portfolio of Investments (cont'd)
Global Strategist Portfolio
The following table represents the equity basket holdings underlying the total return swap with BNP European Staples Index as of September 30, 2017.
Security Description | | Shares | | Value
(000) | | Index Weight | |
BNP European Staples Index | |
Anheuser-Busch InBev SA | | | 53,953 | | | $ | 5,465 | | | | 8.28 | % | |
Associated British Foods PLC | | | 25,645 | | | | 81,885 | | | | 1.41 | | |
Barry Callebaut AG | | | 155 | | | | 230 | | | | 0.31 | | |
Beiersdorf AG | | | 7,159 | | | | 652 | | | | 0.99 | | |
British American Tobacco PLC | | | 131,927 | | | | 616,362 | | | | 10.59 | | |
Carlsberg A/S | | | 7,621 | | | | 5,251 | | | | 1.07 | | |
Carrefour SA | | | 40,440 | | | | 691 | | | | 1.05 | | |
Casino Guichard Perrachon SA | | | 3,899 | | | | 196 | | | | 0.30 | | |
CECONOMY AG | | | 12,540 | | | | 125 | | | | 0.19 | | |
Chocoladefabriken Lindt & Spruengli AG | | | 7 | | | | 483 | | | | 0.64 | | |
Chocoladefabriken Lindt & Spruengli AG | | | 72 | | | | 396 | | | | 0.52 | | |
Coca-Cola European Partners PLC | | | 15,509 | | | | 550 | | | | 0.83 | | |
Coca-Cola HBC AG | | | 12,855 | | | | 32,458 | | | | 0.56 | | |
Colruyt SA | | | 4,259 | | | | 185 | | | | 0.28 | | |
Danone SA | | | 42,055 | | | | 2,791 | | | | 4.23 | | |
Diageo PLC | | | 179,278 | | | | 439,769 | | | | 7.56 | | |
Distribuidora Internacional de Alimentac | | | 44,453 | | | | 219 | | | | 0.33 | | |
Essity AB | | | 42,570 | | | | 9,433 | | | | 1.48 | | |
Heineken Holding N.V. | | | 7,150 | | | | 568 | | | | 0.86 | | |
Heineken N.V. | | | 16,374 | | | | 1,370 | | | | 2.07 | | |
Henkel AG & Co., KGaA | | | 12,691 | | | | 1,461 | | | | 2.21 | | |
Henkel AG & Co., KGaA | | | 7,356 | | | | 757 | | | | 1.15 | | |
ICA Gruppen AB | | | 5,683 | | | | 1,740 | | | | 0.27 | | |
Imperial Brands PLC | | | 68,140 | | | | 216,959 | | | | 3.73 | | |
J Sainsbury PLC | | | 116,871 | | | | 27,804 | | | | 0.48 | | |
Jeronimo Martins SGPS SA | | | 17,893 | | | | 299 | | | | 0.45 | | |
Kerry Group PLC | | | 11,352 | | | | 923 | | | | 1.40 | | |
Koninklijke Ahold Delhaize N.V. | | | 90,597 | | | | 1,433 | | | | 2.17 | | |
L'Oreal SA | | | 17,886 | | | | 3,218 | | | | 4.87 | | |
Marine Harvest ASA | | | 27,132 | | | | 4,273 | | | | 0.69 | | |
METRO AG | | | 12,540 | | | | 224 | | | | 0.34 | | |
Nestle SA | | | 96,922 | | | | 7,860 | | | | 10.41 | | |
Orkla ASA | | | 57,788 | | | | 4,721 | | | | 0.76 | | |
Pernod Ricard SA | | | 15,089 | | | | 1,766 | | | | 2.67 | | |
Reckitt Benckiser Group PLC | | | 47,438 | | | | 323,195 | | | | 5.55 | | |
Remy Cointreau SA | | | 1,589 | | | | 159 | | | | 0.24 | | |
Swedish Match AB | | | 13,425 | | | | 3,836 | | | | 0.60 | | |
Tate & Lyle PLC | | | 32,785 | | | | 21,261 | | | | 0.37 | | |
Tesco PLC | | | 585,678 | | | | 109,610 | | | | 1.88 | | |
Unilever N.V. | | | 116,010 | | | | 5,805 | | | | 8.79 | | |
Unilever PLC | | | 91,398 | | | | 394,749 | | | | 6.78 | | |
Wm Morrison Supermarkets PLC | | | 158,517 | | | | 37,109 | | | | 0.64 | | |
| | | | | | $ | 2,368,244 | | | | 100.00 | % | |
The following table represents the equity basket holdings underlying the total return swap with JPM Custom China Tier 2 Banks Index as of September 30, 2017.
| Security Description | | Shares | | Value
(000) | | Index Weight | |
JPM Custom China Tier 2 Banks Index | |
Bank of Communications Co., Ltd. | | | 230,551 | | | $ | 1,314 | | | | 12.65 | % | |
China CITIC Bank Corp., Ltd. | | | 743,160 | | | | 3,686 | | | | 35.48 | | |
China Everbright Bank Co., Ltd. | | | 57,105 | | | | 206 | | | | 1.99 | | |
China Merchants Bank Co., Ltd. | | | 131,691 | | | | 3,615 | | | | 34.80 | | |
China Minsheng Banking Corp., Ltd. | | | 165,248 | | | | 1,183 | | | | 11.39 | | |
Chongqing Rural Commercial Bank Co., Ltd. | | | 77,532 | | | | 384 | | | | 3.69 | | |
| | | | | | $ | 10,388 | | | | 100.00 | % | |
The accompanying notes are an integral part of the consolidated financial statements.
33
Morgan Stanley Institutional Fund Trust
Annual Report — September 30, 2017
Consolidated Portfolio of Investments (cont'd)
Global Strategist Portfolio
@ Value is less than $500.
* Cleared swap agreement, the broker is Morgan Stanley & Co., LLC.
EURIBOR Euro Interbank Offered Rate.
KORIBOR Korea Interbank Offered Rate.
LIBOR London Interbank Offered Rate.
PRIBOR Prague Interbank Offered Rate.
AUD — Australian Dollar
BRL — Brazilian Real
CAD — Canadian Dollar
CHF — Swiss Franc
CLP — Chilean Peso
CNH — Chinese Yuan Renminbi Offshore
CZK — Czech Koruna
DKK — Danish Krone
EUR — Euro
GBP — British Pound
HKD — Hong Kong Dollar
HUF — Hungarian Forint
IDR — Indonesian Rupiah
ILS — Israeli Shekel
INR — Indian Rupee
JPY — Japanese Yen
KRW — South Korean Won
MXN — Mexican Peso
MYR — Malaysian Ringgit
NOK — Norwegian Krone
NZD — New Zealand Dollar
PLN — Polish Zloty
RUB — Russian Ruble
SEK — Swedish Krona
SGD — Singapore Dollar
THB — Thai Baht
TRY — Turkish Lira
TWD — Taiwan Dollar
USD — United States Dollar
ZAR — South African Rand
Portfolio Composition
Classification | | Percentage of
Total Investments | |
Common Stocks | | | 44.9 | % | |
Fixed Income Securities | | | 42.2 | | |
Short-Term Investments | | | 12.9 | | |
Total Investments | | | 100.0 | %** | |
** Does not include open long/short futures contracts with an underlying face amount of approximately $162,917,000 with net unrealized appreciation of approximately $741,000. Does not include open foreign currency forward exchange contracts with net unrealized appreciation of approximately $572,000 and does not include open swap agreements with net unrealized depreciation of approximately $82,000.
The accompanying notes are an integral part of the consolidated financial statements.
34
Morgan Stanley Institutional Fund Trust
Annual Report — September 30, 2017
Global Strategist Portfolio
Consolidated Statement of Assets and Liabilities | | September 30, 2017
(000) | |
Assets: | |
Investments in Securities of Unaffiliated Issuers, at Value (Cost $247,219) | | $ | 295,931 | | |
Investment in Security of Affiliated Issuer, at Value (Cost $39,976) | | | 39,976 | | |
Total Investments in Securities, at Value (Cost $287,195) | | | 335,907 | | |
Foreign Currency, at Value (Cost $433) | | | 431 | | |
Receivable for Variation Margin on Futures Contracts | | | 5,283 | | |
Receivable for Investments Sold | | | 3,316 | | |
Unrealized Appreciation on Foreign Currency Forward Exchange Contracts | | | 2,839 | | |
Interest and Paydown Receivable | | | 913 | | |
Dividends Receivable | | | 265 | | |
Tax Reclaim Receivable | | | 232 | | |
Unrealized Appreciation on Swap Agreements | | | 165 | | |
Receivable from Affiliate | | | 17 | | |
Receivable for Fund Shares Sold | | | 14 | | |
Receivable for Swap Agreements Termination | | | 8 | | |
Other Assets | | | 72 | | |
Total Assets | | | 349,462 | | |
Liabilities: | |
Payable for Investments Purchased | | | 6,485 | | |
Unrealized Depreciation on Foreign Currency Forward Exchange Contracts | | | 2,267 | | |
Due to Broker | | | 616 | | |
Payable for Fund Shares Redeemed | | | 336 | | |
Unrealized Depreciation on Swap Agreements | | | 314 | | |
Payable for Advisory Fees | | | 293 | | |
Payable for Trustees' Fees and Expenses | | | 133 | | |
Payable for Custodian Fees | | | 82 | | |
Payable for Shareholder Services Fees — Class A | | | 51 | | |
Payable for Distribution and Shareholder Services Fees — Class L | | | 13 | | |
Payable for Distribution and Shareholder Services Fees — Class C | | | 1 | | |
Payable for Sub Transfer Agency Fees — Class I | | | 6 | | |
Payable for Sub Transfer Agency Fees — Class A | | | 48 | | |
Payable for Sub Transfer Agency Fees — Class L | | | 6 | | |
Payable for Sub Transfer Agency Fees — Class C | | | — | @ | |
Payable for Professional Fees | | | 29 | | |
Payable for Administration Fees | | | 22 | | |
Payable for Transfer Agency Fees — Class I | | | 4 | | |
Payable for Transfer Agency Fees — Class A | | | 13 | | |
Payable for Transfer Agency Fees — Class L | | | 2 | | |
Payable for Transfer Agency Fees — Class C | | | 1 | | |
Payable for Transfer Agency Fees — Class IS | | | 1 | | |
Payable for Variation Margin on Swap Agreements | | | 7 | | |
Other Liabilities | | | 104 | | |
Total Liabilities | | | 10,834 | | |
Net Assets | | $ | 338,628 | | |
Net Assets Consist Of: | |
Paid-in-Capital | | $ | 274,050 | | |
Accumulated Undistributed Net Investment Income | | | 315 | | |
Accumulated Undistributed Net Realized Gain | | | 14,143 | | |
Unrealized Appreciation (Depreciation) on: | |
Investments | | | 48,712 | | |
Futures Contracts | | | 741 | | |
Swap Agreements | | | 82 | | |
Foreign Currency Forward Exchange Contracts | | | 572 | | |
Foreign Currency Translations | | | 13 | | |
Net Assets | | $ | 338,628 | | |
The accompanying notes are an integral part of the consolidated financial statements.
35
Morgan Stanley Institutional Fund Trust
Annual Report — September 30, 2017
Global Strategist Portfolio
Consolidated Statement of Assets and Liabilities (cont'd) | | September 30, 2017
(000) | |
CLASS I: | |
Net Assets | | $ | 69,017 | | |
| Shares Outstanding (unlimited number of shares authorized, no par value) (not in 000's) | | | 3,948,420 | | |
Net Asset Value, Offering and Redemption Price Per Share | | $ | 17.48 | | |
CLASS A: | |
Net Assets | | $ | 247,483 | | |
| Shares Outstanding (unlimited number of shares authorized, no par value) (not in 000's) | | | 14,285,948 | | |
Net Asset Value, Redemption Price Per Share | | $ | 17.32 | | |
Maximum Sales Load | | | 5.25 | % | |
Maximum Sales Charge | | $ | 0.96 | | |
Maximum Offering Price Per Share | | $ | 18.28 | | |
CLASS L: | |
Net Assets | | $ | 20,605 | | |
| Shares Outstanding (unlimited number of shares authorized, no par value) (not in 000's) | | | 1,201,693 | | |
Net Asset Value, Offering and Redemption Price Per Share | | $ | 17.15 | | |
CLASS C: | |
Net Assets | | $ | 1,386 | | |
| Shares Outstanding (unlimited number of shares authorized, no par value) (not in 000's) | | | 81,121 | | |
Net Asset Value, Offering and Redemption Price Per Share | | $ | 17.08 | | |
CLASS IS: | |
Net Assets | | $ | 137 | | |
| Shares Outstanding (unlimited number of shares authorized, no par value) (not in 000's) | | | 7,830 | | |
Net Asset Value, Offering and Redemption Price Per Share | | $ | 17.49 | | |
@ Amount is less than $500.
The accompanying notes are an integral part of the consolidated financial statements.
36
Morgan Stanley Institutional Fund Trust
Annual Report — September 30, 2017
Global Strategist Portfolio
Consolidated Statement of Operations | | Year Ended
September 30, 2017
(000) | |
Investment Income: | |
Dividends from Securities of Unaffiliated Issuers (Net of $378 of Foreign Taxes Withheld) | | $ | 4,518 | | |
Interest from Securities of Unaffiliated Issuers | | | 4,077 | | |
Dividends from Security of Affiliated Issuer (Note G) | | | 242 | | |
Total Investment Income | | | 8,837 | | |
Expenses: | |
Advisory Fees (Note B) | | | 1,549 | | |
Shareholder Services Fees — Class A (Note D) | | | 615 | | |
Distribution and Shareholder Services Fees — Class L (Note D) | | | 156 | | |
Distribution and Shareholder Services Fees — Class C (Note D) | | | 14 | | |
Sub Transfer Agency Fees — Class I | | | 48 | | |
Sub Transfer Agency Fees — Class A | | | 229 | | |
Sub Transfer Agency Fees — Class L | | | 25 | | |
Sub Transfer Agency Fees — Class C | | | 1 | | |
Administration Fees (Note C) | | | 274 | | |
Custodian Fees (Note F) | | | 219 | | |
Professional Fees | | | 211 | | |
Pricing Fees | | | 129 | | |
Shareholder Reporting Fees | | | 77 | | |
Registration Fees | | | 70 | | |
Transfer Agency Fees — Class I (Note E) | | | 12 | | |
Transfer Agency Fees — Class A (Note E) | | | 39 | | |
Transfer Agency Fees — Class L (Note E) | | | 5 | | |
Transfer Agency Fees — Class C (Note E) | | | 2 | | |
Transfer Agency Fees — Class IS (Note E) | | | 2 | | |
Organization Costs for Subsidiary | | | 50 | | |
Trustees' Fees and Expenses | | | 9 | | |
Other Expenses | | | 40 | | |
Total Expenses | | | 3,776 | | |
Waiver of Advisory Fees (Note B) | | | (197 | ) | |
Rebate from Morgan Stanley Affiliate (Note G) | | | (59 | ) | |
Reimbursement of Class Specific Expenses — Class I (Note B) | | | (38 | ) | |
Reimbursement of Class Specific Expenses — Class L (Note B) | | | (3 | ) | |
Reimbursement of Class Specific Expenses — Class C (Note B) | | | (2 | ) | |
Reimbursement of Class Specific Expenses — Class IS (Note B) | | | (2 | ) | |
Net Expenses | | | 3,475 | | |
Net Investment Income | | | 5,362 | | |
Realized Gain (Loss): | |
Investments Sold (Net of $149 of Capital Gain Country Tax) | | | 13,952 | | |
Investments in Affiliates | | | (18 | ) | |
Foreign Currency Forward Exchange Contracts | | | (273 | ) | |
Foreign Currency Transactions | | | (67 | ) | |
Futures Contracts | | | 11,555 | | |
Swap Agreements | | | (3,031 | ) | |
Net Realized Gain | | | 22,118 | | |
Change in Unrealized Appreciation (Depreciation): | |
Investments | | | 9,311 | | |
Investments in Affiliates | | | 20 | | |
Foreign Currency Forward Exchange Contracts | | | 412 | | |
Foreign Currency Translations | | | 21 | | |
Futures Contracts | | | 207 | | |
Swap Agreements | | | 101 | | |
Net Change in Unrealized Appreciation (Depreciation) | | | 10,072 | | |
Net Realized Gain and Change in Unrealized Appreciation (Depreciation) | | | 32,190 | | |
Net Increase in Net Assets Resulting from Operations | | $ | 37,552 | | |
The accompanying notes are an integral part of the consolidated financial statements.
37
Morgan Stanley Institutional Fund Trust
Annual Report — September 30, 2017
Global Strategist Portfolio
Consolidated Statements of Changes in Net Assets | | Year Ended
September 30, 2017
(000) | | Year Ended
September 30, 2016*
(000) | |
Increase (Decrease) in Net Assets: | |
Operations: | |
Net Investment Income | | $ | 5,362 | | | $ | 5,899 | | |
Net Realized Gain | | | 22,118 | | | | 5,469 | | |
Net Change in Unrealized Appreciation (Depreciation) | | | 10,072 | | | | 17,291 | | |
Net Increase in Net Assets Resulting from Operations | | | 37,552 | | | | 28,659 | | |
Distributions from and/or in Excess of: | |
Class I: | |
Net Investment Income | | | (830 | ) | | | — | | |
Net Realized Gain | | | — | | | | (87 | ) | |
Class A: | |
Net Investment Income | | | (1,982 | ) | | | — | | |
Net Realized Gain | | | — | | | | (309 | ) | |
Class L: | |
Net Investment Income | | | (40 | ) | | | — | | |
Net Realized Gain | | | — | | | | (27 | ) | |
Class C: | |
Net Realized Gain | | | — | | | | (2 | ) | |
Class IS: | |
Net Investment Income | | | (2 | ) | | | — | | |
Net Realized Gain | | | — | | | | (— | @) | |
Total Distributions | | | (2,854 | ) | | | (425 | ) | |
Capital Share Transactions:(1) | |
Class I: | |
Subscribed | | | 5,495 | | | | 9,802 | | |
Distributions Reinvested | | | 828 | | | | 86 | | |
Redeemed | | | (19,136 | ) | | | (25,460 | ) | |
Class A: | |
Subscribed | | | 3,085 | | | | 3,171 | | |
Distributions Reinvested | | | 1,946 | | | | 304 | | |
Redeemed | | | (42,334 | ) | | | (51,527 | ) | |
Class L: | |
Exchanged | | | 843 | | | | 2,564 | | |
Distributions Reinvested | | | 40 | | | | 27 | | |
Redeemed | | | (5,417 | ) | | | (5,770 | ) | |
Class C: | |
Subscribed | | | 92 | | | | 800 | | |
Distributions Reinvested | | | — | | | | 2 | | |
Redeemed | | | (456 | ) | | | (681 | ) | |
Class IS: | |
Subscribed | | | — | @ | | | 128 | | |
Distributions Reinvested | | | 1 | | | | — | | |
Redeemed | | | (21 | ) | | | — | | |
Net Decrease in Net Assets Resulting from Capital Share Transactions | | | (55,034 | ) | | | (66,554 | ) | |
Total Decrease in Net Assets | | | (20,336 | ) | | | (38,320 | ) | |
Net Assets: | |
Beginning of Period | | | 358,964 | | | | 397,284 | | |
End of Period (Including Accumulated Undistributed Net Investment Income of $315 and $1,214) | | $ | 338,628 | | | $ | 358,964 | | |
The accompanying notes are an integral part of the consolidated financial statements.
38
Morgan Stanley Institutional Fund Trust
Annual Report — September 30, 2017
Global Strategist Portfolio
Consolidated Statements of Changes in Net Assets (cont'd) | | Year Ended
September 30, 2017
(000) | | Year Ended
September 30, 2016*
(000) | |
(1) Capital Share Transactions: | |
Class I: | |
Shares Subscribed | | | 342 | | | | 648 | | |
Shares Issued on Distributions Reinvested | | | 54 | | | | 6 | | |
Shares Redeemed | | | (1,145 | ) | | | (1,711 | ) | |
Net Decrease in Class I Shares Outstanding | | | (749 | ) | | | (1,057 | ) | |
Class A: | |
Shares Subscribed | | | 191 | | | | 211 | | |
Shares Issued on Distributions Reinvested | | | 126 | | | | 21 | | |
Shares Redeemed | | | (2,651 | ) | | | (3,439 | ) | |
Net Decrease in Class A Shares Outstanding | | | (2,334 | ) | | | (3,207 | ) | |
Class L: | |
Shares Exchanged | | | 55 | | | | 174 | | |
Shares Issued on Distributions Reinvested | | | 3 | | | | 2 | | |
Shares Redeemed | | | (346 | ) | | | (389 | ) | |
Net Decrease in Class L Shares Outstanding | | | (288 | ) | | | (213 | ) | |
Class C: | |
Shares Subscribed | | | 6 | | | | 55 | | |
Shares Issued on Distributions Reinvested | | | — | | | | — | @@ | |
Shares Redeemed | | | (29 | ) | | | (45 | ) | |
Net Increase (Decrease) in Class C Shares Outstanding | | | (23 | ) | | | 10 | | |
Class IS: | |
Shares Subscribed | | | — | @@ | | | 8 | | |
Shares Issued on Distributions Reinvested | | | — | @@ | | | — | | |
Shares Redeemed | | | (1 | ) | | | — | | |
Net Increase (Decrease) in Class IS Shares Outstanding | | | (1 | ) | | | 8 | | |
* Not consolidated.
@ Amount is less than $500.
@@ Amount is less than 500 shares.
The accompanying notes are an integral part of the consolidated financial statements.
39
Morgan Stanley Institutional Fund Trust
Annual Report — September 30, 2017
Consolidated Financial Highlights
Global Strategist Portfolio
| | | Class I | |
| | | Year Ended September 30, | |
Selected Per Share Data and Ratios | | 2017 | | 2016(1)(2) | | 2015(2) | | 2014(2) | | 2013(2) | |
Net Asset Value, Beginning of Period | | $ | 15.79 | | | $ | 14.58 | | | $ | 16.99 | | | $ | 16.96 | | | $ | 15.22 | | |
Income (Loss) from Investment Operations: | |
Net Investment Income(3) | | | 0.30 | | | | 0.28 | | | | 0.28 | | | | 0.34 | | | | 0.35 | | |
Net Realized and Unrealized Gain (Loss) | | | 1.57 | | | | 0.95 | | | | (1.73 | ) | | | 1.15 | | | | 1.44 | | |
Total from Investment Operations | | | 1.87 | | | | 1.23 | | | | (1.45 | ) | | | 1.49 | | | | 1.79 | | |
Distributions from and/or in Excess of: | |
Net Investment Income | | | (0.18 | ) | | | — | | | | (0.35 | ) | | | (0.23 | ) | | | (0.05 | ) | |
Net Realized Gain | | | — | | | | (0.02 | ) | | | (0.61 | ) | | | (1.23 | ) | | | — | | |
Total Distributions | | | (0.18 | ) | | | (0.02 | ) | | | (0.96 | ) | | | (1.46 | ) | | | (0.05 | ) | |
Net Asset Value, End of Period | | $ | 17.48 | | | $ | 15.79 | | | $ | 14.58 | | | $ | 16.99 | | | $ | 16.96 | | |
Total Return(4) | | | 11.98 | % | | | 8.42 | %(5) | | | (8.87 | )% | | | 9.37 | % | | | 11.79 | % | |
Ratios and Supplemental Data: | |
Net Assets, End of Period (Thousands) | | $ | 69,017 | | | $ | 74,158 | | | $ | 83,930 | | | $ | 72,952 | | | $ | 52,170 | | |
Ratio of Expenses to Average Net Assets(7) | | | 0.72 | %(6) | | | 0.68 | %(6) | | | 0.73 | %(6) | | | 0.72 | %(6) | | | 0.69 | %(6) | |
Ratio of Expenses to Average Net Assets Excluding Non Operating Expenses | | | N/A | | | | N/A | | | | N/A | | | | N/A | | | | 0.76 | %(6) | |
Ratio of Net Investment Income to Average Net Assets(7) | | | 1.87 | %(6) | | | 1.84 | %(6) | | | 1.78 | %(6) | | | 1.99 | %(6) | | | 2.18 | %(6) | |
Ratio of Rebate from Morgan Stanley Affiliates to Average Net Assets | | | 0.02 | % | | | 0.01 | % | | | 0.01 | % | | | 0.02 | % | | | 0.01 | % | |
Portfolio Turnover Rate | | | 176 | % | | | 103 | % | | | 98 | % | | | 62 | % | | | 107 | % | |
(7) Supplemental Information on the Ratios to Average Net Assets: | |
Ratios Before Expense Limitation: | |
Expenses to Average Net Assets | | | 0.85 | % | | | 0.81 | % | | | 0.83 | % | | | 0.83 | % | | | 0.82 | % | |
Net Investment Income to Average Net Assets | | | 1.74 | % | | | 1.71 | % | | | 1.68 | % | | | 1.88 | % | | | 2.05 | % | |
(1) Reflects prior period custodian out-of-pocket expenses that were reimbursed in September 2016. The amount of the reimbursement was immaterial on a per share basis and did not impact the total return of Class I shares. The Ratio of Expenses to Average Net Assets would have been 0.05% higher and the Ratio of Net Investment Income to Average Net Assets would have been 0.05% lower had the custodian not reimbursed the Fund.
(2) Not consolidated.
(3) Per share amount is based on average shares outstanding.
(4) Calculated based on the net asset value as of the last business day of the period.
(5) Performance was positively impacted by approximately 0.21% due to the receipt of proceeds from the settlement of class action suits involving the Fund's past holdings. These were one-time settlements, and as a result, the impact on the NAV and consequently the performance will not likely be repeated in the future. Had these settlements not occurred, the total return for Class I shares would have been approximately 8.21%.
(6) The Ratios of Expenses and Net Investment Income reflect the rebate of certain Fund expenses in connection with the investments in Morgan Stanley affiliates during the period. The effect of the rebate on the ratios is disclosed in the above table as "Ratio of Rebate from Morgan Stanley Affiliates to Average Net Assets."
The accompanying notes are an integral part of the consolidated financial statements.
40
Morgan Stanley Institutional Fund Trust
Annual Report — September 30, 2017
Consolidated Financial Highlights
Global Strategist Portfolio
| | | Class A | |
| | | Year Ended September 30, | |
Selected Per Share Data and Ratios | | 2017 | | 2016(1)(2) | | 2015(2) | | 2014(2) | | 2013(2) | |
Net Asset Value, Beginning of Period | | $ | 15.64 | | | $ | 14.50 | | | $ | 16.88 | | | $ | 16.88 | | | $ | 15.18 | | |
Income (Loss) from Investment Operations: | |
Net Investment Income(3) | | | 0.25 | | | | 0.23 | | | | 0.23 | | | | 0.27 | | | | 0.42 | | |
Net Realized and Unrealized Gain (Loss) | | | 1.56 | | | | 0.93 | | | | (1.71 | ) | | | 1.15 | | | | 1.32 | | |
Total from Investment Operations | | | 1.81 | | | | 1.16 | | | | (1.48 | ) | | | 1.42 | | | | 1.74 | | |
Distributions from and/or in Excess of: | |
Net Investment Income | | | (0.13 | ) | | | — | | | | (0.29 | ) | | | (0.19 | ) | | | (0.04 | ) | |
Net Realized Gain | | | — | | | | (0.02 | ) | | | (0.61 | ) | | | (1.23 | ) | | | — | | |
Total Distributions | | | (0.13 | ) | | | (0.02 | ) | | | (0.90 | ) | | | (1.42 | ) | | | (0.04 | ) | |
Net Asset Value, End of Period | | $ | 17.32 | | | $ | 15.64 | | | $ | 14.50 | | | $ | 16.88 | | | $ | 16.88 | | |
Total Return(4) | | | 11.64 | % | | | 7.98 | %(5) | | | (9.16 | )% | | | 9.02 | % | | | 11.49 | % | |
Ratios and Supplemental Data: | |
Net Assets, End of Period (Thousands) | | $ | 247,483 | | | $ | 259,999 | | | $ | 287,438 | | | $ | 365,642 | | | $ | 373,559 | | |
Ratio of Expenses to Average Net Assets(8) | | | 1.05 | %(6) | | | 0.99 | %(6) | | | 1.05 | %(6) | | | 1.07 | %(6) | | | 0.47 | %(6)(7) | |
Ratio of Expenses to Average Net Assets Excluding Non Operating Expenses | | | N/A | | | | N/A | | | | N/A | | | | N/A | | | | 1.03 | %(6)(7) | |
Ratio of Net Investment Income to Average Net Assets(8) | | | 1.52 | %(6) | | | 1.56 | %(6) | | | 1.44 | %(6) | | | 1.64 | %(6) | | | 2.60 | %(6)(7) | |
Ratio of Rebate from Morgan Stanley Affiliates to Average Net Assets | | | 0.02 | % | | | 0.01 | % | | | 0.01 | % | | | 0.02 | % | | | 0.01 | % | |
Portfolio Turnover Rate | | | 176 | % | | | 103 | % | | | 98 | % | | | 62 | % | | | 107 | % | |
(8) Supplemental Information on the Ratios to Average Net Assets: | |
Ratios Before Expense Limitation: | |
Expenses to Average Net Assets | | | 1.12 | % | | | 1.11 | % | | | 1.11 | % | | | 1.14 | % | | | 1.11 | % | |
Net Investment Income to Average Net Assets | | | 1.45 | % | | | 1.44 | % | | | 1.38 | % | | | 1.57 | % | | | 1.96 | % | |
(1) Reflects prior period custodian out-of-pocket expenses that were reimbursed in September 2016. The amount of the reimbursement was immaterial on a per share basis and did not impact the total return of Class A shares. The Ratio of Expenses to Average Net Assets would have been 0.07% higher and the Ratio of Net Investment Income to Average Net Assets would have been 0.07% lower had the custodian not reimbursed the Fund.
(2) Not consolidated.
(3) Per share amount is based on average shares outstanding.
(4) Calculated based on the net asset value which does not reflect sales charges, if applicable, as of the last business day of the period.
(5) Performance was positively impacted by approximately 0.27% due to the receipt of proceeds from the settlement of class action suits involving the Fund's past holdings. These were one-time settlements, and as a result, the impact on the NAV and consequently the performance will not likely be repeated in the future. Had these settlements not occurred, the total return for Class A shares would have been approximately 7.71%.
(6) The Ratios of Expenses and Net Investment Income reflect the rebate of certain Fund expenses in connection with the investments in Morgan Stanley affiliates during the period. The effect of the rebate on the ratios is disclosed in the above table as "Ratio of Rebate from Morgan Stanley Affiliates to Average Net Assets."
(7) Effective September 16, 2013, the Adviser has agreed to limit the ratio of expenses to average net assets to the maximum ratio of 1.09% for Class A shares. Prior to September 16, 2013, the maximum ratio was 0.99% for Class A shares.
The accompanying notes are an integral part of the consolidated financial statements.
41
Morgan Stanley Institutional Fund Trust
Annual Report — September 30, 2017
Consolidated Financial Highlights
Global Strategist Portfolio
| | | Class L | |
| | | Year Ended September 30, | |
Selected Per Share Data and Ratios | | 2017 | | 2016(1)(2) | | 2015(2) | | 2014(2) | | 2013(2) | |
Net Asset Value, Beginning of Period | | $ | 15.47 | | | $ | 14.41 | | | $ | 16.79 | | | $ | 16.78 | | | $ | 15.15 | | |
Income (Loss) from Investment Operations: | |
Net Investment Income(3) | | | 0.16 | | | | 0.15 | | | | 0.15 | | | | 0.19 | | | | 0.23 | | |
Net Realized and Unrealized Gain (Loss) | | | 1.55 | | | | 0.93 | | | | (1.72 | ) | | | 1.15 | | | | 1.42 | | |
Total from Investment Operations | | | 1.71 | | | | 1.08 | | | | (1.57 | ) | | | 1.34 | | | | 1.65 | | |
Distributions from and/or in Excess of: | |
Net Investment Income | | | (0.03 | ) | | | — | | | | (0.20 | ) | | | (0.10 | ) | | | (0.02 | ) | |
Net Realized Gain | | | — | | | | (0.02 | ) | | | (0.61 | ) | | | (1.23 | ) | | | — | | |
Total Distributions | | | (0.03 | ) | | | (0.02 | ) | | | (0.81 | ) | | | (1.33 | ) | | | (0.02 | ) | |
Net Asset Value, End of Period | | $ | 17.15 | | | $ | 15.47 | | | $ | 14.41 | | | $ | 16.79 | | | $ | 16.78 | | |
Total Return(4) | | | 11.07 | % | | | 7.47 | %(5) | | | (9.66 | )% | | | 8.49 | % | | | 10.91 | % | |
Ratios and Supplemental Data: | |
Net Assets, End of Period (Thousands) | | $ | 20,605 | | | $ | 23,051 | | | $ | 24,544 | | | $ | 28,032 | | | $ | 29,025 | | |
Ratio of Expenses to Average Net Assets(8) | | | 1.57 | %(6) | | | 1.52 | %(6) | | | 1.58 | %(6) | | | 1.57 | %(6) | | | 1.42 | %(6)(7) | |
Ratio of Expenses to Average Net Assets Excluding Non Operating Expenses | | | N/A | | | | N/A | | | | N/A | | | | N/A | | | | 1.49 | %(6)(7) | |
Ratio of Net Investment Income to Average Net Assets(8) | | | 1.00 | %(6) | | | 1.03 | %(6) | | | 0.93 | %(6) | | | 1.14 | %(6) | | | 1.44 | %(6)(7) | |
Ratio of Rebate from Morgan Stanley Affiliates to Average Net Assets | | | 0.02 | % | | | 0.01 | % | | | 0.01 | % | | | 0.02 | % | | | 0.01 | % | |
Portfolio Turnover Rate | | | 176 | % | | | 103 | % | | | 98 | % | | | 62 | % | | | 107 | % | |
(8) Supplemental Information on the Ratios to Average Net Assets: | |
Ratios Before Expense Limitation: | |
Expenses to Average Net Assets | | | 1.66 | % | | | 1.64 | % | | | 1.69 | % | | | 1.70 | % | | | 1.54 | % | |
Net Investment Income to Average Net Assets | | | 0.91 | % | | | 0.91 | % | | | 0.82 | % | | | 1.01 | % | | | 1.32 | % | |
(1) Reflects prior period custodian out-of-pocket expenses that were reimbursed in September 2016. The amount of the reimbursement was immaterial on a per share basis and did not impact the total return of Class L shares. The Ratio of Expenses to Average Net Assets would have been 0.06% higher and the Ratio of Net Investment Income to Average Net Assets would have been 0.06% lower had the custodian not reimbursed the Fund.
(2) Not consolidated.
(3) Per share amount is based on average shares outstanding.
(4) Calculated based on the net asset value as of the last business day of the period.
(5) Performance was positively impacted by approximately 0.20% due to the receipt of proceeds from the settlement of class action suits involving the Fund's past holdings. These were one-time settlements, and as a result, the impact on the NAV and consequently the performance will not likely be repeated in the future. Had these settlements not occurred, the total return for Class L shares would have been approximately 7.27%.
(6) The Ratios of Expenses and Net Investment Income reflect the rebate of certain Fund expenses in connection with the investments in Morgan Stanley affiliates during the period. The effect of the rebate on the ratios is disclosed in the above table as "Ratio of Rebate from Morgan Stanley Affiliates to Average Net Assets."
(7) Effective September 16, 2013, the Adviser has agreed to limit the ratio of expenses to average net assets to the maximum ratio of 1.59% for Class L shares. Prior to September 16, 2013, the maximum ratio was 1.49% for Class L shares.
The accompanying notes are an integral part of the consolidated financial statements.
42
Morgan Stanley Institutional Fund Trust
Annual Report — September 30, 2017
Consolidated Financial Highlights
Global Strategist Portfolio
| | | Class C | |
| | | Year Ended September 30, | | Period from
April 30, 2015(2) to | |
Selected Per Share Data and Ratios | | 2017 | | 2016(1)(3) | | September 30, 2015(3) | |
Net Asset Value, Beginning of Period | | $ | 15.42 | | | $ | 14.41 | | | $ | 16.03 | | |
Income (Loss) from Investment Operations: | |
Net Investment Income(4) | | | 0.11 | | | | 0.10 | | | | 0.03 | | |
Net Realized and Unrealized Gain (Loss) | | | 1.55 | | | | 0.93 | | | | (1.65 | ) | |
Total from Investment Operations | | | 1.66 | | | | 1.03 | | | | (1.62 | ) | |
Distributions from and/or in Excess of: | |
Net Realized Gain | | | — | | | | (0.02 | ) | | | — | | |
Net Asset Value, End of Period | | $ | 17.08 | | | $ | 15.42 | | | $ | 14.41 | | |
Total Return(5) | | | 10.77 | % | | | 7.13 | %(6) | | | (10.11 | )%(8) | |
Ratios and Supplemental Data: | |
Net Assets, End of Period (Thousands) | | $ | 1,386 | | | $ | 1,613 | | | $ | 1,363 | | |
Ratio of Expenses to Average Net Assets(10) | | | 1.82 | %(7) | | | 1.81 | %(7) | | | 1.83 | %(7)(9) | |
Ratio of Net Investment Income to Average Net Assets(10) | | | 0.72 | %(7) | | | 0.71 | %(7) | | | 0.54 | %(7)(9) | |
Ratio of Rebate from Morgan Stanley Affiliates to Average Net Assets | | | 0.02 | % | | | 0.01 | % | | | 0.01 | %(9) | |
Portfolio Turnover Rate | | | 176 | % | | | 103 | % | | | 98 | %(8) | |
(10) Supplemental Information on the Ratios to Average Net Assets: | |
Ratios Before Expense Limitation: | |
Expenses to Average Net Assets | | | 2.02 | % | | | 1.94 | % | | | 2.28 | %(9) | |
Net Investment Income to Average Net Assets | | | 0.52 | % | | | 0.58 | % | | | 0.09 | %(9) | |
(1) Reflects prior period custodian out-of-pocket expenses that were reimbursed in September 2016. The amount of the reimbursement was immaterial on a per share basis and did not impact the total return of Class C shares. The Ratio of Expenses to Average Net Assets would have been 0.02% higher and the Ratio of Net Investment Income to Average Net Assets would have been 0.02% lower had the custodian not reimbursed the Fund.
(2) Commencement of Offering.
(3) Not consolidated.
(4) Per share amount is based on average shares outstanding.
(5) Calculated based on the net asset value which does not reflect sales charges, if applicable, as of the last business day of the period.
(6) Performance was positively impacted by approximately 0.21% due to the receipt of proceeds from the settlement of class action suits involving the Fund's past holdings. These were one-time settlements, and as a result, the impact on the NAV and consequently the performance will not likely be repeated in the future. Had these settlements not occurred, the total return for Class C shares would have been approximately 6.92%.
(7) The Ratios of Expenses and Net Investment Income reflect the rebate of certain Fund expenses in connection with the investments in Morgan Stanley affiliates during the period. The effect of the rebate on the ratios is disclosed in the above table as "Ratio of Rebate from Morgan Stanley Affiliates to Average Net Assets."
(8) Not annualized.
(9) Annualized.
The accompanying notes are an integral part of the consolidated financial statements.
43
Morgan Stanley Institutional Fund Trust
Annual Report — September 30, 2017
Consolidated Financial Highlights
Global Strategist Portfolio
| | | Class IS | |
| | | Year Ended September 30, | | Period from
May 29, 2015(2) to | |
Selected Per Share Data and Ratios | | 2017 | | 2016(1)(3) | | September 30, 2015(3) | |
Net Asset Value, Beginning of Period | | $ | 15.79 | | | $ | 14.59 | | | $ | 15.97 | | |
Income (Loss) from Investment Operations: | |
Net Investment Income(4) | | | 0.31 | | | | 0.26 | | | | 0.09 | | |
Net Realized and Unrealized Gain (Loss) | | | 1.57 | | | | 0.96 | | | | (1.47 | ) | |
Total from Investment Operations | | | 1.88 | | | | 1.22 | | | | (1.38 | ) | |
Distributions from and/or in Excess of: | |
Net Investment Income | | | (0.18 | ) | | | — | | | | — | | |
Net Realized Gain | | | — | | | | (0.02 | ) | | | — | | |
Total Distributions | | | (0.18 | ) | | | (0.02 | ) | | | — | | |
Net Asset Value, End of Period | | $ | 17.49 | | | $ | 15.79 | | | $ | 14.59 | | |
Total Return(5) | | | 12.08 | % | | | 8.42 | %(6) | | | (8.70 | )%(9) | |
Ratios and Supplemental Data: | |
Net Assets, End of Period (Thousands) | | $ | 137 | | | $ | 143 | | | $ | 9 | | |
Ratio of Expenses to Average Net Assets(11) | | | 0.69 | %(7) | | | 0.70 | %(7) | | | 0.71 | %(7)(10) | |
Ratio of Net Investment Income to Average Net Assets(11) | | | 1.88 | %(7) | | | 1.68 | %(7) | | | 1.66 | %(7)(10) | |
Ratio of Rebate from Morgan Stanley Affiliates to Average Net Assets | | | 0.02 | % | | | 0.01 | % | | | 0.00 | %(8)(10) | |
Portfolio Turnover Rate | | | 176 | % | | | 103 | % | | | 98 | %(9) | |
(11) Supplemental Information on the Ratios to Average Net Assets: | |
Ratios Before Expense Limitation: | |
Expenses to Average Net Assets | | | 2.17 | % | | | 5.44 | % | | | 16.27 | %(10) | |
Net Investment Income (Loss) to Average Net Assets | | | 0.40 | % | | | (3.06 | )% | | | (13.90 | )%(10) | |
(1) Reflects prior period custodian out-of-pocket expenses that were reimbursed in September 2016. The amount of the reimbursement was immaterial on a per share basis and did not impact the total return of Class IS shares. The Ratio of Expenses to Average Net Assets and the Ratio of Net Investment Income to Average Net Assets would be unchanged as the reimbursement of custodian fees was offset against expense waivers/reimbursements with no impact to net expenses or net investment income.
(2) Commencement of Offering.
(3) Not consolidated.
(4) Per share amount is based on average shares outstanding.
(5) Calculated based on the net asset value as of the last business day of the period.
(6) Performance was positively impacted by approximately 0.35% due to the receipt of proceeds from the settlement of class action suits involving the Fund's past holdings. These were one-time settlements, and as a result, the impact on the NAV and consequently the performance will not likely be repeated in the future. Had these settlements not occurred, the total return for Class IS shares would have been approximately 8.07%.
(7) The Ratios of Expenses and Net Investment Income reflect the rebate of certain Fund expenses in connection with the investments in Morgan Stanley affiliates during the period. The effect of the rebate on the ratios is disclosed in the above table as "Ratio of Rebate from Morgan Stanley Affiliates to Average Net Assets."
(8) Amount is less than 0.005%.
(9) Not annualized.
(10) Annualized.
The accompanying notes are an integral part of the consolidated financial statements.
44
Morgan Stanley Institutional Fund Trust
Annual Report — September 30, 2017
Notes to Consolidated Financial Statements
Morgan Stanley Institutional Fund Trust ("Trust'') is registered under the Investment Company Act of 1940, as amended (the "Act''), as an open-end management investment company. The Trust is comprised of nine separate, active funds (individually referred to as a "Fund", collectively as the "Funds"). The Trust applies investment company accounting and reporting guidance. All Funds are considered diversified for purposes of the Act.
The accompanying consolidated financial statements relate to the Global Strategist Portfolio. The Fund seeks above-average total return over a market cycle of three to five years. The Fund offers five classes of shares — Class I, Class A, Class L, Class C and Class IS.
The Fund has suspended offering Class L shares for sales to all investors. Class L shareholders of the Fund do not have the option to purchasing additional Class L shares. However, existing Class L shareholders may invest in additional Class L shares through reinvestment of dividends and distributions.
A. Significant Accounting Policies: The following significant accounting policies are in conformity with U.S. generally accepted accounting principles ("GAAP"). Such policies are consistently followed by the Trust in the preparation of its consolidated financial statements. GAAP may require management to make estimates and assumptions that affect the reported amounts and disclosures in the consolidated financial statements. Actual results may differ from those estimates.
Effective October 3, 2016, the Fund may, consistent with its principal investment strategies, invest up to 25% of its total assets in a wholly-owned subsidiary of the Fund organized as a company under the laws of the Cayman Islands, Global Strategist Cayman Portfolio, Ltd. (the "Subsidiary"). The Subsidiary may invest, directly or indirectly through the use of derivatives, in securities, commodities, commodity-related instruments and other investments, primarily futures, swaps and notes. The Fund is the sole shareholder of the Subsidiary, and it is not currently expected that shares of the Subsidiary will be sold or offered to other investors. The consolidated portfolio of investments and consolidated financial statements include the positions and accounts of the Fund and the Subsidiary. All intercompany accounts and transactions of the Fund and the Subsidiary have been eliminated in consolidation. As of September 30, 2017, the Subsidiary represented approximately $19,089,000 or approximately 5.64% of the total assets of the Fund.
Investments in the Subsidiary are expected to provide the Fund with exposure to the commodity markets within the limita-
tions of Subchapter M of the Code and recent Internal Revenue Service ("IRS") revenue rulings, which require that a mutual fund receive no more than ten percent of its gross income from such investments in order to receive favorable tax treatment as a regulated investment company ("RIC"). Tax treatment of the income received from the Subsidiary may potentially be affected by changes in legislation, regulations or other legally binding authority, which could affect the character, timing and amount of the Fund's taxable income and distributions. If such changes occur, the Fund may need to significantly change its investment strategy and recognize unrealized gains in order to remain qualified for taxation as a RIC, which could adversely affect the Fund.
1. Security Valuation: (1) Certain portfolio securities may be valued by an outside pricing service/vendor approved by the Trust's Board of Trustees (the "Trustees"). The pricing service/vendor may employ a pricing model that takes into account, among other things, bids, yield spreads, and/or other market data and specific security characteristics. Alternatively, if a valuation is not available from an outside pricing service/vendor, and the security trades on an exchange, the security may be valued at its latest reported sale price (or at the exchange official closing price if such exchange reports an official closing price), prior to the time when assets are valued. If there are no sales on a given day and if there is no official exchange closing price for that day, the security is valued at the mean between the last reported bid and asked prices if such bid and asked prices are available in the relevant exchanges; (2) an equity portfolio security listed or traded on an exchange is valued at its latest reported sales price (or at the exchange official closing price if such exchange reports an official closing price), and if there were no sales on a given day and if there is no official exchange closing price for that day, the security is valued at the mean between the last reported bid and asked prices if such bid and asked prices are available on the relevant exchanges. Listed equity securities not traded on the valuation date with no reported bid and asked prices available on the exchange are valued at the mean between the current bid and asked prices obtained from one or more reputable brokers or dealers. In cases where a security is traded on more than one exchange, the security is valued on the exchange designated as the primary market; (3) all other equity portfolio securities for which over-the-counter ("OTC") market quotations are readily available are valued at the latest reported sales price
45
Morgan Stanley Institutional Fund Trust
Annual Report — September 30, 2017
Notes to Consolidated Financial Statements (cont'd)
(or at the market official closing price if such market reports an official closing price), and if there was no trading in the security on a given day and if there is no official closing price from relevant markets for that day, the security is valued at the mean between the last reported bid and asked prices if such bid and asked prices are available on the relevant markets. An unlisted equity security that does not trade on the valuation date and for which bid and asked prices from the relevant markets are unavailable is valued at the mean between the current bid and asked prices obtained from one or more reputable brokers or dealers; (4) futures are valued at the settlement price on the exchange on which they trade or, if a settlement price is unavailable, at the last sale price on the exchange; (5) OTC swaps may be valued by an outside pricing service approved by the Trustees or quotes from a broker or dealer. Swaps cleared on a clearinghouse or exchange may be valued using the closing price provided by the clearinghouse or exchange; (6) listed options are valued at the last reported sales price on the exchange on which they are listed (or at the exchange official closing price if such exchange reports an official closing price). If an official closing price or last reported sales price is unavailable, the listed option should be fair valued at the mean between its latest bid and ask prices. Unlisted options are valued at the mean between their latest bid and ask prices from a broker/dealer or valued by a pricing service/vendor; (7) when market quotations are not readily available, including circumstances under which Morgan Stanley Investment Management Inc. (the "Adviser") determines that the closing price, last sale price or the mean between the last reported bid and asked prices are not reflective of a security's market value, portfolio securities are valued at their fair value as determined in good faith under procedures established by and under the general supervision of the Trustees. Occasionally, developments affecting the closing prices of securities and other assets may occur between the times at which valuations of such securities are determined (that is, close of the foreign market on which the securities trade) and the close of business of the New York Stock Exchange ("NYSE"). If developments occur during such periods that are expected to materially affect the value of such securities, such valuations may be adjusted to reflect the estimated fair value of such securities as of the close of the NYSE, as determined in good faith by the Trustees or by the Adviser using a pricing service and/or procedures approved by the Trustees;
(8) quotations of foreign portfolio securities, other assets and liabilities and forward contracts stated in foreign currency are translated into U.S. dollar equivalents at the prevailing market rates prior to the close of the NYSE; and (9) investments in mutual funds, including the Morgan Stanley Institutional Liquidity Funds, are valued at the net asset value ("NAV") as of the close of each business day.
The Trustees have responsibility for determining in good faith the fair value of the investments, and the Trustees may appoint others, such as the Trust's Adviser or a valuation committee, to assist the Trustees in determining fair value and to make the actual calculations pursuant to the fair valuation methodologies previously approved by the Trustees. Under procedures approved by the Trustees, the Trust's Adviser has formed a Valuation Committee whose members are approved by the Trustees. The Valuation Committee provides administration and oversight of the Trust's valuation policies and procedures, which are reviewed at least annually by the Trustees. These procedures allow the Trust to utilize independent pricing services, quotations from securities and financial instrument dealers, and other market sources to determine fair value.
The Trust has procedures to determine the fair value of securities and other financial instruments for which market prices are not readily available. Under these procedures, the Valuation Committee convenes on a regular and ad hoc basis to review such securities and considers a number of factors, including valuation methodologies and significant unobservable valuation inputs, when arriving at fair value. The Valuation Committee may employ a market-based approach which may use related or comparable assets or liabilities, recent transactions, market multiples, book values, and other relevant information for the investment to determine the fair value of the investment. An income-based valuation approach may also be used in which the anticipated future cash flows of the investment are discounted to calculate fair value. Discounts may also be applied due to the nature or duration of any restrictions on the disposition of the investments. Due to the inherent uncertainty of valuations of such investments, the fair values may differ significantly from the values that would have been used had an active market existed. The Valuation Committee employs various methods for calibrating these valuation approaches including a regular review of valuation
46
Morgan Stanley Institutional Fund Trust
Annual Report — September 30, 2017
Notes to Consolidated Financial Statements (cont'd)
methodologies, key inputs and assumptions, transactional back-testing or disposition analysis, and reviews of any related market activity.
2. Fair Value Measurement: Financial Accounting Standards Board ("FASB") Accounting Standards CodificationTM ("ASC") 820, "Fair Value Measurement" ("ASC 820"), defines fair value as the value that the Fund would receive to sell an investment or pay to transfer a liability in a timely transaction with an independent buyer in the principal market, or in the absence of a principal market, the most advantageous market for the investment or liability. ASC 820 establishes a three-tier hierarchy to distinguish between (1) inputs that reflect the assumptions market participants would use in valuing an asset or liability developed based on market data obtained from sources independent of the reporting entity (observable inputs) and (2) inputs that reflect the reporting entity's own assumptions about the assumptions market participants would use in valuing an asset or liability developed based on the best information available in the circumstances (unobservable inputs) and to establish classification of fair value measurements for disclosure purposes. Various inputs are used in determining the value of the Fund's investments. The inputs are summarized in the three broad levels listed below.
• Level 1 – unadjusted quoted prices in active markets for identical investments
• Level 2 – other significant observable inputs (including quoted prices for similar investments, interest rates, prepayment speeds, credit risk, etc.)
• Level 3 – significant unobservable inputs including the Fund's own assumptions in determining the fair value of investments. Factors considered in making this determination may include, but are not limited to, information obtained by contacting the issuer, analysts, or the appropriate stock exchange (for exchange-traded securities), analysis of the issuer's financial statements or other available documents and, if necessary, available information concerning other securities in similar circumstances
The inputs or methodology used for valuing securities are not necessarily an indication of the risk associated
with investing in those securities and the determination of the significance of a particular input to the fair value measurement in its entirety requires judgment and considers factors specific to each security.
The following is a summary of the inputs used to value the Fund's investments as of September 30, 2017.
Investment Type | | Level 1
Unadjusted
quoted
prices
(000) | | Level 2
Other
significant
observable
inputs
(000) | | Level 3
Significant
unobservable
inputs
(000) | | Total
(000) | |
Assets: | |
Fixed Income Securities | |
Agency Adjustable
Rate Mortgages | | $ | — | | | $ | 222 | | | $ | — | | | $ | 222 | | |
Agency Fixed Rate
Mortgages | | | — | | | | 9,237 | | | | — | | | | 9,237 | | |
Asset-Backed Securities | | | — | | | | 355 | | | | — | | | | 355 | | |
Collateralized Mortgage
Obligations — Agency
Collateral Series | | | — | | | | 175 | | | | — | | | | 175 | | |
Commercial Mortgage-
Backed Securities | | | — | | | | 3,580 | | | | — | | | | 3,580 | | |
Corporate Bonds | | | — | | | | 37,612 | | | | — | | | | 37,612 | | |
Mortgages — Other | | | — | | | | 1,728 | | | | — | | | | 1,728 | | |
Sovereign | | | — | | | | 77,198 | | | | — | | | | 77,198 | | |
U.S. Treasury Securities | | | — | | | | 11,666 | | | | — | | | | 11,666 | | |
Total Fixed Income
Securities | | | — | | | | 141,773 | | | | — | | | | 141,773 | | |
Common Stocks | |
Aerospace & Defense | | | 922 | | | | — | | | | — | | | | 922 | | |
Air Freight & Logistics | | | 535 | | | | — | | | | — | | | | 535 | | |
Airlines | | | 166 | | | | — | | | | — | | | | 166 | | |
Auto Components | | | 1,485 | | | | — | | | | — | | | | 1,485 | | |
Automobiles | | | 5,348 | | | | — | | | | — | | | | 5,348 | | |
Banks | | | 25,498 | | | | — | | | | — | | | | 25,498 | | |
Beverages | | | 2,577 | | | | — | | | | — | | | | 2,577 | | |
Biotechnology | | | 1,294 | | | | — | | | | — | | | | 1,294 | | |
Building Products | | | 1,830 | | | | — | | | | — | | | | 1,830 | | |
Capital Markets | | | 3,816 | | | | — | | | | — | | | | 3,816 | | |
Chemicals | | | 4,437 | | | | — | | | | — | | | | 4,437 | | |
Commercial Services &
Supplies | | | 855 | | | | — | | | | — | | | | 855 | | |
Communications
Equipment | | | 703 | | | | — | | | | — | | | | 703 | | |
Construction &
Engineering | | | 4,025 | | | | — | | | | — | | | | 4,025 | | |
Construction Materials | | | 528 | | | | — | | | | — | | | | 528 | | |
Consumer Finance | | | 3,763 | | | | — | | | | — | | | | 3,763 | | |
Containers & Packaging | | | 203 | | | | — | | | | — | | | | 203 | | |
Distributors | | | 9 | | | | — | | | | — | | | | 9 | | |
Diversified Consumer
Services | | | 17 | | | | — | | | | — | | | | 17 | | |
Diversified Financial
Services | | | 1,053 | | | | — | | | | — | | | | 1,053 | | |
Diversified
Telecommunication
Services | | | 3,047 | | | | 788 | | | | — | | | | 3,835 | | |
Electric Utilities | | | 2,177 | | | | — | | | | — | | | | 2,177 | | |
Electrical Equipment | | | 1,323 | | | | — | | | | — | | | | 1,323 | | |
47
Morgan Stanley Institutional Fund Trust
Annual Report — September 30, 2017
Notes to Consolidated Financial Statements (cont'd)
Investment Type | | Level 1
Unadjusted
quoted
prices
(000) | | Level 2
Other
significant
observable
inputs
(000) | | Level 3
Significant
unobservable
inputs
(000) | | Total
(000) | |
Common Stocks (cont'd) | |
Electronic Equipment,
Instruments &
Components | | $ | 1,340 | | | $ | — | | | $ | — | | | $ | 1,340 | | |
Energy Equipment &
Services | | | 466 | | | | — | | | | — | † | | | 466 | † | |
Equity Real Estate
Investment Trusts
(REITs) | | | 1,897 | | | | — | | | | — | | | | 1,897 | | |
Food & Staples Retailing | | | 2,836 | | | | — | | | | — | | | | 2,836 | | |
Food Products | | | 2,709 | | | | — | | | | — | | | | 2,709 | | |
Gas Utilities | | | 372 | | | | — | | | | — | | | | 372 | | |
Health Care Equipment &
Supplies | | | 2,007 | | | | — | | | | — | | | | 2,007 | | |
Health Care Providers &
Services | | | 1,274 | | | | — | | | | — | | | | 1,274 | | |
Health Care Technology | | | 35 | | | | — | | | | — | | | | 35 | | |
Hotels, Restaurants &
Leisure | | | 2,613 | | | | — | | | | — | | | | 2,613 | | |
Household Durables | | | 986 | | | | — | | | | — | | | | 986 | | |
Household Products | | | 1,592 | | | | — | | | | — | | | | 1,592 | | |
Independent Power and
Renewable Electricity
Producers | | | 94 | | | | — | | | | — | | | | 94 | | |
Industrial Conglomerates | | | 1,778 | | | | — | | | | — | | | | 1,778 | | |
Information Technology
Services | | | 3,975 | | | | — | | | | — | | | | 3,975 | | |
Insurance | | | 4,964 | | | | — | | | | — | | | | 4,964 | | |
Internet & Direct
Marketing Retail | | | 938 | | | | — | | | | — | | | | 938 | | |
Internet Software &
Services | | | 861 | | | | — | | | | — | | | | 861 | | |
Leisure Products | | | 19 | | | | — | | | | — | | | | 19 | | |
Life Sciences Tools &
Services | | | 332 | | | | — | | | | — | | | | 332 | | |
Machinery | | | 3,356 | | | | — | | | | — | | | | 3,356 | | |
Marine | | | 223 | | | | — | | | | — | | | | 223 | | |
Media | | | 2,520 | | | | — | | | | — | | | | 2,520 | | |
Metals & Mining | | | 2,937 | | | | — | @ | | | — | | | | 2,937 | | |
Multi-Line Retail | | | 318 | | | | — | | | | — | | | | 318 | | |
Multi-Utilities | | | 1,325 | | | | — | | | | — | | | | 1,325 | | |
Oil, Gas & Consumable
Fuels | | | 7,958 | | | | — | | | | — | † | | | 7,958 | † | |
Paper & Forest Products | | | 470 | | | | — | | | | — | | | | 470 | | |
Personal Products | | | 2,174 | | | | — | | | | — | | | | 2,174 | | |
Pharmaceuticals | | | 7,373 | | | | — | | | | — | | | | 7,373 | | |
Professional Services | | | 2,985 | | | | — | | | | — | | | | 2,985 | | |
Real Estate
Management &
Development | | | 1,464 | | | | — | | | | — | | | | 1,464 | | |
Road & Rail | | | 2,770 | | | | — | | | | — | | | | 2,770 | | |
Semiconductors &
Semiconductor
Equipment | | | 1,874 | | | | — | | | | — | @ | | | 1,874 | | |
Software | | | 2,649 | | | | — | | | | — | | | | 2,649 | | |
Specialty Retail | | | 1,339 | | | | — | | | | — | | | | 1,339 | | |
Tech Hardware,
Storage & Peripherals | | | 2,222 | | | | — | | | | — | | | | 2,222 | | |
Textiles, Apparel & Luxury
Goods | | | 2,170 | | | | — | | | | — | | | | 2,170 | | |
Investment Type | | Level 1
Unadjusted
quoted
prices
(000) | | Level 2
Other
significant
observable
inputs
(000) | | Level 3
Significant
unobservable
inputs
(000) | | Total
(000) | |
Common Stocks (cont'd) | |
Thrifts & Mortgage
Finance | | $ | 11 | | | $ | — | | | $ | — | | | $ | 11 | | |
Tobacco | | | 1,591 | | | | — | | | | — | | | | 1,591 | | |
Trading Companies &
Distributors | | | 1,458 | | | | — | | | | — | | | | 1,458 | | |
Transportation
Infrastructure | | | 2,179 | | | | — | | | | — | | | | 2,179 | | |
Water Utilities | | | 67 | | | | — | | | | — | | | | 67 | | |
Wireless
Telecommunication
Services | | | 1,821 | | | | — | | | | — | | | | 1,821 | | |
Total Common Stocks | | | 149,953 | | | | 788 | | | | — | @† | | | 150,741 | † | |
Short-Term Investments | |
Investment Company | | | 39,976 | | | | — | | | | — | | | | 39,976 | | |
U.S. Treasury Securities | | | — | | | | 3,417 | | | | — | | | | 3,417 | | |
Total Short-Term
Investments | | | 39,976 | | | | 3,417 | | | | — | | | | 43,393 | | |
Foreign Currency
Forward Exchange
Contracts | | | — | | | | 2,839 | | | | — | | | | 2,839 | | |
Futures Contracts | | | 1,494 | | | | — | | | | — | | | | 1,494 | | |
Interest Rate Swap
Agreements | | | — | | | | 442 | | | | — | | | | 442 | | |
Total Return Swap
Agreements | | | — | | | | 165 | | | | — | | | | 165 | | |
Total Assets | | | 191,423 | | | | 149,424 | | | | — | @† | | | 340,847 | † | |
Liabilities: | |
Foreign Currency
Forward Exchange
Contracts | | | — | | | | (2,267 | ) | | | — | | | | (2,267 | ) | |
Futures Contracts | | | (753 | ) | | | — | | | | — | | | | (753 | ) | |
Interest Rate Swap
Agreements | | | — | | | | (234 | ) | | | — | | | | (234 | ) | |
Total Return Swap
Agreements | | | — | | | | (291 | ) | | | — | | | | (291 | ) | |
Total Liabilities | | | (753 | ) | | | (2,792 | ) | | | — | | | | (3,545 | ) | |
Total | | $ | 190,670 | | | $ | 146,632 | | | $ | — | @† | | $ | 337,302 | † | |
@ Value is less than $500.
† Includes one or more securities which are valued at zero.
Transfers between investment levels may occur as the markets fluctuate and/or the availability of data used in an investment's valuation changes. The Fund recognizes transfers between the levels as of the end of the period. As of September 30, 2017, securities with a total value of approximately $788,000 transferred from Level 1 to Level 2. Securities that were valued using unadjusted quoted prices at September 30, 2016 were valued using other significant observable inputs at September 30, 2017. As of September 30, 2017, a security valued at zero transferred from Level 1 to Level 3. The security that was valued using unadjusted quoted prices at September 30, 2016 was
48
Morgan Stanley Institutional Fund Trust
Annual Report — September 30, 2017
Notes to Consolidated Financial Statements (cont'd)
valued using significant unobservable inputs at September 30, 2017.
Following is a reconciliation of investments in which significant unobservable inputs (Level 3) were used in determining fair value.
| | | Common
Stocks
(000) | | Warrants
(000) | |
Beginning Balance | | $ | — | @† | | $ | — | † | |
Purchases | | | — | | | | — | | |
Sales | | | — | | | | — | | |
Amortization of discount | | | — | | | | — | | |
Transfers in | | | — | † | | | — | | |
Transfers out | | | — | | | | — | | |
Corporate actions | | | (125 | ) | | | (— | @) | |
Change in unrealized appreciation (depreciation) | | | 125 | | | | — | @ | |
Realized gains (losses) | | | — | | | | — | | |
Ending Balance | | $ | — | @† | | $ | — | | |
Net change in unrealized appreciation
(depreciation) from investments
still held as of September 30, 2017 | | $ | (— | @) | | $ | — | | |
@ Value is less than $500.
† Includes one or more securities which are valued at zero.
3. Foreign Currency Translation and Foreign Investments: The books and records of the Fund are maintained in U.S. dollars. Foreign currency amounts are translated into U.S. dollars as follows:
– investments, other assets and liabilities at the prevailing rate of exchange on the valuation date;
– investment transactions and investment income at the prevailing rates of exchange on the dates of such transactions.
Although the net assets of the Fund are presented at the foreign exchange rates and market values at the close of the period, the Fund does not isolate that portion of the results of operations arising as a result of changes in the foreign exchange rates from the fluctuations arising from changes in the market prices of securities held at period end. Similarly, the Fund does not isolate the effect of changes in foreign exchange rates from the fluctuations arising from changes in the market prices of securities sold during the period. Accordingly, realized and unrealized foreign currency gains (losses) on investments in securities are included in the reported net realized and unrealized gains (losses) on investment transactions and balances. However, pursuant to U.S. federal income tax regulations, gains and losses from certain foreign currency transactions and the foreign currency portion of
gains and losses realized on sales and maturities of foreign denominated debt securities are treated as ordinary income for U.S. federal income tax purposes.
Net realized gains (losses) on foreign currency transactions represent net foreign exchange gains (losses) from foreign currency forward exchange contracts, disposition of foreign currencies, currency gains (losses) realized between the trade and settlement dates on securities transactions, and the difference between the amount of investment income and foreign withholding taxes recorded on the Fund's books and the U.S. dollar equivalent amounts actually received or paid. Net unrealized currency gains (losses) from valuing foreign currency denominated assets and liabilities at period end exchange rates are reflected as a component of unrealized appreciation (depreciation) in the Consolidated Statement of Assets and Liabilities. The change in unrealized currency gains (losses) on foreign currency translations for the period is reflected in the Consolidated Statement of Operations.
Foreign security and currency transactions may involve certain considerations and risks not typically associated with those of U.S. dollar denominated transactions as a result of, among other factors, fluctuations of exchange rates in relation to the U.S. dollar, the possibility of lower levels of governmental supervision and regulation of foreign securities markets and the possibility of political or economic instability.
Governmental approval for foreign investments may be required in advance of making an investment under certain circumstances in some countries, and the extent of foreign investments in domestic companies may be subject to limitation in other countries. Foreign ownership limitations also may be imposed by the charters of individual companies to prevent, among other concerns, violations of foreign investment limitations. As a result, an additional class of shares (identified as "Foreign" in the Consolidated Portfolio of Investments) may be created and offered for investment. The "local" and "foreign shares" market values may differ. In the absence of trading of the foreign shares in such markets, the Fund values the foreign shares at the closing exchange price of the local shares.
4. Derivatives: The Fund may, but is not required to, use derivative instruments for a variety of purposes, including
49
Morgan Stanley Institutional Fund Trust
Annual Report — September 30, 2017
Notes to Consolidated Financial Statements (cont'd)
hedging, risk management, portfolio management or to earn income. Derivatives are financial instruments whose value is based, in part, on the value of an underlying asset, interest rate, index or financial instrument. Prevailing interest rates and volatility levels, among other things, also affect the value of derivative instruments. A derivative instrument often has risks similar to its underlying asset and may have additional risks, including imperfect correlation between the value of the derivative and the underlying asset, risks of default by the counterparty to certain transactions, magnification of losses incurred due to changes in the market value of the securities, instruments, indices or interest rates to which the derivative instrument relates, risks that the transactions may not be liquid and risks arising from margin requirements. The use of derivatives involves risks that are different from, and possibly greater than, the risks associated with other portfolio investments. Derivatives may involve the use of highly specialized instruments that require investment techniques and risk analyses different from those associated with other portfolio investments. All of the Fund's holdings, including derivative instruments, are marked-to-market each day with the change in value reflected in unrealized appreciation (depreciation). Upon disposition, a realized gain or loss is recognized.
Certain derivative transactions may give rise to a form of leverage. Leverage magnifies the potential for gain and the risk of loss. Leverage associated with derivative transactions may cause the Fund to liquidate portfolio positions when it may not be advantageous to do so to satisfy its obligations or to meet earmarking or segregation requirements, pursuant to applicable Securities and Exchange Commission ("SEC") rules and regulations, or may cause the Fund to be more volatile than if the Fund had not been leveraged. Although the Adviser seeks to use derivatives to further the Fund's investment objectives, there is no assurance that the use of derivatives will achieve this result.
Following is a description of the derivative instruments and techniques that the Fund used during the period and their associated risks:
Futures: A futures contract is a standardized, exchange-traded agreement to buy or sell a specific quantity of an underlying asset, reference rate or index at a specific price at a specific future time. The value of a futures contract tends to increase and decrease in tandem with
the value of the underlying instrument. Depending on the terms of the particular contract, futures contracts are settled through either physical delivery of the underlying instrument on the settlement date or by payment of a cash settlement amount on the settlement date. During the period the futures contract is open, payments are received from or made to the broker based upon changes in the value of the contract (the variation margin). A decision as to whether, when and how to use futures contracts involves the exercise of skill and judgment and even a well-conceived futures transaction may be unsuccessful because of market behavior or unexpected events. In addition to the derivatives risks discussed above, the prices of futures contracts can be highly volatile, using futures contracts can lower total return, and the potential loss from futures contracts can exceed the Fund's initial investment in such contracts. No assurance can be given that a liquid market will exist for any particular futures contract at any particular time. There is also the risk of loss by the Fund of margin deposits in the event of bankruptcy of a broker with which the Fund has open positions in the futures contract.
Swaps: The Fund may enter into OTC swap contracts or cleared swap transactions. A swap contract is an agreement between two parties pursuant to which the parties exchange payments at specified dates on the basis of a specified notional amount, with the payments calculated by reference to specified securities, indices, reference rates, currencies or other instruments. Typically swap agreements provide that when the period payment dates for both parties are the same, the payments are made on a net basis (i.e., the two payment streams are netted out, with only the net amount paid by one party to the other). The Fund's obligations or rights under a swap contract entered into on a net basis will generally be equal only to the net amount to be paid or received under the agreement, based on the relative values of the positions held by each party. Cleared swap transactions may help reduce counterparty credit risk. In a cleared swap, the Fund's ultimate counterparty is a clearinghouse rather than a swap dealer, bank or other financial institution. OTC swap agreements are not entered into or traded on exchanges and often there is no central clearing or guaranty function for OTC swaps. These OTC swaps are often subject to credit risk or the risk of default or non-performance by the counterparty. Both
50
Morgan Stanley Institutional Fund Trust
Annual Report — September 30, 2017
Notes to Consolidated Financial Statements (cont'd)
OTC and cleared swaps could result in losses if interest rates, foreign currency exchange rates or other factors are not correctly anticipated by the Fund or if the reference index, security or investments do not perform as expected. During the period swap agreements are open, payments are received from or made to the clearinghouse or counterparty based upon changes in the value of the contract (variation margin). The Dodd-Frank Wall Street Reform and Consumer Protection Act and related regulatory developments require the clearing and exchange-trading of certain standardized swap transactions. Mandatory exchange-trading and clearing is occurring on a phased-in basis.
The Fund's use of swaps during the period included those based on the credit of an underlying security commonly referred to as "credit default swaps." The Fund may be either the buyer or seller in a credit default swap. Where the Fund is the buyer of a credit default swap contract, it would typically be entitled to receive the par (or other agreed-upon) value of a referenced debt obligation from the counterparty to the contract only in the event of a default or similar event by the issuer of the debt obligation. If no default occurs, the Fund would have paid to the counterparty a periodic stream of payments over the term of the contract and received no benefit from the contract. When the Fund is the seller of a credit default swap contract, it typically receives the stream of payments but is obligated to pay an amount equal to the par (or other agreed-upon) value of a referenced debt obligation upon the default or similar event by the issuer of the referenced debt obligation. The use of credit default swaps could result in losses to the Fund if the Adviser fails to correctly evaluate the creditworthiness of the issuer of the referenced debt obligation.
If the Fund is a seller of protection and a credit event occurs, as defined under the terms of that particular swap agreement, the Fund will either (i) pay to the buyer of protection an amount equal to the notional amount of the swap agreement and take delivery of the referenced obligation, other deliverable obligations or underlying securities comprising the referenced index or (ii) pay a net settlement amount in the form of cash or securities equal to the notional amount of the swap agreement less the recovery value of the referenced obligation or underlying securities comprising the referenced index. If the Fund is a buyer of protection and a
credit event occurs, as defined under the terms of that particular swap agreement, the Fund will either (i) receive from the seller of protection an amount equal to the notional amount of the swap agreement and deliver the referenced obligation, other deliverable obligations or underlying securities comprising the referenced index or (ii) receive a net settlement amount in the form of cash or securities equal to the notional amount of the swap agreement less the recovery value of the referenced obligation or underlying securities comprising the referenced index. Recovery values are estimated by market makers considering either industry standard recovery rates or entity specific factors and considerations until a credit event occurs. If a credit event has occurred, the recovery value is determined by a facilitated auction whereby a minimum number of allowable broker bids, together with a specified valuation method, are used to calculate the settlement value. The Fund's maximum risk of loss from counterparty risk, either as the protection seller or as the protection buyer, is the fair value of the swap agreement.
The current credit rating of each individual issuer is listed in the table following the Consolidated Portfolio of Investments and serves as an indicator of the current status of the payment/performance risk of the credit derivative. Alternatively, for credit default swaps on an index of credits, the quoted market prices and current values serve as an indicator of the current status of the payment/performance risk of the credit derivative. Generally, lower credit ratings and increasing market values, in absolute terms, represent a deterioration of the credit and a greater likelihood of an adverse credit event of the issuer.
When the Fund has an unrealized loss on a swap agreement, the Fund has instructed the custodian to pledge cash or liquid securities as collateral with a value approximately equal to the amount of the unrealized loss. Collateral pledges are monitored and subsequently adjusted if and when the swap valuations fluctuate. If applicable, cash collateral is included with "Due from (to) Broker" in the Consolidated Statement of Assets and Liabilities.
Upfront payments paid or received by the Fund will be reflected as an asset or liability, respectively, in the Consolidated Statement of Assets and Liabilities.
51
Morgan Stanley Institutional Fund Trust
Annual Report — September 30, 2017
Notes to Consolidated Financial Statements (cont'd)
Foreign Currency Forward Exchange Contracts: In connection with its investments in foreign securities, the Fund also entered into contracts with banks, brokers or dealers to purchase or sell securities or foreign currencies at a future date. A foreign currency forward exchange contract ("currency contract") is a negotiated agreement between the contracting parties to exchange a specified amount of currency at a specified future time at a specified rate. The rate can be higher or lower than the spot rate between the currencies that are the subject of the contract. Currency contracts may be used to protect against uncertainty in the level of future foreign currency exchange rates or to gain or modify exposure to a particular currency. In addition, the Fund may use cross currency hedging or proxy hedging with respect to currencies in which the Fund has or expects to have portfolio or currency exposure. Cross currency hedges involve the sale of one currency against the positive exposure to a different currency and may be used for hedging purposes or to establish an active exposure to the exchange rate between any two currencies. To the extent hedged by the use of currency contracts, the precise matching of the currency contract amounts and the value of the securities involved will not generally be possible because the future value of such securities in foreign currencies will change as a consequence of market movements in the value of those securities between the date on which the contract is entered into and the date it matures. Furthermore, such transactions may reduce or preclude the opportunity for gain if the value of the currency should move in the direction opposite to the position taken. There is additional risk to the extent that currency contracts create exposure to currencies in which the Fund's securities are not denominated. Unanticipated changes in currency prices may result in poorer overall performance for the Fund than if it had not entered into such contracts. The use of currency contracts involves the risk of loss from the insolvency or bankruptcy of the counterparty to the contract or the failure of the counterparty to make payments or otherwise comply with the terms of the contract. A currency contract is marked-to-market daily and the change in market value is recorded by the Fund as unrealized gain or loss. The Fund records realized gains (losses) when the currency contract is closed equal to the difference between the value of the currency contract at the time it was opened and the value at the time it was closed.
Options: With respect to options, the Fund is subject to equity risk, interest rate risk and foreign currency exchange risk in the normal course of pursuing its investment objectives. If the Fund buys an option, it buys a legal contract giving it the right to buy or sell a specific amount of the underlying instrument or foreign currency, or futures contract on the underlying instrument or foreign currency, at an agreed-upon price during a period of time or on a specified date typically in exchange for a premium paid by the Fund. The Fund may purchase and/or sell put and call options. Purchasing call options tends to increase the Fund's exposure to the underlying (or similar) instrument. Purchasing put options tends to decrease the Fund's exposure to the underlying (or similar) instrument. When entering into purchased option contracts, the Fund bears the risk of interest or exchange rates or securities prices moving unexpectedly, in which case, the Fund may not achieve the anticipated benefits of the purchased option contracts; however the risk of loss is limited to the premium paid. Purchased options are reported as part of "Total Investments in Securities" in the Consolidated Statement of Assets and Liabilities. Premium paid for purchasing options which expired are treated as realized losses. If the Fund sells an option, it sells to another party the right to buy from or sell to the Fund a specific amount of the underlying instrument or foreign currency, or futures contract on the underlying instrument or foreign currency, at an agreed-upon price during a period of time or on a specified date typically in exchange for a premium received by the Fund. When options are purchased OTC, the Fund bears the risk that the counterparty that wrote the option will be unable or unwilling to perform its obligations under the option contract. Options may also be illiquid and the Fund may have difficulty closing out its position. A decision as to whether, when and how to use options involves the exercise of skill and judgment and even a well-conceived option transaction may be unsuccessful because of market behavior or unexpected events. The prices of options can be highly volatile and the use of options can lower total returns.
As of September 30, 2017, the Fund did not have any outstanding purchased options.
FASB ASC 815, "Derivatives and Hedging" ("ASC 815"), is intended to improve financial reporting about derivative instruments by requiring enhanced disclosures to
52
Morgan Stanley Institutional Fund Trust
Annual Report — September 30, 2017
Notes to Consolidated Financial Statements (cont'd)
enable investors to better understand how and why the Fund uses derivative instruments, how these derivative instruments are accounted for and their effects on the Fund's financial position and results of operations.
The following tables set forth the fair value of the Fund's derivative contracts by primary risk exposure as of September 30, 2017.
| | | Asset Derivatives
Consolidated
Statement of Assets and
Liabilities Location | | Primary Risk
Exposure | | Value
(000) | |
Foreign Currency
Forward Exchange
Contracts | | Unrealized Appreciation on
Foreign Currency Forward
Exchange Contracts | |
Currency Risk | | $ | 2,839 | | |
Futures Contract
| | Variation Margin on
Futures Contracts | | Commodity Risk | | | 24 | (a) | |
Futures Contracts
| | Variation Margin on
Futures Contracts | | Equity Risk | | | 1,193 | (a) | |
Futures Contracts
| | Variation Margin on
Futures Contracts | | Interest Rate Risk | | | 277 | (a) | |
Swap Agreements
| | Unrealized Appreciation on
Swap Agreements | | Equity Risk | | | 165 | | |
Swap Agreements
| | Variation Margin on
Swap Agreements | | Interest Rate Risk | | | 442 | (a) | |
Total | | | | | | $ | 4,940 | | |
| | | Liability Derivatives
Consolidated
Statement of Assets and
Liabilities Location | | Primary Risk
Exposure | | Value
(000) | |
Foreign Currency
Forward Exchange
Contracts | | Unrealized Depreciation on
Foreign Currency Forward
Exchange Contracts | | Currency Risk | | $ | (2,267 | ) | |
Futures Contracts
| | Variation Margin on
Futures Contracts | | Equity Risk | | | (665 | )(a) | |
Futures Contracts
| | Variation Margin on
Futures Contracts | | Interest Rate Risk | | | (88 | )(a) | |
Swap Agreements
| | Unrealized Depreciation on
Swap Agreements | | Equity Risk | | | (291 | ) | |
Swap Agreements
| | Unrealized Depreciation on
Swap Agreements | | Interest Rate Risk | | | (23 | ) | |
Swap Agreements
| | Variation Margin on
Swap Agreements | | Interest Rate Risk | | | (211 | )(a) | |
Total | | | | | | $ | (3,545 | ) | |
(a) This amount represents the cumulative appreciation (depreciation) as reported in the Consolidated Portfolio of Investments. The Consolidated Statement of Assets and Liabilities only reflects the current day's net variation margin.
The following tables set forth by primary risk exposure the Fund's realized gains (losses) and change in unrealized appreciation (depreciation) by type of derivative contract for the year ended September 30, 2017 in accordance with ASC 815.
Realized Gain (Loss) | |
Primary Risk Exposure | | Derivative Type | | Value
(000) | |
Equity Risk | | Options Purchased | | $ | 11 | (b) | |
Currency Risk
| | Foreign Currency Forward
Exchange Contracts | | | (273) | | |
Commodity Risk | | Futures Contracts | | | (500 | ) | |
Equity Risk | | Futures Contracts | | | 9,070 | | |
Interest Rate Risk | | Futures Contracts | | | 2,985 | | |
Credit Risk | | Swap Agreements | | | 321 | | |
Interest Rate Risk | | Swap Agreements | | | 268 | | |
Equity Risk | | Swap Agreements | | | (3,620 | ) | |
Total | | | | $ | 8,262 | | |
Change in Unrealized Appreciation (Depreciation) | |
Primary Risk Exposure | | Derivative Type | | Value
(000) | |
Currency Risk | | Options Purchased | | $ | (73 | )(b) | |
Currency Risk
| | Foreign Currency Forward
Exchange Contracts | | | 412 | | |
Commodity Risk | | Futures Contracts | | | 24 | | |
Equity Risk | | Futures Contracts | | | 25 | | |
Interest Rate Risk | | Futures Contracts | | | 158 | | |
Equity Risk | | Swap Agreements | | | (639 | ) | |
Credit Risk | | Swap Agreements | | | (108 | ) | |
Interest Rate Risk | | Swap Agreements | | | 848 | | |
Total | | | | $ | 647 | | |
(b) Amounts are included in Investments in the Consolidated Statement of Operations.
At September 30, 2017, the Fund's derivative assets and liabilities are as follows:
Gross Amounts of Assets and Liabilities Presented in the
Statement of Assets and Liabilities | |
Derivatives(c) | | Assets(d)
(000) | | Liabilities(d)
(000) | |
Foreign Currency Forward Exchange Contracts | | $ | 2,839 | | | $ | (2,267 | ) | |
Swap Agreements | | | 165 | | | | (314 | ) | |
Total | | $ | 3,004 | | | $ | (2,581 | ) | |
(c) Excludes exchange traded derivatives.
(d) Absent an event of default or early termination, OTC derivative assets and liabilities are presented gross and not offset in the Statement of Assets and Liabilities.
The Fund typically enters into International Swaps and Derivatives Association, Inc. Master Agreements ("ISDA Master Agreements") or similar master agreements (collectively, "Master Agreements") with its contract counterparties for certain OTC derivatives in order to, among other things, reduce its credit risk to counterparties. ISDA Master Agreements include provisions for general obligations, representations, collateral and events of default or termination. Under an ISDA Master Agreement, the Fund typically may offset with the counterparty certain OTC derivative financial instruments' payables and/or receivables with collateral held and/or posted and create one single net payment (close-out netting) in the event of default, termination and/or potential deterioration in the credit quality of the counterparty. Various Master Agreements
53
Morgan Stanley Institutional Fund Trust
Annual Report — September 30, 2017
Notes to Consolidated Financial Statements (cont'd)
govern the terms of certain transactions with counterparties, including transactions such as swap, forward, repurchase and reverse repurchase agreements. These Master Agreements typically attempt to reduce the counterparty risk associated with such transactions by specifying credit protection mechanisms and providing standardization that improves legal certainty. Cross-termination provisions under Master Agreements typically provide that a default in connection with one transaction between the Fund and a counterparty gives the non-defaulting party the right to terminate any other transactions in place with the defaulting party to create one single net payment due to/due from the defaulting party and may be a feature in certain Master Agreements. In the event the Fund exercises its right to terminate a Master Agreement after a counterparty experiences a termination event as defined in the Master Agreement, the return of collateral with market value in excess of the Fund's net liability may be delayed or denied.
The following tables present derivative financial instruments that are subject to enforceable netting arrangements as of September 30, 2017.
Gross Amounts Not Offset in the Statement of Assets and Liabilities | |
Counterparty | | Gross Asset
Derivatives
Presented in
Statement of
Assets and
Liabilities
(000) | | Financial
Instrument
(000) | | Collateral
Received(e)
(000) | | Net
Amount
(not less
than $0)
(000) | |
Australia and New Zealand
Banking Group | | $ | 37 | | | $ | (— | @) | | $ | — | | | $ | 37 | | |
Bank of America NA | | | 17 | | | | (17 | ) | | | — | | | | 0 | | |
Bank of Montreal | | | 49 | | | | (12 | ) | | | — | | | | 37 | | |
Barclays Bank PLC | | | 101 | | | | (101 | ) | | | — | | | | 0 | | |
BNP Paribas SA | | | 110 | | | | (49 | ) | | | (50 | ) | | | 11 | | |
Citibank NA | | | 2,008 | | | | (1,641 | ) | | | (266 | ) | | | 101 | | |
Commonwealth Bank of Australia | | | — | @ | | | (— | @) | | | — | | | | 0 | | |
Goldman Sachs International | | | 133 | | | | (133 | ) | | | — | | | | 0 | | |
HSBC Bank PLC | | | 8 | | | | (8 | ) | | | — | | | | 0 | | |
JPMorgan Chase Bank NA | | | 484 | | | | (128 | ) | | | (300 | ) | | | 56 | | |
State Street Bank and Trust Co. | | | 4 | | | | (4 | ) | | | — | | | | 0 | | |
UBS AG | | | 53 | | | | (47 | ) | | | — | | | | 6 | | |
Total | | $ | 3,004 | | | $ | (2,140 | ) | | $ | (616 | ) | | $ | 248 | | |
(e) In some instances, the actual collateral received may be more than the amount shown here due to overcollateralization.
Gross Amounts Not Offset in the Statement of Assets and Liabilities | |
Counterparty | | Gross Liability
Derivatives
Presented in
Statement of
Assets and
Liabilities
(000) | | Financial
Instrument
(000) | | Collateral
Pledged
(000) | | Net
Amount
(not less
than $0)
(000) | |
Australia and New Zealand
Banking Group | | $ | — | @ | | $ | (— | @) | | $ | | | | $ | 0 | | |
Bank of America NA | | | 34 | | | | (17 | ) | | | — | | | | 17 | | |
Bank of Montreal | | | 12 | | | | (12 | ) | | | — | | | | 0 | | |
Bank of New York Mellon | | | — | @ | | | — | | | | — | | | | — | @ | |
Barclays Bank PLC | | | 106 | | | | (101 | ) | | | — | | | | 5 | | |
BNP Paribas SA | | | 340 | | | | (49 | ) | | | — | | | | 291 | | |
Citibank NA | | | 1,641 | | | | (1,641 | ) | | | — | | | | 0 | | |
Commonwealth Bank of Australia | | | 32 | | | | (— | @) | | | — | | | | 32 | | |
Credit Suisse International | | | 11 | | | | — | | | | — | | | | 11 | | |
Goldman Sachs International | | | 152 | | | | (133 | ) | | | — | | | | 19 | | |
HSBC Bank PLC | | | 46 | | | | (8 | ) | | | — | | | | 38 | | |
JPMorgan Chase Bank NA | | | 128 | | | | (128 | ) | | | — | | | | 0 | | |
State Street Bank and Trust Co. | | | 32 | | | | (4 | ) | | | — | | | | 28 | | |
UBS AG | | | 47 | | | | (47 | ) | | | — | | | | 0 | | |
Total | | $ | 2,581 | | | $ | (2,140 | ) | | $ | — | | | $ | 441 | | |
@ Amount is less than $500.
For the year ended September 30, 2017, the approximate average monthly amount outstanding for each derivative type is as follows:
Foreign Currency Forward Exchange Contracts: | |
Average monthly principal amount | | $ | 109,417,000 | | |
Futures Contracts: | |
Average monthly original value | | $ | 233,804,000 | | |
Swap Agreements: | |
Average monthly notional amount | | $ | 1,077,671,000 | | |
Options Purchased: | |
| Average monthly notional amount | | | 93,000 | | |
5. When-Issued/Delayed Delivery Securities: The Fund purchases and sells when-issued and delayed delivery securities. Securities purchased on a when-issued or delayed delivery basis are purchased for delivery beyond the normal settlement date at a stated price and yield, and no income accrues to the Fund on such securities prior to delivery date. Payment and delivery for when-issued and delayed delivery securities can take place a month or more after the date of the transaction. When the Fund enters into a purchase transaction on a when-issued or delayed delivery basis, securities are available for collateral in an amount at least equal in value to the Fund's commitments to purchase such securities. Purchasing securities on a when-issued or delayed delivery basis may involve a risk that the market price at the time of delivery may be lower than the agreed upon purchase price, in which case there
54
Morgan Stanley Institutional Fund Trust
Annual Report — September 30, 2017
Notes to Consolidated Financial Statements (cont'd)
could be an unrealized loss at the time of delivery. Purchasing investments on a when-issued or delayed delivery basis may be considered a form of leverage which may increase the impact that gains (losses) may have on the Fund.
6. Indemnifications: The Trust enters into contracts that contain a variety of indemnifications. The Trust's maximum exposure under these arrangements is unknown. However, the Trust has not had prior claims or losses pursuant to these contracts and expects the risk of loss to be remote.
7. Dividends and Distributions to Shareholders: Dividends and distributions to shareholders are recorded on the ex-dividend date. Dividends from net investment income, if any, are declared and paid annually. Net realized capital gains, if any, are distributed at least annually.
8. Security Transactions, Income and Expenses: Security transactions are accounted for on the trade date (date the order to buy or sell is executed). Realized gains and losses on the sale of investment securities are determined on the specific identified cost method. Dividend income and other distributions are recorded on the ex-dividend date (except for certain foreign dividends which may be recorded as soon as the Fund is informed of such dividends) net of applicable withholding taxes. Interest income is recognized on the accrual basis except where collection is in doubt. Discounts are accreted and premiums are amortized over the life of the respective securities. Most expenses of the Trust can be directly attributed to a particular Fund. Expenses which cannot be directly attributed are apportioned among the Funds based upon relative net assets or other appropriate methods. Income, expenses (other than class specific expenses — distribution and shareholder services, transfer agency and sub transfer agency fees) and realized and unrealized gains or losses are allocated to each class of shares based upon their relative net assets.
The Fund owns shares of real estate investment trusts ("REITs") which report information on the source of their distributions annually in the following calendar year. A portion of distributions received from REITs during the year is estimated to be a return of capital and is recorded as a reduction of their cost.
B. Advisory Fees: The Adviser, a wholly-owned subsidiary of Morgan Stanley, provides the Fund with advisory services
under the terms of an Investment Advisory Agreement, paid quarterly, at an annual rate of 0.45% of the average daily net assets of the Fund.
The Adviser has agreed to reduce its advisory fee and/or reimburse the Fund so that total annual portfolio operating expenses, excluding certain investment related expenses, taxes, interest and other extraordinary expenses (including litigation), will not exceed 0.74% for Class I shares, 1.09% for Class A shares, 1.59% for Class L shares, 1.84% for Class C shares and 0.71% for Class IS shares. The fee waivers and/or expense reimbursements will continue for at least one year from the date of the Fund's prospectus or until such time as the Trustees act to discontinue all or a portion of such waivers and/or reimbursements when they deem such action is appropriate. For the year ended September 30, 2017, approximately $197,000 of advisory fees were waived and approximately $45,000 of other expenses were reimbursed by the Adviser pursuant to this arrangement.
The Adviser provides investment advisory services to the Subsidiary pursuant to the Subsidiary Investment Management Agreement (the "Agreement"). Under the Agreement, the Subsidiary will pay the Adviser at the end of each fiscal quarter, calculated by applying a quarterly rate, based on the annual rate of 0.05%, to the average daily net assets of the Subsidiary.
The Adviser has agreed to waive its advisory fees by the amount of advisory fees it receives from the Subsidiary.
C. Administration Fees: The Adviser also serves as Administrator to the Trust and provides administrative services pursuant to an Administration Agreement for an annual fee, accrued daily and paid monthly, of 0.08% of the Fund's average daily net assets. Under a Sub-Administration Agreement between the Administrator and State Street Bank and Trust Company ("State Street"), State Street provides certain administrative services to the Trust. For such services, the Administrator pays State Street a portion of the fee the Administrator receives from the Fund.
D. Distribution and Shareholder Services Fees: Morgan Stanley Distribution, Inc. ("MSDI" or the "Distributor"), a wholly-owned subsidiary of the Adviser, and an indirect subsidiary of Morgan Stanley, serves as the Trust's Distributor of Fund shares pursuant to a Distribution Agreement. The Trust has adopted a Shareholder Services Plan with respect to Class A shares pursuant to Rule 12b-1 under the Act. Under the Shareholder Services Plan, the Fund pays the Distributor a shareholder services fee, accrued daily and paid
55
Morgan Stanley Institutional Fund Trust
Annual Report — September 30, 2017
Notes to Consolidated Financial Statements (cont'd)
monthly, at an annual rate of 0.25% of the Fund's average daily net assets attributable to Class A shares.
The Trust has adopted a Distribution and Shareholder Services Plan with respect to Class L shares pursuant to Rule 12b-1 under the Act. Under the Distribution and Shareholder Services Plan, the Fund pays the Distributor a distribution fee, accrued daily and paid monthly, at an annual rate of 0.50% and a shareholder services fee, accrued daily and paid monthly, at an annual rate of 0.25% of the Fund's average daily net assets attributable to Class L shares.
The Trust has adopted a Distribution and Shareholder Services Plan with respect to Class C shares pursuant to Rule 12b-1 under the Act. Under the Distribution and Shareholder Services Plan, the Fund pays the Distributor a distribution fee, accrued daily and paid monthly, at an annual rate of 0.75% and a shareholder services fee, accrued daily and paid monthly, at an annual rate of 0.25% of the Fund's average daily net assets attributable to Class C shares.
The distribution and shareholder services fees are used to support the expenses associated with servicing and maintaining accounts. The Distributor may compensate other parties for providing shareholder support services to investors who purchase Class A, Class L and Class C shares.
E. Dividend Disbursing and Transfer Agent: The Trust's dividend disbursing and transfer agent is Boston Financial Data Services, Inc. ("BFDS"). Pursuant to a Transfer Agency Agreement, the Trust pays BFDS a fee based on the number of classes, accounts and transactions relating to the Funds of the Trust.
F. Custodian Fees: State Street (the "Custodian") serves as Custodian for the Trust in accordance with a Custodian Agreement. The Custodian holds cash, securities, and other assets of the Trust as required by the Act. Custody fees are payable monthly based on assets held in custody, investment purchases and sales activity and account maintenance fees, plus reimbursement for certain out-of-pocket expenses.
G. Security Transactions and Transactions with Affiliates: For the year ended September 30, 2017, purchases and sales of investment securities for the Fund, other than long-term U.S. Government securities and short-term investments, were approximately $209,121,000 and $267,582,000, respectively. For the year ended September 30, 2017, purchases and sales of long-term U.S. Government securities were approximately $132,508,000 and $147,667,000, respectively.
The Fund invests in the Institutional Class of the Morgan Stanley Institutional Liquidity Funds — Government Portfolio (the "Liquidity Funds"), an open-end management investment company managed by the Adviser. Advisory fees paid by the Fund are reduced by an amount equal to its pro-rata share of the advisory and administration fees paid by the Fund due to its investment in the Liquidity Funds. For the year ended September 30, 2017, advisory fees paid were reduced by approximately $59,000 relating to the Fund's investment in the Liquidity Funds.
The Fund invests in Morgan Stanley Institutional Fund, Inc. — Emerging Markets Portfolio ("Emerging Markets Portfolio"), an open-end management investment company advised by an affiliate of the Adviser. Advisory fees paid by the Fund are reduced by an amount equal to its pro-rata share of the advisory and administration fees paid by the Emerging Markets Portfolio. For the year ended September 30, 2017, advisory fees paid were reduced by less than $500 relating to the Fund's investment in the Emerging Markets Portfolio.
A summary of the Fund's transactions in share of the affiliated investments companies during the year ended September 30, 2017 are as follows:
Affiliated
Investment
Company | | Value
September 30,
2016
(000) | | Purchases
at Cost
(000) | | Proceeds
from Sales
(000) | | Dividend
Income
(000) | |
Liquidity Funds | | $ | 5,955 | | | $ | 274,993 | | | $ | 240,972 | | | $ | 242 | | |
Emerging Markets
Fixed Income
Opportunities
Portfolio | | | 113 | | | | — | | | | 114 | | | | — | | |
| | | $ | 6,068 | | | $ | 274,993 | | | $ | 241,086 | | | $ | 242 | | |
Affiliated
Investment
Company (cont'd) | | Realized
Loss
(000) | | Change in
Unrealized
Appreciation
(Depreciation)
(000) | | Value
September 30,
2017
(000) | |
Liquidity Funds | | $ | — | | | $ | — | | | $ | 39,976 | | |
Emerging Markets
Fixed Income
Opportunities
Portfolio | | | (18 | ) | | | 20 | | | | — | | |
| | | $ | (18 | ) | | $ | 20 | | | $ | 39,976 | | |
The Fund is permitted to purchase and sell securities ("cross-trade") from and to other Morgan Stanley Funds as well as other funds and client accounts for which the Adviser or an affiliate of the Adviser serves as investment adviser, pursuant to procedures approved by the Trustees in compliance with Rule 17a-7 under the Act (the "Rule"). Each cross-trade is executed at the current market price in compliance with
56
Morgan Stanley Institutional Fund Trust
Annual Report — September 30, 2017
Notes to Consolidated Financial Statements (cont'd)
provisions of the Rule. For the year ended September 30, 2017, the Fund did not engage in any cross-trade transactions.
The Fund has an unfunded Deferred Compensation Plan (the "Compensation Plan"), which allows each independent Trustee to defer payment of all, or a portion, of the fees he or she receives for serving on the Board of Trustees. Each eligible Trustee generally may elect to have the deferred amounts credited with a return equal to the total return on one or more of the Morgan Stanley funds that are offered as investment options under the Compensation Plan. Appreciation/depreciation and distributions received from these investments are recorded with an offsetting increase/decrease in the deferred compensation obligation and do not affect the NAV of the Fund.
H. Federal Income Taxes: It is the Fund's intention to continue to qualify as a regulated investment company and distribute all of its taxable and tax-exempt income. Accordingly, no provision for federal income taxes is required in the financial statements.
The Fund may be subject to taxes imposed by countries in which it invests. Such taxes are generally based on income and/or capital gains earned or repatriated. Taxes are accrued based on net investment income, net realized gains and net unrealized appreciation as such income and/or gains are earned. Taxes may also be based on transactions in foreign currency and are accrued based on the value of investments denominated in such currency.
FASB ASC 740-10, "Income Taxes — Overall", sets forth a minimum threshold for financial statement recognition of the benefit of a tax position taken or expected to be taken in a tax return. Management has concluded there are no significant uncertain tax positions that would require recognition in the financial statements. If applicable, the Fund recognizes interest accrued related to unrecognized tax benefits in "Interest Expense" and penalties in "Other Expenses" in the Statement of Operations. The Fund files tax returns with the U.S. Internal Revenue Service, New York and various states. Each of the tax years in the four-year period ended September 30, 2017, remains subject to examination by taxing authorities.
The tax character of distributions paid may differ from the character of distributions shown in the Statements of Changes in Net Assets due to short-term capital gains being treated as
ordinary income for tax purposes. The tax character of distributions paid during fiscal years 2017 and 2016 was as follows:
2017
Distributions
Paid From: | | 2016
Distributions
Paid From: | |
Ordinary
Income
(000) | | Long-Term
Capital Gain
(000) | | Ordinary
Income
(000) | | Long-Term
Capital Gain
(000) | |
| $ | 2,854 | | | $ | — | | | $ | — | | | $ | 425 | | |
The amount and character of income and gains to be distributed are determined in accordance with income tax regulations which may differ from GAAP. These book/tax differences are either considered temporary or permanent in nature.
Temporary differences are attributable to differing book and tax treatments for the timing of the recognition of gains (losses) on certain investment transactions and the timing of the deductibility of certain expenses.
Permanent differences, primarily due to differing treatments of gains (losses) related to foreign currency transactions, basis adjustments for swap transactions, tax adjustments on passive foreign investment companies sold by the Fund and tax adjustments related to the Subsidiary, resulted in the following reclassifications among the components of net assets at September 30, 2017:
Accumulated
Undistributed
Net Investment
Income
(000) | | Accumulated
Undistributed
Net Realized
Gain
(000) | | Paid-in-
Capital
(000) | |
| $ | (3,407 | ) | | $ | 3,407 | | | $ | — | | |
At September 30, 2017, the components of distributable earnings for the Fund on a tax basis were as follows:
Undistributed
Ordinary
Income
(000) | | Undistributed
Long-Term
Capital Gain
(000) | |
| $ | 2,961 | | | $ | 16,271 | | |
During the year ended September 30, 2017, the Fund utilized capital loss carryforwards for U.S. federal income tax purposes of approximately $8,100,000.
I. Credit Facility: The Trust and other Morgan Stanley funds participate in a $150,000,000 committed, unsecured revolving line of credit facility (the "facility") with State Street. This facility is to be used for temporary emergency purposes or funding of shareholder redemption requests. The interest rate on borrowings is based on the federal funds rate or one month libor rate plus a spread. The facility also has a commitment fee of 0.25% per annum based on the unused portion of the
57
Morgan Stanley Institutional Fund Trust
Annual Report — September 30, 2017
Notes to Consolidated Financial Statements (cont'd)
facility. During the year ended September 30, 2017, the Fund did not have any borrowings under the facility.
J. Other: At September 30, 2017, the Fund had record owners of 10% or greater. Investment activities of these shareholders could have a material impact on the Fund. The aggregate percentage of such owners was 50.3%.
K. Accounting Pronouncement: In March 2017, FASB issued an Accounting Standard Update, ASU 2017-08, Receivables-Nonrefundable Fees and Other Costs (Subtopic 310-20), Premium Amortization on Purchased Callable Debt Securities (the "ASU") which amends the amortization period for certain purchased callable debt securities held at a premium, shortening such period to the earliest call date. The ASU does not require any accounting change for debt securities held at a discount; the discount continues to be amortized to maturity. The ASU is effective for fiscal years, and interim periods within those fiscal years, beginning after December 15, 2018. At this time, management is evaluating the implications of these changes on the financial statements.
58
Morgan Stanley Institutional Fund Trust
Annual Report — September 30, 2017
Report of Independent Registered Public Accounting Firm
To the Shareholders and Board of Trustees of
Morgan Stanley Institutional Fund Trust —
Global Strategist Portfolio
We have audited the accompanying consolidated statement of assets and liabilities, including the consolidated portfolio of investments, of Global Strategist Portfolio (one of the funds constituting Morgan Stanley Institutional Fund Trust) (the "Fund") as of September 30, 2017, the related consolidated statement of operations for the year then ended, the consolidated statements of changes in net assets for each of the two years in the period then ended and the consolidated financial highlights for each of the years or periods indicated therein. These consolidated financial statements and financial highlights are the responsibility of the Fund's management. Our responsibility is to express an opinion on these consolidated financial statements and financial highlights based on our audits.
We conducted our audits in accordance with the standards of the Public Company Accounting Oversight Board (United States). Those standards require that we plan and perform the audit to obtain reasonable assurance about whether the consolidated financial statements and financial highlights are free of material misstatement. We were not engaged to perform an audit of the Fund's internal control over financial reporting. Our audits included consideration of internal control over financial reporting as a basis for designing audit procedures that are appropriate in the circumstances, but not for the purpose of expressing an opinion on the effectiveness of the Fund's internal control over financial reporting. Accordingly, we express no such opinion. An audit also includes examining, on a test basis, evidence supporting the amounts and disclosures in the consolidated financial statements and financial highlights, assessing the accounting principles used and significant estimates made by management, and evaluating the overall financial statement presentation. Our procedures included confirmation of securities owned as of September 30, 2017, by correspondence with the custodian and others or by other appropriate auditing procedures where replies from others were not received. We believe that our audits provide a reasonable basis for our opinion.
In our opinion, the consolidated financial statements and financial highlights referred to above present fairly, in all material respects, the consolidated financial position of Global Strategist Portfolio (one of the funds constituting Morgan Stanley Institutional Fund Trust) at September 30, 2017, the consolidated results of its operations for the year then ended, the consolidated changes in its net assets for each of the two years in the period then ended and the consolidated financial highlights for each of the years or periods indicated therein, in conformity with U.S. generally accepted accounting principles.

Boston, Massachusetts
November 22, 2017
59
Morgan Stanley Institutional Fund Trust
Annual Report — September 30, 2017
Investment Advisory Agreement Approval (unaudited)
Nature, Extent and Quality of Services
The Board reviewed and considered the nature and extent of the investment advisory services provided by the Adviser (as defined herein) under the advisory agreement, including portfolio management, investment research and equity and fixed income securities trading. The Board also reviewed and considered the nature and extent of the non-advisory, administrative services provided by the Adviser under the administration agreement, including accounting, operations, clerical, bookkeeping, compliance, business management and planning, legal services and the provision of supplies, office space and utilities at the Adviser's expense. The Board also considered the Adviser's investment in personnel and infrastructure that benefits the Fund. (The advisory and administration agreements together are referred to as the "Management Agreement.") The Board also considered that the Adviser serves a variety of other investment advisory clients and has experience overseeing service providers. The Board also compared the nature of the services provided by the Adviser with similar services provided by non-affiliated advisers as presented to the Board by Broadridge Financial Solutions, Inc. ("Broadridge").
The Board reviewed and considered the qualifications of the portfolio managers, the senior administrative managers and other key personnel of the Adviser who provide the administrative and advisory services to the Fund. The Board determined that the Adviser's portfolio managers and key personnel are well qualified by education and/or training and experience to perform the services in an efficient and professional manner. The Board concluded that the nature and extent of the advisory and administrative services provided were necessary and appropriate for the conduct of the business and investment activities of the Fund and supported its decision to approve the Management Agreement.
Performance, Fees and Expenses of the Fund
The Board reviewed the performance, fees and expenses of the Fund compared to its peers, as presented by Broadridge, and to appropriate benchmarks where applicable. The Board discussed with the Adviser the performance goals and the actual results achieved in managing the Fund. When considering a fund's performance, the Board and the Adviser place emphasis on trends and longer-term returns (focusing on one-year, three-year and five-year performance, as of December 31, 2016, or since inception, as applicable). When a fund underperforms its benchmark and/or its peer group average, the Board and the Adviser discuss the causes of such underperformance and, where necessary, they discuss specific changes to investment strategy or investment personnel. The Board noted that the Fund's performance was below its peer group average for the one- and three-year periods but better than its peer group average for the five-year period. The Board discussed with the Adviser the level of the advisory and administration fees (together, the "management fee") for this Fund relative to comparable funds and/or other accounts advised by the Adviser and/or compared to its peers as presented by Broadridge. In addition to the management fee, the Board also reviewed the Fund's total expense ratio. The Board noted that the Fund's management fee and total expense ratio were lower than its peer group averages. After discussion, the Board concluded that the Fund's (i) performance was acceptable; and (ii) management fee and total expense ratio were competitive with its peer group averages.
Economies of Scale
The Board considered the size and growth prospects of the Fund and how that relates to the Fund's total expense ratio and particularly the Fund's management fee rate, which does not include breakpoints. In conjunction with its review of the Adviser's profitability, the Board discussed with the Adviser how a change in assets can affect the efficiency or effectiveness of managing the Fund and whether the management fee level is appropriate relative to current and projected asset levels and/or whether the management fee structure reflects economies of scale as asset levels change. The Board has determined that its review of the actual and/or potential economies of scale of the Fund supports its decision to approve the Management Agreement.
Profitability of the Adviser and Affiliates
The Board considered information concerning the costs incurred and profits realized by the Adviser and its affiliates during the last year from their relationship with the Fund and during the last two years from their relationship with the Morgan Stanley Fund Complex and reviewed with the Adviser the cost allocation methodology used to determine the profitability of the Adviser and affiliates. The Board has determined that its review of the analysis of the Adviser's expenses and profitability supports its decision to approve the Management Agreement.
60
Morgan Stanley Institutional Fund Trust
Annual Report — September 30, 2017
Investment Advisory Agreement Approval (unaudited) (cont'd)
Other Benefits of the Relationship
The Board considered other direct and indirect benefits to the Adviser and/or its affiliates derived from their relationship with the Fund and other funds advised by the Adviser. These benefits may include, among other things, fees for trading, distribution and/or shareholder servicing and for transaction processing and reporting platforms used by securities lending agents, and research received by the Adviser generated from commission dollars spent on funds' portfolio trading. The Board reviewed with the Adviser these arrangements and the reasonableness of the Adviser's costs relative to the services performed. The Board has determined that its review of the other benefits received by the Adviser or its affiliates supports its decision to approve the Management Agreement.
Resources of the Adviser and Historical Relationship Between the Fund and the Adviser
The Board considered whether the Adviser is financially sound and has the resources necessary to perform its obligations under the Management Agreement. The Board also reviewed and considered the historical relationship between the Fund and the Adviser, including the organizational structure of the Adviser, the policies and procedures formulated and adopted by the Adviser for managing the Fund's operations and the Board's confidence in the competence and integrity of the senior managers and key personnel of the Adviser. The Board concluded that the Adviser has the financial resources necessary to fulfill its obligations under the Management Agreement and that it is beneficial for the Fund to continue its relationship with the Adviser.
Other Factors and Current Trends
The Board considered the controls and procedures adopted and implemented by the Adviser and monitored by the Fund's Chief Compliance Officer and concluded that the conduct of business by the Adviser indicates a good faith effort on its part to adhere to high ethical standards in the conduct of the Fund's business.
General Conclusion
After considering and weighing all of the above factors, with various written materials and verbal information presented by the Adviser, the Board concluded that it would be in the best interest of the Fund and its shareholders to approve renewal of the Management Agreement for another year. In reaching this conclusion the Board did not give particular weight to any single piece of information or factor referenced above. The Board considered these factors and information over the course of the year and in numerous meetings, some of which were in executive session with only the independent Board members and their counsel present. It is possible that individual Board members may have weighed these factors, and the information presented, differently in reaching their individual decisions to approve the Management Agreement.
61
Morgan Stanley Institutional Fund Trust
Annual Report — September 30, 2017
Federal Tax Notice (unaudited)
For federal income tax purposes, the following information is furnished with respect to the distributions paid by the Fund during its taxable year ended September 30, 2017. For corporate shareholders 49.53% of the dividends qualified for the dividends received deduction.
For federal income tax purposes, the following information is furnished with respect to the Fund's earnings for its taxable year ended September 30, 2017. When distributed, certain earnings may be subject to a maximum tax rate of 15% as provided for by the Jobs and Growth Tax Relief Reconciliation Act of 2003. The Fund designated up to a maximum of approximately $4,586,000 as taxable at this lower rate.
The Fund intends to pass through foreign tax credits of approximately $374,000 and has derived net income from sources within foreign countries amounting to approximately $3,736,000.
In January, the Fund provides tax information to shareholders for the preceding calendar year.
62
Morgan Stanley Institutional Fund Trust
Annual Report — September 30, 2017
Privacy Notice (unaudited)
MORGAN STANLEY INVESTMENT MANAGEMENT INC.
AN IMPORTANT NOTICE CONCERNING OUR U.S. PRIVACY POLICY
We are required by federal law to provide you with a copy of our privacy policy annually. This policy applies to current and former individual investors in funds managed or sponsored by Morgan Stanley Investment Management Inc. ("MSIM") as well as current and former individual clients of MSIM. This policy is not applicable to partnerships, corporations, trusts or other non-individual clients or investors. Please note that we may amend this policy at any time, and will inform you of any changes as required by law.
WE RESPECT YOUR PRIVACY
We appreciate that you have provided us with your personal financial information. We strive to maintain the privacy of such information while we help you achieve your financial objectives. This Notice describes what non-public personal information we collect about you, why we collect it, when we may share it with others and how certain others may use it. It discusses the steps you may take to limit our sharing of certain information about you to affiliated companies in the Morgan Stanley family of companies ("other Morgan Stanley companies"). It also discloses how you may limit use of certain shared information for marketing purposes by other Morgan Stanley branded companies. Throughout this policy, we refer to the non-public information that personally identifies you or your accounts as "personal information."
1. WHAT PERSONAL INFORMATION DO WE COLLECT ABOUT YOU?
We obtain personal information from applications and other forms you submit to us, from your dealings with us, from consumer reporting agencies, from our Web sites and from third parties and other sources.
For example:
• We may collect information such as your name, address, e-mail address, telephone/fax numbers, assets, income and investment objectives through subscription documents, applications and other forms you submit to us.
• We may obtain information about account balances, your use of account(s) and the types of products and services you prefer to receive from us through your dealings and transactions with us and other sources.
• We may obtain information about your creditworthiness and credit history from consumer reporting agencies.
• We may collect background information from and through third-party vendors to verify representations you have made and to comply with various regulatory requirements.
• If you interact with us through our public and private Web sites, we may collect information that you provide directly through online communications (such as an e-mail address). We may also collect information about your Internet service provider, your domain name, your computer's operating system and Web browser, your use of our Web sites and your product and service preferences, through the use of "cookies." Please consult the Terms of Use of these sites for more details.
2. WHEN DO WE DISCLOSE PERSONAL INFORMATION WE COLLECT ABOUT YOU?
We may disclose personal information we collect about you to other Morgan Stanley companies and to non-affiliated third parties.
a. Information We Disclose to Other Morgan Stanley Companies.
We may disclose personal information to other Morgan Stanley companies for a variety of reasons, including to manage your account(s) effectively, to service and process your transactions, to let you know about products and services offered by us and other Morgan Stanley companies, to manage our business, and as otherwise required or permitted by law. Offers for products and services from other Morgan Stanley companies are developed under conditions designed to safeguard your personal information.
63
Morgan Stanley Institutional Fund Trust
Annual Report — September 30, 2017
Privacy Notice (unaudited) (cont'd)
b. Information We Disclose to Non-affiliated Third Parties.
We do not disclose personal information that we collect about you to non-affiliated third parties except to those who provide marketing services on our behalf, to financial institutions with whom we have joint marketing agreements, and as otherwise required or permitted by law. For example, we may disclose personal information to non-affiliated third parties for servicing and processing transactions, to offer our own products and services, to protect against fraud, for institutional risk control, to respond to judicial process or to perform services on our behalf. When we share personal information with a non-affiliated third party, they are required to limit their use of personal information to the particular purpose for which it was shared and they are not allowed to share personal information with others except to fulfill that limited purpose or as may be permitted or required by law.
3. HOW DO WE PROTECT THE SECURITY AND CONFIDENTIALITY OF PERSONAL INFORMATION WE COLLECT ABOUT YOU?
We maintain physical, electronic and procedural security measures to help safeguard the personal information we collect about you. We have internal policies governing the proper handling of client information. Third parties that provide support or marketing services on our behalf may also receive personal information, and we require them to adhere to confidentiality standards with respect to such information.
4. HOW CAN YOU LIMIT THE SHARING OF CERTAIN TYPES OF PERSONAL INFORMATION WITH OTHER MORGAN STANLEY COMPANIES?
We offer you choices as to whether we share with other Morgan Stanley companies the personal information that was collected to determine your eligibility for products and services you request ("eligibility information"). Eligibility information does not include your identification information or personal information pertaining to our transactions or experiences with you. Please note that, even if you direct us not to share eligibility information with other Morgan Stanley companies ("opt-out"), we may still share personal information, including eligibility information, with those companies in circumstances excluded from the opt-out under applicable law, such as to process transactions or to service your account.
5. HOW CAN YOU LIMIT THE USE OF CERTAIN TYPES OF PERSONAL INFORMATION BY OTHER MORGAN STANLEY COMPANIES FOR MARKETING?
By following the opt-out instructions in Section 6 below, you may limit other Morgan Stanley branded companies from marketing their products or services to you based on personal information we disclose to them. This information may include, for example, your income and account history with us. Please note that, even if you choose to limit Other Morgan Stanley Companies from using personal information about you that we may share with them for marketing their products and services to you, Other Morgan Stanley Companies may use your personal information that they obtain from us to market to you in circumstances permitted by law, such as if the Other Morgan Stanley Company has its own relationship with you.
6. HOW CAN YOU SEND US AN OPT-OUT INSTRUCTION?
If you wish to limit our sharing of eligibility information about you with other Morgan Stanley companies or other Morgan Stanley companies' use of personal information for marketing purposes, as described in this notice, you may do so by:
• Calling us at (800) 548-7786
Monday–Friday between 8a.m. and 6p.m.(EST)
• Writing to us at the following address:
Boston Financial Data Services, Inc.
c/o Privacy Coordinator
P.O. Box 219804
Kansas City, Missouri 64121
64
Morgan Stanley Institutional Fund Trust
Annual Report — September 30, 2017
Privacy Notice (unaudited) (cont'd)
Your written request should include your name, address, telephone number and account number(s) to which the opt-out applies and whether you are opting out with respect to sharing of eligibility information (Section 4 above), or if information used for Marketing (Section 5 above) or both. Written opt-out requests should not be sent with any other correspondence. In order to process your request, we require that the request be provided by you directly and not through a third party.
Your opt-out preference will remain in effect with respect to this policy (as it may be amended) until you notify us otherwise. If you have a joint account, your direction for us not to share this information with other Morgan Stanley companies and for those other Morgan Stanley companies not to use your personal information for marketing will be applied to all account holders on that account. Please understand that if you limit our sharing or our affiliated companies' use of personal information, you and any joint account holder(s) may not receive information about Morgan Stanley products and services, including products or services that could help you manage your financial resources and achieve your investment objectives.
7. WHAT IF AN AFFILIATED COMPANY BECOMES A NON-AFFILIATED THIRD PARTY?
If, at any time in the future, an affiliated company becomes a non-affiliated third party, further disclosures of personal information made to the former affiliated company will be limited to those described in Section 2(b) above relating to non-affiliated third parties. If you elected under Section 6 to limit disclosures we make to affiliated companies, or use of personal information by affiliated companies, your election will not apply to use by any former affiliated company of your personal information in their possession once it becomes a non-affiliated third party.
SPECIAL NOTICE TO RESIDENTS OF VERMONT
The following section supplements our policy with respect to our individual clients who have a Vermont address and supersedes anything to the contrary in the above policy with respect to those clients only.
The state of Vermont requires financial institutions to obtain your consent prior to sharing personal information that they collect about you with affiliated companies and non-affiliated third parties other than in certain limited circumstances. Except as permitted by law, we will not share personal information we collect about you with non-affiliated third parties or other Morgan Stanley companies unless you provide us with your written consent to share such information ("opt-in").
If you wish to receive offers for investment products and services offered by or through other Morgan Stanley companies, please notify us in writing at the following address:
Boston Financial Data Services, Inc.
c/o Privacy Coordinator
P.O. Box 219804
Kansas City, Missouri 64121
Your authorization should include your name, address, telephone number and account number(s) to which the opt-in applies and should not be sent with any other correspondence. In order to process your authorization, we require that the authorization be provided by you directly and not through a third party.
SPECIAL NOTICE TO RESIDENTS OF CALIFORNIA
The following section supplements our policy with respect to our individual clients who have a California address and supersedes anything to the contrary in the above policy with respect to those clients only.
In response to a California law, if your account has a California home address, your personal information will not be disclosed to non-affiliated third parties except as permitted by applicable California law, and we will limit sharing such information with our affiliates to comply with California privacy laws that apply to us.
65
Morgan Stanley Institutional Fund Trust
Annual Report — September 30, 2017
Trustee and Officer Information (unaudited)
Independent Trustees:
Name, Age and Address of
Independent Trustee | | Position(s)
Held with
Registrant | | Length of Time
Served* | | Principal Occupation(s) During Past 5 Years
and Other Relevant Professional Experience | | Number of
Portfolios in
Fund Complex
Overseen by
Independent
Trustee** | | Other Directorships
Held by Independent
Trustee*** | |
Frank L. Bowman (72)
c/o Perkins Coie LLP
Counsel to the Independent Trustees
30 Rockefeller Plaza
New York, NY 10112 | | Trustee | | Since
August
2006 | | President, Strategic Decisions, LLC (consulting) (since February 2009); Director or Trustee of various Morgan Stanley Funds (since August 2006); Chairperson of the Compliance and Insurance Committee (since October 2015); formerly, Chairperson of the Insurance Sub-Committee of the Compliance and Insurance Committee (2007-2015); served as President and Chief Executive Officer of the Nuclear Energy Institute (policy organization) (February 2005-November 2008); retired as Admiral, U.S. Navy after serving over 38 years on active duty including 8 years as Director of the Naval Nuclear Propulsion Program in the Department of the Navy and the U.S. Department of Energy (1996-2004); served as Chief of Naval Personnel (July 1994-September 1996) and on the Joint Staff as Director of Political Military Affairs (June 1992-July 1994); knighted as Honorary Knight Commander of the Most Excellent Order of the British Empire; awarded the Officier de l'Orde National du Mérite by the French Government; elected to the National Academy of Engineering (2009). | | | 90 | | | Director of BP p.l.c.; Director of Naval and Nuclear Technologies LLP; Director Emeritus of the Armed Services YMCA; Director of the U.S. Naval Submarine League; Member of the National Security Advisory Council of the Center for U.S. Global Engagement and a member of the CNA Military Advisory Board; Chairman of the charity J Street Cup Golf; Trustee of Fairhaven United Methodist Church; and Director of other various non-profit organizations. | |
Kathleen A. Dennis (64)
c/o Perkins Coie LLP
Counsel to the Independent Trustees
30 Rockefeller Plaza
New York, NY 10112 | | Trustee | | Since
August
2006 | | President, Cedarwood Associates (mutual fund and investment management consulting) (since July 2006); Chairperson of the Liquidity and Alternatives Sub-Committee of the Investment Committee (since October 2006) and Director or Trustee of various Morgan Stanley Funds (since August 2006); formerly, Senior Managing Director of Victory Capital Management (1993-2006). | | | 91 | | | Director of various non-profit organizations. | |
Nancy C. Everett (62)
c/o Perkins Coie LLP
Counsel to the Independent Trustees
30 Rockefeller Plaza
New York, NY 10112 | | Trustee | | Since
January
2015 | | Chief Executive Officer, Virginia Commonwealth University Investment Company (since November 2015); Owner OBIR, LLC (institutional investment management consulting) (since June 2014); formerly, Managing Director, BlackRock, Inc. (February 2011-December 2013); and Chief Executive Officer, General Motors Asset Management (a/k/a Promark Global Advisors, Inc.) (June 2005-May 2010). | | | 91 | | | Formerly, Member of Virginia Commonwealth University School of Business Foundation (2005-2016); Member of Virginia Commonwealth University Board of Visitors (2013-2015); Member of Committee on Directors for Emerging Markets Growth Fund, Inc. (2007-2010); Chairperson of Performance Equity Management, LLC (2006-2010); and Chairperson, GMAM Absolute Return Strategies Fund, LLC (2006-2010). | |
66
Morgan Stanley Institutional Fund Trust
Annual Report — September 30, 2017
Trustee and Officer Information (unaudited) (cont'd)
Independent Trustees: (cont'd)
Name, Age and Address of
Independent Trustee | | Position(s)
Held with
Registrant | | Length of Time
Served* | | Principal Occupation(s) During Past 5 Years
and Other Relevant Professional Experience | | Number of
Portfolios in
Fund Complex
Overseen by
Independent
Trustee** | | Other Directorships
Held by Independent
Trustee*** | |
Jakki L. Haussler (60)
c/o Perkins Coie LLP
Counsel to the Independent Trustees
30 Rockefeller Plaza
New York, NY 10112 | | Trustee | | Since
January
2015 | | Chairman and Chief Executive Officer, Opus Capital Group (since January 1996); formerly, Director, Capvest Venture Fund, LP (May 2000-December 2011); Partner, Adena Ventures, LP (July 1999-December 2010); Director, The Victory Funds (February 2005-July 2008). | | | 91 | | | Director of Cincinnati Bell Inc. and Member, Audit Committee and Compensation Committee; Director of Northern Kentucky University Foundation and Member, Investment Committee; Member of Chase College of Law Transactional Law Practice Center Board of Advisors; Director of Best Transport; Director of Chase College of Law Board of Visitors; formerly, Member, University of Cincinnati Foundation Investment Committee; Member, Miami University Board of Visitors (2008-2011); Trustee of Victory Funds (2005-2008) and Chairman, Investment Committee (2007-2008) and Member, Service Provider Committee (2005-2008). | |
Dr. Manuel H. Johnson (68)
c/o Johnson Smick
International, Inc.
220 I Street, NE —
Suite 200
Washington, D.C. 20002 | | Trustee | | Since
July
1991 | | Senior Partner, Johnson Smick International, Inc. (consulting firm); Chairperson of the Investment Committee (since October 2006) and Director or Trustee of various Morgan Stanley Funds (since July 1991); Co-Chairman and a founder of the Group of Seven Council (G7C) (international economic commission); formerly, Chairperson of the Audit Committee (July 1991-September 2006), Vice Chairman of the Board of Governors of the Federal Reserve System and Assistant Secretary of the U.S. Treasury. | | | 91 | | | Director of NVR, Inc. (home construction). | |
Joseph J. Kearns (75)
c/o Kearns & Associates LLC
46 E Peninsula Center
#385 Rolling Hills Estates,
CA 90274-3712 | | Trustee | | Since
August
1994 | | President, Kearns & Associates LLC (investment consulting); Chairperson of the Audit Committee (since October 2006) and Director or Trustee of various Morgan Stanley Funds (since August 1994); formerly, Deputy Chairperson of the Audit Committee (July 2003-September 2006) and Chairperson of the Audit Committee of various Morgan Stanley Funds (since August 1994); CFO of the J. Paul Getty Trust. | | | 93 | | | Director of Electro Rent Corporation (equipment leasing). Prior to December 31, 2013, Director of The Ford Family Foundation. | |
67
Morgan Stanley Institutional Fund Trust
Annual Report — September 30, 2017
Trustee and Officer Information (unaudited) (cont'd)
Independent Trustees: (cont'd)
Name, Age and Address of
Independent Trustee | | Position(s)
Held with
Registrant | | Length of Time
Served* | | Principal Occupation(s) During Past 5 Years
and Other Relevant Professional Experience | | Number of
Portfolios in
Fund Complex
Overseen by
Independent
Trustee** | | Other Directorships
Held by Independent
Trustee*** | |
Michael F. Klein (58)
c/o Perkins Coie LLP
Counsel to the Independent Trustees
30 Rockefeller Plaza
New York, NY 10112 | | Trustee | | Since
August
2006 | | Managing Director, Aetos Capital, LLC (since March 2000); Co-President, Aetos Alternatives Management, LLC (since January 2004) and Co-Chief Executive Officer of Aetos Capital LLC (since August 2013); Chairperson of the Fixed Income Sub-Committee of the Investment Committee (since October 2006) and Director or Trustee of various Morgan Stanley Funds (since August 2006); formerly, Managing Director, Morgan Stanley & Co. Inc. and Morgan Stanley Dean Witter Investment Management, President, various Morgan Stanley Funds (June 1998-March 2000) and Principal, Morgan Stanley & Co. Inc. and Morgan Stanley Dean Witter Investment Management (August 1997-December 1999). | | | 90 | | | Director of certain investment funds managed or sponsored by Aetos Capital, LLC; Director of Sanitized AG and Sanitized Marketing AG (specialty chemicals). | |
Patricia Maleski (57)
c/o Perkins Coie LLP
Counsel to the Independent Trustees
30 Rockefeller Plaza
New York, NY 10112 | | Trustee | | Since
January
2017 | | Managing Director, JPMorgan Asset Management (2004-2016); Oversight and Control Head of Fiduciary and Conflicts of Interest Program(2015-2016); Chief Control Officer-Global Asset Management (2013-2015); President, JPMorgan Funds (2010-2013); Chief Administrative Officer (2004-2013); various other positions including Treasurer and Board Liaison (since 2001). | | | 91 | | | None. | |
Michael E. Nugent (81)
522 Fifth Avenue
New York, NY 10036 | | Chair of the
Board and
Trustee | | Chair of the
Boards since
July 2006 and
Trustee since
July 1991 | | Chair of the Boards of various Morgan Stanley Funds (since July 2006); Chairperson of the Closed-End Fund Committee (since June 2012) and Director or Trustee of various Morgan Stanley Funds (since July 1991); formerly, Chairperson of the Insurance Committee (until July 2006); General Partner, Triumph Capital, L.P. (private investment partnership) (1988-2013). | | | 92 | | | None. | |
W. Allen Reed (70)
c/o Perkins Coie LLP
Counsel to the Independent Trustees
30 Rockefeller Plaza
New York, NY 10112 | | Trustee | | Since
August
2006 | | Chairperson of the Equity Sub-Committee of the Investment Committee (since October 2006) and Director or Trustee of various Morgan Stanley Funds (since August 2006); formerly, President and CEO of General Motors Asset Management; Chairman and Chief Executive Officer of the GM Trust Bank and Corporate Vice President of General Motors Corporation (August 1994-December 2005). | | | 91 | | | Director of Legg Mason, Inc.; formerly, Director of the Auburn University Foundation (2010-2015). | |
Fergus Reid (85)
c/o Joe Pietryka, Inc.
85 Charles Colman Blvd.
Pawling, NY 12564 | | Trustee | | Since
June
1992 | | Chairman, Joe Pietryka, Inc.; Chairperson of the Governance Committee and Director or Trustee of various Morgan Stanley Funds (since June 1992). | | | 92 | | | Formerly, Trustee and Director of certain investment companies in the JP Morgan Fund Complex managed by JP Morgan Investment Management Inc. (1987-2012). | |
* This is the earliest date the Trustee began serving the Morgan Stanley Funds. Each Trustee serves an indefinite term, until his or her successor is elected.
** The Fund Complex includes (as of December 31, 2016) all open-end and closed-end funds (including all of their portfolios) advised by Morgan Stanley Investment Management Inc. (the "Adviser") and any funds that have an adviser that is an affiliated person of the Adviser (including, but not limited to, Morgan Stanley AIP GP LP).
*** This includes any directorships at public companies and registered investment companies held by the Trustee at any time during the past five years.
68
Morgan Stanley Institutional Fund Trust
Annual Report — September 30, 2017
Trustee and Officer Information (unaudited) (cont'd)
Executive Officers:
Name, Age and Address of Executive Officer | | Position(s) Held
with
Registrant | | Length of
Time Served* | | Principal Occupation(s) During Past 5 Years | |
John H. Gernon (54)
522 Fifth Avenue
New York, NY 10036 | | President and
Principal
Executive
Officer | | Since
September
2013 | | President and Principal Executive Officer of the Equity and Fixed Income Funds and the Morgan Stanley AIP Funds (since September 2013) and the Liquidity Funds and various money market funds (since May 2014) in the Fund Complex; Managing Director of the Adviser; Head of Product (since 2006). | |
Timothy J. Knierim (58)
522 Fifth Avenue
New York, NY 10036 | | Chief
Compliance
Officer | | Since
December
2016 | | Managing Director of the Adviser and various entities affiliated with the Adviser; Chief Compliance Officer of various Morgan Stanley Funds and the Adviser (since December 2016) and Chief Compliance Officer of Morgan Stanley AIP GP LP (since 2014). Formerly, Managing Director and Deputy Chief Compliance Officer of the Adviser (2014-2016); and formerly, Chief Compliance Officer of Prudential Investment Management, Inc. (2007-2014). | |
Francis J. Smith (52)
522 Fifth Avenue
New York, NY 10036 | | Treasurer and
Principal
Financial
Officer | | Treasurer
since July 2003 and Principal Financial Officer since September 2002 | | Manging Director of the Adviser and various entities affiliated with the Adviser; Treasurer (since July 2003) and Principal Financial Officer of various Morgan Stanley Funds (since September 2002). | |
Mary E. Mullin (50)
522 Fifth Avenue
New York, NY 10036 | | Secretary | | Since
June
1999 | | Executive Director of the Adviser; Secretary of various Morgan Stanley Funds (since June 1999). | |
Michael J. Key (38)
522 Fifth Avenue
New York, NY 10036 | | Vice President | | Since
June
2017 | | Vice President of the Equity and Fixed Income Funds, Liquidity Funds, various money market funds and the Morgan Stanley AIP Funds in the Fund Complex (since June 2017); Executive Director of the Adviser; Head of Product Development for Equity and Fixed Income Funds (since August 2013). | |
* This is the earliest date the officer began serving the Morgan Stanley Funds. Each officer serves a one-year term, until his or her successor is elected and qualifies.
69
Morgan Stanley Institutional Fund Trust
Annual Report — September 30, 2017
Adviser and Administrator
Morgan Stanley Investment Management Inc.
522 Fifth Avenue
New York, New York 10036
Distributor
Morgan Stanley Distribution, Inc.
522 Fifth Avenue
New York, New York 10036
Dividend Disbursing and Transfer Agent
Boston Financial Data Services, Inc.
2000 Crown Colony Drive
Quincy, Massachusetts 02169
Custodian
State Street Bank and Trust Company
One Lincoln Street
Boston, Massachusetts 02111
Legal Counsel
Dechert LLP
1095 Avenue of the Americas
New York, New York 10036
Counsel to the Independent Trustees
Perkins Coie LLP
30 Rockefeller Plaza
New York, New York 10112
Independent Registered Public Accounting Firm
Ernst & Young LLP
200 Clarendon Street
Boston, Massachusetts 02116
Reporting to Shareholders
Each Morgan Stanley Fund provides a complete schedule of portfolio holdings in its semi-annual and annual reports within 60 days of the end of the fund's second and fourth fiscal quarters. The semi-annual and annual reports are filed electronically with the Securities and Exchange Commission (SEC) on Form N-CSRS and Form N-CSR, respectively. Morgan Stanley also delivers the semi-annual and annual reports to fund shareholders and makes these reports available on its public website, www.morganstanley.com/im. Each Morgan Stanley fund also files a complete schedule of portfolio holdings with the SEC for the fund's first and third fiscal quarters on Form N-Q. Morgan Stanley does not deliver the reports for the first and third fiscal quarters to shareholders, nor are the reports posted to the Morgan Stanley public website. You may, however, obtain the Form N-Q filings (as well as the Form N-CSR and N-CSRS filings) by accessing the SEC's website, www.sec.gov. You may also review and copy them at the SEC's Public Reference Room in Washington, DC. Information on the operation of the SEC's Public Reference Room may be obtained by calling the SEC toll free at 1 (800) SEC-0330. You can also request copies of these materials, upon payment of a duplicating fee, by electronic request at the SEC's email address (publicinfo@sec.gov) or by writing to the SEC's Public Reference Section, Washington, D.C. 20549-1520.
Proxy Voting Policies and Procedures and Proxy Voting Record
You may obtain a copy of the Trust's Proxy Voting Policy and Procedures and information regarding how the Trust voted proxies relating to portfolio securities during the most recent twelve-month period ended June 30, without charge, upon request, by calling toll free 1 (800) 548-7786 or by visiting our website at www.morganstanley.com/im. This information is also available on the SEC's website at www.sec.gov.
This report is authorized for distribution only when preceded or accompanied by a prospectus or summary prospectus of the applicable Fund of Morgan Stanley Institutional Fund Trust, which describes in detail the Fund's investment policies, risks, fees and expenses. Please read the prospectus carefully before you invest or send money. For additional information, including information regarding the investments comprising the Fund, please visit our website at www.morganstanley.com/im or call toll free 1 (800) 548-7786.
70
(This Page has been left blank intentionally.)
(This Page has been left blank intentionally.)
(This Page has been left blank intentionally.)
Printed in U.S.A.
This Report has been prepared for shareholders and may be distributed to others only if preceded or accompanied by a current prospectus.
Morgan Stanley Investment Management Inc.
522 Fifth Avenue
New York, New York 10036
© 2017 Morgan Stanley. Morgan Stanley Distribution, Inc.

IFTGSANN
1942255 EXP 11.30.18

Morgan Stanley Institutional Fund Trust
High Yield Portfolio
Annual Report
September 30, 2017

Morgan Stanley Institutional Fund Trust
Annual Report — September 30, 2017
Shareholders' Letter | | | 2 | | |
Expense Example | | | 3 | | |
Investment Overview | | | 4 | | |
Portfolio of Investments | | | 7 | | |
Statement of Assets and Liabilities | | | 14 | | |
Statement of Operations | | | 16 | | |
Statements of Changes in Net Assets | | | 17 | | |
Financial Highlights | | | 19 | | |
Notes to Financial Statements | | | 24 | | |
Report of Independent Registered Public Accounting Firm | | | 31 | | |
Investment Advisory Agreement Approval | | | 32 | | |
Privacy Notice | | | 34 | | |
Trustee and Officer Information | | | 37 | | |
This report is authorized for distribution only when preceded or accompanied by a prospectus or summary prospectus of the applicable Fund of the Morgan Stanley Institutional Fund Trust. To receive a prospectus and/or statement of additional information (SAI), which contains more complete information such as investment objectives, charges, expenses, policies for voting proxies, risk considerations, and describes in detail each of the Fund's investment policies to the prospective investor, please call toll free 1 (800) 548-7786. Please read the prospectuses carefully before you invest or send money.
Additionally, you can access information about the Fund, including performance, characteristics, and investment team commentary, through Morgan Stanley Investment Management's website: www.morganstanley.com/im.
Market forecasts provided in this report may not necessarily come to pass. There is no guarantee that any sectors mentioned will continue to perform as discussed herein or that securities in such sectors will be held by the Fund in the future. There is no assurance that a fund will achieve its investment objective. Funds are subject to market risk, which is the possibility that market values of securities owned by the Fund will decline and, therefore, the value of the Fund's shares may be less than what you paid for them. Accordingly, you can lose money investing in this Fund. Please see the prospectus for more complete information on investment risks.
1
Morgan Stanley Institutional Fund Trust
Annual Report — September 30, 2017
Shareholders' Letter (unaudited)
Dear Shareholders,
We are pleased to provide this Annual report, in which you will learn how your investment in High Yield Portfolio (the "Fund") performed during the latest twelve-month period.
Morgan Stanley Investment Management is a client-centric, investor-led organization. Our global presence, intellectual capital, and breadth of products and services enable us to partner with investors to meet the evolving challenges of today's financial markets. We aim to deliver superior investment service and to empower our clients to make the informed decisions that help them reach their investment goals.
As always, we thank you for selecting Morgan Stanley Investment Management, and look forward to working with you in the months and years ahead.
Sincerely,

John H. Gernon
President and Principal Executive Officer
October 2017
2
Morgan Stanley Institutional Fund Trust
Annual Report — September 30, 2017
Expense Example (unaudited)
High Yield Portfolio
As a shareholder of the Fund, you may incur two types of costs: (1) transactional costs, including sales charge (loads) on purchase payments; and (2) ongoing costs, which may include advisory fees, administration fees, distribution and shareholder services fees; and other Fund expenses. This example is intended to help you understand your ongoing costs (in dollars) of investing in the Fund and to compare these costs with the ongoing costs of investing in other mutual funds.
This example is based on an investment of $1,000 invested at the beginning of the six-month period ended September 30, 2017 and held for the entire six-month period.
Actual Expenses
The table below provides information about actual account values and actual expenses. You may use the information in this table, together with the amount you invested, to estimate the expenses that you paid over the period. Simply divide your account value by $1,000 (for example, an $8,600 account value divided by $1,000 = 8.6), then multiply the result by the number in the table under the heading entitled "Actual Expenses Paid During Period" to estimate the expenses you paid on your account during this period.
Hypothetical Example for Comparison Purposes
The table below provides information about hypothetical account values and hypothetical expenses based on the Fund's actual expense ratio and an assumed rate of return of 5% per year before expenses, which is not the Fund's actual return. The hypothetical account values and expenses may not be used to estimate the actual ending account balance or expenses you paid for the period. You may use this information to compare the ongoing costs of investing in the Fund and other funds. To do so, compare this 5% hypothetical example with the 5% hypothetical examples that appear in the shareholder reports of the other funds.
Please note that the expenses shown in the table are meant to highlight your ongoing costs only and do not reflect any transactional costs, such as sales charges (loads, if applicable). Therefore, the information for each class in the table is useful in comparing ongoing costs only, and will not help you determine the relative total costs of owning different funds. In addition, if these transactional costs were included, your costs would have been higher.
| | | Beginning
Account
Value
4/1/17 | | Actual Ending
Account
Value
9/30/17 | | Hypothetical
Ending Account
Value | | Actual
Expenses
Paid
During
Period* | | Hypothetical
Expenses Paid
During Period* | | Net
Expense
Ratio
During
Period** | |
High Yield Portfolio Class I | | $ | 1,000.00 | | | $ | 1,041.00 | | | $ | 1,021.76 | | | $ | 3.38 | | | $ | 3.35 | | | | 0.66 | % | |
High Yield Portfolio Class A | | | 1,000.00 | | | | 1,039.20 | | | | 1,020.00 | | | | 5.16 | | | | 5.11 | | | | 1.01 | | |
High Yield Portfolio Class L | | | 1,000.00 | | | | 1,037.80 | | | | 1,018.75 | | | | 6.44 | | | | 6.38 | | | | 1.26 | | |
High Yield Portfolio Class C | | | 1,000.00 | | | | 1,035.40 | | | | 1,016.24 | | | | 8.98 | | | | 8.90 | | | | 1.76 | | |
High Yield Portfolio Class IS | | | 1,000.00 | | | | 1,041.10 | | | | 1,021.96 | | | | 3.17 | | | | 3.14 | | | | 0.62 | | |
* Expenses are calculated using each Fund Class' annualized net expense ratio (as disclosed), multiplied by the average account value over the period, and multiplied by 183/365 (to reflect the most recent one-half year period).
** Annualized.
3
Morgan Stanley Institutional Fund Trust
Annual Report — September 30, 2017
Investment Overview (unaudited)
High Yield Portfolio
The Fund seeks total return.
Performance
For the fiscal year ended September 30, 2017, the Fund's Class I shares had a total return based on net asset value and reinvestment of distributions per share of 9.40%, net of fees. The Fund's Class I shares outperformed against the Fund's benchmark, the Bloomberg Barclays U.S. Corporate High Yield Index (the "Index"), which returned 8.88%.
Factors Affecting Performance
• The last year has been characterized by a steady grind tighter in credit markets, despite pockets of intra-year volatility as concerns about global growth, monetary policy, geopolitical tensions and commodities caused temporary market weaknesses. All of these periods, however, were brief and have resulted in positive performance in credit spreads over the period, as strong technicals and demand for the asset class mitigated any potential softness in the market.
• U.S. Treasury yields rose over the period. They initially jumped after the election. Shorter maturities continued to rise as the Federal Reserve (Fed) increased the target federal funds rate by 75 basis points (bps) over the period. Longer maturity yields fluctuated in a relatively narrow band post-election. Over the 12-month reporting period, the U.S. high yield market, as represented by the Index, was 139 bps tighter on a spread basis, ending the period at 370 bps, while yields were tighter by 72 bps, ending the period at 5.45%.(1)
• In the final quarter of 2016, the surprise Trump win in the United States dominated the news flow in November and pervasively impacted global rates, credit spreads and equity markets. Financial market conditions changed rapidly as investors priced in the inflationary impact of anticipated fiscal stimulus, reduced trade and a more aggressive Fed. Pro-growth rhetoric and continued demand for U.S. credit created a bullish environment for U.S. high yield credit in November 2016.
• Economic fundamentals continued to be strong to start out 2017 and, despite posting negative returns in March, the U.S. high yield market returned 2.70% for the first quarter of 2017, as represented by the Index. The asset class finished the first quarter tighter on both a spread and yield basis, with spreads tightening by 29 bps to end March at 412 bps.(2) On a yield-to-worst basis, yields tightened 27 bps to 5.84%.(2)
• The high yield corporate market continued to perform well in the second quarter of 2017, finishing the quarter tighter on both a spread and yield basis. U.S. high yield rallied during the second half of April 2017 as markets responded favorably to the first round of the French election outcome, a solid corporate earnings season and optimism surrounding Trump's tax plan proposal. Corporate credit markets remained intact in May 2017, as strong technicals helped credit spreads narrow modestly. Heading into June 2017, high yield came under pressure as declining commodity prices and idiosyncratic headwinds weighed modestly on the asset class. Despite this, the asset class posted total returns of 2.17% for the second quarter, as measured by the Index.(3)
• Continuing into the third quarter of 2017, U.S. high yield outperformed the broader fixed income markets in July. Rising commodity prices and strong corporate earnings helped the U.S. high yield market produce total returns of 1.11% in July, as represented by the Index.(4) At July 2017 monetary meetings, the Fed and European Central Bank (ECB) followed their old scripts and indicated that any normalization will be very gradual.
• In August 2017, after four consecutive months of strong performance and tighter spreads, U.S. high yield underperformed as political risks created international market unrest. Heavy supply and negative idiosyncratic headlines pushed spreads 43 bps wider by August 21 before rebounding to end the month 28 bps wider at 402 bps.(5) Nonetheless, total returns for the Index were only slightly negative, returning –0.04%.(6)
(1) Source: Bloomberg Barclays. Data as of September 30, 2017.
(2) Source: Bloomberg Barclays. Data as of March 31, 2017.
(3) Source: Bloomberg Barclays. Data as of June 30, 2017.
(4) Source: Bloomberg Barclays. Data as of July 31, 2017.
(5) Source: Bloomberg Barclays. Data as of August 31, 2017.
(6) Source: Bloomberg L.P.
4
Morgan Stanley Institutional Fund Trust
Annual Report — September 30, 2017
Investment Overview (unaudited) (cont'd)
High Yield Portfolio
• In September 2017, yields around the world rose in response to more hawkish speeches by central bankers. U.S. Treasury 10-year yields rose 22 basis points and the Federal Open Market Committee (FOMC) left rates unchanged.(6) The U.S. high yield market erased its losses from August 2017, producing total returns of 0.90% for the month of September, extending its year-to-date returns to 7.00%, as measured by the Index. Primary market activity dominated the technical picture in September 2017, and the high yield market priced $37 billion new issue over the month, the heaviest since March 2017's $48 billion.(7) Year-to-date supply is up 15% year over year.(8)
• Over the 12-month period, the largest contributor to relative performance was an overweight to capital goods, driven mainly by an overweight to diversified manufacturing and construction machinery. An overweight to transportation names was also a large driver of positive performance for the period.
• An underweight to the communications sector was the largest detractor for the period. However, we continue to remain underweight this sector, as cable and wireless credits tend to have low coupon and long duration capital structures.
• An off-benchmark allocation to bank loans was a positive contributor to relative performance.
Management Strategies
• The Fund is focused on middle-market high yield credits, which we define as companies with $150 million to $1 billion of total debt outstanding. We believe that this segment of the high yield market offers attractive opportunities, as market participants (including asset managers and sell-side research analysts) do not cover it as closely as they do the largest high yield credits. This focus aided relative performance because the middle-market segment offered a yield advantage over the broader high yield market.
• We remain focused on middle market-sized credits and maintain the Fund's overweight in B-rated and CCC-rated bonds, which we believe offer the best risk-adjusted return and less sensitivity to interest rate risk.
• We continue to be overweight transports and building materials, and remain broadly underweight communications and financials, as much of the U.S. high yield financial universe tends to cater to subprime borrowers in some fashion.
(6) Source: Bloomberg L.P.
(7) Source: JP Morgan. Data as of September 30, 2017.
(8) Source: Wells Fargo. Data as of September 30, 2017.
5
Morgan Stanley Institutional Fund Trust
Annual Report — September 30, 2017
Investment Overview (unaudited) (cont'd)
High Yield Portfolio

* Minimum Investment
** Commenced operations on February 7, 2012.
In accordance with SEC regulations, the Fund's performance shown assumes that all recurring fees (including management fees) were deducted and all dividends and distributions were reinvested. The performance of Class A, Class L, Class C and Class IS shares will vary from the performance of Class I shares based upon their different inception dates and will be negatively impacted by additional fees assessed to those classes (where applicable).
Performance Compared to the Bloomberg Barclays U.S. Corporate High Yield Index(1) and the Lipper High Current Yield Bond Funds Index(2)
| | | Period Ended September 30, 2017
Total Returns(3) | |
| | | | | Average Annual | |
| | | One
Year | | Five
Years | | Ten
Years | | Since
Inception(7) | |
Fund — Class I Shares
w/o sales charges(4) | | | 9.40 | % | | | 7.65 | % | | | — | | | | 8.74 | % | |
Fund — Class A Shares
w/o sales charges(4) | | | 9.04 | | | | 7.27 | | | | — | | | | 8.38 | | |
Fund — Class A Shares with
maximum 4.25% sales charges(4) | | | 4.40 | | | | 6.34 | | | | — | | | | 7.56 | | |
Fund — Class L Shares
w/o sales charges(4) | | | 8.75 | | | | 7.01 | | | | — | | | | 8.11 | | |
Fund — Class C Shares
w/o sales charges(6) | | | 8.24 | | | | — | | | | — | | | | 4.78 | | |
Fund — Class C Shares with
maximum 1.00% deferred
sales charges(6) | | | 7.24 | | | | — | | | | — | | | | 4.78 | | |
Fund — Class IS Shares
w/o sales charges(5) | | | 9.43 | | | | — | | | | — | | | | 4.69 | | |
Bloomberg Barclays U.S. Corporate
High Yield Index | | | 8.88 | | | | 6.36 | | | | — | | | | 7.06 | | |
Lipper High Current Yield Bond
Funds Index | | | 8.90 | | | | 5.77 | | | | — | | | | 6.40 | | |
Performance data quoted represents past performance, which is no guarantee of future results, and current performance may be lower or higher than the figures shown. Performance assumes that all dividends and distributions, if any, were reinvested. For the most recent month-end performance figures, please visit www.morganstanley.com/im. Investment returns and principal value will fluctuate so that Fund shares, when redeemed, may be worth more or less than their original cost. Total returns do not reflect the deduction of taxes that a shareholder would pay on Fund distributions or the redemption of Fund shares. Performance of share classes will vary due to differences in sales charges and expenses.
(1) The Bloomberg Barclays U.S. Corporate High Yield Index measures the market of USD-denominated, non-investment grade, fixed-rate, taxable corporate bonds. Securities are classified as high yield if the middle rating of Moody's, Fitch, and S&P is Ba1/BB+/BB+ or below. The index excludes emerging market debt. The Index is unmanaged and its returns do not include any sales charges or fees. Such costs would lower performance. It is not possible to invest directly in an index.
(2) The Lipper High Current Yield Bond Funds Index is an equally weighted performance index of the largest qualifying funds (based on net assets) in the Lipper High Current Yield Bond Funds classification. The Index, which is adjusted for capital gains distributions and income dividends, is unmanaged and should not be considered an investment. There are currently 30 funds represented in this Index. As of the date of this report, the Fund was in the Lipper High Current Yield Bond Funds classification.
(3) Total returns for the Fund reflect expenses waived and/or reimbursed, if applicable, by the Adviser. Without such waivers and/or reimbursements, total returns would have been lower.
(4) Commenced operations on February 7, 2012.
(5) Commenced operations on March 28, 2014.
(6) Commenced operations on April 30, 2015.
(7) For comparative purposes, average annual since inception returns listed for the Indexes refer to the inception date of Class I of the Fund, not the inception of the Indexes.
6
Morgan Stanley Institutional Fund Trust
Annual Report — September 30, 2017
Portfolio of Investments
High Yield Portfolio
| | | Face
Amount
(000) | | Value
(000) | |
Fixed Income Securities (98.4%) | |
Corporate Bonds (89.6%) | |
Basic Materials (4.4%) | |
American Gilsonite Co. | |
17.00% Cash, 3.41% PIK, 12/31/21 (a)(b)(c) | | $ | 191 | | | $ | 217 | | |
Eco Services Operations LLC/Eco Finance Corp. | |
8.50%, 11/1/22 (a) | | | 500 | | | | 522 | | |
First Quantum Minerals Ltd. | |
7.50%, 4/1/25 (a) | | | 600 | | | | 616 | | |
Hexion, Inc. | |
10.00%, 4/15/20 | | | 750 | | | | 722 | | |
Hudbay Minerals, Inc. | |
7.25%, 1/15/23 (a) | | | 500 | | | | 535 | | |
IAMGOLD Corp. | |
7.00%, 4/15/25 (a) | | | 500 | | | | 529 | | |
International Wire Group, Inc. | |
10.75%, 8/1/21 (a) | | | 750 | | | | 696 | | |
MSCI, Inc. | |
4.75%, 8/1/26 (a) | | | 250 | | | | 264 | | |
Prince Mineral Holding Corp. | |
11.50%, 12/15/19 (a) | | | 850 | | | | 888 | | |
Signode Industrial Group Lux SA/Signode
Industrial Group US, Inc. | |
6.38%, 5/1/22 (a) | | | 750 | | | | 782 | | |
Versum Materials, Inc. | |
5.50%, 9/30/24 (a) | | | 225 | | | | 239 | | |
| | | | 6,010 | | |
Communications (6.3%) | |
Bankrate, Inc. | |
6.13%, 8/15/18 (a) | | | 250 | | | | 251 | | |
Block Communications, Inc. | |
6.88%, 2/15/25 (a) | | | 750 | | | | 818 | | |
Cable One, Inc. | |
5.75%, 6/15/22 (a) | | | 350 | | | | 367 | | |
CCO Holdings LLC/CCO Holdings Capital Corp. | |
5.00%, 2/1/28 (a) | | | 750 | | | | 751 | | |
CommScope Technologies LLC | |
5.00%, 3/15/27 (a) | | | 400 | | | | 402 | | |
CSC Holdings LLC | |
5.25%, 6/1/24 | | | 500 | | | | 507 | | |
DISH DBS Corp. | |
7.75%, 7/1/26 | | | 250 | | | | 288 | | |
EW Scripps Co. (The) | |
5.13%, 5/15/25 (a) | | | 325 | | | | 332 | | |
Gray Television, Inc. | |
5.88%, 7/15/26 (a) | | | 550 | | | | 568 | | |
Intelsat Jackson Holdings SA | |
8.00%, 2/15/24 (a) | | | 500 | | | | 539 | | |
Lamar Media Corp. | |
5.75%, 2/1/26 | | | 300 | | | | 327 | | |
MDC Partners, Inc. | |
6.50%, 5/1/24 (a) | | | 564 | | | | 571 | | |
| | | Face
Amount
(000) | | Value
(000) | |
Midcontinent Communications/Midcontinent
Finance Corp. | |
6.88%, 8/15/23 (a) | | $ | 600 | | | $ | 649 | | |
Netflix, Inc. | |
5.88%, 2/15/25 | | | 250 | | | | 274 | | |
| SFR Group SA | |
6.00%, 5/15/22 (a) | | | 500 | | | | 523 | | |
Sprint Communications, Inc. | |
6.00%, 11/15/22 | | | 500 | | | | 536 | | |
T-Mobile USA, Inc. | |
5.38%, 4/15/27 | | | 375 | | | | 405 | | |
Virgin Media Secured Finance PLC | |
5.50%, 8/15/26 (a) | | | 450 | | | | 475 | | |
| | | | 8,583 | | |
Consumer, Cyclical (19.1%) | |
Air Canada | |
7.75%, 4/15/21 (a) | | | 500 | | | | 571 | | |
Algeco Scotsman Global Finance PLC | |
8.50%, 10/15/18 (a) | | | 200 | | | | 192 | | |
American Airlines Group, Inc. | |
5.50%, 10/1/19 (a) | | | 500 | | | | 526 | | |
American Greetings Corp. | |
7.88%, 2/15/25 (a) | | | 750 | | | | 816 | | |
Aramark Services, Inc. | |
4.75%, 6/1/26 | | | 250 | | | | 264 | | |
Aston Martin Capital Holdings Ltd. | |
6.50%, 4/15/22 (a) | | | 400 | | | | 431 | | |
AV Homes, Inc. | |
6.63%, 5/15/22 | | | 750 | | | | 774 | | |
Beacon Roofing Supply, Inc. | |
6.38%, 10/1/23 | | | 350 | | | | 375 | | |
Beazer Homes USA, Inc., | |
5.88%, 10/15/27 (a)(d) | | | 425 | | | | 426 | | |
8.75%, 3/15/22 | | | 500 | | | | 554 | | |
Carrols Restaurant Group, Inc., | |
8.00%, 5/1/22 (a) | | | 150 | | | | 160 | | |
8.00%, 5/1/22 | | | 500 | | | | 534 | | |
CCM Merger, Inc. | |
6.00%, 3/15/22 (a) | | | 500 | | | | 518 | | |
Century Communities, Inc. | |
5.88%, 7/15/25 (a) | | | 675 | | | | 680 | | |
Chester Downs & Marina LLC/Chester Downs
Finance Corp. | |
9.25%, 2/1/20 (a) | | | 500 | | | | 509 | | |
Cumberland Farms, Inc. | |
6.75%, 5/1/25 (a) | | | 500 | | | | 533 | | |
Downstream Development Authority of the
Quapaw Tribe of Oklahoma | |
10.50%, 7/1/19 (a) | | | 767 | | | | 756 | | |
Eldorado Resorts, Inc. | |
6.00%, 4/1/25 | | | 750 | | | | 791 | | |
EMI Music Publishing Group North America
Holdings, Inc. | |
7.63%, 6/15/24 (a) | | | 550 | | | | 613 | | |
The accompanying notes are an integral part of the financial statements.
7
Morgan Stanley Institutional Fund Trust
Annual Report — September 30, 2017
Portfolio of Investments (cont'd)
High Yield Portfolio
| | | Face
Amount
(000) | | Value
(000) | |
Consumer, Cyclical (cont'd) | |
FelCor Lodging LP | |
6.00%, 6/1/25 | | $ | 250 | | | $ | 269 | | |
Ferrellgas LP/Ferrellgas Finance Corp. | |
6.75%, 1/15/22 | | | 500 | | | | 488 | | |
Gibson Brands, Inc. | |
8.88%, 8/1/18 (a) | | | 900 | | | | 729 | | |
Global Partners LP/GLP Finance Corp. | |
6.25%, 7/15/22 | | | 750 | | | | 763 | | |
Golden Nugget, Inc. | |
8.75%, 10/1/25 (a) | | | 900 | | | | 918 | | |
Guitar Center, Inc. | |
6.50%, 4/15/19 (a) | | | 500 | | | | 456 | | |
Hanesbrands, Inc. | |
4.88%, 5/15/26 (a) | | | 250 | | | | 261 | | |
KFC Holding Co./Pizza Hut Holdings LLC/Taco
Bell of America LLC | |
5.00%, 6/1/24 (a) | | | 250 | | | | 264 | | |
Lions Gate Entertainment Corp. | |
5.88%, 11/1/24 (a) | | | 400 | | | | 422 | | |
Mattamy Group Corp. | |
6.88%, 12/15/23 (a) | | | 400 | | | | 420 | | |
Meritor, Inc. | |
6.25%, 2/15/24 | | | 500 | | | | 534 | | |
National CineMedia LLC | |
5.75%, 8/15/26 | | | 650 | | | | 606 | | |
Neiman Marcus Group Ltd., LLC | |
8.75% Cash, 9.50% PIK, 10/15/21 (a)(b) | | | 350 | | | | 166 | | |
New Home Co., Inc. (The) | |
7.25%, 4/1/22 | | | 750 | | | | 778 | | |
Oshkosh Corp. | |
5.38%, 3/1/22 | | | 250 | | | | 260 | | |
Party City Holdings, Inc. | |
6.13%, 8/15/23 (a) | | | 500 | | | | 523 | | |
Penske Automotive Group, Inc. | |
3.75%, 8/15/20 | | | 350 | | | | 358 | | |
Playa Resorts Holding BV | |
8.00%, 8/15/20 (a) | | | 378 | | | | 395 | | |
Rite Aid Corp. | |
6.13%, 4/1/23 (a) | | | 750 | | | | 731 | | |
Rivers Pittsburgh Borrower LP/Rivers Pittsburgh
Finance Corp. | |
6.13%, 8/15/21 (a) | | | 750 | | | | 759 | | |
RSI Home Products, Inc. | |
6.50%, 3/15/23 (a) | | | 400 | | | | 422 | | |
Sally Holdings LLC/Sally Capital, Inc. | |
5.63%, 12/1/25 | | | 500 | | | | 515 | | |
Silversea Cruise Finance Ltd. | |
7.25%, 2/1/25 (a) | | | 500 | | | | 538 | | |
Sonic Automotive, Inc. | |
5.00%, 5/15/23 | | | 500 | | | | 491 | | |
Speedway Motorsports, Inc. | |
5.13%, 2/1/23 | | | 350 | | | | 363 | | |
| | | Face
Amount
(000) | | Value
(000) | |
Sugarhouse HSP Gaming Prop Mezz LP/
Sugarhouse HSP Gaming Finance Corp. | |
5.88%, 5/15/25 (a) | | $ | 750 | | | $ | 739 | | |
Tempur Sealy International, Inc. | |
5.50%, 6/15/26 | | | 500 | | | | 514 | | |
Titan International, Inc. | |
6.88%, 10/1/20 | | | 500 | | | | 516 | | |
Tops Holding II Corp., | |
8.75% Cash, 9.50% PIK, 6/15/18 (b) | | | 175 | | | | 160 | | |
Tops Holding LLC/Tops Markets II Corp. | |
8.00%, 6/15/22 (a) | | | 800 | | | | 536 | | |
VistaJet Malta Finance PLC/VistaJet Co.,
Finance LLC | |
7.75%, 6/1/20 (a) | | | 950 | | | | 860 | | |
Wolverine World Wide, Inc. | |
5.00%, 9/1/26 (a) | | | 500 | | | | 501 | | |
| | | | 26,278 | | |
Consumer, Non-Cyclical (14.0%) | |
Acadia Healthcare Co., Inc., | |
5.13%, 7/1/22 | | | 250 | | | | 260 | | |
5.63%, 2/15/23 | | | 250 | | | | 264 | | |
ACCO Brands Corp. | |
5.25%, 12/15/24 (a) | | | 500 | | | | 520 | | |
Ahern Rentals, Inc. | |
7.38%, 5/15/23 (a) | | | 650 | | | | 598 | | |
Alere, Inc., | |
6.38%, 7/1/23 (a) | | | 200 | | | | 216 | | |
7.25%, 7/1/18 | | | 300 | | | | 301 | | |
APX Group, Inc., | |
6.38%, 12/1/19 | | | 10 | | | | 10 | | |
7.63%, 9/1/23 (a) | | | 500 | | | | 528 | | |
Beverages & More, Inc. | |
11.50%, 6/15/22 (a) | | | 750 | | | | 705 | | |
Central Garden & Pet Co. | |
6.13%, 11/15/23 | | | 350 | | | | 375 | | |
Cenveo Corp. | |
6.00%, 8/1/19 (a) | | | 750 | | | | 598 | | |
Chobani LLC/Chobani Finance Corp., Inc. | |
7.50%, 4/15/25 (a) | | | 525 | | | | 574 | | |
Clearwater Seafoods, Inc. | |
6.88%, 5/1/25 (a) | | | 300 | | | | 319 | | |
CSVC Acquisition Corp. | |
7.75%, 6/15/25 (a) | | | 500 | | | | 491 | | |
DS Services of America, Inc. | |
10.00%, 9/1/21 (a) | | | 217 | | | | 230 | | |
Eagle Holding Co. II LLC | |
7.63% Cash, 8.38% PIK, 5/15/22 (a)(b) | | | 200 | | | | 208 | | |
Emeco Pty Ltd., | |
Series B | |
9.25%, 3/31/22 | | | 162 | | | | 165 | | |
Endo Dac/Endo Finance LLC/Endo Finco, Inc. | |
6.00%, 7/15/23 (a) | | | 750 | | | | 622 | | |
The accompanying notes are an integral part of the financial statements.
8
Morgan Stanley Institutional Fund Trust
Annual Report — September 30, 2017
Portfolio of Investments (cont'd)
High Yield Portfolio
| | | Face
Amount
(000) | | Value
(000) | |
Consumer, Non-Cyclical (cont'd) | |
Envision Healthcare Corp., | |
5.63%, 7/15/22 | | $ | 400 | | | $ | 418 | | |
6.25%, 12/1/24 (a) | | | 250 | | | | 269 | | |
FAGE International SA/FAGE USA Dairy Industry, Inc. | |
5.63%, 8/15/26 (a) | | | 500 | | | | 521 | | |
First Quality Finance Co., Inc. | |
5.00%, 7/1/25 (a) | | | 500 | | | | 517 | | |
Great Lakes Dredge & Dock Corp. | |
8.00%, 5/15/22 | | | 720 | | | | 751 | | |
HCA, Inc. | |
5.25%, 6/15/26 | | | 250 | | | | 270 | | |
Hertz Corp. (The), | |
5.88%, 10/15/20 | | | 750 | | | | 748 | | |
7.63%, 6/1/22 (a) | | | 250 | | | | 258 | | |
Jaguar Holding Co. II/Pharmaceutical Product
Development LLC | |
6.38%, 8/1/23 (a) | | | 500 | | | | 524 | | |
Lamb Weston Holdings, Inc. | |
4.88%, 11/1/26 (a) | | | 300 | | | | 316 | | |
Live Nation Entertainment, Inc. | |
4.88%, 11/1/24 (a) | | | 350 | | | | 363 | | |
Mallinckrodt International Finance SA/
Mallinckrodt CB LLC | |
5.50%, 4/15/25 (a) | | | 500 | | | | 454 | | |
MPH Acquisition Holdings LLC | |
7.13%, 6/1/24 (a) | | | 150 | | | | 162 | | |
Pinnacle Foods Finance LLC/Pinnacle Foods
Finance Corp. | |
5.88%, 1/15/24 | | | 450 | | | | 479 | | |
Pinnacle Operating Corp. | |
9.00%, 11/15/20 (a) | | | 400 | | | | 343 | | |
Quintiles IMS, Inc. | |
4.88%, 5/15/23 (a) | | | 250 | | | | 261 | | |
Ritchie Bros Auctioneers, Inc. | |
5.38%, 1/15/25 (a) | | | 375 | | | | 398 | | |
Select Medical Corp. | |
6.38%, 6/1/21 | | | 500 | | | | 517 | | |
Service Corp. International | |
5.38%, 1/15/22 | | | 250 | | | | 258 | | |
SP Finco LLC | |
6.75%, 7/1/25 (a) | | | 700 | | | | 660 | | |
Spectrum Brands, Inc. | |
5.75%, 7/15/25 | | | 250 | | | | 268 | | |
Team Health Holdings, Inc. | |
6.38%, 2/1/25 (a) | | | 750 | | | | 712 | | |
Teleflex, Inc. | |
4.88%, 6/1/26 | | | 200 | | | | 209 | | |
Tenet Healthcare Corp. | |
7.00%, 8/1/25 (a) | | | 300 | | | | 283 | | |
TMS International Corp. | |
7.25%, 8/15/25 (a) | | | 700 | | | | 717 | | |
| | | Face
Amount
(000) | | Value
(000) | |
TreeHouse Foods, Inc. | |
6.00%, 2/15/24 (a) | | $ | 250 | | | $ | 268 | | |
United Rentals North America, Inc. | |
5.75%, 11/15/24 | | | 350 | | | | 373 | | |
Valeant Pharmaceuticals International, Inc., | |
5.88%, 5/15/23 (a) | | | 500 | | | | 443 | | |
6.13%, 4/15/25 (a) | | | 250 | | | | 220 | | |
Wells Enterprises, Inc. | |
6.75%, 2/1/20 (a) | | | 294 | | | | 303 | | |
| | | | 19,267 | | |
Diversified (0.4%) | |
PetSmart, Inc. | |
7.13%, 3/15/23 (a) | | | 750 | | | | 587 | | |
Energy (13.6%) | |
Alta Mesa Holdings LP/Alta Mesa Finance
Services Corp. | |
7.88%, 12/15/24 (a) | | | 500 | | | | 542 | | |
American Midstream Partners LP/American
Midstream Finance Corp. | |
8.50%, 12/15/21 (a) | | | 750 | | | | 778 | | |
Andeavor Logistics LP/Tesoro Logistics
Finance Corp. | |
6.38%, 5/1/24 | | | 350 | | | | 382 | | |
Blue Racer Midstream LLC/Blue Racer
Finance Corp. | |
6.13%, 11/15/22 (a) | | | 550 | | | | 573 | | |
Callon Petroleum Co. | |
6.13%, 10/1/24 | | | 650 | | | | 676 | | |
Carrizo Oil & Gas, Inc. | |
6.25%, 4/15/23 | | | 800 | | | | 816 | | |
Continental Resources, Inc. | |
5.00%, 9/15/22 | | | 250 | | | | 255 | | |
Covey Park Energy LLC/Covey Park Finance Corp. | |
7.50%, 5/15/25 (a) | | | 375 | | | | 390 | | |
Crestwood Midstream Partners LP/Crestwood
Midstream Finance Corp. | |
6.25%, 4/1/23 | | | 250 | | | | 259 | | |
Denbury Resources, Inc. | |
5.50%, 5/1/22 | | | 1,000 | | | | 576 | | |
Endeavor Energy Resources LP/EER Finance, Inc., | |
7.00%, 8/15/21 (a) | | | 250 | | | | 260 | | |
8.13%, 9/15/23 (a) | | | 750 | | | | 810 | | |
Halcon Resources Corp. | |
6.75%, 2/15/25 (a) | | | 500 | | | | 520 | | |
Hilcorp Energy I LP/Hilcorp Finance Co., | |
5.00%, 12/1/24 (a) | | | 500 | | | | 493 | | |
5.75%, 10/1/25 (a) | | | 250 | | | | 254 | | |
Laredo Petroleum, Inc., | |
5.63%, 1/15/22 | | | 250 | | | | 253 | | |
6.25%, 3/15/23 | | | 450 | | | | 466 | | |
Lonestar Resources America, Inc. | |
8.75%, 4/15/19 (a) | | | 900 | | | | 879 | | |
Matador Resources Co. | |
6.88%, 4/15/23 | | | 300 | | | | 319 | | |
The accompanying notes are an integral part of the financial statements.
9
Morgan Stanley Institutional Fund Trust
Annual Report — September 30, 2017
Portfolio of Investments (cont'd)
High Yield Portfolio
| | | Face
Amount
(000) | | Value
(000) | |
Energy (cont'd) | |
Murphy Oil Corp. | |
5.75%, 8/15/25 | | $ | 500 | | | $ | 516 | | |
Murphy Oil USA, Inc. | |
5.63%, 5/1/27 | | | 650 | | | | 701 | | |
Newfield Exploration Co. | |
5.38%, 1/1/26 | | | 500 | | | | 528 | | |
Northern Oil and Gas, Inc. | |
8.00%, 6/1/20 | | | 750 | | | | 469 | | |
Pacific Drilling V Ltd. | |
7.25%, 12/1/17 (a) | | | 600 | | | | 249 | | |
Parsley Energy LLC/Parsley Finance Corp. | |
5.38%, 1/15/25 (a) | | | 500 | | | | 513 | | |
PDC Energy, Inc. | |
6.13%, 9/15/24 | | | 500 | | | | 525 | | |
Rice Energy, Inc. | |
6.25%, 5/1/22 | | | 550 | | | | 575 | | |
Rockies Express Pipeline LLC | |
6.88%, 4/15/40 (a) | | | 400 | | | | 446 | | |
Rowan Cos., Inc. | |
7.38%, 6/15/25 | | | 750 | | | | 737 | | |
RSP Permian, Inc., | |
5.25%, 1/15/25 (a) | | | 250 | | | | 255 | | |
6.63%, 10/1/22 | | | 500 | | | | 526 | | |
SemGroup Corp. | |
7.25%, 3/15/26 (a) | | | 400 | | | | 404 | | |
SemGroup Corp./Rose Rock Finance Corp. | |
5.63%, 11/15/23 | | | 385 | | | | 376 | | |
Seven Generations Energy Ltd. | |
5.38%, 9/30/25 (a)(d) | | | 425 | | | | 429 | | |
Tallgrass Energy Partners LP/Tallgrass Energy
Finance Corp. | |
5.50%, 9/15/24 (a) | | | 250 | | | | 258 | | |
Vermilion Energy, Inc. | |
5.63%, 3/15/25 (a) | | | 500 | | | | 504 | | |
Whiting Petroleum Corp. | |
5.75%, 3/15/21 | | | 500 | | | | 493 | | |
WildHorse Resource Development Corp. | |
6.88%, 2/1/25 (a) | | | 750 | | | | 751 | | |
| | | | 18,756 | | |
Finance (8.4%) | |
Baytex Energy Corp. | |
5.63%, 6/1/24 (a) | | | 750 | | | | 684 | | |
CNO Financial Group, Inc. | |
4.50%, 5/30/20 | | | 250 | | | | 260 | | |
Compiler Finance Sub, Inc. | |
7.00%, 5/1/21 (a) | | | 500 | | | | 278 | | |
CTR Partnership LP/CareTrust Capital Corp. | |
5.25%, 6/1/25 | | | 500 | | | | 516 | | |
DuPont Fabros Technology LP | |
5.63%, 6/15/23 | | | 162 | | | | 173 | | |
Equinix, Inc. | |
5.38%, 5/15/27 | | | 200 | | | | 218 | | |
| | | Face
Amount
(000) | | Value
(000) | |
Exela Intermediate LLC/Exela Finance, Inc. | |
10.00%, 7/15/23 (a) | | $ | 600 | | | $ | 593 | | |
Fly Leasing Ltd. | |
5.25%, 10/15/24 | | | 425 | | | | 425 | | |
Genworth Holdings, Inc. | |
6.52%, 5/22/18 | | | 250 | | | | 253 | | |
HUB International Ltd. | |
7.88%, 10/1/21 (a) | | | 550 | | | | 573 | | |
Icahn Enterprises LP/Icahn Enterprises
Finance Corp. | |
6.75%, 2/1/24 | | | 550 | | | | 582 | | |
Infinity Acquisition LLC/Infinity Acquisition
Finance Corp. | |
7.25%, 8/1/22 (a) | | | 500 | | | | 491 | | |
iStar, Inc. | |
6.50%, 7/1/21 | | | 500 | | | | 524 | | |
Jack Ohio Finance LLC/Jack Ohio Finance 1 Corp. | |
10.25%, 11/15/22 (a) | | | 750 | | | | 821 | | |
Jefferies Finance LLC/JFIN Co-Issuer Corp. | |
7.25%, 8/15/24 (a) | | | 625 | | | | 628 | | |
Kennedy-Wilson, Inc. | |
5.88%, 4/1/24 | | | 250 | | | | 258 | | |
MGIC Investment Corp. | |
5.75%, 8/15/23 | | | 400 | | | | 441 | | |
MPT Operating Partnership LP/MPT Finance Corp., | |
5.00%, 10/15/27 | | | 650 | | | | 668 | | |
6.38%, 3/1/24 | | | 250 | | | | 271 | | |
NewStar Financial, Inc. | |
7.25%, 5/1/20 | | | 400 | | | | 414 | | |
Post Holdings, Inc. | |
5.00%, 8/15/26 (a) | | | 200 | | | | 200 | | |
Provident Funding Associates LP/PFG
Finance Corp. | |
6.38%, 6/15/25 (a) | | | 500 | | | | 526 | | |
Radian Group, Inc., | |
4.50%, 10/1/24 | | | 350 | | | | 358 | | |
7.00%, 3/15/21 | | | 197 | | | | 224 | | |
Starwood Property Trust, Inc. | |
5.00%, 12/15/21 | | | 250 | | | | 262 | | |
USIS Merger Sub, Inc. | |
6.88%, 5/1/25 (a) | | | 725 | | | | 740 | | |
Valvoline, Inc. | |
5.50%, 7/15/24 (a) | | | 200 | | | | 214 | | |
| | | | 11,595 | | |
Industrials (18.7%) | |
Apex Tool Group LLC | |
7.00%, 2/1/21 (a) | | | 700 | | | | 651 | | |
ARD Finance SA | |
7.13% Cash, 7.88% PIK, 9/15/23 (b) | | | 600 | | | | 644 | | |
Artesyn Embedded Technologies, Inc. | |
9.75%, 10/15/20 (a) | | | 753 | | | | 761 | | |
Atrium Windows & Doors, Inc. | |
7.75%, 5/1/19 (a) | | | 775 | | | | 787 | | |
The accompanying notes are an integral part of the financial statements.
10
Morgan Stanley Institutional Fund Trust
Annual Report — September 30, 2017
Portfolio of Investments (cont'd)
High Yield Portfolio
| | | Face
Amount
(000) | | Value
(000) | |
Industrials (cont'd) | |
Belden, Inc. | |
5.25%, 7/15/24 (a) | | $ | 500 | | | $ | 524 | | |
BlueLine Rental Finance Corp./BlueLine Rental LLC | |
9.25%, 3/15/24 (a) | | | 750 | | | | 809 | | |
Builders FirstSource, Inc. | |
5.63%, 9/1/24 (a) | | | 425 | | | | 451 | | |
BWAY Holding Co. | |
7.25%, 4/15/25 (a) | | | 800 | | | | 826 | | |
CD&R Waterworks Merger Sub LLC | |
6.13%, 8/15/25 (a) | | | 500 | | | | 514 | | |
CEVA Group PLC | |
4.00%, 5/1/18 (a) | | | 750 | | | | 735 | | |
Cleaver-Brooks, Inc. | |
8.75%, 12/15/19 (a) | | | 750 | | | | 771 | | |
Coveris Holdings SA | |
7.88%, 11/1/19 (a) | | | 650 | | | | 643 | | |
| CPG Merger Sub LLC | |
8.00%, 10/1/21 (a) | | | 750 | | | | 778 | | |
CTP Transportation Products LLC/CTP Finance, Inc. | |
8.25%, 12/15/19 (a) | | | 750 | | | | 711 | | |
EnPro Industries, Inc., | |
5.88%, 9/15/22 (a) | | | 200 | | | | 210 | | |
5.88%, 9/15/22 | | | 352 | | | | 369 | | |
Flex Acquisition Co., Inc. | |
6.88%, 1/15/25 (a) | | | 500 | | | | 520 | | |
Flexi-Van Leasing, Inc. | |
7.88%, 8/15/18 (a) | | | 1,000 | | | | 1,005 | | |
GCP Applied Technologies, Inc. | |
9.50%, 2/1/23 (a) | | | 500 | | | | 566 | | |
Gibraltar Industries, Inc. | |
6.25%, 2/1/21 | | | 361 | | | | 372 | | |
Grinding Media, Inc./Moly-Cop AltaSteel Ltd. | |
7.38%, 12/15/23 (a) | | | 600 | | | | 652 | | |
JB Poindexter & Co., Inc. | |
9.00%, 4/1/22 (a) | | | 350 | | | | 367 | | |
JPW Industries Holding Corp. | |
9.00%, 10/1/24 (a) | | | 900 | | | | 925 | | |
Kenan Advantage Group, Inc. (The) | |
7.88%, 7/31/23 (a) | | | 750 | | | | 774 | | |
Koppers, Inc. | |
6.00%, 2/15/25 (a) | | | 500 | | | | 539 | | |
Kratos Defense & Security Solutions, Inc. | |
7.00%, 5/15/19 | | | 500 | | | | 514 | | |
Martin Midstream Partners LP/Martin
Midstream Finance Corp. | |
7.25%, 2/15/21 | | | 500 | | | | 514 | | |
MasTec, Inc. | |
4.88%, 3/15/23 | | | 500 | | | | 514 | | |
Michael Baker Holdings LLC/Michael Baker
Finance Corp. | |
8.88% Cash, 9.63% PIK, 4/15/19 (a)(b) | | | 784 | | | | 785 | | |
| | | Face
Amount
(000) | | Value
(000) | |
Michael Baker International LLC/CDL
Acquisition Co., Inc. | |
8.25%, 10/15/18 (a) | | $ | 350 | | | $ | 352 | | |
Multi-Color Corp. | |
4.88%, 11/1/25 (a)(d) | | | 650 | | | | 659 | | |
Novelis Corp. | |
5.88%, 9/30/26 (a) | | | 225 | | | | 229 | | |
Park Aerospace Holdings Ltd. | |
5.25%, 8/15/22 (a) | | | 250 | | | | 261 | | |
Plastipak Holdings, Inc. | |
6.50%, 10/1/21 (a) | | | 350 | | | | 362 | | |
SAExploration Holdings, Inc. | |
10.00% Cash, 11.00% PIK, 4/14/19 (a)(b) | | | 1,158 | | | | 781 | | |
SBA Communications Corp. | |
4.88%, 9/1/24 | | | 300 | | | | 309 | | |
Standard Industries, Inc. | |
5.00%, 2/15/27 (a) | | | 500 | | | | 522 | | |
Summit Materials LLC/Summit Materials
Finance Corp. | |
6.13%, 7/15/23 | | | 500 | | | | 530 | | |
syncreon Group BV/syncreon Global
Finance US, Inc. | |
8.63%, 11/1/21 (a) | | | 450 | | | | 372 | | |
Techniplas LLC | |
10.00%, 5/1/20 (a) | | | 750 | | | | 529 | | |
TriMas Corp. | |
4.88%, 10/15/25 (a) | | | 350 | | | | 353 | | |
TTM Technologies, Inc. | |
5.63%, 10/1/25 (a) | | | 350 | | | | 355 | | |
Tutor Perini Corp. | |
6.88%, 5/1/25 (a) | | | 200 | | | | 218 | | |
US Concrete, Inc. | |
6.38%, 6/1/24 | | | 500 | | | | 541 | | |
XPO Logistics, Inc. | |
6.13%, 9/1/23 (a) | | | 350 | | | | 367 | | |
Zachry Holdings, Inc. | |
7.50%, 2/1/20 (a) | | | 750 | | | | 776 | | |
| | | | 25,747 | | |
Technology (3.5%) | |
BCP Singapore VI Cayman Financing Co., Ltd. | |
8.00%, 4/15/21 (a) | | | 600 | | | | 592 | | |
Boxer Parent Co., Inc. | |
9.00% Cash, 9.75% PIK, 10/15/19 (a)(b) | | | 500 | | | | 501 | | |
Change Healthcare Holdings LLC/Change
Healthcare Finance, Inc. | |
5.75%, 3/1/25 (a) | | | 350 | | | | 358 | | |
DynCorp International, Inc. | |
10.38% Cash, 1.50% PIK, 11/30/20 (b) | | | 808 | | | | 863 | | |
First Data Corp. | |
7.00%, 12/1/23 (a) | | | 350 | | | | 375 | | |
Harland Clarke Holdings Corp. | |
6.88%, 3/1/20 (a) | | | 500 | | | | 516 | | |
The accompanying notes are an integral part of the financial statements.
11
Morgan Stanley Institutional Fund Trust
Annual Report — September 30, 2017
Portfolio of Investments (cont'd)
High Yield Portfolio
| | | Face
Amount
(000) | | Value
(000) | |
Technology (cont'd) | |
j2 Cloud Services LLC/j2 Global Co-Obligor, Inc. | |
6.00%, 7/15/25 (a) | | $ | 500 | | | $ | 526 | | |
| RP Crown Parent LLC | |
7.38%, 10/15/24 (a) | | | 500 | | | | 513 | | |
Western Digital Corp. | |
7.38%, 4/1/23 (a) | | | 500 | | | | 549 | | |
| | | | 4,793 | | |
Utilities (1.2%) | |
Calpine Corp. | |
5.75%, 1/15/25 | | | 500 | | | | 474 | | |
Dynegy, Inc. | |
7.38%, 11/1/22 | | | 500 | | | | 522 | | |
LBC Tank Terminals Holding Netherlands BV | |
6.88%, 5/15/23 (a) | | | 500 | | | | 528 | | |
NGL Energy Partners LP/NGL Energy Finance Corp. | |
6.13%, 3/1/25 | | | 70 | | | | 65 | | |
| | | | 1,589 | | |
| | | | 123,205 | | |
Sovereign (0.6%) | |
Shape Technologies Group, Inc. | |
7.63%, 2/1/20 (a) | | | 770 | | | | 799 | | |
Variable Rate Senior Loan Interests (8.2%) | |
Consumer, Cyclical (2.8%) | |
BJ's Wholesale Club, Inc.,
2nd Lien Term | |
1 Month LIBOR + 7.50%, 8.73%, 2/3/25 | | | 1,000 | | | | 959 | | |
Checkers Holdings, Inc.,
Term Loan | |
1 Month LIBOR + 4.25%, 5.49%, 4/25/24 | | | 798 | | | | 800 | | |
Commercial Vehicle Group, Inc.,
Term B | |
1 Month LIBOR + 6.00%, 7.24%, 4/12/23 | | | 646 | | | | 649 | | |
Neiman Marcus Group Ltd. LLC,
Term Loan | |
1 Month LIBOR + 3.25%, 4.48%, 10/25/20 | | | 495 | | | | 370 | | |
Sesac Holdco II, LLC,
2nd Lien Term | |
1 Month LIBOR + 7.25%, 8.49%, 2/10/25 | | | 1,000 | | | | 997 | | |
| | | | 3,775 | | |
Energy (0.7%) | |
Gavilan Resources, LLC,
2nd Lien Term | |
1 Month LIBOR + 6.00%, 7.23%, 3/1/24 | | | 1,000 | | | | 974 | | |
Industrials (4.2%) | |
American Bath Group, LLC,
Term B | |
3 Month LIBOR + 5.25%, 6.58%, 9/30/23 | | | 992 | | | | 999 | | |
Associated Asphalt Partners, LLC,
Term B | |
1 Month LIBOR + 5.25%, 6.49%, 4/5/24 | | | 998 | | | | 983 | | |
Commercial Barge Line Co.,
1st Lien Term | |
1 Month LIBOR + 8.75%, 9.99%, 11/12/20 | | | 463 | | | | 369 | | |
| | | Face
Amount
(000) | | Value
(000) | |
Coveris Holdings S.A.,
Term B | |
3 Month LIBOR + 4.25%, 5.58%, 6/29/22 | | $ | 296 | | | $ | 295 | | |
Gruden Acquisition, Inc.,
Term Loan | |
3 Month LIBOR + 5.50%, 6.83%, 8/18/22 | | | 491 | | | | 486 | | |
Harsco Corp.,
Term B | |
1 Month LIBOR + 5.00%, 6.25%, 11/2/23 | | | 397 | | | | 403 | | |
Kemet Electronic Corp.,
Term B | |
1 Month LIBOR + 6.00%, 7.24%, 4/26/24 | | | 988 | | | | 994 | | |
SAExploration Holdings, Inc.,
Term Loan | |
10.00%, 6/28/23 | | | 750 | | | | 742 | | |
syncreon Global Finance, Inc.,
Term B | |
1 Month LIBOR + 4.25%, 1.00%, 10/28/20 (e) | | | 500 | | | | 441 | | |
| | | | 5,712 | | |
Technology (0.5%) | |
Solera, LLC,
Term B | |
1 Month LIBOR + 3.25%, 4.49%, 3/3/23 | | | 744 | | | | 748 | | |
| | | | 11,209 | | |
Total Fixed Income Securities (Cost $133,684) | | | 135,213 | | |
| | | Shares | | | |
Common Stocks (0.3%) | |
Auto Components (0.0%) | |
Exide Technologies (f) | | | 592 | | | | — | @ | |
Equity Real Estate Investment Trusts (REITs) (0.2%) | |
American Gilsonite Co. (c)(f)(g)
(acquisition cost — $—; acquired 3/30/17) | | | 500 | | | | 225 | | |
Machinery (0.1%) | |
Iracore International Holdings, Inc., Class A (f) | | | 470 | | | | 79 | | |
Semiconductors & Semiconductor Equipment (0.0%) | |
UC Holdings, Inc. (c)(f) | | | 2,826 | | | | 67 | | |
Trading Companies & Distributors (0.0%) | |
Emeco Holdings Ltd. (Australia) (f) | | | 430,643 | | | | 64 | | |
Total Common Stocks (Cost $179) | | | 435 | | |
Participation Note (0.0%) | |
Semiconductors & Semiconductor Equipment (0.0%) | |
UC Holdings, Inc. Equity Linked Notes,
expires 9/23/20 (c)(f)
(Cost $—) | | | 2,802 | | | | 17 | | |
Short-Term Investment (1.0%) | |
Investment Company (1.0%) | |
Morgan Stanley Institutional Liquidity
Funds — Government Portfolio —
Institutional Class (See Note G)
(Cost $1,425) | | | 1,424,903 | | | | 1,425 | | |
Total Investments (99.7%) (Cost $135,288) (h) | | | 137,090 | | |
Other Assets in Excess of Liabilities (0.3%) | | | 442 | | |
Net Assets (100.0%) | | $ | 137,532 | | |
The accompanying notes are an integral part of the financial statements.
12
Morgan Stanley Institutional Fund Trust
Annual Report — September 30, 2017
Portfolio of Investments (cont'd)
High Yield Portfolio
(a) 144A security — Certain conditions for public sale may exist. Unless otherwise noted, these securities are deemed to be liquid.
(b) PIK: Payment-in-kind security for which part of the income earned may be paid as additional principal.
(c) Security has been deemed illiquid at September 30, 2017.
(d) When-issued security.
(e) Unsettled Position. The contract rate does not take effect until settlement date.
(f) Non-income producing security.
(g) Security cannot be offered for public resale without first being registered under the Securities Act of 1933 and related rules ("restricted security"). Acquisition date represents the day on which an enforceable right to acquire such security is obtained and is presented along with related cost in the security description. The Fund has registration rights for certain restricted securities. Any costs related to such registration are borne by the issuer. The aggregate value of restricted securities (excluding 144A holdings) at September 30, 2017, amounts to approximately $225,000 and represents 0.2% of net assets.
(h) At September 30, 2017, the aggregate cost for federal income tax purposes is approximately $135,348,000. The aggregate gross unrealized appreciation is approximately $4,947,000 and the aggregate gross unrealized depreciation is approximately $3,205,000, resulting in net unrealized appreciation of approximately $1,742,000.
@ Value is less than $500.
LIBOR London Interbank Offered Rate.
Portfolio Composition
Classification | | Percentage of
Total Investments | |
Consumer, Cyclical | | | 19.1 | % | |
Industrials | | | 18.8 | | |
Consumer, Non-Cyclical | | | 14.1 | | |
Energy | | | 13.7 | | |
Other* | | | 11.4 | | |
Finance | | | 8.4 | | |
Variable Rate Senior Loan Interests | | | 8.2 | | |
Communications | | | 6.3 | | |
Total Investments | | | 100.0 | % | |
* Industries and/or investment types representing less than 5% of total investments.
The accompanying notes are an integral part of the financial statements.
13
Morgan Stanley Institutional Fund Trust
Annual Report — September 30, 2017
Statement of Assets and Liabilities | | September 30, 2017
(000) | |
Assets: | |
Investments in Securities of Unaffiliated Issuers, at Value (Cost $133,863) | | $ | 135,665 | | |
Investment in Security of Affiliated Issuer, at Value (Cost $1,425) | | | 1,425 | | |
Total Investments in Securities, at Value (Cost $135,288) | | | 137,090 | | |
Interest Receivable | | | 2,447 | | |
Receivable for Investments Sold | | | 655 | | |
Receivable for Fund Shares Sold | | | 90 | | |
Receivable from Affiliate | | | 1 | | |
Other Assets | | | 44 | | |
Total Assets | | | 140,327 | | |
Liabilities: | |
Payable for Investments Purchased | | | 2,620 | | |
Bank Overdraft | | | 35 | | |
Payable for Advisory Fees | | | 23 | | |
Payable for Professional Fees | | | 22 | | |
Payable for Sub Transfer Agency Fees — Class I | | | 9 | | |
Payable for Sub Transfer Agency Fees — Class A | | | 10 | | |
Payable for Sub Transfer Agency Fees — Class L | | | — | @ | |
Payable for Sub Transfer Agency Fees — Class C | | | — | @ | |
Payable for Shareholder Services Fees — Class A | | | 14 | | |
Payable for Distribution and Shareholder Services Fees — Class L | | | — | @ | |
Payable for Distribution and Shareholder Services Fees — Class C | | | 3 | | |
Payable for Administration Fees | | | 9 | | |
Payable for Fund Shares Redeemed | | | 7 | | |
Payable for Transfer Agency Fees — Class I | | | 3 | | |
Payable for Transfer Agency Fees — Class A | | | 1 | | |
Payable for Transfer Agency Fees — Class L | | | 1 | | |
Payable for Transfer Agency Fees — Class C | | | 1 | | |
Payable for Transfer Agency Fees — Class IS | | | 1 | | |
Payable for Custodian Fees | | | 6 | | |
Other Liabilities | | | 30 | | |
Total Liabilities | | | 2,795 | | |
Net Assets | | $ | 137,532 | | |
Net Assets Consist Of: | |
Paid-in-Capital | | $ | 135,319 | | |
Accumulated Undistributed Net Investment Income | | | 1,336 | | |
Accumulated Net Realized Loss | | | (925 | ) | |
Unrealized Appreciation (Depreciation) on: | |
Investments | | | 1,802 | | |
Net Assets | | $ | 137,532 | | |
The accompanying notes are an integral part of the financial statements.
14
Morgan Stanley Institutional Fund Trust
Annual Report — September 30, 2017
Statement of Assets and Liabilities (cont'd) | | September 30, 2017
(000) | |
CLASS I: | |
Net Assets | | $ | 64,007 | | |
| Shares Outstanding (unlimited number of shares authorized, no par value) (not in 000's) | | | 6,307,820 | | |
Net Asset Value, Offering and Redemption Price Per Share | | $ | 10.15 | | |
CLASS A: | |
Net Assets | | $ | 68,878 | | |
| Shares Outstanding (unlimited number of shares authorized, no par value) (not in 000's) | | | 6,798,636 | | |
Net Asset Value, Redemption Price Per Share | | $ | 10.13 | | |
Maximum Sales Load | | | 4.25 | % | |
Maximum Sales Charge | | $ | 0.45 | | |
Maximum Offering Price Per Share | | $ | 10.58 | | |
CLASS L: | |
Net Assets | | $ | 502 | | |
| Shares Outstanding (unlimited number of shares authorized, no par value) (not in 000's) | | | 49,527 | | |
Net Asset Value, Offering and Redemption Price Per Share | | $ | 10.13 | | |
CLASS C: | |
Net Assets | | $ | 3,585 | | |
| Shares Outstanding (unlimited number of shares authorized, no par value) (not in 000's) | | | 354,297 | | |
Net Asset Value, Offering and Redemption Price Per Share | | $ | 10.12 | | |
CLASS IS: | |
Net Assets | | $ | 560 | | |
| Shares Outstanding (unlimited number of shares authorized, no par value) (not in 000's) | | | 55,214 | | |
Net Asset Value, Offering and Redemption Price Per Share | | $ | 10.15 | | |
@ Amount is less than $500.
The accompanying notes are an integral part of the financial statements.
15
Morgan Stanley Institutional Fund Trust
Annual Report — September 30, 2017
Statement of Operations | | Year Ended
September 30, 2017
(000) | |
Investment Income: | |
Interest from Securities of Unaffiliated Issuers | | $ | 9,666 | | |
Dividends from Security of Affiliated Issuer (Note G) | | | 6 | | �� |
Total Investment Income | | | 9,672 | | |
Expenses: | |
Advisory Fees (Note B) | | | 757 | | |
Shareholder Services Fees — Class A (Note D) | | | 160 | | |
Distribution and Shareholder Services Fees — Class L (Note D) | | | 3 | | |
Distribution and Shareholder Services Fees — Class C (Note D) | | | 32 | | |
Sub Transfer Agency Fees — Class I | | | 54 | | |
Sub Transfer Agency Fees — Class A | | | 90 | | |
Sub Transfer Agency Fees — Class L | | | — | @ | |
Sub Transfer Agency Fees — Class C | | | 2 | | |
Professional Fees | | | 135 | | |
Administration Fees (Note C) | | | 101 | | |
Registration Fees | | | 69 | | |
Pricing Fees | | | 35 | | |
Shareholder Reporting Fees | | | 31 | | |
Transfer Agency Fees — Class I (Note E) | | | 9 | | |
Transfer Agency Fees — Class A (Note E) | | | 4 | | |
Transfer Agency Fees — Class L (Note E) | | | 2 | | |
Transfer Agency Fees — Class C (Note E) | | | 3 | | |
Transfer Agency Fees — Class IS (Note E) | | | 2 | | |
Custodian Fees (Note F) | | | 11 | | |
Trustees' Fees and Expenses | | | 6 | | |
Other Expenses | | | 31 | | |
Expenses Before Non Operating Expenses | | | 1,537 | | |
Bank Overdraft Expense | | | 15 | | |
Total Expenses | | | 1,552 | | |
Waiver of Advisory Fees (Note B) | | | (394 | ) | |
Reimbursement of Class Specific Expenses — Class I (Note B) | | | (46 | ) | |
Reimbursement of Class Specific Expenses — Class A (Note B) | | | (11 | ) | |
Reimbursement of Class Specific Expenses — Class L (Note B) | | | (2 | ) | |
Reimbursement of Class Specific Expenses — Class C (Note B) | | | (1 | ) | |
Reimbursement of Class Specific Expenses — Class IS (Note B) | | | (2 | ) | |
Rebate from Morgan Stanley Affiliate (Note G) | | | (2 | ) | |
Net Expenses | | | 1,094 | | |
Net Investment Income | | | 8,578 | | |
Realized Gain: | |
Investments Sold | | | 1,665 | | |
Change in Unrealized Appreciation (Depreciation): | |
Investments | | | 668 | | |
Net Realized Gain and Change in Unrealized Appreciation (Depreciation) | | | 2,333 | | |
Net Increase in Net Assets Resulting from Operations | | $ | 10,911 | | |
@ Amount is less than $500.
The accompanying notes are an integral part of the financial statements.
16
Morgan Stanley Institutional Fund Trust
Annual Report — September 30, 2017
Statements of Changes in Net Assets | | Year Ended
September 30, 2017
(000) | | Year Ended
September 30, 2016
(000) | |
Increase (Decrease) in Net Assets: | |
Operations: | |
Net Investment Income | | $ | 8,578 | | | $ | 6,893 | | |
Net Realized Gain (Loss) | | | 1,665 | | | | (1,143 | ) | |
Net Change in Unrealized Appreciation (Depreciation) | | | 668 | | | | 5,881 | | |
Net Increase in Net Assets Resulting from Operations | | | 10,911 | | | | 11,631 | | |
Distributions from and/or in Excess of: | |
Class I: | |
Net Investment Income | | | (3,652 | ) | | | (2,238 | ) | |
Class A: | |
Net Investment Income | | | (4,011 | ) | | | (3,747 | ) | |
Class L: | |
Net Investment Income | | | (34 | ) | | | (47 | ) | |
Class C: | |
Net Investment Income | | | (176 | ) | | | (123 | ) | |
Class IS: | |
Net Investment Income | | | (290 | ) | | | (464 | ) | |
Total Distributions | | | (8,163 | ) | | | (6,619 | ) | |
Capital Share Transactions:(1) | |
Class I: | |
Subscribed | | | 27,882 | | | | 41,355 | | |
Distributions Reinvested | | | 3,649 | | | | 2,236 | | |
Redeemed | | | (18,735 | ) | | | (9,900 | ) | |
Class A: | |
Subscribed | | | 22,224 | | | | 20,138 | | |
Distributions Reinvested | | | 3,981 | | | | 3,727 | | |
Redeemed | | | (17,894 | ) | | | (21,559 | ) | |
Class L: | |
Exchanged | | | — | | | | 99 | | |
Distributions Reinvested | | | 34 | | | | 47 | | |
Redeemed | | | (172 | ) | | | (624 | ) | |
Class C: | |
Subscribed | | | 1,040 | | | | 2,155 | | |
Distributions Reinvested | | | 173 | | | | 121 | | |
Redeemed | | | (605 | ) | | | (752 | ) | |
Class IS: | |
Subscribed | | | 3,090 | | | | 13,688 | | |
Redeemed | | | (16,337 | ) | | | (1,580 | ) | |
Net Increase in Net Assets Resulting from Capital Share Transactions | | | 8,330 | | | | 49,151 | | |
Total Increase in Net Assets | | | 11,078 | | | | 54,163 | | |
Net Assets: | |
Beginning of Period | | | 126,454 | | | | 72,291 | | |
End of Period (Including Accumulated Undistributed Net Investment Income of $1,336 and $918) | | $ | 137,532 | | | $ | 126,454 | | |
(1) Capital Share Transactions: | |
Class I: | |
Shares Subscribed | | | 2,777 | | | | 4,503 | | |
Shares Issued on Distributions Reinvested | | | 365 | | | | 237 | | |
Shares Redeemed | | | (1,874 | ) | | | (1,053 | ) | |
Net Increase in Class I Shares Outstanding | | | 1,268 | | | | 3,687 | | |
Class A: | |
Shares Subscribed | | | 2,219 | | | | 2,115 | | |
Shares Issued on Distributions Reinvested | | | 399 | | | | 395 | | |
Shares Redeemed | | | (1,791 | ) | | | (2,267 | ) | |
Net Increase in Class A Shares Outstanding | | | 827 | | | | 243 | | |
The accompanying notes are an integral part of the financial statements.
17
Morgan Stanley Institutional Fund Trust
Annual Report — September 30, 2017
Statements of Changes in Net Assets (cont'd) | | Year Ended
September 30, 2017
(000) | | Year Ended
September 30, 2016
(000) | |
Class L: | |
Shares Exchanged | | | — | | | | 10 | | |
Shares Issued on Distributions Reinvested | | | 3 | | | | 5 | | |
Shares Redeemed | | | (17 | ) | | | (65 | ) | |
Net Decrease in Class L Shares Outstanding | | | (14 | ) | | | (50 | ) | |
Class C: | |
Shares Subscribed | | | 103 | | | | 228 | | |
Shares Issued on Distributions Reinvested | | | 17 | | | | 13 | | |
Shares Redeemed | | | (60 | ) | | | (81 | ) | |
Net Increase in Class C Shares Outstanding | | | 60 | | | | 160 | | |
Class IS: | |
Shares Subscribed | | | 310 | | | | 1,500 | | |
Shares Redeemed | | | (1,645 | ) | | | (169 | ) | |
Net Increase (Decrease) in Class IS Shares Outstanding | | | (1,335 | ) | | | 1,331 | | |
The accompanying notes are an integral part of the financial statements.
18
Morgan Stanley Institutional Fund Trust
Annual Report — September 30, 2017
Financial Highlights
High Yield Portfolio
| | | Class I | |
| | | Year Ended September 30, | |
Selected Per Share Data and Ratios | | 2017 | | 2016(1) | | 2015 | | 2014 | | 2013 | |
Net Asset Value, Beginning of Period | | $ | 9.92 | | | $ | 9.80 | | | $ | 10.73 | | | $ | 11.00 | | | $ | 10.71 | | |
Income (Loss) from Investment Operations: | |
Net Investment Income(2) | | | 0.70 | | | | 0.67 | | | | 0.71 | | | | 0.75 | | | | 0.81 | | |
Net Realized and Unrealized Gain (Loss) | | | 0.20 | | | | 0.13 | | | | (0.92 | ) | | | 0.25 | | | | 0.55 | | |
Total from Investment Operations | | | 0.90 | | | | 0.80 | | | | (0.21 | ) | | | 1.00 | | | | 1.36 | | |
Distributions from and/or in Excess of: | |
Net Investment Income | | | (0.67 | ) | | | (0.68 | ) | | | (0.66 | ) | | | (0.77 | ) | | | (0.81 | ) | |
Net Realized Gain | | | — | | | | — | | | | (0.06 | ) | | | (0.50 | ) | | | (0.26 | ) | |
Total Distributions | | | (0.67 | ) | | | (0.68 | ) | | | (0.72 | ) | | | (1.27 | ) | | | (1.07 | ) | |
Net Asset Value, End of Period | | $ | 10.15 | | | $ | 9.92 | | | $ | 9.80 | | | $ | 10.73 | | | $ | 11.00 | | |
Total Return(3) | | | 9.40 | % | | | 8.72 | % | | | (2.10 | )% | | | 9.48 | % | | | 13.38 | % | |
Ratios and Supplemental Data: | |
Net Assets, End of Period (Thousands) | | $ | 64,007 | | | $ | 49,990 | | | $ | 13,255 | | | $ | 13,300 | | | $ | 12,678 | | |
Ratio of Expenses to Average Net Assets(7) | | | 0.66 | %(4) | | | 0.66 | %(4)(5) | | | 0.74 | %(4) | | | 0.75 | %(4) | | | 0.75 | %(4) | |
Ratio of Expenses to Average Net Assets
Excluding Non Operating Expenses | | | 0.65 | %(4) | | | N/A | | | | N/A | | | | N/A | | | | N/A | | |
Ratio of Net Investment Income to Average
Net Assets(7) | | | 7.01 | %(4) | | | 7.09 | %(4)(5) | | | 6.88 | %(4) | | | 6.89 | %(4) | | | 7.42 | %(4) | |
Ratio of Rebate from Morgan Stanley Affiliates to
Average Net Assets | | | 0.00 | %(6) | | | 0.00 | %(6) | | | 0.00 | %(6) | | | 0.00 | %(6) | | | 0.00 | %(6) | |
Portfolio Turnover Rate | | | 73 | % | | | 74 | % | | | 62 | % | | | 96 | % | | | 227 | % | |
(7) Supplemental Information on the Ratios to Average Net Assets: | |
Ratios Before Expense Limitation: | |
Expenses to Average Net Assets | | | 1.06 | % | | | 1.02 | % | | | 1.17 | % | | | 1.85 | % | | | 3.16 | % | |
Net Investment Income to Average Net Assets | | | 6.61 | % | | | 6.73 | % | | | 6.45 | % | | | 5.79 | % | | | 5.01 | % | |
(1) Reflects prior period custodian out-of-pocket expenses that were reimbursed in September 2016. The amount of the reimbursement was immaterial on a per share basis and did not impact the total return of Class I shares. The Ratio of Expenses to Average Net Assets and the Ratio of Net Investment Income to Average Net Assets would be unchanged as the reimbursement of custodian fees was offset against expense waivers/reimbursements with no impact to net expenses or net investment income.
(2) Per share amount is based on average shares outstanding.
(3) Calculated based on the net asset value as of the last business day of the period.
(4) The Ratios of Expenses and Net Investment Income reflect the rebate of certain Fund expenses in connection with the investments in Morgan Stanley affiliates during the period. The effect of the rebate on the ratios is disclosed in the above table as "Ratio of Rebate from Morgan Stanley Affiliates to Average Net Assets."
(5) Effective January 4, 2016, the Adviser has agreed to limit the ratio of expenses to average net assets to the maximum ratio of 0.65% for Class I shares. Prior to January 4, 2016, the maximum ratio was 0.75% for Class I shares.
(6) Amount is less than 0.005%.
The accompanying notes are an integral part of the financial statements.
19
Morgan Stanley Institutional Fund Trust
Annual Report — September 30, 2017
Financial Highlights
High Yield Portfolio
| | | Class A | |
| | | Year Ended September 30, | |
Selected Per Share Data and Ratios | | 2017 | | 2016(1) | | 2015 | | 2014 | | 2013 | |
Net Asset Value, Beginning of Period | | $ | 9.90 | | | $ | 9.78 | | | $ | 10.72 | | | $ | 10.99 | | | $ | 10.71 | | |
Income (Loss) from Investment Operations: | |
Net Investment Income(2) | | | 0.67 | | | | 0.64 | | | | 0.66 | | | | 0.65 | | | | 0.77 | | |
Net Realized and Unrealized Gain (Loss) | | | 0.20 | | | | 0.12 | | | | (0.92 | ) | | | 0.31 | | | | 0.55 | | |
Total from Investment Operations | | | 0.87 | | | | 0.76 | | | | (0.26 | ) | | | 0.96 | | | | 1.32 | | |
Distributions from and/or in Excess of: | |
Net Investment Income | | | (0.64 | ) | | | (0.64 | ) | | | (0.62 | ) | | | (0.73 | ) | | | (0.78 | ) | |
Net Realized Gain | | | — | | | | — | | | | (0.06 | ) | | | (0.50 | ) | | | (0.26 | ) | |
Total Distributions | | | (0.64 | ) | | | (0.64 | ) | | | (0.68 | ) | | | (1.23 | ) | | | (1.04 | ) | |
Net Asset Value, End of Period | | $ | 10.13 | | | $ | 9.90 | | | $ | 9.78 | | | $ | 10.72 | | | $ | 10.99 | | |
Total Return(3) | | | 9.04 | % | | | 8.24 | % | | | (2.43 | )% | | | 9.15 | % | | | 13.01 | % | |
Ratios and Supplemental Data: | |
Net Assets, End of Period (Thousands) | | $ | 68,878 | | | $ | 59,139 | | | $ | 56,042 | | | $ | 40,157 | | | $ | 1,092 | | |
Ratio of Expenses to Average Net Assets(8) | | | 1.01 | %(4) | | | 1.02 | %(4)(6) | | | 1.10 | %(4) | | | 1.02 | %(4) | | | 1.01 | %(4)(5) | |
Ratio of Expenses to Average Net Assets
Excluding Non Operating Expenses | | | 1.00 | %(4) | | | N/A | | | | N/A | | | | N/A | | | | N/A | | |
Ratio of Net Investment Income to Average
Net Assets(8) | | | 6.65 | %(4) | | | 6.76 | %(4)(6) | | | 6.49 | %(4) | | | 5.99 | %(4) | | | 7.04 | %(4)(5) | |
Ratio of Rebate from Morgan Stanley Affiliates to
Average Net Assets | | | 0.00 | %(7) | | | 0.00 | %(7) | | | 0.00 | %(7) | | | 0.01 | % | | | 0.00 | %(7) | |
Portfolio Turnover Rate | | | 73 | % | | | 74 | % | | | 62 | % | | | 96 | % | | | 227 | % | |
(8) Supplemental Information on the Ratios to Average Net Assets: | |
Ratios Before Expense Limitation: | |
Expenses to Average Net Assets | | | 1.34 | % | | | 1.33 | % | | | 1.53 | % | | | 2.06 | % | | | 4.22 | % | |
Net Investment Income to Average Net Assets | | | 6.32 | % | | | 6.45 | % | | | 6.06 | % | | | 4.95 | % | | | 3.83 | % | |
(1) Reflects prior period custodian out-of-pocket expenses that were reimbursed in September 2016. The amount of the reimbursement was immaterial on a per share basis and did not impact the total return of Class A shares. The Ratio of Expenses to Average Net Assets and the Ratio of Net Investment Income to Average Net Assets would be unchanged as the reimbursement of custodian fees was offset against expense waivers/reimbursements with no impact to net expenses or net investment income.
(2) Per share amount is based on average shares outstanding.
(3) Calculated based on the net asset value which does not reflect sales charges, if applicable, as of the last business day of the period.
(4) The Ratios of Expenses and Net Investment Income reflect the rebate of certain Fund expenses in connection with the investments in Morgan Stanley affiliates during the period. The effect of the rebate on the ratios is disclosed in the above table as "Ratio of Rebate from Morgan Stanley Affiliates to Average Net Assets."
(5) Effective September 16, 2013, the Adviser has agreed to limit the ratio of expenses to average net assets to the maximum ratio of 1.10% for Class A shares. Prior to September 16, 2013, the maximum ratio was 1.00% for Class A shares.
(6) Effective January 4, 2016, the Adviser has agreed to limit the ratio of expenses to average net assets to the maximum ratio of 1.00% for Class A shares. Prior to January 4, 2016, the maximum ratio was 1.10% for Class A shares.
(7) Amount is less than 0.005%.
The accompanying notes are an integral part of the financial statements.
20
Morgan Stanley Institutional Fund Trust
Annual Report — September 30, 2017
Financial Highlights
High Yield Portfolio
| | | Class L | |
| | | Year Ended September 30, | |
Selected Per Share Data and Ratios | | 2017 | | 2016(1) | | 2015 | | 2014 | | 2013 | |
Net Asset Value, Beginning of Period | | $ | 9.91 | | | $ | 9.78 | | | $ | 10.72 | | | $ | 10.99 | | | $ | 10.70 | | |
Income (Loss) from Investment Operations: | |
Net Investment Income(2) | | | 0.64 | | | | 0.62 | | | | 0.64 | | | | 0.67 | | | | 0.75 | | |
Net Realized and Unrealized Gain (Loss) | | | 0.19 | | | | 0.13 | | | | (0.93 | ) | | | 0.27 | | | | 0.56 | | |
Total from Investment Operations | | | 0.83 | | | | 0.75 | | | | (0.29 | ) | | | 0.94 | | | | 1.31 | | |
Distributions from and/or in Excess of: | |
Net Investment Income | | | (0.61 | ) | | | (0.62 | ) | | | (0.59 | ) | | | (0.71 | ) | | | (0.76 | ) | |
Net Realized Gain | | | — | | | | — | | | | (0.06 | ) | | | (0.50 | ) | | | (0.26 | ) | |
Total Distributions | | | (0.61 | ) | | | (0.62 | ) | | | (0.65 | ) | | | (1.21 | ) | | | (1.02 | ) | |
Net Asset Value, End of Period | | $ | 10.13 | | | $ | 9.91 | | | $ | 9.78 | | | $ | 10.72 | | | $ | 10.99 | | |
Total Return(3) | | | 8.75 | % | | | 7.95 | % | | | (2.70 | )% | | | 8.88 | % | | | 12.82 | % | |
Ratios and Supplemental Data: | |
Net Assets, End of Period (Thousands) | | $ | 502 | | | $ | 628 | | | $ | 1,111 | | | $ | 1,519 | | | $ | 326 | | |
Ratio of Expenses to Average Net Assets(8) | | | 1.26 | %(4) | | | 1.28 | %(4)(6) | | | 1.35 | %(4) | | | 1.35 | %(4) | | | 1.26 | %(4)(5) | |
Ratio of Expenses to Average Net Assets
Excluding Non Operating Expenses | | | 1.25 | %(4) | | | N/A | | | | N/A | | | | N/A | | | | N/A | | |
Ratio of Net Investment Income to Average
Net Assets(8) | | | 6.40 | %(4) | | | 6.51 | %(4)(6) | | | 6.25 | %(4) | | | 6.14 | %(4) | | | 6.90 | %(4)(5) | |
Ratio of Rebate from Morgan Stanley Affiliates to
Average Net Assets | | | 0.00 | %(7) | | | 0.00 | %(7) | | | 0.00 | %(7) | | | 0.00 | %(7) | | | 0.00 | %(7) | |
Portfolio Turnover Rate | | | 73 | % | | | 74 | % | | | 62 | % | | | 96 | % | | | 227 | % | |
(8) Supplemental Information on the Ratios to Average Net Assets: | |
Ratios Before Expense Limitation: | |
Expenses to Average Net Assets | | | 1.90 | % | | | 1.83 | % | | | 1.84 | % | | | 2.52 | % | | | 4.11 | % | |
Net Investment Income to Average Net Assets | | | 5.76 | % | | | 5.96 | % | | | 5.76 | % | | | 4.97 | % | | | 4.05 | % | |
(1) Reflects prior period custodian out-of-pocket expenses that were reimbursed in September 2016. The amount of the reimbursement was immaterial on a per share basis and did not impact the total return of Class L shares. The Ratio of Expenses to Average Net Assets and the Ratio of Net Investment Income to Average Net Assets would be unchanged as the reimbursement of custodian fees was offset against expense waivers/reimbursements with no impact to net expenses or net investment income.
(2) Per share amount is based on average shares outstanding.
(3) Calculated based on the net asset value as of the last business day of the period.
(4) The Ratios of Expenses and Net Investment Income reflect the rebate of certain Fund expenses in connection with the investments in Morgan Stanley affiliates during the period. The effect of the rebate on the ratios is disclosed in the above table as "Ratio of Rebate from Morgan Stanley Affiliates to Average Net Assets."
(5) Effective September 16, 2013, the Adviser has agreed to limit the ratio of expenses to average net assets to the maximum ratio of 1.35% for Class L shares. Prior to September 16, 2013, the maximum ratio was 1.25% for Class L shares.
(6) Effective January 4, 2016, the Adviser has agreed to limit the ratio of expenses to average net assets to the maximum ratio of 1.25% for Class L shares. Prior to January 4, 2016, the maximum ratio was 1.35% for Class L shares.
(7) Amount is less than 0.005%.
The accompanying notes are an integral part of the financial statements.
21
Morgan Stanley Institutional Fund Trust
Annual Report — September 30, 2017
Financial Highlights
High Yield Portfolio
| | | Class C | |
| | | Year Ended September 30, | | Period from
April 30, 2015(2) to | |
Selected Per Share Data and Ratios | | 2017 | | 2016(1) | | September 30, 2015 | |
Net Asset Value, Beginning of Period | | $ | 9.89 | | | $ | 9.78 | | | $ | 10.39 | | |
Income (Loss) from Investment Operations: | |
Net Investment Income(3) | | | 0.59 | | | | 0.57 | | | | 0.24 | | |
Net Realized and Unrealized Gain (Loss) | | | 0.20 | | | | 0.12 | | | | (0.62 | ) | |
Total from Investment Operations | | | 0.79 | | | | 0.69 | | | | (0.38 | ) | |
Distributions from and/or in Excess of: | |
Net Investment Income | | | (0.56 | ) | | | (0.58 | ) | | | (0.23 | ) | |
Net Asset Value, End of Period | | $ | 10.12 | | | $ | 9.89 | | | $ | 9.78 | | |
Total Return(4) | | | 8.24 | % | | | 7.47 | % | | | (3.75 | )%(8) | |
Ratios and Supplemental Data: | |
Net Assets, End of Period (Thousands) | | $ | 3,585 | | | $ | 2,908 | | | $ | 1,309 | | |
Ratio of Expenses to Average Net Assets(10) | | | 1.76 | %(5) | | | 1.77 | %(5)(6) | | | 1.84 | %(5)(9) | |
Ratio of Expenses to Average Net Assets Excluding Non Operating Expenses | | | 1.75 | %(5) | | | N/A | | | | N/A | | |
Ratio of Net Investment Income to Average Net Assets(10) | | | 5.90 | %(5) | | | 6.00 | %(5)(6) | | | 5.60 | %(5)(9) | |
Ratio of Rebate from Morgan Stanley Affiliates to Average Net Assets | | | 0.00 | %(7) | | | 0.00 | %(7) | | | 0.00 | %(7)(9) | |
Portfolio Turnover Rate | | | 73 | % | | | 74 | % | | | 62 | %(8) | |
(10) Supplemental Information on the Ratios to Average Net Assets: | |
Ratios Before Expense Limitation: | |
Expenses to Average Net Assets | | | 2.09 | % | | | 2.12 | % | | | 2.15 | %(9) | |
Net Investment Income to Average Net Assets | | | 5.57 | % | | | 5.65 | % | | | 5.29 | %(9) | |
(1) Reflects prior period custodian out-of-pocket expenses that were reimbursed in September 2016. The amount of the reimbursement was immaterial on a per share basis and did not impact the total return of Class C shares. The Ratio of Expenses to Average Net Assets and the Ratio of Net Investment Income to Average Net Assets would be unchanged as the reimbursement of custodian fees was offset against expense waivers/reimbursements with no impact to net expenses or net investment income.
(2) Commencement of Offering.
(3) Per share amount is based on average shares outstanding.
(4) Calculated based on the net asset value which does not reflect sales charges, if applicable, as of the last business day of the period.
(5) The Ratios of Expenses and Net Investment Income reflect the rebate of certain Fund expenses in connection with the investments in Morgan Stanley affiliates during the period. The effect of the rebate on the ratios is disclosed in the above table as "Ratio of Rebate from Morgan Stanley Affiliates to Average Net Assets."
(6) Effective January 4, 2016, the Adviser has agreed to limit the ratio of expenses to average net assets to the maximum ratio of 1.75% for Class C shares. Prior to January 4, 2016, the maximum ratio was 1.85% for Class C shares.
(7) Amount is less than 0.005%.
(8) Not annualized.
(9) Annualized.
The accompanying notes are an integral part of the financial statements.
22
Morgan Stanley Institutional Fund Trust
Annual Report — September 30, 2017
Financial Highlights
High Yield Portfolio
| | | Class IS | |
| | | Year Ended September 30, | | Period from
March 28, 2014(2) to | |
Selected Per Share Data and Ratios | | 2017 | | 2016(1) | | 2015 | | September 30, 2014 | |
Net Asset Value, Beginning of Period | | $ | 9.92 | | | $ | 9.79 | | | $ | 10.74 | | | $ | 10.98 | | |
Income (Loss) from Investment Operations: | |
Net Investment Income(3) | | | 0.69 | | | | 0.67 | | | | 0.69 | | | | 0.37 | | |
Net Realized and Unrealized Gain (Loss) | | | 0.21 | | | | 0.14 | | | | (0.92 | ) | | | (0.27 | ) | |
Total from Investment Operations | | | 0.90 | | | | 0.81 | | | | (0.23 | ) | | | 0.10 | | |
Distributions from and/or in Excess of: | |
Net Investment Income | | | (0.67 | ) | | | (0.68 | ) | | | (0.66 | ) | | | (0.34 | ) | |
Net Realized Gain | | | — | | | | — | | | | (0.06 | ) | | | — | | |
Total Distributions | | | (0.67 | ) | | | (0.68 | ) | | | (0.72 | ) | | | (0.34 | ) | |
Net Asset Value, End of Period | | $ | 10.15 | | | $ | 9.92 | | | $ | 9.79 | | | $ | 10.74 | | |
Total Return(4) | | | 9.43 | % | | | 8.75 | % | | | (2.17 | )% | | | 0.89 | %(8) | |
Ratios and Supplemental Data: | |
Net Assets, End of Period (Thousands) | | $ | 560 | | | $ | 13,789 | | | $ | 574 | | | $ | 10 | | |
Ratio of Expenses to Average Net Assets(10) | | | 0.62 | %(5) | | | 0.62 | %(5)(6) | | | 0.72 | %(5) | | | 0.72 | %(5)(9) | |
Ratio of Expenses to Average Net Assets Excluding Non Operating Expenses | | | 0.62 | %(5) | | | N/A | | | | N/A | | | | N/A | | |
Ratio of Net Investment Income to Average Net Assets(10) | | | 6.93 | %(5) | | | 7.05 | %(5)(6) | | | 6.75 | %(5) | | | 6.66 | %(5)(9) | |
Ratio of Rebate from Morgan Stanley Affiliates to Average Net Assets | | | 0.00 | %(7) | | | 0.00 | %(7) | | | 0.00 | %(7) | | | 0.00 | %(7)(9) | |
Portfolio Turnover Rate | | | 73 | % | | | 74 | % | | | 62 | % | | | 96 | %(8) | |
(10) Supplemental Information on the Ratios to Average Net Assets: | |
Ratios Before Expense Limitation: | |
Expenses to Average Net Assets | | | 0.99 | % | | | 0.93 | % | | | 1.57 | % | | | 15.70 | %(9) | |
Net Investment Income (Loss) to Average Net Assets | | | 6.56 | % | | | 6.74 | % | | | 5.90 | % | | | (8.32 | )%(9) | |
(1) Reflects prior period custodian out-of-pocket expenses that were reimbursed in September 2016. The amount of the reimbursement was immaterial on a per share basis and did not impact the total return of Class IS shares. The Ratio of Expenses to Average Net Assets and the Ratio of Net Investment Income to Average Net Assets would be unchanged as the reimbursement of custodian fees was offset against expense waivers/reimbursements with no impact to net expenses or net investment income.
(2) Commencement of Offering.
(3) Per share amount is based on average shares outstanding.
(4) Calculated based on the net asset value as of the last business day of the period.
(5) The Ratios of Expenses and Net Investment Income reflect the rebate of certain Fund expenses in connection with the investments in Morgan Stanley affiliates during the period. The effect of the rebate on the ratios is disclosed in the above table as "Ratio of Rebate from Morgan Stanley Affiliates to Average Net Assets."
(6) Effective January 4, 2016, the Adviser has agreed to limit the ratio of expenses to average net assets to the maximum ratio of 0.62% for Class IS shares. Prior to January 4, 2016, the maximum ratio was 0.72% for Class IS shares.
(7) Amount is less than 0.005%.
(8) Not annualized.
(9) Annualized.
The accompanying notes are an integral part of the financial statements.
23
Morgan Stanley Institutional Fund Trust
Annual Report — September 30, 2017
Notes to Financial Statements
Morgan Stanley Institutional Fund Trust ("Trust'') is registered under the Investment Company Act of 1940, as amended (the "Act''), as an open-end management investment company. The Trust is comprised of nine separate, active funds (individually referred to as a "Fund", collectively as the "Funds"). The Trust applies investment company accounting and reporting guidance. All Funds are considered diversified for purposes of the Act.
The accompanying financial statements relate to the High Yield Portfolio. The Fund seeks total return. The Fund offers five classes of shares — Class I, Class A, Class L, Class C and Class IS.
The Fund has suspended offering Class L shares for sale to all investors. Class L shareholders of the Fund do not have the option of purchasing additional Class L shares. However, existing Class L shareholders may invest in additional Class L shares through reinvestment of dividends and distributions.
A. Significant Accounting Policies: The following significant accounting policies are in conformity with U.S. generally accepted accounting principles ("GAAP"). Such policies are consistently followed by the Trust in the preparation of its financial statements. GAAP may require management to make estimates and assumptions that affect the reported amounts and disclosures in the financial statements. Actual results may differ from those estimates.
1. Security Valuation: (1) Certain portfolio securities may be valued by an outside pricing service/vendor approved by the Trust's Board of Trustees (the "Trustees"). The pricing service/vendor may employ a pricing model that takes into account, among other things, bids, yield spreads, and/or other market data and specific security characteristics. Alternatively, if a valuation is not available from an outside pricing service/vendor, and the security trades on an exchange, the security may be valued at its latest reported sale price (or at the exchange official closing price if such exchange reports an official closing price), prior to the time when assets are valued. If there are no sales on a given day and if there is no official exchange closing price for that day, the security is valued at the mean between the last reported bid and asked prices if such bid and asked prices are available in the relevant exchanges; (2) an equity portfolio security listed or traded on an exchange is valued at its latest reported sales price (or at the exchange official closing price if such exchange reports an official closing price), and if there were no sales on a
given day and if there is no official exchange closing price for that day, the security is valued at the mean between the last reported bid and asked prices if such bid and asked prices are available on the relevant exchanges. Listed equity securities not traded on the valuation date with no reported bid and asked prices available on the exchange are valued at the mean between the current bid and asked prices obtained from one or more reputable brokers or dealers. In cases where a security is traded on more than one exchange, the security is valued on the exchange designated as the primary market; (3) all other equity portfolio securities for which over-the-counter ("OTC") market quotations are readily available are valued at the latest reported sales price (or at the market official closing price if such market reports an official closing price), and if there was no trading in the security on a given day and if there is no official closing price from relevant markets for that day, the security is valued at the mean between the last reported bid and asked prices if such bid and asked prices are available on the relevant markets. An unlisted equity security that does not trade on the valuation date and for which bid and asked prices from the relevant markets are unavailable is valued at the mean between the current bid and asked prices obtained from one or more reputable brokers or dealers; (4) certain senior collateralized loans ("Senior Loans") are valued based on quotations received from an independent pricing service; (5) when market quotations are not readily available, including circumstances under which Morgan Stanley Investment Management Inc. (the "Adviser") determines that the closing price, last sale price or the mean between the last reported bid and asked prices are not reflective of a security's market value, portfolio securities are valued at their fair value as determined in good faith under procedures established by and under the general supervision of the Trustees. Occasionally, developments affecting the closing prices of securities and other assets may occur between the times at which valuations of such securities are determined (that is, close of the foreign market on which the securities trade) and the close of business of the New York Stock Exchange ("NYSE"). If developments occur during such periods that are expected to materially affect the value of such securities, such valuations may be adjusted to reflect the estimated fair value of such securities as of the close of the NYSE, as determined in good faith by the Trustees or by the Adviser using a pricing service and/or procedures approved by the Trustees; and (6) investments in mutual
24
Morgan Stanley Institutional Fund Trust
Annual Report — September 30, 2017
Notes to Financial Statements (cont'd)
funds, including the Morgan Stanley Institutional Liquidity Funds, are valued at the net asset value ("NAV") as of the close of each business day.
The Trustees have responsibility for determining in good faith the fair value of the investments, and the Trustees may appoint others, such as the Trust's Adviser or a valuation committee, to assist the Trustees in determining fair value and to make the actual calculations pursuant to the fair valuation methodologies previously approved by the Trustees. Under procedures approved by the Trustees, the Trust's Adviser has formed a Valuation Committee whose members are approved by the Trustees. The Valuation Committee provides administration and oversight of the Trust's valuation policies and procedures, which are reviewed at least annually by the Trustees. These procedures allow the Trust to utilize independent pricing services, quotations from securities and financial instrument dealers, and other market sources to determine fair value.
The Trust has procedures to determine the fair value of securities and other financial instruments for which market prices are not readily available. Under these procedures, the Valuation Committee convenes on a regular and ad hoc basis to review such securities and considers a number of factors, including valuation methodologies and significant unobservable valuation inputs, when arriving at fair value. The Valuation Committee may employ a market-based approach which may use related or comparable assets or liabilities, recent transactions, market multiples, book values, and other relevant information for the investment to determine the fair value of the investment. An income-based valuation approach may also be used in which the anticipated future cash flows of the investment are discounted to calculate fair value. Discounts may also be applied due to the nature or duration of any restrictions on the disposition of the investments. Due to the inherent uncertainty of valuations of such investments, the fair values may differ significantly from the values that would have been used had an active market existed. The Valuation Committee employs various methods for calibrating these valuation approaches including a regular review of valuation methodologies, key inputs and assumptions, transactional back-testing or disposition analysis, and reviews of any related market activity.
2. Fair Value Measurement: Financial Accounting Standards Board ("FASB") Accounting Standards CodificationTM ("ASC") 820, "Fair Value Measurement" ("ASC 820"), defines fair value as the value that the Fund would receive to sell an investment or pay to transfer a liability in a timely transaction with an independent buyer in the principal market, or in the absence of a principal market, the most advantageous market for the investment or liability. ASC 820 establishes a three-tier hierarchy to distinguish between (1) inputs that reflect the assumptions market participants would use in valuing an asset or liability developed based on market data obtained from sources independent of the reporting entity (observable inputs) and (2) inputs that reflect the reporting entity's own assumptions about the assumptions market participants would use in valuing an asset or liability developed based on the best information available in the circumstances (unobservable inputs) and to establish classification of fair value measurements for disclosure purposes. Various inputs are used in determining the value of the Fund's investments. The inputs are summarized in the three broad levels listed below.
• Level 1 – unadjusted quoted prices in active markets for identical investments
• Level 2 – other significant observable inputs (including quoted prices for similar investments, interest rates, prepayment speeds, credit risk, etc.)
• Level 3 – significant unobservable inputs including the Fund's own assumptions in determining the fair value of investments. Factors considered in making this determination may include, but are not limited to, information obtained by contacting the issuer, analysts, or the appropriate stock exchange (for exchange-traded securities), analysis of the issuer's financial statements or other available documents and, if necessary, available information concerning other securities in similar circumstances
The inputs or methodology used for valuing securities are not necessarily an indication of the risk associated with investing in those securities and the determination of the significance of a particular input to the fair value measurement in its entirety requires judgment and considers factors specific to each security.
25
Morgan Stanley Institutional Fund Trust
Annual Report — September 30, 2017
Notes to Financial Statements (cont'd)
The following is a summary of the inputs used to value the Fund's investments as of September 30, 2017.
Investment Type | | Level 1
Unadjusted
quoted
prices
(000) | | Level 2
Other
significant
observable
inputs
(000) | | Level 3
Significant
unobservable
inputs
(000) | | Total
(000) | |
Assets: | |
Fixed Income Securities | |
Corporate Bonds | | $ | — | | | $ | 123,205 | | | $ | — | | | $ | 123,205 | | |
Sovereign | | | — | | | | 799 | | | | — | | | | 799 | | |
Variable Rate Senior
Loan Interests | | | — | | | | 11,209 | | | | — | | | | 11,209 | | |
Total Fixed Income
Securities | | | — | | | | 135,213 | | | | — | | | | 135,213 | | |
Common Stocks | |
Auto Components | | | — | @ | | | — | | | | — | | | | — | @ | |
Equity Real Estate
Investment Trusts
(REITs) | | | — | | | | 225 | | | | — | | | | 225 | | |
Machinery | | | — | | | | 79 | | | | — | | | | 79 | | |
Semiconductors &
Semiconductor
Equipment | | | — | | | | 67 | | | | — | | | | 67 | | |
Trading Companies &
Distributors | | | 64 | | | | — | | | | — | | | | 64 | | |
Total Common Stocks | | | 64 | | | | 371 | | | | — | | | | 435 | | |
Participation Note | | | — | | | | 17 | | | | — | | | | 17 | | |
Short-Term Investment | |
Investment Company | | | 1,425 | | | | — | | | | — | | | | 1,425 | | |
Total Assets | | $ | 1,489 | | | $ | 135,601 | | | $ | — | | | $ | 137,090 | | |
@ Value is less than $500.
Transfers between investment levels may occur as the markets fluctuate and/or the availability of data used in an investment's valuation changes. The Fund recognizes transfers between the levels as of the end of the period. As of September 30, 2017, securities with a total value of approximately $17,000 transferred from Level 3 to Level 2. Securities that were valued using significant unobservable inputs at September 30, 2016 were valued using other significant observable inputs at September 30, 2017.
Following is a reconciliation of investments in which significant unobservable inputs (Level 3) were used in determining fair value.
| | | Corporate
Bond
(000) | | Participation
Note
(000) | |
Beginning Balance | | $ | — | † | | $ | — | † | |
Purchases | | | — | | | | — | | |
Sales | | | — | | | | — | | |
Amortization of discount | | | 2 | | | | — | | |
Transfers in | | | — | | | | — | | |
Transfers out | | | — | | | | (17 | ) | |
| | | Corporate
Bond
(000) | | Participation
Note
(000) | |
Corporate actions | | $ | — | | | $ | — | | |
Change in unrealized appreciation (depreciation) | | | 95 | | | | 17 | | |
Realized gains (losses) | | | (97 | ) | | | — | | |
Ending Balance | | $ | — | | | $ | — | | |
Net change in unrealized appreciation
(depreciation) from investments still
held as of September 30, 2017 | | $ | — | | | $ | 17 | | |
† Includes one security which is valued at zero.
3. Senior Loans: Senior Loans are typically structured by a syndicate of lenders ("Lenders"), one or more of which administers the Senior Loan on behalf of the Lenders ("Agent"). Lenders may sell interests in Senior Loans to third parties ("Participations") or may assign all or a portion of their interest in a Senior Loan to third parties ("Assignments"). Senior Loans are exempt from registration under the Securities Act of 1933. Presently, Senior Loans are not readily marketable and are often subject to restrictions on resale.
4. Structured Investments: The Fund invested a portion of its assets in structured investments. A structured investment is a derivative security designed to offer a return linked to a particular underlying security, currency, commodity or market. Structured investments may come in various forms including notes (such as exchange-traded notes), warrants and options to purchase securities. The Fund will typically use structured investments to gain exposure to a permitted underlying security, currency, commodity or market when direct access to a market is limited or inefficient from a tax or cost standpoint. There can be no assurance that structured investments will trade at the same price or have the same value as the underlying security, currency, commodity or market. Investments in structured investments involve risks including issuer risk, counterparty risk and market risk. Holders of structured investments bear risks of the underlying investment and are subject to issuer or counterparty risk because the Fund is relying on the creditworthiness of such issuer or counterparty and has no rights with respect to the underlying investment. Certain structured investments may be thinly traded or have a limited trading market and may have the effect of increasing the Fund's illiquidity to the extent that the Fund, at a particular time, may be unable to find qualified buyers for these securities.
26
Morgan Stanley Institutional Fund Trust
Annual Report — September 30, 2017
Notes to Financial Statements (cont'd)
5. When-Issued/Delayed Delivery Securities: The Fund purchases and sells when-issued and delayed delivery securities. Securities purchased on a when-issued or delayed delivery basis are purchased for delivery beyond the normal settlement date at a stated price and yield, and no income accrues to the Fund on such securities prior to delivery date. Payment and delivery for when-issued and delayed delivery securities can take place a month or more after the date of the transaction. When the Fund enters into a purchase transaction on a when-issued or delayed delivery basis, securities are available for collateral in an amount at least equal in value to the Fund's commitments to purchase such securities. Purchasing securities on a when-issued or delayed delivery basis may involve a risk that the market price at the time of delivery may be lower than the agreed upon purchase price, in which case there could be an unrealized loss at the time of delivery. Purchasing investments on a when-issued or delayed delivery basis may be considered a form of leverage which may increase the impact that gains (losses) may have on the Fund.
6. Restricted Securities: The Fund invests in unregistered or otherwise restricted securities. The term "restricted securities" refers to securities that are unregistered or are held by control persons of the issuer and securities that are subject to contractual restrictions on their resale. As a result, restricted securities may be more difficult to value and the Fund may have difficulty disposing of such assets either in a timely manner or for a reasonable price. In order to dispose of an unregistered security, the Fund, where it has contractual rights to do so, may have to cause such security to be registered. A considerable period may elapse between the time the decision is made to sell the security and the time the security is registered so that the Fund can sell it. Contractual restrictions on the resale of securities vary in length and scope and are generally the result of a negotiation between the issuer and the acquirer of the securities. The Fund would, in either case, bear market risks during that period. Restricted securities are identified in the Portfolio of Investments.
7. Indemnifications: The Trust enters into contracts that contain a variety of indemnifications. The Trust's maximum exposure under these arrangements is unknown. However, the Trust has not had prior claims or losses pursuant to these contracts and expects the risk of loss to be remote.
8. Dividends and Distributions to Shareholders: Dividends and distributions to shareholders are recorded on the ex-dividend date. Dividends from net investment income, if any, are declared and paid monthly. Net realized capital gains, if any, are distributed at least annually.
9. Security Transactions, Income and Expenses: Security transactions are accounted for on the trade date (date the order to buy or sell is executed). Realized gains and losses on the sale of investment securities are determined on the specific identified cost method. When the Fund buys an interest in a Senior Loan, it may receive a commitment fee which is paid to lenders on an ongoing basis based upon the undrawn portion committed by the lenders of the underlying Senior Loan. The Fund accrues the commitment fee over the expected term of the loan. When the Fund sells an interest in a Senior Loan, it may be required to pay fees or commissions to the purchaser of the interest. Fees received in connection with loan amendments are accrued as earned. Dividend income and other distributions are recorded on the ex-dividend date (except for certain foreign dividends which may be recorded as soon as the Fund is informed of such dividends) net of applicable withholding taxes. Interest income is recognized on the accrual basis except where collection is in doubt. Discounts are accreted and premiums are amortized over the life of the respective securities. Most expenses of the Fund can be directly attributed to a particular Fund. Expenses which cannot be directly attributed are apportioned among the Funds based upon relative net assets or other appropriate methods. Income, expenses (other than class specific expenses — distribution and shareholder services, transfer agency and sub transfer agency fees) and realized and unrealized gains or losses are allocated to each class of shares based upon their relative net assets.
The Fund owns shares of real estate investment trusts ("REITs") which report information on the source of their distributions annually in the following calendar year. A portion of distributions received from REITs during the year is estimated to be a return of capital and is recorded as a reduction of their cost.
B. Advisory Fees: The Adviser, a wholly-owned subsidiary of Morgan Stanley, provides the Fund with advisory services under the terms of an Investment Advisory Agreement, paid quarterly, at an annual rate of 0.60% of the average daily net assets of the Fund.
27
Morgan Stanley Institutional Fund Trust
Annual Report — September 30, 2017
Notes to Financial Statements (cont'd)
The Adviser has agreed to reduce its advisory fee and/or reimburse the Fund so that total annual portfolio operating expenses, excluding certain investment related expenses, taxes, interest and other extraordinary expenses (including litigation), will not exceed 0.65% for Class I shares, 1.00% for Class A shares, 1.25% for Class L shares, 1.75% for Class C shares and 0.62% for Class IS shares. The fee waivers and/or expense reimbursements will continue for at least one year from the date of the Fund's prospectus or until such time as the Trustees act to discontinue all or a portion of such waivers and/or reimbursements when they deem such action is appropriate. For the year ended September 30, 2017, approximately $394,000 of advisory fees were waived and approximately $62,000 of other expenses were reimbursed by the Adviser pursuant to this arrangement.
C. Administration Fees: The Adviser also serves as Administrator to the Trust and provides administrative services pursuant to an Administration Agreement for an annual fee, accrued daily and paid monthly, of 0.08% of the Fund's average daily net assets. Under a Sub-Administration Agreement between the Administrator and State Street Bank and Trust Company ("State Street"), State Street provides certain administrative services to the Trust. For such services, the Administrator pays State Street a portion of the fee the Administrator receives from the Fund.
D. Distribution and Shareholder Services Fees: Morgan Stanley Distribution, Inc. ("MSDI" or the "Distributor"), a wholly-owned subsidiary of the Adviser, and an indirect subsidiary of Morgan Stanley, serves as the Trust's Distributor of Fund shares pursuant to a Distribution Agreement. The Trust has adopted a Shareholder Services Plan with respect to Class A shares pursuant to Rule 12b-1 under the Act. Under the Shareholder Services Plan, the Fund pays the Distributor a shareholder services fee, accrued daily and paid monthly, at an annual rate of 0.25% of the Fund's average daily net assets attributable to Class A shares.
The Trust has adopted a Distribution and Shareholder Services Plan with respect to Class L shares pursuant to Rule 12b-1 under the Act. Under the Distribution and Shareholder Services Plan, the Fund pays the Distributor a distribution fee, accrued daily and paid monthly, at an annual rate of 0.25% and a shareholder services fee, accrued daily and paid monthly, at an annual rate of 0.25% of the Fund's average daily net assets attributable to Class L shares.
The Trust has adopted a Distribution and Shareholder Services Plan with respect to Class C shares pursuant to Rule 12b-1 under the Act. Under the Distribution and Shareholder Services Plan, the Fund pays the Distributor a distribution fee, accrued daily and paid monthly, at an annual rate of 0.75% and a shareholder services fee, accrued daily and paid monthly, at an annual rate of 0.25% of the Fund's average daily net assets attributable to Class C shares.
The distribution and shareholder services fees are used to support the expenses associated with servicing and maintaining accounts. The Distributor may compensate other parties for providing shareholder support services to investors who purchase Class A, Class L and Class C shares.
E. Dividend Disbursing and Transfer Agent: The Trust's dividend disbursing and transfer agent is Boston Financial Data Services, Inc. ("BFDS"). Pursuant to a Transfer Agency Agreement, the Trust pays BFDS a fee based on the number of classes, accounts and transactions relating to the Funds of the Trust.
F. Custodian Fees: State Street (the "Custodian") serves as Custodian for the Trust in accordance with a Custodian Agreement. The Custodian holds cash, securities, and other assets of the Trust as required by the Act. Custody fees are payable monthly based on assets held in custody, investment purchases and sales activity and account maintenance fees, plus reimbursement for certain out-of-pocket expenses.
G. Security Transactions and Transactions with Affiliates: For the year ended September 30, 2017, purchases and sales of investment securities for the Fund, other than long-term U.S. Government securities and short-term investments, were approximately $96,883,000 and $91,555,000, respectively. There were no purchases and sales of long-term U.S. Government securities for the year ended September 30, 2017.
The Fund invests in the Institutional Class of the Morgan Stanley Institutional Liquidity Funds — Government Portfolio (the "Liquidity Funds"), an open-end management investment company managed by the Adviser. Advisory fees paid by the Fund are reduced by an amount equal to its pro-rata share of the advisory and administration fees paid by the Fund due to its investment in the Liquidity Funds. For the year ended September 30, 2017, advisory fees paid were reduced by approximately $2,000 relating to the Fund's investment in the Liquidity Funds.
28
Morgan Stanley Institutional Fund Trust
Annual Report — September 30, 2017
Notes to Financial Statements (cont'd)
A summary of the Fund's transactions in shares of the Liquidity Funds during the year ended September 30, 2017 is as follows:
Affiliated
Investment
Company | | Value
September 30,
2016
(000) | | Purchases
at Cost
(000) | | Proceeds
from Sales
(000) | | Dividend
Income
(000) | |
Liquidity Funds | | $ | 399 | | | $ | 43,602 | | | $ | 42,576 | | | $ | 6 | | |
Affiliated
Investment
Company (cont'd) | | Realized
Gain (Loss)
(000) | | Change in
Unrealized
Appreciation
(Depreciation)
(000) | | Value
September 30,
2017
(000) | |
Liquidity Funds | | $ | — | | | $ | — | | | $ | 1,425 | | |
The Fund is permitted to purchase and sell securities ("cross-trade") from and to other Morgan Stanley Funds as well as other funds and client accounts for which the Adviser or an affiliate of the Adviser serves as investment adviser, pursuant to procedures approved by the Trustees in compliance with Rule 17a-7 under the Act (the "Rule"). Each cross-trade is executed at the current market price in compliance with provisions of the Rule. For the year ended September 30, 2017, the Fund did not engage in any cross-trade transactions.
The Fund has an unfunded Deferred Compensation Plan (the "Compensation Plan"), which allows each independent Trustee to defer payment of all, or a portion, of the fees he or she receives for serving on the Board of Trustees. Each eligible Trustee generally may elect to have the deferred amounts credited with a return equal to the total return on one or more of the Morgan Stanley funds that are offered as investment options under the Compensation Plan. Appreciation/depreciation and distributions received from these investments are recorded with an offsetting increase/decrease in the deferred compensation obligation and do not affect the NAV of the Fund.
H. Federal Income Taxes: It is the Fund's intention to continue to qualify as a regulated investment company and distribute all of its taxable and tax-exempt income. Accordingly, no provision for federal income taxes is required in the financial statements.
The Fund may be subject to taxes imposed by countries in which it invests. Such taxes are generally based on income and/or capital gains earned or repatriated. Taxes are accrued based on net investment income, net realized gains and net unrealized appreciation as such income and/or gains are earned. Taxes may also be based on transactions in foreign currency
and are accrued based on the value of investments denominated in such currency.
FASB ASC 740-10, "Income Taxes — Overall", sets forth a minimum threshold for financial statement recognition of the benefit of a tax position taken or expected to be taken in a tax return. Management has concluded there are no significant uncertain tax positions that would require recognition in the financial statements. If applicable, the Fund recognizes interest accrued related to unrecognized tax benefits in "Interest Expense" and penalties in "Other Expenses" in the Statement of Operations. The Fund files tax returns with the U.S. Internal Revenue Service, New York and various states. Each of the tax years in the four-year period ended September 30, 2017, remains subject to examination by taxing authorities.
The tax character of distributions paid may differ from the character of distributions shown in the Statements of Changes in Net Assets due to short-term capital gains being treated as ordinary income for tax purposes. The tax character of distributions paid during fiscal years 2017 and 2016 was as follows:
2017
Distributions
Paid From: | | 2016
Distributions
Paid From: | |
Ordinary
Income
(000) | | Long-Term
Capital Gain
(000) | | Ordinary
Income
(000) | | Long-Term
Capital Gain
(000) | |
| $ | 8,163 | | | $ | — | | | $ | 6,619 | | | $ | — | | |
The amount and character of income and gains to be distributed are determined in accordance with income tax regulations which may differ from GAAP. These book/tax differences are either considered temporary or permanent in nature.
Temporary differences are attributable to differing book and tax treatments for the timing of the recognition of gains (losses) on certain investment transactions and the timing of the deductibility of certain expenses.
Permanent differences, primarily due to paydown adjustments and adjustments on defaulted bonds sold, resulted in the following reclassifications among the components of net assets at September 30, 2017:
Accumulated
Undistributed
Net Investment
Income
(000) | | Accumulated
Net Realized
Loss
(000) | | Paid-in-
Capital
(000) | |
| $ | 3 | | | $ | (3 | ) | | $ | — | | |
29
Morgan Stanley Institutional Fund Trust
Annual Report — September 30, 2017
Notes to Financial Statements (cont'd)
At September 30, 2017, the components of distributable earnings for the Fund on a tax basis were as follows:
Undistributed
Ordinary
Income
(000) | | Undistributed
Long-Term
Capital Gain
(000) | |
| $ | 1,336 | | | $ | — | | |
At September 30, 2017, the Fund had available for federal income tax purposes unused long term capital losses of approximately $863,000 that do not have an expiration date.
To the extent that capital loss carryforwards are used to offset any future capital gains realized during the carryover period as provided by U.S. federal income tax regulations, no capital gains tax liability will be incurred by the Fund for gains realized and not distributed. To the extent that capital gains are offset, such gains will not be distributed to the shareholders. During the year ended September 30, 2017, the Fund utilized capital loss carryforwards for U.S. federal income tax purposes of approximately $1,555,000.
I. Credit Facility: The Trust and other Morgan Stanley funds participate in a $150,000,000 committed, unsecured revolving line of credit facility (the "facility") with State Street. This facility is to be used for temporary emergency purposes or funding of shareholder redemption requests. The interest rate on borrowings is based on the federal funds rate or one month libor rate plus a spread. The facility also has a commitment fee of 0.25% per annum based on the unused portion of the facility. During the year ended September 30, 2017, the Fund did not have any borrowings under the facility.
J. Other: At September 30, 2017, the Fund had record owners of 10% or greater. Investment activities of these shareholders could have a material impact on the Fund. The aggregate percentage of such owners was 72.6%.
K. Accounting Pronouncement: In March 2017, FASB issued an Accounting Standard Update, ASU 2017-08, Receivables-Nonrefundable Fees and Other Costs (Subtopic 310-20), Premium Amortization on Purchased Callable Debt Securities (the "ASU") which amends the amortization period for certain purchased callable debt securities held at a premium, shortening such period to the earliest call date. The ASU does not require any accounting change for debt securities held at a discount; the discount continues to be amortized to maturity. The ASU is effective for fiscal years, and interim periods within those fiscal years, beginning after December 15, 2018. At this time, management is evaluating the implications of these changes on the financial statements.
30
Morgan Stanley Institutional Fund Trust
Annual Report — September 30, 2017
Report of Independent Registered Public Accounting Firm
To the Shareholders and Board of Trustees of
Morgan Stanley Institutional Fund Trust —
High Yield Portfolio
We have audited the accompanying statement of assets and liabilities, including the portfolio of investments, of High Yield Portfolio (one of the funds constituting Morgan Stanley Institutional Fund Trust) (the "Fund") as of September 30, 2017, and the related statement of operations for the year then ended, the statements of changes in net assets for each of the two years in the period then ended and the financial highlights for each of the years or periods indicated therein. These financial statements and financial highlights are the responsibility of the Fund's management. Our responsibility is to express an opinion on these financial statements and financial highlights based on our audits.
We conducted our audits in accordance with the standards of the Public Company Accounting Oversight Board (United States). Those standards require that we plan and perform the audit to obtain reasonable assurance about whether the financial statements and financial highlights are free of material misstatement. We were not engaged to perform an audit of the Fund's internal control over financial reporting. Our audits included consideration of internal control over financial reporting as a basis for designing audit procedures that are appropriate in the circumstances, but not for the purpose of expressing an opinion on the effectiveness of the Fund's internal control over financial reporting. Accordingly, we express no such opinion. An audit also includes examining, on a test basis, evidence supporting the amounts and disclosures in the financial statements and financial highlights, assessing the accounting principles used and significant estimates made by management, and evaluating the overall financial statement presentation. Our procedures included confirmation of securities owned as of September 30, 2017, by correspondence with the custodian and others or by other appropriate auditing procedures where replies from others were not received. We believe that our audits provide a reasonable basis for our opinion.
In our opinion, the financial statements and financial highlights referred to above present fairly, in all material respects, the financial position of High Yield Portfolio (one of the funds constituting Morgan Stanley Institutional Fund Trust) at September 30, 2017, the results of its operations for the year then ended, the changes in its net assets for each of the two years in the period then ended and the financial highlights for each of the years or periods indicated therein, in conformity with U.S. generally accepted accounting principles.

Boston, Massachusetts
November 22, 2017
31
Morgan Stanley Institutional Fund Trust
Annual Report — September 30, 2017
Investment Advisory Agreement Approval (unaudited)
Nature, Extent and Quality of Services
The Board reviewed and considered the nature and extent of the investment advisory services provided by the Adviser (as defined herein) under the advisory agreement, including portfolio management, investment research and equity and fixed income securities trading. The Board also reviewed and considered the nature and extent of the non-advisory, administrative services provided by the Adviser under the administration agreement, including accounting, operations, clerical, bookkeeping, compliance, business management and planning, legal services and the provision of supplies, office space and utilities at the Adviser's expense. The Board also considered the Adviser's investment in personnel and infrastructure that benefits the Fund. (The advisory and administration agreements together are referred to as the "Management Agreement.") The Board also considered that the Adviser serves a variety of other investment advisory clients and has experience overseeing service providers. The Board also compared the nature of the services provided by the Adviser with similar services provided by non-affiliated advisers as presented to the Board by Broadridge Financial Solutions, Inc. ("Broadridge").
The Board reviewed and considered the qualifications of the portfolio managers, the senior administrative managers and other key personnel of the Adviser who provide the administrative and advisory services to the Fund. The Board determined that the Adviser's portfolio managers and key personnel are well qualified by education and/or training and experience to perform the services in an efficient and professional manner. The Board concluded that the nature and extent of the advisory and administrative services provided were necessary and appropriate for the conduct of the business and investment activities of the Fund and supported its decision to approve the Management Agreement.
Performance, Fees and Expenses of the Fund
The Board reviewed the performance, fees and expenses of the Fund compared to its peers, as presented by Broadridge, and to appropriate benchmarks where applicable. The Board discussed with the Adviser the performance goals and the actual results achieved in managing the Fund. When considering a fund's performance, the Board and the Adviser place emphasis on trends and longer-term returns (focusing on one-year, three-year and five-year performance, as of December 31, 2016, or since inception, as applicable). When a fund underperforms its benchmark and/or its peer group average, the Board and the Adviser discuss the causes of such underperformance and, where necessary, they discuss specific changes to investment strategy or investment personnel. The Board noted that the Fund's performance was better than its peer group average for the one- and three-year periods and the period since the end of February 2012, the month of the Fund's inception. The Board discussed with the Adviser the level of the advisory and administration fees (together, the "management fee") for this Fund relative to comparable funds and/or other accounts advised by the Adviser and/or compared to its peers as presented by Broadridge. In addition to the management fee, the Board also reviewed the Fund's total expense ratio. The Board noted that the Fund's contractual management fee was higher than but close to its peer group average and that its actual management fee and total expense ratio were lower than its peer group averages. After discussion, the Board concluded that the Fund's (i) performance was competitive with its peer group average; and (ii) management fee and total expense ratio were competitive with its peer group averages.
Economies of Scale
The Board considered the size and growth prospects of the Fund and how that relates to the Fund's total expense ratio and particularly the Fund's management fee rate, which does not include breakpoints. In conjunction with its review of the Adviser's profitability, the Board discussed with the Adviser how a change in assets can affect the efficiency or effectiveness of managing the Fund and whether the management fee level is appropriate relative to current and projected asset levels and/or whether the management fee structure reflects economies of scale as asset levels change. The Board has determined that its review of the actual and/or potential economies of scale of the Fund supports its decision to approve the Management Agreement.
Profitability of the Adviser and Affiliates
The Board considered information concerning the costs incurred and profits realized by the Adviser and its affiliates during the last year from their relationship with the Fund and during the last two years from their relationship with the Morgan Stanley Fund Complex and reviewed with the Adviser the cost allocation methodology used to determine the profitability of the Adviser and affiliates. The Board has determined that its review of the analysis of the Adviser's expenses and profitability supports its decision to approve the Management Agreement.
32
Morgan Stanley Institutional Fund Trust
Annual Report — September 30, 2017
Investment Advisory Agreement Approval (unaudited) (cont'd)
Other Benefits of the Relationship
The Board considered other direct and indirect benefits to the Adviser and/or its affiliates derived from their relationship with the Fund and other funds advised by the Adviser. These benefits may include, among other things, fees for trading, distribution and/or shareholder servicing and for transaction processing and reporting platforms used by securities lending agents, and research received by the Adviser generated from commission dollars spent on funds' portfolio trading. The Board reviewed with the Adviser these arrangements and the reasonableness of the Adviser's costs relative to the services performed. The Board has determined that its review of the other benefits received by the Adviser or its affiliates supports its decision to approve the Management Agreement.
Resources of the Adviser and Historical Relationship Between the Fund and the Adviser
The Board considered whether the Adviser is financially sound and has the resources necessary to perform its obligations under the Management Agreement. The Board also reviewed and considered the historical relationship between the Fund and the Adviser, including the organizational structure of the Adviser, the policies and procedures formulated and adopted by the Adviser for managing the Fund's operations and the Board's confidence in the competence and integrity of the senior managers and key personnel of the Adviser. The Board concluded that the Adviser has the financial resources necessary to fulfill its obligations under the Management Agreement and that it is beneficial for the Fund to continue its relationship with the Adviser.
Other Factors and Current Trends
The Board considered the controls and procedures adopted and implemented by the Adviser and monitored by the Fund's Chief Compliance Officer and concluded that the conduct of business by the Adviser indicates a good faith effort on its part to adhere to high ethical standards in the conduct of the Fund's business.
General Conclusion
After considering and weighing all of the above factors, with various written materials and verbal information presented by the Adviser, the Board concluded that it would be in the best interest of the Fund and its shareholders to approve renewal of the Management Agreement for another year. In reaching this conclusion the Board did not give particular weight to any single piece of information or factor referenced above. The Board considered these factors and information over the course of the year and in numerous meetings, some of which were in executive session with only the independent Board members and their counsel present. It is possible that individual Board members may have weighed these factors, and the information presented, differently in reaching their individual decisions to approve the Management Agreement.
33
Morgan Stanley Institutional Fund Trust
Annual Report — September 30, 2017
Privacy Notice (unaudited)
MORGAN STANLEY INVESTMENT MANAGEMENT INC.
AN IMPORTANT NOTICE CONCERNING OUR U.S. PRIVACY POLICY
We are required by federal law to provide you with a copy of our privacy policy annually. This policy applies to current and former individual investors in funds managed or sponsored by Morgan Stanley Investment Management Inc. ("MSIM") as well as current and former individual clients of MSIM. This policy is not applicable to partnerships, corporations, trusts or other non-individual clients or investors. Please note that we may amend this policy at any time, and will inform you of any changes as required by law.
WE RESPECT YOUR PRIVACY
We appreciate that you have provided us with your personal financial information. We strive to maintain the privacy of such information while we help you achieve your financial objectives. This Notice describes what non-public personal information we collect about you, why we collect it, when we may share it with others and how certain others may use it. It discusses the steps you may take to limit our sharing of certain information about you to affiliated companies in the Morgan Stanley family of companies ("other Morgan Stanley companies"). It also discloses how you may limit use of certain shared information for marketing purposes by other Morgan Stanley branded companies. Throughout this policy, we refer to the non-public information that personally identifies you or your accounts as "personal information."
1. WHAT PERSONAL INFORMATION DO WE COLLECT ABOUT YOU?
We obtain personal information from applications and other forms you submit to us, from your dealings with us, from consumer reporting agencies, from our Web sites and from third parties and other sources.
For example:
• We may collect information such as your name, address, e-mail address, telephone/fax numbers, assets, income and investment objectives through subscription documents, applications and other forms you submit to us.
• We may obtain information about account balances, your use of account(s) and the types of products and services you prefer to receive from us through your dealings and transactions with us and other sources.
• We may obtain information about your creditworthiness and credit history from consumer reporting agencies.
• We may collect background information from and through third-party vendors to verify representations you have made and to comply with various regulatory requirements.
• If you interact with us through our public and private Web sites, we may collect information that you provide directly through online communications (such as an e-mail address). We may also collect information about your Internet service provider, your domain name, your computer's operating system and Web browser, your use of our Web sites and your product and service preferences, through the use of "cookies." Please consult the Terms of Use of these sites for more details.
2. WHEN DO WE DISCLOSE PERSONAL INFORMATION WE COLLECT ABOUT YOU?
We may disclose personal information we collect about you to other Morgan Stanley companies and to non-affiliated third parties.
a. Information We Disclose to Other Morgan Stanley Companies.
We may disclose personal information to other Morgan Stanley companies for a variety of reasons, including to manage your account(s) effectively, to service and process your transactions, to let you know about products and services offered by us and other Morgan Stanley companies, to manage our business, and as otherwise required or permitted by law. Offers for products and services from other Morgan Stanley companies are developed under conditions designed to safeguard your personal information.
34
Morgan Stanley Institutional Fund Trust
Annual Report — September 30, 2017
Privacy Notice (unaudited) (cont'd)
b. Information We Disclose to Non-affiliated Third Parties.
We do not disclose personal information that we collect about you to non-affiliated third parties except to those who provide marketing services on our behalf, to financial institutions with whom we have joint marketing agreements, and as otherwise required or permitted by law. For example, we may disclose personal information to non-affiliated third parties for servicing and processing transactions, to offer our own products and services, to protect against fraud, for institutional risk control, to respond to judicial process or to perform services on our behalf. When we share personal information with a non-affiliated third party, they are required to limit their use of personal information to the particular purpose for which it was shared and they are not allowed to share personal information with others except to fulfill that limited purpose or as may be permitted or required by law.
3. HOW DO WE PROTECT THE SECURITY AND CONFIDENTIALITY OF PERSONAL INFORMATION WE COLLECT ABOUT YOU?
We maintain physical, electronic and procedural security measures to help safeguard the personal information we collect about you. We have internal policies governing the proper handling of client information. Third parties that provide support or marketing services on our behalf may also receive personal information, and we require them to adhere to confidentiality standards with respect to such information.
4. HOW CAN YOU LIMIT THE SHARING OF CERTAIN TYPES OF PERSONAL INFORMATION WITH OTHER MORGAN STANLEY COMPANIES?
We offer you choices as to whether we share with other Morgan Stanley companies the personal information that was collected to determine your eligibility for products and services you request ("eligibility information"). Eligibility information does not include your identification information or personal information pertaining to our transactions or experiences with you. Please note that, even if you direct us not to share eligibility information with other Morgan Stanley companies ("opt-out"), we may still share personal information, including eligibility information, with those companies in circumstances excluded from the opt-out under applicable law, such as to process transactions or to service your account.
5. HOW CAN YOU LIMIT THE USE OF CERTAIN TYPES OF PERSONAL INFORMATION BY OTHER MORGAN STANLEY COMPANIES FOR MARKETING?
By following the opt-out instructions in Section 6 below, you may limit other Morgan Stanley branded companies from marketing their products or services to you based on personal information we disclose to them. This information may include, for example, your income and account history with us. Please note that, even if you choose to limit Other Morgan Stanley Companies from using personal information about you that we may share with them for marketing their products and services to you, Other Morgan Stanley Companies may use your personal information that they obtain from us to market to you in circumstances permitted by law, such as if the Other Morgan Stanley Company has its own relationship with you.
6. HOW CAN YOU SEND US AN OPT-OUT INSTRUCTION?
If you wish to limit our sharing of eligibility information about you with other Morgan Stanley companies or other Morgan Stanley companies' use of personal information for marketing purposes, as described in this notice, you may do so by:
• Calling us at (800) 548-7786
Monday–Friday between 8a.m. and 6p.m.(EST)
• Writing to us at the following address:
Boston Financial Data Services, Inc.
c/o Privacy Coordinator
P.O. Box 219804
Kansas City, Missouri 64121
35
Morgan Stanley Institutional Fund Trust
Annual Report — September 30, 2017
Privacy Notice (unaudited) (cont'd)
Your written request should include your name, address, telephone number and account number(s) to which the opt-out applies and whether you are opting out with respect to sharing of eligibility information (Section 4 above), or if information used for Marketing (Section 5 above) or both. Written opt-out requests should not be sent with any other correspondence. In order to process your request, we require that the request be provided by you directly and not through a third party.
Your opt-out preference will remain in effect with respect to this policy (as it may be amended) until you notify us otherwise. If you have a joint account, your direction for us not to share this information with other Morgan Stanley companies and for those other Morgan Stanley companies not to use your personal information for marketing will be applied to all account holders on that account. Please understand that if you limit our sharing or our affiliated companies' use of personal information, you and any joint account holder(s) may not receive information about Morgan Stanley products and services, including products or services that could help you manage your financial resources and achieve your investment objectives.
7. WHAT IF AN AFFILIATED COMPANY BECOMES A NON-AFFILIATED THIRD PARTY?
If, at any time in the future, an affiliated company becomes a non-affiliated third party, further disclosures of personal information made to the former affiliated company will be limited to those described in Section 2(b) above relating to non-affiliated third parties. If you elected under Section 6 to limit disclosures we make to affiliated companies, or use of personal information by affiliated companies, your election will not apply to use by any former affiliated company of your personal information in their possession once it becomes a non-affiliated third party.
SPECIAL NOTICE TO RESIDENTS OF VERMONT
The following section supplements our policy with respect to our individual clients who have a Vermont address and supersedes anything to the contrary in the above policy with respect to those clients only.
The state of Vermont requires financial institutions to obtain your consent prior to sharing personal information that they collect about you with affiliated companies and non-affiliated third parties other than in certain limited circumstances. Except as permitted by law, we will not share personal information we collect about you with non-affiliated third parties or other Morgan Stanley companies unless you provide us with your written consent to share such information ("opt-in").
If you wish to receive offers for investment products and services offered by or through other Morgan Stanley companies, please notify us in writing at the following address:
Boston Financial Data Services, Inc.
c/o Privacy Coordinator
P.O. Box 219804
Kansas City, Missouri 64121
Your authorization should include your name, address, telephone number and account number(s) to which the opt-in applies and should not be sent with any other correspondence. In order to process your authorization, we require that the authorization be provided by you directly and not through a third party.
SPECIAL NOTICE TO RESIDENTS OF CALIFORNIA
The following section supplements our policy with respect to our individual clients who have a California address and supersedes anything to the contrary in the above policy with respect to those clients only.
In response to a California law, if your account has a California home address, your personal information will not be disclosed to non-affiliated third parties except as permitted by applicable California law, and we will limit sharing such information with our affiliates to comply with California privacy laws that apply to us.
36
Morgan Stanley Institutional Fund Trust
Annual Report — September 30, 2017
Trustee and Officer Information (unaudited)
Independent Trustees:
Name, Age and Address of
Independent Trustee | | Position(s)
Held with
Registrant | | Length of Time
Served* | | Principal Occupation(s) During Past 5 Years
and Other Relevant Professional Experience | | Number of
Portfolios in
Fund Complex
Overseen by
Independent
Trustee** | | Other Directorships
Held by Independent
Trustee*** | |
Frank L. Bowman (72)
c/o Perkins Coie LLP
Counsel to the Independent Trustees
30 Rockefeller Plaza
New York, NY 10112 | | Trustee | | Since
August
2006 | | President, Strategic Decisions, LLC (consulting) (since February 2009); Director or Trustee of various Morgan Stanley Funds (since August 2006); Chairperson of the Compliance and Insurance Committee (since October 2015); formerly, Chairperson of the Insurance Sub-Committee of the Compliance and Insurance Committee (2007-2015); served as President and Chief Executive Officer of the Nuclear Energy Institute (policy organization) (February 2005-November 2008); retired as Admiral, U.S. Navy after serving over 38 years on active duty including 8 years as Director of the Naval Nuclear Propulsion Program in the Department of the Navy and the U.S. Department of Energy (1996-2004); served as Chief of Naval Personnel (July 1994-September 1996) and on the Joint Staff as Director of Political Military Affairs (June 1992-July 1994); knighted as Honorary Knight Commander of the Most Excellent Order of the British Empire; awarded the Officier de l'Orde National du Mérite by the French Government; elected to the National Academy of Engineering (2009). | | | 90 | | | Director of BP p.l.c.; Director of Naval and Nuclear Technologies LLP; Director Emeritus of the Armed Services YMCA; Director of the U.S. Naval Submarine League; Member of the National Security Advisory Council of the Center for U.S. Global Engagement and a member of the CNA Military Advisory Board; Chairman of the charity J Street Cup Golf; Trustee of Fairhaven United Methodist Church; and Director of other various non-profit organizations. | |
Kathleen A. Dennis (64)
c/o Perkins Coie LLP
Counsel to the Independent Trustees
30 Rockefeller Plaza
New York, NY 10112 | | Trustee | | Since
August
2006 | | President, Cedarwood Associates (mutual fund and investment management consulting) (since July 2006); Chairperson of the Liquidity and Alternatives Sub-Committee of the Investment Committee (since October 2006) and Director or Trustee of various Morgan Stanley Funds (since August 2006); formerly, Senior Managing Director of Victory Capital Management (1993-2006). | | | 91 | | | Director of various non-profit organizations. | |
Nancy C. Everett (62)
c/o Perkins Coie LLP
Counsel to the Independent Trustees
30 Rockefeller Plaza
New York, NY 10112 | | Trustee | | Since
January
2015 | | Chief Executive Officer, Virginia Commonwealth University Investment Company (since November 2015); Owner OBIR, LLC (institutional investment management consulting) (since June 2014); formerly, Managing Director, BlackRock, Inc. (February 2011-December 2013); and Chief Executive Officer, General Motors Asset Management (a/k/a Promark Global Advisors, Inc.) (June 2005-May 2010). | | | 91 | | | Formerly, Member of Virginia Commonwealth University School of Business Foundation (2005-2016); Member of Virginia Commonwealth University Board of Visitors (2013-2015); Member of Committee on Directors for Emerging Markets Growth Fund, Inc. (2007-2010); Chairperson of Performance Equity Management, LLC (2006-2010); and Chairperson, GMAM Absolute Return Strategies Fund, LLC (2006-2010). | |
37
Morgan Stanley Institutional Fund Trust
Annual Report — September 30, 2017
Trustee and Officer Information (unaudited) (cont'd)
Independent Trustees: (cont'd)
Name, Age and Address of
Independent Trustee | | Position(s)
Held with
Registrant | | Length of Time
Served* | | Principal Occupation(s) During Past 5 Years
and Other Relevant Professional Experience | | Number of
Portfolios in
Fund Complex
Overseen by
Independent
Trustee** | | Other Directorships
Held by Independent
Trustee*** | |
Jakki L. Haussler (60)
c/o Perkins Coie LLP
Counsel to the Independent Trustees
30 Rockefeller Plaza
New York, NY 10112 | | Trustee | | Since
January
2015 | | Chairman and Chief Executive Officer, Opus Capital Group (since January 1996); formerly, Director, Capvest Venture Fund, LP (May 2000-December 2011); Partner, Adena Ventures, LP (July 1999-December 2010); Director, The Victory Funds (February 2005-July 2008). | | | 91 | | | Director of Cincinnati Bell Inc. and Member, Audit Committee and Compensation Committee; Director of Northern Kentucky University Foundation and Member, Investment Committee; Member of Chase College of Law Transactional Law Practice Center Board of Advisors; Director of Best Transport; Director of Chase College of Law Board of Visitors; formerly, Member, University of Cincinnati Foundation Investment Committee; Member, Miami University Board of Visitors (2008-2011); Trustee of Victory Funds (2005-2008) and Chairman, Investment Committee (2007-2008) and Member, Service Provider Committee (2005-2008). | |
Dr. Manuel H. Johnson (68)
c/o Johnson Smick
International, Inc.
220 I Street, NE —
Suite 200
Washington, D.C. 20002 | | Trustee | | Since
July
1991 | | Senior Partner, Johnson Smick International, Inc. (consulting firm); Chairperson of the Investment Committee (since October 2006) and Director or Trustee of various Morgan Stanley Funds (since July 1991); Co-Chairman and a founder of the Group of Seven Council (G7C) (international economic commission); formerly, Chairperson of the Audit Committee (July 1991-September 2006), Vice Chairman of the Board of Governors of the Federal Reserve System and Assistant Secretary of the U.S. Treasury. | | | 91 | | | Director of NVR, Inc. (home construction). | |
Joseph J. Kearns (75)
c/o Kearns & Associates LLC
46 E Peninsula Center
#385 Rolling Hills Estates,
CA 90274-3712 | | Trustee | | Since
August
1994 | | President, Kearns & Associates LLC (investment consulting); Chairperson of the Audit Committee (since October 2006) and Director or Trustee of various Morgan Stanley Funds (since August 1994); formerly, Deputy Chairperson of the Audit Committee (July 2003-September 2006) and Chairperson of the Audit Committee of various Morgan Stanley Funds (since August 1994); CFO of the J. Paul Getty Trust. | | | 93 | | | Director of Electro Rent Corporation (equipment leasing). Prior to December 31, 2013, Director of The Ford Family Foundation. | |
38
Morgan Stanley Institutional Fund Trust
Annual Report — September 30, 2017
Trustee and Officer Information (unaudited) (cont'd)
Independent Trustees: (cont'd)
Name, Age and Address of
Independent Trustee | | Position(s)
Held with
Registrant | | Length of Time
Served* | | Principal Occupation(s) During Past 5 Years
and Other Relevant Professional Experience | | Number of
Portfolios in
Fund Complex
Overseen by
Independent
Trustee** | | Other Directorships
Held by Independent
Trustee*** | |
Michael F. Klein (58)
c/o Perkins Coie LLP
Counsel to the Independent Trustees
30 Rockefeller Plaza
New York, NY 10112 | | Trustee | | Since
August
2006 | | Managing Director, Aetos Capital, LLC (since March 2000); Co-President, Aetos Alternatives Management, LLC (since January 2004) and Co-Chief Executive Officer of Aetos Capital LLC (since August 2013); Chairperson of the Fixed Income Sub-Committee of the Investment Committee (since October 2006) and Director or Trustee of various Morgan Stanley Funds (since August 2006); formerly, Managing Director, Morgan Stanley & Co. Inc. and Morgan Stanley Dean Witter Investment Management, President, various Morgan Stanley Funds (June 1998-March 2000) and Principal, Morgan Stanley & Co. Inc. and Morgan Stanley Dean Witter Investment Management (August 1997-December 1999). | | | 90 | | | Director of certain investment funds managed or sponsored by Aetos Capital, LLC; Director of Sanitized AG and Sanitized Marketing AG (specialty chemicals). | |
Patricia Maleski (57)
c/o Perkins Coie LLP
Counsel to the Independent Trustees
30 Rockefeller Plaza
New York, NY 10112 | | Trustee | | Since
January
2017 | | Managing Director, JPMorgan Asset Management (2004-2016); Oversight and Control Head of Fiduciary and Conflicts of Interest Program(2015-2016); Chief Control Officer-Global Asset Management (2013-2015); President, JPMorgan Funds (2010-2013); Chief Administrative Officer (2004-2013); various other positions including Treasurer and Board Liaison (since 2001). | | | 91 | | | None. | |
Michael E. Nugent (81)
522 Fifth Avenue
New York, NY 10036 | | Chair of the Board and Trustee | | Chair of the
Boards since
July 2006 and
Trustee since
July 1991 | | Chair of the Boards of various Morgan Stanley Funds (since July 2006); Chairperson of the Closed-End Fund Committee (since June 2012) and Director or Trustee of various Morgan Stanley Funds (since July 1991); formerly, Chairperson of the Insurance Committee (until July 2006); General Partner, Triumph Capital, L.P. (private investment partnership) (1988-2013). | | | 92 | | | None. | |
W. Allen Reed (70)
c/o Perkins Coie LLP
Counsel to the Independent Trustees
30 Rockefeller Plaza
New York, NY 10112 | | Trustee | | Since
August
2006 | | Chairperson of the Equity Sub-Committee of the Investment Committee (since October 2006) and Director or Trustee of various Morgan Stanley Funds (since August 2006); formerly, President and CEO of General Motors Asset Management; Chairman and Chief Executive Officer of the GM Trust Bank and Corporate Vice President of General Motors Corporation (August 1994-December 2005). | | | 91 | | | Director of Legg Mason, Inc.; formerly, Director of the Auburn University Foundation (2010-2015). | |
Fergus Reid (85)
c/o Joe Pietryka, Inc.
85 Charles Colman Blvd.
Pawling, NY 12564 | | Trustee | | Since
June
1992 | | Chairman, Joe Pietryka, Inc.; Chairperson of the Governance Committee and Director or Trustee of various Morgan Stanley Funds (since June 1992). | | | 92 | | | Formerly, Trustee and Director of certain investment companies in the JP Morgan Fund Complex managed by JP Morgan Investment Management Inc. (1987-2012). | |
* This is the earliest date the Trustee began serving the Morgan Stanley Funds. Each Trustee serves an indefinite term, until his or her successor is elected.
** The Fund Complex includes (as of December 31, 2016) all open-end and closed-end funds (including all of their portfolios) advised by Morgan Stanley Investment Management Inc. (the "Adviser") and any funds that have an adviser that is an affiliated person of the Adviser (including, but not limited to, Morgan Stanley AIP GP LP).
*** This includes any directorships at public companies and registered investment companies held by the Trustee at any time during the past five years.
39
Morgan Stanley Institutional Fund Trust
Annual Report — September 30, 2017
Trustee and Officer Information (unaudited) (cont'd)
Executive Officers:
Name, Age and Address of Executive Officer | | Position(s) Held
with
Registrant | | Length of
Time Served* | | Principal Occupation(s) During Past 5 Years | |
John H. Gernon (54)
522 Fifth Avenue
New York, NY 10036 | | President and
Principal
Executive
Officer | | Since
September
2013 | | President and Principal Executive Officer of the Equity and Fixed Income Funds and the Morgan Stanley AIP Funds (since September 2013) and the Liquidity Funds and various money market funds (since May 2014) in the Fund Complex; Managing Director of the Adviser; Head of Product (since 2006). | |
Timothy J. Knierim (58)
522 Fifth Avenue
New York, NY 10036 | | Chief
Compliance
Officer | | Since
December
2016 | | Managing Director of the Adviser and various entities affiliated with the Adviser; Chief Compliance Officer of various Morgan Stanley Funds and the Adviser (since December 2016) and Chief Compliance Officer of Morgan Stanley AIP GP LP (since 2014). Formerly, Managing Director and Deputy Chief Compliance Officer of the Adviser (2014-2016); and formerly, Chief Compliance Officer of Prudential Investment Management, Inc. (2007-2014). | |
Francis J. Smith (52)
522 Fifth Avenue
New York, NY 10036 | | Treasurer and
Principal
Financial
Officer | | Treasurer
since July 2003 and Principal Financial Officer since September 2002 | | Manging Director of the Adviser and various entities affiliated with the Adviser; Treasurer (since July 2003) and Principal Financial Officer of various Morgan Stanley Funds (since September 2002). | |
Mary E. Mullin (50)
522 Fifth Avenue
New York, NY 10036 | | Secretary | | Since
June
1999 | | Executive Director of the Adviser; Secretary of various Morgan Stanley Funds (since June 1999). | |
Michael J. Key (38)
522 Fifth Avenue
New York, NY 10036 | | Vice President | | Since
June
2017 | | Vice President of the Equity and Fixed Income Funds, Liquidity Funds, various money market funds and the Morgan Stanley AIP Funds in the Fund Complex (since June 2017); Executive Director of the Adviser; Head of Product Development for Equity and Fixed Income Funds (since August 2013). | |
* This is the earliest date the officer began serving the Morgan Stanley Funds. Each officer serves a one-year term, until his or her successor is elected and qualifies.
40
Morgan Stanley Institutional Fund Trust
Annual Report — September 30, 2017
Adviser and Administrator
Morgan Stanley Investment Management Inc.
522 Fifth Avenue
New York, New York 10036
Distributor
Morgan Stanley Distribution, Inc.
522 Fifth Avenue
New York, New York 10036
Dividend Disbursing and Transfer Agent
Boston Financial Data Services, Inc.
2000 Crown Colony Drive
Quincy, Massachusetts 02169
Custodian
State Street Bank and Trust Company
One Lincoln Street
Boston, Massachusetts 02111
Legal Counsel
Dechert LLP
1095 Avenue of the Americas
New York, New York 10036
Counsel to the Independent Trustees
Perkins Coie LLP
30 Rockefeller Plaza
New York, New York 10112
Independent Registered Public Accounting Firm
Ernst & Young LLP
200 Clarendon Street
Boston, Massachusetts 02116
Reporting to Shareholders
Each Morgan Stanley Fund provides a complete schedule of portfolio holdings in its semi-annual and annual reports within 60 days of the end of the fund's second and fourth fiscal quarters. The semi-annual and annual reports are filed electronically with the Securities and Exchange Commission (SEC) on Form N-CSRS and Form N-CSR, respectively. Morgan Stanley also delivers the semi-annual and annual reports to fund shareholders and makes these reports available on its public website, www.morganstanley.com/im. Each Morgan Stanley fund also files a complete schedule of portfolio holdings with the SEC for the fund's first and third fiscal quarters on Form N-Q. Morgan Stanley does not deliver the reports for the first and third fiscal quarters to shareholders, nor are the reports posted to the Morgan Stanley public website. You may, however, obtain the Form N-Q filings (as well as the Form N-CSR and N-CSRS filings) by accessing the SEC's website, www.sec.gov. You may also review and copy them at the SEC's Public Reference Room in Washington, DC. Information on the operation of the SEC's Public Reference Room may be obtained by calling the SEC toll free at 1 (800) SEC-0330. You can also request copies of these materials, upon payment of a duplicating fee, by electronic request at the SEC's email address (publicinfo@sec.gov) or by writing to the SEC's Public Reference Section, Washington, D.C. 20549-1520.
Proxy Voting Policies and Procedures and Proxy Voting Record
You may obtain a copy of the Trust's Proxy Voting Policy and Procedures and information regarding how the Trust voted proxies relating to portfolio securities during the most recent twelve-month period ended June 30, without charge, upon request, by calling toll free 1 (800) 548-7786 or by visiting our website at www.morganstanley.com/im. This information is also available on the SEC's website at www.sec.gov.
This report is authorized for distribution only when preceded or accompanied by a prospectus or summary prospectus of the applicable Fund of Morgan Stanley Institutional Fund Trust, which describes in detail the Fund's investment policies, risks, fees and expenses. Please read the prospectus carefully before you invest or send money. For additional information, including information regarding the investments comprising the Fund, please visit our website at www.morganstanley.com/im or call toll free 1 (800) 548-7786.
41
Printed in U.S.A.
This Report has been prepared for shareholders and may be distributed to others only if preceded or accompanied by a current prospectus.
Morgan Stanley Investment Management Inc.
522 Fifth Avenue
New York, New York 10036
© 2017 Morgan Stanley. Morgan Stanley Distribution, Inc.

IFTHYANN
1934330 EXP 11.30.18

Morgan Stanley Institutional Fund Trust
Mid Cap Growth Portfolio
Annual Report
September 30, 2017

Morgan Stanley Institutional Fund Trust
Annual Report — September 30, 2017
Shareholders' Letter | | | 2 | | |
Expense Example | | | 3 | | |
Investment Overview | | | 4 | | |
Portfolio of Investments | | | 6 | | |
Statement of Assets and Liabilities | | | 8 | | |
Statement of Operations | | | 10 | | |
Statements of Changes in Net Assets | | | 11 | | |
Financial Highlights | | | 12 | | |
Notes to Financial Statements | | | 17 | | |
Report of Independent Registered Public Accounting Firm | | | 27 | | |
Investment Advisory Agreement Approval | | | 28 | | |
Federal Tax Notice | | | 30 | | |
Privacy Notice | | | 31 | | |
Trustee and Officer Information | | | 34 | | |
This report is authorized for distribution only when preceded or accompanied by a prospectus or summary prospectus of the applicable Fund of the Morgan Stanley Institutional Fund Trust. To receive a prospectus and/or statement of additional information (SAI), which contains more complete information such as investment objectives, charges, expenses, policies for voting proxies, risk considerations, and describes in detail each of the Fund's investment policies to the prospective investor, please call toll free 1 (800) 548-7786. Please read the prospectuses carefully before you invest or send money.
Additionally, you can access information about the Fund, including performance, characteristics, and investment team commentary, through Morgan Stanley Investment Management's website: www.morganstanley.com/im.
Market forecasts provided in this report may not necessarily come to pass. There is no guarantee that any sectors mentioned will continue to perform as discussed herein or that securities in such sectors will be held by the Fund in the future. There is no assurance that a fund will achieve its investment objective. Funds are subject to market risk, which is the possibility that market values of securities owned by the Fund will decline and, therefore, the value of the Fund's shares may be less than what you paid for them. Accordingly, you can lose money investing in this Fund. Please see the prospectus for more complete information on investment risks.
1
Morgan Stanley Institutional Fund Trust
Annual Report — September 30, 2017
Shareholders' Letter (unaudited)
Dear Shareholders,
We are pleased to provide this Annual report, in which you will learn how your investment in Mid Cap Growth Portfolio (the "Fund") performed during the latest twelve-month period.
Morgan Stanley Investment Management is a client-centric, investor-led organization. Our global presence, intellectual capital, and breadth of products and services enable us to partner with investors to meet the evolving challenges of today's financial markets. We aim to deliver superior investment service and to empower our clients to make the informed decisions that help them reach their investment goals.
As always, we thank you for selecting Morgan Stanley Investment Management, and look forward to working with you in the months and years ahead.
Sincerely,

John H. Gernon
President and Principal Executive Officer
October 2017
2
Morgan Stanley Institutional Fund Trust
Annual Report — September 30, 2017
Expense Example (unaudited)
Mid Cap Growth Portfolio
As a shareholder of the Fund, you may incur two types of costs: (1) transactional costs, including sales charge (loads) on purchase payments; and (2) ongoing costs, which may include advisory fees, administration fees, distribution and shareholder services fees; and other Fund expenses. This example is intended to help you understand your ongoing costs (in dollars) of investing in the Fund and to compare these costs with the ongoing costs of investing in other mutual funds.
This example is based on an investment of $1,000 invested at the beginning of the six-month period ended September 30, 2017 and held for the entire six-month period.
Actual Expenses
The table below provides information about actual account values and actual expenses. You may use the information in this table, together with the amount you invested, to estimate the expenses that you paid over the period. Simply divide your account value by $1,000 (for example, an $8,600 account value divided by $1,000 = 8.6), then multiply the result by the number in the table under the heading entitled "Actual Expenses Paid During Period" to estimate the expenses you paid on your account during this period.
Hypothetical Example for Comparison Purposes
The table below provides information about hypothetical account values and hypothetical expenses based on the Fund's actual expense ratio and an assumed rate of return of 5% per year before expenses, which is not the Fund's actual return. The hypothetical account values and expenses may not be used to estimate the actual ending account balance or expenses you paid for the period. You may use this information to compare the ongoing costs of investing in the Fund and other funds. To do so, compare this 5% hypothetical example with the 5% hypothetical examples that appear in the shareholder reports of the other funds.
Please note that the expenses shown in the table are meant to highlight your ongoing costs only and do not reflect any transactional costs, such as sales charges (loads, if applicable). Therefore, the information for each class in the table is useful in comparing ongoing costs only, and will not help you determine the relative total costs of owning different funds. In addition, if these transactional costs were included, your costs would have been higher.
| | | Beginning
Account
Value
4/1/17 | | Actual Ending
Account
Value
9/30/17 | | Hypothetical
Ending Account
Value | | Actual
Expenses
Paid
During
Period | | Hypothetical
Expenses Paid
During Period | | Net
Expense
Ratio
During
Period*** | |
Mid Cap Growth Portfolio Class I | | $ | 1,000.00 | | | $ | 1,159.60 | | | $ | 1,022.06 | | | $ | 3.25 | * | | $ | 3.04 | * | | | 0.60 | % | |
Mid Cap Growth Portfolio Class A | | | 1,000.00 | | | | 1,158.10 | | | | 1,020.46 | | | | 4.98 | * | | | 4.66 | * | | | 0.92 | | |
Mid Cap Growth Portfolio Class L | | | 1,000.00 | | | | 1,154.20 | | | | 1,017.00 | | | | 8.69 | * | | | 8.14 | * | | | 1.61 | | |
Mid Cap Growth Portfolio Class C | | | 1,000.00 | | | | 1,026.40 | | | | 1,010.36 | | | | 6.43 | ** | | | 6.38 | ** | | | 1.90 | | |
Mid Cap Growth Portfolio Class IS | | | 1,000.00 | | | | 1,159.80 | | | | 1,021.86 | | | | 3.47 | * | | | 3.24 | * | | | 0.64 | | |
* Expenses are calculated using each Fund Class' annualized net expense ratio (as disclosed), multiplied by the average account value over the period, and multiplied by 183/365 (to reflect the most recent one-half year period).
** Expenses are calculated using the Fund Class' annualized net expense ratio (as disclosed), multiplied by the average account value over the period, and multiplied by 122/365 (to reflect the actual days in the period).
*** Annualized.
3
Morgan Stanley Institutional Fund Trust
Annual Report — September 30, 2017
Investment Overview (unaudited)
Mid Cap Growth Portfolio
The Fund seeks long-term capital growth.
Performance
For the fiscal year ended September 30, 2017, the Fund's Class I shares had a total return based on net asset value and reinvestment of distributions per share of 16.16%, net of fees. The Fund's Class I shares underperformed against the Fund's benchmark, the Russell Midcap® Growth Index (the "Index"), which returned 17.82%.
Factors Affecting Performance
• The 12-month period was largely supportive to equity prices. Optimism for stocks was fueled by steady economic growth in the U.S. and rebounding growth abroad, healthy corporate earnings reports and expectations that the Trump administration's fiscal agenda could boost the economy and inflation as the Federal Reserve continued to wind down its monetary stimulus.
• Eight of the 11 sectors in the Index delivered double-digit gains over the period, led by the utilities, financials and information technology (IT) sectors. Conversely, the energy and consumer staples sectors recorded losses within the Index while the consumer discretionary sector was the third-weakest sector.
• The Growth Team seeks high-quality companies, which we define primarily as those with sustainable competitive advantages. We manage focused portfolios that are highly differentiated from the benchmark, with securities weighted on our assessment of the quality of the company and our conviction. The value added or detracted in any period of time will result from stock selection, given our philosophy and process.
• The long-term investment horizon and conviction-weighted investment approach embraced by the team since 1998 can result in periods of performance deviation from the benchmark and peers. The Fund underperformed the benchmark this period primarily due to unfavorable stock selection. However, sector allocations contributed positively.
• Stock selection in the IT sector drove nearly all of the Fund's relative underperformance. The three largest detractors in the Fund for the period were
from the IT sector: a cloud-based storage services company, a global communications platform and an online survey developer. An overweight position in the sector contributed positively to performance, somewhat mitigating the negative impact of stock selection there.
• Stock selection in the industrials sector detracted from relative returns, to a lesser extent than the IT sector.
• The consumer discretionary sector was the largest positive contributor to performance, with relative gains from both stock selection and an underweight allocation in the sector. An electric car maker was the leading contributor within the sector and was also the top contributor in the overall Fund for the period.
• A significant underweight in the consumer staples sector and no exposure to the energy sector were advantageous to relative results, as these areas were the two weakest-performing segments in the Index for the period.
Management Strategies
• Our team continues to focus on bottom-up stock selection and the long-term outlook for companies owned in the Fund; accordingly, we have had very little turnover in the Fund to date, as our ongoing work reaffirms our assessment of quality and competitive advantage in the names we own.
• As a team, we believe having a market outlook can be an anchor. Our focus is on assessing company prospects over three to five years, and owning a portfolio of what we believe are high-quality companies with diverse business drivers not tied to a particular market environment.
• We look for high-quality growth companies that we believe have these attributes: sustainable competitive advantages, above-average business visibility, rising return on invested capital, strong free cash flow generation and a favorable risk/reward profile. We find these companies through intense fundamental research. Our emphasis is on secular growth, and as a result, short-term market events are not as meaningful in the stock selection process.
4
Morgan Stanley Institutional Fund Trust
Annual Report — September 30, 2017
Investment Overview (unaudited) (cont'd)
Mid Cap Growth Portfolio
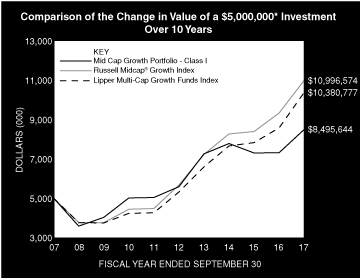
* Minimum Investment
In accordance with SEC regulations, the Fund's performance shown assumes that all recurring fees (including management fees) were deducted and all dividends and distributions were reinvested. The performance of Class A, Class L, Class C and Class IS shares will vary from the performance of Class I shares based upon their different inception dates and will be negatively impacted by additional fees assessed to those classes (where applicable).
Performance Compared to the Russell Midcap® Growth Index(1) and the Lipper Multi-Cap Growth Funds Index(2)
| | | Period Ended September 30, 2017
Total Returns(3) | |
| | | | | Average Annual | |
| | | One
Year | | Five
Years | | Ten
Years | | Since
Inception(9) | |
Fund — Class I Shares
w/o sales charges(4) | | | 16.16 | % | | | 8.75 | % | | | 5.44 | % | | | 11.81 | % | |
Fund — Class A Shares
w/o sales charges(5) | | | 15.85 | | | | 8.46 | | | | 5.17 | | | | 9.15 | | |
Fund — Class A Shares with
maximum 5.25% sales charges(5) | | | 9.78 | | | | 7.30 | | | | 4.60 | | | | 8.86 | | |
Fund — Class L Shares
w/o sales charges(6) | | | 15.07 | | | | 7.83 | | | | — | | | | 8.05 | | |
Fund — Class C Shares
w/o sales charges(8) | | | — | | | | — | | | | — | | | | 2.64 | | |
Fund — Class C Shares with
maximum 1.00% deferred
sales charges(8) | | | — | | | | — | | | | — | | | | 1.64 | | |
Fund — Class IS Shares
w/o sales charges(7) | | | 16.24 | | | | — | | | | — | | | | 4.39 | | |
Russell Midcap® Growth Index | | | 17.82 | | | | 14.18 | | | | 8.20 | | | | 10.43 | | |
Lipper Multi-Cap Growth Funds Index | | | 21.03 | | | | 14.32 | | | | 7.58 | | | | 9.35 | | |
Performance data quoted represents past performance, which is no guarantee of future results, and current performance may be lower or higher than the figures shown. Performance assumes that all dividends and distributions, if any, were reinvested. Periods less than one year are not annualized. For the most recent month-end performance figures, please visit www.morganstanley.com/im. Investment returns and principal value will fluctuate so that Fund shares, when redeemed, may be worth more or less than their original cost. Total returns do not reflect the deduction of taxes that a shareholder would pay on Fund distributions or the redemption of Fund shares. Performance of share classes will vary due to differences in sales charges and expenses.
(1) The Russell Midcap® Growth Index measures the performance of the mid-cap growth segment of the U.S. equity universe. It includes those Russell Midcap® Index companies with higher price-to-book ratios and higher forecasted growth values. The Russell Midcap® Index is a subset of the Russell 1000® Index and includes approximately 800 of the smallest securities in the Russell 1000® Index, which in turn consists of approximately 1,000 of the largest U.S. securities based on a combination of market capitalization and current index membership. The Index is unmanaged and its returns do not include any sales charges or fees. Such costs would lower performance. It is not possible to invest directly in an index.
(2) The Lipper Multi-Cap Growth Funds Index is an equally weighted performance index of the largest qualifying funds (based on net assets) in the Lipper Multi-Cap Growth Funds classification. The index, which is adjusted for capital gains distributions and income dividends, is unmanaged and should not be considered an investment. There are currently 30 funds represented in this Index. As of the date of this report, the Fund was in the Lipper Multi-Cap Growth Funds classification.
(3) Total returns for the Fund reflect expenses waived and/or reimbursed, if applicable, by the Adviser. Without such waivers and/or reimbursements, total returns would have been lower.
(4) Commenced operations on March 30, 1990.
(5) Commenced operations on January 31, 1997.
(6) Commenced operations on June 14, 2012.
(7) Commenced operations on September 13, 2013.
(8) Commenced operations on May 31, 2017.
(9) For comparative purposes, average annual since inception returns listed for the Indexes refer to the inception date of Class I of the Fund, not the inception of the Indexes.
5
Morgan Stanley Institutional Fund Trust
Annual Report — September 30, 2017
Portfolio of Investments
Mid Cap Growth Portfolio
| | | Shares | | Value
(000) | |
Common Stocks (97.6%) | |
Aerospace & Defense (4.9%) | |
TransDigm Group, Inc. | | | 114,721 | | | $ | 29,328 | | |
Biotechnology (1.7%) | |
Alnylam Pharmaceuticals, Inc. (a) | | | 47,218 | | | | 5,548 | | |
Intrexon Corp. (a)(b) | | | 78,851 | | | | 1,499 | | |
Juno Therapeutics, Inc. (a) | | | 73,119 | | | | 3,280 | | |
| | | | 10,327 | | |
Capital Markets (7.6%) | |
MSCI, Inc. | | | 184,739 | | | | 21,596 | | |
S&P Global, Inc. | | | 155,443 | | | | 24,297 | | |
| | | | 45,893 | | |
Construction Materials (3.1%) | |
Martin Marietta Materials, Inc. | | | 45,814 | | | | 9,448 | | |
Vulcan Materials Co. | | | 79,080 | | | | 9,458 | | |
| | | | 18,906 | | |
Consumer Finance (1.1%) | |
LendingClub Corp. (a) | | | 1,115,314 | | | | 6,792 | | |
Electronic Equipment, Instruments & Components (0.7%) | |
Cognex Corp. | | | 36,182 | | | | 3,990 | | |
Health Care Equipment & Supplies (4.7%) | |
DexCom, Inc. (a)(b) | | | 135,983 | | | | 6,653 | | |
Intuitive Surgical, Inc. (a) | | | 20,760 | | | | 21,713 | | |
| | | | 28,366 | | |
Health Care Technology (11.6%) | |
athenahealth, Inc. (a) | | | 310,976 | | | | 38,673 | | |
Veeva Systems, Inc., Class A (a) | | | 552,930 | | | | 31,191 | | |
| | | | 69,864 | | |
Information Technology Services (3.5%) | |
Gartner, Inc. (a) | | | 171,829 | | | | 21,377 | | |
Internet & Direct Marketing Retail (3.6%) | |
Expedia, Inc. | | | 149,698 | | | | 21,548 | | |
Internet Software & Services (14.1%) | |
Angi Homeservices, Inc., Class A | | | 1,728,934 | | | | 21,543 | | |
Survey Monkey, Inc. (a)(c)(d)(e)
(acquisition cost — $28,952;
acquired 11/25/14) | | | 1,760,030 | | | | 11,528 | | |
Twitter, Inc. (a) | | | 1,325,499 | | | | 22,361 | | |
Zillow Group, Inc., Class C (a) | | | 741,804 | | | | 29,828 | | |
| | | | 85,260 | | |
Life Sciences Tools & Services (6.1%) | |
Illumina, Inc. (a) | | | 183,358 | | | | 36,525 | | |
Machinery (6.7%) | |
Fortive Corp. | | | 89,904 | | | | 6,364 | | |
Welbilt, Inc. (a) | | | 1,469,588 | | | | 33,874 | | |
| | | | 40,238 | | |
Multi-Line Retail (3.0%) | |
Dollar Tree, Inc. (a) | | | 205,393 | | | | 17,832 | | |
| | | Shares | | Value
(000) | |
Professional Services (7.1%) | |
IHS Markit Ltd. (a) | | | 472,079 | | | $ | 20,809 | | |
Verisk Analytics, Inc. (a) | | | 265,369 | | | | 22,076 | | |
| | | | 42,885 | | |
Software (16.0%) | |
Atlassian Corp., PLC, Class A (United Kingdom) (a) | | | 183,864 | | | | 6,463 | | |
ServiceNow, Inc. (a) | | | 185,986 | | | | 21,859 | | |
Snap, Inc., Class A (a)(b) | | | 119,653 | | | | 1,740 | | |
Splunk, Inc. (a) | | | 319,963 | | | | 21,255 | | |
Take-Two Interactive Software, Inc. (a) | | | 231,381 | | | | 23,654 | | |
Workday, Inc., Class A (a) | | | 204,408 | | | | 21,542 | | |
| | | | 96,513 | | |
Specialty Retail (1.1%) | |
L Brands, Inc. | | | 154,640 | | | | 6,435 | | |
Textiles, Apparel & Luxury Goods (1.0%) | |
Under Armour, Inc., Class C (a)(b) | | | 382,437 | | | | 5,744 | | |
Total Common Stocks (Cost $498,037) | | | 587,823 | | |
Short-Term Investments (8.3%) | |
Securities held as Collateral on Loaned Securities (5.5%) | |
Investment Company (4.6%) | |
Morgan Stanley Institutional Liquidity
Funds — Treasury Securities Portfolio —
Institutional Class (See Note G) | | | 27,615,812 | | | | 27,616 | | |
| | | Face
Amount
(000) | | | |
Repurchase Agreement (0.9%) | |
Merrill Lynch & Co., Inc., (1.07%,
dated 9/29/17, due 10/2/17;
proceeds $5,699; fully collateralized
by a U.S. Government agency;
4.00% due 4/20/47; valued at $5,812) | | $ | 5,698 | | | | 5,698 | | |
Total Securities held as Collateral on
Loaned Securities (Cost $33,314) | | | 33,314 | | |
| | | Shares | | | |
Investment Company (2.8%) | |
Morgan Stanley Institutional Liquidity
Funds — Treasury Securities Portfolio —
Institutional Class (See Note G)
(Cost $17,125) | | | 17,124,818 | | | | 17,125 | | |
Total Short-Term Investments (Cost $50,439) | | | 50,439 | | |
Total Investments Excluding Purchased
Options (105.9%) (Cost $548,476) | | | 638,262 | | |
Total Purchased Options Outstanding (0.1%)
(Cost $928) | | | 259 | | |
Total Investments (106.0%) (Cost $549,404)
Including $31,563 of Securities Loaned (f) | | | 638,521 | | |
| Liabilities in Excess of Other Assets (–6.0%) | | | (35,932 | ) | |
Net Assets (100.0%) | | $ | 602,589 | | |
(a) Non-income producing security.
(b) All or a portion of this security was on loan at September 30, 2017.
The accompanying notes are an integral part of the financial statements.
6
Morgan Stanley Institutional Fund Trust
Annual Report — September 30, 2017
Portfolio of Investments (cont'd)
Mid Cap Growth Portfolio
(c) At September 30, 2017, the Fund held a fair valued security valued at approximately $11,528,000, representing 1.9% of net assets. This security has been fair valued as determined in good faith under procedures established by and under the general supervision of the Trust's Trustees.
(d) Security has been deemed illiquid at September 30, 2017.
(e) Security cannot be offered for public resale without first being registered under the Securities Act of 1933 and related rules ("restricted security"). Acquisition date represents the day on which an enforceable right to acquire such security is obtained and is presented along with related cost in the security description. The Fund has registration rights for certain restricted securities. Any costs related to such registration are borne by the issuer. The aggregate value of restricted securities (excluding 144A holdings) at September 30, 2017, amounts to approximately $11,528,000 and represents 1.9% of net assets.
(f) At September 30, 2017, the aggregate cost for federal income tax purposes is approximately $572,896,000. The aggregate gross unrealized appreciation is approximately $105,652,000 and the aggregate gross unrealized depreciation is approximately $40,026,000, resulting in net unrealized appreciation of approximately $65,626,000.
Call Options Purchased:
The Fund had the following call options purchased open at September 30, 2017:
Counterparty | | Description | | Strike
Price | | Expiration
Date | | Number of
Contracts | | Notional
Amount
(000) | | Value
(000) | | Premiums
Paid
(000) | | Unrealized
Appreciation
(Depreciation)
(000) | |
Royal Bank of Scotland | | USD/CNH | | CNH | 7.55 | | | Aug-18 | | | 114,738,765 | | | | 114,739 | | | $ | 258 | | | $ | 608 | | | $ | (350 | ) | |
Royal Bank of Scotland | | USD/CNY | | CNY | 7.40 | | | Nov-17 | | | 95,336,273 | | | | 95,336 | | | | 1 | | | | 320 | | | | (319 | ) | |
| | | | | | | | | | | | | $ | 259 | | | $ | 928 | | | $ | (669 | ) | |
CNH — Chinese Yuan Renminbi Offshore
CNY — Chinese Yuan Renminbi
USD — United States Dollar
Portfolio Composition*
Classification | | Percentage of
Total Investments | |
Other** | | | 31.0 | % | |
Software | | | 16.0 | | |
Internet Software & Services | | | 14.1 | | |
Health Care Technology | | | 11.5 | | |
Capital Markets | | | 7.6 | | |
Professional Services | | | 7.1 | | |
Machinery | | | 6.7 | | |
Life Sciences Tools & Services | | | 6.0 | | |
Total Investments | | | 100.0 | % | |
* Percentages indicated are based upon total investments (excluding Securities held as Collateral on Loaned Securities) as of September 30, 2017.
** Industries and/or investment types representing less than 5% of total investments.
The accompanying notes are an integral part of the financial statements.
7
Morgan Stanley Institutional Fund Trust
Annual Report — September 30, 2017
Statement of Assets and Liabilities | | September 30, 2017
(000) | |
Assets: | |
Investments in Securities of Unaffiliated Issuers, at Value(1) (Cost $504,663) | | $ | 593,780 | | |
Investment in Security of Affiliated Issuer, at Value (Cost $44,741) | | | 44,741 | | |
Total Investments in Securities, at Value (Cost $549,404) | | | 638,521 | | |
Cash | | | 208 | | |
Dividends Receivable | | | 1,005 | | |
Receivable for Fund Shares Sold | | | 130 | | |
Receivable from Securities Lending | | | 52 | | |
Receivable from Affiliate | | | 17 | | |
Other Assets | | | 305 | | |
Total Assets | | | 640,238 | | |
Liabilities: | |
Collateral on Securities Loaned, at Value | | | 33,522 | | |
Payable for Fund Shares Redeemed | | | 1,105 | | |
Payable for Investments Purchased | | | 1,029 | | |
Payable for Advisory Fees | | | 765 | | |
Due to Broker | | | 470 | | |
Payable for Sub Transfer Agency Fees — Class I | | | 91 | | |
Payable for Sub Transfer Agency Fees — Class A | | | 67 | | |
Payable for Sub Transfer Agency Fees — Class L | | | 3 | | |
Payable for Sub Transfer Agency Fees — Class C | | | — | @ | |
Payable for Trustees' Fees and Expenses | | | 107 | | |
Payable for Shareholder Services Fees — Class A | | | 61 | | |
Payable for Distribution and Shareholder Services Fees — Class L | | | 5 | | |
Payable for Distribution and Shareholder Services Fees — Class C | | | — | @ | |
Payable for Administration Fees | | | 40 | | |
Payable for Professional Fees | | | 35 | | |
Payable for Transfer Agency Fees — Class I | | | 9 | | |
Payable for Transfer Agency Fees — Class A | | | 17 | | |
Payable for Transfer Agency Fees — Class L | | | 1 | | |
Payable for Transfer Agency Fees — Class C | | | — | @ | |
Payable for Transfer Agency Fees — Class IS | | | 2 | | |
Payable for Custodian Fees | | | 11 | | |
Other Liabilities | | | 309 | | |
Total Liabilities | | | 37,649 | | |
Net Assets | | $ | 602,589 | | |
Net Assets Consist Of: | |
Paid-in-Capital | | $ | 318,846 | | |
Accumulated Net Investment Loss | | | (3,386 | ) | |
Accumulated Undistributed Net Realized Gain | | | 198,012 | | |
Unrealized Appreciation (Depreciation) on: | |
Investments | | | 89,117 | | |
Net Assets | | $ | 602,589 | | |
The accompanying notes are an integral part of the financial statements.
8
Morgan Stanley Institutional Fund Trust
Annual Report — September 30, 2017
Statement of Assets and Liabilities (cont'd) | | September 30, 2017
(000) | |
CLASS I: | |
Net Assets | | $ | 242,140 | | |
| Shares Outstanding (unlimited number of shares authorized, no par value) (not in 000's) | | | 10,857,169 | | |
Net Asset Value, Offering and Redemption Price Per Share | | $ | 22.30 | | |
CLASS A: | |
Net Assets | | $ | 289,123 | | |
| Shares Outstanding (unlimited number of shares authorized, no par value) (not in 000's) | | | 14,515,678 | | |
Net Asset Value, Redemption Price Per Share | | $ | 19.92 | | |
Maximum Sales Load | | | 5.25 | % | |
Maximum Sales Charge | | $ | 1.10 | | |
Maximum Offering Price Per Share | | $ | 21.02 | | |
CLASS L: | |
Net Assets | | $ | 8,091 | | |
| Shares Outstanding (unlimited number of shares authorized, no par value) (not in 000's) | | | 430,420 | | |
Net Asset Value, Offering and Redemption Price Per Share | | $ | 18.79 | | |
CLASS C: | |
Net Assets | | $ | 10 | | |
| Shares Outstanding (unlimited number of shares authorized, no par value) (not in 000's) | | | 517 | | |
Net Asset Value, Offering and Redemption Price Per Share | | $ | 19.85 | | |
CLASS IS: | |
Net Assets | | $ | 63,225 | | |
| Shares Outstanding (unlimited number of shares authorized, no par value) (not in 000's) | | | 2,818,987 | | |
Net Asset Value, Offering and Redemption Price Per Share | | $ | 22.43 | | |
(1) Including:
Securities on Loan, at Value: | | $ | 31,563 | | |
@ Amount is less than $500.
The accompanying notes are an integral part of the financial statements.
9
Morgan Stanley Institutional Fund Trust
Annual Report — September 30, 2017
Statement of Operations | | Year Ended
September 30, 2017
(000) | |
Investment Income: | |
Dividends from Securities of Unaffiliated Issuers | | $ | 4,983 | | |
Income from Securities Loaned — Net | | | 1,384 | | |
Dividends from Security of Affiliated Issuer (Note G) | | | 142 | | |
Total Investment Income | | | 6,509 | | |
Expenses: | |
Advisory Fees (Note B) | | | 3,703 | | |
Shareholder Services Fees — Class A (Note D) | | | 842 | | |
Distribution and Shareholder Services Fees — Class L (Note D) | | | 62 | | |
Distribution and Shareholder Services Fees — Class C (Note D) | | | — | @ | |
Sub Transfer Agency Fees — Class I | | | 232 | | |
Sub Transfer Agency Fees — Class A | | | 353 | | |
Sub Transfer Agency Fees — Class L | | | 16 | | |
Sub Transfer Agency Fees — Class C | | | — | @ | |
Administration Fees (Note C) | | | 593 | | |
Registration Fees | | | 128 | | |
Professional Fees | | | 126 | | |
Transfer Agency Fees — Class I (Note E) | | | 28 | | |
Transfer Agency Fees — Class A (Note E) | | | 56 | | |
Transfer Agency Fees — Class L (Note E) | | | 5 | | |
Transfer Agency Fees — Class C (Note E) | | | — | @ | |
Transfer Agency Fees — Class IS (Note E) | | | 10 | | |
Shareholder Reporting Fees | | | 37 | | |
Custodian Fees (Note F) | | | 26 | | |
Trustees' Fees and Expenses | | | 24 | | |
Pricing Fees | | | 3 | | |
Other Expenses | | | 82 | | |
Expenses Before Non Operating Expenses | | | 6,326 | | |
Bank Overdraft Expense | | | 32 | | |
Total Expenses | | | 6,358 | | |
Rebate from Morgan Stanley Affiliate (Note G) | | | (47 | ) | |
Reimbursement of Class Specific Expenses — Class L (Note B) | | | (1 | ) | |
Reimbursement of Class Specific Expenses — Class C (Note B) | | | (— | @) | |
Net Expenses | | | 6,310 | | |
Net Investment Income | | | 199 | | |
Realized Gain: | |
Investments Sold | | | 311,792 | | |
Foreign Currency Transactions | | | 15 | | |
Net Realized Gain | | | 311,807 | | |
Change in Unrealized Appreciation (Depreciation): | |
Investments | | | (249,571 | ) | |
Net Realized Gain and Change in Unrealized Appreciation (Depreciation) | | | 62,236 | | |
Net Increase in Net Assets Resulting from Operations | | $ | 62,435 | | |
@ Amount is less than $500.
The accompanying notes are an integral part of the financial statements.
10
Morgan Stanley Institutional Fund Trust
Annual Report — September 30, 2017
Statements of Changes in Net Assets | | Year Ended
September 30, 2017
(000) | | Year Ended
September 30, 2016
(000) | |
Increase (Decrease) in Net Assets: | |
Operations: | |
Net Investment Income | | $ | 199 | | | $ | 1,385 | | |
Net Realized Gain | | | 311,807 | | | | 298,773 | | |
Net Change in Unrealized Appreciation (Depreciation) | | | (249,571 | ) | | | (417,181 | ) | |
Net Increase (Decrease) in Net Assets Resulting from Operations | | | 62,435 | | | | (117,023 | ) | |
Distributions from and/or in Excess of: | |
Class I: | |
Net Realized Gain | | | (158,083 | ) | | | (213,404 | ) | |
Class A: | |
Net Realized Gain | | | (165,422 | ) | | | (107,999 | ) | |
Class L: | |
Net Realized Gain | | | (3,634 | ) | | | (1,556 | ) | |
Class IS: | |
Net Realized Gain | | | (24,994 | ) | | | (132,809 | ) | |
Total Distributions | | | (352,133 | ) | | | (455,768 | ) | |
Capital Share Transactions:(1) | |
Class I: | |
Subscribed | | | 37,850 | | | | 99,014 | | |
Distributions Reinvested | | | 151,514 | | | | 195,833 | | |
Redeemed | | | (373,738 | ) | | | (1,632,976 | ) | |
Class A: | |
Subscribed | | | 28,273 | | | | 46,654 | | |
Distributions Reinvested | | | 163,817 | | | | 104,817 | | |
Redeemed | | | (250,783 | ) | | | (546,761 | ) | |
Class L: | |
Distributions Reinvested | | | 3,515 | | | | 1,516 | | |
Redeemed | | | (2,689 | ) | | | (2,529 | ) | |
Class C: | |
Subscribed | | | 10 | * | | | — | | |
Class IS: | |
Subscribed | | | 38,668 | | | | 206,340 | | |
Distributions Reinvested | | | 24,876 | | | | 123,359 | | |
Redeemed | | | (202,040 | ) | | | (1,010,792 | ) | |
Net Decrease in Net Assets Resulting from Capital Share Transactions | | | (380,727 | ) | | | (2,415,525 | ) | |
Total Decrease in Net Assets | | | (670,425 | ) | | | (2,988,316 | ) | |
Net Assets: | |
Beginning of Period | | | 1,273,014 | | | | 4,261,330 | | |
End of Period (Including Accumulated Net Investment Loss of $(3,386) and $(23,543)) | | $ | 602,589 | | | $ | 1,273,014 | | |
(1) Capital Share Transactions: | |
Class I: | |
Shares Subscribed | | | 1,827 | | | | 3,169 | | |
Shares Issued on Distributions Reinvested | | | 8,618 | | | | 5,943 | | |
Shares Redeemed | | | (17,277 | ) | | | (51,617 | ) | |
Net Decrease in Class I Shares Outstanding | | | (6,832 | ) | | | (42,505 | ) | |
Class A: | |
Shares Subscribed | | | 1,503 | | | | 1,631 | | |
Shares Issued on Distributions Reinvested | | | 10,408 | | | | 3,386 | | |
Shares Redeemed | | | (13,489 | ) | | | (18,183 | ) | |
Net Decrease in Class A Shares Outstanding | | | (1,578 | ) | | | (13,166 | ) | |
Class L: | |
Shares Issued on Distributions Reinvested | | | 235 | | | | 50 | | |
Shares Redeemed | | | (145 | ) | | | (87 | ) | |
Net Increase (Decrease) in Class L Shares Outstanding | | | 90 | | | | (37 | ) | |
Class C: | |
Shares Subscribed | | | 1 | * | | | — | | |
Class IS: | |
Shares Subscribed | | | 1,742 | | | | 6,353 | | |
Shares Issued on Distributions Reinvested | | | 1,407 | | | | 3,735 | | |
Shares Redeemed | | | (7,194 | ) | | | (33,413 | ) | |
Net Decrease in Class IS Shares Outstanding | | | (4,045 | ) | | | (23,325 | ) | |
* For the period May 31, 2017 through September 30, 2017.
The accompanying notes are an integral part of the financial statements.
11
Morgan Stanley Institutional Fund Trust
Annual Report — September 30, 2017
Financial Highlights
Mid Cap Growth Portfolio
| | | Class I | |
| | | Year Ended September 30, | |
Selected Per Share Data and Ratios | | 2017 | | 2016(1) | | 2015 | | 2014 | | 2013 | |
Net Asset Value, Beginning of Period | | $ | 31.85 | | | $ | 35.96 | | | $ | 44.73 | | | $ | 44.24 | | | $ | 35.34 | | |
Income (Loss) from Investment Operations: | |
Net Investment Income (Loss)(2) | | | 0.05 | | | | 0.03 | | | | (0.16 | ) | | | 0.09 | | | | 0.10 | | |
Net Realized and Unrealized Gain (Loss) | | | 1.99 | | | | 0.18 | | | | (2.33 | ) | | | 3.04 | | | | 10.10 | | |
Total from Investment Operations | | | 2.04 | | | | 0.21 | | | | (2.49 | ) | | | 3.13 | | | | 10.20 | | |
Distributions from and/or in Excess of: | |
Net Investment Income | | | — | | | | — | | | | (0.09 | ) | | | — | | | | (0.12 | ) | |
Net Realized Gain | | | (11.59 | ) | | | (4.32 | ) | | | (6.19 | ) | | | (2.64 | ) | | | (1.18 | ) | |
Total Distributions | | | (11.59 | ) | | | (4.32 | ) | | | (6.28 | ) | | | (2.64 | ) | | | (1.30 | ) | |
Net Asset Value, End of Period | | $ | 22.30 | | | $ | 31.85 | | | $ | 35.96 | | | $ | 44.73 | | | $ | 44.24 | | |
Total Return(3) | | | 16.16 | % | | | 0.19 | % | | | (6.18 | )% | | | 7.25 | % | | | 29.92 | % | |
Ratios and Supplemental Data: | |
Net Assets, End of Period (Thousands) | | $ | 242,140 | | | $ | 563,397 | | | $ | 2,164,565 | | | $ | 4,708,900 | | | $ | 5,174,440 | | |
Ratio of Expenses to Average Net Assets(7) | | | 0.72 | %(4) | | | 0.73 | %(4) | | | 0.74 | %(4) | | | 0.75 | %(4) | | | 0.70 | %(4)(5) | |
Ratio of Expenses to Average Net Assets Excluding Non Operating Expenses | | | 0.71 | %(4) | | | N/A | | | | N/A | | | | N/A | | | | 0.71 | %(4)(5) | |
Ratio of Net Investment Income (Loss) to Average Net Assets(7) | | | 0.21 | %(4) | | | 0.09 | %(4) | | | (0.39 | )%(4) | | | 0.19 | %(4) | | | 0.27 | %(4)(5) | |
Ratio of Rebate from Morgan Stanley Affiliates to Average Net Assets | | | 0.01 | % | | | 0.00 | %(6) | | | 0.00 | %(6) | | | 0.00 | %(6) | | | 0.00 | %(6) | |
Portfolio Turnover Rate | | | 59 | % | | | 23 | % | | | 27 | % | | | 45 | % | | | 52 | % | |
(7) Supplemental Information on the Ratios to Average Net Assets: | |
Ratios Before Expense Limitation: | |
Expenses to Average Net Assets | | | 0.72 | % | | | 0.74 | % | | | N/A | | | | N/A | | | | N/A | | |
Net Investment Income to Average Net Assets | | | 0.21 | % | | | 0.08 | % | | | N/A | | | | N/A | | | | N/A | | |
(1) Reflects prior period custodian out-of-pocket expenses that were reimbursed in September 2016. The amount of the reimbursement was immaterial on a per share basis and did not impact the total return of Class I shares. The Ratio of Expenses to Average Net Assets would have been less than 0.005% higher and the Ratio of Net Investment Income (Loss) to Average Net Assets would have been less than 0.005% lower had the custodian not reimbursed the Fund.
(2) Per share amount is based on average shares outstanding.
(3) Calculated based on the net asset value as of the last business day of the period.
(4) The Ratios of Expenses and Net Investment Income (Loss) reflect the rebate of certain Fund expenses in connection with the investments in Morgan Stanley affiliates during the period. The effect of the rebate on the ratios is disclosed in the above table as "Ratio of Rebate from Morgan Stanley Affiliates to Average Net Assets."
(5) Effective September 16, 2013, the Adviser has agreed to limit the ratio of expenses to average net assets to the maximum ratio of 0.80% for Class I shares.
(6) Amount is less than 0.005%.
The accompanying notes are an integral part of the financial statements.
12
Morgan Stanley Institutional Fund Trust
Annual Report — September 30, 2017
Financial Highlights
Mid Cap Growth Portfolio
| | | Class A | |
| | | Year Ended September 30, | |
Selected Per Share Data and Ratios | | 2017 | | 2016(1) | | 2015 | | 2014 | | 2013 | |
Net Asset Value, Beginning of Period | | $ | 29.86 | | | $ | 34.06 | | | $ | 42.70 | | | $ | 42.46 | | | $ | 34.03 | | |
Income (Loss) from Investment Operations: | |
Net Investment Income (Loss)(2) | | | (0.03 | ) | | | (0.05 | ) | | | (0.26 | ) | | | (0.03 | ) | | | 0.01 | | |
Net Realized and Unrealized Gain (Loss) | | | 1.68 | | | | 0.17 | | | | (2.19 | ) | | | 2.91 | | | | 9.70 | | |
Total from Investment Operations | | | 1.65 | | | | 0.12 | | | | (2.45 | ) | | | 2.88 | | | | 9.71 | | |
Distributions from and/or in Excess of: | |
Net Investment Income | | | — | | | | — | | | | — | | | | — | | | | (0.10 | ) | |
Net Realized Gain | | | (11.59 | ) | | | (4.32 | ) | | | (6.19 | ) | | | (2.64 | ) | | | (1.18 | ) | |
Total Distributions | | | (11.59 | ) | | | (4.32 | ) | | | (6.19 | ) | | | (2.64 | ) | | | (1.28 | ) | |
Net Asset Value, End of Period | | $ | 19.92 | | | $ | 29.86 | | | $ | 34.06 | | | $ | 42.70 | | | $ | 42.46 | | |
Total Return(3) | | | 15.85 | % | | | (0.12 | )% | | | (6.40 | )% | | | 6.95 | % | | | 29.60 | % | |
Ratios and Supplemental Data: | |
Net Assets, End of Period (Thousands) | | $ | 289,123 | | | $ | 480,488 | | | $ | 996,553 | | | $ | 1,859,126 | | | $ | 2,171,493 | | |
Ratio of Expenses to Average Net Assets(7) | | | 1.01 | %(4) | | | 0.99 | %(4) | | | 1.00 | %(4) | | | 1.00 | %(4) | | | 0.95 | %(4)(5) | |
Ratio of Expenses to Average Net Assets Excluding Non Operating Expenses | | | 1.00 | %(4) | | | N/A | | | | N/A | | | | N/A | | | | 0.96 | %(4)(5) | |
Ratio of Net Investment Income (Loss) to Average Net Assets(7) | | | (0.17 | )%(4) | | | (0.17 | )%(4) | | | (0.65 | )%(4) | | | (0.07 | )%(4) | | | 0.02 | %(4)(5) | |
Ratio of Rebate from Morgan Stanley Affiliates to Average Net Assets | | | 0.01 | % | | | 0.00 | %(6) | | | 0.00 | %(6) | | | 0.00 | %(6) | | | 0.00 | %(6) | |
Portfolio Turnover Rate | | | 59 | % | | | 23 | % | | | 27 | % | | | 45 | % | | | 52 | % | |
(7) Supplemental Information on the Ratios to Average Net Assets: | |
Ratios Before Expense Limitation: | |
Expenses to Average Net Assets | | | 1.01 | % | | | 1.00 | % | | | N/A | | | | N/A | | | | N/A | | |
Net Investment Loss to Average Net Assets | | | (0.16 | )% | | | (0.18 | )% | | | N/A | | | | N/A | | | | N/A | | |
(1) Reflects prior period custodian out-of-pocket expenses that were reimbursed in September 2016. The amount of the reimbursement was immaterial on a per share basis and did not impact the total return of Class A shares. The Ratio of Expenses to Average Net Assets would have been less than 0.005% higher and the Ratio of Net Investment Income (Loss) to Average Net Assets would have been less than 0.005% lower had the custodian not reimbursed the Fund.
(2) Per share amount is based on average shares outstanding.
(3) Calculated based on the net asset value which does not reflect sales charges, if applicable, as of the last business day of the period.
(4) The Ratios of Expenses and Net Investment Income (Loss) reflect the rebate of certain Fund expenses in connection with the investments in Morgan Stanley affiliates during the period. The effect of the rebate on the ratios is disclosed in the above table as "Ratio of Rebate from Morgan Stanley Affiliates to Average Net Assets."
(5) Effective September 16, 2013, the Adviser has agreed to limit the ratio of expenses to average net assets to the maximum ratio of 1.15% for Class A shares.
(6) Amount is less than 0.005%.
The accompanying notes are an integral part of the financial statements.
13
Morgan Stanley Institutional Fund Trust
Annual Report — September 30, 2017
Financial Highlights
Mid Cap Growth Portfolio
| | | Class L | |
| | | Year Ended September 30, | |
Selected Per Share Data and Ratios | | 2017 | | 2016(1) | | 2015 | | 2014 | | 2013 | |
Net Asset Value, Beginning of Period | | $ | 29.01 | | | $ | 33.39 | | | $ | 42.20 | | | $ | 42.20 | | | $ | 33.97 | | |
Income (Loss) from Investment Operations: | |
Net Investment Loss(2) | | | (0.16 | ) | | | (0.22 | ) | | | (0.46 | ) | | | (0.26 | ) | | | (0.15 | ) | |
Net Realized and Unrealized Gain (Loss) | | | 1.53 | | | | 0.16 | | | | (2.16 | ) | | | 2.90 | | | | 9.63 | | |
Total from Investment Operations | | | 1.37 | | | | (0.06 | ) | | | (2.62 | ) | | | 2.64 | | | | 9.48 | | |
Distributions from and/or in Excess of: | |
Net Investment Income | | | — | | | | — | | | | — | | | | — | | | | (0.07 | ) | |
Net Realized Gain | | | (11.59 | ) | | | (4.32 | ) | | | (6.19 | ) | | | (2.64 | ) | | | (1.18 | ) | |
Total Distributions | | | (11.59 | ) | | | (4.32 | ) | | | (6.19 | ) | | | (2.64 | ) | | | (1.25 | ) | |
Net Asset Value, End of Period | | $ | 18.79 | | | $ | 29.01 | | | $ | 33.39 | | | $ | 42.20 | | | $ | 42.20 | | |
Total Return(3) | | | 15.07 | % | | | (0.73 | )% | | | (6.94 | )% | | | 6.40 | % | | | 28.92 | % | |
Ratios and Supplemental Data: | |
Net Assets, End of Period (Thousands) | | $ | 8,091 | | | $ | 9,874 | | | $ | 12,600 | | | $ | 16,817 | | | $ | 17,190 | | |
Ratio of Expenses to Average Net Assets(7) | | | 1.63 | %(4) | | | 1.60 | %(4) | | | 1.55 | %(4) | | | 1.55 | %(4) | | | 1.46 | %(4)(5) | |
Ratio of Expenses to Average Net Assets Excluding Non Operating Expenses | | | 1.63 | %(4) | | | N/A | | | | N/A | | | | N/A | | | | 1.46 | %(4)(5) | |
Ratio of Net Investment Loss to Average Net Assets(7) | | | (0.85 | )%(4) | | | (0.76 | )%(4) | | | (1.20 | )%(4) | | | (0.60 | )%(4) | | | (0.41 | )%(4)(5) | |
Ratio of Rebate from Morgan Stanley Affiliates to Average Net Assets | | | 0.01 | % | | | 0.00 | %(6) | | | 0.00 | %(6) | | | 0.00 | %(6) | | | 0.00 | %(6) | |
Portfolio Turnover Rate | | | 59 | % | | | 23 | % | | | 27 | % | | | 45 | % | | | 52 | % | |
(7) Supplemental Information on the Ratios to Average Net Assets: | |
Ratios Before Expense Limitation: | |
Expenses to Average Net Assets | | | 1.64 | % | | | 1.61 | % | | | N/A | | | | N/A | | | | N/A | | |
Net Investment Loss to Average Net Assets | | | (0.86 | )% | | | (0.77 | )% | | | N/A | | | | N/A | | | | N/A | | |
(1) Reflects prior period custodian out-of-pocket expenses that were reimbursed in September 2016. The amount of the reimbursement was immaterial on a per share basis and did not impact the total return of Class L shares. The Ratio of Expenses to Average Net Assets would have been less than 0.005% higher and the Ratio of Net Investment Loss to Average Net Assets would have been less than 0.005% lower had the custodian not reimbursed the Fund.
(2) Per share amount is based on average shares outstanding.
(3) Calculated based on the net asset value as of the last business day of the period.
(4) The Ratios of Expenses and Net Investment Loss reflect the rebate of certain Fund expenses in connection with the investments in Morgan Stanley affiliates during the period. The effect of the rebate on the ratios is disclosed in the above table as "Ratio of Rebate from Morgan Stanley Affiliates to Average Net Assets."
(5) Effective September 16, 2013, the Adviser has agreed to limit the ratio of expenses to average net assets to the maximum ratio of 1.65% for Class L shares.
(6) Amount is less than 0.005%.
The accompanying notes are an integral part of the financial statements.
14
Morgan Stanley Institutional Fund Trust
Annual Report — September 30, 2017
Financial Highlights
Mid Cap Growth Portfolio
| | | Class C | |
Selected Per Share Data and Ratios | | Period from May 31, 2017(1)
to September 30, 2017 | |
Net Asset Value, Beginning of Period | | $ | 19.34 | | |
Income (Loss) from Investment Operations: | |
Net Investment Loss(2) | | | (0.09 | ) | |
Net Realized and Unrealized Gain | | | 0.60 | | |
Total from Investment Operations | | | 0.51 | | |
Net Asset Value, End of Period | | $ | 19.85 | | |
Total Return(3) | | | 2.64 | %(6) | |
Ratios and Supplemental Data: | |
Net Assets, End of Period (Thousands) | | $ | 10 | | |
Ratio of Expenses to Average Net Assets(8) | | | 1.90 | %(4)(7) | |
Ratio of Expenses to Average Net Assets Excluding Non Operating Expenses | | | 1.90 | %(4)(7) | |
Ratio of Net Investment Loss to Average Net Assets(8) | | | (1.34 | )%(4)(7) | |
Ratio of Rebate from Morgan Stanley Affiliates to Average Net Assets | | | 0.00 | %(5)(7) | |
Portfolio Turnover Rate | | | 59 | %(6) | |
(8) Supplemental Information on the Ratios to Average Net Assets: | |
Ratios Before Expense Limitation: | |
Expenses to Average Net Assets | | | 15.31 | %(7) | |
Net Investment Loss to Average Net Assets | | | (14.75 | )%(7) | |
(1) Commencement of Offering.
(2) Per share amount is based on average shares outstanding.
(3) Calculated based on the net asset value which does not reflect sales charges, if applicable, as of the last business day of the period.
(4) The Ratios of Expenses and Net Investment Loss reflect the rebate of certain Fund expenses in connection with the investments in Morgan Stanley affiliates during the period. The effect of the rebate on the ratios is disclosed in the above table as "Ratio of Rebate from Morgan Stanley Affiliates to Average Net Assets."
(5) Amount is less than 0.005%.
(6) Not annualized.
(7) Annualized.
The accompanying notes are an integral part of the financial statements.
15
Morgan Stanley Institutional Fund Trust
Annual Report — September 30, 2017
Financial Highlights
Mid Cap Growth Portfolio
| | | Class IS | |
| | | Year Ended September 30, | | Period from
September 13, 2013(2) to | |
Selected Per Share Data and Ratios | | 2017 | | 2016(1) | | 2015 | | 2014 | | September 30, 2013 | |
Net Asset Value, Beginning of Period | | $ | 31.94 | | | $ | 36.03 | | | $ | 44.80 | | | $ | 44.25 | | | $ | 43.74 | | |
Income (Loss) from Investment Operations: | |
Net Investment Income (Loss)(3) | | | 0.04 | | | | 0.07 | | | | (0.10 | ) | | | 0.18 | | | | (0.00 | )(4) | |
Net Realized and Unrealized Gain (Loss) | | | 2.04 | | | | 0.16 | | | | (2.33 | ) | | | 3.01 | | | | 0.51 | | |
Total from Investment Operations | | | 2.08 | | | | 0.23 | | | | (2.43 | ) | | | 3.19 | | | | 0.51 | | |
Distributions from and/or in Excess of: | |
Net Investment Income | | | — | | | | — | | | | (0.15 | ) | | | — | | | | — | | |
Net Realized Gain | | | (11.59 | ) | | | (4.32 | ) | | | (6.19 | ) | | | (2.64 | ) | | | — | | |
Total Distributions | | | (11.59 | ) | | | (4.32 | ) | | | (6.34 | ) | | | (2.64 | ) | | | — | | |
Net Asset Value, End of Period | | $ | 22.43 | | | $ | 31.94 | | | $ | 36.03 | | | $ | 44.80 | | | $ | 44.25 | | |
Total Return(5) | | | 16.24 | % | | | 0.25 | % | | | (6.02 | )% | | | 7.39 | % | | | 1.17 | %(9) | |
Ratios and Supplemental Data: | |
Net Assets, End of Period (Thousands) | | $ | 63,225 | | | $ | 219,255 | | | $ | 1,087,612 | | | $ | 662,560 | | | $ | 10 | | |
Ratio of Expenses to Average Net Assets(11) | | | 0.65 | %(6) | | | 0.61 | %(6) | | | 0.61 | %(6) | | | 0.61 | %(6) | | | 0.49 | %(6)(7)(10) | |
Ratio of Expenses to Average Net Assets Excluding Non Operating Expenses | | | 0.65 | %(6) | | | N/A | | | | N/A | | | | N/A | | | | 0.58 | %(6)(7)(10) | |
Ratio of Net Investment Income (Loss) to Average Net Assets(11) | | | 0.18 | %(6) | | | 0.22 | %(6) | | | (0.25 | )%(6) | | | 0.41 | %(6) | | | (0.22 | )%(6)(7)(10) | |
Ratio of Rebate from Morgan Stanley Affiliates to Average Net Assets | | | 0.01 | % | | | 0.00 | %(8) | | | 0.00 | %(8) | | | 0.00 | %(8) | | | 0.01 | %(10) | |
Portfolio Turnover Rate | | | 59 | % | | | 23 | % | | | 27 | % | | | 45 | % | | | 52 | %(9) | |
(11) Supplemental Information on the Ratios to Average Net Assets: | |
Ratios Before Expense Limitation: | |
Expenses to Average Net Assets | | | 0.65 | % | | | 0.62 | % | | | N/A | | | | N/A | | | | N/A | | |
Net Investment Income to Average Net Assets | | | 0.18 | % | | | 0.21 | % | | | N/A | | | | N/A | | | | N/A | | |
(1) Reflects prior period custodian out-of-pocket expenses that were reimbursed in September 2016. The amount of the reimbursement was immaterial on a per share basis and did not impact the total return of Class IS shares. The Ratio of Expenses to Average Net Assets would have been less than 0.005% higher and the Ratio of Net Investment Income (Loss) to Average Net Assets would have been less than 0.005% lower had the custodian not reimbursed the Fund.
(2) Commencement of Offering.
(3) Per share amount is based on average shares outstanding.
(4) Amount is less than $0.005 per share.
(5) Calculated based on the net asset value as of the last business day of the period.
(6) The Ratios of Expenses and Net Investment Income (Loss) reflect the rebate of certain Fund expenses in connection with the investments in Morgan Stanley affiliates during the period. The effect of the rebate on the ratios is disclosed in the above table as "Ratio of Rebate from Morgan Stanley Affiliates to Average Net Assets."
(7) Effective September 16, 2013, the Adviser has agreed to limit the ratio of expenses to average net assets to the maximum ratio of 0.73% for Class IS shares.
(8) Amount is less than 0.005%.
(9) Not annualized.
(10) Annualized.
The accompanying notes are an integral part of the financial statements.
16
Morgan Stanley Institutional Fund Trust
Annual Report — September 30, 2017
Notes to Financial Statements
Morgan Stanley Institutional Fund Trust ("Trust'') is registered under the Investment Company Act of 1940, as amended (the "Act''), as an open-end management investment company. The Trust is comprised of nine separate, active funds (individually referred to as a "Fund", collectively as the "Funds"). The Trust applies investment company accounting and reporting guidance. All Funds are considered diversified for purposes of the Act.
The accompanying financial statements relate to the Mid Cap Growth Portfolio. The Fund seeks long-term capital growth. The Fund offers five classes of shares — Class I, Class A, Class L, Class C and Class IS.
On May 31, 2017, the Fund recommenced offering Class I, Class A and Class IS shares and commenced offering Class C shares. The Fund has suspended offering Class L shares for the sale to all investors. Class L shareholders of the Fund do not have the option of purchasing additional Class L shares. However, existing Class L shareholders may invest in additional Class L shares through reinvestment of dividends and distributions.
A. Significant Accounting Policies: The following significant accounting policies are in conformity with U.S. generally accepted accounting principles ("GAAP"). Such policies are consistently followed by the Trust in the preparation of its financial statements. GAAP may require management to make estimates and assumptions that affect the reported amounts and disclosures in the financial statements. Actual results may differ from those estimates.
1. Security Valuation: (1) An equity portfolio security listed or traded on an exchange is valued at its latest reported sales price (or at the exchange official closing price if such exchange reports an official closing price), and if there were no sales on a given day and if there is no official exchange closing price for that day, the security is valued at the mean between the last reported bid and asked prices if such bid and asked prices are available on the relevant exchanges. Listed equity securities not traded on the valuation date with no reported bid and asked prices available on the exchange are valued at the mean between the current bid and asked prices obtained from one or more reputable brokers or dealers. In cases where a security is traded on more than one exchange, the security is valued on the exchange designated as the primary market; (2) all other equity portfolio securities for which over-the-counter ("OTC") market quotations are readily available are valued at the latest reported sales price (or at the market official closing price if such market reports
an official closing price), and if there was no trading in the security on a given day and if there is no official closing price from relevant markets for that day, the security is valued at the mean between the last reported bid and asked prices if such bid and asked prices are available on the relevant markets. An unlisted equity security that does not trade on the valuation date and for which bid and asked prices from the relevant markets are unavailable is valued at the mean between the current bid and asked prices obtained from one or more reputable brokers or dealers; (3) listed options are valued at the last reported sales price on the exchange on which they are listed (or at the exchange official closing price if such exchange reports an official closing price). If an official closing price or last reported sales price is unavailable, the listed option should be fair valued at the mean between its latest bid and ask prices. Unlisted options are valued at the mean between their latest bid and ask prices from a broker/dealer or valued by a pricing service/vendor; (4) certain portfolio securities may be valued by an outside pricing service/vendor approved by the Trust's Board of Trustees (the "Trustees"). The pricing service/vendor may employ a pricing model that takes into account, among other things, bids, yield spreads, and/or other market data and specific security characteristics. Alternatively, if a valuation is not available from an outside pricing service/vendor, and the security trades on an exchange, the security may be valued at its latest reported sale price (or at the exchange official closing price if such exchange reports an official closing price), prior to the time when assets are valued. If there are no sales on a given day and if there is no official exchange closing price for that day, the security is valued at the mean between the last reported bid and asked prices if such bid and asked prices are available in the relevant exchanges; (5) when market quotations are not readily available, including circumstances under which Morgan Stanley Investment Management Inc. (the "Adviser") determines that the closing price, last sale price or the mean between the last reported bid and asked prices are not reflective of a security's market value, portfolio securities are valued at their fair value as determined in good faith under procedures established by and under the general supervision of the Trustees. Occasionally, developments affecting the closing prices of securities and other assets may occur between the times at which valuations of such securities are determined (that is, close of the foreign market on which the securities trade) and the close of business of the New York Stock Exchange ("NYSE"). If developments occur during such periods that
17
Morgan Stanley Institutional Fund Trust
Annual Report — September 30, 2017
Notes to Financial Statements (cont'd)
are expected to materially affect the value of such securities, such valuations may be adjusted to reflect the estimated fair value of such securities as of the close of the NYSE, as determined in good faith by the Trustees or by the Adviser using a pricing service and/or procedures approved by the Trustees; (6) quotations of foreign portfolio securities, other assets and liabilities and forward contracts stated in foreign currency are translated into U.S. dollar equivalents at the prevailing market rates prior to the close of the NYSE; and (7) investments in mutual funds, including the Morgan Stanley Institutional Liquidity Funds, are valued at the net asset value ("NAV") as of the close of each business day.
The Trustees have responsibility for determining in good faith the fair value of the investments, and the Trustees may appoint others, such as the Trust's Adviser or a valuation committee, to assist the Trustees in determining fair value and to make the actual calculations pursuant to the fair valuation methodologies previously approved by the Trustees. Under procedures approved by the Trustees, the Trust's Adviser has formed a Valuation Committee whose members are approved by the Trustees. The Valuation Committee provides administration and oversight of the Trust's valuation policies and procedures, which are reviewed at least annually by the Trustees. These procedures allow the Trust to utilize independent pricing services, quotations from securities and financial instrument dealers, and other market sources to determine fair value.
The Trust has procedures to determine the fair value of securities and other financial instruments for which market prices are not readily available. Under these procedures, the Valuation Committee convenes on a regular and ad hoc basis to review such securities and considers a number of factors, including valuation methodologies and significant unobservable valuation inputs, when arriving at fair value. The Valuation Committee may employ a market-based approach which may use related or comparable assets or liabilities, recent transactions, market multiples, book values, and other relevant information for the investment to determine the fair value of the investment. An income-based valuation approach may also be used in which the anticipated future cash flows of the investment are discounted to calculate fair value. Discounts may also be applied due to the nature or duration of any restrictions on the disposition of the investments. Due to the inherent uncertainty of valuations of such investments, the fair values may differ significantly from the values that would
have been used had an active market existed. The Valuation Committee employs various methods for calibrating these valuation approaches including a regular review of valuation methodologies, key inputs and assumptions, transactional back-testing or disposition analysis, and reviews of any related market activity.
2. Fair Value Measurement: Financial Accounting Standards Board ("FASB") Accounting Standards CodificationTM ("ASC") 820, "Fair Value Measurement" ("ASC 820"), defines fair value as the value that the Fund would receive to sell an investment or pay to transfer a liability in a timely transaction with an independent buyer in the principal market, or in the absence of a principal market, the most advantageous market for the investment or liability. ASC 820 establishes a three-tier hierarchy to distinguish between (1) inputs that reflect the assumptions market participants would use in valuing an asset or liability developed based on market data obtained from sources independent of the reporting entity (observable inputs) and (2) inputs that reflect the reporting entity's own assumptions about the assumptions market participants would use in valuing an asset or liability developed based on the best information available in the circumstances (unobservable inputs) and to establish classification of fair value measurements for disclosure purposes. Various inputs are used in determining the value of the Fund's investments. The inputs are summarized in the three broad levels listed below.
• Level 1 – unadjusted quoted prices in active markets for identical investments
• Level 2 – other significant observable inputs (including quoted prices for similar investments, interest rates, prepayment speeds, credit risk, etc.)
• Level 3 – significant unobservable inputs including the Fund's own assumptions in determining the fair value of investments. Factors considered in making this determination may include, but are not limited to, information obtained by contacting the issuer, analysts, or the appropriate stock exchange (for exchange-traded securities), analysis of the issuer's financial statements or other available documents and, if necessary, available information concerning other securities in similar circumstances
The inputs or methodology used for valuing securities are not necessarily an indication of the risk associated
18
Morgan Stanley Institutional Fund Trust
Annual Report — September 30, 2017
Notes to Financial Statements (cont'd)
with investing in those securities and the determination of the significance of a particular input to the fair value measurement in its entirety requires judgment and considers factors specific to each security.
The following is a summary of the inputs used to value the Fund's investments as of September 30, 2017.
Investment Type | | Level 1
Unadjusted
quoted
prices
(000) | | Level 2
Other
significant
observable
inputs
(000) | | Level 3
Significant
unobservable
inputs
(000) | | Total
(000) | |
Assets: | |
Common Stocks | |
Aerospace & Defense | | $ | 29,328 | | | $ | — | | | $ | — | | | $ | 29,328 | | |
Biotechnology | | | 10,327 | | | | — | | | | — | | | | 10,327 | | |
Capital Markets | | | 45,893 | | | | — | | | | — | | | | 45,893 | | |
Construction Materials | | | 18,906 | | | | — | | | | — | | | | 18,906 | | |
Consumer Finance | | | 6,792 | | | | — | | | | — | | | | 6,792 | | |
Electronic Equipment,
Instruments &
Components | | | 3,990 | | | | — | | | | — | | | | 3,990 | | |
Health Care Equipment &
Supplies | | | 28,366 | | | | — | | | | — | | | | 28,366 | | |
Health Care Technology | | | 69,864 | | | | — | | | | — | | | | 69,864 | | |
Information Technology
Services | | | 21,377 | | | | — | | | | — | | | | 21,377 | | |
Internet & Direct
Marketing Retail | | | 21,548 | | | | — | | | | — | | | | 21,548 | | |
Internet Software &
Services | | | 73,732 | | | | — | | | | 11,528 | | | | 85,260 | | |
Life Sciences Tools &
Services | | | 36,525 | | | | — | | | | — | | | | 36,525 | | |
Machinery | | | 40,238 | | | | — | | | | — | | | | 40,238 | | |
Multi-Line Retail | | | 17,832 | | | | — | | | | — | | | | 17,832 | | |
Professional Services | | | 42,885 | | | | — | | | | — | | | | 42,885 | | |
Software | | | 96,513 | | | | — | | | | — | | | | 96,513 | | |
Specialty Retail | | | 6,435 | | | | — | | | | — | | | | 6,435 | | |
Textiles, Apparel & Luxury
Goods | | | 5,744 | | | | — | | | | — | | | | 5,744 | | |
Total Common Stocks | | | 576,295 | | | | — | | | | 11,528 | | | | 587,823 | | |
Call Options Purchased | | | — | | | | 259 | | | | — | | | | 259 | | |
Investment Type | | Level 1
Unadjusted
quoted
prices
(000) | | Level 2
Other
significant
observable
inputs
(000) | | Level 3
Significant
unobservable
inputs
(000) | | Total
(000) | |
Short-Term Investments | |
Investment Company | | $ | 44,741 | | | $ | — | | | $ | — | | | $ | 44,741 | | |
Repurchase Agreement | | | — | | | | 5,698 | | | | — | | | | 5,698 | | |
Total Short-Term
Investments | | | 44,741 | | | | 5,698 | | | | — | | | | 50,439 | | |
Total Assets | | $ | 621,036 | | | $ | 5,957 | | | $ | 11,528 | | | $ | 638,521 | | |
Transfers between investment levels may occur as the markets fluctuate and/or the availability of data used in an investment's valuation changes. The Fund recognizes transfers between the levels as of the end of the period. As of September 30, 2017, the Fund did not have any investments transfer between investment levels.
Following is a reconciliation of investments in which significant unobservable inputs (Level 3) were used in determining fair value.
| | | Common
Stocks
(000) | | Convertible
Preferred
Stock
(000) | | Preferred
Stock
(000) | |
Beginning Balance | | $ | 68,563 | | | $ | 5,031 | | | $ | 29,549 | | |
Purchases | | | — | | | | — | | | | — | | |
Sales | | | (31,271 | ) | | | (3,001 | ) | | | (34,924 | ) | |
Amortization of discount | | | — | | | | — | | | | — | | |
Transfers in | | | — | | | | — | | | | — | | |
Transfers out | | | — | | | | — | | | | — | | |
Corporate actions | | | — | | | | — | | | | — | | |
Change in unrealized appreciation
(depreciation) | | | (23,127 | ) | | | (1,666 | ) | | | (16,542 | ) | |
Realized gains (losses) | | | (2,637 | ) | | | (364 | ) | | | 21,917 | | |
Ending Balance | | $ | 11,528 | | | $ | — | | | $ | — | | |
Net change in unrealized appreciation
(depreciation) from investments still
held as of September 30, 2017 | | $ | (6,336 | ) | | $ | — | | | $ | — | | |
The following table presents additional information about valuation techniques and inputs used for investments that are measured at fair value and categorized within Level 3 as of September 30, 2017. Various valuation techniques were used in the valuation of certain investments and weighted based on the level of significance.
| | | Fair Value at
September 30, 2017
(000) | | Valuation
Technique | | Unobservable
Input | | Range | | Selected
Value | | Impact to
Valuation from an
Increase in Input | |
Internet Software & Services | |
Common Stock | | $ | 11,528 | | | Discounted Cash Flow | | Weighted Average
Cost of Capital | | | 16.0 | % | | | 18.0 | % | | | 17.0 | % | | Decrease | |
| | | | | | | Perpetual Growth Rate | | | 3.0 | % | | | 4.0 | % | | | 3.5 | % | | Increase | |
| | | | | Market Comparable
Companies | | Enterprise Value/
Revenue | | | 4.0 | x | | | 9.2 | x | | | 4.6 | x | | Increase | |
| | | | | | | Discount for Lack
of Marketability | | | 20.0 | % | | | 20.0 | % | | | 20.0 | % | | Decrease | |
19
Morgan Stanley Institutional Fund Trust
Annual Report — September 30, 2017
Notes to Financial Statements (cont'd)
3. Repurchase Agreements: The Fund may enter into repurchase agreements under which the Fund lends cash and takes possession of securities with an agreement that the counterparty will repurchase such securities. In connection with transactions in repurchase agreements, a bank as custodian for the Fund takes possession of the underlying securities which are held as collateral, with a market value at least equal to the amount of the repurchase transaction, including principal and accrued interest. To the extent that any repurchase transaction exceeds one business day, the value of the collateral is marked-to-market on a daily basis to determine that the value of the collateral does not decrease below the repurchase price plus accrued interest as earned. If such a decrease occurs, additional collateral will be requested and, when received, will be added to the account to maintain full collateralization. In the event of default on the obligation to repurchase, the Fund has the right to liquidate the collateral and apply the proceeds in satisfaction of the obligation. In the event of default or bankruptcy by the counterparty to the agreement, realization of the collateral proceeds may be subject to cost and delays. The Fund, along with other affiliated investment companies, may utilize a joint trading account for the purpose of entering into repurchase agreements.
4. Foreign Currency Translation and Foreign Investments: The books and records of the Fund are maintained in U.S. dollars. Foreign currency amounts are translated into U.S. dollars as follows:
– investments, other assets and liabilities at the prevailing rate of exchange on the valuation date;
– investment transactions and investment income at the prevailing rates of exchange on the dates of such transactions.
Although the net assets of the Fund are presented at the foreign exchange rates and market values at the close of the period, the Fund does not isolate that portion of the results of operations arising as a result of changes in the foreign exchange rates from the fluctuations arising from changes in the market prices of securities held at period end. Similarly, the Fund does not isolate the effect of changes in foreign exchange rates from the fluctuations arising from changes in the market prices of securities sold during the period. Accordingly, realized and unrealized foreign currency gains (losses) on investments in securities are included in the reported net realized and
unrealized gains (losses) on investment transactions and balances. However, pursuant to U.S. federal income tax regulations, gains and losses from certain foreign currency transactions and the foreign currency portion of gains and losses realized on sales and maturities of foreign denominated debt securities are treated as ordinary income for U.S. federal income tax purposes.
Net realized gains (losses) on foreign currency transactions represent net foreign exchange gains (losses) from foreign currency forward exchange contracts, disposition of foreign currencies, currency gains (losses) realized between the trade and settlement dates on securities transactions, and the difference between the amount of investment income and foreign withholding taxes recorded on the Fund's books and the U.S. dollar equivalent amounts actually received or paid. Net unrealized currency gains (losses) from valuing foreign currency denominated assets and liabilities at period end exchange rates are reflected as a component of unrealized appreciation (depreciation) in the Statement of Assets and Liabilities. The change in unrealized currency gains (losses) on foreign currency translations for the period is reflected in the Statement of Operations.
Foreign security and currency transactions may involve certain considerations and risks not typically associated with those of U.S. dollar denominated transactions as a result of, among other factors, fluctuations of exchange rates in relation to the U.S. dollar, the possibility of lower levels of governmental supervision and regulation of foreign securities markets and the possibility of political or economic instability.
Governmental approval for foreign investments may be required in advance of making an investment under certain circumstances in some countries, and the extent of foreign investments in domestic companies may be subject to limitation in other countries. Foreign ownership limitations also may be imposed by the charters of individual companies to prevent, among other concerns, violations of foreign investment limitations. As a result, an additional class of shares (identified as "Foreign" in the Portfolio of Investments) may be created and offered for investment. The "local" and "foreign shares" market values may differ. In the absence of trading of the foreign shares in such markets, the Fund values the foreign shares at the closing exchange price of the local shares.
20
Morgan Stanley Institutional Fund Trust
Annual Report — September 30, 2017
Notes to Financial Statements (cont'd)
5. Derivatives: The Fund may, but is not required to, use derivative instruments for a variety of purposes, including hedging, risk management, portfolio management or to earn income. Derivatives are financial instruments whose value is based, in part, on the value of an underlying asset, interest rate, index or financial instrument. Prevailing interest rates and volatility levels, among other things, also affect the value of derivative instruments. A derivative instrument often has risks similar to its underlying asset and may have additional risks, including imperfect correlation between the value of the derivative and the underlying asset, risks of default by the counterparty to certain transactions, magnification of losses incurred due to changes in the market value of the securities, instruments, indices or interest rates to which the derivative instrument relates, risks that the transactions may not be liquid and risks arising from margin requirements. The use of derivatives involves risks that are different from, and possibly greater than, the risks associated with other portfolio investments. Derivatives may involve the use of highly specialized instruments that require investment techniques and risk analyses different from those associated with other portfolio investments. All of the Fund's holdings, including derivative instruments, are marked-to-market each day with the change in value reflected in unrealized appreciation (depreciation). Upon disposition, a realized gain or loss is recognized.
Certain derivative transactions may give rise to a form of leverage. Leverage magnifies the potential for gain and the risk of loss. Leverage associated with derivative transactions may cause the Fund to liquidate portfolio positions when it may not be advantageous to do so to satisfy its obligations or to meet earmarking or segregation requirements, pursuant to applicable Securities and Exchange Commission ("SEC") rules and regulations, or may cause the Fund to be more volatile than if the Fund had not been leveraged. Although the Adviser seeks to use derivatives to further the Fund's investment objectives, there is no assurance that the use of derivatives will achieve this result.
Following is a description of the derivative instruments and techniques that the Fund used during the period and their associated risks:
Options: With respect to options, the Fund is subject to equity risk, interest rate risk and foreign currency exchange risk in the normal course of pursuing its
investment objectives. If the Fund buys an option, it buys a legal contract giving it the right to buy or sell a specific amount of the underlying instrument or foreign currency, or futures contract on the underlying instrument or foreign currency, at an agreed-upon price during a period of time or on a specified date typically in exchange for a premium paid by the Fund. The Fund may purchase and/or sell put and call options. Purchasing call options tends to increase the Fund's exposure to the underlying (or similar) instrument. Purchasing put options tends to decrease the Fund's exposure to the underlying (or similar) instrument. When entering into purchased option contracts, the Fund bears the risk of interest or exchange rates or securities prices moving unexpectedly, in which case, the Fund may not achieve the anticipated benefits of the purchased option contracts; however the risk of loss is limited to the premium paid. Purchased options are reported as part of "Total Investments in Securities" in the Statement of Assets and Liabilities. Premium paid for purchasing options which expired are treated as realized losses. If the Fund sells an option, it sells to another party the right to buy from or sell to the Fund a specific amount of the underlying instrument or foreign currency, or futures contract on the underlying instrument or foreign currency, at an agreed-upon price during a period of time or on a specified date typically in exchange for a premium received by the Fund. When options are purchased OTC, the Fund bears the risk that the counterparty that wrote the option will be unable or unwilling to perform its obligations under the option contract. Options may also be illiquid and the Fund may have difficulty closing out its position. A decision as to whether, when and how to use options involves the exercise of skill and judgment and even a well-conceived option transaction may be unsuccessful because of market behavior or unexpected events. The prices of options can be highly volatile and the use of options can lower total returns.
FASB ASC 815, "Derivatives and Hedging" ("ASC 815"), is intended to improve financial reporting about derivative instruments by requiring enhanced disclosures to enable investors to better understand how and why the Fund uses derivative instruments, how these derivative instruments are accounted for and their effects on the Fund's financial position and results of operations.
21
Morgan Stanley Institutional Fund Trust
Annual Report — September 30, 2017
Notes to Financial Statements (cont'd)
The following table sets forth the fair value of the Fund's derivative contracts by primary risk exposure as of September 30, 2017.
| | | Asset Derivatives
Statement of Assets and
Liabilities Location | | Primary Risk
Exposure | | Value
(000) | |
Options Purchased
| | Investments, at Value
(Options Purchased) | |
Currency Risk | | $ | 259 | (a) | |
(a) Amounts are included in Investments in Securities in the Statement of Assets and Liabilities.
The following tables set forth by primary risk exposure the Fund's realized gains (losses) and change in unrealized appreciation (depreciation) by type of derivative contract for the year ended September 30, 2017 in accordance with ASC 815.
Realized Gain (Loss) | |
Primary Risk Exposure | | Derivative Type | | Value
(000) | |
Currency Risk
| | Investments
(Options Purchased) | | | $(1,546)(b) | | |
(b) Amounts are included in Investments Sold in the Statement of Operations.
Change in Unrealized Appreciation (Depreciation) | |
Primary Risk Exposure | | Derivative Type | | Value
(000) | |
Currency Risk
| | Investments
(Options Purchased) | | | $249(c) | | |
(c) Amounts are included in Investments in the Statement of Operations.
At September 30, 2017, the Fund's derivative assets and liabilities are as follows:
Gross Amounts of Assets and Liabilities Presented in the
Statement of Assets and Liabilities | |
Derivatives | | Assets(d)
(000) | | Liabilities(d)
(000) | |
Options Purchased | | $ | 259 | (a) | | $ | — | | |
(a) Amounts are included in Investments in Securities in the Statement of Assets and Liabilities.
(d) Absent an event of default or early termination, OTC derivative assets and liabilities are presented gross and not offset in the Statement of Assets and Liabilities.
The Fund typically enters into International Swaps and Derivatives Association, Inc. Master Agreements ("ISDA Master Agreements") or similar master agreements (collectively, "Master Agreements") with its contract counterparties for certain OTC derivatives in order to, among other things, reduce its credit risk to counterparties. ISDA Master Agreements include provisions for general obligations, representations, collateral and events of default or termination. Under an ISDA Master Agreement, the Fund typically may offset with the counterparty certain OTC derivative financial instruments' payables and/or
receivables with collateral held and/or posted and create one single net payment (close-out netting) in the event of default, termination and/or potential deterioration in the credit quality of the counterparty. Various Master Agreements govern the terms of certain transactions with counterparties, including transactions such as swap, forward, repurchase and reverse repurchase agreements. These Master Agreements typically attempt to reduce the counterparty risk associated with such transactions by specifying credit protection mechanisms and providing standardization that improves legal certainty. Cross-termination provisions under Master Agreements typically provide that a default in connection with one transaction between the Fund and a counterparty gives the non-defaulting party the right to terminate any other transactions in place with the defaulting party to create one single net payment due to/due from the defaulting party and may be a feature in certain Master Agreements. In the event the Fund exercises its right to terminate a Master Agreement after a counterparty experiences a termination event as defined in the Master Agreement, the return of collateral with market value in excess of the Fund's net liability may be delayed or denied.
The following tables present derivative financial instruments that are subject to enforceable netting arrangements as of September 30, 2017.
Gross Amounts Not Offset in the Statement of Assets and Liabilities | |
Counterparty | | Gross Asset
Derivatives
Presented in
Statement of
Assets and
Liabilities
(000) | | Financial
Instrument
(000) | | Collateral
Received(e)
(000) | | Net Amount
(not less
than $0)
(000) | |
Royal Bank of Scotland | | $ | 259 | | | $ | — | | | $ | (259 | ) | | $ | 0 | | |
(e) In some instances, the actual collateral received may be more than the amount shown here due to overcollateralization.
For the year ended September 30, 2017, the approximate average monthly amount outstanding for each derivative type is as follows:
Options Purchased: | |
Average monthly notional amount | | | 157,824,000 | | |
6. Securities Lending: The Fund lends securities to qualified financial institutions, such as broker-dealers, to earn additional income. Any increase or decrease in the fair value of the securities loaned that might occur and any interest earned or dividends declared on those securities during
22
Morgan Stanley Institutional Fund Trust
Annual Report — September 30, 2017
Notes to Financial Statements (cont'd)
the term of the loan would remain in the Fund. The Fund would receive cash or securities as collateral in an amount equal to or exceeding 100% of the current fair value of the loaned securities. The collateral is marked-to-market daily by State Street Bank and Trust Company ("State Street"), the securities lending agent, to ensure that a minimum of 100% collateral coverage is maintained.
Based on pre-established guidelines, the securities lending agent invests any cash collateral that is received in an affiliated money market portfolio and repurchase agreements. Securities lending income is generated from the earnings on the invested collateral and borrowing fees, less any rebates owed to the borrowers and compensation to the lending agent, and is recorded as "Income from Securities Loaned — Net" in the Fund's Statement of Operations. Risks in securities lending transactions are that a borrower may not provide additional collateral when required or return the securities when due, and that the value of the short-term investments will be less than the amount of cash collateral plus any rebate that is required to be returned to the borrower.
The Fund has the right under the lending agreement to recover the securities from the borrower on demand.
The following table presents financial instruments that are subject to enforceable netting arrangements as of September 30, 2017.
Gross Amounts Not Offset in the Statement of Assets and Liabilities | |
Gross Asset
Amounts
Presented in
Statement of
Assets and
Liabilities
(000) | | Financial
Instrument
(000) | | Collateral
Received
(000) | | Net Amount
(not less
than $0)
(000) | |
| $ | 31,563 | (f) | | $ | — | | | $ | (31,563 | )(g)(h) | | $ | 0 | | |
(f) Represents market value of loaned securities at period end.
(g) The Fund received cash collateral of approximately $33,522,000, of which approximately $33,314,000 was subsequently invested in a Repurchase Agreement and Morgan Stanley Institutional Liquidity Funds as reported in the Portfolio of Investments. As of September 30, 2017, there was uninvested cash of approximately $208,000, which is not reflected in the Portfolio of Investments. In addition, the Fund received non-cash collateral of approximately $121,000 in the form of U.S. Government obligations, which the Fund cannot sell or repledge, and accordingly are not reflected in the Portfolio of Investments.
(h) The actual collateral received is greater than the amount shown here due to overcollateralization.
FASB ASC 860, "Transfers & Servicing: Repurchase-to-Maturity Transactions, Repurchase Financings, and Disclosures", is intended to provide increased transparency
about the types of collateral pledged in securities lending transactions and other similar transactions that are accounted for as secured borrowing.
The following table displays a breakdown of transactions accounted for as secured borrowings, the gross obligations by class of collateral pledged, and the remaining contractual maturity of those transactions as of September 30, 2017.
Remaining Contractual Maturity of the Agreements | |
| | | Overnight and
Continuous
(000) | | <30 days
(000) | | Between
30 &
90 days
(000) | | >90 days
(000) | | Total
(000) | |
Securities Lending
Transactions | |
Common Stocks | | $ | 33,522 | | | $ | — | | | $ | — | | | $ | — | | | $ | 33,522 | | |
Total Borrowings | | $ | 33,522 | | | $ | — | | | $ | — | | | $ | — | | | $ | 33,522 | | |
Gross amount of
recognized liabilities
for securities lending
transactions | | | | | | | | | | $ | 33,522 | | |
7. Restricted Securities: The Fund invests in unregistered or otherwise restricted securities. The term "restricted securities" refers to securities that are unregistered or are held by control persons of the issuer and securities that are subject to contractual restrictions on their resale. As a result, restricted securities may be more difficult to value and the Fund may have difficulty disposing of such assets either in a timely manner or for a reasonable price. In order to dispose of an unregistered security, the Fund, where it has contractual rights to do so, may have to cause such security to be registered. A considerable period may elapse between the time the decision is made to sell the security and the time the security is registered so that the Fund can sell it. Contractual restrictions on the resale of securities vary in length and scope and are generally the result of a negotiation between the issuer and the acquirer of the securities. The Fund would, in either case, bear market risks during that period. Restricted securities are identified in the Portfolio of Investments.
8. Indemnifications: The Trust enters into contracts that contain a variety of indemnifications. The Trust's maximum exposure under these arrangements is unknown. However, the Trust has not had prior claims or losses pursuant to these contracts and expects the risk of loss to be remote.
23
Morgan Stanley Institutional Fund Trust
Annual Report — September 30, 2017
Notes to Financial Statements (cont'd)
9. Dividends and Distributions to Shareholders: Dividends and distributions to shareholders are recorded on the ex-dividend date. Dividends from net investment income, if any, are declared and paid annually. Net realized capital gains, if any, are distributed at least annually.
10. Security Transactions, Income and Expenses: Security transactions are accounted for on the trade date (date the order to buy or sell is executed). Realized gains and losses on the sale of investment securities are determined on the specific identified cost method. Dividend income and other distributions are recorded on the ex-dividend date (except for certain foreign dividends which may be recorded as soon as the Fund is informed of such dividends) net of applicable withholding taxes. Interest income is recognized on the accrual basis except where collection is in doubt. Discounts are accreted and premiums are amortized over the life of the respective securities. Most expenses of the Trust can be directly attributed to a particular Fund. Expenses which cannot be directly attributed are apportioned among the Funds based upon relative net assets or other appropriate methods. Income, expenses (other than class specific expenses — distribution and shareholder services, transfer agency and sub transfer agency fees) and realized and unrealized gains or losses are allocated to each class of shares based upon their relative net assets.
B. Advisory Fees: The Adviser, a wholly-owned subsidiary of Morgan Stanley, provides the Fund with advisory services under the terms of an Investment Advisory Agreement, paid quarterly, at an annual rate of 0.50% of the average daily net assets of the Fund.
The Adviser has agreed to reduce its advisory fee and/or reimburse the Fund so that total annual portfolio operating expenses, excluding certain investment related expenses, taxes, interest and other extraordinary expenses (including litigation), will not exceed 0.80% for Class I shares, 1.15% for Class A shares, 1.65% for Class L shares, 1.90% for Class C shares and 0.73% for Class IS shares. The fee waivers and/or expense reimbursements will continue for at least one year from the date of the Fund's prospectus or until such time as the Trustees act to discontinue all or a portion of such waivers and/or reimbursements when they deem such action is appropriate. For the year ended September 30, 2017, approximately $1,000 of other expenses were reimbursed by the Adviser pursuant to this arrangement.
C. Administration Fees: The Adviser also serves as Administrator to the Trust and provides administrative services pursuant to an Administration Agreement for an annual fee, accrued daily and paid monthly, of 0.08% of the Fund's average daily net assets. Under a Sub-Administration Agreement between the Administrator and State Street, State Street provides certain administrative services to the Trust. For such services, the Administrator pays State Street a portion of the fee the Administrator receives from the Fund.
D. Distribution and Shareholder Services Fees: Morgan Stanley Distribution, Inc. ("MSDI" or the "Distributor"), a wholly-owned subsidiary of the Adviser, and an indirect subsidiary of Morgan Stanley, serves as the Trust's Distributor of Fund shares pursuant to a Distribution Agreement. The Trust has adopted a Shareholder Services Plan with respect to Class A shares pursuant to Rule 12b-1 under the Act. Under the Shareholder Services Plan, the Fund pays the Distributor a shareholder services fee, accrued daily and paid monthly, at an annual rate of 0.25% of the Fund's average daily net assets attributable to Class A shares.
The Trust has adopted a Distribution and Shareholder Services Plan with respect to Class L shares pursuant to Rule 12b-1 under the Act. Under the Distribution and Shareholder Services Plan, the Fund pays the Distributor a distribution fee, accrued daily and paid monthly, at an annual rate of 0.50% and a shareholder services fee, accrued daily and paid monthly, at an annual rate of 0.25% of the Fund's average daily net assets attributable to Class L shares.
The Trust has adopted a Distribution and Shareholder Services Plan with respect to Class C shares pursuant to Rule 12b-1 under the Act. Under the Distribution and Shareholder Services Plan, the Fund pays the Distributor a distribution fee, accrued daily and paid monthly, at an annual rate of 0.75% and a shareholder services fee, accrued daily and paid monthly, at an annual rate of 0.25% of the Fund's average daily net assets attributable to Class C shares.
The distribution and shareholder services fees are used to support the expenses associated with servicing and maintaining accounts. The Distributor may compensate other parties for providing shareholder support services to investors who purchase Class A, Class L and Class C shares.
E. Dividend Disbursing and Transfer Agent: The Trust's dividend disbursing and transfer agent is Boston Financial Data Services, Inc. ("BFDS"). Pursuant to a Transfer Agency Agreement, the Trust pays BFDS a fee based on the number of
24
Morgan Stanley Institutional Fund Trust
Annual Report — September 30, 2017
Notes to Financial Statements (cont'd)
classes, accounts and transactions relating to the Funds of the Trust.
F. Custodian Fees: State Street (the "Custodian") serves as Custodian for the Trust in accordance with a Custodian Agreement. The Custodian holds cash, securities, and other assets of the Trust as required by the Act. Custody fees are payable monthly based on assets held in custody, investment purchases and sales activity and account maintenance fees, plus reimbursement for certain out-of-pocket expenses.
G. Security Transactions and Transactions with Affiliates: For the year ended September 30, 2017, purchases and sales of investment securities for the Fund, other than long-term U.S. Government securities and short-term investments, were approximately $429,202,000 and $1,134,649,000, respectively. There were no purchases and sales of long-term U.S. Government securities for the year ended September 30, 2017.
The Fund invests in the Institutional Class of the Morgan Stanley Institutional Liquidity Funds — Treasury Securities Portfolio (the "Liquidity Funds"), an open-end management investment company managed by the Adviser, both directly and as a portion of the securities held as collateral on loaned securities. Advisory fees paid by the Fund are reduced by an amount equal to its pro-rata share of the advisory and administration fees paid by the Fund due to its investment in the Liquidity Funds. For the year ended September 30, 2017, advisory fees paid were reduced by approximately $47,000 relating to the Fund's investment in the Liquidity Funds.
A summary of the Fund's transactions in shares of the Liquidity Funds during the year ended September 30, 2017 is as follows:
Affiliated
Investment
Company | | Value
September 30,
2016
(000) | | Purchases
at Cost
(000) | | Proceeds
from
Sales
(000) | | Dividend
Income
(000) | |
Liquidity Funds | | $ | 83,604 | | | $ | 597,850 | | | $ | 636,713 | | | $ | 142 | | |
Affiliated
Investment
Company (cont'd) | | Realized
Gain (Loss)
(000) | | Change in
Unrealized
Appreciation
(Depreciation)
(000) | | Value
September 30,
2017
(000) | |
Liquidity Funds | | $ | — | | | $ | — | | | $ | 44,741 | | |
During the year ended September 30, 2017, the Fund incurred approximately $10,000 in brokerage commissions with Morgan Stanley & Co., LLC, an affiliate of the Adviser/Administrator
and Distributor, for portfolio transactions executed on behalf of the Fund.
The Fund is permitted to purchase and sell securities ("cross-trade") from and to other Morgan Stanley Funds as well as other funds and client accounts for which the Adviser or an affiliate of the Adviser serves as investment adviser, pursuant to procedures approved by the Trustees in compliance with Rule 17a-7 under the Act (the "Rule"). Each cross-trade is executed at the current market price in compliance with provisions of the Rule. For the year ended September 30, 2017, the Fund did not engage in any cross-trade transactions.
The Fund has an unfunded Deferred Compensation Plan (the "Compensation Plan"), which allows each independent Trustee to defer payment of all, or a portion, of the fees he or she receives for serving on the Board of Trustees. Each eligible Trustee generally may elect to have the deferred amounts credited with a return equal to the total return on one or more of the Morgan Stanley funds that are offered as investment options under the Compensation Plan. Appreciation/depreciation and distributions received from these investments are recorded with an offsetting increase/decrease in the deferred compensation obligation and do not affect the NAV of the Fund.
H. Federal Income Taxes: It is the Fund's intention to continue to qualify as a regulated investment company and distribute all of its taxable and tax-exempt income. Accordingly, no provision for federal income taxes is required in the financial statements.
The Fund may be subject to taxes imposed by countries in which it invests. Such taxes are generally based on income and/or capital gains earned or repatriated. Taxes are accrued based on net investment income, net realized gains and net unrealized appreciation as such income and/or gains are earned. Taxes may also be based on transactions in foreign currency and are accrued based on the value of investments denominated in such currency.
FASB ASC 740-10, "Income Taxes — Overall", sets forth a minimum threshold for financial statement recognition of the benefit of a tax position taken or expected to be taken in a tax return. Management has concluded there are no significant uncertain tax positions that would require recognition in the financial statements. If applicable, the Fund recognizes interest accrued related to unrecognized tax benefits in "Interest Expense" and penalties in "Other Expenses" in the Statement of Operations. The Fund files tax returns with the U.S. Internal Revenue Service, New York and various states. Each of the
25
Morgan Stanley Institutional Fund Trust
Annual Report — September 30, 2017
Notes to Financial Statements (cont'd)
tax years in the four-year period ended September 30, 2017, remains subject to examination by taxing authorities.
The tax character of distributions paid may differ from the character of distributions shown in the Statements of Changes in Net Assets due to short-term capital gains being treated as ordinary income for tax purposes. The tax character of distributions paid during fiscal years 2017 and 2016 was as follows:
2017
Distributions
Paid From: | | 2016
Distributions
Paid From: | |
Ordinary
Income
(000) | | Long-Term
Capital Gain
(000) | | Ordinary
Income
(000) | | Long-Term
Capital Gain
(000) | |
| $ | — | | | $ | 352,133 | | | $ | — | | | $ | 455,768 | | |
The amount and character of income and gains to be distributed are determined in accordance with income tax regulations which may differ from GAAP. These book/tax differences are either considered temporary or permanent in nature.
Temporary differences are attributable to differing book and tax treatments for the timing of the recognition of gains (losses) on certain investment transactions and the timing of the deductibility of certain expenses.
Permanent differences, primarily due to differing treatments of gains (losses) related to foreign currency transactions and a net operating loss, resulted in the following reclassifications among the components of net assets at September 30, 2017:
Net Investment
Loss
(000) | | Accumulated
Accumulated
Net Realized
Gain
(000) | | Undistributed
Paid-in-
Capital
(000) | |
| $ | 19,958 | | | $ | (16,053 | ) | | $ | (3,905 | ) | |
At September 30, 2017, the components of distributable earnings for the Fund on a tax basis were as follows:
Undistributed
Ordinary
Income
(000) | | Undistributed
Long-Term
Capital Gain
(000) | |
| $ | — | | | $ | 221,500 | | |
Qualified late year losses are capital losses and specified ordinary losses, including currency losses, incurred after October 31 but within the taxable year that, if elected, are deemed to arise on the first day of the Fund's next taxable year. These also include non-specified ordinary losses incurred after December 31 but within the same taxable year. For the year ended September 30,
2017, the Fund deferred to October 1, 2017 for U.S. federal income tax purposes the following losses:
Qualified Late Year
Ordinary Losses
(000) | | Post-October
Capital Losses
(000) | |
| $ | 3,111 | | | $ | — | | |
I. Credit Facility: The Trust and other Morgan Stanley funds participate in a $150,000,000 committed, unsecured revolving line of credit facility (the "facility") with State Street. This facility is to be used for temporary emergency purposes or funding of shareholder redemption requests. The interest rate on borrowings is based on the federal funds rate or one month libor rate plus a spread. The facility also has a commitment fee of 0.25% per annum based on the unused portion of the facility. During the year ended September 30, 2017, the Fund did not have any borrowings under the facility.
J. Other: At September 30, 2017, the Fund had record owners of 10% or greater. Investment activities of these shareholders could have a material impact on the Fund. The aggregate percentage of such owners was 57.1%.
26
Morgan Stanley Institutional Fund Trust
Annual Report — September 30, 2017
Report of Independent Registered Public Accounting Firm
To the Shareholders and Board of Trustees of
Morgan Stanley Institutional Fund Trust —
Mid Cap Growth Portfolio
We have audited the accompanying statement of assets and liabilities, including the portfolio of investments, of Mid Cap Growth Portfolio (one of the funds constituting Morgan Stanley Institutional Fund Trust) (the "Fund") as of September 30, 2017, and the related statement of operations for the year then ended, the statements of changes in net assets for each of the two years in the period then ended and the financial highlights for each of the years or periods indicated therein. These financial statements and financial highlights are the responsibility of the Fund's management. Our responsibility is to express an opinion on these financial statements and financial highlights based on our audits.
We conducted our audits in accordance with the standards of the Public Company Accounting Oversight Board (United States). Those standards require that we plan and perform the audit to obtain reasonable assurance about whether the financial statements and financial highlights are free of material misstatement. We were not engaged to perform an audit of the Fund's internal control over financial reporting. Our audits included consideration of internal control over financial reporting as a basis for designing audit procedures that are appropriate in the circumstances, but not for the purpose of expressing an opinion on the effectiveness of the Fund's internal control over financial reporting. Accordingly, we express no such opinion. An audit also includes examining, on a test basis, evidence supporting the amounts and disclosures in the financial statements and financial highlights, assessing the accounting principles used and significant estimates made by management, and evaluating the overall financial statement presentation. Our procedures included confirmation of securities owned as of September 30, 2017, by correspondence with the custodian and others or by other appropriate auditing procedures where replies from others were not obtained. We believe that our audits provide a reasonable basis for our opinion.
In our opinion, the financial statements and financial highlights referred to above present fairly, in all material respects, the financial position of Mid Cap Growth Portfolio (one of the funds constituting Morgan Stanley Institutional Fund Trust) at September 30, 2017, the results of its operations for the year then ended, the changes in its net assets for each of the two years in the period then ended and the financial highlights for each of the years or periods indicated therein, in conformity with U.S. generally accepted accounting principles.

Boston, Massachusetts
November 22, 2017
27
Morgan Stanley Institutional Fund Trust
Annual Report — September 30, 2017
Investment Advisory Agreement Approval (unaudited)
Nature, Extent and Quality of Services
The Board reviewed and considered the nature and extent of the investment advisory services provided by the Adviser (as defined herein) under the advisory agreement, including portfolio management, investment research and equity and fixed income securities trading. The Board also reviewed and considered the nature and extent of the non-advisory, administrative services provided by the Adviser under the administration agreement, including accounting, operations, clerical, bookkeeping, compliance, business management and planning, legal services and the provision of supplies, office space and utilities at the Adviser's expense. The Board also considered the Adviser's investment in personnel and infrastructure that benefits the Fund. (The advisory and administration agreements together are referred to as the "Management Agreement.") The Board also considered that the Adviser serves a variety of other investment advisory clients and has experience overseeing service providers. The Board also compared the nature of the services provided by the Adviser with similar services provided by non-affiliated advisers as presented to the Board by Broadridge Financial Solutions, Inc. ("Broadridge").
The Board reviewed and considered the qualifications of the portfolio managers, the senior administrative managers and other key personnel of the Adviser who provide the administrative and advisory services to the Fund. The Board determined that the Adviser's portfolio managers and key personnel are well qualified by education and/or training and experience to perform the services in an efficient and professional manner. The Board concluded that the nature and extent of the advisory and administrative services provided were necessary and appropriate for the conduct of the business and investment activities of the Fund and supported its decision to approve the Management Agreement.
Performance, Fees and Expenses of the Fund
The Board reviewed the performance, fees and expenses of the Fund compared to its peers, as presented by Broadridge, and to appropriate benchmarks where applicable. The Board discussed with the Adviser the performance goals and the actual results achieved in managing the Fund. When considering a fund's performance, the Board and the Adviser place emphasis on trends and longer-term returns (focusing on one-year, three-year and five-year performance, as of December 31, 2016, or since inception, as applicable). When a fund underperforms its benchmark and/or its peer group average, the Board and the Adviser discuss the causes of such underperformance and, where necessary, they discuss specific changes to investment strategy or investment personnel. The Board noted that the Fund's performance was below its peer group average for the one-, three- and five-year periods. The Board discussed with the Adviser the level of the advisory and administration fees (together, the "management fee") for this Fund relative to comparable funds and/or other accounts advised by the Adviser and/or compared to its peers as presented by Broadridge. In addition to the management fee, the Board also reviewed the Fund's total expense ratio. The Board noted that the Fund's management fee and total expense ratio were lower than its peer group averages. After discussion, the Board concluded that the Fund's (i) performance was acceptable; and (ii) management fee and total expense ratio were competitive with its peer group averages.
Economies of Scale
The Board considered the size and growth prospects of the Fund and how that relates to the Fund's total expense ratio and particularly the Fund's management fee rate, which does not include breakpoints. In conjunction with its review of the Adviser's profitability, the Board discussed with the Adviser how a change in assets can affect the efficiency or effectiveness of managing the Fund and whether the management fee level is appropriate relative to current and projected asset levels and/or whether the management fee structure reflects economies of scale as asset levels change. The Board has determined that its review of the actual and/or potential economies of scale of the Fund supports its decision to approve the Management Agreement.
Profitability of the Adviser and Affiliates
The Board considered information concerning the costs incurred and profits realized by the Adviser and its affiliates during the last year from their relationship with the Fund and during the last two years from their relationship with the Morgan Stanley Fund Complex and reviewed with the Adviser the cost allocation methodology used to determine the profitability of the Adviser and affiliates. The Board has determined that its review of the analysis of the Adviser's expenses and profitability supports its decision to approve the Management Agreement.
28
Morgan Stanley Institutional Fund Trust
Annual Report — September 30, 2017
Investment Advisory Agreement Approval (unaudited) (cont'd)
Other Benefits of the Relationship
The Board considered other direct and indirect benefits to the Adviser and/or its affiliates derived from their relationship with the Fund and other funds advised by the Adviser. These benefits may include, among other things, fees for trading, distribution and/or shareholder servicing and for transaction processing and reporting platforms used by securities lending agents, and research received by the Adviser generated from commission dollars spent on funds' portfolio trading. The Board reviewed with the Adviser these arrangements and the reasonableness of the Adviser's costs relative to the services performed. The Board has determined that its review of the other benefits received by the Adviser or its affiliates supports its decision to approve the Management Agreement.
Resources of the Adviser and Historical Relationship Between the Fund and the Adviser
The Board considered whether the Adviser is financially sound and has the resources necessary to perform its obligations under the Management Agreement. The Board also reviewed and considered the historical relationship between the Fund and the Adviser, including the organizational structure of the Adviser, the policies and procedures formulated and adopted by the Adviser for managing the Fund's operations and the Board's confidence in the competence and integrity of the senior managers and key personnel of the Adviser. The Board concluded that the Adviser has the financial resources necessary to fulfill its obligations under the Management Agreement and that it is beneficial for the Fund to continue its relationship with the Adviser.
Other Factors and Current Trends
The Board considered the controls and procedures adopted and implemented by the Adviser and monitored by the Fund's Chief Compliance Officer and concluded that the conduct of business by the Adviser indicates a good faith effort on its part to adhere to high ethical standards in the conduct of the Fund's business.
General Conclusion
After considering and weighing all of the above factors, with various written materials and verbal information presented by the Adviser, the Board concluded that it would be in the best interest of the Fund and its shareholders to approve renewal of the Management Agreement for another year. In reaching this conclusion the Board did not give particular weight to any single piece of information or factor referenced above. The Board considered these factors and information over the course of the year and in numerous meetings, some of which were in executive session with only the independent Board members and their counsel present. It is possible that individual Board members may have weighed these factors, and the information presented, differently in reaching their individual decisions to approve the Management Agreement.
29
Morgan Stanley Institutional Fund Trust
Annual Report — September 30, 2017
Federal Tax Notice (unaudited)
For federal income tax purposes, the following information is furnished with respect to the distributions paid by the Fund during its taxable year ended September 30, 2017.
The Fund designated and paid approximately $352,133,000 as a long-term capital gain distribution.
For federal income tax purposes, the following information is furnished with respect to the Fund's earnings for its taxable year ended September 30, 2017. When distributed, certain earnings may be subject to a maximum tax rate of 15% as provided for by the Jobs and Growth Tax Relief Reconciliation Act of 2003. The Fund designated up to a maximum of approximately $4,597,000 as taxable at this lower rate.
In January, the Fund provides tax information to shareholders for the preceding calendar year.
30
Morgan Stanley Institutional Fund Trust
Annual Report — September 30, 2017
Privacy Notice (unaudited)
MORGAN STANLEY INVESTMENT MANAGEMENT INC.
AN IMPORTANT NOTICE CONCERNING OUR U.S. PRIVACY POLICY
We are required by federal law to provide you with a copy of our privacy policy annually. This policy applies to current and former individual investors in funds managed or sponsored by Morgan Stanley Investment Management Inc. ("MSIM") as well as current and former individual clients of MSIM. This policy is not applicable to partnerships, corporations, trusts or other non-individual clients or investors. Please note that we may amend this policy at any time, and will inform you of any changes as required by law.
WE RESPECT YOUR PRIVACY
We appreciate that you have provided us with your personal financial information. We strive to maintain the privacy of such information while we help you achieve your financial objectives. This Notice describes what non-public personal information we collect about you, why we collect it, when we may share it with others and how certain others may use it. It discusses the steps you may take to limit our sharing of certain information about you to affiliated companies in the Morgan Stanley family of companies ("other Morgan Stanley companies"). It also discloses how you may limit use of certain shared information for marketing purposes by other Morgan Stanley branded companies. Throughout this policy, we refer to the non-public information that personally identifies you or your accounts as "personal information.''
1. WHAT PERSONAL INFORMATION DO WE COLLECT ABOUT YOU?
We obtain personal information from applications and other forms you submit to us, from your dealings with us, from consumer reporting agencies, from our Web sites and from third parties and other sources.
For example:
• We may collect information such as your name, address, e-mail address, telephone/fax numbers, assets, income and investment objectives through subscription documents, applications and other forms you submit to us.
• We may obtain information about account balances, your use of account(s) and the types of products and services you prefer to receive from us through your dealings and transactions with us and other sources.
• We may obtain information about your creditworthiness and credit history from consumer reporting agencies.
• We may collect background information from and through third-party vendors to verify representations you have made and to comply with various regulatory requirements.
• If you interact with us through our public and private Web sites, we may collect information that you provide directly through online communications (such as an e-mail address). We may also collect information about your Internet service provider, your domain name, your computer's operating system and Web browser, your use of our Web sites and your product and service preferences, through the use of "cookies." Please consult the Terms of Use of these sites for more details.
2. WHEN DO WE DISCLOSE PERSONAL INFORMATION WE COLLECT ABOUT YOU?
We may disclose personal information we collect about you to other Morgan Stanley companies and to non-affiliated third parties.
a. Information We Disclose to Other Morgan Stanley Companies.
We may disclose personal information to other Morgan Stanley companies for a variety of reasons, including to manage your account(s) effectively, to service and process your transactions, to let you know about products and services offered by us and other Morgan Stanley companies, to manage our business, and as otherwise required or permitted by law. Offers for products and services from other Morgan Stanley companies are developed under conditions designed to safeguard your personal information.
31
Morgan Stanley Institutional Fund Trust
Annual Report — September 30, 2017
Privacy Notice (unaudited) (cont'd)
b. Information We Disclose to Non-affiliated Third Parties.
We do not disclose personal information that we collect about you to non-affiliated third parties except to those who provide marketing services on our behalf, to financial institutions with whom we have joint marketing agreements, and as otherwise required or permitted by law. For example, we may disclose personal information to non-affiliated third parties for servicing and processing transactions, to offer our own products and services, to protect against fraud, for institutional risk control, to respond to judicial process or to perform services on our behalf. When we share personal information with a non-affiliated third party, they are required to limit their use of personal information to the particular purpose for which it was shared and they are not allowed to share personal information with others except to fulfill that limited purpose or as may be permitted or required by law.
3. HOW DO WE PROTECT THE SECURITY AND CONFIDENTIALITY OF PERSONAL INFORMATION WE COLLECT ABOUT YOU?
We maintain physical, electronic and procedural security measures to help safeguard the personal information we collect about you. We have internal policies governing the proper handling of client information. Third parties that provide support or marketing services on our behalf may also receive personal information, and we require them to adhere to confidentiality standards with respect to such information.
4. HOW CAN YOU LIMIT THE SHARING OF CERTAIN TYPES OF PERSONAL INFORMATION WITH OTHER MORGAN STANLEY COMPANIES?
We offer you choices as to whether we share with other Morgan Stanley companies the personal information that was collected to determine your eligibility for products and services you request ("eligibility information"). Eligibility information does not include your identification information or personal information pertaining to our transactions or experiences with you. Please note that, even if you direct us not to share eligibility information with other Morgan Stanley companies ("opt-out"), we may still share personal information, including eligibility information, with those companies in circumstances excluded from the opt-out under applicable law, such as to process transactions or to service your account.
5. HOW CAN YOU LIMIT THE USE OF CERTAIN TYPES OF PERSONAL INFORMATION BY OTHER MORGAN STANLEY COMPANIES FOR MARKETING?
By following the opt-out instructions in Section 6 below, you may limit other Morgan Stanley branded companies from marketing their products or services to you based on personal information we disclose to them. This information may include, for example, your income and account history with us. Please note that, even if you choose to limit Other Morgan Stanley Companies from using personal information about you that we may share with them for marketing their products and services to you, Other Morgan Stanley Companies may use your personal information that they obtain from us to market to you in circumstances permitted by law, such as if the Other Morgan Stanley Company has its own relationship with you.
6. HOW CAN YOU SEND US AN OPT-OUT INSTRUCTION?
If you wish to limit our sharing of eligibility information about you with other Morgan Stanley companies or other Morgan Stanley companies' use of personal information for marketing purposes, as described in this notice, you may do so by:
• Calling us at (800) 548-7786
Monday–Friday between 8a.m. and 6p.m.(EST)
• Writing to us at the following address:
Boston Financial Data Services, Inc.
c/o Privacy Coordinator
P.O. Box 219804
Kansas City, Missouri 64121
32
Morgan Stanley Institutional Fund Trust
Annual Report — September 30, 2017
Privacy Notice (unaudited) (cont'd)
Your written request should include your name, address, telephone number and account number(s) to which the opt-out applies and whether you are opting out with respect to sharing of eligibility information (Section 4 above), or if information used for Marketing (Section 5 above) or both. Written opt-out requests should not be sent with any other correspondence. In order to process your request, we require that the request be provided by you directly and not through a third party.
Your opt-out preference will remain in effect with respect to this policy (as it may be amended) until you notify us otherwise. If you have a joint account, your direction for us not to share this information with other Morgan Stanley companies and for those other Morgan Stanley companies not to use your personal information for marketing will be applied to all account holders on that account. Please understand that if you limit our sharing or our affiliated companies' use of personal information, you and any joint account holder(s) may not receive information about Morgan Stanley products and services, including products or services that could help you manage your financial resources and achieve your investment objectives.
7. WHAT IF AN AFFILIATED COMPANY BECOMES A NON-AFFILIATED THIRD PARTY?
If, at any time in the future, an affiliated company becomes a non-affiliated third party, further disclosures of personal information made to the former affiliated company will be limited to those described in Section 2(b) above relating to non-affiliated third parties. If you elected under Section 6 to limit disclosures we make to affiliated companies, or use of personal information by affiliated companies, your election will not apply to use by any former affiliated company of your personal information in their possession once it becomes a non-affiliated third party.
SPECIAL NOTICE TO RESIDENTS OF VERMONT
The following section supplements our policy with respect to our individual clients who have a Vermont address and supersedes anything to the contrary in the above policy with respect to those clients only.
The state of Vermont requires financial institutions to obtain your consent prior to sharing personal information that they collect about you with affiliated companies and non-affiliated third parties other than in certain limited circumstances. Except as permitted by law, we will not share personal information we collect about you with non-affiliated third parties or other Morgan Stanley companies unless you provide us with your written consent to share such information ("opt-in").
If you wish to receive offers for investment products and services offered by or through other Morgan Stanley companies, please notify us in writing at the following address:
Boston Financial Data Services, Inc.
c/o Privacy Coordinator
P.O. Box 219804
Kansas City, Missouri 64121
Your authorization should include your name, address, telephone number and account number(s) to which the opt-in applies and should not be sent with any other correspondence. In order to process your authorization, we require that the authorization be provided by you directly and not through a third party.
SPECIAL NOTICE TO RESIDENTS OF CALIFORNIA
The following section supplements our policy with respect to our individual clients who have a California address and supersedes anything to the contrary in the above policy with respect to those clients only.
In response to a California law, if your account has a California home address, your personal information will not be disclosed to non-affiliated third parties except as permitted by applicable California law, and we will limit sharing such information with our affiliates to comply with California privacy laws that apply to us.
33
Morgan Stanley Institutional Fund Trust
Annual Report — September 30, 2017
Trustee and Officer Information (unaudited)
Independent Trustees:
Name, Age and Address of
Independent Trustee | | Position(s)
Held with
Registrant | | Length of Time
Served* | | Principal Occupation(s) During Past 5 Years
and Other Relevant Professional Experience | | Number of
Portfolios in
Fund Complex
Overseen by
Independent
Trustee** | | Other Directorships
Held by Independent
Trustee*** | |
Frank L. Bowman (72)
c/o Perkins Coie LLP
Counsel to the Independent Trustees
30 Rockefeller Plaza
New York, NY 10112 | | Trustee | | Since
August
2006 | | President, Strategic Decisions, LLC (consulting) (since February 2009); Director or Trustee of various Morgan Stanley Funds (since August 2006); Chairperson of the Compliance and Insurance Committee (since October 2015); formerly, Chairperson of the Insurance Sub-Committee of the Compliance and Insurance Committee (2007-2015); served as President and Chief Executive Officer of the Nuclear Energy Institute (policy organization) (February 2005-November 2008); retired as Admiral, U.S. Navy after serving over 38 years on active duty including 8 years as Director of the Naval Nuclear Propulsion Program in the Department of the Navy and the U.S. Department of Energy (1996-2004); served as Chief of Naval Personnel (July 1994-September 1996) and on the Joint Staff as Director of Political Military Affairs (June 1992-July 1994); knighted as Honorary Knight Commander of the Most Excellent Order of the British Empire; awarded the Officier de l'Orde National du Mérite by the French Government; elected to the National Academy of Engineering (2009). | | | 90 | | | Director of BP p.l.c.; Director of Naval and Nuclear Technologies LLP; Director Emeritus of the Armed Services YMCA; Director of the U.S. Naval Submarine League; Member of the National Security Advisory Council of the Center for U.S. Global Engagement and a member of the CNA Military Advisory Board; Chairman of the charity J Street Cup Golf; Trustee of Fairhaven United Methodist Church; and Director of other various non-profit organizations. | |
Kathleen A. Dennis (64)
c/o Perkins Coie LLP
Counsel to the Independent Trustees
30 Rockefeller Plaza
New York, NY 10112 | | Trustee | | Since
August
2006 | | President, Cedarwood Associates (mutual fund and investment management consulting) (since July 2006); Chairperson of the Liquidity and Alternatives Sub-Committee of the Investment Committee (since October 2006) and Director or Trustee of various Morgan Stanley Funds (since August 2006); formerly, Senior Managing Director of Victory Capital Management (1993-2006). | | | 91 | | | Director of various non-profit organizations. | |
Nancy C. Everett (62)
c/o Perkins Coie LLP
Counsel to the Independent Trustees
30 Rockefeller Plaza
New York, NY 10112 | | Trustee | | Since
January
2015 | | Chief Executive Officer, Virginia Commonwealth University Investment Company (since November 2015); Owner OBIR, LLC (institutional investment management consulting) (since June 2014); formerly, Managing Director, BlackRock, Inc. (February 2011-December 2013); and Chief Executive Officer, General Motors Asset Management (a/k/a Promark Global Advisors, Inc.) (June 2005-May 2010). | | | 91 | | | Formerly, Member of Virginia Commonwealth University School of Business Foundation (2005-2016); Member of Virginia Commonwealth University Board of Visitors (2013-2015); Member of Committee on Directors for Emerging Markets Growth Fund, Inc. (2007-2010); Chairperson of Performance Equity Management, LLC (2006-2010); and Chairperson, GMAM Absolute Return Strategies Fund, LLC (2006-2010). | |
34
Morgan Stanley Institutional Fund Trust
Annual Report — September 30, 2017
Trustee and Officer Information (unaudited) (cont'd)
Independent Trustees: (cont'd)
Name, Age and Address of
Independent Trustee | | Position(s)
Held with
Registrant | | Length of Time
Served* | | Principal Occupation(s) During Past 5 Years
and Other Relevant Professional Experience | | Number of
Portfolios in
Fund Complex
Overseen by
Independent
Trustee** | | Other Directorships
Held by Independent
Trustee*** | |
Jakki L. Haussler (60)
c/o Perkins Coie LLP
Counsel to the Independent Trustees
30 Rockefeller Plaza
New York, NY 10112 | | Trustee | | Since
January
2015 | | Chairman and Chief Executive Officer, Opus Capital Group (since January 1996); formerly, Director, Capvest Venture Fund, LP (May 2000-December 2011); Partner, Adena Ventures, LP (July 1999-December 2010); Director, The Victory Funds (February 2005-July 2008). | | | 91 | | | Director of Cincinnati Bell Inc. and Member, Audit Committee and Compensation Committee; Director of Northern Kentucky University Foundation and Member, Investment Committee; Member of Chase College of Law Transactional Law Practice Center Board of Advisors; Director of Best Transport; Director of Chase College of Law Board of Visitors; formerly, Member, University of Cincinnati Foundation Investment Committee; Member, Miami University Board of Visitors (2008-2011); Trustee of Victory Funds (2005-2008) and Chairman, Investment Committee (2007-2008) and Member, Service Provider Committee (2005-2008). | |
Dr. Manuel H. Johnson (68)
c/o Johnson Smick
International, Inc.
220 I Street, NE —
Suite 200
Washington, D.C. 20002 | | Trustee | | Since
July
1991 | | Senior Partner, Johnson Smick International, Inc. (consulting firm); Chairperson of the Investment Committee (since October 2006) and Director or Trustee of various Morgan Stanley Funds (since July 1991); Co-Chairman and a founder of the Group of Seven Council (G7C) (international economic commission); formerly, Chairperson of the Audit Committee (July 1991-September 2006), Vice Chairman of the Board of Governors of the Federal Reserve System and Assistant Secretary of the U.S. Treasury. | | | 91 | | | Director of NVR, Inc. (home construction). | |
Joseph J. Kearns (75)
c/o Kearns & Associates LLC
46 E Peninsula Center
#385 Rolling Hills Estates,
CA 90274-3712 | | Trustee | | Since
August
1994 | | President, Kearns & Associates LLC (investment consulting); Chairperson of the Audit Committee (since October 2006) and Director or Trustee of various Morgan Stanley Funds (since August 1994); formerly, Deputy Chairperson of the Audit Committee (July 2003-September 2006) and Chairperson of the Audit Committee of various Morgan Stanley Funds (since August 1994); CFO of the J. Paul Getty Trust. | | | 93 | | | Director of Electro Rent Corporation (equipment leasing). Prior to December 31, 2013, Director of The Ford Family Foundation. | |
35
Morgan Stanley Institutional Fund Trust
Annual Report — September 30, 2017
Trustee and Officer Information (unaudited) (cont'd)
Independent Trustees: (cont'd)
Name, Age and Address of
Independent Trustee | | Position(s)
Held with
Registrant | | Length of Time
Served* | | Principal Occupation(s) During Past 5 Years
and Other Relevant Professional Experience | | Number of
Portfolios in
Fund Complex
Overseen by
Independent
Trustee** | | Other Directorships
Held by Independent
Trustee*** | |
Michael F. Klein (58)
c/o Perkins Coie LLP
Counsel to the Independent Trustees
30 Rockefeller Plaza
New York, NY 10112 | | Trustee | | Since
August
2006 | | Managing Director, Aetos Capital, LLC (since March 2000); Co-President, Aetos Alternatives Management, LLC (since January 2004) and Co-Chief Executive Officer of Aetos Capital LLC (since August 2013); Chairperson of the Fixed Income Sub-Committee of the Investment Committee (since October 2006) and Director or Trustee of various Morgan Stanley Funds (since August 2006); formerly, Managing Director, Morgan Stanley & Co. Inc. and Morgan Stanley Dean Witter Investment Management, President, various Morgan Stanley Funds (June 1998-March 2000) and Principal, Morgan Stanley & Co. Inc. and Morgan Stanley Dean Witter Investment Management (August 1997-December 1999). | | | 90 | | | Director of certain investment funds managed or sponsored by Aetos Capital, LLC; Director of Sanitized AG and Sanitized Marketing AG (specialty chemicals). | |
Patricia Maleski (57)
c/o Perkins Coie LLP
Counsel to the Independent Trustees
30 Rockefeller Plaza
New York, NY 10112 | | Trustee | | Since
January
2017 | | Managing Director, JPMorgan Asset Management (2004-2016); Oversight and Control Head of Fiduciary and Conflicts of Interest Program(2015-2016); Chief Control Officer-Global Asset Management (2013-2015); President, JPMorgan Funds (2010-2013); Chief Administrative Officer (2004-2013); various other positions including Treasurer and Board Liaison (since 2001). | | | 91 | | | None. | |
Michael E. Nugent (81)
522 Fifth Avenue
New York, NY 10036 | | Chair of the
Board and
Trustee | | Chair of the
Boards since
July 2006 and
Trustee since
July 1991 | | Chair of the Boards of various Morgan Stanley Funds (since July 2006); Chairperson of the Closed-End Fund Committee (since June 2012) and Director or Trustee of various Morgan Stanley Funds (since July 1991); formerly, Chairperson of the Insurance Committee (until July 2006); General Partner, Triumph Capital, L.P. (private investment partnership) (1988-2013). | | | 92 | | | None. | |
W. Allen Reed (70)
c/o Perkins Coie LLP
Counsel to the Independent Trustees
30 Rockefeller Plaza
New York, NY 10112 | | Trustee | | Since
August
2006 | | Chairperson of the Equity Sub-Committee of the Investment Committee (since October 2006) and Director or Trustee of various Morgan Stanley Funds (since August 2006); formerly, President and CEO of General Motors Asset Management; Chairman and Chief Executive Officer of the GM Trust Bank and Corporate Vice President of General Motors Corporation (August 1994-December 2005). | | | 91 | | | Director of Legg Mason, Inc.; formerly, Director of the Auburn University Foundation (2010-2015). | |
Fergus Reid (85)
c/o Joe Pietryka, Inc.
85 Charles Colman Blvd.
Pawling, NY 12564 | | Trustee | | Since
June
1992 | | Chairman, Joe Pietryka, Inc.; Chairperson of the Governance Committee and Director or Trustee of various Morgan Stanley Funds (since June 1992). | | | 92 | | | Formerly, Trustee and Director of certain investment companies in the JP Morgan Fund Complex managed by JP Morgan Investment Management Inc. (1987-2012). | |
* This is the earliest date the Trustee began serving the Morgan Stanley Funds. Each Trustee serves an indefinite term, until his or her successor is elected.
** The Fund Complex includes (as of December 31, 2016) all open-end and closed-end funds (including all of their portfolios) advised by Morgan Stanley Investment Management Inc. (the "Adviser") and any funds that have an adviser that is an affiliated person of the Adviser (including, but not limited to, Morgan Stanley AIP GP LP).
*** This includes any directorships at public companies and registered investment companies held by the Trustee at any time during the past five years.
36
Morgan Stanley Institutional Fund Trust
Annual Report — September 30, 2017
Trustee and Officer Information (unaudited) (cont'd)
Executive Officers:
Name, Age and Address of Executive Officer | | Position(s) Held
with
Registrant | | Length of
Time Served* | | Principal Occupation(s) During Past 5 Years | |
John H. Gernon (54)
522 Fifth Avenue
New York, NY 10036 | | President and
Principal
Executive
Officer | | Since
September
2013 | | President and Principal Executive Officer of the Equity and Fixed Income Funds and the Morgan Stanley AIP Funds (since September 2013) and the Liquidity Funds and various money market funds (since May 2014) in the Fund Complex; Managing Director of the Adviser; Head of Product (since 2006). | |
Timothy J. Knierim (58)
522 Fifth Avenue
New York, NY 10036 | | Chief
Compliance
Officer | | Since
December
2016 | | Managing Director of the Adviser and various entities affiliated with the Adviser; Chief Compliance Officer of various Morgan Stanley Funds and the Adviser (since December 2016) and Chief Compliance Officer of Morgan Stanley AIP GP LP (since 2014). Formerly, Managing Director and Deputy Chief Compliance Officer of the Adviser (2014-2016); and formerly, Chief Compliance Officer of Prudential Investment Management, Inc. (2007-2014). | |
Francis J. Smith (52)
522 Fifth Avenue
New York, NY 10036 | | Treasurer and
Principal
Financial
Officer | | Treasurer
since July 2003 and Principal Financial Officer since September 2002 | | Manging Director of the Adviser and various entities affiliated with the Adviser; Treasurer (since July 2003) and Principal Financial Officer of various Morgan Stanley Funds (since September 2002). | |
Mary E. Mullin (50)
522 Fifth Avenue
New York, NY 10036 | | Secretary | | Since
June
1999 | | Executive Director of the Adviser; Secretary of various Morgan Stanley Funds (since June 1999). | |
Michael J. Key (38)
522 Fifth Avenue
New York, NY 10036 | | Vice President | | Since
June
2017 | | Vice President of the Equity and Fixed Income Funds, Liquidity Funds, various money market funds and the Morgan Stanley AIP Funds in the Fund Complex (since June 2017); Executive Director of the Adviser; Head of Product Development for Equity and Fixed Income Funds (since August 2013). | |
* This is the earliest date the officer began serving the Morgan Stanley Funds. Each officer serves a one-year term, until his or her successor is elected and qualifies.
37
Morgan Stanley Institutional Fund Trust
Annual Report — September 30, 2017
Adviser and Administrator
Morgan Stanley Investment Management Inc.
522 Fifth Avenue
New York, New York 10036
Distributor
Morgan Stanley Distribution, Inc.
522 Fifth Avenue
New York, New York 10036
Dividend Disbursing and Transfer Agent
Boston Financial Data Services, Inc.
2000 Crown Colony Drive
Quincy, Massachusetts 02169
Custodian
State Street Bank and Trust Company
One Lincoln Street
Boston, Massachusetts 02111
Legal Counsel
Dechert LLP
1095 Avenue of the Americas
New York, New York 10036
Counsel to the Independent Trustees
Perkins Coie LLP
30 Rockefeller Plaza
New York, New York 10112
Independent Registered Public Accounting Firm
Ernst & Young LLP
200 Clarendon Street
Boston, Massachusetts 02116
Reporting to Shareholders
Each Morgan Stanley Fund provides a complete schedule of portfolio holdings in its semi-annual and annual reports within 60 days of the end of the fund's second and fourth fiscal quarters. The semi-annual and annual reports are filed electronically with the Securities and Exchange Commission (SEC) on Form N-CSRS and Form N-CSR, respectively. Morgan Stanley also delivers the semi-annual and annual reports to fund shareholders and makes these reports available on its public website, www.morganstanley.com/im. Each Morgan Stanley fund also files a complete schedule of portfolio holdings with the SEC for the fund's first and third fiscal quarters on Form N-Q. Morgan Stanley does not deliver the reports for the first and third fiscal quarters to shareholders, nor are the reports posted to the Morgan Stanley public website. You may, however, obtain the Form N-Q filings (as well as the Form N-CSR and N-CSRS filings) by accessing the SEC's website, www.sec.gov. You may also review and copy them at the SEC's Public Reference Room in Washington, DC. Information on the operation of the SEC's Public Reference Room may be obtained by calling the SEC toll free at 1 (800) SEC-0330. You can also request copies of these materials, upon payment of a duplicating fee, by electronic request at the SEC's email address (publicinfo@sec.gov) or by writing to the SEC's Public Reference Section, Washington, D.C. 20549-1520.
Proxy Voting Policies and Procedures and Proxy Voting Record
You may obtain a copy of the Trust's Proxy Voting Policy and Procedures and information regarding how the Trust voted proxies relating to portfolio securities during the most recent twelve-month period ended June 30, without charge, upon request, by calling toll free 1 (800) 548-7786 or by visiting our website at www.morganstanley.com/im. This information is also available on the SEC's website at www.sec.gov.
This report is authorized for distribution only when preceded or accompanied by a prospectus or summary prospectus of the applicable Fund of Morgan Stanley Institutional Fund Trust, which describes in detail the Fund's investment policies, risks, fees and expenses. Please read the prospectus carefully before you invest or send money. For additional information, including information regarding the investments comprising the Fund, please visit our website at www.morganstanley.com/im or call toll free 1 (800) 548-7786.
38
(This Page has been left blank intentionally.)
(This Page has been left blank intentionally.)
(This Page has been left blank intentionally.)
Printed in U.S.A.
This Report has been prepared for shareholders and may be distributed to others only if preceded or accompanied by a current prospectus.
Morgan Stanley Investment Management Inc.
522 Fifth Avenue
New York, New York 10036
© 2017 Morgan Stanley. Morgan Stanley Distribution, Inc.

IFTMCGANN
1934339 EXP 11.30.18

Morgan Stanley Institutional Fund Trust
Short Duration Income Portfolio
Annual Report
September 30, 2017

Morgan Stanley Institutional Fund Trust
Annual Report — September 30, 2017
Shareholders' Letter | | | 2 | | |
Expense Example | | | 3 | | |
Investment Overview | | | 4 | | |
Portfolio of Investments | | | 7 | | |
Statement of Assets and Liabilities | | | 14 | | |
Statement of Operations | | | 16 | | |
Statements of Changes in Net Assets | | | 17 | | |
Financial Highlights | | | 19 | | |
Notes to Financial Statements | | | 24 | | |
Report of Independent Registered Public Accounting Firm | | | 33 | | |
Investment Advisory Agreement Approval | | | 34 | | |
Privacy Notice | | | 36 | | |
Trustee and Officer Information | | | 39 | | |
This report is authorized for distribution only when preceded or accompanied by a prospectus or summary prospectus of the applicable Fund of the Morgan Stanley Institutional Fund Trust. To receive a prospectus and/or statement of additional information (SAI), which contains more complete information such as investment objectives, charges, expenses, policies for voting proxies, risk considerations, and describes in detail each of the Fund's investment policies to the prospective investor, please call toll free 1 (800) 548-7786. Please read the prospectuses carefully before you invest or send money.
Additionally, you can access information about the Fund, including performance, characteristics, and investment team commentary, through Morgan Stanley Investment Management's website: www.morganstanley.com/im.
Market forecasts provided in this report may not necessarily come to pass. There is no guarantee that any sectors mentioned will continue to perform as discussed herein or that securities in such sectors will be held by the Fund in the future. There is no assurance that a fund will achieve its investment objective. Funds are subject to market risk, which is the possibility that market values of securities owned by the Fund will decline and, therefore, the value of the Fund's shares may be less than what you paid for them. Accordingly, you can lose money investing in this Fund. Please see the prospectus for more complete information on investment risks.
1
Morgan Stanley Institutional Fund Trust
Annual Report — September 30, 2017
Shareholders' Letter (unaudited)
Dear Shareholders,
We are pleased to provide this Annual report, in which you will learn how your investment in Short Duration Income Portfolio (the "Fund") performed during the latest twelve-month period.
Morgan Stanley Investment Management is a client-centric, investor-led organization. Our global presence, intellectual capital, and breadth of products and services enable us to partner with investors to meet the evolving challenges of today's financial markets. We aim to deliver superior investment service and to empower our clients to make the informed decisions that help them reach their investment goals.
As always, we thank you for selecting Morgan Stanley Investment Management, and look forward to working with you in the months and years ahead.
Sincerely,

John H. Gernon
President and Principal Executive Officer
October 2017
2
Morgan Stanley Institutional Fund Trust
Annual Report — September 30, 2017
Expense Example (unaudited)
Short Duration Income Portfolio
As a shareholder of the Fund, you may incur two types of costs: (1) transactional costs, including sales charge (loads) on purchase payments; and (2) ongoing costs, which may include advisory fees, administration fees, distribution and shareholder services fees; and other Fund expenses. This example is intended to help you understand your ongoing costs (in dollars) of investing in the Fund and to compare these costs with the ongoing costs of investing in other mutual funds.
This example is based on an investment of $1,000 invested at the beginning of the six-month period ended September 30, 2017 and held for the entire six-month period.
Actual Expenses
The table below provides information about actual account values and actual expenses. You may use the information in this table, together with the amount you invested, to estimate the expenses that you paid over the period. Simply divide your account value by $1,000 (for example, an $8,600 account value divided by $1,000 = 8.6), then multiply the result by the number in the table under the heading entitled "Actual Expenses Paid During Period" to estimate the expenses you paid on your account during this period.
Hypothetical Example for Comparison Purposes
The table below provides information about hypothetical account values and hypothetical expenses based on the Fund's actual expense ratio and an assumed rate of return of 5% per year before expenses, which is not the Fund's actual return. The hypothetical account values and expenses may not be used to estimate the actual ending account balance or expenses you paid for the period. You may use this information to compare the ongoing costs of investing in the Fund and other funds. To do so, compare this 5% hypothetical example with the 5% hypothetical examples that appear in the shareholder reports of the other funds.
Please note that the expenses shown in the table are meant to highlight your ongoing costs only and do not reflect any transactional costs, such as sales charges (loads, if applicable). Therefore, the information for each class in the table is useful in comparing ongoing costs only, and will not help you determine the relative total costs of owning different funds. In addition, if these transactional costs were included, your costs would have been higher.
| | Beginning
Account
Value
4/1/17 | | Actual Ending
Account
Value
9/30/17 | | Hypothetical
Ending Account
Value | | Actual
Expenses
Paid
During
Period* | | Hypothetical
Expenses Paid
During Period* | | Net
Expense
Ratio
During
Period** | |
Short Duration Income Portfolio Class I | | $ | 1,000.00 | | | $ | 1,011.70 | | | $ | 1,023.31 | | | $ | 1.77 | | | $ | 1.78 | | | | 0.35 | % | |
Short Duration Income Portfolio Class A | | | 1,000.00 | | | | 1,010.40 | | | | 1,022.06 | | | | 3.02 | | | | 3.04 | | | | 0.60 | | |
Short Duration Income Portfolio Class L | | | 1,000.00 | | | | 1,009.20 | | | | 1,020.81 | | | | 4.28 | | | | 4.31 | | | | 0.85 | | |
Short Duration Income Portfolio Class C | | | 1,000.00 | | | | 1,006.70 | | | | 1,018.20 | | | | 6.89 | | | | 6.93 | | | | 1.37 | | |
Short Duration Income Portfolio Class IS | | | 1,000.00 | | | | 1,012.00 | | | | 1,023.51 | | | | 1.56 | | | | 1.57 | | | | 0.31 | | |
* Expenses are calculated using each Fund Class' annualized net expense ratio (as disclosed), multiplied by the average account value over the period, and multiplied by 183/365 (to reflect the most recent one-half year period).
** Annualized.
3
Morgan Stanley Institutional Fund Trust
Annual Report — September 30, 2017
Investment Overview (unaudited)
Short Duration Income Portfolio
The Fund seeks above-average total return over a market cycle of three to five years.
Performance
For the fiscal year ended September 30, 2017, the Fund's Class I shares had a total return based on net asset value and reinvestment of distributions per share of 2.29%, net of fees. The Fund's Class I shares outperformed against the Fund's benchmark, the ICE BofAML 1-Year U.S. Treasury Note Index (the "Index"), which returned 0.60%.
Factors Affecting Performance
• Benign economic performance of major countries and low interest rates, due to continued aggressive central bank actions, led to strong demand for bonds that offer additional yields over government securities. The result was strong performance in most credit sectors. The Fund benefited from short maturity exposures to these better-performing credit sectors — namely, investment-grade corporates, asset-backed securities, and non-agency residential and commercial mortgage-backed securities.
• U.S. Treasury yields rose over the period. They initially jumped after the election. Shorter maturities continued to rise as the Federal Reserve (Fed) increased the target fed funds rate by 75 basis points over the period. Longer maturity yields fluctuated in a relatively narrow band post-election. The impact on the Fund was small, as its duration was close to one year (the same as the benchmark) throughout the period. The Fund's interest rate exposures are managed, in part, using Treasury futures.
• The Fund also benefited from the receipt of proceeds from legal settlements, as described below.
• There were no material detractors from performance on both an absolute and relative basis in this reporting period.
• During fiscal year 2017, the Fund received monies related to certain nonrecurring litigation settlements. If these monies were not received, any period returns which include these settlement monies would have been lower. For example, the 2017 fiscal year total return would have been 1.78% for Class I shares as of September 30, 2017. The returns on the other Share Classes would also
have been similarly impacted. These were one-time settlements, and as a result, the impact on the net asset value and consequently the performance will not likely be repeated in the future. Please call 1-800-548-7786 for additional information.
Management Strategies
• The Fed has appeared to shift its reaction function, i.e., how its policy decisions will be made based on the economic climate. The big change is that the Fed is underweighting the sharp drop in inflation since February 2017, calling it "noise" and overweighting market indicators such as equities, credit spreads, level of the U.S. dollar and level of Treasury yields (a.k.a. financial conditions) under the guise of financial stability. Financial conditions have been loosening for most of 2017 despite hikes by the Fed, which would suggest that Fed policy should be even tighter.
• We expect more clarity in the near future on tax reform. The White House's tax proposals provided broad directions, but details remains to be hashed out. Since Congress will likely use reconciliation to pass tax reform, the debate must solidify soon so that major tax measures could be passed with the budget bill in November 2017. Market odds of tax reform passage have declined substantially.
• Either event — a change in Fed reaction function or a surprisingly strong tax bill — could lead to higher Treasury yields and a stronger U.S. dollar. This could also lead to wider spreads, especially for sectors that are dollar-sensitive, such as emerging market debt and export-dependent corporates. As a result, we think it is best to approach risk-taking cautiously.
• The Fund's exposures to credit sectors are in short maturity bonds. In our view, these securities usually offer an attractive risk/reward trade-off, as a large amount of spread widening would need to occur to overcome their yield advantage. As a result, we have continued to maintain credit exposures in the Fund, despite our less positive overall views on credit sectors.
4
Morgan Stanley Institutional Fund Trust
Annual Report — September 30, 2017
Investment Overview (unaudited) (cont'd)
Short Duration Income Portfolio

* Minimum Investment
In accordance with SEC regulations, the Fund's performance shown assumes that all recurring fees (including management fees) were deducted and all dividends and distributions were reinvested. The performance of Class A, Class L, Class C and Class IS shares will vary from the performance of Class I shares based upon their different inception dates and will be negatively impacted by additional fees assessed to those classes (where applicable).
Performance Compared to the ICE BofAML 1-Year U.S. Treasury Note Index(1), the Short Duration Income Blend Index(2), and the Lipper Short Investment Grade Debt Funds Index(3)
| | | Period Ended September 30, 2017
Total Returns(4) | |
| | | | | Average Annual | |
| | | One
Year | | Five
Years | | Ten
Years | | Since
Inception(10) | |
Fund — Class I Shares
w/o sales charges(5) | | | 2.29 | % | | | 2.55 | % | | | 0.27 | % | | | 3.13 | % | |
Fund — Class A Shares
w/o sales charges(6) | | | 2.15 | | | | 2.27 | | | | 0.02 | | | | 0.02 | | |
Fund — Class L Shares
w/o sales charges(7) | | | 1.90 | | | | 1.94 | | | | — | | | | 1.99 | | |
Fund — Class C Shares
w/o sales charges(8) | | | 1.34 | | | | — | | | | — | | | | 2.71 | | |
Fund — Class C Shares
with maximum 1.00% deferred
sales charges(8) | | | 0.34 | | | | — | | | | — | | | | 2.71 | | |
Fund — Class IS Shares
w/o sales charges(9) | | | 2.46 | | | | — | | | | — | | | | 5.73 | | |
ICE BofAML 1-Year U.S. Treasury
Note Index | | | 0.60 | | | | 0.39 | | | | 1.05 | | | | — | | |
Short Duration Income Blend Index | | | 0.60 | | | | 0.74 | | | | 2.01 | | | | 4.01 | | |
Lipper Short Investment Grade
Debt Funds Index | | | 1.44 | | | | 1.28 | | | | 2.22 | | | | 3.85 | | |
Performance data quoted represents past performance, which is no guarantee of future results, and current performance may be lower or higher than the figures shown. Performance assumes that all dividends and distributions, if any, were reinvested. For the most recent month-end performance figures, please visit www.morganstanley.com/im. Investment returns and principal value will fluctuate so that Fund shares, when redeemed, may be worth more or less than their original cost. Total returns do not reflect the deduction of taxes that a shareholder would pay on Fund distributions or the redemption of Fund shares. Performance of share classes will vary due to differences in sales charge and expenses.
(1) The ICE BofAML (Intercontinental Exchange Bank of America Merrill Lynch) 1-Year U.S. Treasury note Index tracks one-year U.S. government securities. The Index is unmanaged and its returns do not include any sales charges or fees. Such costs would lower performance. It is not possible to invest directly in an index.
(2) The Short Duration Income Blend Index is a performance linked benchmark of the old represented by Bloomberg Barclays 1-3 Year U.S. Government/Credit Index (benchmark that tracks investment-grade (BBB-/Baa3) or higher publicly traded fixed rate U.S. government, U.S. agency, and corporate issues in the 1-3 Year maturity range) for periods from the Fund's inception to January 8, 2016, to the new represented by ICE BofAML 1-Year U.S. Treasury Note Index (benchmark that tracks one-year U.S. government securities) for periods thereafter. The Index is unmanaged and its returns do not include any sales charges or fees. Such costs would lower performance. It is not possible to invest directly in an index.
(3) The Lipper Short Investment Grade Debt Funds Index is an equally weighted performance index of the largest qualifying funds (based on net assets) in the Lipper Short Investment Grade Debt Funds classification. The Index, which is adjusted for capital gains distributions and income dividends, is unmanaged and should not be considered an investment. There are currently 30 funds
5
Morgan Stanley Institutional Fund Trust
Annual Report — September 30, 2017
Investment Overview (unaudited) (cont'd)
Short Duration Income Portfolio
represented in this Index. As of the date of this report, the Fund was in the Lipper Short Investment Grade Debt Funds classification.
(4) Total returns for the Fund reflect expenses waived and/or reimbursed, if applicable, by the Adviser. Without such waivers and/or reimbursements, total returns would have been lower.
(5) Commenced operations on March 31, 1992.
(6) Commenced operations on September 28, 2007.
(7) Commenced operations on April 27, 2012.
(8) Commenced operations on April 30, 2015.
(9) Commenced operations on January 11, 2016.
(10) For comparative purposes, average annual since inception returns listed for the Indexes refer to the inception date of Class I of the Fund, not the inception of the Indexes.
6
Morgan Stanley Institutional Fund Trust
Annual Report — September 30, 2017
Portfolio of Investments
Short Duration Income Portfolio
| | | Face
Amount
(000) | | Value
(000) | |
Fixed Income Securities (93.4%) | |
Agency Adjustable Rate Mortgages (1.1%) | |
Federal Home Loan Mortgage Corporation, | |
Conventional Pools: | |
2.97%, 6/1/38 | | $ | 385 | | | $ | 407 | | |
3.04%, 1/1/36 | | | 472 | | | | 500 | | |
3.08%, 7/1/38 | | | 501 | | | | 529 | | |
3.14%, 3/1/37 | | | 647 | | | | 683 | | |
| | | | 2,119 | | |
Agency Bond — Consumer Discretionary (U.S. Government
Guaranteed) (0.3%) | |
Safina Ltd. | |
2.00%, 12/30/23 | | | 540 | | | | 537 | | |
Agency Fixed Rate Mortgages (1.6%) | |
Federal Home Loan Mortgage Corporation, | |
Gold Pools: | |
4.50%, 12/1/24 | | | 470 | | | | 499 | | |
6.50%, 9/1/19 - 4/1/24 | | | 2 | | | | 2 | | |
7.50%, 11/1/19 - 5/1/35 | | | 32 | | | | 38 | | |
8.00%, 8/1/32 | | | 19 | | | | 23 | | |
8.50%, 8/1/31 | | | 19 | | | | 23 | | |
Federal National Mortgage Association, | |
Conventional Pools: | |
4.50%, 6/1/24 - 7/1/24 | | | 708 | | | | 747 | | |
5.00%, 12/1/23 - 12/1/24 | | | 381 | | | | 404 | | |
6.00%, 9/1/37 | | | 93 | | | | 106 | | |
6.50%, 2/1/28 - 10/1/32 | | | 253 | | | | 277 | | |
7.00%, 7/1/29 - 3/1/37 | | | 303 | | | | 342 | | |
7.50%, 8/1/37 | | | 44 | | | | 53 | | |
8.00%, 4/1/33 | | | 81 | | | | 98 | | |
8.50%, 10/1/32 | | | 35 | | | | 44 | | |
Government National Mortgage Association, | |
Various Pools: | |
6.00%, 11/15/38 | | | 145 | | | | 164 | | |
8.50%, 7/15/30 | | | 81 | | | | 92 | | |
| | | | 2,912 | | |
Asset-Backed Securities (17.1%) | |
Ally Auto Receivables Trust, | |
1.47%, 4/15/20 | | | 556 | | | | 556 | | |
1.75%, 12/15/21 | | | 730 | | | | 729 | | |
AMSR Trust | |
1 Month LIBOR + 1.40%, 2.63%,
11/17/33 (a)(b) | | | 600 | | | | 606 | | |
AVANT Loans Funding Trust | |
7.80%, 9/15/20 (a) | | | 448 | | | | 455 | | |
Bayview Opportunity Master Fund IIIa Trust | |
3.10%, 9/28/32 (a) | | | 650 | | | | 650 | | |
Bayview Opportunity Master Fund IVb Trust, | |
3.50%, 1/28/55 (a)(b) | | | 373 | | | | 384 | | |
3.60%, 1/28/32 (a) | | | 379 | | | | 379 | | |
BMW Vehicle Lease Trust | |
1.98%, 5/20/20 | | | 775 | | | | 777 | | |
| | | Face
Amount
(000) | | Value
(000) | |
CAM Mortgage Trust | |
4.00%, 1/15/56 (a) | | $ | 50 | | | $ | 51 | | |
CLUB Credit Trust, | |
2.39%, 4/17/23 (a) | | | 303 | | | | 303 | | |
2.42%, 9/15/23 (a) | | | 450 | | | | 450 | | |
Colony American Homes, | |
1 Month LIBOR + 1.15%, 2.38%,
5/17/31 (a)(b) | | | 377 | | | | 379 | | |
1 Month LIBOR + 2.80%, 4.03%,
5/17/31 (a)(b) | | | 550 | | | | 554 | | |
1 Month LIBOR + 3.00%, 4.23%,
7/17/32 (a)(b) | | | 600 | | | | 608 | | |
1 Month LIBOR + 3.20%, 4.44%,
7/17/31 (a)(b) | | | 448 | | | | 451 | | |
Conn Funding II LP | |
2.73%, 7/15/19 (a) | | | 197 | | | | 197 | | |
Ford Credit Auto Owner Trust | |
2.26%, 11/15/25 (a) | | | 1,165 | | | | 1,174 | | |
GCAT LLC | |
3.23%, 5/25/22 (a) | | | 560 | | | | 564 | | |
GMAT Trust | |
4.25%, 9/25/20 (a) | | | 284 | | | | 284 | | |
Green Tree Agency Advance Funding Trust I | |
2.38%, 10/15/48 (a) | | | 600 | | | | 597 | | |
Hyundai Auto Receivables Trust | |
1.77%, 1/18/22 | | | 700 | | | | 700 | | |
Invitation Homes Trust, | |
1 Month LIBOR + 1.35%, 2.58%,
6/17/32 (a)(b) | | | 389 | | | | 392 | | |
1 Month LIBOR + 2.75%, 3.98%,
8/17/32 (a)(b) | | | 666 | | | | 676 | | |
1 Month LIBOR + 3.15%, 4.38%,
6/17/32 (a)(b) | | | 600 | | | | 607 | | |
Lehman Manufactured Housing Asset-Backed | |
6.64%, 7/15/28 | | | 104 | | | | 105 | | |
Mariner Finance Issuance Trust | |
3.62%, 2/20/29 (a) | | | 550 | | | | 554 | | |
Marlette Funding Trust | |
2.83%, 3/15/24 (a) | | | 378 | | | | 380 | | |
Mercedes-Benz Auto Lease Trust | |
1.35%, 8/15/19 | | | 621 | | | | 619 | | |
Nationstar HECM Loan Trust, | |
2.24%, 6/25/26 (a)(b) | | | 159 | | | | 161 | | |
2.82%, 9/25/27 (a)(b) | | | 250 | | | | 250 | | |
2.94%, 5/25/27 (a) | | | 600 | | | | 602 | | |
Nissan Auto Lease Trust | |
1.91%, 4/15/20 | | | 670 | | | | 671 | | |
Nissan Auto Receivables Owner Trust | |
1.75%, 10/15/21 | | | 780 | | | | 779 | | |
North Carolina State Education Assistance
Authority | |
3 Month USD LIBOR + 0.80%, 2.11%,
7/25/25 (b) | | | 357 | | | | 357 | | |
The accompanying notes are an integral part of the financial statements.
7
Morgan Stanley Institutional Fund Trust
Annual Report — September 30, 2017
Portfolio of Investments (cont'd)
Short Duration Income Portfolio
| | | Face
Amount
(000) | | Value
(000) | |
Asset-Backed Securities (cont'd) | |
Oak Hill Advisors Residential Loan Trust | |
3.00%, 6/25/57 (a) | | $ | 249 | | | $ | 250 | | |
Ocwen Master Advance Receivables Trust, | |
2.50%, 9/15/48 (a) | | | 400 | | | | 400 | | |
2.72%, 8/16/49 (a) | | | 600 | | | | 601 | | |
OSCAR US Funding Trust VII LLC | |
0.00%, 11/10/20 (a)(b) | | | 220 | | | | 220 | | |
Panhandle-Plains Higher Education Authority, Inc. | |
3 Month USD LIBOR + 0.95%, 2.25%,
7/1/24 (b) | | | 85 | | | | 86 | | |
PFS Financing Corp. | |
2.57%, 7/15/22 (a) | | | 460 | | | | 458 | | |
Pretium Mortgage Credit Partners I LLC | |
3.25%, 8/27/32 (a) | | | 636 | | | | 636 | | |
Pretium Mortgage Credit Partners LLC, | |
3.25%, 3/28/57 (a) | | | 448 | | | | 449 | | |
3.50%, 10/27/31 - 4/29/32(a) | | | 818 | | | | 823 | | |
PRPM LLC | |
4.00%, 9/27/21 (a) | | | 278 | | | | 278 | | |
RCO Mortgage LLC | |
3.38%, 8/25/22 (a) | | | 686 | | | | 689 | | |
SBA Small Business Investment Cos. | |
2.25%, 9/10/22 | | | 511 | | | | 512 | | |
Skopos Auto Receivables Trust | |
5.43%, 12/15/23 (a) | | | 517 | | | | 521 | | |
SPS Servicer Advance Receivables Trust | |
2.53%, 11/16/48 (a) | | | 700 | | | | 694 | | |
Stanwich Mortgage Loan Co., LLC | |
3.60%, 3/16/22 (a) | | | 302 | | | | 302 | | |
Sunset Mortgage Loan Co., LLC | |
3.50%, 6/15/47 (a) | | | 560 | | | | 561 | | |
Towd Point Mortgage Trust | |
2.75%, 4/25/57 (a)(b) | | | 185 | | | | 187 | | |
Velocity Commercial Capital Loan Trust | |
1 Month LIBOR + 1.80%, 3.04%, 10/25/46 (b) | | | 296 | | | | 300 | | |
Verizon Owner Trust, | |
1.68%, 5/20/21 (a) | | | 610 | | | | 608 | | |
2.06%, 9/20/21 (a) | | | 375 | | | | 376 | | |
VOLT LIV LLC | |
3.50%, 2/25/47 (a) | | | 296 | | | | 299 | | |
VOLT LIX LLC | |
3.25%, 5/25/47 (a) | | | 370 | | | | 372 | | |
VOLT LV LLC | |
3.50%, 3/25/47 (a) | | | 543 | | | | 548 | | |
VOLT LVI LLC | |
3.50%, 3/25/47 (a) | | | 516 | | | | 521 | | |
VOLT LX LLC | |
3.25%, 4/25/59 (a) | | | 419 | | | | 421 | | |
VOLT LXI LLC | |
3.13%, 6/25/47 (a) | | | 535 | | | | 538 | | |
VOLT LXII LLC | |
3.13%, 9/25/47 (a) | | | 500 | | | | 501 | | |
| | | Face
Amount
(000) | | Value
(000) | |
VOLT NPL X LLC | |
4.75%, 10/26/54 (a) | | $ | 37 | | | $ | 37 | | |
VOLT XIX LLC | |
5.00%, 4/25/55 (a) | | | 200 | | | | 201 | | |
VOLT XXII LLC | |
4.25%, 2/25/55 (a) | | | 199 | | | | 201 | | |
VOLT XXV LLC | |
3.50%, 6/26/45 (a) | | | 526 | | | | 528 | | |
World Omni Auto Receivables Trust | |
1.49%, 12/15/20 | | | 1,725 | | | | 1,724 | | |
| | | | 31,843 | | |
Collateralized Mortgage Obligations — Agency Collateral Series (2.7%) | |
Federal Home Loan Mortgage Corporation, | |
1.44%, 1/25/19 | | | 94 | | | | 94 | | |
1.56%, 10/25/18 | | | 81 | | | | 81 | | |
1.62%, 9/25/18 | | | 197 | | | | 196 | | |
1.78%, 10/25/20 | | | 337 | | | | 336 | | |
1.88%, 5/25/19 | | | 843 | | | | 844 | | |
2.06%, 10/25/20 | | | 413 | | | | 414 | | |
2.09%, 3/25/19 | | | 265 | | | | 266 | | |
2.26%, 10/25/20 | | | 187 | | | | 188 | | |
2.30%, 9/25/18 | | | 320 | | | | 322 | | |
2.32%, 10/25/18 | | | 280 | | | | 281 | | |
3.03%, 10/25/20 (b) | | | 483 | | | | 496 | | |
REMIC | |
7.50%, 9/15/29 | | | 625 | | | | 723 | | |
Federal National Mortgage Association, | |
1 Month LIBOR + 0.22%, 1.46%, 6/25/18 (b) | | | 32 | | | | 32 | | |
1.55%, 4/25/18 | | | 112 | | | | 111 | | |
1.63%, 2/25/18 | | | 121 | | | | 121 | | |
2.17%, 9/25/19 (b) | | | 549 | | | | 552 | | |
| | | | 5,057 | | |
Commercial Mortgage-Backed Securities (0.7%) | |
Citigroup Commercial Mortgage Trust | |
2.11%, 1/12/30 (a) | | | 156 | | | | 156 | | |
Cosmopolitan Hotel Trust | |
1 Month LIBOR + 1.40%, 2.63%,
11/15/33 (a)(b) | | | 533 | | | | 537 | | |
Hudsons Bay Simon JV Trust | |
1 Month LIBOR + 1.58%, 2.81%, 8/5/34 (a)(b) | | | 185 | | | | 186 | | |
JP Morgan Chase Commercial Mortgage
Securities Trust | |
1 Month LIBOR + 0.98%, 2.21%,
7/15/31 (a)(b) | | | 24 | | | | 24 | | |
TRU Trust | |
1 Month LIBOR + 2.25%, 3.48%,
11/15/30 (a)(b) | | | 424 | | | | 418 | | |
| | | | 1,321 | | |
Corporate Bonds (66.0%) | |
Finance (30.3%) | |
ABN Amro Bank N.V. | |
2.10%, 1/18/19 (a) | | | 1,175 | | | | 1,180 | | |
The accompanying notes are an integral part of the financial statements.
8
Morgan Stanley Institutional Fund Trust
Annual Report — September 30, 2017
Portfolio of Investments (cont'd)
Short Duration Income Portfolio
| | | Face
Amount
(000) | | Value
(000) | |
Finance (cont'd) | |
ABN Amro Bank N.V. | |
2.50%, 10/30/18 (a) | | $ | 630 | | | $ | 635 | | |
American Express Credit Corp., | |
Series G | |
1.80%, 7/31/18 | | | 425 | | | | 425 | | |
2.25%, 8/15/19 | | | 675 | | | | 681 | | |
ANZ New Zealand Int'l Ltd. | |
2.20%, 7/17/20 (a) | | | 680 | | | | 681 | | |
Bank of America Corp., | |
MTN | |
2.63%, 10/19/20 | | | 780 | | | | 789 | | |
Bank of Montreal, | |
3 Month USD LIBOR + 0.25%, 1.57%,
9/11/19 (b) | | | 945 | | | | 945 | | |
MTN | |
1.50%, 7/18/19 | | | 375 | | | | 373 | | |
Bank of New York Mellon Corp. (The), | |
MTN | |
2.45%, 11/27/20 | | | 525 | | | | 531 | | |
Bank of Nova Scotia (The), | |
1.95%, 1/15/19 | | | 725 | | | | 728 | | |
2.15%, 7/14/20 | | | 430 | | | | 431 | | |
BB&T Corp., | |
MTN | |
2.25%, 2/1/19 | | | 580 | | | | 584 | | |
Berkshire Hathaway Finance Corp. | |
1.70%, 3/15/19 | | | 500 | | | | 501 | | |
BNP Paribas SA, | |
MTN | |
2.70%, 8/20/18 | | | 830 | | | | 838 | | |
BNZ International Funding Ltd. | |
2.35%, 3/4/19 (a) | | | 650 | | | | 654 | | |
| BPCE SA, | |
MTN | |
2.25%, 1/27/20 | | | 600 | | | | 602 | | |
Branch Banking & Trust Co. | |
2.10%, 1/15/20 | | | 1,000 | | | | 1,004 | | |
Canadian Imperial Bank of Commerce | |
2.10%, 10/5/20 | | | 840 | | | | 840 | | |
Capital One Financial Corp. | |
2.45%, 4/24/19 | | | 1,005 | | | | 1,012 | | |
Citibank NA | |
2.10%, 6/12/20 | | | 830 | | | | 832 | | |
Citigroup, Inc., | |
2.05%, 6/7/19 | | | 1,100 | | | | 1,101 | | |
2.45%, 1/10/20 | | | 475 | | | | 479 | | |
Commonwealth Bank of Australia | |
2.50%, 9/20/18 | | | 600 | | | | 605 | | |
Credit Agricole SA | |
2.13%, 4/17/18 (a) | | | 775 | | | | 777 | | |
| | | Face
Amount
(000) | | Value
(000) | |
Credit Suisse AG, | |
Series G | |
2.30%, 5/28/19 | | $ | 650 | | | $ | 654 | | |
Danske Bank A/S | |
1.65%, 9/6/19 (a) | | | 1,700 | | | | 1,687 | | |
DBS Group Holdings Ltd. | |
2.25%, 7/16/19 (a) | | | 650 | | | | 652 | | |
Deutsche Bank AG | |
2.70%, 7/13/20 | | | 750 | | | | 754 | | |
Discover Bank | |
2.00%, 2/21/18 | | | 665 | | | | 666 | | |
DNB Bank ASA | |
2.13%, 10/2/20 (a)(c) | | | 700 | | | | 700 | | |
ERP Operating LP | |
2.38%, 7/1/19 | | | 550 | | | | 555 | | |
Goldman Sachs Group, Inc. (The), | |
2.30%, 12/13/19 | | | 860 | | | | 864 | | |
2.63%, 1/31/19 | | | 790 | | | | 797 | | |
HSBC USA, Inc. | |
2.25%, 6/23/19 | | | 659 | | | | 663 | | |
ING Bank N.V. | |
2.05%, 8/17/18 (a) | | | 1,075 | | | | 1,077 | | |
Intesa Sanpaolo SpA | |
3.88%, 1/16/18 | | | 355 | | | | 357 | | |
Jackson National Life Global Funding, | |
1.88%, 10/15/18 (a) | | | 275 | | | | 276 | | |
2.20%, 1/30/20 (a) | | | 550 | | | | 551 | | |
JPMorgan Chase & Co., | |
1.85%, 3/22/19 | | | 1,170 | | | | 1,171 | | |
2.20%, 10/22/19 | | | 325 | | | | 327 | | |
KeyBank NA | |
1.60%, 8/22/19 | | | 300 | | | | 298 | | |
LeasePlan Corp. N.V. | |
2.88%, 1/22/19 (a) | | | 500 | | | | 501 | | |
Macquarie Bank Ltd., | |
2.35%, 1/15/19 (a) | | | 725 | | | | 728 | | |
2.60%, 6/24/19 (a) | | | 605 | | | | 610 | | |
Manufacturers & Traders Trust Co. | |
2.10%, 2/6/20 | | | 560 | | | | 561 | | |
MassMutual Global Funding II, | |
1.55%, 10/11/19 (a) | | | 1,140 | | | | 1,131 | | |
1.95%, 9/22/20 (a) | | | 560 | | | | 559 | | |
Metropolitan Life Global Funding I, | |
1.35%, 9/14/18 (a) | | | 1,120 | | | | 1,117 | | |
2.00%, 4/14/20 (a) | | | 550 | | | | 549 | | |
Mizuho Bank Ltd. | |
1.85%, 3/21/18 (a) | | | 645 | | | | 646 | | |
National Australia Bank Ltd. | |
1.38%, 7/12/19 | | | 1,220 | | | | 1,211 | | |
National Bank of Canada | |
2.15%, 6/12/20 | | | 1,230 | | | | 1,230 | | |
New York Life Global Funding | |
1.55%, 11/2/18 (a) | | | 375 | | | | 375 | | |
The accompanying notes are an integral part of the financial statements.
9
Morgan Stanley Institutional Fund Trust
Annual Report — September 30, 2017
Portfolio of Investments (cont'd)
Short Duration Income Portfolio
| | | Face
Amount
(000) | | Value
(000) | |
Finance (cont'd) | |
Nordea Bank AB, | |
1.63%, 9/30/19 (a) | | $ | 900 | | | $ | 895 | | |
1.88%, 9/17/18 (a) | | | 800 | | | | 802 | | |
| PNC Bank NA | |
1.95%, 3/4/19 | | | 875 | | | | 877 | | |
Principal Life Global Funding II | |
2.15%, 1/10/20 (a) | | | 1,425 | | | | 1,427 | | |
Protective Life Global Funding, | |
1.72%, 4/15/19 (a) | | | 700 | | | | 698 | | |
2.70%, 11/25/20 (a) | | | 525 | | | | 530 | | |
QBE Insurance Group Ltd. | |
2.40%, 5/1/18 (a) | | | 200 | | | | 201 | | |
Santander Holdings USA, Inc. | |
2.70%, 5/24/19 | | | 675 | | | | 681 | | |
Santander UK Group Holdings PLC | |
2.88%, 10/16/20 | | | 200 | | | | 203 | | |
Santander UK PLC | |
2.00%, 8/24/18 | | | 925 | | | | 927 | | |
Skandinaviska Enskilda Banken AB, | |
1.75%, 3/19/18 (a) | | | 380 | | | | 380 | | |
2.30%, 3/11/20 | | | 530 | | | | 533 | | |
Sumitomo Mitsui Banking Corp., | |
1.76%, 10/19/18 | | | 400 | | | | 400 | | |
2.45%, 1/10/19 | | | 630 | | | | 635 | | |
Sumitomo Mitsui Trust Bank Ltd. | |
1.95%, 9/19/19 (a) | | | 275 | | | | 274 | | |
Suncorp-Metway Ltd. | |
2.10%, 5/3/19 (a) | | | 275 | | | | 275 | | |
Svenska Handelsbanken AB | |
1.95%, 9/8/20 | | | 990 | | | | 987 | | |
Swedbank AB | |
1.75%, 3/12/18 (a) | | | 305 | | | | 305 | | |
Synchrony Financial | |
3.00%, 8/15/19 | | | 800 | | | | 813 | | |
Toronto-Dominion Bank (The), | |
MTN | |
1.95%, 1/22/19 | | | 575 | | | | 576 | | |
UBS AG, | |
MTN | |
2.38%, 8/14/19 | | | 925 | | | | 933 | | |
UnitedHealth Group, Inc. | |
2.70%, 7/15/20 | | | 500 | | | | 510 | | |
US Bank NA | |
2.00%, 1/24/20 | | | 500 | | | | 501 | | |
WEA Finance LLC/Westfield UK & Europe
Finance PLC | |
2.70%, 9/17/19 (a) | | | 600 | | | | 606 | | |
Wells Fargo & Co. | |
2.15%, 1/15/19 | | | 360 | | | | 362 | | |
Wells Fargo Bank NA | |
1.75%, 5/24/19 | | | 1,475 | | | | 1,474 | | |
| | | Face
Amount
(000) | | Value
(000) | |
Westpac Banking Corp., | |
1.65%, 5/13/19 | | $ | 625 | | | $ | 623 | | |
1.95%, 11/23/18 | | | 375 | | | | 376 | | |
| | | | 56,299 | | |
Industrials (33.4%) | |
Abbott Laboratories | |
2.35%, 11/22/19 | | | 860 | | | | 867 | | |
AbbVie, Inc., | |
1.80%, 5/14/18 | | | 1,150 | | | | 1,152 | | |
2.50%, 5/14/20 | | | 575 | | | | 582 | | |
Allergan Funding SCS | |
3.00%, 3/12/20 | | | 835 | | | | 853 | | |
Amazon.com, Inc. | |
1.90%, 8/21/20 (a) | | | 900 | | | | 903 | | |
American Honda Finance Corp., | |
1.95%, 7/20/20 | | | 250 | | | | 250 | | |
MTN | |
1.20%, 7/12/19 | | | 530 | | | | 525 | | |
2.45%, 9/24/20 | | | 550 | | | | 557 | | |
Amgen, Inc. | |
2.20%, 5/22/19 | | | 790 | | | | 794 | | |
Anheuser-Busch InBev Finance, Inc. | |
1.90%, 2/1/19 | | | 775 | | | | 777 | | |
AstraZeneca PLC | |
1.75%, 11/16/18 | | | 1,495 | | | | 1,495 | | |
AT&T, Inc. | |
2.45%, 6/30/20 | | | 1,225 | | | | 1,235 | | |
AutoZone, Inc. | |
1.63%, 4/21/19 | | | 740 | | | | 736 | | |
Baidu, Inc. | |
3.25%, 8/6/18 | | | 225 | | | | 227 | | |
BAT International Finance PLC | |
2.75%, 6/15/20 (a) | | | 450 | | | | 457 | | |
Baxalta, Inc. | |
2.88%, 6/23/20 | | | 550 | | | | 559 | | |
Bayer US Finance LLC | |
2.38%, 10/8/19 (a) | | | 600 | | | | 604 | | |
Becton Dickinson and Co. | |
2.68%, 12/15/19 | | | 300 | | | | 304 | | |
Biogen, Inc. | |
2.90%, 9/15/20 | | | 525 | | | | 538 | | |
BMW US Capital LLC, | |
1.50%, 4/11/19 (a) | | | 700 | | | | 698 | | |
2.15%, 4/6/20 (a) | | | 400 | | | | 402 | | |
Boston Scientific Corp. | |
2.65%, 10/1/18 | | | 570 | | | | 575 | | |
BP Capital Markets PLC | |
2.32%, 2/13/20 | | | 400 | | | | 404 | | |
Cardinal Health, Inc. | |
1.95%, 6/14/19 | | | 725 | | | | 726 | | |
Caterpillar Financial Services Corp., | |
MTN | |
1.35%, 5/18/19 | | | 790 | | | | 785 | | |
The accompanying notes are an integral part of the financial statements.
10
Morgan Stanley Institutional Fund Trust
Annual Report — September 30, 2017
Portfolio of Investments (cont'd)
Short Duration Income Portfolio
| | | Face
Amount
(000) | | Value
(000) | |
Industrials (cont'd) | |
1.80%, 11/13/18 | | $ | 300 | | | $ | 300 | | |
CBS Corp. | |
2.30%, 8/15/19 | | | 625 | | | | 629 | | |
Celgene Corp., | |
2.13%, 8/15/18 | | | 755 | | | | 758 | | |
2.88%, 8/15/20 | | | 525 | | | | 536 | | |
Chevron Corp. | |
1.99%, 3/3/20 | | | 1,260 | | | | 1,265 | | |
CVS Health Corp. | |
1.90%, 7/20/18 | | | 550 | | | | 551 | | |
Daimler Finance North America LLC, | |
1.50%, 7/5/19 (a) | | | 500 | | | | 496 | | |
2.30%, 1/6/20 (a) | | | 325 | | | | 326 | | |
2.38%, 8/1/18 (a) | | | 750 | | | | 754 | | |
Danone SA | |
1.69%, 10/30/19 (a) | | | 875 | | | | 870 | | |
Dell International LLC/EMC Corp. | |
3.48%, 6/1/19 (a) | | | 900 | | | | 918 | | |
Delta Air Lines, Inc. | |
2.88%, 3/13/20 | | | 575 | | | | 582 | | |
Deutsche Telekom International Finance BV | |
6.00%, 7/8/19 | | | 650 | | | | 695 | | |
Discovery Communications LLC, | |
Series 2YR | |
2.20%, 9/20/19 | | | 975 | | | | 979 | | |
Dominion Energy Gas Holdings LLC | |
2.50%, 12/15/19 | | | 825 | | | | 832 | | |
EI du Pont de Nemours & Co. | |
2.20%, 5/1/20 | | | 700 | | | | 705 | | |
EMD Finance LLC | |
2.40%, 3/19/20 (a) | | | 575 | | | | 580 | | |
Energy Transfer LP | |
2.50%, 6/15/18 | | | 575 | | | | 577 | | |
Enterprise Products Operating LLC | |
2.55%, 10/15/19 | | | 325 | | | | 328 | | |
Ford Motor Credit Co., LLC, | |
2.26%, 3/28/19 | | | 450 | | | | 451 | | |
2.68%, 1/9/20 | | | 725 | | | | 731 | | |
5.00%, 5/15/18 | | | 395 | | | | 403 | | |
General Motors Co. | |
3 Month USD LIBOR + 0.80%, 2.11%,
8/7/20 (b) | | | 950 | | | | 951 | | |
General Motors Financial Co., Inc. | |
3.15%, 1/15/20 | | | 600 | | | | 611 | | |
Gilead Sciences, Inc., | |
1.85%, 9/20/19 | | | 445 | | | | 446 | | |
2.55%, 9/1/20 | | | 500 | | | | 509 | | |
Goldcorp, Inc. | |
2.13%, 3/15/18 | | | 520 | | | | 521 | | |
Hewlett Packard Enterprise Co. | |
2.10%, 10/4/19 (a) | | | 800 | | | | 801 | | |
| | | Face
Amount
(000) | | Value
(000) | |
Hutchison Whampoa International 14 Ltd. | |
1.63%, 10/31/17 (a) | | $ | 240 | | | $ | 240 | | |
Hyundai Capital America, | |
2.00%, 3/19/18 (a) | | | 350 | | | | 350 | | |
2.50%, 3/18/19 (a) | | | 775 | | | | 776 | | |
2.55%, 4/3/20 (a) | | | 175 | | | | 175 | | |
2.60%, 3/19/20 (a) | | | 325 | | | | 325 | | |
Ingersoll-Rand Global Holding Co., Ltd. | |
2.88%, 1/15/19 | | | 335 | | | | 339 | | |
JM Smucker Co. (The) | |
2.50%, 3/15/20 | | | 225 | | | | 227 | | |
John Deere Capital Corp., | |
MTN | |
1.95%, 1/8/19 | | | 1,590 | | | | 1,597 | | |
Kinder Morgan, Inc. | |
3.05%, 12/1/19 | | | 650 | | | | 662 | | |
Kroger Co. (The) | |
2.00%, 1/15/19 | | | 750 | | | | 752 | | |
Lockheed Martin Corp., | |
1.85%, 11/23/18 | | | 555 | | | | 556 | | |
2.50%, 11/23/20 | | | 225 | | | | 229 | | |
Marathon Petroleum Corp. | |
2.70%, 12/14/18 | | | 725 | | | | 730 | | |
McDonald's Corp., | |
MTN | |
2.20%, 5/26/20 | | | 550 | | | | 554 | | |
McKesson Corp. | |
2.28%, 3/15/19 | | | 790 | | | | 795 | | |
Mead Johnson Nutrition Co. | |
3.00%, 11/15/20 | | | 175 | | | | 180 | | |
Medtronic, Inc. | |
2.50%, 3/15/20 | | | 550 | | | | 558 | | |
Microsoft Corp. | |
1.85%, 2/6/20 | | | 775 | | | | 778 | | |
Molson Coors Brewing Co. | |
1.45%, 7/15/19 | | | 775 | | | | 767 | | |
Nissan Motor Acceptance Corp., | |
2.00%, 3/8/19 (a) | | | 575 | | | | 576 | | |
2.35%, 3/4/19 (a) | | | 570 | | | | 574 | | |
2.65%, 9/26/18 (a) | | | 720 | | | | 727 | | |
Novartis Capital Corp. | |
1.80%, 2/14/20 | | | 475 | | | | 475 | | |
Orange SA | |
2.75%, 2/6/19 | | | 625 | | | | 633 | | |
QUALCOMM, Inc. | |
2.10%, 5/20/20 | | | 1,816 | | | | 1,831 | | |
Reynolds American, Inc. | |
2.30%, 6/12/18 | | | 525 | | | | 527 | | |
Rockwell Collins, Inc. | |
1.95%, 7/15/19 | | | 800 | | | | 800 | | |
Ryder System, Inc., | |
MTN | |
2.65%, 3/2/20 | | | 125 | | | | 126 | | |
The accompanying notes are an integral part of the financial statements.
11
Morgan Stanley Institutional Fund Trust
Annual Report — September 30, 2017
Portfolio of Investments (cont'd)
Short Duration Income Portfolio
| | | Face
Amount
(000) | | Value
(000) | |
Industrials (cont'd) | |
Scripps Networks Interactive, Inc. | |
2.75%, 11/15/19 | | $ | 575 | | | $ | 582 | | |
Shell International Finance BV | |
1.38%, 9/12/19 | | | 700 | | | | 696 | | |
Sherwin-Williams Co. (The) | |
2.25%, 5/15/20 | | | 925 | | | | 929 | | |
Siemens Financieringsmaatschappij N.V., | |
1.30%, 9/13/19 (a) | | | 900 | | | | 890 | | |
2.15%, 5/27/20 (a) | | | 550 | | | | 553 | | |
Southwest Airlines Co. | |
2.75%, 11/6/19 | | | 600 | | | | 608 | | |
Time Warner Cable LLC | |
6.75%, 7/1/18 | | | 400 | | | | 415 | | |
Toyota Motor Credit Corp., | |
2.10%, 1/17/19 | | | 500 | | | | 503 | | |
MTN | |
1.40%, 5/20/19 | | | 625 | | | | 622 | | |
TSMC Global Ltd. | |
1.63%, 4/3/18 (a) | | | 800 | | | | 799 | | |
Tyson Foods, Inc. | |
2.65%, 8/15/19 | | | 600 | | | | 607 | | |
Union Pacific Corp. | |
2.25%, 6/19/20 | | | 550 | | | | 554 | | |
United Technologies Corp. | |
1.90%, 5/4/20 | | | 800 | | | | 798 | | |
Verizon Communications, Inc. | |
2.63%, 2/21/20 | | | 250 | | | | 254 | | |
Vodafone Group PLC | |
1.50%, 2/19/18 | | | 750 | | | | 750 | | |
Volkswagen Group of America Finance LLC | |
2.40%, 5/22/20 (a) | | | 550 | | | | 552 | | |
| | | | 62,081 | | |
Utilities (2.3%) | |
Dominion Energy, Inc., | |
Series B | |
1.60%, 8/15/19 | | | 225 | | | | 224 | | |
DTE Energy Co. | |
1.50%, 10/1/19 | | | 425 | | | | 419 | | |
Engie SA | |
1.63%, 10/10/17 (a) | | | 650 | | | | 650 | | |
Eversource Energy | |
1.45%, 5/1/18 | | | 525 | | | | 525 | | |
Origin Energy Finance Ltd. | |
3.50%, 10/9/18 (a) | | | 200 | | | | 202 | | |
Public Service Enterprise Group, Inc. | |
1.60%, 11/15/19 | | | 250 | | | | 247 | | |
Sempra Energy | |
2.40%, 3/15/20 | | | 600 | | | | 603 | | |
Southern Co. (The) | |
2.15%, 9/1/19 | | | 725 | | | | 727 | | |
| | | Face
Amount
(000) | | Value
(000) | |
Southern Power Co., | |
Series D | |
1.95%, 12/15/19 | | $ | 675 | | | $ | 674 | | |
| | | | 4,271 | | |
| | | | 122,651 | | |
Mortgages — Other (2.1%) | |
CHL Mortgage Pass-Through Trust | |
5.50%, 5/25/34 | | | 176 | | | | 180 | | |
Federal Home Loan Mortgage Corporation, | |
1 Month USD LIBOR + 0.90%, 2.14%,
10/25/27 (b) | | | 64 | | | | 64 | | |
1 Month USD LIBOR + 1.10%, 2.34%,
12/25/28 (b) | | | 354 | | | | 355 | | |
1 Month USD LIBOR + 1.20%, 2.44%,
10/25/29 (b) | | | 293 | | | | 297 | | |
1 Month USD LIBOR + 1.25%, 2.49%,
10/25/28 (b) | | | 41 | | | | 41 | | |
1 Month USD LIBOR + 1.45%, 2.69%,
7/25/28 (b) | | | 135 | | | | 135 | | |
1 Month USD LIBOR + 1.75%, 2.99%,
9/25/28 (b) | | | 110 | | | | 111 | | |
Federal National Mortgage Association, | |
2.54%, 4/25/29 - 7/25/29 (b) | | | 1,254 | | | | 1,266 | | |
1 Month USD LIBOR + 1.45%, 2.69%,
1/25/29 (b) | | | 259 | | | | 261 | | |
1 Month USD LIBOR + 2.20%, 3.44%,
10/25/28 (b) | | | 237 | | | | 239 | | |
New Residential Mortgage Loan Trust, | |
3.75%, 5/28/52 - 8/25/55 (a)(b) | | | 479 | | | | 497 | | |
Sequoia Mortgage Trust | |
1 Month USD LIBOR + 0.62%, 1.86%,
8/20/34 (b) | | | 365 | | | | 355 | | |
| | | | 3,801 | | |
Sovereign (0.6%) | |
Korea Development Bank (The), | |
1.50%, 1/22/18 | | | 690 | | | | 689 | | |
3 Month USD LIBOR + 0.45%, 1.77%,
2/27/20 (b) | | | 320 | | | | 319 | | |
| | | | 1,008 | | |
U.S. Agency Security (1.2%) | |
Private Export Funding Corp. | |
1.45%, 8/15/19 | | | 2,300 | | | | 2,294 | | |
Total Fixed Income Securities (Cost $172,894) | | | 173,543 | | |
| | | Shares | | | |
Short-Term Investments (7.0%) | |
Investment Company (2.1%) | |
Morgan Stanley Institutional Liquidity Funds —
Government Portfolio — Institutional Class
(See Note G) (Cost $3,863) | | | 3,863,413 | | | | 3,863 | | |
The accompanying notes are an integral part of the financial statements.
12
Morgan Stanley Institutional Fund Trust
Annual Report — September 30, 2017
Portfolio of Investments (cont'd)
Short Duration Income Portfolio
| | | Face
Amount
(000) | | Value
(000) | |
U.S. Treasury Security (0.7%) | |
U.S. Treasury Bill | |
| 1.19%, 4/26/18 (d)(e) (Cost $1,341) | | $ | 1,350 | | | $ | 1,341 | | |
Commercial Paper (4.2%) | |
Computer Technology (0.9%) | |
HP, Inc. | |
1.64%, 10/20/17 (f) | | | 1,750 | | | | 1,748 | | |
Energy (2.3%) | |
Ameren Corp. | |
0.00%, 10/3/17 (f) | | | 1,850 | | | | 1,850 | | |
Enterprise Products Operating LLC | |
0.00%, 10/6/17 (f) | | | 1,520 | | | | 1,520 | | |
NextEra Energy Capital Holdings, Inc. | |
0.00%, 11/29/17 (f) | | | 830 | | | | 828 | | |
| | | | 4,198 | | |
Hospitality (1.0%) | |
Marriott International, Inc. | |
0.00%, 10/17/17 (f) | | | 1,875 | | | | 1,874 | | |
Total Commercial Paper (Cost $7,820) | | | 7,820 | | |
Total Short-Term Investments (Cost $13,024) | | | 13,024 | | |
Total Investments (100.4%) (Cost $185,918) (g)(h) | | | 186,567 | | |
Liabilities in Excess of Other Assets (–0.4%) | | | (806 | ) | |
Net Assets (100.0%) | | $ | 185,761 | | |
(a) 144A security — Certain conditions for public sale may exist. Unless otherwise noted, these securities are deemed to be liquid.
(b) Floating or Variable rate securities: The rates disclosed are as of September 30, 2017. For securities based on a published reference rate and spread, the reference rate and spread are indicated in the description in the Portfolio of Investments. Certain variable rate securities are not based on a published reference rate and spread but are determined by the issuer or agent and are based on current market conditions. These securities do not indicate a reference rate and spread in their description in the Portfolio of Investments.
(c) When-issued security.
(d) Rate shown is the yield to maturity at September 30, 2017.
(e) All or a portion of the security was pledged to cover margin requirements for futures contracts.
(f) The rates shown are the effective yields at the date of purchase.
(g) Securities are available for collateral in connection with purchase of when-issued security and futures contracts.
(h) At September 30, 2017, the aggregate cost for federal income tax purposes is approximately $186,036,000. The aggregate gross unrealized appreciation is approximately $894,000 and the aggregate gross unrealized depreciation is approximately $247,000, resulting in net unrealized appreciation of approximately $647,000.
CMT Constant Maturity Treasury Note Rate.
LIBOR London Interbank Offered Rate.
MTN Medium Term Note.
REMIC Real Estate Mortgage Investment Conduit.
Futures Contracts:
The Fund had the following futures contracts open at September 30, 2017:
| | | Number
of
Contracts | | Expiration
Date | | Notional
Amount
(000) | | Value
(000) | | Unrealized
Appreciation
(000) | |
Short: | |
U.S. Treasury 2 yr. Note | | | 168 | | | Dec-17 | | | (33,600 | ) | | $ | (36,238 | ) | | $ | 90 | | |
U.S. Treasury 5 yr. Note | | | 33 | | | Dec-17 | | | (3,300 | ) | | | (3,878 | ) | | | 26 | | |
| | | | | | | | | | | $ | 116 | | |
Portfolio Composition
Classification | | Percentage of
Total Investments | |
Industrials | | | 33.3 | % | |
Finance | | | 30.2 | | |
Asset-Backed Securities | | | 17.1 | | |
Other* | | | 12.5 | | |
Short-Term Investments | | | 6.9 | | |
Total Investments | | | 100.0 | %** | |
* Industries and/or investment types representing less than 5% of total investments.
** Does not include open short futures contracts with an underlying face amount of approximately $40,116,000 with total unrealized appreciation of approximately $116,000.
The accompanying notes are an integral part of the financial statements.
13
Morgan Stanley Institutional Fund Trust
Annual Report — September 30, 2017
Short Duration Income Portfolio
Statement of Assets and Liabilities | | September 30, 2017
(000) | |
Assets: | |
Investments in Securities of Unaffiliated Issuers, at Value (Cost $182,055) | | $ | 182,704 | | |
Investment in Security of Affiliated Issuer, at Value (Cost $3,863) | | | 3,863 | | |
Total Investments in Securities, at Value (Cost $185,918) | | | 186,567 | | |
Interest and Paydown Receivable | | | 748 | | |
Receivable for Fund Shares Sold | | | 273 | | |
Receivable for Variation Margin on Futures Contracts | | | 26 | | |
Receivable for Investments Sold | | | 20 | | |
Due from Adviser | | | 10 | | |
Receivable from Affiliate | | | 3 | | |
Tax Reclaim Receivable | | | — | @ | |
Other Assets | | | 53 | | |
Total Assets | | | 187,700 | | |
Liabilities: | |
Payable for Investments Purchased | | | 1,539 | | |
Payable for Fund Shares Redeemed | | | 216 | | |
Payable for Trustees' Fees and Expenses | | | 56 | | |
Payable for Professional Fees | | | 25 | | |
Payable for Shareholder Services Fees — Class A | | | 17 | | |
Payable for Distribution and Shareholder Services Fees — Class L | | | — | @ | |
Payable for Distribution and Shareholder Services Fees — Class C | | | — | @ | |
Payable for Sub Transfer Agency Fees — Class I | | | 9 | | |
Payable for Sub Transfer Agency Fees — Class A | | | 7 | | |
Payable for Sub Transfer Agency Fees — Class L | | | — | @ | |
Payable for Sub Transfer Agency Fees — Class C | | | — | @ | |
Payable for Administration Fees | | | 12 | | |
Payable for Custodian Fees | | | 7 | | |
Payable for Transfer Agency Fees — Class I | | | 2 | | |
Payable for Transfer Agency Fees — Class A | | | 2 | | |
Payable for Transfer Agency Fees — Class L | | | 1 | | |
Payable for Transfer Agency Fees — Class C | | | 1 | | |
Payable for Transfer Agency Fees — Class IS | | | — | @ | |
Bank Overdraft | | | — | @ | |
Other Liabilities | | | 45 | | |
Total Liabilities | | | 1,939 | | |
Net Assets | | $ | 185,761 | | |
Net Assets Consist Of: | |
Paid-in-Capital | | $ | 223,060 | | |
Accumulated Undistributed Net Investment Income | | | 541 | | |
Accumulated Net Realized Loss | | | (38,605 | ) | |
Unrealized Appreciation (Depreciation) on: | |
Investments | | | 649 | | |
Futures Contracts | | | 116 | | |
Foreign Currency Translations | | | — | @ | |
Net Assets | | $ | 185,761 | | |
The accompanying notes are an integral part of the financial statements.
14
Morgan Stanley Institutional Fund Trust
Annual Report — September 30, 2017
Short Duration Income Portfolio
Statement of Assets and Liabilities (cont'd) | | September 30, 2017
(000) | |
CLASS I: | |
Net Assets | | $ | 103,131 | | |
| Shares Outstanding (unlimited number of shares authorized, no par value) (not in 000's) | | | 12,651,622 | | |
Net Asset Value, Offering and Redemption Price Per Share | | $ | 8.15 | | |
CLASS A: | |
Net Assets | | $ | 82,157 | | |
| Shares Outstanding (unlimited number of shares authorized, no par value) (not in 000's) | | | 10,055,324 | | |
Net Asset Value, Offering and Redemption Price Per Share | | $ | 8.17 | | |
CLASS L: | |
Net Assets | | $ | 410 | | |
| Shares Outstanding (unlimited number of shares authorized, no par value) (not in 000's) | | | 50,314 | | |
Net Asset Value, Offering and Redemption Price Per Share | | $ | 8.15 | | |
CLASS C: | |
Net Assets | | $ | 52 | | |
| Shares Outstanding (unlimited number of shares authorized, no par value) (not in 000's) | | | 6,380 | | |
Net Asset Value, Offering and Redemption Price Per Share | | $ | 8.13 | | |
CLASS IS: | |
Net Assets | | $ | 11 | | |
| Shares Outstanding (unlimited number of shares authorized, no par value) (not in 000's) | | | 1,307 | | |
Net Asset Value, Offering and Redemption Price Per Share | | $ | 8.15 | | |
@ Amount is less than $500.
The accompanying notes are an integral part of the financial statements.
15
Morgan Stanley Institutional Fund Trust
Annual Report — September 30, 2017
Short Duration Income Portfolio
Statement of Operations | | Year Ended
September 30, 2017
(000) | |
Investment Income: | |
Interest from Securities of Unaffiliated Issuers | | $ | 3,687 | | |
Dividends from Security of Affiliated Issuer (Note G) | | | 29 | | |
Total Investment Income | | | 3,716 | | |
Expenses: | |
Advisory Fees (Note B) | | | 336 | | |
Shareholder Services Fees — Class A (Note D) | | | 172 | | |
Distribution and Shareholder Services Fees — Class L (Note D) | | | 2 | | |
Distribution and Shareholder Services Fees — Class C (Note D) | | | 1 | | |
Professional Fees | | | 140 | | |
Administration Fees (Note C) | | | 135 | | |
Registration Fees | | | 73 | | |
Sub Transfer Agency Fees — Class I | | | 39 | | |
Sub Transfer Agency Fees — Class A | | | 32 | | |
Sub Transfer Agency Fees — Class L | | | — | @ | |
Sub Transfer Agency Fees — Class C | | | — | @ | |
Shareholder Reporting Fees | | | 49 | | |
Pricing Fees | | | 36 | | |
Transfer Agency Fees — Class I (Note E) | | | 6 | | |
Transfer Agency Fees — Class A (Note E) | | | 7 | | |
Transfer Agency Fees — Class L (Note E) | | | 3 | | |
Transfer Agency Fees — Class C (Note E) | | | 2 | | |
Transfer Agency Fees — Class IS (Note E) | | | 2 | | |
Custodian Fees (Note F) | | | 19 | | |
Trustees' Fees and Expenses | | | 6 | | |
Other Expenses | | | 29 | | |
Reorganization Expense | | | (49 | )* | |
Total Expenses | | | 1,040 | | |
Waiver of Advisory Fees (Note B) | | | (336 | ) | |
Expenses Reimbursed by Adviser (Note B) | | | (17 | ) | |
Reimbursement of Class Specific Expenses — Class A (Note B) | | | (5 | ) | |
Reimbursement of Class Specific Expenses — Class L (Note B) | | | (3 | ) | |
Reimbursement of Class Specific Expenses — Class C (Note B) | | | (2 | ) | |
Reimbursement of Class Specific Expenses — Class IS (Note B) | | | (2 | ) | |
Rebate from Morgan Stanley Affiliate (Note G) | | | (7 | ) | |
Net Expenses | | | 668 | | |
Net Investment Income | | | 3,048 | | |
Realized Gain: | |
Investments Sold | | | 829 | | |
Futures Contracts | | | 659 | | |
Net Realized Gain | | | 1,488 | | |
Change in Unrealized Appreciation (Depreciation): | |
Investments | | | (977 | ) | |
Foreign Currency Translations | | | — | @ | |
Futures Contracts | | | 119 | | |
Net Change in Unrealized Appreciation (Depreciation) | | | (858 | ) | |
Net Realized Gain and Change in Unrealized Appreciation (Depreciation) | | | 630 | | |
Net Increase in Net Assets Resulting from Operations | | $ | 3,678 | | |
@ Amount is less than $500.
* Over accrual of prior year expenses.
The accompanying notes are an integral part of the financial statements.
16
Morgan Stanley Institutional Fund Trust
Annual Report — September 30, 2017
Short Duration Income Portfolio
Statements of Changes in Net Assets | | Year Ended
September 30, 2017
(000) | | Year Ended
September 30, 2016
(000) | |
Increase (Decrease) in Net Assets: | |
Operations: | |
Net Investment Income | | $ | 3,048 | | | $ | 2,629 | | |
Net Realized Gain | | | 1,488 | | | | 7,127 | | |
Net Change in Unrealized Appreciation (Depreciation) | | | (858 | ) | | | 1,093 | | |
Net Increase in Net Assets Resulting from Operations | | | 3,678 | | | | 10,849 | | |
Distributions from and/or in Excess of: | |
Class I: | |
Net Investment Income | | | (1,867 | ) | | | (1,953 | ) | |
Class A: | |
Net Investment Income | | | (1,107 | ) | | | (590 | ) | |
Class L: | |
Net Investment Income | | | (6 | ) | | | (6 | ) | |
Class C: | |
Net Investment Income | | | (1 | ) | | | (1 | ) | |
Class IS: | |
Net Investment Income | | | (— | @) | | | (— | @)* | |
Total Distributions | | | (2,981 | ) | | | (2,550 | ) | |
Capital Share Transactions:(1) | |
Class I: | |
Subscribed | | | 31,538 | | | | 8,502 | | |
Issued due to a tax-free reorganization | | | — | | | | 604 | | |
Distributions Reinvested | | | 1,865 | | | | 1,951 | | |
Redeemed | | | (29,309 | ) | | | (20,237 | ) | |
Class A: | |
Subscribed | | | 51,478 | | | | 23,263 | | |
Issued due to a tax-free reorganization | | | — | | | | 47,269 | | |
Distributions Reinvested | | | 1,088 | | | | 585 | | |
Redeemed | | | (37,490 | ) | | | (9,355 | ) | |
Class L: | |
Exchanged | | | 56 | | | | 167 | | |
Issued due to a tax-free reorganization | | | — | | | | 112 | | |
Distributions Reinvested | | | 4 | | | | 3 | | |
Redeemed | | | (55 | ) | | | (339 | ) | |
Class C: | |
Exchanged | | | — | | | | 32 | | |
Distributions Reinvested | | | — | @ | | | 1 | | |
Redeemed | | | (44 | ) | | | (13 | ) | |
Class IS: | |
Subscribed | | | — | | | | 10 | * | |
Net Increase in Net Assets Resulting from Capital Share Transactions | | | 19,131 | | | | 52,555 | | |
Total Increase in Net Assets | | | 19,828 | | | | 60,854 | | |
Net Assets: | |
Beginning of Period | | | 165,933 | | | | 105,079 | | |
End of Period (Including Accumulated Undistributed Net Investment Income of $541 and $474) | | $ | 185,761 | | | $ | 165,933 | | |
The accompanying notes are an integral part of the financial statements.
17
Morgan Stanley Institutional Fund Trust
Annual Report — September 30, 2017
Short Duration Income Portfolio
Statements of Changes in Net Assets (cont'd) | | Year Ended
September 30, 2017
(000) | | Year Ended
September 30, 2016
(000) | |
(1) Capital Share Transactions: | |
Class I: | |
Shares Subscribed | | $ | 3,881 | | | $ | 1,090 | | |
Shares Issued due to a tax-free reorganization | | | — | | | | 79 | | |
Shares Issued on Distributions Reinvested | | | 230 | | | | 252 | | |
Shares Redeemed | | | (3,609 | ) | | | (2,604 | ) | |
Net Increase (Decrease) in Class I Shares Outstanding | | | 502 | | | | (1,183 | ) | |
Class A: | |
Shares Subscribed | | | 6,314 | | | | 2,949 | | |
Shares Issued due to a tax-free reorganization | | | — | | | | 6,163 | | |
Shares Issued on Distributions Reinvested | | | 133 | | | | 75 | | |
Shares Redeemed | | | (4,608 | ) | | | (1,199 | ) | |
Net Increase in Class A Shares Outstanding | | | 1,839 | | | | 7,988 | | |
Class L: | |
Shares Exchanged | | | 7 | | | | 22 | | |
Shares Issued due to a tax-free reorganization | | | — | | | | 15 | | |
Shares Issued on Distributions Reinvested | | | — | @@ | | | — | @@ | |
Shares Redeemed | | | (6 | ) | | | (44 | ) | |
Net Increase (Decrease) in Class L Shares Outstanding | | | 1 | | | | (7 | ) | |
Class C: | |
Shares Exchanged | | | — | | | | 5 | | |
Shares Issued on Distributions Reinvested | | | — | @@ | | | — | @@ | |
Shares Redeemed | | | (5 | ) | | | (2 | ) | |
Net Increase (Decrease) in Class C Shares Outstanding | | | (5 | ) | | | 3 | | |
Class IS: | |
Shares Subscribed | | | — | | | | 1 | * | |
* For the period January 11, 2016 through September 30, 2016.
@ Amount is less than $500.
@@ Amount is less than 500 shares.
The accompanying notes are an integral part of the financial statements.
18
Morgan Stanley Institutional Fund Trust
Annual Report — September 30, 2017
Financial Highlights
Short Duration Income Portfolio
| | | Class I | |
| | | Year Ended September 30, | |
Selected Per Share Data and Ratios | | 2017 | | 2016(1) | | 2015 | | 2014 | | 2013 | |
Net Asset Value, Beginning of Period | | $ | 8.12 | | | $ | 7.71 | | | $ | 7.81 | | | $ | 7.76 | | | $ | 7.80 | | |
Income (Loss) from Investment Operations: | |
Net Investment Income(2) | | | 0.16 | | | | 0.15 | | | | 0.13 | | | | 0.12 | | | | 0.11 | | |
Net Realized and Unrealized Gain (Loss) | | | 0.02 | | | | 0.41 | | | | (0.12 | ) | | | 0.04 | | | | (0.03 | ) | |
Total from Investment Operations | | | 0.18 | | | | 0.56 | | | | 0.01 | | | | 0.16 | | | | 0.08 | | |
Distributions from and/or in Excess of: | |
Net Investment Income | | | (0.15 | ) | | | (0.15 | ) | | | (0.11 | ) | | | (0.11 | ) | | | (0.12 | ) | |
Net Asset Value, End of Period | | $ | 8.15 | | | $ | 8.12 | | | $ | 7.71 | | | $ | 7.81 | | | $ | 7.76 | | |
Total Return(3) | | | 2.29 | %(4) | | | 7.43 | %(5) | | | 0.06 | % | | | 2.06 | % | | | 1.09 | % | |
Ratios and Supplemental Data: | |
Net Assets, End of Period (Thousands) | | $ | 103,131 | | | $ | 98,603 | | | $ | 102,808 | | | $ | 119,059 | | | $ | 122,958 | | |
Ratio of Expenses to Average Net Assets(10) | | | 0.30 | %(6) | | | 0.36 | %(6)(8) | | | 0.53 | %(6) | | | 0.53 | %(6) | | | 0.71 | %(6)(7) | |
Ratio of Net Investment Income to Average Net Assets(10) | | | 1.92 | %(6) | | | 1.97 | %(6)(8) | | | 1.72 | %(6) | | | 1.49 | %(6) | | | 1.45 | %(6)(7) | |
Ratio of Rebate from Morgan Stanley Affiliates to Average Net Assets | | | 0.00 | %(9) | | | 0.00 | %(9) | | | 0.00 | %(9) | | | 0.00 | %(9) | | | 0.00 | %(9) | |
Portfolio Turnover Rate | | | 43 | % | | | 66 | % | | | 41 | % | | | 60 | % | | | 66 | % | |
(10) Supplemental Information on the Ratios to Average Net Assets: | |
Ratios Before Expense Limitation: | |
Expenses to Average Net Assets | | | 0.53 | % | | | 0.65 | % | | | 0.63 | % | | | 0.78 | % | | | 0.72 | % | |
Net Investment Income to Average Net Assets | | | 1.68 | % | | | 1.68 | % | | | 1.62 | % | | | 1.24 | % | | | 1.44 | % | |
(1) Reflects prior period custodian out-of-pocket expenses that were reimbursed in September 2016. The amount of the reimbursement was immaterial on a per share basis and did not impact the total return of Class I shares. The Ratio of Expenses to Average Net Assets and the Ratio of Net Investment Income to Average Net Assets would be unchanged as the reimbursement of custodian fees was offset against expense waivers/reimbursements with no impact to net expenses or net investment income.
(2) Per share amount is based on average shares outstanding.
(3) Calculated based on the net asset value as of the last business day of the period.
(4) Performance was positively impacted by approximately 0.51% due to the receipt of proceeds from the settlement of a class action suit involving the Fund's past holdings. This was a one-time settlement, and as a result, the impact on the NAV and consequently the performance will not likely be repeated in the future. Had this settlement not occurred, the total return for Class I shares would have been approximately 1.78%.
(5) Performance was positively impacted by approximately 5.97% due to the receipt of proceeds from the settlement of class action suits involving the Fund's past holdings. These were one-time settlements, and as a result, the impact on the NAV and consequently the performance will not likely be repeated in the future. Had these settlements not occurred, the total return for Class I shares would have been approximately 1.46%.
(6) The Ratios of Expenses and Net Investment Income reflect the rebate of certain Fund expenses in connection with the investments in Morgan Stanley affiliates during the period. The effect of the rebate on the ratios is disclosed in the above table as "Ratio of Rebate from Morgan Stanley Affiliates to Average Net Assets."
(7) Effective September 16, 2013, the Adviser has agreed to limit the ratio of expenses to average net assets to the maximum ratio of 0.53% for Class I shares.
(8) Effective January 11, 2016, the Adviser has agreed to limit the ratio of expenses to average net assets to the maximum ratio of 0.30% for Class I shares. Prior to January 11, 2016, the maximum ratio was 0.53% for Class I shares.
(9) Amount is less than 0.005%.
The accompanying notes are an integral part of the financial statements.
19
Morgan Stanley Institutional Fund Trust
Annual Report — September 30, 2017
Financial Highlights
Short Duration Income Portfolio
| | | Class A | |
| | | Year Ended September 30, | |
Selected Per Share Data and Ratios | | 2017 | | 2016(1) | | 2015 | | 2014 | | 2013 | |
Net Asset Value, Beginning of Period | | $ | 8.13 | | | $ | 7.72 | | | $ | 7.83 | | | $ | 7.77 | | | $ | 7.80 | | |
Income (Loss) from Investment Operations: | |
Net Investment Income(2) | | | 0.14 | | | | 0.14 | | | | 0.11 | | | | 0.09 | | | | 0.09 | | |
Net Realized and Unrealized Gain (Loss) | | | 0.03 | | | | 0.40 | | | | (0.14 | ) | | | 0.05 | | | | (0.01 | ) | |
Total from Investment Operations | | | 0.17 | | | | 0.54 | | | | (0.03 | ) | | | 0.14 | | | | 0.08 | | |
Distributions from and/or in Excess of: | |
Net Investment Income | | | (0.13 | ) | | | (0.13 | ) | | | (0.08 | ) | | | (0.08 | ) | | | (0.11 | ) | |
Net Asset Value, End of Period | | $ | 8.17 | | | $ | 8.13 | | | $ | 7.72 | | | $ | 7.83 | | | $ | 7.77 | | |
Total Return(3) | | | 2.15 | %(4) | | | 7.15 | %(5) | | | (0.41 | )% | | | 1.78 | % | | | 0.84 | % | |
Ratios and Supplemental Data: | |
Net Assets, End of Period (Thousands) | | $ | 82,157 | | | $ | 66,821 | | | $ | 1,761 | | | $ | 940 | | | $ | 749 | | |
Ratio of Expenses to Average Net Assets(10) | | | 0.55 | %(6) | | | 0.52 | %(6)(8) | | | 0.88 | %(6) | | | 0.88 | %(6) | | | 0.97 | %(6)(7) | |
Ratio of Net Investment Income to Average Net Assets(10) | | | 1.66 | %(6) | | | 1.83 | %(6)(8) | | | 1.40 | %(6) | | | 1.14 | %(6) | | | 1.15 | %(6)(7) | |
Ratio of Rebate from Morgan Stanley Affiliates to Average Net Assets | | | 0.00 | %(9) | | | 0.00 | %(9) | | | 0.00 | %(9) | | | 0.00 | %(9) | | | 0.00 | %(9) | |
Portfolio Turnover Rate | | | 43 | % | | | 66 | % | | | 41 | % | | | 60 | % | | | 66 | % | |
(10) Supplemental Information on the Ratios to Average Net Assets: | |
Ratios Before Expense Limitation: | |
Expenses to Average Net Assets | | | 0.80 | % | | | 0.80 | % | | | 1.22 | % | | | 1.10 | % | | | 1.00 | % | |
Net Investment Income to Average Net Assets | | | 1.41 | % | | | 1.55 | % | | | 1.06 | % | | | 0.92 | % | | | 1.12 | % | |
(1) Reflects prior period custodian out-of-pocket expenses that were reimbursed in September 2016. The amount of the reimbursement was immaterial on a per share basis and did not impact the total return of Class A shares. The Ratio of Expenses to Average Net Assets and the Ratio of Net Investment Income to Average Net Assets would be unchanged as the reimbursement of custodian fees was offset against expense waivers/reimbursements with no impact to net expenses or net investment income.
(2) Per share amount is based on average shares outstanding.
(3) Calculated based on the net asset value as of the last business day of the period.
(4) Performance was positively impacted by approximately 0.50% due to the receipt of proceeds from the settlement of a class action suit involving the Fund's past holdings. This was a one-time settlement, and as a result, the impact on the NAV and consequently the performance will not likely be repeated in the future. Had this settlement not occurred, the total return for Class A shares would have been approximately 1.65%.
(5) Performance was positively impacted by approximately 5.94% due to the receipt of proceeds from the settlement of class action suits involving the Fund's past holdings. These were one-time settlements, and as a result, the impact on the NAV and consequently the performance will not likely be repeated in the future. Had these settlements not occurred, the total return for Class A shares would have been approximately 1.21%.
(6) The Ratios of Expenses and Net Investment Income reflect the rebate of certain Fund expenses in connection with the investments in Morgan Stanley affiliates during the period. The effect of the rebate on the ratios is disclosed in the above table as "Ratio of Rebate from Morgan Stanley Affiliates to Average Net Assets."
(7) Effective September 16, 2013, the Adviser has agreed to limit the ratio of expenses to average net assets to the maximum ratio of 0.88% for Class A shares.
(8) Effective January 11, 2016, the Adviser has agreed to limit the ratio of expenses to average net assets to the maximum ratio of 0.55% for Class A shares. Prior to January 11, 2016, the maximum ratio was 0.88% for Class A shares.
(9) Amount is less than 0.005%.
The accompanying notes are an integral part of the financial statements.
20
Morgan Stanley Institutional Fund Trust
Annual Report — September 30, 2017
Financial Highlights
Short Duration Income Portfolio
| | | Class L | |
| | | Year Ended September 30, | |
Selected Per Share Data and Ratios | | 2017 | | 2016(1) | | 2015 | | 2014 | | 2013 | |
Net Asset Value, Beginning of Period | | $ | 8.11 | | | $ | 7.70 | | | $ | 7.80 | | | $ | 7.75 | | | $ | 7.80 | | |
Income (Loss) from Investment Operations: | |
Net Investment Income(2) | | | 0.11 | | | | 0.11 | | | | 0.08 | | | | 0.06 | | | | 0.07 | | |
Net Realized and Unrealized Gain (Loss) | | | 0.04 | | | | 0.41 | | | | (0.13 | ) | | | 0.05 | | | | (0.03 | ) | |
Total from Investment Operations | | | 0.15 | | | | 0.52 | | | | (0.05 | ) | | | 0.11 | | | | 0.04 | | |
Distributions from and/or in Excess of: | |
Net Investment Income | | | (0.11 | ) | | | (0.11 | ) | | | (0.05 | ) | | | (0.06 | ) | | | (0.09 | ) | |
Net Asset Value, End of Period | | $ | 8.15 | | | $ | 8.11 | | | $ | 7.70 | | | $ | 7.80 | | | $ | 7.75 | | |
Total Return(3) | | | 1.90 | %(4) | | | 6.79 | %(5) | | | (0.68 | )% | | | 1.38 | % | | | 0.48 | % | |
Ratios and Supplemental Data: | |
Net Assets, End of Period (Thousands) | | $ | 410 | | | $ | 403 | | | $ | 439 | | | $ | 200 | | | $ | 95 | | |
Ratio of Expenses to Average Net Assets(10) | | | 0.80 | %(6) | | | 0.92 | %(6)(8) | | | 1.23 | %(6) | | | 1.23 | %(6) | | | 1.24 | %(6)(7) | |
Ratio of Net Investment Income to Average Net Assets(10) | | | 1.41 | %(6) | | | 1.42 | %(6)(8) | | | 1.05 | %(6) | | | 0.79 | %(6) | | | 0.85 | %(6)(7) | |
Ratio of Rebate from Morgan Stanley Affiliates to Average Net Assets | | | 0.00 | %(9) | | | 0.00 | %(9) | | | 0.00 | %(9) | | | 0.00 | %(9) | | | 0.00 | %(9) | |
Portfolio Turnover Rate | | | 43 | % | | | 66 | % | | | 41 | % | | | 60 | % | | | 66 | % | |
(10) Supplemental Information on the Ratios to Average Net Assets: | |
Ratios Before Expense Limitation: | |
Expenses to Average Net Assets | | | 1.70 | % | | | 1.83 | % | | | 1.80 | % | | | 3.48 | % | | | 1.34 | % | |
Net Investment Income (Loss) to Average Net Assets | | | 0.51 | % | | | 0.51 | % | | | 0.48 | % | | | (1.46 | )% | | | 0.75 | % | |
(1) Reflects prior period custodian out-of-pocket expenses that were reimbursed in September 2016. The amount of the reimbursement was immaterial on a per share basis and did not impact the total return of Class L shares. The Ratio of Expenses to Average Net Assets and the Ratio of Net Investment Income to Average Net Assets would be unchanged as the reimbursement of custodian fees was offset against expense waivers/reimbursements with no impact to net expenses or net investment income.
(2) Per share amount is based on average shares outstanding.
(3) Calculated based on the net asset value as of the last business day of the period.
(4) Performance was positively impacted by approximately 0.51% due to the receipt of proceeds from the settlement of a class action suit involving the Fund's past holdings. This was a one-time settlement, and as a result, the impact on the NAV and consequently the performance will not likely be repeated in the future. Had this settlement not occurred, the total return for Class L shares would have been approximately 1.39%.
(5) Performance was positively impacted by approximately 5.92% due to the receipt of proceeds from the settlement of class action suits involving the Fund's past holdings. These were one-time settlements, and as a result, the impact on the NAV and consequently the performance will not likely be repeated in the future. Had these settlements not occurred, the total return for Class L shares would have been approximately 0.87%.
(6) The Ratios of Expenses and Net Investment Income reflect the rebate of certain Fund expenses in connection with the investments in Morgan Stanley affiliates during the period. The effect of the rebate on the ratios is disclosed in the above table as "Ratio of Rebate from Morgan Stanley Affiliates to Average Net Assets."
(7) Effective September 16, 2013, the Adviser has agreed to limit the ratio of expenses to average net assets to the maximum ratio of 1.23% for Class L shares.
(8) Effective January 11, 2016, the Adviser has agreed to limit the ratio of expenses to average net assets to the maximum ratio of 0.80% for Class L shares. Prior to January 11, 2016, the maximum ratio was 1.23% for Class L shares.
(9) Amount is less than 0.005%.
The accompanying notes are an integral part of the financial statements.
21
Morgan Stanley Institutional Fund Trust
Annual Report — September 30, 2017
Financial Highlights
Short Duration Income Portfolio
| | | Class C | |
| | | Year Ended September 30, | | Period from
April 30, 2015(2) to | |
Selected Per Share Data and Ratios | | 2017 | | 2016(1) | | September 30, 2015 | |
Net Asset Value, Beginning of Period | | $ | 8.09 | | | $ | 7.69 | | | $ | 7.78 | | |
Income (Loss) from Investment Operations: | |
Net Investment Income(3) | | | 0.07 | | | | 0.07 | | | | 0.02 | | |
Net Realized and Unrealized Gain (Loss) | | | 0.04 | | | | 0.41 | | | | (0.09 | ) | |
Total from Investment Operations | | | 0.11 | | | | 0.48 | | | | (0.07 | ) | |
Distributions from and/or in Excess of: | |
Net Investment Income | | | (0.07 | ) | | | (0.08 | ) | | | (0.02 | ) | |
Net Asset Value, End of Period | | $ | 8.13 | | | $ | 8.09 | | | $ | 7.69 | | |
Total Return(4) | | | 1.34 | %(5) | | | 6.24 | %(6) | | | (0.92 | )%(10) | |
Ratios and Supplemental Data: | |
Net Assets, End of Period (Thousands) | | $ | 52 | | | $ | 95 | | | $ | 71 | | |
Ratio of Expenses to Average Net Assets(12) | | | 1.30 | %(7) | | | 1.39 | %(7)(8) | | | 1.63 | %(7)(11) | |
Ratio of Net Investment Income to Average Net Assets(12) | | | 0.85 | %(7) | | | 0.93 | %(7)(8) | | | 0.73 | %(7)(11) | |
Ratio of Rebate from Morgan Stanley Affiliates to Average Net Assets | | | 0.00 | %(9) | | | 0.00 | %(9) | | | 0.00 | %(9)(11) | |
Portfolio Turnover Rate | | | 43 | % | | | 66 | % | | | 41 | %(10) | |
(12) Supplemental Information on the Ratios to Average Net Assets: | |
Ratios Before Expense Limitation: | |
Expenses to Average Net Assets | | | 4.92 | % | | | 3.95 | % | | | 6.73 | %(11) | |
Net Investment Loss to Average Net Assets | | | (2.77 | )% | | | (1.63 | )% | | | (4.37 | )%(11) | |
(1) Reflects prior period custodian out-of-pocket expenses that were reimbursed in September 2016. The amount of the reimbursement was immaterial on a per share basis and did not impact the total return of Class C shares. The Ratio of Expenses to Average Net Assets and the Ratio of Net Investment Income to Average Net Assets would be unchanged as the reimbursement of custodian fees was offset against expense waivers/reimbursements with no impact to net expenses or net investment income.
(2) Commencement of Offering.
(3) Per share amount is based on average shares outstanding.
(4) Calculated based on the net asset value which does not reflect sales charges, if applicable, as of the last business day of the period.
(5) Performance was positively impacted by approximately 0.50% due to the receipt of proceeds from the settlement of a class action suit involving the Fund's past holdings. This was a one-time settlement, and as a result, the impact on the NAV and consequently the performance will not likely be repeated in the future. Had this settlement not occurred, the total return for Class C shares would have been approximately 0.84%.
(6) Performance was positively impacted by approximately 5.77% due to the receipt of proceeds from the settlement of class action suits involving the Fund's past holdings. These were one-time settlements, and as a result, the impact on the NAV and consequently the performance will not likely be repeated in the future. Had these settlements not occurred, the total return for Class C shares would have been approximately 0.47%.
(7) The Ratios of Expenses and Net Investment Income reflect the rebate of certain Fund expenses in connection with the investments in Morgan Stanley affiliates during the period. The effect of the rebate on the ratios is disclosed in the above table as "Ratio of Rebate from Morgan Stanley Affiliates to Average Net Assets."
(8) Effective January 11, 2016, the Adviser has agreed to limit the ratio of expenses to average net assets to the maximum ratio of 1.30% for Class C shares. Prior to January 11, 2016, the maximum ratio was 1.63% for Class C shares.
(9) Amount is less than 0.005%.
(10) Not annualized.
(11) Annualized.
The accompanying notes are an integral part of the financial statements.
22
Morgan Stanley Institutional Fund Trust
Annual Report — September 30, 2017
Financial Highlights
Short Duration Income Portfolio
| | | Class IS | |
Selected Per Share Data and Ratios | | Year Ended
September 30, 2017 | | Period from
January 11, 2016(2) to
September 30, 2016(1) | |
Net Asset Value, Beginning of Period | | $ | 8.11 | | | $ | 7.65 | | |
Income from Investment Operations: | |
Net Investment Income(3) | | | 0.16 | | | | 0.17 | | |
Net Realized and Unrealized Gain | | | 0.04 | | | | 0.39 | | |
Total from Investment Operations | | | 0.20 | | | | 0.56 | | |
Distributions from and/or in Excess of: | |
Net Investment Income | | | (0.16 | ) | | | (0.10 | ) | |
Net Asset Value, End of Period | | $ | 8.15 | | | $ | 8.11 | | |
Total Return(4) | | | 2.46 | %(5) | | | 7.42 | %(6)(9) | |
Ratios and Supplemental Data: | |
Net Assets, End of Period (Thousands) | | $ | 11 | | | $ | 11 | | |
Ratio of Expenses to Average Net Assets(11) | | | 0.25 | %(7) | | | 0.25 | %(7)(10) | |
Ratio of Net Investment Income to Average Net Assets(11) | | | 1.96 | %(7) | | | 2.20 | %(7)(10) | |
Ratio of Rebate from Morgan Stanley Affiliates to Average Net Assets | | | 0.00 | %(8) | | | 0.00 | %(8)(10) | |
Portfolio Turnover Rate | | | 43 | % | | | 66 | %(9) | |
(11) Supplemental Information on the Ratios to Average Net Assets: | |
Ratios Before Expense Limitation: | |
Expenses to Average Net Assets | | | 16.24 | % | | | 17.12 | %(10) | |
Net Investment Loss to Average Net Assets | | | (14.03 | )% | | | (14.67 | )%(10) | |
(1) Reflects prior period custodian out-of-pocket expenses that were reimbursed in September 2016. The amount of the reimbursement was immaterial on a per share basis and did not impact the total return of Class IS shares. The Ratio of Expenses to Average Net Assets and the Ratio of Net Investment Income to Average Net Assets would be unchanged as the reimbursement of custodian fees was offset against expense waivers/reimbursements with no impact to net expenses or net investment income.
(2) Commencement of Offering.
(3) Per share amount is based on average shares outstanding.
(4) Calculated based on the net asset value as of the last business day of the period.
(5) Performance was positively impacted by approximately 0.51% due to the receipt of proceeds from the settlement of class action suits involving the Fund's past holdings. These were one-time settlements, and as a result, the impact on the NAV and consequently the performance will not likely be repeated in the future. Had these settlements not occurred, the total return for Class IS shares would have been approximately 1.95%.
(6) Performance was positively impacted by approximately 5.96% due to the receipt of proceeds from the settlement of class action suits involving the Fund's past holdings. These were one-time settlements, and as a result, the impact on the NAV and consequently the performance will not likely be repeated in the future. Had these settlements not occurred, the total return for Class IS shares would have been approximately 1.46%.
(7) The Ratios of Expenses and Net Investment Income reflect the rebate of certain Fund expenses in connection with the investments in Morgan Stanley affiliates during the period. The effect of the rebate on the ratios is disclosed in the above table as "Ratio of Rebate from Morgan Stanley Affiliates to Average Net Assets."
(8) Amount is less than 0.005%.
(9) Not annualized.
(10) Annualized.
The accompanying notes are an integral part of the financial statements.
23
Morgan Stanley Institutional Fund Trust
Annual Report — September 30, 2017
Notes to Financial Statements
Morgan Stanley Institutional Fund Trust ("Trust") is registered under the Investment Company Act of 1940, as amended (the "Act''), as an open-end management investment company. The Trust is comprised of nine separate, active funds (individually referred to as a "Fund", collectively as the "Funds"). The Trust applies investment company accounting and reporting guidance. All Funds are considered diversified for purposes of the Act.
The accompanying financial statements relate to the Short Duration Income Portfolio. The Fund seeks above-average total return over a market cycle of three to five years. The Fund offers five classes of shares — Class I, Class A, Class L, Class C and Class IS.
The Fund has suspended offering Class L and Class C shares to all investors. Class L and Class C shareholders of the Fund do not have the option of purchasing additional Class L and Class C shares, respectively. However, existing Class L and Class C shareholders may invest in additional Class L and Class C shares through reinvestment of dividends and distributions.
On January 11, 2016, the Fund acquired the net assets of Morgan Stanley Limited Duration U.S. Government Trust ("Limited Duration U.S. Government Trust"), an open-end investment company, based on the respective valuations as of the close of business on January 8, 2016, pursuant to a Plan of Reorganization approved by the shareholders of Limited Duration U.S. Government Trust on June 9, 2015 ("Reorganization"). The purpose of the transaction was to combine two portfolios managed by Morgan Stanley Investment Management Inc. (the "Adviser") with comparable investment objectives and strategies. The acquisition was accomplished by a tax-free exchange of 78,397 Class I shares of the Fund at a net asset value of $7.65 for 68,223 Class I shares of Limited Duration U.S. Government Trust; 528 Class I shares of the Fund at a net asset value of $7.65 for 460 Advisor Class shares of Limited Duration U.S. Government Trust; 6,162,897 Class A shares of the Fund at a net asset value of $7.67 for 5,378,737 Advisor Class shares of Limited Duration U.S. Government Trust; and 14,702 Class L shares of the Fund at a net asset value of $7.65 for 12,798 Advisor Class shares of Limited Duration U.S. Government Trust. The net assets of Limited Duration U.S. Government Trust before the Reorganization were approximately $47,986,000, including unrealized appreciation of approximately $462,000 at January 8, 2016. The investment portfolio of Limited Duration U.S. Government Trust, with a fair value of approximately $47,575,000 and identified cost of approximately $47,113,000 on January 8, 2016, was
the principal asset acquired by the Fund. For financial reporting purposes, assets received and shares issued by the Fund were recorded at fair value; however, the cost basis of the investments received from Limited Duration U.S. Government Trust was carried forward to align ongoing reporting of the Fund's realized and unrealized gains and losses with amounts distributable to shareholders for tax purposes. Immediately prior to the Reorganization, the net assets of the Fund were approximately $100,541,000. Immediately after the Reorganization, the net assets of the Fund were approximately $148,527,000.
Upon closing of the Reorganization, shareholders of Limited Duration U.S. Government Trust received shares of the Fund as follows:
Limited Duration
U.S. Government Trust | | Short Duration
Income Portfolio | |
| Class I | | Class I | |
| Advisor Class | | Class I | |
| Advisor Class | | Class A | |
| Advisor Class | | Class L | |
Assuming the acquisition had been completed on October 1, 2015, the beginning of the annual reporting period of the Fund, the Fund's pro forma results of operations for the period ended September 30, 2016, are as follows:
Net investment income(1) | | $ | 4,042,000 | | |
Net realized gain and unrealized gain(2) | | $ | 7,755,000 | | |
Net increase in net assets resulting from operations | | $ | 11,797,000 | | |
(1) Approximately $2,629,000 as reported, plus approximately $898,000 Limited Duration U.S. Government Trust prior to Reorganization, plus approximately $515,000 of estimated pro-forma eliminated expenses.
(2) Approximately $8,220,000 as reported, plus approximately $(465,000) Limited Duration U.S. Government Trust prior to Reorganization.
Because the combined investment portfolios have been managed as a single integrated portfolio since the acquisition was completed, it is not practicable to separate the amounts of revenue and earnings of Limited Duration U.S. Government Trust that have been included in the Fund's Statement of Operations since January 11, 2016.
A. Significant Accounting Policies: The following significant accounting policies are in conformity with U.S. generally accepted accounting principles ("GAAP"). Such policies are consistently followed by the Trust in the preparation of its financial statements. GAAP may require management to make estimates and assumptions that affect the reported amounts and disclosures in the financial statements. Actual results may differ from those estimates.
24
Morgan Stanley Institutional Fund Trust
Annual Report — September 30, 2017
Notes to Financial Statements (cont'd)
1. Security Valuation: (1) Certain portfolio securities may be valued by an outside pricing service/vendor approved by the Trust's Board of Trustees (the "Trustees"). The pricing service/vendor may employ a pricing model that takes into account, among other things, bids, yield spreads, and/or other market data and specific security characteristics. Alternatively, if a valuation is not available from an outside pricing service/vendor, and the security trades on an exchange, the security may be valued at its latest reported sale price (or at the exchange official closing price if such exchange reports an official closing price), prior to the time when assets are valued. If there are no sales on a given day and if there is no official exchange closing price for that day, the security is valued at the mean between the last reported bid and asked prices if such bid and asked prices are available in the relevant exchanges; (2) futures are valued at the settlement price on the exchange on which they trade or, if a settlement price is unavailable, at the last sale price on the exchange; (3) when market quotations are not readily available, including circumstances under which the Adviser determines that the closing price, last sale price or the mean between the last reported bid and asked prices are not reflective of a security's market value, portfolio securities are valued at their fair value as determined in good faith under procedures established by and under the general supervision of the Trustees. Occasionally, developments affecting the closing prices of securities and other assets may occur between the times at which valuations of such securities are determined (that is, close of the foreign market on which the securities trade) and the close of business of the New York Stock Exchange ("NYSE"). If developments occur during such periods that are expected to materially affect the value of such securities, such valuations may be adjusted to reflect the estimated fair value of such securities as of the close of the NYSE, as determined in good faith by the Trustees or by the Adviser using a pricing service and/or procedures approved by the Trustees; (4) quotations of foreign portfolio securities, other assets and liabilities and forward contracts stated in foreign currency are translated into U.S. dollar equivalents at the prevailing market rates prior to the close of the NYSE; and (5) investments in mutual funds, including the Morgan Stanley Institutional Liquidity Funds, are valued at the net asset value ("NAV") as of the close of each business day.
The Trustees have responsibility for determining in good faith the fair value of the investments, and the Trustees may appoint others, such as the Trust's Adviser or a valuation committee, to assist the Trustees in determining fair value and to make the actual calculations pursuant to the fair valuation methodologies previously approved by the Trustees. Under procedures approved by the Trustees, the Trust's Adviser has formed a Valuation Committee whose members are approved by the Trustees. The Valuation Committee provides administration and oversight of the Trust's valuation policies and procedures, which are reviewed at least annually by the Trustees. These procedures allow the Trust to utilize independent pricing services, quotations from securities and financial instrument dealers, and other market sources to determine fair value.
The Trust has procedures to determine the fair value of securities and other financial instruments for which market prices are not readily available. Under these procedures, the Valuation Committee convenes on a regular and ad hoc basis to review such securities and considers a number of factors, including valuation methodologies and significant unobservable valuation inputs, when arriving at fair value. The Valuation Committee may employ a market-based approach which may use related or comparable assets or liabilities, recent transactions, market multiples, book values, and other relevant information for the investment to determine the fair value of the investment. An income-based valuation approach may also be used in which the anticipated future cash flows of the investment are discounted to calculate fair value. Discounts may also be applied due to the nature or duration of any restrictions on the disposition of the investments. Due to the inherent uncertainty of valuations of such investments, the fair values may differ significantly from the values that would have been used had an active market existed. The Valuation Committee employs various methods for calibrating these valuation approaches including a regular review of valuation methodologies, key inputs and assumptions, transactional back-testing or disposition analysis, and reviews of any related market activity.
2. Fair Value Measurement: Financial Accounting Standards Board ("FASB") Accounting Standards CodificationTM ("ASC") 820, "Fair Value Measurement"
25
Morgan Stanley Institutional Fund Trust
Annual Report — September 30, 2017
Notes to Financial Statements (cont'd)
("ASC 820"), defines fair value as the value that the Fund would receive to sell an investment or pay to transfer a liability in a timely transaction with an independent buyer in the principal market, or in the absence of a principal market, the most advantageous market for the investment or liability. ASC 820 establishes a three-tier hierarchy to distinguish between (1) inputs that reflect the assumptions market participants would use in valuing an asset or liability developed based on market data obtained from sources independent of the reporting entity (observable inputs) and (2) inputs that reflect the reporting entity's own assumptions about the assumptions market participants would use in valuing an asset or liability developed based on the best information available in the circumstances (unobservable inputs) and to establish classification of fair value measurements for disclosure purposes. Various inputs are used in determining the value of the Fund's investments. The inputs are summarized in the three broad levels listed below.
• Level 1 – unadjusted quoted prices in active markets for identical investments
• Level 2 – other significant observable inputs (including quoted prices for similar investments, interest rates, prepayment speeds, credit risk, etc.)
• Level 3 – significant unobservable inputs including the Fund's own assumptions in determining the fair value of investments. Factors considered in making this determination may include, but are not limited to, information obtained by contacting the issuer, analysts, or the appropriate stock exchange (for exchange-traded securities), analysis of the issuer's financial statements or other available documents and, if necessary, available information concerning other securities in similar circumstances
The inputs or methodology used for valuing securities are not necessarily an indication of the risk associated with investing in those securities and the determination of the significance of a particular input to the fair value measurement in its entirety requires judgment and considers factors specific to each security.
The following is a summary of the inputs used to value the Fund's investments as of September 30, 2017.
Investment Type | | Level 1
Unadjusted
quoted
prices
(000) | | Level 2
Other
significant
observable
inputs
(000) | | Level 3
Significant
unobservable
inputs
(000) | | Total
(000) | |
Assets: | |
Fixed Income Securities | |
Agency Adjustable
Rate Mortgages | | $ | — | | | $ | 2,119 | | | $ | — | | | $ | 2,119 | | |
Agency Bonds —
Consumer
Discretionary
(U.S. Government
Guaranteed) | | | — | | | | 537 | | | | — | | | | 537 | | |
Agency Fixed Rate
Mortgages | | | — | | | | 2,912 | | | | — | | | | 2,912 | | |
Asset-Backed Securities | | | — | | | | 31,843 | | | | — | | | | 31,843 | | |
Collateralized Mortgage
Obligations — Agency
Collateral Series | | | — | | | | 5,057 | | | | — | | | | 5,057 | | |
Commercial
Mortgage-Backed
Securities | | | — | | | | 1,321 | | | | — | | | | 1,321 | | |
Corporate Bonds | | | — | | | | 122,651 | | | | — | | | | 122,651 | | |
Mortgages — Other | | | — | | | | 3,801 | | | | — | | | | 3,801 | | |
Sovereign | | | — | | | | 1,008 | | | | — | | | | 1,008 | | |
U.S. Agency Security | | | — | | | | 2,294 | | | | — | | | | 2,294 | | |
Total Fixed Income
Securities | | | — | | | | 173,543 | | | | — | | | | 173,543 | | |
Short-Term Investments | |
Investment Company | | | 3,863 | | | | — | | | | — | | | | 3,863 | | |
U.S. Treasury Security | | | — | | | | 1,341 | | | | — | | | | 1,341 | | |
Commercial Paper | | | — | | | | 7,820 | | | | — | | | | 7,820 | | |
Total Short-Term
Investments | | | 3,863 | | | | 9,161 | | | | — | | | | 13,024 | | |
Futures Contracts | | | 116 | | | | — | | | | — | | | | 116 | | |
Total Assets | | $ | 3,979 | | | $ | 182,704 | | | $ | — | | | $ | 186,683 | | |
Transfers between investment levels may occur as the markets fluctuate and/or the availability of data used in an investment's valuation changes. The Fund recognizes transfers between the levels as of the end of the period. As of September 30, 2017, the Fund did not have any investments transfer between investment levels.
3. Foreign Currency Translation and Foreign Investments: The books and records of the Fund are maintained in U.S. dollars. Foreign currency amounts are translated into U.S. dollars as follows:
– investments, other assets and liabilities at the prevailing rate of exchange on the valuation date;
– investment transactions and investment income at the prevailing rates of exchange on the dates of such transactions.
26
Morgan Stanley Institutional Fund Trust
Annual Report — September 30, 2017
Notes to Financial Statements (cont'd)
Although the net assets of the Fund are presented at the foreign exchange rates and market values at the close of the period, the Fund does not isolate that portion of the results of operations arising as a result of changes in the foreign exchange rates from the fluctuations arising from changes in the market prices of securities held at period end. Similarly, the Fund does not isolate the effect of changes in foreign exchange rates from the fluctuations arising from changes in the market prices of securities sold during the period. Accordingly, realized and unrealized foreign currency gains (losses) on investments in securities are included in the reported net realized and unrealized gains (losses) on investment transactions and balances. However, pursuant to U.S. federal income tax regulations, gains and losses from certain foreign currency transactions and the foreign currency portion of gains and losses realized on sales and maturities of foreign denominated debt securities are treated as ordinary income for U.S. federal income tax purposes.
Net realized gains (losses) on foreign currency transactions represent net foreign exchange gains (losses) from currency gains (losses) realized between the trade and settlement dates on securities transactions, and the difference between the amount of investment income and foreign withholding taxes recorded on the Fund's books and the U.S. dollar equivalent amounts actually received or paid. Net unrealized currency gains (losses) from valuing foreign currency denominated assets and liabilities at period end exchange rates are reflected as a component of unrealized appreciation (depreciation) in the Statement of Assets and Liabilities. The change in unrealized currency gains (losses) on foreign currency translations for the period is reflected in the Statement of Operations.
Foreign security and currency transactions may involve certain considerations and risks not typically associated with those of U.S. dollar denominated transactions as a result of, among other factors, fluctuations of exchange rates in relation to the U.S. dollar, the possibility of lower levels of governmental supervision and regulation of foreign securities markets and the possibility of political or economic instability.
Governmental approval for foreign investments may be required in advance of making an investment under certain circumstances in some countries, and the extent of
foreign investments in domestic companies may be subject to limitation in other countries. Foreign ownership limitations also may be imposed by the charters of individual companies to prevent, among other concerns, violations of foreign investment limitations. As a result, an additional class of shares (identified as "Foreign" in the Portfolio of Investments) may be created and offered for investment. The "local" and "foreign shares" market values may differ. In the absence of trading of the foreign shares in such markets, the Fund values the foreign shares at the closing exchange price of the local shares.
4. Derivatives: The Fund may, but is not required to, use derivative instruments for a variety of purposes, including hedging, risk management, portfolio management or to earn income. Derivatives are financial instruments whose value is based, in part, on the value of an underlying asset, interest rate, index or financial instrument. Prevailing interest rates and volatility levels, among other things, also affect the value of derivative instruments. A derivative instrument often has risks similar to its underlying asset and may have additional risks, including imperfect correlation between the value of the derivative and the underlying asset, risks of default by the counterparty to certain transactions, magnification of losses incurred due to changes in the market value of the securities, instruments, indices or interest rates to which the derivative instrument relates, risks that the transactions may not be liquid and risks arising from margin requirements. The use of derivatives involves risks that are different from, and possibly greater than, the risks associated with other portfolio investments. Derivatives may involve the use of highly specialized instruments that require investment techniques and risk analyses different from those associated with other portfolio investments. All of the Fund's holdings, including derivative instruments, are marked-to-market each day with the change in value reflected in unrealized appreciation (depreciation). Upon disposition, a realized gain or loss is recognized.
Certain derivative transactions may give rise to a form of leverage. Leverage magnifies the potential for gain and the risk of loss. Leverage associated with derivative transactions may cause the Fund to liquidate portfolio positions when it may not be advantageous to do so to satisfy its obligations or to meet earmarking or segregation requirements, pursuant to applicable Securities and Exchange Commission ("SEC") rules and regulations, or
27
Morgan Stanley Institutional Fund Trust
Annual Report — September 30, 2017
Notes to Financial Statements (cont'd)
may cause the Fund to be more volatile than if the Fund had not been leveraged. Although the Adviser seeks to use derivatives to further the Fund's investment objectives, there is no assurance that the use of derivatives will achieve this result.
Following is a description of the derivative instruments and techniques that the Fund used during the period and their associated risks:
Futures: A futures contract is a standardized, exchange-traded agreement to buy or sell a specific quantity of an underlying asset, reference rate or index at a specific price at a specific future time. The value of a futures contract tends to increase and decrease in tandem with the value of the underlying instrument. Depending on the terms of the particular contract, futures contracts are settled through either physical delivery of the underlying instrument on the settlement date or by payment of a cash settlement amount on the settlement date. During the period the futures contract is open, payments are received from or made to the broker based upon changes in the value of the contract (the variation margin). A decision as to whether, when and how to use futures contracts involves the exercise of skill and judgment and even a well-conceived futures transaction may be unsuccessful because of market behavior or unexpected events. In addition to the derivatives risks discussed above, the prices of futures contracts can be highly volatile, using futures contracts can lower total return, and the potential loss from futures contracts can exceed the Fund's initial investment in such contracts. No assurance can be given that a liquid market will exist for any particular futures contract at any particular time. There is also the risk of loss by the Fund of margin deposits in the event of bankruptcy of a broker with which the Fund has open positions in the futures contract.
FASB ASC 815, "Derivatives and Hedging" ("ASC 815"), is intended to improve financial reporting about derivative instruments by requiring enhanced disclosures to enable investors to better understand how and why the Fund uses derivative instruments, how these derivative instruments are accounted for and their effects on the Fund's financial position and results of operations.
The following tables set forth the fair value of the Fund's derivative contracts by primary risk exposure as of September 30, 2017.
| | | Asset Derivatives
Statement of Assets and
Liabilities Location | | Primary Risk
Exposure | | Value
(000) | |
Futures Contracts | | Variation Margin on
Futures Contracts | | Interest Rate Risk | | $ | 116 | (a) | |
(a) This amount represents the cumulative appreciation (depreciation) as reported in the Portfolio of Investments. The Statement of Assets and Liabilities only reflects the current day's net variation margin.
The following tables set forth by primary risk exposure the Fund's realized gains (losses) and change in unrealized appreciation (depreciation) by type of derivative contract for the year ended September 30, 2017 in accordance with ASC 815.
Realized Gain (Loss) | |
Primary Risk Exposure | | Derivative Type | | Value
(000) | |
Interest Rate Risk | | Futures Contracts | | $ | 659 | | |
Change in Unrealized Appreciation (Depreciation) | |
Primary Risk Exposure | | Derivative Type | | Value
(000) | |
Interest Rate Risk | | Futures Contracts | | $ | 119 | | |
For the year ended September 30, 2017, the approximate average monthly amount outstanding for each derivative type is as follows:
Futures Contracts: | |
Average monthly original value | | $ | 35,319,000 | | |
5. When-Issued/Delayed Delivery Securities: The Fund purchases and sells when-issued and delayed delivery securities. Securities purchased on a when-issued or delayed delivery basis are purchased for delivery beyond the normal settlement date at a stated price and yield, and no income accrues to the Fund on such securities prior to delivery date. Payment and delivery for when-issued and delayed delivery securities can take place a month or more after the date of the transaction. When the Fund enters into a purchase transaction on a when-issued or delayed delivery basis, securities are available for collateral in an amount at least equal in value to the Fund's commitments to purchase such securities. Purchasing securities on a when-issued or delayed delivery basis may involve a risk that the market price at the time of delivery may be lower than the agreed upon purchase price, in which case there could be an unrealized loss at the time of delivery. Purchasing investments on a when-issued or delayed delivery basis may be considered a form of leverage which may
28
Morgan Stanley Institutional Fund Trust
Annual Report — September 30, 2017
Notes to Financial Statements (cont'd)
increase the impact that gains (losses) may have on the Fund.
6. Indemnifications: The Trust enters into contracts that contain a variety of indemnifications. The Trust's maximum exposure under these arrangements is unknown. However, the Trust has not had prior claims or losses pursuant to these contracts and expects the risk of loss to be remote.
7. Dividends and Distributions to Shareholders: Dividends and distributions to shareholders are recorded on the ex-dividend date. Dividends from net investment income, if any, are declared and paid monthly. Net realized capital gains, if any, are distributed at least annually.
8. Security Transactions, Income and Expenses: Security transactions are accounted for on the trade date (date the order to buy or sell is executed). Realized gains and losses on the sale of investment securities are determined on the specific identified cost method. Dividend income and other distributions are recorded on the ex-dividend date (except for certain foreign dividends which may be recorded as soon as the Fund is informed of such dividends) net of applicable withholding taxes. Interest income is recognized on the accrual basis except where collection is in doubt. Discounts are accreted and premiums are amortized over the life of the respective securities. Most expenses of the Trust can be directly attributed to a particular Fund. Expenses which cannot be directly attributed are apportioned among the Funds based upon relative net assets or other appropriate methods. Income, expenses (other than class specific expenses — distribution and shareholder services, transfer agency and sub transfer agency fees) and realized and unrealized gains or losses are allocated to each class of shares based upon their relative net assets. Included in Realized Gain (Loss) on Investments Sold are proceeds from the one-time settlements of class action lawsuits involving the Fund's past holdings of approximately $964,000, the impact of which is on the Fund's performance is disclosed in the Financial Highlights.
B. Advisory Fees: The Adviser, a wholly-owned subsidiary of Morgan Stanley, provides the Fund with advisory services under the terms of an Investment Advisory Agreement, paid quarterly, at an annual rate of 0.20% of the average daily net assets of the Fund.
The Adviser has agreed to reduce its advisory fee and/or reimburse the Fund so that total annual portfolio operating
expenses, excluding certain investment related expenses, taxes, interest and other extraordinary expenses (including litigation), will not exceed 0.30% for Class I shares, 0.55% for Class A shares, 0.80% for Class L shares, 1.30% for Class C shares and 0.25% for Class IS shares. The fee waivers and/or expense reimbursements will continue for at least two years from the date of the Reorganization or until such time as the Trustees act to discontinue all or a portion of such waivers and/or reimbursements when they deem such action is appropriate. For the year ended September 30, 2017, approximately $336,000 of advisory fees were waived and approximately $29,000 of other expenses were reimbursed by the Adviser pursuant to this arrangement.
C. Administration Fees: The Adviser also serves as Administrator to the Trust and provides administrative services pursuant to an Administration Agreement for an annual fee, accrued daily and paid monthly, of 0.08% of the Fund's average daily net assets. Under a Sub-Administration Agreement between the Administrator and State Street Bank and Trust Company ("State Street"), State Street provides certain administrative services to the Trust. For such services, the Administrator pays State Street a portion of the fee the Administrator receives from the Fund.
D. Distribution and Shareholder Services Fees: Morgan Stanley Distribution, Inc. ("MSDI" or the "Distributor"), a wholly-owned subsidiary of the Adviser, and an indirect subsidiary of Morgan Stanley, serves as the Trust's Distributor of Fund shares pursuant to a Distribution Agreement. The Trust has adopted a Shareholder Services Plan with respect to Class A shares pursuant to Rule 12b-1 under the Act. Under the Shareholder Services Plan, the Fund pays the Distributor a shareholder services fee, accrued daily and paid monthly, at an annual rate of 0.25% of the Fund's average daily net assets attributable to Class A shares.
The Trust has adopted a Distribution and Shareholder Services Plan with respect to Class L shares pursuant to Rule 12b-1 under the Act. Under the Distribution and Shareholder Services Plan, the Fund pays the Distributor a distribution fee, accrued daily and paid monthly, at an annual rate of 0.25% and a shareholder services fee, accrued daily and paid monthly, at an annual rate of 0.25% of the Fund's average daily net assets attributable to Class L shares.
The Trust has adopted a Distribution and Shareholder Services Plan with respect to Class C shares pursuant to Rule 12b-1 under the Act. Under the Distribution and Shareholder
29
Morgan Stanley Institutional Fund Trust
Annual Report — September 30, 2017
Notes to Financial Statements (cont'd)
Services Plan, the Fund pays the Distributor a distribution fee, accrued daily and paid monthly, at an annual rate of 0.75% and a shareholder services fee, accrued daily and paid monthly, at an annual rate of 0.25% of the Fund's average daily net assets attributable to Class C shares.
The distribution and shareholder services fees are used to support the expenses associated with servicing and maintaining accounts. The Distributor may compensate other parties for providing shareholder support services to investors who purchase Class A, Class L and Class C shares.
E. Dividend Disbursing and Transfer/Co-Transfer Agent: The Trust's dividend disbursing and transfer agent is Boston Financial Data Services, Inc. ("BFDS"). Pursuant to a Transfer Agency Agreement, the Trust pays BFDS a fee based on the number of classes, accounts and transactions relating to the Funds of the Trust.
Morgan Stanley Services Company Inc. serves as Co-Transfer Agent and provides certain transfer agency services to the Fund with respect to certain direct transactions with the Fund.
F. Custodian Fees: State Street (the "Custodian") serves as Custodian for the Trust in accordance with a Custodian Agreement. The Custodian holds cash, securities, and other assets of the Trust as required by the Act. Custody fees are payable monthly based on assets held in custody, investment purchases and sales activity and account maintenance fees, plus reimbursement for certain out-of-pocket expenses.
G. Security Transactions and Transactions with Affiliates: For the year ended September 30, 2017, purchases and sales of investment securities for the Fund, other than long-term U.S. Government securities and short-term investments, were approximately $79,640,000 and $48,257,000, respectively. For the year ended September 30, 2017, purchases and sales of long-term U.S. Government securities were approximately $7,654,000 and $18,797,000, respectively.
The Fund invests in the Institutional Class of the Morgan Stanley Institutional Liquidity Funds — Government Portfolio (the "Liquidity Funds"), an open-end management investment company managed by the Adviser. Advisory fees paid by the Fund are reduced by an amount equal to its pro-rata share of the advisory and administration fees paid by the Fund due to its investment in the Liquidity Funds. For the year ended September 30, 2017, advisory fees paid were reduced by approximately $7,000 relating to the Fund's investment in the Liquidity Funds.
A summary of the Fund's transactions in shares of the Liquidity Funds during the year ended September 30, 2017 is as follows:
Affiliated
Investment
Company | | Value
September 30,
2016
(000) | | Purchases
at Cost
(000) | | Proceeds
from Sales
(000) | | Dividend
Income
(000) | |
Liquidity Funds | | $ | 5,928 | | | $ | 88,267 | | | $ | 90,332 | | | $ | 29 | | |
Affiliated
Investment
Company (cont'd) | | Realized
Gain (Loss)
(000) | | Change in
Unrealized
Appreciation
(Depreciation)
(000) | | Value
September 30,
2017
(000) | |
Liquidity Funds | | $ | — | | | $ | — | | | $ | 3,863 | | |
The Fund is permitted to purchase and sell securities ("cross-trade") from and to other Morgan Stanley Funds as well as other funds and client accounts for which the Adviser or an affiliate of the Adviser serves as investment adviser, pursuant to procedures approved by the Trustees in compliance with Rule 17a-7 under the Act (the "Rule"). Each cross-trade is executed at the current market price in compliance with provisions of the Rule. For the year ended September 30, 2017, the Fund did not engage in any cross-trade transactions.
The Fund has an unfunded Deferred Compensation Plan (the "Compensation Plan"), which allows each independent Trustee to defer payment of all, or a portion, of the fees he or she receives for serving on the Board of Trustees. Each eligible Trustee generally may elect to have the deferred amounts credited with a return equal to the total return on one or more of the Morgan Stanley funds that are offered as investment options under the Compensation Plan. Appreciation/depreciation and distributions received from these investments are recorded with an offsetting increase/decrease in the deferred compensation obligation and do not affect the NAV of the Fund.
H. Federal Income Taxes: It is the Fund's intention to continue to qualify as a regulated investment company and distribute all of its taxable and tax-exempt income. Accordingly, no provision for federal income taxes is required in the financial statements.
The Fund may be subject to taxes imposed by countries in which it invests. Such taxes are generally based on income and/or capital gains earned or repatriated. Taxes are accrued based on net investment income, net realized gains and net unrealized appreciation as such income and/or gains are earned. Taxes may also be based on transactions in foreign currency and are accrued based on the value of investments denominated in such currency.
30
Morgan Stanley Institutional Fund Trust
Annual Report — September 30, 2017
Notes to Financial Statements (cont'd)
FASB ASC 740-10, "Income Taxes — Overall", sets forth a minimum threshold for financial statement recognition of the benefit of a tax position taken or expected to be taken in a tax return. Management has concluded there are no significant uncertain tax positions that would require recognition in the financial statements. If applicable, the Fund recognizes interest accrued related to unrecognized tax benefits in "Interest Expense" and penalties in "Other Expenses" in the Statement of Operations. The Fund files tax returns with the U.S. Internal Revenue Service, New York and various states. Each of the tax years in the four-year period ended September 30, 2017, remains subject to examination by taxing authorities.
The tax character of distributions paid may differ from the character of distributions shown in the Statements of Changes in Net Assets due to short-term capital gains being treated as ordinary income for tax purposes. The tax character of distributions paid during fiscal years 2017 and 2016 was as follows:
2017
Distributions
Paid From:
Ordinary Income
(000) | | 2016
Distributions
Paid From:
Ordinary Income
(000) | |
| $ | 2,981 | | | $ | 2,550 | | |
The amount and character of income and gains to be distributed are determined in accordance with income tax regulations which may differ from GAAP. These book/tax differences are either considered temporary or permanent in nature.
Temporary differences are attributable to differing book and tax treatments for the timing of the recognition of gains (losses) on certain investment transactions and the timing of the deductibility of certain expenses.
Permanent differences, primarily due to an expired capital loss carryforward, resulted in the following reclassifications among the components of net assets at September 30, 2017:
Accumulated
Undistributed
Net Investment
Income
(000) | | Accumulated
Net Realized
Loss
(000) | | Paid-in-
Capital
(000) | |
| $ | (— | @) | | $ | 200,321 | | | $ | (200,321 | ) | |
@ Amount is less than 500
At September 30, 2017, the components of distributable earnings for the Fund on a tax basis were as follows:
Undistributed
Ordinary
Income
(000) | | Undistributed
Long-Term
Capital Gain
(000) | |
| $ | 595 | | | $ | — | | |
At September 30, 2017, the Fund had available for federal income tax purposes unused short term and long term capital losses of approximately $1,096,000* and $3,349,000*, respectively, that do not have an expiration date.
In addition, at September 30, 2017, the Fund had available for federal income tax purposes unused capital losses which will expire on the indicated dates:
Amount
(000)* | | Expiration | |
| $ | 34,040 | | | September 30, 2018 | |
* These amounts include capital losses acquired from Limited Duration U.S. Government Trust that may be subject to limitation under IRC Section 382 in future years.
Capital loss carryforwards of approximately $200,321,000 expired during the year ended September 30, 2017.
To the extent that capital loss carryforwards are used to offset any future capital gains realized during the carryover period as provided by U.S. federal income tax regulations, no capital gains tax liability will be incurred by the Fund for gains realized and not distributed. To the extent that capital gains are offset, such gains will not be distributed to the shareholders. During the year ended September 30, 2017, the Fund utilized capital loss carryforwards for U.S. federal income tax purposes of approximately $1,608,000.
I. Credit Facility: The Trust and other Morgan Stanley funds participate in a $150,000,000 committed, unsecured revolving line of credit facility (the "facility") with State Street. This facility is to be used for temporary emergency purposes or funding of shareholder redemption requests. The interest rate on borrowings is based on the federal funds rate or one month libor rate plus a spread. The facility also has a commitment fee of 0.25% per annum based on the unused portion of the facility. During the year ended September 30, 2017, the Fund did not have any borrowings under the facility.
J. Other: At September 30, 2017, the Fund had record owners of 10% or greater. Investment activities of these shareholders could have a material impact on the Fund. The aggregate percentage of such owners was 79.7%.
K. Accounting Pronouncement: In March 2017, FASB issued an Accounting Standard Update, ASU 2017-08,
31
Morgan Stanley Institutional Fund Trust
Annual Report — September 30, 2017
Notes to Financial Statements (cont'd)
Receivables-Nonrefundable Fees and Other Costs (Subtopic 310-20), Premium Amortization on Purchased Callable Debt Securities (the "ASU") which amends the amortization period for certain purchased callable debt securities held at a premium, shortening such period to the earliest call date. The ASU does not require any accounting change for debt securities held at a discount; the discount continues to be amortized to maturity. The ASU is effective for fiscal years, and interim periods within those fiscal years, beginning after December 15, 2018. At this time, management is evaluating the implications of these changes on the financial statements.
32
Morgan Stanley Institutional Fund Trust
Annual Report — September 30, 2017
Report of Independent Registered Public Accounting Firm
To the Shareholders and Board of Trustees of
Morgan Stanley Institutional Fund Trust —
Short Duration Income Portfolio
We have audited the accompanying statement of assets and liabilities, including the portfolio of investments, of Short Duration Income Portfolio (one of the funds constituting Morgan Stanley Institutional Fund Trust) (the "Fund") as of September 30, 2017, and the related statement of operations for the year then ended, the statements of changes in net assets for each of the two years in the period then ended and the financial highlights for each of the years or periods indicated therein. These financial statements and financial highlights are the responsibility of the Fund's management. Our responsibility is to express an opinion on these financial statements and financial highlights based on our audits.
We conducted our audits in accordance with the standards of the Public Company Accounting Oversight Board (United States). Those standards require that we plan and perform the audit to obtain reasonable assurance about whether the financial statements and financial highlights are free of material misstatement. We were not engaged to perform an audit of the Fund's internal control over financial reporting. Our audits included consideration of internal control over financial reporting as a basis for designing audit procedures that are appropriate in the circumstances, but not for the purpose of expressing an opinion on the effectiveness of the Fund's internal control over financial reporting. Accordingly, we express no such opinion. An audit also includes examining, on a test basis, evidence supporting the amounts and disclosures in the financial statements and financial highlights, assessing the accounting principles used and significant estimates made by management, and evaluating the overall financial statement presentation. Our procedures included confirmation of securities owned as of September 30, 2017, by correspondence with the custodian and others or by other appropriate auditing procedures where replies from others were not received. We believe that our audits provide a reasonable basis for our opinion.
In our opinion, the financial statements and financial highlights referred to above present fairly, in all material respects, the financial position of Short Duration Income Portfolio (one of the funds constituting Morgan Stanley Institutional Fund Trust) at September 30, 2017, the results of its operations for the year then ended, the changes in its net assets for each of the two years in the period then ended and the financial highlights for each of the years or periods indicated therein, in conformity with U.S. generally accepted accounting principles.

Boston, Massachusetts
November 22, 2017
33
Morgan Stanley Institutional Fund Trust
Annual Report — September 30, 2017
Investment Advisory Agreement Approval (unaudited)
Nature, Extent and Quality of Services
The Board reviewed and considered the nature and extent of the investment advisory services provided by the Adviser (as defined herein) under the advisory agreement, including portfolio management, investment research and equity and fixed income securities trading. The Board also reviewed and considered the nature and extent of the non-advisory, administrative services provided by the Adviser under the administration agreement, including accounting, operations, clerical, bookkeeping, compliance, business management and planning, legal services and the provision of supplies, office space and utilities at the Adviser's expense. The Board also considered the Adviser's investment in personnel and infrastructure that benefits the Fund. (The advisory and administration agreements together are referred to as the "Management Agreement.") The Board also considered that the Adviser serves a variety of other investment advisory clients and has experience overseeing service providers. The Board also compared the nature of the services provided by the Adviser with similar services provided by non-affiliated advisers as presented to the Board by Broadridge Financial Solutions, Inc. ("Broadridge").
The Board reviewed and considered the qualifications of the portfolio managers, the senior administrative managers and other key personnel of the Adviser who provide the administrative and advisory services to the Fund. The Board determined that the Adviser's portfolio managers and key personnel are well qualified by education and/or training and experience to perform the services in an efficient and professional manner. The Board concluded that the nature and extent of the advisory and administrative services provided were necessary and appropriate for the conduct of the business and investment activities of the Fund and supported its decision to approve the Management Agreement.
Performance, Fees and Expenses of the Fund
The Board reviewed the performance, fees and expenses of the Fund compared to its peers, as presented by Broadridge, and to appropriate benchmarks where applicable. The Board discussed with the Adviser the performance goals and the actual results achieved in managing the Fund. When considering a fund's performance, the Board and the Adviser place emphasis on trends and longer-term returns (focusing on one-year, three-year and five-year performance, as of December 31, 2016, or since inception, as applicable). When a fund underperforms its benchmark and/or its peer group average, the Board and the Adviser discuss the causes of such underperformance and, where necessary, they discuss specific changes to investment strategy or investment personnel. The Board noted that the Fund's performance was better than its peer group average for one-, three- and five-year periods. The Board discussed with the Adviser the level of the advisory and administration fees (together, the "management fee") for this Fund relative to comparable funds and/or other accounts advised by the Adviser and/or compared to its peers as presented by Broadridge. In addition to the management fee, the Board also reviewed the Fund's total expense ratio. The Board noted that the Fund's management fee and total expense ratio were lower than its peer group averages. After discussion, the Board concluded that the Fund's (i) performance was competitive with its peer group average; and (ii) management fee and total expense ratio were competitive with its peer group averages.
Economies of Scale
The Board considered the size and growth prospects of the Fund and how that relates to the Fund's total expense ratio and particularly the Fund's management fee rate, which does not include breakpoints. In conjunction with its review of the Adviser's profitability, the Board discussed with the Adviser how a change in assets can affect the efficiency or effectiveness of managing the Fund and whether the management fee level is appropriate relative to current and projected asset levels and/or whether the management fee structure reflects economies of scale as asset levels change. The Board has determined that its review of the actual and/or potential economies of scale of the Fund supports its decision to approve the Management Agreement.
Profitability of the Adviser and Affiliates
The Board considered information concerning the costs incurred and profits realized by the Adviser and its affiliates during the last year from their relationship with the Fund and during the last two years from their relationship with the Morgan Stanley Fund Complex and reviewed with the Adviser the cost allocation methodology used to determine the profitability of the Adviser and affiliates. The Board has determined that its review of the analysis of the Adviser's expenses and profitability supports its decision to approve the Management Agreement.
34
Morgan Stanley Institutional Fund Trust
Annual Report — September 30, 2017
Investment Advisory Agreement Approval (unaudited) (cont'd)
Other Benefits of the Relationship
The Board considered other direct and indirect benefits to the Adviser and/or its affiliates derived from their relationship with the Fund and other funds advised by the Adviser. These benefits may include, among other things, fees for trading, distribution and/or shareholder servicing and for transaction processing and reporting platforms used by securities lending agents, and research received by the Adviser generated from commission dollars spent on funds' portfolio trading. The Board reviewed with the Adviser these arrangements and the reasonableness of the Adviser's costs relative to the services performed. The Board has determined that its review of the other benefits received by the Adviser or its affiliates supports its decision to approve the Management Agreement.
Resources of the Adviser and Historical Relationship Between the Fund and the Adviser
The Board considered whether the Adviser is financially sound and has the resources necessary to perform its obligations under the Management Agreement. The Board also reviewed and considered the historical relationship between the Fund and the Adviser, including the organizational structure of the Adviser, the policies and procedures formulated and adopted by the Adviser for managing the Fund's operations and the Board's confidence in the competence and integrity of the senior managers and key personnel of the Adviser. The Board concluded that the Adviser has the financial resources necessary to fulfill its obligations under the Management Agreement and that it is beneficial for the Fund to continue its relationship with the Adviser.
Other Factors and Current Trends
The Board considered the controls and procedures adopted and implemented by the Adviser and monitored by the Fund's Chief Compliance Officer and concluded that the conduct of business by the Adviser indicates a good faith effort on its part to adhere to high ethical standards in the conduct of the Fund's business.
General Conclusion
After considering and weighing all of the above factors, with various written materials and verbal information presented by the Adviser, the Board concluded that it would be in the best interest of the Fund and its shareholders to approve renewal of the Management Agreement for another year. In reaching this conclusion the Board did not give particular weight to any single piece of information or factor referenced above. The Board considered these factors and information over the course of the year and in numerous meetings, some of which were in executive session with only the independent Board members and their counsel present. It is possible that individual Board members may have weighed these factors, and the information presented, differently in reaching their individual decisions to approve the Management Agreement.
35
Morgan Stanley Institutional Fund Trust
Annual Report — September 30, 2017
Privacy Notice (unaudited)
MORGAN STANLEY INVESTMENT MANAGEMENT INC.
AN IMPORTANT NOTICE CONCERNING OUR U.S. PRIVACY POLICY
We are required by federal law to provide you with a copy of our privacy policy annually. This policy applies to current and former individual investors in funds managed or sponsored by Morgan Stanley Investment Management Inc. ("MSIM") as well as current and former individual clients of MSIM. This policy is not applicable to partnerships, corporations, trusts or other non-individual clients or investors. Please note that we may amend this policy at any time, and will inform you of any changes as required by law.
WE RESPECT YOUR PRIVACY
We appreciate that you have provided us with your personal financial information. We strive to maintain the privacy of such information while we help you achieve your financial objectives. This Notice describes what non-public personal information we collect about you, why we collect it, when we may share it with others and how certain others may use it. It discusses the steps you may take to limit our sharing of certain information about you to affiliated companies in the Morgan Stanley family of companies ("other Morgan Stanley companies"). It also discloses how you may limit use of certain shared information for marketing purposes by other Morgan Stanley branded companies. Throughout this policy, we refer to the non-public information that personally identifies you or your accounts as "personal information."
1. WHAT PERSONAL INFORMATION DO WE COLLECT ABOUT YOU?
We obtain personal information from applications and other forms you submit to us, from your dealings with us, from consumer reporting agencies, from our Web sites and from third parties and other sources.
For example:
• We may collect information such as your name, address, e-mail address, telephone/fax numbers, assets, income and investment objectives through subscription documents, applications and other forms you submit to us.
• We may obtain information about account balances, your use of account(s) and the types of products and services you prefer to receive from us through your dealings and transactions with us and other sources.
• We may obtain information about your creditworthiness and credit history from consumer reporting agencies.
• We may collect background information from and through third-party vendors to verify representations you have made and to comply with various regulatory requirements.
• If you interact with us through our public and private Web sites, we may collect information that you provide directly through online communications (such as an e-mail address). We may also collect information about your Internet service provider, your domain name, your computer's operating system and Web browser, your use of our Web sites and your product and service preferences, through the use of "cookies." Please consult the Terms of Use of these sites for more details.
2. WHEN DO WE DISCLOSE PERSONAL INFORMATION WE COLLECT ABOUT YOU?
We may disclose personal information we collect about you to other Morgan Stanley companies and to non-affiliated third parties.
a. Information We Disclose to Other Morgan Stanley Companies.
We may disclose personal information to other Morgan Stanley companies for a variety of reasons, including to manage your account(s) effectively, to service and process your transactions, to let you know about products and services offered by us and other Morgan Stanley companies, to manage our business, and as otherwise required or permitted by law. Offers for products and services from other Morgan Stanley companies are developed under conditions designed to safeguard your personal information.
36
Morgan Stanley Institutional Fund Trust
Annual Report — September 30, 2017
Privacy Notice (unaudited) (cont'd)
b. Information We Disclose to Non-affiliated Third Parties.
We do not disclose personal information that we collect about you to non-affiliated third parties except to those who provide marketing services on our behalf, to financial institutions with whom we have joint marketing agreements, and as otherwise required or permitted by law. For example, we may disclose personal information to non-affiliated third parties for servicing and processing transactions, to offer our own products and services, to protect against fraud, for institutional risk control, to respond to judicial process or to perform services on our behalf. When we share personal information with a non-affiliated third party, they are required to limit their use of personal information to the particular purpose for which it was shared and they are not allowed to share personal information with others except to fulfill that limited purpose or as may be permitted or required by law.
3. HOW DO WE PROTECT THE SECURITY AND CONFIDENTIALITY OF PERSONAL INFORMATION WE COLLECT ABOUT YOU?
We maintain physical, electronic and procedural security measures to help safeguard the personal information we collect about you. We have internal policies governing the proper handling of client information. Third parties that provide support or marketing services on our behalf may also receive personal information, and we require them to adhere to confidentiality standards with respect to such information.
4. HOW CAN YOU LIMIT THE SHARING OF CERTAIN TYPES OF PERSONAL INFORMATION WITH OTHER MORGAN STANLEY COMPANIES?
We offer you choices as to whether we share with other Morgan Stanley companies the personal information that was collected to determine your eligibility for products and services you request ("eligibility information"). Eligibility information does not include your identification information or personal information pertaining to our transactions or experiences with you. Please note that, even if you direct us not to share eligibility information with other Morgan Stanley companies ("opt-out"), we may still share personal information, including eligibility information, with those companies in circumstances excluded from the opt-out under applicable law, such as to process transactions or to service your account.
5. HOW CAN YOU LIMIT THE USE OF CERTAIN TYPES OF PERSONAL INFORMATION BY OTHER MORGAN STANLEY COMPANIES FOR MARKETING?
By following the opt-out instructions in Section 6 below, you may limit other Morgan Stanley branded companies from marketing their products or services to you based on personal information we disclose to them. This information may include, for example, your income and account history with us. Please note that, even if you choose to limit Other Morgan Stanley Companies from using personal information about you that we may share with them for marketing their products and services to you, Other Morgan Stanley Companies may use your personal information that they obtain from us to market to you in circumstances permitted by law, such as if the Other Morgan Stanley Company has its own relationship with you.
6. HOW CAN YOU SEND US AN OPT-OUT INSTRUCTION?
If you wish to limit our sharing of eligibility information about you with other Morgan Stanley companies or other Morgan Stanley companies' use of personal information for marketing purposes, as described in this notice, you may do so by:
• Calling us at (800) 548-7786
Monday–Friday between 8a.m. and 6p.m.(EST)
• Writing to us at the following address:
Boston Financial Data Services, Inc.
c/o Privacy Coordinator
P.O. Box 219804
Kansas City, Missouri 64121
37
Morgan Stanley Institutional Fund Trust
Annual Report — September 30, 2017
Privacy Notice (unaudited) (cont'd)
Your written request should include your name, address, telephone number and account number(s) to which the opt-out applies and whether you are opting out with respect to sharing of eligibility information (Section 4 above), or if information used for Marketing (Section 5 above) or both. Written opt-out requests should not be sent with any other correspondence. In order to process your request, we require that the request be provided by you directly and not through a third party.
Your opt-out preference will remain in effect with respect to this policy (as it may be amended) until you notify us otherwise. If you have a joint account, your direction for us not to share this information with other Morgan Stanley companies and for those other Morgan Stanley companies not to use your personal information for marketing will be applied to all account holders on that account. Please understand that if you limit our sharing or our affiliated companies' use of personal information, you and any joint account holder(s) may not receive information about Morgan Stanley products and services, including products or services that could help you manage your financial resources and achieve your investment objectives.
7. WHAT IF AN AFFILIATED COMPANY BECOMES A NON-AFFILIATED THIRD PARTY?
If, at any time in the future, an affiliated company becomes a non-affiliated third party, further disclosures of personal information made to the former affiliated company will be limited to those described in Section 2(b) above relating to non-affiliated third parties. If you elected under Section 6 to limit disclosures we make to affiliated companies, or use of personal information by affiliated companies, your election will not apply to use by any former affiliated company of your personal information in their possession once it becomes a non-affiliated third party.
SPECIAL NOTICE TO RESIDENTS OF VERMONT
The following section supplements our policy with respect to our individual clients who have a Vermont address and supersedes anything to the contrary in the above policy with respect to those clients only.
The state of Vermont requires financial institutions to obtain your consent prior to sharing personal information that they collect about you with affiliated companies and non-affiliated third parties other than in certain limited circumstances. Except as permitted by law, we will not share personal information we collect about you with non-affiliated third parties or other Morgan Stanley companies unless you provide us with your written consent to share such information ("opt-in").
If you wish to receive offers for investment products and services offered by or through other Morgan Stanley companies, please notify us in writing at the following address:
Boston Financial Data Services, Inc.
c/o Privacy Coordinator
P.O. Box 219804
Kansas City, Missouri 64121
Your authorization should include your name, address, telephone number and account number(s) to which the opt-in applies and should not be sent with any other correspondence. In order to process your authorization, we require that the authorization be provided by you directly and not through a third party.
SPECIAL NOTICE TO RESIDENTS OF CALIFORNIA
The following section supplements our policy with respect to our individual clients who have a California address and supersedes anything to the contrary in the above policy with respect to those clients only.
In response to a California law, if your account has a California home address, your personal information will not be disclosed to non-affiliated third parties except as permitted by applicable California law, and we will limit sharing such information with our affiliates to comply with California privacy laws that apply to us.
38
Morgan Stanley Institutional Fund Trust
Annual Report — September 30, 2017
Trustee and Officer Information (unaudited)
Independent Trustees:
Name, Age and Address of
Independent Trustee | | Position(s)
Held with
Registrant | | Length of Time
Served* | | Principal Occupation(s) During Past 5 Years
and Other Relevant Professional Experience | | Number of
Portfolios in
Fund Complex
Overseen by
Independent
Trustee** | | Other Directorships
Held by Independent
Trustee*** | |
Frank L. Bowman (72)
c/o Perkins Coie LLP
Counsel to the Independent Trustees
30 Rockefeller Plaza
New York, NY 10112 | | Trustee | | Since
August
2006 | | President, Strategic Decisions, LLC (consulting) (since February 2009); Director or Trustee of various Morgan Stanley Funds (since August 2006); Chairperson of the Compliance and Insurance Committee (since October 2015); formerly, Chairperson of the Insurance Sub-Committee of the Compliance and Insurance Committee (2007-2015); served as President and Chief Executive Officer of the Nuclear Energy Institute (policy organization) (February 2005-November 2008); retired as Admiral, U.S. Navy after serving over 38 years on active duty including 8 years as Director of the Naval Nuclear Propulsion Program in the Department of the Navy and the U.S. Department of Energy (1996-2004); served as Chief of Naval Personnel (July 1994-September 1996) and on the Joint Staff as Director of Political Military Affairs (June 1992-July 1994); knighted as Honorary Knight Commander of the Most Excellent Order of the British Empire; awarded the Officier de l'Orde National du Mérite by the French Government; elected to the National Academy of Engineering (2009). | | | 90 | | | Director of BP p.l.c.; Director of Naval and Nuclear Technologies LLP; Director Emeritus of the Armed Services YMCA; Director of the U.S. Naval Submarine League; Member of the National Security Advisory Council of the Center for U.S. Global Engagement and a member of the CNA Military Advisory Board; Chairman of the charity J Street Cup Golf; Trustee of Fairhaven United Methodist Church; and Director of other various non-profit organizations. | |
Kathleen A. Dennis (64)
c/o Perkins Coie LLP
Counsel to the Independent Trustees
30 Rockefeller Plaza
New York, NY 10112 | | Trustee | | Since
August
2006 | | President, Cedarwood Associates (mutual fund and investment management consulting) (since July 2006); Chairperson of the Liquidity and Alternatives Sub-Committee of the Investment Committee (since October 2006) and Director or Trustee of various Morgan Stanley Funds (since August 2006); formerly, Senior Managing Director of Victory Capital Management (1993-2006). | | | 91 | | | Director of various non-profit organizations. | |
Nancy C. Everett (62)
c/o Perkins Coie LLP
Counsel to the Independent Trustees
30 Rockefeller Plaza
New York, NY 10112 | | Trustee | | Since
January
2015 | | Chief Executive Officer, Virginia Commonwealth University Investment Company (since November 2015); Owner OBIR, LLC (institutional investment management consulting) (since June 2014); formerly, Managing Director, BlackRock, Inc. (February 2011-December 2013); and Chief Executive Officer, General Motors Asset Management (a/k/a Promark Global Advisors, Inc.) (June 2005-May 2010). | | | 91 | | | Formerly, Member of Virginia Commonwealth University School of Business Foundation (2005-2016); Member of Virginia Commonwealth University Board of Visitors (2013-2015); Member of Committee on Directors for Emerging Markets Growth Fund, Inc. (2007-2010); Chairperson of Performance Equity Management, LLC (2006-2010); and Chairperson, GMAM Absolute Return Strategies Fund, LLC (2006-2010). | |
39
Morgan Stanley Institutional Fund Trust
Annual Report — September 30, 2017
Trustee and Officer Information (unaudited) (cont'd)
Independent Trustees: (cont'd)
Name, Age and Address of
Independent Trustee | | Position(s)
Held with
Registrant | | Length of Time
Served* | | Principal Occupation(s) During Past 5 Years
and Other Relevant Professional Experience | | Number of
Portfolios in
Fund Complex
Overseen by
Independent
Trustee** | | Other Directorships
Held by Independent
Trustee*** | |
Jakki L. Haussler (60)
c/o Perkins Coie LLP
Counsel to the Independent Trustees
30 Rockefeller Plaza
New York, NY 10112 | | Trustee | | Since
January
2015 | | Chairman and Chief Executive Officer, Opus Capital Group (since January 1996); formerly, Director, Capvest Venture Fund, LP (May 2000-December 2011); Partner, Adena Ventures, LP (July 1999-December 2010); Director, The Victory Funds (February 2005-July 2008). | | | 91 | | | Director of Cincinnati Bell Inc. and Member, Audit Committee and Compensation Committee; Director of Northern Kentucky University Foundation and Member, Investment Committee; Member of Chase College of Law Transactional Law Practice Center Board of Advisors; Director of Best Transport; Director of Chase College of Law Board of Visitors; formerly, Member, University of Cincinnati Foundation Investment Committee; Member, Miami University Board of Visitors (2008-2011); Trustee of Victory Funds (2005-2008) and Chairman, Investment Committee (2007-2008) and Member, Service Provider Committee (2005-2008). | |
Dr. Manuel H. Johnson (68)
c/o Johnson Smick
International, Inc.
220 I Street, NE —
Suite 200
Washington, D.C. 20002 | | Trustee | | Since
July
1991 | | Senior Partner, Johnson Smick International, Inc. (consulting firm); Chairperson of the Investment Committee (since October 2006) and Director or Trustee of various Morgan Stanley Funds (since July 1991); Co-Chairman and a founder of the Group of Seven Council (G7C) (international economic commission); formerly, Chairperson of the Audit Committee (July 1991-September 2006), Vice Chairman of the Board of Governors of the Federal Reserve System and Assistant Secretary of the U.S. Treasury. | | | 91 | | | Director of NVR, Inc. (home construction). | |
Joseph J. Kearns (75)
c/o Kearns & Associates LLC
46 E Peninsula Center
#385 Rolling Hills Estates,
CA 90274-3712 | | Trustee | | Since
August
1994 | | President, Kearns & Associates LLC (investment consulting); Chairperson of the Audit Committee (since October 2006) and Director or Trustee of various Morgan Stanley Funds (since August 1994); formerly, Deputy Chairperson of the Audit Committee (July 2003-September 2006) and Chairperson of the Audit Committee of various Morgan Stanley Funds (since August 1994); CFO of the J. Paul Getty Trust. | | | 93 | | | Director of Electro Rent Corporation (equipment leasing). Prior to December 31, 2013, Director of The Ford Family Foundation. | |
40
Morgan Stanley Institutional Fund Trust
Annual Report — September 30, 2017
Trustee and Officer Information (unaudited) (cont'd)
Independent Trustees: (cont'd)
Name, Age and Address of
Independent Trustee | | Position(s)
Held with
Registrant | | Length of Time
Served* | | Principal Occupation(s) During Past 5 Years
and Other Relevant Professional Experience | | Number of
Portfolios in
Fund Complex
Overseen by
Independent
Trustee** | | Other Directorships
Held by Independent
Trustee*** | |
Michael F. Klein (58)
c/o Perkins Coie LLP
Counsel to the Independent Trustees
30 Rockefeller Plaza
New York, NY 10112 | | Trustee | | Since
August
2006 | | Managing Director, Aetos Capital, LLC (since March 2000); Co-President, Aetos Alternatives Management, LLC (since January 2004) and Co-Chief Executive Officer of Aetos Capital LLC (since August 2013); Chairperson of the Fixed Income Sub-Committee of the Investment Committee (since October 2006) and Director or Trustee of various Morgan Stanley Funds (since August 2006); formerly, Managing Director, Morgan Stanley & Co. Inc. and Morgan Stanley Dean Witter Investment Management, President, various Morgan Stanley Funds (June 1998-March 2000) and Principal, Morgan Stanley & Co. Inc. and Morgan Stanley Dean Witter Investment Management (August 1997-December 1999). | | | 90 | | | Director of certain investment funds managed or sponsored by Aetos Capital, LLC; Director of Sanitized AG and Sanitized Marketing AG (specialty chemicals). | |
Patricia Maleski (57)
c/o Perkins Coie LLP
Counsel to the Independent Trustees
30 Rockefeller Plaza
New York, NY 10112 | | Trustee | | Since
January
2017 | | Managing Director, JPMorgan Asset Management (2004-2016); Oversight and Control Head of Fiduciary and Conflicts of Interest Program(2015-2016); Chief Control Officer-Global Asset Management (2013-2015); President, JPMorgan Funds (2010-2013); Chief Administrative Officer (2004-2013); various other positions including Treasurer and Board Liaison (since 2001). | | | 91 | | | None. | |
Michael E. Nugent (81)
522 Fifth Avenue
New York, NY 10036 | | Chair of the
Board and
Trustee | | Chair of the
Boards since
July 2006 and
Trustee since
July 1991 | | Chair of the Boards of various Morgan Stanley Funds (since July 2006); Chairperson of the Closed-End Fund Committee (since June 2012) and Director or Trustee of various Morgan Stanley Funds (since July 1991); formerly, Chairperson of the Insurance Committee (until July 2006); General Partner, Triumph Capital, L.P. (private investment partnership) (1988-2013). | | | 92 | | | None. | |
W. Allen Reed (70)
c/o Perkins Coie LLP
Counsel to the Independent Trustees
30 Rockefeller Plaza
New York, NY 10112 | | Trustee | | Since
August
2006 | | Chairperson of the Equity Sub-Committee of the Investment Committee (since October 2006) and Director or Trustee of various Morgan Stanley Funds (since August 2006); formerly, President and CEO of General Motors Asset Management; Chairman and Chief Executive Officer of the GM Trust Bank and Corporate Vice President of General Motors Corporation (August 1994-December 2005). | | | 91 | | | Director of Legg Mason, Inc.; formerly, Director of the Auburn University Foundation (2010-2015). | |
Fergus Reid (85)
c/o Joe Pietryka, Inc.
85 Charles Colman Blvd.
Pawling, NY 12564 | | Trustee | | Since
June
1992 | | Chairman, Joe Pietryka, Inc.; Chairperson of the Governance Committee and Director or Trustee of various Morgan Stanley Funds (since June 1992). | | | 92 | | | Formerly, Trustee and Director of certain investment companies in the JP Morgan Fund Complex managed by JP Morgan Investment Management Inc. (1987-2012). | |
* This is the earliest date the Trustee began serving the Morgan Stanley Funds. Each Trustee serves an indefinite term, until his or her successor is elected.
** The Fund Complex includes (as of December 31, 2016) all open-end and closed-end funds (including all of their portfolios) advised by Morgan Stanley Investment Management Inc. (the "Adviser") and any funds that have an adviser that is an affiliated person of the Adviser (including, but not limited to, Morgan Stanley AIP GP LP).
*** This includes any directorships at public companies and registered investment companies held by the Trustee at any time during the past five years.
41
Morgan Stanley Institutional Fund Trust
Annual Report — September 30, 2017
Trustee and Officer Information (unaudited) (cont'd)
Executive Officers:
Name, Age and Address of Executive Officer | | Position(s) Held
with
Registrant | | Length of
Time Served* | | Principal Occupation(s) During Past 5 Years | |
John H. Gernon (54)
522 Fifth Avenue
New York, NY 10036 | | President and
Principal
Executive
Officer | | Since
September
2013 | | President and Principal Executive Officer of the Equity and Fixed Income Funds and the Morgan Stanley AIP Funds (since September 2013) and the Liquidity Funds and various money market funds (since May 2014) in the Fund Complex; Managing Director of the Adviser; Head of Product (since 2006). | |
Timothy J. Knierim (58)
522 Fifth Avenue
New York, NY 10036 | | Chief
Compliance
Officer | | Since
December
2016 | | Managing Director of the Adviser and various entities affiliated with the Adviser; Chief Compliance Officer of various Morgan Stanley Funds and the Adviser (since December 2016) and Chief Compliance Officer of Morgan Stanley AIP GP LP (since 2014). Formerly, Managing Director and Deputy Chief Compliance Officer of the Adviser (2014-2016); and formerly, Chief Compliance Officer of Prudential Investment Management, Inc. (2007-2014). | |
Francis J. Smith (52)
522 Fifth Avenue
New York, NY 10036 | | Treasurer and
Principal
Financial
Officer | | Treasurer
since July 2003 and Principal Financial Officer since September 2002 | | Manging Director of the Adviser and various entities affiliated with the Adviser; Treasurer (since July 2003) and Principal Financial Officer of various Morgan Stanley Funds (since September 2002). | |
Mary E. Mullin (50)
522 Fifth Avenue
New York, NY 10036 | | Secretary | | Since
June
1999 | | Executive Director of the Adviser; Secretary of various Morgan Stanley Funds (since June 1999). | |
Michael J. Key (38)
522 Fifth Avenue
New York, NY 10036 | | Vice President | | Since
June
2017 | | Vice President of the Equity and Fixed Income Funds, Liquidity Funds, various money market funds and the Morgan Stanley AIP Funds in the Fund Complex (since June 2017); Executive Director of the Adviser; Head of Product Development for Equity and Fixed Income Funds (since August 2013). | |
* This is the earliest date the officer began serving the Morgan Stanley Funds. Each officer serves a one-year term, until his or her successor is elected and qualifies.
42
Morgan Stanley Institutional Fund Trust
Annual Report — September 30, 2017
Adviser and Administrator
Morgan Stanley Investment Management Inc.
522 Fifth Avenue
New York, New York 10036
Distributor
Morgan Stanley Distribution, Inc.
522 Fifth Avenue
New York, New York 10036
Dividend Disbursing and Transfer Agent
Boston Financial Data Services, Inc.
2000 Crown Colony Drive
Quincy, Massachusetts 02169
Co-Transfer Agent
Morgan Stanley Services Company, Inc.
522 Fifth Avenue
New York, New York 10036
Custodian
State Street Bank and Trust Company
One Lincoln Street
Boston, Massachusetts 02111
Legal Counsel
Dechert LLP
1095 Avenue of the Americas
New York, New York 10036
Counsel to the Independent Trustees
Perkins Coie LLP
30 Rockefeller Plaza
New York, New York 10112
Independent Registered Public Accounting Firm
Ernst & Young LLP
200 Clarendon Street
Boston, Massachusetts 02116
Reporting to Shareholders
Each Morgan Stanley Fund provides a complete schedule of portfolio holdings in its semi-annual and annual reports within 60 days of the end of the fund's second and fourth fiscal quarters. The semi-annual and annual reports are filed electronically with the Securities and Exchange Commission (SEC) on Form N-CSRS and Form N-CSR, respectively. Morgan Stanley also delivers the semi-annual and annual reports to fund shareholders and makes these reports available on its public website, www.morganstanley.com/im. Each Morgan Stanley fund also files a complete schedule of portfolio holdings with the SEC for the fund's first and third fiscal quarters on Form N-Q. Morgan Stanley does not deliver the reports for the first and third fiscal quarters to shareholders, nor are the reports posted to the Morgan Stanley public website. You may, however, obtain the Form N-Q filings (as well as the Form N-CSR and N-CSRS filings) by accessing the SEC's website, www.sec.gov. You may also review and copy them at the SEC's Public Reference Room in Washington, DC. Information on the operation of the SEC's Public Reference Room may be obtained by calling the SEC toll free at 1 (800) SEC-0330. You can also request copies of these materials, upon payment of a duplicating fee, by electronic request at the SEC's email address (publicinfo@sec.gov) or by writing to the SEC's Public Reference Section, Washington, D.C. 20549-1520.
Proxy Voting Policies and Procedures and Proxy Voting Record
You may obtain a copy of the Trust's Proxy Voting Policy and Procedures and information regarding how the Trust voted proxies relating to portfolio securities during the most recent twelve-month period ended June 30, without charge, upon request, by calling toll free 1 (800) 548-7786 or by visiting our website at www.morganstanley.com/im. This information is also available on the SEC's website at www.sec.gov.
This report is authorized for distribution only when preceded or accompanied by a prospectus or summary prospectus of the applicable Fund of Morgan Stanley Institutional Fund Trust, which describes in detail the Fund's investment policies, risks, fees and expenses. Please read the prospectus carefully before you invest or send money. For additional information, including information regarding the investments comprising the Fund, please visit our website at www.morganstanley.com/im or call toll free 1 (800) 548-7786.
43
(This Page has been left blank intentionally.)
(This Page has been left blank intentionally.)
Printed in U.S.A.
This Report has been prepared for shareholders and may be distributed to others only if preceded or accompanied by a current prospectus.
Morgan Stanley Investment Management Inc.
522 Fifth Avenue
New York, New York 10036
© 2017 Morgan Stanley. Morgan Stanley Distribution, Inc.

IFTLDANN
1934363 EXP 11.30.18

Morgan Stanley Institutional Fund Trust
Strategic Income Portfolio
Annual Report
September 30, 2017

Morgan Stanley Institutional Fund Trust
Annual Report — September 30, 2017
Shareholders' Letter | | | 2 | | |
Expense Example | | | 3 | | |
Investment Overview | | | 4 | | |
Portfolio of Investments | | | 7 | | |
Statement of Assets and Liabilities | | | 13 | | |
Statement of Operations | | | 15 | | |
Statements of Changes in Net Assets | | | 16 | | |
Financial Highlights | | | 17 | | |
Notes to Financial Statements | | | 21 | | |
Report of Independent Registered Public Accounting Firm | | | 32 | | |
Investment Advisory Agreement Approval | | | 33 | | |
Privacy Notice | | | 35 | | |
Trustee and Officer Information | | | 38 | | |
This report is authorized for distribution only when preceded or accompanied by a prospectus or summary prospectus of the applicable Fund of the Morgan Stanley Institutional Fund Trust. To receive a prospectus and/or statement of additional information (SAI), which contains more complete information such as investment objectives, charges, expenses, policies for voting proxies, risk considerations, and describes in detail each of the Fund's investment policies to the prospective investor, please call toll free 1 (800) 548-7786. Please read the prospectuses carefully before you invest or send money.
Additionally, you can access information about the Fund, including performance, characteristics, and investment team commentary, through Morgan Stanley Investment Management's website: www.morganstanley.com/im.
Market forecasts provided in this report may not necessarily come to pass. There is no guarantee that any sectors mentioned will continue to perform as discussed herein or that securities in such sectors will be held by the Fund in the future. There is no assurance that a fund will achieve its investment objective. Funds are subject to market risk, which is the possibility that market values of securities owned by the Fund will decline and, therefore, the value of the Fund's shares may be less than what you paid for them. Accordingly, you can lose money investing in this Fund. Please see the prospectus for more complete information on investment risks.
1
Morgan Stanley Institutional Fund Trust
Annual Report — September 30, 2017
Shareholders' Letter (unaudited)
Dear Shareholders,
We are pleased to provide this Annual report, in which you will learn how your investment in Strategic Income Portfolio (the "Fund") performed during the latest twelve-month period.
Morgan Stanley Investment Management is a client-centric, investor-led organization. Our global presence, intellectual capital, and breadth of products and services enable us to partner with investors to meet the evolving challenges of today's financial markets. We aim to deliver superior investment service and to empower our clients to make the informed decisions that help them reach their investment goals.
As always, we thank you for selecting Morgan Stanley Investment Management, and look forward to working with you in the months and years ahead.
Sincerely,

John H. Gernon
President and Principal Executive Officer
October 2017
2
Morgan Stanley Institutional Fund Trust
Annual Report — September 30, 2017
Expense Example (unaudited)
Strategic Income Portfolio
As a shareholder of the Fund, you may incur two types of costs: (1) transactional costs, including sales charge (loads) on purchase payments; and (2) ongoing costs, which may include advisory fees, administration fees, distribution and shareholder services fees; and other Fund expenses. This example is intended to help you understand your ongoing costs (in dollars) of investing in the Fund and to compare these costs with the ongoing costs of investing in other mutual funds.
This example is based on an investment of $1,000 invested at the beginning of the six-month period ended September 30, 2017 and held for the entire six-month period.
Actual Expenses
The table below provides information about actual account values and actual expenses. You may use the information in this table, together with the amount you invested, to estimate the expenses that you paid over the period. Simply divide your account value by $1,000 (for example, an $8,600 account value divided by $1,000 = 8.6), then multiply the result by the number in the table under the heading entitled "Actual Expenses Paid During Period" to estimate the expenses you paid on your account during this period.
Hypothetical Example for Comparison Purposes
The table below provides information about hypothetical account values and hypothetical expenses based on the Fund's actual expense ratio and an assumed rate of return of 5% per year before expenses, which is not the Fund's actual return. The hypothetical account values and expenses may not be used to estimate the actual ending account balance or expenses you paid for the period. You may use this information to compare the ongoing costs of investing in the Fund and other funds. To do so, compare this 5% hypothetical example with the 5% hypothetical examples that appear in the shareholder reports of the other funds.
Please note that the expenses shown in the table are meant to highlight your ongoing costs only and do not reflect any transactional costs, such as sales charges (loads, if applicable). Therefore, the information for each class in the table is useful in comparing ongoing costs only, and will not help you determine the relative total costs of owning different funds. In addition, if these transactional costs were included, your costs would have been higher.
| | | Beginning
Account
Value
4/1/17 | | Actual Ending
Account
Value
9/30/17 | | Hypothetical
Ending Account
Value | | Actual
Expenses
Paid
During
Period* | | Hypothetical
Expenses Paid
During Period* | | Net
Expense
Ratio
During
Period** | |
Strategic Income Portfolio Class I | | $ | 1,000.00 | | | $ | 1,041.40 | | | $ | 1,020.10 | | | $ | 5.07 | | | $ | 5.01 | | | | 0.99 | % | |
Strategic Income Portfolio Class A | | | 1,000.00 | | | | 1,039.30 | | | | 1,018.40 | | | | 6.80 | | | | 6.73 | | | | 1.33 | | |
Strategic Income Portfolio Class C | | | 1,000.00 | | | | 1,035.60 | | | | 1,014.59 | | | | 10.67 | | | | 10.56 | | | | 2.09 | | |
Strategic Income Portfolio Class IS | | | 1,000.00 | | | | 1,042.70 | | | | 1,020.36 | | | | 4.81 | | | | 4.76 | | | | 0.94 | | |
* Expenses are calculated using each Fund Class' annualized net expense ratio (as disclosed), multiplied by the average account value over the period, and multiplied by 183/365 (to reflect the most recent one-half year period).
** Annualized.
3
Morgan Stanley Institutional Fund Trust
Annual Report — September 30, 2017
Investment Overview (unaudited)
Strategic Income Portfolio
The Fund seeks a total return comprised of income and capital appreciation.
Performance
For the fiscal year ended September 30, 2017, the Fund's Class I shares had a total return based on net asset value and reinvestment of distributions per share of 7.64%, net of fees. The Fund's Class I shares outperformed against the Fund's benchmark, the ICE BofAML 3-Month U.S. Treasury Bill Index (the "Index"), which returned 0.66%.
Factors Affecting Performance
• The last year has been characterized by a steady grind tighter in credit markets, despite pockets of intra-year volatility as concerns about global growth, monetary policy, geopolitical tensions, and commodities caused temporary market weaknesses. All of these periods, however, were brief and have resulted in positive performance in credit spreads over the period, as strong technicals and demand for the asset class mitigated any potential softness in the market.
• Global treasury yields generally rose over the period, with U.S. Treasury 10-year yields climbing 74 basis points (bps), German bund 10-year yields climbing 85 bps, and Japanese government bond 10-year yields rising 15 bps. In the final quarter of 2016, the surprise Trump win in the United States dominated the news flow in November and pervasively impacted global rates, credit spreads, and equity markets. Financial market conditions changed rapidly as investors priced in the inflationary impact of anticipated fiscal stimulus, reduced trade, and a more aggressive Federal Reserve (Fed). In the U.S., shorter maturities continued to rise as the Fed increased the target federal funds rate by 75 basis points over the period. Longer maturity yields fluctuated in a relatively narrow band post-election.
• Benign economic performance of major countries and low interest rates, due to continued aggressive central bank actions, led to strong demand for bonds that offer additional yields over government securities. The result was strong performance in most credit sectors. The Fund benefited from overweights to these better-performing credit
sectors — namely, investment-grade and high-yield corporates, convertibles, emerging market debt, asset-backed securities, and non-agency residential and commercial mortgage-backed securities.
• The largest contributor to positive performance was the Fund's allocation to non-agency residential mortgage-backed securities (RMBS). Non-agency MBS spreads continued their tightening trend, posting strong gains during the first nine months of 2017, while cash flow and credit performance continued to improve. Fundamental U.S. housing market and mortgage market conditions remained positive. National home prices were up 5.9% over the past year.(1) Despite the recent increases in home prices, U.S. homes remain affordable from a historical perspective when comparing median incomes against the cost of owning a median-priced home. Commercial mortgage-backed securities (CMBS) exposure was also a positive contributor as the sector performed well despite headwinds late in the period. Negative retail news continued to weigh on the CMBS sector with Toys R Us being the latest major retailer to file for bankruptcy. Uncertainty over impacts from Hurricanes Harvey, Irma, and Maria also continued to put some pressure on CMBS. Spreads for non-retail and non-hurricane-affected CMBS generally continued to perform reasonably well.
• Within interest rate and currency positions, the Fund benefited from emerging markets exposure, with both rate and currency positions contributing to performance. Positive performance was driven primarily by currency positions in Mexico and rate exposure in Brazil. However, rate exposure in Poland and currency exposure in South Africa both detracted somewhat from performance. Exposure to peripheral European debt was beneficial, with gains from rate exposure in Portugal and Cyprus outpacing losses in Spain and Italy. Interest rate swap exposure was beneficial in the period, while short credit default swap exposure, used to partially hedge high yield exposure, detracted.
Management Strategies
• At period-end, we continue to overweight spread product (non-government bonds) as we believe the
(1) Source: National Association of Realtors, data as of September 30, 2017
4
Morgan Stanley Institutional Fund Trust
Annual Report — September 30, 2017
Investment Overview (unaudited) (cont'd)
Strategic Income Portfolio
yield advantage could provide attractive returns over the near term. Specifically, we continue to hold securitized debt (primarily RMBS and CMBS), investment grade credit with a focus on financials, high yield credit (though this was mitigated by a short credit default swap position), convertibles, and emerging market external debt. We also hold global sovereign debt from both emerging and developed nations, including peripheral debt in Portugal, Spain, and Italy. We believe valuations, relative to fundamentals, have been attractive for these segments.
• Though U.S. inflation could stay muted, we believe a possible change in the Fed's reaction function might lead to a more aggressive pace of Fed hikes, which could lead short-term U.S. Treasury yields to rise. We expect the Fed to hike rates in December 2017. We are more agnostic on U.S. Treasury 10-year yields. A more aggressive Fed, better growth and possible tax reform could push yields higher. However, geopolitical noise and wobbles in growth or inflation data are risks to this view.
• The European Central Bank as well as the performance of German government bonds could also impact global treasury markets. In the remainder of 2017, German bonds may not only respond to economic conditions, but also to a preplanned exit of quantitative easing and the possibility of less negative interest rates in 2018. As such, we believe German yields could rise toward year-end. Peripheral European bonds are likely to remain well bid and narrow in spread with Germany. However, continued flare-ups in political risks could weigh on yields, with the German coalition formation, Catalonia independence movement and Italian general elections the current sources of uncertainty.
• In terms of currencies, we believe risk-reward now tilts away from being short/underweight the U.S. dollar. The recent dollar depreciation looks overextended, and the Fed seems to be changing its reaction function toward a faster pace of tightening, which would support the dollar. Particularly against the euro, we believe the dollar has fallen much farther than justified by relative rate or growth differentials. Europe in general has been strengthening, and we are positive on euro-linked
currencies such as Czech koruna and Polish zloty. Emerging market currencies have performed well in a more robust global growth world, and we continue to be relatively bullish on the fundamentals underlying these currencies.
5
Morgan Stanley Institutional Fund Trust
Annual Report — September 30, 2017
Investment Overview (unaudited) (cont'd)
Strategic Income Portfolio

* Minimum Investment
** Commenced operations on December 30, 2014.
In accordance with SEC regulations, the Fund's performance shown assumes that all recurring fees (including management fees) were deducted and all dividends and distributions were reinvested. The performance of Class A, Class C and Class IS shares will vary from the performance of Class I shares based upon their different inception dates and will be negatively impacted by additional fees assessed to those classes (where applicable).
Performance Compared to the ICE BofAML 3-Month U.S. Treasury Bill Index(1), and the Lipper Alternative Credit Focus Funds Index(2)
| | | Period Ended September 30, 2017
Total Returns(3) | |
| | | | | Average Annual | |
| | | One
Year | | Five
Years | | Ten
Years | | Since
Inception(6) | |
Fund — Class I Shares
w/o sales charges(4) | | | 7.64 | % | | | — | | | | — | | | | 3.26 | % | |
Fund — Class A Shares
w/o sales charges(4) | | | 7.18 | | | | — | | | | — | | | | 2.89 | | |
Fund — Class A Shares with
maximum 4.25% sales charges(4) | | | 2.62 | | | | — | | | | — | | | | 1.29 | | |
Fund — Class C Shares
w/o sales charges(5) | | | 6.46 | | | | — | | | | — | | | | 2.20 | | |
Fund — Class C Shares with
maximum 1.00% deferred sales
charges(5) | | | 5.46 | | | | — | | | | — | | | | 2.20 | | |
Fund — Class IS Shares
w/o sales charges(4) | | | 7.80 | | | | — | | | | — | | | | 3.34 | | |
ICE BofAML 3-Month U.S. Treasury
Bill Index | | | 0.66 | | | | — | | | | — | | | | 0.34 | | |
Lipper Alternative Credit Focus
Funds Index | | | 4.99 | | | | — | | | | — | | | | 2.23 | | |
Performance data quoted represents past performance, which is no guarantee of future results, and current performance may be lower or higher than the figures shown. Performance assumes that all dividends and distributions, if any, were reinvested. For the most recent month-end performance figures, please visit www.morganstanley.com/im. Investment returns and principal value will fluctuate so that Fund shares, when redeemed, may be worth more or less than their original cost. Total returns do not reflect the deduction of taxes that a shareholder would pay on Fund distributions or the redemption of Fund shares. Performance of share classes will vary due to differences in sales charges and expenses.
(1) The ICE BofAML (Intercontinental Exchange Bank of America Merrill Lynch) 3-Month U.S. Treasury Bill Index tracks the performance of U.S. Treasury bills with a remaining maturity of three months. Index is unmanaged and its returns do not include any sales charges or fees. Such costs would lower performance. It is not possible to invest directly in an index.
(2) The Lipper Alternative Credit Focus Funds Index is an equally weighted performance index of the largest qualifying funds (based on net assets) in the Lipper Alternative Credit Focus Funds classification. The Index, which is adjusted for capital gains distributions and income dividends, is unmanaged and should not be considered an investment. There are currently 30 funds represented in this Index. As of the date of this report, the Fund was in the Lipper Alternative Credit Focus Funds classification.
(3) Total returns for the Fund reflect expenses waived and/or reimbursed, if applicable, by the Adviser. Without such waivers and/or reimbursements, total returns would have been lower.
(4) Commenced operations on December 30, 2014.
(5) Commenced operations on April 30, 2015.
(6) For comparative purposes, average annual since inception returns listed for the Indexes refer to the inception date of Class I of the Fund, not the inception of the Indexes.
6
Morgan Stanley Institutional Fund Trust
Annual Report — September 30, 2017
Portfolio of Investments
Strategic Income Portfolio
| | | Face
Amount
(000) | | Value
(000) | |
Fixed Income Securities (87.9%) | |
Asset-Backed Securities (9.2%) | |
BNC Mortgage Loan Trust, | |
1 Month USD LIBOR + 0.16%,
1.40%, 3/25/37 (a) | | $ | 100 | | | $ | 93 | | |
Carrington Mortgage Loan Trust, | |
1 Month USD LIBOR + 0.22%,
1.46%, 1/25/37 (a) | | | 100 | | | | 74 | | |
Countrywide Asset-Backed Certificates, | |
4.79%, 7/25/36 | | | 127 | | | | 107 | | |
Credit Suisse First Boston Mortgage
Securities Corp., | |
1 Month USD LIBOR + 0.62%,
1.86%, 1/25/32 (a) | | | 55 | | | | 52 | | |
Ellington Loan Acquisition Trust, | |
1 Month USD LIBOR + 1.10%,
2.34%, 5/25/37 (a)(b) | | | 100 | | | | 98 | | |
GSAA Home Equity Trust, | |
6.00%, 11/25/36 | | | 29 | | | | 20 | | |
GSAMP Trust, | |
1 Month USD LIBOR + 0.32%,
1.56%, 3/25/46 (a) | | | 100 | | | | 96 | | |
Lehman ABS Manufactured Housing Contract Trust, | |
3.70%, 4/15/40 | | | 12 | | | | 12 | | |
Mastr Asset-Backed Securities Trust, | |
1 Month USD LIBOR + 0.05%,
1.29%, 8/25/36 (a) | | | 70 | | | | 36 | | |
1 Month USD LIBOR + 0.24%,
1.48%, 8/25/36 (a) | | | 68 | | | | 36 | | |
Nationstar Home Equity Loan Trust, | |
1 Month USD LIBOR + 0.25%,
1.49%, 4/25/37 (a) | | | 100 | | | | 99 | | |
Ownit Mortgage Loan Trust, | |
1 Month USD LIBOR + 0.27%,
1.51%, 3/25/37 (a) | | | 61 | | | | 52 | | |
RAMP Trust, | |
1 Month USD LIBOR + 0.32%,
1.56%, 11/25/35 (a) | | | 54 | | | | 47 | | |
Truman Capital Mortgage Loan Trust, | |
1 Month USD LIBOR + 1.70%,
2.94%, 1/25/34 (a)(b) | | | 62 | | | | 62 | | |
1 Month USD LIBOR + 2.78%,
4.01%, 11/25/31 (a)(b) | | | 56 | | | | 57 | | |
| | | | 941 | | |
Collateralized Mortgage Obligation — Agency Collateral Series (0.1%) | |
Government National Mortgage Association, | |
IO | |
0.81%, 8/20/58 (a) | | | 468 | | | | 13 | | |
Commercial Mortgage-Backed Securities (4.0%) | |
COMM Mortgage Trust, | |
2.87%, 2/10/48 (b) | | | 100 | | | | 81 | | |
GS Mortgage Securities Trust, | |
4.47%, 2/10/48 (a)(b) | | | 100 | | | | 80 | | |
| | | Face
Amount
(000) | | Value
(000) | |
HILT Mortgage Trust, | |
3.75% - 1 Month LIBOR,
3.23%, 7/15/29 (a)(b) | | $ | 100 | | | $ | 96 | | |
JPMBB Commercial Mortgage Securities Trust, | |
3.99%, 2/15/48 (a)(b) | | | 100 | | | | 81 | | |
Wells Fargo Commercial Mortgage Trust, | |
4.24%, 5/15/48 (a) | | | 75 | | | | 66 | | |
| | | | 404 | | |
Corporate Bonds (39.2%) | |
Finance (17.2%) | |
ABN Amro Bank N.V., | |
6.38%, 4/27/21 | | EUR | 100 | | | | 142 | | |
Ally Financial, Inc., | |
4.13%, 3/30/20 | | $ | 25 | | | | 26 | | |
Banco Santander SA, | |
6.25%, 3/12/19 (c) | | EUR | 100 | | | | 122 | | |
Bank of America Corp., | |
MTN | |
4.25%, 10/22/26 | | $ | 50 | | | | 52 | | |
BNP Paribas SA, | |
3.80%, 1/10/24 (b) | | | 250 | | | | 260 | | |
| BPCE SA, | |
5.15%, 7/21/24 (b) | | | 200 | | | | 216 | | |
Capital One Financial Corp., | |
2.50%, 5/12/20 | | | 25 | | | | 25 | | |
Citigroup, Inc., | |
5.50%, 9/13/25 | | | 75 | | | | 84 | | |
Colony NorthStar, Inc., | |
5.00%, 4/15/23 | | | 25 | | | | 26 | | |
Commonwealth Bank of Australia, | |
1.75%, 11/7/19 (b) | | | 25 | | | | 25 | | |
Cooperatieve Rabobank UA, | |
2.50%, 5/26/26 | | EUR | 100 | | | | 125 | | |
Deutsche Bank AG, | |
2.70%, 7/13/20 | | $ | 25 | | | | 25 | | |
Discover Financial Services, | |
3.95%, 11/6/24 | | | 25 | | | | 26 | | |
Kennedy-Wilson, Inc., | |
5.88%, 4/1/24 | | | 25 | | | | 26 | | |
Lloyds Bank PLC, | |
6.50%, 3/24/20 | | EUR | 50 | | | | 68 | | |
Muenchener Rueckversicherungs-
Gesellschaft AG in Muenchen, | |
6.00%, 5/26/41 | | | 100 | | | | 141 | | |
Nationwide Building Society, | |
4.13%, 3/20/23 | | | 100 | | | | 120 | | |
Shutterfly, Inc., | |
0.25%, 5/15/18 | | $ | 25 | | | | 25 | | |
Spirit Realty Capital, Inc., | |
3.75%, 5/15/21 | | | 25 | | | | 26 | | |
Finance (cont'd) | |
Starwood Property Trust, Inc., | |
4.55%, 3/1/18 | | | 50 | | | | 53 | | |
The accompanying notes are an integral part of the financial statements.
7
Morgan Stanley Institutional Fund Trust
Annual Report — September 30, 2017
Portfolio of Investments (cont'd)
Strategic Income Portfolio
| | | Face
Amount
(000) | | Value
(000) | |
Synchrony Financial, | |
2.60%, 1/15/19 | | $ | 25 | | | $ | 25 | | |
Vonovia Finance BV, | |
4.00%, 12/17/21 (c) | | EUR | 100 | | | | 129 | | |
| | | | 1,767 | | |
Industrials (22.0%) | |
Acadia Healthcare Co., Inc., | |
5.13%, 7/1/22 | | $ | 5 | | | | 5 | | |
Akamai Technologies, Inc., | |
0.00%, 2/15/19 | | | 50 | | | | 49 | | |
Allscripts Healthcare Solutions, Inc., | |
1.25%, 7/1/20 | | | 50 | | | | 53 | | |
Apex Tool Group LLC, | |
7.00%, 2/1/21 (b) | | | 25 | | | | 23 | | |
Aramark Services, Inc., | |
4.75%, 6/1/26 | | | 25 | | | | 26 | | |
AT&T, Inc., | |
4.50%, 3/9/48 | | | 6 | | | | 6 | | |
Avis Budget Car Rental LLC/Avis Budget
Finance, Inc., | |
5.50%, 4/1/23 | | | 25 | | | | 26 | | |
Ball Corp., | |
4.00%, 11/15/23 | | | 25 | | | | 26 | | |
Becton Dickinson and Co., | |
2.89%, 6/6/22 | | | 25 | | | | 25 | | |
Charter Communications Operating LLC/
Charter Communications Operating Capital, | |
4.91%, 7/23/25 | | | 50 | | | | 54 | | |
Continental Airlines Pass-Through Trust, | |
6.13%, 4/29/18 | | | 25 | | | | 26 | | |
Crown Castle International Corp., | |
5.25%, 1/15/23 | | | 25 | | | | 28 | | |
CSC Holdings LLC, | |
5.25%, 6/1/24 | | | 25 | | | | 25 | | |
Ctrip.com International Ltd., | |
1.25%, 9/15/22 | | | 25 | | | | 27 | | |
Dell International LLC/EMC Corp., | |
3.48%, 6/1/19 (b) | | | 50 | | | | 51 | | |
Delta Air Lines, Inc., | |
2.88%, 3/13/20 | | | 25 | | | | 25 | | |
DexCom, Inc., | |
0.75%, 5/15/22 (b) | | | 25 | | | | 22 | | |
Dollar Tree, Inc., | |
5.75%, 3/1/23 | | | 25 | | | | 27 | | |
Finisar Corp., | |
0.50%, 12/15/36 (b) | | | 25 | | | | 24 | | |
First Data Corp., | |
5.38%, 8/15/23 (b) | | | 25 | | | | 26 | | |
| | | Face
Amount
(000) | | Value
(000) | |
General Motors Financial Co., Inc., | |
4.30%, 7/13/25 | | $ | 50 | | | $ | 52 | | |
Global Partners LP/GLP Finance Corp., | |
7.00%, 6/15/23 | | | 25 | | | | 25 | | |
Gray Television, Inc., | |
5.13%, 10/15/24 (b) | | | 25 | | | | 25 | | |
Hanesbrands, Inc., | |
4.63%, 5/15/24 (b) | | | 9 | | | | 9 | | |
4.88%, 5/15/26 (b) | | | 16 | | | | 17 | | |
Harland Clarke Holdings Corp., | |
6.88%, 3/1/20 (b) | | | 25 | | | | 26 | | |
HCA, Inc., | |
4.75%, 5/1/23 | | | 25 | | | | 26 | | |
Hilcorp Energy I LP/Hilcorp Finance Co., | |
5.75%, 10/1/25 (b) | | | 15 | | | | 15 | | |
Intercept Pharmaceuticals, Inc., | |
3.25%, 7/1/23 | | | 25 | | | | 19 | | |
Ionis Pharmaceuticals, Inc., | |
1.00%, 11/15/21 | | | 25 | | | | 26 | | |
Jack Ohio Finance LLC/Jack Ohio Finance 1 Corp., | |
6.75%, 11/15/21 (b) | | | 25 | | | | 26 | | |
Kenan Advantage Group, Inc. (The), | |
7.88%, 7/31/23 (b) | | | 25 | | | | 26 | | |
KFC Holding Co./Pizza Hut Holdings LLC/
Taco Bell of America LLC, | |
5.25%, 6/1/26 (b) | | | 25 | | | | 27 | | |
Lamar Media Corp., | |
5.00%, 5/1/23 | | | 25 | | | | 26 | | |
Lamb Weston Holdings, Inc., | |
4.88%, 11/1/26 (b) | | | 25 | | | | 26 | | |
Lear Corp., | |
5.25%, 1/15/25 | | | 50 | | | | 53 | | |
Lions Gate Entertainment Corp., | |
5.88%, 11/1/24 (b) | | | 25 | | | | 26 | | |
Lundin Mining Corp., | |
7.50%, 11/1/20 (b) | | | 25 | | | | 26 | | |
Macquarie Infrastructure Corp., | |
2.00%, 10/1/23 | | | 25 | | | | 24 | | |
Mallinckrodt International Finance SA/
Mallinckrodt CB LLC, | |
5.50%, 4/15/25 (b) | | | 25 | | | | 23 | | |
MDC Partners, Inc., | |
6.50%, 5/1/24 (b) | | | 25 | | | | 25 | | |
MGM Resorts International, | |
6.00%, 3/15/23 | | | 25 | | | | 28 | | |
Michael Baker International LLC/CDL Acquisition
Co., Inc., | |
8.25%, 10/15/18 (b) | | | 25 | | | | 25 | | |
| MPLX LP, | |
4.00%, 2/15/25 | | | 25 | | | | 25 | | |
MSCI, Inc., | |
4.75%, 8/1/26 (b) | | | 9 | | | | 9 | | |
The accompanying notes are an integral part of the financial statements.
8
Morgan Stanley Institutional Fund Trust
Annual Report — September 30, 2017
Portfolio of Investments (cont'd)
Strategic Income Portfolio
| | | Face
Amount
(000) | | Value
(000) | |
Industrials (cont'd) | |
Neurocrine Biosciences, Inc., | |
2.25%, 5/15/24 (b) | | $ | 25 | | | $ | 29 | | |
Nuance Communications, Inc., | |
1.00%, 12/15/35 | | | 25 | | | | 24 | | |
ON Semiconductor Corp., | |
1.00%, 12/1/20 | | | 50 | | | | 60 | | |
Petrobras Global Finance BV, | |
6.13%, 1/17/22 | | | 50 | | | | 54 | | |
PetSmart, Inc., | |
7.13%, 3/15/23 (b) | | | 25 | | | | 20 | | |
Playa Resorts Holding BV, | |
8.00%, 8/15/20 (b) | | | 5 | | | | 5 | | |
Post Holdings, Inc., | |
5.00%, 8/15/26 (b) | | | 25 | | | | 25 | | |
QUALCOMM, Inc., | |
1.85%, 5/20/19 | | | 25 | | | | 25 | | |
Rivers Pittsburgh Borrower LP/Rivers Pittsburgh
Finance Corp., | |
6.13%, 8/15/21 (b) | | | 25 | | | | 25 | | |
RSI Home Products, Inc., | |
6.50%, 3/15/23 (b) | | | 25 | | | | 26 | | |
SBA Communications Corp., | |
4.88%, 9/1/24 | | | 25 | | | | 26 | | |
Select Medical Corp., | |
6.38%, 6/1/21 | | | 50 | | | | 52 | | |
ServiceNow, Inc., | |
0.00%, 6/1/22 (b) | | | 25 | | | | 27 | | |
Shell International Finance BV, | |
1.38%, 9/12/19 | | | 50 | | | | 50 | | |
Solvay Finance SA, | |
5.12%, 6/2/21 (c) | | EUR | 100 | | | | 133 | | |
Sprint Communications, Inc., | |
6.00%, 11/15/22 | | $ | 25 | | | | 27 | | |
Standard Industries, Inc., | |
5.38%, 11/15/24 (b) | | | 50 | | | | 53 | | |
Tallgrass Energy Partners LP/Tallgrass Energy
Finance Corp., | |
5.50%, 9/15/24 (b) | | | 25 | | | | 26 | | |
Telefonica Europe BV, | |
5.88%, 3/31/24 (c) | | EUR | 100 | | | | 136 | | |
Tenet Healthcare Corp., | |
5.13%, 5/1/25 (b) | | $ | 25 | | | | 25 | | |
Tesla, Inc., | |
0.25%, 3/1/19 | | | 25 | | | | 28 | | |
Teva Pharmaceutical Finance Netherlands III BV, | |
2.20%, 7/21/21 | | | 25 | | | | 24 | | |
3.15%, 10/1/26 | | | 25 | | | | 23 | | |
Tops Holding LLC/Tops Markets II Corp., | |
8.00%, 6/15/22 (b) | | | 25 | | | | 17 | | |
| | | Face
Amount
(000) | | Value
(000) | |
Transurban Finance Co., Pty Ltd., | |
3.38%, 3/22/27 (b) | | $ | 25 | | | $ | 25 | | |
Viavi Solutions, Inc., | |
0.63%, 8/15/33 | | | 25 | | | | 26 | | |
Wolverine World Wide, Inc., | |
5.00%, 9/1/26 (b) | | | 25 | | | | 25 | | |
Zachry Holdings, Inc., | |
7.50%, 2/1/20 (b) | | | 25 | | | | 26 | | |
| | | | 2,251 | | |
| | | | 4,018 | | |
Mortgages — Other (9.8%) | |
Alternative Loan Trust, | |
3.52%, 3/25/35 (a) | | | 72 | | | | 69 | | |
PAC | |
1.69%, 10/25/36 (a) | | | 59 | | | | 35 | | |
Banc of America Alternative Loan Trust, | |
5.71%, 10/25/36 (a) | | | 92 | | | | 57 | | |
Bear Stearns Structured Products, Inc. Trust, | |
3.36%, 1/26/36 (a) | | | 30 | | | | 27 | | |
Bear Stearns Trust, | |
3.17%, 2/25/36 (a) | | | 44 | | | | 40 | | |
3.28%, 4/25/35 (a) | | | 44 | | | | 36 | | |
3.83%, 3/25/36 (a) | | | 135 | | | | 117 | | |
Citigroup Mortgage Loan Trust, | |
3.34%, 6/25/36 (a) | | | 31 | | | | 25 | | |
Grifonas Finance PLC, | |
6 Month EURIBOR + 0.28%,
0.01%, 8/28/39 (a) | | EUR | 45 | | | | 47 | | |
GSR Mortgage Loan Trust, | |
3.97%, 12/25/34 (a) | | $ | 76 | | | | 75 | | |
HarborView Mortgage Loan Trust, | |
1 Month USD LIBOR + 0.19%,
1.43%, 1/19/38 (a) | | | 29 | | | | 27 | | |
IndyMac INDX Mortgage Loan Trust, | |
3.11%, 12/25/34 (a) | | | 40 | | | | 40 | | |
JP Morgan Mortgage Trust, | |
3.50%, 6/25/37 (a) | | | 34 | | | | 34 | | |
Lehman Mortgage Trust, | |
6.00%, 7/25/36 - 6/25/37 | | | 122 | | | | 97 | | |
Luminent Mortgage Trust, | |
1 Month USD LIBOR + 0.23%,
1.47%, 5/25/37 (a) | | | 93 | | | | 86 | | |
Lusitano Mortgages No. 5 PLC, | |
3 Month EURIBOR + 0.26%,
0.00%, 7/15/59 (a) | | EUR | 45 | | | | 49 | | |
MASTR Alternative Loan Trust, | |
6.25%, 7/25/36 | | $ | 41 | | | | 37 | | |
Reperforming Loan REMIC Trust, | |
8.50%, 6/25/35 (b) | | | 97 | | | | 102 | | |
| | | | 1,000 | | |
The accompanying notes are an integral part of the financial statements.
9
Morgan Stanley Institutional Fund Trust
Annual Report — September 30, 2017
Portfolio of Investments (cont'd)
Strategic Income Portfolio
| | | Face
Amount
(000) | | Value
(000) | |
Sovereign (16.7%) | |
Australia Government Bond, | |
2.75%, 11/21/27 | | AUD | 70 | | | $ | 54 | | |
3.25%, 4/21/25 | | | 90 | | | | 73 | | |
Brazil Notas do Tesouro Nacional Serie F, | |
10.00%, 1/1/21 - 1/1/25 | | BRL | 794 | | | | 259 | | |
Cyprus Government International Bond, | |
3.88%, 5/6/22 | | EUR | 60 | | | | 80 | | |
4.25%, 11/4/25 | | | 40 | | | | 56 | | |
Hungary Government International Bond, | |
5.38%, 3/25/24 | | $ | 80 | | | | 92 | | |
Italy Buoni Poliennali Del Tesoro, | |
1.45%, 9/15/22 | | EUR | 55 | | | | 67 | | |
Mexican Bonos, | |
Series M | |
5.75%, 3/5/26 | | MXN | 5,700 | | | | 292 | | |
6.50%, 6/10/21 | | | 3,000 | | | | 164 | | |
Petroleos Mexicanos, | |
6.50%, 3/13/27 (b) | | $ | 60 | | | | 67 | | |
Portugal Obrigacoes do Tesouro OT, | |
4.13%, 4/14/27 (b) | | EUR | 165 | | | | 224 | | |
5.65%, 2/15/24 (b) | | | 40 | | | | 59 | | |
Russian Federal Bond - OFZ, | |
7.00%, 8/16/23 | | RUB | 5,900 | | | | 100 | | |
Spain Government Bond, | |
0.40%, 4/30/22 | | EUR | 100 | | | | 119 | | |
| | | | 1,706 | | |
U.S. Treasury Securities (8.9%) | |
U.S. Treasury Bond, | |
2.50%, 2/15/45 | | | 200 | | | | 187 | | |
U.S. Treasury Notes, | |
0.38%, 1/15/27 | | | 111 | | | | 110 | | |
1.75%, 4/30/22 | | | 100 | | | | 99 | | |
2.13%, 5/15/25 | | | 520 | | | | 517 | | |
| | | | 913 | | |
Total Fixed Income Securities (Cost $8,529) | | | 8,995 | | |
| | | Shares | | | |
Short-Term Investments (9.9%) | |
Investment Company (9.5%) | |
Morgan Stanley Institutional Liquidity
Funds — Government Portfolio —
Institutional Class (See Note G)
(Cost $976) | | | 975,973 | | | | 976 | | |
| | | Face
Amount
(000) | | Value
(000) | |
U.S. Treasury Security (0.4%) | |
U.S. Treasury Bill | |
| 1.19%, 4/26/18 (d)(e) (Cost $38) | | $ | 38 | | | $ | 38 | | |
Total Short-Term Investments (Cost $1,014) | | | 1,014 | | |
Total Investments (97.8%) (Cost $9,543) (f)(g) | | | 10,009 | | |
Other Assets in Excess of Liabilities (2.2%) | | | 230 | | |
Net Assets (100.0%) | | $ | 10,239 | | |
(a) Floating or Variable rate securities: The rates disclosed are as of September 30, 2017. For securities based on a published reference rate and spread, the reference rate and spread are indicated in the description in the Portfolio of Investments. Certain variable rate securities are not based on a published reference rate and spread but are determined by the issuer or agent and are based on current market conditions. These securities do not indicate a reference rate and spread in their description in the Portfolio of Investments.
(b) 144A security — Certain conditions for public sale may exist. Unless otherwise noted, these securities are deemed to be liquid.
(c) Perpetual — One or more securities do not have a predetermined maturity date. Rates for these securities are fixed for a period of time, after which they revert to a floating rate. Interest rates in effect are as of September 30, 2017.
(d) Rate shown is the yield to maturity at September 30, 2017.
(e) All or a portion of the security was pledged to cover margin requirements for swap agreements.
(f) Securities are available for collateral in connection with open foreign currency forward exchange contracts, futures contracts and swap agreements.
(g) At September 30, 2017, the aggregate cost for federal income tax purposes is approximately $9,532,000. The aggregate gross unrealized appreciation is approximately $533,000 and the aggregate gross unrealized depreciation is approximately $75,000, resulting in net unrealized appreciation of approximately $458,000.
EURIBOR Euro Interbank Offered Rate.
IO Interest Only.
LIBOR London Interbank Offered Rate.
MTN Medium Term Note.
OFZ Obilgatsyi Federal'novo Zaima (Russian Federal Loan Obligation).
PAC Planned Amortization Class.
REMIC Real Estate Mortgage Investment Conduit.
Foreign Currency Forward Exchange Contracts:
The Fund had the following foreign currency forward exchange contracts open at September 30, 2017:
Counterparty | | Contracts
to Deliver
(000) | | In Exchange
For
(000) | | Delivery
Date | | Unrealized
Appreciation
(Depreciation)
(000) | |
Australia and New Zealand Banking Group | | AUD | 368 | | | $ | 293 | | | 10/6/17 | | $ | 5 | | |
Australia and New Zealand Banking Group | | MXN | 957 | | | $ | 53 | | | 10/6/17 | | | (— | @) | |
The accompanying notes are an integral part of the financial statements.
10
Morgan Stanley Institutional Fund Trust
Annual Report — September 30, 2017
Portfolio of Investments (cont'd)
Strategic Income Portfolio
Foreign Currency Forward Exchange Contracts (cont'd):
Counterparty | | Contracts
to Deliver
(000) | | In Exchange
For
(000) | | Delivery
Date | | Unrealized
Appreciation
(Depreciation)
(000) | |
Barclays Bank PLC | | MXN | 7,200 | | | $ | 401 | | | 10/6/17 | | $ | 6 | | |
Citibank NA | | EUR | 1,525 | | | $ | 1,822 | | | 10/6/17 | | | 19 | | |
Citibank NA | | $ | — | @ | | EUR | — | @ | | 10/6/17 | | | (— | @) | |
HSBC Bank PLC | | EUR | 11 | | | $ | 13 | | | 10/6/17 | | | (— | @) | |
HSBC Bank PLC | | $ | 3 | | | EUR | 2 | | | 10/6/17 | | | (— | @) | |
HSBC Bank PLC | | $ | 2 | | | EUR | 2 | | | 10/6/17 | | | (— | @) | |
HSBC Bank PLC | | $ | 28 | | | MXN | 501 | | | 10/6/17 | | | (1 | ) | |
HSBC Bank PLC | | $ | 104 | | | PLN | 371 | | | 10/6/17 | | | (3 | ) | |
JPMorgan Chase Bank NA | | BRL | 89 | | | $ | 28 | | | 10/6/17 | | | — | @ | |
JPMorgan Chase Bank NA | | BRL | 425 | | | $ | 136 | | | 10/6/17 | | | 1 | | |
JPMorgan Chase Bank NA | | EUR | 11 | | | $ | 14 | | | 10/6/17 | | | — | @ | |
JPMorgan Chase Bank NA | | EUR | 69 | | | $ | 81 | | | 10/6/17 | | | (— | @) | |
JPMorgan Chase Bank NA | | JPY | 11,048 | | | $ | 102 | | | 10/6/17 | | | 4 | | |
JPMorgan Chase Bank NA | | SEK | 883 | | | $ | 109 | | | 10/6/17 | | | — | @ | |
JPMorgan Chase Bank NA | | $ | 9 | | | MXN | 166 | | | 10/6/17 | | | (— | @) | |
JPMorgan Chase Bank NA | | $ | 101 | | | NOK | 795 | | | 10/6/17 | | | (1 | ) | |
JPMorgan Chase Bank NA | | $ | 111 | | | SEK | 883 | | | 10/6/17 | | | (2 | ) | |
State Street Bank and Trust Co. | | RUB | 5,848 | | | $ | 101 | | | 10/6/17 | | | (— | @) | |
| | | | | | | | | $ | 28 | | |
Futures Contracts:
The Fund had the following futures contracts open at September 30, 2017:
| | | Number
of
Contracts | | Expiration
Date | | Notional Amount
(000) | | Value
(000) | | Unrealized
Appreciation
(000) | |
Short: | |
German Euro BOBL (Germany) | | | 4 | | | Dec-17 | | | (400 | ) | | $ | (620 | ) | | $ | 3 | | |
German Euro Bund (Germany) | | | 4 | | | Dec-17 | | | (400 | ) | | | (761 | ) | | | 8 | | |
U.S. Treasury 10 yr. Note (United States) | | | 6 | | | Dec-17 | | | (600 | ) | | | (752 | ) | | | 8 | | |
U.S. Treasury 10 yr. Ultra Long Bond (United States) | | | 8 | | | Dec-17 | | | (800 | ) | | | (1,075 | ) | | | 13 | | |
U.S. Treasury 2 yr. Note (United States) | | | 2 | | | Dec-17 | | | (400 | ) | | | (431 | ) | | | 1 | | |
U.S. Treasury 5 yr. Note (United States) | | | 10 | | | Dec-17 | | | (1,000 | ) | | | (1,175 | ) | | | 8 | | |
U.S. Treasury Ultra Bond (United States) | | | 1 | | | Dec-17 | | | (100 | ) | | | (165 | ) | | | 3 | | |
| | | | | | | | | | | $ | 44 | | |
Credit Default Swap Agreements:
The Fund had the following credit default swap agreements open at September 30, 2017:
Swap Counterparty and
Reference Obligation | | Credit
Rating of
Reference
Obligation†
(Unaudited) | | Buy/Sell
Protection | | Pay/Receive
Fixed Rate | | Payment
Frequency | | Maturity
Date | | Notional
Amount
(000) | | Value
(000) | | Upfront
Payment
Paid
(Received)
(000) | | Unrealized
Depreciation
(000) | |
Deutsche Bank AG
CMBX.NA.BB.60 | | NR | | Sell | | | 5.00 | % | | Monthly | | 5/11/63 | | $ | 13 | | | $ | (3 | ) | | $ | — | @ | | $ | (3 | ) | |
Goldman Sachs International
CMBX.NA.BB.60 | | NR | | Sell | | | 5.00 | | | Monthly | | 5/11/63 | | | 20 | | | | (5 | ) | | | (— | @) | | | (5 | ) | |
Goldman Sachs International
CMBX.NA.BBB.60 | | NR | | Sell | | | 3.00 | | | Monthly | | 5/11/63 | | | 200 | | | | (31 | ) | | | (13 | ) | | | (18 | ) | |
Goldman Sachs International
CMBX.NA.BBB.60 | | NR | | Sell | | | 3.00 | | | Monthly | | 5/11/63 | | | 27 | | | | (4 | ) | | | (1 | ) | | | (3 | ) | |
Goldman Sachs International
CMBX.NA.BBB.60 | | NR | | Sell | | | 3.00 | | | Monthly | | 5/11/63 | | | 64 | | | | (9 | ) | | | (2 | ) | | | (7 | ) | |
Goldman Sachs International
CMBX.NA.BBB.60 | | NR | | Sell | | | 3.00 | | | Monthly | | 5/11/63 | | | 109 | | | | (17 | ) | | | (5 | ) | | | (12 | ) | |
Morgan Stanley & Co., LLC*
CDX.NA.HY.29 | | NR | | Buy | | | 5.00 | | | Quarterly | | 12/20/22 | | | 200 | | | | (15 | ) | | | (15 | ) | | | (— | @) | |
| | | | | | | | | | | | | $ | 633 | | | $ | (84 | ) | | $ | (36 | ) | | $ | (48 | ) | |
The accompanying notes are an integral part of the financial statements.
11
Morgan Stanley Institutional Fund Trust
Annual Report — September 30, 2017
Portfolio of Investments (cont'd)
Strategic Income Portfolio
Interest Rate Swap Agreements:
The Fund had the following interest rate swap agreements open at September 30, 2017:
Swap Counterparty | | Floating Rate
Index | | Pay/Receive
Floating Rate | | Fixed
Rate | | Payment
Frequency
Paid/
Received | | Maturity
Date | | Notional
Amount
(000) | | Value
(000) | | Upfront
Payment
Paid
(000) | | Unrealized
Appreciation
(Depreciation)
(000) | |
Morgan Stanley & Semi-Annual/
Co., LLC* | | 3 Month LIBOR | | Receive | | | 2.28 | % | | Quarterly | | 12/8/26 | | $ | 160 | | | $ | (1 | ) | | $ | — | | | $ | (1 | ) | |
Morgan Stanley & Semi-Annual/
Co., LLC* | | 3 Month LIBOR | | Receive | | | 2.48 | | | Quarterly | | 12/21/26 | | | 110 | | | | (3 | ) | | | — | | | | (3 | ) | |
Morgan Stanley & Semi-Annual/
Co., LLC* | | 3 Month LIBOR | | Receive | | | 2.59 | | | Quarterly | | 12/8/46 | | | 22 | | | | (1 | ) | | | — | | | | (1 | ) | |
Morgan Stanley & Semi-Annual/
Co., LLC* | | 3 Month LIBOR | | Receive | | | 2.74 | | | Quarterly | | 12/21/46 | | | 50 | | | | (2 | ) | | | — | | | | (2 | ) | |
Morgan Stanley & Semi-Annual/
Co., LLC* | | 3 Month LIBOR | | Receive | | | 2.48 | | | Quarterly | | 5/23/47 | | | 40 | | | | 1 | | | | — | | | | 1 | | |
| | | | | | | | | | | | | $ | 382 | | | $ | (6 | ) | | $ | — | | | $ | (6 | ) | |
@ Value is less than $500.
† Credit rating as issued by Standard & Poor's.
* Cleared swap agreement, the broker is Morgan Stanley & Co., LLC.
NR Not rated.
LIBOR London Interbank Offered Rate.
AUD — Australian Dollar
BRL — Brazilian Real
EUR — Euro
JPY — Japanese Yen
MXN — Mexican Peso
NOK — Norwegian Krone
PLN — Polish Zloty
RUB — Russian Ruble
SEK — Swedish Krona
Portfolio Composition
Classification | | Percentage of
Total Investments | |
Industrials | | | 22.5 | % | |
Finance | | | 17.7 | | |
Sovereign | | | 17.0 | | |
Short-Term Investments | | | 10.1 | | |
Mortgages — Other | | | 10.0 | | |
Asset-Backed Securities | | | 9.4 | | |
U.S. Treasury Securities | | | 9.1 | | |
Other** | | | 4.2 | | |
Total Investments | | | 100.0 | %*** | |
** Industries and/or investment types representing less than 5% of total investments.
*** Does not include open short futures contracts with an underlying face amount of approximately $4,979,000 with total unrealized appreciation of approximately $44,000. Does not include open foreign currency forward exchange contracts with net unrealized appreciation of approximately $28,000 and does not include open swap agreements with net unrealized depreciation of approximately $54,000.
The accompanying notes are an integral part of the financial statements.
12
Morgan Stanley Institutional Fund Trust
Annual Report — September 30, 2017
Strategic Income Portfolio
Statement of Assets and Liabilities | | September 30, 2017
(000) | |
Assets: | |
Investments in Securities of Unaffiliated Issuers, at Value (Cost $8,567) | | $ | 9,033 | | |
Investment in Security of Affiliated Issuer, at Value (Cost $976) | | | 976 | | |
Total Investments in Securities, at Value (Cost $9,543) | | | 10,009 | | |
Foreign Currency, at Value (Cost $2) | | | 2 | | |
Due from Adviser | | | 110 | | |
Interest Receivable | | | 85 | | |
Receivable for Variation Margin on Futures Contracts | | | 74 | | |
Receivable for Investments Sold | | | 55 | | |
Unrealized Appreciation on Foreign Currency Forward Exchange Contracts | | | 35 | | |
Tax Reclaim Receivable | | | 3 | | |
Receivable from Affiliate | | | 1 | | |
Premium Paid on Open Swap Agreements | | | — | @ | |
Other Assets | | | 28 | | |
Total Assets | | | 10,402 | | |
Liabilities: | |
Unrealized Depreciation on Swap Agreements | | | 48 | | |
Payable for Professional Fees | | | 35 | | |
Premium Received on Open Swap Agreements | | | 21 | | |
Payable for Custodian Fees | | | 16 | | |
Bank Overdraft | | | 15 | | |
Unrealized Depreciation on Foreign Currency Forward Exchange Contracts | | | 7 | | |
Payable for Transfer Agency Fees — Class I | | | 1 | | |
Payable for Transfer Agency Fees — Class A | | | 1 | | |
Payable for Transfer Agency Fees — Class C | | | 1 | | |
Payable for Transfer Agency Fees — Class IS | | | 1 | | |
Payable for Administration Fees | | | 1 | | |
Payable for Shareholder Services Fees — Class A | | | — | @ | |
Payable for Distribution and Shareholder Services Fees — Class C | | | — | @ | |
Payable for Sub Transfer Agency Fees — Class A | | | — | @ | |
Payable for Sub Transfer Agency Fees — Class C | | | — | @ | |
Payable for Variation Margin on Swap Agreements | | | — | @ | |
Other Liabilities | | | 16 | | |
Total Liabilities | | | 163 | | |
Net Assets | | $ | 10,239 | | |
Net Assets Consist of: | |
Paid-in-Capital | | $ | 10,007 | | |
Distributions in Excess of Net Investment Income | | | (109 | ) | |
Accumulated Net Realized Loss | | | (144 | ) | |
Unrealized Appreciation (Depreciation) on: | |
Investments | | | 466 | | |
Futures Contracts | | | 44 | | |
Swap Agreements | | | (54 | ) | |
Foreign Currency Forward Exchange Contracts | | | 28 | | |
Foreign Currency Translations | | | 1 | | |
Net Assets | | $ | 10,239 | | |
The accompanying notes are an integral part of the financial statements.
13
Morgan Stanley Institutional Fund Trust
Annual Report — September 30, 2017
Strategic Income Portfolio
Statement of Assets and Liabilities (cont'd) | | September 30, 2017
(000) | |
CLASS I: | |
Net Assets | | $ | 10 | | |
| Shares Outstanding (unlimited number of shares authorized, no par value) (not in 000's) | | | 1,000 | | |
Net Asset Value, Offering and Redemption Price Per Share | | $ | 10.21 | | |
CLASS A: | |
Net Assets | | $ | 10 | | |
| Shares Outstanding (unlimited number of shares authorized, no par value) (not in 000's) | | | 1,000 | | |
Net Asset Value, Redemption Price Per Share | | $ | 10.20 | | |
Maximum Sales Load | | | 4.25 | % | |
Maximum Sales Charge | | $ | 0.45 | | |
Maximum Offering Price Per Share | | $ | 10.65 | | |
CLASS C: | |
Net Assets | | $ | 22 | | |
| Shares Outstanding (unlimited number of shares authorized, no par value) (not in 000's) | | | 2,181 | | |
Net Asset Value, Offering and Redemption Price Per Share | | $ | 10.17 | | |
CLASS IS: | |
Net Assets | | $ | 10,197 | | |
| Shares Outstanding (unlimited number of shares authorized, no par value) (not in 000's) | | | 998,000 | | |
Net Asset Value, Offering and Redemption Price Per Share | | $ | 10.22 | | |
@ Amount is less than $500.
The accompanying notes are an integral part of the financial statements.
14
Morgan Stanley Institutional Fund Trust
Annual Report — September 30, 2017
Strategic Income Portfolio
Statement of Operations | | Year Ended
September 30, 2017
(000) | |
Investment Income: | |
Interest from Securities of Unaffiliated Issuers | | $ | 357 | | |
Dividends from Security of Affiliated Issuer (Note G) | | | 4 | | |
Total Investment Income | | | 361 | | |
Expenses: | |
Professional Fees | | | 163 | | |
Registration Fees | | | 51 | | |
Custodian Fees (Note F) | | | 46 | | |
Advisory Fees (Note B) | | | 40 | | |
Pricing Fees | | | 26 | | |
Shareholder Reporting Fees | | | 14 | | |
Administration Fees (Note C) | | | 8 | | |
Transfer Agency Fees — Class I (Note E) | | | 2 | | |
Transfer Agency Fees — Class A (Note E) | | | 2 | | |
Transfer Agency Fees — Class C (Note E) | | | 2 | | |
Transfer Agency Fees — Class IS (Note E) | | | 1 | | |
Trustees' Fees and Expenses | | | 4 | | |
Shareholder Services Fees — Class A (Note D) | | | — | @ | |
Distribution and Shareholder Services Fees — Class C (Note D) | | | — | @ | |
Sub Transfer Agency Fees — Class A | | | — | @ | |
Sub Transfer Agency Fees — Class C | | | — | @ | |
Other Expenses | | | 24 | | |
Total Expenses | | | 383 | | |
Expenses Reimbursed by Adviser (Note B) | | | (241 | ) | |
Waiver of Advisory Fees (Note B) | | | (40 | ) | |
Reimbursement of Class Specific Expenses — Class I (Note B) | | | (2 | ) | |
Reimbursement of Class Specific Expenses — Class A (Note B) | | | (2 | ) | |
Reimbursement of Class Specific Expenses — Class C (Note B) | | | (2 | ) | |
Reimbursement of Class Specific Expenses — Class IS (Note B) | | | (1 | ) | |
Rebate from Morgan Stanley Affiliate (Note G) | | | (1 | ) | |
Net Expenses | | | 94 | | |
Net Investment Income | | | 267 | | |
Realized Gain (Loss): | |
Investments Sold | | | 24 | | |
Foreign Currency Forward Exchange Contracts | | | (57 | ) | |
Foreign Currency Transactions | | | (1 | ) | |
Futures Contracts | | | 93 | | |
Swap Agreements | | | (6 | ) | |
Net Realized Gain | | | 53 | | |
Change in Unrealized Appreciation (Depreciation): | |
Investments | | | 394 | | |
Foreign Currency Forward Exchange Contracts | | | 16 | | |
Foreign Currency Translations | | | 3 | | |
Futures Contracts | | | 43 | | |
Swap Agreements | | | (30 | ) | |
Net Change in Unrealized Appreciation (Depreciation) | | | 426 | | |
Net Realized Gain and Change in Unrealized Appreciation (Depreciation) | | | 479 | | |
Net Increase in Net Assets Resulting from Operations | | $ | 746 | | |
@ Amount is less than $500.
The accompanying notes are an integral part of the financial statements.
15
Morgan Stanley Institutional Fund Trust
Annual Report — September 30, 2017
Strategic Income Portfolio
Statements of Changes in Net Assets | | Year Ended
September 30, 2017
(000) | | Year Ended
September 30, 2016
(000) | |
Increase (Decrease) in Net Assets: | |
Operations: | |
Net Investment Income | | $ | 267 | | | $ | 220 | | |
Net Realized Gain (Loss) | | | 53 | | | | (287 | ) | |
Net Change in Unrealized Appreciation (Depreciation) | | | 426 | | | | 340 | | |
Net Increase in Net Assets Resulting from Operations | | | 746 | | | | 273 | | |
Distributions from and/or in Excess of: | |
Class I: | |
Net Investment Income | | | (— | @) | | | (— | @) | |
Class A: | |
Net Investment Income | | | (1 | ) | | | (— | @) | |
Class C: | |
Net Investment Income | | | (— | @) | | | (— | @) | |
Class IS: | |
Net Investment Income | | | (215 | ) | | | (379 | ) | |
Total Distributions | | | (216 | ) | | | (379 | ) | |
Capital Share Transactions:(1) | |
Class A: | |
Subscribed | | | — | | | | 37 | | |
Distributions Reinvested | | | — | @ | | | — | | |
Redeemed | | | (31 | ) | | | (7 | ) | |
Class C: | |
Subscribed | | | 13 | | | | 25 | | |
Distributions Reinvested | | | — | @ | | | — | | |
Redeemed | | | (27 | ) | | | — | | |
Net Increase (Decrease) in Net Assets Resulting from Capital Share Transactions | | | (45 | ) | | | 55 | | |
Total Increase (Decrease) in Net Assets | | | 485 | | | | (51 | ) | |
Net Assets: | |
Beginning of Period | | | 9,754 | | | | 9,805 | | |
End of Period (Including Distributions in Excess of Net Investment Income of $(109) and $(29)) | | $ | 10,239 | | | $ | 9,754 | | |
(1) Capital Share Transactions: | |
Class A: | |
Shares Subscribed | | | — | | | | 4 | | |
Shares Issued on Distributions Reinvested | | | — | @@ | | | — | | |
Shares Redeemed | | | (3 | ) | | | (1 | ) | |
Net Increase (Decrease) in Class A Shares Outstanding | | | (3 | ) | | | 3 | | |
Class C: | |
Shares Subscribed | | | 1 | | | | 3 | | |
Shares Issued on Distributions Reinvested | | | — | @@ | | | — | | |
Shares Redeemed | | | (2 | ) | | | — | | |
Net Increase (Decrease) in Class C Shares Outstanding | | | (1 | ) | | | 3 | | |
@ Amount is less than $500.
@@ Amount is less than 500 shares.
The accompanying notes are an integral part of the financial statements.
16
Morgan Stanley Institutional Fund Trust
Annual Report — September 30, 2017
Financial Highlights
Strategic Income Portfolio
| | | Class I | |
| | | Year Ended September 30, | | Period from
December 30, 2014(2) to | |
Selected Per Share Data and Ratios | | 2017 | | 2016(1) | | September 30, 2015 | |
Net Asset Value, Beginning of Period | | $ | 9.69 | | | $ | 9.79 | | | $ | 10.00 | | |
Income (Loss) from Investment Operations: | |
Net Investment Income(3) | | | 0.26 | | | | 0.22 | | | | 0.14 | | |
Net Realized and Unrealized Gain (Loss) | | | 0.47 | | | | 0.06 | | | | (0.28 | ) | |
Total from Investment Operations | | | 0.73 | | | | 0.28 | | | | (0.14 | ) | |
Distributions from and/or in Excess of: | |
Net Investment Income | | | (0.21 | ) | | | (0.38 | ) | | | (0.07 | ) | |
Net Asset Value, End of Period | | $ | 10.21 | | | $ | 9.69 | | | $ | 9.79 | | |
Total Return(4) | | | 7.64 | % | | | 2.91 | % | | | (1.39 | )%(6) | |
Ratios and Supplemental Data: | |
Net Assets, End of Period (Thousands) | | $ | 10 | | | $ | 10 | | | $ | 10 | | |
Ratio of Expenses to Average Net Assets(8) | | | 0.99 | %(5) | | | 0.99 | %(5) | | | 0.98 | %(5)(7) | |
Ratio of Net Investment Income to Average Net Assets(8) | | | 2.63 | %(5) | | | 2.25 | %(5) | | | 1.81 | %(5)(7) | |
Ratio of Rebate from Morgan Stanley Affiliates to Average Net Assets | | | 0.01 | % | | | 0.01 | % | | | 0.02 | %(7) | |
Portfolio Turnover Rate | | | 64 | % | | | 47 | % | | | 39 | %(6) | |
(8) Supplemental Information on the Ratios to Average Net Assets: | |
Ratios Before Expense Limitation: | |
Expenses to Average Net Assets | | | 21.19 | % | | | 7.28 | % | | | 17.80 | %(7) | |
Net Investment Loss to Average Net Assets | | | (17.57 | )% | | | (4.04 | )% | | | (15.01 | )%(7) | |
(1) Reflects prior period custodian out-of-pocket expenses that were reimbursed in September 2016. The amount of the reimbursement was immaterial on a per share basis and did not impact the total return of Class I shares. The Ratio of Expenses to Average Net Assets and the Ratio of Net Investment Income to Average Net Assets would be unchanged as the reimbursement of custodian fees was offset against expense waivers/reimbursements with no impact to net expenses or net investment income.
(2) Commencement of Operations.
(3) Per share amount is based on average shares outstanding.
(4) Calculated based on the net asset value as of the last business day of the period.
(5) The Ratios of Expenses and Net Investment Income reflect the rebate of certain Fund expenses in connection with the investments in Morgan Stanley affiliates during the period. The effect of the rebate on the ratios is disclosed in the above table as "Ratio of Rebate from Morgan Stanley Affiliates to Average Net Assets."
(6) Not annualized.
(7) Annualized.
The accompanying notes are an integral part of the financial statements.
17
Morgan Stanley Institutional Fund Trust
Annual Report — September 30, 2017
Financial Highlights
Strategic Income Portfolio
| | | Class A | |
| | | Year Ended September 30, | | Period from
December 30, 2014(2) to | |
Selected Per Share Data and Ratios | | 2017 | | 2016(1) | | September 30, 2015 | |
Net Asset Value, Beginning of Period | | $ | 9.69 | | | $ | 9.79 | | | $ | 10.00 | | |
Income (Loss) from Investment Operations: | |
Net Investment Income(3) | | | 0.20 | | | | 0.18 | | | | 0.11 | | |
Net Realized and Unrealized Gain (Loss) | | | 0.49 | | | | 0.06 | | | | (0.27 | ) | |
Total from Investment Operations | | | 0.69 | | | | 0.24 | | | | (0.16 | ) | |
Distributions from and/or in Excess of: | |
Net Investment Income | | | (0.18 | ) | | | (0.34 | ) | | | (0.05 | ) | |
Net Asset Value, End of Period | | $ | 10.20 | | | $ | 9.69 | | | $ | 9.79 | | |
Total Return(4) | | | 7.18 | % | | | 2.51 | % | | | (1.56 | )%(6) | |
Ratios and Supplemental Data: | |
Net Assets, End of Period (Thousands) | | $ | 10 | | | $ | 40 | | | $ | 10 | | |
Ratio of Expenses to Average Net Assets(8) | | | 1.33 | %(5) | | | 1.34 | %(5) | | | 1.33 | %(5)(7) | |
Ratio of Net Investment Income to Average Net Assets(8) | | | 2.08 | %(5) | | | 1.86 | %(5) | | | 1.46 | %(5)(7) | |
Ratio of Rebate from Morgan Stanley Affiliates to Average Net Assets | | | 0.02 | % | | | 0.01 | % | | | 0.02 | %(7) | |
Portfolio Turnover Rate | | | 64 | % | | | 47 | % | | | 39 | %(6) | |
(8) Supplemental Information on the Ratios to Average Net Assets: | |
Ratios Before Expense Limitation: | |
Expenses to Average Net Assets | | | 9.96 | % | | | 6.73 | % | | | 18.06 | %(7) | |
Net Investment Loss to Average Net Assets | | | (6.55 | )% | | | (3.53 | )% | | | (15.27 | )%(7) | |
(1) Reflects prior period custodian out-of-pocket expenses that were reimbursed in September 2016. The amount of the reimbursement was immaterial on a per share basis and did not impact the total return of Class A shares. The Ratio of Expenses to Average Net Assets and the Ratio of Net Investment Income to Average Net Assets would be unchanged as the reimbursement of custodian fees was offset against expense waivers/reimbursements with no impact to net expenses or net investment income.
(2) Commencement of Operations.
(3) Per share amount is based on average shares outstanding.
(4) Calculated based on the net asset value which does not reflect sales charges, if applicable, as of the last business day of the period.
(5) The Ratios of Expenses and Net Investment Income reflect the rebate of certain Fund expenses in connection with the investments in Morgan Stanley affiliates during the period. The effect of the rebate on the ratios is disclosed in the above table as "Ratio of Rebate from Morgan Stanley Affiliates to Average Net Assets."
(6) Not annualized.
(7) Annualized.
The accompanying notes are an integral part of the financial statements.
18
Morgan Stanley Institutional Fund Trust
Annual Report — September 30, 2017
Financial Highlights
Strategic Income Portfolio
| | | Class C | |
| | | Year Ended September 30, | | Period from
April 30, 2015(2) to | |
Selected Per Share Data and Ratios | | 2017 | | 2016(1) | | September 30, 2015 | |
Net Asset Value, Beginning of Period | | $ | 9.66 | | | $ | 9.76 | | | $ | 10.06 | | |
Income (Loss) from Investment Operations: | |
Net Investment Income(3) | | | 0.13 | | | | 0.11 | | | | 0.05 | | |
Net Realized and Unrealized Gain (Loss) | | | 0.49 | | | | 0.06 | | | | (0.32 | ) | |
Total from Investment Operations | | | 0.62 | | | | 0.17 | | | | (0.27 | ) | |
Distributions from and/or in Excess of: | |
Net Investment Income | | | (0.11 | ) | | | (0.27 | ) | | | (0.03 | ) | |
Net Asset Value, End of Period | | $ | 10.17 | | | $ | 9.66 | | | $ | 9.76 | | |
Total Return(4) | | | 6.46 | % | | | 1.77 | % | | | (2.71 | )%(7) | |
Ratios and Supplemental Data: | |
Net Assets, End of Period (Thousands) | | $ | 22 | | | $ | 35 | | | $ | 10 | | |
Ratio of Expenses to Average Net Assets(9) | | | 2.09 | %(5) | | | 2.09 | %(5) | | | 2.10 | %(5)(8) | |
Ratio of Net Investment Income to Average Net Assets(9) | | | 1.33 | %(5) | | | 1.14 | %(5) | | | 1.13 | %(5)(8) | |
Ratio of Rebate from Morgan Stanley Affiliates to Average Net Assets | | | 0.01 | % | | | 0.01 | % | | | 0.00 | %(6)(8) | |
Portfolio Turnover Rate | | | 64 | % | | | 47 | % | | | 39 | %(7) | |
(9) Supplemental Information on the Ratios to Average Net Assets: | |
Ratios Before Expense Limitation: | |
Expenses to Average Net Assets | | | 13.41 | % | | | 28.93 | % | | | 19.28 | %(8) | |
Net Investment Loss to Average Net Assets | | | (9.99 | )% | | | (25.70 | )% | | | (16.05 | )%(8) | |
(1) Reflects prior period custodian out-of-pocket expenses that were reimbursed in September 2016. The amount of the reimbursement was immaterial on a per share basis and did not impact the total return of Class C shares. The Ratio of Expenses to Average Net Assets and the Ratio of Net Investment Income to Average Net Assets would be unchanged as the reimbursement of custodian fees was offset against expense waivers/reimbursements with no impact to net expenses or net investment income.
(2) Commencement of Offering.
(3) Per share amount is based on average shares outstanding.
(4) Calculated based on the net asset value which does not reflect sales charges, if applicable, as of the last business day of the period.
(5) The Ratios of Expenses and Net Investment Income reflect the rebate of certain Fund expenses in connection with the investments in Morgan Stanley affiliates during the period. The effect of the rebate on the ratios is disclosed in the above table as "Ratio of Rebate from Morgan Stanley Affiliates to Average Net Assets."
(6) Amount is less than 0.005%.
(7) Not annualized.
(8) Annualized.
The accompanying notes are an integral part of the financial statements.
19
Morgan Stanley Institutional Fund Trust
Annual Report — September 30, 2017
Financial Highlights
Strategic Income Portfolio
| | | Class IS | |
| | | Year Ended September 30, | | Period from
December 30, 2014(2) to | |
Selected Per Share Data and Ratios | | 2017 | | 2016(1) | | September 30, 2015 | |
Net Asset Value, Beginning of Period | | $ | 9.69 | | | $ | 9.79 | | | $ | 10.00 | | |
Income (Loss) from Investment Operations: | |
Net Investment Income(3) | | | 0.27 | | | | 0.23 | | | | 0.14 | | |
Net Realized and Unrealized Gain (Loss) | | | 0.48 | | | | 0.05 | | | | (0.27 | ) | |
Total from Investment Operations | | | 0.75 | | | | 0.28 | | | | (0.13 | ) | |
Distributions from and/or in Excess of: | |
Net Investment Income | | | (0.22 | ) | | | (0.38 | ) | | | (0.08 | ) | |
Net Asset Value, End of Period | | $ | 10.22 | | | $ | 9.69 | | | $ | 9.79 | | |
Total Return(4) | | | 7.80 | % | | | 2.96 | % | | | (1.37 | )%(6) | |
Ratios and Supplemental Data: | |
Net Assets, End of Period (Thousands) | | $ | 10,197 | | | $ | 9,669 | | | $ | 9,775 | | |
Ratio of Expenses to Average Net Assets(8) | | | 0.94 | %(5) | | | 0.94 | %(5) | | | 0.93 | %(5)(7) | |
Ratio of Net Investment Income to Average Net Assets(8) | | | 2.68 | %(5) | | | 2.35 | %(5) | | | 1.88 | %(5)(7) | |
Ratio of Rebate from Morgan Stanley Affiliates to Average Net Assets | | | 0.01 | % | | | 0.01 | % | | | 0.02 | %(7) | |
Portfolio Turnover Rate | | | 64 | % | | | 47 | % | | | 39 | %(6) | |
(8) Supplemental Information on the Ratios to Average Net Assets: | |
Ratios Before Expense Limitation: | |
Expenses to Average Net Assets | | | 3.79 | % | | | 3.45 | % | | | 4.04 | %(7) | |
Net Investment Loss to Average Net Assets | | | (0.17 | )% | | | (0.16 | )% | | | (1.23 | )%(7) | |
(1) Reflects prior period custodian out-of-pocket expenses that were reimbursed in September 2016. The amount of the reimbursement was immaterial on a per share basis and did not impact the total return of Class IS shares. The Ratio of Expenses to Average Net Assets and the Ratio of Net Investment Income to Average Net Assets would be unchanged as the reimbursement of custodian fees was offset against expense waivers/reimbursements with no impact to net expenses or net investment income.
(2) Commencement of Operations.
(3) Per share amount is based on average shares outstanding.
(4) Calculated based on the net asset value as of the last business day of the period.
(5) The Ratios of Expenses and Net Investment Income reflect the rebate of certain Fund expenses in connection with the investments in Morgan Stanley affiliates during the period. The effect of the rebate on the ratios is disclosed in the above table as "Ratio of Rebate from Morgan Stanley Affiliates to Average Net Assets."
(6) Not annualized.
(7) Annualized.
The accompanying notes are an integral part of the financial statements.
20
Morgan Stanley Institutional Fund Trust
Annual Report — September 30, 2017
Notes to Financial Statements
Morgan Stanley Institutional Fund Trust ("Trust") is registered under the Investment Company Act of 1940, as amended (the "Act"), as an open-end management investment company. The Trust is comprised of nine separate, active funds (individually referred to as a "Fund", collectively as the "Funds"). The Trust applies investment company accounting and reporting guidance. All Funds are considered diversified for purposes of the Act.
The accompanying financial statements relate to the Strategic Income Portfolio. The Fund seek a total return comprised of income and capital appreciation. The Fund offers four classes of shares — Class I, Class A, Class C and Class IS.
A. Significant Accounting Policies: The following significant accounting policies are in conformity with U.S. generally accepted accounting principles ("GAAP"). Such policies are consistently followed by the Trust in the preparation of its financial statements. GAAP may require management to make estimates and assumptions that affect the reported amounts and disclosures in the financial statements. Actual results may differ from those estimates.
1. Security Valuation: (1) Certain portfolio securities may be valued by an outside pricing service/vendor approved by the Trust's Board of Trustees (the "Trustees"). The pricing service/vendor may employ a pricing model that takes into account, among other things, bids, yield spreads, and/or other market data and specific security characteristics. Alternatively, if a valuation is not available from an outside pricing service/vendor, and the security trades on an exchange, the security may be valued at its latest reported sale price (or at the exchange official closing price if such exchange reports an official closing price), prior to the time when assets are valued. If there are no sales on a given day and if there is no official exchange closing price for that day, the security is valued at the mean between the last reported bid and asked prices if such bid and asked prices are available in the relevant exchanges; (2) futures are valued at the settlement price on the exchange on which they trade or, if a settlement price is unavailable, at the last sale price on the exchange; (3) over-the-counter ("OTC") swaps may be valued by an outside pricing service approved by the Trustees or quotes from a broker or dealer. Swaps cleared on a clearinghouse or exchange may be valued using the closing price provided by the clearinghouse or exchange; (4) when market quotations are not readily available, including circumstances under which Morgan Stanley Investment Manage-
ment Inc. (the "Adviser") or Morgan Stanley Investment Management Limited ("MSIM Limited") (the "Sub-Adviser"), a wholly-owned subsidiary of Morgan Stanley, determines that the closing price, last sale price or the mean between the last reported bid and asked prices are not reflective of a security's market value, portfolio securities are valued at their fair value as determined in good faith under procedures established by and under the general supervision of the Trustees. Occasionally, developments affecting the closing prices of securities and other assets may occur between the times at which valuations of such securities are determined (that is, close of the foreign market on which the securities trade) and the close of business of the New York Stock Exchange ("NYSE"). If developments occur during such periods that are expected to materially affect the value of such securities, such valuations may be adjusted to reflect the estimated fair value of such securities as of the close of the NYSE, as determined in good faith by the Trustees or by the Adviser using a pricing service and/or procedures approved by the Trustees; (5) quotations of foreign portfolio securities, other assets and liabilities and forward contracts stated in foreign currency are translated into U.S. dollar equivalents at the prevailing market rates prior to the close of the NYSE; and (6) investments in mutual funds, including the Morgan Stanley Institutional Liquidity Funds, are valued at the net asset value ("NAV") as of the close of each business day.
The Trustees have responsibility for determining in good faith the fair value of the investments, and the Trustees may appoint others, such as the Trust's Adviser or a valuation committee, to assist the Trustees in determining fair value and to make the actual calculations pursuant to the fair valuation methodologies previously approved by the Trustees. Under procedures approved by the Trustees, the Trust's Adviser has formed a Valuation Committee whose members are approved by the Trustees. The Valuation Committee provides administration and oversight of the Trust's valuation policies and procedures, which are reviewed at least annually by the Trustees. These procedures allow the Trust to utilize independent pricing services, quotations from securities and financial instrument dealers, and other market sources to determine fair value.
The Trust has procedures to determine the fair value of securities and other financial instruments for which
21
Morgan Stanley Institutional Fund Trust
Annual Report — September 30, 2017
Notes to Financial Statements (cont'd)
market prices are not readily available. Under these procedures, the Valuation Committee convenes on a regular and ad hoc basis to review such securities and considers a number of factors, including valuation methodologies and significant unobservable valuation inputs, when arriving at fair value. The Valuation Committee may employ a market-based approach which may use related or comparable assets or liabilities, recent transactions, market multiples, book values, and other relevant information for the investment to determine the fair value of the investment. An income-based valuation approach may also be used in which the anticipated future cash flows of the investment are discounted to calculate fair value. Discounts may also be applied due to the nature or duration of any restrictions on the disposition of the investments. Due to the inherent uncertainty of valuations of such investments, the fair values may differ significantly from the values that would have been used had an active market existed. The Valuation Committee employs various methods for calibrating these valuation approaches including a regular review of valuation methodologies, key inputs and assumptions, transactional back-testing or disposition analysis, and reviews of any related market activity.
2. Fair Value Measurement: Financial Accounting Standards Board ("FASB") Accounting Standards CodificationTM ("ASC") 820, "Fair Value Measurement" ("ASC 820"), defines fair value as the value that the Fund would receive to sell an investment or pay to transfer a liability in a timely transaction with an independent buyer in the principal market, or in the absence of a principal market, the most advantageous market for the investment or liability. ASC 820 establishes a three-tier hierarchy to distinguish between (1) inputs that reflect the assumptions market participants would use in valuing an asset or liability developed based on market data obtained from sources independent of the reporting entity (observable inputs) and (2) inputs that reflect the reporting entity's own assumptions about the assumptions market participants would use in valuing an asset or liability developed based on the best information available in the circumstances (unobservable inputs) and to establish classification of fair value measurements for disclosure purposes. Various inputs are used in determining the value of the Fund's in-
vestments. The inputs are summarized in the three broad levels listed below.
• Level 1 – unadjusted quoted prices in active markets for identical investments
• Level 2 – other significant observable inputs (including quoted prices for similar investments, interest rates, prepayment speeds, credit risk, etc.)
• Level 3 – significant unobservable inputs including the Fund's own assumptions in determining the fair value of investments. Factors considered in making this determination may include, but are not limited to, information obtained by contacting the issuer, analysts, or the appropriate stock exchange (for exchange-traded securities), analysis of the issuer's financial statements or other available documents and, if necessary, available information concerning other securities in similar circumstances
The inputs or methodology used for valuing securities are not necessarily an indication of the risk associated with investing in those securities and the determination of the significance of a particular input to the fair value measurement in its entirety requires judgment and considers factors specific to each security.
The following is a summary of the inputs used to value the Fund's investments as of September 30, 2017.
Investment Type | | Level 1
Unadjusted
quoted
prices
(000) | | Level 2
Other
significant
observable
inputs
(000) | | Level 3
Significant
unobservable
inputs
(000) | | Total
(000) | |
Assets: | |
Fixed Income Securities | |
Asset-Backed Securities | | $ | — | | | $ | 941 | | | $ | — | | | $ | 941 | | |
Collateralized Mortgage
Obligations — Agency
Collateral Series | | | — | | | | 13 | | | | — | | | | 13 | | |
Commercial
Mortgage-Backed
Securities | | | — | | | | 404 | | | | — | | | | 404 | | |
Corporate Bonds | | | — | | | | 4,018 | | | | — | | | | 4,018 | | |
Mortgages — Other | | | — | | | | 1,000 | | | | — | | | | 1,000 | | |
Sovereign | | | — | | | | 1,706 | | | | — | | | | 1,706 | | |
U.S. Treasury Securities | | | — | | | | 913 | | | | — | | | | 913 | | |
Total Fixed Income
Securities | | | — | | | | 8,995 | | | | — | | | | 8,995 | | |
22
Morgan Stanley Institutional Fund Trust
Annual Report — September 30, 2017
Notes to Financial Statements (cont'd)
Investment Type | | Level 1
Unadjusted
quoted
prices
(000) | | Level 2
Other
significant
observable
inputs
(000) | | Level 3
Significant
unobservable
inputs
(000) | | Total
(000) | |
Short-Term Investments | |
Investment Company | | $ | 976 | | | $ | — | | | $ | — | | | $ | 976 | | |
U.S. Treasury Security | | | — | | | | 38 | | | | — | | | | 38 | | |
Total Short-Term
Investments | | | 976 | | | | 38 | | | | — | | | | 1,014 | | |
Foreign Currency Forward
Exchange Contracts | | | — | | | | 35 | | | | — | | | | 35 | | |
Futures Contracts | | | 44 | | | | — | | | | — | | | | 44 | | |
Interest Rate Swap
Agreement | | | — | | | | 1 | | | | — | | | | 1 | | |
Total Assets | | | 1,020 | | | | 9,069 | | | | — | | | | 10,089 | | |
Liabilities: | |
Foreign Currency Forward
Exchange Contracts | | | — | | | | (7 | ) | | | — | | | | (7 | ) | |
Credit Default Swap
Agreements | | | — | | | | (48 | ) | | | — | | | | (48 | ) | |
Interest Rate Swap
Agreements | | | — | | | | (7 | ) | | | — | | | | (7 | ) | |
Total Liabilities | | | — | | | | (62 | ) | | | — | | | | (62 | ) | |
Total | | $ | 1,020 | | | $ | 9,007 | | | $ | — | | | $ | 10,027 | | |
Transfers between investment levels may occur as the markets fluctuate and/or the availability of data used in an investment's valuation changes. The Fund recognizes transfers between the levels as of the end of the period. As of September 30, 2017, the Fund did not have any investments transfer between investment levels.
3. Foreign Currency Translation and Foreign Investments: The books and records of the Fund are maintained in U.S. dollars. Foreign currency amounts are translated into U.S. dollars as follows:
– investments, other assets and liabilities at the prevailing rate of exchange on the valuation date;
– investment transactions and investment income at the prevailing rates of exchange on the dates of such transactions.
Although the net assets of the Fund are presented at the foreign exchange rates and market values at the close of the period, the Fund does not isolate that portion of the results of operations arising as a result of changes in the foreign exchange rates from the fluctuations arising from changes in the market prices of securities held at period end. Similarly, the Fund does not isolate the effect of changes in foreign exchange rates from the fluctuations arising from changes in the market prices of securities sold during the period. Accordingly, realized
and unrealized foreign currency gains (losses) on investments in securities are included in the reported net realized and unrealized gains (losses) on investment transactions and balances. However, pursuant to U.S. federal income tax regulations, gains and losses from certain foreign currency transactions and the foreign currency portion of gains and losses realized on sales and maturities of foreign denominated debt securities are treated as ordinary income for U.S. federal income tax purposes.
Net realized gains (losses) on foreign currency transactions represent net foreign exchange gains (losses) from currency gains (losses) realized between the trade and settlement dates on securities transactions, and the difference between the amount of investment income and foreign withholding taxes recorded on the Fund's books and the U.S. dollar equivalent amounts actually received or paid. Net unrealized currency gains (losses) from valuing foreign currency denominated assets and liabilities at period end exchange rates are reflected as a component of unrealized appreciation (depreciation) in the Statement of Assets and Liabilities. The change in unrealized currency gains (losses) on foreign currency translations for the period is reflected in the Statement of Operations.
Foreign security and currency transactions may involve certain considerations and risks not typically associated with those of U.S. dollar denominated transactions as a result of, among other factors, fluctuations of exchange rates in relation to the U.S. dollar, the possibility of lower levels of governmental supervision and regulation of foreign securities markets and the possibility of political or economic instability.
Governmental approval for foreign investments may be required in advance of making an investment under certain circumstances in some countries, and the extent of foreign investments in domestic companies may be subject to limitation in other countries. Foreign ownership limitations also may be imposed by the charters of individual companies to prevent, among other concerns, violations of foreign investment limitations. As a result, an additional class of shares (identified as "Foreign" in the Portfolio of Investments) may be created and offered for investment. The "local" and "foreign shares" market values may differ. In the absence of trading of the foreign shares in such markets, the Fund values the
23
Morgan Stanley Institutional Fund Trust
Annual Report — September 30, 2017
Notes to Financial Statements (cont'd)
foreign shares at the closing exchange price of the local shares.
4. Derivatives: The Fund may, but is not required to, use derivative instruments for a variety of purposes, including hedging, risk management, portfolio management or to earn income. Derivatives are financial instruments whose value is based, in part, on the value of an underlying asset, interest rate, index or financial instrument. Prevailing interest rates and volatility levels, among other things, also affect the value of derivative instruments. A derivative instrument often has risks similar to its underlying asset and may have additional risks, including imperfect correlation between the value of the derivative and the underlying asset, risks of default by the counterparty to certain transactions, magnification of losses incurred due to changes in the market value of the securities, instruments, indices or interest rates to which the derivative instrument relates, risks that the transactions may not be liquid and risks arising from margin requirements. The use of derivatives involves risks that are different from, and possibly greater than, the risks associated with other portfolio investments. Derivatives may involve the use of highly specialized instruments that require investment techniques and risk analyses different from those associated with other portfolio investments. All of the Fund's holdings, including derivative instruments, are marked-to-market each day with the change in value reflected in unrealized appreciation (depreciation). Upon disposition, a realized gain or loss is recognized.
Certain derivative transactions may give rise to a form of leverage. Leverage magnifies the potential for gain and the risk of loss. Leverage associated with derivative transactions may cause the Fund to liquidate portfolio positions when it may not be advantageous to do so to satisfy its obligations or to meet earmarking or segregation requirements, pursuant to applicable Securities and Exchange Commission rules and regulations, or may cause the Fund to be more volatile than if the Fund had not been leveraged. Although the Adviser and/or Sub-Adviser seek to use derivatives to further the Fund's investment objectives, there is no assurance that the use of derivatives will achieve this result.
Following is a description of the derivative instruments and techniques that the Fund used during the period and their associated risks:
Futures: A futures contract is a standardized, exchange-traded agreement to buy or sell a specific quantity of an underlying asset, reference rate or index at a specific price at a specific future time. The value of a futures contract tends to increase and decrease in tandem with the value of the underlying instrument. Depending on the terms of the particular contract, futures contracts are settled through either physical delivery of the underlying instrument on the settlement date or by payment of a cash settlement amount on the settlement date. During the period the futures contract is open, payments are received from or made to the broker based upon changes in the value of the contract (the variation margin). A decision as to whether, when and how to use futures contracts involves the exercise of skill and judgment and even a well-conceived futures transaction may be unsuccessful because of market behavior or unexpected events. In addition to the derivatives risks discussed above, the prices of futures contracts can be highly volatile, using futures contracts can lower total return, and the potential loss from futures contracts can exceed the Fund's initial investment in such contracts. No assurance can be given that a liquid market will exist for any particular futures contract at any particular time. There is also the risk of loss by the Fund of margin deposits in the event of bankruptcy of a broker with which the Fund has open positions in the futures contract.
Swaps: The Fund may enter into OTC swap contracts or cleared swap transactions. A swap contract is an agreement between two parties pursuant to which the parties exchange payments at specified dates on the basis of a specified notional amount, with the payments calculated by reference to specified securities, indices, reference rates, currencies or other instruments. Typically swap agreements provide that when the period payment dates for both parties are the same, the payments are made on a net basis (i.e., the two payment streams are netted out, with only the net amount paid by one party to the other). The Fund's obligations or rights under a swap contract entered into on a net basis will generally be equal only to the net amount to be paid or received under the agreement, based on the relative values of the positions held by each party. Cleared swap transactions
24
Morgan Stanley Institutional Fund Trust
Annual Report — September 30, 2017
Notes to Financial Statements (cont'd)
may help reduce counterparty credit risk. In a cleared swap, the Fund's ultimate counterparty is a clearinghouse rather than a swap dealer, bank or other financial institution. OTC swap agreements are not entered into or traded on exchanges and often there is no central clearing or guaranty function for OTC swaps. These OTC swaps are often subject to credit risk or the risk of default or non-performance by the counterparty. Both OTC and cleared swaps could result in losses if interest rates, foreign currency exchange rates or other factors are not correctly anticipated by the Fund or if the reference index, security or investments do not perform as expected. During the period swap agreements are open, payments are received from or made to the clearinghouse or counterparty based upon changes in the value of the contract (variation margin). The Dodd-Frank Wall Street Reform and Consumer Protection Act and related regulatory developments require the clearing and exchange-trading of certain standardized swap transactions. Mandatory exchange-trading and clearing is occurring on a phased-in basis.
The Fund's use of swaps during the period included those based on the credit of an underlying security commonly referred to as "credit default swaps." The Fund may be either the buyer or seller in a credit default swap. Where the Fund is the buyer of a credit default swap contract, it would typically be entitled to receive the par (or other agreed-upon) value of a referenced debt obligation from the counterparty to the contract only in the event of a default or similar event by the issuer of the debt obligation. If no default occurs, the Fund would have paid to the counterparty a periodic stream of payments over the term of the contract and received no benefit from the contract. When the Fund is the seller of a credit default swap contract, it typically receives the stream of payments but is obligated to pay an amount equal to the par (or other agreed-upon) value of a referenced debt obligation upon the default or similar event by the issuer of the referenced debt obligation. The use of credit default swaps could result in losses to the Fund if the Adviser fails to correctly evaluate the creditworthiness of the issuer of the referenced debt obligation.
If the Fund is a seller of protection and a credit event occurs, as defined under the terms of that particular swap agreement, the Fund will either (i) pay to the buyer of protection an amount equal to the notional
amount of the swap agreement and take delivery of the referenced obligation, other deliverable obligations or underlying securities comprising the referenced index or (ii) pay a net settlement amount in the form of cash or securities equal to the notional amount of the swap agreement less the recovery value of the referenced obligation or underlying securities comprising the referenced index. If the Fund is a buyer of protection and a credit event occurs, as defined under the terms of that particular swap agreement, the Fund will either (i) receive from the seller of protection an amount equal to the notional amount of the swap agreement and deliver the referenced obligation, other deliverable obligations or underlying securities comprising the referenced index or (ii) receive a net settlement amount in the form of cash or securities equal to the notional amount of the swap agreement less the recovery value of the referenced obligation or underlying securities comprising the referenced index. Recovery values are estimated by market makers considering either industry standard recovery rates or entity specific factors and considerations until a credit event occurs. If a credit event has occurred, the recovery value is determined by a facilitated auction whereby a minimum number of allowable broker bids, together with a specified valuation method, are used to calculate the settlement value. The Fund's maximum risk of loss from counterparty risk, either as the protection seller or as the protection buyer, is the fair value of the swap agreement.
The current credit rating of each individual issuer is listed in the table following the Portfolio of Investments and serves as an indicator of the current status of the payment/performance risk of the credit derivative. Alternatively, for credit default swaps on an index of credits, the quoted market prices and current values serve as an indicator of the current status of the payment/performance risk of the credit derivative. Generally, lower credit ratings and increasing market values, in absolute terms, represent a deterioration of the credit and a greater likelihood of an adverse credit event of the issuer.
When the Fund has an unrealized loss on a swap agreement, the Fund has instructed the custodian to pledge cash or liquid securities as collateral with a value approximately equal to the amount of the unrealized loss. Collateral pledges are monitored and subsequently adjusted
25
Morgan Stanley Institutional Fund Trust
Annual Report — September 30, 2017
Notes to Financial Statements (cont'd)
if and when the swap valuations fluctuate. If applicable, cash collateral is included with "Due from (to) Broker" in the Statement of Assets and Liabilities.
Upfront payments paid or received by the Fund will be reflected as an asset or liability, respectively, in the Statement of Assets and Liabilities.
Foreign Currency Forward Exchange Contracts: In connection with its investments in foreign securities, the Fund also entered into contracts with banks, brokers or dealers to purchase or sell securities or foreign currencies at a future date. A foreign currency forward exchange contract ("currency contract") is a negotiated agreement between the contracting parties to exchange a specified amount of currency at a specified future time at a specified rate. The rate can be higher or lower than the spot rate between the currencies that are the subject of the contract. Currency contracts may be used to protect against uncertainty in the level of future foreign currency exchange rates or to gain or modify exposure to a particular currency. In addition, the Fund may use cross currency hedging or proxy hedging with respect to currencies in which the Fund has or expects to have portfolio or currency exposure. Cross currency hedges involve the sale of one currency against the positive exposure to a different currency and may be used for hedging purposes or to establish an active exposure to the exchange rate between any two currencies. To the extent hedged by the use of currency contracts, the precise matching of the currency contract amounts and the value of the securities involved will not generally be possible because the future value of such securities in foreign currencies will change as a consequence of market movements in the value of those securities between the date on which the contract is entered into and the date it matures. Furthermore, such transactions may reduce or preclude the opportunity for gain if the value of the currency should move in the direction opposite to the position taken. There is additional risk to the extent that currency contracts create exposure to currencies in which the Fund's securities are not denominated. Unanticipated changes in currency prices may result in poorer overall performance for the Fund than if it had not entered into such contracts. The use of currency contracts involves the risk of loss from the insolvency or bankruptcy of the counterparty to the contract or the failure of the counterparty to make payments or otherwise comply with the
terms of the contract. A currency contract is marked-to-market daily and the change in market value is recorded by the Fund as unrealized gain or loss. The Fund records realized gains (losses) when the currency contract is closed equal to the difference between the value of the currency contract at the time it was opened and the value at the time it was closed.
FASB ASC 815, "Derivatives and Hedging" ("ASC 815"), is intended to improve financial reporting about derivative instruments by requiring enhanced disclosures to enable investors to better understand how and why the Fund uses derivative instruments, how these derivative instruments are accounted for and their effects on the Fund's financial position and results of operations.
The following tables set forth the fair value of the Fund's derivative contracts by primary risk exposure as of September 30, 2017.
| | | Asset Derivatives
Statement of Assets and
Liabilities Location | | Primary Risk
Exposure | | Value
(000) | |
Foreign Currency
Forward Exchange
Contracts | | Unrealized Appreciation on
Foreign Currency Forward
Exchange Contracts | | Currency Risk | | $ | 35 | | |
Futures Contracts
| | Variation Margin on
Futures Contracts | | Interest Rate Risk | | | 44 | (a) | |
Swap Agreements
| | Variation Margin on
Swap Agreements | | Interest Rate Risk | | | 1 | (a) | |
Total | | | | | | $ | 80 | | |
| | | Liability Derivatives
Statement of Assets and
Liabilities Location | | Primary Risk
Exposure | | Value
(000) | |
Foreign Currency
Forward Exchange
Contracts | | Unrealized Depreciation on
Foreign Currency Forward
Exchange Contracts | | Currency Risk | | $ | (7 | ) | |
Swap Agreements
| | Unrealized Depreciation on
Swap Agreements | | Credit Risk | | | (48 | ) | |
Swap Agreements
| | Variation Margin on
Swap Agreements | | Credit Risk | | | (— | @)(a) | |
Swap Agreements
| | Variation Margin on
Swap Agreements | | Interest Rate Risk | | | (7 | )(a) | |
Total | | | | | | $ | (62 | ) | |
@ Amount is less than $500.
(a) This amount represents the cumulative appreciation (depreciation) as reported in the Portfolio of Investments. The Statement of Assets and Liabilities only reflects the current day's net variation margin.
The following tables set forth by primary risk exposure the Fund's realized gains (losses) and change in unrealized appreciation (depreciation) by type of derivative
26
Morgan Stanley Institutional Fund Trust
Annual Report — September 30, 2017
Notes to Financial Statements (cont'd)
contract for the year ended September 30, 2017 in accordance with ASC 815.
| | | Realized Gain (Loss) | |
Primary Risk Exposure | | Derivative Type | | Value
(000) | |
Currency Risk | | Foreign Currency Forward
Exchange Contracts | | $ | (57 | ) | |
Interest Rate Risk | | Futures Contracts | | | 93 | | |
Credit Risk | | Swap Agreements | | | (3 | ) | |
Interest Rate Risk | | Swap Agreements | | | (3 | ) | |
Total | | | | $ | 30 | | |
Change in Unrealized Appreciation (Depreciation) | |
Primary Risk Exposure | | Derivative Type | | Value
(000) | |
Currency Risk | | Foreign Currency Forward
Exchange Contracts | | $ | 16 | | |
Interest Rate Risk | | Futures Contracts | | | 43 | | |
Credit Risk | | Swap Agreements | | | (24 | ) | |
Interest Rate Risk | | Swap Agreements | | | (6 | ) | |
Total | | | | $ | 29 | | |
At September 30, 2017, the Fund's derivative assets and liabilities are as follows:
Gross Amounts of Assets and Liabilities Presented in the
Statement of Assets and Liabilities | |
Derivatives(b) | | Assets(c)
(000) | | Liabilities(c)
(000) | |
Foreign Currency Forward Exchange Contracts | | $ | 35 | | | $ | (7 | ) | |
Swap Agreements | | | — | | | | (48 | ) | |
Total | | $ | 35 | | | $ | (55 | ) | |
(b) Excludes exchange traded derivatives.
(c) Absent an event of default or early termination, OTC derivative assets and liabilities are presented gross and not offset in the Statement of Assets and Liabilities.
The Fund typically enters into International Swaps and Derivatives Association, Inc. Master Agreements ("ISDA Master Agreements") or similar master agreements (collectively, "Master Agreements") with its contract counterparties for certain OTC derivatives in order to, among other things, reduce its credit risk to counterparties. ISDA Master Agreements include provisions for general obligations, representations, collateral and events of default or termination. Under an ISDA Master Agreement, the Fund typically may offset with the counterparty certain OTC derivative financial instruments' payables and/or receivables with collateral held and/or posted and create one single net payment (close-out netting) in the event of default, termination and/or potential deterioration in the credit quality of the counterparty. Various Master Agreements govern the terms of certain transactions with counterparties, including transactions such as swap, forward, repurchase and reverse repurchase agreements. These Master Agreements
typically attempt to reduce the counterparty risk associated with such transactions by specifying credit protection mechanisms and providing standardization that improves legal certainty. Cross-termination provisions under Master Agreements typically provide that a default in connection with one transaction between the Fund and a counterparty gives the non-defaulting party the right to terminate any other transactions in place with the defaulting party to create one single net payment due to/due from the defaulting party and may be a feature in certain Master Agreements. In the event the Fund exercises its right to terminate a Master Agreement after a counterparty experiences a termination event as defined in the Master Agreement, the return of collateral with market value in excess of the Fund's net liability may be delayed or denied.
The following tables present derivative financial instruments that are subject to enforceable netting arrangements as of September 30, 2017.
Gross Amounts Not Offset in the Statement of Assets and Liabilities | |
Counterparty | | Gross Asset
Derivatives
Presented in
Statement of
Assets and
Liabilities
(000) | | Financial
Instrument
(000) | | Collateral
Received
(000) | | Net Amount
(not less
than $0)
(000) | |
Australia and New Zealand
Banking Group | | $ | 5 | | | $ | (— | @) | | $ | — | | | $ | 5 | | |
Barclays Bank PLC | | | 6 | | | | — | | | | — | | | | 6 | | |
Citibank NA | | | 19 | | | | (— | @) | | | — | | | | 19 | | |
JPMorgan Chase Bank NA | | | 5 | | | | (3 | ) | | | — | | | | 2 | | |
Total | | $ | 35 | | | $ | (3 | ) | | $ | — | | | $ | 32 | | |
Gross Amounts Not Offset in the Statement of Assets and Liabilities | |
Counterparty | | Gross Liability
Derivatives
Presented in
Statement of
Assets and
Liabilities
(000) | | Financial
Instrument
(000) | | Collateral
Pledged
(000) | | Net Amount
(not less
than $0)
(000) | |
Australia and New Zealand
Banking Group | | $ | — | @ | | $ | (— | @) | | $ | — | | | $ | 0 | | |
Citibank NA | | | — | @ | | | (— | @) | | | — | | | | 0 | | |
Deutsche Bank AG | | | 3 | | | | — | | | | — | | | | 3 | | |
Goldman Sachs International | | | 45 | | | | — | | | | — | | | | 45 | | |
HSBC Bank PLC | | | 4 | | | | — | | | | — | | | | 4 | | |
JPMorgan Chase Bank NA | | | 3 | | | | (3 | ) | | | — | | | | 0 | | |
State Street Bank and Trust Co. | | | — | @ | | | — | | | | — | | | | — | @ | |
Total | | $ | 55 | | | $ | (3 | ) | | $ | — | | | $ | 52 | | |
@ Amount is less than $500.
27
Morgan Stanley Institutional Fund Trust
Annual Report — September 30, 2017
Notes to Financial Statements (cont'd)
For the year ended September 30, 2017, the approximate average monthly amount outstanding for each derivative type is as follows:
Foreign Currency Forward Exchange Contracts: | |
Average monthly principal amount | | $ | 6,293,000 | | |
Futures Contracts: | |
Average monthly original value | | $ | 3,943,000 | | |
Swap Agreements: | |
Average monthly notional amount | | $ | 1,017,000 | | |
5. Indemnifications: The Trust enters into contracts that contain a variety of indemnifications. The Trust's maximum exposure under these arrangements is unknown. However, the Trust has not had prior claims or losses pursuant to these contracts and expects the risk of loss to be remote.
6. Dividends and Distributions to Shareholders: Dividends and distributions to shareholders are recorded on the ex-dividend date. Dividends from net investment income, if any, are declared and paid quarterly. Net realized capital gains, if any, are distributed at least annually.
7. Security Transactions, Income and Expenses: Security transactions are accounted for on the trade date (date the order to buy or sell is executed). Realized gains and losses on the sale of investment securities are determined on the specific identified cost method. Dividend income and other distributions are recorded on the ex-dividend date (except for certain foreign dividends which may be recorded as soon as the Fund is informed of such dividends) net of applicable withholding taxes. Interest income is recognized on the accrual basis except where collection is in doubt. Discounts are accreted and premiums are amortized over the life of the respective securities. Most expenses of the Trust can be directly attributed to a particular Fund. Expenses which cannot be directly attributed are apportioned among the Funds based upon relative net assets or other appropriate methods. Income, expenses (other than class specific expenses — distribution and shareholder services, transfer agency and sub transfer agency fees) and realized and unrealized gains or losses are allocated to each class of shares based upon their relative net assets.
B. Advisory/Sub-Advisory Fees: The Adviser, a wholly-owned subsidiary of Morgan Stanley, provides the Fund with advisory services under the terms of an Investment Advisory
Agreement, paid quarterly, at the annual rate based on the daily net assets as follows:
First $500
million | | Over $500
million | |
| | 0.40 | % | | | 0.35 | % | |
For the year ended September 30, 2017, the advisory fee rate (net of waivers/rebate) was equivalent to an annual effective rate of 0.00% of the Fund's average daily net assets.
The Adviser has agreed to reduce its advisory fee and/or reimburse the Fund so that total annual portfolio operating expenses, excluding certain investment related expenses, taxes, interest and other extraordinary expenses (including litigation), will not exceed 1.00% for Class I shares, 1.35% for Class A shares, 2.10% for Class C shares and 0.95% for Class IS shares. The fee waivers and/or expense reimbursements will continue for at least one year from the date of the Fund's prospectus or until such time as the Trustees act to discontinue all or a portion of such waivers and/or reimbursements when they deem such action is appropriate. For the year ended September 30, 2017, approximately $40,000 of advisory fees were waived and approximately $248,000 of other expenses were reimbursed by the Adviser pursuant to this arrangement.
The Adviser has entered into a Sub-Advisory Agreement with the Sub-Adviser, a wholly-owned subsidiary of Morgan Stanley. The Sub-Adviser provides the Fund with advisory services subject to the overall supervision of the Adviser and the Fund's Officers and Trustees. The Adviser pays the Sub-Adviser on a monthly basis a portion of the net advisory fees the Adviser receives from the Fund.
C. Administration Fees: The Adviser also serves as Administrator to the Trust and provides administrative services pursuant to an Administration Agreement for an annual fee, accrued daily and paid monthly, of 0.08% of the Fund's average daily net assets. Under a Sub-Administration Agreement between the Administrator and State Street Bank and Trust Company ("State Street"), State Street provides certain administrative services to the Trust. For such services, the Administrator pays State Street a portion of the fee the Administrator receives from the Fund.
D. Distribution and Shareholder Services Fees: Morgan Stanley Distribution, Inc. ("MSDI" or the "Distributor"), a wholly-owned subsidiary of the Adviser and Sub-Adviser, and an indirect subsidiary of Morgan Stanley, serves as the Trust's Distributor of Fund shares pursuant to a Distribution Agreement. The Trust has adopted a Shareholder Services Plan with respect to Class A shares pursuant to Rule 12b-1
28
Morgan Stanley Institutional Fund Trust
Annual Report — September 30, 2017
Notes to Financial Statements (cont'd)
under the Act. Under the Shareholder Services Plan, the Fund pays the Distributor a shareholder services fee, accrued daily and paid monthly, at an annual rate of 0.25% of the Fund's average daily net assets attributable to Class A shares.
The Trust has adopted a Distribution and Shareholder Services Plan with respect to Class C shares pursuant to Rule 12b-1 under the Act. Under the Distribution and Shareholder Services Plan, the Fund pays the Distributor a distribution fee, accrued daily and paid monthly, at an annual rate of 0.75% and a shareholder services fee, accrued daily and paid monthly, at an annual rate of 0.25% of the Fund's average daily net assets attributable to Class C shares.
The distribution and shareholder services fees are used to support the expenses associated with servicing and maintaining accounts. The Distributor may compensate other parties for providing shareholder support services to investors who purchase Class A and Class C shares.
E. Dividend Disbursing and Transfer Agent: The Trust's dividend disbursing and transfer agent is Boston Financial Data Services, Inc. ("BFDS"). Pursuant to a Transfer Agency Agreement, the Trust pays BFDS a fee based on the number of classes, accounts and transactions relating to the Funds of the Trust.
F. Custodian Fees: State Street (the "Custodian") serves as Custodian for the Trust in accordance with a Custodian Agreement. The Custodian holds cash, securities, and other assets of the Trust as required by the Act. Custody fees are payable monthly based on assets held in custody, investment purchases and sales activity and account maintenance fees, plus reimbursement for certain out-of-pocket expenses.
G. Security Transactions and Transactions with Affiliates: For the year ended September 30, 2017, purchases and sales of investment securities for the Fund, other than long-term U.S. Government securities and short-term investments, were approximately $5,384,000 and $5,367,000, respectively. For the year ended September 30, 2017, purchases and sales of long-term U.S. Government securities were approximately $900,000 and $257,000, respectively.
The Fund invests in the Institutional Class of the Morgan Stanley Institutional Liquidity Funds — Government Portfolio (the "Liquidity Funds"), an open-end management investment company managed by the Adviser. Advisory fees paid by the Fund are reduced by an amount equal to its pro-rata share of the advisory and administration fees paid by the Fund due
to its investment in the Liquidity Funds. For the year ended September 30, 2017, advisory fees paid were reduced by approximately $1,000 relating to the Fund's investment in the Liquidity Funds.
A summary of the Fund's transactions in shares of the Liquidity Funds during the year ended September 30, 2017 is as follows:
Affiliated
Investment
Company | | Value
September 30,
2016
(000) | | Purchases
at Cost
(000) | | Proceeds
from Sales
(000) | | Dividend
Income
(000) | |
Liquidity Funds | | $ | 1,725 | | | $ | 5,689 | | | $ | 6,438 | | | $ | 4 | | |
Affiliated
Investment
Company (cont'd) | | Realized
Gain (Loss)
(000) | | Change in
Unrealized
Appreciation
(Depreciation)
(000) | | Value
September 30,
2017
(000) | |
Liquidity Funds | | $ | — | | | $ | — | | | $ | 976 | | |
The Fund is permitted to purchase and sell securities ("cross-trade") from and to other Morgan Stanley Funds as well as other funds and client accounts for which the Adviser or an affiliate of the Adviser serves as investment adviser, pursuant to procedures approved by the Trustees in compliance with Rule 17a-7 under the Act (the "Rule"). Each cross-trade is executed at the current market price in compliance with provisions of the Rule. For the year ended September 30, 2017, the Fund did not engage in any cross-trade transactions.
The Fund has an unfunded Deferred Compensation Plan (the "Compensation Plan"), which allows each independent Trustee to defer payment of all, or a portion, of the fees he or she receives for serving on the Board of Trustees. Each eligible Trustee generally may elect to have the deferred amounts credited with a return equal to the total return on one or more of the Morgan Stanley funds that are offered as investment options under the Compensation Plan. Appreciation/depreciation and distributions received from these investments are recorded with an offsetting increase/decrease in the deferred compensation obligation and do not affect the NAV of the Fund.
H. Federal Income Taxes: It is the Fund's intention to continue to qualify as a regulated investment company and distribute all of its taxable and tax-exempt income. Accordingly, no provision for federal income taxes is required in the financial statements.
The Fund may be subject to taxes imposed by countries in which it invests. Such taxes are generally based on income and/or capital gains earned or repatriated. Taxes are accrued based on net investment income, net realized gains and net unrealized appreciation as such income and/or gains are earned.
29
Morgan Stanley Institutional Fund Trust
Annual Report — September 30, 2017
Notes to Financial Statements (cont'd)
Taxes may also be based on transactions in foreign currency and are accrued based on the value of investments denominated in such currency.
FASB ASC 740-10, "Income Taxes — Overall", sets forth a minimum threshold for financial statement recognition of the benefit of a tax position taken or expected to be taken in a tax return. Management has concluded there are no significant uncertain tax positions that would require recognition in the financial statements. If applicable, the Fund recognizes interest accrued related to unrecognized tax benefits in "Interest Expense" and penalties in "Other Expenses" in the Statement of Operations. The Fund files tax returns with the U.S. Internal Revenue Service, New York and various states. Each of the tax years in the three-year period ended September 30, 2017, remains subject to examination by taxing authorities.
The tax character of distributions paid may differ from the character of distributions shown in the Statements of Changes in Net Assets due to short-term capital gains being treated as ordinary income for tax purposes. The tax character of distributions paid during fiscal years 2017 and 2016 was as follows:
2017 Distributions
Paid From:
Ordinary Income
(000) | | 2016 Distributions
Paid From:
Ordinary Income
(000) | |
| $ | 216 | | | $ | 379 | | |
The amount and character of income and gains to be distributed are determined in accordance with income tax regulations which may differ from GAAP. These book/tax differences are either considered temporary or permanent in nature.
Temporary differences are attributable to differing book and tax treatments for the timing of the recognition of gains (losses) on certain investment transactions and the timing of the deductibility of certain expenses.
Permanent differences, primarily due to differing treatments of gains (losses) related to foreign currency transactions, basis adjustments for swap transactions, paydown adjustments and nondeductible expenses, resulted in the following reclassifications among the components of net assets at September 30, 2017:
Distributions
in Excess of
Net Investment
Income
(000) | | Accumulated
Net Realized
Loss
(000) | | Paid-in-
Capital
(000) | |
| $ | (131 | ) | | $ | 135 | | | $ | (4 | ) | |
At September 30, 2017, the Fund had no distributable earnings on a tax basis.
At September 30, 2017, the Fund had available for federal income tax purposes unused short term capital losses of approximately $95,000 that do not have an expiration date.
To the extent that capital loss carryforwards are used to offset any future capital gains realized during the carryover period as provided by U.S. federal income tax regulations, no capital gains tax liability will be incurred by the Fund for gains realized and not distributed. To the extent that capital gains are offset, such gains will not be distributed to the shareholders. During the year ended September 30, 2017, the Fund utilized capital loss carryforwards for U.S. federal income tax purposes of approximately $237,000.
Qualified late year losses are capital losses and specified ordinary losses, including currency losses, incurred after October 31 but within the taxable year that, if elected, are deemed to arise on the first day of the Fund's next taxable year. These also include non-specified ordinary losses incurred after December 31 but within the same taxable year. For the year ended September 30, 2017, the Fund deferred to October 1, 2017 for U.S. federal income tax purposes the following losses:
Qualified
Late Year
Ordinary Losses
(000) | | Post-October
Capital Losses
(000) | |
| $ | 11 | | | $ | — | | |
I. Credit Facility: The Trust and other Morgan Stanley funds participate in a $150,000,000 committed, unsecured revolving line of credit facility (the "facility") with State Street. This facility is to be used for temporary emergency purposes or funding of shareholder redemption requests. The interest rate on borrowings is based on the federal funds rate or one month libor rate plus a spread. The facility also has a commitment fee of 0.25% per annum based on the unused portion of the facility. During the year ended September 30, 2017, the Fund did not have any borrowings under the facility.
J. Other: At September 30, 2017, the Fund did not have record owners of 10% or greater.
K. Accounting Pronouncement: In March 2017, FASB issued an Accounting Standard Update, ASU 2017-08, Receivables-Nonrefundable Fees and Other Costs (Subtopic 310-20), Premium Amortization on Purchased Callable Debt Securities (the "ASU") which amends the amortization period for certain purchased callable debt securities
30
Morgan Stanley Institutional Fund Trust
Annual Report — September 30, 2017
Notes to Financial Statements (cont'd)
held at a premium, shortening such period to the earliest call date. The ASU does not require any accounting change for debt securities held at a discount; the discount continues to be amortized to maturity. The ASU is effective for fiscal years, and interim periods within those fiscal years, beginning after December 15, 2018. At this time, management is evaluating the implications of these changes on the financial statements.
31
Morgan Stanley Institutional Fund Trust
Annual Report — September 30, 2017
Report of Independent Registered Public Accounting Firm
To the Shareholders and Board of Trustees of
Morgan Stanley Institutional Fund Trust —
Strategic Income Portfolio
We have audited the accompanying statement of assets and liabilities, including the portfolio of investments, of Strategic Income Portfolio (one of the funds constituting Morgan Stanley Institutional Fund Trust) (the "Fund") as of September 30, 2017, the related statement of operations for the year then ended, the statements of changes in net assets for each of the two years in the period then ended and the financial highlights for each of the years or periods indicated therein. These financial statements and financial highlights are the responsibility of the Fund's management. Our responsibility is to express an opinion on these financial statements and financial highlights based on our audits.
We conducted our audits in accordance with the standards of the Public Company Accounting Oversight Board (United States). Those standards require that we plan and perform the audit to obtain reasonable assurance about whether the financial statements and financial highlights are free of material misstatement. We were not engaged to perform an audit of the Fund's internal control over financial reporting. Our audits included consideration of internal control over financial reporting as a basis for designing audit procedures that are appropriate in the circumstances, but not for the purpose of expressing an opinion on the effectiveness of the Fund's internal control over financial reporting. Accordingly, we express no such opinion. An audit also includes examining, on a test basis, evidence supporting the amounts and disclosures in the financial statements and financial highlights, assessing the accounting principles used and significant estimates made by management, and evaluating the overall financial statement presentation. Our procedures included confirmation of securities owned as of September 30, 2017, by correspondence with the custodian and others or by other appropriate auditing procedures where replies from others were not received. We believe that our audits provide a reasonable basis for our opinion.
In our opinion, the financial statements and financial highlights referred to above present fairly, in all material respects, the financial position of Strategic Income Portfolio (one of the funds constituting Morgan Stanley Institutional Fund Trust) at September 30, 2017, the results of its operations for the year then ended, the changes in its net assets for each of the two years in the period then ended and the financial highlights for each of the years or periods indicated therein, in conformity with U.S. generally accepted accounting principles.

Boston, Massachusetts
November 22, 2017
32
Morgan Stanley Institutional Fund Trust
Annual Report — September 30, 2017
Investment Advisory Agreement Approval (unaudited)
Nature, Extent and Quality of Services
The Board reviewed and considered the nature and extent of the investment advisory services provided by the Adviser (as defined herein) under the advisory agreement, including portfolio management, investment research and equity and fixed income securities trading. The Board reviewed similar information and factors regarding the Sub-Adviser (as defined herein), to the extent applicable. The Board also reviewed and considered the nature and extent of the non-advisory, administrative services provided by the Adviser under the administration agreement, including accounting, operations, clerical, bookkeeping, compliance, business management and planning, legal services and the provision of supplies, office space and utilities at the Investment Adviser's expense. The Board also considered the Adviser's investment in personnel and infrastructure that benefits the Fund. (The Adviser and Sub-Adviser together are referred to as the "Adviser" and the advisory, sub-advisory and administration agreements together are referred to as the "Management Agreement.") The Board also considered that the Adviser serves a variety of other investment advisory clients and has experience overseeing service providers. The Board also compared the nature of the services provided by the Adviser with similar services provided by non-affiliated advisers as presented to the Board by Broadridge Financial Solutions, Inc. ("Broadridge").
The Board reviewed and considered the qualifications of the portfolio managers, the senior administrative managers and other key personnel of the Adviser who provide the administrative and advisory services to the Fund. The Board determined that the Adviser's portfolio managers and key personnel are well qualified by education and/or training and experience to perform the services in an efficient and professional manner. The Board concluded that the nature and extent of the advisory and administrative services provided were necessary and appropriate for the conduct of the business and investment activities of the Fund and supported its decision to approve the Management Agreement.
Performance, Fees and Expenses of the Fund
The Board reviewed the performance, fees and expenses of the Fund compared to its peers, as presented by Broadridge, and to appropriate benchmarks where applicable. The Board discussed with the Adviser the performance goals and the actual results achieved in managing the Fund. When considering a fund's performance, the Board and the Adviser place emphasis on trends and longer-term returns (focusing on one-year, three-year and five-year performance, as of December 31, 2016, or since inception, as applicable). When a fund underperforms its benchmark and/or its peer group average, the Board and the Adviser discuss the causes of such underperformance and, where necessary, they discuss specific changes to investment strategy or investment personnel. The Board noted that the Fund's performance was below its peer group average for the one-year period and better than its peer group average for the period since the end of December 2014, the month of the Fund's inception. The Board discussed with the Adviser the level of the advisory and administration fees (together, the "management fee") for this Fund relative to comparable funds and/or other accounts advised by the Adviser and/or compared to its peers as presented by Broadridge. In addition to the management fee, the Board also reviewed the Fund's total expense ratio. The Board noted that the Fund's management fee and total expense ratio were lower than its peer group averages. After discussion, the Board concluded that the Fund's (i) performance was acceptable; and (ii) management fee and total expense ratio were competitive with its peer group averages.
Economies of Scale
The Board considered the size and growth prospects of the Fund and how that relates to the Fund's total expense ratio and particularly the Fund's management fee rate, which includes a breakpoint. In conjunction with its review of the Adviser's profitability, the Board discussed with the Adviser how a change in assets can affect the efficiency or effectiveness of managing the Fund and whether the management fee level is appropriate relative to current and projected asset levels and/or whether the management fee structure reflects economies of scale as asset levels change. The Board has determined that its review of the actual and/or potential economies of scale of the Fund supports its decision to approve the Management Agreement.
Profitability of the Adviser and Affiliates
The Board considered information concerning the costs incurred and profits realized by the Adviser and its affiliates during the last year from their relationship with the Fund and during the last two years from their relationship with the Morgan Stanley Fund Complex and reviewed with the Adviser the cost allocation methodology used to determine the profitability of the Adviser and affiliates. The Board has determined that its review of the analysis of the Adviser's expenses and profitability supports its decision to approve the Management Agreement.
33
Morgan Stanley Institutional Fund Trust
Annual Report — September 30, 2017
Investment Advisory Agreement Approval (unaudited) (cont'd)
Other Benefits of the Relationship
The Board considered other direct and indirect benefits to the Adviser and/or its affiliates derived from their relationship with the Fund and other funds advised by the Adviser. These benefits may include, among other things, fees for trading, distribution and/or shareholder servicing and for transaction processing and reporting platforms used by securities lending agents, and research received by the Adviser generated from commission dollars spent on funds' portfolio trading. The Board reviewed with the Adviser these arrangements and the reasonableness of the Adviser's costs relative to the services performed. The Board has determined that its review of the other benefits received by the Adviser or its affiliates supports its decision to approve the Management Agreement.
Resources of the Adviser and Historical Relationship Between the Fund and the Adviser
The Board considered whether the Adviser is financially sound and has the resources necessary to perform its obligations under the Management Agreement. The Board also reviewed and considered the historical relationship between the Fund and the Adviser, including the organizational structure of the Adviser, the policies and procedures formulated and adopted by the Adviser for managing the Fund's operations and the Board's confidence in the competence and integrity of the senior managers and key personnel of the Adviser. The Board concluded that the Adviser has the financial resources necessary to fulfill its obligations under the Management Agreement and that it is beneficial for the Fund to continue its relationship with the Adviser.
Other Factors and Current Trends
The Board considered the controls and procedures adopted and implemented by the Adviser and monitored by the Fund's Chief Compliance Officer and concluded that the conduct of business by the Adviser indicates a good faith effort on its part to adhere to high ethical standards in the conduct of the Fund's business.
General Conclusion
After considering and weighing all of the above factors, with various written materials and verbal information presented by the Adviser, the Board concluded that it would be in the best interest of the Fund and its shareholders to approve renewal of the Management Agreement for another year. In reaching this conclusion the Board did not give particular weight to any single piece of information or factor referenced above. The Board considered these factors and information over the course of the year and in numerous meetings, some of which were in executive session with only the independent Board members and their counsel present. It is possible that individual Board members may have weighed these factors, and the information presented, differently in reaching their individual decisions to approve the Management Agreement.
34
Morgan Stanley Institutional Fund Trust
Annual Report — September 30, 2017
Privacy Notice (unaudited)
MORGAN STANLEY INVESTMENT MANAGEMENT INC.
AN IMPORTANT NOTICE CONCERNING OUR U.S. PRIVACY POLICY
We are required by federal law to provide you with a copy of our privacy policy annually. This policy applies to current and former individual investors in funds managed or sponsored by Morgan Stanley Investment Management Inc. ("MSIM") as well as current and former individual clients of MSIM. This policy is not applicable to partnerships, corporations, trusts or other non-individual clients or investors. Please note that we may amend this policy at any time, and will inform you of any changes as required by law.
WE RESPECT YOUR PRIVACY
We appreciate that you have provided us with your personal financial information. We strive to maintain the privacy of such information while we help you achieve your financial objectives. This Notice describes what non-public personal information we collect about you, why we collect it, when we may share it with others and how certain others may use it. It discusses the steps you may take to limit our sharing of certain information about you to affiliated companies in the Morgan Stanley family of companies ("other Morgan Stanley companies"). It also discloses how you may limit use of certain shared information for marketing purposes by other Morgan Stanley branded companies. Throughout this policy, we refer to the non-public information that personally identifies you or your accounts as "personal information.''
1. WHAT PERSONAL INFORMATION DO WE COLLECT ABOUT YOU?
We obtain personal information from applications and other forms you submit to us, from your dealings with us, from consumer reporting agencies, from our Web sites and from third parties and other sources.
For example:
• We may collect information such as your name, address, e-mail address, telephone/fax numbers, assets, income and investment objectives through subscription documents, applications and other forms you submit to us.
• We may obtain information about account balances, your use of account(s) and the types of products and services you prefer to receive from us through your dealings and transactions with us and other sources.
• We may obtain information about your creditworthiness and credit history from consumer reporting agencies.
• We may collect background information from and through third-party vendors to verify representations you have made and to comply with various regulatory requirements.
• If you interact with us through our public and private Web sites, we may collect information that you provide directly through online communications (such as an e-mail address). We may also collect information about your Internet service provider, your domain name, your computer's operating system and Web browser, your use of our Web sites and your product and service preferences, through the use of "cookies." Please consult the Terms of Use of these sites for more details.
2. WHEN DO WE DISCLOSE PERSONAL INFORMATION WE COLLECT ABOUT YOU?
We may disclose personal information we collect about you to other Morgan Stanley companies and to non-affiliated third parties.
a. Information We Disclose to Other Morgan Stanley Companies.
We may disclose personal information to other Morgan Stanley companies for a variety of reasons, including to manage your account(s) effectively, to service and process your transactions, to let you know about products and services offered by us and other Morgan Stanley companies, to manage our business, and as otherwise required or permitted by law. Offers for products and services from other Morgan Stanley companies are developed under conditions designed to safeguard your personal information.
35
Morgan Stanley Institutional Fund Trust
Annual Report — September 30, 2017
Privacy Notice (unaudited) (cont'd)
b. Information We Disclose to Non-affiliated Third Parties.
We do not disclose personal information that we collect about you to non-affiliated third parties except to those who provide marketing services on our behalf, to financial institutions with whom we have joint marketing agreements, and as otherwise required or permitted by law. For example, we may disclose personal information to non-affiliated third parties for servicing and processing transactions, to offer our own products and services, to protect against fraud, for institutional risk control, to respond to judicial process or to perform services on our behalf. When we share personal information with a non-affiliated third party, they are required to limit their use of personal information to the particular purpose for which it was shared and they are not allowed to share personal information with others except to fulfill that limited purpose or as may be permitted or required by law.
3. HOW DO WE PROTECT THE SECURITY AND CONFIDENTIALITY OF PERSONAL INFORMATION WE COLLECT ABOUT YOU?
We maintain physical, electronic and procedural security measures to help safeguard the personal information we collect about you. We have internal policies governing the proper handling of client information. Third parties that provide support or marketing services on our behalf may also receive personal information, and we require them to adhere to confidentiality standards with respect to such information.
4. HOW CAN YOU LIMIT THE SHARING OF CERTAIN TYPES OF PERSONAL INFORMATION WITH OTHER MORGAN STANLEY COMPANIES?
We offer you choices as to whether we share with other Morgan Stanley companies the personal information that was collected to determine your eligibility for products and services you request ("eligibility information"). Eligibility information does not include your identification information or personal information pertaining to our transactions or experiences with you. Please note that, even if you direct us not to share eligibility information with other Morgan Stanley companies ("opt-out"), we may still share personal information, including eligibility information, with those companies in circumstances excluded from the opt-out under applicable law, such as to process transactions or to service your account.
5. HOW CAN YOU LIMIT THE USE OF CERTAIN TYPES OF PERSONAL INFORMATION BY OTHER MORGAN STANLEY COMPANIES FOR MARKETING?
By following the opt-out instructions in Section 6 below, you may limit other Morgan Stanley branded companies from marketing their products or services to you based on personal information we disclose to them. This information may include, for example, your income and account history with us. Please note that, even if you choose to limit Other Morgan Stanley Companies from using personal information about you that we may share with them for marketing their products and services to you, Other Morgan Stanley Companies may use your personal information that they obtain from us to market to you in circumstances permitted by law, such as if the Other Morgan Stanley Company has its own relationship with you.
6. HOW CAN YOU SEND US AN OPT-OUT INSTRUCTION?
If you wish to limit our sharing of eligibility information about you with other Morgan Stanley companies or other Morgan Stanley companies' use of personal information for marketing purposes, as described in this notice, you may do so by:
• Calling us at (800) 548-7786
Monday–Friday between 8a.m. and 6p.m.(EST)
• Writing to us at the following address:
Boston Financial Data Services, Inc.
c/o Privacy Coordinator
P.O. Box 219804
Kansas City, Missouri 64121
36
Morgan Stanley Institutional Fund Trust
Annual Report — September 30, 2017
Privacy Notice (unaudited) (cont'd)
Your written request should include your name, address, telephone number and account number(s) to which the opt-out applies and whether you are opting out with respect to sharing of eligibility information (Section 4 above), or if information used for Marketing (Section 5 above) or both. Written opt-out requests should not be sent with any other correspondence. In order to process your request, we require that the request be provided by you directly and not through a third party.
Your opt-out preference will remain in effect with respect to this policy (as it may be amended) until you notify us otherwise. If you have a joint account, your direction for us not to share this information with other Morgan Stanley companies and for those other Morgan Stanley companies not to use your personal information for marketing will be applied to all account holders on that account. Please understand that if you limit our sharing or our affiliated companies' use of personal information, you and any joint account holder(s) may not receive information about Morgan Stanley products and services, including products or services that could help you manage your financial resources and achieve your investment objectives.
7. WHAT IF AN AFFILIATED COMPANY BECOMES A NON-AFFILIATED THIRD PARTY?
If, at any time in the future, an affiliated company becomes a non-affiliated third party, further disclosures of personal information made to the former affiliated company will be limited to those described in Section 2(b) above relating to non-affiliated third parties. If you elected under Section 6 to limit disclosures we make to affiliated companies, or use of personal information by affiliated companies, your election will not apply to use by any former affiliated company of your personal information in their possession once it becomes a non-affiliated third party.
SPECIAL NOTICE TO RESIDENTS OF VERMONT
The following section supplements our policy with respect to our individual clients who have a Vermont address and supersedes anything to the contrary in the above policy with respect to those clients only.
The state of Vermont requires financial institutions to obtain your consent prior to sharing personal information that they collect about you with affiliated companies and non-affiliated third parties other than in certain limited circumstances. Except as permitted by law, we will not share personal information we collect about you with non-affiliated third parties or other Morgan Stanley companies unless you provide us with your written consent to share such information ("opt-in").
If you wish to receive offers for investment products and services offered by or through other Morgan Stanley companies, please notify us in writing at the following address:
Boston Financial Data Services, Inc.
c/o Privacy Coordinator
P.O. Box 219804
Kansas City, Missouri 64121
Your authorization should include your name, address, telephone number and account number(s) to which the opt-in applies and should not be sent with any other correspondence. In order to process your authorization, we require that the authorization be provided by you directly and not through a third party.
SPECIAL NOTICE TO RESIDENTS OF CALIFORNIA
The following section supplements our policy with respect to our individual clients who have a California address and supersedes anything to the contrary in the above policy with respect to those clients only.
In response to a California law, if your account has a California home address, your personal information will not be disclosed to non-affiliated third parties except as permitted by applicable California law, and we will limit sharing such information with our affiliates to comply with California privacy laws that apply to us.
37
Morgan Stanley Institutional Fund Trust
Annual Report — September 30, 2017
Trustee and Officer Information (unaudited)
Independent Trustees:
Name, Age and Address of
Independent Trustee | | Position(s)
Held with
Registrant | | Length of Time
Served* | | Principal Occupation(s) During Past 5 Years
and Other Relevant Professional Experience | | Number of
Portfolios in
Fund Complex
Overseen by
Independent
Trustee** | | Other Directorships
Held by Independent
Trustee*** | |
Frank L. Bowman (72)
c/o Perkins Coie LLP
Counsel to the Independent Trustees
30 Rockefeller Plaza
New York, NY 10112 | | Trustee | | Since
August
2006 | | President, Strategic Decisions, LLC (consulting) (since February 2009); Director or Trustee of various Morgan Stanley Funds (since August 2006); Chairperson of the Compliance and Insurance Committee (since October 2015); formerly, Chairperson of the Insurance Sub-Committee of the Compliance and Insurance Committee (2007-2015); served as President and Chief Executive Officer of the Nuclear Energy Institute (policy organization) (February 2005-November 2008); retired as Admiral, U.S. Navy after serving over 38 years on active duty including 8 years as Director of the Naval Nuclear Propulsion Program in the Department of the Navy and the U.S. Department of Energy (1996-2004); served as Chief of Naval Personnel (July 1994-September 1996) and on the Joint Staff as Director of Political Military Affairs (June 1992-July 1994); knighted as Honorary Knight Commander of the Most Excellent Order of the British Empire; awarded the Officier de l'Orde National du Mérite by the French Government; elected to the National Academy of Engineering (2009). | | | 90 | | | Director of BP p.l.c.; Director of Naval and Nuclear Technologies LLP; Director Emeritus of the Armed Services YMCA; Director of the U.S. Naval Submarine League; Member of the National Security Advisory Council of the Center for U.S. Global Engagement and a member of the CNA Military Advisory Board; Chairman of the charity J Street Cup Golf; Trustee of Fairhaven United Methodist Church; and Director of other various non-profit organizations. | |
Kathleen A. Dennis (64)
c/o Perkins Coie LLP
Counsel to the Independent Trustees
30 Rockefeller Plaza
New York, NY 10112 | | Trustee | | Since
August
2006 | | President, Cedarwood Associates (mutual fund and investment management consulting) (since July 2006); Chairperson of the Liquidity and Alternatives Sub-Committee of the Investment Committee (since October 2006) and Director or Trustee of various Morgan Stanley Funds (since August 2006); formerly, Senior Managing Director of Victory Capital Management (1993-2006). | | | 91 | | | Director of various non-profit organizations. | |
Nancy C. Everett (62)
c/o Perkins Coie LLP
Counsel to the Independent Trustees
30 Rockefeller Plaza
New York, NY 10112 | | Trustee | | Since
January
2015 | | Chief Executive Officer, Virginia Commonwealth University Investment Company (since November 2015); Owner OBIR, LLC (institutional investment management consulting) (since June 2014); formerly, Managing Director, BlackRock, Inc. (February 2011-December 2013); and Chief Executive Officer, General Motors Asset Management (a/k/a Promark Global Advisors, Inc.) (June 2005-May 2010). | | | 91 | | | Formerly, Member of Virginia Commonwealth University School of Business Foundation (2005-2016); Member of Virginia Commonwealth University Board of Visitors (2013-2015); Member of Committee on Directors for Emerging Markets Growth Fund, Inc. (2007-2010); Chairperson of Performance Equity Management, LLC (2006-2010); and Chairperson, GMAM Absolute Return Strategies Fund, LLC (2006-2010). | |
38
Morgan Stanley Institutional Fund Trust
Annual Report — September 30, 2017
Trustee and Officer Information (unaudited) (cont'd)
Independent Trustees: (cont'd)
Name, Age and Address of
Independent Trustee | | Position(s)
Held with
Registrant | | Length of Time
Served* | | Principal Occupation(s) During Past 5 Years
and Other Relevant Professional Experience | | Number of
Portfolios in
Fund Complex
Overseen by
Independent
Trustee** | | Other Directorships
Held by Independent
Trustee*** | |
Jakki L. Haussler (60)
c/o Perkins Coie LLP
Counsel to the Independent Trustees
30 Rockefeller Plaza
New York, NY 10112 | | Trustee | | Since
January
2015 | | Chairman and Chief Executive Officer, Opus Capital Group (since January 1996); formerly, Director, Capvest Venture Fund, LP (May 2000-December 2011); Partner, Adena Ventures, LP (July 1999-December 2010); Director, The Victory Funds (February 2005-July 2008). | | | 91 | | | Director of Cincinnati Bell Inc. and Member, Audit Committee and Compensation Committee; Director of Northern Kentucky University Foundation and Member, Investment Committee; Member of Chase College of Law Transactional Law Practice Center Board of Advisors; Director of Best Transport; Director of Chase College of Law Board of Visitors; formerly, Member, University of Cincinnati Foundation Investment Committee; Member, Miami University Board of Visitors (2008-2011); Trustee of Victory Funds (2005-2008) and Chairman, Investment Committee (2007-2008) and Member, Service Provider Committee (2005-2008). | |
Dr. Manuel H. Johnson (68)
c/o Johnson Smick
International, Inc.
220 I Street, NE — Suite 200
Washington, D.C. 20002 | | Trustee | | Since
July
1991 | | Senior Partner, Johnson Smick International, Inc. (consulting firm); Chairperson of the Investment Committee (since October 2006) and Director or Trustee of various Morgan Stanley Funds (since July 1991); Co-Chairman and a founder of the Group of Seven Council (G7C) (international economic commission); formerly, Chairperson of the Audit Committee (July 1991-September 2006), Vice Chairman of the Board of Governors of the Federal Reserve System and Assistant Secretary of the U.S. Treasury. | | | 91 | | | Director of NVR, Inc. (home construction). | |
Joseph J. Kearns (75)
c/o Kearns & Associates LLC
46 E Peninsula Center #385
Rolling Hills Estates, CA 90274-3712 | | Trustee | | Since
August
1994 | | President, Kearns & Associates LLC (investment consulting); Chairperson of the Audit Committee (since October 2006) and Director or Trustee of various Morgan Stanley Funds (since August 1994); formerly, Deputy Chairperson of the Audit Committee (July 2003-September 2006) and Chairperson of the Audit Committee of various Morgan Stanley Funds (since August 1994); CFO of the J. Paul Getty Trust. | | | 93 | | | Director of Electro Rent Corporation (equipment leasing). Prior to December 31, 2013, Director of The Ford Family Foundation. | |
39
Morgan Stanley Institutional Fund Trust
Annual Report — September 30, 2017
Trustee and Officer Information (unaudited) (cont'd)
Independent Trustees: (cont'd)
Name, Age and Address of
Independent Trustee | | Position(s)
Held with
Registrant | | Length of Time
Served* | | Principal Occupation(s) During Past 5 Years
and Other Relevant Professional Experience | | Number of
Portfolios in
Fund Complex
Overseen by
Independent
Trustee** | | Other Directorships
Held by Independent
Trustee*** | |
Michael F. Klein (58)
c/o Perkins Coie LLP
Counsel to the Independent Trustees
30 Rockefeller Plaza
New York, NY 10112 | | Trustee | | Since
August
2006 | | Managing Director, Aetos Capital, LLC (since March 2000); Co-President, Aetos Alternatives Management, LLC (since January 2004) and Co-Chief Executive Officer of Aetos Capital LLC (since August 2013); Chairperson of the Fixed Income Sub-Committee of the Investment Committee (since October 2006) and Director or Trustee of various Morgan Stanley Funds (since August 2006); formerly, Managing Director, Morgan Stanley & Co. Inc. and Morgan Stanley Dean Witter Investment Management, President, various Morgan Stanley Funds (June 1998-March 2000) and Principal, Morgan Stanley & Co. Inc. and Morgan Stanley Dean Witter Investment Management (August 1997-December 1999). | | | 90 | | | Director of certain investment funds managed or sponsored by Aetos Capital, LLC; Director of Sanitized AG and Sanitized Marketing AG (specialty chemicals). | |
Patricia Maleski (57)
c/o Perkins Coie LLP
Counsel to the Independent Trustees
30 Rockefeller Plaza
New York, NY 10112 | | Trustee | | Since
January
2017 | | Managing Director, JPMorgan Asset Management (2004-2016); Oversight and Control Head of Fiduciary and Conflicts of Interest Program(2015-2016); Chief Control Officer-Global Asset Management (2013-2015); President, JPMorgan Funds (2010-2013); Chief Administrative Officer (2004-2013); various other positions including Treasurer and Board Liaison (since 2001). | | | 91 | | | | None. | | |
Michael E. Nugent (81)
522 Fifth Avenue
New York, NY 10036 | | Chair of the
Board and
Trustee | | Chair of the
Boards since
July 2006 and
Trustee since
July 1991 | | Chair of the Boards of various Morgan Stanley Funds (since July 2006); Chairperson of the Closed-End Fund Committee (since June 2012) and Director or Trustee of various Morgan Stanley Funds (since July 1991); formerly, Chairperson of the Insurance Committee (until July 2006); General Partner, Triumph Capital, L.P. (private investment partnership) (1988-2013). | | | 92 | | | | None. | | |
W. Allen Reed (70)
c/o Perkins Coie LLP
Counsel to the Independent Trustees
30 Rockefeller Plaza
New York, NY 10112 | | Trustee | | Since
August
2006 | | Chairperson of the Equity Sub-Committee of the Investment Committee (since October 2006) and Director or Trustee of various Morgan Stanley Funds (since August 2006); formerly, President and CEO of General Motors Asset Management; Chairman and Chief Executive Officer of the GM Trust Bank and Corporate Vice President of General Motors Corporation (August 1994-December 2005). | | | 91 | | | Director of Legg Mason, Inc.; formerly, Director of the Auburn University Foundation (2010-2015). | |
Fergus Reid (85)
c/o Joe Pietryka, Inc.
85 Charles Colman Blvd.
Pawling, NY 12564 | | Trustee | | Since
June
1992 | | Chairman, Joe Pietryka, Inc.; Chairperson of the Governance Committee and Director or Trustee of various Morgan Stanley Funds (since June 1992). | | | 92 | | | Formerly, Trustee and Director of certain investment companies in the JP Morgan Fund Complex managed by JP Morgan Investment Management Inc. (1987-2012). | |
* This is the earliest date the Trustee began serving the Morgan Stanley Funds. Each Trustee serves an indefinite term, until his or her successor is elected.
** The Fund Complex includes (as of December 31, 2016) all open-end and closed-end funds (including all of their portfolios) advised by Morgan Stanley Investment Management Inc. (the "Adviser") and any funds that have an adviser that is an affiliated person of the Adviser (including, but not limited to, Morgan Stanley AIP GP LP).
*** This includes any directorships at public companies and registered investment companies held by the Trustee at any time during the past five years.
40
Morgan Stanley Institutional Fund Trust
Annual Report — September 30, 2017
Trustee and Officer Information (unaudited) (cont'd)
Executive Officers:
Name, Age and Address of Executive Officer | | Position(s) Held
with
Registrant | | Length of
Time Served* | | Principal Occupation(s) During Past 5 Years | |
John H. Gernon (54)
522 Fifth Avenue
New York, NY 10036 | | President and
Principal
Executive
Officer | | Since
September
2013 | | President and Principal Executive Officer of the Equity and Fixed Income Funds and the Morgan Stanley AIP Funds (since September 2013) and the Liquidity Funds and various money market funds (since May 2014) in the Fund Complex; Managing Director of the Adviser; Head of Product (since 2006). | |
Timothy J. Knierim (58)
522 Fifth Avenue
New York, NY 10036 | | Chief
Compliance
Officer | | Since
December
2016 | | Managing Director of the Adviser and various entities affiliated with the Adviser; Chief Compliance Officer of various Morgan Stanley Funds and the Adviser (since December 2016) and Chief Compliance Officer of Morgan Stanley AIP GP LP (since 2014). Formerly, Managing Director and Deputy Chief Compliance Officer of the Adviser (2014-2016); and formerly, Chief Compliance Officer of Prudential Investment Management, Inc. (2007-2014). | |
Francis J. Smith (52)
522 Fifth Avenue
New York, NY 10036 | | Treasurer and
Principal
Financial
Officer | | Treasurer
since July 2003 and Principal Financial Officer since September 2002 | | Manging Director of the Adviser and various entities affiliated with the Adviser; Treasurer (since July 2003) and Principal Financial Officer of various Morgan Stanley Funds (since September 2002). | |
Mary E. Mullin (50)
522 Fifth Avenue
New York, NY 10036 | | Secretary | | Since
June
1999 | | Executive Director of the Adviser; Secretary of various Morgan Stanley Funds (since June 1999). | |
Michael J. Key (38)
522 Fifth Avenue
New York, NY 10036 | | Vice President | | Since
June
2017 | | Vice President of the Equity and Fixed Income Funds, Liquidity Funds, various money market funds and the Morgan Stanley AIP Funds in the Fund Complex (since June 2017); Executive Director of the Adviser; Head of Product Development for Equity and Fixed Income Funds (since August 2013). | |
* This is the earliest date the officer began serving the Morgan Stanley Funds. Each officer serves a one-year term, until his or her successor is elected and qualifies.
41
Morgan Stanley Institutional Fund Trust
Annual Report — September 30, 2017
Adviser and Administrator
Morgan Stanley Investment Management Inc.
522 Fifth Avenue
New York, New York 10036
Sub-Adviser
Morgan Stanley Investment Management Limited
25 Cabot Square, Canary Wharf
London, E14 4QA, England
Distributor
Morgan Stanley Distribution, Inc.
522 Fifth Avenue
New York, New York 10036
Dividend Disbursing and Transfer Agent
Boston Financial Data Services, Inc.
2000 Crown Colony Drive
Quincy, Massachusetts 02169
Custodian
State Street Bank and Trust Company
One Lincoln Street
Boston, Massachusetts 02111
Legal Counsel
Dechert LLP
1095 Avenue of the Americas
New York, New York 10036
Counsel to the Independent Trustees
Perkins Coie LLP
30 Rockefeller Plaza
New York, New York 10112
Independent Registered Public Accounting Firm
Ernst & Young LLP
200 Clarendon Street
Boston, Massachusetts 02116
Reporting to Shareholders
Each Morgan Stanley Fund provides a complete schedule of portfolio holdings in its semi-annual and annual reports within 60 days of the end of the fund's second and fourth fiscal quarters. The semi-annual and annual reports are filed electronically with the Securities and Exchange Commission (SEC) on Form N-CSRS and Form N-CSR, respectively. Morgan Stanley also delivers the semi-annual and annual reports to fund shareholders and makes these reports available on its public website, www.morganstanley.com/im. Each Morgan Stanley fund also files a complete schedule of portfolio holdings with the SEC for the fund's first and third fiscal quarters on Form N-Q. Morgan Stanley does not deliver the reports for the first and third fiscal quarters to shareholders, nor are the reports posted to the Morgan Stanley public website. You may, however, obtain the Form N-Q filings (as well as the Form N-CSR and N-CSRS filings) by accessing the SEC's website, www.sec.gov. You may also review and copy them at the SEC's Public Reference Room in Washington, DC. Information on the operation of the SEC's Public Reference Room may be obtained by calling the SEC toll free at 1 (800) SEC-0330. You can also request copies of these materials, upon payment of a duplicating fee, by electronic request at the SEC's email address (publicinfo@sec.gov) or by writing to the SEC's Public Reference Section, Washington, D.C. 20549-1520.
Proxy Voting Policies and Procedures and Proxy Voting Record
You may obtain a copy of the Trust's Proxy Voting Policy and Procedures and information regarding how the Trust voted proxies relating to portfolio securities during the most recent twelve-month period ended June 30, without charge, upon request, by calling toll free 1 (800) 548-7786 or by visiting our website at www.morganstanley.com/im. This information is also available on the SEC's website at www.sec.gov.
This report is authorized for distribution only when preceded or accompanied by a prospectus or summary prospectus of the applicable Fund of Morgan Stanley Institutional Fund Trust., which describes in detail the Fund's investment policies, risks, fees and expenses. Please read the prospectus carefully before you invest or send money. For additional information, including information regarding the investments comprising the Fund, please visit our website at www.morganstanley.com/im or call toll free 1 (800) 548-7786.
42
(This Page has been left blank intentionally.)
(This Page has been left blank intentionally.)
(This Page has been left blank intentionally.)
Printed in U.S.A.
This Report has been prepared for shareholders and may be distributed to others only if preceded or accompanied by a current prospectus.
Morgan Stanley Investment Management Inc.
522 Fifth Avenue
New York, New York 10036
© 2017 Morgan Stanley. Morgan Stanley Distribution, Inc.

IFTSIPANN
1934386 EXP 11.30.18

Morgan Stanley Institutional Fund Trust
Ultra-Short Income Portfolio
Annual Report
September 30, 2017

Morgan Stanley Institutional Fund Trust
Annual Report — September 30, 2017
Shareholders' Letter | | | 2 | | |
Expense Example | | | 3 | | |
Investment Overview | | | 4 | | |
Portfolio of Investments | | | 8 | | |
Statement of Assets and Liabilities | | | 12 | | |
Statement of Operations | | | 13 | | |
Statements of Changes in Net Assets | | | 14 | | |
Financial Highlights | | | 15 | | |
Notes to Financial Statements | | | 18 | | |
Report of Independent Registered Public Accounting Firm | | | 23 | | |
Investment Advisory Agreement Approval | | | 24 | | |
Privacy Notice | | | 26 | | |
Trustee and Officer Information | | | 29 | | |
This report is authorized for distribution only when preceded or accompanied by a prospectus or summary prospectus of the applicable Fund of the Morgan Stanley Institutional Fund Trust. To receive a prospectus and/or statement of additional information (SAI), which contains more complete information such as investment objectives, charges, expenses, policies for voting proxies, risk considerations, and describes in detail each of the Fund's investment policies to the prospective investor, please call toll free 1 (800) 548-7786. Please read the prospectuses carefully before you invest or send money.
Additionally, you can access information about the Fund, including performance, characteristics, and investment team commentary, through Morgan Stanley Investment Management's website: www.morganstanley.com/im.
Market forecasts provided in this report may not necessarily come to pass. There is no guarantee that any sectors mentioned will continue to perform as discussed herein or that securities in such sectors will be held by the Fund in the future. There is no assurance that a fund will achieve its investment objective. Funds are subject to market risk, which is the possibility that market values of securities owned by the Fund will decline and, therefore, the value of the Fund's shares may be less than what you paid for them. Accordingly, you can lose money investing in this Fund. Please see the prospectus for more complete information on investment risks.
1
Morgan Stanley Institutional Fund Trust
Annual Report — September 30, 2017
Shareholders' Letter (unaudited)
Dear Shareholders,
We are pleased to provide this Annual report, in which you will learn how your investment in Ultra-Short Income Portfolio (the "Fund") performed during the latest twelve-month period.
Morgan Stanley Investment Management is a client-centric, investor-led organization. Our global presence, intellectual capital, and breadth of products and services enable us to partner with investors to meet the evolving challenges of today's financial markets. We aim to deliver superior investment service and to empower our clients to make the informed decisions that help them reach their investment goals.
As always, we thank you for selecting Morgan Stanley Investment Management, and look forward to working with you in the months and years ahead.
Sincerely,

John H. Gernon
President and Principal Executive Officer
October 2017
2
Morgan Stanley Institutional Fund Trust
Annual Report — September 30, 2017
Expense Example (unaudited)
Ultra-Short Income Portfolio
As a shareholder of the Fund, you may incur two types of costs: (1) transactional costs, including sales charge (loads) on purchase payments; and (2) ongoing costs, which may include advisory fees, administration fees, distribution and shareholder services fees; and other Fund expenses. This example is intended to help you understand your ongoing costs (in dollars) of investing in the Fund and to compare these costs with the ongoing costs of investing in other mutual funds.
This example is based on an investment of $1,000 invested at the beginning of the six-month period ended September 30, 2017 and held for the entire six-month period.
Actual Expenses
The table below provides information about actual account values and actual expenses. You may use the information in this table, together with the amount you invested, to estimate the expenses that you paid over the period. Simply divide your account value by $1,000 (for example, an $8,600 account value divided by $1,000 = 8.6), then multiply the result by the number in the table under the heading entitled "Actual Expenses Paid During Period" to estimate the expenses you paid on your account during this period.
Hypothetical Example for Comparison Purposes
The table below provides information about hypothetical account values and hypothetical expenses based on the Fund's actual expense ratio and an assumed rate of return of 5% per year before expenses, which is not the Fund's actual return. The hypothetical account values and expenses may not be used to estimate the actual ending account balance or expenses you paid for the period. You may use this information to compare the ongoing costs of investing in the Fund and other funds. To do so, compare this 5% hypothetical example with the 5% hypothetical examples that appear in the shareholder reports of the other funds.
Please note that the expenses shown in the table are meant to highlight your ongoing costs only and do not reflect any transactional costs, such as sales charges (loads, if applicable). Therefore, the information for each class in the table is useful in comparing ongoing costs only, and will not help you determine the relative total costs of owning different funds. In addition, if these transactional costs were included, your costs would have been higher.
| | | Beginning
Account
Value
4/1/17 | | Actual Ending
Account
Value
9/30/17 | | Hypothetical
Ending Account
Value | | Actual
Expenses
Paid
During
Period* | | Hypothetical
Expenses Paid
During Period* | | Net
Expense
Ratio
During
Period** | |
Ultra-Short Income Portfolio Class IR | | $ | 1,000.00 | | | $ | 1,006.10 | | | $ | 1,023.92 | | | $ | 1.16 | | | $ | 1.17 | | | | 0.23 | % | |
Ultra-Short Income Portfolio Institutional Class | | | 1,000.00 | | | | 1,005.90 | | | | 1,023.66 | | | | 1.41 | | | | 1.42 | | | | 0.28 | | |
Ultra-Short Income Portfolio Class A | | | 1,000.00 | | | | 1,005.80 | | | | 1,022.66 | | | | 2.41 | | | | 2.43 | | | | 0.48 | | |
* Expenses are calculated using each Fund Class' annualized net expense ratio (as disclosed), multiplied by the average account value over the period, and multiplied by 183/365 (to reflect the most recent one-half year period).
** Annualized.
3
Morgan Stanley Institutional Fund Trust
Annual Report — September 30, 2017
Investment Overview (unaudited)
Ultra Short-Income Portfolio
The Fund seeks current income with capital preservation while maintaining liquidity.
Performance
For the fiscal year ended September 30, 2017, the Fund's Institutional Share Class had a total return of 1.13%. The Fund's Institutional Share Class outperformed against the Fund's benchmark, the ICE BofAML 3-Month U.S. Treasury Bill Index (the "Index"), which returned 0.66%. For the seven-day period ended September 30, 2017, the Fund's Institutional Share Class provided an annualized current yield of 1.26% (subsidized) and 1.16% (non-subsidized), while its 30-day moving average annualized yield was 1.25% (subsidized) and 1.17% (non-subsidized). The 30-day SEC yield was 1.24% (subsidized) and 1.15% (non-subsidized). The non-subsidized yield reflects what the yield would have been had a fee and/or expense waiver not been in place during the period shown. Past performance is no guarantee of future results.
Factors Affecting Performance
• Economic conditions and expectations for U.S. central bank policy, along with changes in the regulatory framework for money market funds, were the primary drivers of market dynamics in the short-term fixed income space for the reporting period.
• From an economic perspective, second-half 2016 gross domestic product (GDP) rose at 2.3% annualized.(i) Highlighting the second half was a rise of 2.8% in the third quarter of 2016, led by a rebound in inventories and a jump in the export market. GDP rose 1.2% in the first quarter of 2017, a weak start to the year due to consumer spending growing at the slowest pace since 2013. Second-quarter 2017 GDP growth rebounded and rose to 3.1%, led by strong business equipment spending, which rose the most in almost two years. The improvement in the second quarter confirmed that the slowdown at the start of 2017 was temporary and showed the economy growing at 2.1% in the first half of 2017.
• Despite global uncertainty, U.S. employment data continued to show resiliency in the second half of 2016, averaging 193,000,(ii) compared to 180,000 in the prior six-month period. The participation
rate in the labor force remained at 62.7%, showing no change year-over-year, although the unemployment rate ending 2016 at 4.7% was a noticeable improvement compared to 5% at the end of 2015.
• Through the first quarter of 2017, non-farm payrolls averaged 166,000, beating market consensus in both January and February, but underperforming in March due to weather-related factors.(iii) The unemployment rate ended the first quarter of 2017 at 4.5%, the lowest level since May 2007. Hiring remained strong in the second quarter of 2017, averaging 187,000, highlighted by the outperformance in June with payrolls beating analysts' expectations and rising 210,000 throughout the month. Payroll gains were broad-based but boosted by the biggest jump in government jobs in almost a year. Hiring in the third quarter of 2017 slowed noticeably, averaging 91,000, due to a net decline in September of 33,000, reflecting major disruptions from Hurricanes Harvey and Irma. The unemployment rate ended the quarter at 4.2%, the lowest level since February 2001.
• Monetary policy and geopolitical headlines remained a key driver of sentiment and market performance over the past 12 months. At the September 2016 Federal Open Market Committee ("FOMC" or "Committee") meeting, the Committee left the target range for the federal funds rate unchanged, citing that the risks to the economic outlook remained balanced and, although the case for an increase in policy rates had strengthened, the Committee decided to wait for further progress toward its objectives. The non-hike appeared to be a very close call, as three Committee members dissented against the decision. However, there was a material split in the Committee, as three other members called for no further rate increases for the remainder of the year, blurring the expectations of an additional rate hike before year-end.
• Specific to the regulatory landscape, October 14, 2016 was the implementation date for the Securities and Exchange Commission's (SEC) revised 2a-7 rule, which regulates money market funds.
(i) Source for GDP data: Bureau of Economic Analysis
(ii) Source for employment data: Bureau of Labor Statistics and Bloomberg L.P.
(iii) Source for employment data: Bureau of Labor Statistics and Bloomberg L.P.
4
Morgan Stanley Institutional Fund Trust
Annual Report — September 30, 2017
Investment Overview (unaudited) (cont'd)
Ultra Short-Income Portfolio
Sweeping changes included the mandatory adoption of trigger-based redemption fees and liquidity gates for prime and tax-exempt funds, along with the conversion to floating net asset value. Government and Treasury funds were largely unchanged. Money market fund managers adopted a defensive approach leading up to the reform date, shortening their maturities and increasing liquidity. This caused a shift in the supply/demand equilibrium for credit products, causing a technical imbalance that resulted in a sharp rise for both 3- and 6-month Libor rates. Three-month Libor closed at 0.88% as of October 14, 2016, up over 20 basis points from the start of the third quarter, while 6-month Libor closed at 1.26%, up over 30 basis points from the start of the quarter.(iv) As expected, money market participants shifted over $1 trillion from prime funds into government funds, for the year ended October 31, 2016.(v)
• November 2016 saw two major events. On November 8, 2016, the United States held presidential elections, with Republican candidate Donald Trump defeating Democratic candidate Hillary Clinton. Trump was viewed as a more hawkish candidate, and the U.S. Treasury market reacted accordingly, sending yields higher across the curve. On November 11, 2016, Federal Reserve (Fed) Chair Yellen testified before the Joint Economic Committee in Congress. She signaled that the U.S. central bank was getting closer to lifting interest rates, as the economy continued to create jobs at a healthy rate while inflation inched higher. She warned of the risks of waiting too long before raising rates. In the weeks following her testimony, the market-implied odds of a rate hike at the December 2016 FOMC meeting reached 100%.
• In a unanimous decision, the FOMC raised interest rates for the first time in 2016 at its December meeting, citing strengthening labor markets and increased inflation expectations. The move brought the target for the federal funds rate to a range of 0.50 to 0.75%. The projections showed that central bankers expected three quarter-point rate increases in 2017, up from the two previously forecasted in September. Following the rate hike on December 14, 2016, the Federal Reserve Bank of New York (FRBNY) made adjustments to the
overnight fixed-rate reverse repurchase (or RRP) facility, increasing the offering rate from 25 basis points to 50 basis points, while maintaining a counterparty limit of $30 billion per day.
• The January 2017 FOMC meeting statement was mostly in line with market expectations. The FOMC remained accommodative and kept interest rates on hold at the target range of 0.50 to 0.75%. In its statement, the FOMC expressed continued confidence in both economic activity and the labor market despite a lower-than-expected fourth-quarter 2016 GDP growth result and below-target inflation levels. Job gains remained strong and the unemployment rate remained near recent lows. The Committee expected economic activity would remain strong and expand at a moderate pace, labor market conditions would continue to strengthen and inflation would meet its 2% target over the medium term.
• With the timing of rate hikes still uncertain, market participants in February 2017 focused on Fed Chair Yellen's semi-annual testimony to Congress and the release of the minutes from the January 2017 FOMC meeting. In her testimony before Congress, Chair Yellen took a slightly hawkish tone when she raised concerns about delaying further rate hikes, stating that "waiting too long to remove accommodation would be unwise, potentially requiring the FOMC to eventually raise rates rapidly, which could risk disrupting the financial markets and pushing the economy into a recession." Later in the month, the January 2017 FOMC meeting minutes reiterated Chair Yellen's sentiments, as Fed officials indicated that a hike "fairly soon" might be appropriate to avoid the risk of overheating the market. As a result, market participants increased the odds of a rate hike occurring at the FOMC's next meeting in March 2017.
• In early March 2017, Fed Chair Yellen delivered a speech in which she indicated an interest rate hike would "likely be appropriate" at the upcoming central bank meeting if employment and inflation continued to meet expectations. With positive economic data releases through the first half of the month, the Committee raised its benchmark lending rate a
(iv) Source: Intercontinental Exchange and Bloomberg L.P.
(v) Source: iMoneynet, an Informa business
5
Morgan Stanley Institutional Fund Trust
Annual Report — September 30, 2017
Investment Overview (unaudited) (cont'd)
Ultra Short-Income Portfolio
quarter point to 0.75 to 1.00% at its March meeting. Fed officials reiterated their "gradual" approach to tightening monetary policy, continuing to project two additional hikes in 2017 and three in 2018. The FRBNY adjusted the overnight RRP facility, increasing the offering rate from 50 basis points to 75 basis points, while maintaining a counterparty limit of $30 billion per day.
• In April 2017, the minutes of the March FOMC meeting were released. Notably, most Fed officials backed a policy that would begin shrinking the central bank's $4.5 trillion balance sheet later in the year, while also reiterating their outlook for gradual interest rate increases going forward. The minutes showed that nearly all officials thought the economy was at or near full employment, while inflation remained below their 2% target.
• As widely expected, the FOMC decided to leave interest rates unchanged at its May 2017 meeting. Committee members signaled that a slowing in growth during the first quarter of 2017 was likely transitory, and that near-term risks to the economic outlook remained balanced. Even with an FOMC meeting, May 2017 was dominated by political headlines from France, where pro-European Union candidate Emmanuel Macron won a decisive victory over far-right candidate Marine Le Pen. Macron's victory sent the VIX volatility index to its lowest levels since 1993, removing additional uncertainty from the global market.
• Despite growing concerns over weak inflation, the FOMC decided to raise rates by 25 basis points for the third time in six months at its June 2017 meeting, increasing the target for the federal funds rate to a range of 1.00 to 1.25%. Committee members maintained their outlook for one more hike in 2017 and spelled out details of how they intend to shrink the Fed's $4.5 trillion balance sheet later this year by allowing a fixed amount of assets to roll off on a monthly basis. The timing of implementation was not specified, leading some in the market to believe the Fed might opt for balance sheet reduction in lieu of an additional rate hike in upcoming months.
• The July 2017 FOMC meeting fell fairly in line with market expectations, with no change in
interest rates. The Fed said it would start winding down its $4.5 trillion balance sheet "relatively soon," which the markets interpreted as likely to be announced at the September 2017 FOMC meeting. The Committee also indicated concern that inflation remains below the 2% target. Despite the weakness in inflation, the FOMC believed inflation would eventually rebound and stabilize to its target, albeit slower than expected.
• As widely expected, the Fed left its benchmark policy rate unchanged at the conclusion of its September 2017 FOMC meeting, while announcing that it will begin shrinking its $4.5 trillion balance sheet starting in October 2017. The "dot plot" indicated that policy makers expect one more rate increase in 2017 and three more in 2018. The Fed said the balance-sheet runoff would follow the framework released in June 2017: reducing $6 billion in Treasuries and $4 billion in mortgage-backed securities per month, with the cap rising every three months until the amounts reach $30 billion and $20 billion per month, respectively.
Management Strategies
• Our investment philosophy continues to revolve around prudent credit, duration, and risk management.
• We continued to manage the Fund to help minimize interest rate sensitivity in a rising rate environment, which was beneficial to performance as short-term rates rose during the period.
• There were no material detractors from performance both on an absolute and relative basis in this reporting period.
6
Morgan Stanley Institutional Fund Trust
Annual Report — September 30, 2017
Investment Overview (unaudited) (cont'd)
Ultra Short-Income Portfolio
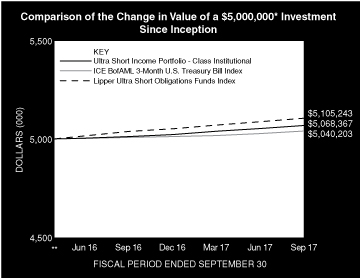
* Minimum Investment
** Commenced operations on April 28, 2016.
In accordance with SEC regulations, the Fund's performance shown assumes that all recurring fees (including management fees) were deducted and all dividends and distributions were reinvested. The performance of Class A, and Class IR shares will vary from the performance of Class Institutional shares and will be negatively impacted by additional fees assessed to those classes (where applicable).
Performance Compared to the ICE BofAML 3-Month U.S. Treasury Bill Index(1), and the Lipper Ultra Short Obligations Funds Index(2)
| | | Period Ended September 30, 2017
Total Returns(3) | |
| | | | | Average Annual | |
| | | One
Year | | Five
Years | | Ten
Years | | Since
Inception(5) | |
Fund — Class IR Shares
w/o sales charges(4) | | | 1.18 | % | | | — | | | | — | | | | 1.01 | % | |
Fund — Class Institutional
Shares w/o sales charges(4) | | | 1.13 | | | | — | | | | — | | | | 0.96 | | |
Fund — Class A Shares
w/o sales charges(4) | | | 0.92 | | | | — | | | | — | | | | 0.74 | | |
ICE BofAML 3-Month U.S. Treasury
Bill Index | | | 0.66 | | | | — | | | | — | | | | 0.56 | | |
Lipper Ultra Short Obligations
Funds Index | | | 1.33 | | | | — | | | | — | | | | 1.47 | | |
Performance data quoted represents past performance, which is no guarantee of future results, and current performance may be lower or higher than the figures shown. Performance assumes that all dividends and distributions, if any, were reinvested. For the most recent month-end performance figures, please visit www.morganstanley.com/im. Investment returns and principal value will fluctuate so that Fund shares, when redeemed, may be worth more or less than their original cost. Total returns do not reflect the deduction of taxes that a shareholder would pay on Fund distributions or the redemption of Fund shares. Performance of share classes will vary due to differences in expenses.
(1) The ICE BofAML (Intercontinental Exchange Bank of America Merrill Lynch) 3-Month U.S. Treasury Bill Index tracks the performance of U.S. Treasury bills with a remaining maturity of three months. The Index is unmanaged and its returns do not include any sales charges or fees. Such costs would lower performance. It is not possible to invest directly in an index.
(2) The Lipper Ultra Short Obligations Funds Index is an equally weighted performance index of the largest qualifying funds (based on net assets) in the Lipper Ultra Short Obligations Funds classification. The Index, which is adjusted for capital gains distributions and income dividends, is unmanaged and should not be considered an investment. There are currently 30 funds represented in this Index. As of the date of this report, the Fund was in the Lipper Ultra Short Obligations' Funds classification.
(3) Total returns for the Fund reflect expenses waived and/or reimbursed, if applicable, by the Adviser. Without such waivers and/or reimbursements, total returns would have been lower.
(4) Commenced operations on April 28, 2016.
(5) For comparative purposes, average annual since inception returns listed for the Indexes refer to the inception date of the Fund, not the inception of the Indexes.
7
Morgan Stanley Institutional Fund Trust
Annual Report — September 30, 2017
Portfolio of Investments
Ultra Short-Income Portfolio
| | | Face
Amount
(000) | | Value
(000) | |
Certificates of Deposit (5.2%) | |
Domestic Banks (1.3%) | |
Citibank NA, | |
1.42%, 12/14/17 - 12/19/17 | | $ | 71,000 | | | $ | 71,018 | | |
International Banks (3.9%) | |
KBC Bank N.V. | |
1.40%, 12/14/17 | | | 155,000 | | | | 154,531 | | |
Sumitomo Mitsui Trust Bank Ltd. | |
1.41%, 12/14/17 | | | 55,000 | | | | 54,853 | | |
| | | | 209,384 | | |
Total Certificates of Deposit (Cost $280,372) | | | 280,402 | | |
Commercial Paper (a) (13.8%) | |
Automobiles (0.9%) | |
Ford Motor Credit Co., LLC | |
1.45%, 11/17/17 | | | 50,000 | | | | 49,896 | | |
Chemicals (0.9%) | |
EI du Pont de Nemours & Co. | |
1.46%, 12/14/17 | | | 50,000 | | | | 49,844 | | |
Computer Technology (1.0%) | |
HP, Inc. | |
1.71%, 3/22/18 | | | 54,000 | | | | 53,652 | | |
Domestic Banks (0.9%) | |
ABN Amro Funding USA LLC, | |
1.43%, 12/18/17 | | | 24,000 | | | | 23,931 | | |
1.48%, 1/5/18 | | | 25,000 | | | | 24,910 | | |
| | | | 48,841 | | |
Health Care Services (1.0%) | |
McKesson Corp. | |
1.36%, 10/2/17 | | | 50,000 | | | | 49,995 | | |
Hospitality (0.9%) | |
Marriott International | |
1.50%, 11/1/17 | | | 50,000 | | | | 49,936 | | |
International Banks (8.2%) | |
Banque Et Caisse, | |
1.43%, 1/4/18 | | | 20,000 | | | | 19,933 | | |
1.45%, 1/12/18 - 1/23/18 | | | 74,000 | | | | 73,707 | | |
| BPCE SA | |
1.45%, 12/1/17 | | | 27,500 | | | | 27,442 | | |
DZ Privatbank SA, | |
1.50%, 1/12/18 | | | 60,000 | | | | 59,767 | | |
1.57%, 3/22/18 | | | 65,000 | | | | 64,559 | | |
Erste Abwicklungsanstalt | |
1.36%, 12/15/17 | | | 26,000 | | | | 25,929 | | |
Macquarie Bank Ltd., | |
1.40%, 12/14/17 | | | 50,000 | | | | 49,856 | | |
1.44%, 11/27/17 | | | 35,000 | | | | 34,929 | | |
Suncorp-Metway Ltd., | |
1.41%, 12/18/17 | | | 5,000 | | | | 4,985 | | |
1.42%, 12/14/17 - 12/19/17 | | | 25,000 | | | | 24,925 | | |
| | | Face
Amount
(000) | | Value
(000) | |
1.51%, 3/20/18 | | $ | 55,000 | | | $ | 54,602 | | |
| | | | 440,634 | | |
Total Commercial Paper (Cost $742,625) | | | 742,798 | | |
Corporate Bonds (4.0%) | |
International Banks (4.0%) | |
ANZ New Zealand International Ltd. | |
1.75%, 3/29/18 (b) | | | 14,114 | | | | 14,133 | | |
BNZ International Funding Ltd. | |
1.90%, 2/26/18 (b) | | | 31,650 | | | | 31,689 | | |
| BPCE SA | |
1.63%, 1/26/18 (c) | | | 6,600 | | | | 6,601 | | |
Caisse Centrale Desjardins | |
1.75%, 1/29/18 (b) | | | 7,491 | | | | 7,498 | | |
Credit Suisse AG | |
1.75%, 1/29/18 | | | 75,318 | | | | 75,381 | | |
ING Bank N.V. | |
1.80%, 3/16/18 (b) | | | 13,221 | | | | 13,239 | | |
Mizuho Bank Ltd., | |
1.80%, 3/26/18 (b) | | | 5,390 | | | | 5,396 | | |
1.85%, 3/21/18 (b) | | | 10,820 | | | | 10,831 | | |
Sumitomo Mitsui Trust Bank Ltd. | |
1.80%, 3/28/18 (b) | | | 11,206 | | | | 11,220 | | |
Swedbank AB | |
1.75%, 3/12/18 (b) | | | 6,830 | | | | 6,833 | | |
UBS AG, | |
1.80%, 3/26/18 | | | 29,950 | | | | 30,001 | | |
5.88%, 12/20/17 | | | 4,980 | | | | 5,026 | | |
Total Corporate Bonds (Cost $217,818) | | | 217,848 | | |
Floating Rate Notes (55.7%) | |
Automobiles (2.6%) | |
Toyota Motor Credit Corp., | |
3 Month USD LIBOR + 0.12%,
1.44%, 3/15/18 | | | 50,000 | | | | 50,029 | | |
Toyota Motor Finance Netherlands, | |
1 Month USD LIBOR + 0.19%,
1.43%, 2/22/18 | | | 60,000 | | | | 60,031 | | |
1 Month USD LIBOR + 0.20%,
1.44%, 4/24/18 | | | 31,000 | | | | 31,012 | | |
| | | | 141,072 | | |
Diversified Financial Services (1.8%) | |
Collateralized Commercial Paper Co., LLC, | |
1 Month USD LIBOR + 0.22%,
1.45%, 5/11/18 | | | 30,000 | | | | 30,003 | | |
1 Month USD LIBOR + 0.22%,
1.46%, 5/23/18 | | | 10,000 | | | | 10,000 | | |
Collateralized Commercial Paper II Co., LLC, | |
3 Month USD LIBOR + 0.12%,
1.45%, 12/27/17 (b) | | | 30,000 | | | | 30,013 | | |
3 Month USD LIBOR + 0.14%,
1.47%, 3/26/18 (b) | | | 25,000 | | | | 25,007 | | |
| | | | 95,023 | | |
The accompanying notes are an integral part of the financial statements.
8
Morgan Stanley Institutional Fund Trust
Annual Report — September 30, 2017
Portfolio of Investments (cont'd)
Ultra Short-Income Portfolio
| | | Face
Amount
(000) | | Value
(000) | |
Domestic Banks (7.1%) | |
Bank of America NA, | |
1 Month LIBOR + 0.25%, 1.47%, 11/17/17 | | $ | 25,000 | | | $ | 25,001 | | |
1 Month LIBOR + 0.40%, 1.62%, 10/16/17 | | | 15,000 | | | | 15,000 | | |
HSBC Bank USA NA, | |
1 Month USD LIBOR + 0.20%,
1.44%, 7/25/18 | | | 25,000 | | | | 25,009 | | |
3 Month USD LIBOR + 0.33%,
1.64%, 2/1/18 | | | 10,000 | | | | 10,012 | | |
1 Month USD LIBOR + 0.49%,
1.73%, 10/11/17 | | | 25,000 | | | | 25,005 | | |
ING US Funding LLC, | |
1 Month USD LIBOR + 0.24%,
1.47%, 5/4/18 | | | 125,000 | | | | 125,031 | | |
1 Month USD LIBOR + 0.33%,
1.57%, 1/26/18 | | | 50,000 | | | | 50,040 | | |
Mizuho Securities USA LLC, | |
3 Month USD LIBOR + 0.41%,
1.72%, 2/16/18 | | | 25,000 | | | | 25,009 | | |
3 Month USD LIBOR + 0.46%,
1.77%, 1/22/18 | | | 35,000 | | | | 35,015 | | |
1 Month USD LIBOR + 0.54%,
1.78%, 10/11/17 | | | 35,000 | | | | 35,000 | | |
Wells Fargo Bank NA. | |
1 Month USD LIBOR + 0.54%.
1.78%, 1/24/18 | | | 15,000 | | | | 15,022 | | |
| | | | 385,144 | | |
International Banks (44.2%) | |
ANZ New Zealand International Ltd., | |
1 Month USD LIBOR + 0.20%,
1.44%, 5/21/18 (b) | | | 40,000 | | | | 40,019 | | |
3 Month USD LIBOR + 0.15%,
1.48%, 6/21/18 (b) | | | 125,000 | | | | 125,086 | | |
ASB Finance Ltd. London, | |
1 Month USD LIBOR + 0.22%,
1.45%, 8/28/18 (b) | | | 110,000 | | | | 110,050 | | |
3 Month USD LIBOR + 0.15%,
1.48%, 6/21/18 (b) | | | 50,000 | | | | 50,036 | | |
1 Month USD LIBOR + 0.46%,
1.69%, 2/15/18 (b) | | | 25,000 | | | | 25,035 | | |
Bank of Montreal, | |
3 Month USD LIBOR + 0.12%,
1.44%, 6/26/18 | | | 50,000 | | | | 49,973 | | |
1 Month USD LIBOR + 0.22%,
1.45%, 8/7/18 | | | 68,500 | | | | 68,508 | | |
1 Month USD LIBOR + 0.54%,
1.78%, 1/11/18 | | | 15,000 | | | | 15,020 | | |
3 Month USD LIBOR + 0.55%,
1.87%, 12/11/17 | | | 16,600 | | | | 16,621 | | |
Bank of Nova Scotia, | |
3 Month USD LIBOR + 0.14%,
1.47%, 9/20/18 (b) | | | 30,000 | | | | 30,010 | | |
3 Month USD LIBOR + 0.34%,
1.67%, 12/19/17 | | | 25,000 | | | | 25,022 | | |
| | | Face
Amount
(000) | | Value
(000) | |
Barclays Bank PLC, | |
1 Month USD LIBOR + 0.49%,
1.73%, 2/20/18 | | $ | 15,000 | | | $ | 15,012 | | |
3 Month USD LIBOR + 0.42%,
1.75%, 3/26/18 | | | 75,000 | | | | 75,058 | | |
BNP Paribas SA, | |
3 Month USD LIBOR + 0.29%,
1.62%, 3/27/18 | | | 50,000 | | | | 50,056 | | |
BNZ International Funding Ltd., | |
3 Month USD LIBOR + 0.15%,
1.47%, 6/14/18 (b) | | | 80,000 | | | | 80,053 | | |
3 Month USD LIBOR + 0.15%,
1.48%, 9/24/18 (b) | | | 35,000 | | | | 35,021 | | |
Canadian Imperial Bank of Commerce, | |
1 Month USD LIBOR + 0.19%,
1.43%, 5/22/18 (b) | | | 75,000 | | | | 75,011 | | |
1 Month USD LIBOR + 0.49%,
1.72%, 2/2/18 (b) | | | 25,000 | | | | 25,036 | | |
Commonwealth Bank of Australia, | |
1 Month USD LIBOR + 0.37%,
1.61%, 2/23/18 (b) | | | 20,000 | | | | 20,024 | | |
3 Month USD LIBOR + 0.30%,
1.61%, 11/3/17 (b) | | | 4,536 | | | | 4,538 | | |
3 Month USD LIBOR + 0.40%,
1.70%, 10/12/17 (b) | | | 10,000 | | | | 10,002 | | |
3 Month USD LIBOR + 0.40%,
1.71%, 3/12/18 (b) | | | 1,550 | | | | 1,552 | | |
1 Month USD LIBOR + 0.52%,
1.75%, 1/12/18 (b) | | | 39,700 | | | | 39,753 | | |
Credit Suisse AG, | |
1 Month USD LIBOR + 0.26%,
1.50%, 4/26/18 | | | 135,000 | | | | 135,059 | | |
1 Month USD LIBOR + 0.30%,
1.54%, 11/20/17 | | | 35,000 | | | | 35,016 | | |
3 Month USD LIBOR + 0.68%,
2.00%, 4/27/18 | | | 4,800 | | | | 4,817 | | |
HSBC Bank PLC, | |
3 Month USD LIBOR + 0.14%,
1.47%, 6/25/18 (b) | | | 60,000 | | | | 60,047 | | |
1 Month USD LIBOR + 0.33%,
1.57%, 3/20/18 (b) | | | 25,000 | | | | 25,029 | | |
1 Month USD LIBOR + 0.51%,
1.75%, 2/9/18 (b) | | | 25,000 | | | | 25,040 | | |
ING Bank N.V., | |
3 Month USD LIBOR + 0.55%,
1.87%, 3/16/18 (b) | | | 13,412 | | | | 13,439 | | |
Lloyds Bank PLC, | |
3 Month USD LIBOR + 0.18%,
1.51%, 6/25/18 | | | 75,000 | | | | 75,072 | | |
3 Month USD LIBOR + 0.25%,
1.56%, 4/26/18 | | | 50,000 | | | | 50,065 | | |
Mizuho Bank Ltd., | |
3 Month USD LIBOR + 0.64%,
1.97%, 3/26/18 (b) | | | 57,700 | | | | 57,841 | | |
3 Month USD LIBOR + 0.70%,
2.02%, 12/12/17 | | | 10,300 | | | | 10,316 | | |
The accompanying notes are an integral part of the financial statements.
9
Morgan Stanley Institutional Fund Trust
Annual Report — September 30, 2017
Portfolio of Investments (cont'd)
Ultra Short-Income Portfolio
| | | Face
Amount
(000) | | Value
(000) | |
International Banks (cont'd) | |
National Australia Bank Ltd., | |
1 Month USD LIBOR + 0.30%,
1.54%, 3/27/18 (b) | | $ | 30,000 | | | $ | 30,028 | | |
1 Month USD LIBOR + 0.35%,
1.58%, 3/1/18 (b) | | | 50,000 | | | | 50,053 | | |
1 Month USD LIBOR + 0.40%,
1.64%, 2/21/18 (b) | | | 20,000 | | | | 20,024 | | |
1 Month USD LIBOR + 0.51%,
1.74%, 1/4/18 (b) | | | 10,000 | | | | 10,012 | | |
1 Month USD LIBOR + 0.51%,
1.75%, 11/17/17 (b) | | | 10,000 | | | | 10,007 | | |
Natixis NY, | |
3 Month USD LIBOR + 0.31%,
1.63%, 5/18/18 | | | 75,000 | | | | 75,089 | | |
Royal Bank of Canada, | |
1 Month USD LIBOR + 0.20%,
1.44%, 7/24/18 | | | 75,000 | | | | 75,007 | | |
1 Month USD LIBOR + 0.32%,
1.56%, 3/20/18 | | | 30,000 | | | | 30,030 | | |
1 Month USD LIBOR + 0.46%,
1.70%, 10/24/17 | | | 9,000 | | | | 9,003 | | |
Sumitomo Mitsui Trust Bank Ltd., | |
3 Month USD LIBOR + 0.20%,
1.53%, 9/25/18 | | | 50,000 | | | | 49,857 | | |
Toronto Dominion Bank, | |
3 Month USD LIBOR + 0.64%,
1.44%, 8/21/18 (b) | | | 50,000 | | | | 50,008 | | |
1 Month USD LIBOR + 0.32%,
1.56%, 3/20/18 | | | 25,000 | | | | 25,028 | | |
1 Month USD LIBOR + 0.34%,
1.57%, 3/5/18 | | | 20,000 | | | | 20,022 | | |
3 Month USD LIBOR + 0.32%,
1.62%, 1/10/18 | | | 5,000 | | | | 5,005 | | |
1 Month USD LIBOR + 0.40%,
1.64%, 2/21/18 | | | 20,000 | | | | 20,026 | | |
1 Month USD LIBOR + 0.41%,
1.64%, 11/6/17 | | | 20,000 | | | | 20,009 | | |
3 Month USD LIBOR + 0.40%,
1.70%, 10/17/17 | | | 10,000 | | | | 10,003 | | |
1 Month USD LIBOR + 0.52%,
1.76%,
11/20/17 - 1/16/18 | | | 65,000 | | | | 65,072 | | |
UBS AG, | |
1 Month USD LIBOR + 0.45%,
1.44%, 11/16/17 | | | 14,000 | | | | 14,010 | | |
1 Month USD LIBOR + 0.25%,
1.49%, 5/21/18 | | | 75,000 | | | | 75,016 | | |
1 Month USD LIBOR + 0.50%,
1.73%, 11/6/17 | | | 40,000 | | | | 40,022 | | |
3 Month USD LIBOR + 0.70%,
2.03%, 3/26/18 | | | 99,421 | | | | 99,718 | | |
Westpac Banking Corp., | |
1 Month USD LIBOR + 0.32%,
1.55%, 3/15/18 (b) | | | 30,000 | | | | 30,030 | | |
1 Month USD LIBOR + 0.41%,
1.64%, 2/16/18 (b) | | | 10,000 | | | | 10,012 | | |
| | | Face
Amount
(000) | | Value
(000) | |
1 Month USD LIBOR + 0.44%,
1.68%, 2/9/18 (b) | | $ | 20,000 | | | $ | 20,025 | | |
1 Month USD LIBOR + 0.47%,
1.71%, 1/26/18 (b) | | | 23,000 | | | | 23,029 | | |
1 Month USD LIBOR + 0.52%,
1.75%, 1/8/18 (b) | | | 15,000 | | | | 15,019 | | |
1 Month USD LIBOR + 0.54%,
1.77%, 11/2/17 (b) | | | 7,000 | | | | 7,004 | | |
| | | | 2,386,405 | | |
Total Floating Rate Notes (Cost $3,006,028) | | | 3,007,644 | | |
Repurchase Agreements (21.2%) | |
ABN Amro Securities LLC, (1.26%,
dated 9/29/17, due 10/2/17;
proceeds $16,002; fully collateralized
by various Corporate Bonds;
1.38% - 6.90% due 6/15/18 - 6/15/47;
valued at $16,800) | | | 16,000 | | | | 16,000 | | |
Bank of Montreal, (1.26%,
dated 9/29/17, due 10/2/17;
proceeds $33,003; fully collateralized
by various Corporate Bonds;
1.10% - 8.40% due 10/25/17 - 3/28/25;
valued at $34,650) | | | 33,000 | | | | 33,000 | | |
Bank of Montreal, (1.28%, dated 9/7/17,
due 10/5/17; proceeds $32,032;
fully collateralized by various Corporate
Bonds; 1.63% - 5.15%
due 1/18/19 - 8/14/27;
valued at $33,649) (Demand 10/5/17) | | | 32,000 | | | | 32,000 | | |
Citigroup Global Markets, Inc., (1.31%,
dated 9/29/17, due 10/2/17;
proceeds $9,001; fully collateralized
by various Common Stocks;
valued at $9,450) | | | 9,000 | | | | 9,000 | | |
HSBC Securities USA, Inc., (1.26%,
dated 9/29/17, due 10/2/17;
proceeds $21,002; fully collateralized
by various Corporate Bonds;
1.97% - 6.20% due 3/15/18 - 1/15/46;
valued at $22,051) | | | 21,000 | | | | 21,000 | | |
HSBC Securities USA, Inc., (1.36%,
dated 9/29/17, due 10/2/17;
proceeds $3,000; fully collateralized by
a Corporate Bond, 12.50% due 7/1/22;
valued at $3,185) | | | 3,000 | | | | 3,000 | | |
ING Financial Markets LLC, (1.21%,
dated 9/29/17, due 10/2/17;
proceeds $18,002; fully collateralized by
various Corporate Bonds; 2.20% - 7.63%
due 9/1/18 - 4/15/32; valued at $18,901) | | | 18,000 | | | | 18,000 | | |
ING Financial Markets LLC, (1.39%,
dated 9/29/17, due 10/2/17; proceeds
$13,002; fully collateralized by various
Corporate Bonds; 5.75% -10.00%
due 4/1/19 - 7/15/25; valued at $13,785) | | | 13,000 | | | | 13,000 | | |
JP Morgan Securities LLC, (1.80%,
dated 4/20/17, due 1/22/18; proceeds
$172,349; fully collateralized by various
Corporate Bonds; 4.63% -12.50%
due 6/1/18 - 6/15/27; valued at $180,202)
(Demand 10/20/17) | | | 170,000 | | | | 170,000 | | |
The accompanying notes are an integral part of the financial statements.
10
Morgan Stanley Institutional Fund Trust
Annual Report — September 30, 2017
Portfolio of Investments (cont'd)
Ultra Short-Income Portfolio
| | | Face
Amount
(000) | | Value
(000) | |
Repurchase Agreements (cont'd) | |
Merrill Lynch Pierce Fenner & Smith, (1.74%,
dated 8/7/17, due 11/27/17;
proceeds $20,108; fully collateralized
by various Common Stocks and various
Preferred Stocks; valued at $21,000)
(Demand 11/21/17) | | $ | 20,000 | | | $ | 20,000 | | |
Merrill Lynch Pierce Fenner & Smith,
(1.74%, dated 5/10/17, due 11/22/17;
proceeds $126,183; fully collateralized
by various Common Stocks , a U.S.
Government obligation 3.00% due 11/15/44
and various Preferred Stocks;
valued at $130,375) (Demand 11/21/17) | | | 125,000 | | | | 125,000 | | |
Merrill Lynch Pierce Fenner & Smith, (1.74%,
dated 5/25/17, due 11/22/17;
proceeds $25,218; fully collateralized
by various Common Stocks and various
Preferred Stocks; valued at $26,250)
(Demand 11/21/17) | | | 25,000 | | | | 25,000 | | |
Merrill Lynch Pierce Fenner & Smith, (1.74%,
dated 8/22/17, due 11/22/17;
proceeds $20,089; fully collateralized
by various Common Stocks and various
Preferred Stocks; valued at $21,000)
(Demand 11/21/17) | | | 20,000 | | | | 20,000 | | |
Pershing LLC, (1.37%, dated 9/29/17,
due 10/2/17; proceeds $200,023;
fully collateralized by various Corporate
Bonds; 1.20% - 11.50%
due 10/15/17 - 11/15/95; valued at
$211,063) (d) | | | 200,000 | | | | 200,000 | | |
Scotia Capital USA, Inc., (1.36%,
dated 9/29/17, due 10/2/17;
proceeds $214,024; fully collateralized
by various Corporate Bonds; 2.38% - 8.75%
due 11/1/17 - 12/1/22; valued at $226,800) | | | 214,000 | | | | 214,000 | | |
Wells Fargo Securities LLC, (1.26%,
dated 9/29/17, due 10/2/17;
proceeds $14,001; fully collateralized
by various Corporate Bonds; 1.33% - 3.58%
due 12/19/17 - 5/22/28; valued at $14,700) | | | 14,000 | | | | 14,000 | | |
Wells Fargo Securities LLC, (1.31%,
dated 9/29/17, due 10/2/17;
proceeds $42,005; fully collateralized
by various Common Stocks and various
Preferred Stocks; valued at $44,100) | | | 42,000 | | | | 42,000 | | |
Wells Fargo Securities LLC, (1.73%,
dated 9/21/17, due 12/14/17; proceeds
$170,686; fully collateralized by various
Corporate Bonds; 1.65% - 8.50%
due 11/15/17 - 12/1/86;
valued at $178,489) (d) | | | 170,000 | | | | 170,000 | | |
Total Repurchase Agreements (Cost $1,145,000) | | | 1,145,000 | | |
Total Investments (99.9%) (Cost $5,391,843) (e)(f) | | | 5,393,692 | | |
Other Assets in Excess of Liabilities (0.1%) | | | 5,828 | | |
Net Assets (100.0%) | | $ | 5,399,520 | | |
(a) The rates shown are the effective yields at the date of purchase.
(b) 144A security — Certain conditions for public sale may exist. Unless otherwise noted, these securities are deemed to be liquid.
(c) Security is subject to delayed delivery.
(d) Perpetual — One or more securities do not have a predetermined maturity date. Rates for these securities are fixed for a period of time, after which they revert to a floating rate. Interest rates in effect are as of September 30, 2017.
(e) Securities are available for collateral in connection with securities purchased on a forward commitment basis.
(f) At September 30, 2017, the aggregate cost for federal income tax purposes is approximately $5,391,843,000. The aggregate gross unrealized appreciation is approximately $2,069,000 and the aggregate gross unrealized depreciation is approximately $220,000, resulting in net unrealized appreciation of approximately $1,849,000.
LIBOR London Interbank Offered Rate.
Portfolio Composition
Classification | | Percentage of
Total Investments | |
Floating Rate Notes | | | 55.8 | % | |
Repurchase Agreements | | | 21.2 | | |
Commercial Paper | | | 13.8 | | |
Certificates of Deposit | | | 5.2 | | |
Other* | | | 4.0 | | |
Total Investments | | | 100.0 | % | |
* Industries and/or investment types representing less than 5% of total investments.
The accompanying notes are an integral part of the financial statements.
11
Morgan Stanley Institutional Fund Trust
Annual Report — September 30, 2017
Ultra-Short Income Portfolio
Statement of Assets and Liabilities | | September 30, 2017
(000) | |
Assets: | |
Investments in Securities of Unaffiliated Issuers, at Value (Cost $5,391,843, including value of repurchases agreements of $1,145,000) | | $ | 5,393,692 | | |
Cash | | | 738 | | |
Receivable for Fund Shares Sold | | | 36,631 | | |
Interest Receivable | | | 2,980 | | |
Other Assets | | | 493 | | |
Total Assets | | | 5,434,534 | | |
Liabilities: | |
Payable for Fund Shares Redeemed | | | 31,882 | | |
Payable for Advisory Fees | | | 1,582 | | |
Payable for Shareholder Services Fees — Institutional Class | | | 70 | | |
Payable for Shareholder Services Fees — Class A | | | 515 | | |
Payable for Administration Fees | | | 352 | | |
Payable for Investments Purchased | | | 251 | | |
Dividends Payable | | | 251 | | |
Payable for Custodian Fees | | | 36 | | |
Payable for Professional Fees | | | 33 | | |
Payable for Transfer Agency Fees — Class IR | | | 1 | | |
Payable for Transfer Agency Fees — Institutional Class | | | 1 | | |
Payable for Transfer Agency Fees — Class A | | | 1 | | |
Other Liabilities | | | 39 | | |
Total Liabilities | | | 35,014 | | |
Net Assets | | $ | 5,399,520 | | |
Net Assets Consist of: | |
Paid-in-Capital | | $ | 5,397,514 | | |
Distributions in Excess of Net Investment Income | | | (171 | ) | |
Accumulated Undistributed Net Realized Gain | | | 328 | | |
Unrealized Appreciation (Depreciation) on: | |
Investments | | | 1,849 | | |
Net Assets | | $ | 5,399,520 | | |
CLASS IR: | |
Net Assets | | $ | 1,122,452 | | |
| Shares Outstanding (unlimited number of shares authorized, no par value) (not in 000's) | | | 112,106,714 | | |
Net Asset Value, Offering and Redemption Price Per Share | | $ | 10.01 | | |
Institutional Class: | |
Net Assets | | $ | 1,695,589 | | |
| Shares Outstanding (unlimited number of shares authorized, no par value) (not in 000's) | | | 169,429,845 | | |
Net Asset Value, Offering and Redemption Price Per Share | | $ | 10.01 | | |
CLASS A: | |
Net Assets | | $ | 2,581,479 | | |
| Shares Outstanding (unlimited number of shares authorized, no par value) (not in 000's) | | | 257,980,996 | | |
Net Asset Value, Offering and Redemption Price Per Share | | $ | 10.01 | | |
The accompanying notes are an integral part of the financial statements.
12
Morgan Stanley Institutional Fund Trust
Annual Report — September 30, 2017
Ultra-Short Income Portfolio
Statement of Operations | | Year Ended
September 30, 2017
(000) | |
Investment Income: | |
Interest from Securities of Unaffiliated Issuers | | $ | 42,811 | | |
Expenses: | |
Advisory Fees (Note B) | | | 6,239 | | |
Shareholder Services Fees — Institutional Class (Note D) | | | 557 | | |
Shareholder Services Fees — Class A (Note D) | | | 3,457 | | |
Administration Fees (Note C) | | | 2,496 | | |
Registration Fees | | | 231 | | |
Professional Fees | | | 127 | | |
Custodian Fees (Note F) | | | 74 | | |
Offering Costs | | | 73 | | |
Trustees' Fees and Expenses | | | 51 | | |
Shareholder Reporting Fees | | | 35 | | |
Pricing Fees | | | 10 | | |
Transfer Agency Fees — Class IR (Note E) | | | 3 | | |
Transfer Agency Fees — Institutional Class (Note E) | | | 2 | | |
Transfer Agency Fees — Class A (Note E) | | | 2 | | |
Other Expenses | | | 87 | | |
Total Expenses | | | 13,444 | | |
Waiver of Advisory Fees (Note B) | | | (2,562 | ) | |
Reimbursement of Class Specific Expenses — Class IR (Note B) | | | (1 | ) | |
Reimbursement of Class Specific Expenses — Institutional Class (Note B) | | | (4 | ) | |
Net Expenses | | | 10,877 | | |
Net Investment Income | | | 31,934 | �� | |
Realized Gain: | |
Investments Sold | | | 344 | | |
Change in Unrealized Appreciation (Depreciation): | |
Investments | | | 1,700 | | |
Net Realized Gain and Change in Unrealized Appreciation (Depreciation) | | | 2,044 | | |
Net Increase in Net Assets Resulting from Operations | | $ | 33,978 | | |
The accompanying notes are an integral part of the financial statements.
13
Morgan Stanley Institutional Fund Trust
Annual Report — September 30, 2017
Ultra-Short Income Portfolio
Statements of Changes in Net Assets | | Year Ended
September 30, 2017
(000) | | Period from
April 28, 2016^ to
September 30, 2016
(000) | |
Increase (Decrease) in Net Assets: | |
Operations: | |
Net Investment Income | | $ | 31,934 | | | $ | 903 | | |
Net Realized Gain | | | 344 | | | | 36 | | |
Net Change in Unrealized Appreciation (Depreciation) | | | 1,700 | | | | 149 | | |
Net Increase in Net Assets Resulting from Operations | | | 33,978 | | | | 1,088 | | |
Distributions from and/or in Excess of: | |
Class IR: | |
Net Investment Income | | | (7,247 | ) | | | (676 | ) | |
Net Realized Gain | | | (6 | ) | | | — | | |
Institutional Class: | |
Net Investment Income | | | (12,198 | ) | | | (185 | ) | |
Net Realized Gain | | | (22 | ) | | | — | | |
Class A: | |
Net Investment Income | | | (12,636 | ) | | | (67 | ) | |
Net Realized Gain | | | (24 | ) | | | — | | |
Total Distributions | | | (32,133 | ) | | | (928 | ) | |
Capital Share Transactions:(1) | |
Class IR: | |
Subscribed | | | 1,819,409 | | | | 302,012 | | |
Distributions Reinvested | | | 5,461 | | | | 55 | | |
Redeemed | | | (979,149 | ) | | | (25,833 | ) | |
Institutional Class: | |
Subscribed | | | 3,111,830 | | | | 229,457 | | |
Distributions Reinvested | | | 12,171 | | | | 154 | | |
Redeemed | | | (1,625,188 | ) | | | (33,552 | ) | |
Class A: | |
Subscribed | | | 4,070,183 | | | | 180,915 | | |
Distributions Reinvested | | | 12,590 | | | | 61 | | |
Redeemed | | | (1,666,600 | ) | | | (16,461 | ) | |
Net Increase in Net Assets Resulting from Capital Share Transactions | | | 4,760,707 | | | | 636,808 | | |
Total Increase in Net Assets | | | 4,762,552 | | | | 636,968 | | |
Net Assets: | |
Beginning of Period | | | 636,968 | | | | — | | |
End of Period (Including Distributions in Excess of Net Investment Income of $(171) and $(25)) | | $ | 5,399,520 | | | $ | 636,968 | | |
(1) Capital Share Transactions:
Class IR: | | | | | | | | | |
Shares Subscribed | | | 181,762 | | | | 30,201 | | |
Shares Issued on Distributions Reinvested | | | 545 | | | | 5 | | |
Shares Redeemed | | | (97,824 | ) | | | (2,583 | ) | |
Net Increase in Class IR Shares Outstanding | | | 84,483 | | | | 27,623 | | |
Institutional Class: | |
Shares Subscribed | | | 311,017 | | | | 22,946 | | |
Shares Issued on Distributions Reinvested | | | 1,216 | | | | 15 | | |
Shares Redeemed | | | (162,409 | ) | | | (3,355 | ) | |
Net Increase in Institutional Class Shares Outstanding | | | 149,824 | | | | 19,606 | | |
Class A: | |
Shares Subscribed | | | 406,818 | | | | 18,092 | | |
Shares Issued on Distributions Reinvested | | | 1,258 | | | | 6 | | |
Shares Redeemed | | | (166,547 | ) | | | (1,646 | ) | |
Net Increase in Class A Shares Outstanding | | | 241,529 | | | | 16,452 | | |
^ Commencement of Operations.
The accompanying notes are an integral part of the financial statements.
14
Morgan Stanley Institutional Fund Trust
Annual Report — September 30, 2017
Financial Highlights
Ultra-Short Income Portfolio
| | | Class IR | |
Selected Per Share Data and Ratios | | Year Ended
September 30, 2017 | | Period from
April 28, 2016(1) to
September 30, 2016 | |
Net Asset Value, Beginning of Period | | $ | 10.00 | | | $ | 10.00 | | |
Income from Investment Operations: | |
Net Investment Income(2) | | | 0.12 | | | | 0.03 | | |
Net Realized and Unrealized Gain | | | 0.00 | (3) | | | 0.00 | (3) | |
Total from Investment Operations | | | 0.12 | | | | 0.03 | | |
Distributions from and/or in Excess of: | |
Net Investment Income | | | (0.11 | ) | | | (0.03 | ) | |
Net Realized Gain | | | (0.00 | )(3) | | | — | | |
Total Distributions | | | (0.11 | ) | | | (0.03 | ) | |
Net Asset Value, End of Period | | $ | 10.01 | | | $ | 10.00 | | |
Total Return(4) | | | 1.18 | % | | | 0.26 | %(5) | |
Ratios and Supplemental Data: | |
Net Assets, End of Period (Thousands) | | $ | 1,122,452 | | | $ | 276,348 | | |
Ratio of Expenses to Average Net Assets(7) | | | 0.22 | % | | | 0.18 | %(6) | |
Ratio of Net Investment Income to Average Net Assets(7) | | | 1.16 | % | | | 0.61 | %(6) | |
(7) Supplemental Information on the Ratios to Average Net Assets: | |
Ratios Before Expense Limitation: | |
Expenses to Average Net Assets | | | 0.30 | % | | | 0.42 | %(6) | |
Net Investment Income to Average Net Assets | | | 1.08 | % | | | 0.37 | %(6) | |
(1) Commencement of Operations.
(2) Per share amount is based on average shares outstanding.
(3) Amount is less than $0.005 per share.
(4) Calculated based on the net asset value as of the last business day of the period.
(5) Not annualized.
(6) Annualized.
The accompanying notes are an integral part of the financial statements.
15
Morgan Stanley Institutional Fund Trust
Annual Report — September 30, 2017
Financial Highlights
Ultra-Short Income Portfolio
| | | Institutional Class | |
Selected Per Share Data and Ratios | | Year Ended
September 30, 2017 | | Period from
April 28, 2016(1) to
September 30, 2016 | |
Net Asset Value, Beginning of Period | | $ | 10.00 | | | $ | 10.00 | | |
Income from Investment Operations: | |
Net Investment Income(2) | | | 0.11 | | | | 0.02 | | |
Net Realized and Unrealized Gain | | | 0.00 | (3) | | | 0.00 | (3) | |
Total from Investment Operations | | | 0.11 | | | | 0.02 | | |
Distributions from and/or in Excess of: | |
Net Investment Income | | | (0.10 | ) | | | (0.02 | ) | |
Net Realized Gain | | | (0.00 | )(3) | | | — | | |
Total Distributions | | | (0.10 | ) | | | (0.02 | ) | |
Net Asset Value, End of Period | | $ | 10.01 | | | $ | 10.00 | | |
Total Return(4) | | | 1.13 | % | | | 0.24 | %(5) | |
Ratios and Supplemental Data: | |
Net Assets, End of Period (Thousands) | | $ | 1,695,589 | | | $ | 196,092 | | |
Ratio of Expenses to Average Net Assets(7) | | | 0.27 | % | | | 0.23 | %(6) | |
Ratio of Net Investment Income to Average Net Assets(7) | | | 1.09 | % | | | 0.65 | %(6) | |
(7) Supplemental Information on the Ratios to Average Net Assets: | |
Ratios Before Expense Limitation: | |
Expenses to Average Net Assets | | | 0.35 | % | | | 0.48 | %(6) | |
Net Investment Income to Average Net Assets | | | 1.01 | % | | | 0.40 | %(6) | |
(1) Commencement of Operations.
(2) Per share amount is based on average shares outstanding.
(3) Amount is less than $0.005 per share.
(4) Calculated based on the net asset value as of the last business day of the period.
(5) Not annualized.
(6) Annualized.
The accompanying notes are an integral part of the financial statements.
16
Morgan Stanley Institutional Fund Trust
Annual Report — September 30, 2017
Financial Highlights
Ultra-Short Income Portfolio
| | | Class A | |
Selected Per Share Data and Ratios | | Year Ended
September 30, 2017 | | Period from
April 28, 2016(1) to
September 30, 2016 | |
Net Asset Value, Beginning of Period | | $ | 10.00 | | | $ | 10.00 | | |
Income from Investment Operations: | |
Net Investment Income(2) | | | 0.09 | | | | 0.01 | | |
Net Realized and Unrealized Gain | | | 0.00 | (3) | | | 0.00 | (3) | |
Total from Investment Operations | | | 0.09 | | | | 0.01 | | |
Distributions from and/or in Excess of: | |
Net Investment Income | | | (0.08 | ) | | | (0.01 | ) | |
Net Realized Gain | | | (0.00 | )(3) | | | — | | |
Total Distributions | | | (0.08 | ) | | | (0.01 | ) | |
Net Asset Value, End of Period | | $ | 10.01 | | | $ | 10.00 | | |
Total Return(4) | | | 0.92 | % | | | 0.14 | %(5) | |
Ratios and Supplemental Data: | |
Net Assets, End of Period (Thousands) | | $ | 2,581,479 | | | $ | 164,528 | | |
Ratio of Expenses to Average Net Assets(7) | | | 0.47 | % | | | 0.44 | %(6) | |
Ratio of Net Investment Income to Average Net Assets(7) | | | 0.91 | % | | | 0.48 | %(6) | |
(7) Supplemental Information on the Ratios to Average Net Assets: | |
Ratios Before Expense Limitation: | |
Expenses to Average Net Assets | | | 0.55 | % | | | 0.68 | %(6) | |
Net Investment Income to Average Net Assets | | | 0.83 | % | | | 0.24 | %(6) | |
(1) Commencement of Operations.
(2) Per share amount is based on average shares outstanding.
(3) Amount is less than $0.005 per share.
(4) Calculated based on the net asset value as of the last business day of the period.
(5) Not annualized.
(6) Annualized.
The accompanying notes are an integral part of the financial statements.
17
Morgan Stanley Institutional Fund Trust
Annual Report — September 30, 2017
Notes to Financial Statements
Morgan Stanley Institutional Fund Trust ("Trust'') is registered under the Investment Company Act of 1940, as amended (the "Act''), as an open-end management investment company. The Trust is comprised of nine separate, active funds (individually referred to as a "Fund", collectively as the "Funds"). The Trust applies investment company accounting and reporting guidance. All Funds are considered diversified for purposes of the Act.
The accompanying financial statements relate to the Ultra-Short Income Portfolio. The Fund seeks current income with capital preservation while maintaining liquidity. The Fund offers three classes of shares — Class IR, Institutional Class and Class A.
A. Significant Accounting Policies: The following significant accounting policies are in conformity with U.S. generally accepted accounting principles ("GAAP"). Such policies are consistently followed by the Trust in the preparation of its financial statements. GAAP may require management to make estimates and assumptions that affect the reported amounts and disclosures in the financial statements. Actual results may differ from those estimates.
1. Security Valuation: (1) Certain portfolio securities may be valued by an outside pricing service/vendor approved by the Trust's Board of Trustees (the "Trustees"). The pricing service/vendor may employ a pricing model that takes into account, among other things, bids, yield spreads, and/or other market data and specific security characteristics. Alternatively, if a valuation is not available from an outside pricing service/vendor, and the security trades on an exchange, the security may be valued at its latest reported sale price (or at the exchange official closing price if such exchange reports an official closing price), prior to the time when assets are valued. If there are no sales on a given day and if there is no official exchange closing price for that day, the security is valued at the mean between the last reported bid and asked prices if such bid and asked prices are available in the relevant exchanges; (2) when market quotations are not readily available, including circumstances under which Morgan Stanley Investment Management Inc. (the "Adviser") determines that the closing price, last sale price or the mean between the last reported bid and asked prices are not reflective of a security's market value, portfolio securities are valued at their fair value as determined in good faith under procedures established by and under the general supervision of the Trustees. Occasionally, developments affecting the closing
prices of securities and other assets may occur between the times at which valuations of such securities are determined (that is, close of the foreign market on which the securities trade) and the close of business of the New York Stock Exchange ("NYSE"). If developments occur during such periods that are expected to materially affect the value of such securities, such valuations may be adjusted to reflect the estimated fair value of such securities as of the close of the NYSE, as determined in good faith by the Trustees or by the Adviser using a pricing service and/or procedures approved by the Trustees; and (3) investments in mutual funds, including the Morgan Stanley Institutional Liquidity Funds, are valued at the net asset value ("NAV") as of the close of each business day.
The Trustees have responsibility for determining in good faith the fair value of the investments, and the Trustees may appoint others, such as the Trust's Adviser or a valuation committee, to assist the Trustees in determining fair value and to make the actual calculations pursuant to the fair valuation methodologies previously approved by the Trustees. Under procedures approved by the Trustees, the Trust's Adviser has formed a Valuation Committee whose members are approved by the Trustees. The Valuation Committee provides administration and oversight of the Trust's valuation policies and procedures, which are reviewed at least annually by the Trustees. These procedures allow the Trust to utilize independent pricing services, quotations from securities and financial instrument dealers, and other market sources to determine fair value.
The Trust has procedures to determine the fair value of securities and other financial instruments for which market prices are not readily available. Under these procedures, the Valuation Committee convenes on a regular and ad hoc basis to review such securities and considers a number of factors, including valuation methodologies and significant unobservable valuation inputs, when arriving at fair value. The Valuation Committee may employ a market-based approach which may use related or comparable assets or liabilities, recent transactions, market multiples, book values, and other relevant information for the investment to determine the fair value of the investment. An income-based valuation approach may also be used in which the anticipated future cash flows of the investment are discounted to calculate fair value. Discounts may also be applied due to the nature or
18
Morgan Stanley Institutional Fund Trust
Annual Report — September 30, 2017
Notes to Financial Statements (cont'd)
duration of any restrictions on the disposition of the investments. Due to the inherent uncertainty of valuations of such investments, the fair values may differ significantly from the values that would have been used had an active market existed. The Valuation Committee employs various methods for calibrating these valuation approaches including a regular review of valuation methodologies, key inputs and assumptions, transactional back-testing or disposition analysis, and reviews of any related market activity.
2. Fair Value Measurement: Financial Accounting Standards Board ("FASB") Accounting Standards CodificationTM ("ASC") 820, "Fair Value Measurement" ("ASC 820"), defines fair value as the value that the Fund would receive to sell an investment or pay to transfer a liability in a timely transaction with an independent buyer in the principal market, or in the absence of a principal market, the most advantageous market for the investment or liability. ASC 820 establishes a three-tier hierarchy to distinguish between (1) inputs that reflect the assumptions market participants would use in valuing an asset or liability developed based on market data obtained from sources independent of the reporting entity (observable inputs) and (2) inputs that reflect the reporting entity's own assumptions about the assumptions market participants would use in valuing an asset or liability developed based on the best information available in the circumstances (unobservable inputs) and to establish classification of fair value measurements for disclosure purposes. Various inputs are used in determining the value of the Fund's investments. The inputs are summarized in the three broad levels listed below.
• Level 1 – unadjusted quoted prices in active markets for identical investments
• Level 2 – other significant observable inputs (including quoted prices for similar investments, interest rates, prepayment speeds, credit risk, etc.)
• Level 3 – significant unobservable inputs including the Fund's own assumptions in determining the fair value of investments. Factors considered in making this determination may include, but are not limited to, information obtained by contacting the issuer, analysts, or the appropriate stock exchange (for
exchange-traded securities), analysis of the issuer's financial statements or other available documents and, if necessary, available information concerning other securities in similar circumstances
The inputs or methodology used for valuing securities are not necessarily an indication of the risk associated with investing in those securities and the determination of the significance of a particular input to the fair value measurement in its entirety requires judgment and considers factors specific to each security.
The following is a summary of the inputs used to value the Fund's investments as of September 30, 2017.
Investment Type | | Level 1
Unadjusted
quoted
prices
(000) | | Level 2
Other
significant
observable
inputs
(000) | | Level 3
Significant
unobservable
inputs
(000) | | Total
(000) | |
Assets: | |
Short-Term Investments | |
Certificates of Deposit | | $ | — | | | $ | 280,402 | | | $ | — | | | $ | 280,402 | | |
Commercial Paper | | | — | | | | 742,798 | | | | — | | | | 742,798 | | |
Corporate Bonds | | | — | | | | 217,848 | | | | — | | | | 217,848 | | |
Floating Rate Notes | | | — | | | | 3,007,644 | | | | — | | | | 3,007,644 | | |
Repurchase Agreements | | | — | | | | 1,145,000 | | | | — | | | | 1,145,000 | | |
Total Short-Term
Investments | | | — | | | | 5,393,692 | | | | — | | | | 5,393,692 | | |
Total Assets | | $ | — | | | $ | 5,393,692 | | | $ | — | | | $ | 5,393,692 | | |
Transfers between investment levels may occur as the markets fluctuate and/or the availability of data used in an investment's valuation changes. The Fund recognizes transfers between the levels as of the end of the period. As of September 30, 2017, the Fund did not have any investments transfer between investment levels.
3. Repurchase Agreements: The Fund may enter into repurchase agreements under which the Fund lends cash and takes possession of securities with an agreement that the counterparty will repurchase such securities. In connection with transactions in repurchase agreements, a bank as custodian for the Fund takes possession of the underlying securities which are held as collateral, with a market value at least equal to the amount of the repurchase transaction, including principal and accrued interest. To the extent that any repurchase transaction exceeds one business day, the value of the collateral is marked-to-market on a daily basis to determine that the value of the collateral does not decrease below the repurchase price plus accrued interest as earned. If such a decrease occurs,
19
Morgan Stanley Institutional Fund Trust
Annual Report — September 30, 2017
Notes to Financial Statements (cont'd)
additional collateral will be requested and, when received, will be added to the account to maintain full collateralization. In the event of default on the obligation to repurchase, the Fund has the right to liquidate the collateral and apply the proceeds in satisfaction of the obligation. In the event of default or bankruptcy by the counterparty to the agreement, realization and/or retention of the collateral or proceeds may be subject to legal proceedings. The Fund, along with other affiliated investment companies, may utilize a joint trading account for the purpose of entering into repurchase agreements.
The Fund may enter into repurchase agreements in which eligible securities are transferred into joint trading accounts maintained by the custodian for investment companies advised by the Fund's Adviser. The Fund will participate on a pro rata basis with the other investment companies in its share of the securities transferred under such repurchase agreements and in its share of proceeds from any repurchase or other disposition of such securities.
Repurchase agreements are subject to Master Repurchase Agreements which are agreements between the Fund and its counterparties that typically include provisions which provide for the net settlement of all transactions and collateral with the Fund, through a single payment, in the event of default or termination. Amounts presented on the Portfolio of Investments and Statement of Assets and Liabilities are not net settlement amounts but gross. As indicated on the Portfolio of Investments, the cash or securities to be repurchased exceeds the repurchase price to be paid under the repurchase agreement reducing the net settlement amount to zero.
4. When-Issued/Delayed Delivery Securities: The Fund purchases and sells when-issued and delayed delivery securities. Securities purchased on a when-issued or delayed delivery basis are purchased for delivery beyond the normal settlement date at a stated price and yield, and no income accrues to the Fund on such securities prior to delivery date. Payment and delivery for when-issued and delayed delivery securities can take place a month or more after the date of the transaction. When the Fund enters into a purchase transaction on a when-issued or delayed delivery basis, securities are available for collateral in an amount at least equal in value to the Fund's commitments to purchase such securities. Purchasing securities on a when-issued or delayed delivery basis may involve a risk
that the market price at the time of delivery may be lower than the agreed upon purchase price, in which case there could be an unrealized loss at the time of delivery. Purchasing investments on a when-issued or delayed delivery basis may be considered a form of leverage which may increase the impact that gains (losses) may have on the Fund.
5. Indemnifications: The Trust enters into contracts that contain a variety of indemnifications. The Trust's maximum exposure under these arrangements is unknown. However, the Trust has not had prior claims or losses pursuant to these contracts and expects the risk of loss to be remote.
6. Dividends and Distributions to Shareholders: Dividends and distributions to shareholders are recorded on the close of each business day. Dividends from net investment income, if any, are declared daily and paid monthly. Net realized capital gains, if any, are distributed at least annually.
7. Security Transactions, Income and Expenses: Security transactions are accounted for on the trade date (date the order to buy or sell is executed). Realized gains and losses on the sale of investment securities are determined on the specific identified cost method. Dividend income and other distributions are recorded on the ex-dividend date (except for certain foreign dividends which may be recorded as soon as the Fund is informed of such dividends) net of applicable withholding taxes. Interest income is recognized on the accrual basis except where collection is in doubt. Discounts are accreted and premiums are amortized over the life of the respective securities. Most expenses of the Trust can be directly attributed to a particular Fund. Expenses which cannot be directly attributed are apportioned among the Funds based upon relative net assets or other appropriate methods. Income, expenses (other than class specific expenses — distribution and shareholder services and transfer agency fees) and realized and unrealized gains or losses are allocated to each class of shares based upon their relative net assets.
B. Advisory Fees: The Adviser, a wholly-owned subsidiary of Morgan Stanley, provides the Fund with advisory services under the terms of an Investment Advisory Agreement, paid quarterly, at an annual rate of 0.20% of the average daily net assets of the Fund.
20
Morgan Stanley Institutional Fund Trust
Annual Report — September 30, 2017
Notes to Financial Statements (cont'd)
The Adviser has agreed to reduce its advisory fee and/or reimburse the Fund so that total annual portfolio operating expenses, excluding certain investment related expenses, taxes, interest and other extraordinary expenses (including litigation), will not exceed 0.25% for Class IR shares, 0.30% for Institutional Class shares and 0.55% for Class A shares. The fee waivers and/or expense reimbursements will continue for at least one year from the date of the Fund's prospectus or until such time as the Trustees act to discontinue all or a portion of such waivers and/or reimbursements when they deem such action is appropriate. In addition, the Adviser may make additional voluntary fee waivers and/or expense reimbursements. The ratios of expenses to average net assets disclosed in the Fund's Financial Highlights may be lower than the maximum expense ratios due to these additional fee waivers and/or expense reimbursements. The Adviser may also waive additional advisory fees and/or reimburse expenses to enable the Fund to maintain a minimum level of daily net investment income. For the year ended September 30, 2017, approximately $2,562,000 of advisory fees were waived and approximately $5,000 of other expenses were reimbursed by the Adviser pursuant to this arrangement.
C. Administration Fees: The Adviser also serves as Administrator to the Trust and provides administrative services pursuant to an Administration Agreement for an annual fee, accrued daily and paid monthly, of 0.08% of the Fund's average daily net assets. Under a Sub-Administration Agreement between the Administrator and State Street Bank and Trust Company ("State Street"), State Street provides certain administrative services to the Trust. For such services, the Administrator pays State Street a portion of the fee the Administrator receives from the Fund.
D. Shareholder Services Fees: Morgan Stanley Distribution, Inc. ("MSDI" or the "Distributor"), a wholly-owned subsidiary of the Adviser, and an indirect subsidiary of Morgan Stanley, serves as the Trust's Distributor of Fund shares pursuant to a Distribution Agreement. The Trust has adopted a Shareholder Services Plan with respect to the Institutional Class shares pursuant to Rule 12b-1 under the Act. Under the Shareholder Services Plan, the Fund pays the Distributor a shareholder services fee, accrued daily and paid monthly, at an annual rate of 0.05% of the Fund's average daily net assets attributable to the Institutional Class shares.
The Trust has adopted a Shareholder Services Plan with respect to the Class A shares pursuant to Rule 12b-1 under the Act. Under the Shareholder Services Plan, the Fund pays the Dis-
tributor a shareholder services fee, accrued daily and paid monthly, at an annual rate of 0.25% of the Fund's average daily net assets attributable to the Class A shares.
The shareholder services fees are used to support the expenses associated with servicing and maintaining accounts. The Distributor may compensate other parties for providing shareholder support services to investors who purchase Institutional Class and Class A shares.
E. Dividend Disbursing and Transfer/Co-Transfer Agent: The Trust's dividend disbursing and transfer agent is Boston Financial Data Services, Inc. ("BFDS"). Pursuant to a Transfer Agency Agreement, the Trust pays BFDS a fee based on the number of classes, accounts and transactions relating to the Funds of the Trust.
Morgan Stanley Services Company Inc. serves as Co-Transfer Agent and provides certain transfer agency services to the Fund with respect to certain direct transactions with the Fund.
F. Custodian Fees: State Street (the "Custodian") serves as Custodian for the Trust in accordance with a Custodian Agreement. The Custodian holds cash, securities, and other assets of the Trust as required by the Act. Custody fees are payable monthly based on assets held in custody, investment purchases and sales activity and account maintenance fees, plus reimbursement for certain out-of-pocket expenses.
G. Security Transactions and Transactions with Affiliates: The Fund is permitted to purchase and sell securities ("cross-trade") from and to other Morgan Stanley Funds as well as other funds and client accounts for which the Adviser or an affiliate of the Adviser serves as investment adviser, pursuant to procedures approved by the Trustees in compliance with Rule 17a-7 under the Act (the "Rule"). Each cross-trade is executed at the current market price in compliance with provisions of the Rule. For the year ended September 30, 2017, the Fund did not engage in any cross-trade transactions.
The Fund has an unfunded Deferred Compensation Plan (the "Compensation Plan"), which allows each independent Trustee to defer payment of all, or a portion, of the fees he or she receives for serving on the Board of Trustees. Each eligible Trustee generally may elect to have the deferred amounts credited with a return equal to the total return on one or more of the Morgan Stanley funds that are offered as investment options under the Compensation Plan. Appreciation/depreciation and distributions received from these investments are recorded
21
Morgan Stanley Institutional Fund Trust
Annual Report — September 30, 2017
Notes to Financial Statements (cont'd)
with an offsetting increase/decrease in the deferred compensation obligation and do not affect the NAV of the Fund.
H. Federal Income Taxes: It is the Fund's intention to continue to qualify as a regulated investment company and distribute all of its taxable and tax-exempt income. Accordingly, no provision for federal income taxes is required in the financial statements.
The Fund may be subject to taxes imposed by countries in which it invests. Such taxes are generally based on income and/or capital gains earned or repatriated. Taxes are accrued based on net investment income, net realized gains and net unrealized appreciation as such income and/or gains are earned. Taxes may also be based on transactions in foreign currency and are accrued based on the value of investments denominated in such currency.
FASB ASC 740-10, "Income Taxes — Overall", sets forth a minimum threshold for financial statement recognition of the benefit of a tax position taken or expected to be taken in a tax return. Management has concluded there are no significant uncertain tax positions that would require recognition in the financial statements. If applicable, the Fund recognizes interest accrued related to unrecognized tax benefits in "Interest Expense" and penalties in "Other Expenses" in the Statement of Operations. The Fund files tax returns with the U.S. Internal Revenue Service, New York and various states. Each of the tax years in the two-year period ended September 30, 2017, remains subject to examination by taxing authorities.
The tax character of distributions paid may differ from the character of distributions shown in the Statement of Changes in Net Assets due to short-term capital gains being treated as ordinary income for tax purposes. The tax character of distributions paid during fiscal years 2017 and 2016 was as follows:
2017 Distributions
Paid From:
Ordinary Income
(000) | | 2016 Distributions
Paid From:
Ordinary Income
(000) | |
| $ | 32,133 | | | $ | 928 | | |
The amount and character of income and gains to be distributed are determined in accordance with income tax regulations which may differ from GAAP. These book/tax differences are either considered temporary or permanent in nature.
Temporary differences are attributable to differing book and tax treatments for the timing of the recognition of gains (losses) on certain investment transactions and the timing of the deductibility of certain expenses.
Permanent differences, primarily due to basis adjustments for swap transactions and nondeductible expenses, resulted in the following reclassifications among the components of net assets at September 30, 2017:
Distributions
in Excess of Net
Investment
Income
(000) | | Accumulated
Undistributed
Net Realized
Gain
(000) | | Paid-in-
Capital
(000) | |
| $ | 1 | | | $ | — | @ | | $ | (1 | ) | |
@ Amount is less than 500
At September 30, 2017, the components of distributable earnings for the Fund on a tax basis were as follows:
Undistributed
Ordinary
Income (000) | | Undistributed
Long-Term
Capital Gain (000) | |
| $ | 473 | | | $ | 1 | | |
I. Credit Facility: The Trust and other Morgan Stanley funds participate in a $150,000,000 committed, unsecured revolving line of credit facility (the "facility") with State Street. This facility is to be used for temporary emergency purposes or funding of shareholder redemption requests. The interest rate on borrowings is based on the federal funds rate or one month libor rate plus a spread. The facility also has a commitment fee of 0.25% per annum based on the unused portion of the facility. During the year ended September 30, 2017, the Fund did not have any borrowings under the facility.
J. Other: At September 30, 2017, the Fund had record owners of 10% or greater. Investment activities of these shareholders could have a material impact on the Fund. The aggregate percentage of such owners was 88.2%.
22
Morgan Stanley Institutional Fund Trust
Annual Report — September 30, 2017
Report of Independent Registered Public Accounting Firm
To the Shareholders and Board of Trustees of
Morgan Stanley Institutional Fund Trust —
Ultra-Short Income Portfolio
We have audited the accompanying statement of assets and liabilities, including the portfolio of investments, of Ultra-Short Income Portfolio (one of the funds constituting Morgan Stanley Institutional Fund Trust) (the "Fund") as of September 30, 2017, the related statement of operations for the year then ended and the statements of changes in net assets and the financial highlights for each of the years or periods indicated therein. These financial statements and financial highlights are the responsibility of the Fund's management. Our responsibility is to express an opinion on these financial statements and financial highlights based on our audits.
We conducted our audits in accordance with the standards of the Public Company Accounting Oversight Board (United States). Those standards require that we plan and perform the audit to obtain reasonable assurance about whether the financial statements and financial highlights are free of material misstatement. We were not engaged to perform an audit of the Fund's internal control over financial reporting. Our audit included consideration of internal control over financial reporting as a basis for designing audit procedures that are appropriate in the circumstances, but not for the purpose of expressing an opinion on the effectiveness of the Fund's internal control over financial reporting. Accordingly, we express no such opinion. An audit also includes examining, on a test basis, evidence supporting the amounts and disclosures in the financial statements and financial highlights, assessing the accounting principles used and significant estimates made by management, and evaluating the overall financial statement presentation. Our procedures included confirmation of securities owned as of September 30, 2017, by correspondence with the custodian and others or by other appropriate auditing procedures where replies from others were not received. We believe that our audits provide a reasonable basis for our opinion.
In our opinion, the financial statements and financial highlights referred to above present fairly, in all material respects, the financial position of Ultra-Short Income Portfolio (one of the funds constituting Morgan Stanley Institutional Fund Trust) at September 30, 2017, the results of its operations for the year then ended and the changes in its net assets and the financial highlights for each of the years or periods indicated therein, in conformity with U.S. generally accepted accounting principles.

Boston, Massachusetts
November 22, 2017
23
Morgan Stanley Institutional Fund Trust
Annual Report — September 30, 2017
Investment Advisory Agreement Approval (unaudited)
Nature, Extent and Quality of Services
The Board reviewed and considered the nature and extent of the investment advisory services provided by the Adviser (as defined herein) under the advisory agreement, including portfolio management, investment research and equity and fixed income securities trading. The Board also reviewed and considered the nature and extent of the non-advisory, administrative services provided by the Adviser under the administration agreement, including accounting, operations, clerical, bookkeeping, compliance, business management and planning, legal services and the provision of supplies, office space and utilities at the Adviser's expense. The Board also considered the Adviser's investment in personnel and infrastructure that benefits the Fund. (The advisory and administration agreements together are referred to as the "Management Agreement.") The Board also considered that the Adviser serves a variety of other investment advisory clients and has experience overseeing service providers. The Board also compared the nature of the services provided by the Adviser with similar services provided by non-affiliated advisers as presented to the Board by Broadridge Financial Solutions, Inc. ("Broadridge").
The Board reviewed and considered the qualifications of the portfolio managers, the senior administrative managers and other key personnel of the Adviser who provide the administrative and advisory services to the Fund. The Board determined that the Adviser's portfolio managers and key personnel are well qualified by education and/or training and experience to perform the services in an efficient and professional manner. The Board concluded that the nature and extent of the advisory and administrative services provided were necessary and appropriate for the conduct of the business and investment activities of the Fund and supported its decision to approve the Management Agreement.
Performance, Fees and Expenses of the Fund
The Board reviewed the performance, fees and expenses of the Fund compared to its peers, as presented by Broadridge, and to appropriate benchmarks where applicable. The Board discussed with the Adviser the performance goals and the actual results achieved in managing the Fund. When considering a fund's performance, the Board and the Adviser place emphasis on trends and longer-term returns (focusing on one-year, three-year and five-year performance, as of December 31, 2016, or since inception, as applicable). When a fund underperforms its benchmark and/or its peer group average, the Board and the Adviser discuss the causes of such underperformance and, where necessary, they discuss specific changes to investment strategy or investment personnel. The Board noted that the Fund's performance was below its peer group average for the period since the end of April 2016, the month of the Fund's inception. The Board discussed with the Adviser the level of the advisory and administration fees (together, the "management fee") for this Fund relative to comparable funds and/or other accounts advised by the Adviser and/or compared to its peers as presented by Broadridge. In addition to the management fee, the Board also reviewed the Fund's total expense ratio. The Board noted that the Fund's management fee and total expense ratio were lower than its peer group averages. After discussion, the Board concluded that the Fund's (i) performance was acceptable; and (ii) management fee and total expense ratio were competitive with its peer group averages.
Economies of Scale
The Board considered the size and growth prospects of the Fund and how that relates to the Fund's total expense ratio and particularly the Fund's management fee rate, which does not include breakpoints. In conjunction with its review of the Adviser's profitability, the Board discussed with the Adviser how a change in assets can affect the efficiency or effectiveness of managing the Fund and whether the management fee level is appropriate relative to current and projected asset levels and/or whether the management fee structure reflects economies of scale as asset levels change. The Board has determined that its review of the actual and/or potential economies of scale of the Fund supports its decision to approve the Management Agreement.
Profitability of the Adviser and Affiliates
The Board considered information concerning the costs incurred and profits realized by the Adviser and its affiliates during the last year from their relationship with the Fund and during the last two years from their relationship with the Morgan Stanley Fund Complex and reviewed with the Adviser the cost allocation methodology used to determine the profitability of the Adviser and affiliates. The Board has determined that its review of the analysis of the Adviser's expenses and profitability supports its decision to approve the Management Agreement.
24
Morgan Stanley Institutional Fund Trust
Annual Report — September 30, 2017
Investment Advisory Agreement Approval (unaudited) (cont'd)
Other Benefits of the Relationship
The Board considered other direct and indirect benefits to the Adviser and/or its affiliates derived from their relationship with the Fund and other funds advised by the Adviser. These benefits may include, among other things, fees for trading, distribution and/or shareholder servicing and for transaction processing and reporting platforms used by securities lending agents, and research received by the Adviser generated from commission dollars spent on funds' portfolio trading. The Board reviewed with the Adviser these arrangements and the reasonableness of the Adviser's costs relative to the services performed. The Board has determined that its review of the other benefits received by the Adviser or its affiliates supports its decision to approve the Management Agreement.
Resources of the Adviser and Historical Relationship Between the Fund and the Adviser
The Board considered whether the Adviser is financially sound and has the resources necessary to perform its obligations under the Management Agreement. The Board also reviewed and considered the historical relationship between the Fund and the Adviser, including the organizational structure of the Adviser, the policies and procedures formulated and adopted by the Adviser for managing the Fund's operations and the Board's confidence in the competence and integrity of the senior managers and key personnel of the Adviser. The Board concluded that the Adviser has the financial resources necessary to fulfill its obligations under the Management Agreement and that it is beneficial for the Fund to continue its relationship with the Adviser.
Other Factors and Current Trends
The Board considered the controls and procedures adopted and implemented by the Adviser and monitored by the Fund's Chief Compliance Officer and concluded that the conduct of business by the Adviser indicates a good faith effort on its part to adhere to high ethical standards in the conduct of the Fund business.
General Conclusion
After considering and weighing all of the above factors, with various written materials and verbal information presented by the Adviser, the Board concluded that it would be in the best interest of the Fund and its shareholders to approve the Management Agreement for another year. In reaching this conclusion the Board did not give particular weight to any single piece of information or factor referenced above. The Board considered these factors and information over the course of the year and in numerous meetings, some of which were in executive session with only the independent Board members and their counsel present. It is possible that individual Board members may have weighed these factors, and the information presented, differently in reaching their individual decisions to approve the Management Agreement.
25
Morgan Stanley Institutional Fund Trust
Annual Report — September 30, 2017
Privacy Notice (unaudited)
MORGAN STANLEY INVESTMENT MANAGEMENT INC.
AN IMPORTANT NOTICE CONCERNING OUR U.S. PRIVACY POLICY
We are required by federal law to provide you with a copy of our privacy policy annually. This policy applies to current and former individual investors in funds managed or sponsored by Morgan Stanley Investment Management Inc. ("MSIM") as well as current and former individual clients of MSIM. This policy is not applicable to partnerships, corporations, trusts or other non-individual clients or investors. Please note that we may amend this policy at any time, and will inform you of any changes as required by law.
WE RESPECT YOUR PRIVACY
We appreciate that you have provided us with your personal financial information. We strive to maintain the privacy of such information while we help you achieve your financial objectives. This Notice describes what non-public personal information we collect about you, why we collect it, when we may share it with others and how certain others may use it. It discusses the steps you may take to limit our sharing of certain information about you to affiliated companies in the Morgan Stanley family of companies ("other Morgan Stanley companies"). It also discloses how you may limit use of certain shared information for marketing purposes by other Morgan Stanley branded companies. Throughout this policy, we refer to the non-public information that personally identifies you or your accounts as "personal information.''
1. WHAT PERSONAL INFORMATION DO WE COLLECT ABOUT YOU?
We obtain personal information from applications and other forms you submit to us, from your dealings with us, from consumer reporting agencies, from our Web sites and from third parties and other sources.
For example:
• We may collect information such as your name, address, e-mail address, telephone/fax numbers, assets, income and investment objectives through subscription documents, applications and other forms you submit to us.
• We may obtain information about account balances, your use of account(s) and the types of products and services you prefer to receive from us through your dealings and transactions with us and other sources.
• We may obtain information about your creditworthiness and credit history from consumer reporting agencies.
• We may collect background information from and through third-party vendors to verify representations you have made and to comply with various regulatory requirements.
• If you interact with us through our public and private Web sites, we may collect information that you provide directly through online communications (such as an e-mail address). We may also collect information about your Internet service provider, your domain name, your computer's operating system and Web browser, your use of our Web sites and your product and service preferences, through the use of "cookies." Please consult the Terms of Use of these sites for more details.
2. WHEN DO WE DISCLOSE PERSONAL INFORMATION WE COLLECT ABOUT YOU?
We may disclose personal information we collect about you to other Morgan Stanley companies and to non-affiliated third parties.
a. Information We Disclose to Other Morgan Stanley Companies.
We may disclose personal information to other Morgan Stanley companies for a variety of reasons, including to manage your account(s) effectively, to service and process your transactions, to let you know about products and services offered by us and other Morgan Stanley companies, to manage our business, and as otherwise required or permitted by law. Offers for products and services from other Morgan Stanley companies are developed under conditions designed to safeguard your personal information.
26
Morgan Stanley Institutional Fund Trust
Annual Report — September 30, 2017
Privacy Notice (unaudited) (cont'd)
b. Information We Disclose to Non-affiliated Third Parties.
We do not disclose personal information that we collect about you to non-affiliated third parties except to those who provide marketing services on our behalf, to financial institutions with whom we have joint marketing agreements, and as otherwise required or permitted by law. For example, we may disclose personal information to non-affiliated third parties for servicing and processing transactions, to offer our own products and services, to protect against fraud, for institutional risk control, to respond to judicial process or to perform services on our behalf. When we share personal information with a non-affiliated third party, they are required to limit their use of personal information to the particular purpose for which it was shared and they are not allowed to share personal information with others except to fulfill that limited purpose or as may be permitted or required by law.
3. HOW DO WE PROTECT THE SECURITY AND CONFIDENTIALITY OF PERSONAL INFORMATION WE COLLECT ABOUT YOU?
We maintain physical, electronic and procedural security measures to help safeguard the personal information we collect about you. We have internal policies governing the proper handling of client information. Third parties that provide support or marketing services on our behalf may also receive personal information, and we require them to adhere to confidentiality standards with respect to such information.
4. HOW CAN YOU LIMIT THE SHARING OF CERTAIN TYPES OF PERSONAL INFORMATION WITH OTHER MORGAN STANLEY COMPANIES?
We offer you choices as to whether we share with other Morgan Stanley companies the personal information that was collected to determine your eligibility for products and services you request ("eligibility information"). Eligibility information does not include your identification information or personal information pertaining to our transactions or experiences with you. Please note that, even if you direct us not to share eligibility information with other Morgan Stanley companies ("opt-out"), we may still share personal information, including eligibility information, with those companies in circumstances excluded from the opt-out under applicable law, such as to process transactions or to service your account.
5. HOW CAN YOU LIMIT THE USE OF CERTAIN TYPES OF PERSONAL INFORMATION BY OTHER MORGAN STANLEY COMPANIES FOR MARKETING?
By following the opt-out instructions in Section 6 below, you may limit other Morgan Stanley branded companies from marketing their products or services to you based on personal information we disclose to them. This information may include, for example, your income and account history with us. Please note that, even if you choose to limit Other Morgan Stanley Companies from using personal information about you that we may share with them for marketing their products and services to you, Other Morgan Stanley Companies may use your personal information that they obtain from us to market to you in circumstances permitted by law, such as if the Other Morgan Stanley Company has its own relationship with you.
6. HOW CAN YOU SEND US AN OPT-OUT INSTRUCTION?
If you wish to limit our sharing of eligibility information about you with other Morgan Stanley companies or other Morgan Stanley companies' use of personal information for marketing purposes, as described in this notice, you may do so by:
• Calling us at (800) 548-7786
Monday-Friday between 8a.m. and 6p.m.(EST)
• Writing to us at the following address:
Boston Financial Data Services, Inc.
c/o Privacy Coordinator
P.O. Box 219804
Kansas City, Missouri 64121
27
Morgan Stanley Institutional Fund Trust
Annual Report — September 30, 2017
Privacy Notice (unaudited) (cont'd)
Your written request should include your name, address, telephone number and account number(s) to which the opt-out applies and whether you are opting out with respect to sharing of eligibility information (Section 4 above), or if information used for Marketing (Section 5 above) or both. Written opt-out requests should not be sent with any other correspondence. In order to process your request, we require that the request be provided by you directly and not through a third party.
Your opt-out preference will remain in effect with respect to this policy (as it may be amended) until you notify us otherwise. If you have a joint account, your direction for us not to share this information with other Morgan Stanley companies and for those other Morgan Stanley companies not to use your personal information for marketing will be applied to all account holders on that account. Please understand that if you limit our sharing or our affiliated companies' use of personal information, you and any joint account holder(s) may not receive information about Morgan Stanley products and services, including products or services that could help you manage your financial resources and achieve your investment objectives.
7. WHAT IF AN AFFILIATED COMPANY BECOMES A NON-AFFILIATED THIRD PARTY?
If, at any time in the future, an affiliated company becomes a non-affiliated third party, further disclosures of personal information made to the former affiliated company will be limited to those described in Section 2(b) above relating to non-affiliated third parties. If you elected under Section 6 to limit disclosures we make to affiliated companies, or use of personal information by affiliated companies, your election will not apply to use by any former affiliated company of your personal information in their possession once it becomes a non-affiliated third party.
SPECIAL NOTICE TO RESIDENTS OF VERMONT
The following section supplements our policy with respect to our individual clients who have a Vermont address and supersedes anything to the contrary in the above policy with respect to those clients only.
The state of Vermont requires financial institutions to obtain your consent prior to sharing personal information that they collect about you with affiliated companies and non-affiliated third parties other than in certain limited circumstances. Except as permitted by law, we will not share personal information we collect about you with non-affiliated third parties or other Morgan Stanley companies unless you provide us with your written consent to share such information ("opt-in").
If you wish to receive offers for investment products and services offered by or through other Morgan Stanley companies, please notify us in writing at the following address:
Boston Financial Data Services, Inc.
c/o Privacy Coordinator
P.O. Box 219804
Kansas City, Missouri 64121
Your authorization should include your name, address, telephone number and account number(s) to which the opt-in applies and should not be sent with any other correspondence. In order to process your authorization, we require that the authorization be provided by you directly and not through a third party.
SPECIAL NOTICE TO RESIDENTS OF CALIFORNIA
The following section supplements our policy with respect to our individual clients who have a California address and supersedes anything to the contrary in the above policy with respect to those clients only.
In response to a California law, if your account has a California home address, your personal information will not be disclosed to non-affiliated third parties except as permitted by applicable California law, and we will limit sharing such information with our affiliates to comply with California privacy laws that apply to us.
28
Morgan Stanley Institutional Fund Trust
Annual Report — September 30, 2017
Trustee and Officer Information (unaudited)
Independent Trustees:
Name, Age and Address of
Independent Trustee | | Position(s)
Held with
Registrant | | Length of Time
Served* | | Principal Occupation(s) During Past 5 Years
and Other Relevant Professional Experience | | Number of
Portfolios in
Fund Complex
Overseen by
Independent
Trustee** | | Other Directorships
Held by Independent
Trustee*** | |
Frank L. Bowman (72)
c/o Perkins Coie LLP
Counsel to the Independent Trustees
30 Rockefeller Plaza
New York, NY 10112 | | Trustee | | Since
August
2006 | | President, Strategic Decisions, LLC (consulting) (since February 2009); Director or Trustee of various Morgan Stanley Funds (since August 2006); Chairperson of the Compliance and Insurance Committee (since October 2015); formerly, Chairperson of the Insurance Sub-Committee of the Compliance and Insurance Committee (2007-2015); served as President and Chief Executive Officer of the Nuclear Energy Institute (policy organization) (February 2005-November 2008); retired as Admiral, U.S. Navy after serving over 38 years on active duty including 8 years as Director of the Naval Nuclear Propulsion Program in the Department of the Navy and the U.S. Department of Energy (1996-2004); served as Chief of Naval Personnel (July 1994-September 1996) and on the Joint Staff as Director of Political Military Affairs (June 1992-July 1994); knighted as Honorary Knight Commander of the Most Excellent Order of the British Empire; awarded the Officier de l'Orde National du Mérite by the French Government; elected to the National Academy of Engineering (2009). | | | 90 | | | Director of BP p.l.c.; Director of Naval and Nuclear Technologies LLP; Director Emeritus of the Armed Services YMCA; Director of the U.S. Naval Submarine League; Member of the National Security Advisory Council of the Center for U.S. Global Engagement and a member of the CNA Military Advisory Board; Chairman of the charity J Street Cup Golf; Trustee of Fairhaven United Methodist Church; and Director of other various non-profit organizations. | |
Kathleen A. Dennis (64)
c/o Perkins Coie LLP
Counsel to the Independent Trustees
30 Rockefeller Plaza
New York, NY 10112 | | Trustee | | Since
August
2006 | | President, Cedarwood Associates (mutual fund and investment management consulting) (since July 2006); Chairperson of the Liquidity and Alternatives Sub-Committee of the Investment Committee (since October 2006) and Director or Trustee of various Morgan Stanley Funds (since August 2006); formerly, Senior Managing Director of Victory Capital Management (1993-2006). | | | 91 | | | Director of various non-profit organizations. | |
Nancy C. Everett (62)
c/o Perkins Coie LLP
Counsel to the Independent Trustees
30 Rockefeller Plaza
New York, NY 10112 | | Trustee | | Since
January
2015 | | Chief Executive Officer, Virginia Commonwealth University Investment Company (since November 2015); Owner OBIR, LLC (institutional investment management consulting) (since June 2014); formerly, Managing Director, BlackRock, Inc. (February 2011-December 2013); and Chief Executive Officer, General Motors Asset Management (a/k/a Promark Global Advisors, Inc.) (June 2005-May 2010). | | | 91 | | | Formerly, Member of Virginia Commonwealth University School of Business Foundation (2005-2016); Member of Virginia Commonwealth University Board of Visitors (2013-2015); Member of Committee on Directors for Emerging Markets Growth Fund, Inc. (2007-2010); Chairperson of Performance Equity Management, LLC (2006-2010); and Chairperson, GMAM Absolute Return Strategies Fund, LLC (2006-2010). | |
29
Morgan Stanley Institutional Fund Trust
Annual Report — September 30, 2017
Trustee and Officer Information (unaudited) (cont'd)
Independent Trustees: (cont'd)
Name, Age and Address of
Independent Trustee | | Position(s)
Held with
Registrant | | Length of Time
Served* | | Principal Occupation(s) During Past 5 Years
and Other Relevant Professional Experience | | Number of
Portfolios in
Fund Complex
Overseen by
Independent
Trustee** | | Other Directorships
Held by Independent
Trustee*** | |
Jakki L. Haussler (60)
c/o Perkins Coie LLP
Counsel to the Independent Trustees
30 Rockefeller Plaza
New York, NY 10112 | | Trustee | | Since
January
2015 | | Chairman and Chief Executive Officer, Opus Capital Group (since January 1996); formerly, Director, Capvest Venture Fund, LP (May 2000-December 2011); Partner, Adena Ventures, LP (July 1999-December 2010); Director, The Victory Funds (February 2005-July 2008). | | | 91 | | | Director of Cincinnati Bell Inc. and Member, Audit Committee and Compensation Committee; Director of Northern Kentucky University Foundation and Member, Investment Committee; Member of Chase College of Law Transactional Law Practice Center Board of Advisors; Director of Best Transport; Director of Chase College of Law Board of Visitors; formerly, Member, University of Cincinnati Foundation Investment Committee; Member, Miami University Board of Visitors (2008-2011); Trustee of Victory Funds (2005-2008) and Chairman, Investment Committee (2007-2008) and Member, Service Provider Committee (2005-2008). | |
Dr. Manuel H. Johnson (68)
c/o Johnson Smick
International, Inc.
220 I Street, NE — Suite 200
Washington, D.C. 20002 | | Trustee | | Since
July
1991 | | Senior Partner, Johnson Smick International, Inc. (consulting firm); Chairperson of the Investment Committee (since October 2006) and Director or Trustee of various Morgan Stanley Funds (since July 1991); Co-Chairman and a founder of the Group of Seven Council (G7C) (international economic commission); formerly, Chairperson of the Audit Committee (July 1991-September 2006), Vice Chairman of the Board of Governors of the Federal Reserve System and Assistant Secretary of the U.S. Treasury. | | | 91 | | | Director of NVR, Inc.
(home construction). | |
Joseph J. Kearns (75)
c/o Kearns & Associates LLC
46 E Peninsula Center #385 Rolling Hills Estates, CA 90274-3712 | | Trustee | | Since
August
1994 | | President, Kearns & Associates LLC (investment consulting); Chairperson of the Audit Committee (since October 2006) and Director or Trustee of various Morgan Stanley Funds (since August 1994); formerly, Deputy Chairperson of the Audit Committee (July 2003-September 2006) and Chairperson of the Audit Committee of various Morgan Stanley Funds (since August 1994); CFO of the J. Paul Getty Trust. | | | 93 | | | Director of Electro Rent Corporation (equipment leasing). Prior to December 31, 2013, Director of The Ford Family Foundation. | |
30
Morgan Stanley Institutional Fund Trust
Annual Report — September 30, 2017
Trustee and Officer Information (unaudited) (cont'd)
Independent Trustees: (cont'd)
Name, Age and Address of
Independent Trustee | | Position(s)
Held with
Registrant | | Length of Time
Served* | | Principal Occupation(s) During Past 5 Years
and Other Relevant Professional Experience | | Number of
Portfolios in
Fund Complex
Overseen by
Independent
Trustee** | | Other Directorships
Held by Independent
Trustee*** | |
Michael F. Klein (58)
c/o Perkins Coie LLP
Counsel to the Independent Trustees
30 Rockefeller Plaza
New York, NY 10112 | | Trustee | | Since
August
2006 | | Managing Director, Aetos Capital, LLC (since March 2000); Co-President, Aetos Alternatives Management, LLC (since January 2004) and Co-Chief Executive Officer of Aetos Capital LLC (since August 2013); Chairperson of the Fixed Income Sub-Committee of the Investment Committee (since October 2006) and Director or Trustee of various Morgan Stanley Funds (since August 2006); formerly, Managing Director, Morgan Stanley & Co. Inc. and Morgan Stanley Dean Witter Investment Management, President, various Morgan Stanley Funds (June 1998-March 2000) and Principal, Morgan Stanley & Co. Inc. and Morgan Stanley Dean Witter Investment Management (August 1997-December 1999). | | | 90 | | | Director of certain investment funds managed or sponsored by Aetos Capital, LLC; Director of Sanitized AG and Sanitized Marketing AG (specialty chemicals). | |
Patricia Maleski (57)
c/o Perkins Coie LLP
Counsel to the Independent Trustees
30 Rockefeller Plaza
New York, NY 10112 | | Trustee | | Since
January
2017 | | Managing Director, JPMorgan Asset Management (2004-2016); Oversight and Control Head of Fiduciary and Conflicts of Interest Program(2015-2016); Chief Control Officer-Global Asset Management (2013-2015); President, JPMorgan Funds (2010-2013); Chief Administrative Officer (2004-2013); various other positions including Treasurer and Board Liaison (since 2001). | | | 91 | | | | None. | | |
Michael E. Nugent (81)
522 Fifth Avenue
New York, NY 10036 | | Chair of the Board and Trustee | | Chair of the
Boards since
July 2006 and
Trustee since
July 1991 | | Chair of the Boards of various Morgan Stanley Funds (since July 2006); Chairperson of the Closed-End Fund Committee (since June 2012) and Director or Trustee of various Morgan Stanley Funds (since July 1991); formerly, Chairperson of the Insurance Committee (until July 2006); General Partner, Triumph Capital, L.P. (private investment partnership) (1988-2013). | | | 92 | | | | None. | | |
W. Allen Reed (70)
c/o Perkins Coie LLP
Counsel to the Independent Trustees
30 Rockefeller Plaza
New York, NY 10112 | | Trustee | | Since
August
2006 | | Chairperson of the Equity Sub-Committee of the Investment Committee (since October 2006) and Director or Trustee of various Morgan Stanley Funds (since August 2006); formerly, President and CEO of General Motors Asset Management; Chairman and Chief Executive Officer of the GM Trust Bank and Corporate Vice President of General Motors Corporation (August 1994-December 2005). | | | 91 | | | Director of Legg Mason, Inc.; formerly, Director of the Auburn University Foundation (2010-2015). | |
Fergus Reid (85)
c/o Joe Pietryka, Inc.
85 Charles Colman Blvd.
Pawling, NY 12564 | | Trustee | | Since
June
1992 | | Chairman, Joe Pietryka, Inc.; Chairperson of the Governance Committee and Director or Trustee of various Morgan Stanley Funds (since June 1992). | | | 92 | | | Formerly, Trustee and Director of certain investment companies in the JP Morgan Fund Complex managed by JP Morgan Investment Management Inc. (1987-2012). | |
* This is the earliest date the Trustee began serving the Morgan Stanley Funds. Each Trustee serves an indefinite term, until his or her successor is elected.
** The Fund Complex includes (as of December 31, 2016) all open-end and closed-end funds (including all of their portfolios) advised by Morgan Stanley Investment Management Inc. (the "Adviser") and any funds that have an adviser that is an affiliated person of the Adviser (including, but not limited to, Morgan Stanley AIP GP LP).
*** This includes any directorships at public companies and registered investment companies held by the Trustee at any time during the past five years.
31
Morgan Stanley Institutional Fund Trust
Annual Report — September 30, 2017
Trustee and Officer Information (unaudited) (cont'd)
Executive Officers:
Name, Age and Address of Executive Officer | | Position(s) Held
with
Registrant | | Length of
Time Served* | | Principal Occupation(s) During Past 5 Years | |
John H. Gernon (54)
522 Fifth Avenue
New York, NY 10036 | | President and
Principal
Executive
Officer | | Since
September
2013 | | President and Principal Executive Officer of the Equity and Fixed Income Funds and the Morgan Stanley AIP Funds (since September 2013) and the Liquidity Funds and various money market funds (since May 2014) in the Fund Complex; Managing Director of the Adviser; Head of Product (since 2006). | |
Timothy J. Knierim (58)
522 Fifth Avenue
New York, NY 10036 | | Chief
Compliance
Officer | | Since
December
2016 | | Managing Director of the Adviser and various entities affiliated with the Adviser; Chief Compliance Officer of various Morgan Stanley Funds and the Adviser (since December 2016) and Chief Compliance Officer of Morgan Stanley AIP GP LP (since 2014). Formerly, Managing Director and Deputy Chief Compliance Officer of the Adviser (2014-2016); and formerly, Chief Compliance Officer of Prudential Investment Management, Inc. (2007-2014). | |
Francis J. Smith (52)
522 Fifth Avenue
New York, NY 10036 | | Treasurer and
Principal
Financial
Officer | | Treasurer since July 2003 and Principal Financial Officer since September 2002 | | Manging Director of the Adviser and various entities affiliated with the Adviser; Treasurer (since July 2003) and Principal Financial Officer of various Morgan Stanley Funds (since September 2002). | |
Mary E. Mullin (50)
522 Fifth Avenue
New York, NY 10036 | | Secretary | | Since
June
1999 | | Executive Director of the Adviser; Secretary of various Morgan Stanley Funds (since June 1999). | |
Michael J. Key (38)
522 Fifth Avenue
New York, NY 10036 | | Vice President | | Since
June
2017 | | Vice President of the Equity and Fixed Income Funds, Liquidity Funds, various money market funds and the Morgan Stanley AIP Funds in the Fund Complex (since June 2017); Executive Director of the Adviser; Head of Product Development for Equity and Fixed Income Funds (since August 2013). | |
* This is the earliest date the officer began serving the Morgan Stanley Funds. Each officer serves a one-year term, until his or her successor is elected and qualifies.
32
Morgan Stanley Institutional Fund Trust
Annual Report — September 30, 2017
Adviser and Administrator
Morgan Stanley Investment Management Inc.
522 Fifth Avenue
New York, New York 10036
Distributor
Morgan Stanley Distribution, Inc.
522 Fifth Avenue
New York, New York 10036
Dividend Disbursing and Transfer Agent
Boston Financial Data Services, Inc.
2000 Crown Colony Drive
Quincy, Massachusetts 02169
Co-Transfer Agent
Morgan Stanley Services Company, Inc.
522 Fifth Avenue
New York, New York 10036
Custodian
State Street Bank and Trust Company
One Lincoln Street
Boston, Massachusetts 02111
Legal Counsel
Dechert LLP
1095 Avenue of the Americas
New York, New York 10036
Counsel to the Independent Trustees
Perkins Coie LLP
30 Rockefeller Plaza
New York, New York 10112
Independent Registered Public Accounting Firm
Ernst & Young LLP
200 Clarendon Street
Boston, Massachusetts 02116
Reporting to Shareholders
Each Morgan Stanley Fund provides a complete schedule of portfolio holdings in its semi-annual and annual reports within 60 days of the end of the fund's second and fourth fiscal quarters. The semi-annual and annual reports are filed electronically with the Securities and Exchange Commission (SEC) on Form N-CSRS and Form N-CSR, respectively. Morgan Stanley also delivers the semi-annual and annual reports to fund shareholders and makes these reports available on its public website, www.morganstanley.com/im. Each Morgan Stanley fund also files a complete schedule of portfolio holdings with the SEC for the fund's first and third fiscal quarters on Form N-Q. Morgan Stanley does not deliver the reports for the first and third fiscal quarters to shareholders, nor are the reports posted to the Morgan Stanley public website. You may, however, obtain the Form N-Q filings (as well as the Form N-CSR and N-CSRS filings) by accessing the SEC's website, www.sec.gov. You may also review and copy them at the SEC's Public Reference Room in Washington, DC. Information on the operation of the SEC's Public Reference Room may be obtained by calling the SEC toll free at 1 (800) SEC-0330. You can also request copies of these materials, upon payment of a duplicating fee, by electronic request at the SEC's email address (publicinfo@sec.gov) or by writing to the SEC's Public Reference Section, Washington, D.C. 20549-1520.
Proxy Voting Policies and Procedures and Proxy Voting Record
You may obtain a copy of the Trust's Proxy Voting Policy and Procedures and information regarding how the Trust voted proxies relating to portfolio securities during the most recent twelve-month period ended June 30, without charge, upon request, by calling toll free 1 (800) 548-7786 or by visiting our website at www.morganstanley.com/im. This information is also available on the SEC's website at www.sec.gov.
This report is authorized for distribution only when preceded or accompanied by a prospectus or summary prospectus of the applicable Fund of Morgan Stanley Institutional Fund Trust, which describes in detail the Fund's investment policies, risks, fees and expenses. Please read the prospectus carefully before you invest or send money. For additional information, including information regarding the investments comprising the Fund, please visit our website at www.morganstanley.com/im or call toll free 1 (800) 548-7786.
33
Printed in U.S.A.
This Report has been prepared for shareholders and may be distributed to others only if preceded or accompanied by a current prospectus.
Morgan Stanley Investment Management Inc.
522 Fifth Avenue
New York, New York 10036
© 2017 Morgan Stanley. Morgan Stanley Distribution, Inc.

IFTUSIANN
1934398 EXP 11.30.18
Item 2. Code of Ethics.
(a) The Fund has adopted a code of ethics (the “Code of Ethics”) that applies to its principal executive officer, principal financial officer, principal accounting officer or controller, or persons performing similar functions, regardless of whether these individuals are employed by the Fund or a third party.
(b) No information need be disclosed pursuant to this paragraph.
(c) Not applicable.
(d) Not applicable.
(e) Not applicable.
(f)
(1) The Fund’s Code of Ethics is attached hereto as Exhibit 12 A.
(2) Not applicable.
(3) Not applicable.
Item 3. Audit Committee Financial Expert.
The Fund’s Board of Trustees has determined that Joseph J. Kearns, an “independent” Trustee, is an “audit committee financial expert” serving on its audit committee. Under applicable securities laws, a person who is determined to be an audit committee financial expert will not be deemed an “expert” for any purpose, including without limitation for the purposes of Section 11 of the Securities Act of 1933, as a result of being designated or identified as an audit committee financial expert. The designation or identification of a person as an audit committee financial expert does not impose on such person any duties, obligations, or liabilities that are greater than the duties, obligations, and liabilities imposed on such person as a member of the audit committee and Board of Trustees in the absence of such designation or identification.
Item 4. Principal Accountant Fees and Services.
(a)(b)(c)(d) and (g). Based on fees billed for the periods shown:
2017 | | Registrant | | Covered Entities(1) | |
Audit Fees | | $ | 551,151 | | N/A | |
| | | | | |
Non-Audit Fees | | | | | |
Audit-Related Fees | | $ | — | (2) | $ | | (2) |
Tax Fees | | $ | 45,000 | (3) | $ | 10,659,594 | (4) |
All Other Fees | | $ | — | | $ | 247,388 | (5) |
Total Non-Audit Fees | | $ | 45,000 | | $ | 10,906,982 | |
| | | | | |
Total | | $ | 596,151 | | $ | 10,906,982 | |
2016 | | Registrant | | Covered Entities(1) | |
Audit Fees | | $ | 501,002 | | N/A | |
| | | | | |
Non-Audit Fees | | | | | |
Audit-Related Fees | | $ | — | (2) | $ | — | (2) |
Tax Fees | | $ | 40,500 | (3) | $ | 9,000,199 | (4) |
All Other Fees | | $ | — | | $ | 288,825 | (5) |
Total Non-Audit Fees | | $ | 40,500 | | $ | 9,289,024 | |
| | | | | |
Total | | $ | 541,502 | | $ | 9,289,024 | |
N/A- Not applicable, as not required by Item 4.
(1) Covered Entities include the Adviser (excluding sub-advisors) and any entity controlling, controlled by or under common control with the Adviser that provides ongoing services to the Registrant.
(2) Audit-Related Fees represent assurance and related services provided that are reasonably related to the performance of the audit of the financial statements of the Covered Entities’ and funds advised by the Adviser or its affiliates, specifically data verification and agreed-upon procedures related to asset securitizations and agreed-upon procedures engagements.
(3) Tax Fees represent tax compliance, tax planning and tax advice services provided in connection with the preparation and review of the Registrant’s tax returns.
(4) Tax Fees represent tax compliance, tax planning and tax advice services provided in connection with the review of Covered Entities’ tax returns.
(5) All other fees represent project management for future business applications and improving business and operational processes.
(e)(1) The audit committee’s pre-approval policies and procedures are as follows:
APPENDIX A
AUDIT COMMITTEE
AUDIT AND NON-AUDIT SERVICES
PRE-APPROVAL POLICY AND PROCEDURES
OF THE
MORGAN STANLEY RETAIL AND INSTITUTIONAL FUNDS
AS ADOPTED AND AMENDED JULY 23, 2004,(1)
1. Statement of Principles
The Audit Committee of the Board is required to review and, in its sole discretion, pre-approve all Covered Services to be provided by the Independent Auditors to the Fund and Covered Entities in order to assure that services performed by the Independent Auditors do not impair the auditor’s independence from the Fund.
The SEC has issued rules specifying the types of services that an independent auditor may not provide to its audit client, as well as the audit committee’s administration of the engagement of the independent auditor. The SEC’s rules establish two different approaches to pre-approving services, which the SEC considers to be equally valid. Proposed services either: may be pre-approved without consideration of specific case-by-case services by the Audit Committee (“general pre-approval”); or require the specific pre-approval of the Audit Committee or its delegate (“specific pre-approval”). The Audit Committee believes that the combination of these two approaches in this Policy will result in an effective and efficient procedure to pre-approve services performed by the Independent Auditors. As set forth in this Policy, unless a type of service has received general pre-approval, it will require specific pre-approval by the Audit Committee (or by any member of the Audit Committee to which pre-approval authority has been delegated) if it is to be provided by the Independent Auditors. Any proposed services exceeding pre-approved cost levels or budgeted amounts will also require specific pre-approval by the Audit Committee.
The appendices to this Policy describe the Audit, Audit-related, Tax and All Other services that have the general pre-approval of the Audit Committee. The term of any general pre-approval is 12 months from the date of pre-approval, unless the Audit Committee considers and provides a different period and states otherwise. The Audit Committee will annually review and pre-approve the services that may be provided by the Independent Auditors without obtaining specific pre-approval from the Audit Committee. The Audit Committee will add to or subtract from the list of general pre-approved services from time to time, based on subsequent determinations.
(1) This Audit Committee Audit and Non-Audit Services Pre-Approval Policy and Procedures (the “Policy”), adopted as of the date above, supersedes and replaces all prior versions that may have been adopted from time to time.
The purpose of this Policy is to set forth the policy and procedures by which the Audit Committee intends to fulfill its responsibilities. It does not delegate the Audit Committee’s responsibilities to pre-approve services performed by the Independent Auditors to management.
The Fund’s Independent Auditors have reviewed this Policy and believes that implementation of the Policy will not adversely affect the Independent Auditors’ independence.
2. Delegation
As provided in the Act and the SEC’s rules, the Audit Committee may delegate either type of pre-approval authority to one or more of its members. The member to whom such authority is delegated must report, for informational purposes only, any pre-approval decisions to the Audit Committee at its next scheduled meeting.
3. Audit Services
The annual Audit services engagement terms and fees are subject to the specific pre-approval of the Audit Committee. Audit services include the annual financial statement audit and other procedures required to be performed by the Independent Auditors to be able to form an opinion on the Fund’s financial statements. These other procedures include information systems and procedural reviews and testing performed in order to understand and place reliance on the systems of internal control, and consultations relating to the audit. The Audit Committee will approve, if necessary, any changes in terms, conditions and fees resulting from changes in audit scope, Fund structure or other items.
In addition to the annual Audit services engagement approved by the Audit Committee, the Audit Committee may grant general pre-approval to other Audit services, which are those services that only the Independent Auditors reasonably can provide. Other Audit services may include statutory audits and services associated with SEC registration statements (on Forms N-1A, N-2, N-3, N-4, etc.), periodic reports and other documents filed with the SEC or other documents issued in connection with securities offerings.
The Audit Committee has pre-approved the Audit services in Appendix B.1. All other Audit services not listed in Appendix B.1 must be specifically pre-approved by the Audit Committee (or by any member of the Audit Committee to which pre-approval has been delegated).
4. Audit-related Services
Audit-related services are assurance and related services that are reasonably related to the performance of the audit or review of the Fund’s financial statements and, to the extent they are Covered Services, the Covered Entities or that are traditionally performed by the Independent Auditors. Because the Audit Committee believes that the provision of Audit-related services does not impair the independence of the auditor and is consistent with the SEC’s rules on auditor independence, the Audit Committee may grant general pre-approval to Audit-related services. Audit-related services include, among others, accounting consultations related to accounting, financial reporting or disclosure matters not classified as “Audit services”; assistance with understanding and implementing new accounting and financial reporting guidance from rulemaking authorities; agreed-upon or expanded audit procedures related to accounting and/or billing records required to respond to or comply with financial, accounting or regulatory
reporting matters; and assistance with internal control reporting requirements under Forms N-SAR and/or N-CSR.
The Audit Committee has pre-approved the Audit-related services in Appendix B.2. All other Audit-related services not listed in Appendix B.2 must be specifically pre-approved by the Audit Committee (or by any member of the Audit Committee to which pre-approval has been delegated).
5. Tax Services
The Audit Committee believes that the Independent Auditors can provide Tax services to the Fund and, to the extent they are Covered Services, the Covered Entities, such as tax compliance, tax planning and tax advice without impairing the auditor’s independence, and the SEC has stated that the Independent Auditors may provide such services.
Pursuant to the preceding paragraph, the Audit Committee has pre-approved the Tax Services in Appendix B.3. All Tax services in Appendix B.3 must be specifically pre-approved by the Audit Committee (or by any member of the Audit Committee to which pre-approval has been delegated).
6. All Other Services
The Audit Committee believes, based on the SEC’s rules prohibiting the Independent Auditors from providing specific non-audit services, that other types of non-audit services are permitted. Accordingly, the Audit Committee believes it may grant general pre-approval to those permissible non-audit services classified as All Other services that it believes are routine and recurring services, would not impair the independence of the auditor and are consistent with the SEC’s rules on auditor independence.
The Audit Committee has pre-approved the All Other services in Appendix B.4. Permissible All Other services not listed in Appendix B.4 must be specifically pre-approved by the Audit Committee (or by any member of the Audit Committee to which pre-approval has been delegated).
7. Pre-Approval Fee Levels or Budgeted Amounts
Pre-approval fee levels or budgeted amounts for all services to be provided by the Independent Auditors will be established annually by the Audit Committee. Any proposed services exceeding these levels or amounts will require specific pre-approval by the Audit Committee. The Audit Committee is mindful of the overall relationship of fees for audit and non-audit services in determining whether to pre-approve any such services.
8. Procedures
All requests or applications for services to be provided by the Independent Auditors that do not require specific approval by the Audit Committee will be submitted to the Fund’s Chief Financial Officer and must include a detailed description of the services to be rendered. The Fund’s Chief Financial Officer will determine whether such services are included within the list of services that have received the general pre-approval of the Audit Committee. The Audit Committee will be informed on a timely basis of any such services rendered by the Independent Auditors. Requests or applications to provide services that require specific approval by the
Audit Committee will be submitted to the Audit Committee by both the Independent Auditors and the Fund’s Chief Financial Officer, and must include a joint statement as to whether, in their view, the request or application is consistent with the SEC’s rules on auditor independence.
The Audit Committee has designated the Fund’s Chief Financial Officer to monitor the performance of all services provided by the Independent Auditors and to determine whether such services are in compliance with this Policy. The Fund’s Chief Financial Officer will report to the Audit Committee on a periodic basis on the results of its monitoring. Both the Fund’s Chief Financial Officer and management will immediately report to the chairman of the Audit Committee any breach of this Policy that comes to the attention of the Fund’s Chief Financial Officer or any member of management.
9. Additional Requirements
The Audit Committee has determined to take additional measures on an annual basis to meet its responsibility to oversee the work of the Independent Auditors and to assure the auditor’s independence from the Fund, such as reviewing a formal written statement from the Independent Auditors delineating all relationships between the Independent Auditors and the Fund, consistent with Independence Standards Board No. 1, and discussing with the Independent Auditors its methods and procedures for ensuring independence.
10. Covered Entities
Covered Entities include the Fund’s investment adviser(s) and any entity controlling, controlled by or under common control with the Fund’s investment adviser(s) that provides ongoing services to the Fund(s). Beginning with non-audit service contracts entered into on or after May 6, 2003, the Fund’s audit committee must pre-approve non-audit services provided not only to the Fund but also to the Covered Entities if the engagements relate directly to the operations and financial reporting of the Fund. This list of Covered Entities would include:
Morgan Stanley Retail Funds
Morgan Stanley Investment Advisors Inc.
Morgan Stanley & Co. Incorporated
Morgan Stanley DW Inc.
Morgan Stanley Investment Management Inc.
Morgan Stanley Investment Management Limited
Morgan Stanley Investment Management Private Limited
Morgan Stanley Asset & Investment Trust Management Co., Limited
Morgan Stanley Investment Management Company
Morgan Stanley Services Company, Inc.
Morgan Stanley Distributors Inc.
Morgan Stanley Trust FSB
Morgan Stanley Institutional Funds
Morgan Stanley Investment Management Inc.
Morgan Stanley Investment Advisors Inc.
Morgan Stanley Investment Management Limited
Morgan Stanley Investment Management Private Limited
Morgan Stanley Asset & Investment Trust Management Co., Limited
Morgan Stanley Investment Management Company
Morgan Stanley & Co. Incorporated
Morgan Stanley Distribution, Inc.
Morgan Stanley AIP GP LP
Morgan Stanley Alternative Investment Partners LP
(e)(2) Beginning with non-audit service contracts entered into on or after May 6, 2003, the audit committee also is required to pre-approve services to Covered Entities to the extent that the services are determined to have a direct impact on the operations or financial reporting of the Registrant. 100% of such services were pre-approved by the audit committee pursuant to the Audit Committee’s pre-approval policies and procedures (attached hereto).
(f) Not applicable.
(g) See table above.
(h) The audit committee of the Board of Trustees has considered whether the provision of services other than audit services performed by the auditors to the Registrant and Covered Entities is compatible with maintaining the auditors’ independence in performing audit services.
Item 5. Audit Committee of Listed Registrants.
(a) The Fund has a separately-designated standing audit committee established in accordance with Section 3(a)(58)(A) of the Exchange Act whose members are:
Joseph J. Kearns, Jakki L. Haussler, Michael F. Klein and W. Allen Reed.
(b) Not applicable.
Item 6. Schedule of Investments
(a) Refer to Item 1.
(b) Not applicable.
Item 7. Disclosure of Proxy Voting Policies and Procedures for Closed-End Management Investment Companies.
Applicable only to reports filed by closed-end funds.
Item 8. Portfolio Managers of Closed-End Management Investment Companies
Applicable only to reports filed by closed-end funds.
Item 9. Closed-End Fund Repurchases
Applicable only to reports filed by closed-end funds.
Item 10. Submission of Matters to a Vote of Security Holders
Not applicable.
Item 11. Controls and Procedures
(a) The Fund’s principal executive officer and principal financial officer have concluded that the Fund’s disclosure controls and procedures are sufficient to ensure that information required to be disclosed by the Fund in this Form N-CSR was recorded, processed, summarized and reported within the time periods specified in the Securities and Exchange Commission’s rules and forms, based upon such officers’ evaluation of these controls and procedures as of a date within 90 days of the filing date of the report.
(b) There were no changes in the registrant’s internal control over financial reporting that occurred during the second fiscal quarter of the period covered by this report that has materially affected, or is reasonably likely to materially affect, the registrant’s internal control over financial reporting.
Item 12. Exhibits
(a) The Code of Ethics for Principal Executive and Senior Financial Officers is attached hereto.
(b) A separate certification for each principal executive officer and principal financial officer of the registrant are attached hereto as part of EX-99.CERT.
SIGNATURES
Pursuant to the requirements of the Securities Exchange Act of 1934 and the Investment Company Act of 1940, the registrant has duly caused this report to be signed on its behalf by the undersigned, thereunto duly authorized.
Morgan Stanley Institutional Fund Trust | |
| |
/s/ John H. Gernon | |
John H. Gernon | |
Principal Executive Officer | |
November 16, 2017 | |
Pursuant to the requirements of the Securities Exchange Act of 1934 and the Investment Company Act of 1940, this report has been signed by the following persons on behalf of the registrant and in the capacities and on the dates indicated.
/s/ John H. Gernon | |
John H. Gernon | |
Principal Executive Officer | |
November 16, 2017 | |
| |
/s/ Francis Smith | |
Francis Smith | |
Principal Financial Officer | |
November 16, 2017 | |