UNITED STATES
SECURITIES AND EXCHANGE COMMISSION
Washington, D.C. 20549
FORM N-CSR
CERTIFIED SHAREHOLDER REPORT OF REGISTERED
MANAGEMENT INVESTMENT COMPANIES
Investment Company Act file number: 811-03980
Morgan Stanley Institutional Fund Trust
(Exact name of registrant as specified in charter)
| | 522 Fifth Avenue, New York, New York | 10036 | |
| | (Address of principal executive offices) | (Zip code) | |
John H. Gernon
522 Fifth Avenue, New York, New York 10036
(Name and address of agent for service)
Registrant's telephone number, including area code: 212-296-0289
Date of fiscal year end: September 30,
Date of reporting period: September 30, 2020
Item 1 - Report to Shareholders

Morgan Stanley Institutional Fund Trust
Core Plus Fixed Income Portfolio
Annual Report
September 30, 2020
Beginning on January 1, 2021, as permitted by regulations adopted by the Securities and Exchange Commission ("SEC"), paper copies of the Fund's Annual and Semi-Annual Reports to Shareholders ("Shareholder Reports") will no longer be sent by mail, unless you specifically request paper copies of the Shareholder Reports from the Fund or from your financial intermediary, such as a broker-dealer or a bank. Instead, the Shareholder Reports will be made available on the Fund's website, https://www.morganstanley.com/im/shareholderreports and you will be notified by mail each time a Shareholder Report is posted and provided with a website link to access the Shareholder Report. If you already elected to receive Shareholder Reports electronically, you will not be affected by this change and you need not take any action. You may elect to receive Shareholder Reports and other communications from the Fund electronically anytime by contacting your financial intermediary or, if you are a direct investor, please follow the instructions on the envelope.
Beginning on January 1, 2019, you may elect to receive all future Shareholder Reports in paper free of charge. If you invest through a financial intermediary, you can contact your financial intermediary to request that you continue to receive paper copies of your Shareholder Reports. If you invest directly with the Fund, please follow the instructions on the envelope to let the Fund know you wish to continue receiving paper copies of your Shareholder Reports. Your election to receive Shareholder Reports in paper will apply to all funds held in your account if you invest through your financial intermediary or all funds held with the fund complex if you invest directly with a fund.

Morgan Stanley Institutional Fund Trust
Annual Report — September 30, 2020
Shareholders' Letter | | | 2 | | |
Expense Example | | | 3 | | |
Investment Overview | | | 4 | | |
Portfolio of Investments | | | 6 | | |
Statement of Assets and Liabilities | | | 20 | | |
Statement of Operations | | | 22 | | |
Statements of Changes in Net Assets | | | 23 | | |
Financial Highlights | | | 25 | | |
Notes to Financial Statements | | | 30 | | |
Report of Independent Registered Public Accounting Firm | | | 42 | | |
Investment Advisory Agreement Approval | | | 43 | | |
Liquidity Risk Management Program | | | 45 | | |
Federal Tax Notice | | | 46 | | |
Privacy Notice | | | 47 | | |
Trustee and Officer Information | | | 49 | | |
This report is authorized for distribution only when preceded or accompanied by a prospectus or summary prospectus of the applicable Fund of the Morgan Stanley Institutional Fund Trust. To receive a prospectus and/or statement of additional information ("SAI"), which contains more complete information such as investment objectives, charges, expenses, policies for voting proxies, risk considerations and describes in detail each of the Fund's investment policies to the prospective investor, please call toll free 1 (800) 548-7786. Please read the prospectuses carefully before you invest or send money.
Additionally, you can access information about the Fund, including performance, characteristics and investment team commentary, through Morgan Stanley Investment Management's website: www.morganstanley.com/im/shareholderreports.
Market forecasts provided in this report may not necessarily come to pass. There is no guarantee that any sectors mentioned will continue to perform as discussed herein or that securities in such sectors will be held by the Fund in the future. There is no assurance that a fund will achieve its investment objective. Funds are subject to market risk, which is the possibility that market values of securities owned by the Fund will decline and, therefore, the value of the Fund's shares may be less than what you paid for them. Accordingly, you can lose money investing in this Fund. Please see the prospectus for more complete information on investment risks.
1
Morgan Stanley Institutional Fund Trust
Annual Report — September 30, 2020
Shareholders' Letter (unaudited)
Dear Shareholders,
We are pleased to provide this Annual Report, in which you will learn how your investment in Core Plus Fixed Income Portfolio (the "Fund") performed during the latest twelve-month period.
Morgan Stanley Investment Management is a client-centric, investor-led organization. Our global presence, intellectual capital, and breadth of products and services enable us to partner with investors to meet the evolving challenges of today's financial markets. We aim to deliver superior investment service and to empower our clients to make the informed decisions that help them reach their investment goals.
As always, we thank you for selecting Morgan Stanley Investment Management, and look forward to working with you in the months and years ahead.
Sincerely,

John H. Gernon
President and Principal Executive Officer
October 2020
2
Morgan Stanley Institutional Fund Trust
Annual Report — September 30, 2020
Expense Example (unaudited)
Core Plus Fixed Income Portfolio
As a shareholder of the Fund, you may incur two types of costs: (1) transactional costs, including sales charge (loads) on purchase payments; and (2) ongoing costs, which may include advisory fees, administration fees, distribution and shareholder services fees; and other Fund expenses. This example is intended to help you understand your ongoing costs (in dollars) of investing in the Fund and to compare these costs with the ongoing costs of investing in other mutual funds.
This example is based on an investment of $1,000 invested at the beginning of the six-month period ended September 30, 2020 and held for the entire six-month period.
Actual Expenses
The table below provides information about actual account values and actual expenses. You may use the information in this table, together with the amount you invested, to estimate the expenses that you paid over the period. Simply divide your account value by $1,000 (for example, an $8,600 account value divided by $1,000 = 8.6), then multiply the result by the number in the table under the heading entitled "Actual Expenses Paid During Period" to estimate the expenses you paid on your account during this period.
Hypothetical Example for Comparison Purposes
The table below provides information about hypothetical account values and hypothetical expenses based on the Fund's actual expense ratio and an assumed rate of return of 5% per year before expenses, which is not the Fund's actual return. The hypothetical account values and expenses may not be used to estimate the actual ending account balance or expenses you paid for the period. You may use this information to compare the ongoing costs of investing in the Fund and other funds. To do so, compare this 5% hypothetical example with the 5% hypothetical examples that appear in the shareholder reports of the other funds.
Please note that the expenses shown in the table are meant to highlight your ongoing costs only and do not reflect any transactional costs, such as sales charges (loads, if applicable). Therefore, the information for each class in the table is useful in comparing ongoing costs only, and will not help you determine the relative total costs of owning different funds. In addition, if these transactional costs were included, your costs would have been higher.
| | | Beginning
Account
Value
4/1/20 | | Actual Ending
Account
Value
9/30/20 | | Hypothetical
Ending Account
Value | | Actual
Expenses
Paid
During
Period* | | Hypothetical
Expenses Paid
During Period* | | Net
Expense
Ratio
During
Period** | |
Core Plus Fixed Income Portfolio Class I | | $ | 1,000.00 | | | $ | 1,081.30 | | | $ | 1,023.00 | | | $ | 2.08 | | | $ | 2.02 | | | | 0.40 | % | |
Core Plus Fixed Income Portfolio Class A | | | 1,000.00 | | | | 1,079.30 | | | | 1,021.25 | | | | 3.90 | | | | 3.79 | | | | 0.75 | | |
Core Plus Fixed Income Portfolio Class L | | | 1,000.00 | | | | 1,077.80 | | | | 1,020.00 | | | | 5.19 | | | | 5.05 | | | | 1.00 | | |
Core Plus Fixed Income Portfolio Class C | | | 1,000.00 | | | | 1,075.30 | | | | 1,017.80 | | | | 7.47 | | | | 7.26 | | | | 1.44 | | |
Core Plus Fixed Income Portfolio Class IS | | | 1,000.00 | | | | 1,080.60 | | | | 1,023.25 | | | | 1.82 | | | | 1.77 | | | | 0.35 | | |
* Expenses are calculated using each Fund Class' annualized net expense ratio (as disclosed), multiplied by the average account value over the period and multiplied by 183/366 (to reflect the most recent one-half year period).
** Annualized.
3
Morgan Stanley Institutional Fund Trust
Annual Report — September 30, 2020
Investment Overview (unaudited)
Core Plus Fixed Income Portfolio
The Fund seeks above-average total return over a market cycle of three to five years.
Performance
For the fiscal year ended September 30, 2020, the Fund's Class I shares had a total return based on net asset value and reinvestment of distributions per share of 6.27%, net of fees. The Fund's Class I shares underperformed against the Fund's benchmark, the Bloomberg Barclays U.S. Aggregate Index (the "Index"), which returned 6.98%.
Factors Affecting Performance
• Government bond yields declined significantly over the period, particularly in the first quarter of 2020, in the U.S. and throughout the world. This slightly hurt relative performance because the Fund had a short duration position in the U.S. as rates fell. The portfolio had a long duration position in both emerging markets and non-U.S. developed markets, however, which helped relative performance as rates fell in those regions.
• The Fund's exposure to Treasury inflation-protected securities (TIPS) hurt relative performance during the beginning of the first quarter 2020, and the position was subsequently closed out as inflation breakevens began to narrow.
• Over the period, the portfolio's overweight to both investment grade and high yield corporate bonds contributed to relative performance given the significant rally during the second and third quarters of 2020.
• The Fund was hurt by its exposure to emerging market debt, which lagged the initial recovery seen in the second quarter of 2020 after the market sell-off caused by the coronavirus pandemic.
• Overall securitized positioning detracted from relative performance during the period, particularly in areas that were disproportionately affected by the lockdowns caused by the coronavirus. Exposure in areas such as asset-backed securities (ABS) and non-agency commercial mortgage-backed securities (CMBS) were the largest detractors in the sector. However, positioning in non-agency and agency residential mortgage-backed securities (RMBS) contributed to relative performance as these sub-sectors rallied significantly in the second and third quarters of 2020.
Management Strategies
• We see little risk of government bond yields rising meaningfully anytime soon. Recent rises in yields during September 2020 appear to have been more technical in nature and/or related to shifting probabilities of who will be elected the next U.S. president. However, further declines in yields also seem unlikely, given that most central banks have now cut interest rates to as low as they feel comfortable doing. Nonetheless, further cuts and other policy innovations could still happen if there is a turn for the worse, so there is still a case, we believe, for owning high-quality government bonds as a hedge against further stress, even if much less than normal.
• We remain constructive on corporate credit. Although we continue to hold a positive and upbeat view with regard to the evolution of the economy and credit spreads, risks remain. Rising infection rates, leading to larger and more aggressive lockdowns, could easily slow economies and upend our views. We do not think this is likely, as all governments seem to be adopting more selective, targeted lockdowns to deal with local issues. As long as local issues do not spread and/or hospitalization rates/mortality rates do not climb too much, economies should be fine. Vaccines continue to be the linchpin of a broader solution to get sectors of the economy like travel, leisure and entertainment back to semi-normal, thus allowing national incomes to return back to pre-COVID-19 levels.
• In the securitized assets sector, we still have a positive fundamental credit outlook for U.S. residential and consumer credit conditions given various government support programs that have been put in place in response to the coronavirus pandemic. Additionally, mortgage fundamental performance has been generally positive so far, as loan delinquencies and forbearance requests continue to decline, and remain much lower than most market forecasts given current unemployment forecasts. National home prices are up almost 5% over the past year, fueled by record low mortgage rates and historically low housing supply.i We expect the U.S. housing market to remain stable and non-agency RMBS to continue to perform relatively well from a credit perspective in the near future.
i Source: S&P CoreLogic Case Shiller U.S. National Home Price Index, September 29, 2020. The index measures U.S. residential real estate prices, tracking changes in the value of residential real estate nationally.
4
Morgan Stanley Institutional Fund Trust
Annual Report — September 30, 2020
Investment Overview (unaudited) (cont'd)
Core Plus Fixed Income Portfolio
• We remain cautiously optimistic on emerging market debt in the near term on the back of continued global monetary and fiscal policy accommodation. A continued rebound in China growth, to the extent that spills over to the global economy, should also provide a further boost to risky assets, as well as any positive developments on coronavirus treatments and vaccines. On the other hand, our relatively constructive view on emerging market assets in the near term is tempered by less compelling valuations, increased volatility due to the upcoming U.S. presidential election, and some setbacks on the fight against the pandemic, as evidenced in increasing case counts in Europe and stricter lockdown measures imposed in several countries.

* Minimum Investment
In accordance with SEC regulations, the Fund's performance shown assumes that all recurring fees (including management fees) were deducted and all dividends and distributions were reinvested. The performance of Class A, Class L, Class C and Class IS shares will vary from the performance of Class I shares based upon their different inception dates and will be negatively impacted by additional fees assessed to those classes (where applicable).
Performance Compared to the Bloomberg Barclays U.S. Aggregate Index(1) and the Lipper Core Plus Bond Funds Index(2)
| | | Period Ended September 30, 2020
Total Returns(3) | |
| | | | | Average Annual | |
| | | One
Year | | Five
Years | | Ten
Years | | Since
Inception(9) | |
Fund — Class I Shares
w/o sales charges(4) | | | 6.27 | % | | | 6.73 | % | | | 5.61 | % | | | 7.17 | % | |
Fund — Class A Shares
w/o sales charges(5) | | | 5.91 | | | | 6.35 | | | | 5.27 | | | | 4.95 | | |
Fund — Class A Shares with
maximum 3.25% sales charges(5) | | | 2.46 | | | | 5.66 | | | | 4.93 | | | | 4.81 | | |
Fund — Class L Shares
w/o sales charges(6) | | | 5.63 | | | | 6.08 | | | | — | | | | 4.93 | | |
Fund — Class C Shares
w/o sales charges(7) | | | 5.16 | | | | 5.58 | | | | — | | | | 4.74 | | |
Fund — Class C Shares with
maximum 1.00% deferred
sales charges(7) | | | 4.16 | | | | 5.58 | | | | — | | | | 4.74 | | |
Fund — Class IS Shares
w/o sales charges(8) | | | 6.24 | | | | — | | | | — | | | | 7.67 | | |
Bloomberg Barclays
U.S. Aggregate Index | | | 6.98 | | | | 4.18 | | | | 3.64 | | | | 6.90 | | |
Lipper Core Plus Bond Funds Index | | | 6.91 | | | | 4.68 | | | | 4.19 | | | | — | | |
Performance data quoted represents past performance, which is no guarantee of future results, and current performance may be lower or higher than the figures shown. Performance assumes that all dividends and distributions, if any, were reinvested. For the most recent month-end performance figures, please visit www.morganstanley.com/im/shareholderreports. Investment returns and principal value will fluctuate so that Fund shares, when redeemed, may be worth more or less than their original cost. Total returns do not reflect the deduction of taxes that a shareholder would pay on Fund distributions or the redemption of Fund shares. Performance of share classes will vary due to differences in sales charges and expenses.
(1) The Bloomberg Barclays U.S. Aggregate Index tracks the performance of U.S. government agency and Treasury securities, investment-grade corporate debt securities, agency mortgage-backed securities, asset-backed securities and commercial mortgage-backed securities. The Index is unmanaged and its returns do not include any sales charges or fees. Such costs would lower performance. It is not possible to invest directly in an index.
(2) The Lipper Core Plus Bond Funds Index is an equally weighted performance index of the largest qualifying funds (based on net assets) in the Lipper Core Plus Bond Funds classification. The Index, which is adjusted for capital gains distributions and income dividends, is unmanaged and should not be considered an investment. There are currently 30 funds represented in this Index. As of the date of this report, the Fund was in the Lipper Core Plus Bond Funds classification.
(3) Total returns for the Fund reflect expenses waived and/or reimbursed, if applicable, by the Adviser. Without such waivers and/or reimbursements, total returns would have been lower.
(4) Commenced operations on November 14, 1984.
(5) Commenced offering on November 7, 1996.
(6) Commenced offering on April 27, 2012.
(7) Commenced offering on April 30, 2015.
(8) Commenced offering on June 15, 2018.
(9) For comparative purposes, average annual since inception returns listed for the Indexes refer to the inception date of Class I of the Fund, not the inception of the Indexes.
5
Morgan Stanley Institutional Fund Trust
Annual Report — September 30, 2020
Portfolio of Investments
Core Plus Fixed Income Portfolio
| | | Face
Amount
(000) | | Value
(000) | |
Fixed Income Securities (97.8%) | |
Agency Adjustable Rate Mortgage (0.0%) | |
Federal Home Loan Mortgage Corporation,
Conventional Pools:
12 Month USD LIBOR + 1.62%,
3.00%, 7/1/45 | | $ | 52 | | | $ | 54 | | |
Agency Fixed Rate Mortgages (23.0%) | |
Federal Home Loan Mortgage Corporation, | |
Conventional Pools: | |
2.50%, 11/1/49 | | | 1,532 | | | | 1,609 | | |
3.00%, 11/1/49 - 12/1/49 | | | 2,004 | | | | 2,071 | | |
3.50%, 8/1/49 | | | 818 | | | | 845 | | |
4.00%, 4/1/49 - 11/1/49 | | | 3,097 | | | | 3,260 | | |
4.50%, 2/1/49 | | | 1,255 | | | | 1,357 | | |
Gold Pools: | |
3.00%, 3/1/47 - 6/1/49 | | | 2,734 | | | | 2,873 | | |
3.50%, 1/1/44 - 4/1/49 | | | 1,482 | | | | 1,609 | | |
4.00%, 6/1/44 - 1/1/48 | | | 938 | | | | 1,016 | | |
5.41%, 7/1/37 - 8/1/37 | | | 20 | | | | 21 | | |
5.44%, 1/1/37 - 2/1/38 | | | 50 | | | | 55 | | |
5.46%, 5/1/37 - 1/1/38 | | | 52 | | | | 57 | | |
5.48%, 8/1/37 - 10/1/37 | | | 36 | | | | 41 | | |
5.50%, 8/1/37 - 4/1/38 | | | 72 | | | | 81 | | |
5.52%, 10/1/37 | | | 5 | | | | 6 | | |
5.62%, 12/1/36 - 8/1/37 | | | 59 | | | | 66 | | |
6.00%, 10/1/36 - 8/1/38 | | | 97 | | | | 111 | | |
6.50%, 12/1/25 - 8/1/33 | | | 74 | | | | 84 | | |
7.00%, 6/1/28 - 11/1/31 | | | 31 | | | | 31 | | |
Federal National Mortgage Association, | |
Conventional Pools: | |
2.50%, 10/1/49 - 2/1/50 | | | 3,642 | | | | 3,773 | | |
3.00%, 6/1/40 - 1/1/50 | | | 11,095 | | | | 11,516 | | |
3.50%, 8/1/45 - 11/1/49 | | | 8,718 | | | | 9,205 | | |
4.00%, 11/1/41 - 9/1/49 | | | 6,744 | | | | 7,271 | | |
4.50%, 3/1/41 - 8/1/49 | | | 2,907 | | | | 3,170 | | |
5.00%, 3/1/41 | | | 163 | | | | 188 | | |
5.50%, 6/1/35 - 1/1/37 | | | 49 | | | | 58 | | |
5.62%, 12/1/36 | | | 31 | | | | 33 | | |
6.50%, 4/1/24 - 1/1/34 | | | 673 | | | | 761 | | |
7.00%, 5/1/24 - 12/1/33 | | | 120 | | | | 132 | | |
9.50%, 4/1/30 | | | 48 | | | | 54 | | |
October TBA: | |
2.00%, 10/1/50 (a) | | | 19,025 | | | | 19,672 | | |
2.50%, 10/1/50 (a) | | | 30,600 | | | | 32,100 | | |
3.00%, 10/1/35 - 10/1/50(a) | | | 62,460 | | | | 65,440 | | |
3.50%, 10/1/50 (a) | | | 24,000 | | | | 25,306 | | |
Government National Mortgage Association, | |
Various Pools: | |
3.50%, 11/20/40 - 7/20/49 | | | 1,868 | | | | 1,985 | | |
4.00%, 8/20/41 - 11/20/49 | | | 8,746 | | | | 9,310 | | |
4.50%, 4/20/49 - 7/20/49 | | | 1,425 | | | | 1,509 | | |
5.00%, 12/20/48 - 2/20/49 | | | 201 | | | | 217 | | |
6.50%, 5/15/40 | | | 419 | | | | 499 | | |
| | | | 207,392 | | |
| | | Face
Amount
(000) | | Value
(000) | |
Asset-Backed Securities (12.2%) | |
Aaset Trust, | |
3.84%, 5/15/39 (b) | | $ | 443 | | | $ | 418 | | |
Accredited Mortgage Loan Trust, | |
1 Month USD LIBOR + 0.60%,
0.75%, 4/25/34 (c) | | | 686 | | | | 677 | | |
Ajax Mortgage Loan Trust, | |
1.70%, 5/25/59 (b) | | | 2,583 | | | | 2,591 | | |
American Homes 4 Rent Trust, | |
6.07%, 10/17/52 (b) | | | 601 | | | | 674 | | |
AMSR 2019-SFR1 Trust, | |
2.77%, 1/19/39 (b) | | | 3,100 | | | | 3,293 | | |
Aqua Finance Trust, | |
3.47%, 7/16/40 (b) | | | 900 | | | | 930 | | |
Avant Loans Funding Trust, | |
4.65%, 4/15/26 (b) | | | 850 | | | | 832 | | |
5.00%, 11/17/25 (b) | | | 525 | | | | 527 | | |
BCMSC Trust, | |
7.51%, 1/15/29 (c) | | | 1,474 | | | | 1,422 | | |
Blackbird Capital Aircraft Lease
Securitization Ltd., | |
5.68%, 12/16/41 (b) | | | 771 | | | | 542 | | |
Cascade Funding Mortgage Trust, | |
5.60%, 4/25/30 (b)(c) | | | 1,000 | | | | 1,054 | | |
7.30%, 4/25/30 (b)(c) | | | 2,000 | | | | 2,115 | | |
Cascade MH Asset Trust, | |
4.00%, 11/25/44 (b)(c) | | | 1,510 | | | | 1,559 | | |
| CFMT 2020-HB3 LLC, | |
6.28%, 5/25/30 (b)(c) | | | 1,100 | | | | 1,111 | | |
Conn's Receivables Funding LLC, | |
3.62%, 6/17/24 (b) | | | 1,000 | | | | 989 | | |
Consumer Loan Underlying Bond Credit Trust, | |
4.41%, 10/15/26 (b) | | | 2,000 | | | | 1,936 | | |
4.66%, 7/15/26 (b) | | | 1,000 | | | | 973 | | |
5.21%, 7/15/25 (b) | | | 1,136 | | | | 1,127 | | |
ContiMortgage Home Equity Loan Trust, | |
8.10%, 8/15/25 | | | 20 | | | | 16 | | |
Diamond Resorts Owner Trust, | |
4.02%, 2/20/32 (b) | | | 1,226 | | | | 1,206 | | |
Fair Square Issuance Trust, | |
2.90%, 9/20/24 (b) | | | 900 | | | | 901 | | |
Fairstone Financial Issuance Trust I, | |
3.95%, 3/21/33 (b) | | CAD | 600 | | | | 451 | | |
Falcon Aerospace Ltd., | |
3.60%, 9/15/39 (b) | | $ | 962 | | | | 887 | | |
FCI Funding 2019-1 LLC, | |
3.63%, 2/18/31 (b) | | | 362 | | | | 368 | | |
Foundation Finance Trust, | |
3.86%, 11/15/34 (b) | | | 592 | | | | 611 | | |
FREED ABS Trust, | |
3.19%, 11/18/26 (b) | | | 2,000 | | | | 1,987 | | |
3.87%, 6/18/26 (b) | | | 800 | | | | 802 | | |
4.52%, 6/18/27 (b) | | | 1,004 | | | | 1,016 | | |
4.61%, 10/20/25 (b) | | | 969 | | | | 972 | | |
The accompanying notes are an integral part of the financial statements.
6
Morgan Stanley Institutional Fund Trust
Annual Report — September 30, 2020
Portfolio of Investments (cont'd)
Core Plus Fixed Income Portfolio
| | | Face
Amount
(000) | | Value
(000) | |
Asset-Backed Securities (cont'd) | |
GAIA Aviation Ltd., | |
7.00%, 12/15/44 (b) | | $ | 1,274 | | | $ | 591 | | |
Goodgreen Trust, | |
5.53%, 4/15/55 (b) | | | 2,895 | | | | 2,932 | | |
Home Partners of America Trust, | |
1 Month USD LIBOR + 1.45%,
1.60%, 7/17/37 (b)(c) | | | 2,200 | | | | 2,181 | | |
Invitation Homes Trust, | |
1 Month USD LIBOR + 2.00%,
2.15%, 6/17/37 (b)(c) | | | 2,500 | | | | 2,514 | | |
1 Month USD LIBOR + 2.25%,
2.50%, 7/17/37 (b)(c) | | | 132 | | | | 131 | | |
JOL Air Ltd., | |
4.95%, 4/15/44 (b) | | | 241 | | | | 175 | | |
Lunar Aircraft Ltd., | |
3.38%, 2/15/45 (b) | | | 468 | | | | 438 | | |
MACH 1 Cayman Ltd., | |
3.47%, 10/15/39 (b) | | | 1,114 | | | | 1,024 | | |
MAPS Ltd., | |
4.21%, 5/15/43 (b) | | | 580 | | | | 539 | | |
METAL LLC, | |
4.58%, 10/15/42 (b) | | | 623 | | | | 473 | | |
MFA LLC, | |
3.35%, 11/25/47 (b) | | | 613 | | | | 616 | | |
3.88%, 5/25/48 (b) | | | 874 | | | | 874 | | |
4.16%, 7/25/48 (b) | | | 660 | | | | 662 | | |
Mosaic Solar Loan Trust, | |
2.10%, 4/20/46 (b) | | | 1,045 | | | | 1,071 | | |
Nationstar HECM Loan Trust, | |
2.82%, 9/25/30 (b)(c) | | | 775 | | | | 775 | | |
Navistar Financial Dealer Note Master Trust, | |
1 Month USD LIBOR + 2.90%,
3.05%, 7/25/25 (b)(c) | | | 1,300 | | | | 1,309 | | |
New Residential Advance Receivables Trust, | |
2.80%, 10/15/51 (b) | | | 600 | | | | 601 | | |
New Residential Mortgage LLC, | |
5.44%, 7/25/25 (b) | | | 2,818 | | | | 2,829 | | |
New Residential Mortgage LLC, | |
4.69%, 5/25/23 (b) | | | 333 | | | | 325 | | |
NewDay Funding PLC, | |
1 Month GBP LIBOR + 2.10%,
2.15%, 8/15/26 (b)(c) | | GBP | 500 | | | | 637 | | |
Newtek Small Business Loan Trust, | |
1 Month USD LIBOR + 1.70%,
1.85%, 2/25/44 (b)(c) | | $ | 563 | | | | 550 | | |
NRZ Excess Spread-Collateralized Notes, | |
4.37%, 1/25/23 (b) | | | 332 | | | | 328 | | |
4.59%, 2/25/23 (b) | | | 603 | | | | 583 | | |
5.44%, 6/25/25 (b) | | | 2,671 | | | | 2,696 | | |
NYCTL Trust, | |
2.19%, 11/10/32 (b) | | | 1,297 | | | | 1,315 | | |
| | | Face
Amount
(000) | | Value
(000) | |
Oxford Finance Funding LLC, | |
3.10%, 2/15/28 (b) | | $ | 1,000 | | | $ | 1,017 | | |
5.44%, 2/15/27 (b) | | | 550 | | | | 556 | | |
PNMAC GMSR Issuer Trust, | |
1 Month USD LIBOR + 2.35%,
2.50%, 4/25/23 (b)(c) | | | 1,050 | | | | 1,013 | | |
1 Month USD LIBOR + 2.65%,
2.80%, 8/25/25 (b)(c) | | | 1,400 | | | | 1,354 | | |
1 Month USD LIBOR + 2.85%,
3.00%, 2/25/23 (b)(c) | | | 500 | | | | 492 | | |
Pretium Mortgage Credit Partners I LLC, | |
2.86%, 5/27/59 (b) | | | 2,009 | | | | 2,004 | | |
Prosper Marketplace Issuance Trust, | |
3.20%, 2/17/26 (b) | | | 1,150 | | | | 1,155 | | |
3.59%, 7/15/25 (b) | | | 1,250 | | | | 1,259 | | |
4.87%, 6/17/24 (b) | | | 120 | | | | 120 | | |
5.50%, 10/15/24 (b) | | | 2,000 | | | | 1,972 | | |
PRPM LLC, | |
3.35%, 11/25/24 (b) | | | 986 | | | | 990 | | |
3.97%, 4/25/24 (b) | | | 924 | | | | 934 | | |
Raptor Aircraft Finance I LLC, | |
4.21%, 8/23/44 (b) | | | 2,307 | | | | 2,064 | | |
RCO V Mortgage LLC, | |
3.47%, 11/25/24 (b) | | | 1,979 | | | | 1,978 | | |
4.46%, 10/25/23 (b) | | | 2 | | | | 2 | | |
ReadyCap Lending Small Business Loan Trust, | |
Daily U.S. Prime Rate – 0.50%,
2.75%, 12/27/44 (b)(c) | | | 828 | | | | 774 | | |
Republic Finance Issuance Trust, | |
3.43%, 11/22/27 (b) | | | 1,100 | | | | 1,119 | | |
3.93%, 11/22/27 (b) | | | 500 | | | | 495 | | |
S-Jets Ltd., | |
7.02%, 8/15/42 (b) | | | 1,008 | | | | 445 | | |
SFS Asset Securitization LLC, | |
4.24%, 6/10/25 (b) | | | 2,137 | | | | 2,133 | | |
SLM Student Loan Trust, | |
3 Month EURIBOR + 0.55%,
0.10%, 7/25/39 - 1/25/40 (c) | | EUR | 3,900 | | | | 4,208 | | |
Small Business Lending Trust, | |
2.85%, 7/15/26 (b) | | $ | 292 | | | | 287 | | |
Small Business Origination Loan Trust, | |
3.85%, 12/15/27 (c) | | GBP | 751 | | | | 529 | | |
Sofi Consumer Loan Program Trust, | |
3.79%, 4/26/27 (b) | | $ | 600 | | | | 616 | | |
4.02%, 8/25/27 (b) | | | 200 | | | | 203 | | |
Sprite 2017-1 Ltd., | |
4.25%, 12/15/37 (b) | | | 517 | | | | 472 | | |
SPS Servicer Advance Receivables Trust
Advance Receivables Backed Notes, | |
2.77%, 10/15/52 (b) | | | 1,000 | | | | 992 | | |
START Ireland, | |
4.09%, 3/15/44 (b) | | | 363 | | | | 342 | | |
Start Ltd., | |
4.09%, 5/15/43 (b) | | | 1,308 | | | | 1,222 | | |
The accompanying notes are an integral part of the financial statements.
7
Morgan Stanley Institutional Fund Trust
Annual Report — September 30, 2020
Portfolio of Investments (cont'd)
Core Plus Fixed Income Portfolio
| | | Face
Amount
(000) | | Value
(000) | |
Asset-Backed Securities (cont'd) | |
Tricon American Homes Trust, | |
5.10%, 1/17/36 (b) | | $ | 1,500 | | | $ | 1,564 | | |
5.15%, 9/17/34 (b) | | | 1,200 | | | | 1,235 | | |
5.77%, 11/17/33 (b) | | | 1,300 | | | | 1,292 | | |
Upgrade Receivables Trust, | |
5.17%, 11/15/24 (b) | | | 1,500 | | | | 1,493 | | |
Upstart Securitization Trust, | |
3.73%, 9/20/29 (b) | | | 1,700 | | | | 1,695 | | |
5.00%, 8/20/25 (b) | | | 59 | | | | 59 | | |
Vantage Data Centers Issuer LLC, | |
4.07%, 2/16/43 (b) | | | 390 | | | | 404 | | |
VCAT LLC, | |
3.57%, 11/25/49 (b)(c) | | | 1,078 | | | | 1,077 | | |
3.67%, 8/25/50 (b) | | | 2,944 | | | | 2,949 | | |
Vericrest Opportunity Loan Trust, | |
3.18%, 10/25/49 (b) | | | 979 | | | | 982 | | |
3.35%, 9/25/49 (b) | | | 1,415 | | | | 1,419 | | |
Verizon Owner Trust, | |
1.94%, 4/22/24 | | | 1,700 | | | | 1,741 | | |
VOLT LXXX LLC, | |
3.23%, 10/25/49 (b) | | | 825 | | | | 826 | | |
VOLT LXXXIII LLC, | |
3.33%, 11/26/49 (b) | | | 1,597 | | | | 1,604 | | |
VOLT LXXXV LLC, | |
3.23%, 1/25/50 (b) | | | 1,201 | | | | 1,205 | | |
VOLT LXXXVIII LLC, | |
2.98%, 3/25/50 (b) | | | 1,834 | | | | 1,834 | | |
| | | | 110,282 | | |
Collateralized Mortgage Obligations — Agency Collateral Series (0.4%) | |
Federal Home Loan Mortgage Corporation, | |
IO | |
2.83%, 8/25/48 (c) | | | 5,484 | | | | 1,153 | | |
Federal Home Loan Mortgage Corporation, | |
1 Month USD LIBOR + 4.35%,
4.51%, 12/25/26 (b)(c) | | | 114 | | | | 113 | | |
1 Month USD LIBOR + 5.05%,
5.21%, 7/25/23 (c) | | | 99 | | | | 96 | | |
1 Month USD LIBOR + 5.25%,
5.41%, 7/25/26 (b)(c) | | | 46 | | | | 47 | | |
IO | |
0.46%, 11/25/27 (c) | | | 23,788 | | | | 531 | | |
0.56%, 8/25/27 (c) | | | 14,735 | | | | 402 | | |
3.57%, 10/25/38 (c) | | | 3,500 | | | | 1,175 | | |
IO REMIC | |
6.00% - 1 Month USD LIBOR,
5.85%, 11/15/43 (d) | | | 778 | | | | 134 | | |
6.05% - 1 Month USD LIBOR,
5.90%, 4/15/39 (d) | | | 236 | | | | 4 | | |
IO STRIPS | |
7.50%, 12/15/29 | | | 21 | | | | 4 | | |
| | | Face
Amount
(000) | | Value
(000) | |
Federal National Mortgage Association, | |
IO PAC REMIC | |
8.00%, 9/18/27 | | $ | 64 | | | $ | 10 | | |
IO REMIC | |
6.00%, 7/25/33 | | | 50 | | | | 7 | | |
IO STRIPS | |
6.50%, 9/25/29 - 12/25/29 | | | 277 | | | | 39 | | |
8.00%, 4/25/24 | | | 31 | | | | 1 | | |
8.50%, 10/25/25 | | | 21 | | | | 3 | | |
9.00%, 11/25/26 | | | 21 | | | | 2 | | |
REMIC | |
7.00%, 9/25/32 | | | 155 | | | | 188 | | |
Government National Mortgage Association, | |
IO | |
5.00%, 2/16/41 | | | 161 | | | | 29 | | |
IO PAC | |
6.15% - 1 Month USD LIBOR,
5.99%, 10/20/41 (d) | | | 556 | | | | 26 | | |
| | | | 3,964 | | |
Commercial Mortgage-Backed Securities (5.1%) | |
Bancorp Commercial Mortgage Trust, | |
1 Month USD LIBOR + 2.30%, 2.45%,
9/15/36 (b)(c) | | | 1,400 | | | | 1,297 | | |
BANK 2019-BNK21, | |
IO | |
1.00%, 10/17/52 (c) | | | 14,956 | | | | 970 | | |
Barclays Commercial Mortgage Trust, | |
IO | |
1.51%, 5/15/52 (c) | | | 17,937 | | | | 1,679 | | |
Benchmark Mortgage Trust, | |
3.76%, 7/15/53 (b) | | | 2,000 | | | | 2,017 | | |
IO | |
0.99%, 9/15/48 (b)(c) | | | 31,000 | | | | 1,482 | | |
BF 2019-NYT Mortgage Trust, | |
1 Month USD LIBOR + 1.70%,
1.85%, 12/15/35 (b)(c) | | | 2,500 | | | | 2,497 | | |
BXP Trust, | |
1 Month USD LIBOR + 3.00%,
3.15%, 11/15/34 (b)(c) | | | 1,150 | | | | 874 | | |
CG-CCRE Commercial Mortgage Trust, | |
1 Month USD LIBOR + 1.85%,
2.01%, 11/15/31 (b)(c) | | | 761 | | | | 712 | | |
Citigroup Commercial Mortgage Trust, | |
3.62%, 12/10/41 (b) | | | 1,100 | | | | 866 | | |
IO | |
0.98%, 11/10/48 (c) | | | 2,632 | | | | 76 | | |
1.04%, 9/10/58 (c) | | | 4,588 | | | | 168 | | |
COMM Mortgage Trust, | |
3.51%, 8/15/57 (b)(c) | | | 1,400 | | | | 1,327 | | |
5.46%, 8/10/46 (b)(c) | | | 800 | | | | 664 | | |
IO | |
0.14%, 7/10/45 (c) | | | 12,527 | | | | 26 | | |
0.88%, 10/10/47 (c) | | | 3,198 | | | | 73 | | |
1.15%, 7/15/47 (c) | | | 3,021 | | | | 93 | | |
The accompanying notes are an integral part of the financial statements.
8
Morgan Stanley Institutional Fund Trust
Annual Report — September 30, 2020
Portfolio of Investments (cont'd)
Core Plus Fixed Income Portfolio
| | | Face
Amount
(000) | | Value
(000) | |
Commercial Mortgage-Backed Securities (cont'd) | |
CSWF 2018-TOP, | |
1 Month USD LIBOR + 1.45%,
1.60%, 8/15/35 (b)(c) | | $ | 2,240 | | | $ | 2,143 | | |
GS Mortgage Securities Trust, | |
4.90%, 8/10/46 (b)(c) | | | 500 | | | | 384 | | |
IO | |
0.87%, 9/10/47 (c) | | | 5,124 | | | | 122 | | |
1.40%, 10/10/48 (c) | | | 5,012 | | | | 245 | | |
InTown Hotel Portfolio Trust, | |
1 Month USD LIBOR + 2.05%,
2.20%, 1/15/33 (b)(c) | | | 579 | | | | 562 | | |
Jackson Park Trust LIC, | |
3.24%, 10/14/39 (b)(c) | | | 1,700 | | | | 1,624 | | |
JP Morgan Chase Commercial Mortgage
Securities Trust, | |
IO | |
0.65%, 4/15/46 (c) | | | 6,956 | | | | 90 | | |
0.82%, 12/15/49 (c) | | | 4,136 | | | | 116 | | |
1.09%, 7/15/47 (c) | | | 7,168 | | | | 132 | | |
JPMBB Commercial Mortgage Securities Trust, | |
4.83%, 4/15/47 (b)(c) | | | 775 | | | | 684 | | |
IO | |
1.16%, 8/15/47 (c) | | | 3,867 | | | | 113 | | |
Manhattan West, | |
2.41%, 9/10/39 (b)(c) | | | 1,500 | | | | 1,468 | | |
MFT Trust, | |
3.39%, 8/10/40 (b)(c) | | | 1,000 | | | | 932 | | |
3.48%, 2/10/42 (b)(c) | | | 800 | | | | 746 | | |
MKT 2020-525M Mortgage Trust, | |
2.94%, 2/12/40 (b)(c) | | | 1,000 | | | | 908 | | |
Multifamily Connecticut Avenue Securities Trust, | |
1 Month USD LIBOR + 1.70%,
1.85%, 10/15/49 (b)(c) | | | 473 | | | | 454 | | |
1 Month USD LIBOR + 1.95%,
2.10%, 3/25/50 (b)(c) | | | 2,992 | | | | 2,917 | | |
Natixis Commercial Mortgage Securities Trust, | |
1 Month USD LIBOR + 2.20%,
2.35%, 7/15/36 (b)(c) | | | 2,300 | | | | 2,217 | | |
4.27%, 5/15/39(b)(c) | | | 2,300 | | | | 2,337 | | |
4.46%, 1/15/43 (b)(c) | | | 800 | | | | 802 | | |
4.56%, 2/15/39 (b)(c) | | | 1,941 | | | | 1,930 | | |
Olympic Tower 2017-OT Mortgage Trust, | |
3.57%, 5/10/39 (b) | | | 2,900 | | | | 3,128 | | |
SG Commercial Mortgage Securities Trust, | |
3.85%, 3/15/37 (b)(c) | | | 1,900 | | | | 1,740 | | |
4.66%, 2/15/41 (b)(c) | | | 1,250 | | | | 1,141 | | |
VMC Finance 2019-FL3 LLC, | |
1 Month USD LIBOR + 2.05%,
2.20%, 9/15/36 (b)(c) | | | 1,603 | | | | 1,551 | | |
Wells Fargo Commercial Mortgage Trust, | |
1 Month USD LIBOR + 1.74%,
1.89%, 2/15/37 (b)(c) | | | 900 | | | | 802 | | |
1 Month USD LIBOR + 2.21%,
2.36%, 1/15/35 (b)(c) | | | 500 | | | | 469 | | |
| | | Face
Amount
(000) | | Value
(000) | |
WFRBS Commercial Mortgage Trust, | |
3.50%, 8/15/47 (b) | | $ | 1,400 | | | $ | 1,010 | | |
4.28%, 5/15/45 (b)(c) | | | 425 | | | | 398 | | |
| | | | 45,986 | | |
Corporate Bonds (36.0%) | |
Energy (0.5%) | |
BP Capital Markets America, Inc., | |
3.12%, 5/4/26 | | | 2,250 | | | | 2,486 | | |
3.25%, 5/6/22 | | | 625 | | | | 652 | | |
Midwest Connector Capital Co. LLC, | |
3.63%, 4/1/22 (b)(e) | | | 400 | | | | 403 | | |
Petrobras Global Finance BV, | |
6.75%, 6/3/50 | | | 710 | | | | 770 | | |
| | | | 4,311 | | |
Finance (14.2%) | |
AerCap Ireland Capital DAC/AerCap Global
Aviation Trust, | |
4.13%, 7/3/23 | | | 1,150 | | | | 1,174 | | |
Aflac, Inc., | |
3.60%, 4/1/30 | | | 1,250 | | | | 1,470 | | |
Air Lease Corp., | |
2.30%, 2/1/25 | | | 1,325 | | | | 1,305 | | |
American Express Co., | |
4.20%, 11/6/25 | | | 1,625 | | | | 1,884 | | |
American International Group, Inc., | |
4.50%, 7/16/44 | | | 1,075 | | | | 1,258 | | |
4.88%, 6/1/22 | | | 375 | | | | 402 | | |
Aon Corp., | |
2.20%, 11/15/22 | | | 1,250 | | | | 1,294 | | |
AvalonBay Communities, Inc.,
Series G | |
2.95%, 5/11/26 | | | 375 | | | | 416 | | |
Avolon Holdings Funding Ltd., | |
2.88%, 2/15/25 (b) | | | 1,750 | | | | 1,607 | | |
Banco Bradesco SA, | |
3.20%, 1/27/25 (b) | | | 2,790 | | | | 2,838 | | |
Banco Santander Chile, | |
2.70%, 1/10/25 (b) | | | 1,125 | | | | 1,188 | | |
Banco Santander SA, | |
5.18%, 11/19/25 | | | 600 | | | | 680 | | |
Bank of America Corp., | |
2.59%, 4/29/31 | | | 1,275 | | | | 1,360 | | |
2.68%, 6/19/41 | | | 603 | | | | 619 | | |
3.19%, 7/23/30 | | | 475 | | | | 523 | | |
4.24%, 4/24/38 | | | 94 | | | | 115 | | |
4.25%, 10/22/26 | | | 2,288 | | | | 2,653 | | |
MTN | |
4.00%, 1/22/25 | | | 1,055 | | | | 1,176 | | |
Bank of Montreal, | |
3.80%, 12/15/32 | | | 1,675 | | | | 1,868 | | |
Bank of New York Mellon Corp. (The),
MTN | |
3.65%, 2/4/24 | | | 1,750 | | | | 1,922 | | |
The accompanying notes are an integral part of the financial statements.
9
Morgan Stanley Institutional Fund Trust
Annual Report — September 30, 2020
Portfolio of Investments (cont'd)
Core Plus Fixed Income Portfolio
| | | Face
Amount
(000) | | Value
(000) | |
Finance (cont'd) | |
Banque Federative du Credit Mutuel SA, | |
3.75%, 7/20/23 (b) | | $ | 1,530 | | | $ | 1,661 | | |
BBVA USA, | |
3.50%, 6/11/21 | | | 800 | | | | 815 | | |
Belrose Funding Trust, | |
2.33%, 8/15/30 (b) | | | 2,800 | | | | 2,773 | | |
BNP Paribas SA, | |
2.82%, 11/19/25 (b) | | | 700 | | | | 738 | | |
4.40%, 8/14/28 (b) | | | 1,050 | | | | 1,233 | | |
Boston Properties LP, | |
3.80%, 2/1/24 | | | 700 | | | | 759 | | |
| BPCE SA, | |
5.15%, 7/21/24 (b) | | | 1,075 | | | | 1,206 | | |
Brookfield Finance LLC, | |
3.45%, 4/15/50 | | | 1,350 | | | | 1,325 | | |
Brookfield Finance, Inc., | |
4.00%, 4/1/24 | | | 775 | | | | 854 | | |
Brown & Brown, Inc., | |
2.38%, 3/15/31 | | | 900 | | | | 908 | | |
4.20%, 9/15/24 | | | 1,150 | | | | 1,270 | | |
Canadian Imperial Bank of Commerce, | |
2.25%, 1/28/25 | | | 2,300 | | | | 2,429 | | |
Capital One Bank USA NA, | |
3.38%, 2/15/23 | | | 925 | | | | 979 | | |
Capital One Financial Corp., | |
3.30%, 10/30/24 | | | 3,525 | | | | 3,824 | | |
Chubb INA Holdings, Inc., | |
1.38%, 9/15/30 | | | 2,275 | | | | 2,253 | | |
Citigroup, Inc., | |
2.57%, 6/3/31 | | | 425 | | | | 446 | | |
2.67%, 1/29/31 | | | 4,375 | | | | 4,614 | | |
2.98%, 11/5/30 | | | 932 | | | | 1,009 | | |
5.30%, 5/6/44 | | | 50 | | | | 67 | | |
6.68%, 9/13/43 | | | 70 | | | | 108 | | |
Citizens Bank NA,
MTN | |
2.55%, 5/13/21 | | | 250 | | | | 253 | | |
CNO Financial Group, Inc., | |
5.25%, 5/30/29 | | | 885 | | | | 1,025 | | |
Cooperatieve Rabobank UA, | |
3.95%, 11/9/22 | | | 650 | | | | 691 | | |
Credit Agricole SA, | |
3.75%, 4/24/23 (b) | | | 1,175 | | | | 1,260 | | |
Credit Suisse Group AG, | |
2.59%, 9/11/25 (b) | | | 2,125 | | | | 2,220 | | |
Crown Castle International Corp., | |
3.30%, 7/1/30 | | | 950 | | | | 1,041 | | |
4.15%, 7/1/50 | | | 725 | | | | 832 | | |
CyrusOne LP/CyrusOne Finance Corp., | |
2.90%, 11/15/24 | | | 200 | | | | 212 | | |
Danske Bank A/S, | |
5.00%, 1/12/23 (b) | | | 350 | | | | 367 | | |
| | | Face
Amount
(000) | | Value
(000) | |
Deutsche Bank AG, | |
3.95%, 2/27/23 | | $ | 850 | | | $ | 892 | | |
GE Capital International Funding Co.
Unlimited Co., | |
4.42%, 11/15/35 | | | 1,315 | | | | 1,391 | | |
GLP Capital LP/GLP Financing II, Inc., | |
3.35%, 9/1/24 | | | 1,900 | | | | 1,934 | | |
Goldman Sachs Group, Inc. (The), | |
3.69%, 6/5/28 | | | 775 | | | | 870 | | |
6.75%, 10/1/37 | | | 965 | | | | 1,405 | | |
MTN | |
4.80%, 7/8/44 | | | 625 | | | | 821 | | |
Grupo Aval Ltd., | |
4.38%, 2/4/30 (b) | | | 770 | | | | 745 | | |
Harborwalk Funding Trust, | |
5.08%, 2/15/69 (b) | | | 950 | | | | 1,177 | | |
HSBC Holdings PLC, | |
4.25%, 3/14/24 | | | 2,325 | | | | 2,494 | | |
HSBC USA, Inc., | |
3.50%, 6/23/24 | | | 1,450 | | | | 1,567 | | |
ING Bank N.V., | |
5.80%, 9/25/23 (b) | | | 204 | | | | 229 | | |
Intercontinental Exchange, Inc., | |
1.85%, 9/15/32 | | | 2,675 | | | | 2,673 | | |
Intesa Sanpaolo SpA, | |
5.25%, 1/12/24 | | | 610 | | | | 676 | | |
Itau Unibanco Holding SA, | |
2.90%, 1/24/23 (b) | | | 3,100 | | | | 3,140 | | |
Jefferies Finance LLC/JFIN Co-Issuer Corp., | |
6.25%, 6/3/26 (b) | | | 1,325 | | | | 1,351 | | |
JPMorgan Chase & Co., | |
3.70%, 5/6/30 | | | 3,750 | | | | 4,310 | | |
4.13%, 12/15/26 | | | 1,600 | | | | 1,862 | | |
Kimco Realty Corp., | |
3.70%, 10/1/49 | | | 1,050 | | | | 1,034 | | |
Lloyds Banking Group PLC, | |
3.57%, 11/7/28 | | | 250 | | | | 274 | | |
4.38%, 3/22/28 | | | 1,525 | | | | 1,770 | | |
Macquarie Bank Ltd., | |
2.30%, 1/22/25 (b)(e) | | | 1,700 | | | | 1,802 | | |
Marsh & McLennan Cos., Inc., | |
2.25%, 11/15/30 | | | 2,025 | | | | 2,123 | | |
MassMutual Global Funding II, | |
3.40%, 3/8/26 (b) | | | 1,040 | | | | 1,175 | | |
MetLife, Inc., | |
5.88%, 2/6/41 | | | 150 | | | | 219 | | |
Metropolitan Life Global Funding I, | |
2.95%, 4/9/30 (b) | | | 1,300 | | | | 1,461 | | |
Mizuho Financial Group, Inc., | |
2.63%, 4/12/21 (b) | | | 600 | | | | 607 | | |
MPT Operating Partnership LP/MPT
Finance Corp., | |
5.00%, 10/15/27 | | | 965 | | | | 1,008 | | |
The accompanying notes are an integral part of the financial statements.
10
Morgan Stanley Institutional Fund Trust
Annual Report — September 30, 2020
Portfolio of Investments (cont'd)
Core Plus Fixed Income Portfolio
| | | Face
Amount
(000) | | Value
(000) | |
Finance (cont'd) | |
Nationwide Building Society, | |
3.96%, 7/18/30 (b) | | $ | 350 | | | $ | 396 | | |
4.30%, 3/8/29 (b) | | | 1,550 | | | | 1,753 | | |
4.36%, 8/1/24 (b) | | | 500 | | | | 543 | | |
New York Life Global Funding, | |
1.70%, 9/14/21 (b) | | | 600 | | | | 609 | | |
Oversea-Chinese Banking Corp. Ltd., | |
1.83%, 9/10/30 (b)(e) | | | 970 | | | | 969 | | |
Pine Street Trust I, | |
4.57%, 2/15/29 (b) | | | 575 | | | | 669 | | |
PNC Financial Services Group, Inc. (The), | |
2.20%, 11/1/24 | | | 1,650 | | | | 1,747 | | |
Progressive Corp. (The), | |
3.20%, 3/26/30 | | | 725 | | | | 831 | | |
4.00%, 3/1/29 | | | 575 | | | | 694 | | |
Quicken Loans LLC/Quicken Loans Co-Issuer, Inc., | |
3.88%, 3/1/31 (b) | | | 1,350 | | | | 1,337 | | |
Realty Income Corp., | |
3.25%, 10/15/22 | | | 400 | | | | 420 | | |
Royal Bank of Scotland Group PLC, | |
3.88%, 9/12/23 | | | 875 | | | | 939 | | |
Santander UK Group Holdings PLC, | |
3.57%, 1/10/23 | | | 2,400 | | | | 2,481 | | |
Skandinaviska Enskilda Banken AB, | |
2.63%, 11/17/20 (b) | | | 500 | | | | 502 | | |
Societe Generale SA, | |
2.63%, 1/22/25 (b) | | | 1,625 | | | | 1,678 | | |
Standard Chartered PLC, | |
3.05%, 1/15/21 (b) | | | 325 | | | | 327 | | |
4.64%, 4/1/31 (b) | | | 526 | | | | 607 | | |
Syngenta Finance N.V., | |
4.89%, 4/24/25 (b) | | | 975 | | | | 1,058 | | |
TD Ameritrade Holding Corp., | |
3.63%, 4/1/25 | | | 500 | | | | 561 | | |
Travelers Cos., Inc. (The), | |
3.75%, 5/15/46 | | | 800 | | | | 941 | | |
UnitedHealth Group, Inc., | |
2.88%, 3/15/23 | | | 1,025 | | | | 1,086 | | |
3.75%, 7/15/25 | | | 1,675 | | | | 1,914 | | |
University of Chicago (The),
Series C | |
2.55%, 4/1/50 | | | 620 | | | | 622 | | |
WEA Finance LLC/Westfield UK &
Europe Finance PLC, | |
3.25%, 10/5/20 (b) | | | 314 | | | | 314 | | |
Wells Fargo & Co., | |
2.57%, 2/11/31 | | | 500 | | | | 526 | | |
2.88%, 10/30/30 | | | 675 | | | | 726 | | |
5.01%, 4/4/51 | | | 1,000 | | | | 1,376 | | |
| | | | 127,560 | | |
| | | Face
Amount
(000) | | Value
(000) | |
Industrials (19.2%) | |
AbbVie, Inc., | |
3.20%, 11/21/29 (b) | | $ | 4,825 | | | $ | 5,337 | | |
Adobe, Inc., | |
2.30%, 2/1/30 | | | 1,975 | | | | 2,129 | | |
Air Liquide Finance SA, | |
1.75%, 9/27/21 (b) | | | 450 | | | | 456 | | |
Airbus SE, | |
0.00%, 6/14/21 | | EUR | 800 | | | | 933 | | |
Akamai Technologies, Inc., | |
0.38%, 9/1/27 | | $ | 371 | | | | 431 | | |
Albertsons Cos., Inc./Safeway, Inc./
New Albertsons LP/Albertsons LLC, | |
3.50%, 2/15/23 (b) | | | 700 | | | | 712 | | |
Amazon.com, Inc., | |
2.50%, 6/3/50 | | | 775 | | | | 795 | | |
2.80%, 8/22/24 | | | 1,625 | | | | 1,760 | | |
4.25%, 8/22/57 | | | 375 | | | | 514 | | |
American Airlines Pass-Through Trust,
Series AA | |
3.15%, 8/15/33 | | | 531 | | | | 503 | | |
Amgen, Inc., | |
2.45%, 2/21/30 | | | 1,925 | | | | 2,045 | | |
2.77%, 9/1/53 (b) | | | 600 | | | | 578 | | |
4.66%, 6/15/51 | | | 75 | | | | 98 | | |
Anheuser-Busch InBev Worldwide, Inc., | |
4.60%, 4/15/48 | | | 725 | | | | 867 | | |
4.75%, 1/23/29 | | | 725 | | | | 886 | | |
5.55%, 1/23/49 | | | 1,125 | | | | 1,517 | | |
Anthem, Inc., | |
2.38%, 1/15/25 | | | 550 | | | | 585 | | |
3.65%, 12/1/27 | | | 1,650 | | | | 1,882 | | |
Apple, Inc., | |
2.95%, 9/11/49 | | | 2,025 | | | | 2,225 | | |
3.20%, 5/13/25 | | | 450 | | | | 502 | | |
AT&T, Inc., | |
2.25%, 2/1/32 | | | 1,950 | | | | 1,957 | | |
3.50%, 9/15/53 (b) | | | 652 | | | | 633 | | |
3.65%, 9/15/59 (b) | | | 1,375 | | | | 1,358 | | |
Automatic Data Processing, Inc., | |
1.25%, 9/1/30 | | | 2,250 | | | | 2,225 | | |
BAT Capital Corp., | |
3.56%, 8/15/27 | | | 2,100 | | | | 2,271 | | |
Becton Dickinson and Co., | |
2.89%, 6/6/22 | | | 600 | | | | 621 | | |
Berry Global, Inc., | |
4.50%, 2/15/26 (b)(e) | | | 1,635 | | | | 1,654 | | |
Boeing Co. (The), | |
3.95%, 8/1/59 | | | 850 | | | | 771 | | |
5.15%, 5/1/30 | | | 1,700 | | | | 1,916 | | |
Booking Holdings, Inc., | |
0.90%, 9/15/21 | | | 275 | | | | 293 | | |
The accompanying notes are an integral part of the financial statements.
11
Morgan Stanley Institutional Fund Trust
Annual Report — September 30, 2020
Portfolio of Investments (cont'd)
Core Plus Fixed Income Portfolio
| | | Face
Amount
(000) | | Value
(000) | |
Industrials (cont'd) | |
BP Capital Markets PLC, | |
4.38%, 6/22/25 (f) | | $ | 700 | | | $ | 731 | | |
4.88%, 3/22/30 (f) | | | 700 | | | | 751 | | |
Braskem Netherlands Finance BV, | |
4.50%, 1/31/30 (b) | | | 1,200 | | | | 1,122 | | |
Campbell Soup Co., | |
3.13%, 4/24/50 | | | 1,375 | | | | 1,398 | | |
Canadian National Railway Co., | |
2.45%, 5/1/50 | | | 900 | | | | 898 | | |
Charter Communications Operating LLC/
Charter Communications Operating Capital, | |
2.80%, 4/1/31 | | | 1,250 | | | | 1,304 | | |
Children's Health System of Texas, | |
2.51%, 8/15/50 | | | 800 | | | | 762 | | |
Cigna Corp., | |
2.40%, 3/15/30 | | | 2,150 | | | | 2,234 | | |
3.05%, 10/15/27 | | | 350 | | | | 390 | | |
CNH Industrial Capital LLC, | |
4.38%, 11/6/20 (e) | | | 625 | | | | 627 | | |
CNOOC Finance 2013 Ltd., | |
3.00%, 5/9/23 | | | 540 | | | | 567 | | |
Coca-Cola Femsa SAB de CV, | |
2.75%, 1/22/30 | | | 1,600 | | | | 1,706 | | |
Comcast Corp., | |
1.95%, 1/15/31 | | | 2,350 | | | | 2,422 | | |
2.80%, 1/15/51 | | | 825 | | | | 840 | | |
4.05%, 11/1/52 | | | 450 | | | | 555 | | |
4.25%, 1/15/33 | | | 1,050 | | | | 1,308 | | |
Concho Resources, Inc., | |
4.85%, 8/15/48 | | | 575 | | | | 634 | | |
Cummins, Inc., | |
1.50%, 9/1/30 | | | 2,175 | | | | 2,166 | | |
CVS Health Corp., | |
1.75%, 8/21/30 | | | 425 | | | | 416 | | |
3.75%, 4/1/30 | | | 1,182 | | | | 1,352 | | |
5.05%, 3/25/48 | | | 1,275 | | | | 1,633 | | |
5.13%, 7/20/45 | | | 425 | | | | 539 | | |
Deere & Co., | |
3.10%, 4/15/30 | | | 500 | | | | 572 | | |
Dell International LLC/EMC Corp., | |
6.02%, 6/15/26 (b) | | | 1,475 | | | | 1,734 | | |
Delta Air Lines, Inc.,
Series AA | |
3.20%, 10/25/25 | | | 1,050 | | | | 1,049 | | |
Diageo Capital PLC, | |
2.13%, 10/24/24 | | | 1,475 | | | | 1,566 | | |
Diamond Sports Group LLC/Diamond Sports
Finance Co., | |
6.63%, 8/15/27 (b) | | | 700 | | | | 365 | | |
Diamondback Energy, Inc., | |
3.25%, 12/1/26 | | | 1,750 | | | | 1,758 | | |
| | | Face
Amount
(000) | | Value
(000) | |
Duke University,
Series 2020 | |
2.83%, 10/1/55 | | $ | 1,600 | | | $ | 1,700 | | |
Enbridge, Inc., | |
2.50%, 1/15/25 | | | 925 | | | | 974 | | |
Energy Transfer Operating LP, | |
2.90%, 5/15/25 | | | 1,575 | | | | 1,586 | | |
Enterprise Products Operating LLC, | |
4.20%, 1/31/50 | | | 1,775 | | | | 1,894 | | |
Equinix, Inc., | |
1.55%, 3/15/28 (g) | | | 1,675 | | | | 1,681 | | |
Exxon Mobil Corp., | |
3.10%, 8/16/49 | | | 1,225 | | | | 1,257 | | |
Fiserv, Inc., | |
2.65%, 6/1/30 | | | 500 | | | | 539 | | |
Ford Motor Credit Co., LLC, | |
3.10%, 5/4/23 | | | 400 | | | | 392 | | |
4.39%, 1/8/26 | | | 800 | | | | 792 | | |
Fortune Brands Home & Security, Inc., | |
4.00%, 9/21/23 | | | 675 | | | | 739 | | |
Fox Corp., | |
5.58%, 1/25/49 | | | 925 | | | | 1,282 | | |
General Motors Co., | |
6.60%, 4/1/36 | | | 200 | | | | 244 | | |
General Motors Financial Co., Inc., | |
3.85%, 1/5/28 | | | 800 | | | | 842 | | |
4.35%, 1/17/27 | | | 1,825 | | | | 1,985 | | |
Georgia-Pacific LLC, | |
2.30%, 4/30/30 (b) | | | 1,525 | | | | 1,622 | | |
Glencore Funding LLC, | |
4.13%, 3/12/24 (b) | | | 2,375 | | | | 2,576 | | |
Grifols SA, | |
2.25%, 11/15/27 (b) | | EUR | 800 | | | | 934 | | |
HCA, Inc., | |
5.50%, 6/15/47 | | $ | 1,100 | | | | 1,367 | | |
Heathrow Funding Ltd., | |
4.88%, 7/15/23 (b) | | | 525 | | | | 538 | | |
Imperial Brands Finance PLC, | |
3.13%, 7/26/24 (b) | | | 1,000 | | | | 1,059 | | |
Intel Corp., | |
3.25%, 11/15/49 | | | 1,500 | | | | 1,686 | | |
International Business Machines Corp., | |
3.30%, 5/15/26 | | | 2,750 | | | | 3,099 | | |
J2 Global, Inc., | |
1.75%, 11/1/26 (b) | | | 825 | | | | 734 | | |
Jazz Investments I Ltd., | |
1.88%, 8/15/21 | | | 1,000 | | | | 1,015 | | |
Johns Hopkins University,
Series A | |
2.81%, 1/1/60 | | | 1,170 | | | | 1,248 | | |
Kimberly-Clark de Mexico SAB de CV, | |
2.43%, 7/1/31 (b) | | | 1,375 | | | | 1,402 | | |
The accompanying notes are an integral part of the financial statements.
12
Morgan Stanley Institutional Fund Trust
Annual Report — September 30, 2020
Portfolio of Investments (cont'd)
Core Plus Fixed Income Portfolio
| | | Face
Amount
(000) | | Value
(000) | |
Industrials (cont'd) | |
Las Vegas Sands Corp., | |
3.20%, 8/8/24 | | $ | 850 | | | $ | 860 | | |
Level 3 Financing, Inc., | |
3.40%, 3/1/27 (b) | | | 1,275 | | | | 1,376 | | |
Lowe's Cos., Inc., | |
2.50%, 4/15/26 | | | 775 | | | | 841 | | |
4.50%, 4/15/30 | | | 475 | | | | 591 | | |
LYB International Finance III LLC, | |
4.20%, 5/1/50 | | | 550 | | | | 616 | | |
Marriott Vacations Worldwide Corp., | |
1.50%, 9/15/22 | | | 600 | | | | 593 | | |
McLaren Health Care Corp.,
Series A | |
4.39%, 5/15/48 | | | 1,175 | | | | 1,469 | | |
Methodist Hospital (The),
Series 20A | |
2.71%, 12/1/50 | | | 1,520 | | | | 1,526 | | |
Microsoft Corp., | |
2.53%, 6/1/50 | | | 750 | | | | 789 | | |
3.13%, 11/3/25 | | | 325 | | | | 364 | | |
Mondelez International Holdings Netherlands BV, | |
2.25%, 9/19/24 (b) | | | 2,925 | | | | 3,081 | | |
Newcastle Coal Infrastructure Group Pty Ltd., | |
4.40%, 9/29/27 (b) | | | 1,375 | | | | 1,371 | | |
Newmont Corp., | |
2.25%, 10/1/30 | | | 1,150 | | | | 1,190 | | |
3.70%, 3/15/23 (e) | | | 39 | | | | 41 | | |
NIKE, Inc., | |
2.85%, 3/27/30 | | | 1,225 | | | | 1,379 | | |
Nissan Motor Co. Ltd., | |
3.04%, 9/15/23 (b) | | | 1,325 | | | | 1,344 | | |
Nuance Communications, Inc., | |
1.00%, 12/15/35 | | | 425 | | | | 619 | | |
Nvent Finance Sarl, | |
3.95%, 4/15/23 | | | 775 | | | | 809 | | |
NVIDIA Corp., | |
2.85%, 4/1/30 | | | 1,250 | | | | 1,408 | | |
Occidental Petroleum Corp., | |
3.20%, 8/15/26 | | | 160 | | | | 127 | | |
5.55%, 3/15/26 | | | 925 | | | | 839 | | |
Oracle Corp., | |
2.50%, 4/1/25 | | | 1,900 | | | | 2,039 | | |
4.00%, 7/15/46 | | | 1,050 | | | | 1,249 | | |
Palo Alto Networks, Inc., | |
0.75%, 7/1/23 | | | 515 | | | | 582 | | |
Procter & Gamble Co. (The), | |
3.00%, 3/25/30 | | | 1,050 | | | | 1,220 | | |
Pure Storage, Inc., | |
0.13%, 4/15/23 | | | 170 | | | | 165 | | |
Raytheon Technologies Corp., | |
4.50%, 6/1/42 | | | 475 | | | | 601 | | |
| | | Face
Amount
(000) | | Value
(000) | |
Resorts World Las Vegas LLC/RWLV Capital, Inc., | |
4.63%, 4/16/29 (b) | | $ | 2,000 | | | $ | 1,889 | | |
Rockies Express Pipeline LLC, | |
3.60%, 5/15/25 (b) | | | 2,125 | | | | 2,088 | | |
Royalty Pharma PLC, | |
2.20%, 9/2/30 (b) | | | 2,000 | | | | 2,001 | | |
Shell International Finance BV, | |
3.25%, 5/11/25 | | | 1,150 | | | | 1,273 | | |
Sherwin-Williams Co. (The), | |
2.30%, 5/15/30 | | | 1,850 | | | | 1,937 | | |
2.95%, 8/15/29 | | | 625 | | | | 689 | | |
Siemens Financieringsmaatschappij N.V., | |
2.35%, 10/15/26 (b) | | | 2,050 | | | | 2,203 | | |
Sprint Spectrum Co., LLC/Sprint Spectrum
Co., II LLC/Sprint Spectrum Co., III LLC, | |
3.36%, 3/20/23 (b) | | | 847 | | | | 858 | | |
Standard Industries, Inc., | |
2.25%, 11/21/26 (b) | | EUR | 575 | | | | 647 | | |
Starbucks Corp., | |
3.80%, 8/15/25 | | $ | 1,550 | | | | 1,754 | | |
Sunoco Logistics Partners Operations LP, | |
3.90%, 7/15/26 | | | 750 | | | | 771 | | |
T-Mobile USA, Inc., | |
3.88%, 4/15/30 (b) | | | 1,700 | | | | 1,931 | | |
Target Corp., | |
2.65%, 9/15/30 | | | 500 | | | | 560 | | |
Telefonica Emisiones SA, | |
4.10%, 3/8/27 | | | 1,800 | | | | 2,050 | | |
Teva Pharmaceutical Finance Netherlands III BV, | |
2.20%, 7/21/21 | | | 162 | | | | 161 | | |
TJX Cos., Inc. (The), | |
3.88%, 4/15/30 | | | 1,625 | | | | 1,930 | | |
Total Capital International SA, | |
2.88%, 2/17/22 | | | 500 | | | | 517 | | |
Trimble, Inc., | |
4.15%, 6/15/23 | | | 1,150 | | | | 1,240 | | |
TSMC Global Ltd., | |
0.75%, 9/28/25 (b)(e) | | | 1,325 | | | | 1,314 | | |
Twitter, Inc., | |
0.25%, 6/15/24 | | | 1,000 | | | | 1,118 | | |
1.00%, 9/15/21 | | | 1,433 | | | | 1,428 | | |
Upjohn, Inc., | |
4.00%, 6/22/50 (b) | | | 725 | | | | 778 | | |
Verint Systems, Inc., | |
1.50%, 6/1/21 | | | 325 | | | | 330 | | |
Verizon Communications, Inc., | |
3.88%, 2/8/29 | | | 375 | | | | 445 | | |
4.67%, 3/15/55 | | | 1,671 | | | | 2,324 | | |
Visa, Inc., | |
1.10%, 2/15/31 | | | 1,500 | | | | 1,477 | | |
Volkswagen Group of America Finance LLC, | |
4.75%, 11/13/28 (b) | | | 1,025 | | | | 1,227 | | |
The accompanying notes are an integral part of the financial statements.
13
Morgan Stanley Institutional Fund Trust
Annual Report — September 30, 2020
Portfolio of Investments (cont'd)
Core Plus Fixed Income Portfolio
| | | Face
Amount
(000) | | Value
(000) | |
Industrials (cont'd) | |
VTR Finance, | |
6.38%, 7/15/28 (b) | | $ | 1,050 | | | $ | 1,108 | | |
Walmart, Inc., | |
3.70%, 6/26/28 | | | 250 | | | | 296 | | |
4.05%, 6/29/48 | | | 200 | | | | 262 | | |
Walt Disney Co. (The), | |
2.75%, 9/1/49 | | | 1,766 | | | | 1,729 | | |
3.60%, 1/13/51 | | | 281 | | | | 318 | | |
Weibo Corp., | |
1.25%, 11/15/22 | | | 332 | | | | 317 | | |
Western Midstream Operating LP, | |
4.10%, 2/1/25 | | | 1,200 | | | | 1,145 | | |
Williams Cos., Inc. (The), | |
4.85%, 3/1/48 | | | 1,325 | | | | 1,487 | | |
Zillow Group, Inc., | |
2.00%, 12/1/21 | | | 637 | | | | 1,237 | | |
| | | | 172,968 | | |
Utilities (2.1%) | |
Boston Gas Co., | |
3.00%, 8/1/29 (b) | | | 1,150 | | | | 1,267 | | |
Calpine Corp., | |
4.50%, 2/15/28 (b) | | | 1,450 | | | | 1,487 | | |
DTE Energy Co., | |
2.95%, 3/1/30 | | | 800 | | | | 859 | | |
Duke Energy Indiana LLC,
Series YYY | |
3.25%, 10/1/49 | | | 450 | | | | 503 | | |
Enel Finance International N.V., | |
3.63%, 5/25/27 (b) | | | 350 | | | | 390 | | |
4.25%, 9/14/23 (b) | | | 575 | | | | 630 | | |
Entergy Louisiana LLC, | |
3.05%, 6/1/31 | | | 525 | | | | 601 | | |
FirstEnergy Corp.,
Series C | |
3.40%, 3/1/50 | | | 1,300 | | | | 1,269 | | |
Korea Hydro & Nuclear Power Co., Ltd., | |
3.75%, 7/25/23 (b) | | | 1,380 | | | | 1,497 | | |
Mississippi Power Co., | |
3.95%, 3/30/28 | | | 2,325 | | | | 2,672 | | |
Northern States Power Co., | |
2.90%, 3/1/50 | | | 825 | | | | 887 | | |
Oglethorpe Power Corp., | |
5.05%, 10/1/48 | | | 1,325 | | | | 1,572 | | |
ONEOK, Inc., | |
3.10%, 3/15/30 | | | 1,750 | | | | 1,688 | | |
Pacific Gas and Electric Co., | |
3.15%, 1/1/26 (e) | | | 1,000 | | | | 1,028 | | |
3.50%, 8/1/50 | | | 1,275 | | | | 1,157 | | |
Xcel Energy, Inc., | |
2.60%, 12/1/29 | | | 1,375 | | | | 1,488 | | |
| | | | 18,995 | | |
| | | | 323,834 | | |
| | | Face
Amount
(000) | | Value
(000) | |
Mortgages — Other (9.5%) | |
Adjustable Rate Mortgage Trust, | |
3.90%, 6/25/35 (c) | | $ | 170 | | | $ | 168 | | |
Alternative Loan Trust, | |
1 Month USD LIBOR + 0.18%,
0.33%, 5/25/47 (c) | | | 115 | | | | 106 | | |
Banc of America Alternative Loan Trust, | |
1 Month USD LIBOR + 0.65%,
0.80%, 7/25/46 (c) | | | 158 | | | | 116 | | |
5.86%, 10/25/36 | | | 484 | | | | 218 | | |
6.00%, 4/25/36 | | | 5 | | | | 5 | | |
Banc of America Funding Trust, | |
5.25%, 7/25/37 | | | 78 | | | | 77 | | |
Bear Stearns ARM Trust, | |
3.85%, 2/25/34 (c) | | | 714 | | | | 707 | | |
Bunker Hill Loan Depositary Trust, | |
1.72%, 2/25/55 (b)(c) | | | 2,850 | | | | 2,884 | | |
Cascade Funding Mortgage Trust, | |
4.00%, 10/25/68 (b)(c) | | | 1,832 | | | | 1,793 | | |
| CFMT 2020-ABC1 LLC, | |
1.94%, 9/25/50 (b)(c) | | | 4,325 | | | | 4,325 | | |
ChaseFlex Trust, | |
6.00%, 2/25/37 | | | 672 | | | | 424 | | |
Classic RMBS Trust, | |
3.06%, 8/16/49 (b) | | CAD | 2,068 | | | | 1,561 | | |
E-MAC NL BV, | |
3 Month EURIBOR + 0.18%,
1.81%, 7/25/36 (c) | | EUR | 490 | | | | 555 | | |
Eurosail BV, | |
3 Month EURIBOR + 1.80%,
1.36%, 10/17/40 (c) | | | 700 | | | | 803 | | |
Eurosail PLC, | |
3 Month GBP LIBOR + 0.95%,
1.01%, 6/13/45 (c) | | GBP | 674 | | | | 851 | | |
Farringdon Mortgages No. 2 PLC, | |
3 Month GBP LIBOR + 1.50%,
1.58%, 7/15/47 (c) | | | 209 | | | | 267 | | |
Federal Home Loan Mortgage Corporation, | |
3.00%, 7/25/46 - 5/25/47 | | $ | 3,214 | | | | 3,279 | | |
3.50%, 5/25/45 - 5/25/47 | | | 1,430 | | | | 1,484 | | |
3.88%, 5/25/45 (b)(c) | | | 42 | | | | 42 | | |
4.00%, 5/25/45 | | | 53 | | | | 56 | | |
1 Month USD LIBOR + 2.35%,
2.50%, 4/25/30 (c) | | | 956 | | | | 966 | | |
1 Month USD LIBOR + 5.15%,
5.30%, 10/25/29 (c) | | | 300 | | | | 307 | | |
FMC GMSR Issuer Trust, | |
4.23%, 9/25/24 (b)(c) | | | 1,900 | | | | 1,864 | | |
5.07%, 5/25/24 (b)(c) | | | 1,400 | | | | 1,418 | | |
GCAT Trust, | |
2.65%, 10/25/68 (b)(c) | | | 967 | | | | 1,010 | | |
Grifonas Finance PLC, | |
6 Month EURIBOR + 0.28%,
0.00%, 8/28/39 (c) | | EUR | 359 | | | | 407 | | |
The accompanying notes are an integral part of the financial statements.
14
Morgan Stanley Institutional Fund Trust
Annual Report — September 30, 2020
Portfolio of Investments (cont'd)
Core Plus Fixed Income Portfolio
| | | Face
Amount
(000) | | Value
(000) | |
Mortgages — Other (cont'd) | |
HarborView Mortgage Loan Trust, | |
1 Month USD LIBOR + 0.19%,
0.35%, 1/19/38 (c) | | $ | 417 | | | $ | 379 | | |
Headlands Residential LLC, | |
3.97%, 6/25/24 (b) | | | 500 | | | | 504 | | |
IM Pastor 3 FTH, | |
3 Month EURIBOR + 0.14%,
0.00%, 3/22/43 (c) | | EUR | 521 | | | | 548 | | |
JP Morgan Mortgage Trust, | |
3.79%, 6/25/37 (c) | | $ | 101 | | | | 89 | | |
6.00%, 6/25/37 | | | 55 | | | | 59 | | |
L1C 2020-1 LLC, | |
5.29%, 8/25/51 (b) | | | 1,600 | | | | 1,604 | | |
Landmark Mortgage Securities No. 1 PLC, | |
3 Month EURIBOR + 0.60%,
0.25%, 6/17/38 (c) | | EUR | 768 | | | | 838 | | |
Lehman Mortgage Trust, | |
6.50%, 9/25/37 | | $ | 701 | | | | 366 | | |
LHOME Mortgage Trust, | |
3.23%, 10/25/24 (b) | | | 675 | | | | 677 | | |
4.58%, 10/25/23 (b) | | | 1,000 | | | | 1,018 | | |
New Residential Mortgage Loan Trust, | |
3.23%, 8/25/60 (b) | | | 557 | | | | 558 | | |
New Residential Mortgage Loan Trust, | |
4.00%, 9/25/57 (b)(c) | | | 787 | | | | 870 | | |
Newgate Funding PLC, | |
3 Month GBP LIBOR + 0.16%,
0.22%, 12/15/50 (c) | | GBP | 1,400 | | | | 1,699 | | |
NRPL Trust, | |
4.25%, 7/25/67 (b) | | $ | 950 | | | | 980 | | |
OBX 2020-EXP1 Trust, | |
3.50%, 2/25/60 (b)(c) | | | 1,018 | | | | 1,053 | | |
OBX Trust, | |
3.50%, 10/25/59 (b)(c) | | | 809 | | | | 834 | | |
Paragon Mortgages No. 13 PLC, | |
3 Month GBP LIBOR + 0.40%,
0.48%, 1/15/39 (c) | | GBP | 268 | | | | 330 | | |
Paragon Mortgages No. 15 PLC, | |
3 Month EURIBOR + 0.54%,
0.06%, 12/15/39 (c) | | EUR | 800 | | | | 850 | | |
Pepper Residential Securities Trust, | |
1 Month USD LIBOR + 0.93%,
1.08%, 3/12/61 (b)(c) | | $ | 1,536 | | | | 1,531 | | |
Preston Ridge Partners LLC, | |
1.00%, 9/25/25 | | | 3,000 | | | | 3,000 | | |
PRPM LLC, | |
3.50%, 10/25/24 (b)(c) | | | 1,733 | | | | 1,738 | | |
4.50%, 1/25/24 (b) | | | 829 | | | | 837 | | |
RMF Buyout Issuance Trust, | |
1.71%, 6/25/30 (b)(c) | | | 1,987 | | | | 1,993 | | |
2.15%, 6/25/30 (b)(c) | | | 750 | | | | 753 | | |
Rochester Financing No. 2 PLC, | |
3 Month GBP LIBOR + 2.75%,
2.80%, 6/18/45 (c) | | GBP | 750 | | | | 966 | | |
| | | Face
Amount
(000) | | Value
(000) | |
Seasoned Credit Risk Transfer Trust, | |
3.00%, 9/25/55 - 2/25/59 | | $ | 13,394 | | | $ | 14,599 | | |
4.00%, 7/25/56 (c) | | | 450 | | | | 453 | | |
4.00%, 8/25/56 (b)(c) | | | 1,000 | | | | 982 | | |
4.00%, 8/25/58 - 2/25/59 | | | 2,106 | | | | 2,338 | | |
4.25%, 8/25/59 (b)(c) | | | 2,700 | | | | 2,626 | | |
4.50%, 6/25/57 | | | 2,196 | | | | 2,464 | | |
4.75%, 7/25/56 - 6/25/57(b)(c) | | | 1,408 | | | | 1,397 | | |
4.75%, 10/25/58 (c) | | | 1,300 | | | | 1,259 | | |
Structured Asset Securities Corp.
Reverse Mortgage Loan Trust, | |
1 Month USD LIBOR + 1.85%,
2.00%, 5/25/47 (b)(c) | | | 1,466 | | | | 1,231 | | |
TDA 27 FTA, | |
3 Month EURIBOR + 0.19%,
0.00%, 12/28/50 (c) | | EUR | 1,600 | | | | 1,504 | | |
Toorak Mortgage Corp. Ltd., | |
3.72%, 9/25/22 | | $ | 2,000 | | | | 2,044 | | |
TVC Mortgage Trust, | |
3.47%, 9/25/24 (b) | | | 850 | | | | 868 | | |
Verus Securitization Trust, | |
3.72%, 1/25/47 (b)(c) | | | 265 | | | | 267 | | |
Vista Point Securitization Trust, | |
1.76%, 3/25/65 (b)(c) | | | 3,713 | | | | 3,742 | | |
| | | | 85,541 | | |
Municipal Bonds (1.2%) | |
Chicago O'Hare International Airport, IL,
O'Hare International Airport Revenue
Series 2010B | |
6.40%, 1/1/40 | | | 255 | | | | 381 | | |
City of New York, NY,
Series G-1 | |
5.97%, 3/1/36 | | | 270 | | | | 391 | | |
Illinois State Toll Highway Authority, IL,
Highway Revenue, Build America Bonds
Series A | |
6.18%, 1/1/34 | | | 477 | | | | 692 | | |
New York City Transitional Finance Authority
Future Tax Secured Revenue, NY,
Transitional Finance Authority Future
Tax Secured Revenue Series A | |
5.27%, 5/1/27 | | | 320 | | | | 393 | | |
Onondaga Civic Development Corp., NY, | |
3.07%, 12/1/55 | | | 2,925 | | | | 3,028 | | |
Pennsylvania State University/The, PA,
Series D | |
2.84%, 9/1/50 | | | 1,425 | | | | 1,467 | | |
University of Virginia, VA, | |
2.26%, 9/1/50 | | | 1,550 | | | | 1,519 | | |
Series C-1 | |
2.97%, 9/1/49 | | | 1,440 | | | | 1,627 | | |
Series C-2 | |
2.97%, 9/1/49 | | | 1,020 | | | | 1,157 | | |
| | | | 10,655 | | |
The accompanying notes are an integral part of the financial statements.
15
Morgan Stanley Institutional Fund Trust
Annual Report — September 30, 2020
Portfolio of Investments (cont'd)
Core Plus Fixed Income Portfolio
| | | Face
Amount
(000) | | Value
(000) | |
Sovereign (7.4%) | |
Australia Government Bond, | |
2.75%, 11/21/28 | | AUD | 15,150 | | | $ | 12,638 | | |
3.25%, 4/21/25 | | | 10,500 | | | | 8,529 | | |
Banque Ouest Africaine de Developpement, | |
4.70%, 10/22/31 (b) | | $ | 1,240 | | | | 1,304 | | |
Croatia Government International Bond, | |
1.50%, 6/17/31 | | EUR | 1,307 | | | | 1,595 | | |
Dominican Republic International Bond, | |
5.88%, 1/30/60 (b) | | $ | 2,310 | | | | 2,195 | | |
Ecuador Government International Bond, | |
0.00%, 7/31/30 (b) | | | 62 | | | | 29 | | |
0.50%, 7/31/30 - 7/31/40(b)(h) | | | 1,048 | | | | 597 | | |
Egypt Government International Bond, | |
6.38%, 4/11/31 (b) | | EUR | 2,025 | | | | 2,216 | | |
8.15%, 11/20/59 (b) | | $ | 470 | | | | 440 | | |
8.88%, 5/29/50 (b) | | | 410 | | | | 407 | | |
Export-Import Bank of India, | |
3.25%, 1/15/30 (b) | | | 670 | | | | 678 | | |
3.88%, 2/1/28 (b) | | | 505 | | | | 532 | | |
Honduras Government International Bond, | |
5.63%, 6/24/30 (b) | | | 350 | | | | 376 | | |
Indonesia Treasury Bond, | |
8.25%, 5/15/29 | | IDR | 33,797,000 | | | | 2,481 | | |
8.38%, 3/15/34 | | | 19,717,000 | | | | 1,427 | | |
Italy Buoni Poliennali Del Tesoro, | |
1.65%, 12/1/30 (b) | | EUR | 2,150 | | | | 2,713 | | |
Mexican Bonos,
Series M | |
8.50%, 5/31/29 | | MXN | 70,000 | | | | 3,746 | | |
Mexico Government International Bond, | |
3.25%, 4/16/30 (e) | | $ | 750 | | | | 770 | | |
New Zealand Government Bond, | |
2.75%, 4/15/37 | | NZD | 3,925 | | | | 3,333 | | |
Nigeria Government International Bond, | |
9.25%, 1/21/49 (b)(e) | | $ | 1,620 | | | | 1,614 | | |
Pertamina Persero PT, | |
6.50%, 11/7/48 (b) | | | 1,325 | | | | 1,769 | | |
Petroleos Mexicanos, | |
6.50%, 1/23/29 | | | 525 | | | | 472 | | |
6.84%, 1/23/30 (b) | | | 570 | | | | 509 | | |
6.95%, 1/28/60 (b) | | | 350 | | | | 271 | | |
7.69%, 1/23/50 (b) | | | 536 | | | | 449 | | |
Qatar Government International Bond, | |
5.10%, 4/23/48 (b) | | | 1,480 | | | | 2,061 | | |
Republic of Austria Government Bond, | |
0.85%, 12/31/99 (b) | | EUR | 290 | | | | 421 | | |
2.10%, 12/31/99 (b) | | | 197 | | | | 493 | | |
Republic of Belarus Ministry of Finance, | |
6.38%, 2/24/31 (b) | | $ | 1,150 | | | | 1,079 | | |
Republic of South Africa Government Bond, | |
8.00%, 1/31/30 | | ZAR | 67,793 | | | | 3,699 | | |
| | | Face
Amount
(000) | | Value
(000) | |
Russian Foreign Bond — Eurobond, | |
5.63%, 4/4/42 | | $ | 1,800 | | | $ | 2,411 | | |
Senegal Government International Bond, | |
6.25%, 5/23/33 (b) | | | 705 | | | | 698 | | |
Spain Government Bond, | |
1.25%, 10/31/30 (b) | | EUR | 3,525 | | | | 4,545 | | |
| | | | 66,497 | | |
U.S. Treasury Security (1.2%) | |
U.S. Treasury Bond,
2.25%, 8/15/46 | | $ | 9,000 | | | | 10,656 | | |
Variable Rate Senior Loan Interests (1.8%) | |
American Airlines, Inc., | |
| 2018 Term Loan B | | | | | | | | | |
1 Month USD LIBOR + 1.75%,
1.89%, 6/27/25 (c) | | | 990 | | | | 614 | | |
BWAY Holding Co., | |
| 2017 Term Loan B | | | | | |
3 Month USD LIBOR + 3.25%,
3.52%, 4/3/24 (c) | | | 990 | | | | 933 | | |
Carrols Restaurant Group, Inc., | |
Term Loan B | |
3 Month USD LIBOR + 3.25%,
3.40%, 4/30/26 (c) | | | 990 | | | | 945 | | |
Chemours Company (The), | |
| 2018 USD Term Loan B | | | | | |
1 Month USD LIBOR + 1.75%,
1.89%, 4/3/25 (c) | | | 992 | | | | 961 | | |
Core & Main LP, | |
| 2017 Term Loan B | | | | | |
3 Month USD LIBOR + 2.75%,
3.75%, 8/1/24 (c) | | | 992 | | | | 978 | | |
CPG International, Inc., | |
| 2017 Term Loan | | | | | |
3 Month USD LIBOR + 3.75%,
4.75%, 5/5/24 (c) | | | 218 | | | | 218 | | |
DaVita, Inc., | |
| 2020 Term Loan B | | | | | |
1 Month USD LIBOR + 1.75%,
1.90%, 8/12/26 (c) | | | 993 | | | | 977 | | |
Grifols Worldwide Operations USA, Inc., | |
| USD 2019 Term Loan B | | | | | |
1 Week USD LIBOR + 2.00%,
2.10%, 11/15/27 (c) | | | 993 | | | | 974 | | |
Hargray Communications Group, Inc., | |
| 2017 Term Loan B | | | | | |
1 Month USD LIBOR + 3.00%,
4.00%, 5/16/24 (c) | | | 992 | | | | 988 | | |
Level 3 Financing Inc., | |
| 2019 Term Loan B | | | | | |
1 Month USD LIBOR + 1.75%,
1.90%, 3/1/27 (c) | | | 1,000 | | | | 971 | | |
Lions Gate Capital Holdings LLC, | |
| 2018 Term Loan B | | | | | |
1 Month USD LIBOR + 2.25%,
2.40%, 3/24/25 (c) | | | 990 | | | | 958 | | |
The accompanying notes are an integral part of the financial statements.
16
Morgan Stanley Institutional Fund Trust
Annual Report — September 30, 2020
Portfolio of Investments (cont'd)
Core Plus Fixed Income Portfolio
| | | Face
Amount
(000) | | Value
(000) | |
Variable Rate Senior Loan Interests (cont'd) | |
Medallion Midland Acquisition LLC, | |
| 1st Lien Term Loan | |
1 Month USD LIBOR + 3.25%,
4.25%, 10/30/24 (c) | | $ | 794 | | | $ | 752 | | |
Surf Holdings LLC, | |
| USD Term Loan | |
3 Month USD LIBOR + 3.50%,
3.75%, 3/5/27 (c) | | | 748 | | | | 734 | | |
Surgery Center Holdings, Inc., | |
| 2017 Term Loan B | | | | | |
1 Month USD LIBOR + 3.25%,
4.25%, 9/3/24 (c) | | | 992 | | | | 938 | | |
Univision Communications Inc., | |
2020 Replacement Term Loan | |
1 Month USD LIBOR + 3.75%,
4.75%, 3/13/26 (c) | | | 919 | | | | 897 | | |
Verifone Systems, Inc., | |
| 2018 1st Lien Term Loan | |
3 Month USD LIBOR + 4.00%,
4.25%, 8/20/25 (c) | | | 992 | | | | 892 | | |
Virgin Media Bristol LLC, | |
| USD Term Loan N | |
1 Month USD LIBOR + 2.50%,
2.65%, 1/31/28 (c) | | | 1,000 | | | | 973 | | |
Ziggo Financing Partnership, | |
| USD Term Loan I | |
1 Month USD LIBOR + 2.50%,
2.65%, 4/30/28 (c) | | | 1,500 | | | | 1,447 | | |
| | | | 16,150 | | |
Total Fixed Income Securities (Cost $861,411) | | | 881,011 | | |
| | | Shares | | | |
Short-Term Investments (18.4%) | |
Securities held as Collateral on Loaned Securities (0.6%) | |
Investment Company (0.6%) | |
Morgan Stanley Institutional Liquidity
Funds — Government Portfolio —
Institutional Class (See Note G)
(Cost $5,536) | | | 5,535,980 | | | | 5,536 | | |
Investment Company (17.2%) | |
Morgan Stanley Institutional Liquidity
Funds — Government Portfolio —
Institutional Class (See Note G)
(Cost $154,471) | | | 154,470,695 | | | | 154,471 | | |
| | | Face
Amount
(000) | | | |
U.S. Treasury Security (0.3%) | |
U.S. Treasury Bill | |
0.16%, 1/28/21 (i)(j)
(Cost $2,517) | | $ | 2,518 | | | | 2,517 | | |
| | | Face
Amount
(000) | | Value
(000) | |
Sovereign (0.3%) | |
Egypt Treasury Bills, | |
13.60%, 3/2/21 | | EGP | 3,600 | | | $ | 218 | | |
13.65%, 3/2/21 | | | 5,975 | | | | 361 | | |
13.66%, 3/2/21 | | | 8,950 | | | | 541 | | |
13.68%, 3/2/21 | | | 12,850 | | | | 777 | | |
13.69%, 3/2/21 | | | 5,975 | | | | 361 | | |
13.70%, 3/2/21 | | | 900 | | | | 55 | | |
Total Sovereign (Cost $2,281) | | | 2,313 | | |
Total Short-Term Investments (Cost $164,805) | | | 164,837 | | |
Total Investments (116.2%) (Cost $1,026,216)
Including $6,455 of Securities Loaned (k)(l) | | | 1,045,848 | | |
Liabilities in Excess of Other Assets (–16.2%) | | | (145,685 | ) | |
Net Assets (100.0%) | | $ | 900,163 | | |
(a) Security is subject to delayed delivery.
(b) 144A security — Certain conditions for public sale may exist. Unless otherwise noted, these securities are deemed to be liquid.
(c) Floating or variable rate securities: The rates disclosed are as of September 30, 2020. For securities based on a published reference rate and spread, the reference rate and spread are indicated in the description in the Portfolio of Investments. Certain variable rate securities may not be based on a published reference rate and spread but are determined by the issuer or agent and are based on current market conditions. These securities do not indicate a reference rate and spread in their description in the Portfolio of Investments.
(d) Inverse Floating Rate Security — Interest rate fluctuates with an inverse relationship to an associated interest rate. Indicated rate is the effective rate at September 30, 2020.
(e) All or a portion of this security was on loan at September 30, 2020.
(f) Perpetual — One or more securities do not have a predetermined maturity date. Rates for these securities are fixed for a period of time, after which they revert to a floating rate. Interest rates in effect are as of September 30, 2020.
(g) When-issued security.
(h) Multi-step — Coupon rate changes in predetermined increments to maturity. Rate disclosed is as of September 30, 2020. Maturity date disclosed is the ultimate maturity date.
(i) All or a portion of the security was pledged to cover margin requirements for swap agreements.
(j) Rate shown is the yield to maturity at September 30, 2020.
(k) Securities are available for collateral in connection with purchase of when issued security, securities purchased on a forward commitment basis, open foreign currency forward exchange contracts, futures contracts and swap agreements.
(l) At September 30, 2020, the aggregate cost for federal income tax purposes is approximately $1,026,013,000. The aggregate gross unrealized appreciation is approximately $32,341,000 and the aggregate gross unrealized depreciation is approximately $13,142,000, resulting in net unrealized appreciation of approximately $19,199,000.
EURIBOR Euro Interbank Offered Rate.
IO Interest Only.
LIBOR London Interbank Offered Rate.
MTN Medium Term Note.
OAT Obligations Assimilables du Trésor (French Treasury Obligation).
PAC Planned Amortization Class.
REMIC Real Estate Mortgage Investment Conduit.
The accompanying notes are an integral part of the financial statements.
17
Morgan Stanley Institutional Fund Trust
Annual Report — September 30, 2020
Portfolio of Investments (cont'd)
Core Plus Fixed Income Portfolio
STRIPS Separate Trading of Registered Interest and Principal of Securities.
TBA To Be Announced.
USD United States Dollar.
Foreign Currency Forward Exchange Contracts:
The Fund had the following foreign currency forward exchange contracts open at September 30, 2020:
Counterparty | | Contracts to
Deliver
(000) | | In Exchange
For
(000) | | Delivery
Date | | Unrealized
Appreciation
(Depreciation)
(000) | |
Australia And New Zealand Banking Group | | GBP | 3,844 | | | $ | 5,082 | | | 12/1/20 | | $ | 121 | | |
Bank of America NA | | ZAR | 62,674 | | | $ | 3,672 | | | 12/1/20 | | | (43 | ) | |
Barclays Bank PLC | | NOK | 20,771 | | | $ | 2,298 | | | 12/1/20 | | | 71 | | |
Barclays Bank PLC | | NZD | 4,865 | | | $ | 3,179 | | | 12/1/20 | | | (39 | ) | |
BNP Paribas SA | | EUR | 1,868 | | | PLN | 8,270 | | | 12/1/20 | | | (53 | ) | |
BNP Paribas SA | | $ | 2,168 | | | MXN | 46,126 | | | 12/1/20 | | | (96 | ) | |
Citibank NA | | EUR | 18,614 | | | $ | 22,183 | | | 12/1/20 | | | 332 | | |
Citibank NA | | MXN | 35,106 | | | $ | 1,578 | | | 12/1/20 | | | 2 | | |
Citibank NA | | $ | 3,865 | | | RUB | 292,585 | | | 12/1/20 | | | (124 | ) | |
Goldman Sachs International | | RUB | 292,585 | | | $ | 3,906 | | | 12/1/20 | | | 164 | | |
JPMorgan Chase Bank NA | | CAD | 5,739 | | | $ | 4,352 | | | 12/1/20 | | | 40 | | |
JPMorgan Chase Bank NA | | $ | 67 | | | CAD | 87 | | | 12/1/20 | | | (1 | ) | |
JPMorgan Chase Bank NA | | $ | 36 | | | GBP | 28 | | | 12/1/20 | | | — | @ | |
UBS AG | | CAD | 78 | | | $ | 59 | | | 10/5/20 | | | — | @ | |
UBS AG | | AUD | 29,604 | | | $ | 21,246 | | | 12/1/20 | | | 39 | | |
UBS AG | | IDR | 60,587,262 | | | $ | 4,086 | | | 12/1/20 | | | 37 | | |
UBS AG | | $ | 59 | | | CAD | 78 | | | 12/1/20 | | | (— | @) | |
UBS AG | | $ | 2,184 | | | EUR | 1,830 | | | 12/1/20 | | | (36 | ) | |
UBS AG | | $ | 4,697 | | | NOK | 41,220 | | | 12/1/20 | | | (277 | ) | |
| | | | | | | | | $ | 137 | | |
Futures Contracts:
The Fund had the following futures contracts open at September 30, 2020:
| | | Number
of
Contracts | | Expiration
Date | | Notional
Amount
(000) | | Value
(000) | | Unrealized
Appreciation
(Depreciation)
(000) | |
Long: | |
U.S. Treasury 2 yr. Note | | | 306 | | | Dec-20 | | $ | 61,200 | | | $ | 67,614 | | | $ | 33 | | |
U.S. Treasury 5 yr. Note | | | 557 | | | Dec-20 | | | 55,700 | | | | 70,200 | | | | 143 | | |
U.S. Treasury Long Bond | | | 26 | | | Dec-20 | | | 2,600 | | | | 4,583 | | | | (21 | ) | |
U.S. Treasury Ultra Bond | | | 212 | | | Dec-20 | | | 21,200 | | | | 47,024 | | | | 32 | | |
Short: | |
Euro OAT | | | 27 | | | Dec-20 | | EUR | (2,700 | ) | | | (5,336 | ) | | | (45 | ) | |
German Euro 30 yr. Bond | | | 4 | | | Dec-20 | | | (400 | ) | | | (1,044 | ) | | | (25 | ) | |
German Euro Bund | | | 43 | | | Dec-20 | | | (4,300 | ) | | | (8,798 | ) | | | (56 | ) | |
U.S. Treasury 10 yr. Note | | | 43 | | | Dec-20 | | $ | (4,300 | ) | | | (6,000 | ) | | | (4 | ) | |
U.S. Treasury 10 yr. Ultra Long Bond | | | 104 | | | Dec-20 | | | (10,400 | ) | | | (16,632 | ) | | | (23 | ) | |
| | | | | | | | | | | $ | 34 | | |
Credit Default Swap Agreements:
The Fund had the following credit default swap agreements open at September 30, 2020:
Swap Counterparty and
Reference Obligation | | Credit
Rating of
Reference
Obligation† | | Buy/Sell
Protection | | Pay/Receive
Fixed Rate | | Payment
Frequency | | Maturity
Date | | Notional
Amount
(000) | | Value
(000) | | Upfront
Payment
Paid
(Received)
(000) | | Unrealized
Appreciation
(Depreciation)
(000) | |
Morgan Stanley & Co. LLC*
CDX.NA.HY.33 | | NR | | Buy | | | 5.00 | % | | Quarterly | | 12/20/24 | | $ | 8,500 | | | $ | (449 | ) | | $ | (699 | ) | | $ | 250 | | |
Morgan Stanley & Co. LLC*
CDX.NA.HY.34 | | NR | | Buy | | | 5.00 | | | Quarterly | | 6/20/25 | | | 6,256 | | | | (297 | ) | | | 87 | | | | (384 | ) | |
| | | | | | | | | | | | | | | $ | (746 | ) | | $ | (612 | ) | | $ | (134 | ) | |
The accompanying notes are an integral part of the financial statements.
18
Morgan Stanley Institutional Fund Trust
Annual Report — September 30, 2020
Portfolio of Investments (cont'd)
Core Plus Fixed Income Portfolio
@ — Value is less than $500.
† — Credit rating as issued by Standard & Poor's.
* — Cleared swap agreement, the broker is Morgan Stanley & Co., LLC.
NR — Not Rated.
OAT — Obligations Assimilables du Trésor (Treasury Obligation).
AUD — Australian Dollar
CAD — Canadian Dollar
EGP — Egyptian Pound
EUR — Euro
GBP — British Pound
IDR — Indonesian Rupiah
MXN — Mexican Peso
NOK — Norwegian Krone
NZD — New Zealand Dollar
PLN — Polish Zloty
RUB — Russian Ruble
USD — United States Dollar
ZAR — South African Rand
Portfolio Composition**
Classification | | Percentage of
Total Investments | |
Agency Fixed Rate Mortgages | | | 19.9 | % | |
Industrials | | | 16.6 | | |
Short-Term Investments | | | 15.3 | | |
Finance | | | 12.3 | | |
Other*** | | | 10.7 | | |
Asset-Backed Securities | | | 10.6 | | |
Mortgages — Other | | | 8.2 | | |
Sovereign | | | 6.4 | | |
Total Investments | | | 100.0 | %**** | |
** Percentages indicated are based upon total investments (excluding Securities held as Collateral on Loaned Securities) as of September 30, 2020.
*** Industries and/or investment types representing less than 5% of total investments.
**** Does not include open long/short futures contracts with a value of approximately $227,231,000 and net unrealized appreciation of approximately $34,000. Does not include open foreign currency forward exchange contracts with net unrealized appreciation of approximately $137,000 and does not include open swap agreements with net unrealized depreciation of approximately $134,000.
The accompanying notes are an integral part of the financial statements.
19
Morgan Stanley Institutional Fund Trust
Annual Report — September 30, 2020
Core Plus Fixed Income Portfolio
Statement of Assets and Liabilities | | September 30, 2020
(000) | |
Assets: | |
Investments in Securities of Unaffiliated Issuers, at Value(1) (Cost $866,209) | | $ | 885,841 | | |
Investment in Security of Affiliated Issuer, at Value (Cost $160,007) | | | 160,007 | | |
Total Investments in Securities, at Value (Cost $1,026,216) | | | 1,045,848 | | |
Foreign Currency, at Value (Cost $106) | | | 105 | | |
Interest Receivable | | | 4,197 | | |
Receivable for Variation Margin on Futures Contracts | | | 2,516 | | |
Receivable for Fund Shares Sold | | | 1,608 | | |
Receivable for Investments Sold | | | 1,218 | | |
Unrealized Appreciation on Foreign Currency Forward Exchange Contracts | | | 806 | | |
Tax Reclaim Receivable | | | 11 | | |
Receivable from Affiliate | | | 2 | | |
Receivable from Securities Lending Income | | | 1 | | |
Other Assets | | | 128 | | |
Total Assets | | | 1,056,440 | | |
Liabilities: | |
Payable for Investments Purchased | | | 147,849 | | |
Collateral on Securities Loaned, at Value | | | 5,536 | | |
Payable for Fund Shares Redeemed | | | 1,243 | | |
Unrealized Depreciation on Foreign Currency Forward Exchange Contracts | | | 669 | | |
Due to Broker | | | 270 | | |
Payable for Advisory Fees | | | 239 | | |
Payable for Sub Transfer Agency Fees — Class I | | | 82 | | |
Payable for Sub Transfer Agency Fees — Class A | | | 21 | | |
Payable for Sub Transfer Agency Fees — Class L | | | — | @ | |
Payable for Sub Transfer Agency Fees — Class C | | | 2 | | |
Deferred Capital Gain Country Tax | | | 90 | | |
Payable for Professional Fees | | | 77 | | |
Payable for Administration Fees | | | 59 | | |
Payable for Shareholder Services Fees — Class A | | | 23 | | |
Payable for Distribution and Shareholder Services Fees — Class L | | | — | @ | |
Payable for Distribution and Shareholder Services Fees — Class C | | | 20 | | |
Payable for Custodian Fees | | | 25 | | |
Payable for Transfer Agency Fees — Class I | | | 3 | | |
Payable for Transfer Agency Fees — Class A | | | 1 | | |
Payable for Transfer Agency Fees — Class L | | | — | @ | |
Payable for Transfer Agency Fees — Class C | | | 1 | | |
Payable for Transfer Agency Fees — Class IS | | | 1 | | |
Payable for Variation Margin on Swap Agreements | | | 3 | | |
Other Liabilities | | | 63 | | |
Total Liabilities | | | 156,277 | | |
Net Assets | | $ | 900,163 | | |
Net Assets Consist of: | |
Paid-in-Capital | | $ | 852,762 | | |
Total Distributable Earnings | | | 47,401 | | |
Net Assets | | $ | 900,163 | | |
The accompanying notes are an integral part of the financial statements.
20
Morgan Stanley Institutional Fund Trust
Annual Report — September 30, 2020
Core Plus Fixed Income Portfolio
Statement of Assets and Liabilities (cont'd) | | September 30, 2020
(000) | |
CLASS I: | |
Net Assets | | $ | 662,724 | | |
| Shares Outstanding (unlimited number of shares authorized, no par value) (not in 000's) | | | 55,635,559 | | |
Net Asset Value, Offering and Redemption Price Per Share | | $ | 11.91 | | |
CLASS A: | |
Net Assets | | $ | 114,387 | | |
| Shares Outstanding (unlimited number of shares authorized, no par value) (not in 000's) | | | 9,589,291 | | |
Net Asset Value, Redemption Price Per Share | | $ | 11.93 | | |
Maximum Sales Load | | | 3.25 | % | |
Maximum Sales Charge | | $ | 0.40 | | |
Maximum Offering Price Per Share | | $ | 12.33 | | |
CLASS L: | |
Net Assets | | $ | 812 | | |
| Shares Outstanding (unlimited number of shares authorized, no par value) (not in 000's) | | | 67,955 | | |
Net Asset Value, Offering and Redemption Price Per Share | | $ | 11.94 | | |
CLASS C: | |
Net Assets | | $ | 25,989 | | |
| Shares Outstanding (unlimited number of shares authorized, no par value) (not in 000's) | | | 2,194,670 | | |
Net Asset Value, Offering and Redemption Price Per Share | | $ | 11.84 | | |
CLASS IS: | |
Net Assets | | $ | 96,251 | | |
| Shares Outstanding (unlimited number of shares authorized, no par value) (not in 000's) | | | 8,084,816 | | |
Net Asset Value, Offering and Redemption Price Per Share | | $ | 11.91 | | |
(1) Including:
Securities on Loan, at Value: | | $ | 6,455 | | |
@ Amount is less than $500.
The accompanying notes are an integral part of the financial statements.
21
Morgan Stanley Institutional Fund Trust
Annual Report — September 30, 2020
Core Plus Fixed Income Portfolio
Statement of Operations | | Year Ended
September 30, 2020
(000) | |
Investment Income: | |
Interest from Securities of Unaffiliated Issuers (Net of $72 of Foreign Taxes Withheld) | | $ | 23,074 | | |
Dividends from Security of Affiliated Issuer (Note G) | | | 560 | | |
Dividends from Securities of Unaffiliated Issuers | | | 39 | | |
Income from Securities Loaned — Net | | | 19 | | |
Total Investment Income | | | 23,692 | | |
Expenses: | |
Advisory Fees (Note B) | | | 2,934 | | |
Sub Transfer Agency Fees — Class I | | | 604 | | |
Sub Transfer Agency Fees — Class A | | | 140 | | |
Sub Transfer Agency Fees — Class L | | | — | @ | |
Sub Transfer Agency Fees — Class C | | | 12 | | |
Administration Fees (Note C) | | | 626 | | |
Shareholder Services Fees — Class A (Note D) | | | 260 | | |
Distribution and Shareholder Services Fees — Class L (Note D) | | | 4 | | |
Distribution and Shareholder Services Fees — Class C (Note D) | | | 198 | | |
Registration Fees | | | 169 | | |
Professional Fees | | | 153 | | |
Custodian Fees (Note F) | | | 98 | | |
Pricing Fees | | | 85 | | |
Shareholder Reporting Fees | | | 64 | | |
Transfer Agency Fees — Class I (Note E) | | | 9 | | |
Transfer Agency Fees — Class A (Note E) | | | 5 | | |
Transfer Agency Fees — Class L (Note E) | | | 2 | | |
Transfer Agency Fees — Class C (Note E) | | | 4 | | |
Transfer Agency Fees — Class IS (Note E) | | | 2 | | |
Trustees' Fees and Expenses | | | 14 | | |
Other Expenses | | | 43 | | |
Expenses Before Non Operating Expenses | | | 5,426 | | |
Bank Overdraft Expense | | | 4 | | |
Total Expenses | | | 5,430 | | |
Waiver of Advisory Fees (Note B) | | | (1,289 | ) | |
Reimbursement of Class Specific Expenses — Class I (Note B) | | | (326 | ) | |
Reimbursement of Class Specific Expenses — Class L (Note B) | | | (1 | ) | |
Reimbursement of Class Specific Expenses — Class IS (Note B) | | | (2 | ) | |
Rebate from Morgan Stanley Affiliate (Note G) | | | (153 | ) | |
Net Expenses | | | 3,659 | | |
Net Investment Income | | | 20,033 | | |
Realized Gain (Loss): | |
Investments Sold (Net of $36 of Capital Gain Country Tax) | | | 25,672 | | |
Foreign Currency Forward Exchange Contracts | | | (1,592 | ) | |
Foreign Currency Translation | | | (132 | ) | |
Futures Contracts | | | 2,428 | | |
Swap Agreements | | | 1,009 | | |
Net Realized Gain | | | 27,385 | | |
Change in Unrealized Appreciation (Depreciation): | |
Investments (Net of Decrease in Deferred Capital Gain Country Tax of $38) | | | (123 | ) | |
Foreign Currency Forward Exchange Contracts | | | (497 | ) | |
Foreign Currency Translation | | | 16 | | |
Futures Contracts | | | 254 | | |
Swap Agreements | | | (134 | ) | |
Net Change in Unrealized Appreciation (Depreciation) | | | (484 | ) | |
Net Realized Gain and Change in Unrealized Appreciation (Depreciation) | | | 26,901 | | |
Net Increase in Net Assets Resulting from Operations | | $ | 46,934 | | |
@ Amount is less than $500.
The accompanying notes are an integral part of the financial statements.
22
Morgan Stanley Institutional Fund Trust
Annual Report — September 30, 2020
Core Plus Fixed Income Portfolio
Statements of Changes in Net Assets | | Year Ended
September 30, 2020
(000) | | Year Ended
September 30, 2019
(000) | |
Increase (Decrease) in Net Assets: | |
Operations: | |
Net Investment Income | | $ | 20,033 | | | $ | 13,332 | | |
Net Realized Gain | | | 27,385 | | | | 3,415 | | |
Net Change in Unrealized Appreciation (Depreciation) | | | (484 | ) | | | 26,965 | | |
Net Increase in Net Assets Resulting from Operations | | | 46,934 | | | | 43,712 | | |
Dividends and Distributions to Shareholders: | |
Class I | | | (18,149 | ) | | | (11,689 | ) | |
Class A | | | (2,980 | ) | | | (2,538 | ) | |
Class L | | | (20 | ) | | | (17 | ) | |
Class C | | | (432 | ) | | | (229 | ) | |
Class IS | | | (2,603 | ) | | | (— | @) | |
Total Dividends and Distributions to Shareholders | | | (24,184 | ) | | | (14,473 | ) | |
Capital Share Transactions:(1) | |
Class I: | |
Subscribed | | | 449,352 | | | | 258,962 | | |
Distributions Reinvested | | | 17,870 | | | | 11,394 | | |
Redeemed | | | (278,475 | ) | | | (93,324 | ) | |
Class A: | |
Subscribed | | | 59,971 | | | | 57,507 | | |
Distributions Reinvested | | | 2,980 | | | | 2,538 | | |
Redeemed | | | (43,470 | ) | | | (39,054 | ) | |
Class L: | |
Exchanged | | | 73 | | | | 341 | | |
Distributions Reinvested | | | 20 | | | | 17 | | |
Redeemed | | | (24 | ) | | | (150 | ) | |
Class C: | |
Subscribed | | | 15,394 | | | | 9,758 | | |
Distributions Reinvested | | | 427 | | | | 225 | | |
Redeemed | | | (5,020 | ) | | | (2,836 | ) | |
Class IS: | |
Subscribed | | | 102,407 | | | | — | | |
Distributions Reinvested | | | 2,250 | | | | — | @ | |
Redeemed | | | (11,558 | ) | | | — | | |
Net Increase in Net Assets Resulting from Capital Share Transactions | | | 312,197 | | | | 205,378 | | |
Total Increase in Net Assets | | | 334,947 | | | | 234,617 | | |
Net Assets: | |
Beginning of Period | | | 565,216 | | | | 330,599 | | |
End of Period | | $ | 900,163 | | | $ | 565,216 | | |
The accompanying notes are an integral part of the financial statements.
23
Morgan Stanley Institutional Fund Trust
Annual Report — September 30, 2020
Core Plus Fixed Income Portfolio
Statements of Changes in Net Assets (cont'd) | | Year Ended
September 30, 2020
(000) | | Year Ended
September 30, 2019
(000) | |
(1) Capital Share Transactions: | |
Class I: | |
Shares Subscribed | | | 38,635 | | | | 23,170 | | |
Shares Issued on Distributions Reinvested | | | 1,542 | | | | 1,028 | | |
Shares Redeemed | | | (24,048 | ) | | | (8,452 | ) | |
Net Increase in Class I Shares Outstanding | | | 16,129 | | | | 15,746 | | |
Class A: | |
Shares Subscribed | | | 5,160 | | | | 5,169 | | |
Shares Issued on Distributions Reinvested | | | 257 | | | | 229 | | |
Shares Redeemed | | | (3,776 | ) | | | (3,499 | ) | |
Net Increase in Class A Shares Outstanding | | | 1,641 | | | | 1,899 | | |
Class L: | |
Shares Exchanged | | | 6 | | | | 31 | | |
Shares Issued on Distributions Reinvested | | | 2 | | | | 2 | | |
Shares Redeemed | | | (2 | ) | | | (14 | ) | |
Net Increase in Class L Shares Outstanding | | | 6 | | | | 19 | | |
Class C: | |
Shares Subscribed | | | 1,325 | | | | 873 | | |
Shares Issued on Distributions Reinvested | | | 37 | | | | 20 | | |
Shares Redeemed | | | (442 | ) | | | (256 | ) | |
Net Increase in Class C Shares Outstanding | | | 920 | | | | 637 | | |
Class IS: | |
Shares Subscribed | | | 8,888 | | | | — | | |
Shares Issued on Distributions Reinvested | | | 194 | | | | — | @@ | |
Shares Redeemed | | | (998 | ) | | | — | | |
Net Increase in Class IS Shares Outstanding | | | 8,084 | | | | — | @@ | |
@ Amount is less than $500.
@@ Amount is less than 500 shares.
The accompanying notes are an integral part of the financial statements.
24
Morgan Stanley Institutional Fund Trust
Annual Report — September 30, 2020
Financial Highlights
Core Plus Fixed Income Portfolio
| | | Class I | |
| | | Year Ended September 30, | |
Selected Per Share Data and Ratios | | 2020 | | 2019 | | 2018 | | 2017 | | 2016(1) | |
Net Asset Value, Beginning of Period | | $ | 11.58 | | | $ | 10.84 | | | $ | 11.17 | | | $ | 11.22 | | | $ | 10.18 | | |
Income (Loss) from Investment Operations: | |
Net Investment Income(2) | | | 0.31 | | | | 0.37 | | | | 0.34 | | | | 0.32 | | | | 0.34 | | |
Net Realized and Unrealized Gain (Loss) | | | 0.40 | | | | 0.78 | | | | (0.38 | ) | | | (0.02 | ) | | | 1.11 | | |
Total from Investment Operations | | | 0.71 | | | | 1.15 | | | | (0.04 | ) | | | 0.30 | | | | 1.45 | | |
Distributions from and/or in Excess of: | |
Net Investment Income | | | (0.30 | ) | | | (0.41 | ) | | | (0.29 | ) | | | (0.35 | ) | | | (0.41 | ) | |
Net Realized Gain | | | (0.08 | ) | | | — | | | | — | | | | — | | | | — | | |
Total Distributions | | | (0.38 | ) | | | (0.41 | ) | | | (0.29 | ) | | | (0.35 | ) | | | (0.41 | ) | |
Net Asset Value, End of Period | | $ | 11.91 | | | $ | 11.58 | | | $ | 10.84 | | | $ | 11.17 | | | $ | 11.22 | | |
Total Return(3) | | | 6.27 | % | | | 10.83 | %(4) | | | (0.36 | )% | | | 2.79 | %(5) | | | 14.80 | %(6) | |
Ratios to Average Net Assets and Supplemental Data: | |
Net Assets, End of Period (Thousands) | | $ | 662,724 | | | $ | 457,610 | | | $ | 257,605 | | | $ | 265,958 | | | $ | 193,976 | | |
Ratio of Expenses Before Expense Limitation | | | 0.64 | % | | | 0.67 | % | | | 0.70 | % | | | 0.73 | % | | | 0.74 | % | |
Ratio of Expenses After Expense Limitation | | | 0.40 | %(7) | | | 0.41 | %(7) | | | 0.40 | %(7) | | | 0.40 | %(7) | | | 0.43 | %(7)(8) | |
Ratio of Expenses After Expense Limitation Excluding Non-Operating Expenses | | | 0.40 | %(7) | | | N/A | | | | N/A | | | | N/A | | | | N/A | | |
Ratio of Net Investment Income | | | 2.63 | %(7) | | | 3.29 | %(7) | | | 3.09 | %(7) | | | 2.94 | %(7) | | | 3.31 | %(7)(8) | |
Ratio of Rebate from Morgan Stanley Affiliates | | | 0.02 | % | | | 0.01 | % | | | 0.02 | % | | | 0.02 | % | | | 0.01 | % | |
Portfolio Turnover Rate | | | 287 | % | | | 217 | % | | | 248 | % | | | 350 | % | | | 262 | % | |
(1) Reflects prior period custodian out-of-pocket expenses that were reimbursed in September 2016. The amount of the reimbursement was immaterial on a per share basis and did not impact the total return of Class I shares. The Ratio of Expenses After Expense Limitation and the Ratio of Net Investment Income would be unchanged as the reimbursement of custodian fees was offset against expense waivers/reimbursements with no impact to net expenses or net investment income.
(2) Per share amount is based on average shares outstanding.
(3) Calculated based on the net asset value as of the last business day of the period.
(4) Performance was positively impacted by approximately 0.20% due to the receipt of proceeds from the settlement of a class action suit involving the Fund's past holdings. This was a one-time settlement, and as a result, the impact on the NAV and consequently the performance will not likely be repeated in the future. Had this settlement not occurred, the total return for Class I shares would have been approximately 10.63%.
(5) Performance was positively impacted by approximately 0.46% due to the receipt of proceeds from the settlement of class action suits involving the Fund's past holdings. These were one-time settlements, and as a result, the impact on the NAV and consequently the performance will not likely be repeated in the future. Had these settlements not occurred, the total return for Class I shares would have been approximately 2.33%.
(6) Performance was positively impacted by approximately 7.72% due to the receipt of proceeds from the settlement of class action suits involving the Fund's past holdings. These were one-time settlements, and as a result, the impact on the NAV and consequently the performance will not likely be repeated in the future. Had these settlements not occurred, the total return for Class I shares would have been approximately 7.08%.
(7) The Ratio of Expenses After Expense Limitation and Ratio of Net Investment Income reflect the rebate of certain Fund expenses in connection with the investments in Morgan Stanley affiliates during the period. The effect of the rebate on the ratios is disclosed in the above table as "Ratio of Rebate from Morgan Stanley Affiliates."
(8) Effective January 4, 2016, the Adviser has agreed to limit the ratio of expenses to average net assets to the maximum ratio of 0.42% for Class I shares. Prior to January 4, 2016, the maximum ratio was 0.52% for Class I shares.
The accompanying notes are an integral part of the financial statements.
25
Morgan Stanley Institutional Fund Trust
Annual Report — September 30, 2020
Financial Highlights
Core Plus Fixed Income Portfolio
| | | Class A | |
| | | Year Ended September 30, | |
Selected Per Share Data and Ratios | | 2020 | | 2019 | | 2018 | | 2017 | | 2016(1) | |
Net Asset Value, Beginning of Period | | $ | 11.60 | | | $ | 10.85 | | | $ | 11.18 | | | $ | 11.23 | | | $ | 10.19 | | |
Income (Loss) from Investment Operations: | |
Net Investment Income(2) | | | 0.27 | | | | 0.33 | | | | 0.30 | | | | 0.28 | | | | 0.30 | | |
Net Realized and Unrealized Gain (Loss) | | | 0.40 | | | | 0.79 | | | | (0.38 | ) | | | (0.02 | ) | | | 1.12 | | |
Total from Investment Operations | | | 0.67 | | | | 1.12 | | | | (0.08 | ) | | | 0.26 | | | | 1.42 | | |
Distributions from and/or in Excess of: | |
Net Investment Income | | | (0.26 | ) | | | (0.37 | ) | | | (0.25 | ) | | | (0.31 | ) | | | (0.38 | ) | |
Net Realized Gain | | | (0.08 | ) | | | — | | | | — | | | | — | | | | — | | |
Total Distributions | | | (0.34 | ) | | | (0.37 | ) | | | (0.25 | ) | | | (0.31 | ) | | | (0.38 | ) | |
Net Asset Value, End of Period | | $ | 11.93 | | | $ | 11.60 | | | $ | 10.85 | | | $ | 11.18 | | | $ | 11.23 | | |
Total Return(3) | | | 5.91 | % | | | 10.49 | %(4) | | | (0.70 | )% | | | 2.43 | %(5) | | | 14.31 | %(6) | |
Ratios to Average Net Assets and Supplemental Data: | |
Net Assets, End of Period (Thousands) | | $ | 114,387 | | | $ | 92,191 | | | $ | 65,647 | | | $ | 60,874 | | | $ | 24,071 | | |
Ratio of Expenses Before Expense Limitation | | | 0.92 | % | | | 0.97 | % | | | 1.00 | % | | | 1.02 | % | | | 1.15 | % | |
Ratio of Expenses After Expense Limitation | | | 0.74 | %(7) | | | 0.75 | %(7) | | | 0.75 | %(7) | | | 0.75 | %(7) | | | 0.76 | %(7)(8) | |
Ratio of Expenses After Expense Limitation Excluding Non-Operating Expenses | | | 0.74 | %(7) | | | N/A | | | | N/A | | | | N/A | | | | N/A | | |
Ratio of Net Investment Income | | | 2.29 | %(7) | | | 2.96 | %(7) | | | 2.73 | %(7) | | | 2.58 | %(7) | | | 2.82 | %(7)(8) | |
Ratio of Rebate from Morgan Stanley Affiliates | | | 0.02 | % | | | 0.01 | % | | | 0.02 | % | | | 0.02 | % | | | 0.02 | % | |
Portfolio Turnover Rate | | | 287 | % | | | 217 | % | | | 248 | % | | | 350 | % | | | 262 | % | |
(1) Reflects prior period custodian out-of-pocket expenses that were reimbursed in September 2016. The amount of the reimbursement was immaterial on a per share basis and did not impact the total return of Class A shares. The Ratio of Expenses After Expense Limitation and the Ratio of Net Investment Income would be unchanged as the reimbursement of custodian fees was offset against expense waivers/reimbursements with no impact to net expenses or net investment income.
(2) Per share amount is based on average shares outstanding.
(3) Calculated based on the net asset value which does not reflect sales charges, if applicable, as of the last business day of the period.
(4) Performance was positively impacted by approximately 0.20% due to the receipt of proceeds from the settlement of a class action suit involving the Fund's past holdings. This was a one-time settlement, and as a result, the impact on the NAV and consequently the performance will not likely be repeated in the future. Had this settlement not occurred, the total return for Class A shares would have been approximately 10.29%.
(5) Performance was positively impacted by approximately 0.46% due to the receipt of proceeds from the settlement of class action suits involving the Fund's past holdings. These were one-time settlements, and as a result, the impact on the NAV and consequently the performance will not likely be repeated in the future. Had these settlements not occurred, the total return for Class A shares would have been approximately 1.97%.
(6) Performance was positively impacted by approximately 7.76% due to the receipt of proceeds from the settlement of class action suits involving the Fund's past holdings. These were one-time settlements, and as a result, the impact on the NAV and consequently the performance will not likely be repeated in the future. Had these settlements not occurred, the total return for Class A shares would have been approximately 6.55%.
(7) The Ratio of Expenses After Expense Limitation and Ratio of Net Investment Income reflect the rebate of certain Fund expenses in connection with the investments in Morgan Stanley affiliates during the period. The effect of the rebate on the ratios is disclosed in the above table as "Ratio of Rebate from Morgan Stanley Affiliates."
(8) Effective January 4, 2016, the Adviser has agreed to limit the ratio of expenses to average net assets to the maximum ratio of 0.77% for Class A shares. Prior to January 4, 2016, the maximum ratio was 0.87% for Class A shares.
The accompanying notes are an integral part of the financial statements.
26
Morgan Stanley Institutional Fund Trust
Annual Report — September 30, 2020
Financial Highlights
Core Plus Fixed Income Portfolio
| | | Class L | |
| | | Year Ended September 30, | |
Selected Per Share Data and Ratios | | 2020 | | 2019 | | 2018 | | 2017 | | 2016(1) | |
Net Asset Value, Beginning of Period | | $ | 11.61 | | | $ | 10.86 | | | $ | 11.17 | | | $ | 11.23 | | | $ | 10.18 | | |
Income (Loss) from Investment Operations: | |
Net Investment Income(2) | | | 0.24 | | | | 0.30 | | | | 0.27 | | | | 0.26 | | | | 0.28 | | |
Net Realized and Unrealized Gain (Loss) | | | 0.40 | | | | 0.78 | | | | (0.37 | ) | | | (0.03 | ) | | | 1.12 | | |
Total from Investment Operations | | | 0.64 | | | | 1.08 | | | | (0.10 | ) | | | 0.23 | | | | 1.40 | | |
Distributions from and/or in Excess of: | |
Net Investment Income | | | (0.23 | ) | | | (0.33 | ) | | | (0.21 | ) | | | (0.29 | ) | | | (0.35 | ) | |
Net Realized Gain | | | (0.08 | ) | | | — | | | | — | | | | — | | | | — | | |
Total Distributions | | | (0.31 | ) | | | (0.33 | ) | | | (0.21 | ) | | | (0.29 | ) | | | (0.35 | ) | |
Net Asset Value, End of Period | | $ | 11.94 | | | $ | 11.61 | | | $ | 10.86 | | | $ | 11.17 | | | $ | 11.23 | | |
Total Return(3) | | | 5.63 | % | | | 10.12 | %(4) | | | (0.95 | )% | | | 2.16 | %(5) | | | 14.10 | %(6) | |
Ratios to Average Net Assets and Supplemental Data: | |
Net Assets, End of Period (Thousands) | | $ | 812 | | | $ | 720 | | | $ | 464 | | | $ | 1,138 | | | $ | 841 | | |
Ratio of Expenses Before Expense Limitation | | | 1.37 | % | | | 1.45 | % | | | 1.41 | % | | | 1.35 | % | | | 1.82 | % | |
Ratio of Expenses After Expense Limitation | | | 1.00 | %(7) | | | 1.01 | %(7) | | | 1.00 | %(7) | | | 1.00 | %(7) | | | 1.03 | %(7)(8) | |
Ratio of Expenses After Expense Limitation Excluding Non-Operating Expenses | | | 1.00 | %(7) | | | N/A | | | | N/A | | | | N/A | | | | N/A | | |
Ratio of Net Investment Income | | | 2.04 | %(7) | | | 2.70 | %(7) | | | 2.46 | %(7) | | | 2.37 | %(7) | | | 2.65 | %(7)(8) | |
Ratio of Rebate from Morgan Stanley Affiliates | | | 0.02 | % | | | 0.01 | % | | | 0.02 | % | | | 0.02 | % | | | 0.01 | % | |
Portfolio Turnover Rate | | | 287 | % | | | 217 | % | | | 248 | % | | | 350 | % | | | 262 | % | |
(1) Reflects prior period custodian out-of-pocket expenses that were reimbursed in September 2016. The amount of the reimbursement was immaterial on a per share basis and did not impact the total return of Class L shares. The Ratio of Expenses After Expense Limitation and the Ratio of Net Investment Income would be unchanged as the reimbursement of custodian fees was offset against expense waivers/reimbursements with no impact to net expenses or net investment income.
(2) Per share amount is based on average shares outstanding.
(3) Calculated based on the net asset value as of the last business day of the period.
(4) Performance was positively impacted by approximately 0.20% due to the receipt of proceeds from the settlement of a class action suit involving the Fund's past holdings. This was a one-time settlement, and as a result, the impact on the NAV and consequently the performance will not likely be repeated in the future. Had this settlement not occurred, the total return for Class L shares would have been approximately 9.92%.
(5) Performance was positively impacted by approximately 0.46% due to the receipt of proceeds from the settlement of class action suits involving the Fund's past holdings. These were one-time settlements, and as a result, the impact on the NAV and consequently the performance will not likely be repeated in the future. Had these settlements not occurred, the total return for Class L shares would have been approximately 1.70%.
(6) Performance was positively impacted by approximately 7.76% due to the receipt of proceeds from the settlement of class action suits involving the Fund's past holdings. These were one-time settlements, and as a result, the impact on the NAV and consequently the performance will not likely be repeated in the future. Had these settlements not occurred, the total return for Class L shares would have been approximately 6.34%.
(7) The Ratio of Expenses After Expense Limitation and Ratio of Net Investment Income reflect the rebate of certain Fund expenses in connection with the investments in Morgan Stanley affiliates during the period. The effect of the rebate on the ratios is disclosed in the above table as "Ratio of Rebate from Morgan Stanley Affiliates."
(8) Effective January 4, 2016, the Adviser has agreed to limit the ratio of expenses to average net assets to the maximum ratio of 1.02% for Class L shares. Prior to January 4, 2016, the maximum ratio was 1.12% for Class L shares.
The accompanying notes are an integral part of the financial statements.
27
Morgan Stanley Institutional Fund Trust
Annual Report — September 30, 2020
Financial Highlights
Core Plus Fixed Income Portfolio
| | | Class C | |
| | | Year Ended September 30, | |
Selected Per Share Data and Ratios | | 2020 | | 2019 | | 2018 | | 2017 | | 2016(1) | |
Net Asset Value, Beginning of Period | | $ | 11.52 | | | $ | 10.77 | | | $ | 11.10 | | | $ | 11.17 | | | $ | 10.16 | | |
Income (Loss) from Investment Operations: | |
Net Investment Income(2) | | | 0.18 | | | | 0.25 | | | | 0.22 | | | | 0.20 | | | | 0.22 | | |
Net Realized and Unrealized Gain (Loss) | | | 0.41 | | | | 0.78 | | | | (0.37 | ) | | | (0.03 | ) | | | 1.12 | | |
Total from Investment Operations | | | 0.59 | | | | 1.03 | | | | (0.15 | ) | | | 0.17 | | | | 1.34 | | |
Distributions from and/or in Excess of: | |
Net Investment Income | | | (0.19 | ) | | | (0.28 | ) | | | (0.18 | ) | | | (0.24 | ) | | | (0.33 | ) | |
Net Realized Gain | | | (0.08 | ) | | | — | | | | — | | | | — | | | | — | | |
Total Distributions | | | (0.27 | ) | | | (0.28 | ) | | | (0.18 | ) | | | (0.24 | ) | | | (0.33 | ) | |
Net Asset Value, End of Period | | $ | 11.84 | | | $ | 11.52 | | | $ | 10.77 | | | $ | 11.10 | | | $ | 11.17 | | |
Total Return(3) | | | 5.16 | % | | | 9.70 | %(4) | | | (1.39 | )% | | | 1.57 | %(5) | | | 13.52 | %(6) | |
Ratios to Average Net Assets and Supplemental Data: | |
Net Assets, End of Period (Thousands) | | $ | 25,989 | | | $ | 14,684 | | | $ | 6,873 | | | $ | 4,890 | | | $ | 3,528 | | |
Ratio of Expenses Before Expense Limitation | | | 1.62 | % | | | 1.68 | % | | | 1.73 | % | | | 1.74 | % | | | 2.00 | % | |
Ratio of Expenses After Expense Limitation | | | 1.43 | %(7) | | | 1.46 | %(7) | | | 1.50 | %(7) | | | 1.50 | %(7) | | | 1.51 | %(7)(8) | |
Ratio of Expenses After Expense Limitation Excluding Non-Operating Expenses | | | 1.43 | %(7) | | | N/A | | | | N/A | | | | N/A | | | | N/A | | |
Ratio of Net Investment Income | | | 1.60 | %(7) | | | 2.23 | %(7) | | | 2.01 | %(7) | | | 1.86 | %(7) | | | 2.04 | %(7)(8) | |
Ratio of Rebate from Morgan Stanley Affiliates | | | 0.02 | % | | | 0.01 | % | | | 0.02 | % | | | 0.02 | % | | | 0.02 | % | |
Portfolio Turnover Rate | | | 287 | % | | | 217 | % | | | 248 | % | | | 350 | % | | | 262 | % | |
(1) Reflects prior period custodian out-of-pocket expenses that were reimbursed in September 2016. The amount of the reimbursement was immaterial on a per share basis and did not impact the total return of Class C shares. The Ratio of Expenses After Expense Limitation and the Ratio of Net Investment Income would be unchanged as the reimbursement of custodian fees was offset against expense waivers/reimbursements with no impact to net expenses or net investment income.
(2) Per share amount is based on average shares outstanding.
(3) Calculated based on the net asset value which does not reflect sales charges, if applicable, as of the last business day of the period.
(4) Performance was positively impacted by approximately 0.20% due to the receipt of proceeds from the settlement of a class action suit involving the Fund's past holdings. This was a one-time settlement, and as a result, the impact on the NAV and consequently the performance will not likely be repeated in the future. Had this settlement not occurred, the total return for Class C shares would have been approximately 9.50%.
(5) Performance was positively impacted by approximately 0.46% due to the receipt of proceeds from the settlement of class action suits involving the Fund's past holdings. These were one-time settlements, and as a result, the impact on the NAV and consequently the performance will not likely be repeated in the future. Had these settlements not occurred, the total return for Class C shares would have been approximately 1.11%.
(6) Performance was positively impacted by approximately 7.75% due to the receipt of proceeds from the settlement of class action suits involving the Fund's past holdings. These were one-time settlements, and as a result, the impact on the NAV and consequently the performance will not likely be repeated in the future. Had these settlements not occurred, the total return for Class C shares would have been approximately 5.77%.
(7) The Ratio of Expenses After Expense Limitation and Ratio of Net Investment Income reflect the rebate of certain Fund expenses in connection with the investments in Morgan Stanley affiliates during the period. The effect of the rebate on the ratios is disclosed in the above table as "Ratio of Rebate from Morgan Stanley Affiliates."
(8) Effective January 4, 2016, the Adviser has agreed to limit the ratio of expenses to average net assets to the maximum ratio of 1.52% for Class C shares. Prior to January 4, 2016, the maximum ratio was 1.62% for Class C shares.
The accompanying notes are an integral part of the financial statements.
28
Morgan Stanley Institutional Fund Trust
Annual Report — September 30, 2020
Financial Highlights
Core Plus Fixed Income Portfolio
| | | Class IS | |
| | | Year Ended September 30, | | Period from
June 15, 2018(1) to | |
Selected Per Share Data and Ratios | | 2020 | | 2019 | | September 30, 2018 | |
Net Asset Value, Beginning of Period | | $ | 11.58 | | | $ | 10.84 | | | $ | 10.85 | | |
Income (Loss) from Investment Operations: | |
Net Investment Income(2) | | | 0.31 | | | | 0.37 | | | | 0.10 | | |
Net Realized and Unrealized Gain (Loss) | | | 0.41 | | | | 0.78 | | | | (0.04 | ) | |
Total from Investment Operations | | | 0.72 | | | | 1.15 | | | | 0.06 | | |
Distributions from and/or in Excess of: | |
Net Investment Income | | | (0.31 | ) | | | (0.41 | ) | | | (0.07 | ) | |
Net Realized Gain | | | (0.08 | ) | | | — | | | | — | | |
Total Distributions | | | (0.39 | ) | | | (0.41 | ) | | | (0.07 | ) | |
Net Asset Value, End of Period | | $ | 11.91 | | | $ | 11.58 | | | $ | 10.84 | | |
Total Return(3) | | | 6.24 | % | | | 10.89 | %(4) | | | 0.56 | %(6) | |
Ratios to Average Net Assets and Supplemental Data: | |
Net Assets, End of Period (Thousands) | | $ | 96,251 | | | $ | 11 | | | $ | 10 | | |
Ratio of Expenses Before Expense Limitation | | | 0.54 | % | | | 18.96 | % | | | 18.71 | %(7) | |
Ratio of Expenses After Expense Limitation | | | 0.35 | %(5) | | | 0.35 | %(5) | | | 0.35 | %(5)(7) | |
Ratio of Expenses After Expense Limitation Excluding Non-Operating Expenses | | | 0.35 | %(5) | | | N/A | | | | N/A | | |
Ratio of Net Investment Income | | | 2.67 | %(5) | | | 3.33 | %(5) | | | 3.17 | %(5)(7) | |
Ratio of Rebate from Morgan Stanley Affiliates | | | 0.02 | % | | | 0.01 | % | | | 0.02 | %(7) | |
Portfolio Turnover Rate | | | 287 | % | | | 217 | % | | | 248 | %(6) | |
(1) Commencement of Offering.
(2) Per share amount is based on average shares outstanding.
(3) Calculated based on the net asset value as of the last business day of the period.
(4) Performance was positively impacted by approximately 0.20% due to the receipt of proceeds from the settlement of a class action suit involving the Fund's past holdings. This was a one-time settlement, and as a result, the impact on the NAV and consequently the performance will not likely be repeated in the future. Had this settlement not occurred, the total return for Class IS shares would have been approximately 10.69%.
(5) The Ratio of Expenses After Expense Limitation and Ratio of Net Investment Income reflect the rebate of certain Fund expenses in connection with the investments in Morgan Stanley affiliates during the period. The effect of the rebate on the ratios is disclosed in the above table as "Ratio of Rebate from Morgan Stanley Affiliates."
(6) Not annualized.
(7) Annualized.
The accompanying notes are an integral part of the financial statements.
29
Morgan Stanley Institutional Fund Trust
Annual Report — September 30, 2020
Notes to Financial Statements
Morgan Stanley Institutional Fund Trust ("Trust'') is registered under the Investment Company Act of 1940, as amended (the "Act''), as an open-end management investment company. The Trust is comprised of twelve separate, active funds (individually referred to as a "Fund," collectively as the "Funds"). The Trust applies investment company accounting and reporting guidance. All Funds are considered diversified for purposes of the Act.
The accompanying financial statements relate to the Core Plus Fixed Income Portfolio. The Fund seeks above-average total return over a market cycle of three to five years. The Fund offers five classes of shares — Class I, Class A, Class L, Class C and Class IS.
The Fund has suspended offering Class L shares for sale to all investors. Class L shareholders of the Fund do not have the option of purchasing additional Class L shares. However, existing Class L shareholders may invest in additional Class L shares through reinvestment of dividends and distributions.
A. Significant Accounting Policies: The following significant accounting policies are in conformity with U.S. generally accepted accounting principles ("GAAP"). Such policies are consistently followed by the Trust in the preparation of its financial statements. GAAP may require management to make estimates and assumptions that affect the reported amounts and disclosures in the financial statements. Actual results may differ from those estimates.
In March 2017, the Financial Accounting Standards Board ("FASB") issued an Accounting Standard Update, ASU 2017-08, Receivables-Nonrefundable Fees and Other Costs (Subtopic 310-20), Premium Amortization on Purchased Callable Debt Securities ("ASU 2017-08") which amends the amortization period for certain purchased callable debt securities held at a premium, shortening such period to the earliest call date. ASU 2017-08 does not require any accounting change for debt securities held at a discount; the discount continues to be accreted to maturity. ASU 2017-08 is effective for fiscal years, and interim periods within those fiscal years, beginning after December 15, 2018. The adoption resulted in a change in accounting principle, since the Fund had historically amortized such premiums to maturity for U.S. GAAP. Accordingly, the Fund has adopted ASU 2017-08 to amend the premium amortization period for certain purchased callable debt securities with non-contingent call features to the earliest call date. It is impracticable to evaluate the effect on individual prior periods, therefore the Fund applied the amendments on a modified retrospective basis by recognizing a cumulative effect
adjustment that decreased the beginning of period cost of investments and increased the unrealized appreciation on investments of approximately $5,000.
This change in accounting policy has been made to comply with the newly issued accounting standard and had no impact on total accumulated earnings (loss) or the net asset value of the Fund. With respect to the Fund's results of operations, amortization of premium to first call date accelerates amortization with the intent of more closely aligning the recognition of income on such bonds with the economics of the instrument.
In March 2020, FASB issued an Accounting Standard Update, ASU 2020-04, Reference Rate Reform (Topic 848) — Facilitation of the Effects of Reference Rate Reform on Financial Reporting ("ASU 2020-04"), which provides optional, temporary relief with respect to the financial reporting of contracts subject to certain types of modifications due to the planned discontinuation of the London Interbank Offered Rate ("LIBOR") and other IBOR-based reference rates at the end of 2021. The temporary relief provided by ASU 2020-04 is effective for certain reference rate-related contract modifications that occur during the period from March 12, 2020 through December 31, 2022. Management is evaluating the impact of ASU 2020-04 on the Fund's investments, derivatives, debt and other contracts that will undergo reference rate-related modifications as a result of the reference rate reform.
1. Security Valuation: (1) Certain portfolio securities may be valued by an outside pricing service/vendor approved by the Trust's Board of Trustees (the "Trustees"). The pricing service/vendor may employ a pricing model that takes into account, among other things, bids, yield spreads and/or other market data and specific security characteristics. Alternatively, if a valuation is not available from an outside pricing service/vendor, and the security trades on an exchange, the security may be valued at its latest reported sale price (or at the exchange official closing price if such exchange reports an official closing price), prior to the time when assets are valued. If there are no sales on a given day and if there is no official exchange closing price for that day, the security is valued at the mean between the last reported bid and asked prices if such bid and asked prices are available in the relevant exchanges. If only bid prices are available then the latest bid price may be used. If Morgan Stanley Investment Management Inc. (the "Adviser"), a wholly-owned subsidiary of Morgan Stanley, determines that the price provided by the outside pricing service/vendor or exchange does not reflect the security's
30
Morgan Stanley Institutional Fund Trust
Annual Report — September 30, 2020
Notes to Financial Statements (cont'd)
fair value or is unable to provide a price, prices from brokers or dealers may also be utilized. In these circumstances, the value of the security will be the mean of bid and asked prices obtained from brokers or dealers; (2) futures are valued at the settlement price on the exchange on which they trade or, if a settlement price is unavailable, at the last sale price on the exchange; (3) over-the-counter ("OTC") swaps may be valued by an outside pricing service approved by the Trustees or quotes from a broker or dealer. Swaps cleared on a clearinghouse or exchange may be valued using the closing price provided by the clearinghouse or exchange; (4) when market quotations are not readily available, including circumstances under which the Adviser determines that the closing price, last sale price or the mean between the last reported bid and asked prices are not reflective of a security's market value, portfolio securities are valued at their fair value as determined in good faith under procedures established by and under the general supervision of the Trustees. Occasionally, developments affecting the closing prices of securities and other assets may occur between the times at which valuations of such securities are determined (that is, close of the foreign market on which the securities trade) and the close of business of the New York Stock Exchange ("NYSE"). If developments occur during such periods that are expected to materially affect the value of such securities, such valuations may be adjusted to reflect the estimated fair value of such securities as of the close of the NYSE, as determined in good faith by the Trustees or by the Adviser using a pricing service and/or procedures approved by the Trustees; (5) quotations of foreign portfolio securities, other assets and liabilities and forward contracts stated in foreign currency are translated into U.S. dollar equivalents at the prevailing market rates prior to the close of the NYSE; and (6) investments in mutual funds, including the Morgan Stanley Institutional Liquidity Funds, are valued at the net asset value ("NAV") as of the close of each business day.
The Trustees have responsibility for determining in good faith the fair value of the investments, and the Trustees may appoint others, such as the Trust's Adviser or a valuation committee, to assist the Trustees in determining fair value and to make the actual calculations pursuant to the fair valuation methodologies previously approved by the Trustees. Under procedures approved by the Trustees, the Trust's Adviser has formed a Valuation Committee whose members are approved by the
Trustees. The Valuation Committee provides administration and oversight of the Trust's valuation policies and procedures, which are reviewed at least annually by the Trustees. These procedures allow the Trust to utilize independent pricing services, quotations from securities and financial instrument dealers and other market sources to determine fair value.
2. Fair Value Measurement: FASB Accounting Standards CodificationTM ("ASC") 820, "Fair Value Measurement" ("ASC 820"), defines fair value as the value that the Fund would receive to sell an investment or pay to transfer a liability in a timely transaction with an independent buyer in the principal market, or in the absence of a principal market, the most advantageous market for the investment or liability. ASC 820 establishes a three-tier hierarchy to distinguish between (1) inputs that reflect the assumptions market participants would use in valuing an asset or liability developed based on market data obtained from sources independent of the reporting entity (observable inputs) and (2) inputs that reflect the reporting entity's own assumptions about the assumptions market participants would use in valuing an asset or liability developed based on the best information available in the circumstances (unobservable inputs) and to establish classification of fair value measurements for disclosure purposes. Various inputs are used in determining the value of the Fund's investments. The inputs are summarized in the three broad levels listed below:
• Level 1 – unadjusted quoted prices in active markets for identical investments
• Level 2 – other significant observable inputs (including quoted prices for similar investments, interest rates, prepayment speeds, credit risk, etc.)
• Level 3 – significant unobservable inputs including the Fund's own assumptions in determining the fair value of investments. Factors considered in making this determination may include, but are not limited to, information obtained by contacting the issuer, analysts, or the appropriate stock exchange (for exchange-traded securities), analysis of the issuer's financial statements or other available documents and, if necessary, available information concerning other securities in similar circumstances.
31
Morgan Stanley Institutional Fund Trust
Annual Report — September 30, 2020
Notes to Financial Statements (cont'd)
The inputs or methodology used for valuing securities are not necessarily an indication of the risk associated with investing in those securities and the determination of the significance of a particular input to the fair value measurement in its entirety requires judgment and considers factors specific to each security.
The following is a summary of the inputs used to value the Fund's investments as of September 30, 2020:
Investment Type | | Level 1
Unadjusted
quoted
prices
(000) | | Level 2
Other
significant
observable
inputs
(000) | | Level 3
Significant
unobservable
inputs
(000) | | Total
(000) | |
Assets: | |
Fixed Income Securities | |
Agency Adjustable Rate
Mortgage | | $ | — | | | $ | 54 | | | $ | — | | | $ | 54 | | |
Agency Fixed Rate
Mortgages | | | — | | | | 207,392 | | | | — | | | | 207,392 | | |
Asset-Backed Securities | | | — | | | | 110,282 | | | | — | | | | 110,282 | | |
Collateralized Mortgage
Obligations — Agency
Collateral Series | | | — | | | | 3,964 | | | | — | | | | 3,964 | | |
Commercial Mortgage-
Backed Securities | | | — | | | | 45,986 | | | | — | | | | 45,986 | | |
Corporate Bonds | | | — | | | | 323,834 | | | | — | | | | 323,834 | | |
Mortgages — Other | | | — | | | | 85,541 | | | | — | | | | 85,541 | | |
Municipal Bonds | | | — | | | | 10,655 | | | | — | | | | 10,655 | | |
Sovereign | | | — | | | | 66,497 | | | | — | | | | 66,497 | | |
U.S. Treasury Security | | | — | | | | 10,656 | | | | — | | | | 10,656 | | |
Variable Rate Senior
Loan Interests | | | — | | | | 16,150 | | | | — | | | | 16,150 | | |
Total Fixed Income
Securities | | | — | | | | 881,011 | | | | — | | | | 881,011 | | |
Short-Term Investments | |
Investment Company | | | 160,007 | | | | — | | | | — | | | | 160,007 | | |
Sovereign | | | — | | | | 2,313 | | | | — | | | | 2,313 | | |
U.S. Treasury Securities | | | — | | | | 2,517 | | | | — | | | | 2,517 | | |
Total Short-Term
Investments | | | 160,007 | | | | 4,830 | | | | — | | | | 164,837 | | |
Foreign Currency
Forward Exchange
Contracts | | | — | | | | 806 | | | | — | | | | 806 | | |
Futures Contracts | | | 208 | | | | — | | | | — | | | | 208 | | |
Credit Default Swap
Agreement | | | — | | | | 250 | | | | — | | | | 250 | | |
Total Assets | | | 160,215 | | | | 886,897 | | | | — | | | | 1,047,112 | | |
Liabilities: | |
Foreign Currency
Forward Exchange
Contracts | | | — | | | | (669 | ) | | | — | | | | (669 | ) | |
Futures Contracts | | | (174 | ) | | | — | | | | — | | | | (174 | ) | |
Credit Default Swap
Agreement | | | — | | | | (384 | ) | | | — | | | | (384 | ) | |
Total Liabilities | | | (174 | ) | | | (1,053 | ) | | | — | | | | (1,227 | ) | |
Total | | $ | 160,041 | | | $ | 885,844 | | | $ | — | | | $ | 1,045,885 | | |
Transfers between investment levels may occur as the markets fluctuate and/or the availability of data used in an investment's valuation changes.
3. Foreign Currency Translation and Foreign Investments: The books and records of the Fund are maintained in U.S. dollars. Foreign currency amounts are translated into U.S. dollars as follows:
– investments, other assets and liabilities at the prevailing rate of exchange on the valuation date;
– investment transactions and investment income at the prevailing rates of exchange on the dates of such transactions.
Although the net assets of the Fund are presented at the foreign exchange rates and market values at the close of the period, the Fund does not isolate that portion of the results of operations arising as a result of changes in the foreign exchange rates from the fluctuations arising from changes in the market prices of securities held at period end. Similarly, the Fund does not isolate the effect of changes in foreign exchange rates from the fluctuations arising from changes in the market prices of securities sold during the period. Accordingly, realized and unrealized foreign currency gains (losses) on investments in securities are included in the reported net realized and unrealized gains (losses) on investment transactions and balances. However, pursuant to U.S. federal income tax regulations, gains and losses from certain foreign currency transactions and the foreign currency portion of gains and losses realized on sales and maturities of foreign denominated debt securities are treated as ordinary income for U.S. federal income tax purposes.
Net realized gains (losses) on foreign currency transactions represent net foreign exchange gains (losses) from foreign currency forward exchange contracts, disposition of foreign currencies, currency gains (losses) realized between the trade and settlement dates on securities transactions, and the difference between the amount of investment income and foreign withholding taxes recorded on the Fund's books and the U.S. dollar equivalent amounts actually received or paid. The change in unrealized currency gains (losses) on foreign currency transactions for the period is reflected in the Statement of Operations.
32
Morgan Stanley Institutional Fund Trust
Annual Report — September 30, 2020
Notes to Financial Statements (cont'd)
Foreign security and currency transactions may involve certain considerations and risks not typically associated with those of U.S. dollar denominated transactions as a result of, among other factors, fluctuations of exchange rates in relation to the U.S. dollar, the possibility of lower levels of governmental supervision and regulation of foreign securities markets and the possibility of political or economic instability.
Governmental approval for foreign investments may be required in advance of making an investment under certain circumstances in some countries, and the extent of foreign investments in domestic companies may be subject to limitation in other countries. Foreign ownership limitations also may be imposed by the charters of individual companies to prevent, among other concerns, violations of foreign investment limitations. As a result, an additional class of shares (identified as "Foreign" in the Portfolio of Investments) may be created and offered for investment. The "local" and "foreign shares" market values may differ. In the absence of trading of the foreign shares in such markets, the Fund values the foreign shares at the closing exchange price of the local shares.
4. Derivatives: The Fund may, but is not required to, use derivative instruments for a variety of purposes, including hedging, risk management, portfolio management or to earn income. Derivatives are financial instruments whose value is based, in part, on the value of an underlying asset, interest rate, index or financial instrument. Prevailing interest rates and volatility levels, among other things, also affect the value of derivative instruments. A derivative instrument often has risks similar to its underlying asset and may have additional risks, including imperfect correlation between the value of the derivative and the underlying asset, risks of default by the counterparty to certain transactions, magnification of losses incurred due to changes in the market value of the securities, instruments, indices or interest rates to which the derivative instrument relates, risks that the transactions may not be liquid and risks arising from margin requirements. The use of derivatives involves risks that are different from, and possibly greater than, the risks associated with other portfolio investments. Derivatives may involve the use of highly specialized instruments that require investment techniques and risk analyses different from those associated with other portfolio investments. All of the Fund's holdings, including derivative instruments, are marked-to-market each day with
the change in value reflected in unrealized appreciation (depreciation). Upon disposition, a realized gain or loss is recognized.
Certain derivative transactions may give rise to a form of leverage. Leverage magnifies the potential for gain and the risk of loss. Leverage associated with derivative transactions may cause the Fund to liquidate portfolio positions when it may not be advantageous to do so to satisfy its obligations or to meet earmarking or segregation requirements, pursuant to applicable Securities and Exchange Commission ("SEC") rules and regulations, or may cause the Fund to be more volatile than if the Fund had not been leveraged. Although the Adviser seeks to use derivatives to further the Fund's investment objectives, there is no assurance that the use of derivatives will achieve this result.
Following is a description of the derivative instruments and techniques that the Fund used during the period and their associated risks:
Futures: A futures contract is a standardized, exchange-traded agreement to buy or sell a specific quantity of an underlying asset, reference rate or index at a specific price at a specific future time. The value of a futures contract tends to increase and decrease in tandem with the value of the underlying instrument. Depending on the terms of the particular contract, futures contracts are settled through either physical delivery of the underlying instrument on the settlement date or by payment of a cash settlement amount on the settlement date. During the period the futures contract is open, payments are received from or made to the broker based upon changes in the value of the contract (the variation margin). A decision as to whether, when and how to use futures contracts involves the exercise of skill and judgment and even a well-conceived futures transaction may be unsuccessful because of market behavior or unexpected events. In addition to the derivatives risks discussed above, the prices of futures contracts can be highly volatile, using futures contracts can lower total return and the potential loss from futures contracts can exceed the Fund's initial investment in such contracts. No assurance can be given that a liquid market will exist for any particular futures contract at any particular time. There is also the risk of loss by the Fund of margin deposits in the event of bankruptcy of a broker with which the Fund has open positions in the futures contract.
33
Morgan Stanley Institutional Fund Trust
Annual Report — September 30, 2020
Notes to Financial Statements (cont'd)
Swaps: The Fund may enter into OTC swap contracts or cleared swap transactions. A swap contract is an agreement between two parties pursuant to which the parties exchange payments at specified dates on the basis of a specified notional amount, with the payments calculated by reference to specified securities, indices, reference rates, currencies or other instruments. Typically swap agreements provide that when the period payment dates for both parties are the same, the payments are made on a net basis (i.e., the two payment streams are netted out, with only the net amount paid by one party to the other). The Fund's obligations or rights under a swap contract entered into on a net basis will generally be equal only to the net amount to be paid or received under the agreement, based on the relative values of the positions held by each party. Cleared swap transactions may help reduce counterparty credit risk. In a cleared swap, the Fund's ultimate counterparty is a clearinghouse rather than a swap dealer, bank or other financial institution. OTC swap agreements are not entered into or traded on exchanges and often there is no central clearing or guaranty function for OTC swaps. These OTC swaps are often subject to credit risk or the risk of default or non-performance by the counterparty. Both OTC and cleared swaps could result in losses if interest rates, foreign currency exchange rates or other factors are not correctly anticipated by the Fund or if the reference index, security or investments do not perform as expected. During the period swap agreements are open, payments are received from or made to the clearinghouse or counterparty based upon changes in the value of the contract (variation margin). The Dodd-Frank Wall Street Reform and Consumer Protection Act and related regulatory developments require the clearing and exchange-trading of certain standardized swap transactions. Mandatory exchange-trading and clearing is occurring on a phased-in basis.
The Fund's use of swaps during the period included those based on the credit of an underlying security commonly referred to as "credit default swaps." The Fund may be either the buyer or seller in a credit default swap. Where the Fund is the buyer of a credit default swap contract, it would typically be entitled to receive the par (or other agreed-upon) value of a referenced debt obligation from the counterparty to the contract only in the event of a default or similar event by the issuer of the
debt obligation. If no default occurs, the Fund would have paid to the counterparty a periodic stream of payments over the term of the contract and received no benefit from the contract. When the Fund is the seller of a credit default swap contract, it typically receives the stream of payments but is obligated to pay an amount equal to the par (or other agreed-upon) value of a referenced debt obligation upon the default or similar event by the issuer of the referenced debt obligation. The use of credit default swaps could result in losses to the Fund if the Adviser fails to correctly evaluate the creditworthiness of the issuer of the referenced debt obligation.
If the Fund is a seller of protection and a credit event occurs, as defined under the terms of that particular swap agreement, the Fund will either (i) pay to the buyer of protection an amount equal to the notional amount of the swap agreement and take delivery of the referenced obligation, other deliverable obligations or underlying securities comprising the referenced index or (ii) pay a net settlement amount in the form of cash or securities equal to the notional amount of the swap agreement less the recovery value of the referenced obligation or underlying securities comprising the referenced index. If the Fund is a buyer of protection and a credit event occurs, as defined under the terms of that particular swap agreement, the Fund will either (i) receive from the seller of protection an amount equal to the notional amount of the swap agreement and deliver the referenced obligation, other deliverable obligations or underlying securities comprising the referenced index or (ii) receive a net settlement amount in the form of cash or securities equal to the notional amount of the swap agreement less the recovery value of the referenced obligation or underlying securities comprising the referenced index. Recovery values are estimated by market makers considering either industry standard recovery rates or entity specific factors and considerations until a credit event occurs. If a credit event has occurred, the recovery value is determined by a facilitated auction whereby a minimum number of allowable broker bids, together with a specified valuation method, are used to calculate the settlement value. The Fund's maximum risk of loss from counterparty risk, either as the protection seller or as the protection buyer, is the fair value of the swap agreement.
34
Morgan Stanley Institutional Fund Trust
Annual Report — September 30, 2020
Notes to Financial Statements (cont'd)
The current credit rating of each individual issuer is listed in the table following the Portfolio of Investments and serves as an indicator of the current status of the payment/performance risk of the credit derivative. Alternatively, for credit default swaps on an index of credits, the quoted market prices and current values serve as an indicator of the current status of the payment/performance risk of the credit derivative. Generally, lower credit ratings and increasing market values, in absolute terms, represent a deterioration of the credit and a greater likelihood of an adverse credit event of the issuer.
When the Fund has an unrealized loss on a swap agreement, the Fund has instructed the custodian to pledge cash or liquid securities as collateral with a value approximately equal to the amount of the unrealized loss. Collateral pledges are monitored and subsequently adjusted if and when the swap valuations fluctuate. If applicable, cash collateral is included with "Due from (to) Broker" in the Statement of Assets and Liabilities.
Upfront payments paid or received by the Fund will be reflected as an asset or liability, respectively, in the Statement of Assets and Liabilities.
Foreign Currency Forward Exchange Contracts: In connection with its investments in foreign securities, the Fund also entered into contracts with banks, brokers or dealers to purchase or sell securities or foreign currencies at a future date. A foreign currency forward exchange contract ("currency contract") is a negotiated agreement between the contracting parties to exchange a specified amount of currency at a specified future time at a specified rate. The rate can be higher or lower than the spot rate between the currencies that are the subject of the contract. Currency contracts may be used to protect against uncertainty in the level of future foreign currency exchange rates or to gain or modify exposure to a particular currency. In addition, the Fund may use cross currency hedging or proxy hedging with respect to currencies in which the Fund has or expects to have portfolio or currency exposure. Cross currency hedges involve the sale of one currency against the positive exposure to a different currency and may be used for hedging purposes or to establish an active exposure to the exchange rate between any two currencies. To the extent hedged by the use of currency contracts, the precise matching of
the currency contract amounts and the value of the securities involved will not generally be possible because the future value of such securities in foreign currencies will change as a consequence of market movements in the value of those securities between the date on which the contract is entered into and the date it matures. Furthermore, such transactions may reduce or preclude the opportunity for gain if the value of the currency should move in the direction opposite to the position taken. There is additional risk to the extent that currency contracts create exposure to currencies in which the Fund's securities are not denominated. Unanticipated changes in currency prices may result in poorer overall performance for the Fund than if it had not entered into such contracts. The use of currency contracts involves the risk of loss from the insolvency or bankruptcy of the counterparty to the contract or the failure of the counterparty to make payments or otherwise comply with the terms of the contract. A currency contract is marked-to-market daily and the change in market value is recorded by the Fund as unrealized gain or loss. The Fund records realized gains (losses) when the currency contract is closed equal to the difference between the value of the currency contract at the time it was opened and the value at the time it was closed.
FASB ASC 815, "Derivatives and Hedging" ("ASC 815"), is intended to improve financial reporting about derivative instruments by requiring enhanced disclosures to enable investors to better understand how and why the Fund uses derivative instruments, how these derivative instruments are accounted for and their effects on the Fund's financial position and results of operations.
The following tables set forth the fair value of the Fund's derivative contracts by primary risk exposure as of September 30, 2020:
| | | Asset Derivatives
Statement of Assets and
Liabilities Location | | Primary Risk
Exposure | | Value
(000) | |
Foreign Currency Forward
Exchange Contracts
| | Unrealized Appreciation on
Foreign Currency Forward
Exchange Contracts | |
Currency Risk | | $ | 806 | | |
Futures Contracts
| | Variation Margin on
Futures Contracts | | Interest Rate Risk | | | 208 | (a) | |
Swap Agreements
| | Variation Margin on
Swap Agreement | | Credit Risk | | | 250 | (a) | |
Total | | | | | | $ | 1,264 | | |
35
Morgan Stanley Institutional Fund Trust
Annual Report — September 30, 2020
Notes to Financial Statements (cont'd)
| | | Liability Derivatives
Statement of Assets and
Liabilities Location | | Primary Risk
Exposure | | Value
(000) | |
Foreign Currency Forward
Exchange Contracts
| | Unrealized Depreciation on
Foreign Currency Forward
Exchange Contracts | |
Currency Risk | | $ | (669 | ) | |
Futures Contracts
| | Variation Margin on
Futures Contracts | | Interest Rate Risk | | | (174 | )(a) | |
Swap Agreements
| | Variation Margin on
Swap Agreement | | Credit Risk | | | (384 | )(a) | |
Total | | | | | | $ | (1,227 | ) | |
(a) This amount represents the cumulative appreciation (depreciation) as reported in the Portfolio of Investments. The Statement of Assets and Liabilities only reflects the current day's net variation margin.
The following tables set forth by primary risk exposure the Fund's realized gains (losses) and change in unrealized appreciation (depreciation) by type of derivative contract for the year ended September 30, 2020 in accordance with ASC 815:
Realized Gain (Loss) | |
Primary Risk Exposure | | Derivative Type | | Value
(000) | |
Currency Risk | | Foreign Currency Forward
Exchange Contracts | | $ | (1,592 | ) | |
Interest Rate Risk | | Futures Contracts | | | 2,428 | | |
Credit Risk | | Swap Agreements | | | 1,009 | | |
| | | Total | | $ | 1,845 | | |
Change in Unrealized Appreciation (Depreciation) | |
Primary Risk Exposure | | Derivative Type | | Value
(000) | |
Currency Risk | | Foreign Currency Forward
Exchange Contracts | | $ | (497 | ) | |
Interest Rate Risk | | Futures Contracts | | | 254 | | |
Credit Risk | | Swap Agreements | | | (134 | ) | |
| | | Total | | $ | (377 | ) | |
At September 30, 2020, the Fund's derivative assets and liabilities are as follows:
Gross Amounts of Assets and Liabilities
Presented in the Statement of Assets and Liabilities | |
Derivatives(b) | | Assets(c)
(000) | | Liabilities(c)
(000) | |
Foreign Currency Forward Exchange Contracts | | $ | 806 | | | $ | (669 | ) | |
(b) Excludes exchange-traded derivatives.
(c) Absent an event of default or early termination, OTC derivative assets and liabilities are presented gross and not offset in the Statement of Assets and Liabilities.
The Fund typically enters into International Swaps and Derivatives Association, Inc. Master Agreements ("ISDA Master Agreements") or similar master agreements (collectively, "Master Agreements") with its contract counterparties for certain OTC derivatives in order to, among other things, reduce its credit risk to counterparties. ISDA Master Agreements include provisions for general obligations, representations, collateral and events
of default or termination. Under an ISDA Master Agreement, the Fund typically may offset with the counterparty certain OTC derivative financial instruments' payables and/or receivables with collateral held and/or posted and create one single net payment (close-out netting) in the event of default, termination and/or potential deterioration in the credit quality of the counterparty. Various Master Agreements govern the terms of certain transactions with counterparties, including transactions such as swap, forward, repurchase and reverse repurchase agreements. These Master Agreements typically attempt to reduce the counterparty risk associated with such transactions by specifying credit protection mechanisms and providing standardization that improves legal certainty. Cross-termination provisions under Master Agreements typically provide that a default in connection with one transaction between the Fund and a counterparty gives the non-defaulting party the right to terminate any other transactions in place with the defaulting party to create one single net payment due to/due from the defaulting party and may be a feature in certain Master Agreements. In the event the Fund exercises its right to terminate a Master Agreement after a counterparty experiences a termination event as defined in the Master Agreement, the return of collateral with market value in excess of the Fund's net liability may be delayed or denied.
The following table presents derivative financial instruments that are subject to enforceable netting arrangements as of September 30, 2020:
Gross Amounts Not Offset in the Statement of Assets and Liabilities | |
Counterparty | | Gross Asset
Derivatives
Presented in
the Statement of
Assets and
Liabilities
(000) | | Financial
Instrument
(000) | | Collateral
Received
(000)(d) | | Net Amount
(not less
than $0)
(000) | |
Australia And New Zealand
Banking Group | | $ | 121 | | | $ | — | | | $ | — | | | $ | 121 | | |
Barclays Bank PLC | | | 71 | | | | (39 | ) | | | — | | | | 32 | | |
Citibank NA | | | 334 | | | | (124 | ) | | | (210 | ) | | | 0 | | |
Goldman Sachs International | | | 164 | | | | — | | | | — | | | | 164 | | |
JPMorgan Chase Bank NA | | | 40 | | | | (1 | ) | | | — | | | | 39 | | |
UBS AG | | | 76 | | | | (76 | ) | | | — | | | | 0 | | |
Total | | $ | 806 | | | $ | (240 | ) | | $ | (210 | ) | | $ | 356 | | |
(d) In some instances, the actual collateral received may be more than the amount shown here due to overcollateralization.
36
Morgan Stanley Institutional Fund Trust
Annual Report — September 30, 2020
Notes to Financial Statements (cont'd)
Gross Amounts Not Offset in the Statement of Assets and Liabilities | |
Counterparty | | Gross Liability
Derivatives
Presented in
the Statement of
Assets and
Liabilities
(000) | | Financial
Instrument
(000) | | Collateral
Pledged
(000) | | Net Amount
(not less
than $0)
(000) | |
Bank of America NA | | $ | 43 | | | $ | — | | | $ | — | | | $ | 43 | | |
Barclays Bank PLC | | | 39 | | | | (39 | ) | | | — | | | | 0 | | |
BNP Paribas SA | | | 149 | | | | — | | | | — | | | | 149 | | |
Citibank NA | | | 124 | | | | (124 | ) | | | — | | | | 0 | | |
JPMorgan Chase Bank NA | | | 1 | | | | (1 | ) | | | — | | | | 0 | | |
UBS AG | | | 313 | | | | (76 | ) | | | — | | | | 237 | | |
Total | | $ | 669 | | | $ | (240 | ) | | $ | — | | | $ | 429 | | |
For the year ended September 30, 2020, the approximate average monthly amount outstanding for each derivative type is as follows:
Foreign Currency Forward Exchange Contracts: | |
Average monthly principal amount | | $ | 124,397,000 | | |
Futures Contracts: | |
Average monthly notional value | | $ | 323,287,000 | | |
Swap Agreements: | |
Average monthly notional amount | | $ | 10,245,000 | | |
5. Securities Lending: The Fund lends securities to qualified financial institutions, such as broker-dealers, to earn additional income. Any increase or decrease in the fair value of the securities loaned that might occur and any interest earned or dividends declared on those securities during the term of the loan would remain in the Fund. The Fund would receive cash or securities as collateral in an amount equal to or exceeding 100% of the current fair value of the loaned securities. The collateral is marked-to-market daily by State Street Bank and Trust Company ("State Street"), the securities lending agent, to ensure that a minimum of 100% collateral coverage is maintained.
Based on pre-established guidelines, the securities lending agent invests any cash collateral that is received in an affiliated money market portfolio and repurchase agreements. Securities lending income is generated from the earnings on the invested collateral and borrowing fees, less any rebates owed to the borrowers and compensation to the lending agent, and is recorded as "Income from Securities Loaned — Net" in the Fund's Statement of Operations. Risks in securities lending transactions are that a borrower may not provide additional collateral when required or return the securities when due, and that the value of the short-term investments will be less
than the amount of cash collateral plus any rebate that is required to be returned to the borrower.
The Fund has the right under the securities lending agreement to recover the securities from the borrower on demand.
The following table presents financial instruments that are subject to enforceable netting arrangements as of September 30, 2020:
Gross Amounts Not Offset in the Statement of Assets and Liabilities | |
Gross Asset
Amounts
Presented in the
Statement of
Assets and
Liabilities
(000) | | Financial
Instrument
(000) | | Collateral
Received
(000) | | Net Amount
(not less
than $0)
(000) | |
| $ | 6,455 | (e) | | $ | — | | | $ | (6,455 | )(f)(g) | | $ | 0 | | |
(e) Represents market value of loaned securities at year end.
(f) The Fund received cash collateral of approximately $5,536,000, which was subsequently invested in Morgan Stanley Institutional Liquidity Funds as reported in the Portfolio of Investments. In addition, the Fund received non-cash collateral of approximately $1,058,000 in the form of U.S. Government obligations, which the Fund cannot sell or repledge, and accordingly are not reflected in the Portfolio of Investments.
(g) The actual collateral received is greater than the amount shown here due to overcollateralization.
FASB ASC 860, "Transfers & Servicing: Repurchase-to-Maturity Transactions, Repurchase Financings, and Disclosures", is intended to provide increased transparency about the types of collateral pledged in securities lending transactions and other similar transactions that are accounted for as secured borrowing.
The following table displays a breakdown of transactions accounted for as secured borrowings, the gross obligations by class of collateral pledged and the remaining contractual maturity of those transactions as of September 30, 2020:
Remaining Contractual Maturity of the Agreements | |
| | | Overnight and
Continuous
(000) | | <30 days
(000) | | Between
30 &
90 days
(000) | | >90 days
(000) | | Total
(000) | |
Securities Lending
Transactions | |
Corporate Bonds | | $ | 4,747 | | | $ | — | | | $ | — | | | $ | — | | | $ | 4,747 | | |
Sovereign | | | 789 | | | | — | | | | — | | | | — | | | | 789 | | |
Total | | $ | 5,536 | | | $ | — | | | $ | — | | | $ | — | | | $ | 5,536 | | |
Total Borrowings | | $ | 5,536 | | | $ | — | | | $ | — | | | $ | — | | | $ | 5,536 | | |
Gross amount of
recognized liabilities
for securities lending
transactions | | | | | | | | | | $ | 5,536 | | |
37
Morgan Stanley Institutional Fund Trust
Annual Report — September 30, 2020
Notes to Financial Statements (cont'd)
6. When-Issued/Delayed Delivery Securities: The Fund purchases and sells when-issued and delayed delivery securities. Securities purchased on a when-issued or delayed delivery basis are purchased for delivery beyond the normal settlement date at a stated price and yield, and no income accrues to the Fund on such securities prior to delivery date. Payment and delivery for when-issued and delayed delivery securities can take place a month or more after the date of the transaction. When the Fund enters into a purchase transaction on a when-issued or delayed delivery basis, securities are available for collateral in an amount at least equal in value to the Fund's commitments to purchase such securities. Purchasing securities on a when-issued or delayed delivery basis may involve a risk that the market price at the time of delivery may be lower than the agreed upon purchase price, in which case there could be an unrealized loss at the time of delivery. Purchasing investments on a when-issued or delayed delivery basis may be considered a form of leverage which may increase the impact that gains (losses) may have on the Fund.
7. Indemnifications: The Trust enters into contracts that contain a variety of indemnifications. The Trust's maximum exposure under these arrangements is unknown. However, the Trust has not had prior claims or losses pursuant to these contracts and expects the risk of loss to be remote.
8. Dividends and Distributions to Shareholders: Dividends and distributions to shareholders are recorded on the ex-dividend date. Dividends from net investment income, if any, are declared and paid monthly. Net realized capital gains, if any, are distributed at least annually.
9. Security Transactions, Income and Expenses: Security transactions are accounted for on the trade date (date the order to buy or sell is executed). Realized gains and losses on the sale of investment securities are determined on the specific identified cost method. Dividend income and other distributions are recorded on the ex-dividend date (except for certain foreign dividends which may be recorded as soon as the Fund is informed of such dividends) net of applicable withholding taxes. Interest income is recognized on the accrual basis except where collection is in doubt. Discounts are accreted and premiums are amortized over the life of the respective securities.
Most expenses of the Trust can be directly attributed to a particular Fund. Expenses which cannot be directly attributed are apportioned among the Funds based upon relative net assets or other appropriate methods. Income, expenses (other than class specific expenses — distribution and shareholder services, transfer agency and sub transfer agency fees) and realized and unrealized gains or losses are allocated to each class of shares based upon their relative net assets.
B. Advisory Fees: The Adviser, a wholly-owned subsidiary of Morgan Stanley, provides the Fund with advisory services under the terms of an Investment Advisory Agreement, paid quarterly, at the annual rate based on the average daily net assets as follows:
First $1
billion | | Over $1
billion | |
| | 0.375 | % | | | 0.300 | % | |
For the year ended September 30, 2020, the advisory fee rate (net of waivers/rebate) was equivalent to an annual effective rate of 0.19% of the Fund's average daily net assets.
The Adviser has agreed to reduce its advisory fee and/or reimburse the Fund so that total annual Fund operating expenses, excluding certain investment related expenses, taxes, interest and other extraordinary expenses (including litigation), will not exceed 0.42% for Class I shares, 0.77% for Class A shares, 1.02% for Class L shares, 1.52% for Class C shares and 0.37% for Class IS shares. The fee waivers and/or expense reimbursements will continue for at least one year from the date of the Fund's prospectus or until such time as the Trustees act to discontinue all or a portion of such waivers and/or reimbursements when they deem such action is appropriate. For the year ended September 30, 2020, approximately $1,289,000 of advisory fees were waived and approximately $329,000 of other expenses were reimbursed by the Adviser pursuant to this arrangement.
C. Administration Fees: The Adviser also serves as Administrator to the Trust and provides administrative services pursuant to an Administration Agreement for an annual fee, accrued daily and paid monthly, of 0.08% of the Fund's average daily net assets. Under a Sub-Administration Agreement between the Administrator and State Street, State Street provides certain administrative services to the Trust. For such services, the Administrator pays State Street a portion of the fee the Administrator receives from the Fund.
38
Morgan Stanley Institutional Fund Trust
Annual Report — September 30, 2020
Notes to Financial Statements (cont'd)
D. Distribution and Shareholder Services Fees: Morgan Stanley Distribution, Inc. ("MSDI" or the "Distributor"), a wholly-owned subsidiary of the Adviser, and an indirect subsidiary of Morgan Stanley, serves as the Trust's Distributor of Fund shares pursuant to a Distribution Agreement. The Trust has adopted a Shareholder Services Plan with respect to Class A shares pursuant to Rule 12b-1 under the Act. Under the Shareholder Services Plan, the Fund pays the Distributor a shareholder services fee, accrued daily and paid monthly, at an annual rate of 0.25% of the Fund's average daily net assets attributable to Class A shares.
The Trust has adopted a Distribution and Shareholder Services Plan with respect to Class L shares pursuant to Rule 12b-1 under the Act. Under the Distribution and Shareholder Services Plan, the Fund pays the Distributor a distribution fee, accrued daily and paid monthly, at an annual rate of 0.25% and a shareholder services fee, accrued daily and paid monthly, at an annual rate of 0.25% of the Fund's average daily net assets attributable to Class L shares.
The Trust has adopted a Distribution and Shareholder Services Plan with respect to Class C shares pursuant to Rule 12b-1 under the Act. Under the Distribution and Shareholder Services Plan, the Fund pays the Distributor a distribution fee, accrued daily and paid monthly, at an annual rate of 0.75% and a shareholder services fee, accrued daily and paid monthly, at an annual rate of 0.25% of the Fund's average daily net assets attributable to Class C shares.
The distribution and shareholder services fees are used to support the expenses associated with servicing and maintaining accounts. The Distributor may compensate other parties for providing shareholder support services to investors who purchase Class A, Class L and Class C shares.
E. Dividend Disbursing and Transfer Agent: The Trust's dividend disbursing and transfer agent is DST Asset Manager Solutions, Inc. ("DST"). Pursuant to a Transfer Agency Agreement, the Trust pays DST a fee based on the number of classes, accounts and transactions relating to the Funds of the Trust.
F. Custodian Fees: State Street (the "Custodian") also serves as Custodian for the Trust in accordance with a Custodian Agreement. The Custodian holds cash, securities and other assets of the Trust as required by the Act. Custody fees are payable monthly based on assets held in custody, investment purchases and sales activity and account maintenance fees, plus reimbursement for certain out-of-pocket expenses.
G. Security Transactions and Transactions with Affiliates: For the year ended September 30, 2020, purchases and sales of investment securities for the Fund, other than long-term U.S. Government securities and short-term investments were approximately $653,794,000 and $372,705,000, respectively. For the year ended September 30, 2020, purchases and sales of long-term U.S. Government securities were approximately $1,840,548,000 and $1,809,093,000, respectively.
The Fund invests in the Institutional Class of the Morgan Stanley Institutional Liquidity Funds — Government Portfolio (the "Liquidity Funds"), an open-end management investment company managed by the Adviser, both directly and as a portion of the securities held as collateral on loaned securities. Advisory fees paid by the Fund are reduced by an amount equal to its pro-rata share of the advisory and administration fees paid by the Fund due to its investment in the Liquidity Funds. For the year ended September 30, 2020, advisory fees paid were reduced by approximately $153,000 relating to the Fund's investment in the Liquidity Funds.
A summary of the Fund's transactions in shares of affiliated investments during the year ended September 30, 2020 is as follows:
Affiliated
Investment
Company | | Value
September 30,
2019
(000) | | Purchases
at Cost
(000) | | Proceeds
from Sales
(000) | | Dividend
Income
(000) | |
Liquidity Funds | | $ | 57,949 | | | $ | 604,747 | | | $ | 502,689 | | | $ | 560 | | |
Affiliated
Investment
Company (cont'd) | | Realized
Gain (Loss)
(000) | | Change in
Unrealized
Appreciation
(Depreciation)
(000) | | Value
September 30,
2020
(000) | |
Liquidity Funds | | $ | — | | | $ | — | | | $ | 160,007 | | |
The Fund is permitted to purchase and sell securities ("cross-trade") from and to other Morgan Stanley funds as well as other funds and client accounts for which the Adviser or an affiliate of the Adviser serves as investment adviser, pursuant to procedures approved by the Trustees in compliance with Rule 17a-7 under the Act (the "Rule"). Each cross-trade is executed at the current market price in compliance with provisions of the Rule. For the year ended September 30, 2020, the Fund did not engage in any cross-trade transactions.
The Fund has an unfunded Deferred Compensation Plan (the "Compensation Plan"), which allows each independent Trustee to defer payment of all, or a portion, of the fees he or she receives for serving on the Board of Trustees. Each eligible Trustee generally may elect to have the deferred amounts credited with a return equal to the total return on one or more of
39
Morgan Stanley Institutional Fund Trust
Annual Report — September 30, 2020
Notes to Financial Statements (cont'd)
the Morgan Stanley funds that are offered as investment options under the Compensation Plan. Appreciation/depreciation and distributions received from these investments are recorded with an offsetting increase/decrease in the deferred compensation obligation and do not affect the NAV of the Fund.
H. Federal Income Taxes: It is the Fund's intention to continue to qualify as a regulated investment company and distribute all of its taxable and tax-exempt income. Accordingly, no provision for federal income taxes is required in the financial statements.
The Fund may be subject to taxes imposed by countries in which it invests. Such taxes are generally based on income and/or capital gains earned or repatriated. Taxes are accrued based on net investment income, net realized gains and net unrealized appreciation as such income and/or gains are earned. Taxes may also be based on transactions in foreign currency and are accrued based on the value of investments denominated in such currency.
FASB ASC 740-10, "Income Taxes — Overall", sets forth a minimum threshold for financial statement recognition of the benefit of a tax position taken or expected to be taken in a tax return. Management has concluded there are no significant uncertain tax positions that would require recognition in the financial statements. If applicable, the Fund recognizes interest accrued related to unrecognized tax benefits in "Interest Expense" and penalties in "Other Expenses" in the Statement of Operations. The Fund files tax returns with the U.S. Internal Revenue Service, New York and various states. Generally, each of the tax years in the four-year period ended September 30, 2020 remains subject to examination by taxing authorities.
The tax character of distributions paid may differ from the character of distributions shown for GAAP purposes due to short-term capital gains being treated as ordinary income for tax purposes. The tax character of distributions paid during fiscal years 2020 and 2019 was as follows:
2020
Distributions
Paid From: | | 2019
Distributions
Paid From: | |
Ordinary
Income
(000) | | Long-Term
Capital Gain
(000) | | Ordinary
Income
(000) | | Long-Term
Capital Gain
(000) | |
| $ | 21,516 | | | $ | 2,668 | | | $ | 14,473 | | | $ | — | | |
The amount and character of income and gains to be distributed are determined in accordance with income tax regulations
which may differ from GAAP. These book/tax differences are either considered temporary or permanent in nature.
Temporary differences are attributable to differing book and tax treatments for the timing of the recognition of gains (losses) on certain investment transactions and the timing of the deductibility of certain expenses.
The Fund had no permanent differences causing reclassifications among the components of net assets for the year ended September 30, 2020.
At September 30, 2020, the components of distributable earnings for the Fund on a tax basis were as follows:
Undistributed
Ordinary
Income
(000) | | Undistributed
Long-Term
Capital Gain
(000) | |
| $ | 25,539 | | | $ | 2,687 | | |
I. Credit Facility: The Trust and other Morgan Stanley funds participated in a $300,000,000 committed, unsecured revolving line of credit facility (the "Facility") with State Street. This Facility is to be used for temporary emergency purposes or funding of shareholder redemption requests. The interest rate on borrowings is based on the federal funds rate or 1 month LIBOR rate plus a spread. The Facility also has a commitment fee of 0.25% per annum based on the unused portion of the Facility. During the year ended September 30, 2020, the Fund did not have any borrowings under the Facility.
J. Other: At September 30, 2020, the Fund had record owners of 10% or greater. Investment activities of these shareholders could have a material impact on the Fund. The aggregate percentage of such owners was 46.4%.
K. Market Risk: Certain impacts to public health conditions particular to the coronavirus (COVID-19) outbreak could impact the operations and financial performance of certain of the Fund's investments. The extent of the impact to the financial performance of the Fund's investments will depend on future developments, including (i) the duration and spread of the outbreak, (ii) the restrictions and advisories, (iii) the effects on the financial markets, and (iv) the effects on the economy overall, all of which are highly uncertain and cannot be predicted. If the financial performance of the Fund's investments is impacted because of these factors for an extended period, the Fund's investment results may be adversely affected.
40
Morgan Stanley Institutional Fund Trust
Annual Report — September 30, 2020
Notes to Financial Statements (cont'd)
L. LIBOR Risk: The Fund's investments, payment obligations and financing terms may be based on floating rates, such as London Interbank Offer Rate ("LIBOR"), Euro Interbank Offered Rate and other similar types of reference rates (each, a "Reference Rate"). These Reference Rates are generally intended to represent the rate at which contributing banks may obtain short-term borrowings from each other within certain financial markets. On July 27, 2017, the Chief Executive of the UK Financial Conduct Authority ("FCA"), which regulates LIBOR, announced that the FCA will no longer persuade nor require banks to submit rates for the calculation of LIBOR and certain other Reference Rates after 2021. Such announcement indicates that the continuation of LIBOR and other Reference Rates on the current basis cannot and will not be guaranteed after the end of 2021. This announcement and any additional regulatory or market changes may have an adverse impact on the Fund or its investments.
In advance of 2022, regulators and market participants are currently engaged in identifying successor Reference Rates ("Alternative Reference Rates"). Additionally, prior to the end of 2021, it is expected that market participants will focus on the transition mechanisms by which the Reference Rates in existing contracts or instruments may be amended, whether through marketwide protocols, fallback contractual provisions, bespoke negotiations or amendments or otherwise. Nonetheless, the termination of certain Reference Rates presents risks to the Fund. At this time, it is not possible to completely identify or predict the effect of any such changes, any establishment of Alternative Reference Rates or any other reforms to Reference Rates that may be enacted in the UK or elsewhere. The elimination of a Reference Rate or any other changes or reforms to the determination or supervision of Reference Rates could have an adverse impact on the market for or value of any securities or payments linked to those Reference Rates and other financial obligations held by the Fund or on its overall financial condition or results of operations.
41
Morgan Stanley Institutional Fund Trust
Annual Report — September 30, 2020
Report of Independent Registered Public Accounting Firm
To the Shareholders and Board of Trustees of
Morgan Stanley Institutional Fund Trust —
Core Plus Fixed Income Portfolio
Opinion on the Financial Statements
We have audited the accompanying statement of assets and liabilities of Core Plus Fixed Income Portfolio (the "Fund") (one of the funds constituting Morgan Stanley Institutional Fund Trust (the "Trust")), including the portfolio of investments, as of September 30, 2020, and the related statement of operations for the year then ended, the statements of changes in net assets for each of the two years in the period then ended, the financial highlights for each of the five years in the period then ended and the related notes (collectively referred to as the "financial statements"). In our opinion, the financial statements present fairly, in all material respects, the financial position of the Fund (one of the funds constituting Morgan Stanley Institutional Fund Trust) at September 30, 2020, the results of its operations for the year then ended, the changes in its net assets for each of the two years in the period then ended and its financial highlights for each of the five years in the period then ended, in conformity with U.S. generally accepted accounting principles.
Basis for Opinion
These financial statements are the responsibility of the Trust's management. Our responsibility is to express an opinion on the Fund's financial statements based on our audits. We are a public accounting firm registered with the Public Company Accounting Oversight Board (United States) ("PCAOB") and are required to be independent with respect to the Trust in accordance with the U.S. federal securities law and the applicable rules and regulations of the Securities and Exchange Commission and the PCAOB.
We conducted our audits in accordance with the standards of the PCAOB. Those standards require that we plan and perform the audit to obtain reasonable assurance about whether the financial statements are free of material misstatement, whether due to error or fraud. The Trust is not required to have, nor were we engaged to perform, an audit of the Trust's internal control over financial reporting. As part of our audits we are required to obtain an understanding of internal control over financial reporting but not for the purpose of expressing an opinion on the effectiveness of the Trust's internal control over financial reporting. Accordingly, we express no such opinion.
Our audits included performing procedures to assess the risks of material misstatement of the financial statements, whether due to error or fraud, and performing procedures that respond to those risks. Such procedures included examining, on a test basis, evidence regarding the amounts and disclosures in the financial statements. Our procedures included confirmation of securities owned as of September 30, 2020 by correspondence with the custodian and brokers or by other appropriate auditing procedures where replies from brokers were not received. Our audits also included evaluating the accounting principles used and significant estimates made by management, as well as evaluating the overall presentation of the financial statements. We believe that our audits provide a reasonable basis for our opinion.

We have served as the auditor of one or more Morgan Stanley investment companies since 2000.
Boston, Massachusetts
November 24, 2020
42
Morgan Stanley Institutional Fund Trust
Annual Report — September 30, 2020
Investment Advisory Agreement Approval (unaudited)
Nature, Extent and Quality of Services
The Board reviewed and considered the nature and extent of the investment advisory services provided by the Adviser under the advisory agreement, including portfolio management, investment research and equity and fixed income securities trading. The Board also reviewed and considered the nature and extent of the non-advisory, administrative services provided by the Administrator under the administration agreement, including accounting, operations, clerical, bookkeeping, compliance, business management and planning, legal services and the provision of supplies, office space and utilities at the Adviser's expense. The Board also considered the Adviser's investment in personnel and infrastructure that benefits the Fund. (The Adviser and Administrator together are referred to as the "Adviser" and the advisory and administration agreements together are referred to as the "Management Agreement.") The Board also considered that the Adviser serves a variety of other investment advisory clients and has experience overseeing service providers. The Board also compared the nature of the services provided by the Adviser with similar services provided by non-affiliated advisers as prepared by Broadridge Financial Solutions, Inc. ("Broadridge").
The Board reviewed and considered the qualifications of the portfolio managers, the senior administrative managers and other key personnel of the Adviser who provide the advisory and administrative services to the Fund. The Board determined that the Adviser's portfolio managers and key personnel are well qualified by education and/or training and experience to perform the services in an efficient and professional manner. The Board concluded that the nature and extent of the advisory and administrative services provided were necessary and appropriate for the conduct of the business and investment activities of the Fund and supported its decision to approve the Management Agreement.
Performance, Fees and Expenses of the Fund
The Board reviewed the performance, fees and expenses of the Fund compared to its peers, as prepared by Broadridge, and to appropriate benchmarks where applicable. The Board discussed with the Adviser the performance goals and the actual results achieved in managing the Fund. When considering a fund's performance, the Board and the Adviser place emphasis on trends and longer-term returns (focusing on one-year, three-year and five-year performance, as of December 31, 2019, or since inception, as applicable). When a fund underperforms its benchmark and/or its peer group average, the Board and the Adviser discuss the causes of such underperformance and, where necessary, they discuss specific changes to investment strategy or investment personnel. The Board noted that the Fund's performance was better than its peer group average for the one-, three- and five-year periods. The Board discussed with the Adviser the level of the advisory and administration fees (together, the "management fee") for this Fund relative to comparable funds and/or other accounts advised by the Adviser and/or compared to its peers as prepared by Broadridge. In addition to the management fee, the Board also reviewed the Fund's total expense ratio. The Board noted that the Fund's contractual management fee was higher than but close to its peer group averages and actual management fee and total expense ratio were lower than its peer group averages. After discussion, the Board concluded that the Fund's performance, management fee and total expense ratio were competitive with its peer group averages.
Economies of Scale
The Board considered the size and growth prospects of the Fund and how that relates to the Fund's total expense ratio and particularly the Fund's management fee rate, which includes a breakpoint. In conjunction with its review of the Adviser's profitability, the Board discussed with the Adviser how a change in assets can affect the efficiency or effectiveness of managing the Fund and whether the management fee level is appropriate relative to current and projected asset levels and/or whether the management fee structure reflects economies of scale as asset levels change. The Board has determined that its review of the actual and/or potential economies of scale of the Fund supports its decision to approve the Management Agreement.
Profitability of the Adviser and Affiliates
The Board considered information concerning the costs incurred and profits realized by the Adviser and its affiliates during the last year from their relationship with the Fund and during the last two years from their relationship with the Morgan Stanley Fund Complex and reviewed with the Adviser the cost allocation methodology used to determine the profitability of the Adviser and affiliates. The Board has determined that its review of the analysis of the Adviser's expenses and profitability supports its decision to approve the Management Agreement.
43
Morgan Stanley Institutional Fund Trust
Annual Report — September 30, 2020
Investment Advisory Agreement Approval (unaudited) (cont'd)
Other Benefits of the Relationship
The Board considered other direct and indirect benefits to the Adviser and/or its affiliates derived from their relationship with the Fund and other funds advised by the Adviser. These benefits may include, among other things, fees for trading, distribution and/or shareholder servicing and for transaction processing and reporting platforms used by securities lending agents, and research received by the Adviser generated from commission dollars spent on funds' portfolio trading. The Board reviewed with the Adviser these arrangements and the reasonableness of the Adviser's costs relative to the services performed. The Board has determined that its review of the other benefits received by the Adviser or its affiliates supports its decision to approve the Management Agreement.
Resources of the Adviser and Historical Relationship Between the Fund and the Adviser
The Board considered whether the Adviser is financially sound and has the resources necessary to perform its obligations under the Management Agreement. The Board also reviewed and considered the historical relationship between the Fund and the Adviser, including the organizational structure of the Adviser, the policies and procedures formulated and adopted by the Adviser for managing the Fund's operations and the Board's confidence in the competence and integrity of the senior managers and key personnel of the Adviser. The Board concluded that the Adviser has the financial resources necessary to fulfill its obligations under the Management Agreement and that it is beneficial for the Fund to continue its relationship with the Adviser.
Other Factors and Current Trends
The Board considered the controls and procedures adopted and implemented by the Adviser and monitored by the Fund's Chief Compliance Officer and concluded that the conduct of business by the Adviser indicates a good faith effort on its part to adhere to high ethical standards in the conduct of the Fund's business.
As part of the Board's review, the Board received information from management on the impact of COVID-19 on the firm generally and the Adviser and the Fund in particular including, among other information, the pandemic's current and expected impact on the Fund's performance and operations.
General Conclusion
After considering and weighing all of the above factors, with various written materials and verbal information presented by the Adviser, the Board concluded that it would be in the best interest of the Fund and its shareholders to approve renewal of the Management Agreement for another year. In reaching this conclusion the Board did not give particular weight to any single piece of information or factor referenced above. The Board considered these factors and information over the course of the year and in numerous meetings, some of which were in executive session with only the independent Board members and their counsel present. It is possible that individual Board members may have weighed these factors, and the information presented, differently in reaching their individual decisions to approve the Management Agreement.
44
Morgan Stanley Institutional Fund Trust
Annual Report — September 30, 2020
Liquidity Risk Management Program (unaudited)
In compliance with Rule 22e-4 under the Investment Company Act of 1940, as amended (the "Liquidity Rule"), the Fund has adopted and implemented a liquidity risk management program (the "Program"), which is reasonably designed to assess and manage the risk that the Fund could not meet requests to redeem shares issued by the Fund without significant dilution of remaining investors' interests in the Fund (i.e., liquidity risk). The Fund's Board of Trustees (the "Board") previously approved the designation of the Liquidity Risk Subcommittee (the "LRS") as Program administrator. The LRS is comprised of representatives from various divisions within Morgan Stanley Investment Management.
At a meeting held on April 22-23, 2020, the Board reviewed a written report prepared by the LRS that addressed the Program's operation and assessed its adequacy, and effectiveness of implementation for the period from December 1, 2018, through December 31, 2019, as required under the Liquidity Rule. The report concluded that the Program operated effectively and was adequately and effectively implemented in all material aspects, and that the relevant controls and safeguards were appropriately designed to enable the LRS to administer the Program in compliance with the Liquidity Rule.
In accordance with the Program, the LRS assessed each Fund's liquidity risk no less frequently than annually taking into consideration certain factors, as applicable, such as (i) investment strategy and liquidity of portfolio investments, (ii) short-term and long-term cash flow projections and (iii) holdings of cash and cash equivalents and borrowing arrangements and other funding sources. Certain factors are considered under both normal and reasonably foreseeable stressed conditions.
Each Fund portfolio investment is classified into one of four liquidity categories, which classification is assessed at least monthly by the LRS. The classification is based on a determination of the number of days it is reasonably expected to take to convert the investment into cash, or sell or dispose of the investment, in current market conditions without significantly changing the market value of the investment. Liquidity classification determinations take into account various market, trading and investment-specific considerations, as well as market depth, and in some cases utilize third-party vendor data.
The Liquidity Rule limits a fund's investments in illiquid investments to 15% of its net assets and requires funds that do not primarily hold assets that are highly liquid investments to determine and maintain a minimum percentage of the fund's net assets to be invested in highly liquid investments (highly liquid investment minimum or "HLIM"). The LRS believes that the Program includes provisions reasonably designed to review, monitor and comply with the 15% limit on illiquid investments and for determining, periodically reviewing and complying with the HLIM requirement, as applicable.
There can be no assurance that the Program will achieve its objectives under all circumstances in the future. Please refer to the Fund's prospectus for more information regarding the Fund's exposure to liquidity risk and other risks to which it may be subject.
45
Morgan Stanley Institutional Fund Trust
Annual Report — September 30, 2020
Federal Tax Notice (unaudited)
For federal income tax purposes, the following information is furnished with respect to the distributions paid by the Fund during its taxable year ended September 30, 2020.
The Fund designated and paid approximately $2,668,000 as a long-term capital gain distribution.
For federal income tax purposes, the following information is furnished with respect to the Fund's earnings for its taxable year ended September 30, 2020. The Fund designated up to a maximum of approximately $6,442,000 as qualifying as interest-related dividends.
In January, the Fund provides tax information to shareholders for the preceding calendar year.
46
Morgan Stanley Institutional Fund Trust
Annual Report — September 30, 2020
Privacy Notice (unaudited) April 2019
FACTS | | WHAT DOES MSIM DO WITH YOUR PERSONAL INFORMATION? | |
Why? | | Financial companies choose how they share your personal information. Federal law gives consumers the right to limit some but not all sharing. Federal law also requires us to tell you how we collect, share, and protect your personal information. Please read this notice carefully to understand what we do. | |
What? | | The types of personal information we collect and share depend on the product or service you have with us. This information can include:
n Social Security number and income
n investment experience and risk tolerance
n checking account number and wire transfer instructions | |
How? | | All financial companies need to share customers' personal information to run their everyday business. In the section below, we list the reasons financial companies can share their customers' personal information; the reasons MSIM chooses to share; and whether you can limit this sharing. | |
Reasons we can share your personal information | | Does MSIM share? | | Can you limit this sharing? | |
For our everyday business purposes —
such as to process your transactions, maintain your account(s), respond to court orders and legal investigations, or report to credit bureaus | | Yes | | No | |
For our marketing purposes —
to offer our products and services to you | | Yes | | No | |
For joint marketing with other financial companies | | No | | We don't share | |
For our affiliates' everyday business purposes —
information about your transactions and experiences | | Yes | | No | |
For our affiliates' everyday business purposes —
information about your creditworthiness | | No | | We don't share | |
For our affiliates to market to you | | No | | We don't share | |
For non-affiliates to market to you | | No | | We don't share | |
Questions? Call toll-free (844) 312-6327 or email: imprivacyinquiries@morganstanley.com
47
Morgan Stanley Institutional Fund Trust
Annual Report — September 30, 2020
Privacy Notice (unaudited) (cont'd) April 2019
Who we are
Who is providing this notice? | | Morgan Stanley Investment Management, Inc. and its affiliated registered investment advisers, registered broker-dealers, and registered and unregistered funds ("MSIM") | |
What we do
How does MSIM protect my personal information? | | To protect your personal information from unauthorized access and use, we use security measures that comply with federal law. These measures include computer safeguards and secured files and buildings. We have policies governing the proper handling of customer information by personnel and requiring third parties that provide support to adhere to appropriate security standards with respect to such information. | |
How does MSIM collect my personal information? | | We collect your personal information, for example, when you
n open an account or make deposits or withdrawals from your account
n buy securities from us or make a wire transfer
n give us your contact information
We also collect your personal information from others, such as credit bureaus, affiliates, or other companies. | |
Why can't I limit all sharing? | | Federal law gives you the right to limit only
n sharing for affiliates' everyday business purposes — information about your creditworthiness
n affiliates from using your information to market to you
n sharing for non-affiliates to market to you
State laws and individual companies may give you additional rights to limit sharing. See below for more on your rights under state law. | |
Definitions
Affiliates | | Companies related by common ownership or control. They can be financial and non-financial companies.
n Our affilies include companies with a Morgan Stanley name and financial companies such as Morgan Stanley Smith Barney LLC and Morgan Stanley & Co. | |
Non-affiliates | | Companies not related by common ownership or control. They can be financial and non-financial companies.
n MSIM does not share with non-affiliates so they can market to you. | |
Joint marketing | | A formal agreement between non-affiliated financial companies that together market financial products or services to you.
n MSIM doesn't jointly market | |
Other Important Information
Vermont: Except as permitted by law, we will not share personal information we collect about Vermont residents with Non-affiliates unless you provide us with your written consent to share such information.
California: Except as permitted by law, we will not share personal information we collect about California residents with Non-affiliates and we will limit sharing such personal information with our Affiliates to comply with California privacy laws that apply to us.
48
Morgan Stanley Institutional Fund Trust
Annual Report — September 30, 2020
Trustee and Officer Information (unaudited)
Independent Trustees:
Name, Address and Birth Year
of Independent Trustee | | Position(s)
Held with
Registrant | | Length of Time
Served* | | Principal Occupation(s) During Past 5 Years
and Other Relevant Professional Experience | | Number of
Funds in
Fund Complex
Overseen by
Independent
Trustee** | | Other Directorships
Held by Independent
Trustee*** | |
Frank L. Bowman
c/o Perkins Coie LLP
Counsel to the Independent Trustees
1155 Avenue of the Americas, 22nd Floor
New York, NY 10036
Birth Year 1944 | | Trustee | | Since
August
2006 | | President, Strategic Decisions, LLC (consulting) (since February 2009); Director or Trustee of various Morgan Stanley Funds (since August 2006); Chairperson of the Compliance and Insurance Committee (since October 2015); formerly, Chairperson of the Insurance Sub-Committee of the Compliance and Insurance Committee (2007-2015); served as President and Chief Executive Officer of the Nuclear Energy Institute (policy organization) (February 2005-November 2008); retired as Admiral, U.S. Navy after serving over 38 years on active duty including 8 years as Director of the Naval Nuclear Propulsion Program in the Department of the Navy and the U.S. Department of Energy (1996-2004); served as Chief of Naval Personnel (July 1994-September 1996) and on the Joint Staff as Director of Political Military Affairs (June 1992-July 1994); knighted as Honorary Knight Commander of the Most Excellent Order of the British Empire; awarded the Officier de l'Orde National du Mérite by the French Government; elected to the National Academy of Engineering (2009). | | 86 | | Director of Naval and Nuclear Technologies LLP; Director Emeritus of the Armed Services YMCA; Member of the National Security Advisory Council of the Center for U.S. Global Engagement and a member of the CNA Military Advisory Board; Trustee of Fairhaven United Methodist Church; Member of the Board of Advisors of the Dolphin Scholarship Foundation; Director of other various non-profit organizations; Formerly, Director of BP p.l.c. (November 2010-May 2019). | |
Kathleen A. Dennis
c/o Perkins Coie LLP
Counsel to the Independent Trustees
1155 Avenue of the Americas, 22nd Floor
New York, NY 10036
Birth Year 1953 | | Trustee | | Since
August
2006 | | President, Cedarwood Associates (mutual fund and investment management consulting) (since July 2006); Chairperson of the Liquidity and Alternatives Sub-Committee of the Investment Committee (since October 2006) and Director or Trustee of various Morgan Stanley Funds (since August 2006); formerly, Senior Managing Director of Victory Capital Management (1993-2006). | | 86 | | Director of various non-profit organizations. | |
Nancy C. Everett
c/o Perkins Coie LLP
Counsel to the Independent Trustees
1155 Avenue of the Americas, 22nd Floor
New York, NY 10036
Birth Year 1955 | | Trustee | | Since
January
2015 | | Chief Executive Officer, Virginia Commonwealth University Investment Company (since November 2015); Owner, OBIR, LLC (institutional investment management consulting) (since June 2014); formerly, Managing Director, BlackRock, Inc. (February 2011-December 2013); and Chief Executive Officer, General Motors Asset Management (a/k/a Promark Global Advisors, Inc.) (June 2005-May 2010). | | 87 | | Formerly, Member of Virginia Commonwealth University School of Business Foundation (2005-2016); Member of Virginia Commonwealth University Board of Visitors (2013-2015); Member of Committee on Directors for Emerging Markets Growth Fund, Inc. (2007-2010); Chairperson of Performance Equity Management, LLC (2006-2010); and Chairperson, GMAM Absolute Return Strategies Fund, LLC (2006-2010). | |
49
Morgan Stanley Institutional Fund Trust
Annual Report — September 30, 2020
Trustee and Officer Information (unaudited) (cont'd)
Independent Trustees: (cont'd)
Name, Address and Birth Year
of Independent Trustee | | Position(s)
Held with
Registrant | | Length of Time
Served* | | Principal Occupation(s) During Past 5 Years
and Other Relevant Professional Experience | | Number of
Funds in
Fund Complex
Overseen by
Independent
Trustee** | | Other Directorships
Held by Independent
Trustee*** | |
Jakki L. Haussler
c/o Perkins Coie LLP
Counsel to the Independent Trustees
1155 Avenue of the Americas, 22nd Floor
New York, NY 10036
Birth Year 1957 | | Trustee | | Since
January
2015 | | Chairman, Opus Capital Group (since January 1996); formerly, Chief Executive Officer, Opus Capital Group (1996-2019); Director, Capvest Venture Fund, LP (May 2000-December 2011); Partner, Adena Ventures, LP (July 1999-December 2010); Director, The Victory Funds (February 2005-July 2008). | | 87 | | Director of Service Corporation International and Member, Audit Committee and Investment Committee; Director of Cincinnati Bell Inc. and Member, Audit Committee and Governance and Nominating Committee; Director of Northern Kentucky University Foundation and Member, Investment Committee; Member of Chase College of Law Transactional Law Practice Center Board of Advisors; Director of Chase College of Law Board of Visitors; formerly, Member, University of Cincinnati Foundation Investment Committee; Member, Miami University Board of Visitors (2008-2011); Trustee of Victory Funds (2005-2008) and Chairman, Investment Committee (2007-2008); Member, Service Provider Committee (2005-2008) and Director of Best Transport (2006-2019). | |
Dr. Manuel H. Johnson
c/o Johnson Smick
International, Inc.
220 I Street, NE — Suite 200 Washington, D.C. 20002
Birth Year 1949 | | Trustee | | Since
July
1991 | | Senior Partner, Johnson Smick International, Inc. (consulting firm); Chairperson of the Investment Committee (since October 2006) and Director or Trustee of various Morgan Stanley Funds (since July 1991); Co-Chairman and a founder of the Group of Seven Council (G7C) (international economic commission); formerly, Chairperson of the Audit Committee (July 1991-September 2006), Vice Chairman of the Board of Governors of the Federal Reserve System and Assistant Secretary of the U.S. Treasury. | | 86 | | Director of NVR, Inc. (home construction). | |
Joseph J. Kearns
c/o Perkins Coie LLP
Counsel to the Independent Trustees
1155 Avenue of the Americas, 22nd Floor
New York, NY 10036
Birth Year 1942 | | Trustee | | Since
August
1994 | | Senior Adviser, Kearns & Associates LLC (investment consulting); Chairperson of the Audit Committee (since October 2006) and Director or Trustee of various Morgan Stanley Funds (since August 1994); Director, Rubicorn Investments (since February 2019); formerly, Deputy Chairperson of the Audit Committee (July 2003-September 2006) and Chairperson of the Audit Committee of various Morgan Stanley Funds (since August 1994); CFO of the J. Paul Getty Trust (1982-1999). | | 87 | | Prior to August 10, 2016, Director of Electro Rent Corporation (equipment leasing); Prior to December 31, 2013, Director of The Ford Family Foundation. | |
50
Morgan Stanley Institutional Fund Trust
Annual Report — September 30, 2020
Trustee and Officer Information (unaudited) (cont'd)
Independent Trustees: (cont'd)
Name, Address and Birth Year
of Independent Trustee | | Position(s)
Held with
Registrant | | Length of Time
Served* | | Principal Occupation(s) During Past 5 Years
and Other Relevant Professional Experience | | Number of
Funds in
Fund Complex
Overseen by
Independent
Trustee** | | Other Directorships
Held by Independent
Trustee*** | |
Michael F. Klein
c/o Perkins Coie LLP
Counsel to the Independent Trustees
1155 Avenue of the Americas, 22nd Floor
New York, NY 10036
Birth Year 1958 | | Trustee | | Since
August
2006 | | Managing Director, Aetos Alternatives Management, LP (since March 2000); Co-President, Aetos Alternatives Management, LP (since January 2004) and Co-Chief Executive Officer of Aetos Alternatives Management, LP (since August 2013); Chairperson of the Fixed Income Sub-Committee of the Investment Committee (since October 2006) and Director or Trustee of various Morgan Stanley Funds (since August 2006); formerly, Managing Director, Morgan Stanley & Co. Inc. and Morgan Stanley Dean Witter Investment Management and President, various Morgan Stanley Funds (June 1998-March 2000); Principal, Morgan Stanley & Co. Inc. and Morgan Stanley Dean Witter Investment Management (August 1997-December 1999). | | 86 | | Director of certain investment funds managed or sponsored by Aetos Alternatives Management, LP; Director of Sanitized AG and Sanitized Marketing AG (specialty chemicals). | |
Patricia Maleski
c/o Perkins Coie LLP
Counsel to the Independent Trustees
1155 Avenue of the Americas, 22nd Floor
New York, NY 10036
Birth Year 1960 | | Trustee | | Since
January
2017 | | Managing Director, JPMorgan Asset Management (2004-2016); Oversight and Control Head of Fiduciary and Conflicts of Interest Program (2015-2016); Chief Control Officer-Global Asset Management (2013-2015); President, JPMorgan Funds (2010-2013); Chief Administrative Officer (2004-2013); various other positions including Treasurer and Board Liaison (since 2001). | | 87 | | None. | |
W. Allen Reed
c/o Perkins Coie LLP
Counsel to the Independent Trustees
1155 Avenue of the Americas, 22nd Floor
New York, NY 10036
Birth Year 1947 | | Chair of the Board and Trustee | | Chair of the Boards since August 2020 and Trustee since August 2006 | | Chair of the Boards of various Morgan Stanley Funds (since August 2020); Chairperson of the Governance Committee; Chairperson of the Equity Sub-Committee of the Investment Committee (since October 2006) and Director or Trustee of various Morgan Stanley Funds (since August 2006); formerly, Vice Chair of the Boards of various Morgan Stanley Funds (January 2020-August 2020); President and Chief Executive Officer of General Motors Asset Management; Chairman and Chief Executive Officer of the GM Trust Bank and Corporate Vice President of General Motors Corporation (August 1994-December 2005). | | 86 | | Formerly, Director of Legg Mason, Inc. (2006-2019); and Director of the Auburn University Foundation (2010-2015). | |
* This is the earliest date the Trustee began serving the Morgan Stanley Funds. Each Trustee serves an indefinite term, until his or her successor is elected.
** The Fund Complex includes (as of December 31, 2019) all open-end and closed-end funds (including all of their portfolios) advised by Morgan Stanley Investment Management Inc. (the "Adviser") and any funds that have an adviser that is an affiliated person of the Adviser (including, but not limited to, Morgan Stanley AIP GP LP).
*** This includes any directorships at public companies and registered investment companies held by the Trustee at any time during the past five years.
51
Morgan Stanley Institutional Fund Trust
Annual Report — September 30, 2020
Trustee and Officer Information (unaudited) (cont'd)
Executive Officers:
Name, Address and Birth Year
of Executive Officer | | Position(s) Held
with
Registrant | | Length of
Time Served* | | Principal Occupation(s) During Past 5 Years | |
John H. Gernon
522 Fifth Avenue
New York, NY 10036
Birth Year 1963 | | President and Principal Executive Officer | | Since September 2013 | | President and Principal Executive Officer of the Equity and Fixed Income Funds and the Morgan Stanley AIP Funds (since September 2013) and the Liquidity Funds and various money market funds (since May 2014) in the Fund Complex; Managing Director of the Adviser; Head of Public Markets Product Development (since 2006). | |
Timothy J. Knierim
522 Fifth Avenue
New York, NY 10036
Birth Year 1959 | | Chief Compliance Officer | | Since December 2016 | | Managing Director of the Adviser and various entities affiliated with the Adviser; Chief Compliance Officer of various Morgan Stanley Funds and the Adviser (since December 2016) and Chief Compliance Officer of Morgan Stanley AIP GP LP (since 2014). Formerly, Managing Director and Deputy Chief Compliance Officer of the Adviser (2014-2016); and formerly, Chief Compliance Officer of Prudential Investment Management, Inc. (2007-2014). | |
Francis J. Smith
522 Fifth Avenue
New York, NY 10036
Birth Year 1965 | | Treasurer and Principal Financial Officer | | Treasurer since July 2003 and Principal Financial Officer since September 2002 | | Managing Director of the Adviser and various entities affiliated with the Adviser; Treasurer (since July 2003) and Principal Financial Officer of various Morgan Stanley Funds (since September 2002). | |
Mary E. Mullin
522 Fifth Avenue
New York, NY 10036
Birth Year 1967 | | Secretary | | Since
June
1999 | | Managing Director of the Adviser; Secretary of various Morgan Stanley Funds (since June 1999). | |
Michael J. Key
522 Fifth Avenue
New York, NY 10036
Birth Year 1979 | | Vice President | | Since
June
2017 | | Vice President of the Equity and Fixed Income Funds, Liquidity Funds, various money market funds and the Morgan Stanley AIP Funds in the Fund Complex (since June 2017); Executive Director of the Adviser; Head of Product Development for Equity and Fixed Income Funds (since August 2013). | |
* This is the earliest date the officer began serving the Morgan Stanley Funds. Each officer serves a one-year term, until his or her successor is elected and qualifies.
52
Morgan Stanley Institutional Fund Trust
Annual Report — September 30, 2020
Adviser and Administrator
Morgan Stanley Investment Management Inc.
522 Fifth Avenue
New York, New York 10036
Distributor
Morgan Stanley Distribution, Inc.
522 Fifth Avenue
New York, New York 10036
Dividend Disbursing and Transfer Agent
DST Asset Manager Solutions, Inc.
2000 Crown Colony Drive
Quincy, Massachusetts 02169
Custodian
State Street Bank and Trust Company
One Lincoln Street
Boston, Massachusetts 02111
Legal Counsel
Dechert LLP
1095 Avenue of the Americas
New York, New York 10036
Counsel to the Independent Trustees
Perkins Coie LLP
1155 Avenue of the Americas,
22nd Floor
New York, New York 10036
Independent Registered Public Accounting Firm
Ernst & Young LLP
200 Clarendon Street
Boston, Massachusetts 02116
Reporting to Shareholders
Each Morgan Stanley fund provides a complete schedule of portfolio holdings in its Semi-Annual and the Annual Reports within 60 days of the end of the fund's second and fourth fiscal quarters. The Semi-Annual and Annual Reports are filed electronically with the Securities and Exchange Commission ("SEC") on Form N-CSRS and Form N-CSR, respectively. Morgan Stanley also delivers the Semi-Annual and Annual Reports to fund shareholders and makes these reports available on its public website, www.morganstanley.com/im/shareholderreports. Each Morgan Stanley non-money market fund also files a complete schedule of portfolio holdings with the SEC for the fund's first and third fiscal quarters as an attachment to Form N-PORT. Morgan Stanley does not deliver the reports for the first and third fiscal quarters to shareholders, nor are the reports posted to the Morgan Stanley public website. However, the holdings for each money market fund are posted to the Morgan Stanley public website. You may obtain the Form N-PORT filings (as well as the Form N-CSR and N-CSRS filings) by accessing the SEC's website, www.sec.gov. You can also request copies of these materials, upon payment of a duplicating fee, by electronic request at the SEC's email address (publicinfo@sec.gov).
Proxy Voting Policies and Procedures and Proxy Voting Record
You may obtain a copy of the Trust's Proxy Voting Policy and Procedures and information regarding how the Trust voted proxies relating to portfolio securities during the most recent twelve-month period ended June 30, without charge, upon request, by calling toll free 1 (800) 548-7786 or by visiting our website at www.morganstanley.com/im/shareholderreports. This information is also available on the SEC's website at www.sec.gov.
This report is authorized for distribution only when preceded or accompanied by a prospectus or summary prospectus of the applicable Fund of Morgan Stanley Institutional Fund Trust, which describes in detail the Fund's investment policies, risks, fees and expenses. Please read the prospectus carefully before you invest or send money. For additional information, including information regarding the investments comprising the Fund, please visit our website at www.morganstanley.com/im/shareholderreports or call toll free 1 (800) 548-7786.
53
Printed in U.S.A.
This Report has been prepared for shareholders and may be distributed to others only if preceded or accompanied by a current prospectus.
Morgan Stanley Investment Management Inc.
522 Fifth Avenue
New York, New York 10036
© 2020 Morgan Stanley. Morgan Stanley Distribution, Inc.

IFTCPFIANN
3298732 EXP 11.30.21

Morgan Stanley Institutional Fund Trust
Corporate Bond Portfolio
Annual Report
September 30, 2020
Beginning on January 1, 2021, as permitted by regulations adopted by the Securities and Exchange Commission ("SEC"), paper copies of the Fund's Annual and Semi-Annual Reports to Shareholders ("Shareholder Reports") will no longer be sent by mail, unless you specifically request paper copies of the Shareholder Reports from the Fund or from your financial intermediary, such as a broker-dealer or a bank. Instead, the Shareholder Reports will be made available on the Fund's website, https://www.morganstanley.com/im/shareholderreports and you will be notified by mail each time a Shareholder Report is posted and provided with a website link to access the Shareholder Report. If you already elected to receive Shareholder Reports electronically, you will not be affected by this change and you need not take any action. You may elect to receive Shareholder Reports and other communications from the Fund electronically anytime by contacting your financial intermediary or, if you are a direct investor, please follow the instructions on the envelope.
Beginning on January 1, 2019, you may elect to receive all future Shareholder Reports in paper free of charge. If you invest through a financial intermediary, you can contact your financial intermediary to request that you continue to receive paper copies of your Shareholder Reports. If you invest directly with the Fund, please follow the instructions on the envelope to let the Fund know you wish to continue receiving paper copies of your Shareholder Reports. Your election to receive Shareholder Reports in paper will apply to all funds held in your account if you invest through your financial intermediary or all funds held with the fund complex if you invest directly with a fund.

Morgan Stanley Institutional Fund Trust
Annual Report — September 30, 2020
Shareholders' Letter | | | 2 | | |
Expense Example | | | 3 | | |
Investment Overview | | | 4 | | |
Portfolio of Investments | | | 7 | | |
Statement of Assets and Liabilities | | | 15 | | |
Statement of Operations | | | 17 | | |
Statements of Changes in Net Assets | | | 18 | | |
Financial Highlights | | | 19 | | |
Notes to Financial Statements | | | 23 | | |
Report of Independent Registered Public Accounting Firm | | | 34 | | |
Investment Advisory Agreement Approval | | | 35 | | |
Liquidity Risk Management Program | | | 37 | | |
Privacy Notice | | | 38 | | |
Trustee and Officer Information | | | 40 | | |
This report is authorized for distribution only when preceded or accompanied by a prospectus or summary prospectus of the applicable Fund of the Morgan Stanley Institutional Fund Trust. To receive a prospectus and/or statement of additional information ("SAI"), which contains more complete information such as investment objectives, charges, expenses, policies for voting proxies, risk considerations and describes in detail each of the Fund's investment policies to the prospective investor, please call toll free 1 (800) 548-7786. Please read the prospectuses carefully before you invest or send money.
Additionally, you can access information about the Fund, including performance, characteristics and investment team commentary, through Morgan Stanley Investment Management's website: www.morganstanley.com/im/shareholderreports.
Market forecasts provided in this report may not necessarily come to pass. There is no guarantee that any sectors mentioned will continue to perform as discussed herein or that securities in such sectors will be held by the Fund in the future. There is no assurance that a fund will achieve its investment objective. Funds are subject to market risk, which is the possibility that market values of securities owned by the Fund will decline and, therefore, the value of the Fund's shares may be less than what you paid for them. Accordingly, you can lose money investing in this Fund. Please see the prospectus for more complete information on investment risks.
1
Morgan Stanley Institutional Fund Trust
Annual Report — September 30, 2020
Shareholders' Letter (unaudited)
Dear Shareholders,
We are pleased to provide this Annual Report, in which you will learn how your investment in Corporate Bond Portfolio (the "Fund") performed during the latest twelve-month period.
Morgan Stanley Investment Management is a client-centric, investor-led organization. Our global presence, intellectual capital, and breadth of products and services enable us to partner with investors to meet the evolving challenges of today's financial markets. We aim to deliver superior investment service and to empower our clients to make the informed decisions that help them reach their investment goals.
As always, we thank you for selecting Morgan Stanley Investment Management, and look forward to working with you in the months and years ahead.
Sincerely,

John H. Gernon
President and Principal Executive Officer
October 2020
2
Morgan Stanley Institutional Fund Trust
Annual Report — September 30, 2020
Expense Example (unaudited)
Corporate Bond Portfolio
As a shareholder of the Fund, you may incur two types of costs: (1) transactional costs, including sales charge (loads) on purchase payments; and (2) ongoing costs, which may include advisory fees, administration fees, distribution and shareholder services fees; and other Fund expenses. This example is intended to help you understand your ongoing costs (in dollars) of investing in the Fund and to compare these costs with the ongoing costs of investing in other mutual funds.
This example is based on an investment of $1,000 invested at the beginning of the six-month period ended September 30, 2020 and held for the entire six-month period.
Actual Expenses
The table below provides information about actual account values and actual expenses. You may use the information in this table, together with the amount you invested, to estimate the expenses that you paid over the period. Simply divide your account value by $1,000 (for example, an $8,600 account value divided by $1,000 = 8.6), then multiply the result by the number in the table under the heading entitled "Actual Expenses Paid During Period" to estimate the expenses you paid on your account during this period.
Hypothetical Example for Comparison Purposes
The table below provides information about hypothetical account values and hypothetical expenses based on the Fund's actual expense ratio and an assumed rate of return of 5% per year before expenses, which is not the Fund's actual return. The hypothetical account values and expenses may not be used to estimate the actual ending account balance or expenses you paid for the period. You may use this information to compare the ongoing costs of investing in the Fund and other funds. To do so, compare this 5% hypothetical example with the 5% hypothetical examples that appear in the shareholder reports of the other funds.
Please note that the expenses shown in the table are meant to highlight your ongoing costs only and do not reflect any transactional costs, such as sales charges (loads, if applicable). Therefore, the information for each class in the table is useful in comparing ongoing costs only, and will not help you determine the relative total costs of owning different funds. In addition, if these transactional costs were included, your costs would have been higher.
| | | Beginning
Account
Value
4/1/20 | | Actual Ending
Account
Value
9/30/20 | | Hypothetical
Ending Account
Value | | Actual
Expenses
Paid
During
Period* | | Hypothetical
Expenses Paid
During Period* | | Net
Expense
Ratio
During
Period** | |
Corporate Bond Portfolio Class I | | $ | 1,000.00 | | | $ | 1,120.40 | | | $ | 1,021.50 | | | $ | 3.71 | | | $ | 3.54 | | | | 0.70 | % | |
Corporate Bond Portfolio Class A | | | 1,000.00 | | | | 1,117.60 | | | | 1,019.85 | | | | 5.45 | | | | 5.20 | | | | 1.03 | | |
Corporate Bond Portfolio Class L | | | 1,000.00 | | | | 1,116.50 | | | | 1,017.95 | | | | 7.46 | | | | 7.11 | | | | 1.41 | | |
Corporate Bond Portfolio Class C | | | 1,000.00 | | | | 1,114.20 | | | | 1,016.00 | | | | 9.51 | | | | 9.07 | | | | 1.80 | | |
* Expenses are calculated using each Fund Class' annualized net expense ratio (as disclosed), multiplied by the average account value over the period and multiplied by 183/366 (to reflect the most recent one-half year period).
** Annualized.
3
Morgan Stanley Institutional Fund Trust
Annual Report — September 30, 2020
Investment Overview (unaudited)
Corporate Bond Portfolio
The Fund seeks above-average total return over a market cycle of three to five years.
Performance
For the fiscal year ended September 30, 2020, the Fund's Class I shares had a total return based on net asset value and reinvestment of distributions per share of 8.19%, net of fees. The Fund's Class I shares outperformed against the Fund's benchmark, the Bloomberg Barclays U.S. Corporate Index (the "Index"), which returned 7.90%.
Factors Affecting Performance
• The final quarter of 2019 provided a remarkable ending to a remarkable year. The world's issues seemed to vanish as financial markets rallied. Credit markets enjoyed meaningful tightening in their spreads. The Index spread fell 22 basis points (bps) to end December 2019 at 93 bps over government bonds, its tightest level of the year (and 60 bps tighter than where they started the year).i Risk was rewarded, as lower quality and longer maturity bonds performed the best. The key drivers of tighter spreads were (1) a reported agreement on a U.S.-China "phase one" trade deal, (2) a victory for the Tories in the U.K. election reducing Brexit uncertainty, (3) macroeconomic data continuing a stabilization trend, (4) minimal negative corporate news, and (5) low supply in a period of strong demand.
• The virus-induced economic shutdown and the decline in oil prices hit credit markets with a double whammy in the first quarter of 2020, leading to historically poor performance of corporate bonds. The Index spread widened by 179 bps to end March 2020 at 272 bps over government bonds.i The stressed liquidity conditions in the market could be seen in the flattening of the spread curve, as shorter maturity corporate bonds, which are often viewed as a cash surrogate, widened the most. The 1- to 3-year portion of the Index widened by 218 bps, versus "only" 138 bps for long-maturity corporate bonds in the first quarter of 2020.i BBB-rated bonds underperformed their higher-rated counterparts, as worries about ratings downgrades to high yield credit swept the market.
• Markets enjoyed a historic bounce back in the second quarter of 2020, after a volatile COVID-19
and lockdown-driven first quarter. Equities rallied and credit spreads moved tighter. Spreads on the Index ended the second quarter at 150 bps over government bonds, after gapping as wide as 373 bps on March 23, 2020, during the peak of the crisis.i Spreads were only 57 bps wider in the year-to-date through June 30, 2020.i During the second quarter, financials outperformed non-financials, and a continued theme of beta compression helped BBB-rated bonds outperform A-rated credits. Additionally, given the Federal Reserve's (Fed) support to stabilize the credit markets amid coronavirus-related impacts, the short end of the yield curve outperformed the long end.
• The market continued to recover during the third quarter of 2020, though it ran out of steam in September amid a pickup in virus cases and uncertainty surrounding the prospect of another stimulus package ahead of the U.S. election. The Index tightened 14 bps in the third quarter to end at 136 bps over government bonds.i The Index produced total returns of 1.54% during the third quarter, bringing year-to-date returns to 6.64%. Lower quality outperformed as BBB-rated bonds tightened 21 bps.i Third quarter 2020 investment grade bond issuance was $371 billion, up 17% year-over-year.ii This increase was primarily driven by the strong issuance activity observed in August and September 2020, which offset the slowdown in July. Third quarter 2020 supply was down sharply from $692 billion in the second quarter of 2020 and $480 billion in the first quarter of 2020.ii Nevertheless, year-to-date through September 2020, investment grade bond issuance reached $1.54 trillion, which is $290 billion above the prior full-year record high of $1.25 trillion.ii We would note that the first wave of supply specifically addressed liquidity needs, while the second wave of supply was driven by issuers taking advantage of improving market conditions and historically low rates.
• In terms of positioning, we have not actively changed the portfolio's key risk positions. As of September 30, 2020, the Fund is positioned to be modestly underweight credit risk as a whole. The portfolio's largest overweight remains financials, which contributed positively to returns over the period. The Fund's underweight positioning to the consumer non-cyclical and capital goods sectors also
i Source: Bloomberg Barclays.
ii Source: JP Morgan. Data as September 30, 2020.
4
Morgan Stanley Institutional Fund Trust
Annual Report — September 30, 2020 (unaudited)
Investment Overview (cont'd)
Corporate Bond Portfolio
contributed positively to returns. Overall positioning in energy and communications detracted from returns, as did exposure to airlines.
• Small allocations to off-index sectors also contributed significantly over the period. The Fund's allocation to high yield bonds contributed positively to returns as several fallen angels rallied over the period. Exposure to convertible bonds was also particularly beneficial as convertible bond performance has been a leader among fixed income categories, largely due to the rise in equity volatility. As volatility rises, embedded equity options become more valuable.
• While we had reduced BBB-rated industrial exposure back in 2019 on valuation grounds, recently we have been selectively increasing our exposure to this space at attractive valuations. In addition, while high-level exposures may not look very different, we were quite active at a more idiosyncratic security level. We were very active in the new issue market, especially in the second quarter of 2020 when supply was especially elevated and new issue concessions remained higher.
Management Strategies
• We remain cautiously optimistic on investment grade corporate debt on the back of continued global monetary and fiscal policy accommodation. On the other hand, our relatively constructive view is tempered by less compelling valuations, increased volatility due to the upcoming U.S. presidential election, and some setbacks on the fight against the pandemic, as evidenced in increasing case counts in Europe and stricter lockdown measures imposed in several countries. Our base case reflects the consensus view that the coronavirus is transitory and monetary policy is credit risk friendly, likely driving spreads tighter in the medium term and offering investors yield advantages but limited capital gain.
5
Morgan Stanley Institutional Fund Trust
Annual Report — September 30, 2020 (unaudited)
Investment Overview (cont'd)
Corporate Bond Portfolio
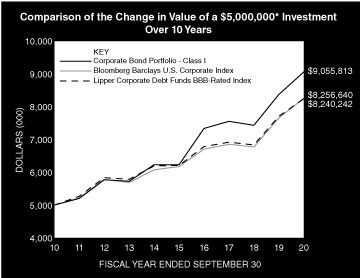
* Minimum Investment
In accordance with SEC regulations, the Fund's performance shown assumes that all recurring fees (including management fees) were deducted and all dividends and distributions were reinvested. The performance of Class A, Class L and Class C shares will vary from the performance of Class I shares based upon their different inception dates and will be negatively impacted by additional fees assessed to those classes.
Performance Compared to the Bloomberg Barclays U.S. Corporate Index(1) and the Lipper Corporate Debt Funds BBB-Rated Index(2)
| | | Period Ended September 30, 2020
Total Returns(3) | |
| | | | | Average Annual | |
| | | One
Year | | Five
Years | | Ten
Years | | Since
Inception(8) | |
Fund — Class I Shares
w/o sales charges(4) | | | 8.19 | % | | | 7.77 | % | | | 6.12 | % | | | 6.51 | % | |
Fund — Class A Shares
w/o sales charges(5) | | | 7.88 | | | | 7.43 | | | | 5.84 | | | | 4.86 | | |
Fund — Class A Shares with
maximum 3.25% sales charges(5) | | | 4.38 | | | | 6.72 | | | | 5.49 | | | | 4.67 | | |
Fund — Class L Shares
w/o sales charges(6) | | | 7.47 | | | | 7.05 | | | | 5.47 | | | | 5.27 | | |
Fund — Class C Shares
w/o sales charges(7) | | | 7.09 | | | | 6.60 | | | | — | | | | 5.40 | | |
Fund — Class C Shares with
maximum 1.00% deferred
sales charges(7) | | | 6.09 | | | | 6.60 | | | | — | | | | 5.40 | | |
Bloomberg Barclays
U.S. Corporate Index | | | 7.90 | | | | 5.98 | | | | 5.14 | | | | 6.89 | | |
Lipper Corporate Debt Funds
BBB-Rated Index | | | 6.95 | | | | 5.83 | | | | 5.12 | | | | 6.49 | | |
Performance data quoted represents past performance, which is no guarantee of future results, and current performance may be lower or higher than the figures shown. Performance assumes that all dividends and distributions, if any, were reinvested. For the most recent month-end performance figures, please visit www.morganstanley.com/im/shareholderreports. Investment returns and principal value will fluctuate so that Fund shares, when redeemed, may be worth more or less than their original cost. Total returns do not reflect the deduction of taxes that a shareholder would pay on Fund distributions or the redemption of Fund shares. Performance of share classes will vary due to differences in sales charges and expenses.
(1) The Bloomberg Barclays U.S. Corporate Index is a broad-based benchmark that measures the investment grade, U.S. dollar-denominated, fixed rate, taxable corporate bond market. It includes USD-denominated securities publicly issued by U.S. and non-U.S. industrial, utility and financial issuers that meet specified maturity, liquidity and quality requirements.The Index is unmanaged and its returns do not include any sales charges or fees. Such costs would lower performance. It is not possible to invest directly in an index.
(2) The Lipper Corporate Debt Funds BBB-Rated Index is an equally weighted performance index of the largest qualifying funds (based on net assets) in the Lipper Corporate Debt Funds BBB-Rated Funds classification. The Index, which is adjusted for capital gains distributions and income dividends, is unmanaged and should not be considered an investment. There are currently 30 funds represented in this Index. As of the date of this report, the Fund was in the Lipper Corporate Debt Funds BBB-Rated Funds classification.
(3) Total returns for the Fund reflect expenses waived and/or reimbursed, if applicable, by the Adviser and Distributor. Without such waivers and/or reimbursements, total returns would have been lower.
(4) Commenced operations on August 31, 1990.
(5) Commenced offering on May 20, 2002.
(6) Commenced offering on June 16, 2008.
(7) Commenced offering on April 30, 2015.
(8) For comparative purposes, average annual since inception returns listed for the Indexes refer to the inception date of Class I of the Fund, not the inception of the Indexes.
6
Morgan Stanley Institutional Fund Trust
Annual Report — September 30, 2020
Portfolio of Investments
Corporate Bond Portfolio
| | | Face
Amount
(000) | | Value
(000) | |
Fixed Income Securities (96.1%) | |
Corporate Bonds (96.1%) | |
Communications (0.2%) | |
Vodafone Group PLC | |
5.13%, 6/19/59 | | $ | 250 | | | $ | 321 | | |
Energy (0.4%) | |
Equinor ASA | |
3.70%, 4/6/50 | | | 300 | | | | 346 | | |
Midwest Connector Capital Co. LLC | |
3.63%, 4/1/22 (a)(b) | | | 375 | | | | 378 | | |
| | | | 724 | | |
Finance (35.3%) | |
Aflac, Inc., | |
3.60%, 4/1/30 | | | 350 | | | | 412 | | |
Air Lease Corp., | |
2.50%, 3/1/21 | | | 650 | | | | 654 | | |
3.75%, 6/1/26 | | | 600 | | | | 611 | | |
Alexandria Real Estate Equities, Inc., | |
1.88%, 2/1/33 | | | 325 | | | | 319 | | |
American Express Co., | |
4.20%, 11/6/25 | | | 550 | | | | 638 | | |
American International Group, Inc., | |
4.25%, 3/15/29 | | | 300 | | | | 352 | | |
Aon Corp., | |
2.20%, 11/15/22 | | | 300 | | | | 311 | | |
2.80%, 5/15/30 | | | 500 | | | | 543 | | |
Arch Capital Group Ltd., | |
3.64%, 6/30/50 | | | 300 | | | | 324 | | |
Avolon Holdings Funding Ltd., | |
2.88%, 2/15/25 (a) | | | 550 | | | | 505 | | |
Banco de Credito del Peru | |
2.70%, 1/11/25 (a) | | | 325 | | | | 339 | | |
Banco Santander Chile | |
2.70%, 1/10/25 (a) | | | 425 | | | | 449 | | |
Bank of America Corp., | |
2.59%, 4/29/31 | | | 400 | | | | 427 | | |
2.68%, 6/19/41 | | | 1,436 | | | | 1,474 | | |
3.19%, 7/23/30 | | | 125 | | | | 138 | | |
4.24%, 4/24/38 | | | 341 | | | | 416 | | |
4.25%, 10/22/26 | | | 475 | | | | 551 | | |
7.75%, 5/14/38 | | | 175 | | | | 290 | | |
Barclays PLC | |
2.85%, 5/7/26 | | | 1,225 | | | | 1,275 | | |
BBVA USA, | |
2.50%, 8/27/24 | | | 325 | | | | 339 | | |
3.50%, 6/11/21 | | | 975 | | | | 993 | | |
Belrose Funding Trust | |
2.33%, 8/15/30 (a) | | | 1,200 | | | | 1,189 | | |
Berkshire Hathaway Finance Corp., | |
1.85%, 3/12/30 | | | 475 | | | | 498 | | |
BNP Paribas SA | |
4.40%, 8/14/28 (a) | | | 850 | | | | 998 | | |
| | | Face
Amount
(000) | | Value
(000) | |
| BPCE SA | |
5.15%, 7/21/24 (a) | | $ | 1,025 | | | $ | 1,150 | | |
Brookfield Finance LLC | |
3.45%, 4/15/50 | | | 250 | | | | 245 | | |
Brookfield Finance, Inc., | |
3.90%, 1/25/28 | | | 325 | | | | 362 | | |
4.00%, 4/1/24 | | | 300 | | | | 331 | | |
4.85%, 3/29/29 | | | 150 | | | | 179 | | |
Brown & Brown, Inc., | |
2.38%, 3/15/31 | | | 650 | | | | 655 | | |
4.20%, 9/15/24 | | | 325 | | | | 359 | | |
Capital One Financial Corp., | |
3.30%, 10/30/24 | | | 1,625 | | | | 1,763 | | |
3.75%, 3/9/27 | | | 125 | | | | 139 | | |
Chubb INA Holdings, Inc., | |
1.38%, 9/15/30 | | | 1,050 | | | | 1,040 | | |
Citigroup, Inc., | |
1.68%, 5/15/24 | | | 375 | | | | 384 | | |
2.57%, 6/3/31 | | | 225 | | | | 236 | | |
2.67%, 1/29/31 | | | 1,674 | | | | 1,766 | | |
2.98%, 11/5/30 | | | 428 | | | | 463 | | |
4.45%, 9/29/27 | | | 1,025 | | | | 1,190 | | |
CNO Financial Group, Inc., | |
5.25%, 5/30/29 | | | 260 | | | | 301 | | |
Commerzbank AG | |
8.13%, 9/19/23 (a) | | | 550 | | | | 625 | | |
Credit Agricole SA | |
4.13%, 1/10/27 (a) | | | 250 | | | | 287 | | |
Credit Suisse Group AG | |
2.59%, 9/11/25 (a) | | | 675 | | | | 705 | | |
Crown Castle International Corp., | |
4.15%, 7/1/50 | | | 200 | | | | 229 | | |
3.30%, 7/1/30 | | | 575 | | | | 630 | | |
CubeSmart | |
2.00%, 2/15/31 | | | 775 | | | | 766 | | |
CyrusOne LP/CyrusOne Finance Corp., | |
2.90%, 11/15/24 | | | 100 | | | | 106 | | |
Danske Bank A/S, | |
3.00%, 9/20/22 (a) | | | 425 | | | | 433 | | |
5.00%, 1/12/23 (a) | | | 200 | | | | 210 | | |
Deutsche Bank AG, | |
3.15%, 1/22/21 | | | 625 | | | | 629 | | |
3.70%, 5/30/24 | | | 100 | | | | 105 | | |
Discover Financial Services | |
3.95%, 11/6/24 | | | 625 | | | | 688 | | |
Duke Realty LP | |
1.75%, 7/1/30 | | | 775 | | | | 773 | | |
Equitable Financial Life Global Funding | |
1.40%, 7/7/25 - 8/27/27 (a) | | | 1,000 | | | | 1,016 | | |
ERP Operating LP | |
4.63%, 12/15/21 | | | 600 | | | | 624 | | |
Federal Realty Investment Trust | |
3.63%, 8/1/46 | | | 225 | | | | 225 | | |
The accompanying notes are an integral part of the financial statements.
7
Morgan Stanley Institutional Fund Trust
Annual Report — September 30, 2020
Portfolio of Investments (cont'd)
Corporate Bond Portfolio
| | | Face
Amount
(000) | | Value
(000) | |
Finance (cont'd) | |
Five Corners Funding Trust II | |
2.85%, 5/15/30 (a) | | $ | 750 | | | $ | 807 | | |
GE Capital International Funding Co.,
Unlimited Co., | |
4.42%, 11/15/35 | | | 486 | | | | 514 | | |
General Electric Co., | |
MTN | |
5.88%, 1/14/38 | | | 400 | | | | 469 | | |
Global Atlantic Fin Co., | |
4.40%, 10/15/29 (a) | | | 925 | | | | 965 | | |
GLP Capital LP/GLP Financing II, Inc., | |
4.00%, 1/15/30 | | | 350 | | | | 363 | | |
Goldman Sachs Group, Inc. (The), | |
3.69%, 6/5/28 | | | 250 | | | | 281 | | |
MTN | |
4.80%, 7/8/44 | | | 275 | | | | 361 | | |
6.75%, 10/1/37 | | | 950 | | | | 1,383 | | |
Grupo Aval Ltd., | |
4.38%, 2/4/30 (a) | | | 625 | | | | 604 | | |
Hartford Financial Services Group, Inc. (The), | |
2.80%, 8/19/29 | | | 775 | | | | 843 | | |
High Street Funding Trust I | |
4.11%, 2/15/28 (a) | | | 850 | | | | 980 | | |
HSBC Holdings PLC | |
2.63%, 11/7/25 | | | 625 | | | | 652 | | |
4.29%, 9/12/26 | | | 750 | | | | 838 | | |
4.38%, 11/23/26 | | | 625 | | | | 690 | | |
ING Groep N.V., | |
4.63%, 1/6/26 (a) | | | 1,000 | | | | 1,175 | | |
Intercontinental Exchange, Inc., | |
1.85%, 9/15/32 | | | 950 | | | | 949 | | |
Itau Unibanco Holding SA | |
2.90%, 1/24/23 (a) | | | 850 | | | | 861 | | |
JPMorgan Chase & Co., | |
2.52%, 4/22/31 | | | 175 | | | | 187 | | |
2.96%, 5/13/31 | | | 1,200 | | | | 1,291 | | |
3.70%, 5/6/30 | | | 2,450 | | | | 2,816 | | |
JPMorgan Chase Bank NA | |
0.00%, 8/7/22 | | | 200 | | | | 254 | | |
Kemper Corp., | |
2.40%, 9/30/30 | | | 500 | | | | 496 | | |
Kilroy Realty LP | |
2.50%, 11/15/32 | | | 200 | | | | 195 | | |
3.05%, 2/15/30 | | | 150 | | | | 157 | | |
Kimco Realty Corp., | |
3.70%, 10/1/49 | | | 275 | | | | 271 | | |
LeasePlan Corp., | |
2.88%, 10/24/24 (a) | | | 675 | | | | 697 | | |
Lloyds Banking Group PLC | |
3.57%, 11/7/28 | | | 425 | | | | 466 | | |
Macquarie Bank Ltd., | |
3.62%, 6/3/30 (a) | | | 800 | | | | 852 | | |
| | | Face
Amount
(000) | | Value
(000) | |
Marsh & McLennan Cos., Inc., | |
2.25%, 11/15/30 | | $ | 875 | | | $ | 917 | | |
MDC GMTN BV | |
4.50%, 11/7/28 (a) | | | 425 | | | | 510 | | |
MetLife, Inc., | |
5.88%, 2/6/41 | | | 350 | | | | 511 | | |
Metropolitan Life Global Funding I | |
2.95%, 4/9/30 (a) | | | 350 | | | | 393 | | |
National Australia Bank Ltd., | |
2.33%, 8/21/30 (a)(b) | | | 850 | | | | 843 | | |
National Securities Clearing Corp., | |
1.50%, 4/23/25 (a) | | | 450 | | | | 464 | | |
Nationwide Building Society | |
4.30%, 3/8/29 (a) | | | 275 | | | | 311 | | |
4.36%, 8/1/24 (a) | | | 500 | | | | 543 | | |
Oversea-Chinese Banking Corp. Ltd., | |
1.83%, 9/10/30 (a)(b) | | | 390 | | | | 390 | | |
Pine Street Trust I | |
4.57%, 2/15/29 (a) | | | 375 | | | | 436 | | |
PNC Financial Services Group, Inc. (The), | |
2.20%, 11/1/24 | | | 675 | | | | 715 | | |
Progressive Corp. (The), | |
3.20%, 3/26/30 | | | 450 | | | | 516 | | |
4.00%, 3/1/29 | | | 75 | | | | 91 | | |
Prologis LP | |
1.25%, 10/15/30 | | | 1,050 | | | | 1,029 | | |
Quicken Loans LLC/
Quicken Loans Co-Issuer, Inc., | |
3.88%, 3/1/31 (a) | | | 290 | | | | 287 | | |
Royal Bank of Scotland Group PLC | |
3.88%, 9/12/23 | | | 1,075 | | | | 1,154 | | |
Santander UK Group Holdings PLC | |
4.80%, 11/15/24 | | | 575 | | | | 634 | | |
Santander UK PLC | |
5.00%, 11/7/23 (a) | | | 369 | | | | 404 | | |
Shinhan Bank Co., Ltd., | |
4.00%, 4/23/29 (a) | | | 600 | | | | 676 | | |
Shinhan Financial Group Co. Ltd., | |
1.35%, 1/10/26 (a) | | | 460 | | | | 461 | | |
Societe Generale SA | |
2.63%, 1/22/25 (a) | | | 625 | | | | 645 | | |
| SVB Financial Group | |
3.13%, 6/5/30 | | | 400 | | | | 447 | | |
Synchrony Financial | |
4.25%, 8/15/24 | | | 175 | | | | 190 | | |
Syngenta Finance N.V., | |
4.89%, 4/24/25 (a) | | | 300 | | | | 325 | | |
TD Ameritrade Holding Corp., | |
3.30%, 4/1/27 | | | 325 | | | | 365 | | |
Transurban Finance Co. Pty Ltd., | |
2.45%, 3/16/31 (a) | | | 800 | | | | 817 | | |
UnitedHealth Group, Inc., | |
3.70%, 8/15/49 | | | 700 | | | | 839 | | |
The accompanying notes are an integral part of the financial statements.
8
Morgan Stanley Institutional Fund Trust
Annual Report — September 30, 2020
Portfolio of Investments (cont'd)
Corporate Bond Portfolio
| | | Face
Amount
(000) | | Value
(000) | |
Finance (cont'd) | |
Wells Fargo & Co., | |
2.41%, 10/30/25 | | $ | 225 | | | $ | 236 | | |
2.57%, 2/11/31 | | | 475 | | | | 500 | | |
2.88%, 10/30/30 | | | 525 | | | | 565 | | |
3.07%, 4/30/41 | | | 525 | | | | 552 | | |
| | | | 69,842 | | |
Industrials (51.5%) | |
Abbott Laboratories | |
1.15%, 1/30/28 | | | 1,125 | | | | 1,135 | | |
AbbVie, Inc., | |
3.20%, 11/21/29 (a) | | | 1,525 | | | | 1,687 | | |
4.25%, 11/21/49 (a) | | | 700 | | | | 835 | | |
Activision Blizzard, Inc., | |
2.50%, 9/15/50 | | | 425 | | | | 398 | | |
Adobe, Inc., | |
2.30%, 2/1/30 | | | 525 | | | | 566 | | |
Air Products and Chemicals, Inc., | |
2.80%, 5/15/50 | | | 425 | | | | 456 | | |
Airbus SE | |
0.00%, 6/14/21 | | EUR | 300 | | | | 350 | | |
Akamai Technologies, Inc., | |
0.38%, 9/1/27 | | $ | 344 | | | | 400 | | |
Aker BP ASA | |
4.75%, 6/15/24 (a) | | | 575 | | | | 591 | | |
Alaska Airlines 2020-1 Class A Pass
Through Trust | |
4.80%, 2/15/29 (a) | | | 325 | | | | 342 | | |
Alphabet, Inc., | |
1.10%, 8/15/30 | | | 475 | | | | 474 | | |
Altria Group, Inc., | |
3.88%, 9/16/46 | | | 175 | | | | 180 | | |
Amazon.com, Inc., | |
2.50%, 6/3/50 | | | 325 | | | | 334 | | |
4.25%, 8/22/57 | | | 500 | | | | 685 | | |
American Airlines Pass-Through Trust, | |
Series AA | |
3.15%, 8/15/33 | | | 676 | | | | 641 | | |
Amgen, Inc., | |
2.45%, 2/21/30 | | | 675 | | | | 717 | | |
2.77%, 9/1/53 (a) | | | 200 | | | | 193 | | |
4.66%, 6/15/51 | | | 25 | | | | 33 | | |
Anheuser-Busch Cos. LLC/Anheuser-Busch
InBev Worldwide, Inc., | |
3.65%, 2/1/26 | | | 425 | | | | 477 | | |
Anheuser-Busch InBev Worldwide, Inc., | |
4.60%, 4/15/48 | | | 150 | | | | 179 | | |
5.55%, 1/23/49 | | | 1,100 | | | | 1,484 | | |
Anthem, Inc., | |
2.38%, 1/15/25 | | | 275 | | | | 293 | | |
3.65%, 12/1/27 | | | 450 | | | | 513 | | |
Apple, Inc., | |
2.95%, 9/11/49 | | | 1,100 | | | | 1,209 | | |
| | | Face
Amount
(000) | | Value
(000) | |
APT Pipelines Ltd., | |
4.20%, 3/23/25 (a) | | $ | 300 | | | $ | 331 | | |
AstraZeneca PLC | |
1.38%, 8/6/30 | | | 525 | | | | 512 | | |
AT&T, Inc., | |
2.25%, 2/1/32 | | | 1,225 | | | | 1,230 | | |
3.30%, 2/1/52 | | | 225 | | | | 215 | | |
3.50%, 9/15/53 (a) | | | 445 | | | | 432 | | |
3.55%, 9/15/55 (a) | | | 177 | | | | 172 | | |
3.65%, 9/15/59 (a) | | | 778 | | | | 768 | | |
4.50%, 3/9/48 | | | 22 | | | | 25 | | |
Automatic Data Processing, Inc., | |
1.25%, 9/1/30 | | | 850 | | | | 841 | | |
Aviation Capital Group LLC | |
4.38%, 1/30/24 (a) | | | 475 | | | | 473 | | |
BAT Capital Corp., | |
3.56%, 8/15/27 | | | 675 | | | | 730 | | |
3.73%, 9/25/40 | | | 525 | | | | 529 | | |
BEST BUY Co., Inc., | |
1.95%, 10/1/30 | | | 625 | | | | 622 | | |
Boeing Co. (The), | |
3.25%, 2/1/35 | | | 150 | | | | 141 | | |
3.90%, 5/1/49 | | | 225 | | | | 208 | | |
3.95%, 8/1/59 | | | 175 | | | | 159 | | |
5.15%, 5/1/30 | | | 500 | | | | 563 | | |
Booking Holdings, Inc., | |
0.90%, 9/15/21 | | | 225 | | | | 240 | | |
Boston Scientific Corp., | |
2.65%, 6/1/30 | | | 975 | | | | 1,037 | | |
BP Capital Markets PLC | |
4.38%, 12/31/99 (c) | | | 500 | | | | 522 | | |
4.88%, 12/31/99 (c) | | | 525 | | | | 563 | | |
Braskem Netherlands Finance BV | |
4.50%, 1/31/30 (a) | | | 340 | | | | 318 | | |
Bristol-Myers Squibb Co., | |
3.40%, 7/26/29 | | | 575 | | | | 671 | | |
4.25%, 10/26/49 | | | 75 | | | | 99 | | |
4.35%, 11/15/47 | | | 125 | | | | 166 | | |
Broadcom, Inc., | |
4.15%, 11/15/30 | | | 650 | | | | 732 | | |
Burlington Northern Santa Fe LLC | |
4.40%, 3/15/42 | | | 75 | | | | 94 | | |
4.55%, 9/1/44 | | | 610 | | | | 798 | | |
Campbell Soup Co. | |
3.13%, 4/24/50 | | | 450 | | | | 457 | | |
Canadian National Railway Co., | |
2.45%, 5/1/50 | | | 375 | | | | 374 | | |
Canadian Natural Resources Ltd., | |
2.95%, 1/15/23 | | | 650 | | | | 676 | | |
Caterpillar, Inc., | |
3.25%, 9/19/49 | | | 225 | | | | 253 | | |
The accompanying notes are an integral part of the financial statements.
9
Morgan Stanley Institutional Fund Trust
Annual Report — September 30, 2020
Portfolio of Investments (cont'd)
Corporate Bond Portfolio
| | | Face
Amount
(000) | | Value
(000) | |
Industrials (cont'd) | |
Charter Communications Operating LLC/
Charter Communications Operating Capital | |
2.80%, 4/1/31 | | $ | 375 | | | $ | 391 | | |
5.75%, 4/1/48 | | | 275 | | | | 344 | | |
Chevron Corp., | |
2.24%, 5/11/30 | | | 750 | | | | 798 | | |
Cigna Corp., | |
2.40%, 3/15/30 | | | 375 | | | | 390 | | |
3.05%, 10/15/27 | | | 150 | | | | 167 | | |
3.88%, 10/15/47 | | | 125 | | | | 139 | | |
4.80%, 7/15/46 | | | 125 | | | | 157 | | |
Cimarex Energy Co., | |
3.90%, 5/15/27 | | | 475 | | | | 479 | | |
4.38%, 3/15/29 (b) | | | 425 | | | | 440 | | |
Clorox Co. (The), | |
1.80%, 5/15/30 | | | 525 | | | | 542 | | |
Coca-Cola Femsa SAB de CV | |
2.75%, 1/22/30 | | | 600 | | | | 640 | | |
Comcast Corp., | |
1.95%, 1/15/31 | | | 575 | | | | 593 | | |
2.80%, 1/15/51 | | | 375 | | | | 382 | | |
3.75%, 4/1/40 | | | 175 | | | | 206 | | |
4.05%, 11/1/52 | | | 725 | | | | 895 | | |
4.25%, 1/15/33 | | | 375 | | | | 467 | | |
Conagra Brands, Inc., | |
4.85%, 11/1/28 | | | 375 | | | | 459 | | |
Concho Resources, Inc., | |
4.85%, 8/15/48 | | | 250 | | | | 275 | | |
Cummins, Inc., | |
2.60%, 9/1/50 | | | 375 | | | | 369 | | |
CVS Health Corp., | |
1.75%, 8/21/30 | | | 275 | | | | 269 | | |
3.75%, 4/1/30 | | | 787 | | | | 900 | | |
5.05%, 3/25/48 | | | 200 | | | | 256 | | |
5.13%, 7/20/45 | | | 75 | | | | 95 | | |
Daimler Finance North America LLC | |
2.70%, 6/14/24 (a) | | | 325 | | | | 344 | | |
Dell International LLC/EMC Corp., | |
4.90%, 10/1/26 (a) | | | 750 | | | | 849 | | |
Delta Air Lines, Inc., | |
Series AA | |
3.20%, 10/25/25 | | | 450 | | | | 450 | | |
3.63%, 3/15/22 | | | 475 | | | | 467 | | |
Diamond Sports Group LLC/Diamond
Sports Finance Co., | |
6.63%, 8/15/27 (a) | | | 200 | | | | 104 | | |
Diamondback Energy, Inc., | |
3.25%, 12/1/26 | | | 700 | | | | 703 | | |
Dollar General Corp., | |
4.13%, 4/3/50 | | | 325 | | | | 387 | | |
DP World PLC | |
5.63%, 9/25/48 (a) | | | 500 | | | | 572 | | |
| | | Face
Amount
(000) | | Value
(000) | |
DuPont de Nemours, Inc., | |
5.32%, 11/15/38 | | $ | 225 | | | $ | 286 | | |
Embraer Netherlands Finance BV | |
5.40%, 2/1/27 | | | 330 | | | | 314 | | |
Enbridge, Inc. | |
3.13%, 11/15/29 | | | 150 | | | | 160 | | |
Energy Transfer Operating LP | |
5.00%, 5/15/50 | | | 175 | | | | 163 | | |
Enterprise Products Operating LLC | |
3.95%, 1/31/60 | | | 125 | | | | 124 | | |
4.20%, 1/31/50 | | | 575 | | | | 613 | | |
4.80%, 2/1/49 | | | 250 | | | | 290 | | |
Equinix, Inc., | |
1.55%, 3/15/28 (d) | | | 600 | | | | 602 | | |
Exxon Mobil Corp., | |
3.10%, 8/16/49 | | | 200 | | | | 205 | | |
Fiserv, Inc., | |
2.65%, 6/1/30 | | | 250 | | | | 270 | | |
Ford Motor Credit Co., LLC | |
4.39%, 1/8/26 | | | 725 | | | | 718 | | |
Fortune Brands Home & Security, Inc., | |
4.00%, 9/21/23 | | | 475 | | | | 520 | | |
Fox Corp., | |
5.58%, 1/25/49 | | | 225 | | | | 312 | | |
General Mills, Inc., | |
2.88%, 4/15/30 | | | 925 | | | | 1,017 | | |
General Motors Co., | |
6.60%, 4/1/36 | | | 325 | | | | 396 | | |
6.75%, 4/1/46 | | | 150 | | | | 185 | | |
General Motors Financial Co., Inc., | |
3.85%, 1/5/28 | | | 75 | | | | 79 | | |
4.35%, 1/17/27 | | | 175 | | | | 190 | | |
Georgia-Pacific LLC | |
2.30%, 4/30/30 (a) | | | 675 | | | | 718 | | |
Glencore Funding LLC | |
2.50%, 9/1/30 (a) | | | 600 | | | | 585 | | |
4.13%, 3/12/24 (a) | | | 325 | | | | 353 | | |
Global Payments, Inc., | |
2.90%, 5/15/30 | | | 725 | | | | 777 | | |
Grifols SA | |
2.25%, 11/15/27 (a) | | EUR | 200 | | | | 234 | | |
HCA, Inc., | |
5.50%, 6/15/47 | | $ | 350 | | | | 435 | | |
Home Depot, Inc. (The), | |
2.95%, 6/15/29 | | | 300 | | | | 339 | | |
3.13%, 12/15/49 | | | 75 | | | | 84 | | |
3.30%, 4/15/40 | | | 200 | | | | 228 | | |
3.35%, 4/15/50 | | | 200 | | | | 233 | | |
Hormel Foods Corp. | |
1.80%, 6/11/30 | | | 400 | | | | 414 | | |
Hyundai Capital America | |
2.38%, 2/10/23 (a) | | | 500 | | | | 514 | | |
3.00%, 2/10/27 (a) | | | 775 | | | | 803 | | |
The accompanying notes are an integral part of the financial statements.
10
Morgan Stanley Institutional Fund Trust
Annual Report — September 30, 2020
Portfolio of Investments (cont'd)
Corporate Bond Portfolio
| | | Face
Amount
(000) | | Value
(000) | |
Industrials (cont'd) | |
Imperial Brands Finance PLC | |
3.13%, 7/26/24 (a) | | $ | 800 | | | $ | 847 | | |
Industrias Penoles SAB de CV | |
4.75%, 8/6/50 (a) | | | 250 | | | | 259 | | |
Intel Corp., | |
3.25%, 11/15/49 | | | 700 | | | | 787 | | |
International Business Machines Corp., | |
4.15%, 5/15/39 | | | 700 | | | | 860 | | |
Inversiones CMPC SA | |
3.85%, 1/13/30 | | | 200 | | | | 219 | | |
J2 Global, Inc. | |
1.75%, 11/1/26 (a) | | | 270 | | | | 240 | | |
JetBlue Pass Through Trust
Series AA | |
2.75%, 11/15/33 | | | 494 | | | | 486 | | |
John Deere Capital Corp., | |
2.45%, 1/9/30 | | | 775 | | | | 844 | | |
Johnson Controls International plc/
Tyco Fire & Security Finance SCA | |
1.75%, 9/15/30 | | | 400 | | | | 403 | | |
Kimberly-Clark de Mexico SAB de CV | |
2.43%, 7/1/31 (a) | | | 275 | | | | 280 | | |
Kinder Morgan, Inc., | |
5.20%, 3/1/48 | | | 325 | | | | 382 | | |
Lam Research Corp., | |
3.13%, 6/15/60 | | | 300 | | | | 322 | | |
Las Vegas Sands Corp., | |
3.20%, 8/8/24 | | | 925 | | | | 936 | | |
Level 3 Financing, Inc., | |
3.40%, 3/1/27 (a) | | | 625 | | | | 674 | | |
Lowe's Cos., Inc., | |
2.50%, 4/15/26 | | | 575 | | | | 624 | | |
4.50%, 4/15/30 | | | 225 | | | | 280 | | |
Marathon Petroleum Corp., | |
4.70%, 5/1/25 | | | 300 | | | | 340 | | |
4.75%, 12/15/23 | | | 1,125 | | | | 1,235 | | |
Mars, Inc., | |
3.20%, 4/1/30 (a) | | | 300 | | | | 343 | | |
McDonald's Corp., | |
1.45%, 9/1/25 | | | 650 | | | | 671 | | |
Microsoft Corp., | |
2.40%, 8/8/26 | | | 675 | | | | 738 | | |
2.53%, 6/1/50 | | | 625 | | | | 658 | | |
4.45%, 11/3/45 | | | 325 | | | | 460 | | |
Mondelez International, Inc., | |
2.75%, 4/13/30 | | | 675 | | | | 736 | | |
| MPLX LP | |
5.20%, 12/1/47 | | | 100 | | | | 110 | | |
NetApp, Inc., | |
1.88%, 6/22/25 | | | 1,175 | | | | 1,219 | | |
Newcastle Coal Infrastructure Group Pty Ltd., | |
4.40%, 9/29/27 (a) | | | 1,125 | | | | 1,121 | | |
| | | Face
Amount
(000) | | Value
(000) | |
Newmont Corp., | |
2.25%, 10/1/30 | | $ | 425 | | | $ | 440 | | |
5.45%, 6/9/44 | | | 225 | | | | 321 | | |
NIKE, Inc., | |
3.38%, 3/27/50 | | | 400 | | | | 470 | | |
Nissan Motor Co. Ltd., | |
3.04%, 9/15/23 (a) | | | 650 | | | | 659 | | |
NOVA Chemicals Corp., | |
4.88%, 6/1/24 (a) | | | 300 | | | | 299 | | |
Nuance Communications, Inc., | |
1.00%, 12/15/35 | | | 251 | | | | 366 | | |
Nutrition & Biosciences, Inc., | |
2.30%, 11/1/30 (a) | | | 250 | | | | 252 | | |
Nvent Finance Sarl | |
3.95%, 4/15/23 | | | 1,075 | | | | 1,122 | | |
NVIDIA Corp., | |
3.50%, 4/1/50 | | | 425 | | | | 501 | | |
NXP BV/NXP Funding LLC/NXP USA, Inc., | |
3.40%, 5/1/30 (a) | | | 875 | | | | 961 | | |
Occidental Petroleum Corp., | |
3.50%, 8/15/29 | | | 200 | | | | 154 | | |
Oracle Corp., | |
3.60%, 4/1/50 | | | 125 | | | | 142 | | |
3.85%, 4/1/60 | | | 275 | | | | 327 | | |
4.00%, 11/15/47 | | | 475 | | | | 565 | | |
Patterson-UTI Energy, Inc., | |
3.95%, 2/1/28 | | | 126 | | | | 98 | | |
PayPal Holdings, Inc., | |
2.30%, 6/1/30 | | | 684 | | | | 725 | | |
2.85%, 10/1/29 | | | 202 | | | | 223 | | |
Phillips 66 | |
2.15%, 12/15/30 | | | 275 | | | | 268 | | |
POSCO | |
4.00%, 8/1/23 (a) | | | 475 | | | | 511 | | |
Prosus NV | |
3.68%, 1/21/30 (a) | | | 200 | | | | 216 | | |
Pure Storage, Inc., | |
0.13%, 4/15/23 | | | 55 | | | | 54 | | |
Q-Park Holding I BV | |
1.50%, 3/1/25 (a) | | EUR | 150 | | | | 161 | | |
Raytheon Technologies Corp., | |
4.50%, 6/1/42 | | $ | 450 | | | | 570 | | |
Resorts World Las Vegas LLC/
RWLV Capital, Inc., | |
4.63%, 4/16/29 (a)(b) | | | 500 | | | | 472 | | |
Rockies Express Pipeline LLC | |
3.60%, 5/15/25 (a) | | | 400 | | | | 393 | | |
Roper Technologies, Inc., | |
1.00%, 9/15/25 | | | 600 | | | | 602 | | |
Ross Stores, Inc., | |
4.80%, 4/15/30 | | | 950 | | | | 1,159 | | |
Royalty Pharma PLC | |
2.20%, 9/2/30 (a) | | | 750 | | | | 750 | | |
The accompanying notes are an integral part of the financial statements.
11
Morgan Stanley Institutional Fund Trust
Annual Report — September 30, 2020
Portfolio of Investments (cont'd)
Corporate Bond Portfolio
| | | Face
Amount
(000) | | Value
(000) | |
Industrials (cont'd) | |
Sabine Pass Liquefaction LLC | |
4.50%, 5/15/30 (a) | | $ | 1,200 | | | $ | 1,355 | | |
Saudi Arabian Oil Co., | |
3.50%, 4/16/29 (a) | | | 500 | | | | 551 | | |
Shell International Finance BV | |
3.13%, 11/7/49 | | | 400 | | | | 411 | | |
Sherwin-Williams Co. (The), | |
2.30%, 5/15/30 | | | 775 | | | | 811 | | |
2.95%, 8/15/29 | | | 175 | | | | 193 | | |
3.30%, 5/15/50 | | | 150 | | | | 159 | | |
Sigma Finance Netherlands BV | |
4.88%, 3/27/28 (a) | | | 200 | | | | 221 | | |
Silgan Holdings, Inc., | |
2.25%, 6/1/28 | | EUR | 200 | | | | 229 | | |
Smithfield Foods, Inc., | |
3.00%, 10/15/30 (a) | | $ | 75 | | | | 75 | | |
5.20%, 4/1/29 (a) | | | 775 | | | | 907 | | |
Sprint Spectrum Co., LLC/Sprint Spectrum
Co., II LLC/Sprint Spectrum Co., III LLC | |
4.74%, 9/20/29 (a) | | | 400 | | | | 434 | | |
5.15%, 9/20/29 (a) | | | 550 | | | | 649 | | |
Standard Industries, Inc., | |
2.25%, 11/21/26 (a) | | EUR | 100 | | | | 113 | | |
Sunoco Logistics Partners Operations LP | |
3.90%, 7/15/26 | | $ | 275 | | | | 283 | | |
4.00%, 10/1/27 | | | 325 | | | | 332 | | |
T-Mobile USA, Inc., | |
3.88%, 4/15/30 (a) | | | 400 | | | | 454 | | |
4.50%, 4/15/50 (a) | | | 400 | | | | 481 | | |
Tencent Holdings Ltd., | |
3.60%, 1/19/28 (a) | | | 675 | | | | 744 | | |
TJX Cos., Inc., | |
4.50%, 4/15/50 | | | 450 | | | | 583 | | |
Transcontinental Gas Pipe Line Co. LLC | |
3.25%, 5/15/30 (a) | | | 450 | | | | 487 | | |
Transportadora de Gas Internacional SA ESP | |
5.55%, 11/1/28 (a) | | | 400 | | | | 453 | | |
TSMC Global Ltd., | |
0.75%, 9/28/25 (a)(b) | | | 550 | | | | 545 | | |
TWDC Enterprises 18 Corp., | |
Series B | |
7.00%, 3/1/32 | | | 75 | | | | 113 | | |
Twitter, Inc. | |
1.00%, 9/15/21 | | | 280 | | | | 279 | | |
Union Pacific Corp., | |
3.25%, 2/5/50 | | | 550 | | | | 610 | | |
Upjohn, Inc., | |
4.00%, 6/22/50 (a) | | | 500 | | | | 536 | | |
Verint Systems, Inc., | |
1.50%, 6/1/21 | | | 225 | | | | 228 | | |
| | | Face
Amount
(000) | | Value
(000) | |
Verizon Communications, Inc., | |
3.88%, 2/8/29 | | $ | 650 | | | $ | 771 | | |
4.33%, 9/21/28 | | | 300 | | | | 364 | | |
4.67%, 3/15/55 | | | 200 | | | | 278 | | |
5.01%, 4/15/49 | | | 775 | | | | 1,120 | | |
Visa, Inc., | |
2.70%, 4/15/40 | | | 225 | | | | 244 | | |
Walmart, Inc., | |
3.70%, 6/26/28 | | | 625 | | | | 740 | | |
Walt Disney Co. (The), | |
2.75%, 9/1/49 | | | 784 | | | | 768 | | |
3.60%, 1/13/51 | | | 331 | | | | 374 | | |
Western Midstream Operating LP | |
4.10%, 2/1/25 | | | 375 | | | | 358 | | |
Williams Cos., Inc. (The), | |
4.85%, 3/1/48 | | | 200 | | | | 224 | | |
5.10%, 9/15/45 | | | 225 | | | | 253 | | |
Zillow Group, Inc., | |
2.00%, 12/1/21 | | | 205 | | | | 398 | | |
| | | | 101,796 | | |
Utilities (8.7%) | |
Avangrid, Inc., | |
3.80%, 6/1/29 | | | 625 | | | | 724 | | |
Boston Gas Co., | |
3.00%, 8/1/29 (a) | | | 525 | | | | 579 | | |
4.49%, 2/15/42 (a) | | | 125 | | | | 155 | | |
Cleveland Electric Illuminating Co. (The), | |
4.55%, 11/15/30 (a) | | | 250 | | | | 299 | | |
Consorcio Transmantaro SA | |
4.70%, 4/16/34 (a) | | | 400 | | | | 474 | | |
Consumers Energy Co., | |
2.50%, 5/1/60 | | | 325 | | | | 307 | | |
3.50%, 8/1/51 | | | 275 | | | | 323 | | |
DTE Electric Co., | |
3.95%, 3/1/49 | | | 450 | | | | 569 | | |
Duke Energy Corp., | |
2.45%, 6/1/30 | | | 875 | | | | 925 | | |
Duke Energy Indiana LLC | |
Series YYY | |
3.25%, 10/1/49 | | | 250 | | | | 280 | | |
Duke Energy Progress LLC | |
3.45%, 3/15/29 | | | 550 | | | | 635 | | |
Enel Finance International N.V., | |
6.00%, 10/7/39 (a) | | | 200 | | | | 273 | | |
Entergy Arkansas LLC | |
3.50%, 4/1/26 | | | 458 | | | | 519 | | |
Entergy Louisiana LLC | |
3.05%, 6/1/31 | | | 75 | | | | 86 | | |
FirstEnergy Corp., | |
Series C | |
3.40%, 3/1/50 | | | 450 | | | | 439 | | |
The accompanying notes are an integral part of the financial statements.
12
Morgan Stanley Institutional Fund Trust
Annual Report — September 30, 2020
Portfolio of Investments (cont'd)
Corporate Bond Portfolio
| | | Face
Amount
(000) | | Value
(000) | |
Utilities (cont'd) | |
Interstate Power and Light Co., | |
2.30%, 6/1/30 | | $ | 350 | | | $ | 370 | | |
3.50%, 9/30/49 | | | 175 | | | | 194 | | |
Liberty Utilities Finance GP 1 | |
2.05%, 9/15/30 (a) | | | 875 | | | | 865 | | |
Mississippi Power Co., | |
3.95%, 3/30/28 | | | 575 | | | | 661 | | |
NextEra Energy Capital Holdings, Inc., | |
2.25%, 6/1/30 | | | 1,050 | | | | 1,090 | | |
NiSource, Inc., | |
1.70%, 2/15/31 | | | 500 | | | | 493 | | |
2.95%, 9/1/29 | | | 400 | | | | 435 | | |
Northern States Power Co., | |
2.90%, 3/1/50 | | | 275 | | | | 296 | | |
Oglethorpe Power Corp., | |
5.05%, 10/1/48 | | | 325 | | | | 385 | | |
ONEOK, Inc., | |
3.10%, 3/15/30 | | | 725 | | | | 699 | | |
Pacific Gas and Electric Co., | |
3.15%, 1/1/26 (b) | | | 175 | | | | 180 | | |
3.30%, 8/1/40 | | | 225 | | | | 208 | | |
3.50%, 8/1/50 | | | 200 | | | | 181 | | |
PacifiCorp | |
2.70%, 9/15/30 | | | 825 | | | | 908 | | |
Public Service Co. of Colorado | |
Series 34 | |
3.20%, 3/1/50 | | | 275 | | | | 313 | | |
Southern California Edison Co., | |
4.00%, 4/1/47 | | | 250 | | | | 269 | | |
Southern Co. (The), | |
4.40%, 7/1/46 | | | 850 | | | | 1,010 | | |
Virginia Electric and Power Co., | |
Series A | |
2.88%, 7/15/29 | | | 825 | | | | 928 | | |
Series B | |
3.30%, 12/1/49 (b) | | | 350 | | | | 407 | | |
Xcel Energy, Inc., | |
2.60%, 12/1/29 | | | 775 | | | | 839 | | |
| | | | 17,318 | | |
Total Fixed Income Securities (Cost $181,198) | | | 190,001 | | |
| | | Shares | | Value
(000) | |
Short-Term Investments (5.5%) | |
Securities held as Collateral on Loaned Securities (1.6%) | |
Investment Company (1.6%) | |
Morgan Stanley Institutional Liquidity
Funds — Government Portfolio —
Institutional Class (See Note G)
(Cost $3,247) | | | 3,247,060 | | | $ | 3,247 | | |
Investment Company (2.9%) | |
Morgan Stanley Institutional Liquidity
Funds — Government Portfolio —
Institutional Class (See Note G)
(Cost $5,785) | | | 5,785,051 | | | | 5,785 | | |
| | | Face
Amount
(000) | | | |
U.S. Treasury Security (1.0%) | |
U.S. Treasury Bill | |
| 0.16%, 1/28/21 (e)(f) (Cost $1,864) | | $ | 1,865 | | | | 1,864 | | |
Total Short-Term Investments (Cost $10,896) | | | 10,896 | | |
Total Investments (101.6%) (Cost $192,094)
Including $3,559 of Securities Loaned (g)(h) | | | 200,897 | | |
Liabilities in Excess of Other Assets (–1.6%) | | | (3,071 | ) | |
Net Assets (100.0%) | | $ | 197,826 | | |
(a) 144A security — Certain conditions for public sale may exist. Unless otherwise noted, these securities are deemed to be liquid.
(b) All or a portion of this security was on loan at September 30, 2020.
(c) Perpetual — One or more securities do not have a predetermined maturity date. Rates for these securities are fixed for a period of time, after which they revert to a floating rate. Interest rates in effect are as of September 30, 2020.
(d) When-issued security.
(e) Rate shown is the yield to maturity at September 30, 2020.
(f) All or a portion of the security was pledged to cover margin requirements for futures contracts and swap agreement.
(g) Securities are available for collateral in connection with purchase of a when-issued security, open foreign currency forward exchange contract, open futures contracts and swap agreement.
(h) At September 30, 2020, the aggregate cost for federal income tax purposes is approximately $192,153,000. The aggregate gross unrealized appreciation is approximately $10,284,000 and the aggregate gross unrealized depreciation is approximately $1,540,000, resulting in net unrealized appreciation of approximately $8,744,000.
MTN Medium Term Note.
The accompanying notes are an integral part of the financial statements.
13
Morgan Stanley Institutional Fund Trust
Annual Report — September 30, 2020
Portfolio of Investments (cont'd)
Corporate Bond Portfolio
Foreign Currency Forward Exchange Contract:
The Fund had the following foreign currency forward exchange contract open at September 30, 2020:
Counterparty | | Contracts to
Deliver
(000) | | In Exchange
For
(000) | | Delivery
Date | | Unrealized
Appreciation
(000) | |
Citibank NA | | EUR | 954 | | | $ | 1,137 | | | 12/1/20 | | $ | 17 | | |
Futures Contracts:
The Fund had the following futures contracts open at September 30, 2020:
| | | Number
of
Contracts | | Expiration
Date | | Notional
Amount
(000) | | Value
(000) | | Unrealized
Appreciation
(Depreciation)
(000) | |
Long: | |
U.S. Treasury 2 yr. Note | | | 80 | | | Dec-20 | | $ | 16,000 | | | $ | 17,677 | | | $ | 8 | | |
U.S. Treasury 5 yr. Note | | | 74 | | | Dec-20 | | | 7,400 | | | | 9,326 | | | | 13 | | |
U.S. Treasury Long Bond | | | 94 | | | Dec-20 | | | 9,400 | | | | 16,570 | | | | (137 | ) | |
U.S. Treasury Ultra Bond | | | 13 | | | Dec-20 | | | 1,300 | | | | 2,884 | | | | 2 | | |
Short: | |
German Euro Bund | | | 2 | | | Dec-20 | | EUR | (200 | ) | | | (409 | ) | | | (3 | ) | |
German Euro BOBL | | | 1 | | | Dec-20 | | | (100 | ) | | | (158 | ) | | | (— | @) | |
U.S. Treasury 10 yr. Ultra Long Bond | | | 221 | | | Dec-20 | | $ | (22,100 | ) | | | (35,343 | ) | | | (66 | ) | |
U.S. Treasury 10 yr. Note | | | 17 | | | Dec-20 | | | (1,700 | ) | | | (2,372 | ) | | | (2 | ) | |
| | | | | | | | | | | $ | (185 | ) | |
Credit Default Swap Agreement:
The Fund had the following credit default swap agreement open at September 30, 2020:
Swap Counterparty and
Reference Obligation | | Credit
Rating of
Reference
Obligation† | | Buy/Sell
Protection | | Pay/Receive
Fixed Rate | | Payment
Frequency | | Maturity
Date | | Notional
Amount
(000) | | Value
(000) | | Upfront
Payment
(Received)
(000) | | Unrealized
Appreciation
(000) | |
Morgan Stanley &
Co. LLC*
CDX.NA.HY.33 | | NR | | Buy | | | 5.00 | % | | Quarterly | | 12/20/24 | | $ | 1,224 | | | $ | (65 | ) | | $ | (117 | ) | | $ | 52 | | |
@ Value is less than $500.
† Credit rating as issued by Standard & Poor's.
* Cleared swap agreement, the broker is Morgan Stanley & Co., LLC.
NR Not rated.
EUR Euro
Portfolio Composition**
Classification | | Percentage of
Total Investments | |
Industrials | | | 51.5 | % | |
Finance | | | 35.3 | | |
Utilities | | | 8.8 | | |
Short-Term Investments | | | 3.9 | | |
Other*** | | | 0.5 | | |
Total Investments | | | 100.0 | %**** | |
** Percentages indicated are based upon total investments (excluding Securities held as Collateral on Loaned Securities) as of September 30, 2020.
*** Industries and/or investment types representing less than 5% of total investments.
**** Does not include open long/short futures contracts with a value of approximately $84,739,000 and net unrealized depreciation of approximately $185,000. Does not include an open foreign currency forward exchange contract with total unrealized appreciation of approximately $17,000. Does not include an open swap agreement with total unrealized appreciation of approximately $52,000.
The accompanying notes are an integral part of the financial statements.
14
Morgan Stanley Institutional Fund Trust
Annual Report — September 30, 2020
Statement of Assets and Liabilities | | September 30, 2020
(000) | |
Assets: | |
Investments in Securities of Unaffiliated Issuers, at Value(1) (Cost $183,062) | | $ | 191,865 | | |
Investment in Security of Affiliated Issuer, at Value (Cost $9,032) | | | 9,032 | | |
Total Investments in Securities, at Value (Cost $192,094) | | | 200,897 | | |
Foreign Currency, at Value (Cost $3) | | | 3 | | |
Cash | | | 4 | | |
Interest Receivable | | | 1,544 | | |
Receivable for Investments Sold | | | 1,438 | | |
Receivable for Fund Shares Sold | | | 971 | | |
Unrealized Appreciation on Foreign Currency Forward Exchange Contract | | | 17 | | |
Receivable for Variation Margin on Futures Contracts | | | 1 | | |
Receivable from Affiliate | | | — | @ | |
Receivable from Securities Lending Income | | | — | @ | |
Other Assets | | | 63 | | |
Total Assets | | | 204,938 | | |
Liabilities: | |
Collateral on Securities Loaned, at Value | | | 3,247 | | |
Payable for Investments Purchased | | | 2,894 | | |
Payable for Fund Shares Redeemed | | | 622 | | |
Payable for Advisory Fees | | | 98 | | |
Payable for Professional Fees | | | 74 | | |
Payable for Trustees' Fees and Expenses | | | 42 | | |
Payable for Transfer Agency Fees — Class I | | | 27 | | |
Payable for Transfer Agency Fees — Class A | | | 1 | | |
Payable for Transfer Agency Fees — Class L | | | — | @ | |
Payable for Transfer Agency Fees — Class C | | | 1 | | |
Deferred Capital Gain Country Tax | | | 26 | | |
Payable for Sub Transfer Agency Fees — Class I | | | 16 | | |
Payable for Sub Transfer Agency Fees — Class A | | | 1 | | |
Payable for Sub Transfer Agency Fees — Class L | | | — | @ | |
Payable for Sub Transfer Agency Fees — Class C | | | — | @ | |
Payable for Administration Fees | | | 13 | | |
Payable for Custodian Fees | | | 12 | | |
Payable for Shareholder Services Fees — Class A | | | 1 | | |
Payable for Distribution and Shareholder Services Fees — Class L | | | 1 | | |
Payable for Distribution and Shareholder Services Fees — Class C | | | 2 | | |
Payable for Variation Margin on Swap Agreements | | | 2 | | |
Other Liabilities | | | 32 | | |
Total Liabilities | | | 7,112 | | |
Net Assets | | $ | 197,826 | | |
Net Assets Consist of: | |
Paid-in-Capital | | $ | 182,545 | | |
Total Distributable Earnings | | | 15,281 | | |
Net Assets | | $ | 197,826 | | |
The accompanying notes are an integral part of the financial statements.
15
Morgan Stanley Institutional Fund Trust
Annual Report — September 30, 2020
Statement of Assets and Liabilities (cont'd) | | September 30, 2020
(000) | |
CLASS I: | |
Net Assets | | $ | 182,070 | | |
| Shares Outstanding (unlimited number of shares authorized, no par value) (not in 000's) | | | 13,497,545 | | |
Net Asset Value, Offering and Redemption Price Per Share | | $ | 13.49 | | |
CLASS A: | |
Net Assets | | $ | 10,807 | | |
| Shares Outstanding (unlimited number of shares authorized, no par value) (not in 000's) | | | 800,252 | | |
Net Asset Value, Redemption Price Per Share | | $ | 13.50 | | |
Maximum Sales Load | | | 3.25 | % | |
Maximum Sales Charge | | $ | 0.45 | | |
Maximum Offering Price Per Share | | $ | 13.95 | | |
CLASS L: | |
Net Assets | | $ | 1,727 | | |
| Shares Outstanding (unlimited number of shares authorized, no par value) (not in 000's) | | | 127,985 | | |
Net Asset Value, Offering and Redemption Price Per Share | | $ | 13.49 | | |
CLASS C: | |
Net Assets | | $ | 3,222 | | |
| Shares Outstanding (unlimited number of shares authorized, no par value) (not in 000's) | | | 240,314 | | |
Net Asset Value, Offering and Redemption Price Per Share | | $ | 13.41 | | |
(1) Including:
Securities on Loan, at Value: | | $ | 3,559 | | |
@ Amount is less than $500.
The accompanying notes are an integral part of the financial statements.
16
Morgan Stanley Institutional Fund Trust
Annual Report — September 30, 2020
Statement of Operations | | Year Ended
September 30, 2020
(000) | |
Investment Income: | |
Interest from Securities of Unaffiliated Issuers (Net of $—@ of Foreign Taxes Withheld) | | $ | 4,803 | | |
Dividends from Security of Affiliated Issuer (Note G) | | | 24 | | |
Income from Securities Loaned — Net | | | 6 | | |
Total Investment Income | | | 4,833 | | |
Expenses: | |
Advisory Fees (Note B) | | | 569 | | |
Professional Fees | | | 171 | | |
Transfer Agency Fees — Class I (Note E) | | | 116 | | |
Transfer Agency Fees — Class A (Note E) | | | 3 | | |
Transfer Agency Fees — Class L (Note E) | | | 2 | | |
Transfer Agency Fees — Class C (Note E) | | | 3 | | |
Administration Fees (Note C) | | | 121 | | |
Sub Transfer Agency Fees — Class I | | | 97 | | |
Sub Transfer Agency Fees — Class A | | | 8 | | |
Sub Transfer Agency Fees — Class L | | | 1 | | |
Sub Transfer Agency Fees — Class C | | | 2 | | |
Registration Fees | | | 65 | | |
Shareholder Services Fees — Class A (Note D) | | | 20 | | |
Distribution and Shareholder Services Fees — Class L (Note D) | | | 8 | | |
Distribution and Shareholder Services Fees — Class C (Note D) | | | 23 | | |
Custodian Fees (Note F) | | | 44 | | |
Shareholder Reporting Fees | | | 37 | | |
Pricing Fees | | | 32 | | |
Trustees' Fees and Expenses | | | 7 | | |
Other Expenses | | | 26 | | |
Total Expenses | | | 1,355 | | |
Reimbursement of Class Specific Expenses — Class I (Note B) | | | (213 | ) | |
Reimbursement of Class Specific Expenses — Class C (Note B) | | | (2 | ) | |
Waiver of Advisory Fees (Note B) | | | (9 | ) | |
Waiver of Shareholder Servicing Fees — Class A (Note D) | | | (8 | ) | |
Rebate from Morgan Stanley Affiliate (Note G) | | | (5 | ) | |
Net Expenses | | | 1,118 | | |
Net Investment Income | | | 3,715 | | |
Realized Gain (Loss): | |
Investments Sold (Net of $5 of Capital Gain Country Tax) | | | 7,930 | | |
Foreign Currency Forward Exchange Contracts | | | (76 | ) | |
Foreign Currency Translation | | | (1 | ) | |
Futures Contracts | | | 353 | | |
Swap Agreements | | | (971 | ) | |
Net Realized Gain | | | 7,235 | | |
Change in Unrealized Appreciation (Depreciation): | |
Investments (Net of Decrease in Deferred Capital Gain Country Tax of $11) | | | 193 | | |
Foreign Currency Forward Exchange Contract | | | 17 | | |
Foreign Currency Translation | | | (— | @) | |
Futures Contracts | | | (21 | ) | |
Swap Agreements | | | 546 | | |
Net Change in Unrealized Appreciation (Depreciation) | | | 735 | | |
Net Realized Gain and Change in Unrealized Appreciation (Depreciation) | | | 7,970 | | |
Net Increase in Net Assets Resulting from Operations | | $ | 11,685 | | |
@ Amount is less than $500.
The accompanying notes are an integral part of the financial statements.
17
Morgan Stanley Institutional Fund Trust
Annual Report — September 30, 2020
Statements of Changes in Net Assets | | Year Ended
September 30, 2020
(000) | | Year Ended
September 30, 2019
(000) | |
Increase (Decrease) in Net Assets: | |
Operations: | |
Net Investment Income | | $ | 3,715 | | | $ | 3,980 | | |
Net Realized Gain | | | 7,235 | | | | 1,004 | | |
Net Change in Unrealized Appreciation (Depreciation) | | | 735 | | | | 9,503 | | |
Net Increase in Net Assets Resulting from Operations | | | 11,685 | | | | 14,487 | | |
Dividends and Distributions to Shareholders: | |
Class I | | | (3,443 | ) | | | (4,270 | ) | |
Class A | | | (177 | ) | | | (176 | ) | |
Class L | | | (32 | ) | | | (48 | ) | |
Class C | | | (36 | ) | | | (77 | ) | |
Total Dividends and Distributions to Shareholders | | | (3,688 | ) | | | (4,571 | ) | |
Capital Share Transactions:(1) | |
Class I: | |
Subscribed | | | 76,817 | | | | 19,935 | | |
Distributions Reinvested | | | 3,197 | | | | 3,813 | | |
Redeemed | | | (27,783 | ) | | | (19,161 | ) | |
Class A: | |
Subscribed | | | 7,693 | | | | 3,735 | | |
Distributions Reinvested | | | 176 | | | | 175 | | |
Redeemed | | | (3,877 | ) | | | (2,440 | ) | |
Class L: | |
Exchanged | | | — | | | | 83 | | |
Distributions Reinvested | | | 32 | | | | 48 | | |
Redeemed | | | (67 | ) | | | (93 | ) | |
Class C: | |
Subscribed | | | 2,884 | | | | 1,752 | | |
Distributions Reinvested | | | 36 | | | | 77 | | |
Redeemed | | | (2,601 | ) | | | (1,396 | ) | |
Net Increase in Net Assets Resulting from Capital Share Transactions | | | 56,507 | | | | 6,528 | | |
Total Increase in Net Assets | | | 64,504 | | | | 16,444 | | |
Net Assets: | |
Beginning of Period | | | 133,322 | | | | 116,878 | | |
End of Period | | $ | 197,826 | | | $ | 133,322 | | |
(1) Capital Share Transactions: | |
Class I: | |
Shares Subscribed | | | 5,836 | | | | 1,647 | | |
Shares Issued on Distributions Reinvested | | | 246 | | | | 318 | | |
Shares Redeemed | | | (2,162 | ) | | | (1,607 | ) | |
Net Increase in Class I Shares Outstanding | | | 3,920 | | | | 358 | | |
Class A: | |
Shares Subscribed | | | 582 | | | | 303 | | |
Shares Issued on Distributions Reinvested | | | 14 | | | | 14 | | |
Shares Redeemed | | | (296 | ) | | | (199 | ) | |
Net Increase in Class A Shares Outstanding | | | 300 | | | | 118 | | |
Class L: | |
Shares Exchanged | | | — | | | | 8 | | |
Shares Issued on Distributions Reinvested | | | 2 | | | | 4 | | |
Shares Redeemed | | | (5 | ) | | | (8 | ) | |
Net Increase (Decrease) in Class L Shares Outstanding | | | (3 | ) | | | 4 | | |
Class C: | |
Shares Subscribed | | | 221 | | | | 150 | | |
Shares Issued on Distributions Reinvested | | | 3 | | | | 6 | | |
Shares Redeemed | | | (204 | ) | | | (113 | ) | |
Net Increase in Class C Shares Outstanding | | | 20 | | | | 43 | | |
The accompanying notes are an integral part of the financial statements.
18
Morgan Stanley Institutional Fund Trust
Annual Report — September 30, 2020
Financial Highlights
Corporate Bond Portfolio
| | | Class I | |
| | | Year Ended September 30, | |
Selected Per Share Data and Ratios | | 2020 | | 2019 | | 2018 | | 2017 | | 2016(1) | |
Net Asset Value, Beginning of Period | | $ | 12.78 | | | $ | 11.80 | | | $ | 12.32 | | | $ | 12.33 | | | $ | 10.80 | | |
Income (Loss) from Investment Operations: | |
Net Investment Income(2) | | | 0.32 | | | | 0.40 | | | | 0.39 | | | | 0.34 | | | | 0.37 | | |
Net Realized and Unrealized Gain (Loss) | | | 0.72 | | | | 1.04 | | | | (0.58 | ) | | | 0.01 | | | | 1.51 | | |
Total from Investment Operations | | | 1.04 | | | | 1.44 | | | | (0.19 | ) | | | 0.35 | | | | 1.88 | | |
Distributions from and/or in Excess of: | |
Net Investment Income | | | (0.33 | ) | | | (0.46 | ) | | | (0.33 | ) | | | (0.36 | ) | | | (0.35 | ) | |
Net Asset Value, End of Period | | $ | 13.49 | | | $ | 12.78 | | | $ | 11.80 | | | $ | 12.32 | | | $ | 12.33 | | |
Total Return(3) | | | 8.19 | % | | | 12.64 | % | | | (1.60 | )% | | | 2.95 | %(4) | | | 17.79 | %(5) | |
Ratios to Average Net Assets and Supplemental Data: | |
Net Assets, End of Period (Thousands) | | $ | 182,070 | | | $ | 122,450 | | | $ | 108,809 | | | $ | 37,993 | | | $ | 31,873 | | |
Ratio of Expenses Before Expense Limitation | | | 0.86 | % | | | 1.01 | % | | | 0.97 | % | | | 1.26 | % | | | 1.28 | % | |
Ratio of Expenses After Expense Limitation | | | 0.70 | %(6) | | | 0.70 | %(6) | | | 0.70 | %(6) | | | 0.70 | %(6) | | | 0.69 | %(6) | |
Ratio of Net Investment Income | | | 2.49 | %(6) | | | 3.34 | %(6) | | | 3.29 | %(6) | | | 2.85 | %(6) | | | 3.28 | %(6) | |
Ratio of Rebate from Morgan Stanley Affiliates | | | 0.00 | %(7) | | | 0.00 | %(7) | | | 0.00 | %(7) | | | 0.00 | %(7) | | | 0.01 | % | |
Portfolio Turnover Rate | | | 133 | % | | | 64 | % | | | 37 | % | | | 33 | % | | | 41 | % | |
(1) Reflects prior period custodian out-of-pocket expenses that were reimbursed in September 2016. The amount of the reimbursement was immaterial on a per share basis and did not impact the total return of Class I shares. The Ratio of Expenses After Expense Limitation and the Ratio of Net Investment Income would be unchanged as the reimbursement of custodian fees was offset against expense waivers/reimbursements with no impact to net expenses or net investment income.
(2) Per share amount is based on average shares outstanding.
(3) Calculated based on the net asset value as of the last business day of the period.
(4) Performance was positively impacted by approximately 0.85% due to the receipt of proceeds from the settlement of class action suits involving the Fund's past holdings. These were one-time settlements, and as a result, the impact on the NAV and consequently the performance will not likely be repeated in the future. Had these settlements not occurred, the total return for Class I shares would have been approximately 2.10%.
(5) Performance was positively impacted by approximately 9.01% due to the receipt of proceeds from the settlement of class action suits involving the Fund's past holdings. These were one-time settlements, and as a result, the impact on the NAV and consequently the performance will not likely be repeated in the future. Had these settlements not occurred, the total return for Class I shares would have been approximately 8.78%.
(6) The Ratio of Expenses After Expense Limitation and Ratio of Net Investment Income reflect the rebate of certain Fund expenses in connection with the investments in Morgan Stanley affiliates during the period. The effect of the rebate on the ratios is disclosed in the above table as "Ratio of Rebate from Morgan Stanley Affiliates."
(7) Amount is less than 0.005%.
The accompanying notes are an integral part of the financial statements.
19
Morgan Stanley Institutional Fund Trust
Annual Report — September 30, 2020
Financial Highlights
Corporate Bond Portfolio
| | | Class A | |
| | | Year Ended September 30, | |
Selected Per Share Data and Ratios | | 2020 | | 2019 | | 2018 | | 2017 | | 2016(1) | |
Net Asset Value, Beginning of Period | | $ | 12.80 | | | $ | 11.81 | | | $ | 12.32 | | | $ | 12.34 | | | $ | 10.81 | | |
Income (Loss) from Investment Operations: | |
Net Investment Income(2) | | | 0.29 | | | | 0.37 | | | | 0.33 | | | | 0.30 | | | | 0.32 | | |
Net Realized and Unrealized Gain (Loss) | | | 0.70 | | | | 1.04 | | | | (0.56 | ) | | | (0.00 | )(3) | | | 1.53 | | |
Total from Investment Operations | | | 0.99 | | | | 1.41 | | | | (0.23 | ) | | | 0.30 | | | | 1.85 | | |
Distributions from and/or in Excess of: | |
Net Investment Income | | | (0.29 | ) | | | (0.42 | ) | | | (0.28 | ) | | | (0.32 | ) | | | (0.32 | ) | |
Net Asset Value, End of Period | | $ | 13.50 | | | $ | 12.80 | | | $ | 11.81 | | | $ | 12.32 | | | $ | 12.34 | | |
Total Return(4) | | | 7.88 | % | | | 12.25 | % | | | (1.87 | )% | | | 2.54 | %(5) | | | 17.41 | %(6) | |
Ratios to Average Net Assets and Supplemental Data: | |
Net Assets, End of Period (Thousands) | | $ | 10,807 | | | $ | 6,400 | | | $ | 4,496 | | | $ | 7,911 | | | $ | 6,916 | | |
Ratio of Expenses Before Expense Limitation | | | 1.10 | % | | | 1.21 | % | | | 1.29 | % | | | 1.62 | % | | | 1.51 | % | |
Ratio of Expenses After Expense Limitation | | | 0.99 | %(7) | | | 0.99 | %(7) | | | 1.01 | %(7) | | | 1.05 | %(7) | | | 0.99 | %(7) | |
Ratio of Net Investment Income | | | 2.20 | %(7) | | | 3.04 | %(7) | | | 2.78 | %(7) | | | 2.50 | %(7) | | | 2.78 | %(7) | |
Ratio of Rebate from Morgan Stanley Affiliates | | | 0.00 | %(8) | | | 0.00 | %(8) | | | 0.00 | %(8) | | | 0.00 | %(8) | | | 0.01 | % | |
Portfolio Turnover Rate | | | 133 | % | | | 64 | % | | | 37 | % | | | 33 | % | | | 41 | % | |
(1) Reflects prior period custodian out-of-pocket expenses that were reimbursed in September 2016. The amount of the reimbursement was immaterial on a per share basis and did not impact the total return of Class A shares. The Ratio of Expenses After Expense Limitation and the Ratio of Net Investment Income would be unchanged as the reimbursement of custodian fees was offset against expense waivers/reimbursements with no impact to net expenses or net investment income.
(2) Per share amount is based on average shares outstanding.
(3) Amount is less than $0.005 per share.
(4) Calculated based on the net asset value which does not reflect sales charges, if applicable, as of the last business day of the period.
(5) Performance was positively impacted by approximately 0.85% due to the receipt of proceeds from the settlement of class action suits involving the Fund's past holdings. These were one-time settlements, and as a result, the impact on the NAV and consequently the performance will not likely be repeated in the future. Had these settlements not occurred, the total return for Class A shares would have been approximately 1.69%.
(6) Performance was positively impacted by approximately 8.97% due to the receipt of proceeds from the settlement of class action suits involving the Fund's past holdings. These were one-time settlements, and as a result, the impact on the NAV and consequently the performance will not likely be repeated in the future. Had these settlements not occurred, the total return for Class A shares would have been approximately 8.44%.
(7) The Ratio of Expenses After Expense Limitation and Ratio of Net Investment Income reflect the rebate of certain Fund expenses in connection with the investments in Morgan Stanley affiliates during the period. The effect of the rebate on the ratios is disclosed in the above table as "Ratio of Rebate from Morgan Stanley Affiliates."
(8) Amount is less than 0.005%.
The accompanying notes are an integral part of the financial statements.
20
Morgan Stanley Institutional Fund Trust
Annual Report — September 30, 2020
Financial Highlights
Corporate Bond Portfolio
| | | Class L | |
| | | Year Ended September 30, | |
Selected Per Share Data and Ratios | | 2020 | | 2019 | | 2018 | | 2017 | | 2016(1) | |
Net Asset Value, Beginning of Period | | $ | 12.79 | | | $ | 11.79 | | | $ | 12.30 | | | $ | 12.32 | | | $ | 10.79 | | |
Income (Loss) from Investment Operations: | |
Net Investment Income(2) | | | 0.24 | | | | 0.32 | | | | 0.29 | | | | 0.26 | | | | 0.30 | | |
Net Realized and Unrealized Gain (Loss) | | | 0.70 | | | | 1.04 | | | | (0.56 | ) | | | (0.00 | )(3) | | | 1.51 | | |
Total from Investment Operations | | | 0.94 | | | | 1.36 | | | | (0.27 | ) | | | 0.26 | | | | 1.81 | | |
Distributions from and/or in Excess of: | |
Net Investment Income | | | (0.24 | ) | | | (0.36 | ) | | | (0.24 | ) | | | (0.28 | ) | | | (0.28 | ) | |
Net Asset Value, End of Period | | $ | 13.49 | | | $ | 12.79 | | | $ | 11.79 | | | $ | 12.30 | | | $ | 12.32 | | |
Total Return(4) | | | 7.47 | % | | | 11.82 | % | | | (2.19 | )% | | | 2.20 | %(5) | | | 17.06 | %(6) | |
Ratios to Average Net Assets and Supplemental Data: | |
Net Assets, End of Period (Thousands) | | $ | 1,727 | | | $ | 1,671 | | | $ | 1,499 | | | $ | 1,749 | | | $ | 2,151 | | |
Ratio of Expenses Before Expense Limitation | | | 1.39 | % | | | 1.49 | % | | | 1.56 | % | | | 1.80 | % | | | 1.75 | % | |
Ratio of Expenses After Expense Limitation | | | 1.38 | %(7) | | | 1.38 | %(7) | | | 1.38 | %(7) | | | 1.34 | %(7) | | | 1.33 | %(7) | |
Ratio of Net Investment Income | | | 1.84 | %(7) | | | 2.67 | %(7) | | | 2.45 | %(7) | | | 2.20 | %(7) | | | 2.64 | %(7) | |
Ratio of Rebate from Morgan Stanley Affiliates | | | 0.00 | %(8) | | | 0.00 | %(8) | | | 0.00 | %(8) | | | 0.01 | % | | | 0.01 | % | |
Portfolio Turnover Rate | | | 133 | % | | | 64 | % | | | 37 | % | | | 33 | % | | | 41 | % | |
(1) Reflects prior period custodian out-of-pocket expenses that were reimbursed in September 2016. The amount of the reimbursement was immaterial on a per share basis and did not impact the total return of Class L shares. The Ratio of Expenses After Expense Limitation and the Ratio of Net Investment Income would be unchanged as the reimbursement of custodian fees was offset against expense waivers/reimbursements with no impact to net expenses or net investment income.
(2) Per share amount is based on average shares outstanding.
(3) Amount is less than $0.005 per share.
(4) Calculated based on the net asset value as of the last business day of the period.
(5) Performance was positively impacted by approximately 0.84% due to the receipt of proceeds from the settlement of class action suits involving the Fund's past holdings. These were one-time settlements, and as a result, the impact on the NAV and consequently the performance will not likely be repeated in the future. Had these settlements not occurred, the total return for Class L shares would have been approximately 1.36%.
(6) Performance was positively impacted by approximately 9.05% due to the receipt of proceeds from the settlement of class action suits involving the Fund's past holdings. These were one-time settlements, and as a result, the impact on the NAV and consequently the performance will not likely be repeated in the future. Had these settlements not occurred, the total return for Class L shares would have been approximately 8.01%.
(7) The Ratio of Expenses After Expense Limitation and Ratio of Net Investment Income reflect the rebate of certain Fund expenses in connection with the investments in Morgan Stanley affiliates during the period. The effect of the rebate on the ratios is disclosed in the above table as "Ratio of Rebate from Morgan Stanley Affiliates."
(8) Amount is less than 0.005%.
The accompanying notes are an integral part of the financial statements.
21
Morgan Stanley Institutional Fund Trust
Annual Report — September 30, 2020
Financial Highlights
Corporate Bond Portfolio
| | | Class C | |
| | | Year Ended September 30, | |
Selected Per Share Data and Ratios | | 2020 | | 2019 | | 2018 | | 2017 | | 2016(1) | |
Net Asset Value, Beginning of Period | | $ | 12.71 | | | $ | 11.72 | | | $ | 12.25 | | | $ | 12.27 | | | $ | 10.77 | | |
Income (Loss) from Investment Operations: | |
Net Investment Income(2) | | | 0.18 | | | | 0.27 | | | | 0.25 | | | | 0.21 | | | | 0.22 | | |
Net Realized and Unrealized Gain (Loss) | | | 0.71 | | | | 1.03 | | | | (0.57 | ) | | | 0.00 | (3) | | | 1.53 | | |
Total from Investment Operations | | | 0.89 | | | | 1.30 | | | | (0.32 | ) | | | 0.21 | | | | 1.75 | | |
Distributions from and/or in Excess of: | |
Net Investment Income | | | (0.19 | ) | | | (0.31 | ) | | | (0.21 | ) | | | (0.23 | ) | | | (0.25 | ) | |
Net Asset Value, End of Period | | $ | 13.41 | | | $ | 12.71 | | | $ | 11.72 | | | $ | 12.25 | | | $ | 12.27 | | |
Total Return(4) | | | 7.09 | % | | | 11.34 | % | | | (2.64 | )% | | | 1.81 | %(5) | | | 16.47 | %(6) | |
Ratios to Average Net Assets and Supplemental Data: | |
Net Assets, End of Period (Thousands) | | $ | 3,222 | | | $ | 2,801 | | | $ | 2,074 | | | $ | 1,084 | | | $ | 126 | | |
Ratio of Expenses Before Expense Limitation | | | 1.90 | % | | | 2.01 | % | | | 2.15 | % | | | 2.82 | % | | | 4.45 | % | |
Ratio of Expenses After Expense Limitation | | | 1.80 | %(7) | | | 1.80 | %(7) | | | 1.80 | %(7) | | | 1.80 | %(7) | | | 1.79 | %(7) | |
Ratio of Net Investment Income | | | 1.42 | %(7) | | | 2.24 | %(7) | | | 2.10 | %(7) | | | 1.71 | %(7) | | | 1.90 | %(7) | |
Ratio of Rebate from Morgan Stanley Affiliates | | | 0.00 | %(8) | | | 0.00 | %(8) | | | 0.00 | %(8) | | | 0.00 | %(8) | | | 0.01 | % | |
Portfolio Turnover Rate | | | 133 | % | | | 64 | % | | | 37 | % | | | 33 | % | | | 41 | % | |
(1) Reflects prior period custodian out-of-pocket expenses that were reimbursed in September 2016. The amount of the reimbursement was immaterial on a per share basis and did not impact the total return of Class C shares. The Ratio of Expenses After Expense Limitation and the Ratio of Net Investment Income would be unchanged as the reimbursement of custodian fees was offset against expense waivers/reimbursements with no impact to net expenses or net investment income.
(2) Per share amount is based on average shares outstanding.
(3) Amount is less than $0.005 per share.
(4) Calculated based on the net asset value which does not reflect sales charges, if applicable, as of the last business day of the period.
(5) Performance was positively impacted by approximately 0.85% due to the receipt of proceeds from the settlement of class action suits involving the Fund's past holdings. These were one-time settlements, and as a result, the impact on the NAV and consequently the performance will not likely be repeated in the future. Had these settlements not occurred, the total return for Class C shares would have been approximately 0.96%.
(6) Performance was positively impacted by approximately 8.85% due to the receipt of proceeds from the settlement of class action suits involving the Fund's past holdings. These were one-time settlements, and as a result, the impact on the NAV and consequently the performance will not likely be repeated in the future. Had these settlements not occurred, the total return for Class C shares would have been approximately 7.62%.
(7) The Ratio of Expenses After Expense Limitation and Ratio of Net Investment Income reflect the rebate of certain Fund expenses in connection with the investments in Morgan Stanley affiliates during the period. The effect of the rebate on the ratios is disclosed in the above table as "Ratio of Rebate from Morgan Stanley Affiliates."
(8) Amount is less than 0.005%.
The accompanying notes are an integral part of the financial statements.
22
Morgan Stanley Institutional Fund Trust
Annual Report — September 30, 2020
Notes to Financial Statements
Morgan Stanley Institutional Fund Trust ("Trust'') is registered under the Investment Company Act of 1940, as amended (the "Act''), as an open-end management investment company. The Trust is comprised of twelve separate, active funds (individually referred to as a "Fund," collectively as the "Funds"). The Trust applies investment company accounting and reporting guidance. All Funds are considered diversified for purposes of the Act.
The accompanying financial statements relate to the Corporate Bond Portfolio. The Fund seeks above-average total return over a market cycle of three to five years. The Fund offers four classes of shares — Class I, Class A, Class L and Class C.
The Fund has suspended offering Class L shares for sale to all investors. Class L shareholders of the Fund do not have the option to purchasing additional Class L shares. However, existing Class L shareholders may invest in additional Class L shares through reinvestment of dividends and distributions.
A. Significant Accounting Policies: The following significant accounting policies are in conformity with U.S. generally accepted accounting principles ("GAAP"). Such policies are consistently followed by the Trust in the preparation of its financial statements. GAAP may require management to make estimates and assumptions that affect the reported amounts and disclosures in the financial statements. Actual results may differ from those estimates.
In March 2017, the Financial Accounting Standards Board ("FASB") issued an Accounting Standard Update, ASU 2017-08, Receivables-Nonrefundable Fees and Other Costs (Subtopic 310-20), Premium Amortization on Purchased Callable Debt Securities ("ASU 2017-08") which amends the amortization period for certain purchased callable debt securities held at a premium, shortening such period to the earliest call date. ASU 2017-08 does not require any accounting change for debt securities held at a discount; the discount continues to be accreted to maturity. ASU 2017-08 is effective for fiscal years, and interim periods within those fiscal years, beginning after December 15, 2018. The adoption resulted in a change in accounting principle, since the Fund had historically amortized such premiums to maturity for U.S. GAAP. Accordingly, the Fund has adopted ASU 2017-08 to amend the premium amortization period for certain purchased callable debt securities with non-contingent call features to the earliest call date. It is impracticable to evaluate the effect on individual prior periods, therefore the Fund applied the amendments on a modified retrospective basis by recognizing a
cumulative effect adjustment that decreased the beginning of period cost of investments and increased the unrealized appreciation on investments of approximately $1,000.
This change in accounting policy has been made to comply with the newly issued accounting standard and had no impact on total accumulated earnings (loss) or the net asset value of the Fund. With respect to the Fund's results of operations, amortization of premium to first call date accelerates amortization with the intent of more closely aligning the recognition of income on such bonds with the economics of the instrument.
In March 2020, FASB issued an Accounting Standard Update, ASU 2020-04, Reference Rate Reform (Topic 848) — Facilitation of the Effects of Reference Rate Reform on Financial Reporting ("ASU 2020-04"), which provides optional, temporary relief with respect to the financial reporting of contracts subject to certain types of modifications due to the planned discontinuation of the London Interbank Offered Rate ("LIBOR") and other IBOR-based reference rates at the end of 2021. The temporary relief provided by ASU 2020-04 is effective for certain reference rate-related contract modifications that occur during the period from March 12, 2020 through December 31, 2022. Management is evaluating the impact of ASU 2020-04 on the Fund's investments, derivatives, debt and other contracts that will undergo reference rate-related modifications as a result of the reference rate reform.
1. Security Valuation: (1) Certain portfolio securities may be valued by an outside pricing service/vendor approved by the Trust's Board of Trustees (the "Trustees"). The pricing service/vendor may employ a pricing model that takes into account, among other things, bids, yield spreads and/or other market data and specific security characteristics. Alternatively, if a valuation is not available from an outside pricing service/vendor, and the security trades on an exchange, the security may be valued at its latest reported sale price (or at the exchange official closing price if such exchange reports an official closing price), prior to the time when assets are valued. If there are no sales on a given day and if there is no official exchange closing price for that day, the security is valued at the mean between the last reported bid and asked prices if such bid and asked prices are available in the relevant exchanges. If only bid prices are available then the latest bid price may be used. If Morgan Stanley Investment Management Inc. (the "Adviser"), a wholly-owned subsidiary of Morgan Stanley, determines that the price provided by the outside pricing service/vendor or exchange does not reflect the security's
23
Morgan Stanley Institutional Fund Trust
Annual Report — September 30, 2020
Notes to Financial Statements (cont'd)
fair value or is unable to provide a price, prices from brokers or dealers may also be utilized. In these circumstances, the value of the security will be the mean of bid and asked prices obtained from brokers or dealers; (2) futures are valued at the settlement price on the exchange on which they trade or, if a settlement price is unavailable, at the last sale price on the exchange; (3) over-the-counter ("OTC") swaps may be valued by an outside pricing service approved by the Trustees or quotes from a broker or dealer. Swaps cleared on a clearinghouse or exchange may be valued using the closing price provided by the clearinghouse or exchange; (4) when market quotations are not readily available, including circumstances under which the Adviser determines that the closing price, last sale price or the mean between the last reported bid and asked prices are not reflective of a security's market value, portfolio securities are valued at their fair value as determined in good faith under procedures established by and under the general supervision of the Trustees. Occasionally, developments affecting the closing prices of securities and other assets may occur between the times at which valuations of such securities are determined (that is, close of the foreign market on which the securities trade) and the close of business of the New York Stock Exchange ("NYSE"). If developments occur during such periods that are expected to materially affect the value of such securities, such valuations may be adjusted to reflect the estimated fair value of such securities as of the close of the NYSE, as determined in good faith by the Trustees or by the Adviser using a pricing service and/or procedures approved by the Trustees; (5) quotations of foreign portfolio securities, other assets and liabilities and forward contracts stated in foreign currency are translated into U.S. dollar equivalents at the prevailing market rates prior to the close of the NYSE; and (6) investments in mutual funds, including the Morgan Stanley Institutional Liquidity Funds, are valued at the net asset value ("NAV") as of the close of each business day.
The Trustees have responsibility for determining in good faith the fair value of the investments, and the Trustees may appoint others, such as the Trust's Adviser or a valuation committee, to assist the Trustees in determining fair value and to make the actual calculations pursuant to the fair valuation methodologies previously approved by the Trustees. Under procedures approved by the Trustees, the Trust's Adviser has formed a Valuation Committee whose members are approved by the
Trustees. The Valuation Committee provides administration and oversight of the Trust's valuation policies and procedures, which are reviewed at least annually by the Trustees. These procedures allow the Trust to utilize independent pricing services, quotations from securities and financial instrument dealers and other market sources to determine fair value.
2. Fair Value Measurement: FASB Accounting Standards CodificationTM ("ASC") 820, "Fair Value Measurement" ("ASC 820"), defines fair value as the value that the Fund would receive to sell an investment or pay to transfer a liability in a timely transaction with an independent buyer in the principal market, or in the absence of a principal market, the most advantageous market for the investment or liability. ASC 820 establishes a three-tier hierarchy to distinguish between (1) inputs that reflect the assumptions market participants would use in valuing an asset or liability developed based on market data obtained from sources independent of the reporting entity (observable inputs) and (2) inputs that reflect the reporting entity's own assumptions about the assumptions market participants would use in valuing an asset or liability developed based on the best information available in the circumstances (unobservable inputs) and to establish classification of fair value measurements for disclosure purposes. Various inputs are used in determining the value of the Fund's investments. The inputs are summarized in the three broad levels listed below:
• Level 1 – unadjusted quoted prices in active markets for identical investments
• Level 2 – other significant observable inputs (including quoted prices for similar investments, interest rates, prepayment speeds, credit risk, etc.)
• Level 3 – significant unobservable inputs including the Fund's own assumptions in determining the fair value of investments. Factors considered in making this determination may include, but are not limited to, information obtained by contacting the issuer, analysts, or the appropriate stock exchange (for exchange-traded securities), analysis of the issuer's financial statements or other available documents and, if necessary, available information concerning other securities in similar circumstances.
24
Morgan Stanley Institutional Fund Trust
Annual Report — September 30, 2020
Notes to Financial Statements (cont'd)
The inputs or methodology used for valuing securities are not necessarily an indication of the risk associated with investing in those securities and the determination of the significance of a particular input to the fair value measurement in its entirety requires judgment and considers factors specific to each security.
The following is a summary of the inputs used to value the Fund's investments as of September 30, 2020:
Investment Type | | Level 1
Unadjusted
quoted
prices
(000) | | Level 2
Other
significant
observable
inputs
(000) | | Level 3
Significant
unobservable
inputs
(000) | | Total
(000) | |
Assets: | |
Fixed Income
Securities | |
Corporate Bonds | | $ | — | | | $ | 190,001 | | | $ | — | | | $ | 190,001 | | |
Short-Term
Investments | |
Investment Company | | | 9,032 | | | | — | | | | — | | | | 9,032 | | |
U.S. Treasury Security | | | — | | | | 1,864 | | | | — | | | | 1,864 | | |
Total Short-Term
Investments | | | 9,032 | | | | 1,864 | | | | — | | | | 10,896 | | |
Foreign Currency
Forward Exchange
Contract | | | — | | | | 17 | | | | — | | | | 17 | | |
Futures Contracts | | | 23 | | | | — | | | | — | | | | 23 | | |
Credit Default Swap
Agreement | | | — | | | | 52 | | | | — | | | | 52 | | |
Total Assets | | | 9,055 | | | | 191,934 | | | | — | | | | 200,989 | | |
Liabilities: | |
Futures Contracts | | | (208 | ) | | | — | | | | — | | | | (208 | ) | |
Total | | $ | 8,847 | | | $ | 191,934 | | | $ | — | | | $ | 200,781 | | |
Transfers between investment levels may occur as the markets fluctuate and/or the availability of data used in an investment's valuation changes.
3. Foreign Currency Translation and Foreign Investments: The books and records of the Fund are maintained in U.S. dollars. Foreign currency amounts are translated into U.S. dollars as follows:
– investments, other assets and liabilities at the prevailing rate of exchange on the valuation date;
– investment transactions and investment income at the prevailing rates of exchange on the dates of such transactions.
Although the net assets of the Fund are presented at the foreign exchange rates and market values at the close of the period, the Fund does not isolate that portion of the results of operations arising as a result of changes in the foreign exchange rates from the fluctuations arising
from changes in the market prices of securities held at period end. Similarly, the Fund does not isolate the effect of changes in foreign exchange rates from the fluctuations arising from changes in the market prices of securities sold during the period. Accordingly, realized and unrealized foreign currency gains (losses) on investments in securities are included in the reported net realized and unrealized gains (losses) on investment transactions and balances. However, pursuant to U.S. federal income tax regulations, gains and losses from certain foreign currency transactions and the foreign currency portion of gains and losses realized on sales and maturities of foreign denominated debt securities are treated as ordinary income for U.S. federal income tax purposes.
Net realized gains (losses) on foreign currency transactions represent net foreign exchange gains (losses) from foreign currency forward exchange contracts, disposition of foreign currency, currency gains (losses) realized between the trade and settlement dates on securities transactions, and the difference between the amount of investment income and foreign withholding taxes recorded on the Fund's books and the U.S. dollar equivalent amounts actually received or paid. The change in unrealized currency gains (losses) on foreign currency transactions for the period is reflected in the Statement of Operations.
Foreign security and currency transactions may involve certain considerations and risks not typically associated with those of U.S. dollar denominated transactions as a result of, among other factors, fluctuations of exchange rates in relation to the U.S. dollar, the possibility of lower levels of governmental supervision and regulation of foreign securities markets and the possibility of political or economic instability.
Governmental approval for foreign investments may be required in advance of making an investment under certain circumstances in some countries, and the extent of foreign investments in domestic companies may be subject to limitation in other countries. Foreign ownership limitations also may be imposed by the charters of individual companies to prevent, among other concerns, violations of foreign investment limitations. As a result, an additional class of shares (identified as "Foreign" in the Portfolio of Investments) may be created and offered for investment. The "local" and "foreign shares" market
25
Morgan Stanley Institutional Fund Trust
Annual Report — September 30, 2020
Notes to Financial Statements (cont'd)
values may differ. In the absence of trading of the foreign shares in such markets, the Fund values the foreign shares at the closing exchange price of the local shares.
4. Derivatives: The Fund may, but is not required to, use derivative instruments for a variety of purposes, including hedging, risk management, portfolio management or to earn income. Derivatives are financial instruments whose value is based, in part, on the value of an underlying asset, interest rate, index or financial instrument. Prevailing interest rates and volatility levels, among other things, also affect the value of derivative instruments. A derivative instrument often has risks similar to its underlying asset and may have additional risks, including imperfect correlation between the value of the derivative and the underlying asset, risks of default by the counterparty to certain transactions, magnification of losses incurred due to changes in the market value of the securities, instruments, indices or interest rates to which the derivative instrument relates, risks that the transactions may not be liquid and risks arising from margin requirements. The use of derivatives involves risks that are different from, and possibly greater than, the risks associated with other portfolio investments. Derivatives may involve the use of highly specialized instruments that require investment techniques and risk analyses different from those associated with other portfolio investments. All of the Fund's holdings, including derivative instruments, are marked-to-market each day with the change in value reflected in unrealized appreciation (depreciation). Upon disposition, a realized gain or loss is recognized.
Certain derivative transactions may give rise to a form of leverage. Leverage magnifies the potential for gain and the risk of loss. Leverage associated with derivative transactions may cause the Fund to liquidate portfolio positions when it may not be advantageous to do so to satisfy its obligations or to meet earmarking or segregation requirements, pursuant to applicable Securities and Exchange Commission ("SEC") rules and regulations, or may cause the Fund to be more volatile than if the Fund had not been leveraged. Although the Adviser seeks to use derivatives to further the Fund's investment objectives, there is no assurance that the use of derivatives will achieve this result.
Following is a description of the derivative instruments and techniques that the Fund used during the period and their associated risks:
Foreign Currency Forward Exchange Contracts: In connection with its investments in foreign securities, the Fund also entered into contracts with banks, brokers or dealers to purchase or sell securities or foreign currencies at a future date. A foreign currency forward exchange contract ("currency contract") is a negotiated agreement between the contracting parties to exchange a specified amount of currency at a specified future time at a specified rate. The rate can be higher or lower than the spot rate between the currencies that are the subject of the contract. Currency contracts may be used to protect against uncertainty in the level of future foreign currency exchange rates or to gain or modify exposure to a particular currency. In addition, the Fund may use cross currency hedging or proxy hedging with respect to currencies in which the Fund has or expects to have portfolio or currency exposure. Cross currency hedges involve the sale of one currency against the positive exposure to a different currency and may be used for hedging purposes or to establish an active exposure to the exchange rate between any two currencies. To the extent hedged by the use of currency contracts, the precise matching of the currency contract amounts and the value of the securities involved will not generally be possible because the future value of such securities in foreign currencies will change as a consequence of market movements in the value of those securities between the date on which the contract is entered into and the date it matures. Furthermore, such transactions may reduce or preclude the opportunity for gain if the value of the currency should move in the direction opposite to the position taken. There is additional risk to the extent that currency contracts create exposure to currencies in which the Fund's securities are not denominated. Unanticipated changes in currency prices may result in poorer overall performance for the Fund than if it had not entered into such contracts. The use of currency contracts involves the risk of loss from the insolvency or bankruptcy of the counterparty to the contract or the failure of the counterparty to make payments or otherwise comply with the terms of the contract. A currency contract is marked-to-market daily and the change in market value is recorded
26
Morgan Stanley Institutional Fund Trust
Annual Report — September 30, 2020
Notes to Financial Statements (cont'd)
by the Fund as unrealized gain or loss. The Fund records realized gains (losses) when the currency contract is closed equal to the difference between the value of the currency contract at the time it was opened and the value at the time it was closed.
Futures: A futures contract is a standardized, exchange-traded agreement to buy or sell a specific quantity of an underlying asset, reference rate or index at a specific price at a specific future time. The value of a futures contract tends to increase and decrease in tandem with the value of the underlying instrument. Depending on the terms of the particular contract, futures contracts are settled through either physical delivery of the underlying instrument on the settlement date or by payment of a cash settlement amount on the settlement date. During the period the futures contract is open, payments are received from or made to the broker based upon changes in the value of the contract (the variation margin). A decision as to whether, when and how to use futures contracts involves the exercise of skill and judgment and even a well-conceived futures transaction may be unsuccessful because of market behavior or unexpected events. In addition to the derivatives risks discussed above, the prices of futures contracts can be highly volatile, using futures contracts can lower total return and the potential loss from futures contracts can exceed the Fund's initial investment in such contracts. No assurance can be given that a liquid market will exist for any particular futures contract at any particular time. There is also the risk of loss by the Fund of margin deposits in the event of bankruptcy of a broker with which the Fund has open positions in the futures contract.
Swaps: The Fund may enter into OTC swap contracts or cleared swap transactions. A swap contract is an agreement between two parties pursuant to which the parties exchange payments at specified dates on the basis of a specified notional amount, with the payments calculated by reference to specified securities, indices, reference rates, currencies or other instruments. Typically swap agreements provide that when the period payment dates for both parties are the same, the payments are made on a net basis (i.e., the two payment streams are netted out, with only the net amount paid by one party to the other). The Fund's obligations or rights under a swap contract entered into on a net basis will generally be equal only to the net amount to be paid or received
under the agreement, based on the relative values of the positions held by each party. Cleared swap transactions may help reduce counterparty credit risk. In a cleared swap, the Fund's ultimate counterparty is a clearinghouse rather than a swap dealer, bank or other financial institution. OTC swap agreements are not entered into or traded on exchanges and often there is no central clearing or guaranty function for OTC swaps. These OTC swaps are often subject to credit risk or the risk of default or non-performance by the counterparty. Both OTC and cleared swaps could result in losses if interest rates, foreign currency exchange rates or other factors are not correctly anticipated by the Fund or if the reference index, security or investments do not perform as expected. During the period swap agreements are open, payments are received from or made to the clearinghouse or counterparty based upon changes in the value of the contract (variation margin). The Dodd-Frank Wall Street Reform and Consumer Protection Act and related regulatory developments require the clearing and exchange-trading of certain standardized swap transactions. Mandatory exchange-trading and clearing is occurring on a phased-in basis.
The Fund's use of swaps during the period included those based on the credit of an underlying security commonly referred to as "credit default swaps." The Fund may be either the buyer or seller in a credit default swap. Where the Fund is the buyer of a credit default swap contract, it would typically be entitled to receive the par (or other agreed-upon) value of a referenced debt obligation from the counterparty to the contract only in the event of a default or similar event by the issuer of the debt obligation. If no default occurs, the Fund would have paid to the counterparty a periodic stream of payments over the term of the contract and received no benefit from the contract. When the Fund is the seller of a credit default swap contract, it typically receives the stream of payments but is obligated to pay an amount equal to the par (or other agreed-upon) value of a referenced debt obligation upon the default or similar event by the issuer of the referenced debt obligation. The use of credit default swaps could result in losses to the Fund if the Adviser fails to correctly evaluate the creditworthiness of the issuer of the referenced debt obligation.
If the Fund is a seller of protection and a credit event occurs, as defined under the terms of that particular
27
Morgan Stanley Institutional Fund Trust
Annual Report — September 30, 2020
Notes to Financial Statements (cont'd)
swap agreement, the Fund will either (i) pay to the buyer of protection an amount equal to the notional amount of the swap agreement and take delivery of the referenced obligation, other deliverable obligations or underlying securities comprising the referenced index or (ii) pay a net settlement amount in the form of cash or securities equal to the notional amount of the swap agreement less the recovery value of the referenced obligation or underlying securities comprising the referenced index. If the Fund is a buyer of protection and a credit event occurs, as defined under the terms of that particular swap agreement, the Fund will either (i) receive from the seller of protection an amount equal to the notional amount of the swap agreement and deliver the referenced obligation, other deliverable obligations or underlying securities comprising the referenced index or (ii) receive a net settlement amount in the form of cash or securities equal to the notional amount of the swap agreement less the recovery value of the referenced obligation or underlying securities comprising the referenced index. Recovery values are estimated by market makers considering either industry standard recovery rates or entity specific factors and considerations until a credit event occurs. If a credit event has occurred, the recovery value is determined by a facilitated auction whereby a minimum number of allowable broker bids, together with a specified valuation method, are used to calculate the settlement value. The Fund's maximum risk of loss from counterparty risk, either as the protection seller or as the protection buyer, is the fair value of the swap agreement.
The current credit rating of each individual issuer is listed in the table following the Portfolio of Investments and serves as an indicator of the current status of the payment/performance risk of the credit derivative. Alternatively, for credit default swaps on an index of credits, the quoted market prices and current values serve as an indicator of the current status of the payment/performance risk of the credit derivative. Generally, lower credit ratings and increasing market values, in absolute terms, represent a deterioration of the credit and a greater likelihood of an adverse credit event of the issuer.
When the Fund has an unrealized loss on a swap agreement, the Fund has instructed the custodian to pledge cash or liquid securities as collateral with a value approximately equal to the amount of the unrealized loss.
Collateral pledges are monitored and subsequently adjusted if and when the swap valuations fluctuate. If applicable, cash collateral is included with "Due from (to) Broker" in the Statement of Assets and Liabilities.
Upfront payments paid or received by the Fund will be reflected as an asset or liability, respectively, in the Statement of Assets and Liabilities.
FASB ASC 815, "Derivatives and Hedging" ("ASC 815"), is intended to improve financial reporting about derivative instruments by requiring enhanced disclosures to enable investors to better understand how and why the Fund uses derivative instruments, how these derivative instruments are accounted for and their effects on the Fund's financial position and results of operations.
The following tables set forth the fair value of the Fund's derivative contracts by primary risk exposure as of September 30, 2020:
| | | Asset Derivatives
Statement of Assets and
Liabilities Location | | Primary Risk
Exposure | | Value
(000) | |
Foreign Currency
Forward Exchange
Contracts | | Unrealized Appreciation on
Foreign Currency Forward
Exchange Contracts | | Currency Risk | | $ | 17 | | |
Futures Contracts
| | Variation Margin on
Futures Contracts | | Interest Rate Risk | | | 23 | (a) | |
Swap Agreement
| | Variation Margin on
Swap Agreement | | Credit Risk | | | 52 | (a) | |
Total | | | | | | $ | 92 | | |
| | | Liability Derivatives
Statement of Assets and
Liabilities Location | | Primary Risk
Exposure | | Value
(000) | |
Futures Contracts | | Variation Margin on
Futures Contracts | | Interest Rate Risk | | $ | (208 | )(a) | |
(a) This amount represents the cumulative appreciation (depreciation) as reported in the Portfolio of Investments. The Statement of Assets and Liabilities only reflects the current day's net variation margin.
The following tables set forth by primary risk exposure the Fund's realized gains (losses) and change in unrealized appreciation (depreciation) by type of derivative contract for the year ended September 30, 2020 in accordance with ASC 815:
Realized Gain (Loss) | |
Primary Risk Exposure | | Derivative Type | | Value
(000) | |
| Currency Risk Foreign Currency Forward | |
Exchange Contracts | | $ | (76 | ) | |
Interest Rate Risk | | Futures Contracts | | | 353 | | |
Credit Risk | | Swap Agreements | | | 90 | | |
Interest Rate Risk | | Swap Agreements | | | (1,061 | ) | |
Total | | | | | | $ | (694 | ) | |
28
Morgan Stanley Institutional Fund Trust
Annual Report — September 30, 2020
Notes to Financial Statements (cont'd)
Change in Unrealized Appreciation (Depreciation) | |
Primary Risk Exposure | | Derivative Type | | Value
(000) | |
| Currency Risk Foreign Currency Forward | |
Exchange Contracts | | $ | 17 | | |
Interest Rate Risk | | Futures Contracts | | | (21 | ) | |
Credit Risk | | Swap Agreements | | | 52 | | |
Interest Rate Risk | | Swap Agreements | | | 494 | | |
Total | | | | | | $ | 542 | | |
At September 30, 2020, the Fund's derivative assets and liabilities are as follows:
Gross Amounts of Assets and Liabilities
Presented in the Statement of Assets and Liabilities | |
Derivatives(b) | | Assets(c)
(000) | | Liabilities(c)
(000) | |
Foreign Currency Forward Exchange Contracts | | $ | 17 | | | $ | — | | |
(b) Excludes exchange-traded derivatives.
(c) Absent an event of default or early termination, OTC derivative assets and liabilities are presented gross and not offset in the Statement of Assets and Liabilities.
The Fund typically enters into International Swaps and Derivatives Association, Inc. Master Agreements ("ISDA Master Agreements") or similar master agreements (collectively, "Master Agreements") with its contract counterparties for certain OTC derivatives in order to, among other things, reduce its credit risk to counterparties. ISDA Master Agreements include provisions for general obligations, representations, collateral and events of default or termination. Under an ISDA Master Agreement, the Fund typically may offset with the counterparty certain OTC derivative financial instruments' payables and/or receivables with collateral held and/or posted and create one single net payment (close-out netting) in the event of default, termination and/or potential deterioration in the credit quality of the counterparty. Various Master Agreements govern the terms of certain transactions with counterparties, including transactions such as swap, forward, repurchase and reverse repurchase agreements. These Master Agreements typically attempt to reduce the counterparty risk associated with such transactions by specifying credit protection mechanisms and providing standardization that improves legal certainty. Cross-termination provisions under Master Agreements typically provide that a default in connection with one transaction between the Fund and a counterparty gives the non-defaulting party the right to terminate any other transactions in place with the defaulting party to create one single net payment due to/due from the defaulting party and may be a feature in certain Master Agreements. In the event the Fund exercises its right to terminate a Master Agreement
after a counterparty experiences a termination event as defined in the Master Agreement, the return of collateral with market value in excess of the Fund's net liability may be delayed or denied.
The following table presents derivative financial instruments that are subject to enforceable netting arrangements as of September 30, 2020:
Gross Amounts Not Offset in the Statement of Assets and Liabilities | |
Counterparty | | Gross Asset
Derivatives
Presented in the
Statement of
Assets and
Liabilities
(000) | | Financial
Instrument
(000) | | Collateral
Received
(000) | | Net Amount
(not less
than $0)
(000) | |
Citibank NA | | $ | 17 | | | $ | — | | | $ | — | | | $ | 17 | | |
For the year ended September 30, 2020, the approximate average monthly amount outstanding for each derivative type is as follows:
Foreign Currency Forward Exchange Contracts: | |
Average monthly principal amount | | $ | 840,000 | | |
Futures Contracts: | |
Average monthly notional value | | $ | 72,277,000 | | |
Swap Agreements: | |
Average monthly notional amount | | $ | 4,444,000 | | |
5. Securities Lending: The Fund lends securities to qualified financial institutions, such as broker-dealers, to earn additional income. Any increase or decrease in the fair value of the securities loaned that might occur and any interest earned or dividends declared on those securities during the term of the loan would remain in the Fund. The Fund would receive cash or securities as collateral in an amount equal to or exceeding 100% of the current fair value of the loaned securities. The collateral is marked-to-market daily by State Street Bank and Trust Company ("State Street"), the securities lending agent, to ensure that a minimum of 100% collateral coverage is maintained.
Based on pre-established guidelines, the securities lending agent invests any cash collateral that is received in an affiliated money market portfolio and repurchase agreements. Securities lending income is generated from the earnings on the invested collateral and borrowing fees, less any rebates owed to the borrowers and compensation to the lending agent, and is recorded as "Income from Securities Loaned — Net" in the Fund's Statement of Operations. Risks in securities lending transactions are that a borrower may not provide additional collateral when required or return the securities when due, and
29
Morgan Stanley Institutional Fund Trust
Annual Report — September 30, 2020
Notes to Financial Statements (cont'd)
that the value of the short-term investments will be less than the amount of cash collateral plus any rebate that is required to be returned to the borrower.
The Fund has the right under the securities lending agreement to recover the securities from the borrower on demand.
The following table presents financial instruments that are subject to enforceable netting arrangements as of September 30, 2020:
Gross Amounts Not Offset in the Statement of Assets and Liabilities | |
Gross Asset
Amounts
Presented in the
Statement of
Assets and
Liabilities
(000) | | Financial
Instrument
(000) | | Collateral
Received
(000) | | Net Amount
(not less
than $0)
(000) | |
| $ | 3,559 | (d) | | $ | — | | | $ | (3,559 | )(e)(f) | | $ | 0 | | |
(d) Represents market value of loaned securities at year end.
(e) The Fund received cash collateral of approximately $3,247,000 which was subsequently invested in Morgan Stanley Institutional Liquidity Funds as reported in the Portfolio of Investments. In addition, the Fund received non-cash collateral of approximately $393,000 in the form of U.S. Government obligations, which the Fund cannot sell or repledge, and accordingly are not reflected in the Portfolio of Investments.
(f) The actual collateral received is greater than the amount shown here due to overcollateralization.
FASB ASC 860, "Transfers & Servicing: Repurchase-to-Maturity Transactions, Repurchase Financings, and Disclosures", is intended to provide increased transparency about the types of collateral pledged in securities lending transactions and other similar transactions that are accounted for as secured borrowing.
The following table displays a breakdown of transactions accounted for as secured borrowings, the gross obligations by class of collateral pledged and the remaining contractual maturity of those transactions as of September 30, 2020:
Remaining Contractual Maturity of the Agreements | |
| | | Overnight and
Continuous
(000) | | <30 days
(000) | | Between
30 &
90 days
(000) | | >90 days
(000) | | Total
(000) | |
Securities Lending
Transactions | |
Corporate Bonds | | $ | 3,247 | | | $ | — | | | $ | — | | | $ | — | | | $ | 3,247 | | |
Total Borrowings | | $ | 3,247 | | | $ | — | | | $ | — | | | $ | — | | | $ | 3,247 | | |
Gross amount of
recognized liabilities
for securities lending
transactions | | | | | | | | | | $ | 3,247 | | |
6. When-Issued/Delayed Delivery Securities: The Fund purchases and sells when-issued and delayed delivery securities. Securities purchased on a when-issued or delayed delivery basis are purchased for delivery beyond the normal settlement date at a stated price and yield, and no income accrues to the Fund on such securities prior to delivery date. Payment and delivery for when-issued and delayed delivery securities can take place a month or more after the date of the transaction. When the Fund enters into a purchase transaction on a when-issued or delayed delivery basis, securities are available for collateral in an amount at least equal in value to the Fund's commitments to purchase such securities. Purchasing securities on a when-issued or delayed delivery basis may involve a risk that the market price at the time of delivery may be lower than the agreed upon purchase price, in which case there could be an unrealized loss at the time of delivery. Purchasing investments on a when-issued or delayed delivery basis may be considered a form of leverage which may increase the impact that gains (losses) may have on the Fund.
7. Indemnifications: The Trust enters into contracts that contain a variety of indemnifications. The Trust's maximum exposure under these arrangements is unknown. However, the Trust has not had prior claims or losses pursuant to these contracts and expects the risk of loss to be remote.
8. Dividends and Distributions to Shareholders: Dividends and distributions to shareholders are recorded on the ex-dividend date. Dividends from net investment income, if any, are declared and paid monthly. Net realized capital gains, if any, are distributed at least annually.
9. Security Transactions, Income and Expenses: Security transactions are accounted for on the trade date (date the order to buy or sell is executed). Realized gains and losses on the sale of investment securities are determined on the specific identified cost method. Dividend income and other distributions are recorded on the ex-dividend date (except for certain foreign dividends which may be recorded as soon as the Fund is informed of such dividends) net of applicable withholding taxes. Interest income is recognized on the accrual basis except where collection is in doubt. Discounts are accreted and premiums are amortized over the life of the respective securities. Most expenses of the Trust can be directly attributed to a particular Fund. Expenses which cannot be directly
30
Morgan Stanley Institutional Fund Trust
Annual Report — September 30, 2020
Notes to Financial Statements (cont'd)
attributed are apportioned among the Funds based upon relative net assets or other appropriate methods. Income, expenses (other than class specific expenses — distribution and shareholder services, transfer agency and sub transfer agency fees) and realized and unrealized gains or losses are allocated to each class of shares based upon their relative net assets.
B. Advisory Fees: The Adviser, a wholly-owned subsidiary of Morgan Stanley, provides the Fund with advisory services under the terms of an Investment Advisory Agreement, paid quarterly, at an annual rate of 0.375% of the average daily net assets of the Fund.
The Adviser has agreed to reduce its advisory fee and/or reimburse the Fund so that total annual Fund operating expenses, excluding certain investment related expenses, taxes, interest and other extraordinary expenses (including litigation), will not exceed 0.70% for Class I shares, 1.05% for Class A shares, 1.52% for Class L shares and 1.80% for Class C shares. The fee waivers and/or expense reimbursements will continue for at least one year from the date of the Fund's prospectus or until such time as the Trustees act to discontinue all or a portion of such waivers and/or reimbursements when they deem such action is appropriate. For the year ended September 30, 2020, approximately $9,000 of advisory fees were waived and approximately $215,000 of other expenses were reimbursed by the Adviser pursuant to this arrangement.
C. Administration Fees: The Adviser also serves as Administrator to the Trust and provides administrative services pursuant to an Administration Agreement for an annual fee, accrued daily and paid monthly, of 0.08% of the Fund's average daily net assets. Under a Sub-Administration Agreement between the Administrator and State Street, State Street provides certain administrative services to the Trust. For such services, the Administrator pays State Street a portion of the fee the Administrator receives from the Fund.
D. Distribution and Shareholder Services Fees: Morgan Stanley Distribution, Inc. ("MSDI" or the "Distributor"), a wholly-owned subsidiary of the Adviser, and an indirect subsidiary of Morgan Stanley, serves as the Trust's Distributor of Fund shares pursuant to a Distribution Agreement. The Trust has adopted a Shareholder Services Plan with respect to Class A shares pursuant to Rule 12b-1 under the Act. Under the Shareholder Services Plan, the Fund pays the Distributor a shareholder services fee, accrued daily and paid monthly, at an annual rate of 0.25% of the Fund's average daily net assets attributable to Class A shares. The Distributor
has agreed to waive the 12b-1 fees on Class A shares of the Fund to the extent it exceeds 0.15% of the average daily net assets of such shares on an annualized basis. For the year ended September 30, 2020, this waiver amounted to approximately $8,000.
The Trust has adopted a Distribution and Shareholder Services Plan with respect to Class L shares pursuant to Rule 12b-1 under the Act. Under the Distribution and Shareholder Services Plan, the Fund pays the Distributor a distribution fee, accrued daily and paid monthly, at an annual rate of 0.25% and a shareholder services fee, accrued daily and paid monthly, at an annual rate of 0.25% of the Fund's average daily net assets attributable to Class L shares.
The Trust has adopted a Distribution and Shareholder Services Plan with respect to Class C shares pursuant to Rule 12b-1 under the Act. Under the Distribution and Shareholder Services Plan, the Fund pays the Distributor a distribution fee, accrued daily and paid monthly, at an annual rate of 0.75% and a shareholder services fee, accrued daily and paid monthly, at an annual rate of 0.25% of the Fund's average daily net assets attributable to Class C shares.
The distribution and shareholder services fees are used to support the expenses associated with servicing and maintaining accounts. The Distributor may compensate other parties for providing shareholder support services to investors who purchase Class A, Class L and Class C shares.
E. Dividend Disbursing and Transfer Agent: The Trust's dividend disbursing and transfer agent is DST Asset Manager Solutions, Inc. ("DST"). Pursuant to a Transfer Agency Agreement, the Trust pays DST a fee based on the number of classes, accounts and transactions relating to the Funds of the Trust.
F. Custodian Fees: State Street (the "Custodian") also serves as Custodian for the Trust in accordance with a Custodian Agreement. The Custodian holds cash, securities and other assets of the Trust as required by the Act. Custody fees are payable monthly based on assets held in custody, investment purchases and sales activity and account maintenance fees, plus reimbursement for certain out-of-pocket expenses.
G. Security Transactions and Transactions with Affiliates: For the year ended September 30, 2020, purchases and sales of investment securities for the Fund, other than long-term U.S. Government securities and short-term investments were approximately $251,198,000 and $195,731,000, respectively. There were no purchases and sales of long-term
31
Morgan Stanley Institutional Fund Trust
Annual Report — September 30, 2020
Notes to Financial Statements (cont'd)
U.S. Government securities for the year ended September 30, 2020.
The Fund invests in the Institutional Class of the Morgan Stanley Institutional Liquidity Funds — Government Portfolio (the "Liquidity Funds"), an open-end management investment company managed by the Adviser, both directly and as a portion of the securities held as collateral on loaned securities. Advisory fees paid by the Fund are reduced by an amount equal to its pro-rata share of the advisory and administration fees paid by the Fund due to its investment in the Liquidity Funds. For the year ended September 30, 2020, advisory fees paid were reduced by approximately $5,000 relating to the Fund's investment in the Liquidity Funds.
A summary of the Fund's transactions in shares of affiliated investments during the year ended September 30, 2020 is as follows:
Affiliated
Investment
Company | | Value
September 30,
2019
(000) | | Purchases
at Cost
(000) | | Proceeds
from Sales
(000) | | Dividend
Income
(000) | |
Liquidity Funds | | $ | 6,412 | | | $ | 85,236 | | | $ | 82,616 | | | $ | 24 | | |
Affiliated
Investment
Company (cont'd) | | Realized
Gain (Loss)
(000) | | Change in
Unrealized
Appreciation
(Depreciation)
(000) | | Value
September 30,
2020
(000) | |
Liquidity Funds | | $ | — | | | $ | — | | | $ | 9,032 | | |
The Fund is permitted to purchase and sell securities ("cross-trade") from and to other Morgan Stanley funds as well as other funds and client accounts for which the Adviser or an affiliate of the Adviser serves as investment adviser, pursuant to procedures approved by the Trustees in compliance with Rule 17a-7 under the Act (the "Rule"). Each cross-trade is executed at the current market price in compliance with provisions of the Rule. For the year ended September 30, 2020, the Fund did not engage in any cross-trade transactions.
The Fund has an unfunded Deferred Compensation Plan (the "Compensation Plan"), which allows each independent Trustee to defer payment of all, or a portion, of the fees he or she receives for serving on the Board of Trustees. Each eligible Trustee generally may elect to have the deferred amounts credited with a return equal to the total return on one or more of the Morgan Stanley funds that are offered as investment options under the Compensation Plan. Appreciation/depreciation and distributions received from these investments are recorded with an offsetting increase/decrease in the deferred compensation obligation and do not affect the NAV of the Fund.
H. Federal Income Taxes: It is the Fund's intention to continue to qualify as a regulated investment company and distribute all of its taxable and tax-exempt income. Accordingly, no provision for federal income taxes is required in the financial statements.
The Fund may be subject to taxes imposed by countries in which it invests. Such taxes are generally based on income and/or capital gains earned or repatriated. Taxes are accrued based on net investment income, net realized gains and net unrealized appreciation as such income and/or gains are earned. Taxes may also be based on transactions in foreign currency and are accrued based on the value of investments denominated in such currency.
FASB ASC 740-10, "Income Taxes — Overall", sets forth a minimum threshold for financial statement recognition of the benefit of a tax position taken or expected to be taken in a tax return. Management has concluded there are no significant uncertain tax positions that would require recognition in the financial statements. If applicable, the Fund recognizes interest accrued related to unrecognized tax benefits in "Interest Expense" and penalties in "Other Expenses" in the Statement of Operations. The Fund files tax returns with the U.S. Internal Revenue Service, New York and various states. Generally, each of the tax years in the four-year period ended September 30, 2020 remains subject to examination by taxing authorities.
The tax character of distributions paid may differ from the character of distributions shown for GAAP purposes due to short-term capital gains being treated as ordinary income for tax purposes. The tax character of distributions paid during fiscal years 2020 and 2019 was as follows:
2020 Distributions
Paid From:
Ordinary Income
(000) | | 2019 Distributions
Paid From:
Ordinary Income
(000) | |
| $ | 3,688 | | | $ | 4,571 | | |
The amount and character of income and gains to be distributed are determined in accordance with income tax regulations which may differ from GAAP. These book/tax differences are either considered temporary or permanent in nature.
Temporary differences are attributable to differing book and tax treatments for the timing of the recognition of gains (losses) on certain investment transactions and the timing of the deductibility of certain expenses.
The Fund had no permanent differences causing reclassifications among the components of net assets for the year ended September 30, 2020.
32
Morgan Stanley Institutional Fund Trust
Annual Report — September 30, 2020
Notes to Financial Statements (cont'd)
At September 30, 2020, the components of distributable earnings for the Fund on a tax basis were as follows:
Undistributed
Ordinary
Income
(000) | | Undistributed
Long-Term
Capital Gain
(000) | |
| $ | 2,479 | | | $ | 4,127 | | |
During the year ended September 30, 2020, the Fund utilized capital loss carryforwards for U. S. federal income tax purposes of approximately $1,265,000.
I. Credit Facility: The Trust and other Morgan Stanley funds participated in a $300,000,000 committed, unsecured revolving line of credit facility (the "Facility") with State Street. This Facility is to be used for temporary emergency purposes or funding of shareholder redemption requests. The interest rate on borrowings is based on the federal funds rate or 1 month LIBOR rate plus a spread. The Facility also has a commitment fee of 0.25% per annum based on the unused portion of the Facility. During the year ended September 30, 2020, the Fund did not have any borrowings under the Facility.
J. Other: At September 30, 2020, the Fund had record owners of 10% or greater. Investment activities of these shareholders could have a material impact on the Fund. The aggregate percentage of such owners was 47.5%.
K. Market Risk: Certain impacts to public health conditions particular to the coronavirus (COVID-19) outbreak could impact the operations and financial performance of certain of the Fund's investments. The extent of the impact to the financial performance of the Fund's investments will depend on future developments, including (i) the duration and spread of the outbreak, (ii) the restrictions and advisories, (iii) the effects on the financial markets, and (iv) the effects on the economy overall, all of which are highly uncertain and cannot be predicted. If the financial performance of the Fund's investments is impacted because of these factors for an extended period, the Fund's investment results may be adversely affected.
L. LIBOR Risk: The Fund's investments, payment obligations and financing terms may be based on floating rates, such as London Interbank Offer Rate ("LIBOR"), Euro Interbank Offered Rate and other similar types of reference rates (each, a "Reference Rate"). These Reference Rates are generally intended to represent the rate at which contributing banks may obtain short-term borrowings from each other within certain financial markets. On July 27, 2017, the Chief Executive of the UK Financial Conduct Authority ("FCA"), which regulates LIBOR, announced that the FCA will no longer persuade
nor require banks to submit rates for the calculation of LIBOR and certain other Reference Rates after 2021. Such announcement indicates that the continuation of LIBOR and other Reference Rates on the current basis cannot and will not be guaranteed after the end of 2021. This announcement and any additional regulatory or market changes may have an adverse impact on the Fund or its investments.
In advance of 2022, regulators and market participants are currently engaged in identifying successor Reference Rates ("Alternative Reference Rates"). Additionally, prior to the end of 2021, it is expected that market participants will focus on the transition mechanisms by which the Reference Rates in existing contracts or instruments may be amended, whether through marketwide protocols, fallback contractual provisions, bespoke negotiations or amendments or otherwise. Nonetheless, the termination of certain Reference Rates presents risks to the Fund. At this time, it is not possible to completely identify or predict the effect of any such changes, any establishment of Alternative Reference Rates or any other reforms to Reference Rates that may be enacted in the UK or elsewhere. The elimination of a Reference Rate or any other changes or reforms to the determination or supervision of Reference Rates could have an adverse impact on the market for or value of any securities or payments linked to those Reference Rates and other financial obligations held by the Fund or on its overall financial condition or results of operations.
33
Morgan Stanley Institutional Fund Trust
Annual Report — September 30, 2020
Report of Independent Registered Public Accounting Firm
To the Shareholders and Board of Trustees of
Morgan Stanley Institutional Fund Trust —
Corporate Bond Portfolio
Opinion on the Financial Statements
We have audited the accompanying statement of assets and liabilities of Corporate Bond Portfolio (the "Fund") (one of the funds constituting Morgan Stanley Institutional Fund Trust (the "Trust")), including the portfolio of investments, as of September 30, 2020, and the related statement of operations for the year then ended, the statements of changes in net assets for each of the two years in the period then ended, the financial highlights for each of the five years in the period then ended and the related notes (collectively referred to as the "financial statements"). In our opinion, the financial statements present fairly, in all material respects, the financial position of the Fund (one of the funds constituting Morgan Stanley Institutional Fund Trust) at September 30, 2020, the results of its operations for the year then ended, the changes in its net assets for each of the two years in the period then ended and its financial highlights for each of the five years in the period then ended, in conformity with U.S. generally accepted accounting principles.
Basis for Opinion
These financial statements are the responsibility of the Trust's management. Our responsibility is to express an opinion on the Fund's financial statements based on our audits. We are a public accounting firm registered with the Public Company Accounting Oversight Board (United States) ("PCAOB") and are required to be independent with respect to the Trust in accordance with the U.S. federal securities law and the applicable rules and regulations of the Securities and Exchange Commission and the PCAOB.
We conducted our audits in accordance with the standards of the PCAOB. Those standards require that we plan and perform the audit to obtain reasonable assurance about whether the financial statements are free of material misstatement, whether due to error or fraud. The Trust is not required to have, nor were we engaged to perform, an audit of the Trust's internal control over financial reporting. As part of our audits we are required to obtain an understanding of internal control over financial reporting but not for the purpose of expressing an opinion on the effectiveness of the Trust's internal control over financial reporting. Accordingly, we express no such opinion.
Our audits included performing procedures to assess the risks of material misstatement of the financial statements, whether due to error or fraud, and performing procedures that respond to those risks. Such procedures included examining, on a test basis, evidence regarding the amounts and disclosures in the financial statements. Our procedures included confirmation of securities owned as of September 30, 2020 by correspondence with the custodian and brokers or by other appropriate auditing procedures where replies from brokers were not received. Our audits also included evaluating the accounting principles used and significant estimates made by management, as well as evaluating the overall presentation of the financial statements. We believe that our audits provide a reasonable basis for our opinion.

We have served as the auditor of one or more Morgan Stanley investment companies since 2000.
Boston, Massachusetts
November 24, 2020
34
Morgan Stanley Institutional Fund Trust
Annual Report — September 30, 2020
Investment Advisory Agreement Approval (unaudited)
Nature, Extent and Quality of Services
The Board reviewed and considered the nature and extent of the investment advisory services provided by the Adviser under the advisory agreement, including portfolio management, investment research and equity and fixed income securities trading. The Board also reviewed and considered the nature and extent of the non-advisory, administrative services provided by the Administrator under the administration agreement, including accounting, operations, clerical, bookkeeping, compliance, business management and planning, legal services and the provision of supplies, office space and utilities at the Adviser's expense. The Board also considered the Adviser's investment in personnel and infrastructure that benefits the Fund. (The Adviser and Administrator together are referred to as the "Adviser" and the advisory and administration agreements together are referred to as the "Management Agreement.") The Board also considered that the Adviser serves a variety of other investment advisory clients and has experience overseeing service providers. The Board also compared the nature of the services provided by the Adviser with similar services provided by non-affiliated advisers as prepared by Broadridge Financial Solutions, Inc. ("Broadridge").
The Board reviewed and considered the qualifications of the portfolio managers, the senior administrative managers and other key personnel of the Adviser who provide the advisory and administrative services to the Fund. The Board determined that the Adviser's portfolio managers and key personnel are well qualified by education and/or training and experience to perform the services in an efficient and professional manner. The Board concluded that the nature and extent of the advisory and administrative services provided were necessary and appropriate for the conduct of the business and investment activities of the Fund and supported its decision to approve the Management Agreement.
Performance, Fees and Expenses of the Fund
The Board reviewed the performance, fees and expenses of the Fund compared to its peers, as prepared by Broadridge, and to appropriate benchmarks where applicable. The Board discussed with the Adviser the performance goals and the actual results achieved in managing the Fund. When considering a fund's performance, the Board and the Adviser place emphasis on trends and longer-term returns (focusing on one-year, three-year and five-year performance, as of December 31, 2019, or since inception, as applicable). When a fund underperforms its benchmark and/or its peer group average, the Board and the Adviser discuss the causes of such underperformance and, where necessary, they discuss specific changes to investment strategy or investment personnel. The Board noted that the Fund's performance was better than its peer group average for the one-, three- and five-year periods. The Board discussed with the Adviser the level of the advisory and administration fees (together, the "management fee") for this Fund relative to comparable funds and/or other accounts advised by the Adviser and/or compared to its peers as prepared by Broadridge. In addition to the management fee, the Board also reviewed the Fund's total expense ratio. When a fund's management fee and/or its total expense ratio are higher than its peers, the Board and the Adviser discuss the reasons for this and, where appropriate, they discuss possible waivers and/or caps. The Board noted that the Fund's management fee was lower than its peer group average and total expense ratio was higher than its peer group average. After discussion, the Board concluded that the Fund's (i) performance and management fee were competitive with its peer group averages and (ii) total expense ratio was acceptable.
Economies of Scale
The Board considered the size and growth prospects of the Fund and how that relates to the Fund's total expense ratio and particularly the Fund's management fee rate, which does not include breakpoints. In conjunction with its review of the Adviser's profitability, the Board discussed with the Adviser how a change in assets can affect the efficiency or effectiveness of managing the Fund and whether the management fee level is appropriate relative to current and projected asset levels and/or whether the management fee structure reflects economies of scale as asset levels change. The Board has determined that its review of the actual and/or potential economies of scale of the Fund supports its decision to approve the Management Agreement.
Profitability of the Adviser and Affiliates
The Board considered information concerning the costs incurred and profits realized by the Adviser and its affiliates during the last year from their relationship with the Fund and during the last two years from their relationship with the Morgan Stanley Fund Complex and reviewed with the Adviser the cost allocation methodology used to determine the profitability of the Adviser and affiliates. The Board has determined that its review of the analysis of the Adviser's expenses and profitability supports its decision to approve the Management Agreement.
35
Morgan Stanley Institutional Fund Trust
Annual Report — September 30, 2020
Investment Advisory Agreement Approval (unaudited) (cont'd)
Other Benefits of the Relationship
The Board considered other direct and indirect benefits to the Adviser and/or its affiliates derived from their relationship with the Fund and other funds advised by the Adviser. These benefits may include, among other things, fees for trading, distribution and/or shareholder servicing and for transaction processing and reporting platforms used by securities lending agents, and research received by the Adviser generated from commission dollars spent on funds' portfolio trading. The Board reviewed with the Adviser these arrangements and the reasonableness of the Adviser's costs relative to the services performed. The Board has determined that its review of the other benefits received by the Adviser or its affiliates supports its decision to approve the Management Agreement.
Resources of the Adviser and Historical Relationship Between the Fund and the Adviser
The Board considered whether the Adviser is financially sound and has the resources necessary to perform its obligations under the Management Agreement. The Board also reviewed and considered the historical relationship between the Fund and the Adviser, including the organizational structure of the Adviser, the policies and procedures formulated and adopted by the Adviser for managing the Fund's operations and the Board's confidence in the competence and integrity of the senior managers and key personnel of the Adviser. The Board concluded that the Adviser has the financial resources necessary to fulfill its obligations under the Management Agreement and that it is beneficial for the Fund to continue its relationship with the Adviser.
Other Factors and Current Trends
The Board considered the controls and procedures adopted and implemented by the Adviser and monitored by the Fund's Chief Compliance Officer and concluded that the conduct of business by the Adviser indicates a good faith effort on its part to adhere to high ethical standards in the conduct of the Fund's business.
As part of the Board's review, the Board received information from management on the impact of COVID-19 on the firm generally and the Adviser and the Fund in particular including, among other information, the pandemic's current and expected impact on the Fund's performance and operations.
General Conclusion
After considering and weighing all of the above factors, with various written materials and verbal information presented by the Adviser, the Board concluded that it would be in the best interest of the Fund and its shareholders to approve renewal of the Management Agreement for another year. In reaching this conclusion the Board did not give particular weight to any single piece of information or factor referenced above. The Board considered these factors and information over the course of the year and in numerous meetings, some of which were in executive session with only the independent Board members and their counsel present. It is possible that individual Board members may have weighed these factors, and the information presented, differently in reaching their individual decisions to approve the Management Agreement.
36
Morgan Stanley Institutional Fund Trust
Annual Report — September 30, 2020
Liquidity Risk Management Program (unaudited)
In compliance with Rule 22e-4 under the Investment Company Act of 1940, as amended (the "Liquidity Rule"), the Fund has adopted and implemented a liquidity risk management program (the "Program"), which is reasonably designed to assess and manage the risk that the Fund could not meet requests to redeem shares issued by the Fund without significant dilution of remaining investors' interests in the Fund (i.e., liquidity risk). The Fund's Board of Trustees (the "Board") previously approved the designation of the Liquidity Risk Subcommittee (the "LRS") as Program administrator. The LRS is comprised of representatives from various divisions within Morgan Stanley Investment Management.
At a meeting held on April 22-23, 2020, the Board reviewed a written report prepared by the LRS that addressed the Program's operation and assessed its adequacy, and effectiveness of implementation for the period from December 1, 2018, through December 31, 2019, as required under the Liquidity Rule. The report concluded that the Program operated effectively and was adequately and effectively implemented in all material aspects, and that the relevant controls and safeguards were appropriately designed to enable the LRS to administer the Program in compliance with the Liquidity Rule.
In accordance with the Program, the LRS assessed each Fund's liquidity risk no less frequently than annually taking into consideration certain factors, as applicable, such as (i) investment strategy and liquidity of portfolio investments, (ii) short-term and long-term cash flow projections and (iii) holdings of cash and cash equivalents and borrowing arrangements and other funding sources. Certain factors are considered under both normal and reasonably foreseeable stressed conditions.
Each Fund portfolio investment is classified into one of four liquidity categories, which classification is assessed at least monthly by the LRS. The classification is based on a determination of the number of days it is reasonably expected to take to convert the investment into cash, or sell or dispose of the investment, in current market conditions without significantly changing the market value of the investment. Liquidity classification determinations take into account various market, trading and investment-specific considerations, as well as market depth, and in some cases utilize third-party vendor data.
The Liquidity Rule limits a fund's investments in illiquid investments to 15% of its net assets and requires funds that do not primarily hold assets that are highly liquid investments to determine and maintain a minimum percentage of the fund's net assets to be invested in highly liquid investments (highly liquid investment minimum or "HLIM"). The LRS believes that the Program includes provisions reasonably designed to review, monitor and comply with the 15% limit on illiquid investments and for determining, periodically reviewing and complying with the HLIM requirement, as applicable.
There can be no assurance that the Program will achieve its objectives under all circumstances in the future. Please refer to the Fund's prospectus for more information regarding the Fund's exposure to liquidity risk and other risks to which it may be subject.
37
Morgan Stanley Institutional Fund Trust
Annual Report — September 30, 2020
Privacy Notice (unaudited) April 2019
FACTS | | WHAT DOES MSIM DO WITH YOUR PERSONAL INFORMATION? | |
Why? | | Financial companies choose how they share your personal information. Federal law gives consumers the right to limit some but not all sharing. Federal law also requires us to tell you how we collect, share, and protect your personal information. Please read this notice carefully to understand what we do. | |
What? | | The types of personal information we collect and share depend on the product or service you have with us. This information can include:
n Social Security number and income
n investment experience and risk tolerance
n checking account number and wire transfer instructions | |
How? | | All financial companies need to share customers' personal information to run their everyday business. In the section below, we list the reasons financial companies can share their customers' personal information; the reasons MSIM chooses to share; and whether you can limit this sharing. | |
Reasons we can share your personal information | | Does MSIM share? | | Can you limit this sharing? | |
For our everyday business purposes —
such as to process your transactions, maintain your account(s), respond to court orders and legal investigations, or report to credit bureaus | | Yes | | No | |
For our marketing purposes —
to offer our products and services to you | | Yes | | No | |
For joint marketing with other financial companies | | No | | We don't share | |
For our affiliates' everyday business purposes —
information about your transactions and experiences | | Yes | | No | |
For our affiliates' everyday business purposes —
information about your creditworthiness | | No | | We don't share | |
For our affiliates to market to you | | No | | We don't share | |
For non-affiliates to market to you | | No | | We don't share | |
Questions? Call toll-free (844) 312-6327 or email: imprivacyinquiries@morganstanley.com
38
Morgan Stanley Institutional Fund Trust
Annual Report — September 30, 2020
Privacy Notice (unaudited) (cont'd) April 2019
Who we are
Who is providing this notice? | | Morgan Stanley Investment Management, Inc. and its affiliated registered investment advisers, registered broker-dealers, and registered and unregistered funds ("MSIM") | |
What we do
How does MSIM protect my personal information? | | To protect your personal information from unauthorized access and use, we use security measures that comply with federal law. These measures include computer safeguards and secured files and buildings. We have policies governing the proper handling of customer information by personnel and requiring third parties that provide support to adhere to appropriate security standards with respect to such information. | |
How does MSIM collect my personal information? | | We collect your personal information, for example, when you
n open an account or make deposits or withdrawals from your account
n buy securities from us or make a wire transfer
n give us your contact information
We also collect your personal information from others, such as credit bureaus, affiliates, or other companies. | |
Why can't I limit all sharing? | | Federal law gives you the right to limit only
n sharing for affiliates' everyday business purposes — information about your creditworthiness
n affiliates from using your information to market to you
n sharing for non-affiliates to market to you
State laws and individual companies may give you additional rights to limit sharing. See below for more on your rights under state law. | |
Definitions
Affiliates | | Companies related by common ownership or control. They can be financial and non-financial companies.
n Our affiliates include companies with a Morgan Stanley name and financial companies such as Morgan Stanley Smith Barney LLC and Morgan Stanley & Co. | |
Non-affiliates | | Companies not related by common ownership or control. They can be financial and non-financial companies.
n MSIM does not share with non-affiliates so they can market to you. | |
Joint marketing | | A formal agreement between non-affiliated financial companies that together market financial products or services to you.
n MSIM doesn't jointly market | |
Other Important Information
Vermont: Except as permitted by law, we will not share personal information we collect about Vermont residents with Non-affiliates unless you provide us with your written consent to share such information.
California: Except as permitted by law, we will not share personal information we collect about California residents with Non-affiliates and we will limit sharing such personal information with our Affiliates to comply with California privacy laws that apply to us.
39
Morgan Stanley Institutional Fund Trust
Annual Report — September 30, 2020
Trustee and Officer Information (unaudited)
Independent Trustees:
Name, Address and Birth Year
of Independent Trustee | | Position(s)
Held with
Registrant | | Length of Time
Served* | | Principal Occupation(s) During Past 5 Years
and Other Relevant Professional Experience | | Number of
Funds in
Fund Complex
Overseen by
Independent
Trustee** | | Other Directorships
Held by Independent
Trustee*** | |
Frank L. Bowman
c/o Perkins Coie LLP
Counsel to the Independent Trustees
1155 Avenue of the Americas, 22nd Floor
New York, NY 10036
Birth Year 1944 | | Trustee | | Since
August
2006 | | President, Strategic Decisions, LLC (consulting) (since February 2009); Director or Trustee of various Morgan Stanley Funds (since August 2006); Chairperson of the Compliance and Insurance Committee (since October 2015); formerly, Chairperson of the Insurance Sub-Committee of the Compliance and Insurance Committee (2007-2015); served as President and Chief Executive Officer of the Nuclear Energy Institute (policy organization) (February 2005-November 2008); retired as Admiral, U.S. Navy after serving over 38 years on active duty including 8 years as Director of the Naval Nuclear Propulsion Program in the Department of the Navy and the U.S. Department of Energy (1996-2004); served as Chief of Naval Personnel (July 1994-September 1996) and on the Joint Staff as Director of Political Military Affairs (June 1992-July 1994); knighted as Honorary Knight Commander of the Most Excellent Order of the British Empire; awarded the Officier de l'Orde National du Mérite by the French Government; elected to the National Academy of Engineering (2009). | | | 86 | | | Director of Naval and Nuclear Technologies LLP; Director Emeritus of the Armed Services YMCA; Member of the National Security Advisory Council of the Center for U.S. Global Engagement and a member of the CNA Military Advisory Board; Trustee of Fairhaven United Methodist Church; Member of the Board of Advisors of the Dolphin Scholarship Foundation; Director of other various non-profit organizations; Formerly, Director of BP p.l.c. (November 2010-May 2019). | |
Kathleen A. Dennis
c/o Perkins Coie LLP
Counsel to the Independent Trustees
1155 Avenue of the Americas, 22nd Floor
New York, NY 10036
Birth Year 1953 | | Trustee | | Since
August
2006 | | President, Cedarwood Associates (mutual fund and investment management consulting) (since July 2006); Chairperson of the Liquidity and Alternatives Sub-Committee of the Investment Committee (since October 2006) and Director or Trustee of various Morgan Stanley Funds (since August 2006); formerly, Senior Managing Director of Victory Capital Management (1993-2006). | | | 86 | | | Director of various
non-profit organizations. | |
Nancy C. Everett
c/o Perkins Coie LLP
Counsel to the Independent Trustees
1155 Avenue of the Americas, 22nd Floor
New York, NY 10036
Birth Year 1955 | | Trustee | | Since
January
2015 | | Chief Executive Officer, Virginia Commonwealth University Investment Company (since November 2015); Owner, OBIR, LLC (institutional investment management consulting) (since June 2014); formerly, Managing Director, BlackRock, Inc. (February 2011-December 2013); and Chief Executive Officer, General Motors Asset Management (a/k/a Promark Global Advisors, Inc.) (June 2005-May 2010). | | | 87 | | | Formerly, Member of Virginia Commonwealth University School of Business Foundation (2005-2016); Member of Virginia Commonwealth University Board of Visitors (2013-2015); Member of Committee on Directors for Emerging Markets Growth Fund, Inc. (2007-2010); Chairperson of Performance Equity Management, LLC (2006-2010); and Chairperson, GMAM Absolute Return Strategies Fund, LLC (2006-2010). | |
40
Morgan Stanley Institutional Fund Trust
Annual Report — September 30, 2020
Trustee and Officer Information (unaudited) (cont'd)
Independent Trustees: (cont'd)
Name, Address and Birth Year
of Independent Trustee | | Position(s)
Held with
Registrant | | Length of Time
Served* | | Principal Occupation(s) During Past 5 Years
and Other Relevant Professional Experience | | Number of
Funds in
Fund Complex
Overseen by
Independent
Trustee** | | Other Directorships
Held by Independent
Trustee*** | |
Jakki L. Haussler
c/o Perkins Coie LLP
Counsel to the Independent Trustees
1155 Avenue of the Americas, 22nd Floor
New York, NY 10036
Birth Year 1957 | | Trustee | | Since
January
2015 | | Chairman, Opus Capital Group (since January 1996); formerly, Chief Executive Officer, Opus Capital Group (1996-2019); Director, Capvest Venture Fund, LP (May 2000-December 2011); Partner, Adena Ventures, LP (July 1999-December 2010); Director, The Victory Funds (February 2005-July 2008). | | | 87 | | | Director of Service Corporation International and Member, Audit Committee and Investment Committee; Director of Cincinnati Bell Inc. and Member, Audit Committee and Governance and Nominating Committee; Director of Northern Kentucky University Foundation and Member, Investment Committee; Member of Chase College of Law Transactional Law Practice Center Board of Advisors; Director of Chase College of Law Board of Visitors; formerly, Member, University of Cincinnati Foundation Investment Committee; Member, Miami University Board of Visitors (2008-2011); Trustee of Victory Funds (2005-2008) and Chairman, Investment Committee (2007-2008); Member, Service Provider Committee (2005-2008) and Director of Best Transport (2006-2019). | |
Dr. Manuel H. Johnson
c/o Johnson Smick
International, Inc.
220 I Street, NE — Suite 200 Washington, D.C. 20002
Birth Year 1949 | | Trustee | | Since
July
1991 | | Senior Partner, Johnson Smick International, Inc. (consulting firm); Chairperson of the Investment Committee (since October 2006) and Director or Trustee of various Morgan Stanley Funds (since July 1991); Co-Chairman and a founder of the Group of Seven Council (G7C) (international economic commission); formerly, Chairperson of the Audit Committee (July 1991-September 2006), Vice Chairman of the Board of Governors of the Federal Reserve System and Assistant Secretary of the U.S. Treasury. | | | 86 | | | Director of NVR, Inc. (home construction). | |
Joseph J. Kearns
c/o Perkins Coie LLP
Counsel to the Independent Trustees
1155 Avenue of the Americas, 22nd Floor
New York, NY 10036
Birth Year 1942 | | Trustee | | Since
August
1994 | | Senior Adviser, Kearns & Associates LLC (investment consulting); Chairperson of the Audit Committee (since October 2006) and Director or Trustee of various Morgan Stanley Funds (since August 1994); Director, Rubicorn Investments (since February 2019); formerly, Deputy Chairperson of the Audit Committee (July 2003-September 2006) and Chairperson of the Audit Committee of various Morgan Stanley Funds (since August 1994); CFO of the J. Paul Getty Trust (1982-1999). | | | 87 | | | Prior to August 10, 2016, Director of Electro Rent Corporation (equipment leasing); Prior to December 31, 2013, Director of The Ford Family Foundation. | |
41
Morgan Stanley Institutional Fund Trust
Annual Report — September 30, 2020
Trustee and Officer Information (unaudited) (cont'd)
Independent Trustees: (cont'd)
Name, Address and Birth Year
of Independent Trustee | | Position(s)
Held with
Registrant | | Length of Time
Served* | | Principal Occupation(s) During Past 5 Years
and Other Relevant Professional Experience | | Number of
Funds in
Fund Complex
Overseen by
Independent
Trustee** | | Other Directorships
Held by Independent
Trustee*** | |
Michael F. Klein
c/o Perkins Coie LLP
Counsel to the Independent Trustees
1155 Avenue of the Americas, 22nd Floor
New York, NY 10036
Birth Year 1958 | | Trustee | | Since
August
2006 | | Managing Director, Aetos Alternatives Management, LP (since March 2000); Co-President, Aetos Alternatives Management, LP (since January 2004) and Co-Chief Executive Officer of Aetos Alternatives Management, LP (since August 2013); Chairperson of the Fixed Income Sub-Committee of the Investment Committee (since October 2006) and Director or Trustee of various Morgan Stanley Funds (since August 2006); formerly, Managing Director, Morgan Stanley & Co. Inc. and Morgan Stanley Dean Witter Investment Management and President, various Morgan Stanley Funds (June 1998-March 2000); Principal, Morgan Stanley & Co. Inc. and Morgan Stanley Dean Witter Investment Management (August 1997-December 1999). | | | 86 | | | Director of certain investment funds managed or sponsored by Aetos Alternatives Management, LP; Director of Sanitized AG and Sanitized Marketing AG (specialty chemicals). | |
Patricia Maleski
c/o Perkins Coie LLP
Counsel to the Independent Trustees
1155 Avenue of the Americas, 22nd Floor
New York, NY 10036
Birth Year 1960 | | Trustee | | Since
January
2017 | | Managing Director, JPMorgan Asset Management (2004-2016); Oversight and Control Head of Fiduciary and Conflicts of Interest Program (2015-2016); Chief Control Officer-Global Asset Management (2013-2015); President, JPMorgan Funds (2010-2013); Chief Administrative Officer (2004-2013); various other positions including Treasurer and Board Liaison (since 2001). | | | 87 | | | None. | |
W. Allen Reed
c/o Perkins Coie LLP
Counsel to the Independent Trustees
1155 Avenue of the Americas, 22nd Floor
New York, NY 10036
Birth Year 1947 | | Chair of the Board and Trustee | | Chair of the Boards since August 2020 and Trustee since August 2006 | | Chair of the Boards of various Morgan Stanley Funds (since August 2020); Chairperson of the Governance Committee; Chairperson of the Equity Sub-Committee of the Investment Committee (since October 2006) and Director or Trustee of various Morgan Stanley Funds (since August 2006); formerly, Vice Chair of the Boards of various Morgan Stanley Funds (January 2020-August 2020); President and Chief Executive Officer of General Motors Asset Management; Chairman and Chief Executive Officer of the GM Trust Bank and Corporate Vice President of General Motors Corporation (August 1994-December 2005). | | | 86 | | | Formerly, Director of Legg Mason, Inc. (2006-2019); and Director of the Auburn University Foundation (2010-2015). | |
* This is the earliest date the Trustee began serving the Morgan Stanley Funds. Each Trustee serves an indefinite term, until his or her successor is elected.
** The Fund Complex includes (as of December 31, 2019) all open-end and closed-end funds (including all of their portfolios) advised by Morgan Stanley Investment Management Inc. (the "Adviser") and any funds that have an adviser that is an affiliated person of the Adviser (including, but not limited to, Morgan Stanley AIP GP LP).
*** This includes any directorships at public companies and registered investment companies held by the Trustee at any time during the past five years.
42
Morgan Stanley Institutional Fund Trust
Annual Report — September 30, 2020
Trustee and Officer Information (unaudited) (cont'd)
Executive Officers:
Name, Address and Birth Year
of Executive Officer | | Position(s) Held
with
Registrant | | Length of
Time Served* | | Principal Occupation(s) During Past 5 Years | |
John H. Gernon
522 Fifth Avenue
New York, NY 10036
Birth Year 1963 | | President and Principal Executive Officer | | Since September 2013 | | President and Principal Executive Officer of the Equity and Fixed Income Funds and the Morgan Stanley AIP Funds (since September 2013) and the Liquidity Funds and various money market funds (since May 2014) in the Fund Complex; Managing Director of the Adviser; Head of Public Markets Product Development (since 2006). | |
Timothy J. Knierim
522 Fifth Avenue
New York, NY 10036
Birth Year 1959 | | Chief Compliance Officer | | Since December 2016 | | Managing Director of the Adviser and various entities affiliated with the Adviser; Chief Compliance Officer of various Morgan Stanley Funds and the Adviser (since December 2016) and Chief Compliance Officer of Morgan Stanley AIP GP LP (since 2014). Formerly, Managing Director and Deputy Chief Compliance Officer of the Adviser (2014-2016); and formerly, Chief Compliance Officer of Prudential Investment Management, Inc. (2007-2014). | |
Francis J. Smith
522 Fifth Avenue
New York, NY 10036
Birth Year 1965 | | Treasurer and Principal Financial Officer | | Treasurer since July 2003 and Principal Financial Officer since September 2002 | | Managing Director of the Adviser and various entities affiliated with the Adviser; Treasurer (since July 2003) and Principal Financial Officer of various Morgan Stanley Funds (since September 2002). | |
Mary E. Mullin
522 Fifth Avenue
New York, NY 10036
Birth Year 1967 | | Secretary | | Since
June
1999 | | Managing Director of the Adviser; Secretary of various Morgan Stanley Funds (since June 1999). | |
Michael J. Key
522 Fifth Avenue
New York, NY 10036
Birth Year 1979 | | Vice President | | Since
June
2017 | | Vice President of the Equity and Fixed Income Funds, Liquidity Funds, various money market funds and the Morgan Stanley AIP Funds in the Fund Complex (since June 2017); Executive Director of the Adviser; Head of Product Development for Equity and Fixed Income Funds (since August 2013). | |
* This is the earliest date the officer began serving the Morgan Stanley Funds. Each officer serves a one-year term, until his or her successor is elected and qualifies.
43
Morgan Stanley Institutional Fund Trust
Annual Report — September 30, 2020
Adviser and Administrator
Morgan Stanley Investment Management Inc.
522 Fifth Avenue
New York, New York 10036
Distributor
Morgan Stanley Distribution, Inc.
522 Fifth Avenue
New York, New York 10036
Dividend Disbursing and Transfer Agent
DST Asset Manager Solutions, Inc.
2000 Crown Colony Drive
Quincy, Massachusetts 02169
Custodian
State Street Bank and Trust Company
One Lincoln Street
Boston, Massachusetts 02111
Legal Counsel
Dechert LLP
1095 Avenue of the Americas
New York, New York 10036
Counsel to the Independent Trustees
Perkins Coie LLP
1155 Avenue of the Americas,
22nd Floor
New York, New York 10036
Independent Registered Public Accounting Firm
Ernst & Young LLP
200 Clarendon Street
Boston, Massachusetts 02116
Reporting to Shareholders
Each Morgan Stanley fund provides a complete schedule of portfolio holdings in its Semi-Annual and the Annual Reports within 60 days of the end of the fund's second and fourth fiscal quarters. The Semi-Annual and Annual Reports are filed electronically with the Securities and Exchange Commission ("SEC") on Form N-CSRS and Form N-CSR, respectively. Morgan Stanley also delivers the Semi-Annual and Annual Reports to fund shareholders and makes these reports available on its public website, www.morganstanley.com/im/shareholderreports. Each Morgan Stanley non-money market fund also files a complete schedule of portfolio holdings with the SEC for the fund's first and third fiscal quarters as an attachment to Form N-PORT. Morgan Stanley does not deliver the reports for the first and third fiscal quarters to shareholders, nor are the reports posted to the Morgan Stanley public website. However, the holdings for each money market fund are posted to the Morgan Stanley public website. You may obtain the Form N-PORT filings (as well as the Form N-CSR and N-CSRS filings) by accessing the SEC's website, www.sec.gov. You can also request copies of these materials, upon payment of a duplicating fee, by electronic request at the SEC's email address (publicinfo@sec.gov).
Proxy Voting Policies and Procedures and Proxy Voting Record
You may obtain a copy of the Trust's Proxy Voting Policy and Procedures and information regarding how the Trust voted proxies relating to portfolio securities during the most recent twelve-month period ended June 30, without charge, upon request, by calling toll free 1 (800) 548-7786 or by visiting our website at www.morganstanley.com/im/shareholderreports. This information is also available on the SEC's website at www.sec.gov.
This report is authorized for distribution only when preceded or accompanied by a prospectus or summary prospectus of the applicable Fund of Morgan Stanley Institutional Fund Trust, which describes in detail the Fund's investment policies, risks, fees and expenses. Please read the prospectus carefully before you invest or send money. For additional information, including information regarding the investments comprising the Fund, please visit our website at www.morganstanley.com/im/shareholderreports or call toll free 1 (800) 548-7786.
44
Printed in U.S.A.
This Report has been prepared for shareholders and may be distributed to others only if preceded or accompanied by a current prospectus.
Morgan Stanley Investment Management Inc.
522 Fifth Avenue
New York, New York 10036
© 2020 Morgan Stanley. Morgan Stanley Distribution, Inc.

IFTCBANN
3298799 EXP 11.30.21

Morgan Stanley Institutional Fund Trust
Discovery Portfolio
Annual Report
September 30, 2020
Beginning on January 1, 2021, as permitted by regulations adopted by the Securities and Exchange Commission ("SEC"), paper copies of the Fund's Annual and Semi-Annual Reports to Shareholders ("Shareholder Reports") will no longer be sent by mail, unless you specifically request paper copies of the Shareholder Reports from the Fund or from your financial intermediary, such as a broker-dealer or a bank. Instead, the Shareholder Reports will be made available on the Fund's website, https://www.morganstanley.com/im/shareholderreports and you will be notified by mail each time a Shareholder Report is posted and provided with a website link to access the Shareholder Report. If you already elected to receive Shareholder Reports electronically, you will not be affected by this change and you need not take any action. You may elect to receive Shareholder Reports and other communications from the Fund electronically anytime by contacting your financial intermediary or, if you are a direct investor, please follow the instructions on the envelope.
Beginning on January 1, 2019, you may elect to receive all future Shareholder Reports in paper free of charge. If you invest through a financial intermediary, you can contact your financial intermediary to request that you continue to receive paper copies of your Shareholder Reports. If you invest directly with the Fund, please follow the instructions on the envelope to let the Fund know you wish to continue receiving paper copies of your Shareholder Reports. Your election to receive Shareholder Reports in paper will apply to all funds held in your account if you invest through your financial intermediary or all funds held with the fund complex if you invest directly with a fund.

Morgan Stanley Institutional Fund Trust
Annual Report — September 30, 2020
Shareholders' Letter | | | 2 | | |
Expense Example | | | 3 | | |
Investment Overview | | | 4 | | |
Portfolio of Investments | | | 6 | | |
Statement of Assets and Liabilities | | | 8 | | |
Statement of Operations | | | 10 | | |
Statements of Changes in Net Assets | | | 11 | | |
Financial Highlights | | | 13 | | |
Notes to Financial Statements | | | 18 | | |
Report of Independent Registered Public Accounting Firm | | | 28 | | |
Investment Advisory Agreement Approval | | | 29 | | |
Liquidity Risk Management Program | | | 31 | | |
Federal Tax Notice | | | 32 | | |
Privacy Notice | | | 33 | | |
Trustee and Officer Information | | | 35 | | |
This report is authorized for distribution only when preceded or accompanied by a prospectus or summary prospectus of the applicable Fund of the Morgan Stanley Institutional Fund Trust. To receive a prospectus and/or statement of additional information ("SAI"), which contains more complete information such as investment objectives, charges, expenses, policies for voting proxies, risk considerations and describes in detail each of the Fund's investment policies to the prospective investor, please call toll free 1 (800) 548-7786. Please read the prospectuses carefully before you invest or send money.
Additionally, you can access information about the Fund, including performance, characteristics and investment team commentary, through Morgan Stanley Investment Management's website: www.morganstanley.com/im/shareholderreports.
Market forecasts provided in this report may not necessarily come to pass. There is no guarantee that any sectors mentioned will continue to perform as discussed herein or that securities in such sectors will be held by the Fund in the future. There is no assurance that a fund will achieve its investment objective. Funds are subject to market risk, which is the possibility that market values of securities owned by the Fund will decline and, therefore, the value of the Fund's shares may be less than what you paid for them. Accordingly, you can lose money investing in this Fund. Please see the prospectus for more complete information on investment risks.
1
Morgan Stanley Institutional Fund Trust
Annual Report — September 30, 2020
Shareholders' Letter (unaudited)
Dear Shareholders,
We are pleased to provide this Annual Report, in which you will learn how your investment in Discovery Portfolio (the "Fund") performed during the latest twelve-month period.
Morgan Stanley Investment Management is a client-centric, investor-led organization. Our global presence, intellectual capital, and breadth of products and services enable us to partner with investors to meet the evolving challenges of today's financial markets. We aim to deliver superior investment service and to empower our clients to make the informed decisions that help them reach their investment goals.
As always, we thank you for selecting Morgan Stanley Investment Management, and look forward to working with you in the months and years ahead.
Sincerely,

John H. Gernon
President and Principal Executive Officer
October 2020
2
Morgan Stanley Institutional Fund Trust
Annual Report — September 30, 2020
Expense Example (unaudited)
Discovery Portfolio
As a shareholder of the Fund, you may incur two types of costs: (1) transactional costs, including sales charge (loads) on purchase payments; and (2) ongoing costs, which may include advisory fees, administration fees, distribution and shareholder services fees; and other Fund expenses. This example is intended to help you understand your ongoing costs (in dollars) of investing in the Fund and to compare these costs with the ongoing costs of investing in other mutual funds.
This example is based on an investment of $1,000 invested at the beginning of the six-month period ended September 30, 2020 and held for the entire six-month period.
Actual Expenses
The table below provides information about actual account values and actual expenses. You may use the information in this table, together with the amount you invested, to estimate the expenses that you paid over the period. Simply divide your account value by $1,000 (for example, an $8,600 account value divided by $1,000 = 8.6), then multiply the result by the number in the table under the heading entitled "Actual Expenses Paid During Period" to estimate the expenses you paid on your account during this period.
Hypothetical Example for Comparison Purposes
The table below provides information about hypothetical account values and hypothetical expenses based on the Fund's actual expense ratio and an assumed rate of return of 5% per year before expenses, which is not the Fund's actual return. The hypothetical account values and expenses may not be used to estimate the actual ending account balance or expenses you paid for the period. You may use this information to compare the ongoing costs of investing in the Fund and other funds. To do so, compare this 5% hypothetical example with the 5% hypothetical examples that appear in the shareholder reports of the other funds.
Please note that the expenses shown in the table are meant to highlight your ongoing costs only and do not reflect any transactional costs, such as sales charges (loads, if applicable). Therefore, the information for each class in the table is useful in comparing ongoing costs only, and will not help you determine the relative total costs of owning different funds. In addition, if these transactional costs were included, your costs would have been higher.
| | | Beginning
Account
Value
4/1/20 | | Actual Ending
Account
Value
9/30/20 | | Hypothetical
Ending Account
Value | | Actual
Expenses
Paid
During
Period* | | Hypothetical
Expenses Paid
During Period* | | Net
Expense
Ratio
During
Period** | |
Discovery Portfolio Class I | | $ | 1,000.00 | | | $ | 2,121.70 | | | $ | 1,021.40 | | | $ | 5.62 | | | $ | 3.64 | | | | 0.72 | % | |
Discovery Portfolio Class A | | | 1,000.00 | | | | 2,119.00 | | | | 1,020.10 | | | | 7.64 | | | | 4.95 | | | | 0.98 | | |
Discovery Portfolio Class L | | | 1,000.00 | | | | 2,114.40 | | | | 1,017.65 | | | | 11.44 | | | | 7.41 | | | | 1.47 | | |
Discovery Portfolio Class C | | | 1,000.00 | | | | 2,111.70 | | | | 1,016.35 | | | | 13.46 | | | | 8.72 | | | | 1.73 | | |
Discovery Portfolio Class IS | | | 1,000.00 | | | | 2,122.80 | | | | 1,021.90 | | | | 4.84 | | | | 3.13 | | | | 0.62 | | |
* Expenses are calculated using each Fund Class' annualized net expense ratio (as disclosed), multiplied by the average account value over the period and multiplied by 183/366 (to reflect the most recent one-half year period).
** Annualized.
3
Morgan Stanley Institutional Fund Trust
Annual Report — September 30, 2020
Investment Overview (unaudited)
Discovery Portfolio
The Fund seeks long-term capital growth.
Performance
For the fiscal year ended September 30, 2020, the Fund's Class I shares had a total return based on net asset value and reinvestment of distributions per share of 115.34%, net of fees. The Fund's Class I shares outperformed against the Fund's benchmark, the Russell Midcap® Growth Index (the "Index"), which returned 23.23%.
Please keep in mind that triple-digit returns are highly unusual and cannot be sustained. Investors should also be aware that these returns were primarily achieved during favorable market conditions.
Factors Affecting Performance
• U.S. stocks posted a positive return despite enduring an economic shock and bear market correction caused by a global pandemic. Stock prices fell sharply in February and March 2020 as the measures to contain the spread of COVID-19 stifled economic activity, disrupted supply chains and caused significant job losses. The U.S. government and the Federal Reserve (FED) intervened with aggressive emergency relief, which helped stabilize financial markets. By May, progress toward reducing the coronavirus infection rate allowed the U.S. economy to gradually reopen, leading to a quicker-than-expected rebound in many facets of the economy over the subsequent months. Additionally, COVID-19 vaccine and treatment research was received positively, although the timeline was still uncertain. After recouping all the losses since the February-March 2020 sell-off, the market retreated in September. Investors were unnerved by evidence that the economic recovery was losing momentum amid still high unemployment rates, expiring government aid and an uptick in virus infection rates. Political uncertainty also contributed to increased market volatility due to concerns about a contested presidential election.
• Counterpoint Global seeks high quality companies, which we define primarily as those with sustainable competitive advantages. We manage concentrated portfolios that are highly differentiated from the benchmark, with securities weighted on our assessment of the quality of the company and our conviction. The value added or detracted in any period of time will result from stock selection, given our philosophy and process.
• The long-term investment horizon and conviction-weighted investment approach embraced by the team since 1998 can result in periods of performance deviation from the benchmark and peers. The portfolio outperformed the benchmark this reporting period due favorable stock selection and sector allocations.
• Mid-cap growth stocks advanced 23.23% in the 12-month period, as measured by the Index. Health care, information technology and consumer discretionary were the top performing sectors in the Index, while energy and utilities were the only sectors with negative returns. Against this backdrop, our team continued to focus on stock selection and the long-term outlook for companies in the portfolio.
• Information technology drove the majority of the portfolio's outperformance this period, primarily due to favorable stock selection. Software and IT services companies were among the largest positive contributors. Investor sentiment broadly remains positive across businesses in the software industry that facilitate virtual collaboration, support distributed workforces, and enable enterprises to improve efficiency, enhance agility, and make more informed data-driven business decisions. Together with the information technology sector, strong stock selection in the consumer discretionary, health care and communication services sectors drove nearly all of the Fund's relative outperformance in the period.
• Given the Fund's strong outperformance in the period, there were few meaningful detractors from relative performance. An overweight in communication services had a modestly adverse impact on performance, although it was more than offset by the gain from our stock selection in the sector. Stock selection in industrials was another detractor, but the relatively small loss was outweighed by the positive contribution from the Fund's underweight in industrials.
Management Strategies
• As a team, we believe having a market outlook can be an anchor. Our focus is on assessing company prospects over a five-year horizon and owning a portfolio of unique companies whose market value can increase significantly for underlying fundamental reasons.
4
Morgan Stanley Institutional Fund Trust
Annual Report — September 30, 2020
Investment Overview (unaudited) (cont'd)
Discovery Portfolio
• We seek to invest primarily in high-quality established and emerging companies with sustainable competitive advantages, strong free-cash-flow yields and favorable returns on invested capital trends. We focus on long-term growth rather than short-term events, with our stock selection informed by rigorous fundamental analysis.

* Minimum Investment
In accordance with SEC regulations, the Fund's performance shown assumes that all recurring fees (including management fees) were deducted and all dividends and distributions were reinvested. The performance of Class A, Class L, Class C and Class IS shares will vary from the performance of Class I shares based upon their different inception dates and will be negatively impacted by additional fees assessed to those classes (where applicable).
Performance Compared to the Russell Midcap® Growth Index(1) and the Lipper Mid-Cap Growth Funds Index(2)
| | | Period Ended September 30, 2020
Total Returns(3) | |
| | | | | Average Annual | |
| | | One
Year | | Five
Years | | Ten
Years | | Since
Inception(9) | |
Fund — Class I Shares
w/o sales charges(4) | | | 115.34 | % | | | 31.15 | % | | | 18.91 | % | | | 15.04 | % | |
Fund — Class A Shares
w/o sales charges(5) | | | 114.87 | | | | 30.78 | | | | 18.59 | | | | 13.54 | | |
Fund — Class A Shares with
maximum 5.25% sales charges(5) | | | 103.63 | | | | 29.37 | | | | 17.95 | | | | 13.28 | | |
Fund — Class L Shares
w/o sales charges(6) | | | 113.70 | | | | 30.06 | | | | — | | | | 21.14 | | |
Fund — Class C Shares
w/o sales charges(8) | | | 113.21 | | | | — | | | | — | | | | 43.19 | | |
Fund — Class C Shares with
maximum 1.00% deferred
sales charges(8) | | | 112.21 | | | | — | | | | — | | | | 43.19 | | |
Fund — Class IS Shares
w/o sales charges(7) | | | 115.65 | | | | 31.24 | | | | — | | | | 21.64 | | |
Russell Midcap® Growth Index | | | 23.23 | | | | 15.53 | | | | 14.55 | | | | 10.99 | | |
Lipper Mid-Cap Growth Funds Index | | | 23.13 | | | | 15.38 | | | | 13.44 | | | | 10.49 | | |
Performance data quoted represents past performance, which is no guarantee of future results, and current performance may be lower or higher than the figures shown. Performance assumes that all dividends and distributions, if any, were reinvested. For the most recent month-end performance figures, please visit www.morganstanley.com/im/shareholderreports. Investment returns and principal value will fluctuate so that Fund shares, when redeemed, may be worth more or less than their original cost. Total returns do not reflect the deduction of taxes that a shareholder would pay on Fund distributions or the redemption of Fund shares. Performance of share classes will vary due to differences in sales charges and expenses.
(1) The Russell Midcap® Growth Index measures the performance of the mid-cap growth segment of the U.S. equity universe. It includes those Russell Midcap® Index companies with higher price-to-book ratios and higher forecasted growth values. The Russell Midcap® Index is a subset of the Russell 1000® Index and includes approximately 800 of the smallest securities in the Russell 1000® Index, which in turn consists of approximately 1,000 of the largest U.S. securities based on a combination of market capitalization and current index membership. The Index is unmanaged and its returns do not include any sales charges or fees. Such costs would lower performance. It is not possible to invest directly in an index.
(2) The Lipper Mid-Cap Growth Funds Index is an equally weighted performance index of the largest qualifying funds (based on net assets) in the Lipper Mid-Cap Growth Funds classification. The index, which is adjusted for capital gains distributions and income dividends, is unmanaged and should not be considered an investment. There are currently 30 funds represented in this Index. As of the date of this report, the Fund was in the Lipper Mid-Cap Growth Funds classification.
(3) Total returns for the Fund reflect expenses waived and/or reimbursed, if applicable, by the Adviser. Without such waivers and/or reimbursements, total returns would have been lower.
(4) Commenced operations on March 30, 1990.
(5) Commenced offering on January 31, 1997.
(6) Commenced offering on June 14, 2012.
(7) Commenced offering on September 13, 2013.
(8) Commenced offering on May 31, 2017.
(9) For comparative purposes, average annual since inception returns listed for the Indexes refer to the inception date of Class I of the Fund, not the inception of the Indexes.
5
Morgan Stanley Institutional Fund Trust
Annual Report — September 30, 2020
Portfolio of Investments
Discovery Portfolio
| | | Shares | | Value
(000) | |
Common Stocks (96.0%) | |
Biotechnology (1.3%) | |
Alnylam Pharmaceuticals, Inc. (a) | | | 79,156 | | | $ | 11,525 | | |
Exact Sciences Corp. (a) | | | 188,930 | | | | 19,261 | | |
Moderna, Inc. (a) | | | 149,889 | | | | 10,605 | | |
| | | | 41,391 | | |
Electronic Equipment, Instruments & Components (0.8%) | |
Cognex Corp. | | | 361,745 | | | | 23,550 | | |
Entertainment (5.2%) | |
Roku, Inc. (a) | | | 228,706 | | | | 43,179 | | |
Spotify Technology SA (a) | | | 364,158 | | | | 88,334 | | |
Zynga, Inc., Class A (a) | | | 3,220,311 | | | | 29,369 | | |
| | | | 160,882 | | |
Health Care Equipment & Supplies (4.1%) | |
DexCom, Inc. (a) | | | 236,822 | | | | 97,625 | | |
Penumbra, Inc. (a) | | | 143,420 | | | | 27,878 | | |
| | | | 125,503 | | |
Health Care Providers & Services (3.9%) | |
Covetrus, Inc. (a) | | | 3,250,807 | | | | 79,319 | | |
Guardant Health, Inc. (a) | | | 378,653 | | | | 42,326 | | |
| | | | 121,645 | | |
Health Care Technology (6.6%) | |
Agilon Health Topco, Inc.(a)(b)(c)
(acquisition cost — $2,693;
acquired 11/7/18) | | | 7,122 | | | | 3,980 | | |
GoodRx Holdings, Inc., Class A (a) | | | 693,802 | | | | 38,575 | | |
Livongo Health, Inc. (a) | | | 102,166 | | | | 14,309 | | |
Veeva Systems, Inc., Class A (a) | | | 519,191 | | | | 145,991 | | |
| | | | 202,855 | | |
Information Technology Services (24.3%) | |
Adyen N.V. (Netherlands) (a) | | | 26,758 | | | | 49,355 | | |
Fastly, Inc., Class A (a) | | | 1,603,677 | | | | 150,232 | | |
MongoDB, Inc. (a) | | | 613,383 | | | | 142,004 | | |
Okta, Inc. (a) | | | 661,621 | | | | 141,488 | | |
Snowflake, Inc., Class A (a)(d) | | | 41,917 | | | | 10,521 | | |
Square, Inc., Class A (a) | | | 648,961 | | | | 105,489 | | |
Twilio, Inc., Class A (a) | | | 607,839 | | | | 150,191 | | |
| | | | 749,280 | | |
Interactive Media & Services (10.5%) | |
Pinterest, Inc., Class A (a) | | | 1,432,990 | | | | 59,483 | | |
Snap, Inc., Class A (a) | | | 2,031,805 | | | | 53,051 | | |
Twitter, Inc. (a) | | | 2,280,490 | | | | 101,482 | | |
Zillow Group, Inc., Class C (a) | | | 537,721 | | | | 54,627 | | |
ZoomInfo Technologies, Inc., Class A (a) | | | 1,282,411 | | | | 55,131 | | |
| | | | 323,774 | | |
Internet & Direct Marketing Retail (7.5%) | |
Chewy, Inc., Class A (a) | | | 656,001 | | | | 35,968 | | |
Farfetch Ltd., Class A (a) | | | 1,895,848 | | | | 47,700 | | |
Overstock.com, Inc. (a) | | | 647,488 | | | | 47,040 | | |
Wayfair, Inc., Class A (a) | | | 344,941 | | | | 100,381 | | |
| | | | 231,089 | | |
| | | Shares | | Value
(000) | |
Leisure Products (2.9%) | |
Peloton Interactive, Inc., Class A (a) | | | 894,051 | | | $ | 88,726 | | |
Life Sciences Tools & Services (5.2%) | |
10X Genomics, Inc., Class A (a) | | | 1,294,492 | | | | 161,397 | | |
Metals & Mining (0.1%) | |
Royal Gold, Inc. | | | 34,063 | | | | 4,093 | | |
Oil, Gas & Consumable Fuels (0.1%) | |
Texas Pacific Land Trust | | | 8,482 | | | | 3,830 | | |
Pharmaceuticals (1.2%) | |
Royalty Pharma PLC, Class A (United Kingdom) | | | 906,521 | | | | 38,137 | | |
Semiconductors & Semiconductor Equipment (0.7%) | |
Teradyne, Inc. | | | 268,507 | | | | 21,336 | | |
Software (17.2%) | |
Alteryx, Inc., Class A (a) | | | 484,263 | | | | 54,988 | | |
Coupa Software, Inc. (a) | | | 308,470 | | | | 84,595 | | |
Datadog, Inc., Class A (a) | | | 661,139 | | | | 67,542 | | |
DocuSign, Inc. (a) | | | 210,832 | | | | 45,379 | | |
Nuance Communications, Inc. (a) | | | 448,132 | | | | 14,874 | | |
Slack Technologies, Inc., Class A (a) | | | 2,500,217 | | | | 67,156 | | |
Trade Desk, Inc. (The), Class A (a) | | | 211,702 | | | | 109,827 | | |
Unity Software, Inc. (a) | | | 158,672 | | | | 13,849 | | |
Zoom Video Communications, Inc., Class A (a) | | | 155,855 | | | | 73,269 | | |
| | | | 531,479 | | |
Specialty Retail (4.4%) | |
Carvana Co. (a) | | | 613,287 | | | | 136,800 | | |
Total Common Stocks (Cost $1,965,846) | | | 2,965,767 | | |
Preferred Stocks (0.1%) | |
Internet & Direct Marketing Retail (0.1%) | |
| Overstock.com, Inc. Series A-1 (a)(d) (Cost $337) | | | 44,025 | | | | 2,774 | | |
Short-Term Investments (3.0%) | |
Securities held as Collateral on Loaned Securities (0.4%) | |
Investment Company (0.3%) | |
Morgan Stanley Institutional Liquidity
Funds — Treasury Securities Portfolio —
Institutional Class (See Note G) | | | 9,033,000 | | | | 9,033 | | |
| | | Face
Amount
(000) | | | |
Repurchase Agreements (0.1%) | |
Barclays Capital, Inc., (0.06%,
dated 9/30/20, due 10/1/20; proceeds
$1,365; fully collateralized by a U.S.
Government obligation; 2.13% due
5/15/22; valued at $1,393) | | $ | 1,365 | | | | 1,365 | | |
Merrill Lynch & Co., Inc., (0.05%,
dated 9/30/20, due 10/1/20; proceeds
$170; fully collateralized by U.S.
Government obligations; 1.50% due
10/31/24; valued at $174) | | | 170 | | | | 170 | | |
The accompanying notes are an integral part of the financial statements.
6
Morgan Stanley Institutional Fund Trust
Annual Report — September 30, 2020
Portfolio of Investments (cont'd)
Discovery Portfolio
| | | Face
Amount
(000) | | Value
(000) | |
Repurchase Agreements (cont'd) | |
Merrill Lynch & Co., Inc., (0.06%,
dated 9/30/20, due 10/1/20; proceeds
$525; fully collateralized by U.S.
Government obligations; 1.50% due
10/31/24; valued at $536) | | $ | 525 | | | $ | 525 | | |
| | | | 2,060 | | |
Total Securities held as Collateral on Loaned
Securities (Cost $11,093) | | | 11,093 | | |
| | | Shares | | | |
Investment Company (2.6%) | |
Morgan Stanley Institutional Liquidity
Funds — Treasury Securities Portfolio —
Institutional Class (See Note G)
(Cost $80,688) | | | 80,688,078 | | | | 80,688 | | |
Total Short-Term Investments (Cost $91,781) | | | 91,781 | | |
Total Investments Excluding Purchased
Options (99.1%) (Cost $2,057,964) | | | | | 3,060,322 | | |
Total Purchased Options Outstanding (0.1%)
(Cost $7,331) | | | 3,218 | | |
Total Investments (99.2%) (Cost $2,065,295)
Including $10,527 of Securities Loaned (e)(f) | | | 3,063,540 | | |
Other Assets in Excess of Liabilities (0.8%) | | | 24,969 | | |
Net Assets (100.0%) | | $ | 3,088,509 | | |
(a) Non-income producing security.
(b) At September 30, 2020, the Fund held a fair valued security valued at approximately $3,980,000, representing 0.1% of net assets. This security has been fair valued as determined in good faith under procedures established by and under the general supervision of the Trust's (as defined herein) Trustees.
(c) Security cannot be offered for public resale without first being registered under the Securities Act of 1933 and related rules ("restricted security"). Acquisition date represents the day on which an enforceable right to acquire such security is obtained and is presented along with related cost in the security description. The Fund has registration rights for certain restricted securities. Any costs related to such registration are borne by the issuer. The aggregate value of restricted securities (excluding 144A holdings) at September 30, 2020 amounts to approximately $3,980,000 and represents 0.1% of net assets.
(d) All or a portion of this security was on loan at September 30, 2020.
(e) The approximate fair value and percentage of net assets, $49,355,000 and 1.6%, respectively, represent the securities that have been fair valued under the fair valuation policy for international investments as described in Note A-1 within the Notes to the Financial Statements.
(f) At September 30, 2020, the aggregate cost for federal income tax purposes is approximately $2,081,996,000. The aggregate gross unrealized appreciation is approximately $1,025,503,000 and the aggregate gross unrealized depreciation is approximately $43,959,000, resulting in net unrealized appreciation of approximately $981,544,000.
Call Options Purchased:
The Fund had the following call options purchased open at September 30, 2020:
Counterparty | | Description | | Strike
Price | | Expiration
Date | | Number of
Contracts | | Notional
Amount
(000) | | Value
(000) | | Premiums
Paid
(000) | | Unrealized
Depreciation
(000) | |
BNP Paribas | | USD/CNH | | CNH | 7.99 | | | Sep-21 | | | 451,174,389 | | | | 451,174 | | | $ | 1,654 | | | $ | 2,732 | | | $ | (1,078 | ) | |
Royal Bank of Scotland | | USD/CNH | | CNH | 7.75 | | | Jan-21 | | | 197,985,615 | | | | 197,986 | | | | 124 | | | | 865 | | | | (741 | ) | |
Royal Bank of Scotland | | USD/CNH | | CNH | 8.06 | | | Jul-21 | | | 437,306,829 | | | | 437,307 | | | | 1,197 | | | | 2,319 | | | | (1,122 | ) | |
Royal Bank of Scotland | | USD/CNH | | CNH | 8.48 | | | May-21 | | | 226,595,778 | | | | 226,596 | | | | 243 | | | | 1,415 | | | | (1,172 | ) | |
| | | | | | | | | | | | | $ | 3,218 | | | $ | 7,331 | | | $ | (4,113 | ) | |
CNH — Chinese Yuan Renminbi Offshore
USD — United States Dollar
Portfolio Composition*
Classification | | Percentage of
Total Investments | |
Information Technology Services | | | 24.6 | % | |
Other** | | | 22.5 | | |
Software | | | 17.4 | | |
Interactive Media & Services | | | 10.6 | | |
Internet & Direct Marketing Retail | | | 7.7 | | |
Health Care Technology | | | 6.6 | | |
Life Sciences Tools & Services | | | 5.3 | | |
Entertainment | | | 5.3 | | |
Total Investments | | | 100.0 | % | |
* Percentages indicated are based upon total investments (excluding Securities held as Collateral on Loaned Securities) as of September 30, 2020.
** Industries and/or investment types representing less than 5% of total investments.
The accompanying notes are an integral part of the financial statements.
7
Morgan Stanley Institutional Fund Trust
Annual Report — September 30, 2020
Statement of Assets and Liabilities | | September 30, 2020
(000) | |
Assets: | |
Investments in Securities of Unaffiliated Issuers, at Value(1) (Cost $1,975,574) | | $ | 2,973,819 | | |
Investment in Security of Affiliated Issuer, at Value (Cost $89,721) | | | 89,721 | | |
Total Investments in Securities, at Value (Cost $2,065,295) | | | 3,063,540 | | |
Foreign Currency, at Value (Cost $1) | | | 1 | | |
Cash from Securities Lending | | | — | @ | |
Receivable for Investments Sold | | | 36,234 | | |
Receivable for Fund Shares Sold | | | 11,577 | | |
Receivable from Securities Lending Income | | | 11 | | |
Receivable from Affiliate | | | 1 | | |
Other Assets | | | 405 | | |
Total Assets | | | 3,111,769 | | |
Liabilities: | |
Collateral on Securities Loaned, at Value | | | 11,093 | | |
Payable for Fund Shares Redeemed | | | 3,726 | | |
Due to Broker | | | 3,605 | | |
Payable for Advisory Fees | | | 3,143 | | |
Payable for Investments Purchased | | | 718 | | |
Payable for Shareholder Services Fees — Class A | | | 260 | | |
Payable for Distribution and Shareholder Services Fees — Class L | | | 8 | | |
Payable for Distribution and Shareholder Services Fees — Class C | | | 24 | | |
Payable for Sub Transfer Agency Fees — Class I | | | 111 | | |
Payable for Sub Transfer Agency Fees — Class A | | | 111 | | |
Payable for Sub Transfer Agency Fees — Class L | | | 1 | | |
Payable for Sub Transfer Agency Fees — Class C | | | 2 | | |
Payable for Administration Fees | | | 186 | | |
Payable for Professional Fees | | | 73 | | |
Payable for Trustees' Fees and Expenses | | | 41 | | |
Payable for Transfer Agency Fees — Class I | | | 5 | | |
Payable for Transfer Agency Fees — Class A | | | 10 | | |
Payable for Transfer Agency Fees — Class L | | | 1 | | |
Payable for Transfer Agency Fees — Class C | | | 1 | | |
Payable for Transfer Agency Fees — Class IS | | | 2 | | |
Payable for Custodian Fees | | | 12 | | |
Other Liabilities | | | 127 | | |
Total Liabilities | | | 23,260 | | |
Net Assets | | $ | 3,088,509 | | |
Net Assets Consist of: | |
Paid-in-Capital | | $ | 1,858,166 | | |
Total Distributable Earnings | | | 1,230,343 | | |
Net Assets | | $ | 3,088,509 | | |
The accompanying notes are an integral part of the financial statements.
8
Morgan Stanley Institutional Fund Trust
Annual Report — September 30, 2020
Statement of Assets and Liabilities (cont'd) | | September 30, 2020
(000) | |
CLASS I: | |
Net Assets | | $ | 1,282,828 | | |
| Shares Outstanding (unlimited number of shares authorized, no par value) (not in 000's) | | | 33,590,570 | | |
Net Asset Value, Offering and Redemption Price Per Share | | $ | 38.19 | | |
CLASS A: | |
Net Assets | | $ | 1,403,660 | | |
| Shares Outstanding (unlimited number of shares authorized, no par value) (not in 000's) | | | 46,919,963 | | |
Net Asset Value, Redemption Price Per Share | | $ | 29.92 | | |
Maximum Sales Load | | | 5.25 | % | |
Maximum Sales Charge | | $ | 1.66 | | |
Maximum Offering Price Per Share | | $ | 31.58 | | |
CLASS L: | |
Net Assets | | $ | 14,173 | | |
| Shares Outstanding (unlimited number of shares authorized, no par value) (not in 000's) | | | 551,764 | | |
Net Asset Value, Offering and Redemption Price Per Share | | $ | 25.69 | | |
CLASS C: | |
Net Assets | | $ | 33,781 | | |
| Shares Outstanding (unlimited number of shares authorized, no par value) (not in 000's) | | | 1,175,437 | | |
Net Asset Value, Offering and Redemption Price Per Share | | $ | 28.74 | | |
CLASS IS: | |
Net Assets | | $ | 354,067 | | |
| Shares Outstanding (unlimited number of shares authorized, no par value) (not in 000's) | | | 9,145,401 | | |
Net Asset Value, Offering and Redemption Price Per Share | | $ | 38.72 | | |
(1) Including:
Securities on Loan, at Value: | | $ | 10,527 | | |
@ Amount is less than $500.
The accompanying notes are an integral part of the financial statements.
9
Morgan Stanley Institutional Fund Trust
Annual Report — September 30, 2020
Statement of Operations | | Year Ended
September 30, 2020
(000) | |
Investment Income: | |
Income from Securities Loaned — Net | | $ | 1,706 | | |
Dividends from Securities of Unaffiliated Issuers (Net of $5 of Foreign Taxes Withheld) | | | 505 | | |
Dividends from Security of Affiliated Issuer (Note G) | | | 192 | | |
Total Investment Income | | | 2,403 | | |
Expenses: | |
Advisory Fees (Note B) | | | 7,000 | | |
Shareholder Services Fees — Class A (Note D) | | | 1,470 | | |
Distribution and Shareholder Services Fees — Class L (Note D) | | | 73 | | |
Distribution and Shareholder Services Fees — Class C (Note D) | | | 131 | | |
Sub Transfer Agency Fees — Class I | | | 591 | | |
Sub Transfer Agency Fees — Class A | | | 640 | | |
Sub Transfer Agency Fees — Class L | | | 6 | | |
Sub Transfer Agency Fees — Class C | | | 12 | | |
Administration Fees (Note C) | | | 1,120 | | |
Registration Fees | | | 358 | | |
Professional Fees | | | 214 | | |
Shareholder Reporting Fees | | | 135 | | |
Transfer Agency Fees — Class I (Note E) | | | 20 | | |
Transfer Agency Fees — Class A (Note E) | | | 42 | | |
Transfer Agency Fees — Class L (Note E) | | | 5 | | |
Transfer Agency Fees — Class C (Note E) | | | 3 | | |
Transfer Agency Fees — Class IS (Note E) | | | 7 | | |
Custodian Fees (Note F) | | | 39 | | |
Trustees' Fees and Expenses | | | 23 | | |
Pricing Fees | | | 3 | | |
Other Expenses | | | 51 | | |
Expenses Before Non Operating Expenses | | | 11,943 | | |
Bank Overdraft Expense | | | 9 | | |
Total Expenses | | | 11,952 | | |
Rebate from Morgan Stanley Affiliate (Note G) | | | (147 | ) | |
Net Expenses | | | 11,805 | | |
Net Investment Loss | | | (9,402 | ) | |
Realized Gain (Loss): | |
Investments Sold | | | 256,448 | | |
Foreign Currency Translation | | | (5 | ) | |
Net Realized Gain | | | 256,443 | | |
Change in Unrealized Appreciation (Depreciation): | |
Investments | | | 953,720 | | |
Foreign Currency Translation | | | (— | @) | |
Net Change in Unrealized Appreciation (Depreciation) | | | 953,720 | | |
Net Realized Gain and Change in Unrealized Appreciation (Depreciation) | | | 1,210,163 | | |
Net Increase in Net Assets Resulting from Operations | | $ | 1,200,761 | | |
@ Amount is less than $500.
The accompanying notes are an integral part of the financial statements.
10
Morgan Stanley Institutional Fund Trust
Annual Report — September 30, 2020
Statements of Changes in Net Assets | | Year Ended
September 30, 2020
(000) | | Year Ended
September 30, 2019
(000) | |
Increase (Decrease) in Net Assets: | |
Operations: | |
Net Investment Loss | | $ | (9,402 | ) | | $ | (2,925 | ) | |
Net Realized Gain | | | 256,443 | | | | 134,151 | | |
Net Change in Unrealized Appreciation (Depreciation) | | | 953,720 | | | | (123,664 | ) | |
Net Increase in Net Assets Resulting from Operations | | | 1,200,761 | | | | 7,562 | | |
Dividends and Distributions to Shareholders: | |
Class I | | | (37,434 | ) | | | (47,434 | ) | |
Class A | | | (47,691 | ) | | | (56,202 | ) | |
Class L | | | (1,239 | ) | | | (1,904 | ) | |
Class C | | | (1,011 | ) | | | (138 | ) | |
Class IS | | | (14,656 | ) | | | (15,697 | ) | |
Total Dividends and Distributions to Shareholders | | | (102,031 | ) | | | (121,375 | ) | |
Capital Share Transactions:(1) | |
Class I: | |
Subscribed | | | 724,696 | | | | 233,979 | | |
Distributions Reinvested | | | 37,394 | | | | 47,059 | | |
Redeemed | | | (344,262 | ) | | | (169,311 | ) | |
Class A: | |
Subscribed | | | 894,159 | | | | 269,839 | | |
Distributions Reinvested | | | 47,483 | | | | 55,847 | | |
Redeemed | | | (380,841 | ) | | | (167,362 | ) | |
Class L: | |
Exchanged | | | 117 | | | | 28 | | |
Distributions Reinvested | | | 1,231 | | | | 1,883 | | |
Redeemed | | | (1,927 | ) | | | (1,677 | ) | |
Class C: | |
Subscribed | | | 18,597 | | | | 7,204 | | |
Distributions Reinvested | | | 1,003 | | | | 136 | | |
Redeemed | | | (2,622 | ) | | | (1,047 | ) | |
Class IS: | |
Subscribed | | | 138,795 | | | | 51,205 | | |
Distributions Reinvested | | | 14,656 | | | | 15,694 | | |
Redeemed | | | (82,016 | ) | | | (18,561 | ) | |
Net Increase in Net Assets Resulting from Capital Share Transactions | | | 1,066,463 | | | | 324,916 | | |
Total Increase in Net Assets | | | 2,165,193 | | | | 211,103 | | |
Net Assets: | |
Beginning of Period | | | 923,316 | | | | 712,213 | | |
End of Period | | $ | 3,088,509 | | | $ | 923,316 | | |
The accompanying notes are an integral part of the financial statements.
11
Morgan Stanley Institutional Fund Trust
Annual Report — September 30, 2020
Statements of Changes in Net Assets (cont'd) | | Year Ended
September 30, 2020
(000) | | Year Ended
September 30, 2019
(000) | |
(1) Capital Share Transactions: | |
Class I: | |
Shares Subscribed | | | 26,530 | | | | 11,358 | | |
Shares Issued on Distributions Reinvested | | | 1,994 | | | | 2,875 | | |
Shares Redeemed | | | (13,746 | ) | | | (8,473 | ) | |
Net Increase in Class I Shares Outstanding | | | 14,778 | | | | 5,760 | | |
Class A: | |
Shares Subscribed | | | 37,384 | | | | 15,741 | | |
Shares Issued on Distributions Reinvested | | | 3,226 | | | | 4,208 | | |
Shares Redeemed | | | (18,715 | ) | | | (10,392 | ) | |
Net Increase in Class A Shares Outstanding | | | 21,895 | | | | 9,557 | | |
Class L: | |
Shares Exchanged | | | 6 | | | | 2 | | |
Shares Issued on Distributions Reinvested | | | 97 | | | | 160 | | |
Shares Redeemed | | | (123 | ) | | | (123 | ) | |
Net Increase (Decrease) in Class L Shares Outstanding | | | (20 | ) | | | 39 | | |
Class C: | |
Shares Subscribed | | | 833 | | | | 448 | | |
Shares Issued on Distributions Reinvested | | | 71 | | | | 10 | | |
Shares Redeemed | | | (145 | ) | | | (70 | ) | |
Net Increase in Class C Shares Outstanding | | | 759 | | | | 388 | | |
Class IS: | |
Shares Subscribed | | | 4,897 | | | | 2,482 | | |
Shares Issued on Distributions Reinvested | | | 772 | | | | 949 | | |
Shares Redeemed | | | (3,009 | ) | | | (902 | ) | |
Net Increase in Class IS Shares Outstanding | | | 2,660 | | | | 2,529 | | |
The accompanying notes are an integral part of the financial statements.
12
Morgan Stanley Institutional Fund Trust
Annual Report — September 30, 2020
Financial Highlights
Discovery Portfolio
| | | Class I | |
| | | Year Ended September 30, | |
Selected Per Share Data and Ratios | | 2020 | | 2019 | | 2018 | | 2017 | | 2016(1) | |
Net Asset Value, Beginning of Period | | $ | 19.92 | | | $ | 23.30 | | | $ | 22.30 | | | $ | 31.85 | | | $ | 35.96 | | |
Income (Loss) from Investment Operations: | |
Net Investment Income (Loss)(2) | | | (0.15 | ) | | | (0.05 | ) | | | (0.07 | ) | | | 0.05 | | | | 0.03 | | |
Net Realized and Unrealized Gain | | | 20.73 | | | | 0.35 | | | | 7.99 | | | | 1.99 | | | | 0.18 | | |
Total from Investment Operations | | | 20.58 | | | | 0.30 | | | | 7.92 | | | | 2.04 | | | | 0.21 | | |
Distributions from and/or in Excess of: | |
Net Realized Gain | | | (2.31 | ) | | | (3.68 | ) | | | (6.92 | ) | | | (11.59 | ) | | | (4.32 | ) | |
Net Asset Value, End of Period | | $ | 38.19 | | | $ | 19.92 | | | $ | 23.30 | | | $ | 22.30 | | | $ | 31.85 | | |
Total Return(3) | | | 115.34 | % | | | 4.71 | % | | | 47.85 | % | | | 16.16 | % | | | 0.19 | % | |
Ratios to Average Net Assets and Supplemental Data: | |
Net Assets, End of Period (Thousands) | | $ | 1,282,828 | | | $ | 374,736 | | | $ | 304,179 | | | $ | 242,140 | | | $ | 563,397 | | |
Ratio of Expenses Before Expense Limitation | | | 0.74 | % | | | 0.74 | % | | | 0.72 | % | | | 0.72 | % | | | 0.74 | % | |
Ratio of Expenses After Expense Limitation | | | 0.73 | %(4) | | | 0.73 | %(4) | | | 0.71 | %(4) | | | 0.72 | %(4) | | | 0.73 | %(4) | |
Ratio of Expenses After Expense Limitation Excluding Non-Operating Expenses | | | 0.73 | %(4) | | | 0.73 | %(4) | | | 0.71 | %(4) | | | 0.71 | %(4) | | | N/A | | |
Ratio of Net Investment Income (Loss) | | | (0.57 | )%(4) | | | (0.27 | )%(4) | | | (0.35 | )%(4) | | | 0.21 | %(4) | | | 0.09 | %(4) | |
Ratio of Rebate from Morgan Stanley Affiliates | | | 0.01 | % | | | 0.01 | % | | | 0.01 | % | | | 0.01 | % | | | 0.00 | %(5) | |
Portfolio Turnover Rate | | | 65 | % | | | 116 | % | | | 86 | % | | | 59 | % | | | 23 | % | |
(1) Reflects prior period custodian out-of-pocket expenses that were reimbursed in September 2016. The amount of the reimbursement was immaterial on a per share basis and did not impact the total return of Class I shares. The Ratio of Expenses After Expense Limitation would have been 0.005% higher and the Ratio of Net Investment Income would have been 0.005% lower had the custodian not reimbursed the Fund.
(2) Per share amount is based on average shares outstanding.
(3) Calculated based on the net asset value as of the last business day of the period.
(4) The Ratio of Expenses After Expense Limitation and Ratio of Net Investment Income (Loss) reflect the rebate of certain Fund expenses in connection with the investments in Morgan Stanley affiliates during the period. The effect of the rebate on the ratios is disclosed in the above table as "Ratio of Rebate from Morgan Stanley Affiliates."
(5) Amount is less than 0.005%.
The accompanying notes are an integral part of the financial statements.
13
Morgan Stanley Institutional Fund Trust
Annual Report — September 30, 2020
Financial Highlights
Discovery Portfolio
| | | Class A | |
| | | Year Ended September 30, | |
Selected Per Share Data and Ratios | | 2020 | | 2019 | | 2018 | | 2017 | | 2016(1) | |
Net Asset Value, Beginning of Period | | $ | 16.12 | | | $ | 19.71 | | | $ | 19.92 | | | $ | 29.86 | | | $ | 34.06 | | |
Income (Loss) from Investment Operations: | |
Net Investment Loss(2) | | | (0.17 | ) | | | (0.09 | ) | | | (0.11 | ) | | | (0.03 | ) | | | (0.05 | ) | |
Net Realized and Unrealized Gain | | | 16.28 | | | | 0.18 | | | | 6.82 | | | | 1.68 | | | | 0.17 | | |
Total from Investment Operations | | | 16.11 | | | | 0.09 | | | | 6.71 | | | | 1.65 | | | | 0.12 | | |
Distributions from and/or in Excess of: | |
Net Realized Gain | | | (2.31 | ) | | | (3.68 | ) | | | (6.92 | ) | | | (11.59 | ) | | | (4.32 | ) | |
Net Asset Value, End of Period | | $ | 29.92 | | | $ | 16.12 | | | $ | 19.71 | | | $ | 19.92 | | | $ | 29.86 | | |
Total Return(3) | | | 114.87 | % | | | 4.40 | % | | | 47.36 | % | | | 15.85 | % | | | (0.12 | )% | |
Ratios to Average Net Assets and Supplemental Data: | |
Net Assets, End of Period (Thousands) | | $ | 1,403,660 | | | $ | 403,285 | | | $ | 304,921 | | | $ | 289,123 | | | $ | 480,488 | | |
Ratio of Expenses Before Expense Limitation | | | 1.01 | % | | | 1.00 | % | | | 1.02 | % | | | 1.01 | % | | | 1.00 | % | |
Ratio of Expenses After Expense Limitation | | | 1.00 | %(4) | | | 0.99 | %(4) | | | 1.01 | %(4) | | | 1.01 | %(4) | | | 0.99 | %(4) | |
Ratio of Expenses After Expense Limitation Excluding Non-Operating Expenses | | | 1.00 | %(4) | | | 0.99 | %(4) | | | 1.01 | %(4) | | | 1.00 | %(4) | | | N/A | | |
Ratio of Net Investment Loss | | | (0.82 | )%(4) | | | (0.52 | )%(4) | | | (0.65 | )%(4) | | | (0.17 | )%(4) | | | (0.17 | )%(4) | |
Ratio of Rebate from Morgan Stanley Affiliates | | | 0.01 | % | | | 0.01 | % | | | 0.01 | % | | | 0.01 | % | | | 0.00 | %(5) | |
Portfolio Turnover Rate | | | 65 | % | | | 116 | % | | | 86 | % | | | 59 | % | | | 23 | % | |
(1) Reflects prior period custodian out-of-pocket expenses that were reimbursed in September 2016. The amount of the reimbursement was immaterial on a per share basis and did not impact the total return of Class A shares. The Ratio of Expenses After Expense Limitation would have been less than 0.005% higher and the Ratio of Net Investment Loss would have been less than 0.005% lower had the custodian not reimbursed the Fund.
(2) Per share amount is based on average shares outstanding.
(3) Calculated based on the net asset value which does not reflect sales charges, if applicable, as of the last business day of the period.
(4) The Ratio of Expenses After Expense Limitation and Ratio of Net Investment Loss reflect the rebate of certain Fund expenses in connection with the investments in Morgan Stanley affiliates during the period. The effect of the rebate on the ratios is disclosed in the above table as "Ratio of Rebate from Morgan Stanley Affiliates."
(5) Amount is less than 0.005%.
The accompanying notes are an integral part of the financial statements.
14
Morgan Stanley Institutional Fund Trust
Annual Report — September 30, 2020
Financial Highlights
Discovery Portfolio
| | | Class L | |
| | | Year Ended September 30, | |
Selected Per Share Data and Ratios | | 2020 | | 2019 | | 2018 | | 2017 | | 2016(1) | |
Net Asset Value, Beginning of Period | | $ | 14.21 | | | $ | 17.96 | | | $ | 18.79 | | | $ | 29.01 | | | $ | 33.39 | | |
Income (Loss) from Investment Operations: | |
Net Investment Loss(2) | | | (0.21 | ) | | | (0.15 | ) | | | (0.18 | ) | | | (0.16 | ) | | | (0.22 | ) | |
Net Realized and Unrealized Gain | | | 14.00 | | | | 0.08 | | | | 6.27 | | | | 1.53 | | | | 0.16 | | |
Total from Investment Operations | | | 13.79 | | | | (0.07 | ) | | | 6.09 | | | | 1.37 | | | | (0.06 | ) | |
Distributions from and/or in Excess of: | |
Net Realized Gain | | | (2.31 | ) | | | (3.68 | ) | | | (6.92 | ) | | | (11.59 | ) | | | (4.32 | ) | |
Net Asset Value, End of Period | | $ | 25.69 | | | $ | 14.21 | | | $ | 17.96 | | | $ | 18.79 | | | $ | 29.01 | | |
Total Return(3) | | | 113.70 | % | | | 3.90 | % | | | 46.73 | % | | | 15.07 | % | | | (0.73 | )% | |
Ratios to Average Net Assets and Supplemental Data: | |
Net Assets, End of Period (Thousands) | | $ | 14,173 | | | $ | 8,124 | | | $ | 9,572 | | | $ | 8,091 | | | $ | 9,874 | | |
Ratio of Expenses Before Expense Limitation | | | 1.50 | % | | | 1.51 | % | | | 1.51 | % | | | 1.64 | % | | | 1.61 | % | |
Ratio of Expenses After Expense Limitation | | | 1.49 | %(4) | | | 1.50 | %(4) | | | 1.50 | %(4) | | | 1.63 | %(4) | | | 1.60 | %(4) | |
Ratio of Expenses After Expense Limitation Excluding Non-Operating Expenses | | | 1.49 | %(4) | | | 1.50 | %(4) | | | 1.50 | %(4) | | | 1.63 | %(4) | | | N/A | | |
Ratio of Net Investment Loss | | | (1.27 | )%(4) | | | (1.06 | )%(4) | | | (1.15 | )%(4) | | | (0.85 | )%(4) | | | (0.76 | )%(4) | |
Ratio of Rebate from Morgan Stanley Affiliates | | | 0.01 | % | | | 0.01 | % | | | 0.01 | % | | | 0.01 | % | | | 0.00 | %(5) | |
Portfolio Turnover Rate | | | 65 | % | | | 116 | % | | | 86 | % | | | 59 | % | | | 23 | % | |
(1) Reflects prior period custodian out-of-pocket expenses that were reimbursed in September 2016. The amount of the reimbursement was immaterial on a per share basis and did not impact the total return of Class L shares. The Ratio of Expenses After Expense Limitation would have been less than 0.005% higher and the Ratio of Net Investment Loss would have been less than 0.005% lower had the custodian not reimbursed the Fund.
(2) Per share amount is based on average shares outstanding.
(3) Calculated based on the net asset value as of the last business day of the period.
(4) The Ratio of Expenses After Expense Limitation and Ratio of Net Investment Loss reflect the rebate of certain Fund expenses in connection with the investments in Morgan Stanley affiliates during the period. The effect of the rebate on the ratios is disclosed in the above table as "Ratio of Rebate from Morgan Stanley Affiliates."
(5) Amount is less than 0.005%.
The accompanying notes are an integral part of the financial statements.
15
Morgan Stanley Institutional Fund Trust
Annual Report — September 30, 2020
Financial Highlights
Discovery Portfolio
| | | Class C | |
| | | Year Ended September 30, | | Period from
May 31, 2017(1) to | |
Selected Per Share Data and Ratios | | 2020 | | 2019 | | 2018 | | September 30, 2017 | |
Net Asset Value, Beginning of Period | | $ | 15.67 | | | $ | 19.42 | | | $ | 19.85 | | | $ | 19.34 | | |
Income (Loss) from Investment Operations: | |
Net Investment Loss(2) | | | (0.32 | ) | | | (0.22 | ) | | | (0.29 | ) | | | (0.09 | ) | |
Net Realized and Unrealized Gain | | | 15.70 | | | | 0.15 | | | | 6.78 | | | | 0.60 | | |
Total from Investment Operations | | | 15.38 | | | | (0.07 | ) | | | 6.49 | | | | 0.51 | | |
Distributions from and/or in Excess of: | |
Net Realized Gain | | | (2.31 | ) | | | (3.68 | ) | | | (6.92 | ) | | | — | | |
Net Asset Value, End of Period | | $ | 28.74 | | | $ | 15.67 | | | $ | 19.42 | | | $ | 19.85 | | |
Total Return(3) | | | 113.21 | % | | | 3.55 | % | | | 46.08 | % | | | 2.64 | %(6) | |
Ratios to Average Net Assets and Supplemental Data: | |
Net Assets, End of Period (Thousands) | | $ | 33,781 | | | $ | 6,518 | | | $ | 536 | | | $ | 10 | | |
Ratio of Expenses Before Expense Limitation | | | 1.75 | % | | | 1.84 | % | | | 3.69 | % | | | 15.31 | %(7) | |
Ratio of Expenses After Expense Limitation | | | 1.74 | %(4) | | | 1.83 | %(4) | | | 1.89 | %(4) | | | 1.90 | %(4)(7) | |
Ratio of Expenses After Expense Limitation Excluding Non-Operating Expenses | | | 1.74 | %(4) | | | 1.83 | %(4) | | | 1.89 | %(4) | | | 1.90 | %(4)(7) | |
Ratio of Net Investment Loss | | | (1.59 | )%(4) | | | (1.32 | )%(4) | | | (1.58 | )%(4) | | | (1.34 | )%(4)(7) | |
Ratio of Rebate from Morgan Stanley Affiliates | | | 0.01 | % | | | 0.01 | % | | | 0.01 | % | | | 0.00 | %(5)(7) | |
Portfolio Turnover Rate | | | 65 | % | | | 116 | % | | | 86 | % | | | 59 | %(6) | |
(1) Commencement of Offering.
(2) Per share amount is based on average shares outstanding.
(3) Calculated based on the net asset value which does not reflect sales charges, if applicable, as of the last business day of the period.
(4) The Ratio of Expenses After Expense Limitation and Ratio of Net Investment Loss reflect the rebate of certain Fund expenses in connection with the investments in Morgan Stanley affiliates during the period. The effect of the rebate on the ratios is disclosed in the above table as "Ratio of Rebate from Morgan Stanley Affiliates."
(5) Amount is less than 0.005%.
(6) Not annualized.
(7) Annualized.
The accompanying notes are an integral part of the financial statements.
16
Morgan Stanley Institutional Fund Trust
Annual Report — September 30, 2020
Financial Highlights
Discovery Portfolio
| | | Class IS | |
| | | Year Ended September 30, | |
Selected Per Share Data and Ratios | | 2020 | | 2019 | | 2018 | | 2017 | | 2016(1) | |
Net Asset Value, Beginning of Period | | $ | 20.15 | | | $ | 23.50 | | | $ | 22.43 | | | $ | 31.94 | | | $ | 36.03 | | |
Income (Loss) from Investment Operations: | |
Net Investment Income (Loss)(2) | | | (0.12 | ) | | | (0.04 | ) | | | (0.06 | ) | | | 0.04 | | | | 0.07 | | |
Net Realized and Unrealized Gain | | | 21.00 | | | | 0.37 | | | | 8.05 | | | | 2.04 | | | | 0.16 | | |
Total from Investment Operations | | | 20.88 | | | | 0.33 | | | | 7.99 | | | | 2.08 | | | | 0.23 | | |
Distributions from and/or in Excess of: | |
Net Realized Gain | | | (2.31 | ) | | | (3.68 | ) | | | (6.92 | ) | | | (11.59 | ) | | | (4.32 | ) | |
Net Asset Value, End of Period | | $ | 38.72 | | | $ | 20.15 | | | $ | 23.50 | | | $ | 22.43 | | | $ | 31.94 | | |
Total Return(3) | | | 115.65 | % | | | 4.77 | % | | | 47.89 | % | | | 16.24 | % | | | 0.25 | % | |
Ratios to Average Net Assets and Supplemental Data: | |
Net Assets, End of Period (Thousands) | | $ | 354,067 | | | $ | 130,653 | | | $ | 93,005 | | | $ | 63,225 | | | $ | 219,255 | | |
Ratio of Expenses Before Expense Limitation | | | 0.64 | % | | | 0.64 | % | | | 0.66 | % | | | 0.65 | % | | | 0.62 | % | |
Ratio of Expenses After Expense Limitation | | | 0.63 | %(4) | | | 0.63 | %(4) | | | 0.65 | %(4) | | | 0.65 | %(4) | | | 0.61 | %(4) | |
Ratio of Expenses After Expense Limitation Excluding Non-Operating Expenses | | | 0.63 | %(4) | | | 0.63 | %(4) | | | 0.65 | %(4) | | | 0.65 | %(4) | | | N/A | | |
Ratio of Net Investment Income (Loss) | | | (0.44 | )%(4) | | | (0.18 | )%(4) | | | (0.30 | )%(4) | | | 0.18 | %(4) | | | 0.22 | %(4) | |
Ratio of Rebate from Morgan Stanley Affiliates | | | 0.01 | % | | | 0.01 | % | | | 0.01 | % | | | 0.01 | % | | | 0.00 | %(5) | |
Portfolio Turnover Rate | | | 65 | % | | | 116 | % | | | 86 | % | | | 59 | % | | | 23 | % | |
(1) Reflects prior period custodian out-of-pocket expenses that were reimbursed in September 2016. The amount of the reimbursement was immaterial on a per share basis and did not impact the total return of Class IS shares. The Ratio of Expenses After Expense Limitation would have been less than 0.005% higher and the Ratio of Net Investment Income would have been less than 0.005% lower had the custodian not reimbursed the Fund.
(2) Per share amount is based on average shares outstanding.
(3) Calculated based on the net asset value as of the last business day of the period.
(4) The Ratio of Expenses After Expense Limitation and Ratio of Net Investment Income (Loss) reflect the rebate of certain Fund expenses in connection with the investments in Morgan Stanley affiliates during the period. The effect of the rebate on the ratios is disclosed in the above table as "Ratio of Rebate from Morgan Stanley Affiliates."
(5) Amount is less than 0.005%.
The accompanying notes are an integral part of the financial statements.
17
Morgan Stanley Institutional Fund Trust
Annual Report — September 30, 2020
Notes to Financial Statements
Morgan Stanley Institutional Fund Trust ("Trust'') is registered under the Investment Company Act of 1940, as amended (the "Act''), as an open-end management investment company. The Trust is comprised of twelve separate, active funds (individually referred to as a "Fund," collectively as the "Funds"). The Trust applies investment company accounting and reporting guidance. All Funds are considered diversified for purposes of the Act.
The accompanying financial statements relate to the Discovery Portfolio. The Fund seeks long-term capital growth. The Fund offers five classes of shares — Class I, Class A, Class L, Class C and Class IS.
The Fund has suspended offering of Class L shares for sale to all investors. Class L shareholders of the Fund do not have the option of purchasing additional Class L shares. However, existing Class L shareholders may invest in additional Class L shares through reinvestment of dividends and distributions.
A. Significant Accounting Policies: The following significant accounting policies are in conformity with U.S. generally accepted accounting principles ("GAAP"). Such policies are consistently followed by the Trust in the preparation of its financial statements. GAAP may require management to make estimates and assumptions that affect the reported amounts and disclosures in the financial statements. Actual results may differ from those estimates.
1. Security Valuation: (1) An equity portfolio security listed or traded on an exchange is valued at its latest reported sales price (or at the exchange official closing price if such exchange reports an official closing price), and if there were no sales on a given day and if there is no official exchange closing price for that day, the security is valued at the mean between the last reported bid and asked prices if such bid and asked prices are available on the relevant exchanges. If only bid prices are available then the latest bid price may be used. Listed equity securities not traded on the valuation date with no reported bid and asked prices available on the exchange are valued at the mean between the current bid and asked prices obtained from one or more reputable brokers or dealers. In cases where a security is traded on more than one exchange, the security is valued on the exchange designated as the primary market; (2) all other equity portfolio securities for which over-the-counter ("OTC") market quotations are readily available are valued at the latest reported sales price (or at the market official closing price if such market reports an official closing price), and if there was no trading in the security
on a given day and if there is no official closing price from relevant markets for that day, the security is valued at the mean between the last reported bid and asked prices if such bid and asked prices are available on the relevant markets. An unlisted equity security that does not trade on the valuation date and for which bid and asked prices from the relevant markets are unavailable is valued at the mean between the current bid and asked prices obtained from one or more reputable brokers or dealers; (3) listed options are valued at the last reported sales price on the exchange on which they are listed (or at the exchange official closing price if such exchange reports an official closing price). If an official closing price or last reported sales price is unavailable, the listed option should be fair valued at the mean between its latest bid and ask prices. Unlisted options are valued at the mean between their latest bid and ask prices from a broker/dealer or valued by a pricing service/vendor; (4) certain portfolio securities may be valued by an outside pricing service/vendor approved by the Trust's Board of Trustees (the "Trustees"). The pricing service/vendor may employ a pricing model that takes into account, among other things, bids, yield spreads and/or other market data and specific security characteristics. Alternatively, if a valuation is not available from an outside pricing service/vendor, and the security trades on an exchange, the security may be valued at its latest reported sale price (or at the exchange official closing price if such exchange reports an official closing price), prior to the time when assets are valued. If there are no sales on a given day and if there is no official exchange closing price for that day, the security is valued at the mean between the last reported bid and asked prices if such bid and asked prices are available in the relevant exchanges. If only bid prices are available then the latest bid price may be used. If Morgan Stanley Investment Management Inc. (the "Adviser"), a wholly-owned subsidiary of Morgan Stanley, determines that the price provided by the outside pricing service/vendor or exchange does not reflect the security's fair value or is unable to provide a price, prices from brokers or dealers may also be utilized. In these circumstances, the value of the security will be the mean of bid and asked prices obtained from brokers or dealers; (5) when market quotations are not readily available, including circumstances under which the Adviser determines that the closing price, last sale price or the mean between the last reported bid and asked prices are not reflective of a security's market value, portfolio securities are valued at
18
Morgan Stanley Institutional Fund Trust
Annual Report — September 30, 2020
Notes to Financial Statements (cont'd)
their fair value as determined in good faith under procedures established by and under the general supervision of the Trustees. Occasionally, developments affecting the closing prices of securities and other assets may occur between the times at which valuations of such securities are determined (that is, close of the foreign market on which the securities trade) and the close of business of the New York Stock Exchange ("NYSE"). If developments occur during such periods that are expected to materially affect the value of such securities, such valuations may be adjusted to reflect the estimated fair value of such securities as of the close of the NYSE, as determined in good faith by the Trustees or by the Adviser using a pricing service and/or procedures approved by the Trustees; (6) quotations of foreign portfolio securities, other assets and liabilities and forward contracts stated in foreign currency are translated into U.S. dollar equivalents at the prevailing market rates prior to the close of the NYSE; and (7) investments in mutual funds, including the Morgan Stanley Institutional Liquidity Funds, are valued at the net asset value ("NAV") as of the close of each business day.
The Trustees have responsibility for determining in good faith the fair value of the investments, and the Trustees may appoint others, such as the Trust's Adviser or a valuation committee, to assist the Trustees in determining fair value and to make the actual calculations pursuant to the fair valuation methodologies previously approved by the Trustees. Under procedures approved by the Trustees, the Trust's Adviser has formed a Valuation Committee whose members are approved by the Trustees. The Valuation Committee provides administration and oversight of the Trust's valuation policies and procedures, which are reviewed at least annually by the Trustees. These procedures allow the Trust to utilize independent pricing services, quotations from securities and financial instrument dealers and other market sources to determine fair value.
2. Fair Value Measurement: FASB Accounting Standards CodificationTM ("ASC") 820, "Fair Value Measurement" ("ASC 820"), defines fair value as the value that the Fund would receive to sell an investment or pay to transfer a liability in a timely transaction with an independent
buyer in the principal market, or in the absence of a principal market, the most advantageous market for the investment or liability. ASC 820 establishes a three-tier hierarchy to distinguish between (1) inputs that reflect the assumptions market participants would use in valuing an asset or liability developed based on market data obtained from sources independent of the reporting entity (observable inputs) and (2) inputs that reflect the reporting entity's own assumptions about the assumptions market participants would use in valuing an asset or liability developed based on the best information available in the circumstances (unobservable inputs) and to establish classification of fair value measurements for disclosure purposes. Various inputs are used in determining the value of the Fund's investments. The inputs are summarized in the three broad levels listed below:
• Level 1 – unadjusted quoted prices in active markets for identical investments
• Level 2 – other significant observable inputs (including quoted prices for similar investments, interest rates, prepayment speeds, credit risk, etc.)
• Level 3 – significant unobservable inputs including the Fund's own assumptions in determining the fair value of investments. Factors considered in making this determination may include, but are not limited to, information obtained by contacting the issuer, analysts, or the appropriate stock exchange (for exchange-traded securities), analysis of the issuer's financial statements or other available documents and, if necessary, available information concerning other securities in similar circumstances.
The inputs or methodology used for valuing securities are not necessarily an indication of the risk associated with investing in those securities and the determination of the significance of a particular input to the fair value measurement in its entirety requires judgment and considers factors specific to each security.
19
Morgan Stanley Institutional Fund Trust
Annual Report — September 30, 2020
Notes to Financial Statements (cont'd)
The following is a summary of the inputs used to value the Fund's investments as of September 30, 2020:
Investment Type | | Level 1
Unadjusted
quoted
prices
(000) | | Level 2
Other
significant
observable
inputs
(000) | | Level 3
Significant
unobservable
inputs
(000) | | Total
(000) | |
Assets: | |
Common Stocks | |
Biotechnology | | $ | 41,391 | | | $ | — | | | $ | — | | | $ | 41,391 | | |
Electronic Equipment,
Instruments &
Components | | | 23,550 | | | | — | | | | — | | | | 23,550 | | |
Entertainment | | | 160,882 | | | | — | | | | — | | | | 160,882 | | |
Health Care Equipment &
Supplies | | | 125,503 | | | | — | | | | — | | | | 125,503 | | |
Health Care Providers &
Services | | | 121,645 | | | | — | | | | — | | | | 121,645 | | |
Health Care Technology | | | 198,875 | | | | — | | | | 3,980 | | | | 202,855 | | |
Information Technology
Services | | | 699,925 | | | | 49,355 | | | | — | | | | 749,280 | | |
Interactive Media &
Services | | | 323,774 | | | | — | | | | — | | | | 323,774 | | |
Internet & Direct
Marketing Retail | | | 231,089 | | | | — | | | | — | | | | 231,089 | | |
Leisure Products | | | 88,726 | | | | — | | | | — | | | | 88,726 | | |
Life Sciences Tools &
Services | | | 161,397 | | | | — | | | | — | | | | 161,397 | | |
Metals & Mining | | | 4,093 | | | | — | | | | — | | | | 4,093 | | |
Oil, Gas & Consumable
Fuels | | | 3,830 | | | | — | | | | — | | | | 3,830 | | |
Pharmaceuticals | | | 38,137 | | | | — | | | | — | | | | 38,137 | | |
Semiconductors &
Semiconductor
Equipment | | | 21,336 | | | | — | | | | — | | | | 21,336 | | |
Software | | | 531,479 | | | | — | | | | — | | | | 531,479 | | |
Specialty Retail | | | 136,800 | | | | — | | | | — | | | | 136,800 | | |
Total Common Stocks | | | 2,912,432 | | | | 49,355 | | | | 3,980 | | | | 2,965,767 | | |
Investment Type | | Level 1
Unadjusted
quoted
prices
(000) | | Level 2
Other
significant
observable
inputs
(000) | | Level 3
Significant
unobservable
inputs
(000) | | Total
(000) | |
Preferred Stocks | |
Internet & Direct
Marketing Retail | | $ | 2,774 | | | $ | — | | | $ | — | | | $ | 2,774 | | |
Call Options Purchased | | | — | | | | 3,218 | | | | — | | | | 3,218 | | |
Short-Term Investments | |
Investment Company | | | 89,721 | | | | — | | | | — | | | | 89,721 | | |
Repurchase Agreements | | | — | | | | 2,060 | | | | — | | | | 2,060 | | |
Total Short-Term
Investments | | | 89,721 | | | | 2,060 | | | | — | | | | 91,781 | | |
Total Assets | | $ | 3,004,927 | | | $ | 54,633 | | | $ | 3,980 | | | $ | 3,063,540 | | |
Transfers between investment levels may occur as the markets fluctuate and/or the availability of data used in an investment's valuation changes.
Following is a reconciliation of investments in which significant unobservable inputs (Level 3) were used in determining fair value:
| | | Common
Stock
(000) | |
Beginning Balance | | $ | 2,832 | | |
Purchases | | | — | | |
Sales | | | — | | |
Amortization of discount | | | — | | |
Transfers in | | | — | | |
Transfers out | | | — | | |
Corporate actions | | | — | | |
Change in unrealized appreciation (depreciation) | | | 1,148 | | |
Realized gains (losses) | | | — | | |
Ending Balance | | $ | 3,980 | | |
Net change in unrealized appreciation (depreciation) from investments
still held as of September 30, 2020 | | $ | 1,148 | | |
The following table presents additional information about valuation techniques and inputs used for investments that are measured at fair value and categorized within Level 3 as of September 30, 2020:
| | | Fair Value at
September 30, 2020
(000) | | Valuation
Technique | | Unobservable
Input | | Amount* | | Impact to
Valuation from an
Increase in Input** | |
Common Stock | | $ | 3,980 | | | Discounted Cash Flow | | Weighted Average
Cost of Capital | | | 12.5 | % | | Decrease | |
| | | | | | | Perpetual Growth Rate | | | 3.5 | % | | Increase | |
| | | | | Market Comparable
Companies | | Enterprise Value/
Revenue | | | 1.1x | | | Increase | |
| | | | | | | Discount for Lack of
Marketability | | | 12.0 | % | | Decrease | |
* Amount is indicative of the weighted average.
** Represents the expected directional change in the fair value of the Level 3 investments that would result from an increase in the corresponding input. A decrease to the unobservable input would have the opposite effect. Significant changes in these inputs could result in significantly higher or lower fair value measurements.
20
Morgan Stanley Institutional Fund Trust
Annual Report — September 30, 2020
Notes to Financial Statements (cont'd)
3. Repurchase Agreements: The Fund may enter into repurchase agreements under which the Fund lends cash and takes possession of securities with an agreement that the counterparty will repurchase such securities. In connection with transactions in repurchase agreements, a bank as custodian for the Fund takes possession of the underlying securities which are held as collateral, with a market value at least equal to the amount of the repurchase transaction, including principal and accrued interest. To the extent that any repurchase transaction exceeds one business day, the value of the collateral is marked-to-market on a daily basis to determine that the value of the collateral does not decrease below the repurchase price plus accrued interest as earned. If such a decrease occurs, additional collateral will be requested and, when received, will be added to the account to maintain full collateralization. In the event of default on the obligation to repurchase, the Fund has the right to liquidate the collateral and apply the proceeds in satisfaction of the obligation. In the event of default or bankruptcy by the counterparty to the agreement, realization of the collateral proceeds may be subject to cost and delays. The Fund, along with other affiliated investment companies, may utilize a joint trading account for the purpose of entering into repurchase agreements.
4. Foreign Currency Translation and Foreign Investments: The books and records of the Fund are maintained in U.S. dollars. Foreign currency amounts are translated into U.S. dollars as follows:
– investments, other assets and liabilities at the prevailing rate of exchange on the valuation date;
– investment transactions and investment income at the prevailing rates of exchange on the dates of such transactions.
Although the net assets of the Fund are presented at the foreign exchange rates and market values at the close of the period, the Fund does not isolate that portion of the results of operations arising as a result of changes in the foreign exchange rates from the fluctuations arising from changes in the market prices of securities held at period end. Similarly, the Fund does not isolate the effect of changes in foreign exchange rates from the fluctuations arising from changes in the market prices of securities sold during the period. Accordingly, realized and unrealized foreign currency gains (losses) on invest-
ments in securities are included in the reported net realized and unrealized gains (losses) on investment transactions and balances. However, pursuant to U.S. federal income tax regulations, gains and losses from certain foreign currency transactions and the foreign currency portion of gains and losses realized on sales and maturities of foreign denominated debt securities are treated as ordinary income for U.S. federal income tax purposes.
Net realized gains (losses) on foreign currency transactions represent net foreign exchange gains (losses) from foreign currency forward exchange contracts, disposition of foreign currencies, currency gains (losses) realized between the trade and settlement dates on securities transactions, and the difference between the amount of investment income and foreign withholding taxes recorded on the Fund's books and the U.S. dollar equivalent amounts actually received or paid. The change in unrealized currency gains (losses) on foreign currency transactions for the period is reflected in the Statement of Operations.
Foreign security and currency transactions may involve certain considerations and risks not typically associated with those of U.S. dollar denominated transactions as a result of, among other factors, fluctuations of exchange rates in relation to the U.S. dollar, the possibility of lower levels of governmental supervision and regulation of foreign securities markets and the possibility of political or economic instability.
Governmental approval for foreign investments may be required in advance of making an investment under certain circumstances in some countries, and the extent of foreign investments in domestic companies may be subject to limitation in other countries. Foreign ownership limitations also may be imposed by the charters of individual companies to prevent, among other concerns, violations of foreign investment limitations. As a result, an additional class of shares (identified as "Foreign" in the Portfolio of Investments) may be created and offered for investment. The "local" and "foreign shares" market values may differ. In the absence of trading of the foreign shares in such markets, the Fund values the foreign shares at the closing exchange price of the local shares.
5. Derivatives: The Fund may, but is not required to, use derivative instruments for a variety of purposes, including hedging, risk management, portfolio management or to
21
Morgan Stanley Institutional Fund Trust
Annual Report — September 30, 2020
Notes to Financial Statements (cont'd)
earn income. Derivatives are financial instruments whose value is based, in part, on the value of an underlying asset, interest rate, index or financial instrument. Prevailing interest rates and volatility levels, among other things, also affect the value of derivative instruments. A derivative instrument often has risks similar to its underlying asset and may have additional risks, including imperfect correlation between the value of the derivative and the underlying asset, risks of default by the counterparty to certain transactions, magnification of losses incurred due to changes in the market value of the securities, instruments, indices or interest rates to which the derivative instrument relates, risks that the transactions may not be liquid and risks arising from margin requirements. The use of derivatives involves risks that are different from, and possibly greater than, the risks associated with other portfolio investments. Derivatives may involve the use of highly specialized instruments that require investment techniques and risk analyses different from those associated with other portfolio investments. All of the Fund's holdings, including derivative instruments, are marked-to-market each day with the change in value reflected in unrealized appreciation (depreciation). Upon disposition, a realized gain or loss is recognized.
Certain derivative transactions may give rise to a form of leverage. Leverage magnifies the potential for gain and the risk of loss. Leverage associated with derivative transactions may cause the Fund to liquidate portfolio positions when it may not be advantageous to do so to satisfy its obligations or to meet earmarking or segregation requirements, pursuant to applicable Securities and Exchange Commission ("SEC") rules and regulations, or may cause the Fund to be more volatile than if the Fund had not been leveraged. Although the Adviser seeks to use derivatives to further the Fund's investment objectives, there is no assurance that the use of derivatives will achieve this result.
Following is a description of the derivative instruments and techniques that the Fund used during the period and their associated risks:
Options: With respect to options, the Fund is subject to equity risk, interest rate risk and foreign currency exchange risk in the normal course of pursuing its investment objectives. If the Fund buys an option, it
buys a legal contract giving it the right to buy or sell a specific amount of the underlying instrument or foreign currency, or futures contract on the underlying instrument or foreign currency, at an agreed-upon price during a period of time or on a specified date typically in exchange for a premium paid by the Fund. The Fund may purchase and/or sell put and call options. Purchasing call options tends to increase the Fund's exposure to the underlying (or similar) instrument. Purchasing put options tends to decrease the Fund's exposure to the underlying (or similar) instrument. When entering into purchased option contracts, the Fund bears the risk of interest or exchange rates or securities prices moving unexpectedly, in which case, the Fund may not achieve the anticipated benefits of the purchased option contracts; however the risk of loss is limited to the premium paid. Purchased options are reported as part of "Total Investments in Securities" in the Statement of Assets and Liabilities. Premium paid for purchasing options which expired are treated as realized losses. If the Fund sells an option, it sells to another party the right to buy from or sell to the Fund a specific amount of the underlying instrument or foreign currency, or futures contract on the underlying instrument or foreign currency, at an agreed-upon price during a period of time or on a specified date typically in exchange for a premium received by the Fund. When options are purchased OTC, the Fund bears the risk that the counterparty that wrote the option will be unable or unwilling to perform its obligations under the option contract. Options may also be illiquid and the Fund may have difficulty closing out its position. A decision as to whether, when and how to use options involves the exercise of skill and judgment and even a well-conceived option transaction may be unsuccessful because of market behavior or unexpected events. The prices of options can be highly volatile and the use of options can lower total returns.
FASB ASC 815, "Derivatives and Hedging" ("ASC 815"), is intended to improve financial reporting about derivative instruments by requiring enhanced disclosures to enable investors to better understand how and why the Fund uses derivative instruments, how these derivative instruments are accounted for and their effects on the Fund's financial position and results of operations.
22
Morgan Stanley Institutional Fund Trust
Annual Report — September 30, 2020
Notes to Financial Statements (cont'd)
The following table sets forth the fair value of the Fund's derivative contracts by primary risk exposure as of September 30, 2020:
| | | Asset Derivatives
Statement of Assets and
Liabilities Location | | Primary Risk
Exposure | | Value
(000) | |
Purchased Options
| | Investments, at Value
(Purchased Options) | |
Currency Risk | | $ | 3,218 | (a) | |
(a) Amounts are included in Investments in Securities in the Statement of Assets and Liabilities.
The following tables set forth by primary risk exposure the Fund's realized gains (losses) and change in unrealized appreciation (depreciation) by type of derivative contract for the year ended September 30, 2020 in accordance with ASC 815:
Realized Gain (Loss) | |
Primary Risk Exposure | | Derivative Type | | Value
(000) | |
Currency Risk
| | Investments
(Purchased Options) | | |
$(3,178)(b) | | |
(b) Amounts are included in Investments Sold in the Statement of Operations.
Change in Unrealized Appreciation (Depreciation) | |
Primary Risk Exposure | | Derivative Type | | Value
(000) | |
Currency Risk
| | Investments
(Purchased Options) | | |
$(2,754)(c) | | |
(c) Amounts are included in Investments in the Statement of Operations.
At September 30, 2020, the Fund's derivative assets and liabilities are as follows:
Gross Amounts of Assets and Liabilities
Presented in the Statement of Assets and Liabilities | |
Derivatives | | Assets(d)
(000) | | Liabilities(d)
(000) | |
Purchased Options | | $ | 3,218 | (a) | | $ | — | | |
(a) Amounts are included in Investments in Securities in the Statement of Assets and Liabilities.
(d) Absent an event of default or early termination, OTC derivative assets and liabilities are presented gross and not offset in the Statement of Assets and Liabilities.
The Fund typically enters into International Swaps and Derivatives Association, Inc. Master Agreements ("ISDA Master Agreements") or similar master agreements (collectively, "Master Agreements") with its contract counterparties for certain OTC derivatives in order to, among other things, reduce its credit risk to counterparties. ISDA Master Agreements include provisions for general obligations, representations, collateral and events of default or termination. Under an ISDA Master Agreement, the Fund typically may offset with the counterparty certain OTC derivative financial instruments' payables and/or receivables with collateral held
and/or posted and create one single net payment (close-out netting) in the event of default, termination and/or potential deterioration in the credit quality of the counterparty. Various Master Agreements govern the terms of certain transactions with counterparties, including transactions such as swap, forward, repurchase and reverse repurchase agreements. These Master Agreements typically attempt to reduce the counterparty risk associated with such transactions by specifying credit protection mechanisms and providing standardization that improves legal certainty. Cross-termination provisions under Master Agreements typically provide that a default in connection with one transaction between the Fund and a counterparty gives the non-defaulting party the right to terminate any other transactions in place with the defaulting party to create one single net payment due to/due from the defaulting party and may be a feature in certain Master Agreements. In the event the Fund exercises its right to terminate a Master Agreement after a counterparty experiences a termination event as defined in the Master Agreement, the return of collateral with market value in excess of the Fund's net liability may be delayed or denied.
The following table presents derivative financial instruments that are subject to enforceable netting arrangements as of September 30, 2020:
Gross Amounts Not Offset in the Statement of Assets and Liabilities | |
Counterparty | | Gross Asset
Derivatives
Presented in
the Statement
of Assets and
Liabilities(a)
(000) | | Financial
Instrument
(000) | | Collateral
Received(e)
(000) | | Net Amount
(not less
than $0)
(000) | |
BNP Paribas | | $ | 1,654 | | | $ | — | | | $ | (1,654 | ) | | $ | 0 | | |
Royal Bank of Scotland | | | 1,564 | | | | — | | | | (1,564 | ) | | | 0 | | |
Total | | $ | 3,218 | | | $ | — | | | $ | (3,218 | ) | | $ | 0 | | |
(a) Amounts are included in Investments in Securities in the Statement of Assets and Liabilities.
(e) In some instances, the actual collateral received may be more than the amount shown here due to overcollateralization.
For the year ended September 30, 2020, the approximate average monthly amount outstanding for each derivative type is as follows:
Options Purchased: | |
Average monthly notional amount | | | 710,671,000 | | |
6. Securities Lending: The Fund lends securities to qualified financial institutions, such as broker-dealers, to earn additional income. Any increase or decrease in the fair
23
Morgan Stanley Institutional Fund Trust
Annual Report — September 30, 2020
Notes to Financial Statements (cont'd)
value of the securities loaned that might occur and any interest earned or dividends declared on those securities during the term of the loan would remain in the Fund. The Fund would receive cash or securities as collateral in an amount equal to or exceeding 100% of the current fair value of the loaned securities. The collateral is marked-to-market daily by State Street Bank and Trust Company ("State Street"), the securities lending agent, to ensure that a minimum of 100% collateral coverage is maintained.
Based on pre-established guidelines, the securities lending agent invests any cash collateral that is received in an affiliated money market portfolio and repurchase agreements. Securities lending income is generated from the earnings on the invested collateral and borrowing fees, less any rebates owed to the borrowers and compensation to the lending agent, and is recorded as "Income from Securities Loaned — Net" in the Fund's Statement of Operations. Risks in securities lending transactions are that a borrower may not provide additional collateral when required or return the securities when due, and that the value of the short-term investments will be less than the amount of cash collateral plus any rebate that is required to be returned to the borrower.
The Fund has the right under the securities lending agreement to recover the securities from the borrower on demand.
The following table presents financial instruments that are subject to enforceable netting arrangements as of September 30, 2020:
Gross Amounts Not Offset in the Statement of Assets and Liabilities | |
Gross Asset
Amounts
Presented in the
Statement of
Assets and
Liabilities
(000) | | Financial
Instrument
(000) | | Collateral
Received
(000) | | Net Amount
(not less
than $0)
(000) | |
| $ | 10,527 | (f) | | $ | — | | | $ | (10,527 | )(g)(h) | | $ | 0 | | |
(f) Represents market value of loaned securities at year end.
(g) The Fund received cash collateral of approximately $11,093,000, which was subsequently invested in Repurchase Agreements and Morgan Stanley Institutional Liquidity Funds as reported in the Portfolio of Investments.
(h) The actual collateral received is greater than the amount shown here due to overcollateralization.
FASB ASC 860, "Transfers & Servicing: Repurchase-to-Maturity Transactions, Repurchase Financings, and Disclosures", is intended to provide increased transparency about the types of collateral pledged in securities lending
transactions and other similar transactions that are accounted for as secured borrowing.
The following table displays a breakdown of transactions accounted for as secured borrowings, the gross obligations by class of collateral pledged and the remaining contractual maturity of those transactions as of September 30, 2020:
Remaining Contractual Maturity of the Agreements | |
| | | Overnight and
Continuous
(000) | | <30 days
(000) | | Between
30 &
90 days
(000) | | >90 days
(000) | | Total
(000) | |
Securities Lending
Transactions | |
Common Stocks | | $ | 11,087 | | | $ | — | | | $ | — | | | $ | — | | | $ | 11,087 | | |
Preferred Stocks | | | 6 | | | | — | | | | — | | | | — | | | | 6 | | |
Total | | $ | 11,093 | | | $ | — | | | $ | — | | | $ | — | | | $ | 11,093 | | |
Total Borrowings | | $ | 11,093 | | | $ | — | | | $ | — | | | $ | — | | | $ | 11,093 | | |
Gross amount of
recognized liabilities
for securities lending
transactions | | | | | | | | | | $ | 11,093 | | |
7. Restricted Securities: The Fund invests in unregistered or otherwise restricted securities. The term "restricted securities" refers to securities that are unregistered or are held by control persons of the issuer and securities that are subject to contractual restrictions on their resale. As a result, restricted securities may be more difficult to value and the Fund may have difficulty disposing of such assets either in a timely manner or for a reasonable price. In order to dispose of an unregistered security, the Fund, where it has contractual rights to do so, may have to cause such security to be registered. A considerable period may elapse between the time the decision is made to sell the security and the time the security is registered so that the Fund can sell it. Contractual restrictions on the resale of securities vary in length and scope and are generally the result of a negotiation between the issuer and the acquirer of the securities. The Fund would, in either case, bear market risks during that period. Restricted securities are identified in the Portfolio of Investments.
8. Indemnifications: The Trust enters into contracts that contain a variety of indemnifications. The Trust's maximum exposure under these arrangements is unknown. However, the Trust has not had prior claims or losses pursuant to these contracts and expects the risk of loss to be remote.
24
Morgan Stanley Institutional Fund Trust
Annual Report — September 30, 2020
Notes to Financial Statements (cont'd)
9. Dividends and Distributions to Shareholders: Dividends and distributions to shareholders are recorded on the ex-dividend date. Dividends from net investment income, if any, are declared and paid annually. Net realized capital gains, if any, are distributed at least annually.
10. Security Transactions, Income and Expenses: Security transactions are accounted for on the trade date (date the order to buy or sell is executed). Realized gains and losses on the sale of investment securities are determined on the specific identified cost method. Dividend income and other distributions are recorded on the ex-dividend date (except for certain foreign dividends which may be recorded as soon as the Fund is informed of such dividends) net of applicable withholding taxes. Interest income is recognized on the accrual basis except where collection is in doubt. Discounts are accreted and premiums are amortized over the life of the respective securities. Most expenses of the Trust can be directly attributed to a particular Fund. Expenses which cannot be directly attributed are apportioned among the Funds based upon relative net assets or other appropriate methods. Income, expenses (other than class specific expenses — distribution and shareholder services, transfer agency and sub transfer agency fees) and realized and unrealized gains or losses are allocated to each class of shares based upon their relative net assets.
B. Advisory Fees: The Adviser, a wholly-owned subsidiary of Morgan Stanley, provides the Fund with advisory services under the terms of an Investment Advisory Agreement, paid quarterly, at an annual rate of 0.50% of the average daily net assets of the Fund.
The Adviser has agreed to reduce its advisory fee and/or reimburse the Fund so that total annual Fund operating expenses, excluding certain investment related expenses, taxes, interest and other extraordinary expenses (including litigation), will not exceed 0.80% for Class I shares, 1.15% for Class A shares, 1.65% for Class L shares, 1.90% for Class C shares and 0.73% for Class IS shares. The fee waivers and/or expense reimbursements will continue for at least one year from the date of the Fund's prospectus or until such time as the Trustees act to discontinue all or a portion of such waivers and/or reimbursements when they deem such action is appropriate.
C. Administration Fees: The Adviser also serves as Administrator to the Trust and provides administrative services pursuant to an Administration Agreement for an annual fee,
accrued daily and paid monthly, of 0.08% of the Fund's average daily net assets. Under a Sub-Administration Agreement between the Administrator and State Street, State Street provides certain administrative services to the Trust. For such services, the Administrator pays State Street a portion of the fee the Administrator receives from the Fund.
D. Distribution and Shareholder Services Fees: Morgan Stanley Distribution, Inc. ("MSDI" or the "Distributor"), a wholly-owned subsidiary of the Adviser, and an indirect subsidiary of Morgan Stanley, serves as the Trust's Distributor of Fund shares pursuant to a Distribution Agreement. The Trust has adopted a Shareholder Services Plan with respect to Class A shares pursuant to Rule 12b-1 under the Act. Under the Shareholder Services Plan, the Fund pays the Distributor a shareholder services fee, accrued daily and paid monthly, at an annual rate of 0.25% of the Fund's average daily net assets attributable to Class A shares.
The Trust has adopted a Distribution and Shareholder Services Plan with respect to Class L shares pursuant to Rule 12b-1 under the Act. Under the Distribution and Shareholder Services Plan, the Fund pays the Distributor a distribution fee, accrued daily and paid monthly, at an annual rate of 0.50% and a shareholder services fee, accrued daily and paid monthly, at an annual rate of 0.25% of the Fund's average daily net assets attributable to Class L shares.
The Trust has adopted a Distribution and Shareholder Services Plan with respect to Class C shares pursuant to Rule 12b-1 under the Act. Under the Distribution and Shareholder Services Plan, the Fund pays the Distributor a distribution fee, accrued daily and paid monthly, at an annual rate of 0.75% and a shareholder services fee, accrued daily and paid monthly, at an annual rate of 0.25% of the Fund's average daily net assets attributable to Class C shares.
The distribution and shareholder services fees are used to support the expenses associated with servicing and maintaining accounts. The Distributor may compensate other parties for providing shareholder support services to investors who purchase Class A, Class L and Class C shares.
E. Dividend Disbursing and Transfer Agent: The Trust's dividend disbursing and transfer agent is DST Asset Manager Solutions, Inc. ("DST"). Pursuant to a Transfer Agency Agreement, the Trust pays DST a fee based on the number of classes, accounts and transactions relating to the Funds of the Trust.
25
Morgan Stanley Institutional Fund Trust
Annual Report — September 30, 2020
Notes to Financial Statements (cont'd)
F. Custodian Fees: State Street (the "Custodian") also serves as Custodian for the Trust in accordance with a Custodian Agreement. The Custodian holds cash, securities and other assets of the Trust as required by the Act. Custody fees are payable monthly based on assets held in custody, investment purchases and sales activity and account maintenance fees, plus reimbursement for certain out-of-pocket expenses.
G. Security Transactions and Transactions with Affiliates: For the year ended September 30, 2020, purchases and sales of investment securities for the Fund, other than long-term U.S. Government securities and short-term investments were approximately $1,768,319,000 and $900,098,000, respectively. There were no purchases and sales of long-term U.S. Government securities for the year ended September 30, 2020.
The Fund invests in the Institutional Class of the Morgan Stanley Institutional Liquidity Funds — Treasury Securities Portfolio (the "Liquidity Funds"), an open-end management investment company managed by the Adviser, both directly and as a portion of the securities held as collateral on loaned securities. Advisory fees paid by the Fund are reduced by an amount equal to its pro-rata share of the advisory and administration fees paid by the Fund due to its investment in the Liquidity Funds. For the year ended September 30, 2020, advisory fees paid were reduced by approximately $147,000 relating to the Fund's investment in the Liquidity Funds.
A summary of the Fund's transactions in shares of affiliated investments during the year ended September 30, 2020 is as follows:
Affiliated
Investment
Company | | Value
September 30,
2019
(000) | | Purchases
at Cost
(000) | | Proceeds
from
Sales
(000) | | Dividend
Income
(000) | |
Liquidity Funds | | $ | 66,220 | | | $ | 1,261,759 | | | $ | 1,238,258 | | | $ | 192 | | |
Affiliated
Investment
Company (cont'd) | | Realized
Gain (Loss)
(000) | | Change in
Unrealized
Appreciation
(Depreciation)
(000) | | Value
September 30,
2020
(000) | |
Liquidity Funds | | $ | — | | | $ | — | | | $ | 89,721 | | |
The Fund is permitted to purchase and sell securities ("cross-trade") from and to other Morgan Stanley funds as well as other funds and client accounts for which the Adviser or an affiliate of the Adviser serves as investment adviser, pursuant to procedures approved by the Trustees in compliance with
Rule 17a-7 under the Act (the "Rule"). Each cross-trade is executed at the current market price in compliance with provisions of the Rule. For the year ended September 30, 2020, the Fund engaged in cross-trade purchases of approximately $1,439,000.
The Fund has an unfunded Deferred Compensation Plan (the "Compensation Plan"), which allows each independent Trustee to defer payment of all, or a portion, of the fees he or she receives for serving on the Board of Trustees. Each eligible Trustee generally may elect to have the deferred amounts credited with a return equal to the total return on one or more of the Morgan Stanley funds that are offered as investment options under the Compensation Plan. Appreciation/depreciation and distributions received from these investments are recorded with an offsetting increase/decrease in the deferred compensation obligation and do not affect the NAV of the Fund.
H. Federal Income Taxes: It is the Fund's intention to continue to qualify as a regulated investment company and distribute all of its taxable and tax-exempt income. Accordingly, no provision for federal income taxes is required in the financial statements.
The Fund may be subject to taxes imposed by countries in which it invests. Such taxes are generally based on income and/or capital gains earned or repatriated. Taxes are accrued based on net investment income, net realized gains and net unrealized appreciation as such income and/or gains are earned. Taxes may also be based on transactions in foreign currency and are accrued based on the value of investments denominated in such currency.
FASB ASC 740-10, "Income Taxes — Overall", sets forth a minimum threshold for financial statement recognition of the benefit of a tax position taken or expected to be taken in a tax return. Management has concluded there are no significant uncertain tax positions that would require recognition in the financial statements. If applicable, the Fund recognizes interest accrued related to unrecognized tax benefits in "Interest Expense" and penalties in "Other Expenses" in the Statement of Operations. The Fund files tax returns with the U.S. Internal Revenue Service, New York and various states. Generally, each of the tax years in the four-year period ended September 30, 2020 remains subject to examination by taxing authorities.
The tax character of distributions paid may differ from the character of distributions shown for GAAP purposes due to
26
Morgan Stanley Institutional Fund Trust
Annual Report — September 30, 2020
Notes to Financial Statements (cont'd)
short-term capital gains being treated as ordinary income for tax purposes. The tax character of distributions paid during fiscal years 2020 and 2019 was as follows:
2020
Distributions
Paid From: | | 2019
Distributions
Paid From: | |
Ordinary
Income
(000) | | Long-Term
Capital Gain
(000) | | Ordinary
Income
(000) | | Long-Term
Capital Gain
(000) | |
| $ | 21,323 | | | $ | 80,708 | | | $ | 10,731 | | | $ | 110,644 | | |
The amount and character of income and gains to be distributed are determined in accordance with income tax regulations which may differ from GAAP. These book/tax differences are either considered temporary or permanent in nature.
Temporary differences are attributable to differing book and tax treatments for the timing of the recognition of gains (losses) on certain investment transactions and the timing of the deductibility of certain expenses.
Permanent differences, due to tax adjustments related to real estate investment trusts sold by the Fund, resulted in the following reclassifications among the components of net assets at September 30, 2020:
Total
Distributable
Earnings
(000) | | Paid-in-
Capital
(000) | |
| $ | 150 | | | $ | (150 | ) | |
At September 30, 2020, the components of distributable earnings for the Fund on a tax basis were as follows:
Undistributed
Ordinary
Income
(000) | | Undistributed
Long-Term
Capital Gain
(000) | |
| $ | 56,162 | | | $ | 192,756 | | |
I. Credit Facility: The Trust and other Morgan Stanley funds participated in a $300,000,000 committed, unsecured revolving line of credit facility (the "Facility") with State Street. This Facility is to be used for temporary emergency purposes or funding of shareholder redemption requests. The interest rate on borrowings is based on the federal funds rate or 1 month LIBOR rate plus a spread. The Facility also has a commitment fee of 0.25% per annum based on the unused portion of the Facility. During the year ended September 30, 2020, the Fund did not have any borrowings under the Facility.
J. Other: At September 30, 2020, the Fund had record owners of 10% or greater. Investment activities of these sharehold-
ers could have a material impact on the Fund. The aggregate percentage of such owners was 40.1%.
K. Market Risk: Certain impacts to public health conditions particular to the coronavirus (COVID-19) outbreak could impact the operations and financial performance of certain of the Fund's investments. The extent of the impact to the financial performance of the Fund's investments will depend on future developments, including (i) the duration and spread of the outbreak, (ii) the restrictions and advisories, (iii) the effects on the financial markets, and (iv) the effects on the economy overall, all of which are highly uncertain and cannot be predicted. If the financial performance of the Fund's investments is impacted because of these factors for an extended period, the Fund's investment results may be adversely affected.
27
Morgan Stanley Institutional Fund Trust
Annual Report — September 30, 2020
Report of Independent Registered Public Accounting Firm
To the Shareholders and Board of Trustees of
Morgan Stanley Institutional Fund Trust —
Discovery Portfolio
Opinion on the Financial Statements
We have audited the accompanying statement of assets and liabilities of Discovery Portfolio (the "Fund") (one of the funds constituting Morgan Stanley Institutional Fund Trust (the "Trust")), including the portfolio of investments, as of September 30, 2020, and the related statement of operations for the year then ended, the statements of changes in net assets for each of the two years in the period then ended, the financial highlights for each of the five years in the period then ended and the related notes (collectively referred to as the "financial statements"). In our opinion, the financial statements present fairly, in all material respects, the financial position of the Fund (one of the funds constituting Morgan Stanley Institutional Fund Trust) at September 30, 2020, the results of its operations for the year then ended, the changes in its net assets for each of the two years in the period then ended and its financial highlights for each of the five years in the period then ended, in conformity with U.S. generally accepted accounting principles.
Basis for Opinion
These financial statements are the responsibility of the Trust's management. Our responsibility is to express an opinion on the Fund's financial statements based on our audits. We are a public accounting firm registered with the Public Company Accounting Oversight Board (United States) ("PCAOB") and are required to be independent with respect to the Trust in accordance with the U.S. federal securities law and the applicable rules and regulations of the Securities and Exchange Commission and the PCAOB.
We conducted our audits in accordance with the standards of the PCAOB. Those standards require that we plan and perform the audit to obtain reasonable assurance about whether the financial statements are free of material misstatement, whether due to error or fraud. The Trust is not required to have, nor were we engaged to perform, an audit of the Trust's internal control over financial reporting. As part of our audits we are required to obtain an understanding of internal control over financial reporting but not for the purpose of expressing an opinion on the effectiveness of the Trust's internal control over financial reporting. Accordingly, we express no such opinion.
Our audits included performing procedures to assess the risks of material misstatement of the financial statements, whether due to error or fraud, and performing procedures that respond to those risks. Such procedures included examining, on a test basis, evidence regarding the amounts and disclosures in the financial statements. Our procedures included confirmation of securities owned as of September 30, 2020 by correspondence with the custodian and brokers or by other appropriate auditing procedures where replies from brokers were not received. Our audits also included evaluating the accounting principles used and significant estimates made by management, as well as evaluating the overall presentation of the financial statements. We believe that our audits provide a reasonable basis for our opinion.

We have served as the auditor of one or more Morgan Stanley investment companies since 2000.
Boston, Massachusetts
November 24, 2020
28
Morgan Stanley Institutional Fund Trust
Annual Report — September 30, 2020
Investment Advisory Agreement Approval (unaudited)
Nature, Extent and Quality of Services
The Board reviewed and considered the nature and extent of the investment advisory services provided by the Adviser under the advisory agreement, including portfolio management, investment research and equity and fixed income securities trading. The Board also reviewed and considered the nature and extent of the non-advisory, administrative services provided by the Administrator under the administration agreement, including accounting, operations, clerical, bookkeeping, compliance, business management and planning, legal services and the provision of supplies, office space and utilities at the Adviser's expense. The Board also considered the Adviser's investment in personnel and infrastructure that benefits the Fund. (The Adviser and Administrator together are referred to as the "Adviser" and the advisory and administration agreements together are referred to as the "Management Agreement.") The Board also considered that the Adviser serves a variety of other investment advisory clients and has experience overseeing service providers. The Board also compared the nature of the services provided by the Adviser with similar services provided by non-affiliated advisers as prepared by Broadridge Financial Solutions, Inc. ("Broadridge").
The Board reviewed and considered the qualifications of the portfolio managers, the senior administrative managers and other key personnel of the Adviser who provide the advisory and administrative services to the Fund. The Board determined that the Adviser's portfolio managers and key personnel are well qualified by education and/or training and experience to perform the services in an efficient and professional manner. The Board concluded that the nature and extent of the advisory and administrative services provided were necessary and appropriate for the conduct of the business and investment activities of the Fund and supported its decision to approve the Management Agreement.
Performance, Fees and Expenses of the Fund
The Board reviewed the performance, fees and expenses of the Fund compared to its peers, as prepared by Broadridge, and to appropriate benchmarks where applicable. The Board discussed with the Adviser the performance goals and the actual results achieved in managing the Fund. When considering a fund's performance, the Board and the Adviser place emphasis on trends and longer-term returns (focusing on one-year, three-year and five-year performance, as of December 31, 2019, or since inception, as applicable). When a fund underperforms its benchmark and/or its peer group average, the Board and the Adviser discuss the causes of such underperformance and, where necessary, they discuss specific changes to investment strategy or investment personnel. The Board noted that the Fund's performance was better than its peer group average for the one-, three-, and five-year periods. The Board discussed with the Adviser the level of the advisory and administration fees (together, the "management fee") for this Fund relative to comparable funds and/or other accounts advised by the Adviser and/or compared to its peers as prepared by Broadridge. In addition to the management fee, the Board also reviewed the Fund's total expense ratio. The Board noted that the Fund's management fee and total expense ratio were lower than its peer group averages. After discussion, the Board concluded that the Fund's performance, management fee and total expense ratio were competitive with its peer group averages.
Economies of Scale
The Board considered the size and growth prospects of the Fund and how that relates to the Fund's total expense ratio and particularly the Fund's management fee rate, which does not include breakpoints. In conjunction with its review of the Adviser's profitability, the Board discussed with the Adviser how a change in assets can affect the efficiency or effectiveness of managing the Fund and whether the management fee level is appropriate relative to current and projected asset levels and/or whether the management fee structure reflects economies of scale as asset levels change. The Board has determined that its review of the actual and/or potential economies of scale of the Fund supports its decision to approve the Management Agreement.
Profitability of the Adviser and Affiliates
The Board considered information concerning the costs incurred and profits realized by the Adviser and its affiliates during the last year from their relationship with the Fund and during the last two years from their relationship with the Morgan Stanley Fund Complex and reviewed with the Adviser the cost allocation methodology used to determine the profitability of the Adviser and affiliates. The Board has determined that its review of the analysis of the Adviser's expenses and profitability supports its decision to approve the Management Agreement.
29
Morgan Stanley Institutional Fund Trust
Annual Report — September 30, 2020
Investment Advisory Agreement Approval (unaudited) (cont'd)
Other Benefits of the Relationship
The Board considered other direct and indirect benefits to the Adviser and/or its affiliates derived from their relationship with the Fund and other funds advised by the Adviser. These benefits may include, among other things, fees for trading, distribution and/or shareholder servicing and for transaction processing and reporting platforms used by securities lending agents, and research received by the Adviser generated from commission dollars spent on funds' portfolio trading. The Board reviewed with the Adviser these arrangements and the reasonableness of the Adviser's costs relative to the services performed. The Board has determined that its review of the other benefits received by the Adviser or its affiliates supports its decision to approve the Management Agreement.
Resources of the Adviser and Historical Relationship Between the Fund and the Adviser
The Board considered whether the Adviser is financially sound and has the resources necessary to perform its obligations under the Management Agreement. The Board also reviewed and considered the historical relationship between the Fund and the Adviser, including the organizational structure of the Adviser, the policies and procedures formulated and adopted by the Adviser for managing the Fund's operations and the Board's confidence in the competence and integrity of the senior managers and key personnel of the Adviser. The Board concluded that the Adviser has the financial resources necessary to fulfill its obligations under the Management Agreement and that it is beneficial for the Fund to continue its relationship with the Adviser.
Other Factors and Current Trends
The Board considered the controls and procedures adopted and implemented by the Adviser and monitored by the Fund's Chief Compliance Officer and concluded that the conduct of business by the Adviser indicates a good faith effort on its part to adhere to high ethical standards in the conduct of the Fund's business.
As part of the Board's review, the Board received information from management on the impact of COVID-19 on the firm generally and the Adviser and the Fund in particular including, among other information, the pandemic's current and expected impact on the Fund's performance and operations.
General Conclusion
After considering and weighing all of the above factors, with various written materials and verbal information presented by the Adviser, the Board concluded that it would be in the best interest of the Fund and its shareholders to approve renewal of the Management Agreement for another year. In reaching this conclusion the Board did not give particular weight to any single piece of information or factor referenced above. The Board considered these factors and information over the course of the year and in numerous meetings, some of which were in executive session with only the independent Board members and their counsel present. It is possible that individual Board members may have weighed these factors, and the information presented, differently in reaching their individual decisions to approve the Management Agreement.
30
Morgan Stanley Institutional Fund Trust
Annual Report — September 30, 2020
Liquidity Risk Management Program (unaudited)
In compliance with Rule 22e-4 under the Investment Company Act of 1940, as amended (the "Liquidity Rule"), the Fund has adopted and implemented a liquidity risk management program (the "Program"), which is reasonably designed to assess and manage the risk that the Fund could not meet requests to redeem shares issued by the Fund without significant dilution of remaining investors' interests in the Fund (i.e., liquidity risk). The Fund's Board of Trustees (the "Board") previously approved the designation of the Liquidity Risk Subcommittee (the "LRS") as Program administrator. The LRS is comprised of representatives from various divisions within Morgan Stanley Investment Management.
At a meeting held on April 22-23, 2020, the Board reviewed a written report prepared by the LRS that addressed the Program's operation and assessed its adequacy, and effectiveness of implementation for the period from December 1, 2018, through December 31, 2019, as required under the Liquidity Rule. The report concluded that the Program operated effectively and was adequately and effectively implemented in all material aspects, and that the relevant controls and safeguards were appropriately designed to enable the LRS to administer the Program in compliance with the Liquidity Rule.
In accordance with the Program, the LRS assessed each Fund's liquidity risk no less frequently than annually taking into consideration certain factors, as applicable, such as (i) investment strategy and liquidity of portfolio investments, (ii) short-term and long-term cash flow projections and (iii) holdings of cash and cash equivalents and borrowing arrangements and other funding sources. Certain factors are considered under both normal and reasonably foreseeable stressed conditions.
Each Fund portfolio investment is classified into one of four liquidity categories, which classification is assessed at least monthly by the LRS. The classification is based on a determination of the number of days it is reasonably expected to take to convert the investment into cash, or sell or dispose of the investment, in current market conditions without significantly changing the market value of the investment. Liquidity classification determinations take into account various market, trading and investment-specific considerations, as well as market depth, and in some cases utilize third-party vendor data.
The Liquidity Rule limits a fund's investments in illiquid investments to 15% of its net assets and requires funds that do not primarily hold assets that are highly liquid investments to determine and maintain a minimum percentage of the fund's net assets to be invested in highly liquid investments (highly liquid investment minimum or "HLIM"). The LRS believes that the Program includes provisions reasonably designed to review, monitor and comply with the 15% limit on illiquid investments and for determining, periodically reviewing and complying with the HLIM requirement, as applicable.
There can be no assurance that the Program will achieve its objectives under all circumstances in the future. Please refer to the Fund's prospectus for more information regarding the Fund's exposure to liquidity risk and other risks to which it may be subject.
31
Morgan Stanley Institutional Fund Trust
Annual Report — September 30, 2020
Federal Tax Notice (unaudited)
For federal income tax purposes, the following information is furnished with respect to the distributions paid by the Fund during its taxable year ended September 30, 2020. For corporate shareholders, 4.49% of the dividends qualified for the dividends received deduction.
The Fund designated and paid approximately $80,708,000 as a long-term capital gain distribution.
For federal income tax purposes, the following information is furnished with respect to the Fund's earnings for its taxable year ended September 30, 2020. When distributed, certain earnings may be subject to a maximum tax rate of 15% as provided for by the Jobs and Growth Tax Relief Reconciliation Act of 2003. The Fund designated up to a maximum of approximately $1,217,000 as taxable at this lower rate.
In January, the Fund provides tax information to shareholders for the preceding calendar year.
32
Morgan Stanley Institutional Fund Trust
Annual Report — September 30, 2020
Privacy Notice (unaudited) April 2019
FACTS | | WHAT DOES MSIM DO WITH YOUR PERSONAL INFORMATION? | |
Why? | | Financial companies choose how they share your personal information. Federal law gives consumers the right to limit some but not all sharing. Federal law also requires us to tell you how we collect, share, and protect your personal information. Please read this notice carefully to understand what we do. | |
What? | | The types of personal information we collect and share depend on the product or service you have with us. This information can include:
n Social Security number and income
n investment experience and risk tolerance
n checking account number and wire transfer instructions | |
How? | | All financial companies need to share customers' personal information to run their everyday business. In the section below, we list the reasons financial companies can share their customers' personal information; the reasons MSIM chooses to share; and whether you can limit this sharing. | |
Reasons we can share your personal information | | Does MSIM share? | | Can you limit this sharing? | |
For our everyday business purposes —
such as to process your transactions, maintain your account(s), respond to court orders and legal investigations, or report to credit bureaus | | Yes | | No | |
For our marketing purposes —
to offer our products and services to you | | Yes | | No | |
For joint marketing with other financial companies | | No | | We don't share | |
For our affiliates' everyday business purposes —
information about your transactions and experiences | | Yes | | No | |
For our affiliates' everyday business purposes —
information about your creditworthiness | | No | | We don't share | |
For our affiliates to market to you | | No | | We don't share | |
For non-affiliates to market to you | | No | | We don't share | |
Questions? Call toll-free (844) 312-6327 or email: imprivacyinquiries@morganstanley.com
33
Morgan Stanley Institutional Fund Trust
Annual Report — September 30, 2020
Privacy Notice (unaudited) (cont'd) April 2019
Who we are
Who is providing this notice? | | Morgan Stanley Investment Management, Inc. and its affiliated registered investment advisers, registered broker-dealers, and registered and unregistered funds ("MSIM") | |
What we do
How does MSIM protect my personal information? | | To protect your personal information from unauthorized access and use, we use security measures that comply with federal law. These measures include computer safeguards and secured files and buildings. We have policies governing the proper handling of customer information by personnel and requiring third parties that provide support to adhere to appropriate security standards with respect to such information. | |
How does MSIM collect my personal information? | | We collect your personal information, for example, when you
n open an account or make deposits or withdrawals from your account
n buy securities from us or make a wire transfer
n give us your contact information
We also collect your personal information from others, such as credit bureaus, affiliates, or other companies. | |
Why can't I limit all sharing? | | Federal law gives you the right to limit only
n sharing for affiliates' everyday business purposes — information about your creditworthiness
n affiliates from using your information to market to you
n sharing for non-affiliates to market to you
State laws and individual companies may give you additional rights to limit sharing. See below for more on your rights under state law. | |
Definitions
Affiliates | | Companies related by common ownership or control. They can be financial and non-financial companies.
n Our affiliates include companies with a Morgan Stanley name and financial companies such as Morgan Stanley Smith Barney LLC and Morgan Stanley & Co. | |
Non-affiliates | | Companies not related by common ownership or control. They can be financial and non-financial companies.
n MSIM does not share with non-affiliates so they can market to you. | |
Joint marketing | | A formal agreement between non-affiliated financial companies that together market financial products or services to you.
n MSIM doesn't jointly market | |
Other Important Information
Vermont: Except as permitted by law, we will not share personal information we collect about Vermont residents with Non-affiliates unless you provide us with your written consent to share such information.
California: Except as permitted by law, we will not share personal information we collect about California residents with Non-affiliates and we will limit sharing such personal information with our Affiliates to comply with California privacy laws that apply to us.
34
Morgan Stanley Institutional Fund Trust
Annual Report — September 30, 2020
Trustee and Officer Information (unaudited)
Independent Trustees:
Name, Address and Birth Year
of Independent Trustee | | Position(s)
Held with
Registrant | | Length of Time
Served* | | Principal Occupation(s) During Past 5 Years
and Other Relevant Professional Experience | | Number of
Funds in
Fund Complex
Overseen by
Independent
Trustee** | | Other Directorships
Held by Independent
Trustee*** | |
Frank L. Bowman
c/o Perkins Coie LLP
Counsel to the Independent Trustees
1155 Avenue of the Americas, 22nd Floor
New York, NY 10036
Birth Year 1944 | | Trustee | | Since
August
2006 | | President, Strategic Decisions, LLC (consulting) (since February 2009); Director or Trustee of various Morgan Stanley Funds (since August 2006); Chairperson of the Compliance and Insurance Committee (since October 2015); formerly, Chairperson of the Insurance Sub-Committee of the Compliance and Insurance Committee (2007-2015); served as President and Chief Executive Officer of the Nuclear Energy Institute (policy organization) (February 2005-November 2008); retired as Admiral, U.S. Navy after serving over 38 years on active duty including 8 years as Director of the Naval Nuclear Propulsion Program in the Department of the Navy and the U.S. Department of Energy (1996-2004); served as Chief of Naval Personnel (July 1994-September 1996) and on the Joint Staff as Director of Political Military Affairs (June 1992-July 1994); knighted as Honorary Knight Commander of the Most Excellent Order of the British Empire; awarded the Officier de l'Orde National du Mérite by the French Government; elected to the National Academy of Engineering (2009). | | | 86 | | | Director of Naval and Nuclear Technologies LLP; Director Emeritus of the Armed Services YMCA; Member of the National Security Advisory Council of the Center for U.S. Global Engagement and a member of the CNA Military Advisory Board; Trustee of Fairhaven United Methodist Church; Member of the Board of Advisors of the Dolphin Scholarship Foundation; Director of other various non-profit organizations; Formerly, Director of BP p.l.c. (November 2010-May 2019). | |
Kathleen A. Dennis
c/o Perkins Coie LLP
Counsel to the Independent Trustees
1155 Avenue of the Americas, 22nd Floor
New York, NY 10036
Birth Year 1953 | | Trustee | | Since
August
2006 | | President, Cedarwood Associates (mutual fund and investment management consulting) (since July 2006); Chairperson of the Liquidity and Alternatives Sub-Committee of the Investment Committee (since October 2006) and Director or Trustee of various Morgan Stanley Funds (since August 2006); formerly, Senior Managing Director of Victory Capital Management (1993-2006). | | | 86 | | | Director of various
non-profit organizations. | |
Nancy C. Everett
c/o Perkins Coie LLP
Counsel to the Independent Trustees
1155 Avenue of the Americas, 22nd Floor
New York, NY 10036
Birth Year 1955 | | Trustee | | Since
January
2015 | | Chief Executive Officer, Virginia Commonwealth University Investment Company (since November 2015); Owner, OBIR, LLC (institutional investment management consulting) (since June 2014); formerly, Managing Director, BlackRock, Inc. (February 2011-December 2013); and Chief Executive Officer, General Motors Asset Management (a/k/a Promark Global Advisors, Inc.) (June 2005-May 2010). | | | 87 | | | Formerly, Member of Virginia Commonwealth University School of Business Foundation (2005-2016); Member of Virginia Commonwealth University Board of Visitors (2013-2015); Member of Committee on Directors for Emerging Markets Growth Fund, Inc. (2007-2010); Chairperson of Performance Equity Management, LLC (2006-2010); and Chairperson, GMAM Absolute Return Strategies Fund, LLC (2006-2010). | |
35
Morgan Stanley Institutional Fund Trust
Annual Report — September 30, 2020
Trustee and Officer Information (unaudited) (cont'd)
Independent Trustees: (cont'd)
Name, Address and Birth Year
of Independent Trustee | | Position(s)
Held with
Registrant | | Length of Time
Served* | | Principal Occupation(s) During Past 5 Years
and Other Relevant Professional Experience | | Number of
Funds in
Fund Complex
Overseen by
Independent
Trustee** | | Other Directorships
Held by Independent
Trustee*** | |
Jakki L. Haussler
c/o Perkins Coie LLP
Counsel to the Independent Trustees
1155 Avenue of the Americas, 22nd Floor
New York, NY 10036
Birth Year 1957 | | Trustee | | Since
January
2015 | | Chairman, Opus Capital Group (since January 1996); formerly, Chief Executive Officer, Opus Capital Group (1996-2019); Director, Capvest Venture Fund, LP (May 2000-December 2011); Partner, Adena Ventures, LP (July 1999-December 2010); Director, The Victory Funds (February 2005-July 2008). | | | 87 | | | Director of Service Corporation International and Member, Audit Committee and Investment Committee; Director of Cincinnati Bell Inc. and Member, Audit Committee and Governance and Nominating Committee; Director of Northern Kentucky University Foundation and Member, Investment Committee; Member of Chase College of Law Transactional Law Practice Center Board of Advisors; Director of Chase College of Law Board of Visitors; formerly, Member, University of Cincinnati Foundation Investment Committee; Member, Miami University Board of Visitors (2008-2011); Trustee of Victory Funds (2005-2008) and Chairman, Investment Committee (2007-2008); Member, Service Provider Committee (2005-2008) and Director of Best Transport (2006-2019). | |
Dr. Manuel H. Johnson
c/o Johnson Smick
International, Inc.
220 I Street, NE — Suite 200 Washington, D.C. 20002
Birth Year 1949 | | Trustee | | Since
July
1991 | | Senior Partner, Johnson Smick International, Inc. (consulting firm); Chairperson of the Investment Committee (since October 2006) and Director or Trustee of various Morgan Stanley Funds (since July 1991); Co-Chairman and a founder of the Group of Seven Council (G7C) (international economic commission); formerly, Chairperson of the Audit Committee (July 1991-September 2006), Vice Chairman of the Board of Governors of the Federal Reserve System and Assistant Secretary of the U.S. Treasury. | | | 86 | | | Director of NVR, Inc. (home construction). | |
Joseph J. Kearns
c/o Perkins Coie LLP
Counsel to the Independent Trustees
1155 Avenue of the Americas, 22nd Floor
New York, NY 10036
Birth Year 1942 | | Trustee | | Since
August
1994 | | Senior Adviser, Kearns & Associates LLC (investment consulting); Chairperson of the Audit Committee (since October 2006) and Director or Trustee of various Morgan Stanley Funds (since August 1994); Director, Rubicorn Investments (since February 2019); formerly, Deputy Chairperson of the Audit Committee (July 2003-September 2006) and Chairperson of the Audit Committee of various Morgan Stanley Funds (since August 1994); CFO of the J. Paul Getty Trust (1982-1999). | | | 87 | | | Prior to August 10, 2016, Director of Electro Rent Corporation (equipment leasing); Prior to December 31, 2013, Director of The Ford Family Foundation. | |
36
Morgan Stanley Institutional Fund Trust
Annual Report — September 30, 2020
Trustee and Officer Information (unaudited) (cont'd)
Independent Trustees: (cont'd)
Name, Address and Birth Year
of Independent Trustee | | Position(s)
Held with
Registrant | | Length of Time
Served* | | Principal Occupation(s) During Past 5 Years
and Other Relevant Professional Experience | | Number of
Funds in
Fund Complex
Overseen by
Independent
Trustee** | | Other Directorships
Held by Independent
Trustee*** | |
Michael F. Klein
c/o Perkins Coie LLP
Counsel to the Independent Trustees
1155 Avenue of the Americas, 22nd Floor
New York, NY 10036
Birth Year 1958 | | Trustee | | Since
August
2006 | | Managing Director, Aetos Alternatives Management, LP (since March 2000); Co-President, Aetos Alternatives Management, LP (since January 2004) and Co-Chief Executive Officer of Aetos Alternatives Management, LP (since August 2013); Chairperson of the Fixed Income Sub-Committee of the Investment Committee (since October 2006) and Director or Trustee of various Morgan Stanley Funds (since August 2006); formerly, Managing Director, Morgan Stanley & Co. Inc. and Morgan Stanley Dean Witter Investment Management and President, various Morgan Stanley Funds (June 1998-March 2000); Principal, Morgan Stanley & Co. Inc. and Morgan Stanley Dean Witter Investment Management (August 1997-December 1999). | | | 86 | | | Director of certain investment funds managed or sponsored by Aetos Alternatives Management, LP; Director of Sanitized AG and Sanitized Marketing AG (specialty chemicals). | |
Patricia Maleski
c/o Perkins Coie LLP
Counsel to the Independent Trustees
1155 Avenue of the Americas, 22nd Floor
New York, NY 10036
Birth Year 1960 | | Trustee | | Since
January
2017 | | Managing Director, JPMorgan Asset Management (2004-2016); Oversight and Control Head of Fiduciary and Conflicts of Interest Program (2015-2016); Chief Control Officer-Global Asset Management (2013-2015); President, JPMorgan Funds (2010-2013); Chief Administrative Officer (2004-2013); various other positions including Treasurer and Board Liaison (since 2001). | | | 87 | | | None. | |
W. Allen Reed
c/o Perkins Coie LLP
Counsel to the Independent Trustees
1155 Avenue of the Americas, 22nd Floor
New York, NY 10036
Birth Year 1947 | | Chair of the Board and Trustee | | Chair of the Boards since August 2020 and Trustee since August 2006 | | Chair of the Boards of various Morgan Stanley Funds (since August 2020); Chairperson of the Governance Committee; Chairperson of the Equity Sub-Committee of the Investment Committee (since October 2006) and Director or Trustee of various Morgan Stanley Funds (since August 2006); formerly, Vice Chair of the Boards of various Morgan Stanley Funds (January 2020-August 2020); President and Chief Executive Officer of General Motors Asset Management; Chairman and Chief Executive Officer of the GM Trust Bank and Corporate Vice President of General Motors Corporation (August 1994-December 2005). | | | 86 | | | Formerly, Director of Legg Mason, Inc. (2006-2019); and Director of the Auburn University Foundation (2010-2015). | |
* This is the earliest date the Trustee began serving the Morgan Stanley Funds. Each Trustee serves an indefinite term, until his or her successor is elected.
** The Fund Complex includes (as of December 31, 2019) all open-end and closed-end funds (including all of their portfolios) advised by Morgan Stanley Investment Management Inc. (the "Adviser") and any funds that have an adviser that is an affiliated person of the Adviser (including, but not limited to, Morgan Stanley AIP GP LP).
*** This includes any directorships at public companies and registered investment companies held by the Trustee at any time during the past five years.
37
Morgan Stanley Institutional Fund Trust
Annual Report — September 30, 2020
Trustee and Officer Information (unaudited) (cont'd)
Executive Officers:
Name, Address and
Birth Year of Executive Officer | | Position(s) Held
with
Registrant | | Length of
Time Served* | | Principal Occupation(s) During Past 5 Years | |
John H. Gernon
522 Fifth Avenue
New York, NY 10036
Birth Year 1963 | | President and Principal Executive Officer | | Since September 2013 | | President and Principal Executive Officer of the Equity and Fixed Income Funds and the Morgan Stanley AIP Funds (since September 2013) and the Liquidity Funds and various money market funds (since May 2014) in the Fund Complex; Managing Director of the Adviser; Head of Public Markets Product Development (since 2006). | |
Timothy J. Knierim
522 Fifth Avenue
New York, NY 10036
Birth Year 1959 | | Chief Compliance Officer | | Since December 2016 | | Managing Director of the Adviser and various entities affiliated with the Adviser; Chief Compliance Officer of various Morgan Stanley Funds and the Adviser (since December 2016) and Chief Compliance Officer of Morgan Stanley AIP GP LP (since 2014). Formerly, Managing Director and Deputy Chief Compliance Officer of the Adviser (2014-2016); and formerly, Chief Compliance Officer of Prudential Investment Management, Inc. (2007-2014). | |
Francis J. Smith
522 Fifth Avenue
New York, NY 10036
Birth Year 1965 | | Treasurer and Principal Financial Officer | | Treasurer since July 2003 and Principal Financial Officer since September 2002 | | Managing Director of the Adviser and various entities affiliated with the Adviser; Treasurer (since July 2003) and Principal Financial Officer of various Morgan Stanley Funds (since September 2002). | |
Mary E. Mullin
522 Fifth Avenue
New York, NY 10036
Birth Year 1967 | | Secretary | | Since
June
1999 | | Managing Director of the Adviser; Secretary of various Morgan Stanley Funds (since June 1999). | |
Michael J. Key
522 Fifth Avenue
New York, NY 10036
Birth Year 1979 | | Vice President | | Since
June
2017 | | Vice President of the Equity and Fixed Income Funds, Liquidity Funds, various money market funds and the Morgan Stanley AIP Funds in the Fund Complex (since June 2017); Executive Director of the Adviser; Head of Product Development for Equity and Fixed Income Funds (since August 2013). | |
* This is the earliest date the officer began serving the Morgan Stanley Funds. Each officer serves a one-year term, until his or her successor is elected and qualifies.
38
Morgan Stanley Institutional Fund Trust
Annual Report — September 30, 2020
Adviser and Administrator
Morgan Stanley Investment Management Inc.
522 Fifth Avenue
New York, New York 10036
Distributor
Morgan Stanley Distribution, Inc.
522 Fifth Avenue
New York, New York 10036
Dividend Disbursing and Transfer Agent
DST Asset Manager Solutions, Inc.
2000 Crown Colony Drive
Quincy, Massachusetts 02169
Custodian
State Street Bank and Trust Company
One Lincoln Street
Boston, Massachusetts 02111
Legal Counsel
Dechert LLP
1095 Avenue of the Americas
New York, New York 10036
Counsel to the Independent Trustees
Perkins Coie LLP
1155 Avenue of the Americas,
22nd Floor
New York, New York 10036
Independent Registered Public Accounting Firm
Ernst & Young LLP
200 Clarendon Street
Boston, Massachusetts 02116
Reporting to Shareholders
Each Morgan Stanley fund provides a complete schedule of portfolio holdings in its Semi-Annual and the Annual Reports within 60 days of the end of the fund's second and fourth fiscal quarters. The Semi-Annual and Annual Reports are filed electronically with the Securities and Exchange Commission ("SEC") on Form N-CSRS and Form N-CSR, respectively. Morgan Stanley also delivers the Semi-Annual and Annual Reports to fund shareholders and makes these reports available on its public website, www.morganstanley.com/im/shareholderreports. Each Morgan Stanley non-money market fund also files a complete schedule of portfolio holdings with the SEC for the fund's first and third fiscal quarters as an attachment to Form N-PORT. Morgan Stanley does not deliver the reports for the first and third fiscal quarters to shareholders, nor are the reports posted to the Morgan Stanley public website. However, the holdings for each money market fund are posted to the Morgan Stanley public website. You may obtain the Form N-PORT filings (as well as the Form N-CSR and N-CSRS filings) by accessing the SEC's website, www.sec.gov. You can also request copies of these materials, upon payment of a duplicating fee, by electronic request at the SEC's email address (publicinfo@sec.gov).
Proxy Voting Policies and Procedures and Proxy Voting Record
You may obtain a copy of the Trust's Proxy Voting Policy and Procedures and information regarding how the Trust voted proxies relating to portfolio securities during the most recent twelve-month period ended June 30, without charge, upon request, by calling toll free 1 (800) 548-7786 or by visiting our website at www.morganstanley.com/im/shareholderreports. This information is also available on the SEC's website at www.sec.gov.
This report is authorized for distribution only when preceded or accompanied by a prospectus or summary prospectus of the applicable fund of Morgan Stanley Institutional Fund Trust, which describes in detail the fund's investment policies, risks, fees and expenses. Please read the prospectus carefully before you invest or send money. For additional information, including information regarding the investments comprising the Fund, please visit our website at www.morganstanley.com/im/shareholderreports or call toll free 1 (800) 548-7786.
39
Printed in U.S.A.
This Report has been prepared for shareholders and may be distributed to others only if preceded or accompanied by a current prospectus.
Morgan Stanley Investment Management Inc.
522 Fifth Avenue
New York, New York 10036
© 2020 Morgan Stanley. Morgan Stanley Distribution, Inc.

IFTMCGANN
3298674 EXP 11.30.21

Morgan Stanley Institutional Fund Trust
Global Strategist Portfolio
Annual Report
September 30, 2020
Beginning on January 1, 2021, as permitted by regulations adopted by the Securities and Exchange Commission ("SEC"), paper copies of the Fund's Annual and Semi-Annual Reports to Shareholders ("Shareholder Reports") will no longer be sent by mail, unless you specifically request paper copies of the Shareholder Reports from the Fund or from your financial intermediary, such as a broker-dealer or a bank. Instead, the Shareholder Reports will be made available on the Fund's website, https://www.morganstanley.com/im/shareholderreports and you will be notified by mail each time a Shareholder Report is posted and provided with a website link to access the Shareholder Report. If you already elected to receive Shareholder Reports electronically, you will not be affected by this change and you need not take any action. You may elect to receive Shareholder Reports and other communications from the Fund electronically anytime by contacting your financial intermediary or, if you are a direct investor, please follow the instructions on the envelope.
Beginning on January 1, 2019, you may elect to receive all future Shareholder Reports in paper free of charge. If you invest through a financial intermediary, you can contact your financial intermediary to request that you continue to receive paper copies of your Shareholder Reports. If you invest directly with the Fund, please follow the instructions on the envelope to let the Fund know you wish to continue receiving paper copies of your Shareholder Reports. Your election to receive Shareholder Reports in paper will apply to all funds held in your account if you invest through your financial intermediary or all funds held with the fund complex if you invest directly with a fund.

Morgan Stanley Institutional Fund Trust
Annual Report — September 30, 2020
Shareholders' Letter | | | 2 | | |
Consolidated Expense Example | | | 3 | | |
Investment Overview | | | 4 | | |
Consolidated Portfolio of Investments | | | 9 | | |
Consolidated Statement of Assets and Liabilities | | | 51 | | |
Consolidated Statement of Operations | | | 53 | | |
Consolidated Statements of Changes in Net Assets | | | 54 | | |
Consolidated Financial Highlights | | | 56 | | |
Notes to Consolidated Financial Statements | | | 61 | | |
Report of Independent Registered Public Accounting Firm | | | 74 | | |
Investment Advisory Agreement Approval | | | 75 | | |
Liquidity Risk Management Program | | | 77 | | |
Federal Tax Notice | | | 78 | | |
Privacy Notice | | | 79 | | |
Trustee and Officer Information | | | 81 | | |
This report is authorized for distribution only when preceded or accompanied by a prospectus or summary prospectus of the applicable Fund of the Morgan Stanley Institutional Fund Trust. To receive a prospectus and/or statement of additional information ("SAI"), which contains more complete information such as investment objectives, charges, expenses, policies for voting proxies, risk considerations and describes in detail each of the Fund's investment policies to the prospective investor, please call toll free 1 (800) 548-7786. Please read the prospectuses carefully before you invest or send money.
Additionally, you can access information about the Fund, including performance, characteristics and investment team commentary, through Morgan Stanley Investment Management's website: www.morganstanley.com/im/shareholderreports.
Market forecasts provided in this report may not necessarily come to pass. There is no guarantee that any sectors mentioned will continue to perform as discussed herein or that securities in such sectors will be held by the Fund in the future. There is no assurance that a fund will achieve its investment objective. Funds are subject to market risk, which is the possibility that market values of securities owned by the Fund will decline and, therefore, the value of the Fund's shares may be less than what you paid for them. Accordingly, you can lose money investing in this Fund. Please see the prospectus for more complete information on investment risks.
1
Morgan Stanley Institutional Fund Trust
Annual Report — September 30, 2020
Shareholders' Letter (unaudited)
Dear Shareholders,
We are pleased to provide this Annual Report, in which you will learn how your investment in Global Strategist Portfolio (the "Fund") performed during the latest twelve-month period.
Morgan Stanley Investment Management is a client-centric, investor-led organization. Our global presence, intellectual capital, and breadth of products and services enable us to partner with investors to meet the evolving challenges of today's financial markets. We aim to deliver superior investment service and to empower our clients to make the informed decisions that help them reach their investment goals.
As always, we thank you for selecting Morgan Stanley Investment Management, and look forward to working with you in the months and years ahead.
Sincerely,

John H. Gernon
President and Principal Executive Officer
October 2020
2
Morgan Stanley Institutional Fund Trust
Annual Report — September 30, 2020
Consolidated Expense Example (unaudited)
Global Strategist Portfolio
As a shareholder of the Fund, you may incur two types of costs: (1) transactional costs, including sales charge (loads) on purchase payments; and (2) ongoing costs, which may include advisory fees, administration fees, distribution and shareholder services fees; and other Fund expenses. This example is intended to help you understand your ongoing costs (in dollars) of investing in the Fund and to compare these costs with the ongoing costs of investing in other mutual funds.
This example is based on an investment of $1,000 invested at the beginning of the six-month period ended September 30, 2020 and held for the entire six-month period.
Actual Expenses
The table below provides information about actual account values and actual expenses. You may use the information in this table, together with the amount you invested, to estimate the expenses that you paid over the period. Simply divide your account value by $1,000 (for example, an $8,600 account value divided by $1,000 = 8.6), then multiply the result by the number in the table under the heading entitled "Actual Expenses Paid During Period" to estimate the expenses you paid on your account during this period.
Hypothetical Example for Comparison Purposes
The table below provides information about hypothetical account values and hypothetical expenses based on the Fund's actual expense ratio and an assumed rate of return of 5% per year before expenses, which is not the Fund's actual return. The hypothetical account values and expenses may not be used to estimate the actual ending account balance or expenses you paid for the period. You may use this information to compare the ongoing costs of investing in the Fund and other funds. To do so, compare this 5% hypothetical example with the 5% hypothetical examples that appear in the shareholder reports of the other funds.
Please note that the expenses shown in the table are meant to highlight your ongoing costs only and do not reflect any transactional costs, such as sales charges (loads, if applicable). Therefore, the information for each class in the table is useful in comparing ongoing costs only, and will not help you determine the relative total costs of owning different funds. In addition, if these transactional costs were included, your costs would have been higher.
| | | Beginning
Account
Value
4/1/20 | | Actual Ending
Account
Value
9/30/20 | | Hypothetical
Ending Account
Value | | Actual
Expenses
Paid
During
Period* | | Hypothetical
Expenses Paid
During Period* | | Net
Expense
Ratio
During
Period** | |
Global Strategist Portfolio Class I | | $ | 1,000.00 | | | $ | 1,209.90 | | | $ | 1,021.45 | | | $ | 3.92 | | | $ | 3.59 | | | | 0.71 | % | |
Global Strategist Portfolio Class A | | | 1,000.00 | | | | 1,208.00 | | | | 1,019.95 | | | | 5.58 | | | | 5.10 | | | | 1.01 | | |
Global Strategist Portfolio Class L | | | 1,000.00 | | | | 1,204.50 | | | | 1,017.30 | | | | 8.49 | | | | 7.77 | | | | 1.54 | | |
Global Strategist Portfolio Class C | | | 1,000.00 | | | | 1,202.60 | | | | 1,015.95 | | | | 9.97 | | | | 9.12 | | | | 1.81 | | |
Global Strategist Portfolio Class IS | | | 1,000.00 | | | | 1,209.60 | | | | 1,021.55 | | | | 3.81 | | | | 3.49 | | | | 0.69 | | |
* Expenses are calculated using each Fund Class' annualized net expense ratio (as disclosed), multiplied by the average account value over the period and multiplied by 183/366 (to reflect the most recent one-half year period).
** Annualized.
3
Morgan Stanley Institutional Fund Trust
Annual Report — September 30, 2020
Investment Overview (unaudited)
Global Strategist Portfolio
The Fund seeks above-average total return over a market cycle of three to five years.
Performance
For the fiscal year ended September 30, 2020, the Fund's Class I shares had a total return based on net asset value and reinvestment of distributions per share of 5.93%, net of fees. The Fund's Class I shares underperformed against the Fund's primary benchmark, the MSCI All Country World Index, which returned 10.44%, and underperformed the Customized MSIM Global Allocation Index (the "Customized Index"), which returned 9.26%.
Factors Affecting Performance1
• In the 12 months ended September 30, 2020, equities outperformed bonds and commodities, with the MSCI All Country World Index (ACWI) up +10.4%, the J.P. Morgan Global Government Bond Index up +6.7%, and the S&P GSCI Index, a broad index of commodity prices, down –27.8%.2 (Except where noted, equity market returns are represented by the MSCI regional or country index and are calculated in U.S. dollars [USD].)
• Global markets ended 2019 on a strong risk-on note, propelled by stabilizing economic data, subdued inflation, news of a U.S.-China phase one trade deal, and 75 basis points of Federal Reserve (Fed) easing. Then the COVID-19 pandemic began spreading, causing major economies around the world to grind to a near-halt and global markets to sell off, prompting policy makers to come out forcefully with fiscal and monetary support in the spring and summer of 2020. Policy support, coupled with gradual economic reopening, eventually led to improving growth and sharply rebounding markets for the remainder of the fiscal year ending in September 2020.
• Global equities rose +10.4% for the fiscal year overall, but experienced substantial volatility on the way (MSCI ACWI in USD). After rising by
+11.9% from September 30, 2019, to February 19, 2020, global equity prices fell by over one third in the next 33 days, before rebounding by +48% from March 23 to September 30, 2020 (MSCI ACWI in USD). The VIX Index climbed above 80 in early March 2020, a level it has not reached since 2008, with the S&P 500 Index subsequently experiencing its best two-quarter performance since 2009. U.S. equities led other regions (S&P 500 Index +15.1% in the fiscal year period), supported by bold government stimulus and positive economic surprises. Positive performance was driven in particular by U.S. mega-cap and growth stocks that have dominated for much of the last market cycle. The S&P 500 tech and consumer discretionary sectors were up +48.6% and 40.0%, respectively, while the energy and financials sectors were down –45.3% and –12.5%. Eurozone equities were the weakest regionally (Eurostoxx 50 Index –8.6% in euro terms). While data there was surprising positively in the fourth quarter of 2019, the region was hit relatively early by the COVID-19 virus. The region managed to contain the virus quickly with aggressive lockdowns and many individual countries announced fiscal stimulus plans, but coordinated policy support proved to be more difficult to achieve, and the region began to experience a second wave by early fall 2020, prompting fears of renewed shutdowns. Emerging markets rose in line with the global index (MSCI Emerging Markets Index in USD +10.5%), despite difficulty containing the virus, aided in part by a weaker U.S. dollar and overall risk-on sentiment.
• Prices on relatively safe government bonds rose +6.7%, with gains primarily coming at the height of COVID-19 fears in the first quarter of 2020 (J.P. Morgan Global Government Bond Index). Even as economic data improved, U.S. sovereign bond yields did not rise with equity prices in the second and third quarters of 2020, reflecting lingering investor caution as COVID-19 cases remained
1 Certain of the Fund's investment themes may, in whole or part, be implemented through the use of derivatives, including the purchase and sale of futures, options, swaps, structured investments (including commodity-linked notes) and other related instruments and techniques. The Fund may also invest in foreign currency forward exchange contracts, which are also derivatives, in connection with its investments in foreign securities. The Fund may use derivative instruments for a variety of purposes, including hedging, risk management, portfolio management or to earn income. As a result, the use of derivatives had a material effect on the Fund's performance during the period.
2 Data sources used in preparation of this commentary include FactSet and Bloomberg LP. data as of September 30, 2020.
4
Morgan Stanley Institutional Fund Trust
Annual Report — September 30, 2020
Investment Overview (unaudited) (cont'd)
Global Strategist Portfolio
elevated globally. The yield curve steepened: the U.S. 10-year Treasury yield fell –98 basis points to 0.68% while the 2-year fell –127 basis points to 0.13%. Riskier spreads followed a similar pattern to equities, widening sharply in the first quarter of 2020 then rebounding with overall sentiment in the second and third quarters. U.S. high yield bonds suffered a major sell-off before the U.S. announced a comprehensive economic support package that included support for high yield markets. Spreads shot upward from about 375 basis points in September 2019 to 1100 basis points on March 23, 2020, before settling back down to 517 basis points by the end of the fiscal year (Bloomberg Barclays U.S. Corporate High Yield Index), ending September 2020 about 140 basis points wider than their pre-COVID levels. Emerging market hard currency bond spreads nearly roundtripped during the year: rising from 338 to 662 basis points on March 23, 2020, then falling back down to end the fiscal year just below 400 basis points (J.P. Morgan Emerging Markets Bond Index Global).
• Commodity prices overall collapsed –27.8% (S&P GSCI Index), driven by oil prices. Brent oil prices fell from $60 per barrel to just over $21 per barrel, as the OPEC+ alliance (between the Organization of Petroleum Exporting Countries and key oil-producing non-OPEC members) broke down and Saudi Arabia increased production amid a collapse in global demand. Prices reached their lowest point when concerns about oversupply and storage limitations caused WTI oil futures for May delivery to fall to –$37.63 per barrel before rebounding. Oil prices managed to rebound by over 90% (entirely in the second quarter of 2020), ending the fiscal year just above $40 per barrel. Gold has been among the best performing assets during the fiscal year, given its role as a relatively safe asset, and rose +28.1%.
• The U.S. dollar weakened by –5.5%, despite a temporary spike amid funding concerns in late March 2020. From the March peak, the U.S. dollar has now fallen by –8.9%, given stabilizing global economic data and aggressive U.S. fiscal and monetary activism. Relatively safe reserve currencies were the largest gainers versus the U.S. dollar, with the Swiss franc up +8.4% and the euro up +7.5%. The renminbi began appreciating in June 2020, and rose +5.3% versus the U.S. dollar for the fiscal year,
as China's ability to contain the virus and its post-COVID economic rebound both beat expectations and its macro policy remained supportive. However, emerging market currencies overall depreciated during the fiscal year (J.P. Morgan Emerging Market Currency Index –10%). The weakest were the Turkish lira, which fell –27%; the Brazilian real, which was down –26%; and the Argentine peso, which fell –25%.
• Regarding the Fund's overall performance relative to the Customized Index, the Fund's asset allocation mix of an average overweight in equities, an underweight in fixed income and an overweight in cash had a negative impact on performance.
• Active positions within equities contributed negatively to performance. Detractors included positions in our Value Recovery theme, such as overweight value stocks vs. anti-value, low-volatility and momentum stocks in the U.S. and Europe. In addition, an overweight position in Japanese real estate relative to Japanese equities and an overweight position in European domestic stocks relative to U.S. equities also detracted from performance. However, these losses were partially offset by gains from an overweight position in U.S. homebuilders and housing stocks relative to U.S. equities, an overweight position in U.S. equity volatility (beta hedged), and an underweight position in Australian banks relative to developed market equities and banks.
• Active positions within fixed income contributed positively to performance. Contributors during the period included an overweight position in U.S. 10-year inflation breakeven rates and an overweight position in Greek 10-year bonds versus French, Italian and Spanish 10-year bonds. Detractors during the period included an underweight position in U.S. 30-year Treasuries and an overweight position in Mexican 10-year bonds relative to U.S. 10-year Treasuries.
• Active positions within commodities had a positive impact on performance, as overweight positions in gold and oil contributed to performance.
• Active currency positions (implemented via currency forwards and futures) negatively impacted performance. Overweight positions in the Mexican
5
Morgan Stanley Institutional Fund Trust
Annual Report — September 30, 2020
Investment Overview (unaudited) (cont'd)
Global Strategist Portfolio
peso and in the British pound, both relative to the U.S. dollar, and in the Brazilian real relative to emerging market currencies detracted from performance. These losses were partially offset by gains from our overweight positions in defensive currencies (Swiss franc, euro, British pound and Japanese yen) and in the Chinese renminbi, both relative to the U.S. dollar, and in the Argentine peso relative to emerging market currencies.
Management Strategies
• We expect continued steady improvement in economic activity, as the impact of the virus subsides and as economic stimulus remains strong. In spite of the near-term risks of rolling second waves and some renewed lockdowns, between now and mid-2021 we expect a gradual return to some semblance of normalcy. We enter the fourth quarter of 2020 with a modest tactical overweight to global equities. We think bonds are at risk in a recovery, and express this view via a curve steepener position. We have re-established a significant overweight in value stocks vs. low volatility and anti-value stocks in the U.S., and remain overweight underpriced recovery plays, such as U.S. housing stocks, global industrials and auto manufacturers, as well as developed market hotel stocks. We are also underweight certain COVID "winners" and U.S. initial public offering stocks. Key risks to our views are mostly to the downside, and include the increasing likelihood of a second wave and the lack of a vaccine by early 2021. Other downside risks that we are watching include a fiscal cliff, a Democratic sweep, and worsening U.S.-China relations. Upside risks are greater fiscal activism and/or a weaker U.S. dollar.
• We are neutral duration, but hold a curve steepener position. As economies reopen and fiscal stimulus increases, we believe a curve steepener is likely to benefit from a growth and inflation recovery. Positive carry makes a long-end curve steepener more attractive relative to an outright underweight position in Treasuries. We believe recessionary fundamentals are more than fully priced in government bonds, and going forward we expect the U.S. 10-year Treasury yield to rise modestly from 0.77% to 1.1% by the second half of 2020. We believe U.S. growth will come in at –2.4% in 2020 and +6.7% in 2021 (versus consensus
expectations of –4.0% in 2020 and +3.7% in 2021). In addition, we believe inflation will rebound modestly faster than consensus forecasts in a period of extreme monetary policy accommodation, with core personal consumption expenditures coming in at 1.8% in 12 months versus consensus expectation of 1.6% by third quarter 2021. Elsewhere in fixed income, we are overweight U.S. TIPS (Treasury inflation-protected securities) vs. Treasuries. Rates markets are pricing in approximately 1.5% U.S. core inflation over the next 10 years. As economic activity rebounds, we expect resilient aggregate demand, given massive fiscal and monetary stimulus, to be met with shrunken supply as the labor market recovers more gradually. Deficit spending will necessitate some form of financial repression, with higher inflation likely being a major part of this.
• We are modestly overweight U.S. equities. While valuations in absolute terms are very high at 21.9x forward price-to-earnings for U.S. equities, U.S. stocks are still somewhat cheap relative to bonds (equity risk premium 4.58%), and we expect the equity risk premium could overshoot in a recovery, compressing beyond normalized levels of around 4.2%, closer to 3.5%, as the equity risk premium tends to overshoot during recoveries. Fundamentals are supportive: a strong earnings per share (EPS) rebound is currently underway, and should continue with reopenings and an eventual normalization. While U.S. EPS is likely to be down by –21% for the year, we expect that full year 2021 EPS will grow by +25% year-over-year, in line with consensus expectations.
• We are overweight value stocks vs. low volatility and anti-value stocks in the U.S., where value is still near the cheapest it has ever been, and positioning is extreme. For example, U.S. value stocks are –39% cheap to their long-term median relative valuation to anti-value, compared with 40% in March 2000. The expected bottoming in economic activity should benefit value stocks relative to anti-value and low volatility stocks.
• We believe the U.S. dollar is in the early stages of a multi-year bear market. While better growth in the U.S., coupled with global economic uncertainty, have buoyed the U.S. dollar's role as a relative safe-haven asset and caused it to appreciate versus other
6
Morgan Stanley Institutional Fund Trust
Annual Report — September 30, 2020
Investment Overview (unaudited) (cont'd)
Global Strategist Portfolio
reserve currencies, the U.S. dollar remains expensive, and is facing headwinds in the medium term. We expect the dollar to depreciate approximately 10% over the next 12 to 18 months.
• We are overweight commodities, via gold and oil. We believe that the medium-term outlook for gold continues to be favorable as the fiscal response to the COVID-19 outbreak has been to flood the economy with money, while the Fed has promised to keep interest rates at zero for a prolonged period, even after inflation has risen. Historically, money printing and negative real interest rates have been extremely favorable for gold on a forward-looking basis, and we expect the same to hold true going forward. Our end-2021 forecast is for gold above $2,100 per ounce. We expect oil prices will increase to $60 per barrel by mid-2021 from around $40 today, as demand recovers and oil inventories fall back to pre-COVID-19 levels. Nearer-term risks to the downside include moderating demand in the event of slowing global mobility, and the possibility that OPEC+ reverses current production cuts early next year.

* Minimum Investment
In accordance with SEC regulations, the Fund's performance shown assumes that all recurring fees (including management fees) were deducted and all dividends and distributions were reinvested. The performance of Class A, Class L, Class C and Class IS shares will vary from the performance of Class I shares based upon their different inception dates and will be negatively impacted by additional fees assessed to those classes (where applicable).
7
Morgan Stanley Institutional Fund Trust
Annual Report — September 30, 2020
Investment Overview (unaudited) (cont'd)
Global Strategist Portfolio
Performance Compared to the MSCI All Country World Index(1), the Customized MSIM Global Allocation Index(2) and the Lipper Flexible Portfolio Funds Index(3)
| | | Period Ended September 30, 2020
Total Returns(4) | |
| | | | | Average Annual | |
| | | One
Year | | Five
Years | | Ten
Years | | Since
Inception(10) | |
Fund — Class I Shares
w/o sales charges(5) | | | 5.93 | % | | | 6.76 | % | | | 6.80 | % | | | 7.07 | % | |
Fund — Class A Shares
w/o sales charges(6) | | | 5.65 | | | | 6.42 | | | | 6.48 | | | | 6.04 | | |
Fund — Class A Shares with
maximum 5.25% sales charges(6) | | | 0.09 | | | | 5.29 | | | | 5.91 | | | | 5.80 | | |
Fund — Class L Shares
w/o sales charges(7) | | | 5.10 | | | | 5.89 | | | | — | | | | 5.12 | | |
Fund — Class C Shares
w/o sales charges(8) | | | 4.81 | | | | 5.57 | | | | — | | | | 3.08 | | |
Fund — Class C Shares with
maximum 1.00% deferred
sales charges(8) | | | 3.81 | | | | 5.57 | | | | — | | | | 3.08 | | |
Fund — Class IS
Shares w/o sales charges(9) | | | 6.02 | | | | 6.81 | | | | — | | | | 4.56 | | |
MSCI All Country World Index | | | 10.44 | | | | 10.30 | | | | 8.55 | | | | 7.67 | | |
Customized MSIM Global
Allocation Index | | | 9.26 | | | | 7.77 | | | | 5.91 | | | | — | | |
Lipper Flexible Portfolio Funds Index | | | 11.52 | | | | 8.56 | | | | 7.56 | | | | 6.93 | | |
Performance data quoted represents past performance, which is no guarantee of future results, and current performance may be lower or higher than the figures shown. Performance assumes that all dividends and distributions, if any, were reinvested. For the most recent month-end performance figures, please visit www.morganstanley.com/im/shareholderreports. Investment returns and principal value will fluctuate so that Fund shares, when redeemed, may be worth more or less than their original cost. Total returns do not reflect the deduction of taxes that a shareholder would pay on Fund distributions or the redemption of Fund shares. Performance of share classes will vary due to differences in sales charges and expenses.
(1) The MSCI All Country World Index (ACWI) is a free float-adjusted market capitalization weighted index designed to measure the equity market performance of developed and emerging markets. The term "free float" represents the portion of shares outstanding that are deemed to be available for purchase in the public equity markets by investors. The performance of the Index is listed in U.S. dollars and assumes reinvestment of net dividends. Net total return indices reinvest dividends after the deduction of withholding taxes, using (for international indices) a tax rate applicable to non-resident institutional investors who do not benefit from double taxation treaties. Returns, including periods prior to January 1, 2001, are calculated using the return data of the MSCI All Country World Index (gross dividends) through December 31, 2000 and the return data of the MSCI All Country World Index (net dividends) after December 31, 2000. The Index is unmanaged and its returns do not include any sales charges or fees. Such costs would lower performance. It is not possible to invest directly in an index.
(2) The Customized MSIM Global Allocation Index is a performance linked benchmark comprised of 60% MSCI All Country World Index and 40% Bloomberg Barclays Global Aggregate Index for periods after May 31, 2017. Prior to May 31, 2017, the Customized MSIM Global Allocation Index consisted of 60% MSCI All Country World Index (benchmark that measures the equity market performance of developed and emerging markets), 30% Bloomberg Barclays Global Aggregate Index (benchmark that provides a broadbased measure of the global investment grade fixed-rate debt markets), 5% S&P GSCI Light Energy Index (benchmark for investment performance in the energy commodity market) and 5% ICE BofA U.S. Dollar 1-Month LIBID Average Index (benchmark that tracks the performance of a basket of synthetic assets paying LIBID to a stated maturity). The Customized MSIM Global Allocation Index was added as the Fund benchmark on October 2, 2013 and is provided for comparative purposes only. The Index is unmanaged and its returns do not include any sales charges or fees. Such costs would lower performance. It is not possible to invest directly in an index.
(3) The Lipper Flexible Portfolio Funds Index is an equally weighted performance index of the largest qualifying funds (based on net assets) in the Lipper Flexible Portfolio Funds classification. The Index, which is adjusted for capital gains distributions and income dividends, is unmanaged and should not be considered an investment. There are currently 30 funds represented in this Index. As of the date of this report, the Fund was in the Lipper Flexible Portfolio Funds classification.
(4) Total returns for the Fund reflect expenses waived and/or reimbursed, if applicable, by the Adviser. Without such waivers and/or reimbursements, total returns would have been lower.
(5) Commenced operations on December 31, 1992.
(6) Commenced offering on November 1, 1996.
(7) Commenced offering on April 27, 2012.
(8) Commenced offering on April 30, 2015.
(9) Commenced offering on May 29, 2015.
(10) For comparative purposes, average annual since inception returns listed for the Indexes refer to the inception date of Class I of the Fund, not the inception of the Indexes.
8
Morgan Stanley Institutional Fund Trust
Annual Report — September 30, 2020
Consolidated Portfolio of Investments
Global Strategist Portfolio
| | | Face
Amount
(000) | | Value
(000) | |
Fixed Income Securities (40.2%) | |
Agency Adjustable Rate Mortgage (0.0%) | |
United States (0.0%) | |
Federal Home Loan Mortgage Corporation, | |
Conventional Pool:, | |
12 Month USD LIBOR + 1.62%,
3.00%, 7/1/45 | | $ | 67 | | | $ | 69 | | |
Agency Fixed Rate Mortgages (3.6%) | |
United States (3.6%) | |
Federal Home Loan Mortgage Corporation, | |
Conventional Pool: | |
4.50%, 1/1/49 | | | 305 | | | | 331 | | |
Gold Pools: | |
3.50%, 1/1/44 - 6/1/45 | | | 906 | | | | 991 | | |
4.50%, 1/1/49 | | | 70 | | | | 74 | | |
6.50%, 5/1/32 - 7/1/32 | | | 28 | | | | 30 | | |
7.50%, 5/1/35 | | | 3 | | | | 4 | | |
Federal National Mortgage Association, | |
Conventional Pools: | |
3.00%, 7/1/49 | | | 654 | | | | 680 | | |
3.50%, 3/1/47 | | | 118 | | | | 127 | | |
4.00%, 4/1/45 - 9/1/45 | | | 862 | | | | 948 | | |
4.50%, 3/1/41 - 11/1/44 | | | 186 | | | | 207 | | |
5.00%, 1/1/41 - 3/1/41 | | | 447 | | | | 514 | | |
6.00%, 1/1/38 | | | 3 | | | | 4 | | |
6.50%, 12/1/29 | | | 9 | | | | 10 | | |
7.00%, 2/1/31 | | | 54 | | | | 56 | | |
7.50%, 8/1/37 | | | 6 | | | | 7 | | |
October TBA: | |
2.00%, 10/1/50 (a) | | | 1,000 | | | | 1,034 | | |
3.00%, 10/1/35 - 10/1/50 (a) | | | 5,400 | | | | 5,657 | | |
3.50%, 10/1/50 (a) | | | 2,000 | | | | 2,109 | | |
Government National Mortgage Association, | |
Various Pools: | |
4.00%, 8/20/41 - 11/20/42 | | | 251 | | | | 276 | | |
4.50%, 6/20/49 | | | 121 | | | | 127 | | |
5.00%, 2/20/49 - 6/20/49 | | | 366 | | | | 392 | | |
5.50%, 8/15/39 | | | 16 | | | | 18 | | |
| | | | 13,596 | | |
Asset-Backed Securities (0.5%) | |
United States (0.5%) | |
Freed ABS Trust, | |
3.06%, 3/18/27 (b) | | | 300 | | | | 300 | | |
New Century Home Equity Loan Trust, | |
1 Month USD LIBOR + 1.35%,
1.50%, 3/25/33 (c) | | | 205 | | | | 203 | | |
NovaStar Mortgage Funding Trust, | |
1 Month USD LIBOR + 1.58%,
1.72%, 12/25/34 (c) | | | 200 | | | | 197 | | |
Renaissance Home Equity Loan Trust, | |
1 Month USD LIBOR + 0.76%,
0.91%, 12/25/32 (c) | | | 227 | | | | 219 | | |
| | | Face
Amount
(000) | | Value
(000) | |
SASCO Mortgage Loan Trust, | |
1 Month USD LIBOR + 2.18%,
2.32%, 5/25/34 (c) | | $ | 360 | | | $ | 360 | | |
SLM Student Loan Trust, | |
3 Month EURIBOR + 0.55%,
0.10%, 7/25/39 (c) | | EUR | 450 | | | | 501 | | |
| | | | 1,780 | | |
Collateralized Mortgage Obligations — Agency Collateral Series (0.0%) | |
United States (0.0%) | |
Federal Home Loan Mortgage Corporation | |
IO REMIC, | |
6.05% - 1 Month USD LIBOR,
5.90%, 4/15/39 (d) | | $ | 15 | | | | — | @ | |
Commercial Mortgage-Backed Securities (0.5%) | |
United Kingdom (0.1%) | |
Taurus 2018-2 UK DAC, | |
3 Month GBP LIBOR + 1.10%,
1.17%, 5/22/28 (c) | | GBP | 231 | | | | 291 | | |
United States (0.4%) | |
Ashford Hospitality Trust, | |
1 Month USD LIBOR + 1.85%,
2.00%, 6/15/35 (b)(c) | | $ | 250 | | | | 227 | | |
COMM Mortgage Trust, | |
3.28%, 1/10/46 | | | 305 | | | | 318 | | |
4.88%, 7/15/47 (b)(c) | | | 152 | | | | 121 | | |
Federal Home Loan Mortgage Corporation, | |
2.79%, 1/25/22 | | | 69 | | | | 71 | | |
2.97%, 10/25/21 | | | 82 | | | | 84 | | |
JP Morgan Chase Commercial
Mortgage Securities Trust, | |
4.39%, 7/15/46 (b) | | | 29 | | | | 29 | | |
UBS-Barclays Commercial Mortgage Trust, | |
3.53%, 5/10/63 | | | 255 | | | | 263 | | |
WFRBS Commercial Mortgage Trust, | |
4.14%, 10/15/57 (b)(c) | | | 362 | | | | 317 | | |
5.19%, 9/15/46 (b)(c) | | | 375 | | | | 225 | | |
| | | | 1,655 | | |
| | | | 1,946 | | |
Corporate Bonds (10.9%) | |
Australia (0.2%) | |
Macquarie Bank Ltd., | |
6.63%, 4/7/21 (b) | | | 270 | | | | 278 | | |
Macquarie Group Ltd., | |
4.15%, 3/27/24 (b) | | | 125 | | | | 134 | | |
Transurban Finance Co. Pty Ltd., | |
2.00%, 8/28/25 | | | 350 | | | | 433 | | |
| | | | 845 | | |
Belgium (0.1%) | |
Anheuser-Busch InBev SA, | |
2.75%, 3/17/36 | | EUR | 350 | | | | 481 | | |
Canada (0.6%) | |
Enbridge, Inc., | |
2.50%, 1/15/25 | | $ | 200 | | | | 210 | | |
Province of British Columbia Canada, | |
2.00%, 10/23/22 | | | 780 | | | | 808 | | |
The accompanying notes are an integral part of the consolidated financial statements.
9
Morgan Stanley Institutional Fund Trust
Annual Report — September 30, 2020
Consolidated Portfolio of Investments (cont'd)
Global Strategist Portfolio
| | | Face
Amount
(000) | | Value
(000) | |
Canada (cont'd) | |
Province of Ontario Canada, | |
2.30%, 6/15/26 | | $ | 780 | | | $ | 852 | | |
Royal Bank of Canada, | |
2.75%, 2/1/22 | | | 350 | | | | 362 | | |
| | | | 2,232 | | |
Chile (0.1%) | |
Banco del Estado de Chile, | |
2.67%, 1/8/21 (b) | | | 300 | | | | 302 | | |
China (0.1%) | |
Baidu, Inc., | |
2.88%, 7/6/22 | | | 200 | | | | 206 | | |
Colombia (0.2%) | |
Ecopetrol SA, | |
5.88%, 9/18/23 | | | 710 | | | | 782 | | |
Denmark (0.1%) | |
Danske Bank A/S, | |
5.00%, 1/12/23 (b) | | | 200 | | | | 210 | | |
France (0.7%) | |
Banque Federative du Credit Mutuel SA, | |
0.75%, 7/17/25 | | EUR | 400 | | | | 486 | | |
BNP Paribas SA, | |
1.13%, 6/11/26 | | | 485 | | | | 591 | | |
| BPCE SA, | |
5.15%, 7/21/24 (b) | | $ | 725 | | | | 813 | | |
Orange SA, | |
5.00%, 10/1/26 (e) | | EUR | 250 | | | | 347 | | |
TOTAL SA, | |
2.71%, 12/29/49 (e) | | | 100 | | | | 121 | | |
3.88%, 12/29/49 (e) | | | 250 | | | | 307 | | |
| | | | 2,665 | | |
Germany (0.8%) | |
Bayer US Finance II LLC, | |
3.88%, 12/15/23 (b) | | $ | 675 | | | | 738 | | |
Daimler Finance North America LLC, | |
2.70%, 6/14/24 (b) | | | 325 | | | | 344 | | |
Deutsche Telekom International Finance BV, | |
3.60%, 1/19/27 (b) | | | 625 | | | | 701 | | |
Kreditanstalt fuer Wiederaufbau, | |
1.13%, 9/15/32 | | EUR | 640 | | | | 870 | | |
Muenchener Rueckversicherungs-
Gesellschaft AG in Muenchen, | |
6.00%, 5/26/41 | | | 400 | | | | 486 | | |
| | | | 3,139 | | |
Hong Kong (0.1%) | |
CK Hutchison International 16 Ltd., | |
1.88%, 10/3/21 (b) | | $ | 200 | | | | 202 | | |
India (0.2%) | |
ONGC Videsh Vankorneft Pte Ltd., | |
3.75%, 7/27/26 | | | 820 | | | | 856 | | |
| | | Face
Amount
(000) | | Value
(000) | |
Ireland (0.1%) | |
Avolon Holdings Funding Ltd., | |
2.88%, 2/15/25 (b) | | $ | 250 | | | $ | 230 | | |
Israel (0.0%) | |
Teva Pharmaceutical Finance Netherlands III BV, | |
2.20%, 7/21/21 | | | 82 | | | | 81 | | |
Korea, Republic of (0.3%) | |
Korea Electric Power Corp., | |
2.50%, 6/24/24 (b) | | | 610 | | | | 646 | | |
Korea Hydro & Nuclear Power Co., Ltd., | |
3.75%, 7/25/23 (b) | | | 510 | | | | 553 | | |
| | | | 1,199 | | |
Netherlands (0.3%) | |
ASR Nederland N.V., | |
5.00%, 9/30/24 (e) | | EUR | 425 | | | | 554 | | |
Cooperatieve Rabobank UA, | |
3.95%, 11/9/22 | | $ | 250 | | | | 266 | | |
Series G
3.75%, 11/9/20 | | EUR | 300 | | | | 353 | | |
| | | | 1,173 | | |
Saudi Arabia (0.1%) | |
Saudi Arabian Oil Co., | |
3.50%, 4/16/29 | | $ | 490 | | | | 540 | | |
Spain (0.4%) | |
Banco Santander SA, | |
3.13%, 1/19/27 | | EUR | 400 | | | | 521 | | |
5.18%, 11/19/25 | | $ | 600 | | | | 680 | | |
CaixaBank SA, | |
0.75%, 4/18/23 | | EUR | 400 | | | | 477 | | |
| | | | 1,678 | | |
Switzerland (0.3%) | |
Syngenta Finance N.V., | |
4.44%, 4/24/23 (b) | | $ | 200 | | | | 212 | | |
UBS Group Funding Switzerland AG, | |
3.49%, 5/23/23 (b) | | | 900 | | | | 939 | | |
| | | | 1,151 | | |
United Arab Emirates (0.1%) | |
ADCB Finance Cayman Ltd., | |
4.00%, 3/29/23 (b) | | | 200 | | | | 213 | | |
United Kingdom (1.0%) | |
BAT Capital Corp., | |
3.56%, 8/15/27 | | | 525 | | | | 568 | | |
BP Capital Markets PLC, | |
2.50%, 11/6/22 | | | 275 | | | | 286 | | |
HSBC Holdings PLC, | |
2.63%, 11/7/25 | | | 525 | | | | 547 | | |
4.25%, 3/14/24 | | | 400 | | | | 429 | | |
Lloyds Banking Group PLC, | |
2.44%, 2/5/26 | | | 350 | | | | 363 | | |
Nationwide Building Society, | |
3.77%, 3/8/24 (b) | | | 300 | | | | 319 | | |
4.36%, 8/1/24 (b) | | | 200 | | | | 217 | | |
The accompanying notes are an integral part of the consolidated financial statements.
10
Morgan Stanley Institutional Fund Trust
Annual Report — September 30, 2020
Consolidated Portfolio of Investments (cont'd)
Global Strategist Portfolio
| | | Face
Amount
(000) | | Value
(000) | |
United Kingdom (cont'd) | |
NGG Finance PLC, | |
5.63%, 6/18/73 | | GBP | 200 | | | $ | 292 | | |
Royal Bank of Scotland Group PLC, | |
3.88%, 9/12/23 | | $ | 750 | | | | 805 | | |
| | | | 3,826 | | |
United States (5.1%) | |
AbbVie, Inc., | |
3.20%, 11/21/29 (b) | | | 300 | | | | 332 | | |
Air Lease Corp., | |
2.30%, 2/1/25 | | | 300 | | | | 295 | | |
Amazon.com, Inc., | |
4.25%, 8/22/57 | | | 175 | | | | 240 | | |
American International Group, Inc., | |
4.88%, 6/1/22 | | | 400 | | | | 429 | | |
American Tower Corp., | |
2.40%, 3/15/25 | | | 200 | | | | 212 | | |
AT&T, Inc., | |
1.80%, 9/5/26 | | EUR | 400 | | | | 505 | | |
Bank of America Corp.MTN, | |
4.00%, 1/22/25 | | $ | 825 | | | | 920 | | |
Boeing Co. (The), | |
5.15%, 5/1/30 | | | 525 | | | | 592 | | |
Burlington Northern Santa Fe LLC, | |
4.55%, 9/1/44 | | | 195 | | | | 255 | | |
Campbell Soup Co., | |
2.38%, 4/24/30 | | | 200 | | | | 208 | | |
Capital One Financial Corp., | |
3.30%, 10/30/24 | | | 325 | | | | 353 | | |
Charter Communications Operating LLC/
Charter Communications
Operating Capital, | |
5.75%, 4/1/48 | | | 175 | | | | 219 | | |
Chubb INA Holdings, Inc., | |
0.88%, 6/15/27 | | EUR | 400 | | | | 482 | | |
Cigna Corp., | |
2.40%, 3/15/30 | | $ | 75 | | | | 78 | | |
3.88%, 10/15/47 | | | 200 | | | | 223 | | |
Citigroup, Inc., | |
2.57%, 6/3/31 | | | 50 | | | | 52 | | |
2.67%, 1/29/31 | | | 156 | | | | 165 | | |
2.98%, 11/5/30 | | | 94 | | | | 102 | | |
5.50%, 9/13/25 | | | 425 | | | | 504 | | |
Comcast Corp., | |
1.95%, 1/15/31 | | | 400 | | | | 412 | | |
3.40%, 4/1/30 | | | 125 | | | | 145 | | |
Crown Castle International Corp., | |
3.30%, 7/1/30 | | | 125 | | | | 137 | | |
CVS Health Corp., | |
3.75%, 4/1/30 | | | 50 | | | | 57 | | |
4.10%, 3/25/25 | | | 73 | | | | 83 | | |
Deere & Co., | |
3.10%, 4/15/30 | | | 100 | | | | 114 | | |
| | | Face
Amount
(000) | | Value
(000) | |
Diamondback Energy, Inc., | |
2.88%, 12/1/24 | | $ | 425 | | | $ | 431 | | |
Emerson Electric Co., | |
1.25%, 10/15/25 | | EUR | 450 | | | | 560 | | |
Energy Transfer Operating LP, | |
2.90%, 5/15/25 | | $ | 600 | | | | 604 | | |
Enterprise Products Operating LLC, | |
3.95%, 1/31/60 | | | 100 | | | | 99 | | |
Ford Motor Credit Co. LLC, | |
3.09%, 1/9/23 | | | 300 | | | | 295 | | |
Fox Corp., | |
4.71%, 1/25/29 | | | 175 | | | | 210 | | |
GE Capital International Funding Co.
Unlimited Co., | |
4.42%, 11/15/35 | | | 250 | | | | 264 | | |
Georgia-Pacific LLC, | |
2.30%, 4/30/30 (b) | | | 325 | | | | 346 | | |
Goldman Sachs Group, Inc. (The), | |
2.88%, 10/31/22 | | | 350 | | | | 358 | | |
HCA, Inc., | |
5.50%, 6/15/47 | | | 100 | | | | 124 | | |
HSBC USA, Inc., | |
3.50%, 6/23/24 | | | 100 | | | | 108 | | |
JPMorgan Chase & Co., | |
3.70%, 5/6/30 | | | 200 | | | | 230 | | |
Las Vegas Sands Corp., | |
3.20%, 8/8/24 | | | 75 | | | | 76 | | |
3.50%, 8/18/26 | | | 125 | | | | 127 | | |
Level 3 Financing, Inc., | |
3.40%, 3/1/27 (b) | | | 425 | | | | 459 | | |
McDonald's Corp.MTN, | |
3.38%, 5/26/25 | | | 275 | | | | 306 | | |
Metropolitan Life Global Funding I, | |
2.95%, 4/9/30 (b) | | | 425 | | | | 478 | | |
Newmont Corp., | |
3.70%, 3/15/23 | | | 26 | | | | 27 | | |
NextEra Energy Capital Holdings, Inc., | |
2.25%, 6/1/30 | | | 325 | | | | 337 | | |
2.75%, 5/1/25 | | | 450 | | | | 487 | | |
NIKE, Inc., | |
2.85%, 3/27/30 | | | 275 | | | | 309 | | |
NiSource, Inc., | |
3.60%, 5/1/30 | | | 175 | | | | 200 | | |
NVIDIA Corp., | |
2.85%, 4/1/30 | | | 275 | | | | 310 | | |
Occidental Petroleum Corp., | |
3.20%, 8/15/26 | | | 40 | | | | 32 | | |
5.55%, 3/15/26 | | | 350 | | | | 318 | | |
Oracle Corp., | |
2.95%, 4/1/30 | | | 350 | | | | 392 | | |
3.40%, 7/8/24 | | | 175 | | | | 192 | | |
Pacific Gas and Electric Co., | |
2.50%, 2/1/31 | | | 300 | | | | 286 | | |
The accompanying notes are an integral part of the consolidated financial statements.
11
Morgan Stanley Institutional Fund Trust
Annual Report — September 30, 2020
Consolidated Portfolio of Investments (cont'd)
Global Strategist Portfolio
| | | Face
Amount
(000) | | Value
(000) | |
United States (cont'd) | |
PepsiCo, Inc., | |
2.63%, 4/28/26 | | EUR | 400 | | | $ | 538 | | |
Prologis Euro Finance LLC, | |
1.88%, 1/5/29 | | | 300 | | | | 392 | | |
Synchrony Bank, | |
3.00%, 6/15/22 | | $ | 875 | | | | 903 | | |
Target Corp., | |
2.65%, 9/15/30 | | | 125 | | | | 140 | | |
TJX Cos., Inc. (The), | |
3.88%, 4/15/30 | | | 350 | | | | 416 | | |
Union Pacific Corp., | |
3.95%, 9/10/28 | | | 190 | | | | 225 | | |
Verizon Communications, Inc., | |
4.67%, 3/15/55 | | EUR | 196 | | | | 273 | | |
Walt Disney Co. (The), | |
2.65%, 1/13/31 | | $ | 350 | | | | 379 | | |
Wells Fargo & Co., | |
2.57%, 2/11/31 | | | 350 | | | | 368 | | |
2.88%, 10/30/30 | | | 175 | | | | 188 | | |
5.01%, 4/4/51 | | | 300 | | | | 413 | | |
| | | | 19,314 | | |
| | | | 41,325 | | |
Mortgages — Other (0.6%) | |
Netherlands (0.1%) | |
E-MAC NL 2006-II BV, | |
3 Month EURIBOR + 0.13%,
0.77%, 1/25/39 (c) | | EUR | 242 | | | | 262 | | |
United Kingdom (0.1%) | |
Great Hall Mortgages No 1 PLC, | |
3 Month EURIBOR + 0.25%
0.00%, 6/18/38 (c) | | EUR | 200 | | | | 220 | | |
United States (0.4%) | |
Banc of America Alternative Loan Trust, | |
5.86%, 10/25/36 | | $ | 27 | | | | 12 | | |
6.00%, 4/25/36 | | | 1 | | | | 1 | | |
ChaseFlex Trust, | |
6.00%, 2/25/37 | | | 23 | | | | 15 | | |
Federal Home Loan Mortgage Corporation, | |
3.00%, 9/25/45 - 5/25/47 | | | 810 | | | | 829 | | |
3.50%, 5/25/45 - 7/25/46 | | | 313 | | | | 322 | | |
4.00%, 5/25/45 | | | 32 | | | | 33 | | |
GSR Mortgage Loan Trust, | |
5.75%, 1/25/37 | | | 11 | | | | 10 | | |
Lehman Mortgage Trust, | |
6.50%, 9/25/37 | | | 19 | | | | 10 | | |
Seasoned Credit Risk Transfer Trust, | |
3.00%, 7/25/58 - 10/25/58 | | | 385 | | | | 422 | | |
4.00%, 10/25/58 | | | 46 | | | | 51 | | |
| | | | 1,705 | | |
| | | | 2,187 | | |
| | | Face
Amount
(000) | | Value
(000) | |
Sovereign (22.1%) | |
Australia (1.1%) | |
Australia Government Bond, | |
0.25%, 11/21/25 | | AUD | 2,480 | | | $ | 1,767 | | |
2.50%, 5/21/30 | | | 1,790 | | | | 1,487 | | |
2.75%, 11/21/29 | | | 830 | | | | 699 | | |
3.00%, 3/21/47 | | | 340 | | | | 315 | | |
| | | | 4,268 | | |
Austria (0.1%) | |
Republic of Austria Government Bond, | |
0.00%, 2/20/30 (b) | | EUR | 260 | | | | 315 | | |
2.10%, 12/31/99 (b) | | | 60 | | | | 150 | | |
| | | | 465 | | |
Belgium (0.4%) | |
Kingdom of Belgium Government Bond, | |
0.90%, 6/22/29 (b) | | | 120 | | | | 157 | | |
1.70%, 6/22/50 (b) | | | 350 | | | | 561 | | |
1.90%, 6/22/38 (b) | | | 550 | | | | 849 | | |
| | | | 1,567 | | |
Canada (1.4%) | |
Canadian Government Bond, | |
2.25%, 6/1/29 | | CAD | 4,970 | | | | 4,289 | | |
Province of Quebec Canada, | |
1.35%, 5/28/30 | | $ | 860 | | | | 884 | | |
| | | | 5,173 | | |
Chile (0.1%) | |
Chile Government International Bond, | |
3.50%, 1/25/50 | | | 320 | | | | 366 | | |
China (1.3%) | |
China Development Bank, | |
3.07%, 3/10/30 | | CNY | 4,900 | | | | 682 | | |
China Government Bond, | |
3.13%, 11/21/29 | | | 20,150 | | | | 2,945 | | |
3.86%, 7/22/49 | | | 6,000 | | | | 883 | | |
Sinopec Group Overseas Development
2013 Ltd., | |
2.63%, 10/17/20 | | EUR | 300 | | | | 352 | | |
| | | | 4,862 | | |
Denmark (0.1%) | |
Denmark Government Bond, | |
0.50%, 11/15/27 | | DKK | 2,190 | | | | 370 | | |
Finland (0.1%) | |
Finland Government Bond, | |
1.13%, 4/15/34 (b) | | EUR | 270 | | | | 374 | | |
France (1.0%) | |
French Republic Government Bond OAT, | |
0.00%, 11/25/29 | | | 2,220 | | | | 2,680 | | |
2.00%, 5/25/48 (b) | | | 680 | | | | 1,147 | | |
| | | | 3,827 | | |
The accompanying notes are an integral part of the consolidated financial statements.
12
Morgan Stanley Institutional Fund Trust
Annual Report — September 30, 2020
Consolidated Portfolio of Investments (cont'd)
Global Strategist Portfolio
| | | Face
Amount
(000) | | Value
(000) | |
Germany (1.0%) | |
Bundesrepublik Deutschland Bundesanleihe, | |
0.25%, 2/15/29 | | $ | 1,580 | | | $ | 1,990 | | |
4.25%, 7/4/39 | | | 210 | | | | 464 | | |
State of North Rhine-Westphalia Germany, | |
1.65%, 2/22/38 | | | 940 | | | | 1,406 | | |
| | | | 3,860 | | |
Greece (2.6%) | |
Hellenic Republic Government Bond, | |
3.75%, 1/30/28 | | | 6,812 | | | | 9,676 | | |
Hong Kong (0.1%) | |
Hong Kong Government International Bond, | |
2.50%, 5/28/24 (b) | | $ | 250 | | | | 264 | | |
Hungary (0.0%) | |
Hungary Government Bond, | |
3.00%, 8/21/30 | | HUF | 17,000 | | | | 59 | | |
Indonesia (0.3%) | |
Indonesia Government International Bond, | |
1.75%, 4/24/25 | | EUR | 440 | | | | 533 | | |
Indonesia Treasury Bond, | |
6.13%, 5/15/28 | | IDR | 2,681,000 | | | | 174 | | |
8.25%, 5/15/29 | | | 1,320,000 | | | | 97 | | |
8.38%, 3/15/34 | | | 3,345,000 | | | | 242 | | |
| | | | 1,046 | | |
Italy (1.1%) | |
Italy Buoni Poliennali Del Tesoro, | |
1.40%, 5/26/25 (b) | | EUR | 199 | | | | 244 | | |
1.75%, 7/1/24 | | | 1,875 | | | | 2,336 | | |
1.80%, 3/1/41 (b) | | | 260 | | | | 320 | | |
2.45%, 9/1/50 (b) | | | 910 | | | | 1,241 | | |
| | | | 4,141 | | |
Japan (4.0%) | |
Japan Government Ten Year Bond, | |
0.10%, 6/20/26 - 6/20/29 | | JPY | 650,000 | | | | 6,237 | | |
Japan Government Thirty Year Bond, | |
0.30%, 6/20/46 | | | 214,000 | | | | 1,924 | | |
0.40%, 9/20/49 | | | 108,000 | | | | 975 | | |
1.70%, 6/20/33 | | | 267,000 | | | | 3,024 | | |
2.00%, 9/20/40 | | | 253,000 | | | | 3,132 | | |
| | | | 15,292 | | |
Korea, Republic of (0.2%) | |
Export-Import Bank of Korea, | |
2.38%, 6/25/24 | | $ | 510 | | | | 540 | | |
Korea International Bond, | |
2.00%, 6/19/24 | | | 350 | | | | 367 | | |
| | | | 907 | | |
Malaysia (0.4%) | |
Malaysia Government Bond, | |
3.96%, 9/15/25 | | MYR | 2,600 | | | | 675 | | |
Petronas Capital Ltd., | |
3.50%, 3/18/25 (b) | | $ | 675 | | | | 743 | | |
| | | | 1,418 | | |
| | | Face
Amount
(000) | | Value
(000) | |
Mexico (2.5%) | |
Mexican Bonos, | |
7.50%, 6/3/27 | | MXN | 12,000 | | | $ | 604 | | |
Series M
7.75%, 5/29/31 | | | 5,000 | | | | 255 | | |
8.50%, 5/31/29 | | | 156,000 | | | | 8,349 | | |
Mexico Government International Bond, | |
4.50%, 4/22/29 | | $ | 330 | | | | 371 | | |
Petroleos Mexicanos, | |
6.95%, 1/28/60 (b) | | | 95 | | | | 73 | | |
| | | | 9,652 | | |
Netherlands (0.4%) | |
Nederlandse Waterschapsbank, | |
1.00%, 5/28/30 (b) | | | 376 | | | | 378 | | |
Netherlands Government Bond, | |
0.00%, 7/15/30 (b) | | | 700 | | | | 854 | | |
2.75%, 1/15/47 (b) | | | 70 | | | | 144 | | |
| | | | 1,376 | | |
New Zealand (0.3%) | |
New Zealand Government Bond, | |
2.75%, 4/15/37 | | NZD | 1,360 | | | | 1,155 | | |
3.00%, 4/20/29 | | | 130 | | | | 105 | | |
| | | | 1,260 | | |
Nigeria (0.1%) | |
Africa Finance Corp., | |
4.38%, 4/17/26 (b) | | $ | 200 | | | | 216 | | |
Norway (0.0%) | |
Norway Government Bond, | |
1.38%, 8/19/30 (b) | | NOK | 790 | | | | 91 | | |
Poland (0.1%) | |
Republic of Poland Government Bond, | |
2.50%, 7/25/27 | | PLN | 820 | | | | 233 | | |
Portugal (0.1%) | |
Portugal Obrigacoes do Tesouro OT, | |
0.70%, 10/15/27 (b) | | EUR | 390 | | | | 480 | | |
Russia (0.1%) | |
Russian Federal Bond — OFZ, | |
7.95%, 10/7/26 | | RUB | 21,000 | | | | 302 | | |
Spain (0.7%) | |
Spain Government Bond, | |
1.25%, 10/31/30(b) | | EUR | 1,490 | | | | 1,921 | | |
2.70%, 10/31/48 (b) | | | 300 | | | | 497 | | |
3.45%, 7/30/66 (b) | | | 80 | | | | 163 | | |
| | | | 2,581 | | |
Supernational (1.0%) | |
European Investment Bank, | |
0.20%, 7/15/24 | | | 690 | | | | 835 | | |
International Bank for Reconstruction &
Development, | |
SOFR + 0.43%, 0.51%, 8/19/27 (c) | | AUD | 1,170 | | | | 1,168 | | |
2.20%, 2/27/24 | | | 2,190 | | | | 1,662 | | |
| | | | 3,665 | | |
The accompanying notes are an integral part of the consolidated financial statements.
13
Morgan Stanley Institutional Fund Trust
Annual Report — September 30, 2020
Consolidated Portfolio of Investments (cont'd)
Global Strategist Portfolio
| | | Face
Amount
(000) | | Value
(000) | |
Sweden (0.1%) | |
Sweden Government Bond, | |
0.75%, 5/12/28 | | SEK | 1,590 | | | $ | 190 | | |
1.00%, 11/12/26 | | | 1,350 | | | | 163 | | |
| | | | 353 | | |
United Kingdom (1.4%) | |
United Kingdom Gilt, | |
0.63%, 10/22/50 | | GBP | 900 | | | | 1,115 | | |
1.63%, 10/22/28 | | | 1,000 | | | | 1,450 | | |
3.50%, 1/22/45 | | | 820 | | | | 1,702 | | |
4.25%, 9/7/39 | | | 450 | | | | 953 | | |
| | | | 5,220 | | |
| | | | 83,364 | | |
U.S. Treasury Securities (2.0%) | |
United States (2.0%) | |
U.S. Treasury Bonds, | |
1.13%, 5/15/40 | | $ | 2,740 | | | | 2,703 | | |
1.25%, 5/15/50 | | | 690 | | | | 656 | | |
2.50%, 2/15/45 | | | 1,180 | | | | 1,456 | | |
3.13%, 5/15/48 | | | 2,000 | | | | 2,788 | | |
| | | | 7,603 | | |
Total Fixed Income Securities (Cost $142,514) | | | 151,870 | | |
| | | Shares | | | |
Common Stocks (45.6%) | |
Australia (1.4%) | |
AGL Energy Ltd. | | | 3,105 | | | | 30 | | |
Alumina Ltd. | | | 11,583 | | | | 12 | | |
Amcor PLC CDI | | | 5,265 | | | | 58 | | |
AMP Ltd. | | | 13,865 | | | | 13 | | |
Ampol Ltd. | | | 1,264 | | | | 22 | | |
APA Group | | | 5,005 | | | | 37 | | |
Aristocrat Leisure Ltd. | | | 2,418 | | | | 53 | | |
ASX Ltd. | | | 868 | | | | 51 | | |
Aurizon Holdings Ltd. | | | 9,285 | | | | 29 | | |
AusNet Services | | | 9,851 | | | | 13 | | |
Australia & New Zealand Banking Group Ltd. | | | 15,161 | | | | 189 | | |
Bank of Queensland Ltd. | | | 2,383 | | | | 10 | | |
Bendigo & Adelaide Bank Ltd. | | | 2,958 | | | | 13 | | |
BHP Group Ltd. | | | 53,401 | | | | 1,380 | | |
Boral Ltd. | | | 5,651 | | | | 19 | | |
Brambles Ltd. | | | 7,217 | | | | 55 | | |
Challenger Ltd. | | | 3,033 | | | | 8 | | |
CIMIC Group Ltd. (f) | | | 518 | | | | 7 | | |
Coca-Cola Amatil Ltd. | | | 2,891 | | | | 20 | | |
Cochlear Ltd. | | | 257 | | | | 37 | | |
Coles Group Ltd. | | | 5,061 | | | | 62 | | |
Commonwealth Bank of Australia | | | 7,509 | | | | 346 | | |
Computershare Ltd. | | | 2,205 | | | | 20 | | |
Crown Resorts Ltd. | | | 1,777 | | | | 11 | | |
CSL Ltd. | | | 1,929 | | | | 398 | | |
Dexus REIT | | | 4,383 | | | | 28 | | |
| | | Shares | | Value
(000) | |
Domino's Pizza Enterprises Ltd. | | | 310 | | | $ | 18 | | |
Flight Centre Travel Group Ltd. (f) | | | 309 | | | | 3 | | |
Fortescue Metals Group Ltd. | | | 32,294 | | | | 379 | | |
Goodman Group REIT | | | 8,162 | | | | 106 | | |
GPT Group (The) REIT | | | 8,494 | | | | 24 | | |
Harvey Norman Holdings Ltd. | | | 2,912 | | | | 9 | | |
Incitec Pivot Ltd. | | | 8,227 | | | | 12 | | |
Insurance Australia Group Ltd. | | | 10,672 | | | | 34 | | |
James Hardie Industries PLC CDI | | | 2,025 | | | | 49 | | |
Lend Lease Group REIT | | | 2,601 | | | | 21 | | |
Macquarie Group Ltd. | | | 1,407 | | | | 122 | | |
Medibank Pvt Ltd. | | | 12,422 | | | | 22 | | |
Mirvac Group REIT | | | 16,831 | | | | 26 | | |
National Australia Bank Ltd. | | | 14,203 | | | | 182 | | |
Newcrest Mining Ltd. | | | 3,382 | | | | 77 | | |
Oil Search Ltd. | | | 6,410 | | | | 12 | | |
OneMarket Ltd. (f) | | | 390 | | | | — | | |
Orica Ltd. | | | 1,765 | | | | 20 | | |
Origin Energy Ltd. | | | 7,892 | | | | 24 | | |
Qantas Airways Ltd. (f) | | | 1,836 | | | | 5 | | |
QBE Insurance Group Ltd. | | | 7,227 | | | | 45 | | |
Ramsay Health Care Ltd. | | | 626 | | | | 30 | | |
REA Group Ltd. | | | 267 | | | | 21 | | |
Rio Tinto Ltd. | | | 1,881 | | | | 128 | | |
Santos Ltd. | | | 8,312 | | | | 29 | | |
Scentre Group REIT | | | 24,135 | | | | 38 | | |
Seek Ltd. | | | 1,574 | | | | 24 | | |
Shopping Centres Australasia Property
Group REIT | | | 60 | | | | — | @ | |
Sonic Healthcare Ltd. | | | 1,897 | | | | 45 | | |
South32 Ltd. | | | 23,497 | | | | 35 | | |
Stockland REIT | | | 12,198 | | | | 33 | | |
Suncorp Group Ltd. | | | 5,829 | | | | 36 | | |
Sydney Airport | | | 5,187 | | | | 22 | | |
Tabcorp Holdings Ltd. | | | 9,164 | | | | 22 | | |
Telstra Corp., Ltd. | | | 19,211 | | | | 38 | | |
TPG Telecom Ltd. (f) | | | 1,809 | | | | 10 | | |
Transurban Group | | | 9,194 | | | | 94 | | |
Treasury Wine Estates Ltd. | | | 3,452 | | | | 22 | | |
Tuas Ltd. (f) | | | 904 | | | | — | @ | |
Vicinity Centres REIT | | | 15,698 | | | | 16 | | |
Vocus Group Ltd. (f) | | | 2,924 | | | | 8 | | |
Wesfarmers Ltd. | | | 5,061 | | | | 162 | | |
Westpac Banking Corp. | | | 15,168 | | | | 184 | | |
Woodside Petroleum Ltd. | | | 3,690 | | | | 47 | | |
Woolworths Group Ltd. | | | 5,985 | | | | 157 | | |
| | | | 5,312 | | |
Austria (0.0%) | |
IMMOFINANZ AG (f) | | | 332 | | | | 5 | | |
voestalpine AG | | | 1,205 | | | | 32 | | |
| | | | 37 | | |
The accompanying notes are an integral part of the consolidated financial statements.
14
Morgan Stanley Institutional Fund Trust
Annual Report — September 30, 2020
Consolidated Portfolio of Investments (cont'd)
Global Strategist Portfolio
| | | Shares | | Value
(000) | |
Belgium (0.1%) | |
Ageas | | | 751 | | | $ | 31 | | |
Anheuser-Busch InBev SA N.V. | | | 3,075 | | | | 166 | | |
Colruyt SA | | | 239 | | | | 15 | | |
Groupe Bruxelles Lambert SA | | | 320 | | | | 29 | | |
KBC Group N.V. | | | 1,004 | | | | 50 | | |
Proximus SADP | | | 606 | | | | 11 | | |
Solvay SA | | | 296 | | | | 25 | | |
Telenet Group Holding N.V. | | | 212 | | | | 8 | | |
UCB SA | | | 499 | | | | 57 | | |
Umicore SA | | | 746 | | | | 31 | | |
| | | | 423 | | |
Brazil (0.1%) | |
Vale SA | | | 43,500 | | | | 458 | | |
Canada (1.7%) | |
Agnico Eagle Mines Ltd. | | | 1,200 | | | | 96 | | |
Alimentation Couche-Tard, Inc., Class B | | | 4,262 | | | | 148 | | |
AltaGas Ltd. | | | 1,100 | | | | 13 | | |
ARC Resources Ltd. | | | 1,445 | | | | 6 | | |
Atco Ltd., Class I | | | 600 | | | | 17 | | |
Bank of Montreal | | | 3,398 | | | | 199 | | |
Bank of Nova Scotia (The) | | | 5,711 | | | | 237 | | |
Barrick Gold Corp. (NYSE) | | | 3,432 | | | | 96 | | |
Barrick Gold Corp. (LSE) | | | 4,090 | | | | 114 | | |
Bausch Health Cos., Inc. (f) | | | 1,400 | | | | 22 | | |
BCE, Inc. | | | 1,100 | | | | 46 | | |
Blackberry Ltd. (f) | | | 2,420 | | | | 11 | | |
Bombardier, Inc., Class B (f) | | | 9,698 | | | | 2 | | |
Brookfield Asset Management, Inc., Class A | | | 5,819 | | | | 193 | | |
CAE, Inc. | | | 1,300 | | | | 19 | | |
Cameco Corp. | | | 1,934 | | | | 20 | | |
Canadian Imperial Bank of Commerce | | | 1,738 | | | | 130 | | |
Canadian National Railway Co. | | | 3,676 | | | | 391 | | |
Canadian Natural Resources Ltd. | | | 5,229 | | | | 84 | | |
Canadian Pacific Railway Ltd. | | | 1,100 | | | | 335 | | |
Canadian Tire Corp., Ltd., Class A | | | 600 | | | | 60 | | |
Canadian Utilities Ltd., Class A | | | 1,000 | | | | 24 | | |
CCL Industries, Inc., Class B | | | 1,200 | | | | 46 | | |
Cenovus Energy, Inc. | | | 3,569 | | | | 14 | | |
CGI, Inc. (f) | | | 1,200 | | | | 81 | | |
CI Financial Corp. | | | 1,200 | | | | 15 | | |
Constellation Software, Inc. | | | 100 | | | | 111 | | |
Crescent Point Energy Corp. | | | 2,613 | | | | 3 | | |
Dollarama, Inc. | | | 2,000 | | | | 77 | | |
Eldorado Gold Corp. (f) | | | 738 | | | | 8 | | |
Element Fleet Management Corp. | | | 1,938 | | | | 16 | | |
Emera, Inc. | | | 500 | | | | 21 | | |
Empire Co., Ltd., Class A | | | 1,100 | | | | 32 | | |
Enbridge, Inc. | | | 4,747 | | | | 139 | | |
Fairfax Financial Holdings Ltd. | | | 100 | | | | 29 | | |
Finning International, Inc. | | | 1,100 | | | | 17 | | |
First Quantum Minerals Ltd. | | | 3,394 | | | | 30 | | |
Fortis, Inc. | | | 1,934 | | | | 79 | | |
| | | Shares | | Value
(000) | |
Franco-Nevada Corp. | | | 1,100 | | | $ | 154 | | |
George Weston Ltd. | | | 631 | | | | 46 | | |
Gildan Activewear, Inc. | | | 1,300 | | | | 26 | | |
Great-West Lifeco, Inc. | | | 1,300 | | | | 25 | | |
H&R Real Estate Investment Trust REIT | | | 1,100 | | | | 8 | | |
Husky Energy, Inc. | | | 1,698 | | | | 4 | | |
Hydro One Ltd. | | | 1,200 | | | | 25 | | |
IA Financial Corp., Inc. | | | 800 | | | | 28 | | |
IGM Financial, Inc. | | | 700 | | | | 16 | | |
Imperial Oil Ltd. | | | 1,256 | | | | 15 | | |
Intact Financial Corp. | | | 1,000 | | | | 107 | | |
Inter Pipeline Ltd. | | | 1,545 | | | | 15 | | |
Keyera Corp. | | | 1,200 | | | | 18 | | |
Kinross Gold Corp. (f) | | | 5,514 | | | | 49 | | |
Linamar Corp. | | | 500 | | | | 15 | | |
Loblaw Cos., Ltd. | | | 1,373 | | | | 72 | | |
Magna International, Inc. | | | 6,210 | | | | 284 | | |
Manulife Financial Corp. | | | 9,483 | | | | 132 | | |
Methanex Corp. | | | 700 | | | | 17 | | |
Metro, Inc. | | | 1,200 | | | | 58 | | |
National Bank of Canada | | | 1,400 | | | | 70 | | |
Nutrien Ltd. | | | 3,369 | | | | 132 | | |
Onex Corp. | | | 700 | | | | 31 | | |
Open Text Corp. | | | 1,200 | | | | 51 | | |
Pembina Pipeline Corp. | | | 2,558 | | | | 54 | | |
Peyto Exploration & Development Corp. | | | 1,200 | | | | 2 | | |
Power Corp. of Canada | | | 3,012 | | | | 59 | | |
PrairieSky Royalty Ltd. | | | 977 | | | | 6 | | |
Restaurant Brands International, Inc. | | | 1,200 | | | | 69 | | |
RioCan Real Estate Investment Trust REIT | | | 1,100 | | | | 12 | | |
Rogers Communications, Inc., Class B | | | 1,442 | | | | 57 | | |
Royal Bank of Canada | | | 6,967 | | | | 489 | | |
Saputo, Inc. | | | 1,400 | | | | 35 | | |
Seven Generations Energy Ltd., Class A (f) | | | 1,600 | | | | 4 | | |
Shaw Communications, Inc., Class B | | | 1,934 | | | | 35 | | |
SmartCentres Real Estate Investment
Trust REIT | | | 600 | | | | 9 | | |
SNC-Lavalin Group, Inc. | | | 1,100 | | | | 18 | | |
Sun Life Financial, Inc. | | | 2,905 | | | | 118 | | |
Suncor Energy, Inc. | | | 8,088 | | | | 99 | | |
TC Energy Corp. | | | 4,062 | | | | 171 | | |
Teck Resources Ltd., Class B | | | 3,009 | | | | 42 | | |
TELUS Corp. | | | 2,100 | | | | 37 | | |
Thomson Reuters Corp. | | | 1,389 | | | | 111 | | |
Toronto-Dominion Bank (The) | | | 8,709 | | | | 403 | | |
Tourmaline Oil Corp. | | | 1,200 | | | | 15 | | |
Trisura Group Ltd. (f) | | | 27 | | | | 2 | | |
Turquoise Hill Resources Ltd. (f) | | | 5,340 | | | | 5 | | |
Vermilion Energy, Inc. | | | 800 | | | | 2 | | |
West Fraser Timber Co., Ltd. | | | 600 | | | | 28 | | |
Wheaton Precious Metals Corp. | | | 2,031 | | | | 100 | | |
Yamana Gold, Inc. | | | 3,962 | | | | 22 | | |
| | | | 6,383 | | |
The accompanying notes are an integral part of the consolidated financial statements.
15
Morgan Stanley Institutional Fund Trust
Annual Report — September 30, 2020
Consolidated Portfolio of Investments (cont'd)
Global Strategist Portfolio
| | | Shares | | Value
(000) | |
China (0.2%) | |
BAIC Motor Corp., Ltd. H Shares (g) | | | 24,336 | | | $ | 10 | | |
Brilliance China Automotive Holdings Ltd. (g) | | | 42,831 | | | | 41 | | |
BYD Co., Ltd. H Shares (f) | | | 9,734 | | | | 157 | | |
China Common Rich Renewable Energy
Investments Ltd. (f) | | | 42,000 | | | | — | | |
Dongfeng Motor Group Co., Ltd. H Shares (g) | | | 35,043 | | | | 22 | | |
Fuyao Glass Industry Group Co. Ltd. (g) | | | 7,787 | | | | 29 | | |
Geely Automobile Holdings Ltd. (g) | | | 91,449 | | | | 183 | | |
Great Wall Motor Co., Ltd. H Shares (g) | | | 48,645 | | | | 62 | | |
Guangzhou Automobile Group Co., Ltd.
H Shares (g) | | | 42,831 | | | | 36 | | |
NIO, Inc. ADR (f) | | | 12,065 | | | | 256 | | |
Wharf Holdings Ltd. (The) (g) | | | 13,200 | | | | 26 | | |
| | | | 822 | | |
Denmark (0.4%) | |
AP Moller — Maersk A/S Series A | | | 14 | | | | 21 | | |
AP Moller — Maersk A/S Series B | | | 29 | | | | 46 | | |
Carlsberg A/S Series B | | | 55 | | | | 7 | | |
Coloplast A/S Series B | | | 66 | | | | 10 | | |
Danske Bank A/S (f) | | | 3,140 | | | | 42 | | |
Drilling Co of 1972 A/S/The (f) | | | 104 | | | | 2 | | |
DSV A/S | | | 1,791 | | | | 291 | | |
Novo Nordisk A/S Series B | | | 10,114 | | | | 701 | | |
Novozymes A/S Series B | | | 1,439 | | | | 90 | | |
Vestas Wind Systems A/S | | | 1,810 | | | | 293 | | |
| | | | 1,503 | | |
Finland (0.3%) | |
Elisa Oyj | | | 601 | | | | 35 | | |
Fortum Oyj | | | 1,836 | | | | 37 | | |
Kone Oyj, Class B | | | 1,416 | | | | 124 | | |
Metso Outotec Oyj | | | 2,033 | | | | 14 | | |
Neles Oyj | | | 473 | | | | 6 | | |
Neste Oyj | | | 1,646 | | | | 87 | | |
Nokia Oyj (f) | | | 24,585 | | | | 96 | | |
Nokian Renkaat Oyj | | | 10,529 | | | | 298 | | |
Nordea Bank Abp (f) (OMXH) | | | 194 | | | | 2 | | |
Nordea Bank Abp (f) (SSE) | | | 14,028 | | | | 107 | | |
Orion Oyj, Class B | | | 439 | | | | 20 | | |
Sampo Oyj, Class A | | | 1,873 | | | | 74 | | |
Stora Enso Oyj, Class R | | | 2,345 | | | | 37 | | |
UPM-Kymmene Oyj | | | 2,245 | | | | 68 | | |
Wartsila Oyj Abp | | | 1,880 | | | | 15 | | |
| | | | 1,020 | | |
France (2.2%) | |
Accor SA (f) | | | 16,287 | | | | 456 | | |
Aeroports de Paris (ADP) | | | 122 | | | | 12 | | |
Air Liquide SA | | | 1,936 | | | | 307 | | |
Airbus SE (f) | | | 2,412 | | | | 175 | | |
Alstom SA (f) | | | 631 | | | | 31 | | |
Amundi SA (f) | | | 245 | | | | 17 | | |
ArcelorMittal (f) | | | 2,718 | | | | 36 | | |
| | | Shares | | Value
(000) | |
Arkema SA | | | 279 | | | $ | 30 | | |
Atos SE (f) | | | 393 | | | | 32 | | |
AXA SA | | | 7,969 | | | | 147 | | |
BioMerieux | | | 172 | | | | 27 | | |
BNP Paribas SA (f) | | | 4,613 | | | | 167 | | |
Bollore SA | | | 3,563 | | | | 13 | | |
Bouygues SA | | | 876 | | | | 30 | | |
Bureau Veritas SA (f) | | | 1,088 | | | | 25 | | |
Capgemini SE | | | 660 | | | | 85 | | |
Carrefour SA | | | 2,338 | | | | 37 | | |
Casino Guichard Perrachon SA (f) | | | 226 | | | | 5 | | |
Cie de Saint-Gobain (f) | | | 2,095 | | | | 88 | | |
Cie Generale des Etablissements Michelin SCA | | | 16,395 | | | | 1,760 | | |
CNP Assurances (f) | | | 694 | | | | 9 | | |
Covivio REIT | | | 137 | | | | 10 | | |
Credit Agricole SA (f) | | | 4,654 | | | | 41 | | |
Danone SA | | | 2,491 | | | | 161 | | |
Dassault Aviation SA (f) | | | 11 | | | | 9 | | |
Dassault Systemes SE | | | 537 | | | | 100 | | |
Edenred | | | 915 | | | | 41 | | |
Eiffage SA (f) | | | 301 | | | | 25 | | |
Electricite de France SA | | | 2,348 | | | | 25 | | |
Engie SA (f) | | | 7,578 | | | | 101 | | |
EssilorLuxottica SA (f) | | | 851 | | | | 116 | | |
Eurazeo SE (f) | | | 194 | | | | 10 | | |
Eurofins Scientific SE (f) | | | 46 | | | | 36 | | |
Eutelsat Communications SA | | | 722 | | | | 7 | | |
Faurecia SE (f) | | | 1,443 | | | | 62 | | |
Gecina SA REIT | | | 195 | | | | 26 | | |
Getlink SE (f) | | | 1,904 | | | | 26 | | |
Hermes International | | | 130 | | | | 112 | | |
ICADE REIT | | | 137 | | | | 8 | | |
Iliad SA | | | 107 | | | | 20 | | |
Imerys SA | | | 153 | | | | 6 | | |
Ingenico Group SA (f) | | | 243 | | | | 38 | | |
Ipsen SA | | | 155 | | | | 16 | | |
JCDecaux SA (f) | | | 304 | | | | 5 | | |
Kering SA | | | 313 | | | | 208 | | |
Klepierre SA REIT | | | 902 | | | | 13 | | |
L'Oreal SA (BSRM) | | | 1,040 | | | | 338 | | |
Lagardere SCA (f) | | | 490 | | | | 12 | | |
Legrand SA | | | 1,087 | | | | 87 | | |
LVMH Moet Hennessy Louis Vuitton SE | | | 1,154 | | | | 540 | | |
Natixis SA (f) | | | 3,881 | | | | 9 | | |
Orange SA | | | 8,178 | | | | 85 | | |
Pernod Ricard SA | | | 887 | | | | 141 | | |
Peugeot SA (f) | | | 11,226 | | | | 204 | | |
Publicis Groupe SA | | | 854 | | | | 28 | | |
Remy Cointreau SA | | | 95 | | | | 17 | | |
Renault SA (f) | | | 787 | | | | 20 | | |
Rexel SA (f) | | | 1,228 | | | | 15 | | |
Safran SA (f) | | | 1,368 | | | | 135 | | |
Sanofi | | | 4,584 | | | | 459 | | |
The accompanying notes are an integral part of the consolidated financial statements.
16
Morgan Stanley Institutional Fund Trust
Annual Report — September 30, 2020
Consolidated Portfolio of Investments (cont'd)
Global Strategist Portfolio
| | | Shares | | Value
(000) | |
France (cont'd) | |
Schneider Electric SE | | | 2,332 | | | $ | 290 | | |
SCOR SE (f) | | | 706 | | | | 20 | | |
SEB SA | | | 94 | | | | 15 | | |
SES SA | | | 1,501 | | | | 11 | | |
Societe BIC SA | | | 117 | | | | 6 | | |
Societe Generale SA (f) | | | 3,139 | | | | 42 | | |
Sodexo SA | | | 378 | | | | 27 | | |
STMicroelectronics N.V. | | | 2,775 | | | | 85 | | |
Suez | | | 1,805 | | | | 33 | | |
Teleperformance | | | 239 | | | | 74 | �� | |
Thales SA | | | 439 | | | | 33 | | |
TOTAL SA | | | 9,675 | | | | 332 | | |
Ubisoft Entertainment SA (f) | | | 260 | | | | 23 | | |
Unibail-Rodamco-Westfield REIT | | | 408 | | | | 15 | | |
Unibail-Rodamco-Westfield REIT CDI | | | 2,974 | | | | 5 | | |
Valeo SA | | | 4,424 | | | | 136 | | |
Veolia Environnement SA | | | 2,032 | | | | 44 | | |
Vinci SA | | | 2,076 | | | | 173 | | |
Vivendi SA | | | 4,239 | | | | 118 | | |
Wendel SA | | | 115 | | | | 10 | | |
Worldline SA (f) | | | 156 | | | | 13 | | |
| | | | 8,306 | | |
Germany (1.9%) | |
| 1&1 Drillisch AG | | | 229 | | | | 5 | | |
Adidas AG (f) | | | 769 | | | | 248 | | |
Allianz SE (Registered) | | | 1,840 | | | | 353 | | |
BASF SE | | | 3,783 | | | | 230 | | |
Bayer AG (Registered) | | | 3,413 | | | | 211 | | |
Bayerische Motoren Werke AG | | | 6,488 | | | | 471 | | |
Bayerische Motoren Werke AG (Preference) | | | 1,086 | | | | 59 | | |
Beiersdorf AG | | | 416 | | | | 47 | | |
Brenntag AG | | | 639 | | | | 41 | | |
Commerzbank AG (f) | | | 4,353 | | | | 21 | | |
Continental AG | | | 2,116 | | | | 229 | | |
Covestro AG | | | 662 | | | | 33 | | |
Daimler AG (Registered) | | | 17,105 | | | | 923 | | |
Deutsche Bank AG (Registered) (f) | | | 8,417 | | | | 71 | | |
Deutsche Boerse AG | | | 772 | | | | 135 | | |
Deutsche Lufthansa AG (Registered) (f) | | | 974 | | | | 8 | | |
Deutsche Post AG (Registered) | | | 3,982 | | | | 181 | | |
Deutsche Telekom AG (Registered) | | | 13,693 | | | | 228 | | |
Deutsche Wohnen SE | | | 1,453 | | | | 73 | | |
E.ON SE | | | 9,245 | | | | 102 | | |
Evonik Industries AG | | | 668 | | | | 17 | | |
Fraport AG Frankfurt Airport Services
Worldwide (f) | | | 171 | | | | 7 | | |
Fresenius Medical Care AG & Co., KGaA | | | 888 | | | | 75 | | |
Fresenius SE & Co., KGaA | | | 1,711 | | | | 78 | | |
Fuchs Petrolub SE (Preference) | | | 287 | | | | 15 | | |
GEA Group AG | | | 721 | | | | 25 | | |
Hannover Rueck SE (Registered) | | | 245 | | | | 38 | | |
HeidelbergCement AG | | | 623 | | | | 38 | | |
| | | Shares | | Value
(000) | |
Henkel AG & Co., KGaA | | | 429 | | | $ | 40 | | |
Henkel AG & Co., KGaA (Preference) | | | 738 | | | | 77 | | |
Hochtief AG | | | 79 | | | | 6 | | |
Hugo Boss AG | | | 264 | | | | 7 | | |
Infineon Technologies AG | | | 4,808 | | | | 136 | | |
K+S AG (Registered) | | | 780 | | | | 5 | | |
KION Group AG | | | 294 | | | | 25 | | |
LANXESS AG | | | 377 | | | | 22 | | |
Linde PLC (f) | | | 1,188 | | | | 281 | | |
Merck KGaA | | | 531 | | | | 77 | | |
METRO AG | | | 736 | | | | 7 | | |
MTU Aero Engines AG | | | 213 | | | | 35 | | |
Muenchener Rueckversicherungs-Gesellschaft
AG in Muenchen (Registered) | | | 636 | | | | 162 | | |
OSRAM Licht AG (f) | | | 408 | | | | 24 | | |
Porsche Automobil Holding SE (Preference) (f) | | | 3,000 | | | | 179 | | |
ProSiebenSat.1 Media SE (Registered) (f) | | | 968 | | | | 13 | | |
Puma SE (f) | | | 261 | | | | 24 | | |
QIAGEN N.V. (f) | | | 896 | | | | 47 | | |
RTL Group SA (f) | | | 159 | | | | 6 | | |
RWE AG | | | 2,186 | | | | 82 | | |
SAP SE | | | 4,031 | | | | 628 | | |
Schaeffler AG (Preference) | | | 1,000 | | | | 6 | | |
Siemens AG (Registered) | | | 3,170 | | | | 400 | | |
Symrise AG | | | 512 | | | | 71 | | |
Telefonica Deutschland Holding AG | | | 3,079 | | | | 8 | | |
thyssenKrupp AG (f) | | | 1,787 | | | | 9 | | |
Uniper SE | | | 829 | | | | 27 | | |
United Internet AG (Registered) | | | 503 | | | | 19 | | |
Volkswagen AG (f) | | | 592 | | | | 104 | | |
Volkswagen AG (Preference) (f) | | | 3,582 | | | | 576 | | |
Vonovia SE | | | 2,015 | | | | 138 | | |
Wirecard AG (f) | | | 496 | | | | — | @ | |
Zalando SE (f) | | | 465 | | | | 43 | | |
| | | | 7,246 | | |
Greece (0.0%) | |
National Bank of Greece SA (f) | | | 9 | | | | — | @ | |
Hong Kong (0.5%) | |
AIA Group Ltd. | | | 52,200 | | | | 519 | | |
ASM Pacific Technology Ltd. | | | 1,000 | | | | 10 | | |
Bank of East Asia Ltd. (The) | | | 6,994 | | | | 13 | | |
BOC Hong Kong Holdings Ltd. | | | 18,500 | | | | 49 | | |
Cathay Pacific Airways Ltd. (f) | | | 5,000 | | | | 3 | | |
CK Asset Holdings Ltd. | | | 12,364 | | | | 61 | | |
CK Hutchison Holdings Ltd. | | | 11,364 | | | | 69 | | |
CK Infrastructure Holdings Ltd. | | | 4,000 | | | | 19 | | |
CLP Holdings Ltd. | | | 7,500 | | | | 70 | | |
First Pacific Co., Ltd. | | | 10,000 | | | | 3 | | |
Galaxy Entertainment Group Ltd. | | | 10,000 | | | | 68 | | |
Hang Lung Group Ltd. | | | 5,000 | | | | 11 | | |
Hang Lung Properties Ltd. | | | 10,000 | | | | 25 | | |
Hang Seng Bank Ltd. | | | 3,800 | | | | 56 | | |
Henderson Land Development Co., Ltd. | | | 7,644 | | | | 28 | | |
The accompanying notes are an integral part of the consolidated financial statements.
17
Morgan Stanley Institutional Fund Trust
Annual Report — September 30, 2020
Consolidated Portfolio of Investments (cont'd)
Global Strategist Portfolio
| | | Shares | | Value
(000) | |
Hong Kong (cont'd) | |
HK Electric Investments & HK Electric
Investments Ltd. | | | 12,500 | | | $ | 13 | | |
HKT Trust & HKT Ltd. | | | 11,000 | | | | 15 | | |
Hong Kong & China Gas Co., Ltd. | | | 51,561 | | | | 75 | | |
Hong Kong Exchanges & Clearing Ltd. | | | 5,440 | | | | 256 | | |
Hongkong Land Holdings Ltd. | | | 5,600 | | | | 21 | | |
Hysan Development Co., Ltd. | | | 4,000 | | | | 12 | | |
I-CABLE Communications Ltd. (f) | | | 7,559 | | | | — | @ | |
Jardine Matheson Holdings Ltd. | | | 1,000 | | | | 40 | | |
Kerry Properties Ltd. | | | 3,500 | | | | 9 | | |
Link REIT | | | 9,882 | | | | 81 | | |
Melco Resorts & Entertainment Ltd. ADR | | | 900 | | | | 15 | | |
MGM China Holdings Ltd. | | | 3,600 | | | | 4 | | |
MTR Corp., Ltd. | | | 7,392 | | | | 37 | | |
New World Development Co. Ltd. | | | 7,841 | | | | 38 | | |
NWS Holdings Ltd. | | | 8,000 | | | | 6 | | |
Pacific Century Premium Developments Ltd. (f) | | | 2,160 | | | | 1 | | |
PCCW Ltd. | | | 21,000 | | | | 13 | | |
Power Assets Holdings Ltd. | | | 6,500 | | | | 34 | | |
Sands China Ltd. | | | 11,600 | | | | 45 | | |
Shangri-La Asia Ltd. (f) | | | 8,000 | | | | 6 | | |
Sino Land Co., Ltd. | | | 17,725 | | | | 21 | | |
SJM Holdings Ltd. | | | 9,000 | | | | 11 | | |
Sun Hung Kai Properties Ltd. | | | 7,004 | | | | 90 | | |
Swire Pacific Ltd., Class A | | | 2,000 | | | | 10 | | |
Swire Properties Ltd. | | | 5,550 | | | | 15 | | |
Techtronic Industries Co., Ltd. | | | 6,500 | | | | 86 | | |
WH Group Ltd. | | | 39,500 | | | | 32 | | |
Wharf Real Estate Investment Co., Ltd. | | | 12,200 | | | | 50 | | |
Wynn Macau Ltd. (f) | | | 8,000 | | | | 13 | | |
Yue Yuen Industrial Holdings Ltd. | | | 4,000 | | | | 6 | | |
| | | | 2,059 | | |
Ireland (0.1%) | |
AIB Group PLC (f) | | | 3,316 | | | | 3 | | |
Bank of Ireland Group PLC (f) | | | 3,768 | | | | 7 | | |
CRH PLC | | | 3,431 | | | | 124 | | |
Flutter Entertainment PLC (f) | | | 332 | | | | 53 | | |
Kerry Group PLC, Class A | | | 645 | | | | 83 | | |
| | | | 270 | | |
Italy (0.5%) | |
Assicurazioni Generali SpA | | | 5,058 | | | | 71 | | |
Atlantia SpA (f) | | | 1,869 | | | | 29 | | |
CNH Industrial N.V. (f) | | | 4,274 | | | | 33 | | |
Davide Campari-Milano | | | 2,426 | | | | 26 | | |
Enel SpA | | | 33,642 | | | | 292 | | |
Eni SpA | | | 10,436 | | | | 81 | | |
EXOR N.V. | | | 444 | | | | 24 | | |
Ferrari N.V. | | | 2,394 | | | | 439 | | |
Fiat Chrysler Automobiles N.V. (f) | | | 21,806 | | | | 268 | | |
Intesa Sanpaolo SpA (f) | | | 55,945 | | | | 105 | | |
Leonardo SpA | | | 1,685 | | | | 10 | | |
| | | Shares | | Value
(000) | |
Mediobanca Banca di Credito Finanziario SpA | | | 2,344 | | | $ | 18 | | |
Pirelli & C SpA (f) | | | 79,275 | | | | 340 | | |
Poste Italiane SpA | | | 2,151 | | | | 19 | | |
Prysmian SpA | | | 852 | | | | 25 | | |
Recordati SpA | | | 449 | | | | 23 | | |
Snam SpA | | | 9,450 | | | | 49 | | |
Telecom Italia SpA | | | 71,769 | | | | 29 | | |
Tenaris SA | | | 1,951 | | | | 10 | | |
Terna Rete Elettrica Nazionale SpA | | | 5,867 | | | | 41 | | |
UniCredit SpA (f) | | | 8,182 | | | | 68 | | |
UnipolSai Assicurazioni SpA | | | 4,062 | | | | 11 | | |
| | | | 2,011 | | |
Japan (1.8%) | |
Aisin Seiki Co., Ltd. | | | 2,726 | | | | 87 | | |
Bridgestone Corp. | | | 60,061 | | | | 1,899 | | |
Denso Corp. | | | 6,909 | | | | 303 | | |
Honda Motor Co., Ltd. | | | 25,588 | | | | 608 | | |
Isuzu Motors Ltd. | | | 9,145 | | | | 80 | | |
JTEKT Corp. | | | 2,820 | | | | 22 | | |
Koito Manufacturing Co., Ltd. | | | 1,752 | | | | 89 | | |
Mazda Motor Corp. | | | 8,756 | | | | 51 | | |
Mitsubishi Motors Corp. (f) | | | 8,756 | | | | 19 | | |
NGK Spark Plug Co., Ltd. | | | 2,336 | | | | 41 | | |
Nissan Motor Co., Ltd. (f) | | | 37,848 | | | | 134 | | |
Stanley Electric Co., Ltd. | | | 1,947 | | | | 56 | | |
Subaru Corp. | | | 9,729 | | | | 189 | | |
Sumitomo Electric Industries Ltd. | | | 11,676 | | | | 131 | | |
Sumitomo Rubber Industries Ltd. | | | 21,831 | | | | 203 | | |
Toyo Tire Corp. | | | 11,400 | | | | 185 | | |
Toyoda Gosei Co., Ltd. | | | 1,168 | | | | 27 | | |
Toyota Industries Corp. | | | 2,531 | | | | 160 | | |
Toyota Motor Corp. | | | 33,275 | | | | 2,208 | | |
Yamaha Motor Co., Ltd. | | | 4,378 | | | | 64 | | |
Yokohama Rubber Co., Ltd. (The) | | | 13,857 | | | | 197 | | |
| | | | 6,753 | | |
Netherlands (0.6%) | |
ABN Amro Bank N.V. CVA | | | 1,755 | | | | 15 | | |
Aegon N.V. | | | 7,272 | | | | 19 | | |
AerCap Holdings N.V. (f) | | | 600 | | | | 15 | | |
Akzo Nobel N.V. | | | 923 | | | | 93 | | |
Altice Europe N.V. (f) | | | 2,239 | | | | 11 | | |
ASML Holding N.V. | | | 1,629 | | | | 602 | | |
Basic-Fit N.V. (f) | | | 3,193 | | | | 76 | | |
Boskalis Westminster (f) | | | 373 | | | | 8 | | |
Coca-Cola European Partners PLC | | | 900 | | | | 35 | | |
Heineken Holding N.V. | | | 475 | | | | 37 | | |
Heineken N.V. | | | 1,070 | | | | 95 | | |
ING Groep N.V. (f) | | | 16,088 | | | | 115 | | |
Koninklijke Ahold Delhaize N.V. | | | 5,421 | | | | 160 | | |
Koninklijke DSM N.V. | | | 746 | | | | 123 | | |
Koninklijke KPN N.V. | | | 14,131 | | | | 33 | | |
Koninklijke Philips N.V. (f) | | | 3,947 | | | | 186 | | |
The accompanying notes are an integral part of the consolidated financial statements.
18
Morgan Stanley Institutional Fund Trust
Annual Report — September 30, 2020
Consolidated Portfolio of Investments (cont'd)
Global Strategist Portfolio
| | | Shares | | Value
(000) | |
Netherlands (cont'd) | |
Koninklijke Vopak N.V. | | | 288 | | | $ | 16 | | |
NN Group N.V. | | | 1,251 | | | | 47 | | |
Randstad N.V. (f) | | | 485 | | | | 25 | | |
Unilever N.V. | | | 6,720 | | | | 408 | | |
Wolters Kluwer N.V. | | | 1,242 | | | | 106 | | |
| | | | 2,225 | | |
New Zealand (0.1%) | |
Auckland International Airport Ltd. (f) | | | 8,426 | | | | 41 | | |
Contact Energy Ltd. | | | 6,107 | | | | 27 | | |
Fletcher Building Ltd. (f) | | | 5,762 | | | | 15 | | |
Mercury NZ Ltd. | | | 5,917 | | | | 20 | | |
Meridian Energy Ltd. | | | 10,965 | | | | 36 | | |
Ryman Healthcare Ltd. | | | 3,227 | | | | 30 | | |
Spark New Zealand Ltd. | | | 15,294 | | | | 48 | | |
| | | | 217 | | |
Norway (0.1%) | |
Akastor ASA (f) | | | 892 | | | | 1 | | |
Aker Carbon Capture AS (f) | | | 669 | | | | — | @ | |
Aker Offshore Wind Holding AS (f) | | | 669 | | | | — | @ | |
Aker Solutions ASA (f) | | | 892 | | | | 1 | | |
DNB ASA (f) | | | 4,504 | | | | 63 | | |
Equinor ASA | | | 5,009 | | | | 71 | | |
Kvaerner ASA (f) | | | 816 | | | | 1 | | |
Norsk Hydro ASA (f) | | | 5,242 | | | | 14 | | |
Orkla ASA | | | 3,898 | | | | 39 | | |
REC Silicon ASA (f) | | | 649 | | | | — | @ | |
Seadrill Ltd. (f) | | | 1 | | | | — | @ | |
Subsea 7 SA (f) | | | 1,189 | | | | 9 | | |
Telenor ASA | | | 6,190 | | | | 104 | | |
Yara International ASA | | | 776 | | | | 30 | | |
| | | | 333 | | |
Poland (0.0%) | |
Jeronimo Martins SGPS SA | | | 2,786 | | | | 45 | | |
Portugal (0.0%) | |
Galp Energia SGPS SA | | | 2,600 | | | | 24 | | |
Pharol SGPS SA (Registered) (f) | | | 11,120 | | | | 2 | | |
| | | | 26 | | |
South Africa (0.0%) | |
Nedbank Group Ltd. | | | 633 | | | | 4 | | |
Old Mutual Ltd. | | | 19,716 | | | | 12 | | |
| | | | 16 | | |
Spain (0.3%) | |
ACS Actividades de Construccion y Servicios SA | | | 1,049 | | | | 24 | | |
Aena SME SA (f) | | | 277 | | | | 38 | | |
Amadeus IT Group SA | | | 1,807 | | | | 100 | | |
Banco Bilbao Vizcaya Argentaria SA | | | 27,331 | | | | 76 | | |
Banco de Sabadell SA | | | 22,275 | | | | 8 | | |
Banco Santander SA (f) | | | 66,432 | | | | 124 | | |
Bankia SA | | | 4,118 | | | | 6 | | |
Bankinter SA | | | 2,774 | | | | 12 | | |
CaixaBank SA | | | 14,871 | | | | 32 | | |
| | | Shares | | Value
(000) | |
Enagas SA | | | 939 | | | $ | 22 | | |
Endesa SA | | | 1,308 | | | | 35 | | |
Ferrovial SA | | | 2,034 | | | | 49 | | |
Grifols SA | | | 1,228 | | | | 35 | | |
Iberdrola SA | | | 23,703 | | | | 292 | | |
Industria de Diseno Textil SA | | | 4,465 | | | | 123 | | |
International Consolidated Airlines Group SA | | | 2,565 | | | | 3 | | |
Mapfre SA | | | 4,445 | | | | 7 | | |
Melia Hotels International SA (f) | | | 14,735 | | | | 54 | | |
Naturgy Energy Group SA | | | 1,452 | | | | 29 | | |
Red Electrica Corp., SA | | | 1,793 | | | | 34 | | |
Repsol SA | | | 5,281 | | | | 36 | | |
Siemens Gamesa Renewable Energy SA | | | 1,000 | | | | 27 | | |
Telefonica SA | | | 18,669 | | | | 64 | | |
Telepizza Group SA (f) | | | 156 | | | | 1 | | |
| | | | 1,231 | | |
Sweden (0.5%) | |
Alfa Laval AB (f) | | | 1,371 | | | | 30 | | |
Assa Abloy AB, Class B | | | 4,670 | | | | 109 | | |
Atlas Copco AB, Class A | | | 3,100 | | | | 148 | | |
Atlas Copco AB, Class B | | | 1,804 | | | | 75 | | |
Boliden AB | | | 1,251 | | | | 37 | | |
Electrolux AB, Class B | | | 1,108 | | | | 26 | | |
Electrolux Professional AB (f) | | | 1,099 | | | | 4 | | |
Epiroc AB, Class A | | | 3,100 | | | | 45 | | |
Epiroc AB, Class B | | | 1,919 | | | | 27 | | |
Essity AB, Class B (f) | | | 2,848 | | | | 96 | | |
Getinge AB, Class B | | | 1,110 | | | | 24 | | |
Hennes & Mauritz AB, Class B | | | 4,306 | | | | 74 | | |
Hexagon AB, Class B (f) | | | 1,192 | | | | 90 | | |
Husqvarna AB, Class B | | | 1,961 | | | | 22 | | |
ICA Gruppen AB | | | 390 | | | | 20 | | |
Industrivarden AB, Class C (f) | | | 834 | | | | 22 | | |
Investor AB, Class B | | | 2,152 | | | | 141 | | |
Kinnevik AB | | | 1,152 | | | | 47 | | |
L E Lundbergforetagen AB, Class B (f) | | | 382 | | | | 19 | | |
Lundin Energy AB | | | 864 | | | | 17 | | |
Millicom International Cellular SA SDR | | | 327 | | | | 10 | | |
Modern Times Group MTG AB, Class B (f) | | | 44 | | | | 1 | | |
Nordic Entertainment Group AB, Class B (f) | | | 44 | | | | 2 | | |
Sandvik AB (f) | | | 5,141 | | | | 101 | | |
Securitas AB, Class B (f) | | | 1,445 | | | | 22 | | |
Skandinaviska Enskilda Banken AB, Class A (f) | | | 7,057 | | | | 63 | | |
Skanska AB, Class B (f) | | | 1,569 | | | | 33 | | |
| SKF AB, Class B | | | 1,759 | | | | 36 | | |
Svenska Handelsbanken AB, Class A (f) | | | 6,968 | | | | 58 | | |
Swedbank AB, Class A (f) | | | 4,171 | | | | 65 | | |
Swedish Match AB | | | 836 | | | | 68 | | |
Tele2 AB, Class B | | | 1,653 | | | | 23 | | |
Telefonaktiebolaget LM Ericsson, Class B | | | 14,612 | | | | 160 | | |
Telia Co., AB | | | 11,968 | | | | 49 | | |
Volvo AB, Class B (f) | | | 7,191 | | | | 138 | | |
| | | | 1,902 | | |
The accompanying notes are an integral part of the consolidated financial statements.
19
Morgan Stanley Institutional Fund Trust
Annual Report — September 30, 2020
Consolidated Portfolio of Investments (cont'd)
Global Strategist Portfolio
| | | Shares | | Value
(000) | |
Switzerland (1.7%) | |
ABB Ltd. (Registered) | | | 15,641 | | | $ | 398 | | |
Adecco Group AG (Registered) | | | 627 | | | | 33 | | |
Alcon, Inc. (f) | | | 1,967 | | | | 111 | | |
Cie Financiere Richemont SA (Registered) | | | 2,222 | | | | 149 | | |
Credit Suisse Group AG (Registered) | | | 7,378 | | | | 74 | | |
Geberit AG (Registered) | | | 375 | | | | 222 | | |
Givaudan SA (Registered) | | | 44 | | | | 190 | | |
Idorsia Ltd. (f) | | | 503 | | | | 13 | | |
Julius Baer Group Ltd. | | | 1,051 | | | | 45 | | |
Kuehne & Nagel International AG (Registered) | | | 337 | | | | 65 | | |
LafargeHolcim Ltd. (Registered) (f) (Euronext) | | | 1,910 | | | | 87 | | |
LafargeHolcim Ltd. (Registered) (f) (SIX) | | | 166 | | | | 8 | | |
Lonza Group AG (Registered) | | | 235 | | | | 145 | | |
Nestle SA (Registered) | | | 16,332 | | | | 1,944 | | |
Novartis AG (Registered) | | | 10,107 | | | | 877 | | |
Roche Holding AG (Genusschein) | | | 2,751 | | | | 942 | | |
SGS SA (Registered) | | | 26 | | | | 70 | | |
Siemens Energy AG (f) | | | 1,585 | | | | 43 | | |
Sonova Holding AG (Registered) (f) | | | 435 | | | | 110 | | |
Swatch Group AG (The) | | | 159 | | | | 37 | | |
Swiss Re AG | | | 615 | | | | 46 | | |
Swisscom AG (Registered) | | | 311 | | | | 165 | | |
Transocean Ltd. (f) | | | 1,913 | | | | 2 | | |
UBS Group AG (Registered) | | | 12,706 | | | | 142 | | |
Zurich Insurance Group AG | | | 1,085 | | | | 378 | | |
| | | | 6,296 | | |
United Kingdom (2.6%) | |
| 3i Group PLC | | | 4,619 | | | | 59 | | |
Admiral Group PLC | | | 956 | | | | 32 | | |
Anglo American PLC | | | 5,995 | | | | 145 | | |
Antofagasta PLC | | | 1,915 | | | | 25 | | |
Ashtead Group PLC | | | 2,395 | | | | 86 | | |
Associated British Foods PLC | | | 1,697 | | | | 41 | | |
AstraZeneca PLC | | | 5,702 | | | | 623 | | |
Auto Trader Group PLC | | | 4,887 | | | | 36 | | |
Aviva PLC | | | 19,475 | | | | 72 | | |
Babcock International Group PLC | | | 1,273 | | | | 4 | | |
BAE Systems PLC | | | 15,137 | | | | 94 | | |
Barclays PLC (f) | | | 76,403 | | | | 96 | | |
Barratt Developments PLC | | | 4,717 | | | | 29 | | |
Berkeley Group Holdings PLC | | | 608 | | | | 33 | | |
BHP Group PLC | | | 9,893 | | | | 211 | | |
| BP PLC | | | 87,860 | | | | 254 | | |
British American Tobacco PLC | | | 10,120 | | | | 363 | | |
British Land Co., PLC (The) REIT | | | 4,658 | | | | 20 | | |
BT Group PLC | | | 40,614 | | | | 51 | | |
Bunzl PLC | | | 1,590 | | | | 51 | | |
Burberry Group PLC | | | 2,099 | | | | 42 | | |
Capita PLC (f) | | | 3,863 | | | | 2 | | |
Carnival PLC | | | 906 | | | | 12 | | |
Centrica PLC | | | 25,312 | | | | 13 | | |
| | | Shares | | Value
(000) | |
Coca-Cola HBC AG (f) | | | 913 | | | $ | 23 | | |
Compass Group PLC | | | 7,054 | | | | 106 | | |
ConvaTec Group PLC | | | 6,675 | | | | 15 | | |
Croda International PLC | | | 608 | | | | 49 | | |
DCC PLC | | | 425 | | | | 33 | | |
Diageo PLC | | | 11,181 | | | | 384 | | |
Direct Line Insurance Group PLC | | | 6,389 | | | | 22 | | |
Dixons Carphone PLC | | | 5,049 | | | | 6 | | |
easyJet PLC | | | 789 | | | | 5 | | |
Experian PLC | | | 4,522 | | | | 170 | | |
Ferguson PLC | | | 1,176 | | | | 118 | | |
Fresnillo PLC | | | 1,140 | | | | 18 | | |
G4S PLC (f) | | | 6,550 | | | | 17 | | |
GlaxoSmithKline PLC | | | 22,079 | | | | 414 | | |
Glencore PLC (f) | | | 55,105 | | | | 114 | | |
Hammerson PLC REIT (f) | | | 793 | | | | — | @ | |
Hargreaves Lansdown PLC | | | 1,243 | | | | 25 | | |
Hikma Pharmaceuticals PLC | | | 684 | | | | 23 | | |
HSBC Holdings PLC | | | 90,206 | | | | 353 | | |
IMI PLC | | | 1,324 | | | | 18 | | |
Imperial Brands PLC | | | 4,161 | | | | 74 | | |
InterContinental Hotels Group PLC (f) | | | 10,109 | | | | 531 | | |
Intertek Group PLC | | | 781 | | | | 64 | | |
Intu Properties PLC REIT (f) | | | 5,299 | | | | — | @ | |
Investec PLC | | | 3,345 | | | | 6 | | |
ITV PLC | | | 17,090 | | | | 15 | | |
J Sainsbury PLC | | | 7,901 | | | | 20 | | |
Johnson Matthey PLC | | | 911 | | | | 28 | | |
Kingfisher PLC | | | 10,186 | | | | 39 | | |
Land Securities Group PLC REIT | | | 3,515 | | | | 24 | | |
Legal & General Group PLC | | | 28,615 | | | | 70 | | |
Lloyds Banking Group PLC (f) | | | 321,808 | | | | 109 | | |
London Stock Exchange Group PLC | | | 1,537 | | | | 176 | | |
M&G PLC | | | 11,531 | | | | 24 | | |
Marks & Spencer Group PLC | | | 8,120 | | | | 10 | | |
Mediclinic International PLC | | | 1,879 | | | | 7 | | |
Meggitt PLC | | | 3,776 | | | | 13 | | |
Melrose Industries PLC (f) | | | 17,615 | | | | 26 | | |
Micro Focus International PLC (f) | | | 1,468 | | | | 5 | | |
Mondi PLC | | | 1,740 | | | | 37 | | |
National Grid PLC | | | 15,212 | | | | 175 | | |
Next PLC | | | 680 | | | | 52 | | |
Ninety One PLC (f) | | | 1,672 | | | | 4 | | |
Paragon Offshore PLC (f)(h) | | | 303 | | | | — | | |
Pearson PLC | | | 3,983 | | | | 28 | | |
Persimmon PLC | | | 1,445 | | | | 46 | | |
Provident Financial PLC (f) | | | 917 | | | | 2 | | |
Prudential PLC | | | 11,586 | | | | 166 | | |
Quilter PLC | | | 7,967 | | | | 13 | | |
Reckitt Benckiser Group PLC | | | 3,018 | | | | 294 | | |
RELX PLC (Euronext N.V.) | | | 4,935 | | | | 110 | | |
RELX PLC (LSE) | | | 5,143 | | | | 115 | | |
Rio Tinto PLC | | | 19,351 | | | | 1,164 | | |
The accompanying notes are an integral part of the consolidated financial statements.
20
Morgan Stanley Institutional Fund Trust
Annual Report — September 30, 2020
Consolidated Portfolio of Investments (cont'd)
Global Strategist Portfolio
| | | Shares | | Value
(000) | |
United Kingdom (cont'd) | |
Rolls-Royce Holdings PLC | | | 7,917 | | | $ | 13 | | |
Royal Bank of Scotland Group PLC (f) | | | 17,032 | | | | 23 | | |
Royal Dutch Shell PLC, Class A | | | 20,099 | | | | 251 | | |
Royal Dutch Shell PLC, Class B | | | 16,836 | | | | 204 | | |
Royal Mail PLC | | | 4,551 | | | | 14 | | |
RSA Insurance Group PLC | | | 4,901 | | | | 29 | | |
Sage Group PLC (The) | | | 5,214 | | | | 49 | | |
Schroders PLC | | | 603 | | | | 21 | | |
Segro PLC REIT | | | 4,773 | | | | 57 | | |
Severn Trent PLC | | | 1,169 | | | | 37 | | |
Smith & Nephew PLC | | | 4,215 | | | | 83 | | |
Smiths Group PLC | | | 1,878 | | | | 33 | | |
SSE PLC | | | 4,827 | | | | 75 | | |
St. James's Place PLC | | | 2,509 | | | | 30 | | |
Standard Chartered PLC (f) | | | 15,915 | | | | 73 | | |
Standard Life Aberdeen PLC | | | 11,117 | | | | 32 | | |
Tate & Lyle PLC | | | 2,231 | | | | 19 | | |
Taylor Wimpey PLC | | | 15,388 | | | | 22 | | |
Tesco PLC | | | 40,719 | | | | 112 | | |
Travis Perkins PLC | | | 1,211 | | | | 17 | | |
TUI AG | | | 2,220 | | | | 8 | | |
Unilever PLC | | | 5,697 | | | | 351 | | |
United Utilities Group PLC | | | 3,244 | | | | 36 | | |
Vodafone Group PLC | | | 119,724 | | | | 159 | | |
Weir Group PLC (The) | | | 1,065 | | | | 17 | | |
Whitbread PLC (f) | | | 9,590 | | | | 262 | | |
Wm Morrison Supermarkets PLC | | | 10,067 | | | | 22 | | |
WPP PLC | | | 6,145 | | | | 48 | | |
| | | | 9,851 | | |
United States (28.5%) | |
3M Co. | | | 5,110 | | | | 819 | | |
Abbott Laboratories | | | 4,134 | | | | 450 | | |
AbbVie, Inc. | | | 4,194 | | | | 367 | | |
ABIOMED, Inc. (f) | | | 164 | | | | 45 | | |
Accenture PLC, Class A | | | 1,455 | | | | 329 | | |
Activision Blizzard, Inc. | | | 1,693 | | | | 137 | | |
Acuity Brands, Inc. | | | 238 | | | | 24 | | |
Adobe, Inc. (f) | | | 1,227 | | | | 602 | | |
Advance Auto Parts, Inc. | | | 249 | | | | 38 | | |
Advanced Micro Devices, Inc. (f) | | | 2,301 | | | | 189 | | |
AES Corp. | | | 2,045 | | | | 37 | | |
Affiliated Managers Group, Inc. | | | 283 | | | | 19 | | |
Aflac, Inc. | | | 1,834 | | | | 67 | | |
Agilent Technologies, Inc. | | | 817 | | | | 82 | | |
AGNC Investment Corp. REIT | | | 1,484 | | | | 21 | | |
Air Products & Chemicals, Inc. | | | 579 | | | | 172 | | |
Akamai Technologies, Inc. (f) | | | 476 | | | | 53 | | |
Albemarle Corp. | | | 264 | | | | 24 | | |
Alexandria Real Estate Equities, Inc. REIT | | | 197 | | | | 32 | | |
Alexion Pharmaceuticals, Inc. (f) | | | 496 | | | | 57 | | |
Align Technology, Inc. (f) | | | 170 | | | | 56 | | |
| | | Shares | | Value
(000) | |
Alkermes PLC (f) | | | 449 | | | $ | 7 | | |
Alleghany Corp. | | | 51 | | | | 27 | | |
Allegion PLC | | | 822 | | | | 81 | | |
Alliance Data Systems Corp. | | | 268 | | | | 11 | | |
Alliant Energy Corp. | | | 540 | | | | 28 | | |
Allstate Corp. (The) | | | 869 | | | | 82 | | |
Ally Financial, Inc. | | | 1,301 | | | | 33 | | |
Alnylam Pharmaceuticals, Inc. (f) | | | 243 | | | | 35 | | |
Alphabet, Inc., Class A (f) | | | 659 | | | | 966 | | |
Alphabet, Inc., Class C (f) | | | 813 | | | | 1,195 | | |
Altice USA, Inc., Class A (f) | | | 1,477 | | | | 38 | | |
Altria Group, Inc. | | | 4,325 | | | | 167 | | |
Amazon.com, Inc. (f) | | | 1,068 | | | | 3,363 | | |
Amcor PLC | | | 3,738 | | | | 41 | | |
AMERCO | | | 63 | | | | 22 | | |
Ameren Corp. | | | 569 | | | | 45 | | |
American Airlines Group, Inc. | | | 292 | | | | 4 | | |
American Electric Power Co., Inc. | | | 1,253 | | | | 102 | | |
American Express Co. | | | 1,633 | | | | 164 | | |
American Financial Group, Inc. | | | 267 | | | | 18 | | |
American International Group, Inc. | | | 2,047 | | | | 56 | | |
American Tower Corp. REIT | | | 1,064 | | | | 257 | | |
American Water Works Co., Inc. | | | 443 | | | | 64 | | |
Ameriprise Financial, Inc. | | | 278 | | | | 43 | | |
AmerisourceBergen Corp. | | | 458 | | | | 44 | | |
AMETEK, Inc. | | | 1,914 | | | | 190 | | |
Amgen, Inc. | | | 1,433 | | | | 364 | | |
Amphenol Corp., Class A | | | 640 | | | | 69 | | |
Analog Devices, Inc. | | | 987 | | | | 115 | | |
Annaly Capital Management, Inc. REIT | | | 4,134 | | | | 29 | | |
ANSYS, Inc. (f) | | | 196 | | | | 64 | | |
Anthem, Inc. | | | 584 | | | | 157 | | |
AO Smith Corp. | | | 1,315 | | | | 69 | | |
Aon PLC | | | 546 | | | | 113 | | |
Apache Corp. | | | 1,119 | | | | 11 | | |
Apple, Inc. | | | 43,128 | | | | 4,995 | | |
Applied Materials, Inc. | | | 2,190 | | | | 130 | | |
Aptiv PLC | | | 4,774 | | | | 438 | | |
Aramark | | | 768 | | | | 20 | | |
Arch Capital Group Ltd. (f) | | | 1,319 | | | | 39 | | |
Archer-Daniels-Midland Co. | | | 1,259 | | | | 59 | | |
Arconic Corp. (f) | | | 357 | | | | 7 | | |
Arista Networks, Inc. (f) | | | 185 | | | | 38 | | |
Arrow Electronics, Inc. (f) | | | 293 | | | | 23 | | |
Arthur J Gallagher & Co. | | | 550 | | | | 58 | | |
Assurant, Inc. | | | 217 | | | | 26 | | |
AT&T, Inc. | | | 16,732 | | | | 477 | | |
Athene Holding Ltd., Class A (f) | | | 470 | | | | 16 | | |
Atmos Energy Corp. | | | 215 | | | | 21 | | |
Autodesk, Inc. (f) | | | 579 | | | | 134 | | |
Autoliv, Inc. | | | 1,452 | | | | 106 | | |
Automatic Data Processing, Inc. | | | 1,047 | | | | 146 | | |
AutoZone, Inc. (f) | | | 87 | | | | 102 | | |
The accompanying notes are an integral part of the consolidated financial statements.
21
Morgan Stanley Institutional Fund Trust
Annual Report — September 30, 2020
Consolidated Portfolio of Investments (cont'd)
Global Strategist Portfolio
| | | Shares | | Value
(000) | |
United States (cont'd) | |
AvalonBay Communities, Inc. REIT | | | 389 | | | $ | 58 | | |
Avery Dennison Corp. | | | 202 | | | | 26 | | |
Axalta Coating Systems Ltd. (f) | | | 738 | | | | 16 | | |
Baker Hughes Co. | | | 1,508 | | | | 20 | | |
Ball Corp. | | | 841 | | | | 70 | | |
Bank of America Corp. | | | 21,264 | | | | 512 | | |
Bank of New York Mellon Corp. (The) | | | 2,049 | | | | 70 | | |
Baxter International, Inc. | | | 1,230 | | | | 99 | | |
Becton Dickinson & Co. | | | 559 | | | | 130 | | |
Berkshire Hathaway, Inc., Class B (f) | | | 2,908 | | | | 619 | | |
Best Buy Co., Inc. | | | 539 | | | | 60 | | |
Biogen, Inc. (f) | | | 493 | | | | 140 | | |
BioMarin Pharmaceutical, Inc. (f) | | | 528 | | | | 40 | | |
BlackRock, Inc. | | | 220 | | | | 124 | | |
Boeing Co. (The) | | | 4,663 | | | | 771 | | |
Booking Holdings, Inc. (f) | | | 158 | | | | 270 | | |
BorgWarner, Inc. | | | 3,728 | | | | 144 | | |
Boston Properties, Inc. REIT | | | 545 | | | | 44 | | |
Boston Scientific Corp. (f) | | | 3,263 | | | | 125 | | |
Brighthouse Financial, Inc. (f) | | | 268 | | | | 7 | | |
Bristol-Myers Squibb Co. | | | 5,422 | | | | 327 | | |
Broadcom, Inc. | | | 873 | | | | 318 | | |
Broadridge Financial Solutions, Inc. | | | 207 | | | | 27 | | |
Brown-Forman Corp., Class B | | | 787 | | | | 59 | | |
Bunge Ltd. | | | 493 | | | | 23 | | |
Burlington Stores, Inc. (f) | | | 232 | | | | 48 | | |
Cabot Oil & Gas Corp. | | | 1,385 | | | | 24 | | |
Cadence Design Systems, Inc. (f) | | | 600 | | | | 64 | | |
Camden Property Trust REIT | | | 341 | | | | 30 | | |
Campbell Soup Co. | | | 484 | | | | 23 | | |
Capital One Financial Corp. | | | 1,147 | | | | 82 | | |
Capri Holdings Ltd. (f) | | | 511 | | | | 9 | | |
Cardinal Health, Inc. | | | 654 | | | | 31 | | |
CarMax, Inc. (f) | | | 496 | | | | 46 | | |
Carnival Corp. | | | 1,368 | | | | 21 | | |
Carrier Global Corp. | | | 7,717 | | | | 236 | | |
Caterpillar, Inc. | | | 4,927 | | | | 735 | | |
Cboe Global Markets, Inc. | | | 291 | | | | 26 | | |
CBRE Group, Inc., Class A (f) | | | 1,032 | | | | 48 | | |
CDK Global, Inc. | | | 334 | | | | 15 | | |
CDW Corp. | | | 412 | | | | 49 | | |
Celanese Corp. | | | 241 | | | | 26 | | |
Centene Corp. (f) | | | 1,662 | | | | 97 | | |
CenterPoint Energy, Inc. | | | 1,575 | | | | 30 | | |
CenturyLink, Inc. | | | 2,906 | | | | 29 | | |
Cerner Corp. | | | 849 | | | | 61 | | |
CF Industries Holdings, Inc. | | | 766 | | | | 24 | | |
CH Robinson Worldwide, Inc. | | | 1,194 | | | | 122 | | |
Charles Schwab Corp. (The) | | | 2,768 | | | | 100 | | |
Charter Communications, Inc., Class A (f) | | | 453 | | | | 283 | | |
Chemours Co. (The) | | | 464 | | | | 10 | | |
Cheniere Energy, Inc. (f) | | | 512 | | | | 24 | | |
| | | Shares | | Value
(000) | |
Chevron Corp. | | | 4,373 | | | $ | 315 | | |
Chipotle Mexican Grill, Inc. (f) | | | 92 | | | | 114 | | |
Choice Hotels International, Inc. | | | 2,634 | | | | 226 | | |
Chubb Ltd. | | | 1,120 | | | | 130 | | |
Church & Dwight Co., Inc. | | | 567 | | | | 53 | | |
Cigna Corp. | | | 821 | | | | 139 | | |
Cimarex Energy Co. | | | 254 | | | | 6 | | |
Cincinnati Financial Corp. | | | 447 | | | | 35 | | |
Cintas Corp. | | | 790 | | | | 263 | | |
Cisco Systems, Inc. | | | 10,142 | | | | 399 | | |
CIT Group, Inc. | | | 277 | | | | 5 | | |
Citigroup, Inc. | | | 5,393 | | | | 232 | | |
Citizens Financial Group, Inc. | | | 1,348 | | | | 34 | | |
Citrix Systems, Inc. | | | 260 | | | | 36 | | |
Clorox Co. (The) | | | 246 | | | | 52 | | |
CME Group, Inc. | | | 964 | | | | 161 | | |
CMS Energy Corp. | | | 608 | | | | 37 | | |
Coca-Cola Co. (The) | | | 9,534 | | | | 471 | | |
Cognex Corp. | | | 495 | | | | 32 | | |
Cognizant Technology Solutions Corp., Class A | | | 1,326 | | | | 92 | | |
Colgate-Palmolive Co. | | | 1,880 | | | | 145 | | |
Comcast Corp., Class A | | | 10,430 | | | | 482 | | |
Comerica, Inc. | | | 532 | | | | 20 | | |
CommScope Holding Co., Inc. (f) | | | 568 | | | | 5 | | |
Conagra Brands, Inc. | | | 1,109 | | | | 40 | | |
Concho Resources, Inc. | | | 510 | | | | 23 | | |
ConocoPhillips | | | 2,586 | | | | 85 | | |
Consolidated Edison, Inc. | | | 841 | | | | 65 | | |
Constellation Brands, Inc., Class A | | | 482 | | | | 91 | | |
Continental Resources, Inc. | | | 331 | | | | 4 | | |
Cooper Cos., Inc. (The) | | | 177 | | | | 60 | | |
Cooper Tire & Rubber Co. | | | 3,800 | | | | 120 | | |
Copart, Inc. (f) | | | 1,882 | | | | 198 | | |
Corning, Inc. | | | 1,838 | | | | 60 | | |
Corteva, Inc. | | | 1,710 | | | | 49 | | |
CoStar Group, Inc. (f) | | | 452 | | | | 384 | | |
Costco Wholesale Corp. | | | 1,043 | | | | 370 | | |
Coty, Inc., Class A | | | 960 | | | | 3 | | |
Crown Castle International Corp. REIT | | | 1,081 | | | | 180 | | |
Crown Holdings, Inc. (f) | | | 378 | | | | 29 | | |
CSX Corp. | | | 6,637 | | | | 515 | | |
Cummins, Inc. | | | 1,390 | | | | 294 | | |
CVS Health Corp. | | | 2,939 | | | | 172 | | |
Danaher Corp. | | | 1,463 | | | | 315 | | |
Darden Restaurants, Inc. | | | 329 | | | | 33 | | |
DaVita, Inc. (f) | | | 335 | | | | 29 | | |
Deere & Co. | | | 2,594 | | | | 575 | | |
Dell Technologies, Inc., Class C (f) | | | 441 | | | | 30 | | |
Delta Air Lines, Inc. | | | 1,508 | | | | 46 | | |
DENTSPLY SIRONA, Inc. | | | 780 | | | | 34 | | |
Devon Energy Corp. | | | 1,335 | | | | 13 | | |
DexCom, Inc. (f) | | | 227 | | | | 94 | | |
Diamondback Energy, Inc. | | | 541 | | | | 16 | | |
The accompanying notes are an integral part of the consolidated financial statements.
22
Morgan Stanley Institutional Fund Trust
Annual Report — September 30, 2020
Consolidated Portfolio of Investments (cont'd)
Global Strategist Portfolio
| | | Shares | | Value
(000) | |
United States (cont'd) | |
Digital Realty Trust, Inc. REIT | | | 536 | | | $ | 79 | | |
Discover Financial Services | | | 855 | | | | 49 | | |
Discovery, Inc., Class A (f) | | | 441 | | | | 10 | | |
Discovery, Inc., Class C (f) | | | 1,144 | | | | 22 | | |
DISH Network Corp., Class A (f) | | | 705 | | | | 20 | | |
DocuSign, Inc. (f) | | | 164 | | | | 35 | | |
Dollar General Corp. | | | 523 | | | | 110 | | |
Dollar Tree, Inc. (f) | | | 536 | | | | 49 | | |
Dominion Energy, Inc. | | | 1,933 | | | | 153 | | |
Domino's Pizza, Inc. | | | 236 | | | | 100 | | |
Dover Corp. | | | 1,357 | | | | 147 | | |
Dow, Inc. | | | 1,705 | | | | 80 | | |
DR Horton, Inc. | | | 42,058 | | | | 3,181 | | |
Dropbox, Inc., Class A (f) | | | 571 | | | | 11 | | |
DTE Energy Co. | | | 446 | | | | 51 | | |
Duke Energy Corp. | | | 1,686 | | | | 149 | | |
Duke Realty Corp. REIT | | | 968 | | | | 36 | | |
DuPont de Nemours, Inc. | | | 1,674 | | | | 93 | | |
DXC Technology Co. | | | 728 | | | | 13 | | |
E*Trade Financial Corp. | | | 865 | | | | 43 | | |
Eagle Materials, Inc. | | | 1,057 | | | | 91 | | |
East West Bancorp, Inc. | | | 492 | | | | 16 | | |
Eastman Chemical Co. | | | 377 | | | | 29 | | |
Eaton Corp., PLC | | | 3,658 | | | | 373 | | |
Eaton Vance Corp. | | | 305 | | | | 12 | | |
eBay, Inc. | | | 2,047 | | | | 107 | | |
Ecolab, Inc. | | | 522 | | | | 104 | | |
Edison International | | | 849 | | | | 43 | | |
Edwards Lifesciences Corp. (f) | | | 1,844 | | | | 147 | | |
Elanco Animal Health, Inc. (f) | | | 780 | | | | 22 | | |
Electronic Arts, Inc. (f) | | | 663 | | | | 86 | | |
Eli Lilly & Co. | | | 2,154 | | | | 319 | | |
Emerson Electric Co. | | | 5,338 | | | | 350 | | |
Entergy Corp. | | | 471 | | | | 46 | | |
EOG Resources, Inc. | | | 1,348 | | | | 48 | | |
EPAM Systems, Inc. (f) | | | 192 | | | | 62 | | |
Equifax, Inc. | | | 1,006 | | | | 158 | | |
Equinix, Inc. REIT | | | 185 | | | | 141 | | |
Equitable Holdings, Inc. | | | 831 | | | | 15 | | |
Equity Lifestyle Properties, Inc. REIT | | | 470 | | | | 29 | | |
Equity Residential REIT | | | 1,006 | | | | 52 | | |
Erie Indemnity Co., Class A | | | 90 | | | | 19 | | |
ESC Seventy Seven (f)(h) | | | 275 | | | | — | | |
Essex Property Trust, Inc. REIT | | | 232 | | | | 47 | | |
Estee Lauder Cos., Inc. (The), Class A | | | 564 | | | | 123 | | |
Everest Re Group Ltd. | | | 243 | | | | 48 | | |
Evergy, Inc. | | | 600 | | | | 30 | | |
Eversource Energy | | | 825 | | | | 69 | | |
Exact Sciences Corp. (f) | | | 351 | | | | 36 | | |
Exelon Corp. | | | 2,235 | | | | 80 | | |
Expedia Group, Inc. | | | 325 | | | | 30 | | |
Expeditors International of Washington, Inc. | | | 1,531 | | | | 139 | | |
| | | Shares | | Value
(000) | |
Extended Stay America, Inc. (Units) (i) | | | 8,667 | | | $ | 104 | | |
Extra Space Storage, Inc. REIT | | | 249 | | | | 27 | | |
Exxon Mobil Corp. | | | 9,719 | | | | 334 | | |
F5 Networks, Inc. (f) | | | 206 | | | | 25 | | |
Facebook, Inc., Class A (f) | | | 5,617 | | | | 1,471 | | |
Factset Research Systems, Inc. | | | 235 | | | | 79 | | |
Fastenal Co. | | | 4,976 | | | | 224 | | |
Federal Realty Investment Trust REIT | | | 262 | | | | 19 | | |
FedEx Corp. | | | 2,126 | | | | 535 | | |
Fidelity National Financial, Inc. | | | 8,119 | | | | 254 | | |
Fidelity National Information Services, Inc. | | | 1,316 | | | | 194 | | |
Fifth Third Bancorp | | | 1,902 | | | | 41 | | |
First American Financial Corp. | | | 3,114 | | | | 159 | | |
First Republic Bank | | | 456 | | | | 50 | | |
FirstEnergy Corp. | | | 1,279 | | | | 37 | | |
Fiserv, Inc. (f) | | | 1,388 | | | | 143 | | |
FleetCor Technologies, Inc. (f) | | | 203 | | | | 48 | | |
Flex Ltd. (f) | | | 1,600 | | | | 18 | | |
FLIR Systems, Inc. | | | 370 | | | | 13 | | |
Flowserve Corp. | | | 355 | | | | 10 | | |
Fluor Corp. | | | 378 | | | | 3 | | |
FMC Corp. | | | 264 | | | | 28 | | |
Ford Motor Co. | | | 69,775 | | | | 465 | | |
Fortinet, Inc. (f) | | | 415 | | | | 49 | | |
Fortive Corp. | | | 2,598 | | | | 198 | | |
Fortune Brands Home & Security, Inc. | | | 1,324 | | | | 115 | | |
Fox Corp., Class A | | | 1,128 | | | | 31 | | |
Fox Corp., Class B (f) | | | 504 | | | | 14 | | |
Franklin Resources, Inc. | | | 866 | | | | 18 | | |
Freeport-McMoRan, Inc. | | | 3,192 | | | | 50 | | |
Gap, Inc. (The) | | | 778 | | | | 13 | | |
Garmin Ltd. | | | 264 | | | | 25 | | |
Gartner, Inc. (f) | | | 217 | | | | 27 | | |
General Dynamics Corp. | | | 2,134 | | | | 295 | | |
General Electric Co. | | | 75,774 | | | | 472 | | |
General Mills, Inc. | | | 1,301 | | | | 80 | | |
General Motors Co. | | | 22,925 | | | | 678 | | |
Genuine Parts Co. | | | 508 | | | | 48 | | |
Gilead Sciences, Inc. | | | 2,884 | | | | 182 | | |
Global Payments, Inc. | | | 644 | | | | 114 | | |
Globe Life, Inc. | | | 274 | | | | 22 | | |
GoDaddy, Inc., Class A (f) | | | 507 | | | | 39 | | |
Goldman Sachs Group, Inc. (The) | | | 864 | | | | 174 | | |
Goodyear Tire & Rubber Co. (The) | | | 16,600 | | | | 127 | | |
GrubHub, Inc. (f) | | | 308 | | | | 22 | | |
H&R Block, Inc. | | | 722 | | | | 12 | | |
Halliburton Co. | | | 2,560 | | | | 31 | | |
Hanesbrands, Inc. | | | 1,149 | | | | 18 | | |
Harley-Davidson, Inc. | | | 452 | | | | 11 | | |
Hartford Financial Services Group, Inc. (The) | | | 963 | | | | 35 | | |
Hasbro, Inc. | | | 317 | | | | 26 | | |
HCA Healthcare, Inc. | | | 556 | | | | 69 | | |
HD Supply Holdings, Inc. (f) | | | 1,527 | | | | 63 | | |
The accompanying notes are an integral part of the consolidated financial statements.
23
Morgan Stanley Institutional Fund Trust
Annual Report — September 30, 2020
Consolidated Portfolio of Investments (cont'd)
Global Strategist Portfolio
| | | Shares | | Value
(000) | |
United States (cont'd) | |
Healthpeak Properties, Inc. REIT | | | 1,491 | | | $ | 40 | | |
HEICO Corp. | | | 494 | | | | 52 | | |
HEICO Corp., Class A | | | 698 | | | | 62 | | |
Helmerich & Payne, Inc. | | | 278 | | | | 4 | | |
Henry Schein, Inc. (f) | | | 520 | | | | 31 | | |
Hershey Co. (The) | | | 422 | | | | 60 | | |
Hess Corp. | | | 551 | | | | 23 | | |
Hewlett Packard Enterprise Co. | | | 3,956 | | | | 37 | | |
Hilton Worldwide Holdings, Inc. | | | 15,279 | | | | 1,304 | | |
HollyFrontier Corp. | | | 465 | | | | 9 | | |
Hologic, Inc. (f) | | | 543 | | | | 36 | | |
Home Depot, Inc. (The) | | | 2,632 | | | | 731 | | |
Honeywell International, Inc. | | | 6,193 | | | | 1,019 | | |
Hormel Foods Corp. | | | 643 | | | | 31 | | |
Host Hotels & Resorts, Inc. REIT | | | 2,194 | | | | 24 | | |
Howmet Aerospace, Inc. | | | 3,864 | | | | 65 | | |
HP, Inc. | | | 3,524 | | | | 67 | | |
Humana, Inc. | | | 264 | | | | 109 | | |
Huntington Bancshares, Inc. | | | 3,152 | | | | 29 | | |
Huntington Ingalls Industries, Inc. | | | 474 | | | | 67 | | |
Hyatt Hotels Corp., Class A | | | 6,219 | | | | 332 | | |
IAC/InterActiveCorp (f) | | | 174 | | | | 21 | | |
IDEX Corp. | | | 606 | | | | 111 | | |
IDEXX Laboratories, Inc. (f) | | | 205 | | | | 81 | | |
IHS Markit Ltd. | | | 3,231 | | | | 254 | | |
Illinois Tool Works, Inc. | | | 2,829 | | | | 547 | | |
Illumina, Inc. (f) | | | 517 | | | | 160 | | |
Incyte Corp. (f) | | | 550 | | | | 49 | | |
Ingersoll Rand, Inc. (f) | | | 2,854 | | | | 102 | | |
Ingredion, Inc. | | | 334 | | | | 25 | | |
Intel Corp. | | | 10,277 | | | | 532 | | |
Intercontinental Exchange, Inc. | | | 1,310 | | | | 131 | | |
International Business Machines Corp. | | | 2,121 | | | | 258 | | |
International Flavors & Fragrances, Inc. | | | 256 | | | | 31 | | |
International Paper Co. | | | 830 | | | | 34 | | |
Interpublic Group of Cos., Inc. (The) | | | 1,136 | | | | 19 | | |
Intuit, Inc. | | | 609 | | | | 199 | | |
Intuitive Surgical, Inc. (f) | | | 211 | | | | 150 | | |
Invesco Ltd. | | | 1,270 | | | | 14 | | |
Invitation Homes, Inc. REIT | | | 1,368 | | | | 38 | | |
Ionis Pharmaceuticals, Inc. (f) | | | 364 | | | | 17 | | |
IPG Photonics Corp. (f) | | | 229 | | | | 39 | | |
IQVIA Holdings, Inc. (f) | | | 498 | | | | 78 | | |
Iron Mountain, Inc. REIT | | | 797 | | | | 21 | | |
Jack Henry & Associates, Inc. | | | 170 | | | | 28 | | |
Jacobs Engineering Group, Inc. | | | 1,204 | | | | 112 | | |
Jazz Pharmaceuticals PLC (f) | | | 207 | | | | 30 | | |
JB Hunt Transport Services, Inc. | | | 759 | | | | 96 | | |
Jefferies Financial Group, Inc. | | | 788 | | | | 14 | | |
JM Smucker Co. (The) | | | 202 | | | | 23 | | |
Johnson & Johnson | | | 6,215 | | | | 925 | | |
Johnson Controls International PLC | | | 6,802 | | | | 278 | | |
| | | Shares | | Value
(000) | |
Jones Lang LaSalle, Inc. | | | 179 | | | $ | 17 | | |
JPMorgan Chase & Co. | | | 7,716 | | | | 743 | | |
Juniper Networks, Inc. | | | 1,112 | | | | 24 | | |
Kansas City Southern | | | 856 | | | | 155 | | |
KB Home | | | 10,455 | | | | 401 | | |
Kellogg Co. | | | 601 | | | | 39 | | |
KeyCorp | | | 2,947 | | | | 35 | | |
Keysight Technologies, Inc. (f) | | | 459 | | | | 45 | | |
Kimberly-Clark Corp. | | | 809 | | | | 119 | | |
Kimco Realty Corp. REIT | | | 1,385 | | | | 16 | | |
Kinder Morgan, Inc. | | | 4,644 | | | | 57 | | |
KKR & Co., Inc., Class A | | | 1,199 | | | | 41 | | |
KLA Corp. | | | 468 | | | | 91 | | |
Knight-Swift Transportation Holdings, Inc. | | | 1,142 | | | | 46 | | |
Kohl's Corp. | | | 471 | | | | 9 | | |
Kraft Heinz Co. (The) | | | 1,555 | | | | 47 | | |
Kroger Co. (The) | | | 1,880 | | | | 64 | | |
L Brands, Inc. | | | 701 | | | | 22 | | |
L3Harris Technologies, Inc. | | | 1,968 | | | | 334 | | |
Laboratory Corp. of America Holdings (f) | | | 247 | | | | 47 | | |
Lam Research Corp. | | | 426 | | | | 141 | | |
Lamb Weston Holdings, Inc. | | | 520 | | | | 34 | | |
Las Vegas Sands Corp. | | | 825 | | | | 38 | | |
Lear Corp. | | | 1,176 | | | | 128 | | |
Leggett & Platt, Inc. | | | 352 | | | | 14 | | |
Leidos Holdings, Inc. | | | 490 | | | | 44 | | |
Lennar Corp., Class A | | | 34,748 | | | | 2,838 | | |
Lennox International, Inc. | | | 435 | | | | 119 | | |
Liberty Broadband Corp., Class C (f) | | | 176 | | | | 25 | | |
Liberty Global PLC, Class A (f) | | | 543 | | | | 11 | | |
Liberty Global PLC Series C (f) | | | 1,349 | | | | 28 | | |
Liberty Media Corp-Liberty SiriusXM, Class A (f) | | | 305 | | | | 10 | | |
Liberty Media Corp-Liberty SiriusXM, Class C (f) | | | 490 | | | | 16 | | |
Liberty Media Corp.-Liberty Formula One,
Class C (f) | | | 713 | | | | 26 | | |
Lincoln National Corp. | | | 717 | | | | 22 | | |
Linde PLC | | | 1,335 | | | | 318 | | |
Live Nation Entertainment, Inc. (f) | | | 521 | | | | 28 | | |
LKQ Corp. (f) | | | 988 | | | | 27 | | |
Lockheed Martin Corp. | | | 2,196 | | | | 842 | | |
Loews Corp. | | | 788 | | | | 27 | | |
Louisiana-Pacific Corp. | | | 3,078 | | | | 91 | | |
Lowe's Cos., Inc. | | | 1,866 | | | | 309 | | |
Lululemon Athletica, Inc. (f) | | | 185 | | | | 61 | | |
LyondellBasell Industries N.V., Class A | | | 632 | | | | 45 | | |
M&T Bank Corp. | | | 261 | | | | 24 | | |
M/I Homes, Inc. (f) | | | 3,281 | | | | 151 | | |
Macerich Co. (The) REIT | | | 313 | | | | 2 | | |
Macy's, Inc. | | | 848 | | | | 5 | | |
ManpowerGroup, Inc. | | | 307 | | | | 23 | | |
Marathon Oil Corp. | | | 2,355 | | | | 10 | | |
Marathon Petroleum Corp. | | | 1,560 | | | | 46 | | |
Markel Corp. (f) | | | 39 | | | | 38 | | |
The accompanying notes are an integral part of the consolidated financial statements.
24
Morgan Stanley Institutional Fund Trust
Annual Report — September 30, 2020
Consolidated Portfolio of Investments (cont'd)
Global Strategist Portfolio
| | | Shares | | Value
(000) | |
United States (cont'd) | |
MarketAxess Holdings, Inc. | | | 232 | | | $ | 112 | | |
Marriott International, Inc., Class A | | | 18,263 | | | | 1,691 | | |
Marriott Vacations Worldwide Corp. | | | 2,040 | | | | 185 | | |
Marsh & McLennan Cos., Inc. | | | 1,274 | | | | 146 | | |
Martin Marietta Materials, Inc. | | | 1,945 | | | | 458 | | |
Marvell Technology Group Ltd. | | | 1,389 | | | | 55 | | |
Masco Corp. | | | 9,738 | | | | 537 | | |
Mastercard, Inc., Class A | | | 2,238 | | | | 757 | | |
Match Group, Inc. (f) | | | 491 | | | | 54 | | |
Maxim Integrated Products, Inc. | | | 560 | | | | 38 | | |
McCormick & Co., Inc. | | | 232 | | | | 45 | | |
McDonald's Corp. | | | 1,716 | | | | 377 | | |
McKesson Corp. | | | 467 | | | | 70 | | |
MDC Holdings, Inc. | | | 6,968 | | | | 328 | | |
Medtronic PLC | | | 3,165 | | | | 329 | | |
MercadoLibre, Inc. (f) | | | 252 | | | | 273 | | |
Merck & Co., Inc. | | | 5,959 | | | | 494 | | |
Meritage Homes Corp. (f) | | | 4,219 | | | | 466 | | |
MetLife, Inc. | | | 1,860 | | | | 69 | | |
Mettler-Toledo International, Inc. (f) | | | 89 | | | | 86 | | |
MGIC Investment Corp. | | | 9,571 | | | | 85 | | |
MGM Resorts International | | | 1,497 | | | | 33 | | |
Microchip Technology, Inc. | | | 526 | | | | 54 | | |
Micron Technology, Inc. (f) | | | 2,597 | | | | 122 | | |
Microsoft Corp. | | | 16,844 | | | | 3,543 | | |
Mid-America Apartment Communities, Inc. REIT | | | 205 | | | | 24 | | |
Middleby Corp. (The) (f) | | | 195 | | | | 17 | | |
Mohawk Industries, Inc. (f) | | | 2,141 | | | | 209 | | |
Molson Coors Brewing Co., Class B | | | 567 | | | | 19 | | |
Mondelez International, Inc., Class A | | | 3,207 | | | | 184 | | |
MongoDB, Inc. (f) | | | 216 | | | | 50 | | |
Monster Beverage Corp. (f) | | | 1,039 | | | | 83 | | |
Moody's Corp. | | | 504 | | | | 146 | | |
Mosaic Co. (The) | | | 1,262 | | | | 23 | | |
Motorola Solutions, Inc. | | | 476 | | | | 75 | | |
MSCI, Inc. | | | 197 | | | | 70 | | |
Mylan N.V. (f) | | | 1,492 | | | | 22 | | |
Nasdaq, Inc. | | | 208 | | | | 26 | | |
National Oilwell Varco, Inc. | | | 1,144 | | | | 10 | | |
National Retail Properties, Inc. REIT | | | 471 | | | | 16 | | |
Nektar Therapeutics (f) | | | 510 | | | | 8 | | |
NetApp, Inc. | | | 767 | | | | 34 | | |
Netflix, Inc. (f) | | | 1,063 | | | | 532 | | |
Newell Brands, Inc. | | | 1,337 | | | | 23 | | |
Newmont Corp. | | | 1,884 | | | | 120 | | |
News Corp., Class A | | | 1,155 | | | | 16 | | |
NextEra Energy, Inc. | | | 1,206 | | | | 335 | | |
Nielsen Holdings PLC | | | 3,506 | | | | 50 | | |
NIKE, Inc., Class B | | | 2,936 | | | | 369 | | |
NiSource, Inc. | | | 1,126 | | | | 25 | | |
Noble Energy, Inc. | | | 1,470 | | | | 13 | | |
Nordson Corp. | | | 372 | | | | 71 | | |
| | | Shares | | Value
(000) | |
Nordstrom, Inc. | | | 302 | | | $ | 4 | | |
Norfolk Southern Corp. | | | 2,145 | | | | 459 | | |
Northern Trust Corp. | | | 532 | | | | 41 | | |
Northrop Grumman Corp. | | | 1,470 | | | | 464 | | |
NortonLifeLock, Inc. | | | 1,848 | | | | 39 | | |
Norwegian Cruise Line Holdings Ltd. (f) | | | 763 | | | | 13 | | |
NRG Energy, Inc. | | | 790 | | | | 24 | | |
Nucor Corp. | | | 856 | | | | 38 | | |
NVIDIA Corp. | | | 1,308 | | | �� | 708 | | |
NVR, Inc. (f) | | | 449 | | | | 1,833 | | |
NXP Semiconductors N.V. | | | 1,400 | | | | 175 | | |
O'Reilly Automotive, Inc. (f) | | | 171 | | | | 79 | | |
Occidental Petroleum Corp. | | | 2,563 | | | | 26 | | |
OGE Energy Corp. | | | 706 | | | | 21 | | |
Okta, Inc. (f) | | | 167 | | | | 36 | | |
Old Dominion Freight Line, Inc. | | | 981 | | | | 177 | | |
Omnicom Group, Inc. | | | 583 | | | | 29 | | |
ON Semiconductor Corp. (f) | | | 1,315 | | | | 29 | | |
ONEOK, Inc. | | | 1,349 | | | | 35 | | |
Oracle Corp. | | | 5,849 | | | | 349 | | |
Otis Worldwide Corp. | | | 3,858 | | | | 241 | | |
Ovintiv, Inc. | | | 909 | | | | 7 | | |
Owens Corning | | | 3,787 | | | | 261 | | |
PACCAR, Inc. | | | 2,991 | | | | 255 | | |
Packaging Corp. of America | | | 332 | | | | 36 | | |
Palo Alto Networks, Inc. (f) | | | 233 | | | | 57 | | |
Parker Hannifin Corp. | | | 1,043 | | | | 211 | | |
Parsley Energy, Inc., Class A | | | 795 | | | | 7 | | |
Paychex, Inc. | | | 840 | | | | 67 | | |
Paycom Software, Inc. (f) | | | 176 | | | | 55 | | |
PayPal Holdings, Inc. (f) | | | 2,565 | | | | 505 | | |
Pentair PLC | | | 1,495 | | | | 68 | | |
People's United Financial, Inc. | | | 1,279 | | | | 13 | | |
PepsiCo, Inc. | | | 3,280 | | | | 455 | | |
PerkinElmer, Inc. | | | 196 | | | | 25 | | |
Perrigo Co., PLC | | | 349 | | | | 16 | | |
Pfizer, Inc. | | | 13,122 | | | | 482 | | |
Philip Morris International, Inc. | | | 3,668 | | | | 275 | | |
Phillips 66 | | | 1,097 | | | | 57 | | |
Pinnacle West Capital Corp. | | | 300 | | | | 22 | | |
Pioneer Natural Resources Co. | | | 496 | | | | 43 | | |
Plains GP Holdings LP, Class A (f) | | | 437 | | | | 3 | | |
PNC Financial Services Group, Inc. (The) | | | 1,051 | | | | 116 | | |
Polaris, Inc. | | | 199 | | | | 19 | | |
PPG Industries, Inc. | | | 521 | | | | 64 | | |
PPL Corp. | | | 1,665 | | | | 45 | | |
Principal Financial Group, Inc. | | | 773 | | | | 31 | | |
Procter & Gamble Co. (The) | | | 5,819 | | | | 809 | | |
Progressive Corp. (The) | | | 1,365 | | | | 129 | | |
ProLogis, Inc. REIT | | | 1,698 | | | | 171 | | |
Prudential Financial, Inc. | | | 1,033 | | | | 66 | | |
PTC, Inc. (f) | | | 299 | | | | 25 | | |
Public Service Enterprise Group, Inc. | | | 1,287 | | | | 71 | | |
The accompanying notes are an integral part of the consolidated financial statements.
25
Morgan Stanley Institutional Fund Trust
Annual Report — September 30, 2020
Consolidated Portfolio of Investments (cont'd)
Global Strategist Portfolio
| | | Shares | | Value
(000) | |
United States (cont'd) | |
Public Storage REIT | | | 454 | | | $ | 101 | | |
Pulte Group, Inc. | | | 30,126 | | | | 1,395 | | |
PVH Corp. | | | 262 | | | | 16 | | |
Qorvo, Inc. (f) | | | 230 | | | | 30 | | |
QUALCOMM, Inc. | | | 2,727 | | | | 321 | | |
Quest Diagnostics, Inc. | | | 275 | | | | 31 | | |
Qurate Retail, Inc. | | | 1,288 | | | | 9 | | |
Ralph Lauren Corp. | | | 282 | | | | 19 | | |
Raymond James Financial, Inc. | | | 345 | | | | 25 | | |
Raytheon Technologies Corp. | | | 12,999 | | | | 748 | | |
Realty Income Corp. REIT | | | 772 | | | | 47 | | |
Regency Centers Corp. REIT | | | 490 | | | | 19 | | |
Regeneron Pharmaceuticals, Inc. (f) | | | 185 | | | | 104 | | |
Regions Financial Corp. | | | 2,972 | | | | 34 | | |
Reinsurance Group of America, Inc. | | | 320 | | | | 30 | | |
RenaissanceRe Holdings Ltd. | | | 250 | | | | 42 | | |
Republic Services, Inc. | | | 1,904 | | | | 178 | | |
ResMed, Inc. | | | 409 | | | | 70 | | |
Robert Half International, Inc. | | | 1,072 | | | | 57 | | |
Rockwell Automation, Inc. | | | 974 | | | | 215 | | |
Rollins, Inc. | | | 1,482 | | | | 80 | | |
Roper Technologies, Inc. | | | 798 | | | | 315 | | |
Ross Stores, Inc. | | | 975 | | | | 91 | | |
Royal Caribbean Cruises Ltd. | | | 530 | | | | 34 | | |
S&P Global, Inc. | | | 577 | | | | 208 | | |
Sabre Corp. | | | 766 | | | | 5 | | |
salesforce.com, Inc. (f) | | | 1,907 | | | | 479 | | |
SBA Communications Corp. REIT | | | 198 | | | | 63 | | |
Schlumberger Ltd. | | | 3,173 | | | | 49 | | |
Scotts Miracle-Gro Co. (The), Class A | | | 1,559 | | | | 238 | | |
Seagate Technology PLC | | | 777 | | | | 38 | | |
Sealed Air Corp. | | | 448 | | | | 17 | | |
Seattle Genetics, Inc. (f) | | | 202 | | | | 40 | | |
SEI Investments Co. | | | 358 | | | | 18 | | |
Sempra Energy | | | 570 | | | | 67 | | |
Sensata Technologies Holding PLC (f) | | | 1,468 | | | | 63 | | |
ServiceNow, Inc. (f) | | | 546 | | | | 265 | | |
Sherwin-Williams Co. (The) | | | 191 | | | | 133 | | |
Signature Bank | | | 247 | | | | 20 | | |
Simon Property Group, Inc. REIT | | | 787 | | | | 51 | | |
Sirius XM Holdings, Inc. | | | 4,812 | | | | 26 | | |
Skyline Champion Corp. (f) | | | 1,565 | | | | 42 | | |
Skyworks Solutions, Inc. | | | 507 | | | | 74 | | |
SL Green Realty Corp. REIT | | | 295 | | | | 14 | | |
Snap, Inc., Class A (f) | | | 1,877 | | | | 49 | | |
Snap-On, Inc. | | | 554 | | | | 82 | | |
Southern Co. (The) | | | 2,484 | | | | 135 | | |
Southwest Airlines Co. | | | 1,338 | | | | 50 | | |
Spectrum Brands Holdings, Inc. | | | 14 | | | | 1 | | |
Spirit AeroSystems Holdings, Inc., Class A | | | 270 | | | | 5 | | |
Splunk, Inc. (f) | | | 427 | | | | 80 | | |
Square, Inc., Class A (f) | | | 818 | | | | 133 | | |
| | | Shares | | Value
(000) | |
SS&C Technologies Holdings, Inc. | | | 496 | | | $ | 30 | | |
Stanley Black & Decker, Inc. | | | 1,410 | | | | 229 | | |
Starbucks Corp. | | | 2,890 | | | | 248 | | |
State Street Corp. | | | 825 | | | | 49 | | |
Steel Dynamics, Inc. | | | 773 | | | | 22 | | |
STERIS PLC | | | 203 | | | | 36 | | |
Stewart Information Services Corp. | | | 636 | | | | 28 | | |
Stryker Corp. | | | 897 | | | | 187 | | |
Sun Communities, Inc. REIT | | | 206 | | | | 29 | | |
SVB Financial Group (f) | | | 239 | | | | 58 | | |
Synchrony Financial | | | 1,850 | | | | 48 | | |
Synopsys, Inc. (f) | | | 430 | | | | 92 | | |
Sysco Corp. | | | 1,109 | | | | 69 | | |
T Rowe Price Group, Inc. | | | 533 | | | | 68 | | |
T-Mobile US, Inc. (f) | | | 1,047 | | | | 120 | | |
Take-Two Interactive Software, Inc. (f) | | | 199 | | | | 33 | | |
Tapestry, Inc. | | | 793 | | | | 12 | | |
Targa Resources Corp. | | | 703 | | | | 10 | | |
Target Corp. | | | 1,194 | | | | 188 | | |
TD Ameritrade Holding Corp. | | | 793 | | | | 31 | | |
TE Connectivity Ltd. | | | 877 | | | | 86 | | |
TechnipFMC PLC | | | 1,303 | | | | 8 | | |
Teledyne Technologies, Inc. (f) | | | 216 | | | | 67 | | |
Teleflex, Inc. | | | 163 | | | | 55 | | |
Tesla, Inc. (f) | | | 1,145 | | | | 491 | | |
Texas Instruments, Inc. | | | 2,190 | | | | 313 | | |
Textron, Inc. | | | 2,130 | | | | 77 | | |
Thermo Fisher Scientific, Inc. | | | 1,039 | | | | 459 | | |
Tiffany & Co. | | | 184 | | | | 21 | | |
TJX Cos., Inc. (The) | | | 2,906 | | | | 162 | | |
Toll Brothers, Inc. | | | 13,700 | | | | 667 | | |
Tractor Supply Co. | | | 218 | | | | 31 | | |
Trane Technologies PLC | | | 2,090 | | | | 253 | | |
TransDigm Group, Inc. | | | 526 | | | | 250 | | |
TransUnion | | | 1,749 | | | | 147 | | |
Travelers Cos., Inc. (The) | | | 530 | | | | 57 | | |
Trimble, Inc. (f) | | | 579 | | | | 28 | | |
TripAdvisor, Inc. | | | 281 | | | | 6 | | |
Truist Financial Corp. | | | 3,002 | | | | 114 | | |
Twilio, Inc., Class A (f) | | | 200 | | | | 49 | | |
Twitter, Inc. (f) | | | 1,662 | | | | 74 | | |
Tyson Foods, Inc., Class A | | | 648 | | | | 39 | | |
Uber Technologies, Inc. (f) | | | 6,645 | | | | 242 | | |
UDR, Inc. REIT | | | 774 | | | | 25 | | |
UFP Industries, Inc. | | | 1,586 | | | | 90 | | |
UGI Corp. | | | 519 | | | | 17 | | |
Ulta Beauty, Inc. (f) | | | 197 | | | | 44 | | |
Under Armour, Inc., Class A (f) | | | 545 | | | | 6 | | |
Under Armour, Inc., Class C (f) | | | 559 | | | | 5 | | |
Union Pacific Corp. | | | 6,007 | | | | 1,183 | | |
United Airlines Holdings, Inc. (f) | | | 332 | | | | 12 | | |
United Parcel Service, Inc., Class B | | | 6,017 | | | | 1,003 | | |
United Rentals, Inc. (f) | | | 606 | | | | 106 | | |
The accompanying notes are an integral part of the consolidated financial statements.
26
Morgan Stanley Institutional Fund Trust
Annual Report — September 30, 2020
Consolidated Portfolio of Investments (cont'd)
Global Strategist Portfolio
| | | Shares | | Value
(000) | |
United States (cont'd) | |
UnitedHealth Group, Inc. | | | 2,225 | | | $ | 694 | | |
Universal Health Services, Inc., Class B | | | 192 | | | | 21 | | |
Unum Group | | | 748 | | | | 13 | | |
US Bancorp | | | 3,538 | | | | 127 | | |
Vail Resorts, Inc. | | | 241 | | | | 52 | | |
Valero Energy Corp. | | | 962 | | | | 42 | | |
Varian Medical Systems, Inc. (f) | | | 219 | | | | 38 | | |
Veeva Systems, Inc., Class A (f) | | | 245 | | | | 69 | | |
Ventas, Inc. REIT | | | 963 | | | | 40 | | |
VEREIT, Inc. REIT | | | 2,918 | | | | 19 | | |
VeriSign, Inc. (f) | | | 182 | | | | 37 | | |
Verisk Analytics, Inc. | | | 1,437 | | | | 266 | | |
Verizon Communications, Inc. | | | 9,531 | | | | 567 | | |
Vertex Pharmaceuticals, Inc. (f) | | | 606 | | | | 165 | | |
VF Corp. | | | 872 | | | | 61 | | |
ViacomCBS, Inc., Class B | | | 1,402 | | | | 39 | | |
Visa, Inc., Class A | | | 4,131 | | | | 826 | | |
Vistra Energy Corp. | | | 1,275 | | | | 24 | | |
VMware, Inc., Class A (f) | | | 194 | | | | 28 | | |
Vornado Realty Trust REIT | | | 505 | | | | 17 | | |
Voya Financial, Inc. | | | 512 | | | | 25 | | |
Vulcan Materials Co. | | | 4,075 | | | | 552 | | |
Walgreens Boots Alliance, Inc. | | | 1,920 | | | | 69 | | |
Walmart, Inc. | | | 3,203 | | | | 448 | | |
Walt Disney Co. (The) | | | 4,089 | | | | 507 | | |
Waste Connections, Inc. | | | 2,261 | | | | 235 | | |
Waste Management, Inc. | | | 3,831 | | | | 434 | | |
Waters Corp. (f) | | | 252 | | | | 49 | | |
Watsco, Inc. | | | 1,058 | | | | 246 | | |
Wayfair, Inc., Class A (f) | | | 214 | | | | 62 | | |
WEC Energy Group, Inc. | | | 820 | | | | 79 | | |
Wells Fargo & Co. | | | 10,017 | | | | 235 | | |
Welltower, Inc. REIT | | | 970 | | | | 53 | | |
Western Digital Corp. | | | 813 | | | | 30 | | |
Western Union Co. (The) | | | 1,332 | | | | 29 | | |
Westinghouse Air Brake Technologies Corp. | | | 1,622 | | | | 100 | | |
Westlake Chemical Corp. | | | 232 | | | | 15 | | |
WestRock Co. | | | 786 | | | | 27 | | |
Weyerhaeuser Co. REIT | | | 1,846 | | | | 53 | | |
Whirlpool Corp. | | | 219 | | | | 40 | | |
Williams Cos., Inc. (The) | | | 2,736 | | | | 54 | | |
Willis Towers Watson PLC | | | 257 | | | | 54 | | |
Workday, Inc., Class A (f) | | | 438 | | | | 94 | | |
WP Carey, Inc. REIT | | | 486 | | | | 32 | | |
WR Berkley Corp. | | | 519 | | | | 32 | | |
WW Grainger, Inc. | | | 407 | | | | 145 | | |
Wyndham Hotels & Resorts, Inc. | | | 4,039 | | | | 204 | | |
Wynn Resorts Ltd. | | | 338 | | | | 24 | | |
Xcel Energy, Inc. | | | 1,325 | | | | 91 | | |
Xerox Holdings Corp. | | | 721 | | | | 14 | | |
Xilinx, Inc. | | | 585 | | | | 61 | | |
XPO Logistics, Inc. (f) | | | 854 | | | | 72 | | |
| | | Shares | | Value
(000) | |
Xylem, Inc. | | | 1,696 | | | $ | 143 | | |
Yum! Brands, Inc. | | | 787 | | | | 72 | | |
Zebra Technologies Corp., Class A (f) | | | 186 | | | | 47 | | |
Zillow Group, Inc., Class C (f) | | | 339 | | | | 34 | | |
Zimmer Biomet Holdings, Inc. | | | 520 | | | | 71 | | |
Zions Bancorp NA | | | 502 | | | | 15 | | |
Zoetis, Inc. | | | 1,104 | | | | 183 | | |
| | | | 107,783 | | |
Total Common Stocks (Cost $134,372) | | | 172,528 | | |
Preferred Stock (0.0%) | |
United States (0.0%) | |
| Qurate Retail, Inc. (f) (Cost $5) | | | 41 | | | | 4 | | |
| | | No. of
Rights | | | |
Right (0.0%) | |
United States (0.0%) | |
| Bristol-Myers Squibb Co. (f) (Cost $5) | | | 2,295 | | | | 5 | | |
| | | No. of
Warrants | | | |
Warrants (0.0%) | |
France (0.0%) | |
| CGG SA, expires 2/21/22 (f) (Cost $—) | | | 59 | | | | — | @ | |
United States (0.0%) | |
Occidental Petroleum Corp., expires 8/3/27 (f)
(Cost $2) | | | 357 | | | | 1 | | |
Total Warrants (Cost $2) | | | 1 | | |
| | | Shares | | | |
Short-Term Investments (13.1%) | |
Investment Company (11.7%) | |
Morgan Stanley Institutional Liquidity
Funds — Government Portfolio —
Institutional Class (See Note G)
(Cost $44,327) | | | 44,327,016 | | | | 44,327 | | |
| | | Face
Amount
(000) | | | |
U.S. Treasury Security (1.4%) | |
U.S. Treasury Bill, | |
| 0.16%, 1/28/21 (j)(k) (Cost $5,153) | | $ | 5,156 | | | | 5,154 | | |
Total Short-Term Investments (Cost $49,480) | | | 49,481 | | |
Total Investments (98.9%) (Cost $326,378) (l)(m)(n) | | | 373,889 | | |
Other Assets in Excess of Liabilities (1.1%) | | | 4,231 | | |
Net Assets (100.0%) | | $ | 378,120 | | |
Country assignments and aggregations are based generally on third party vendor classifications and information, and may be different from the assignments and aggregations under the policies set forth in the Fund's prospectus and/or statement of additional information relating to geographic classifications.
(a) Security is subject to delayed delivery.
(b) 144A security — Certain conditions for public sale may exist. Unless otherwise noted, these securities are deemed to be liquid.
The accompanying notes are an integral part of the consolidated financial statements.
27
Morgan Stanley Institutional Fund Trust
Annual Report — September 30, 2020
Consolidated Portfolio of Investments (cont'd)
Global Strategist Portfolio
(c) Floating or variable rate securities: The rates disclosed are as of September 30, 2020. For securities based on a published reference rate and spread, the reference rate and spread are indicated in the description in the Consolidated Portfolio of Investments. Certain variable rate securities may not be based on a published reference rate and spread but are determined by the issuer or agent and are based on current market conditions. These securities do not indicate a reference rate and spread in their description in the Consolidated Portfolio of Investments.
(d) Inverse Floating Rate Security — Interest rate fluctuates with an inverse relationship to an associated interest rate. Indicated rate is the effective rate at September 30, 2020.
(e) Perpetual — One or more securities do not have a predetermined maturity date. Rates for these securities are fixed for a period of time, after which they revert to a floating rate. Interest rates in effect are as of September 30, 2020.
(f) Non-income producing security.
(g) Security trades on the Hong Kong exchange.
(h) At September 30, 2020, the Fund held fair valued securities valued at $0, representing 0.0% of net assets. These securities have been fair valued as determined in good faith under procedures established by and under the general supervision of the Trust's (as defined herein) Trustees.
(i) Consists of one or more classes of securities traded together as a unit; stocks with attached warrants.
(j) All or a portion of the security was pledged to cover margin requirements for swap agreements.
(k) Rate shown is the yield to maturity at September 30, 2020.
(l) Securities are available for collateral in connection with securities purchased on a forward commitment basis, foreign currency forward exchange contracts, futures contracts and swap agreements.
(m) The approximate fair value and percentage of net assets, $57,630,000 and 15.2%, respectively, represent the securities that have been fair valued under the fair valuation policy for international investments as described in Note A-1 within the Notes to the Consolidated Financial Statements.
(n) At September 30, 2020, the aggregate cost for federal income tax purposes is approximately $336,492,000. The aggregate gross unrealized appreciation is approximately $54,120,000 and the aggregate gross unrealized depreciation is approximately $14,087,000, resulting in net unrealized appreciation of approximately $40,033,000.
@ Value is less than $500.
ADR American Depositary Receipt.
CDI CHESS Depositary Interest.
CVA Certificaten Van Aandelen.
EURIBOR Euro Interbank Offered Rate.
Euronext Euronext Paris Exchange.
Euronext N.V. Euronext Amsterdam Stock Market.
IO Interest Only.
LIBOR London Interbank Offered Rate.
LSE London Stock Exchange.
MTN Medium Term Note.
NYSE New York Stock Exchange.
OAT Obligations Assimilables du Trésor (French Treasury Obligation).
OFZ Obilgatsyi Federal'novo Zaima (Russian Federal Loan Obligation).
OMXH Helsinki Stock Exchange.
REIT Real Estate Investment Trust.
REMIC Real Estate Mortgage Investment Conduit.
SDR Swedish Depositary Receipt.
SIX Swiss Exchange.
SOFR Secured Overnight Financing Rate.
SSE Stockholm Stock Exchange.
TBA To Be Announced.
Foreign Currency Forward Exchange Contracts:
The Fund had the following foreign currency forward exchange contracts open at September 30, 2020:
Counterparty | | Contracts to
Deliver
(000) | | In Exchange
For
(000) | | Delivery
Date | | Unrealized
Appreciation
(Depreciation)
(000) | |
Australia And New Zealand Banking Group | | $ | 952 | | | GBP | 720 | | | 12/1/20 | | $ | (23 | ) | |
Bank of America NA | | $ | 154 | | | CZK | 3,385 | | | 12/1/20 | | | (7 | ) | |
Bank of America NA | | CNH | 10,096 | | | $ | 1,481 | | | 12/17/20 | | | (— | @) | |
Bank of America NA | | PLN | 252 | | | $ | 67 | | | 12/17/20 | | | 2 | | |
Bank of America NA | | $ | 304 | | | ILS | 1,040 | | | 12/17/20 | | | (— | @) | |
Bank of Montreal | | HUF | 11,918 | | | $ | 39 | | | 12/17/20 | | | 1 | | |
Bank of New York Mellon | | EUR | 381 | | | $ | 452 | | | 12/17/20 | | | 5 | | |
Barclays Bank PLC | | EUR | 320 | | | $ | 383 | | | 12/1/20 | | | 8 | | |
Barclays Bank PLC | | EUR | 202 | | | $ | 237 | | | 12/1/20 | | | — | @ | |
Barclays Bank PLC | | NZD | 1,513 | | | $ | 989 | | | 12/1/20 | | | (12 | ) | |
Barclays Bank PLC | | $ | 6,655 | | | JPY | 708,528 | | | 12/1/20 | | | 68 | | |
Barclays Bank PLC | | COP | 2,621,457 | | | $ | 705 | | | 12/17/20 | | | 23 | | |
Barclays Bank PLC | | EUR | 81 | | | $ | 96 | | | 12/17/20 | | | 1 | | |
Barclays Bank PLC | | $ | 1,654 | | | CNY | 11,353 | | | 12/17/20 | | | 5 | | |
BNP Paribas SA | | JPY | 43,263 | | | $ | 410 | | | 12/1/20 | | | (— | @) | |
BNP Paribas SA | | $ | 156 | | | COP | 577,465 | | | 12/1/20 | | | (6 | ) | |
BNP Paribas SA | | $ | 155 | | | PEN | 545 | | | 12/1/20 | | | (3 | ) | |
BNP Paribas SA | | $ | 509 | | | THB | 15,946 | | | 12/1/20 | | | (6 | ) | |
BNP Paribas SA | | CAD | 55 | | | $ | 42 | | | 12/17/20 | | | — | @ | |
The accompanying notes are an integral part of the consolidated financial statements.
28
Morgan Stanley Institutional Fund Trust
Annual Report — September 30, 2020
Consolidated Portfolio of Investments (cont'd)
Global Strategist Portfolio
Foreign Currency Forward Exchange Contracts: (cont'd)
Counterparty | | Contracts to
Deliver
(000) | | In Exchange
For
(000) | | Delivery
Date | | Unrealized
Appreciation
(Depreciation)
(000) | |
BNP Paribas SA | | CZK | 3,331 | | | $ | 145 | | | 12/17/20 | | $ | — | @ | |
BNP Paribas SA | | EUR | 241 | | | $ | 283 | | | 12/17/20 | | | — | @ | |
BNP Paribas SA | | HKD | 685 | | | $ | 88 | | | 12/17/20 | | | (— | @) | |
BNP Paribas SA | | INR | 52,093 | | | $ | 703 | | | 12/17/20 | | | 2 | | |
BNP Paribas SA | | JPY | 70,072 | | | $ | 665 | | | 12/17/20 | | | — | @ | |
BNP Paribas SA | | KRW | 839,646 | | | $ | 708 | | | 12/17/20 | | | (10 | ) | |
BNP Paribas SA | | NZD | 172 | | | $ | 115 | | | 12/17/20 | | | 2 | | |
BNP Paribas SA | | RUB | 48,037 | | | $ | 636 | | | 12/17/20 | | | 23 | | |
BNP Paribas SA | | RUB | 14,337 | | | $ | 183 | | | 12/17/20 | | | — | @ | |
BNP Paribas SA | | SEK | 234 | | | $ | 27 | | | 12/17/20 | | | 1 | | |
BNP Paribas SA | | TRY | 41 | | | $ | 5 | | | 12/17/20 | | | — | @ | |
BNP Paribas SA | | TWD | 1,768 | | | $ | 61 | | | 12/17/20 | | | — | @ | |
BNP Paribas SA | | $ | 206 | | | EUR | 177 | | | 12/17/20 | | | 1 | | |
BNP Paribas SA | | $ | 1,170 | | | GBP | 910 | | | 12/17/20 | | | 5 | | |
BNP Paribas SA | | $ | 163 | | | HKD | 1,261 | | | 12/17/20 | | | (— | @) | |
BNP Paribas SA | | $ | 19 | | | IDR | 285,595 | | | 12/17/20 | | | — | @ | |
BNP Paribas SA | | $ | 11 | | | PEN | 39 | | | 12/17/20 | | | (— | @) | |
Citibank NA | | CNH | 1,055 | | | $ | 153 | | | 12/1/20 | | | (2 | ) | |
Citibank NA | | MXN | 16,024 | | | $ | 720 | | | 12/1/20 | | | 1 | | |
Citibank NA | | $ | 7,331 | | | EUR | 6,152 | | | 12/1/20 | | | (110 | ) | |
Citibank NA | | $ | 353 | | | SGD | 482 | | | 12/1/20 | | | — | @ | |
Citibank NA | | $ | 77 | | | CZK | 1,734 | | | 12/17/20 | | | (2 | ) | |
Citibank NA | | $ | 140 | | | ILS | 479 | | | 12/17/20 | | | (— | @) | |
Citibank NA | | $ | 7 | | | THB | 223 | | | 12/17/20 | | | (— | @) | |
Commonwealth Bank of Australia | | EUR | 149 | | | $ | 176 | | | 12/17/20 | | | 2 | | |
Commonwealth Bank of Australia | | NZD | 41 | | | $ | 28 | | | 12/17/20 | | | — | @ | |
Credit Suisse International | | EUR | 103 | | | $ | 122 | | | 12/17/20 | | | 1 | | |
Goldman Sachs International | | MYR | 960 | | | $ | 230 | | | 12/1/20 | | | (— | @) | |
Goldman Sachs International | | RUB | 13,367 | | | $ | 178 | | | 12/1/20 | | | 7 | | |
Goldman Sachs International | | $ | 92 | | | HUF | 27,675 | | | 12/1/20 | | | (3 | ) | |
Goldman Sachs International | | $ | 1,644 | | | KRW | 1,947,574 | | | 12/1/20 | | | 22 | | |
Goldman Sachs International | | $ | 297 | | | MXN | 6,381 | | | 12/1/20 | | | (11 | ) | |
Goldman Sachs International | | $ | 154 | | | RUB | 11,405 | | | 12/1/20 | | | (8 | ) | |
Goldman Sachs International | | CLP | 468,992 | | | $ | 613 | | | 12/17/20 | | | 15 | | |
Goldman Sachs International | | EUR | 2,213 | | | $ | 2,628 | | | 12/17/20 | | | 29 | | |
Goldman Sachs International | | GBP | 130 | | | $ | 169 | | | 12/17/20 | | | — | @ | |
Goldman Sachs International | | JPY | 20,686 | | | $ | 196 | | | 12/17/20 | | | — | @ | |
Goldman Sachs International | | $ | 7,987 | | | BRL | 42,301 | | | 12/17/20 | | | (471 | ) | |
Goldman Sachs International | | $ | 226 | | | CHF | 205 | | | 12/17/20 | | | (3 | ) | |
Goldman Sachs International | | $ | 93 | | | CZK | 2,104 | | | 12/17/20 | | | (2 | ) | |
JPMorgan Chase Bank NA | | $ | 108 | | | AUD | 151 | | | 10/6/20 | | | (— | @) | |
JPMorgan Chase Bank NA | | AUD | 151 | | | $ | 109 | | | 12/1/20 | | | — | @ | |
JPMorgan Chase Bank NA | | CAD | 278 | | | $ | 211 | | | 12/1/20 | | | 2 | | |
JPMorgan Chase Bank NA | | $ | 827 | | | CHF | 746 | | | 12/1/20 | | | (16 | ) | |
JPMorgan Chase Bank NA | | $ | 600 | | | CNH | 4,085 | | | 12/1/20 | | | — | @ | |
JPMorgan Chase Bank NA | | $ | 517 | | | EUR | 442 | | | 12/1/20 | | | 3 | | |
JPMorgan Chase Bank NA | | $ | 227 | | | GBP | 169 | | | 12/1/20 | | | (8 | ) | |
JPMorgan Chase Bank NA | | $ | 13 | | | GBP | 10 | | | 12/1/20 | | | — | @ | |
JPMorgan Chase Bank NA | | $ | 85 | | | PLN | 317 | | | 12/1/20 | | | (3 | ) | |
JPMorgan Chase Bank NA | | $ | 355 | | | SEK | 3,093 | | | 12/1/20 | | | (9 | ) | |
JPMorgan Chase Bank NA | | CAD | 258 | | | $ | 196 | | | 12/17/20 | | | 2 | | |
JPMorgan Chase Bank NA | | EUR | 2,261 | | | $ | 2,684 | | | 12/17/20 | | | 29 | | |
JPMorgan Chase Bank NA | | NOK | 474 | | | $ | 52 | | | 12/17/20 | | | 2 | | |
JPMorgan Chase Bank NA | | $ | 190 | | | GBP | 147 | | | 12/17/20 | | | 1 | | |
JPMorgan Chase Bank NA | | ZAR | 10 | | | $ | 1 | | | 12/17/20 | | | — | @ | |
JPMorgan Chase Bank NA | | CNH | 2,595 | | | $ | 373 | | | 8/12/21 | | | (2 | ) | |
JPMorgan Chase Bank NA | | $ | 589 | | | CNH | 4,185 | | | 8/12/21 | | | 16 | | |
JPMorgan Chase Bank NA | | $ | 10,322 | | | CNH | 73,272 | | | 8/12/21 | | | 268 | | |
State Street Bank and Trust Co. | | AUD | 100 | | | $ | 73 | | | 12/17/20 | | | 1 | | |
UBS AG | | GBP | 378 | | | $ | 487 | | | 10/5/20 | | | — | @ | |
The accompanying notes are an integral part of the consolidated financial statements.
29
Morgan Stanley Institutional Fund Trust
Annual Report — September 30, 2020
Consolidated Portfolio of Investments (cont'd)
Global Strategist Portfolio
Foreign Currency Forward Exchange Contracts: (cont'd)
Counterparty | | Contracts to
Deliver
(000) | | In Exchange
For
(000) | | Delivery
Date | | Unrealized
Appreciation
(Depreciation)
(000) | |
UBS AG | | $ | 61 | | | CAD | 81 | | | 10/5/20 | | $ | (— | @) | |
UBS AG | | AUD | 2,789 | | | $ | 2,002 | | | 12/1/20 | | | 4 | | |
UBS AG | | AUD | 125 | | | $ | 92 | | | 12/1/20 | | | 3 | | |
UBS AG | | AUD | 2,461 | | | $ | 1,752 | | | 12/1/20 | | | (12 | ) | |
UBS AG | | CAD | 81 | | | $ | 61 | | | 12/1/20 | | | — | @ | |
UBS AG | | DKK | 379 | | | $ | 60 | | | 12/1/20 | | | 1 | | |
UBS AG | | EUR | 230 | | | $ | 273 | | | 12/1/20 | | | 2 | | |
UBS AG | | $ | 3,966 | | | CNH | 27,457 | | | 12/1/20 | | | 67 | | |
UBS AG | | $ | 487 | | | GBP | 378 | | | 12/1/20 | | | (— | @) | |
UBS AG | | $ | 26 | | | JPY | 2,746 | | | 12/1/20 | | | (— | @) | |
UBS AG | | $ | 52 | | | NOK | 454 | | | 12/1/20 | | | (3 | ) | |
UBS AG | | $ | 154 | | | RON | 625 | | | 12/2/20 | | | (4 | ) | |
UBS AG | | DKK | 370 | | | $ | 59 | | | 12/17/20 | | | 1 | | |
UBS AG | | EUR | 4,789 | | | $ | 5,686 | | | 12/17/20 | | | 62 | | |
UBS AG | | HKD | 644 | | | $ | 83 | | | 12/17/20 | | | (— | @) | |
UBS AG | | HUF | 224,528 | | | $ | 743 | | | 12/17/20 | | | 20 | | |
UBS AG | | JPY | 311,401 | | | $ | 2,956 | | | 12/17/20 | | | (— | @) | |
UBS AG | | MXN | 210,435 | | | $ | 9,882 | | | 12/17/20 | | | 447 | | |
UBS AG | | MXN | 4,751 | | | $ | 213 | | | 12/17/20 | | | — | @ | |
UBS AG | | SGD | 172 | | | $ | 127 | | | 12/17/20 | | | — | @ | |
UBS AG | | TRY | 5,704 | | | $ | 738 | | | 12/17/20 | | | 16 | | |
UBS AG | | $ | 156 | | | AUD | 217 | | | 12/17/20 | | | (— | @) | |
UBS AG | | $ | 1,552 | | | CHF | 1,406 | | | 12/17/20 | | | (23 | ) | |
UBS AG | | $ | 231 | | | MXN | 5,242 | | | 12/17/20 | | | 5 | | |
UBS AG | | ZAR | 13,023 | | | $ | 785 | | | 12/17/20 | | | 14 | | |
| | | | | | | | | $ | 431 | | |
Futures Contracts:
The Fund had the following futures contracts open at September 30, 2020:
| | | Number
of
Contracts | | Expiration
Date | | Notional
Amount
(000) | | Value
(000) | | Unrealized
Appreciation
(Depreciation)
(000) | |
Long: | |
100 oz Gold Future (United States) | | | 20 | | | Dec-20 | | $ | 2 | | | $ | 3,791 | | | $ | 21 | | |
MSCI Emerging Market E Mini (United States) | | | 81 | | | Dec-20 | | | 4 | | | | 4,409 | | | | 1 | | |
NASDAQ 100 E Mini (United States) | | | 9 | | | Dec-20 | | | — | @ | | | 2,053 | | | | 54 | | |
NYMEX WTI Crude Oil Futures (United States) | | | 46 | | | Nov-21 | | | 46 | | | | 1,984 | | | | 5 | | |
S&P 500 E Mini Index (United States) | | | 145 | | | Dec-20 | | | 8 | | | | 24,302 | | | | 119 | | |
SGX MSCI Singapore (Singapore) | | | 30 | | | Oct-20 | | SGD | 3 | | | | 621 | | | | 3 | | |
U.S. Treasury 2 yr. Note (United States) | | | 16 | | | Dec-20 | | $ | 3,200 | | | | 3,535 | | | | 2 | | |
U.S. Treasury Ultra Long Bond (United States) | | | 79 | | | Dec-20 | | | 7,900 | | | | 12,634 | | | | 10 | | |
Short: | |
Euro Stoxx 50 Index (Germany) | | | 92 | | | Dec-20 | | EUR | (1 | ) | | | (3,445 | ) | | | 101 | | |
FTSE 100 Index (United Kingdom) | | | 2 | | | Dec-20 | | GBP | — | @ | | | (151 | ) | | | 5 | | |
German Euro BTP (Germany) | | | 47 | | | Dec-20 | | EUR | (4,700 | ) | | | (8,132 | ) | | | (103 | ) | |
NIKKEI 225 Index (Japan) | | | 46 | | | Dec-20 | | JPY | (23 | ) | | | (5,074 | ) | | | (50 | ) | |
U.S. Treasury 10 yr. Note (United States) | | | 31 | | | Dec-20 | | $ | (3,100 | ) | | | (4,326 | ) | | | (— | @) | |
U.S. Treasury 10 yr. Ultra Long Bond (United States) | | | 11 | | | Dec-20 | | | (1,100 | ) | | | (1,759 | ) | | | (4 | ) | |
U.S. Treasury 5 yr. Note (United States) | | | 9 | | | Dec-20 | | | (900 | ) | | | (1,134 | ) | | | (2 | ) | |
U.S. Treasury Ultra Long Bond (United States) | | | 39 | | | Dec-20 | | | (3,900 | ) | | | (8,651 | ) | | | 71 | | |
| | | | | | | | | | | $ | 233 | | |
The accompanying notes are an integral part of the consolidated financial statements.
30
Morgan Stanley Institutional Fund Trust
Annual Report — September 30, 2020
Consolidated Portfolio of Investments (cont'd)
Global Strategist Portfolio
Interest Rate Swap Agreements:
The Fund had the following interest rate swap agreements open at September 30, 2020:
Swap Counterparty | | Floating Rate
Index | | Pay/
Receive
Floating
Rate | | Fixed
Rate | | Payment
Frequency
Paid/
Received | | Maturity
Date | | Notional
Amount
(000) | | Value
(000) | | Upfront
Payment
Paid
(000) | | Unrealized
Appreciation
(000) | |
JPMorgan Chase
Bank NA | | 3 Month KORIBOR | | Pay | | | 1.83 | % | | Quarterly/Quarterly | | 6/14/27 | | KRW | 1,400,000 | | | $ | 71 | | | $ | — | | | $ | 71 | | |
Morgan Stanley & US CPI All Urban
Co. LLC* | | Consumers Index | | Receive | | | 1.24 | | | Semi-Annual/Quarterly | | 3/30/30 | | $ | 1,286 | | | | 79 | | | | — | | | | 79 | | |
Morgan Stanley & US CPI All Urban
Co. LLC* | | Consumers Index | | Receive | | | 1.27 | | | Semi-Annual/Quarterly | | 3/30/30 | | | 4,644 | | | | 266 | | | | — | | | | 266 | | |
Morgan Stanley & US CPI All Urban
Co. LLC* | | Consumers Index | | Receive | | | 1.30 | | | Semi-Annual/Quarterly | | 3/30/30 | | | 1,286 | | | | 70 | | | | — | | | | 70 | | |
Morgan Stanley & US CPI All Urban
Co. LLC* | | Consumers Index | | Receive | | | 1.18 | | | Semi-Annual/Quarterly | | 3/31/30 | | | 2,143 | | | | 144 | | | | — | | | | 144 | | |
Morgan Stanley & US CPI All Urban
Co. LLC* | | Consumers Index | | Receive | | | 1.31 | | | Semi-Annual/Quarterly | | 4/28/30 | | | 790 | | | | 43 | | | | — | | | | 43 | | |
Morgan Stanley & US CPI All Urban
Co. LLC* | | Consumers Index | | Receive | | | 1.37 | | | Semi-Annual/Quarterly | | 5/29/30 | | | 628 | | | | 34 | | | | — | | | | 34 | | |
Morgan Stanley & US CPI All Urban
Co. LLC* | | Consumers Index | | Receive | | | 1.75 | | | Semi-Annual/Quarterly | | 7/30/30 | | | 318 | | | | 9 | | | | — | | | | 9 | | |
Morgan Stanley & US CPI All Urban
Co. LLC* | | Consumers Index | | Receive | | | 1.96 | | | Semi-Annual/Quarterly | | 8/28/30 | | | 591 | | | | — | @ | | | — | | | | — | @ | |
| | | | | | | | | | | | | | | $ | 716 | | | $ | — | | | $ | 716 | | |
Total Return Swap Agreements:
The Fund had the following total return swap agreements open at September 30, 2020:
Swap Counterparty | | Index | | Pay/Receive
Total Return of
Referenced
Index | | Floating
Rate | | Payment
Frequency | | Maturity
Date | | Notional
Amount
(000) | | Value
(000) | | Upfront
Payment
Paid
(000) | | Unrealized
Appreciation
(Depreciation)
(000) | |
Barclays Bank PLC
| | Barclays Custom
Covid-19 Basket
Index†† | |
Pay | | 3 Month
USD LIBOR
plus 0.11% | |
Quarterly | |
9/9/21 | | $ | 978 | | | $ | (65 | ) | | $ | — | | | $ | (65 | ) | |
BNP Paribas SA
| | MSCI Emerging
Markets Index | | Receive | | 3 Month
USD LIBOR
plus 0.28% | | Quarterly | | 1/26/21 | | | 21,336 | | | | 147 | | | | — | | | | 147 | | |
BNP Paribas SA
| | BNP Custom
U.S. Banks Index†† | | Receive | | 3 Month
USD LIBOR
plus 0.15% | | Quarterly | | 9/16/21 | | | 886 | | | | (56 | ) | | | — | | | | (56 | ) | |
BNP Paribas SA
| | BNP Custom
IPO Basket Index†† | | Pay | | 3 Month
USD LIBOR
plus 1.00% | | Quarterly | | 9/24/21 | | | 252 | | | | (23 | ) | | | — | | | | (23 | ) | |
BNP Paribas SA
| | BNP Custom
IPO Basket Index†† | | Pay | | 3 Month
USD LIBOR
plus 1.00% | | Quarterly | | 9/24/21 | | | 588 | | | | (65 | ) | | | — | | | | (65 | ) | |
JPMorgan Chase
Bank NA
| | MSCI Japan Net
Total Return Index | | Receive | | 3 Month
USD LIBOR
plus 0.15% | | Quarterly | | 2/10/21 | | | 16,602 | | | | 806 | | | | — | | | | 806 | | |
JPMorgan Chase
Bank NA
| |
JPM EMU
Growth Index†† | |
Pay | | 3 Month
EUR EURIBOR
plus 0.05% | |
Quarterly | |
5/14/21 | | EUR | 2,519 | | | | 95 | | | | — | | | | 95 | | |
JPMorgan Chase
Bank NA
| | JPM EMU
Low Vol Index†† | | Pay | | 3 Month
EUR EURIBOR
plus 0.05% | | Quarterly | | 5/14/21 | | | 2,494 | | | | 148 | | | | — | | | | 148 | | |
JPMorgan Chase
Bank NA
| | JPM EMU
Value Index†† | | Receive | | 3 Month
EUR EURIBOR
plus 0.14% | | Quarterly | | 5/14/21 | | | 5,241 | | | | (524 | ) | | | — | | | | (524 | ) | |
The accompanying notes are an integral part of the consolidated financial statements.
31
Morgan Stanley Institutional Fund Trust
Annual Report — September 30, 2020
Consolidated Portfolio of Investments (cont'd)
Global Strategist Portfolio
Total Return Swap Agreements: (cont'd)
Swap Counterparty | | Index | | Pay/Receive
Total Return of
Referenced
Index | | Floating
Rate | | Payment
Frequency | | Maturity
Date | | Notional
Amount
(000) | | Value
(000) | | Upfront
Payment
Paid
(000) | | Unrealized
Appreciation
(Depreciation)
(000) | |
JPMorgan Chase
Bank NA
| |
JPM U.S. SPX 1500
Low Vol Index†† | |
Pay | | 3 Month
USD LIBOR
plus 0.10% | |
Quarterly | |
5/14/21 | | $ | 3,937 | | | $ | 158 | | | $ | — | | | $ | 158 | | |
JPMorgan Chase
Bank NA
| | JPM U.S. SPX 1500
Low Vol Index†† | | Pay | | 3 Month
USD LIBOR
plus 0.10% | | Quarterly | | 5/14/21 | | | 3,912 | | | | 157 | | | | — | | | | 157 | | |
JPMorgan Chase
Bank NA
| | JPM U.S. SPX 1500
Low Vol Index†† | | Pay | | 3 Month
USD LIBOR
plus 0.10% | | Quarterly | | 5/14/21 | | | 3,844 | | | | 154 | | | | — | | | | 154 | | |
JPMorgan Chase
Bank NA
| | JPM U.S. SPX 1500
Low Vol Index†† | | Pay | | 3 Month
USD LIBOR
plus 0.10% | | Quarterly | | 5/14/21 | | | 313 | | | | (8 | ) | | | — | | | | (8 | ) | |
JPMorgan Chase
Bank NA
| | JPM U.S. SPX 1500
Value Index†† | | Receive | | 3 Month
USD LIBOR
plus 0.10% | | Quarterly | | 5/14/21 | | | 4,172 | | | | (280 | ) | | | — | | | | (280 | ) | |
JPMorgan Chase
Bank NA
| | JPM U.S. SPX 1500
Value Index†† | | Receive | | 3 Month
USD LIBOR
plus 0.10% | | Quarterly | | 5/14/21 | | | 4,075 | | | | (273 | ) | | | — | | | | (273 | ) | |
JPMorgan Chase
Bank NA
| | JPM U.S. SPX 1500
Value Index†† | | Receive | | 3 Month
USD LIBOR
plus 0.10% | | Quarterly | | 5/14/21 | | | 3,828 | | | | (257 | ) | | | — | | | | (257 | ) | |
JPMorgan Chase
Bank NA
| | JPM U.S. SPX 1500
Value Index†† | | Receive | | 3 Month
USD LIBOR
plus 0.10% | | Quarterly | | 5/14/21 | | | 427 | | | | 16 | | | | — | | | | 16 | | |
JPMorgan Chase
Bank NA
| | JPM U.S. SPX 500
Growth Index†† | | Pay | | 3 Month
USD LIBOR
plus 0.10% | | Quarterly | | 5/14/21 | | | 9,097 | | | | 83 | | | | — | | | | 83 | | |
JPMorgan Chase
Bank NA
| | JPM U.S. SPX 500
Growth Index†† | | Pay | | 3 Month
USD LIBOR
plus 0.10% | | Quarterly | | 5/14/21 | | | 69 | | | | (2 | ) | | | — | | | | (2 | ) | |
JPMorgan Chase
Bank NA
| | JPM U.S. SPX 500
Low Vol Index†† | | Pay | | 3 Month
USD LIBOR
plus 0.10% | | Quarterly | | 5/14/21 | | | 8,382 | | | | 16 | | | | — | | | | 16 | | |
JPMorgan Chase
Bank NA
| | JPM U.S. SPX 500
Value Index†† | | Receive | | 3 Month
USD LIBOR
plus 0.10% | | Quarterly | | 5/14/21 | | | 18,207 | | | | (902 | ) | | | — | | | | (902 | ) | |
JPMorgan Chase
Bank NA
| | JPM U.S. SPX 500
Value Index†† | | Receive | | 3 Month
USD LIBOR
plus 0.10% | | Quarterly | | 5/14/21 | | | 89 | | | | 3 | | | | — | | | | 3 | | |
JPMorgan Chase
Bank NA
| | JPM IPO
Index†† | | Pay | | 3 Month
USD LIBOR
plus 1.24% | | Quarterly | | 9/1/21 | | | 1,237 | | | | 162 | | | | — | | | | 162 | | |
| | | | | | | | | | | | | | | $ | (510 | ) | | $ | — | | | $ | (510 | ) | |
†† See tables below for details of the equity basket holdings underlying the swap.
The accompanying notes are an integral part of the consolidated financial statements.
32
Morgan Stanley Institutional Fund Trust
Annual Report — September 30, 2020
Consolidated Portfolio of Investments (cont'd)
Global Strategist Portfolio
The following table represents the equity basket holdings underlying the total return swap with Barclays Custom Covid-19 Basket Index as of September 30, 2020:
Security Description | | Shares | | Value
(000) | | Index Weight | |
Barclays Custom Covid-19 Basket Index | |
Atlassian Corp. PLC-Class A | | | 25,005 | | | $ | 4,546 | | | | 8.98 | % | |
Citrix Systems, Inc. | | | 32,328 | | | | 4,452 | | | | 8.80 | | |
Crowdstrike Holdings, Inc. — A | | | 35,167 | | | | 4,829 | | | | 9.54 | | |
Everbridge, Inc. | | | 33,302 | | | | 4,187 | | | | 8.27 | | |
Netflix, Inc. | | | 8,645 | | | | 4,323 | | | | 8.54 | | |
Okta, Inc. | | | 21,771 | | | | 4,656 | | | | 9.20 | | |
Ringcentral Inc. — Class A | | | 16,250 | | | | 4,462 | | | | 8.82 | | |
Roku, Inc. | | | 27,234 | | | | 5,142 | | | | 10.17 | | |
Slack Technologies, Inc. — Class A | | | 146,722 | | | | 3,941 | | | | 7.79 | | |
Zoom Video Communications — A | | | 11,920 | | | | 5,604 | | | | 11.08 | | |
Zscaler, Inc. | | | 31,686 | | | | 4,458 | | | | 8.81 | | |
Total | | | | $ | 50,600 | | | | 100.00 | % | |
The following table represents the equity basket holdings underlying the total return swap with BNP Custom U.S. Banks Index as of September 30, 2020:
Security Description | | Shares | | Value
(000) | | Index Weight | |
BNP Custom U.S. Banks Index | |
Bank of America Corp. | | | 308,343 | | | $ | 7,428 | | | | 21.41 | % | |
CIT Group, Inc. | | | 3,298 | | | | 58 | | | | 0.17 | | |
Citigroup, Inc. | | | 79,236 | | | | 3,416 | | | | 9.85 | | |
Citizens Financial Group | | | 15,687 | | | | 397 | | | | 1.14 | | |
Comerica, Inc. | | | 5,287 | | | | 202 | | | | 0.58 | | |
East West Bancorp, Inc. | | | 4,961 | | | | 162 | | | | 0.47 | | |
Fifth Third Bancorp | | | 25,079 | | | | 535 | | | | 1.54 | | |
First Republic Bank | | | 5,750 | | | | 627 | | | | 1.81 | | |
Huntington Bancshares, Inc. | | | 35,695 | | | | 327 | | | | 0.94 | | |
JPMorgan Chase & Co. | | | 110,953 | | | | 10,681 | | | | 30.80 | | |
Keycorp | | | 34,389 | | | | 410 | | | | 1.18 | | |
M & T Bank Corp. | | | 4,440 | | | | 409 | | | | 1.18 | | |
People'S United Financial | | | 13,619 | | | | 140 | | | | 0.40 | | |
PNC Financial Services Group | | | 15,425 | | | | 1,695 | | | | 4.89 | | |
Regions Financial Corp. | | | 34,597 | | | | 399 | | | | 1.15 | | |
Signature Bank | | | 1,907 | | | | 158 | | | | 0.46 | | |
| SVB Financial Group | | | 1,793 | | | | 431 | | | | 1.24 | | |
Truist Financial Corp. | | | 45,852 | | | | 1,745 | | | | 5.03 | | |
US Bancorp | | | 51,605 | | | | 1,850 | | | | 5.33 | | |
Wells Fargo & Co. | | | 146,120 | | | | 3,435 | | | | 9.90 | | |
Zions Bancorp NA | | | 6,245 | | | | 182 | | | | 0.53 | | |
Total | | | | $ | 34,687 | | | | 100.00 | % | |
The following table represents the equity basket holdings underlying the total return swap with BNP Custom IPO Basket Index as of September 30, 2020:
Security Description | | Shares | | Value
(000) | | Index Weight | |
BNP Custom IPO Basket Index | |
Berkeley Lights, Inc. | | | 1,878 | | | $ | 143 | | | | 13.15 | % | |
Duck Creek Technologies, Inc. | | | 5,023 | | | | 228 | | | | 20.93 | | |
Li Auto Inc — ADR | | | 21,351 | | | | 371 | | | | 34.04 | | |
Oak Street Health, Inc. | | | 4,323 | | | | 231 | | | | 21.18 | | |
Vertex, Inc. — Class A | | | 5,073 | | | | 117 | | | | 10.70 | | |
Total | | | | $ | 1,090 | | | | 100.00 | % | |
The accompanying notes are an integral part of the consolidated financial statements.
33
Morgan Stanley Institutional Fund Trust
Annual Report — September 30, 2020
Consolidated Portfolio of Investments (cont'd)
Global Strategist Portfolio
The following table represents the equity basket holdings underlying the total return swap with JPM EMU Growth Index as of September 30, 2020:
Security Description | | Shares | | Value
(000) | | Index Weight | |
JPM EMU Growth Index | |
Adyen N.V. | | | 121 | | | $ | 224 | | | | 2.27 | % | |
Air Liquide SA | | | 1,245 | | | | 198 | | | | 2.01 | | |
Airbus SE | | | 2,785 | | | | 203 | | | | 2.06 | | |
Amundi SA | | | 2,767 | | | | 195 | | | | 1.98 | | |
Beiersdorf AG | | | 1,726 | | | | 196 | | | | 1.99 | | |
Biomerieux | | | 1,272 | | | | 200 | | | | 2.03 | | |
Cellnex Telecom SA | | | 3,347 | | | | 204 | | | | 2.07 | | |
Davide Campari-Milano N.V. | | | 20,698 | | | | 226 | | | | 2.30 | | |
Delivery Hero SE | | | 1,747 | | | | 201 | | | | 2.04 | | |
Deutsche Bank Ag-Registered | | | 22,658 | | | | 191 | | | | 1.94 | | |
Deutsche Boerse AG | | | 1,119 | | | | 197 | | | | 2.00 | | |
Deutsche Wohnen SE | | | 4,237 | | | | 212 | | | | 2.16 | | |
E.On SE | | | 17,599 | | | | 194 | | | | 1.98 | | |
Elia Group SA | | | 1,968 | | | | 196 | | | | 2.00 | | |
Ferrari N.V. | | | 1,129 | | | | 207 | | | | 2.11 | | |
Ferrovial SA | | | 8,424 | | | | 205 | | | | 2.08 | | |
Finecobank SPA | | | 13,970 | | | | 192 | | | | 1.96 | | |
Galapagos N.V. | | | 1,082 | | | | 154 | | | | 1.56 | | |
Gea Group AG | | | 5,579 | | | | 196 | | | | 2.00 | | |
Getlink SE | | | 13,590 | | | | 185 | | | | 1.88 | | |
Groupe Bruxelles Lambert SA | | | 2,306 | | | | 208 | | | | 2.11 | | |
Hannover Rueck SE | | | 1,206 | | | | 187 | | | | 1.90 | | |
Hermes International | | | 257 | | | | 222 | | | | 2.25 | | |
Iberdrola SA | | | 16,004 | | | | 197 | | | | 2.00 | | |
Iliad SA | | | 1,046 | | | | 193 | | | | 1.96 | | |
Just Eat Takeaway | | | 1,866 | | | | 209 | | | | 2.13 | | |
Knorr-Bremse AG | | | 1,755 | | | | 207 | | | | 2.10 | | |
Koninklijke Dsm N.V. | | | 1,341 | | | | 221 | | | | 2.24 | | |
L'Oreal | | | 638 | | | | 208 | | | | 2.11 | | |
Muenchener Rueckver AG | | | 758 | | | | 192 | | | | 1.96 | | |
Nemetschek SE | | | 2,752 | | | | 202 | | | | 2.05 | | |
Pernod Ricard SA | | | 1,183 | | | | 189 | | | | 1.92 | | |
Prosus N.V. | | | 2,108 | | | | 194 | | | | 1.98 | | |
Sartorius AG-Vorzug | | | 539 | | | | 221 | | | | 2.25 | | |
Sartorius Stedim Biotech | | | 661 | | | | 228 | | | | 2.31 | | |
Scout24 AG | | | 2,398 | | | | 209 | | | | 2.13 | | |
Siemens Gamesa Renewable Energy | | | 8,649 | | | | 234 | | | | 2.38 | | |
Symrise AG | | | 1,640 | | | | 227 | | | | 2.31 | | |
Teamviewer AG | | | 3,758 | | | | 186 | | | | 1.89 | | |
Teleperformance | | | 695 | | | | 215 | | | | 2.18 | | |
Terna SPA | | | 28,262 | | | | 198 | | | | 2.01 | | |
Ubisoft Entertainment | | | 2,467 | | | | 223 | | | | 2.26 | | |
Umicore | | | 4,434 | | | | 185 | | | | 1.88 | | |
Vonovia SE | | | 3,146 | | | | 216 | | | | 2.20 | | |
Vopak | | | 3,826 | | | | 216 | | | | 2.19 | | |
Wendel | | | 2,153 | | | | 195 | | | | 1.99 | | |
Wolters Kluwer | | | 2,588 | | | | 221 | | | | 2.25 | | |
Zalando SE | | | 2,771 | | | | 260 | | | | 2.64 | | |
Total | | | | $ | 9,839 | | | | 100.00 | % | |
The accompanying notes are an integral part of the consolidated financial statements.
34
Morgan Stanley Institutional Fund Trust
Annual Report — September 30, 2020
Consolidated Portfolio of Investments (cont'd)
Global Strategist Portfolio
The following table represents the equity basket holdings underlying the total return swap with JPM EMU Low Vol Index as of September 30, 2020:
Security Description | | Shares | | Value
(000) | | Index Weight | |
JPM EMU Low Vol Index | |
Ageas | | | 5,626 | | | $ | 230 | | | | 2.36 | % | |
Air Liquide SA | | | 1,299 | | | | 206 | | | | 2.12 | | |
Akzo Nobel N.V. | | | 2,291 | | | | 232 | | | | 2.39 | | |
Allianz SE-REG | | | 1,022 | | | | 196 | | | | 2.01 | | |
Alstom | | | 3,842 | | | | 191 | | | | 1.97 | | |
Asml Holding N.V. | | | 597 | | | | 220 | | | | 2.26 | | |
Assicurazioni Generali | | | 14,543 | | | | 205 | | | | 2.11 | | |
Dassault Systemes SA | | | 1,186 | | | | 222 | | | | 2.28 | | |
Deutsche Boerse AG | | | 1,168 | | | | 205 | | | | 2.11 | | |
Eni SPA | | | 24,582 | | | | 193 | | | | 1.98 | | |
Essilorluxottica | | | 1,676 | | | | 228 | | | | 2.34 | | |
Ferrovial SA | | | 8,790 | | | | 214 | | | | 2.20 | | |
Getlink SE | | | 14,181 | | | | 193 | | | | 1.98 | | |
Groupe Bruxelles Lambert SA | | | 2,406 | | | | 217 | | | | 2.23 | | |
Hannover Rueck SE | | | 1,258 | | | | 195 | | | | 2.00 | | |
Heineken Holding N.V. | | | 2,540 | | | | 198 | | | | 2.03 | | |
Henkel AG & Co. KGaA | | | 2,508 | | | | 235 | | | | 2.41 | | |
Hermes International | | | 268 | | | | 231 | | | | 2.38 | | |
Iberdrola SA | | | 16,700 | | | | 206 | | | | 2.11 | | |
ICADE | | | 3,331 | | | | 187 | | | | 1.92 | | |
Koninklijke Dsm N.V. | | | 1,399 | | | | 231 | | | | 2.37 | | |
Koninklijke Kpn N.V. | | | 84,259 | | | | 198 | | | | 2.04 | | |
Legrand SA | | | 2,780 | | | | 222 | | | | 2.28 | | |
L'Oreal | | | 666 | | | | 217 | | | | 2.23 | | |
Lvmh Moet Hennessy Louis Vui | | | 497 | | | | 233 | | | | 2.39 | | |
Mapfre SA | | | 116,773 | | | | 183 | | | | 1.88 | | |
Merck KGaA | | | 1,649 | | | | 241 | | | | 2.47 | | |
Michelin | | | 2,047 | | | | 220 | | | | 2.26 | | |
Muenchener Rueckver AG-REG | | | 791 | | | | 201 | | | | 2.06 | | |
Pernod Ricard SA | | | 1,234 | | | | 197 | | | | 2.02 | | |
Prosus N.V. | | | 2,200 | | | | 203 | | | | 2.08 | | |
Proximus | | | 10,718 | | | | 196 | | | | 2.01 | | |
Recordati Industria Chimica | | | 4,043 | | | | 207 | | | | 2.13 | | |
Red Electrica Corporacion SA | | | 11,279 | | | | 212 | | | | 2.17 | | |
Sanofi | | | 2,052 | | | | 205 | | | | 2.11 | | |
SAP SE | | | 1,347 | | | | 210 | | | | 2.15 | | |
Schneider Electric SE | | | 1,822 | | | | 226 | | | | 2.33 | | |
Snam SPA | | | 41,110 | | | | 211 | | | | 2.17 | | |
Symrise AG | | | 1,711 | | | | 237 | | | | 2.43 | | |
Teleperformance | | | 725 | | | | 224 | | | | 2.30 | | |
Terna SPA | | | 29,491 | | | | 206 | | | | 2.12 | | |
Total SE | | | 5,716 | | | | 196 | | | | 2.01 | | |
UCB SA | | | 1,712 | | | | 195 | | | | 2.00 | | |
Vinci SA | | | 2,447 | | | | 205 | | | | 2.11 | | |
Vonovia SE | | | 3,283 | | | | 225 | | | | 2.32 | | |
Wolters Kluwer | | | 2,701 | | | | 231 | | | | 2.37 | | |
Total | | | | $ | 9,736 | | | | 100.00 | % | |
The accompanying notes are an integral part of the consolidated financial statements.
35
Morgan Stanley Institutional Fund Trust
Annual Report — September 30, 2020
Consolidated Portfolio of Investments (cont'd)
Global Strategist Portfolio
The following table represents the equity basket holdings underlying the total return swap with JPM EMU Value Index as of September 30, 2020:
Security Description | | Shares | | Value
(000) | | Index Weight | |
JPM EMU Value Index | |
ACS Actividades Cons Y Serv | | | 8,932 | | | $ | 203 | | | | 2.08 | % | |
Aercap Holdings N.V. | | | 7,450 | | | | 188 | | | | 1.93 | | |
Atlantia SPA | | | 12,945 | | | | 204 | | | | 2.10 | | |
Atos SE | | | 2,448 | | | | 197 | | | | 2.03 | | |
Banco Bilbao Vizcaya Argenta | | | 65,842 | | | | 183 | | | | 1.88 | | |
Banco Santander SA | | | 96,583 | | | | 181 | | | | 1.86 | | |
Bayer AG-REG | | | 3,067 | | | | 192 | | | | 1.97 | | |
Bayerische Motoren Werke AG | | | 3,191 | | | | 232 | | | | 2.38 | | |
Bayerische Motoren Werke-Pref | | | 2,022 | | | | 111 | | | | 1.14 | | |
BNP Paribas | | | 5,058 | | | | 184 | | | | 1.89 | | |
Bouygues SA | | | 5,727 | | | | 199 | | | | 2.04 | | |
Capgemini SE | | | 1,635 | | | | 210 | | | | 2.16 | | |
Carrefour SA | | | 13,335 | | | | 214 | | | | 2.20 | | |
Casino Guichard Perrachon | | | 7,639 | | | | 186 | | | | 1.91 | | |
CNP Assurances | | | 17,147 | | | | 215 | | | | 2.21 | | |
Compagnie De Saint Gobain | | | 5,492 | | | | 232 | | | | 2.39 | | |
Credit Agricole SA | | | 21,423 | | | | 188 | | | | 1.93 | | |
Deutsche Telekom AG-REG | | | 6,206 | | | | 104 | | | | 1.07 | | |
EIFFAGE | | | 2,368 | | | | 194 | | | | 1.99 | | |
ENGIE | | | 15,072 | | | | 202 | | | | 2.07 | | |
Fresenius Medical Care AG | | | 2,352 | | | | 199 | | | | 2.04 | | |
Fresenius SE & Co. KGaA | | | 4,188 | | | | 191 | | | | 1.96 | | |
Heidelbergcement AG | | | 3,716 | | | | 228 | | | | 2.35 | | |
Hochtief AG | | | 2,581 | | | | 201 | | | | 2.07 | | |
Ipsen | | | 2,090 | | | | 219 | | | | 2.26 | | |
Klepierre | | | 13,140 | | | | 185 | | | | 1.90 | | |
Koninklijke Ahold Delhaize N | | | 7,273 | | | | 215 | | | | 2.21 | | |
Lanxess AG | | | 4,001 | | | | 230 | | | | 2.37 | | |
Leonardo SPA | | | 32,386 | | | | 190 | | | | 1.95 | | |
Metro AG | | | 22,526 | | | | 225 | | | | 2.31 | | |
Natixis | | | 86,353 | | | | 195 | | | | 2.00 | | |
Naturgy Energy Group SA | | | 11,352 | | | | 228 | | | | 2.34 | | |
Nokia Oyj | | | 41,949 | | | | 165 | | | | 1.69 | | |
Omv AG | | | 6,546 | | | | 180 | | | | 1.85 | | |
Orange | | | 8,968 | | | | 93 | | | | 0.96 | | |
Peugeot SA | | | 12,871 | | | | 234 | | | | 2.40 | | |
Pirelli & C SPA | | | 51,777 | | | | 222 | | | | 2.29 | | |
Publicis Groupe | | | 6,331 | | | | 205 | | | | 2.10 | | |
Raiffeisen Bank International | | | 12,234 | | | | 187 | | | | 1.93 | | |
Repsol SA | | | 26,793 | | | | 180 | | | | 1.85 | | |
Societe Generale SA | | | 13,903 | | | | 184 | | | | 1.90 | | |
Solvay SA | | | 2,689 | | | | 232 | | | | 2.38 | | |
Stora Enso Oyj-R SHS | | | 16,447 | | | | 258 | | | | 2.65 | | |
Suez | | | 16,050 | | | | 297 | | | | 3.06 | | |
Telefonica SA | | | 49,821 | | | | 172 | | | | 1.76 | | |
Unibail-Rodamco-Westfield | | | 4,298 | | | | 159 | | | | 1.63 | | |
Uniper SE | | | 5,963 | | | | 193 | | | | 1.98 | | |
Volkswagen AG | | | 1,292 | | | | 226 | | | | 2.32 | | |
Volkswagen AG-Pref | | | 1,367 | | | | 220 | | | | 2.26 | | |
Total | | | | $ | 9,732 | | | | 100.00 | % | |
The accompanying notes are an integral part of the consolidated financial statements.
36
Morgan Stanley Institutional Fund Trust
Annual Report — September 30, 2020
Consolidated Portfolio of Investments (cont'd)
Global Strategist Portfolio
The following table represents the equity basket holdings underlying the total return swap with JPM U.S. SPX 1500 Low Vol Index as of September 30, 2020:
Security Description | | Shares | | Value
(000) | | Index Weight | |
JPM U.S. SPX 1500 Low Vol Index | |
Abbott Laboratories | | | 520 | | | $ | 57 | | | | 0.57 | % | |
Agilent Technologies, Inc. | | | 528 | | | | 53 | | | | 0.54 | | |
Air Products & Chemicals, Inc. | | | 188 | | | | 56 | | | | 0.56 | | |
Akamai Technologies, Inc. | | | 463 | | | | 51 | | | | 0.52 | | |
Alexandria Real Estate Equity | | | 297 | | | | 48 | | | | 0.48 | | |
Allstate Corp. | | | 544 | | | | 51 | | | | 0.52 | | |
American Express Co. | | | 560 | | | | 56 | | | | 0.56 | | |
American Tower Corp. | | | 204 | | | | 49 | | | | 0.50 | | |
Amerisafe, Inc. | | | 825 | | | | 47 | | | | 0.48 | | |
Amerisourcebergen Corp. | | | 501 | | | | 49 | | | | 0.49 | | |
Amgen, Inc. | | | 212 | | | | 54 | | | | 0.54 | | |
Amphenol Corp. — Cl A | | | 487 | | | | 53 | | | | 0.53 | | |
Analog Devices, Inc. | | | 449 | | | | 52 | | | | 0.53 | | |
Aptargroup, Inc. | | | 441 | | | | 50 | | | | 0.50 | | |
Arthur J Gallagher & Co. | | | 493 | | | | 52 | | | | 0.52 | | |
At&T, Inc. | | | 1,767 | | | | 50 | | | | 0.51 | | |
Atmos Energy Corp. | | | 497 | | | | 48 | | | | 0.48 | | |
Autozone, Inc. | | | 43 | | | | 51 | | | | 0.51 | | |
Badger Meter, Inc. | | | 817 | | | | 53 | | | | 0.54 | | |
Baxter International, Inc. | | | 630 | | | | 51 | | | | 0.51 | | |
Booking Holdings, Inc. | | | 32 | | | | 54 | | | | 0.55 | | |
Brady Corp. — Cl A | | | 1,118 | | | | 45 | | | | 0.45 | | |
Broadcom, Inc. | | | 163 | | | | 59 | | | | 0.61 | | |
Brookline BanCorp, Inc. | | | 5,476 | | | | 47 | | | | 0.48 | | |
Brown & Brown, Inc. | | | 1,150 | | | | 52 | | | | 0.52 | | |
Cable One, Inc. | | | 28 | | | | 53 | | | | 0.53 | | |
Cabot Oil & Gas Corp. | | | 2,738 | | | | 48 | | | | 0.48 | | |
Carrier Global Corp. | | | 1,895 | | | | 58 | | | | 0.58 | | |
CDW Corp. | | | 446 | | | | 53 | | | | 0.54 | | |
Cerner Corp. | | | 761 | | | | 55 | | | | 0.55 | | |
Chemed Corp. | | | 104 | | | | 50 | | | | 0.50 | | |
Chevron Corp. | | | 617 | | | | 44 | | | | 0.45 | | |
Cisco Systems, Inc. | | | 1,110 | | | | 44 | | | | 0.44 | | |
City Holding Co. | | | 837 | | | | 48 | | | | 0.49 | | |
Cme Group, Inc. | | | 321 | | | | 54 | | | | 0.54 | | |
Cms Energy Corp. | | | 831 | | | | 51 | | | | 0.51 | | |
Columbia Sportswear Co. | | | 710 | | | | 62 | | | | 0.62 | | |
Comcast Corp. — Class A | | | 1,221 | | | | 56 | | | | 0.57 | | |
Commerce Bancshares, Inc. | | | 910 | | | | 51 | | | | 0.52 | | |
Community Bank System, Inc. | | | 937 | | | | 51 | | | | 0.51 | | |
Conocophillips | | | 1,426 | | | | 47 | | | | 0.47 | | |
Corning, Inc. | | | 1,694 | | | | 55 | | | | 0.55 | | |
Costco Wholesale Corp. | | | 159 | | | | 56 | | | | 0.57 | | |
Cousins Properties, Inc. | | | 1,728 | | | | 49 | | | | 0.50 | | |
Crown Castle Intl Corp. | | | 319 | | | | 53 | | | | 0.53 | | |
Cvb Financial Corp. | | | 2,902 | | | | 48 | | | | 0.49 | | |
Daktronics, Inc. | | | 3,894 | | | | 15 | | | | 0.16 | | |
Danaher Corp. | | | 253 | | | | 55 | | | | 0.55 | | |
Deckers Outdoor Corp. | | | 253 | | | | 56 | | | | 0.56 | | |
Digital Realty Trust, Inc. | | | 326 | | | | 48 | | | | 0.48 | | |
Dollar General Corp. | | | 271 | | | | 57 | | | | 0.57 | | |
Dominion Energy, Inc. | | | 652 | | | | 51 | | | | 0.52 | | |
Domino'S Pizza, Inc. | | | 135 | | | | 58 | | | | 0.58 | | |
The accompanying notes are an integral part of the consolidated financial statements.
37
Morgan Stanley Institutional Fund Trust
Annual Report — September 30, 2020
Consolidated Portfolio of Investments (cont'd)
Global Strategist Portfolio
Security Description | | Shares | | Value
(000) | | Index Weight | |
Dorman Products, Inc. | | | 639 | | | $ | 58 | | | | 0.58 | % | |
Douglas Emmett, Inc. | | | 1,818 | | | | 46 | | | | 0.46 | | |
Dril-Quip, Inc. | | | 1,529 | | | | 38 | | | | 0.38 | | |
Dsp Group, Inc. | | | 3,410 | | | | 45 | | | | 0.45 | | |
Duke Energy Corp. | | | 625 | | | | 55 | | | | 0.56 | | |
Duke Realty Corp. | | | 1,320 | | | | 49 | | | | 0.49 | | |
Dunkin' Brands Group, Inc. | | | 772 | | | | 63 | | | | 0.64 | | |
Easterly Government Properties | | | 2,177 | | | | 49 | | | | 0.49 | | |
Eaton Corp. PLC | | | 552 | | | | 56 | | | | 0.57 | | |
Ecolab, Inc. | | | 284 | | | | 57 | | | | 0.57 | | |
Emcor Group, Inc. | | | 736 | | | | 50 | | | | 0.50 | | |
Encore Wire Corp. | | | 1,043 | | | | 48 | | | | 0.49 | | |
Estee Lauder Companies — Cl A | | | 264 | | | | 58 | | | | 0.58 | | |
Ethan Allen Interiors, Inc. | | | 4,270 | | | | 58 | | | | 0.58 | | |
Eversource Energy | | | 585 | | | | 49 | | | | 0.49 | | |
Expeditors Intl Wash, Inc. | | | 610 | | | | 55 | | | | 0.56 | | |
Exponent, Inc. | | | 628 | | | | 45 | | | | 0.46 | | |
Extra Space Storage, Inc. | | | 514 | | | | 55 | | | | 0.55 | | |
Exxon Mobil Corp. | | | 1,239 | | | | 43 | | | | 0.43 | | |
Factset Research Systems, Inc. | | | 150 | | | | 50 | | | | 0.51 | | |
Fidelity National Info Serv | | | 352 | | | | 52 | | | | 0.52 | | |
Firstcash, Inc. | | | 927 | | | | 53 | | | | 0.53 | | |
Fiserv, Inc. | | | 521 | | | | 54 | | | | 0.54 | | |
Flowers Foods, Inc. | | | 2,252 | | | | 55 | | | | 0.55 | | |
Fulton Financial Corp. | | | 5,419 | | | | 51 | | | | 0.51 | | |
Garmin Ltd. | | | 524 | | | | 50 | | | | 0.50 | | |
Gatx Corp. | | | 861 | | | | 55 | | | | 0.55 | | |
General Dynamics Corp. | | | 354 | | | | 49 | | | | 0.49 | | |
Gentex Corp. | | | 1,943 | | | | 50 | | | | 0.50 | | |
Gilead Sciences, Inc. | | | 730 | | | | 46 | | | | 0.46 | | |
Graco, Inc. | | | 979 | | | | 60 | | | | 0.60 | | |
Hasbro, Inc. | | | 699 | | | | 58 | | | | 0.58 | | |
Hawaiian Electric Industries | | | 1,453 | | | | 48 | | | | 0.49 | | |
Heartland Express, Inc. | | | 2,589 | | | | 48 | | | | 0.48 | | |
Helen Of Troy Ltd. | | | 267 | | | | 52 | | | | 0.52 | | |
Henry Schein, Inc. | | | 738 | | | | 43 | | | | 0.44 | | |
Heritage Financial Corp. | | | 2,803 | | | | 52 | | | | 0.52 | | |
Hershey Co. (The) | | | 361 | | | | 52 | | | | 0.52 | | |
Hill-Rom Holdings, Inc. | | | 547 | | | | 46 | | | | 0.46 | | |
Hilton Worldwide Holdings In | | | 700 | | | | 60 | | | | 0.60 | | |
Home Depot, Inc. | | | 197 | | | | 55 | | | | 0.55 | | |
Hp, Inc. | | | 2,946 | | | | 56 | | | | 0.56 | | |
Idex Corp. | | | 315 | | | | 57 | | | | 0.58 | | |
Ihs Markit Ltd. | | | 642 | | | | 50 | | | | 0.51 | | |
Illinois Tool Works | | | 282 | | | | 54 | | | | 0.55 | | |
Intercontinental Exchange In | | | 544 | | | | 54 | | | | 0.55 | | |
Intuit, Inc. | | | 168 | | | | 55 | | | | 0.55 | | |
Jack Henry & Associates, Inc. | | | 288 | | | | 47 | | | | 0.47 | | |
Jacobs Engineering Group, Inc. | | | 578 | | | | 54 | | | | 0.54 | | |
Johnson & Johnson | | | 355 | | | | 53 | | | | 0.53 | | |
Kilroy Realty Corp. | | | 918 | | | | 48 | | | | 0.48 | | |
Kinder Morgan, Inc. | | | 3,731 | | | | 46 | | | | 0.46 | | |
Kkr Real Estate Finance Trust | | | 3,146 | | | | 52 | | | | 0.52 | | |
Lennox International, Inc. | | | 194 | | | | 53 | | | | 0.53 | | |
Life Storage, Inc. | | | 533 | | | | 56 | | | | 0.56 | | |
Lincoln Electric Holdings | | | 569 | | | | 52 | | | | 0.53 | | |
The accompanying notes are an integral part of the consolidated financial statements.
38
Morgan Stanley Institutional Fund Trust
Annual Report — September 30, 2020
Consolidated Portfolio of Investments (cont'd)
Global Strategist Portfolio
Security Description | | Shares | | Value
(000) | | Index Weight | |
Linde PLC | | | 214 | | | $ | 51 | | | | 0.51 | % | |
Lindsay Corp. | | | 532 | | | | 51 | | | | 0.52 | | |
Lockheed Martin Corp. | | | 139 | | | | 53 | | | | 0.54 | | |
Lowe'S Cos, Inc. | | | 348 | | | | 58 | | | | 0.58 | | |
Marsh & Mclennan Cos | | | 452 | | | | 52 | | | | 0.52 | | |
Maximus, Inc. | | | 693 | | | | 47 | | | | 0.48 | | |
Mcdonald'S Corp. | | | 269 | | | | 59 | | | | 0.59 | | |
Merck & Co., Inc. | | | 634 | | | | 53 | | | | 0.53 | | |
Microsoft Corp. | | | 242 | | | | 51 | | | | 0.51 | | |
Microstrategy, Inc.-Cl A | | | 423 | | | | 64 | | | | 0.64 | | |
Mid-America Apartment Comm | | | 448 | | | | 52 | | | | 0.52 | | |
Mondelez International, Inc. — A | | | 943 | | | | 54 | | | | 0.55 | | |
Monro, Inc. | | | 896 | | | | 36 | | | | 0.37 | | |
Msa Safety, Inc. | | | 433 | | | | 58 | | | | 0.58 | | |
Msc Industrial Direct Co.-A | | | 774 | | | | 49 | | | | 0.49 | | |
N B T BanCorp., Inc. | | | 1,767 | | | | 47 | | | | 0.48 | | |
Nasdaq, Inc. | | | 402 | | | | 49 | | | | 0.50 | | |
National Instruments Corp. | | | 1,430 | | | | 51 | | | | 0.51 | | |
National Oilwell Varco, Inc. | | | 4,517 | | | | 41 | | | | 0.41 | | |
National Storage Affiliates | | | 1,691 | | | | 55 | | | | 0.56 | | |
Neenah, Inc. | | | 1,145 | | | | 43 | | | | 0.43 | | |
Netscout Systems, Inc. | | | 2,031 | | | | 44 | | | | 0.45 | | |
Newmarket Corp. | | | 142 | | | | 48 | | | | 0.49 | | |
Newmont Corp. | | | 768 | | | | 49 | | | | 0.49 | | |
Nike, Inc. — Cl B | | | 532 | | | | 67 | | | | 0.67 | | |
Northern Trust Corp. | | | 660 | | | | 51 | | | | 0.52 | | |
Northrop Grumman Corp. | | | 162 | | | | 51 | | | | 0.51 | | |
Northwest Bancshares, Inc. | | | 5,331 | | | | 49 | | | | 0.49 | | |
Nucor Corp. | | | 1,221 | | | | 55 | | | | 0.55 | | |
Nvr, Inc. | | | 14 | | | | 55 | | | | 0.56 | | |
Old National BanCorp. | | | 3,774 | | | | 47 | | | | 0.48 | | |
Old Republic Intl Corp. | | | 3,200 | | | | 47 | | | | 0.47 | | |
Omnicom Group | | | 975 | | | | 48 | | | | 0.49 | | |
O'Reilly Automotive, Inc. | | | 110 | | | | 51 | | | | 0.51 | | |
Otis Worldwide Corp. | | | 828 | | | | 52 | | | | 0.52 | | |
Pepsico, Inc. | | | 383 | | | | 53 | | | | 0.53 | | |
Power Integrations, Inc. | | | 863 | | | | 48 | | | | 0.48 | | |
Ppg Industries, Inc. | | | 488 | | | | 60 | | | | 0.60 | | |
Procter & Gamble Co. (The) | | | 399 | | | | 55 | | | | 0.56 | | |
Ps Business Parks, Inc. | | | 376 | | | | 46 | | | | 0.46 | | |
Public Storage | | | 267 | | | | 60 | | | | 0.60 | | |
Reliance Steel & Aluminum | | | 518 | | | | 53 | | | | 0.53 | | |
Republic Services, Inc. | | | 599 | | | | 56 | | | | 0.56 | | |
Resmed, Inc. | | | 259 | | | | 44 | | | | 0.45 | | |
Rex American Resources Corp. | | | 581 | | | | 38 | | | | 0.38 | | |
Ross Stores, Inc. | | | 596 | | | | 56 | | | | 0.56 | | |
S & T BanCorp., Inc. | | | 2,522 | | | | 45 | | | | 0.45 | | |
S&P Global, Inc. | | | 149 | | | | 54 | | | | 0.54 | | |
Safety Insurance Group, Inc. | | | 698 | | | | 48 | | | | 0.49 | | |
Schlumberger Ltd. | | | 2,797 | | | | 44 | | | | 0.44 | | |
Seacor Holdings, Inc. | | | 1,696 | | | | 49 | | | | 0.50 | | |
Service Corp. International | | | 1,176 | | | | 50 | | | | 0.50 | | |
Sherwin-Williams Co. (The) | | | 82 | | | | 57 | | | | 0.57 | | |
Sonoco Products Co. | | | 1,002 | | | | 51 | | | | 0.51 | | |
Southside Bancshares, Inc. | | | 1,911 | | | | 47 | | | | 0.47 | | |
Southwest Airlines Co. | | | 1,658 | | | | 62 | | | | 0.63 | | |
The accompanying notes are an integral part of the consolidated financial statements.
39
Morgan Stanley Institutional Fund Trust
Annual Report — September 30, 2020
Consolidated Portfolio of Investments (cont'd)
Global Strategist Portfolio
Security Description | | Shares | | Value
(000) | | Index Weight | |
Standard Motor Prods | | | 1,132 | | | $ | 51 | | | | 0.51 | % | |
Starbucks Corp. | | | 693 | | | | 60 | | | | 0.60 | | |
Steris PLC | | | 325 | | | | 57 | | | | 0.58 | | |
Stryker Corp. | | | 273 | | | | 57 | | | | 0.57 | | |
Texas Instruments, Inc. | | | 405 | | | | 58 | | | | 0.58 | | |
Thermo Fisher Scientific, Inc. | | | 125 | | | | 55 | | | | 0.56 | | |
Tjx Companies, Inc. | | | 1,009 | | | | 56 | | | | 0.56 | | |
Tompkins Financial Corp. | | | 819 | | | | 47 | | | | 0.47 | | |
Tootsie Roll Inds | | | 1,658 | | | | 51 | | | | 0.52 | | |
Toro Co. | | | 726 | | | | 61 | | | | 0.61 | | |
Tractor Supply Company | | | 355 | | | | 51 | | | | 0.51 | | |
Trane Technologies PLC | | | 467 | | | | 57 | | | | 0.57 | | |
Tyler Technologies, Inc. | | | 144 | | | | 50 | | | | 0.50 | | |
UDR, Inc. | | | 1,491 | | | | 49 | | | | 0.49 | | |
Union Pacific Corp. | | | 304 | | | | 60 | | | | 0.60 | | |
Unitedhealth Group, Inc. | | | 172 | | | | 54 | | | | 0.54 | | |
Verisign, Inc. | | | 247 | | | | 51 | | | | 0.51 | | |
Vertex Pharmaceuticals, Inc. | | | 187 | | | | 51 | | | | 0.51 | | |
Visa, Inc. — Class A Shares | | | 275 | | | | 55 | | | | 0.55 | | |
Walmart, Inc. | | | 405 | | | | 57 | | | | 0.57 | | |
Washington Federal, Inc. | | | 2,274 | | | | 47 | | | | 0.48 | | |
Waste Management, Inc. | | | 480 | | | | 54 | | | | 0.55 | | |
Watts Water Technologies — A | | | 609 | | | | 61 | | | | 0.61 | | |
Westamerica BanCorporation | | | 875 | | | | 48 | | | | 0.48 | | |
Williams Cos, Inc. | | | 2,655 | | | | 52 | | | | 0.52 | | |
Yum! Brands, Inc. | | | 576 | | | | 53 | | | | 0.53 | | |
Zoetis, Inc. | | | 339 | | | | 56 | | | | 0.56 | | |
Total | | | | $ | 9,940 | | | | 100.00 | % | |
The following table represents the equity basket holdings underlying the total return swap with JPM U.S. SPX 1500 Value Index as of September 30, 2020:
Security Description | | Shares | | Value
(000) | | Index Weight | |
JPM U.S. SPX 1500 Value Index | |
AAR Corp. | | | 3,015 | | | $ | 57 | | | | 0.55 | % | |
Advansix, Inc. | | | 4,275 | | | | 55 | | | | 0.54 | | |
Alliance Data Systems Corp. | | | 1,151 | | | | 48 | | | | 0.47 | | |
American Equity Invt Life Hl | | | 1,986 | | | | 44 | | | | 0.43 | | |
American International Group | | | 1,610 | | | | 44 | | | | 0.43 | | |
Apogee Enterprises, Inc. | | | 2,348 | | | | 50 | | | | 0.49 | | |
Arcbest Corp. | | | 1,653 | | | | 51 | | | | 0.50 | | |
Archer-Daniels-Midland Co. | | | 1,205 | | | | 56 | | | | 0.55 | | |
Archrock, Inc. | | | 7,476 | | | | 40 | | | | 0.39 | | |
Asbury Automotive Group | | | 513 | | | | 50 | | | | 0.49 | | |
Associated BancCorp. | | | 3,989 | | | | 50 | | | | 0.49 | | |
Atlas Air Worldwide Holdings | | | 970 | | | | 59 | | | | 0.58 | | |
Autonation, Inc. | | | 978 | | | | 52 | | | | 0.51 | | |
Avanos Medical, Inc. | | | 1,661 | | | | 55 | | | | 0.54 | | |
Avis Budget Group, Inc. | | | 2,038 | | | | 54 | | | | 0.52 | | |
Avnet, Inc. | | | 1,915 | | | | 49 | | | | 0.48 | | |
Azz, Inc. | | | 1,617 | | | | 55 | | | | 0.54 | | |
Baker Hughes Co. | | | 3,310 | | | | 44 | | | | 0.43 | | |
Bank Of New York Mellon Corp. | | | 1,436 | | | | 49 | | | | 0.48 | | |
Big Lots, Inc. | | | 1,263 | | | | 56 | | | | 0.55 | | |
Biogen, Inc. | | | 186 | | | | 53 | | | | 0.52 | | |
Bonanza Creek Energy, Inc. | | | 2,847 | | | | 54 | | | | 0.52 | | |
The accompanying notes are an integral part of the consolidated financial statements.
40
Morgan Stanley Institutional Fund Trust
Annual Report — September 30, 2020
Consolidated Portfolio of Investments (cont'd)
Global Strategist Portfolio
Security Description | | Shares | | Value
(000) | | Index Weight | |
Boston Private Finl Holding | | | 8,828 | | | $ | 49 | | | | 0.48 | % | |
Brinker International, Inc. | | | 1,991 | | | | 85 | | | | 0.83 | | |
Brixmor Property Group, Inc. | | | 4,538 | | | | 53 | | | | 0.52 | | |
Cadence BanCorp. | | | 6,641 | | | | 57 | | | | 0.56 | | |
Callon Petroleum Co. | | | 4,384 | | | | 21 | | | | 0.21 | | |
Capri Holdings Ltd. | | | 3,693 | | | | 66 | | | | 0.65 | | |
Cardinal Health, Inc. | | | 891 | | | | 42 | | | | 0.41 | | |
Cardtronics PLC — A | | | 2,353 | | | | 47 | | | | 0.46 | | |
Carnival Corp. | | | 3,958 | | | | 60 | | | | 0.59 | | |
Cato Corp.-Class A | | | 6,011 | | | | 47 | | | | 0.46 | | |
Centerpoint Energy, Inc. | | | 2,678 | | | | 52 | | | | 0.51 | | |
Central Garden And Pet Co. — A | | | 1,421 | | | | 51 | | | | 0.50 | | |
Century Communities, Inc. | | | 1,417 | | | | 60 | | | | 0.59 | | |
Centurylink, Inc. | | | 5,279 | | | | 53 | | | | 0.52 | | |
Citigroup, Inc. | | | 1,027 | | | | 44 | | | | 0.43 | | |
Citizens Financial Group | | | 2,135 | | | | 54 | | | | 0.53 | | |
Cno Financial Group, Inc. | | | 3,381 | | | | 54 | | | | 0.53 | | |
Cnx Resources Corp. | | | 5,097 | | | | 48 | | | | 0.47 | | |
Comerica, Inc. | | | 1,360 | | | | 52 | | | | 0.51 | | |
Commercial Metals Co. | | | 2,428 | | | | 49 | | | | 0.47 | | |
Computer Programs & Systems | | | 1,440 | | | | 40 | | | | 0.39 | | |
Comtech Telecommunications | | | 3,128 | | | | 44 | | | | 0.43 | | |
Cooper-Standard Holding | | | 4,538 | | | | 60 | | | | 0.59 | | |
Corecivic, Inc. | | | 5,800 | | | | 46 | | | | 0.45 | | |
Crane Co. | | | 899 | | | | 45 | | | | 0.44 | | |
Customers BanCorp., Inc. | | | 4,433 | | | | 50 | | | | 0.49 | | |
Cvs Health Corp. | | | 810 | | | | 47 | | | | 0.46 | | |
Dana, Inc. | | | 4,297 | | | | 53 | | | | 0.52 | | |
Dave & Buster'S Entertainment | | | 4,297 | | | | 65 | | | | 0.64 | | |
Deluxe Corp. | | | 1,761 | | | | 45 | | | | 0.44 | | |
Diamondrock Hospitality Co. | | | 11,420 | | | | 58 | | | | 0.57 | | |
Dine Brands Global, Inc. | | | 1,165 | | | | 64 | | | | 0.62 | | |
Diodes, Inc. | | | 985 | | | | 56 | | | | 0.54 | | |
Discovery, Inc. — C | | | 2,704 | | | | 53 | | | | 0.52 | | |
Donnelley Financial Solution | | | 5,347 | | | | 71 | | | | 0.70 | | |
Dorian Lpg Ltd. | | | 5,780 | | | | 46 | | | | 0.45 | | |
Dxc Technology Co. | | | 2,850 | | | | 51 | | | | 0.50 | | |
Dxp Enterprises, Inc. | | | 2,832 | | | | 46 | | | | 0.45 | | |
Eastman Chemical Co. | | | 688 | | | | 54 | | | | 0.53 | | |
Ebay, Inc. | | | 915 | | | | 48 | | | | 0.47 | | |
Ebix, Inc. | | | 2,295 | | | | 47 | | | | 0.46 | | |
Edgewell Personal Care Co. | | | 1,677 | | | | 47 | | | | 0.46 | | |
Endo International PLC | | | 14,291 | | | | 47 | | | | 0.46 | | |
Enova International, Inc. | | | 3,199 | | | | 52 | | | | 0.51 | | |
Enpro Industries, Inc. | | | 1,075 | | | | 61 | | | | 0.59 | | |
Exelon Corp. | | | 1,362 | | | | 49 | | | | 0.48 | | |
Fifth Third BanCorp. | | | 2,634 | | | | 56 | | | | 0.55 | | |
First Solar, Inc. | | | 850 | | | | 56 | | | | 0.55 | | |
Fnb Corp. | | | 7,000 | | | | 47 | | | | 0.46 | | |
Fresh Del Monte Produce, Inc. | | | 2,237 | | | | 51 | | | | 0.50 | | |
Garrett Motion, Inc. | | | 9,238 | | | | 32 | | | | 0.31 | | |
Genworth Financial, Inc. — Cl A | | | 25,236 | | | | 85 | | | | 0.83 | | |
Geo Group, Inc. (The) | | | 4,703 | | | | 53 | | | | 0.52 | | |
G-Iii Apparel Group Ltd. | | | 5,372 | | | | 70 | | | | 0.69 | | |
Gms, Inc. | | | 2,099 | | | | 51 | | | | 0.49 | | |
Graham Holdings Co. — Class B | | | 129 | | | | 52 | | | | 0.51 | | |
The accompanying notes are an integral part of the consolidated financial statements.
41
Morgan Stanley Institutional Fund Trust
Annual Report — September 30, 2020
Consolidated Portfolio of Investments (cont'd)
Global Strategist Portfolio
Security Description | | Shares | | Value
(000) | | Index Weight | |
Granite Point Mortgage Trust | | | 7,642 | | | $ | 54 | | | | 0.53 | % | |
Greenbrier Companies, Inc. | | | 2,042 | | | | 60 | | | | 0.59 | | |
Greif, Inc. — Cl A | | | 1,450 | | | | 53 | | | | 0.51 | | |
Group 1 Automotive, Inc. | | | 584 | | | | 52 | | | | 0.50 | | |
Hibbett Sports, Inc. | | | 2,221 | | | | 87 | | | | 0.85 | | |
Hologic, Inc. | | | 725 | | | | 48 | | | | 0.47 | | |
Hope BanCorp., Inc. | | | 6,196 | | | | 47 | | | | 0.46 | | |
Howmet Aerospace, Inc. | | | 3,419 | | | | 57 | | | | 0.56 | | |
Insight Enterprises, Inc. | | | 1,018 | | | | 58 | | | | 0.56 | | |
Integer Holdings Corp. | | | 789 | | | | 47 | | | | 0.46 | | |
Interface, Inc. | | | 6,379 | | | | 39 | | | | 0.38 | | |
Intl Business Machines Corp. | | | 416 | | | | 51 | | | | 0.49 | | |
Istar, Inc. | | | 4,491 | | | | 53 | | | | 0.52 | | |
J2 Global, Inc. | | | 884 | | | | 61 | | | | 0.60 | | |
Janus Henderson Group PLC | | | 2,471 | | | | 54 | | | | 0.52 | | |
KB Home | | | 1,523 | | | | 58 | | | | 0.57 | | |
KBR, Inc. | | | 2,260 | | | | 51 | | | | 0.49 | | |
Kelly Services, Inc. — A | | | 3,440 | | | | 59 | | | | 0.57 | | |
Koppers Holdings, Inc. | | | 2,042 | | | | 43 | | | | 0.42 | | |
Kraton Corp. | | | 3,790 | | | | 68 | | | | 0.66 | | |
Lannett Co, Inc. | | | 8,264 | | | | 50 | | | | 0.49 | | |
Lantheus Holdings, Inc. | | | 3,890 | | | | 49 | | | | 0.48 | | |
Laredo Petroleum, Inc. | | | 3,558 | | | | 35 | | | | 0.34 | | |
Lincoln National Corp. | | | 1,377 | | | | 43 | | | | 0.42 | | |
Lyondellbasell Indu — Cl A | | | 833 | | | | 59 | | | | 0.57 | | |
M/I Homes, Inc. | | | 1,219 | | | | 56 | | | | 0.55 | | |
Macerich Co. (The) | | | 6,807 | | | | 46 | | | | 0.45 | | |
Manpowergroup, Inc. | | | 750 | | | | 55 | | | | 0.54 | | |
Marcus Corporation | | | 3,887 | | | | 30 | | | | 0.29 | | |
Mastec, Inc. | | | 1,211 | | | | 51 | | | | 0.50 | | |
Matrix Service Co. | | | 4,129 | | | | 34 | | | | 0.34 | | |
Mdu Resources Group, Inc. | | | 2,443 | | | | 55 | | | | 0.54 | | |
Meredith Corp. | | | 3,583 | | | | 47 | | | | 0.46 | | |
Meritor, Inc. | | | 2,229 | | | | 47 | | | | 0.46 | | |
Meta Financial Group, Inc. | | | 2,793 | | | | 54 | | | | 0.52 | | |
Metlife, Inc. | | | 1,387 | | | | 52 | | | | 0.50 | | |
Micron Technology, Inc. | | | 1,027 | | | | 48 | | | | 0.47 | | |
Minerals Technologies, Inc. | | | 1,010 | | | | 52 | | | | 0.50 | | |
Mohawk Industries, Inc. | | | 651 | | | | 64 | | | | 0.62 | | |
Molson Coors Beverage Co. — B | | | 1,405 | | | | 47 | | | | 0.46 | | |
Moog, Inc. — Class A | | | 959 | | | | 61 | | | | 0.60 | | |
Mts Systems Corp. | | | 2,737 | | | | 52 | | | | 0.51 | | |
Mylan N.V. | | | 3,162 | | | | 47 | | | | 0.46 | | |
Natus Medical, Inc. | | | 2,944 | | | | 50 | | | | 0.49 | | |
Navient Corp. | | | 6,379 | | | | 54 | | | | 0.53 | | |
Netgear, Inc. | | | 1,607 | | | | 50 | | | | 0.48 | | |
Nrg Energy, Inc. | | | 1,546 | | | | 48 | | | | 0.46 | | |
Odp Corp. (The) | | | 2,431 | | | | 47 | | | | 0.46 | | |
Oge Energy Corp. | | | 1,599 | | | | 48 | | | | 0.47 | | |
Orthofix Medical, Inc. | | | 1,659 | | | | 52 | | | | 0.50 | | |
Oshkosh Corp. | | | 648 | | | | 48 | | | | 0.47 | | |
Owens & Minor, Inc. | | | 3,041 | | | | 76 | | | | 0.75 | | |
Pebblebrook Hotel Trust | | | 4,989 | | | | 63 | | | | 0.61 | | |
Penn Virginia Corp. | | | 5,184 | | | | 51 | | | | 0.50 | | |
Photronics, Inc. | | | 4,251 | | | | 42 | | | | 0.41 | | |
Pilgrim'S Pride Corp. | | | 3,422 | | | | 51 | | | | 0.50 | | |
The accompanying notes are an integral part of the consolidated financial statements.
42
Morgan Stanley Institutional Fund Trust
Annual Report — September 30, 2020
Consolidated Portfolio of Investments (cont'd)
Global Strategist Portfolio
Security Description | | Shares | | Value
(000) | | Index Weight | |
Polaris, Inc. | | | 488 | | | $ | 46 | | | | 0.45 | % | |
Powell Industries, Inc. | | | 1,145 | | | | 28 | | | | 0.27 | | |
Pra Health Sciences, Inc. | | | 479 | | | | 49 | | | | 0.47 | | |
Progress Software Corp. | | | 1,439 | | | | 53 | | | | 0.52 | | |
Propetro Holding Corp. | | | 9,355 | | | | 38 | | | | 0.37 | | |
Quanex Building Products | | | 2,895 | | | | 53 | | | | 0.52 | | |
Quanta Services, Inc. | | | 1,256 | | | | 66 | | | | 0.65 | | |
Quinstreet, Inc. | | | 4,347 | | | | 69 | | | | 0.67 | | |
Reinsurance Group Of America | | | 608 | | | | 58 | | | | 0.57 | | |
Renewable Energy Group, Inc. | | | 1,820 | | | | 97 | | | | 0.95 | | |
Resideo Technologies, Inc. | | | 4,656 | | | | 51 | | | | 0.50 | | |
| RPT Realty | | | 8,551 | | | | 47 | | | | 0.45 | | |
RR Donnelley & Sons Co. | | | 32,657 | | | | 48 | | | | 0.47 | | |
Ruth'S Hospitality Group, Inc. | | | 7,827 | | | | 87 | | | | 0.85 | | |
Sabra Health Care Reit, Inc. | | | 3,595 | | | | 50 | | | | 0.48 | | |
Sally Beauty Holdings, Inc. | | | 4,479 | | | | 39 | | | | 0.38 | | |
Sanmina Corp. | | | 1,735 | | | | 47 | | | | 0.46 | | |
Scansource, Inc. | | | 2,171 | | | | 43 | | | | 0.42 | | |
Schweitzer-Mauduit Intl, Inc. | | | 1,574 | | | | 48 | | | | 0.47 | | |
Select Medical Holdings Corp. | | | 2,727 | | | | 57 | | | | 0.55 | | |
Service Properties Trust | | | 8,077 | | | | 64 | | | | 0.63 | | |
Signet Jewelers Ltd. | | | 4,690 | | | | 88 | | | | 0.86 | | |
Simmons First Natl Corp. — Cl A | | | 3,089 | | | | 49 | | | | 0.48 | | |
Simon Property Group, Inc. | | | 848 | | | | 55 | | | | 0.54 | | |
Skywest, Inc. | | | 1,914 | | | | 57 | | | | 0.56 | | |
Sl Green Realty Corp. | | | 1,127 | | | | 52 | | | | 0.51 | | |
Smart Global Holdings, Inc. | | | 1,831 | | | | 50 | | | | 0.49 | | |
Spartannash Co. | | | 2,412 | | | | 39 | | | | 0.39 | | |
Standex International Corp. | | | 950 | | | | 56 | | | | 0.55 | | |
Sterling BanCorp. | | | 4,623 | | | | 49 | | | | 0.48 | | |
Stifel Financial Corp. | | | 1,056 | | | | 53 | | | | 0.52 | | |
Summit Hotel Properties, Inc. | | | 10,224 | | | | 53 | | | | 0.52 | | |
Suncoke Energy, Inc. | | | 15,443 | | | | 53 | | | | 0.52 | | |
Sykes Enterprises, Inc. | | | 1,809 | | | | 62 | | | | 0.60 | | |
Syneos Health, Inc. | | | 795 | | | | 42 | | | | 0.41 | | |
Synnex Corp. | | | 408 | | | | 57 | | | | 0.56 | | |
Synovus Financial Corp. | | | 2,585 | | | | 55 | | | | 0.53 | | |
Tanger Factory Outlet Center | | | 8,264 | | | | 50 | | | | 0.49 | | |
Tapestry, Inc. | | | 3,878 | | | | 61 | | | | 0.59 | | |
Timken Co. | | | 1,038 | | | | 56 | | | | 0.55 | | |
Tyson Foods, Inc. — Cl A | | | 829 | | | | 49 | | | | 0.48 | | |
Ugi Corp. | | | 1,560 | | | | 51 | | | | 0.50 | | |
Ultra Clean Holdings, Inc. | | | 1,714 | | | | 37 | | | | 0.36 | | |
United Therapeutics Corp. | | | 444 | | | | 45 | | | | 0.44 | | |
Universal Health Services-B | | | 480 | | | | 51 | | | | 0.50 | | |
Unum Group | | | 3,031 | | | | 51 | | | | 0.50 | | |
Vanda Pharmaceuticals, Inc. | | | 4,894 | | | | 47 | | | | 0.46 | | |
Varex Imaging Corp. | | | 3,237 | | | | 41 | | | | 0.40 | | |
Viacomcbs, Inc. — Class B | | | 2,013 | | | | 56 | | | | 0.55 | | |
Viad Corp. | | | 3,522 | | | | 73 | | | | 0.72 | | |
Wabash National Corp. | | | 4,452 | | | | 53 | | | | 0.52 | | |
Waddell & Reed Financial — A | | | 3,580 | | | | 53 | | | | 0.52 | | |
Walgreens Boots Alliance, Inc. | | | 1,259 | | | | 45 | | | | 0.44 | | |
Walker & Dunlop, Inc. | | | 1,016 | | | | 54 | | | | 0.53 | | |
Warrior Met Coal, Inc. | | | 3,201 | | | | 55 | | | | 0.53 | | |
Weingarten Realty Investors | | | 3,036 | | | | 51 | | | | 0.50 | | |
The accompanying notes are an integral part of the consolidated financial statements.
43
Morgan Stanley Institutional Fund Trust
Annual Report — September 30, 2020
Consolidated Portfolio of Investments (cont'd)
Global Strategist Portfolio
Security Description | | Shares | | Value
(000) | | Index Weight | |
Westrock Co. | | | 1,860 | | | $ | 65 | | | | 0.63 | % | |
Whitestone REIT | | | 8,021 | | | | 48 | | | | 0.47 | | |
Wyndham Destinations, Inc. | | | 1,968 | | | | 61 | | | | 0.59 | | |
Xerox Holdings Corp. | | | 3,231 | | | | 61 | | | | 0.59 | | |
Xperi Holding Corp. | | | 2,726 | | | | 31 | | | | 0.31 | | |
Total | | | | $ | 10,234 | | | | 100.00 | % | |
The following table represents the equity basket holdings underlying the total return swap with JPM U.S. SPX 500 Growth Index as of September 30, 2020:
Security Description | | Shares | | Value
(000) | | Index Weight | |
JPM U.S. SPX 500 Growth Index | |
Abiomed, Inc. | | | 318 | | | $ | 88 | | | | 0.87 | % | |
Adobe, Inc. | | | 219 | | | | 107 | | | | 1.06 | | |
Advanced Micro Devices | | | 1,262 | | | | 103 | | | | 1.02 | | |
Air Products & Chemicals, Inc. | | | 352 | | | | 105 | | | | 1.04 | | |
Alexandria Real Estate Equity | | | 556 | | | | 89 | | | | 0.88 | | |
Align Technology, Inc. | | | 341 | | | | 112 | | | | 1.10 | | |
Amazon.Com, Inc. | | | 32 | | | | 99 | | | | 0.98 | | |
American Tower Corp. | | | 382 | | | | 92 | | | | 0.91 | | |
American Water Works Co., Inc. | | | 667 | | | | 97 | | | | 0.95 | | |
Ansys, Inc. | | | 311 | | | | 102 | | | | 1.01 | | |
Aon PLC — Class A | | | 490 | | | | 101 | | | | 1.00 | | |
Apache Corp. | | | 6,237 | | | | 59 | | | | 0.58 | | |
Arthur J Gallagher & Co. | | | 924 | | | | 98 | | | | 0.96 | | |
Autodesk, Inc. | | | 409 | | | | 95 | | | | 0.93 | | |
Ball Corp. | | | 1,322 | | | | 110 | | | | 1.09 | | |
Berkshire Hathaway, Inc. — Cl B | | | 492 | | | | 105 | | | | 1.03 | | |
Blackrock, Inc. | | | 169 | | | | 95 | | | | 0.94 | | |
Boeing Co. (The) | | | 604 | | | | 100 | | | | 0.99 | | |
Brown-Forman Corp. — Class B | | | 1,420 | | | | 107 | | | | 1.06 | | |
Cadence Design System, Inc. | | | 877 | | | | 94 | | | | 0.92 | | |
Chipotle Mexican Grill, Inc. | | | 85 | | | | 106 | | | | 1.05 | | |
Church & Dwight Co., Inc. | | | 1,050 | | | | 98 | | | | 0.97 | | |
Cintas Corp. | | | 328 | | | | 109 | | | | 1.08 | | |
Clorox Company | | | 423 | | | | 89 | | | | 0.88 | | |
Cme Group, Inc. | | | 601 | | | | 101 | | | | 0.99 | | |
Cms Energy Corp. | | | 1,557 | | | | 96 | | | | 0.94 | | |
Copart, Inc. | | | 1,051 | | | | 111 | | | | 1.09 | | |
Costco Wholesale Corp. | | | 298 | | | | 106 | | | | 1.04 | | |
Crown Castle Intl Corp. | | | 597 | | | | 99 | | | | 0.98 | | |
Dexcom, Inc. | | | 221 | | | | 91 | | | | 0.90 | | |
Domino'S Pizza, Inc. | | | 253 | | | | 108 | | | | 1.06 | | |
Ecolab, Inc. | | | 532 | | | | 106 | | | | 1.05 | | |
Edwards Lifesciences Corp. | | | 1,257 | | | | 100 | | | | 0.99 | | |
Equifax, Inc. | | | 602 | | | | 94 | | | | 0.93 | | |
Equinix, Inc. | | | 126 | | | | 96 | | | | 0.94 | | |
Estee Lauder Companies — Cl A | | | 495 | | | | 108 | | | | 1.07 | | |
Eversource Energy | | | 1,096 | | | | 92 | | | | 0.90 | | |
Fastenal Co. | | | 2,066 | | | | 93 | | | | 0.92 | | |
First Republic Bank | | | 868 | | | | 95 | | | | 0.94 | | |
Fortinet, Inc. | | | 709 | | | | 84 | | | | 0.83 | | |
Gap, Inc. (The) | | | 7,478 | | | | 127 | | | | 1.26 | | |
Hess Corp. | | | 1,967 | | | | 81 | | | | 0.80 | | |
Hilton Worldwide Holdings In | | | 1,312 | | | | 112 | | | | 1.11 | | |
Idex Corp. | | | 590 | | | | 108 | | | | 1.06 | | |
The accompanying notes are an integral part of the consolidated financial statements.
44
Morgan Stanley Institutional Fund Trust
Annual Report — September 30, 2020
Consolidated Portfolio of Investments (cont'd)
Global Strategist Portfolio
Security Description | | Shares | | Value
(000) | | Index Weight | |
Idexx Laboratories, Inc. | | | 250 | | | $ | 98 | | | | 0.97 | % | |
Ihs Markit Ltd. | | | 1,202 | | | | 94 | | | | 0.93 | | |
Illinois Tool Works | | | 527 | | | | 102 | | | | 1.01 | | |
Illumina, Inc. | | | 246 | | | | 76 | | | | 0.75 | | |
Incyte Corp. | | | 963 | | | | 86 | | | | 0.85 | | |
Intercontinental Exchange In | | | 1,018 | | | | 102 | | | | 1.01 | | |
Intl Flavors & Fragrances | | | 787 | | | | 96 | | | | 0.95 | | |
Intuit, Inc. | | | 315 | | | | 103 | | | | 1.01 | | |
Intuitive Surgical, Inc. | | | 142 | | | | 101 | | | | 1.00 | | |
Jack Henry & Associates, Inc. | | | 539 | | | | 88 | | | | 0.87 | | |
Linde PLC | | | 401 | | | | 96 | | | | 0.94 | | |
Live Nation Entertainment In | | | 2,101 | | | | 113 | | | | 1.12 | | |
Marathon Petroleum Corp. | | | 2,542 | | | | 75 | | | | 0.74 | | |
Marketaxess Holdings, Inc. | | | 192 | | | | 92 | | | | 0.91 | | |
Marsh & Mclennan Cos | | | 846 | | | | 97 | | | | 0.96 | | |
Mastercard, Inc. — A | | | 314 | | | | 106 | | | | 1.05 | | |
Mccormick & Co.-Non Vtg Shares | | | 499 | | | | 97 | | | | 0.96 | | |
Mcdonald'S Corp. | | | 504 | | | | 111 | | | | 1.09 | | |
Mettler-Toledo International | | | 106 | | | | 102 | | | | 1.01 | | |
Monster Beverage Corp. | | | 1,259 | | | | 101 | | | | 1.00 | | |
Moody'S Corp. | | | 349 | | | | 101 | | | | 1.00 | | |
Msci, Inc. | | | 264 | | | | 94 | | | | 0.93 | | |
Nasdaq, Inc. | | | 752 | | | | 92 | | | | 0.91 | | |
National Oilwell Varco, Inc. | | | 8,459 | | | | 77 | | | | 0.76 | | |
Netflix, Inc. | | | 197 | | | | 98 | | | | 0.97 | | |
Nextera Energy, Inc. | | | 353 | | | | 98 | | | | 0.97 | | |
Nike, Inc. — Cl B | | | 997 | | | | 125 | | | | 1.24 | | |
Nvidia Corp. | | | 223 | | | | 120 | | | | 1.19 | | |
Old Dominion Freight Line | | | 537 | | | | 97 | | | | 0.96 | | |
Otis Worldwide Corp. | | | 1,551 | | | | 97 | | | | 0.96 | | |
Paycom Software, Inc. | | | 340 | | | | 106 | | | | 1.05 | | |
Paypal Holdings, Inc. | | | 497 | | | | 98 | | | | 0.97 | | |
Prologis, Inc. | | | 934 | | | | 94 | | | | 0.93 | | |
Resmed, Inc. | | | 485 | | | | 83 | | | | 0.82 | | |
Rockwell Automation, Inc. | | | 444 | | | | 98 | | | | 0.97 | | |
Rollins, Inc. | | | 1,852 | | | | 100 | | | | 0.99 | | |
Roper Technologies, Inc. | | | 225 | | | | 89 | | | | 0.88 | | |
S&P Global, Inc. | | | 280 | | | | 101 | | | | 1.00 | | |
Salesforce.Com, Inc. | | | 483 | | | | 121 | | | | 1.19 | | |
Sba Communications Corp. | | | 321 | | | | 102 | | | | 1.01 | | |
Schlumberger Ltd. | | | 5,237 | | | | 81 | | | | 0.80 | | |
Servicenow, Inc. | | | 223 | | | | 108 | | | | 1.07 | | |
Sherwin-Williams Co. (The) | | | 153 | | | | 107 | | | | 1.05 | | |
Starbucks Corp. | | | 1,299 | | | | 112 | | | | 1.10 | | |
TJX Companies, Inc. | | | 1,889 | | | | 105 | | | | 1.04 | | |
T-Mobile US, Inc. | | | 917 | | | | 105 | | | | 1.04 | | |
Transdigm Group, Inc. | | | 225 | | | | 107 | | | | 1.06 | | |
Tyler Technologies, Inc. | | | 269 | | | | 94 | | | | 0.93 | | |
Under Armour, Inc. — Class A | | | 10,138 | | | | 114 | | | | 1.11 | | |
Under Armour, Inc. — Class C | | | 11,153 | | | | 110 | | | | 1.08 | | |
Verisign, Inc. | | | 462 | | | | 95 | | | | 0.94 | | |
Verisk Analytics, Inc. | | | 524 | | | | 97 | | | | 0.96 | | |
Wec Energy Group, Inc. | | | 1,047 | | | | 101 | | | | 1.00 | | |
West Pharmaceutical Services | | | 352 | | | | 97 | | | | 0.96 | | |
Wynn Resorts Ltd. | | | 1,342 | | | | 96 | | | | 0.95 | | |
Xcel Energy, Inc. | | | 1,426 | | | | 98 | | | | 0.97 | | |
The accompanying notes are an integral part of the consolidated financial statements.
45
Morgan Stanley Institutional Fund Trust
Annual Report — September 30, 2020
Consolidated Portfolio of Investments (cont'd)
Global Strategist Portfolio
Security Description | | Shares | | Value
(000) | | Index Weight | |
Yum! Brands, Inc. | | | 1,078 | | | $ | 98 | | | | 0.97 | % | |
Zoetis, Inc. | | | 635 | | | | 105 | | | | 1.04 | | |
Total | | | | $ | 10,125 | | | | 100.00 | % | |
The following table represents the equity basket holdings underlying the total return swap with JPM U.S. SPX 500 Low Vol Index as of September 30, 2020:
Security Description | | Shares | | Value
(000) | | Index Weight | |
JPM U.S. SPX 500 Low Vol Index | |
3M Co. | | | 693 | | | $ | 111 | | | | 1.08 | % | |
Abbott Laboratories | | | 1,035 | | | | 113 | | | | 1.10 | | |
Accenture PLC — Cl A | | | 459 | | | | 104 | | | | 1.01 | | |
Air Products & Chemicals, Inc. | | | 374 | | | | 111 | | | | 1.09 | | |
Akamai Technologies, Inc. | | | 922 | | | | 102 | | | | 0.99 | | |
Alexandria Real Estate Equity | | | 591 | | | | 95 | | | | 0.92 | | |
Alphabet, Inc. — Cl A | | | 70 | | | | 103 | | | | 1.00 | | |
Alphabet, Inc. — Cl C | | | 71 | | | | 104 | | | | 1.01 | | |
Ameren Corporation | | | 1,314 | | | | 104 | | | | 1.01 | | |
American Tower Corp. | | | 406 | | | | 98 | | | | 0.96 | | |
Amgen, Inc. | | | 421 | | | | 107 | | | | 1.04 | | |
Aon PLC — Class A | | | 520 | | | | 107 | | | | 1.05 | | |
Arthur J Gallagher & Co. | | | 982 | | | | 104 | | | | 1.01 | | |
Atmos Energy Corp. | | | 989 | | | | 95 | | | | 0.92 | | |
Automatic Data Processing | | | 775 | | | | 108 | | | | 1.05 | | |
Autozone, Inc. | | | 86 | | | | 102 | | | | 0.99 | | |
Ball Corp. | | | 1,404 | | | | 117 | | | | 1.14 | | |
Baxter International, Inc. | | | 1,253 | | | | 101 | | | | 0.98 | | |
Berkshire Hathaway, Inc. — Cl B | | | 523 | | | | 111 | | | | 1.09 | | |
Booking Holdings, Inc. | | | 63 | | | | 108 | | | | 1.05 | | |
C.H. Robinson Worldwide, Inc. | | | 1,114 | | | | 114 | | | | 1.11 | | |
Cabot Oil & Gas Corp. | | | 5,448 | | | | 95 | | | | 0.92 | | |
Carrier Global Corp. | | | 3,771 | | | | 115 | | | | 1.12 | | |
Cerner Corp. | | | 1,514 | | | | 109 | | | | 1.07 | | |
Chevron Corp. | | | 1,228 | | | | 88 | | | | 0.86 | | |
Cme Group, Inc. | | | 639 | | | | 107 | | | | 1.04 | | |
Cms Energy Corp. | | | 1,654 | | | | 102 | | | | 0.99 | | |
Coca-Cola Co. (The) | | | 2,250 | | | | 111 | | | | 1.08 | | |
Colgate-Palmolive Co. | | | 1,360 | | | | 105 | | | | 1.02 | | |
Comcast Corp — Class A | | | 2,429 | | | | 112 | | | | 1.10 | | |
Costco Wholesale Corp. | | | 316 | | | | 112 | | | | 1.09 | | |
Crown Castle Intl Corp. | | | 635 | | | | 106 | | | | 1.03 | | |
Danaher Corp. | | | 504 | | | | 108 | | | | 1.06 | | |
Dollar General Corp. | | | 540 | | | | 113 | | | | 1.10 | | |
Dominion Energy, Inc. | | | 1,297 | | | | 102 | | | | 1.00 | | |
Duke Realty Corp. | | | 2,626 | | | | 97 | | | | 0.94 | | |
Ecolab, Inc. | | | 565 | | | | 113 | | | | 1.10 | | |
Eli Lilly & Co. | | | 682 | | | | 101 | | | | 0.98 | | |
Eversource Energy | | | 1,164 | | | | 97 | | | | 0.95 | | |
Expeditors Intl Wash, Inc. | | | 1,214 | | | | 110 | | | | 1.07 | | |
Exxon Mobil Corp. | | | 2,465 | | | | 85 | | | | 0.83 | | |
Fidelity National Info Serv | | | 699 | | | | 103 | | | | 1.00 | | |
Fiserv, Inc. | | | 1,036 | | | | 107 | | | | 1.04 | | |
Garmin Ltd. | | | 1,042 | | | | 99 | | | | 0.96 | | |
Hershey Co. (The) | | | 719 | | | | 103 | | | | 1.00 | | |
Hilton Worldwide Holdings In | | | 1,394 | | | | 119 | | | | 1.16 | | |
The accompanying notes are an integral part of the consolidated financial statements.
46
Morgan Stanley Institutional Fund Trust
Annual Report — September 30, 2020
Consolidated Portfolio of Investments (cont'd)
Global Strategist Portfolio
Security Description | | Shares | | Value
(000) | | Index Weight | |
Home Depot, Inc. | | | 391 | | | $ | 109 | | | | 1.06 | % | |
Honeywell Internationa,l Inc. | | | 701 | | | | 115 | | | | 1.13 | | |
Idex Corp. | | | 626 | | | | 114 | | | | 1.11 | | |
Ihs Markit Ltd. | | | 1,277 | | | | 100 | | | | 0.98 | | |
Illinois Tool Works | | | 560 | | | | 108 | | | | 1.06 | | |
Intercontinental Exchange In | | | 1,082 | | | | 108 | | | | 1.06 | | |
Intuit, Inc. | | | 334 | | | | 109 | | | | 1.06 | | |
Jack Henry & Associates, Inc. | | | 572 | | | | 93 | | | | 0.91 | | |
Johnson & Johnson | | | 707 | | | | 105 | | | | 1.03 | | |
Kimberly-Clark Corp. | | | 687 | | | | 101 | | | | 0.99 | | |
Linde PLC | | | 426 | | | | 102 | | | | 0.99 | | |
Marsh & Mclennan Cos | | | 899 | | | | 103 | | | | 1.01 | | |
Mastercard, Inc. — A | | | 333 | | | | 113 | | | | 1.10 | | |
Mcdonald'S Corp. | | | 536 | | | | 118 | | | | 1.16 | | |
Medtronic PLC | | | 1,070 | | | | 111 | | | | 1.08 | | |
Merck & Co. Inc. | | | 1,262 | | | | 105 | | | | 1.02 | | |
Microsoft Corp. | | | 481 | | | | 101 | | | | 0.99 | | |
Nasdaq, Inc. | | | 799 | | | | 98 | | | | 0.96 | | |
Nike, Inc. — Cl B | | | 1,059 | | | | 133 | | | | 1.30 | | |
Northrop Grumman Corp. | | | 322 | | | | 102 | | | | 0.99 | | |
Oracle Corp. | | | 1,861 | | | | 111 | | | | 1.08 | | |
Otis Worldwide Corp. | | | 1,648 | | | | 103 | | | | 1.00 | | |
Packaging Corp Of America | | | 1,086 | | | | 118 | | | | 1.15 | | |
Paychex, Inc. | | | 1,432 | | | | 114 | | | | 1.11 | | |
Pepsico, Inc. | | | 762 | | | | 106 | | | | 1.03 | | |
Procter & Gamble Co. (The) | | | 793 | | | | 110 | | | | 1.08 | | |
Progressive Corp. | | | 1,159 | | | | 110 | | | | 1.07 | | |
Public Storage | | | 532 | | | | 118 | | | | 1.15 | | |
Republic Services, Inc. | | | 1,191 | | | | 111 | | | | 1.08 | | |
Roper Technologies, Inc. | | | 239 | | | | 95 | | | | 0.92 | | |
Ross Stores, Inc. | | | 1,185 | | | | 111 | | | | 1.08 | | |
S&P Global, Inc. | | | 297 | | | | 107 | | | | 1.04 | | |
Starbucks Corp. | | | 1,380 | | | | 119 | | | | 1.17 | | |
Steris PLC | | | 647 | | | | 114 | | | | 1.11 | | |
Thermo Fisher Scientific, Inc. | | | 249 | | | | 110 | | | | 1.07 | | |
Tjx Companies, Inc. | | | 2,007 | | | | 112 | | | | 1.09 | | |
T-Mobile US, Inc. | | | 975 | | | | 111 | | | | 1.09 | | |
Travelers Cos, Inc. (The) | | | 911 | | | | 99 | | | | 0.96 | | |
UDR, Inc. | | | 2,966 | | | | 97 | | | | 0.94 | | |
Union Pacific Corp. | | | 605 | | | | 119 | | | | 1.17 | | |
Verisign, Inc. | | | 491 | | | | 101 | | | | 0.98 | | |
Verisk Analytics, Inc. | | | 557 | | | | 103 | | | | 1.01 | | |
Visa, Inc. — Class A Shares | | | 546 | | | | 109 | | | | 1.07 | | |
Vulcan Materials Co. | | | 886 | | | | 120 | | | | 1.17 | | |
Walt Disney Co. (The) | | | 895 | | | | 111 | | | | 1.08 | | |
Waste Management, Inc. | | | 956 | | | | 108 | | | | 1.05 | | |
Wec Energy Group, Inc. | | | 1,112 | | | | 108 | | | | 1.05 | | |
Williams Cos Inc | | | 5,282 | | | | 104 | | | | 1.01 | | |
Wr Berkley Corp. | | | 1,676 | | | | 103 | | | | 1.00 | | |
Zoetis, Inc. | | | 674 | | | | 111 | | | | 1.09 | | |
Total | | | | $ | 10,259 | | | | 100.00 | % | |
The accompanying notes are an integral part of the consolidated financial statements.
47
Morgan Stanley Institutional Fund Trust
Annual Report — September 30, 2020
Consolidated Portfolio of Investments (cont'd)
Global Strategist Portfolio
The following table represents the equity basket holdings underlying the total return swap with JPM U.S. SPX 500 Value Index as of September 30, 2020:
Security Description | | Shares | | Value
(000) | | Index Weight | |
JPM U.S. SPX 500 Value Index | |
AES Corp. | | | 6,681 | | | $ | 121 | | | | 1.20 | % | |
Aflac, Inc. | | | 1,428 | | | | 52 | | | | 0.51 | | |
Alexion Pharmaceuticals, Inc. | | | 963 | | | | 110 | | | | 1.09 | | |
Allstate Corp. | | | 525 | | | | 49 | | | | 0.49 | | |
American International Group | | | 3,143 | | | | 87 | | | | 0.86 | | |
Amerisourcebergen Corp. | | | 967 | | | | 94 | | | | 0.93 | | |
Anthem, Inc. | | | 373 | | | | 100 | | | | 0.99 | | |
Archer-Daniels-Midland Co. | | | 2,353 | | | | 109 | | | | 1.08 | | |
Baker Hughes Co. | | | 6,463 | | | | 86 | | | | 0.85 | | |
Biogen, Inc. | | | 363 | | | | 103 | | | | 1.02 | | |
Borgwarner, Inc. | | | 2,735 | | | | 106 | | | | 1.05 | | |
Cardinal Health, Inc. | | | 1,740 | | | | 82 | | | | 0.81 | | |
Cbre Group, Inc, — A | | | 2,443 | | | | 115 | | | | 1.14 | | |
Centene Corp. | | | 1,601 | | | | 93 | | | | 0.93 | | |
Centerpoint Energy, Inc. | | | 5,228 | | | | 101 | | | | 1.00 | | |
Centurylink, Inc. | | | 10,307 | | | | 104 | | | | 1.03 | | |
Cf Industries Holdings, Inc. | | | 3,212 | | | | 99 | | | | 0.98 | | |
Cigna Corp. | | | 584 | | | | 99 | | | | 0.98 | | |
Cisco Systems, Inc. | | | 2,142 | | | | 84 | | | | 0.84 | | |
Citigroup, Inc. | | | 2,005 | | | | 86 | | | | 0.86 | | |
Citizens Financial Group | | | 4,169 | | | | 105 | | | | 1.05 | | |
Cognizant Tech Solutions — A | | | 1,485 | | | | 103 | | | | 1.02 | | |
Comerica, Inc. | | | 2,655 | | | | 102 | | | | 1.01 | | |
Cvs Health Corp. | | | 1,582 | | | | 92 | | | | 0.92 | | |
Delta Air Lines, Inc. | | | 4,008 | | | | 123 | | | | 1.22 | | |
Devon Energy Corp. | | | 9,529 | | | | 90 | | | | 0.89 | | |
Discovery, Inc. — A | | | 4,733 | | | | 103 | | | | 1.02 | | |
Discovery, Inc. — C | | | 5,280 | | | | 103 | | | | 1.03 | | |
Dxc Technology Co. | | | 5,565 | | | | 99 | | | | 0.99 | | |
Eastman Chemical Co. | | | 1,344 | | | | 105 | | | | 1.04 | | |
Edison International | | | 1,873 | | | | 95 | | | | 0.94 | | |
Exelon Corp. | | | 2,659 | | | | 95 | | | | 0.94 | | |
Fedex Corp. | | | 597 | | | | 150 | | | | 1.49 | | |
Fifth Third Bancorp | | | 5,143 | | | | 110 | | | | 1.09 | | |
General Dynamics Corp. | | | 684 | | | | 95 | | | | 0.94 | | |
General Motors Co. | | | 3,940 | | | | 117 | | | | 1.16 | | |
Hartford Financial Services Group | | | 2,405 | | | | 89 | | | | 0.88 | | |
Hewlett Packard Enterprise | | | 10,213 | | | | 96 | | | | 0.95 | | |
Host Hotels & Resorts, Inc. | | | 9,797 | | | | 106 | | | | 1.05 | | |
Howmet Aerospace, Inc. | | | 6,676 | | | | 112 | | | | 1.11 | | |
HP, Inc. | | | 5,684 | | | | 108 | | | | 1.07 | | |
Huntington Ingalls Industries | | | 576 | | | | 81 | | | | 0.80 | | |
Intel Corp. | | | 2,091 | | | | 108 | | | | 1.07 | | |
International Paper Co. | | | 2,850 | | | | 116 | | | | 1.15 | | |
Interpublic Group Of Cos, Inc. | | | 2,742 | | | | 46 | | | | 0.45 | | |
Intl Business Machines Corp. | | | 813 | | | | 99 | | | | 0.98 | | |
Jm Smucker Co. (The) | | | 910 | | | | 105 | | | | 1.04 | | |
Johnson Controls Internation | | | 2,595 | | | | 106 | | | | 1.05 | | |
Juniper Networks, Inc. | | | 3,992 | | | | 86 | | | | 0.85 | | |
Kimco Realty Corp. | | | 9,108 | | | | 103 | | | | 1.02 | | |
Kinder Morgan, Inc. | | | 3,600 | | | | 44 | | | | 0.44 | | |
Kohls Corp. | | | 5,226 | | | | 97 | | | | 0.96 | | |
Kraft Heinz Co. (The) | | | 2,903 | | | | 87 | | | | 0.86 | | |
The accompanying notes are an integral part of the consolidated financial statements.
48
Morgan Stanley Institutional Fund Trust
Annual Report — September 30, 2020
Consolidated Portfolio of Investments (cont'd)
Global Strategist Portfolio
Security Description | | Shares | | Value
(000) | | Index Weight | |
Kroger Co. | | | 2,878 | | | $ | 98 | | | | 0.97 | % | |
Leidos Holdings, Inc. | | | 1,028 | | | | 92 | | | | 0.91 | | |
Lennar Corp. — A | | | 1,372 | | | | 112 | | | | 1.11 | | |
Lincoln National Corp. | | | 2,688 | | | | 84 | | | | 0.84 | | |
LKQ Corp. | | | 3,524 | | | | 98 | | | | 0.97 | | |
Lyondellbasell Indu — Cl A | | | 1,626 | | | | 115 | | | | 1.14 | | |
Metlife, Inc. | | | 2,708 | | | | 101 | | | | 1.00 | | |
Micron Technology, Inc. | | | 2,005 | | | | 94 | | | | 0.93 | | |
Mohawk Industries, Inc. | | | 1,271 | | | | 124 | | | | 1.23 | | |
Molson Coors Beverage Co. — B | | | 2,744 | | | | 92 | | | | 0.91 | | |
Mylan N.V. | | | 6,174 | | | | 92 | | | | 0.91 | | |
Netapp, Inc. | | | 2,362 | | | | 104 | | | | 1.03 | | |
Newell Brands, Inc. | | | 6,163 | | | | 106 | | | | 1.05 | | |
Nielsen Holdings PLC | | | 7,005 | | | | 99 | | | | 0.99 | | |
Nrg Energy, Inc. | | | 3,018 | | | | 93 | | | | 0.92 | | |
Nucor Corp. | | | 2,357 | | | | 106 | | | | 1.05 | | |
Omnicom Group | | | 941 | | | | 47 | | | | 0.46 | | |
Oneok, Inc. | | | 3,592 | | | | 93 | | | | 0.93 | | |
Perrigo Co. PLC | | | 1,845 | | | | 85 | | | | 0.84 | | |
Pfizer, Inc. | | | 2,634 | | | | 97 | | | | 0.96 | | |
Phillips 66 | | | 1,653 | | | | 86 | | | | 0.85 | | |
Ppl Corp. | | | 3,809 | | | | 104 | | | | 1.03 | | |
Principal Financial Group | | | 2,351 | | | | 95 | | | | 0.94 | | |
Pultegroup, Inc. | | | 2,294 | | | | 106 | | | | 1.05 | | |
Quanta Services Inc | | | 2,452 | | | | 130 | | | | 1.29 | | |
Raytheon Technologies Corp. | | | 1,756 | | | | 101 | | | | 1.00 | | |
Robert Half Intl, Inc. | | | 1,981 | | | | 105 | | | | 1.04 | | |
Seagate Technology | | | 2,257 | | | | 111 | | | | 1.10 | | |
Simon Property Group, Inc. | | | 1,655 | | | | 107 | | | | 1.06 | | |
Sl Green Realty Corp. | | | 2,200 | | | | 102 | | | | 1.01 | | |
Snap-On, Inc. | | | 703 | | | | 103 | | | | 1.03 | | |
Synchrony Financial | | | 4,446 | | | | 116 | | | | 1.15 | | |
Tapestry, Inc. | | | 7,572 | | | | 118 | | | | 1.17 | | |
Te Connectivity Ltd. | | | 1,125 | | | | 110 | | | | 1.09 | | |
Textron, Inc. | | | 2,814 | | | | 102 | | | | 1.01 | | |
Tyson Foods, Inc. — Cl A | | | 1,618 | | | | 96 | | | | 0.95 | | |
United Airlines Holdings, Inc. | | | 3,169 | | | | 110 | | | | 1.09 | | |
United Rentals, Inc. | | | 633 | | | | 110 | | | | 1.10 | | |
Universal Health Services-B | | | 937 | | | | 100 | | | | 1.00 | | |
Unum Group | | | 5,917 | | | | 100 | | | | 0.99 | | |
Viacomcbs, Inc. — Class B | | | 3,930 | | | | 110 | | | | 1.09 | | |
Vornado Realty Trust | | | 2,969 | | | | 100 | | | | 0.99 | | |
Wabtec Corp. | | | 1,643 | | | | 102 | | | | 1.01 | | |
Walgreens Boots Alliance, Inc. | | | 2,459 | | | | 88 | | | | 0.88 | | |
Western Digital Corp. | | | 2,301 | | | | 84 | | | | 0.83 | | |
Western Union Co. | | | 2,086 | | | | 45 | | | | 0.44 | | |
Westrock Co. | | | 3,631 | | | | 126 | | | | 1.25 | | |
Whirlpool Corp. | | | 614 | | | | 113 | | | | 1.12 | | |
Xerox Holdings Corp. | | | 6,309 | | | | 118 | | | | 1.17 | | |
Total | | | | $ | 10,086 | | | | 100.00 | % | |
The accompanying notes are an integral part of the consolidated financial statements.
49
Morgan Stanley Institutional Fund Trust
Annual Report — September 30, 2020
Consolidated Portfolio of Investments (cont'd)
Global Strategist Portfolio
The following table represents the equity basket holdings underlying the total return swap with JPM IPO Index as of September 30, 2020:
Security Description | | Shares | | Value
(000) | | Index Weight | |
JPM IPO Index | |
Kingsoft Cloud Holdings — ADR | | | 64,698 | | | $ | 1,911 | | | | 22.49 | % | |
Lemonade, Inc. | | | 37,954 | | | | 1,887 | | | | 22.22 | | |
Ncino, Inc. | | | 15,421 | | | | 1,229 | | | | 14.47 | | |
Shift4 Payments, Inc. — Class A | | | 34,820 | | | | 1,684 | | | | 19.83 | | |
Vroom, Inc. | | | 34,421 | | | | 1,782 | | | | 20.99 | | |
Total | | | | $ | 8,493 | | | | 100.00 | % | |
@ Value is less than $500.
* Cleared swap agreement, the broker is Morgan Stanley & Co. LLC.
BTP Buoni del Tesoro Poliennali.
CPI Consumer Price Index.
EURIBOR Euro Interbank Offered Rate.
KORIBOR Korea Interbank Offered Rate.
LIBOR London Interbank Offered Rate.
NYMEX New York Mercantile Exchange.
SGX Singapore Exchange Ltd.
WTI West Texas Intermediate.
AUD — Australian Dollar
BRL — Brazilian Real
CAD — Canadian Dollar
CHF — Swiss Franc
CLP — Chilean Peso
CNH — Chinese Yuan Renminbi Offshore
CNY — Chinese Yuan Renminbi
COP — Colombian Peso
CZK — Czech Koruna
DKK — Danish Krone
EUR — Euro
GBP — British Pound
HKD — Hong Kong Dollar
HUF — Hungarian Forint
IDR — Indonesian Rupiah
ILS — Israeli Shekel
INR — Indian Rupee
JPY — Japanese Yen
KRW — South Korean Won
MXN — Mexican Peso
MYR — Malaysian Ringgit
NOK — Norwegian Krone
NZD — New Zealand Dollar
PEN — Peruvian Nuevo Sol
PLN — Polish Zloty
RON — Romanian New Leu
RUB — Russian Ruble
SEK — Swedish Krona
SGD — Singapore Dollar
THB — Thai Baht
TRY — Turkish Lira
TWD — Taiwan Dollar
USD — United States Dollar
ZAR — South African Rand
Portfolio Composition
Classification | | Percentage of
Total Investments | |
Common Stocks | | | 46.2 | % | |
Fixed Income Securities | | | 40.6 | | |
Short-Term Investments | | | 13.2 | | |
Other** | | | 0.0 | *** | |
Total Investments | | | 100.0 | %**** | |
** Industries and/or investment types representing less than 5% of total investments.
*** Amount is less than 0.05%.
**** Does not include open long/short futures contracts with a value of approximately $97,195,000 and net unrealized appreciation of approximately $243,000. Does not include open foreign currency forward exchange contracts with net unrealized appreciation of approximately $431,000. Also does not include open swap agreements with net unrealized appreciation of approximately $206,000.
The accompanying notes are an integral part of the consolidated financial statements.
50
Morgan Stanley Institutional Fund Trust
Annual Report — September 30, 2020
Global Strategist Portfolio
Consolidated Statement of Assets and Liabilities | | September 30, 2020
(000) | |
Assets: | |
Investments in Securities of Unaffiliated Issuers, at Value (Cost $282,051) | | $ | 329,562 | | |
Investment in Security of Affiliated Issuer, at Value (Cost $44,327) | | | 44,327 | | |
Total Investments in Securities, at Value (Cost $326,378) | | | 373,889 | | |
Foreign Currency, at Value (Cost $1,035) | | | 1,035 | | |
Receivable for Investments Sold | | | 9,770 | | |
Receivable for Variation Margin on Futures Contracts | | | 3,334 | | |
Unrealized Appreciation on Swap Agreements | | | 2,016 | | |
Due from Broker | | | 1,224 | | |
Unrealized Appreciation on Foreign Currency Forward Exchange Contracts | | | 1,190 | | |
Interest Receivable | | | 1,120 | | |
Dividends Receivable | | | 178 | | |
Tax Reclaim Receivable | | | 172 | | |
Receivable for Variation Margin on Swap Agreements | | | 10 | | |
Receivable for Fund Shares Sold | | | 7 | | |
Receivable from Affiliate | | | 1 | | |
Other Assets | | | 63 | | |
Total Assets | | | 394,009 | | |
Liabilities: | |
Payable for Investments Purchased | | | 10,306 | | |
Unrealized Depreciation on Swap Agreements | | | 2,455 | | |
Bank Overdraft | | | 1,223 | | |
Unrealized Depreciation on Foreign Currency Forward Exchange Contracts | | | 759 | | |
Payable for Advisory Fees | | | 374 | | |
Due to Broker | | | 312 | | |
Payable for Trustees' Fees and Expenses | | | 110 | | |
Payable for Professional Fees | | | 82 | | |
Payable for Custodian Fees | | | 58 | | |
Payable for Shareholder Services Fees — Class A | | | 35 | | |
Payable for Distribution and Shareholder Services Fees — Class L | | | 8 | | |
Payable for Distribution and Shareholder Services Fees — Class C | | | 1 | | |
Payable for Sub Transfer Agency Fees — Class I | | | 6 | | |
Payable for Sub Transfer Agency Fees — Class A | | | 24 | | |
Payable for Sub Transfer Agency Fees — Class L | | | 2 | | |
Payable for Sub Transfer Agency Fees — Class C | | | — | @ | |
Payable for Administration Fees | | | 25 | | |
Payable for Fund Shares Redeemed | | | 19 | | |
Payable for Transfer Agency Fees — Class I | | | 2 | | |
Payable for Transfer Agency Fees — Class A | | | 6 | | |
Payable for Transfer Agency Fees — Class L | | | 1 | | |
Payable for Transfer Agency Fees — Class C | | | 1 | | |
Payable for Transfer Agency Fees — Class IS | | | 1 | | |
Deferred Capital Gain Country Tax | | | 5 | | |
Other Liabilities | | | 74 | | |
Total Liabilities | | | 15,889 | | |
Net Assets | | $ | 378,120 | | |
Net Assets Consist of: | |
Paid-in-Capital | | $ | 335,034 | | |
Total Distributable Earnings | | | 43,086 | | |
Net Assets | | $ | 378,120 | | |
The accompanying notes are an integral part of the consolidated financial statements.
51
Morgan Stanley Institutional Fund Trust
Annual Report — September 30, 2020
Global Strategist Portfolio
Consolidated Statement of Assets and Liabilities (cont'd) | | September 30, 2020
(000) | |
CLASS I: | |
Net Assets | | $ | 34,031 | | |
| Shares Outstanding (unlimited number of shares authorized, no par value) (not in 000's) | | | 2,115,836 | | |
Net Asset Value, Offering and Redemption Price Per Share | | $ | 16.08 | | |
CLASS A: | |
Net Assets | | $ | 170,643 | | |
| Shares Outstanding (unlimited number of shares authorized, no par value) (not in 000's) | | | 10,727,972 | | |
Net Asset Value, Redemption Price Per Share | | $ | 15.91 | | |
Maximum Sales Load | | | 5.25 | % | |
Maximum Sales Charge | | $ | 0.88 | | |
Maximum Offering Price Per Share | | $ | 16.79 | | |
CLASS L: | |
Net Assets | | $ | 12,773 | | |
| Shares Outstanding (unlimited number of shares authorized, no par value) (not in 000's) | | | 815,306 | | |
Net Asset Value, Offering and Redemption Price Per Share | | $ | 15.67 | | |
CLASS C: | |
Net Assets | | $ | 1,435 | | |
| Shares Outstanding (unlimited number of shares authorized, no par value) (not in 000's) | | | 92,659 | | |
Net Asset Value, Offering and Redemption Price Per Share | | $ | 15.49 | | |
CLASS IS: | |
Net Assets | | $ | 159,238 | | |
| Shares Outstanding (unlimited number of shares authorized, no par value) (not in 000's) | | | 9,891,840 | | |
Net Asset Value, Offering and Redemption Price Per Share | | $ | 16.10 | | |
@ Amount is less than $500.
The accompanying notes are an integral part of the consolidated financial statements.
52
Morgan Stanley Institutional Fund Trust
Annual Report — September 30, 2020
Global Strategist Portfolio
Consolidated Statement of Operations | | Year Ended
September 30, 2020
(000) | |
Investment Income: | |
Dividends from Securities of Unaffiliated Issuers (Net of $167 of Foreign Taxes Withheld) | | $ | 3,510 | | |
Interest from Securities of Unaffiliated Issuers (Net of $9 of Foreign Taxes Withheld) | | | 3,419 | | |
Dividends from Security of Affiliated Issuer (Note G) | | | 417 | | |
Total Investment Income | | | 7,346 | | |
Expenses: | |
Advisory Fees (Note B) | | | 1,750 | | |
Shareholder Services Fees — Class A (Note D) | | | 431 | | |
Distribution and Shareholder Services Fees — Class L (Note D) | | | 95 | | |
Distribution and Shareholder Services Fees — Class C (Note D) | | | 15 | | |
Administration Fees (Note C) | | | 311 | | |
Custodian Fees (Note F) | | | 269 | | |
Professional Fees | | | 241 | | |
Sub Transfer Agency Fees — Class I | | | 38 | | |
Sub Transfer Agency Fees — Class A | | | 118 | | |
Sub Transfer Agency Fees — Class L | | | 8 | | |
Sub Transfer Agency Fees — Class C | | | 1 | | |
Pricing Fees | | | 134 | | |
Registration Fees | | | 96 | | |
Shareholder Reporting Fees | | | 56 | | |
Transfer Agency Fees — Class I (Note E) | | | 9 | | |
Transfer Agency Fees — Class A (Note E) | | | 25 | | |
Transfer Agency Fees — Class L (Note E) | | | 5 | | |
Transfer Agency Fees — Class C (Note E) | | | 3 | | |
Transfer Agency Fees — Class IS (Note E) | | | 2 | | |
Trustees' Fees and Expenses | | | 12 | | |
Other Expenses | | | 39 | | |
Total Expenses | | | 3,658 | | |
Waiver of Advisory Fees (Note B) | | | (144 | ) | |
Rebate from Morgan Stanley Affiliate (Note G) | | | (94 | ) | |
Reimbursement of Class Specific Expenses — Class I (Note B) | | | (32 | ) | |
Reimbursement of Class Specific Expenses — Class C (Note B) | | | (2 | ) | |
Reimbursement of Class Specific Expenses — Class IS (Note B) | | | (2 | ) | |
Net Expenses | | | 3,384 | | |
Net Investment Income | | | 3,962 | | |
Realized Gain (Loss): | |
Investments Sold (Net of $4 of Capital Gain Country Tax) | | | 4,500 | | |
Foreign Currency Forward Exchange Contracts | | | (2,253 | ) | |
Foreign Currency Translation | | | (35 | ) | |
Futures Contracts | | | 147 | | |
Swap Agreements | | | (3,424 | ) | |
Net Realized Loss | | | (1,065 | ) | |
Change in Unrealized Appreciation (Depreciation): | |
Investments (Net of Increase in Deferred Capital Gain Country Tax of $1) | | | 13,984 | | |
Foreign Currency Forward Exchange Contracts | | | 1,463 | | |
Foreign Currency Translation | | | 42 | | |
Futures Contracts | | | 708 | | |
Swap Agreements | | | 1,382 | | |
Net Change in Unrealized Appreciation (Depreciation) | | | 17,579 | | |
Net Realized Loss and Change in Unrealized Appreciation (Depreciation) | | | 16,514 | | |
Net Increase in Net Assets Resulting from Operations | | $ | 20,476 | | |
The accompanying notes are an integral part of the consolidated financial statements.
53
Morgan Stanley Institutional Fund Trust
Annual Report — September 30, 2020
Global Strategist Portfolio
Consolidated Statements of Changes in Net Assets | | Year Ended
September 30, 2020
(000) | | Year Ended
September 30, 2019
(000) | |
Increase (Decrease) in Net Assets: | |
Operations: | |
Net Investment Income | | $ | 3,962 | | | $ | 5,153 | | |
Net Realized Gain (Loss) | | | (1,065 | ) | | | 1,003 | | |
Net Change in Unrealized Appreciation (Depreciation) | | | 17,579 | | | | 4,495 | | |
Net Increase in Net Assets Resulting from Operations | | | 20,476 | | | | 10,651 | | |
Dividends and Distributions to Shareholders: | |
Class I | | | (1,022 | ) | | | (7,553 | ) | |
Class A | | | (2,927 | ) | | | (25,417 | ) | |
Class L | | | (214 | ) | | | (1,941 | ) | |
Class C | | | (28 | ) | | | (218 | ) | |
Class IS | | | (2,790 | ) | | | (20 | ) | |
Total Dividends and Distributions to Shareholders | | | (6,981 | ) | | | (35,149 | ) | |
Capital Share Transactions:(1) | |
Class I: | |
Subscribed | | | 5,888 | | | | 6,077 | | |
Distributions Reinvested | | | 1,019 | | | | 7,518 | | |
Redeemed | | | (31,374 | ) | | | (13,423 | ) | |
Class A: | |
Subscribed | | | 2,167 | | | | 9,231 | | |
Distributions Reinvested | | | 2,875 | | | | 24,946 | | |
Redeemed | | | (37,743 | ) | | | (39,012 | ) | |
Class L: | |
Exchanged | | | 321 | | | | 404 | | |
Distributions Reinvested | | | 209 | | | | 1,901 | | |
Redeemed | | | (1,507 | ) | | | (4,829 | ) | |
Class C: | |
Subscribed | | | 208 | | | | 654 | | |
Distributions Reinvested | | | 28 | | | | 217 | | |
Redeemed | | | (709 | ) | | | (670 | ) | |
Class IS: | |
Subscribed | | | 83 | | | | 148,417 | | |
Distributions Reinvested | | | 2,790 | | | | 19 | | |
Redeemed | | | (937 | ) | | | (66 | ) | |
Net Increase (Decrease) in Net Assets Resulting from Capital Share Transactions | | | (56,682 | ) | | | 141,384 | | |
Total Increase (Decrease) in Net Assets | | | (43,187 | ) | | | 116,886 | | |
Net Assets: | |
Beginning of Period | | | 421,307 | | | | 304,421 | | |
End of Period | | $ | 378,120 | | | $ | 421,307 | | |
The accompanying notes are an integral part of the consolidated financial statements.
54
Morgan Stanley Institutional Fund Trust
Annual Report — September 30, 2020
Global Strategist Portfolio
Consolidated Statements of Changes in Net Assets (cont'd) | | Year Ended
September 30, 2020
(000) | | Year Ended
September 30, 2019
(000) | |
(1) Capital Share Transactions: | |
Class I: | |
Shares Subscribed | | | 393 | | | | 397 | | |
Shares Issued on Distributions Reinvested | | | 65 | | | | 535 | | |
Shares Redeemed | | | (2,066 | ) | | | (903 | ) | |
Net Increase (Decrease) in Class I Shares Outstanding | | | (1,608 | ) | | | 29 | | |
Class A: | |
Shares Subscribed | | | 140 | | | | 585 | | |
Shares Issued on Distributions Reinvested | | | 184 | | | | 1,788 | | |
Shares Redeemed | | | (2,489 | ) | | | (2,601 | ) | |
Net Decrease in Class A Shares Outstanding | | | (2,165 | ) | | | (228 | ) | |
Class L: | |
Shares Exchanged | | | 23 | | | | 29 | | |
Shares Issued on Distributions Reinvested | | | 14 | | | | 137 | | |
Shares Redeemed | | | (103 | ) | | | (340 | ) | |
Net Decrease in Class L Shares Outstanding | | | (66 | ) | | | (174 | ) | |
Class C: | |
Shares Subscribed | | | 14 | | | | 44 | | |
Shares Issued on Distributions Reinvested | | | 2 | | | | 16 | | |
Shares Redeemed | | | (50 | ) | | | (46 | ) | |
Net Increase (Decrease) in Class C Shares Outstanding | | | (34 | ) | | | 14 | | |
Class IS: | |
Shares Subscribed | | | 5 | | | | 9,774 | | |
Shares Issued on Distributions Reinvested | | | 177 | | | | 1 | | |
Shares Redeemed | | | (70 | ) | | | (5 | ) | |
Net Increase in Class IS Shares Outstanding | | | 112 | | | | 9,770 | | |
The accompanying notes are an integral part of the consolidated financial statements.
55
Morgan Stanley Institutional Fund Trust
Annual Report — September 30, 2020
Consolidated Financial Highlights
Global Strategist Portfolio
| | | Class I | |
| | | Year Ended September 30, | |
Selected Per Share Data and Ratios | | 2020 | | 2019 | | 2018 | | 2017 | | 2016(1)(2) | |
Net Asset Value, Beginning of Period | | $ | 15.45 | | | $ | 17.05 | | | $ | 17.48 | | | $ | 15.79 | | | $ | 14.58 | | |
Income from Investment Operations: | |
Net Investment Income(3) | | | 0.17 | | | | 0.27 | | | | 0.33 | | | | 0.30 | | | | 0.28 | | |
Net Realized and Unrealized Gain | | | 0.74 | | | | 0.17 | | | | 0.35 | | | | 1.57 | | | | 0.95 | | |
Total from Investment Operations | | | 0.91 | | | | 0.44 | | | | 0.68 | | | | 1.87 | | | | 1.23 | | |
Distributions from and/or in Excess of: | |
Net Investment Income | | | (0.03 | ) | | | (0.58 | ) | | | (0.21 | ) | | | (0.18 | ) | | | — | | |
Net Realized Gain | | | (0.25 | ) | | | (1.46 | ) | | | (0.90 | ) | | | — | | | | (0.02 | ) | |
Total Distributions | | | (0.28 | ) | | | (2.04 | ) | | | (1.11 | ) | | | (0.18 | ) | | | (0.02 | ) | |
Net Asset Value, End of Period | | $ | 16.08 | | | $ | 15.45 | | | $ | 17.05 | | | $ | 17.48 | | | $ | 15.79 | | |
Total Return(4) | | | 5.93 | % | | | 3.74 | % | | | 3.94 | % | | | 11.98 | % | | | 8.42 | %(5) | |
Ratios to Average Net Assets and Supplemental Data: | |
Net Assets, End of Period (Thousands) | | $ | 34,031 | | | $ | 57,532 | | | $ | 62,998 | | | $ | 69,017 | | | $ | 74,158 | | |
Ratio of Expenses Before Expense Limitation | | | 0.84 | % | | | 0.84 | % | | | 0.85 | % | | | 0.85 | % | | | 0.81 | % | |
Ratio of Expenses After Expense Limitation | | | 0.72 | %(6) | | | 0.72 | %(6) | | | 0.73 | %(6) | | | 0.72 | %(6) | | | 0.68 | %(6) | |
Ratio of Net Investment Income | | | 1.14 | %(6) | | | 1.80 | %(6) | | | 1.95 | %(6) | | | 1.87 | %(6) | | | 1.84 | %(6) | |
Ratio of Rebate from Morgan Stanley Affiliates | | | 0.02 | % | | | 0.02 | % | | | 0.01 | % | | | 0.02 | % | | | 0.01 | % | |
Portfolio Turnover Rate | | | 109 | % | | | 117 | % | | | 132 | % | | | 176 | % | | | 103 | % | |
(1) Reflects prior period custodian out-of-pocket expenses that were reimbursed in September 2016. The amount of the reimbursement was immaterial on a per share basis and did not impact the total return of Class I shares. The Ratio of Expenses After Expense Limitation would have been 0.05% higher and the Ratio of Net Investment Income would have been 0.05% lower had the custodian not reimbursed the Fund.
(2) Not consolidated.
(3) Per share amount is based on average shares outstanding.
(4) Calculated based on the net asset value as of the last business day of the period.
(5) Performance was positively impacted by approximately 0.21% due to the receipt of proceeds from the settlement of class action suits involving the Fund's past holdings. These were one-time settlements, and as a result, the impact on the NAV and consequently the performance will not likely be repeated in the future. Had these settlements not occurred, the total return for Class I shares would have been approximately 8.21%.
(6) The Ratio of Expenses After Expense Limitation and Ratio of Net Investment Income reflect the rebate of certain Fund expenses in connection with the investments in Morgan Stanley affiliates during the period. The effect of the rebate on the ratios is disclosed in the above table as "Ratio of Rebate from Morgan Stanley Affiliates."
The accompanying notes are an integral part of the consolidated financial statements.
56
Morgan Stanley Institutional Fund Trust
Annual Report — September 30, 2020
Consolidated Financial Highlights
Global Strategist Portfolio
| | | Class A | |
| | | Year Ended September 30, | |
Selected Per Share Data and Ratios | | 2020 | | 2019 | | 2018 | | 2017 | | 2016(1)(2) | |
Net Asset Value, Beginning of Period | | $ | 15.30 | | | $ | 16.90 | | | $ | 17.32 | | | $ | 15.64 | | | $ | 14.50 | | |
Income from Investment Operations: | |
Net Investment Income(3) | | | 0.13 | | | | 0.23 | | | | 0.28 | | | | 0.25 | | | | 0.23 | | |
Net Realized and Unrealized Gain | | | 0.73 | | | | 0.15 | | | | 0.35 | | | | 1.56 | | | | 0.93 | | |
Total from Investment Operations | | | 0.86 | | | | 0.38 | | | | 0.63 | | | | 1.81 | | | | 1.16 | | |
Distributions from and/or in Excess of: | |
Net Investment Income | | | — | | | | (0.52 | ) | | | (0.15 | ) | | | (0.13 | ) | | | — | | |
Net Realized Gain | | | (0.25 | ) | | | (1.46 | ) | | | (0.90 | ) | | | — | | | | (0.02 | ) | |
Total Distributions | | | (0.25 | ) | | | (1.98 | ) | | | (1.05 | ) | | | (0.13 | ) | | | (0.02 | ) | |
Net Asset Value, End of Period | | $ | 15.91 | | | $ | 15.30 | | | $ | 16.90 | | | $ | 17.32 | | | $ | 15.64 | | |
Total Return(4) | | | 5.65 | % | | | 3.38 | % | | | 3.68 | % | | | 11.64 | % | | | 7.98 | %(5) | |
Ratios to Average Net Assets and Supplemental Data: | |
Net Assets, End of Period (Thousands) | | $ | 170,643 | | | $ | 197,271 | | | $ | 221,707 | | | $ | 247,483 | | | $ | 259,999 | | |
Ratio of Expenses Before Expense Limitation | | | 1.08 | % | | | 1.09 | % | | | 1.09 | % | | | 1.12 | % | | | 1.11 | % | |
Ratio of Expenses After Expense Limitation | | | 1.02 | %(6) | | | 1.03 | %(6) | | | 1.03 | %(6) | | | 1.05 | %(6) | | | 0.99 | %(6) | |
Ratio of Net Investment Income | | | 0.87 | %(6) | | | 1.49 | %(6) | | | 1.66 | %(6) | | | 1.52 | %(6) | | | 1.56 | %(6) | |
Ratio of Rebate from Morgan Stanley Affiliates | | | 0.02 | % | | | 0.02 | % | | | 0.01 | % | | | 0.02 | % | | | 0.01 | % | |
Portfolio Turnover Rate | | | 109 | % | | | 117 | % | | | 132 | % | | | 176 | % | | | 103 | % | |
(1) Reflects prior period custodian out-of-pocket expenses that were reimbursed in September 2016. The amount of the reimbursement was immaterial on a per share basis and did not impact the total return of Class A shares. The Ratio of Expenses After Expense Limitation would have been 0.07% higher and the Ratio of Net Investment Income would have been 0.07% lower had the custodian not reimbursed the Fund.
(2) Not consolidated.
(3) Per share amount is based on average shares outstanding.
(4) Calculated based on the net asset value which does not reflect sales charges, if applicable, as of the last business day of the period.
(5) Performance was positively impacted by approximately 0.27% due to the receipt of proceeds from the settlement of class action suits involving the Fund's past holdings. These were one-time settlements, and as a result, the impact on the NAV and consequently the performance will not likely be repeated in the future. Had these settlements not occurred, the total return for Class A shares would have been approximately 7.71%.
(6) The Ratio of Expenses After Expense Limitation and Ratio of Net Investment Income reflect the rebate of certain Fund expenses in connection with the investments in Morgan Stanley affiliates during the period. The effect of the rebate on the ratios is disclosed in the above table as "Ratio of Rebate from Morgan Stanley Affiliates."
The accompanying notes are an integral part of the consolidated financial statements.
57
Morgan Stanley Institutional Fund Trust
Annual Report — September 30, 2020
Consolidated Financial Highlights
Global Strategist Portfolio
| | | Class L | |
| | | Year Ended September 30, | |
Selected Per Share Data and Ratios | | 2020 | | 2019 | | 2018 | | 2017 | | 2016(1)(2) | |
Net Asset Value, Beginning of Period | | $ | 15.15 | | | $ | 16.73 | | | $ | 17.15 | | | $ | 15.47 | | | $ | 14.41 | | |
Income from Investment Operations: | |
Net Investment Income(3) | | | 0.05 | | | | 0.15 | | | | 0.19 | | | | 0.16 | | | | 0.15 | | |
Net Realized and Unrealized Gain | | | 0.72 | | | | 0.16 | | | | 0.34 | | | | 1.55 | | | | 0.93 | | |
Total from Investment Operations | | | 0.77 | | | | 0.31 | | | | 0.53 | | | | 1.71 | | | | 1.08 | | |
Distributions from and/or in Excess of: | |
Net Investment Income | | | — | | | | (0.43 | ) | | | (0.05 | ) | | | (0.03 | ) | | | — | | |
Net Realized Gain | | | (0.25 | ) | | | (1.46 | ) | | | (0.90 | ) | | | — | | | | (0.02 | ) | |
Total Distributions | | | (0.25 | ) | | | (1.89 | ) | | | (0.95 | ) | | | (0.03 | ) | | | (0.02 | ) | |
Net Asset Value, End of Period | | $ | 15.67 | | | $ | 15.15 | | | $ | 16.73 | | | $ | 17.15 | | | $ | 15.47 | | |
Total Return(4) | | | 5.10 | % | | | 2.87 | % | | | 3.13 | % | | | 11.07 | % | | | 7.47 | %(5) | |
Ratios to Average Net Assets and Supplemental Data: | |
Net Assets, End of Period (Thousands) | | $ | 12,773 | | | $ | 13,356 | | | $ | 17,665 | | | $ | 20,605 | | | $ | 23,051 | | |
Ratio of Expenses Before Expense Limitation | | | 1.60 | % | | | 1.58 | % | | | 1.58 | % | | | 1.66 | % | | | 1.64 | % | |
Ratio of Expenses After Expense Limitation | | | 1.54 | %(6) | | | 1.53 | %(6) | | | 1.52 | %(6) | | | 1.57 | %(6) | | | 1.52 | %(6) | |
Ratio of Net Investment Income | | | 0.36 | %(6) | | | 0.97 | %(6) | | | 1.12 | %(6) | | | 1.00 | %(6) | | | 1.03 | %(6) | |
Ratio of Rebate from Morgan Stanley Affiliates | | | 0.02 | % | | | 0.02 | % | | | 0.01 | % | | | 0.02 | % | | | 0.01 | % | |
Portfolio Turnover Rate | | | 109 | % | | | 117 | % | | | 132 | % | | | 176 | % | | | 103 | % | |
(1) Reflects prior period custodian out-of-pocket expenses that were reimbursed in September 2016. The amount of the reimbursement was immaterial on a per share basis and did not impact the total return of Class L shares. The Ratio of Expenses After Expense Limitation would have been 0.06% higher and the Ratio of Net Investment Income would have been 0.06% lower had the custodian not reimbursed the Fund.
(2) Not consolidated.
(3) Per share amount is based on average shares outstanding.
(4) Calculated based on the net asset value as of the last business day of the period.
(5) Performance was positively impacted by approximately 0.20% due to the receipt of proceeds from the settlement of class action suits involving the Fund's past holdings. These were one-time settlements, and as a result, the impact on the NAV and consequently the performance will not likely be repeated in the future. Had these settlements not occurred, the total return for Class L shares would have been approximately 7.27%.
(6) The Ratio of Expenses After Expense Limitation and Ratio of Net Investment Income reflect the rebate of certain Fund expenses in connection with the investments in Morgan Stanley affiliates during the period. The effect of the rebate on the ratios is disclosed in the above table as "Ratio of Rebate from Morgan Stanley Affiliates."
The accompanying notes are an integral part of the consolidated financial statements.
58
Morgan Stanley Institutional Fund Trust
Annual Report — September 30, 2020
Consolidated Financial Highlights
Global Strategist Portfolio
| | | Class C | |
| | | Year Ended September 30, | |
Selected Per Share Data and Ratios | | 2020 | | 2019 | | 2018 | | 2017 | | 2016(1)(2) | |
Net Asset Value, Beginning of Period | | $ | 15.02 | | | $ | 16.65 | | | $ | 17.08 | | | $ | 15.42 | | | $ | 14.41 | | |
Income from Investment Operations: | |
Net Investment Income(3) | | | 0.01 | | | | 0.11 | | | | 0.21 | | | | 0.11 | | | | 0.10 | | |
Net Realized and Unrealized Gain | | | 0.71 | | | | 0.15 | | | | 0.27 | | | | 1.55 | | | | 0.93 | | |
Total from Investment Operations | | | 0.72 | | | | 0.26 | | | | 0.48 | | | | 1.66 | | | | 1.03 | | |
Distributions from and/or in Excess of: | |
Net Investment Income | | | — | | | | (0.43 | ) | | | (0.01 | ) | | | — | | | | — | | |
Net Realized Gain | | | (0.25 | ) | | | (1.46 | ) | | | (0.90 | ) | | | — | | | | (0.02 | ) | |
Total Distributions | | | (0.25 | ) | | | (1.89 | ) | | | (0.91 | ) | | | — | | | | (0.02 | ) | |
Net Asset Value, End of Period | | $ | 15.49 | | | $ | 15.02 | | | $ | 16.65 | | | $ | 17.08 | | | $ | 15.42 | | |
Total Return(4) | | | 4.81 | % | | | 2.55 | % | | | 2.83 | % | | | 10.77 | % | | | 7.13 | %(5) | |
Ratios to Average Net Assets and Supplemental Data: | |
Net Assets, End of Period (Thousands) | | $ | 1,435 | | | $ | 1,906 | | | $ | 1,885 | | | $ | 1,386 | | | $ | 1,613 | | |
Ratio of Expenses Before Expense Limitation | | | 1.98 | % | | | 1.93 | % | | | 1.99 | % | | | 2.02 | % | | | 1.94 | % | |
Ratio of Expenses After Expense Limitation | | | 1.82 | %(6) | | | 1.82 | %(6) | | | 1.83 | %(6) | | | 1.82 | %(6) | | | 1.81 | %(6) | |
Ratio of Net Investment Income | | | 0.07 | %(6) | | | 0.73 | %(6) | | | 1.28 | %(6) | | | 0.72 | %(6) | | | 0.71 | %(6) | |
Ratio of Rebate from Morgan Stanley Affiliates | | | 0.02 | % | | | 0.02 | % | | | 0.01 | % | | | 0.02 | % | | | 0.01 | % | |
Portfolio Turnover Rate | | | 109 | % | | | 117 | % | | | 132 | % | | | 176 | % | | | 103 | % | |
(1) Reflects prior period custodian out-of-pocket expenses that were reimbursed in September 2016. The amount of the reimbursement was immaterial on a per share basis and did not impact the total return of Class C shares. The Ratio of Expenses After Expense Limitation would have been 0.02% higher and the Ratio of Net Investment Income would have been 0.02% lower had the custodian not reimbursed the Fund.
(2) Not consolidated.
(3) Per share amount is based on average shares outstanding.
(4) Calculated based on the net asset value which does not reflect sales charges, if applicable, as of the last business day of the period.
(5) Performance was positively impacted by approximately 0.21% due to the receipt of proceeds from the settlement of class action suits involving the Fund's past holdings. These were one-time settlements, and as a result, the impact on the NAV and consequently the performance will not likely be repeated in the future. Had these settlements not occurred, the total return for Class C shares would have been approximately 6.92%.
(6) The Ratio of Expenses After Expense Limitation and Ratio of Net Investment Income reflect the rebate of certain Fund expenses in connection with the investments in Morgan Stanley affiliates during the period. The effect of the rebate on the ratios is disclosed in the above table as "Ratio of Rebate from Morgan Stanley Affiliates."
The accompanying notes are an integral part of the consolidated financial statements.
59
Morgan Stanley Institutional Fund Trust
Annual Report — September 30, 2020
Consolidated Financial Highlights
Global Strategist Portfolio
| | | Class IS | |
| | | Year Ended September 30, | |
Selected Per Share Data and Ratios | | 2020 | | 2019 | | 2018 | | 2017 | | 2016(1)(2) | |
Net Asset Value, Beginning of Period | | $ | 15.46 | | | $ | 17.06 | | | $ | 17.49 | | | $ | 15.79 | | | $ | 14.59 | | |
Income from Investment Operations: | |
Net Investment Income(3) | | | 0.19 | | | | 0.27 | | | | 0.37 | | | | 0.31 | | | | 0.26 | | |
Net Realized and Unrealized Gain | | | 0.74 | | | | 0.17 | | | | 0.31 | | | | 1.57 | | | | 0.96 | | |
Total from Investment Operations | | | 0.93 | | | | 0.44 | | | | 0.68 | | | | 1.88 | | | | 1.22 | | |
Distributions from and/or in Excess of: | |
Net Investment Income | | | (0.04 | ) | | | (0.58 | ) | | | (0.21 | ) | | | (0.18 | ) | | | — | | |
Net Realized Gain | | | (0.25 | ) | | | (1.46 | ) | | | (0.90 | ) | | | — | | | | (0.02 | ) | |
Total Distributions | | | (0.29 | ) | | | (2.04 | ) | | | (1.11 | ) | | | (0.18 | ) | | | (0.02 | ) | |
Net Asset Value, End of Period | | $ | 16.10 | | | $ | 15.46 | | | $ | 17.06 | | | $ | 17.49 | | | $ | 15.79 | | |
Total Return(4) | | | 6.02 | % | | | 3.77 | % | | | 3.98 | % | | | 12.08 | % | | | 8.42 | %(5) | |
Ratios to Average Net Assets and Supplemental Data: | |
Net Assets, End of Period (Thousands) | | $ | 159,238 | | | $ | 151,242 | | | $ | 166 | | | $ | 137 | | | $ | 143 | | |
Ratio of Expenses Before Expense Limitation | | | 0.75 | % | | | 0.75 | % | | | 1.95 | % | | | 2.17 | % | | | 5.44 | % | |
Ratio of Expenses After Expense Limitation | | | 0.69 | %(6) | | | 0.69 | %(6) | | | 0.70 | %(6) | | | 0.69 | %(6) | | | 0.70 | %(6) | |
Ratio of Net Investment Income | | | 1.21 | %(6) | | | 1.76 | %(6) | | | 2.13 | %(6) | | | 1.88 | %(6) | | | 1.68 | %(6) | |
Ratio of Rebate from Morgan Stanley Affiliates | | | 0.02 | % | | | 0.02 | % | | | 0.01 | % | | | 0.02 | % | | | 0.01 | % | |
Portfolio Turnover Rate | | | 109 | % | | | 117 | % | | | 132 | % | | | 176 | % | | | 103 | % | |
(1) Reflects prior period custodian out-of-pocket expenses that were reimbursed in September 2016. The amount of the reimbursement was immaterial on a per share basis and did not impact the total return of Class IS shares. The Ratio of Expenses After Expense Limitation and the Ratio of Net Investment Income would be unchanged as the reimbursement of custodian fees was offset against expense waivers/reimbursements with no impact to net expenses or net investment income.
(2) Not consolidated.
(3) Per share amount is based on average shares outstanding.
(4) Calculated based on the net asset value as of the last business day of the period.
(5) Performance was positively impacted by approximately 0.35% due to the receipt of proceeds from the settlement of class action suits involving the Fund's past holdings. These were one-time settlements, and as a result, the impact on the NAV and consequently the performance will not likely be repeated in the future. Had these settlements not occurred, the total return for Class IS shares would have been approximately 8.07%.
(6) The Ratio of Expenses After Expense Limitation and Ratio of Net Investment Income reflect the rebate of certain Fund expenses in connection with the investments in Morgan Stanley affiliates during the period. The effect of the rebate on the ratios is disclosed in the above table as "Ratio of Rebate from Morgan Stanley Affiliates."
The accompanying notes are an integral part of the consolidated financial statements.
60
Morgan Stanley Institutional Fund Trust
Annual Report — September 30, 2020
Notes to Consolidated Financial Statements
Morgan Stanley Institutional Fund Trust ("Trust") is registered under the Investment Company Act of 1940, as amended (the "Act"), as an open-end management investment company. The Trust is comprised of twelve separate, active funds (individually referred to as a "Fund," collectively as the "Funds"). The Trust applies investment company accounting and reporting guidance. All Funds are considered diversified for purposes of the Act.
The accompanying consolidated financial statements relate to the Global Strategist Portfolio. The Fund seeks above-average total return over a market cycle of three to five years. The Fund offers five classes of shares — Class I, Class A, Class L, Class C and Class IS.
The Fund has suspended offering Class L shares for sale to all investors. Class L shareholders of the Fund do not have the option to purchasing additional Class L shares. However, existing Class L shareholders may invest in additional Class L shares through reinvestment of dividends and distributions.
A. Significant Accounting Policies: The following significant accounting policies are in conformity with U.S. generally accepted accounting principles ("GAAP"). Such policies are consistently followed by the Trust in the preparation of its consolidated financial statements. GAAP may require management to make estimates and assumptions that affect the reported amounts and disclosures in the consolidated financial statements. Actual results may differ from those estimates.
The Fund may, consistent with its principal investment strategies, invest up to 25% of its total assets in a wholly-owned subsidiary of the Fund organized as a company under the laws of the Cayman Islands, Global Strategist Cayman Portfolio, Ltd. (the "Subsidiary"). The Subsidiary may invest, directly or indirectly through the use of derivatives, in securities, commodities, commodity-related instruments and other investments, primarily futures, swaps and notes. The Fund is the sole shareholder of the Subsidiary, and it is not currently expected that shares of the Subsidiary will be sold or offered to other investors. The consolidated portfolio of investments and consolidated financial statements include the positions and accounts of the Fund and the Subsidiary. All intercompany accounts and transactions of the Fund and the Subsidiary have been eliminated in consolidation. As of September 30, 2020, the Subsidiary represented approximately $24,146,000 or approximately 6.39% of the total assets of the Fund.
Investments in the Subsidiary are expected to provide the Fund with exposure to the commodity markets within the
limitations of Subchapter M of the Code and recent Internal Revenue Service ("IRS") revenue rulings, which require that a mutual fund receive no more than ten percent of its gross income from such investments in order to receive favorable tax treatment as a regulated investment company ("RIC"). Tax treatment of the income received from the Subsidiary may potentially be affected by changes in legislation, regulations or other legally binding authority, which could affect the character, timing and amount of the Fund's taxable income and distributions. If such changes occur, the Fund may need to significantly change its investment strategy and recognize unrealized gains in order to remain qualified for taxation as a RIC, which could adversely affect the Fund.
In March 2017, the Financial Accounting Standards Board ("FASB") issued an Accounting Standard Update, ASU 2017-08, Receivables-Nonrefundable Fees and Other Costs (Subtopic 310-20), Premium Amortization on Purchased Callable Debt Securities ("ASU 2017-08") which amends the amortization period for certain purchased callable debt securities held at a premium, shortening such period to the earliest call date. ASU 2017-08 does not require any accounting change for debt securities held at a discount; the discount continues to be accreted to maturity. ASU 2017-08 is effective for fiscal years, and interim periods within those fiscal years, beginning after December 15, 2018. The adoption resulted in a change in accounting principle, since the Fund had historically amortized such premiums to maturity for U.S. GAAP. Accordingly, the Fund has adopted ASU 2017-08 to amend the premium amortization period for certain purchased callable debt securities with non-contingent call features to the earliest call date. It is impracticable to evaluate the effect on individual prior periods, therefore the Fund applied the amendments on a modified retrospective basis by recognizing a cumulative effect adjustment that decreased the beginning of period cost of investments and increased the unrealized appreciation on investments of approximately $21,000.
This change in accounting policy has been made to comply with the newly issued accounting standard and had no impact on total accumulated earnings (loss) or the net asset value of the Fund. With respect to the Fund's results of operations, amortization of premium to first call date accelerates amortization with the intent of more closely aligning the recognition of income on such bonds with the economics of the instrument.
In March 2020, FASB issued an Accounting Standard Update, ASU 2020-04, Reference Rate Reform (Topic 848) — Facilitation of the Effects of Reference Rate Reform on
61
Morgan Stanley Institutional Fund Trust
Annual Report — September 30, 2020
Notes to Consolidated Financial Statements (cont'd)
Financial Reporting ("ASU 2020-04"), which provides optional, temporary relief with respect to the financial reporting of contracts subject to certain types of modifications due to the planned discontinuation of the London Interbank Offered Rate ("LIBOR") and other IBOR-based reference rates at the end of 2021. The temporary relief provided by ASU 2020-04 is effective for certain reference rate-related contract modifications that occur during the period from March 12, 2020 through December 31, 2022. Management is evaluating the impact of ASU 2020-04 on the Fund's investments, derivatives, debt and other contracts that will undergo reference rate-related modifications as a result of the reference rate reform.
1. Security Valuation: (1) Certain portfolio securities may be valued by an outside pricing service/vendor approved by the Trust's Board of Trustees (the "Trustees"). The pricing service/vendor may employ a pricing model that takes into account, among other things, bids, yield spreads and/or other market data and specific security characteristics. Alternatively, if a valuation is not available from an outside pricing service/vendor, and the security trades on an exchange, the security may be valued at its latest reported sale price (or at the exchange official closing price if such exchange reports an official closing price), prior to the time when assets are valued. If there are no sales on a given day and if there is no official exchange closing price for that day, the security is valued at the mean between the last reported bid and asked prices if such bid and asked prices are available in the relevant exchanges. If only bid prices are available then the latest bid price may be used. If Morgan Stanley Investment Management Inc. (the "Adviser") or Morgan Stanley Investment Management Limited ("MSIM Limited") (the "Sub-Adviser"), each a wholly-owned subsidiary of Morgan Stanley, determines that the price provided by the outside pricing service/vendor or exchange does not reflect the security's fair value or is unable to provide a price, prices from brokers or dealers may also be utilized. In these circumstances, the value of the security will be the mean of bid and asked prices obtained from brokers or dealers; (2) an equity portfolio security listed or traded on an exchange is valued at its latest reported sales price (or at the exchange official closing price if such exchange reports an official closing price), and if there were no sales on a given day and if there is no official exchange closing price for that day, the security is valued at the mean between the last reported bid and asked prices if such bid and asked prices
are available on the relevant exchanges. If only bid prices are available then the latest bid price may be used. Listed equity securities not traded on the valuation date with no reported bid and asked prices available on the exchange are valued at the mean between the current bid and asked prices obtained from one or more reputable brokers or dealers. In cases where a security is traded on more than one exchange, the security is valued on the exchange designated as the primary market; (3) all other equity portfolio securities for which over-the-counter ("OTC") market quotations are readily available are valued at the latest reported sales price (or at the market official closing price if such market reports an official closing price), and if there was no trading in the security on a given day and if there is no official closing price from relevant markets for that day, the security is valued at the mean between the last reported bid and asked prices if such bid and asked prices are available on the relevant markets. An unlisted equity security that does not trade on the valuation date and for which bid and asked prices from the relevant markets are unavailable is valued at the mean between the current bid and asked prices obtained from one or more reputable brokers or dealers; (4) futures are valued at the settlement price on the exchange on which they trade or, if a settlement price is unavailable, at the last sale price on the exchange; (5) OTC swaps may be valued by an outside pricing service approved by the Trustees or quotes from a broker or dealer. Swaps cleared on a clearinghouse or exchange may be valued using the closing price provided by the clearinghouse or exchange; (6) when market quotations are not readily available, including circumstances under which the Adviser or the Sub-Adviser determines that the closing price, last sale price or the mean between the last reported bid and asked prices are not reflective of a security's market value, portfolio securities are valued at their fair value as determined in good faith under procedures established by and under the general supervision of the Trustees. Occasionally, developments affecting the closing prices of securities and other assets may occur between the times at which valuations of such securities are determined (that is, close of the foreign market on which the securities trade) and the close of business of the New York Stock Exchange ("NYSE"). If developments occur during such periods that are expected to materially affect the value of such securities, such valuations may be adjusted to reflect the estimated fair value of such securities as of the close of the NYSE, as determined in good faith
62
Morgan Stanley Institutional Fund Trust
Annual Report — September 30, 2020
Notes to Consolidated Financial Statements (cont'd)
by the Trustees or by the Adviser using a pricing service and/or procedures approved by the Trustees; (7) quotations of foreign portfolio securities, other assets and liabilities and forward contracts stated in foreign currency are translated into U.S. dollar equivalents at the prevailing market rates prior to the close of the NYSE; and (8) investments in mutual funds, including the Morgan Stanley Institutional Liquidity Funds, are valued at the net asset value ("NAV") as of the close of each business day.
The Trustees have responsibility for determining in good faith the fair value of the investments, and the Trustees may appoint others, such as the Trust's Adviser or a valuation committee, to assist the Trustees in determining fair value and to make the actual calculations pursuant to the fair valuation methodologies previously approved by the Trustees. Under procedures approved by the Trustees, the Trust's Adviser has formed a Valuation Committee whose members are approved by the Trustees. The Valuation Committee provides administration and oversight of the Trust's valuation policies and procedures, which are reviewed at least annually by the Trustees. These procedures allow the Trust to utilize independent pricing services, quotations from securities and financial instrument dealers and other market sources to determine fair value.
2. Fair Value Measurement: FASB Accounting Standards CodificationTM ("ASC") 820, "Fair Value Measurement" ("ASC 820"), defines fair value as the value that the Fund would receive to sell an investment or pay to transfer a liability in a timely transaction with an independent buyer in the principal market, or in the absence of a principal market, the most advantageous market for the investment or liability. ASC 820 establishes a three-tier hierarchy to distinguish between (1) inputs that reflect the assumptions market participants would use in valuing an asset or liability developed based on market data obtained from sources independent of the reporting entity (observable inputs) and (2) inputs that reflect the reporting entity's own assumptions about the assumptions market participants would use in valuing an asset or liability developed based on the best information available in the circumstances (unobservable inputs) and to establish classification of fair value measurements for disclosure purposes. Various inputs are used in determining the value
of the Fund's investments. The inputs are summarized in the three broad levels listed below:
• Level 1 – unadjusted quoted prices in active markets for identical investments
• Level 2 – other significant observable inputs (including quoted prices for similar investments, interest rates, prepayment speeds, credit risk, etc.)
• Level 3 – significant unobservable inputs including the Fund's own assumptions in determining the fair value of investments. Factors considered in making this determination may include, but are not limited to, information obtained by contacting the issuer, analysts, or the appropriate stock exchange (for exchange-traded securities), analysis of the issuer's financial statements or other available documents and, if necessary, available information concerning other securities in similar circumstances.
The inputs or methodology used for valuing securities are not necessarily an indication of the risk associated with investing in those securities and the determination of the significance of a particular input to the fair value measurement in its entirety requires judgment and considers factors specific to each security.
The following is a summary of the inputs used to value the Fund's investments as of September 30, 2020:
Investment Type | | Level 1
Unadjusted
quoted
prices
(000) | | Level 2
Other
significant
observable
inputs
(000) | | Level 3
Significant
unobservable
inputs
(000) | | Total
(000) | |
Assets: | |
Fixed Income Securities | |
Agency Adjustable Rate
Mortgage | | $ | — | | | $ | 69 | | | $ | — | | | $ | 69 | | |
Agency Fixed Rate
Mortgages | | | — | | | | 13,596 | | | | — | | | | 13,596 | | |
Asset-Backed Securities | | | — | | | | 1,780 | | | | — | | | | 1,780 | | |
Collateralized Mortgage
Obligations — Agency
Collateral Series | | | — | | | | — | @ | | | — | | | | — | @ | |
Commercial
Mortgage-Backed
Securities | | | — | | | | 1,946 | | | | — | | | | 1,946 | | |
Corporate Bonds | | | — | | | | 41,325 | | | | — | | | | 41,325 | | |
Mortgages — Other | | | — | | | | 2,187 | | | | — | | | | 2,187 | | |
Sovereign | | | — | | | | 83,364 | | | | — | | | | 83,364 | | |
U.S. Treasury Securities | | | — | | | | 7,603 | | | | — | | | | 7,603 | | |
Total Fixed Income
Securities | | | — | | | | 151,870 | | | | — | | | | 151,870 | | |
63
Morgan Stanley Institutional Fund Trust
Annual Report — September 30, 2020
Notes to Consolidated Financial Statements (cont'd)
Investment Type | | Level 1
Unadjusted
quoted
prices
(000) | | Level 2
Other
significant
observable
inputs
(000) | | Level 3
Significant
unobservable
inputs
(000) | | Total
(000) | |
Common Stocks | |
Aerospace & Defense | | $ | 4,120 | | | $ | 517 | | | $ | — | | | $ | 4,637 | | |
Air Freight & Logistics | | | 1,871 | | | | 499 | | | | — | | | | 2,370 | | |
Airlines | | | 112 | | | | 24 | | | | — | | | | 136 | | |
Auto Components | | | 1,362 | | | | 6,238 | | | | — | | | | 7,600 | | |
Automobiles | | | 1,901 | | | | 7,107 | | | | — | | | | 9,008 | | |
Banks | | | 4,001 | | | | 3,008 | | | | — | | | | 7,009 | | |
Beverages | | | 1,213 | | | | 938 | | | | — | | | | 2,151 | | |
Biotechnology | | | 1,603 | | | | 446 | | | | — | | | | 2,049 | | |
Building Products | | | 2,039 | | | | 419 | | | | — | | | | 2,458 | | |
Capital Markets | | | 2,073 | | | | 1,256 | | | | — | | | | 3,329 | | |
Chemicals | | | 1,671 | | | | 1,702 | | | | — | | | | 3,373 | | |
Commercial Banks | | | — | | | | 2 | | | | — | | | | 2 | | |
Commercial Services &
Supplies | | | 1,388 | | | | 145 | | | | — | | | | 1,533 | | |
Communications
Equipment | | | 566 | | | | 256 | | | | — | | | | 822 | | |
Construction &
Engineering | | | 133 | | | | 355 | | | | — | | | | 488 | | |
Construction Materials | | | 1,101 | | | | 346 | | | | — | | | | 1,447 | | |
Consumer Finance | | | 376 | | | | 2 | | | | — | | | | 378 | | |
Containers &
Packaging | | | 326 | | | | 58 | | | | — | | | | 384 | | |
Distributors | | | 75 | | | | — | | | | — | | | | 75 | | |
Diversified Consumer
Services | | | 12 | | | | — | | | | — | | | | 12 | | |
Diversified Financial
Services | | | 720 | | | | 382 | | | | — | | | | 1,102 | | |
Diversified
Telecommunication
Services | | | 1,156 | | | | 1,035 | | | | — | | | | 2,191 | | |
Electric Utilities | | | 1,358 | | | | 1,027 | | | | — | | | | 2,385 | | |
Electrical Equipment | | | 1,258 | | | | 1,170 | | | | — | | | | 2,428 | | |
Electronic Equipment,
Instruments &
Components | | | 509 | | | | 128 | | | | — | | | | 637 | | |
Energy Equipment &
Services | | | 122 | | | | 26 | | | | — | † | | | 148 | † | |
Entertainment | | | 1,237 | | | | 141 | | | | — | | | | 1,378 | | |
Equity Real Estate
Investment Trusts
(REITs) | | | 2,025 | | | | 530 | | | | — | | | | 2,555 | | |
Food & Staples Retailing | | | 1,376 | | | | 661 | | | | — | | | | 2,037 | | |
Food Products | | | 787 | | | | 2,319 | | | | — | | | | 3,106 | | |
Gas Utilities | | | 51 | | | | 190 | | | | — | | | | 241 | | |
Health Care Equipment &
Supplies | | | 2,608 | | | | 603 | | | | — | | | | 3,211 | | |
Health Care Providers &
Services | | | 1,741 | | | | 265 | | | | — | | | | 2,006 | | |
Health Care Technology | | | 130 | | | | — | | | | — | | | | 130 | | |
Hotels, Restaurants &
Leisure | | | 5,309 | | | | 1,840 | | | | — | | | | 7,149 | | |
Household Durables | | | 11,613 | | | | 279 | | | | — | | | | 11,892 | | |
Household Products | | | 1,179 | | | | 507 | | | | — | | | | 1,686 | | |
Independent Power &
Renewable Electricity
Producers | | | 85 | | | | 63 | | | | — | | | | 148 | | |
Industrial Conglomerates | | | 2,625 | | | | 581 | | | | — | | | | 3,206 | | |
Information Technology
Services | | | 4,150 | | | | 250 | | | | — | | | | 4,400 | | |
Insurance | | | 2,495 | | | | 2,491 | | | | — | | | | 4,986 | | |
Interactive Media &
Services | | | 4,041 | | | | 57 | | | | — | | | | 4,098 | | |
Investment Type | | Level 1
Unadjusted
quoted
prices
(000) | | Level 2
Other
significant
observable
inputs
(000) | | Level 3
Significant
unobservable
inputs
(000) | | Total
(000) | |
Common Stocks (cont'd) | |
Internet & Direct
Marketing Retail | | $ | 4,029 | | | $ | 43 | | | $ | — | | | $ | 4,072 | | |
Leisure Products | | | 45 | | | | — | | | | — | | | | 45 | | |
Life Sciences Tools &
Services | | | 939 | | | | 228 | | | | — | | | | 1,167 | | |
Machinery | | | 4,136 | | | | 934 | | | | — | | | | 5,070 | | |
Marine | | | — | | | | 132 | | | | — | | | | 132 | | |
Media | | | 1,180 | | | | 195 | | | | — | | | | 1,375 | | |
Metals & Mining | | | 1,298 | | | | 3,930 | | | | — | | | | 5,228 | | |
Multi-Line Retail | | | 502 | | | | 233 | | | | — | | | | 735 | | |
Multi-Utilities | | | 664 | | | | 580 | | | | — | | | | 1,244 | | |
Oil, Gas & Consumable
Fuels | | | 2,016 | | | | 1,529 | | | | — | | | | 3,545 | | |
Paper & Forest Products | | | 119 | | | | 142 | | | | — | | | | 261 | | |
Personal Products | | | 126 | | | | 1,144 | | | | — | | | | 1,270 | | |
Pharmaceuticals | | | 2,850 | | | | 4,443 | | | | — | | | | 7,293 | | |
Professional Services | | | 1,450 | | | | 818 | | | | — | | | | 2,268 | | |
Real Estate
Management &
Development | | | 65 | | | | 655 | | | | — | | | | 720 | | |
Road & Rail | | | 3,621 | | | | 66 | | | | — | | | | 3,687 | | |
Semiconductors &
Semiconductor
Equipment | | | 3,496 | | | | 833 | | | | — | | | | 4,329 | | |
Software | | | 6,593 | | | | 782 | | | | — | | | | 7,375 | | |
Specialty Retail | | | 1,797 | | | | 242 | | | | — | | | | 2,039 | | |
Tech Hardware,
Storage & Peripherals | | | 5,245 | | | | — | | | | — | | | | 5,245 | | |
Textiles, Apparel &
Luxury Goods | | | 626 | | | | 1,465 | | | | — | | | | 2,091 | | |
Thrifts & Mortgage
Finance | | | 85 | | | | — | | | | — | | | | 85 | | |
Tobacco | | | 442 | | | | 505 | | | | — | | | | 947 | | |
Trading Companies &
Distributors | | | 816 | | | | 328 | | | | — | | | | 1,144 | | |
Transportation
Infrastructure | | | — | | | | 269 | | | | — | | | | 269 | | |
Water Utilities | | | 64 | | | | 73 | | | | — | | | | 137 | | |
Wireless
Telecommunication
Services | | | 177 | | | | 197 | | | | — | | | | 374 | | |
Total Common Stocks | | | 114,899 | | | | 57,629 | | | | — | † | | | 172,528 | † | |
Preferred Stock | |
Internet & Direct
Marketing Retail | | | 4 | | | | — | | | | — | | | | 4 | | |
Right | | | 5 | | | | — | | | | — | | | | 5 | | |
Warrants | | | 1 | | | | — | | | | — | | | | 1 | | |
Short-Term Investments | |
Investment Company | | | 44,327 | | | | — | | | | — | | | | 44,327 | | |
U.S. Treasury Security | | | — | | | | 5,154 | | | | — | | | | 5,154 | | |
Total Short-Term
Investments | | | 44,327 | | | | 5,154 | | | | — | | | | 49,481 | | |
Foreign Currency
Forward Exchange
Contracts | | | — | | | | 1,190 | | | | — | | | | 1,190 | | |
Futures Contracts | | | 392 | | | | — | | | | — | | | | 392 | | |
Interest Rate Swap
Agreements | | | — | | | | 716 | | | | — | | | | 716 | | |
Total Return Swap
Agreements | | | — | | | | 1,945 | | | | — | | | | 1,945 | | |
Total Assets | | | 159,628 | | | | 218,504 | | | | — | † | | | 378,132 | † | |
64
Morgan Stanley Institutional Fund Trust
Annual Report — September 30, 2020
Notes to Consolidated Financial Statements (cont'd)
Investment Type | | Level 1
Unadjusted
quoted
prices
(000) | | Level 2
Other
significant
observable
inputs
(000) | | Level 3
Significant
unobservable
inputs
(000) | | Total
(000) | |
Liabilities: | |
Foreign Currency
Forward Exchange
Contracts | | $ | — | | | $ | (759 | ) | | $ | — | | | $ | (759 | ) | |
Futures Contracts | | | (159 | ) | | | — | | | | — | | | | (159 | ) | |
Total Return Swap
Agreements | | | — | | | | (2,455 | ) | | | — | | | | (2,455 | ) | |
Total Liabilities | | | (159 | ) | | | (3,214 | ) | | | — | | | | (3,373 | ) | |
Total | | $ | 159,469 | | | $ | 215,290 | | | $ | — | † | | $ | 374,759 | † | |
@ Value is less than $500.
† Includes one or more securities valued at zero.
Transfers between investment levels may occur as the markets fluctuate and/or the availability of data used in an investment's valuation changes.
Following is a reconciliation of investments in which significant unobservable inputs (Level 3) were used in determining fair value:
| | | Common
Stocks
(000) | |
Beginning Balance | | $ | — | † | |
Purchases | | | — | | |
Sales | | | — | | |
Amortization of discount | | | — | | |
Transfers in | | | — | | |
Transfers out | | | — | | |
Corporate actions | | | — | | |
Change in unrealized appreciation (depreciation) | | | — | | |
Realized gains (losses) | | | — | | |
Ending Balance | | $ | — | † | |
Net change in unrealized appreciation (depreciation) from investments
still held as of September 30, 2020 | | $ | — | † | |
† Includes one or more securities valued at zero.
3. Foreign Currency Translation and Foreign Investments: The books and records of the Fund are maintained in U.S. dollars. Foreign currency amounts are translated into U.S. dollars as follows:
– investments, other assets and liabilities at the prevailing rate of exchange on the valuation date;
– investment transactions and investment income at the prevailing rates of exchange on the dates of such transactions.
Although the net assets of the Fund are presented at the foreign exchange rates and market values at the close of
the period, the Fund does not isolate that portion of the results of operations arising as a result of changes in the foreign exchange rates from the fluctuations arising from changes in the market prices of securities held at period end. Similarly, the Fund does not isolate the effect of changes in foreign exchange rates from the fluctuations arising from changes in the market prices of securities sold during the period. Accordingly, realized and unrealized foreign currency gains (losses) on investments in securities are included in the reported net realized and unrealized gains (losses) on investment transactions and balances. However, pursuant to U.S. federal income tax regulations, gains and losses from certain foreign currency transactions and the foreign currency portion of gains and losses realized on sales and maturities of foreign denominated debt securities are treated as ordinary income for U.S. federal income tax purposes.
Net realized gains (losses) on foreign currency transactions represent net foreign exchange gains (losses) from foreign currency forward exchange contracts, disposition of foreign currencies, currency gains (losses) realized between the trade and settlement dates on securities transactions, and the difference between the amount of investment income and foreign withholding taxes recorded on the Fund's books and the U.S. dollar equivalent amounts actually received or paid. The change in unrealized currency gains (losses) on foreign currency transactions for the period is reflected in the Consolidated Statement of Operations.
Foreign security and currency transactions may involve certain considerations and risks not typically associated with those of U.S. dollar denominated transactions as a result of, among other factors, fluctuations of exchange rates in relation to the U.S. dollar, the possibility of lower levels of governmental supervision and regulation of foreign securities markets and the possibility of political or economic instability.
Governmental approval for foreign investments may be required in advance of making an investment under certain circumstances in some countries, and the extent of foreign investments in domestic companies may be subject to limitation in other countries. Foreign ownership limitations also may be imposed by the charters of individual companies to prevent, among other concerns, violations of foreign investment limitations. As a result, an additional class of shares (identified as "Foreign" in
65
Morgan Stanley Institutional Fund Trust
Annual Report — September 30, 2020
Notes to Consolidated Financial Statements (cont'd)
the Consolidated Portfolio of Investments) may be created and offered for investment. The "local" and "foreign shares" market values may differ. In the absence of trading of the foreign shares in such markets, the Fund values the foreign shares at the closing exchange price of the local shares.
4. Derivatives: The Fund may, but is not required to, use derivative instruments for a variety of purposes, including hedging, risk management, portfolio management or to earn income. Derivatives are financial instruments whose value is based, in part, on the value of an underlying asset, interest rate, index or financial instrument. Prevailing interest rates and volatility levels, among other things, also affect the value of derivative instruments. A derivative instrument often has risks similar to its underlying asset and may have additional risks, including imperfect correlation between the value of the derivative and the underlying asset, risks of default by the counterparty to certain transactions, magnification of losses incurred due to changes in the market value of the securities, instruments, indices or interest rates to which the derivative instrument relates, risks that the transactions may not be liquid and risks arising from margin requirements. The use of derivatives involves risks that are different from, and possibly greater than, the risks associated with other portfolio investments. Derivatives may involve the use of highly specialized instruments that require investment techniques and risk analyses different from those associated with other portfolio investments. All of the Fund's holdings, including derivative instruments, are marked-to-market each day with the change in value reflected in unrealized appreciation (depreciation). Upon disposition, a realized gain or loss is recognized.
Certain derivative transactions may give rise to a form of leverage. Leverage magnifies the potential for gain and the risk of loss. Leverage associated with derivative transactions may cause the Fund to liquidate portfolio positions when it may not be advantageous to do so to satisfy its obligations or to meet earmarking or segregation requirements, pursuant to applicable Securities and Exchange Commission ("SEC") rules and regulations, or may cause the Fund to be more volatile than if the Fund had not been leveraged. Although the Adviser seeks to use derivatives to further the Fund's investment objectives, there is no assurance that the use of derivatives will achieve this result.
Following is a description of the derivative instruments and techniques that the Fund used during the period and their associated risks:
Futures: A futures contract is a standardized, exchange-traded agreement to buy or sell a specific quantity of an underlying asset, reference rate or index at a specific price at a specific future time. The value of a futures contract tends to increase and decrease in tandem with the value of the underlying instrument. Depending on the terms of the particular contract, futures contracts are settled through either physical delivery of the underlying instrument on the settlement date or by payment of a cash settlement amount on the settlement date. During the period the futures contract is open, payments are received from or made to the broker based upon changes in the value of the contract (the variation margin). A decision as to whether, when and how to use futures contracts involves the exercise of skill and judgment and even a well-conceived futures transaction may be unsuccessful because of market behavior or unexpected events. In addition to the derivatives risks discussed above, the prices of futures contracts can be highly volatile, using futures contracts can lower total return and the potential loss from futures contracts can exceed the Fund's initial investment in such contracts. No assurance can be given that a liquid market will exist for any particular futures contract at any particular time. There is also the risk of loss by the Fund of margin deposits in the event of bankruptcy of a broker with which the Fund has open positions in the futures contract.
Swaps: The Fund may enter into OTC swap contracts or cleared swap transactions. A swap contract is an agreement between two parties pursuant to which the parties exchange payments at specified dates on the basis of a specified notional amount, with the payments calculated by reference to specified securities, indices, reference rates, currencies or other instruments. Typically swap agreements provide that when the period payment dates for both parties are the same, the payments are made on a net basis (i.e., the two payment streams are netted out, with only the net amount paid by one party to the other). The Fund's obligations or rights under a swap contract entered into on a net basis will generally be equal only to the net amount to be paid or received under the agreement, based on the relative values of the positions held by each party. Cleared swap transactions
66
Morgan Stanley Institutional Fund Trust
Annual Report — September 30, 2020
Notes to Consolidated Financial Statements (cont'd)
may help reduce counterparty credit risk. In a cleared swap, the Fund's ultimate counterparty is a clearinghouse rather than a swap dealer, bank or other financial institution. OTC swap agreements are not entered into or traded on exchanges and often there is no central clearing or guaranty function for OTC swaps. These OTC swaps are often subject to credit risk or the risk of default or non-performance by the counterparty. Both OTC and cleared swaps could result in losses if interest rates, foreign currency exchange rates or other factors are not correctly anticipated by the Fund or if the reference index, security or investments do not perform as expected. During the period swap agreements are open, payments are received from or made to the clearinghouse or counterparty based upon changes in the value of the contract (variation margin). The Dodd-Frank Wall Street Reform and Consumer Protection Act and related regulatory developments require the clearing and exchange-trading of certain standardized swap transactions. Mandatory exchange-trading and clearing is occurring on a phased-in basis.
The Fund's use of swaps during the period included those based on the credit of an underlying security commonly referred to as "credit default swaps." The Fund may be either the buyer or seller in a credit default swap. Where the Fund is the buyer of a credit default swap contract, it would typically be entitled to receive the par (or other agreed-upon) value of a referenced debt obligation from the counterparty to the contract only in the event of a default or similar event by the issuer of the debt obligation. If no default occurs, the Fund would have paid to the counterparty a periodic stream of payments over the term of the contract and received no benefit from the contract. When the Fund is the seller of a credit default swap contract, it typically receives the stream of payments but is obligated to pay an amount equal to the par (or other agreed-upon) value of a referenced debt obligation upon the default or similar event by the issuer of the referenced debt obligation. The use of credit default swaps could result in losses to the Fund if the Adviser fails to correctly evaluate the creditworthiness of the issuer of the referenced debt obligation.
If the Fund is a seller of protection and a credit event occurs, as defined under the terms of that particular swap agreement, the Fund will either (i) pay to the buyer of protection an amount equal to the notional
amount of the swap agreement and take delivery of the referenced obligation, other deliverable obligations or underlying securities comprising the referenced index or (ii) pay a net settlement amount in the form of cash or securities equal to the notional amount of the swap agreement less the recovery value of the referenced obligation or underlying securities comprising the referenced index. If the Fund is a buyer of protection and a credit event occurs, as defined under the terms of that particular swap agreement, the Fund will either (i) receive from the seller of protection an amount equal to the notional amount of the swap agreement and deliver the referenced obligation, other deliverable obligations or underlying securities comprising the referenced index or (ii) receive a net settlement amount in the form of cash or securities equal to the notional amount of the swap agreement less the recovery value of the referenced obligation or underlying securities comprising the referenced index. Recovery values are estimated by market makers considering either industry standard recovery rates or entity specific factors and considerations until a credit event occurs. If a credit event has occurred, the recovery value is determined by a facilitated auction whereby a minimum number of allowable broker bids, together with a specified valuation method, are used to calculate the settlement value. The Fund's maximum risk of loss from counterparty risk, either as the protection seller or as the protection buyer, is the fair value of the swap agreement.
The current credit rating of each individual issuer is listed in the table following the Consolidated Portfolio of Investments and serves as an indicator of the current status of the payment/performance risk of the credit derivative. Alternatively, for credit default swaps on an index of credits, the quoted market prices and current values serve as an indicator of the current status of the payment/performance risk of the credit derivative. Generally, lower credit ratings and increasing market values, in absolute terms, represent a deterioration of the credit and a greater likelihood of an adverse credit event of the issuer.
When the Fund has an unrealized loss on a swap agreement, the Fund has instructed the custodian to pledge cash or liquid securities as collateral with a value approximately equal to the amount of the unrealized loss. Collateral pledges are monitored and subsequently adjusted
67
Morgan Stanley Institutional Fund Trust
Annual Report — September 30, 2020
Notes to Consolidated Financial Statements (cont'd)
if and when the swap valuations fluctuate. If applicable, cash collateral is included with "Due from (to) Broker" in the Consolidated Statement of Assets and Liabilities.
Upfront payments paid or received by the Fund will be reflected as an asset or liability, respectively, in the Consolidated Statement of Assets and Liabilities.
Foreign Currency Forward Exchange Contracts: In connection with its investments in foreign securities, the Fund also entered into contracts with banks, brokers or dealers to purchase or sell securities or foreign currencies at a future date. A foreign currency forward exchange contract ("currency contract") is a negotiated agreement between the contracting parties to exchange a specified amount of currency at a specified future time at a specified rate. The rate can be higher or lower than the spot rate between the currencies that are the subject of the contract. Currency contracts may be used to protect against uncertainty in the level of future foreign currency exchange rates or to gain or modify exposure to a particular currency. In addition, the Fund may use cross currency hedging or proxy hedging with respect to currencies in which the Fund has or expects to have portfolio or currency exposure. Cross currency hedges involve the sale of one currency against the positive exposure to a different currency and may be used for hedging purposes or to establish an active exposure to the exchange rate between any two currencies. To the extent hedged by the use of currency contracts, the precise matching of the currency contract amounts and the value of the securities involved will not generally be possible because the future value of such securities in foreign currencies will change as a consequence of market movements in the value of those securities between the date on which the contract is entered into and the date it matures. Furthermore, such transactions may reduce or preclude the opportunity for gain if the value of the currency should move in the direction opposite to the position taken. There is additional risk to the extent that currency contracts create exposure to currencies in which the Fund's securities are not denominated. Unanticipated changes in currency prices may result in poorer overall performance for the Fund than if it had not entered into such contracts. The use of currency contracts involves the risk of loss from the insolvency or bankruptcy of the counterparty to the contract or the failure of the counterparty to make payments or otherwise comply with the
terms of the contract. A currency contract is marked-to-market daily and the change in market value is recorded by the Fund as unrealized gain or loss. The Fund records realized gains (losses) when the currency contract is closed equal to the difference between the value of the currency contract at the time it was opened and the value at the time it was closed.
FASB ASC 815, "Derivatives and Hedging" ("ASC 815"), is intended to improve financial reporting about derivative instruments by requiring enhanced disclosures to enable investors to better understand how and why the Fund uses derivative instruments, how these derivative instruments are accounted for and their effects on the Fund's financial position and results of operations.
The following tables set forth the fair value of the Fund's derivative contracts by primary risk exposure as of September 30, 2020:
| | | Asset Derivatives
Consolidated
Statement of Assets and
Liabilities Location | | Primary Risk
Exposure | | Value
(000) | |
Foreign Currency
Forward Exchange
Contracts | | Unrealized Appreciation on
Foreign Currency Forward
Exchange Contracts | |
Currency Risk | | $ | 1,190 | | |
Futures Contracts
| | Variation Margin on
Futures Contracts | | Commodity Risk | | | 26 | (a) | |
Futures Contracts
| | Variation Margin on
Futures Contracts | | Equity Risk | | | 283 | (a) | |
Futures Contracts
| | Variation Margin on
Futures Contracts | | Interest Rate Risk | | | 83 | (a) | |
Swap Agreements
| | Variation Margin on
Swap Agreements | | Interest Rate Risk | | | 645 | (a) | |
Swap Agreements
| | Unrealized Appreciation on
Swap Agreements | | Equity Risk | | | 1,945 | | |
Swap Agreement | | Unrealized Appreciation on
Swap Agreement | | Interest Rate Risk | | | 71 | | |
Total | | | | | | $ | 4,243 | | |
| | | Liability Derivatives
Consolidated
Statement of Assets and
Liabilities Location | | Primary Risk
Exposure | | Value
(000) | |
Foreign Currency
Forward Exchange
Contracts | | Unrealized Depreciation on
Foreign Currency Forward
Exchange Contracts | |
Currency Risk | | $ | (759 | ) | |
Futures Contract
| | Variation Margin on
Futures Contract | | Equity Risk | | | (50 | )(a) | |
Futures Contracts
| | Variation Margin on
Futures Contracts | | Interest Rate Risk | | | (109 | )(a) | |
Swap Agreements
| | Unrealized Depreciation on
Swap Agreements | | Equity Risk | | | (2,455 | ) | |
Total | | | | | | $ | (3,373 | ) | |
(a) This amount represents the cumulative appreciation (depreciation) as reported in the Consolidated Portfolio of Investments. The Consolidated Statement of Assets and Liabilities only reflects the current day's net variation margin.
68
Morgan Stanley Institutional Fund Trust
Annual Report — September 30, 2020
Notes to Consolidated Financial Statements (cont'd)
The following tables set forth by primary risk exposure the Fund's realized gains (losses) and change in unrealized appreciation (depreciation) by type of derivative contract for the year ended September 30, 2020 in accordance with ASC 815:
Realized Gain (Loss) | |
Primary Risk Exposure | | Derivative Type | | Value
(000) | |
Currency Risk
| | Foreign Currency Forward
Exchange Contracts | | $ | (2,253 | ) | |
Commodity Risk | | Futures Contracts | | | 1,920 | | |
Equity Risk | | Futures Contracts | | | 48 | | |
Interest Rate Risk | | Futures Contracts | | | (1,821 | ) | |
Credit Risk | | Swap Agreements | | | 46 | | |
Equity Risk | | Swap Agreements | | | (3,430 | ) | |
Interest Rate Risk | | Swap Agreements | | | (40 | ) | |
Total | | | | $ | (5,530 | ) | |
Change in Unrealized Appreciation (Depreciation) | |
Primary Risk Exposure | | Derivative Type | | Value
(000) | |
Currency Risk
| | Foreign Currency Forward
Exchange Contracts | | $ | 1,463 | | |
Commodity Risk | | Futures Contracts | | | (50 | ) | |
Equity Risk | | Futures Contracts | | | 683 | | |
Interest Rate Risk | | Futures Contracts | | | 75 | | |
Equity Risk | | Swap Agreements | | | 482 | | |
Credit Risk | | Swap Agreement | | | (25 | ) | |
Interest Rate Risk | | Swap Agreements | | | 925 | | |
Total | | | | $ | 3,553 | | |
At September 30, 2020, the Fund's derivative assets and liabilities are as follows:
Gross Amounts of Assets and Liabilities
Presented in the Consolidated Statement of Assets and Liabilities | |
Derivatives(b) | | Assets(c)
(000) | | Liabilities(c)
(000) | |
Foreign Currency Forward Exchange Contracts | | $ | 1,190 | | | $ | (759 | ) | |
Swap Agreements | | | 2,016 | | | | (2,455 | ) | |
Total | | $ | 3,206 | | | $ | (3,214 | ) | |
(b) Excludes exchange-traded derivatives.
(c) Absent an event of default or early termination, OTC derivative assets and liabilities are presented gross and not offset in the Consolidated Statement of Assets and Liabilities.
The Fund typically enters into International Swaps and Derivatives Association, Inc. Master Agreements ("ISDA Master Agreements") or similar master agreements (collectively, "Master Agreements") with its contract counterparties for certain OTC derivatives in order to, among other things, reduce its credit risk to counterparties. ISDA Master Agreements include provisions for general obligations, representations, collateral and events of default or termination. Under an ISDA Master Agreement, the Fund typically may offset with the counterparty certain OTC
derivative financial instruments' payables and/or receivables with collateral held and/or posted and create one single net payment (close-out netting) in the event of default, termination and/or potential deterioration in the credit quality of the counterparty. Various Master Agreements govern the terms of certain transactions with counterparties, including transactions such as swap, forward, repurchase and reverse repurchase agreements. These Master Agreements typically attempt to reduce the counterparty risk associated with such transactions by specifying credit protection mechanisms and providing standardization that improves legal certainty. Cross-termination provisions under Master Agreements typically provide that a default in connection with one transaction between the Fund and a counterparty gives the non-defaulting party the right to terminate any other transactions in place with the defaulting party to create one single net payment due to/due from the defaulting party and may be a feature in certain Master Agreements. In the event the Fund exercises its right to terminate a Master Agreement after a counterparty experiences a termination event as defined in the Master Agreement, the return of collateral with market value in excess of the Fund's net liability may be delayed or denied.
The following tables present derivative financial instruments that are subject to enforceable netting arrangements as of September 30, 2020:
Gross Amounts Not Offset in the Consolidated Statement of Assets and Liabilities | |
Counterparty | | Gross Asset
Derivatives
Presented in the
Consolidated
Statement of
Assets and
Liabilities
(000) | | Financial
Instrument
(000) | | Collateral
Received(d)
(000) | | Net Amount
(not less
than $0)
(000) | |
Bank of America NA | | $ | 2 | | | $ | (2 | ) | | $ | — | | | $ | 0 | | |
Bank of Montreal | | | 1 | | | | — | | | | — | | | | 1 | | |
Bank of New York Mellon | | | 5 | | | | — | | | | — | | | | 5 | | |
Barclays Bank PLC | | | 105 | | | | (12 | ) | | | — | | | | 93 | | |
BNP Paribas SA | | | 181 | | | | (169 | ) | | | (12 | ) | | | 0 | | |
Citibank NA | | | 1 | | | | (1 | ) | | | — | | | | 0 | | |
Commonwealth Bank of Australia | | | 2 | | | | — | | | | — | | | | 2 | | |
Credit Suisse International | | | 1 | | | | — | | | | — | | | | 1 | | |
Goldman Sachs International | | | 73 | | | | (73 | ) | | | — | | | | 0 | | |
JPMorgan Chase Bank NA | | | 2,192 | | | | (1,836 | ) | | | (310 | ) | | | 46 | | |
State Street Bank and Trust Co. | | | 1 | | | | — | | | | — | | | | 1 | | |
UBS AG | | | 642 | | | | (42 | ) | | | — | | | | 600 | | |
Total | | $ | 3,206 | | | $ | (2,135 | ) | | $ | (322 | ) | | $ | 749 | | |
69
Morgan Stanley Institutional Fund Trust
Annual Report — September 30, 2020
Notes to Consolidated Financial Statements (cont'd)
Gross Amounts Not Offset in the Consolidated Statement of Assets and Liabilities | |
Counterparty | | Gross Liability
Derivatives
Presented in the
Consolidated
Statement of
Assets and
Liabilities
(000) | | Financial
Instrument
(000) | | Collateral
Pledged(d)
(000) | | Net Amount
(not less
than $0)
(000) | |
Australia And New Zealand
Banking Group | | $ | 23 | | | $ | — | | | $ | — | | | $ | 23 | | |
Bank of America NA | | | 7 | | | | (2 | ) | | | — | | | | 5 | | |
Barclays Bank PLC | | | 77 | | | | (12 | ) | | | — | | | | 65 | | |
BNP Paribas SA | | | 169 | | | | (169 | ) | | | — | | | | 0 | | |
Citibank NA | | | 114 | | | | (1 | ) | | | — | | | | 113 | | |
Goldman Sachs International | | | 498 | | | | (73 | ) | | | (339 | ) | | | 86 | | |
JPMorgan Chase Bank NA | | | 2,284 | | | | (1,836 | ) | | | — | | | | 448 | | |
UBS AG | | | 42 | | | | (42 | ) | | | — | | | | 0 | | |
Total | | $ | 3,214 | | | $ | (2,135 | ) | | $ | (339 | ) | | $ | 740 | | |
(d) In some instances, the actual collateral received may be more than the amount shown here due to overcollateralization.
For the year ended September 30, 2020, the approximate average monthly amount outstanding for each derivative type is as follows:
Foreign Currency Forward Exchange Contracts: | |
Average monthly principal amount | | $ | 131,655,000 | | |
Futures Contracts: | |
Average monthly notional value | | $ | 121,058,000 | | |
Swap Agreements: | |
Average monthly notional amount | | $ | 62,217,000 | | |
5. When-Issued/Delayed Delivery Securities: The Fund purchases and sells when-issued and delayed delivery securities. Securities purchased on a when-issued or delayed delivery basis are purchased for delivery beyond the normal settlement date at a stated price and yield, and no income accrues to the Fund on such securities prior to delivery date. Payment and delivery for when-issued and delayed delivery securities can take place a month or more after the date of the transaction. When the Fund enters into a purchase transaction on a when-issued or delayed delivery basis, securities are available for collateral in an amount at least equal in value to the Fund's commitments to purchase such securities. Purchasing securities on a when-issued or delayed delivery basis may involve a risk that the market price at the time of delivery may be lower than the agreed upon purchase price, in which case there could be an unrealized loss at the time of delivery. Purchasing investments on a when-issued or delayed delivery basis may be considered a form of leverage which may
increase the impact that gains (losses) may have on the Fund.
6. Indemnifications: The Trust enters into contracts that contain a variety of indemnifications. The Trust's maximum exposure under these arrangements is unknown. However, the Trust has not had prior claims or losses pursuant to these contracts and expects the risk of loss to be remote.
7. Dividends and Distributions to Shareholders: Dividends and distributions to shareholders are recorded on the ex-dividend date. Dividends from net investment income, if any, are declared and paid annually. Net realized capital gains, if any, are distributed at least annually.
8. Security Transactions, Income and Expenses: Security transactions are accounted for on the trade date (date the order to buy or sell is executed). Realized gains and losses on the sale of investment securities are determined on the specific identified cost method. Dividend income and other distributions are recorded on the ex-dividend date (except for certain foreign dividends which may be recorded as soon as the Fund is informed of such dividends) net of applicable withholding taxes. Interest income is recognized on the accrual basis except where collection is in doubt. Discounts are accreted and premiums are amortized over the life of the respective securities. Most expenses of the Trust can be directly attributed to a particular Fund. Expenses which cannot be directly attributed are apportioned among the Funds based upon relative net assets or other appropriate methods. Income, expenses (other than class specific expenses — distribution and shareholder services, transfer agency and sub transfer agency fees) and realized and unrealized gains or losses are allocated to each class of shares based upon their relative net assets.
The Fund owns shares of real estate investment trusts ("REITs") which report information on the source of their distributions annually in the following calendar year. A portion of distributions received from REITs during the year is estimated to be a return of capital and is recorded as a reduction of their cost.
B. Advisory/Sub-Advisory Fees: The Adviser, a wholly-owned subsidiary of Morgan Stanley, provides the Fund with advisory services under the terms of an Investment Advisory
70
Morgan Stanley Institutional Fund Trust
Annual Report — September 30, 2020
Notes to Consolidated Financial Statements (cont'd)
Agreement, paid quarterly, at an annual rate of 0.45% of the average daily net assets of the Fund.
The Adviser has agreed to reduce its advisory fee and/or reimburse the Fund so that total annual Fund operating expenses, excluding certain investment related expenses, taxes, interest and other extraordinary expenses (including litigation), will not exceed 0.74% for Class I shares, 1.09% for Class A shares, 1.59% for Class L shares, 1.84% for Class C shares and 0.71% for Class IS shares. The fee waivers and/or expense reimbursements will continue for at least one year from the date of the Fund's prospectus or until such time as the Trustees act to discontinue all or a portion of such waivers and/or reimbursements when they deem such action is appropriate. For the year ended September 30, 2020, approximately $144,000 of advisory fees were waived and approximately $36,000 of other expenses were reimbursed by the Adviser pursuant to this arrangement.
The Adviser has entered into a Sub-Advisory Agreement with the Sub-Adviser, a wholly-owned subsidiary of Morgan Stanley. The Sub-Adviser provides the Fund with advisory services subject to the overall supervision of the Adviser and the Fund's Officers and Trustees. The Adviser pays the Sub-Adviser on a monthly basis a portion of the net advisory fees the Adviser receives from the Fund.
The Adviser provides investment advisory services to the Subsidiary pursuant to the Subsidiary Investment Management Agreement (the "Agreement"). Under the Agreement, the Subsidiary will pay the Adviser at the end of each fiscal quarter, calculated by applying a quarterly rate, based on the annual rate of 0.05%, to the average daily net assets of the Subsidiary.
The Adviser has agreed to waive its advisory fees by the amount of advisory fees it receives from the Subsidiary.
C. Administration Fees: The Adviser also serves as Administrator to the Trust and provides administrative services pursuant to an Administration Agreement for an annual fee, accrued daily and paid monthly, of 0.08% of the Fund's average daily net assets. Under a Sub-Administration Agreement between the Administrator and State Street Bank and Trust Company ("State Street"), State Street provides certain administrative services to the Trust. For such services, the Administrator pays State Street a portion of the fee the Administrator receives from the Fund.
D. Distribution and Shareholder Services Fees: Morgan Stanley Distribution, Inc. ("MSDI" or the "Distributor"), a wholly-owned subsidiary of the Adviser, and an indirect subsidiary of Morgan Stanley, serves as the Trust's Distributor of Fund shares pursuant to a Distribution Agreement. The Trust has adopted a Shareholder Services Plan with respect to Class A shares pursuant to Rule 12b-1 under the Act. Under the Shareholder Services Plan, the Fund pays the Distributor a shareholder services fee, accrued daily and paid monthly, at an annual rate of 0.25% of the Fund's average daily net assets attributable to Class A shares.
The Trust has adopted a Distribution and Shareholder Services Plan with respect to Class L shares pursuant to Rule 12b-1 under the Act. Under the Distribution and Shareholder Services Plan, the Fund pays the Distributor a distribution fee, accrued daily and paid monthly, at an annual rate of 0.50% and a shareholder services fee, accrued daily and paid monthly, at an annual rate of 0.25% of the Fund's average daily net assets attributable to Class L shares.
The Trust has adopted a Distribution and Shareholder Services Plan with respect to Class C shares pursuant to Rule 12b-1 under the Act. Under the Distribution and Shareholder Services Plan, the Fund pays the Distributor a distribution fee, accrued daily and paid monthly, at an annual rate of 0.75% and a shareholder services fee, accrued daily and paid monthly, at an annual rate of 0.25% of the Fund's average daily net assets attributable to Class C shares.
The distribution and shareholder services fees are used to support the expenses associated with servicing and maintaining accounts. The Distributor may compensate other parties for providing shareholder support services to investors who purchase Class A, Class L and Class C shares.
E. Dividend Disbursing and Transfer Agent: The Trust's dividend disbursing and transfer agent is DST Asset Manager Solutions, Inc. ("DST"). Pursuant to a Transfer Agency Agreement, the Trust pays DST a fee based on the number of classes, accounts and transactions relating to the Funds of the Trust.
F. Custodian Fees: State Street (the "Custodian") also serves as Custodian for the Trust in accordance with a Custodian Agreement. The Custodian holds cash, securities and other assets of the Trust as required by the Act. Custody fees
71
Morgan Stanley Institutional Fund Trust
Annual Report — September 30, 2020
Notes to Consolidated Financial Statements (cont'd)
are payable monthly based on assets held in custody, investment purchases and sales activity and account maintenance fees, plus reimbursement for certain out-of-pocket expenses.
G. Security Transactions and Transactions with Affiliates: For the year ended September 30, 2020, purchases and sales of investment securities for the Fund, other than long-term U.S. Government securities and short-term investments were approximately $215,111,000 and $267,372,000, respectively. For the year ended September 30, 2020, purchases and sales of long-term U.S. Government securities were approximately $169,877,000 and $180,314,000, respectively.
The Fund invests in the Institutional Class of the Morgan Stanley Institutional Liquidity Funds — Government Portfolio (the "Liquidity Funds"), an open-end management investment company managed by the Adviser. Advisory fees paid by the Fund are reduced by an amount equal to its pro-rata share of the advisory and administration fees paid by the Fund due to its investment in the Liquidity Funds. For the year ended September 30, 2020, advisory fees paid were reduced by approximately $94,000 relating to the Fund's investment in the Liquidity Funds.
A summary of the Fund's transactions in shares of affiliated investments during the year ended September 30, 2020 is as follows:
Affiliated
Investment
Company | | Value
September 30,
2019
(000) | | Purchases
at Cost
(000) | | Proceeds
from Sales
(000) | | Dividend
Income
(000) | |
Liquidity Funds | | $ | 50,100 | | | $ | 241,604 | | | $ | 247,377 | | | $ | 417 | | |
Affiliated
Investment
Company (cont'd) | | Realized
Gain (Loss)
(000) | | Change in
Unrealized
Appreciation
(Depreciation)
(000) | | Value
September 30,
2020
(000) | |
Liquidity Funds | | $ | — | | | $ | — | | | $ | 44,327 | | |
The Fund is permitted to purchase and sell securities ("cross-trade") from and to other Morgan Stanley funds as well as other funds and client accounts for which the Adviser or an affiliate of the Adviser serves as investment adviser, pursuant to procedures approved by the Trustees in compliance with Rule 17a-7 under the Act (the "Rule"). Each cross-trade is executed at the current market price in compliance with provisions of the Rule. For the year ended September 30, 2020, the Fund did not engage in any cross-trade transactions.
The Fund has an unfunded Deferred Compensation Plan (the "Compensation Plan"), which allows each independent Trustee to defer payment of all, or a portion, of the fees he or she receives for serving on the Board of Trustees. Each eligible
Trustee generally may elect to have the deferred amounts credited with a return equal to the total return on one or more of the Morgan Stanley funds that are offered as investment options under the Compensation Plan. Appreciation/depreciation and distributions received from these investments are recorded with an offsetting increase/decrease in the deferred compensation obligation and do not affect the NAV of the Fund.
H. Federal Income Taxes: It is the Fund's intention to continue to qualify as a regulated investment company and distribute all of its taxable and tax-exempt income. Accordingly, no provision for federal income taxes is required in the consolidated financial statements.
The Fund may be subject to taxes imposed by countries in which it invests. Such taxes are generally based on income and/or capital gains earned or repatriated. Taxes are accrued based on net investment income, net realized gains and net unrealized appreciation as such income and/or gains are earned. Taxes may also be based on transactions in foreign currency and are accrued based on the value of investments denominated in such currency.
FASB ASC 740-10, "Income Taxes — Overall", sets forth a minimum threshold for consolidated financial statement recognition of the benefit of a tax position taken or expected to be taken in a tax return. Management has concluded that there are no significant uncertain tax positions that would require recognition in the consolidated financial statements. If applicable, the Fund recognizes interest accrued related to unrecognized tax benefits in "Interest Expense" and penalties in "Other Expenses" in the Consolidated Statement of Operations. The Fund files tax returns with the U.S. Internal Revenue Service, New York and various states. Generally, each of the tax years in the four-year period ended September 30, 2020 remains subject to examination by taxing authorities.
The tax character of distributions paid may differ from the character of distributions shown for GAAP purposes due to short-term capital gains being treated as ordinary income for tax purposes. The tax character of distributions paid during fiscal years 2020 and 2019 was as follows:
2020
Distributions
Paid From: | | 2019
Distributions
Paid From: | |
Ordinary
Income
(000) | | Long-Term
Capital Gain
(000) | | Ordinary
Income
(000) | | Long-Term
Capital Gain
(000) | |
| $ | 5,926 | | | $ | 1,055 | | | $ | 9,365 | | | $ | 25,784 | | |
72
Morgan Stanley Institutional Fund Trust
Annual Report — September 30, 2020
Notes to Consolidated Financial Statements (cont'd)
The amount and character of income and gains to be distributed are determined in accordance with income tax regulations which may differ from GAAP. These book/tax differences are either considered temporary or permanent in nature.
Temporary differences are attributable to differing book and tax treatments for the timing of the recognition of gains (losses) on certain investment transactions and the timing of the deductibility of certain expenses.
Permanent differences, primarily due to wash sale adjustments, resulted in the following reclassifications among the components of net assets at September 30, 2020:
Total
Distributable
Earnings
(000) | | Paid-in-
Capital
(000) | |
| $ | 2 | | | $ | (2 | ) | |
At September 30, 2020, the components of distributable earnings for the Fund on a tax basis were as follows:
Undistributed
Ordinary
Income
(000) | | Undistributed
Long-Term
Capital Gain
(000) | |
| $ | 4,953 | | | $ | — | | |
I. Credit Facility: The Trust and other Morgan Stanley funds participated in a $300,000,000 committed, unsecured revolving line of credit facility (the "Facility") with State Street. This Facility is to be used for temporary emergency purposes or funding of shareholder redemption requests. The interest rate on borrowings is based on the federal funds rate or 1 month LIBOR rate plus a spread. The Facility also has a commitment fee of 0.25% per annum based on the unused portion of the Facility. During the year ended September 30, 2020, the Fund did not have any borrowings under the Facility.
J. Other: At September 30, 2020, the Fund had record owners of 10% or greater. Investment activities of these shareholders could have a material impact on the Fund. The aggregate percentage of such owners was 74.8%.
K. Market Risk: Certain impacts to public health conditions particular to the coronavirus (COVID-19) outbreak could impact the operations and financial performance of certain of the Fund's investments. The extent of the impact to the financial performance of the Fund's investments will depend on future developments, including (i) the duration and spread of the outbreak, (ii) the restrictions and advisories, (iii) the effects on the financial markets, and (iv) the effects on the economy overall, all of which are highly uncertain and cannot be predicted.
If the financial performance of the Fund's investments is impacted because of these factors for an extended period, the Fund's investment results may be adversely affected.
L. LIBOR Risk: The Fund's investments, payment obligations and financing terms may be based on floating rates, such as London Interbank Offer Rate ("LIBOR"), Euro Interbank Offered Rate and other similar types of reference rates (each, a "Reference Rate"). These Reference Rates are generally intended to represent the rate at which contributing banks may obtain short-term borrowings from each other within certain financial markets. On July 27, 2017, the Chief Executive of the UK Financial Conduct Authority ("FCA"), which regulates LIBOR, announced that the FCA will no longer persuade nor require banks to submit rates for the calculation of LIBOR and certain other Reference Rates after 2021. Such announcement indicates that the continuation of LIBOR and other Reference Rates on the current basis cannot and will not be guaranteed after the end of 2021. This announcement and any additional regulatory or market changes may have an adverse impact on the Fund or its investments.
In advance of 2022, regulators and market participants are currently engaged in identifying successor Reference Rates ("Alternative Reference Rates"). Additionally, prior to the end of 2021, it is expected that market participants will focus on the transition mechanisms by which the Reference Rates in existing contracts or instruments may be amended, whether through marketwide protocols, fallback contractual provisions, bespoke negotiations or amendments or otherwise. Nonetheless, the termination of certain Reference Rates presents risks to the Fund. At this time, it is not possible to completely identify or predict the effect of any such changes, any establishment of Alternative Reference Rates or any other reforms to Reference Rates that may be enacted in the UK or elsewhere. The elimination of a Reference Rate or any other changes or reforms to the determination or supervision of Reference Rates could have an adverse impact on the market for or value of any securities or payments linked to those Reference Rates and other financial obligations held by the Fund or on its overall financial condition or results of operations.
73
Morgan Stanley Institutional Fund Trust
Annual Report — September 30, 2020
Report of Independent Registered Public Accounting Firm
To the Shareholders and Board of Trustees of
Morgan Stanley Institutional Fund Trust —
Global Strategist Portfolio
Opinion on the Financial Statements
We have audited the accompanying consolidated statement of assets and liabilities of Global Strategist Portfolio (the "Fund") (one of the funds constituting Morgan Stanley Institutional Fund Trust (the "Trust")), including the consolidated portfolio of investments, as of September 30, 2020, and the related consolidated statement of operations for the year then ended, the consolidated statements of changes in net assets for each of the two years in the period then ended, the consolidated financial highlights for each of the five years in the period then ended and the related notes (collectively referred to as the "financial statements"). In our opinion, the financial statements present fairly, in all material respects, the consolidated financial position of the Fund (one of the funds constituting Morgan Stanley Institutional Fund Trust) at September 30, 2020, the consolidated results of its operations for the year then ended, the consolidated changes in its net assets for each of the two years in the period then ended and its consolidated financial highlights for each of the five years in the period then ended, in conformity with U.S. generally accepted accounting principles.
Basis for Opinion
These financial statements are the responsibility of the Trust's management. Our responsibility is to express an opinion on the Fund's financial statements based on our audits. We are a public accounting firm registered with the Public Company Accounting Oversight Board (United States) ("PCAOB") and are required to be independent with respect to the Trust in accordance with the U.S. federal securities law and the applicable rules and regulations of the Securities and Exchange Commission and the PCAOB.
We conducted our audits in accordance with the standards of the PCAOB. Those standards require that we plan and perform the audit to obtain reasonable assurance about whether the financial statements are free of material misstatement, whether due to error or fraud. The Trust is not required to have, nor were we engaged to perform, an audit of the Trust's internal control over financial reporting. As part of our audits we are required to obtain an understanding of internal control over financial reporting but not for the purpose of expressing an opinion on the effectiveness of the Trust's internal control over financial reporting. Accordingly, we express no such opinion.
Our audits included performing procedures to assess the risks of material misstatement of the financial statements, whether due to error or fraud, and performing procedures that respond to those risks. Such procedures included examining, on a test basis, evidence regarding the amounts and disclosures in the financial statements. Our procedures included confirmation of securities owned as of September 30, 2020 by correspondence with the custodian and brokers or by other appropriate auditing procedures where replies from brokers were not received. Our audits also included evaluating the accounting principles used and significant estimates made by management, as well as evaluating the overall presentation of the financial statements. We believe that our audits provide a reasonable basis for our opinion.

We have served as the auditor of one or more Morgan Stanley investment companies since 2000.
Boston, Massachusetts
November 24, 2020
74
Morgan Stanley Institutional Fund Trust
Annual Report — September 30, 2020
Investment Advisory Agreement Approval (unaudited)
Nature, Extent and Quality of Services
The Board reviewed and considered the nature and extent of the investment advisory services provided by the Adviser under the advisory agreement, including portfolio management, investment research and equity and fixed income securities trading. The Board reviewed similar information and factors regarding the Sub-Adviser, to the extent applicable. The Board also reviewed and considered the nature and extent of the non-advisory, administrative services provided by the Administrator under the administration agreement, including accounting, operations, clerical, bookkeeping, compliance, business management and planning, legal services and the provision of supplies, office space and utilities at the Adviser's expense. The Board also considered the Adviser's investment in personnel and infrastructure that benefits the Fund. (The Adviser, Sub-Adviser and Administrator together are referred to as the "Adviser" and the advisory, sub-advisory and administration agreements together are referred to as the "Management Agreement.") The Board also considered that the Adviser serves a variety of other investment advisory clients and has experience overseeing service providers. The Board also compared the nature of the services provided by the Adviser with similar services provided by non-affiliated advisers as prepared by Broadridge Financial Solutions, Inc. ("Broadridge").
The Board reviewed and considered the qualifications of the portfolio managers, the senior administrative managers and other key personnel of the Adviser who provide the advisory and administrative services to the Fund. The Board determined that the Adviser's portfolio managers and key personnel are well qualified by education and/or training and experience to perform the services in an efficient and professional manner. The Board concluded that the nature and extent of the advisory and administrative services provided were necessary and appropriate for the conduct of the business and investment activities of the Fund and supported its decision to approve the Management Agreement.
Performance, Fees and Expenses of the Fund
The Board reviewed the performance, fees and expenses of the Fund compared to its peers, as prepared by Broadridge, and to appropriate benchmarks where applicable. The Board discussed with the Adviser the performance goals and the actual results achieved in managing the Fund. When considering a fund's performance, the Board and the Adviser place emphasis on trends and longer-term returns (focusing on one-year, three-year and five-year performance, as of December 31, 2019, or since inception, as applicable). When a fund underperforms its benchmark and/or its peer group average, the Board and the Adviser discuss the causes of such underperformance and, where necessary, they discuss specific changes to investment strategy or investment personnel. The Board noted that the Fund's performance was better than its peer group average for the one-, three- and five-year periods. The Board discussed with the Adviser the level of the advisory and administration fees (together, the "management fee") for this Fund relative to comparable funds and/or other accounts advised by the Adviser and/or compared to its peers as prepared by Broadridge. In addition to the management fee, the Board also reviewed the Fund's total expense ratio. The Board noted that the Fund's management fee and total expense ratio were lower than its peer group averages. After discussion, the Board concluded that the Fund's performance, management fee and total expense ratio were competitive with its peer group averages.
Economies of Scale
The Board considered the size and growth prospects of the Fund and how that relates to the Fund's total expense ratio and particularly the Fund's management fee rate, which does not include breakpoints. In conjunction with its review of the Adviser's profitability, the Board discussed with the Adviser how a change in assets can affect the efficiency or effectiveness of managing the Fund and whether the management fee level is appropriate relative to current and projected asset levels and/or whether the management fee structure reflects economies of scale as asset levels change. The Board has determined that its review of the actual and/or potential economies of scale of the Fund supports its decision to approve the Management Agreement.
Profitability of the Adviser and Affiliates
The Board considered information concerning the costs incurred and profits realized by the Adviser and its affiliates during the last year from their relationship with the Fund and during the last two years from their relationship with the Morgan Stanley Fund Complex and reviewed with the Adviser the cost allocation methodology used to determine the profitability of the Adviser and affiliates. The Board has determined that its review of the analysis of the Adviser's expenses and profitability supports its decision to approve the Management Agreement.
75
Morgan Stanley Institutional Fund Trust
Annual Report — September 30, 2020
Investment Advisory Agreement Approval (unaudited) (cont'd)
Other Benefits of the Relationship
The Board considered other direct and indirect benefits to the Adviser and/or its affiliates derived from their relationship with the Fund and other funds advised by the Adviser. These benefits may include, among other things, fees for trading, distribution and/or shareholder servicing and for transaction processing and reporting platforms used by securities lending agents, and research received by the Adviser generated from commission dollars spent on funds' portfolio trading. The Board reviewed with the Adviser these arrangements and the reasonableness of the Adviser's costs relative to the services performed. The Board has determined that its review of the other benefits received by the Adviser or its affiliates supports its decision to approve the Management Agreement.
Resources of the Adviser and Historical Relationship Between the Fund and the Adviser
The Board considered whether the Adviser is financially sound and has the resources necessary to perform its obligations under the Management Agreement. The Board also reviewed and considered the historical relationship between the Fund and the Adviser, including the organizational structure of the Adviser, the policies and procedures formulated and adopted by the Adviser for managing the Fund's operations and the Board's confidence in the competence and integrity of the senior managers and key personnel of the Adviser. The Board concluded that the Adviser has the financial resources necessary to fulfill its obligations under the Management Agreement and that it is beneficial for the Fund to continue its relationship with the Adviser.
Other Factors and Current Trends
The Board considered the controls and procedures adopted and implemented by the Adviser and monitored by the Fund's Chief Compliance Officer and concluded that the conduct of business by the Adviser indicates a good faith effort on its part to adhere to high ethical standards in the conduct of the Fund's business.
As part of the Board's review, the Board received information from management on the impact of COVID-19 on the firm generally and the Adviser and the Fund in particular including, among other information, the pandemic's current and expected impact on the Fund's performance and operations.
General Conclusion
After considering and weighing all of the above factors, with various written materials and verbal information presented by the Adviser, the Board concluded that it would be in the best interest of the Fund and its shareholders to approve renewal of the Management Agreement for another year. In reaching this conclusion the Board did not give particular weight to any single piece of information or factor referenced above. The Board considered these factors and information over the course of the year and in numerous meetings, some of which were in executive session with only the independent Board members and their counsel present. It is possible that individual Board members may have weighed these factors, and the information presented, differently in reaching their individual decisions to approve the Management Agreement.
76
Morgan Stanley Institutional Fund Trust
Annual Report — September 30, 2020
Liquidity Risk Management Program (unaudited)
In compliance with Rule 22e-4 under the Investment Company Act of 1940, as amended (the "Liquidity Rule"), the Fund has adopted and implemented a liquidity risk management program (the "Program"), which is reasonably designed to assess and manage the risk that the Fund could not meet requests to redeem shares issued by the Fund without significant dilution of remaining investors' interests in the Fund (i.e., liquidity risk). The Fund's Board of Trustees (the "Board") previously approved the designation of the Liquidity Risk Subcommittee (the "LRS") as Program administrator. The LRS is comprised of representatives from various divisions within Morgan Stanley Investment Management.
At a meeting held on April 22-23, 2020, the Board reviewed a written report prepared by the LRS that addressed the Program's operation and assessed its adequacy, and effectiveness of implementation for the period from December 1, 2018, through December 31, 2019, as required under the Liquidity Rule. The report concluded that the Program operated effectively and was adequately and effectively implemented in all material aspects, and that the relevant controls and safeguards were appropriately designed to enable the LRS to administer the Program in compliance with the Liquidity Rule.
In accordance with the Program, the LRS assessed each Fund's liquidity risk no less frequently than annually taking into consideration certain factors, as applicable, such as (i) investment strategy and liquidity of portfolio investments, (ii) short-term and long-term cash flow projections and (iii) holdings of cash and cash equivalents and borrowing arrangements and other funding sources. Certain factors are considered under both normal and reasonably foreseeable stressed conditions.
Each Fund portfolio investment is classified into one of four liquidity categories, which classification is assessed at least monthly by the LRS. The classification is based on a determination of the number of days it is reasonably expected to take to convert the investment into cash, or sell or dispose of the investment, in current market conditions without significantly changing the market value of the investment. Liquidity classification determinations take into account various market, trading and investment-specific considerations, as well as market depth, and in some cases utilize third-party vendor data.
The Liquidity Rule limits a fund's investments in illiquid investments to 15% of its net assets and requires funds that do not primarily hold assets that are highly liquid investments to determine and maintain a minimum percentage of the fund's net assets to be invested in highly liquid investments (highly liquid investment minimum or "HLIM"). The LRS believes that the Program includes provisions reasonably designed to review, monitor and comply with the 15% limit on illiquid investments and for determining, periodically reviewing and complying with the HLIM requirement, as applicable.
There can be no assurance that the Program will achieve its objectives under all circumstances in the future. Please refer to the Fund's prospectus for more information regarding the Fund's exposure to liquidity risk and other risks to which it may be subject.
77
Morgan Stanley Institutional Fund Trust
Annual Report — September 30, 2020
Federal Tax Notice (unaudited)
For federal income tax purposes, the following information is furnished with respect to the distributions paid by the Fund during its taxable year ended September 30, 2020. For corporate shareholders, 26.86% of the dividends qualified for the dividends received deduction.
The Fund designated and paid approximately $1,055,000 as a long-term capital gain distribution. In addition, the Fund designated approximately $316,000 of its distributions paid as business interest income and approximately $9,000 of its distributions paid as qualified business income.
For federal income tax purposes, the following information is furnished with respect to the Fund's earnings for its taxable year ended September 30, 2020. When distributed, certain earnings may be subject to a maximum tax rate of 15% as provided for by the Jobs and Growth Tax Relief Reconciliation Act of 2003. The Fund designated up to a maximum of approximately $4,632,000 as taxable at this lower rate.
In January, the Fund provides tax information to shareholders for the preceding calendar year.
78
Morgan Stanley Institutional Fund Trust
Annual Report — September 30, 2020
Privacy Notice (unaudited) April 2019
FACTS | | WHAT DOES MSIM DO WITH YOUR PERSONAL INFORMATION? | |
Why? | | Financial companies choose how they share your personal information. Federal law gives consumers the right to limit some but not all sharing. Federal law also requires us to tell you how we collect, share, and protect your personal information. Please read this notice carefully to understand what we do. | |
What? | | The types of personal information we collect and share depend on the product or service you have with us. This information can include:
n Social Security number and income
n investment experience and risk tolerance
n checking account number and wire transfer instructions | |
How? | | All financial companies need to share customers' personal information to run their everyday business. In the section below, we list the reasons financial companies can share their customers' personal information; the reasons MSIM chooses to share; and whether you can limit this sharing. | |
Reasons we can share your personal information | | Does MSIM share? | | Can you limit this sharing? | |
For our everyday business purposes —
such as to process your transactions, maintain your account(s), respond to court orders and legal investigations, or report to credit bureaus | | Yes | | No | |
For our marketing purposes —
to offer our products and services to you | | Yes | | No | |
For joint marketing with other financial companies | | No | | We don't share | |
For our affiliates' everyday business purposes —
information about your transactions and experiences | | Yes | | No | |
For our affiliates' everyday business purposes —
information about your creditworthiness | | No | | We don't share | |
For our affiliates to market to you | | No | | We don't share | |
For non-affiliates to market to you | | No | | We don't share | |
Questions? Call toll-free (844) 312-6327 or email: imprivacyinquiries@morganstanley.com
79
Morgan Stanley Institutional Fund Trust
Annual Report — September 30, 2020
Privacy Notice (unaudited) (cont'd) April 2019
Who we are
Who is providing this notice? | | Morgan Stanley Investment Management, Inc. and its affiliated registered investment advisers, registered broker-dealers, and registered and unregistered funds ("MSIM") | |
What we do
How does MSIM protect my personal information? | | To protect your personal information from unauthorized access and use, we use security measures that comply with federal law. These measures include computer safeguards and secured files and buildings. We have policies governing the proper handling of customer information by personnel and requiring third parties that provide support to adhere to appropriate security standards with respect to such information. | |
How does MSIM collect my personal information? | | We collect your personal information, for example, when you
n open an account or make deposits or withdrawals from your account
n buy securities from us or make a wire transfer
n give us your contact information
We also collect your personal information from others, such as credit bureaus, affiliates, or other companies. | |
Why can't I limit all sharing? | | Federal law gives you the right to limit only
n sharing for affiliates' everyday business purposes — information about your creditworthiness
n affiliates from using your information to market to you
n sharing for non-affiliates to market to you
State laws and individual companies may give you additional rights to limit sharing. See below for more on your rights under state law. | |
Definitions
Affiliates | | Companies related by common ownership or control. They can be financial and non-financial companies.
n Our affiliates include companies with a Morgan Stanley name and financial companies such as Morgan Stanley Smith Barney LLC and Morgan Stanley & Co. | |
Non-affiliates | | Companies not related by common ownership or control. They can be financial and non-financial companies.
n MSIM does not share with non-affiliates so they can market to you. | |
Joint marketing | | A formal agreement between non-affiliated financial companies that together market financial products or services to you.
n MSIM doesn't jointly market | |
Other Important Information
Vermont: Except as permitted by law, we will not share personal information we collect about Vermont residents with Non-affiliates unless you provide us with your written consent to share such information.
California: Except as permitted by law, we will not share personal information we collect about California residents with Non-affiliates and we will limit sharing such personal information with our Affiliates to comply with California privacy laws that apply to us.
80
Morgan Stanley Institutional Fund Trust
Annual Report — September 30, 2020
Trustee and Officer Information (unaudited)
Independent Trustees:
Name, Address and Birth Year
of Independent Trustee | | Position(s)
Held with
Registrant | | Length of Time
Served* | | Principal Occupation(s) During Past 5 Years
and Other Relevant Professional Experience | | Number of
Funds in
Fund Complex
Overseen by
Independent
Trustee** | | Other Directorships
Held by Independent
Trustee*** | |
Frank L. Bowman
c/o Perkins Coie LLP
Counsel to the Independent Trustees
1155 Avenue of the Americas, 22nd Floor
New York, NY 10036
Birth Year 1944 | | Trustee | | Since
August
2006 | | President, Strategic Decisions, LLC (consulting) (since February 2009); Director or Trustee of various Morgan Stanley Funds (since August 2006); Chairperson of the Compliance and Insurance Committee (since October 2015); formerly, Chairperson of the Insurance Sub-Committee of the Compliance and Insurance Committee (2007-2015); served as President and Chief Executive Officer of the Nuclear Energy Institute (policy organization) (February 2005-November 2008); retired as Admiral, U.S. Navy after serving over 38 years on active duty including 8 years as Director of the Naval Nuclear Propulsion Program in the Department of the Navy and the U.S. Department of Energy (1996-2004); served as Chief of Naval Personnel (July 1994-September 1996) and on the Joint Staff as Director of Political Military Affairs (June 1992-July 1994); knighted as Honorary Knight Commander of the Most Excellent Order of the British Empire; awarded the Officier de l'Orde National du Mérite by the French Government; elected to the National Academy of Engineering (2009). | | | 86 | | | Director of Naval and Nuclear Technologies LLP; Director Emeritus of the Armed Services YMCA; Member of the National Security Advisory Council of the Center for U.S. Global Engagement and a member of the CNA Military Advisory Board; Trustee of Fairhaven United Methodist Church; Member of the Board of Advisors of the Dolphin Scholarship Foundation; Director of other various non-profit organizations; Formerly, Director of BP p.l.c. (November 2010-May 2019). | |
Kathleen A. Dennis
c/o Perkins Coie LLP
Counsel to the Independent Trustees
1155 Avenue of the Americas, 22nd Floor
New York, NY 10036
Birth Year 1953 | | Trustee | | Since
August
2006 | | President, Cedarwood Associates (mutual fund and investment management consulting) (since July 2006); Chairperson of the Liquidity and Alternatives Sub-Committee of the Investment Committee (since October 2006) and Director or Trustee of various Morgan Stanley Funds (since August 2006); formerly, Senior Managing Director of Victory Capital Management (1993-2006). | | | 86 | | | Director of various
non-profit organizations. | |
Nancy C. Everett
c/o Perkins Coie LLP
Counsel to the Independent Trustees
1155 Avenue of the Americas, 22nd Floor
New York, NY 10036
Birth Year 1955 | | Trustee | | Since
January
2015 | | Chief Executive Officer, Virginia Commonwealth University Investment Company (since November 2015); Owner, OBIR, LLC (institutional investment management consulting) (since June 2014); formerly, Managing Director, BlackRock, Inc. (February 2011-December 2013); and Chief Executive Officer, General Motors Asset Management (a/k/a Promark Global Advisors, Inc.) (June 2005-May 2010). | | | 87 | | | Formerly, Member of Virginia Commonwealth University School of Business Foundation (2005-2016); Member of Virginia Commonwealth University Board of Visitors (2013-2015); Member of Committee on Directors for Emerging Markets Growth Fund, Inc. (2007-2010); Chairperson of Performance Equity Management, LLC (2006-2010); and Chairperson, GMAM Absolute Return Strategies Fund, LLC (2006-2010). | |
81
Morgan Stanley Institutional Fund Trust
Annual Report — September 30, 2020
Trustee and Officer Information (unaudited) (cont'd)
Independent Trustees: (cont'd)
Name, Address and Birth Year
of Independent Trustee | | Position(s)
Held with
Registrant | | Length of Time
Served* | | Principal Occupation(s) During Past 5 Years
and Other Relevant Professional Experience | | Number of
Funds in
Fund Complex
Overseen by
Independent
Trustee** | | Other Directorships
Held by Independent
Trustee*** | |
Jakki L. Haussler
c/o Perkins Coie LLP
Counsel to the Independent Trustees
1155 Avenue of the Americas, 22nd Floor
New York, NY 10036
Birth Year 1957 | | Trustee | | Since
January
2015 | | Chairman, Opus Capital Group (since January 1996); formerly, Chief Executive Officer, Opus Capital Group (1996-2019); Director, Capvest Venture Fund, LP (May 2000-December 2011); Partner, Adena Ventures, LP (July 1999-December 2010); Director, The Victory Funds (February 2005-July 2008). | | | 87 | | | Director of Service Corporation International and Member, Audit Committee and Investment Committee; Director of Cincinnati Bell Inc. and Member, Audit Committee and Governance and Nominating Committee; Director of Northern Kentucky University Foundation and Member, Investment Committee; Member of Chase College of Law Transactional Law Practice Center Board of Advisors; Director of Chase College of Law Board of Visitors; formerly, Member, University of Cincinnati Foundation Investment Committee; Member, Miami University Board of Visitors (2008-2011); Trustee of Victory Funds (2005-2008) and Chairman, Investment Committee (2007-2008); Member, Service Provider Committee (2005-2008) and Director of Best Transport (2006-2019). | |
Dr. Manuel H. Johnson
c/o Johnson Smick
International, Inc.
220 I Street, NE — Suite 200 Washington, D.C. 20002
Birth Year 1949 | | Trustee | | Since
July
1991 | | Senior Partner, Johnson Smick International, Inc. (consulting firm); Chairperson of the Investment Committee (since October 2006) and Director or Trustee of various Morgan Stanley Funds (since July 1991); Co-Chairman and a founder of the Group of Seven Council (G7C) (international economic commission); formerly, Chairperson of the Audit Committee (July 1991-September 2006), Vice Chairman of the Board of Governors of the Federal Reserve System and Assistant Secretary of the U.S. Treasury. | | | 86 | | | Director of NVR, Inc. (home construction). | |
Joseph J. Kearns
c/o Perkins Coie LLP
Counsel to the Independent Trustees
1155 Avenue of the Americas, 22nd Floor
New York, NY 10036
Birth Year 1942 | | Trustee | | Since
August
1994 | | Senior Adviser, Kearns & Associates LLC (investment consulting); Chairperson of the Audit Committee (since October 2006) and Director or Trustee of various Morgan Stanley Funds (since August 1994); Director, Rubicorn Investments (since February 2019); formerly, Deputy Chairperson of the Audit Committee (July 2003-September 2006) and Chairperson of the Audit Committee of various Morgan Stanley Funds (since August 1994); CFO of the J. Paul Getty Trust (1982-1999). | | | 87 | | | Prior to August 10, 2016, Director of Electro Rent Corporation (equipment leasing); Prior to December 31, 2013, Director of The Ford Family Foundation. | |
82
Morgan Stanley Institutional Fund Trust
Annual Report — September 30, 2020
Trustee and Officer Information (unaudited) (cont'd)
Independent Trustees: (cont'd)
Name, Address and Birth Year
of Independent Trustee | | Position(s)
Held with
Registrant | | Length of Time
Served* | | Principal Occupation(s) During Past 5 Years
and Other Relevant Professional Experience | | Number of
Funds in
Fund Complex
Overseen by
Independent
Trustee** | | Other Directorships
Held by Independent
Trustee*** | |
Michael F. Klein
c/o Perkins Coie LLP
Counsel to the Independent Trustees
1155 Avenue of the Americas, 22nd Floor
New York, NY 10036
Birth Year 1958 | | Trustee | | Since
August
2006 | | Managing Director, Aetos Alternatives Management, LP (since March 2000); Co-President, Aetos Alternatives Management, LP (since January 2004) and Co-Chief Executive Officer of Aetos Alternatives Management, LP (since August 2013); Chairperson of the Fixed Income Sub-Committee of the Investment Committee (since October 2006) and Director or Trustee of various Morgan Stanley Funds (since August 2006); formerly, Managing Director, Morgan Stanley & Co. Inc. and Morgan Stanley Dean Witter Investment Management and President, various Morgan Stanley Funds (June 1998-March 2000); Principal, Morgan Stanley & Co. Inc. and Morgan Stanley Dean Witter Investment Management (August 1997-December 1999). | | | 86 | | | Director of certain investment funds managed or sponsored by Aetos Alternatives Management, LP; Director of Sanitized AG and Sanitized Marketing AG (specialty chemicals). | |
Patricia Maleski
c/o Perkins Coie LLP
Counsel to the Independent Trustees
1155 Avenue of the Americas, 22nd Floor
New York, NY 10036
Birth Year 1960 | | Trustee | | Since
January
2017 | | Managing Director, JPMorgan Asset Management (2004-2016); Oversight and Control Head of Fiduciary and Conflicts of Interest Program (2015-2016); Chief Control Officer-Global Asset Management (2013-2015); President, JPMorgan Funds (2010-2013); Chief Administrative Officer (2004-2013); various other positions including Treasurer and Board Liaison (since 2001). | | | 87 | | | None. | |
W. Allen Reed
c/o Perkins Coie LLP
Counsel to the Independent Trustees
1155 Avenue of the Americas, 22nd Floor
New York, NY 10036
Birth Year 1947 | | Chair of the Board and Trustee | | Chair of the Boards since August 2020 and Trustee since August 2006 | | Chair of the Boards of various Morgan Stanley Funds (since August 2020); Chairperson of the Governance Committee; Chairperson of the Equity Sub-Committee of the Investment Committee (since October 2006) and Director or Trustee of various Morgan Stanley Funds (since August 2006); formerly, Vice Chair of the Boards of various Morgan Stanley Funds (January 2020-August 2020); President and Chief Executive Officer of General Motors Asset Management; Chairman and Chief Executive Officer of the GM Trust Bank and Corporate Vice President of General Motors Corporation (August 1994-December 2005). | | | 86 | | | Formerly, Director of Legg Mason, Inc. (2006-2019); and Director of the Auburn University Foundation (2010-2015). | |
* This is the earliest date the Trustee began serving the Morgan Stanley Funds. Each Trustee serves an indefinite term, until his or her successor is elected.
** The Fund Complex includes (as of December 31, 2019) all open-end and closed-end funds (including all of their portfolios) advised by Morgan Stanley Investment Management Inc. (the "Adviser") and any funds that have an adviser that is an affiliated person of the Adviser (including, but not limited to, Morgan Stanley AIP GP LP).
*** This includes any directorships at public companies and registered investment companies held by the Trustee at any time during the past five years.
83
Morgan Stanley Institutional Fund Trust
Annual Report — September 30, 2020
Trustee and Officer Information (unaudited) (cont'd)
Executive Officers:
Name, Address and
Birth Year of Executive Officer | | Position(s) Held
with
Registrant | | Length of
Time Served* | | Principal Occupation(s) During Past 5 Years | |
John H. Gernon
522 Fifth Avenue
New York, NY 10036
Birth Year 1963 | | President and Principal Executive Officer | | Since September 2013 | | President and Principal Executive Officer of the Equity and Fixed Income Funds and the Morgan Stanley AIP Funds (since September 2013) and the Liquidity Funds and various money market funds (since May 2014) in the Fund Complex; Managing Director of the Adviser; Head of Public Markets Product Development (since 2006). | |
Timothy J. Knierim
522 Fifth Avenue
New York, NY 10036
Birth Year 1959 | | Chief Compliance Officer | | Since December 2016 | | Managing Director of the Adviser and various entities affiliated with the Adviser; Chief Compliance Officer of various Morgan Stanley Funds and the Adviser (since December 2016) and Chief Compliance Officer of Morgan Stanley AIP GP LP (since 2014). Formerly, Managing Director and Deputy Chief Compliance Officer of the Adviser (2014-2016); and formerly, Chief Compliance Officer of Prudential Investment Management, Inc. (2007-2014). | |
Francis J. Smith
522 Fifth Avenue
New York, NY 10036
Birth Year 1965 | | Treasurer and Principal Financial Officer | | Treasurer since July 2003 and Principal Financial Officer since September 2002 | | Managing Director of the Adviser and various entities affiliated with the Adviser; Treasurer (since July 2003) and Principal Financial Officer of various Morgan Stanley Funds (since September 2002). | |
Mary E. Mullin
522 Fifth Avenue
New York, NY 10036
Birth Year 1967 | | Secretary | | Since
June
1999 | | Managing Director of the Adviser; Secretary of various Morgan Stanley Funds (since June 1999). | |
Michael J. Key
522 Fifth Avenue
New York, NY 10036
Birth Year 1979 | | Vice President | | Since
June
2017 | | Vice President of the Equity and Fixed Income Funds, Liquidity Funds, various money market funds and the Morgan Stanley AIP Funds in the Fund Complex (since June 2017); Executive Director of the Adviser; Head of Product Development for Equity and Fixed Income Funds (since August 2013). | |
* This is the earliest date the officer began serving the Morgan Stanley Funds. Each officer serves a one-year term, until his or her successor is elected and qualifies.
84
Morgan Stanley Institutional Fund Trust
Annual Report — September 30, 2020
Adviser and Administrator
Morgan Stanley Investment Management Inc.
522 Fifth Avenue
New York, New York 10036
Sub-Adviser
Morgan Stanley Investment Management Limited
25 Cabot Square, Canary Wharf
London, E14 4QA, England
Distributor
Morgan Stanley Distribution, Inc.
522 Fifth Avenue
New York, New York 10036
Dividend Disbursing and Transfer Agent
DST Asset Manager Solutions, Inc.
2000 Crown Colony Drive
Quincy, Massachusetts 02169
Custodian
State Street Bank and Trust Company
One Lincoln Street
Boston, Massachusetts 02111
Legal Counsel
Dechert LLP
1095 Avenue of the Americas
New York, New York 10036
Counsel to the Independent Trustees
Perkins Coie LLP
1155 Avenue of the Americas,
22nd Floor
New York, New York 10036
Independent Registered Public Accounting Firm
Ernst & Young LLP
200 Clarendon Street
Boston, Massachusetts 02116
Reporting to Shareholders
Each Morgan Stanley fund provides a complete schedule of portfolio holdings in its Semi-Annual and the Annual Reports within 60 days of the end of the fund's second and fourth fiscal quarters. The Semi-Annual and Annual Reports are filed electronically with the Securities and Exchange Commission ("SEC") on Form N-CSRS and Form N-CSR, respectively. Morgan Stanley also delivers the Semi-Annual and Annual Reports to fund shareholders and makes these reports available on its public website, www.morganstanley.com/im/shareholderreports. Each Morgan Stanley non-money market fund also files a complete schedule of portfolio holdings with the SEC for the fund's first and third fiscal quarters as an attachment to Form N-PORT. Morgan Stanley does not deliver the reports for the first and third fiscal quarters to shareholders, nor are the reports posted to the Morgan Stanley public website. However, the holdings for each money market fund are posted to the Morgan Stanley public website. You may obtain the Form N-PORT filings (as well as the Form N-CSR and N-CSRS filings) by accessing the SEC's website, www.sec.gov. You can also request copies of these materials, upon payment of a duplicating fee, by electronic request at the SEC's email address (publicinfo@sec.gov).
Proxy Voting Policies and Procedures and Proxy Voting Record
You may obtain a copy of the Trust's Proxy Voting Policy and Procedures and information regarding how the Trust voted proxies relating to portfolio securities during the most recent twelve-month period ended June 30, without charge, upon request, by calling toll free 1 (800) 548-7786 or by visiting our website at www.morganstanley.com/im/shareholderreports. This information is also available on the SEC's website at www.sec.gov.
This report is authorized for distribution only when preceded or accompanied by a prospectus or summary prospectus of the applicable fund of Morgan Stanley Institutional Fund Trust., which describes in detail the fund's investment policies, risks, fees and expenses. Please read the prospectus carefully before you invest or send money. For additional information, including information regarding the investments comprising the Fund, please visit our website at www.morganstanley.com/im/shareholderreports or call toll free 1 (800) 548-7786.
85
Printed in U.S.A.
This Report has been prepared for shareholders and may be distributed to others only if preceded or accompanied by a current prospectus.
Morgan Stanley Investment Management Inc.
522 Fifth Avenue
New York, New York 10036
© 2020 Morgan Stanley. Morgan Stanley Distribution, Inc.

IFTGSANN
3300498 EXP 11.30.21

Morgan Stanley Institutional Fund Trust
High Yield Portfolio
Annual Report
September 30, 2020
Beginning on January 1, 2021, as permitted by regulations adopted by the Securities and Exchange Commission ("SEC"), paper copies of the Fund's Annual and Semi-Annual Reports to Shareholders ("Shareholder Reports") will no longer be sent by mail, unless you specifically request paper copies of the Shareholder Reports from the Fund or from your financial intermediary, such as a broker-dealer or a bank. Instead, the Shareholder Reports will be made available on the Fund's website, https://www.morganstanley.com/im/shareholderreports and you will be notified by mail each time a Shareholder Report is posted and provided with a website link to access the Shareholder Report. If you already elected to receive Shareholder Reports electronically, you will not be affected by this change and you need not take any action. You may elect to receive Shareholder Reports and other communications from the Fund electronically anytime by contacting your financial intermediary or, if you are a direct investor, please follow the instructions on the envelope.
Beginning on January 1, 2019, you may elect to receive all future Shareholder Reports in paper free of charge. If you invest through a financial intermediary, you can contact your financial intermediary to request that you continue to receive paper copies of your Shareholder Reports. If you invest directly with the Fund, please follow the instructions on the envelope to let the Fund know you wish to continue receiving paper copies of your Shareholder Reports. Your election to receive Shareholder Reports in paper will apply to all funds held in your account if you invest through your financial intermediary or all funds held with the fund complex if you invest directly with a fund.

Morgan Stanley Institutional Fund Trust
Annual Report — September 30, 2020
Shareholders' Letter | | | 2 | | |
Expense Example | | | 3 | | |
Investment Overview | | | 4 | | |
Portfolio of Investments | | | 7 | | |
Statement of Assets and Liabilities | | | 15 | | |
Statement of Operations | | | 17 | | |
Statements of Changes in Net Assets | | | 18 | | |
Financial Highlights | | | 20 | | |
Notes to Financial Statements | | | 26 | | |
Report of Independent Registered Public Accounting Firm | | | 34 | | |
Investment Advisory Agreement Approval | | | 35 | | |
Liquidity Risk Management Program | | | 37 | | |
Privacy Notice | | | 38 | | |
Trustee and Officer Information | | | 40 | | |
This report is authorized for distribution only when preceded or accompanied by a prospectus or summary prospectus of the applicable Fund of the Morgan Stanley Institutional Fund Trust. To receive a prospectus and/or statement of additional information ("SAI"), which contains more complete information such as investment objectives, charges, expenses, policies for voting proxies, risk considerations and describes in detail each of the Fund's investment policies to the prospective investor, please call toll free 1 (800) 548-7786. Please read the prospectuses carefully before you invest or send money.
Additionally, you can access information about the Fund, including performance, characteristics and investment team commentary, through Morgan Stanley Investment Management's website: www.morganstanley.com/im/shareholderreports.
Market forecasts provided in this report may not necessarily come to pass. There is no guarantee that any sectors mentioned will continue to perform as discussed herein or that securities in such sectors will be held by the Fund in the future. There is no assurance that a fund will achieve its investment objective. Funds are subject to market risk, which is the possibility that market values of securities owned by the Fund will decline and, therefore, the value of the Fund's shares may be less than what you paid for them. Accordingly, you can lose money investing in this Fund. Please see the prospectus for more complete information on investment risks.
1
Morgan Stanley Institutional Fund Trust
Annual Report — September 30, 2020
Shareholders' Letter (unaudited)
Dear Shareholders,
We are pleased to provide this Annual Report, in which you will learn how your investment in High Yield Portfolio (the "Fund") performed during the latest twelve-month period.
Morgan Stanley Investment Management is a client-centric, investor-led organization. Our global presence, intellectual capital, and breadth of products and services enable us to partner with investors to meet the evolving challenges of today's financial markets. We aim to deliver superior investment service and to empower our clients to make the informed decisions that help them reach their investment goals.
As always, we thank you for selecting Morgan Stanley Investment Management, and look forward to working with you in the months and years ahead.
Sincerely,

John H. Gernon
President and Principal Executive Officer
October 2020
2
Morgan Stanley Institutional Fund Trust
Annual Report — September 30, 2020
Expense Example (unaudited)
High Yield Portfolio
As a shareholder of the Fund, you may incur two types of costs: (1) transactional costs, including sales charge (loads) on purchase payments; and (2) ongoing costs, which may include advisory fees, administration fees, distribution and shareholder services fees; and other Fund expenses. This example is intended to help you understand your ongoing costs (in dollars) of investing in the Fund and to compare these costs with the ongoing costs of investing in other mutual funds.
This example is based on an investment of $1,000 invested at the beginning of the six-month period ended September 30, 2020 and held for the entire six-month period.
Actual Expenses
The table below provides information about actual account values and actual expenses. You may use the information in this table, together with the amount you invested, to estimate the expenses that you paid over the period. Simply divide your account value by $1,000 (for example, an $8,600 account value divided by $1,000 = 8.6), then multiply the result by the number in the table under the heading entitled "Actual Expenses Paid During Period" to estimate the expenses you paid on your account during this period.
Hypothetical Example for Comparison Purposes
The table below provides information about hypothetical account values and hypothetical expenses based on the Fund's actual expense ratio and an assumed rate of return of 5% per year before expenses, which is not the Fund's actual return. The hypothetical account values and expenses may not be used to estimate the actual ending account balance or expenses you paid for the period. You may use this information to compare the ongoing costs of investing in the Fund and other funds. To do so, compare this 5% hypothetical example with the 5% hypothetical examples that appear in the shareholder reports of the other funds.
Please note that the expenses shown in the table are meant to highlight your ongoing costs only and do not reflect any transactional costs, such as sales charges (loads, if applicable). Therefore, the information for each class in the table is useful in comparing ongoing costs only, and will not help you determine the relative total costs of owning different funds. In addition, if these transactional costs were included, your costs would have been higher.
| | | Beginning
Account
Value
4/1/20 | | Actual Ending
Account
Value
9/30/20 | | Hypothetical
Ending Account
Value | | Actual
Expenses
Paid
During
Period* | | Hypothetical
Expenses Paid
During Period* | | Net
Expense
Ratio
During
Period** | |
High Yield Portfolio Class I | | $ | 1,000.00 | | | $ | 1,159.80 | | | $ | 1,021.75 | | | $ | 3.51 | | | $ | 3.29 | | | | 0.65 | % | |
High Yield Portfolio Class A | | | 1,000.00 | | | | 1,156.40 | | | | 1,020.00 | | | | 5.39 | | | | 5.05 | | | | 1.00 | | |
High Yield Portfolio Class L | | | 1,000.00 | | | | 1,155.20 | | | | 1,018.75 | | | | 6.74 | | | | 6.31 | | | | 1.25 | | |
High Yield Portfolio Class C | | | 1,000.00 | | | | 1,153.00 | | | | 1,016.30 | | | | 9.37 | | | | 8.77 | | | | 1.74 | | |
High Yield Portfolio Class IS | | | 1,000.00 | | | | 1,160.00 | | | | 1,021.90 | | | | 3.35 | | | | 3.13 | | | | 0.62 | | |
High Yield Portfolio Class IR | | | 1,000.00 | | | | 1,160.00 | | | | 1,021.90 | | | | 3.35 | | | | 3.13 | | | | 0.62 | | |
* Expenses are calculated using each Fund Class' annualized net expense ratio (as disclosed), multiplied by the average account value over the period and multiplied by 183/366 (to reflect the most recent one-half year period).
** Annualized.
3
Morgan Stanley Institutional Fund Trust
Annual Report — September 30, 2020
Investment Overview (unaudited)
High Yield Portfolio
The Fund seeks total return.
Performance
For the fiscal year ended September 30, 2020, the Fund's Class I shares had a total return based on net asset value and reinvestment of distributions per share of 0.15%, net of fees. The Fund's Class I shares underperformed against the Fund's benchmark, the Bloomberg Barclays U.S. Corporate High Yield Index (the "Index"), which returned 3.25%.
Factors Affecting Performance
• The final quarter of 2019 provided a remarkable ending to a remarkable year. Credit markets enjoyed meaningful tightening in their spreads on the back of reduced U.S.-China trade tensions, improved economic data and the dovish stance from the Federal Reserve (Fed). Over the fourth quarter of 2019, the Index returned 2.61%, bringing 2019 full-year returns to 14.32%.i Yields tightened 46 basis points (bps) over the fourth quarter to end 2019 at 5.19%, while spreads tightened 45 bps to end the year at 357 bps.i
• 2020 began with a risk-off sentiment as escalation between the U.S. and Iran as well as the coronavirus outbreak in China weighed on investors. However, by the beginning of March 2020, this risk-off sentiment quickly became full-blown panic as the COVID-19 epidemic turned into a global pandemic, engulfing the rest of the world and leading to rapidly rising deaths and infections, lockdowns of populations and closing of economies. Extraordinary times were matched by extraordinary price action in the high yield market. At the end of the first quarter of 2020, spreads were 544 bps wider at 880 bps, and yields widened 425 bps to end March at 9.44%.i On March 23, 2020, at the peak of the sell-off, yields and spreads were 11.69% and 1123 bps, respectively.i What occurred in March 2020 was the fastest, most severe sell-off in high yield history. To put it in perspective, the spread widening that occurred over a six-month period in 2008 took 13 days in March 2020.i This March 2020 sell-off was then followed by a historic, top-three rebound that only trailed rallies seen in March 2001 and January 2009.i The Index gained 8.85% between March 23 and March 31, 2020.i
• Unprecedented monetary relief measures, in addition to some better-than-expected economic
data, helped fuel a sharp rally that continued in the second quarter of 2020. The Index returned over 10% in the second quarter, the strongest quarterly returns in over a decade.i Spreads tightened 254 bps to end the second quarter at 626 bps, and yields fell 257 bps to 6.87%.i
• The market continued to recover during the third quarter of 2020, though it ran out of steam in September amid a pickup in virus cases and uncertainty surrounding the prospect of another stimulus package ahead of the U.S. election. However, given the rebound we have seen in asset prices, a pause was to be expected. We view the September swoon as nothing more than constructive consolidation. The Index returned 4.60% in the third quarter of 2020, bringing year-to-date returns to 0.62% as of September 30, 2020.i Spreads tightened 109 bps to end the third quarter at 517 bps, and yields fell 110 bps to 5.77%.i Spreads and yields are now just 181 bps and 58 bps wider on a year-to-date basis as of September 30, 2020, and 583 bps and 592 bps tighter since March 23, 2020.i
• While volatility with regard to policy, politics and the pandemic have increased, we believe fundamentals continue to support an economic recovery, albeit slower than what we enjoyed in the third quarter. Employment has continued to rebound, global trade and manufacturing have remained in strong recovery mode, and consumer spending in particular has remained robust, with retail sales moving above pre-COVID-19 levels in many developed countries.
• While the Fund had been outperforming the Index though February 2020 over nearly all time periods, the month of March proved to be a difficult one for both the markets and the Fund. In March 2020 alone, the Fund returned -15.15% (net of fees), underperforming the benchmark return of -11.46%.
• Our sector positioning was a major factor going into the downturn and subsequent underperformance. The portfolio was positioned to be overweight the consumer cyclicals sectors, as the strong U.S. consumer remained the linchpin of the U.S. economy. However, given the rapid spread of COVID-19, many of these sectors saw an almost
i Source: Bloomberg Barclays.
4
Morgan Stanley Institutional Fund Trust
Annual Report — September 30, 2020
Investment Overview (unaudited) (cont'd)
High Yield Portfolio
immediate cessation of revenues because of various travel restrictions and stay-at-home ordinances issued globally. As a result, overweight positioning to consumer cyclicals detracted over the 12-month period. The Fund's broad underweight to communications and technology also detracted over the period as both of these sectors have been relatively insulated from the effects of COVID-19 and, in some circumstances, actually benefited from increased demand. Work-from-home requirements drove demand in various tech sectors (e.g., increased software demand for virtualization, end-point security, recovery and backups, and cloud access), and with most of the country ordered to stay at home, there has been a strong demand for media/telecom/wireless and wirelines.
• This relative weakness was partially offset by an underweight to airlines as well as overweights to defensive sectors such as packaging and food & beverage, which were additive.
• The Fund's underweight positioning to energy, particularly some "fallen angel" credits (bonds that were downgraded from investment grade to high yield), detracted over the period as well, as these credits rallied on the back of an improving commodity backdrop.
• From a ratings perspective, the Fund's underweight to BB-rated bonds detracted from performance as higher-quality bonds outperformed over the period. An off-benchmark allocation to bank loans also detracted from returns.
Management Strategies
• We have added some higher-quality fallen angels and selectively added larger ETF-eligible names that we believe may benefit (whether directly or indirectly) from the Fed's corporate credit facilities.
• We have been actively participating in the new issue calendar as the primary market continues to present opportunities — new issue premiums have been high and new bonds have generally traded well. We continue to sell credits that we think are at near-term default risk and have sold some BB-rated securities trading at very tight levels. While we remain underweight the energy sector, we continue increase high-grade exposure within this sector, and have added producers in high-quality basins with low leverage that we believe can make it through the current environment.
• We expect to see a meaningful increase in overall defaults in the coming year due to a weaker economy stemming from the outbreak, as well as stress in the energy sector. However, with a significant reduction in default activity over the last two months, and a far quicker recovery from the COVID-19 shock than initially anticipated, we expect default rates to be a more muted 6% to 8%, as opposed to the 10% to 12% initially forecast. We still expect all to be heavily concentrated in energy and coronavirus-impacted sectors, so getting sector positioning right will be critical for performance over the coming months.
• Going into the final quarter of 2020, we continue to expect monetary policy to remain accommodative and risk assets to be well supported across developed markets. On the other hand, our relatively constructive view is tempered by less compelling valuations and some setbacks in the fight against the pandemic, as evidenced in increasing case counts in Europe and the U.S. While we remain cautiously optimistic that developments could lead to even tighter spreads by year-end or in 2021, we expect some near-term volatility as we approach the November U.S. election.

* Minimum Investment
** Commenced operations on February 7, 2012.
In accordance with SEC regulations, the Fund's performance shown assumes that all recurring fees (including management fees) were deducted and all dividends and distributions were reinvested. The performance of Class A, Class L, Class C, Class IS and Class IR shares will vary from the performance of Class I shares based upon their different inception dates and will be negatively impacted by additional fees assessed to those classes (where applicable).
5
Morgan Stanley Institutional Fund Trust
Annual Report — September 30, 2020
Investment Overview (unaudited) (cont'd)
High Yield Portfolio
Performance Compared to the Bloomberg Barclays U.S. Corporate High Yield Index(1) and the Lipper High Current Yield Bond Funds Index(2)
| | | Period Ended September 30, 2020
Total Returns(3) | |
| | | | | Average Annual | |
| | | One
Year | | Five
Years | | Ten
Years | | Since
Inception(8) | |
Fund — Class I Shares
w/o sales charges(4) | | | 0.15 | % | | | 5.54 | % | | | — | | | | 6.81 | % | |
Fund — Class A Shares
w/o sales charges(4) | | | -0.22 | | | | 5.14 | | | | — | | | | 6.44 | | |
Fund — Class A Shares with
maximum 3.25% sales charges(4) | | | -3.48 | | | | 4.45 | | | | — | | | | 6.03 | | |
Fund — Class L Shares
w/o sales charges(4) | | | -0.46 | | | | 4.88 | | | | — | | | | 6.18 | | |
Fund — Class C Shares
w/o sales charges(6) | | | -0.93 | | | | 4.40 | | | | — | | | | 3.32 | | |
Fund — Class C Shares with
maximum 1.00% deferred
sales charges(6) | | | -1.87 | | | | 4.40 | | | | — | | | | 3.32 | | |
Fund — Class IS Shares
w/o sales charges(5) | | | 0.18 | | | | 5.57 | | | | — | | | | 4.04 | | |
Fund — Class IR Shares
w/o sales charges(7) | | | 0.18 | | | | — | | | | — | | | | 2.96 | | |
Bloomberg Barclays U.S. Corporate
High Yield Index | | | 3.25 | | | | 6.79 | | | | — | | | | 6.06 | | |
Lipper High Current Yield Bond
Funds Index | | | 1.19 | | | | 5.54 | | | | — | | | | 5.27 | | |
Performance data quoted represents past performance, which is no guarantee of future results, and current performance may be lower or higher than the figures shown. Performance assumes that all dividends and distributions, if any, were reinvested. For the most recent month-end performance figures, please visit www.morganstanley.com/im/shareholderreports. Investment returns and principal value will fluctuate so that Fund shares, when redeemed, may be worth more or less than their original cost. Total returns do not reflect the deduction of taxes that a shareholder would pay on Fund distributions or the redemption of Fund shares. Performance of share classes will vary due to differences in sales charges and expenses.
(1) The Bloomberg Barclays U.S. Corporate High Yield Index measures the market of USD-denominated, non-investment grade, fixed-rate, taxable corporate bonds. Securities are classified as high yield if the middle rating of Moody's, Fitch, and S&P is Ba1/BB+/BB+ or below. The index excludes emerging market debt. The Index is unmanaged and its returns do not include any sales charges or fees. Such costs would lower performance. It is not possible to invest directly in an index.
(2) The Lipper High Current Yield Bond Funds Index is an equally weighted performance index of the largest qualifying funds (based on net assets) in the Lipper High Current Yield Bond Funds classification. The Index, which is adjusted for capital gains distributions and income dividends, is unmanaged and should not be considered an investment. There are currently 30 funds represented in this Index. As of the date of this report, the Fund was in the Lipper High Current Yield Bond Funds classification.
(3) Total returns for the Fund reflect expenses waived and/or reimbursed, if applicable, by the Adviser. Without such waivers and/or reimbursements, total returns would have been lower.
(4) Commenced operations on February 7, 2012.
(5) Commenced offering on March 28, 2014.
(6) Commenced offering on April 30, 2015.
(7) Commenced offering on June 15, 2018.
(8) For comparative purposes, average annual since inception returns listed for the Indexes refer to the inception date of Class I of the Fund, not the inception of the Indexes.
6
Morgan Stanley Institutional Fund Trust
Annual Report — September 30, 2020
Portfolio of Investments
High Yield Portfolio
| | | Face
Amount
(000) | | Value
(000) | |
Fixed Income Securities (97.8%) | |
Corporate Bonds (94.6%) | |
Basic Materials (5.5%) | |
Alcoa Nederland Holding BV | |
5.50%, 12/15/27 (a) | | $ | 500 | | | $ | 522 | | |
Avient Corp. | |
5.75%, 5/15/25 (a) | | | 500 | | | | 531 | | |
Axalta Coating Systems LLC/Axalta Coating
Systems Dutch Holding B BV | |
4.75%, 6/15/27 (a) | | | 225 | | | | 230 | | |
Chemours Co. (The) | |
6.63%, 5/15/23 | | | 750 | | | | 761 | | |
Eldorado Gold Corp. | |
9.50%, 6/1/24 (a) | | | 789 | | | | 841 | | |
First Quantum Minerals Ltd., | |
6.88%, 10/15/27 (a)(b) | | | 250 | | | | 241 | | |
7.50%, 4/1/25 (a) | | | 500 | | | | 495 | | |
Hudbay Minerals, Inc., | |
6.13%, 4/1/29 (a) | | | 325 | | | | 323 | | |
7.63%, 1/15/25 (a) | | | 250 | | | | 255 | | |
IAMGOLD Corp. | |
5.75%, 10/15/28 (a) | | | 550 | | | | 535 | | |
Innophos Holdings, Inc. | |
9.38%, 2/15/28 (a) | | | 1,000 | | | | 1,067 | | |
International Wire Group, Inc. | |
10.75%, 8/1/21 (a) | | | 650 | | | | 579 | | |
Kaiser Aluminum Corp., | |
4.63%, 3/1/28 (a) | | | 400 | | | | 374 | | |
6.50%, 5/1/25 (a) | | | 300 | | | | 310 | | |
Minerals Technologies, Inc. | |
5.00%, 7/1/28 (a) | | | 500 | | | | 519 | | |
Novelis Corp. | |
4.75%, 1/30/30 (a) | | | 600 | | | | 590 | | |
Olin Corp. | |
9.50%, 6/1/25 (a) | | | 425 | | | | 496 | | |
PQ Corp. | |
5.75%, 12/15/25 (a) | | | 575 | | | | 594 | | |
Schweitzer-Mauduit International, Inc. | |
6.88%, 10/1/26 (a) | | | 850 | | | | 900 | | |
| | | | 10,163 | | |
Communications (12.3%) | |
Altice Financing SA | |
5.00%, 1/15/28 (a) | | | 550 | | | | 535 | | |
Altice France SA, | |
5.13%, 1/15/29 (a) | | | 250 | | | | 249 | | |
7.38%, 5/1/26 (a) | | | 500 | | | | 524 | | |
Avaya, Inc. | |
6.13%, 9/15/28 (a) | | | 500 | | | | 512 | | |
Block Communications, Inc. | |
4.88%, 3/1/28 (a) | | | 800 | | | | 818 | | |
C&W Senior Financing DAC | |
6.88%, 9/15/27 (a) | | | 500 | | | | 521 | | |
| | | Face
Amount
(000) | | Value
(000) | |
CCO Holdings LLC/CCO Holdings Capital Corp. | |
5.00%, 2/1/28 (a) | | $ | 800 | | | $ | 841 | | |
CenturyLink, Inc. | |
4.00%, 2/15/27 (a) | | | 500 | | | | 509 | | |
Clear Channel Worldwide Holdings, Inc., | |
5.13%, 8/15/27 (a) | | | 250 | | | | 240 | | |
9.25%, 2/15/24 | | | 851 | | | | 827 | | |
CSC Holdings LLC | |
5.75%, 1/15/30 (a) | | | 985 | | | | 1,048 | | |
Diamond Sports Group LLC/Diamond Sports
Finance Co. | |
6.63%, 8/15/27 (a) | | | 650 | | | | 339 | | |
DISH DBS Corp. | |
7.75%, 7/1/26 | | | 500 | | | | 550 | | |
Entercom Media Corp. | |
6.50%, 5/1/27 (a) | | | 900 | | | | 786 | | |
EW Scripps Co. (The) | |
5.13%, 5/15/25 (a) | | | 1,000 | | | | 980 | | |
GCI LLC | |
4.75%, 10/15/28 (a)(b) | | | 300 | | | | 304 | | |
Gray Television, Inc. | |
5.88%, 7/15/26 (a) | | | 900 | | | | 935 | | |
iHeartCommunications, Inc. | |
5.25%, 8/15/27 (a) | | | 750 | | | | 732 | | |
Lamar Media Corp. | |
4.00%, 2/15/30 (a) | | | 250 | | | | 250 | | |
LCPR Senior Secured Financing DAC | |
6.75%, 10/15/27 (a) | | | 1,050 | | | | 1,099 | | |
Level 3 Financing, Inc. | |
4.63%, 9/15/27 (a) | | | 500 | | | | 515 | | |
MDC Partners, Inc. | |
6.50%, 5/1/24 (a) | | | 1,039 | | | | 950 | | |
Midcontinent Communications/Midcontinent
Finance Corp. | |
5.38%, 8/15/27 (a) | | | 1,000 | | | | 1,031 | | |
Nexstar Broadcasting, Inc. | |
5.63%, 7/15/27 (a) | | | 550 | | | | 579 | | |
Outfront Media Capital LLC/Outfront
Media Capital Corp. | |
4.63%, 3/15/30 (a) | | | 750 | | | | 721 | | |
Radiate Holdco LLC / Radiate Finance, Inc. | |
6.50%, 9/15/28 (a) | | | 750 | | | | 771 | | |
Sable International Finance Ltd. | |
5.75%, 9/7/27 (a) | | | 500 | | | | 523 | | |
Sirius XM Radio, Inc. | |
5.00%, 8/1/27 (a) | | | 500 | | | | 522 | | |
Switch Ltd. | |
3.75%, 9/15/28 (a) | | | 300 | | | | 304 | | |
TEGNA, Inc., | |
4.63%, 3/15/28 (a) | | | 450 | | | | 441 | | |
5.00%, 9/15/29 (a) | | | 300 | | | | 297 | | |
TripAdvisor, Inc. | |
7.00%, 7/15/25 (a) | | | 175 | | | | 183 | | |
The accompanying notes are an integral part of the financial statements.
7
Morgan Stanley Institutional Fund Trust
Annual Report — September 30, 2020
Portfolio of Investments (cont'd)
High Yield Portfolio
| | | Face
Amount
(000) | | Value
(000) | |
Communications (cont'd) | |
Univision Communications, Inc., | |
6.63%, 6/1/27 (a) | | $ | 425 | | | $ | 416 | | |
9.50%, 5/1/25 (a) | | | 850 | | | | 914 | | |
Virgin Media Finance PLC | |
5.00%, 7/15/30 (a) | | | 900 | | | | 897 | | |
Ziggo Bond Co. BV | |
5.13%, 2/28/30 (a) | | | 525 | | | | 532 | | |
Ziggo BV | |
4.88%, 1/15/30 (a) | | | 350 | | | | 363 | | |
| | | | 22,558 | | |
Consumer, Cyclical (24.2%) | |
AAG FH LP/AAG FH Finco, Inc. | |
9.75%, 7/15/24 (a) | | | 550 | | | | 521 | | |
Adient US LLC | |
9.00%, 4/15/25 (a) | | | 275 | | | | 304 | | |
American Axle & Manufacturing, Inc. | |
6.88%, 7/1/28 | | | 650 | | | | 632 | | |
American Builders & Contractors Supply Co., Inc. | |
5.88%, 5/15/26 (a) | | | 350 | | | | 364 | | |
Aramark Services, Inc., | |
4.75%, 6/1/26 | | | 250 | | | | 253 | | |
6.38%, 5/1/25 (a) | | | 600 | | | | 626 | | |
Asbury Automotive Group, Inc. | |
4.75%, 3/1/30 (a) | | | 250 | | | | 252 | | |
Ashton Woods USA LLC/Ashton Woods Finance Co. | |
6.63%, 1/15/28 (a) | | | 725 | | | | 730 | | |
Aston Martin Capital Holdings Ltd. | |
6.50%, 4/15/22 (a) | | | 650 | | | | 585 | | |
At Home Holding III, Inc. | |
8.75%, 9/1/25 (a) | | | 750 | | | | 785 | | |
Banijay Entertainment SASU | |
5.38%, 3/1/25 (a) | | | 825 | | | | 833 | | |
Beacon Roofing Supply, Inc. | |
4.88%, 11/1/25 (a) | | | 500 | | | | 491 | | |
Beazer Homes USA, Inc. | |
5.88%, 10/15/27 | | | 750 | | | | 761 | | |
Boyd Gaming Corp., | |
4.75%, 12/1/27 | | | 200 | | | | 197 | | |
6.00%, 8/15/26 | | | 750 | | | | 776 | | |
Boyne USA, Inc. | |
7.25%, 5/1/25 (a) | | | 830 | | | | 874 | | |
Burlington Coat Factory Warehouse Corp. | |
6.25%, 4/15/25 (a) | | | 750 | | | | 791 | | |
Carvana Co. | |
5.88%, 10/1/28 (a)(b) | | | 600 | | | | 594 | | |
CCM Merger, Inc. | |
6.00%, 3/15/22 (a) | | | 750 | | | | 742 | | |
CD&R Smokey Buyer, Inc. | |
6.75%, 7/15/25 (a) | | | 750 | | | | 792 | | |
Century Communities, Inc., | |
5.88%, 7/15/25 | | | 500 | | | | 522 | | |
6.75%, 6/1/27 | | | 300 | | | | 317 | | |
| | | Face
Amount
(000) | | Value
(000) | |
Core & Main Holdings LP | |
8.63% CASH, 9.38% PIK, 9/15/24 (a)(c) | | $ | 350 | | | $ | 354 | | |
Dana, Inc. | |
5.38%, 11/15/27 | | | 500 | | | | 513 | | |
Dealer Tire LLC / DT Issuer LLC | |
8.00%, 2/1/28 (a) | | | 525 | | | | 537 | | |
Delta Air Lines, Inc./SkyMiles IP Ltd. | |
4.75%, 10/20/28 (a) | | | 850 | | | | 884 | | |
Downstream Development Authority of the
Quapaw Tribe of Oklahoma | |
10.50%, 2/15/23 (a) | | | 1,268 | | | | 1,171 | | |
Eagle Intermediate Global Holding BV/
Ruyi US Finance LLC | |
7.50%, 5/1/25 (a) | | | 425 | | | | 300 | | |
FelCor Lodging LP | |
6.00%, 6/1/25 | | | 500 | | | | 492 | | |
Ferrellgas LP/Ferrellgas Finance Corp. | |
10.00%, 4/15/25 (a) | | | 550 | | | | 597 | | |
Ford Motor Co., | |
8.50%, 4/21/23 | | | 575 | | | | 628 | | |
9.00%, 4/22/25 | | | 750 | | | | 861 | | |
Ford Motor Credit Co. LLC | |
4.13%, 8/17/27 | | | 250 | | | | 244 | | |
Forestar Group, Inc. | |
5.00%, 3/1/28 (a) | | | 500 | | | | 506 | | |
G-III Apparel Group Ltd. | |
7.88%, 8/15/25 (a) | | | 400 | | | | 404 | | |
Golden Nugget, Inc. | |
8.75%, 10/1/25 (a) | | | 600 | | | | 474 | | |
Hanesbrands, Inc. | |
4.88%, 5/15/26 (a) | | | 250 | | | | 267 | | |
Installed Building Products, Inc. | |
5.75%, 2/1/28 (a) | | | 250 | | | | 264 | | |
International Game Technology PLC | |
5.25%, 1/15/29 (a) | | | 375 | | | | 380 | | |
IRB Holding Corp. | |
7.00%, 6/15/25 (a) | | | 500 | | | | 534 | | |
JB Poindexter & Co., Inc. | |
7.13%, 4/15/26 (a) | | | 700 | | | | 745 | | |
Ken Garff Automotive LLC | |
4.88%, 9/15/28 (a) | | | 275 | | | | 271 | | |
LGI Homes, Inc. | |
6.88%, 7/15/26 (a) | | | 500 | | | | 524 | | |
Lithia Motors, Inc. | |
4.63%, 12/15/27 (a) | | | 600 | | | | 621 | | |
Macy's, Inc. | |
8.38%, 6/15/25 (a) | | | 750 | | | | 776 | | |
Marriott Ownership Resorts, Inc. | |
6.13%, 9/15/25 (a) | | | 450 | | | | 465 | | |
Mattamy Group Corp. | |
5.25%, 12/15/27 (a) | | | 500 | | | | 515 | | |
Mclaren Finance PLC | |
5.75%, 8/1/22 (a) | | | 550 | | | | 499 | | |
The accompanying notes are an integral part of the financial statements.
8
Morgan Stanley Institutional Fund Trust
Annual Report — September 30, 2020
Portfolio of Investments (cont'd)
High Yield Portfolio
| | | Face
Amount
(000) | | Value
(000) | |
Consumer, Cyclical (cont'd) | |
Meritor, Inc., | |
6.25%, 2/15/24 | | $ | 350 | | | $ | 358 | | |
6.25%, 6/1/25 (a) | | | 250 | | | | 262 | | |
MGM Resorts International, | |
5.50%, 4/15/27 | | | 327 | | | | 342 | | |
6.75%, 5/1/25 | | | 500 | | | | 525 | | |
Mileage Plus Holdings LLC/Mileage Plus
Intellectual Property Assets Ltd. | |
6.50%, 6/20/27 (a) | | | 750 | | | | 783 | | |
Nathan's Famous, Inc. | |
6.63%, 11/1/25 (a) | | | 1,000 | | | | 1,020 | | |
National CineMedia LLC | |
5.75%, 8/15/26 | | | 500 | | | | 342 | | |
Navistar International Corp. | |
6.63%, 11/1/25 (a) | | | 750 | | | | 768 | | |
New Home Co., Inc. (The) | |
7.25%, 4/1/22 | | | 750 | | | | 747 | | |
Panther BF Aggregator 2 LP/Panther
Finance Co., Inc. | |
8.50%, 5/15/27 (a) | | | 465 | | | | 481 | | |
Performance Food Group, Inc., | |
5.50%, 10/15/27 (a) | | | 710 | | | | 733 | | |
6.88%, 5/1/25 (a) | | | 500 | | | | 535 | | |
Picasso Finance Sub, Inc. | |
6.13%, 6/15/25 (a) | | | 625 | | | | 674 | | |
Powdr Corp. | |
6.00%, 8/1/25 (a) | | | 750 | | | | 770 | | |
Rite Aid Corp., | |
7.50%, 7/1/25 (a) | | | 275 | | | | 271 | | |
8.00%, 11/15/26 (a) | | | 380 | | | | 381 | | |
Sally Holdings LLC/Sally Capital, Inc. | |
5.63%, 12/1/25 | | | 500 | | | | 508 | | |
Scientific Games International, Inc., | |
7.00%, 5/15/28 (a) | | | 225 | | | | 226 | | |
8.25%, 3/15/26 (a) | | | 500 | | | | 523 | | |
Speedway Motorsports LLC/Speedway
Funding II, Inc. | |
4.88%, 11/1/27 (a) | | | 500 | | | | 481 | | |
Spirit Loyalty Cayman Ltd./Spirit IP Cayman Ltd. | |
8.00%, 9/20/25 (a) | | | 500 | | | | 530 | | |
Station Casinos LLC | |
4.50%, 2/15/28 (a) | | | 550 | | | | 507 | | |
Sugarhouse HSP Gaming Prop Mezz LP/
Sugarhouse HSP Gaming Finance Corp. | |
5.88%, 5/15/25 (a) | | | 810 | | | | 793 | | |
Taylor Morrison Communities, Inc. | |
5.88%, 6/15/27 (a) | | | 450 | | | | 496 | | |
Tempur Sealy International, Inc. | |
5.50%, 6/15/26 | | | 425 | | | | 442 | | |
Titan International, Inc. | |
6.50%, 11/30/23 | | | 900 | | | | 676 | | |
| | | Face
Amount
(000) | | Value
(000) | |
Truck Hero, Inc. | |
8.50%, 4/21/24 (a) | | $ | 1,100 | | | $ | 1,170 | | |
Vail Resorts, Inc. | |
6.25%, 5/15/25 (a) | | | 575 | | | | 611 | | |
Winnebago Industries, Inc. | |
6.25%, 7/15/28 (a) | | | 550 | | | | 581 | | |
Wolverine World Wide, Inc., | |
5.00%, 9/1/26 (a) | | | 500 | | | | 503 | | |
6.38%, 5/15/25 (a) | | | 300 | | | | 318 | | |
Wyndham Destinations, Inc. | |
4.63%, 3/1/30 (a) | | | 500 | | | | 483 | | |
| | | | 44,408 | | |
Consumer, Non-Cyclical (12.2%) | |
Acadia Healthcare Co., Inc. | |
5.50%, 7/1/28 (a) | | | 600 | | | | 618 | | |
AdaptHealth LLC | |
6.13%, 8/1/28 (a) | | | 350 | | | | 363 | | |
Ahern Rentals, Inc. | |
7.38%, 5/15/23 (a) | | | 925 | | | | 494 | | |
Albertsons Cos., Inc./Safeway, Inc./
New Albertson's, Inc./Albertson's LLC | |
5.88%, 2/15/28 (a) | | | 250 | | | | 267 | | |
Bausch Health Cos, Inc., | |
6.13%, 4/15/25 (a) | | | 100 | | | | 102 | | |
9.00%, 12/15/25 (a) | | | 550 | | | | 600 | | |
Beverages & More, Inc. | |
11.50%, 6/15/22 (a) | | | 900 | | | | 759 | | |
Catalent Pharma Solutions, Inc. | |
5.00%, 7/15/27 (a) | | | 500 | | | | 521 | | |
Central Garden & Pet Co. | |
5.13%, 2/1/28 | | | 450 | | | | 474 | | |
Chobani LLC/Chobani Finance Corp., Inc. | |
7.50%, 4/15/25 (a) | | | 950 | | | | 985 | | |
Edgewell Personal Care Co. | |
5.50%, 6/1/28 (a) | | | 500 | | | | 527 | | |
Emergent BioSolutions, Inc. | |
3.88%, 8/15/28 (a) | | | 275 | | | | 277 | | |
Endo Dac/Endo Finance LLC/Endo Finco, Inc. | |
6.00%, 7/15/23 (a) | | | 778 | | | | 617 | | |
FAGE International SA/FAGE USA Dairy Industry, Inc. | |
5.63%, 8/15/26 (a) | | | 500 | | | | 482 | | |
Garda World Security Corp. | |
9.50%, 11/1/27 (a) | | | 900 | | | | 947 | | |
Great Lakes Dredge & Dock Corp. | |
8.00%, 5/15/22 | | | 650 | | | | 669 | | |
H-Food Holdings LLC/Hearthside Finance Co., Inc. | |
8.50%, 6/1/26 (a) | | | 1,000 | | | | 981 | | |
Hadrian Merger Sub, Inc. | |
8.50%, 5/1/26 (a) | | | 350 | | | | 349 | | |
Harsco Corp. | |
5.75%, 7/31/27 (a) | | | 700 | | | | 710 | | |
Jaguar Holding Co. II/PPD Development LP | |
5.00%, 6/15/28 (a) | | | 300 | | | | 313 | | |
The accompanying notes are an integral part of the financial statements.
9
Morgan Stanley Institutional Fund Trust
Annual Report — September 30, 2020
Portfolio of Investments (cont'd)
High Yield Portfolio
| | | Face
Amount
(000) | | Value
(000) | |
Consumer, Non-Cyclical (cont'd) | |
Lamb Weston Holdings, Inc. | |
4.88%, 11/1/26 (a) | | $ | 500 | | | $ | 522 | | |
Michael Baker International LLC | |
8.75%, 3/1/23 (a) | | | 800 | | | | 800 | | |
MPH Acquisition Holdings LLC | |
7.13%, 6/1/24 (a) | | | 750 | | | | 771 | | |
Nielsen Finance LLC/Nielsen Finance Co. | |
5.63%, 10/1/28 (a) | | | 625 | | | | 648 | | |
Polaris Intermediate Corp. | |
8.50% CASH, 9.25% PIK, 12/1/22 (a)(c) | | | 650 | | | | 662 | | |
Post Holdings, Inc. | |
5.50%, 12/15/29 (a) | | | 150 | | | | 161 | | |
Select Medical Corp. | |
6.25%, 8/15/26 (a) | | | 650 | | | | 677 | | |
Service Corp. International | |
5.13%, 6/1/29 | | | 250 | | | | 277 | | |
Simmons Foods, Inc. | |
5.75%, 11/1/24 (a) | | | 600 | | | | 602 | | |
Sotheby's | |
7.38%, 10/15/27 (a) | | | 450 | | | | 451 | | |
Spectrum Brands, Inc. | |
5.00%, 10/1/29 (a) | | | 500 | | | | 520 | | |
Surgery Center Holdings, Inc., | |
6.75%, 7/1/25 (a) | | | 650 | | | | 649 | | |
10.00%, 4/15/27 (a) | | | 700 | | | | 747 | | |
Teleflex, Inc. | |
4.88%, 6/1/26 | | | 350 | | | | 363 | | |
Tenet Healthcare Corp., | |
6.13%, 10/1/28 (a) | | | 250 | | | | 244 | | |
7.00%, 8/1/25 | | | 600 | | | | 619 | | |
Teva Pharmaceutical Finance Netherlands III BV | |
3.15%, 10/1/26 | | | 540 | | | | 477 | | |
TMS International Holding Corp. | |
7.25%, 8/15/25 (a) | | | 1,000 | | | | 939 | | |
TreeHouse Foods, Inc. | |
4.00%, 9/1/28 | | | 225 | | | | 228 | | |
United Rentals North America, Inc. | |
4.88%, 1/15/28 | | | 250 | | | | 263 | | |
US Foods, Inc. | |
6.25%, 4/15/25 (a) | | | 686 | | | | 727 | | |
| | | 22,402 | | |
Diversified (1.0%) | |
PetSmart, Inc. | |
7.13%, 3/15/23 (a) | | | 800 | | | | 808 | | |
Trident TPI Holdings, Inc. | |
6.63%, 11/1/25 (a) | | | 1,000 | | | | 989 | | |
| | | | 1,797 | | |
Energy (10.6%) | |
American Midstream Partners LP/American
Midstream Finance Corp. | |
9.50%, 12/15/21 (a) | | | 1,000 | | | | 996 | | |
| | | Face
Amount
(000) | | Value
(000) | |
Archrock Partners LP/Archrock Partners
Finance Corp. | |
6.88%, 4/1/27 (a) | | $ | 300 | | | $ | 288 | | |
Baytex Energy Corp. | |
5.63%, 6/1/24 (a) | | | 1,000 | | | | 569 | | |
Blue Racer Midstream LLC/Blue Racer
Finance Corp. | |
6.63%, 7/15/26 (a) | | | 850 | | | | 751 | | |
CrownRock LP/CrownRock Finance, Inc. | |
5.63%, 10/15/25 (a) | | | 750 | | | | 709 | | |
Endeavor Energy Resources LP/EER Finance, Inc., | |
5.75%, 1/30/28 (a) | | | 750 | | | | 755 | | |
6.63%, 7/15/25 (a) | | | 250 | | | | 257 | | |
Energy Ventures Gom LLC/EnVen Finance Corp. | |
11.00%, 2/15/23 (a) | | | 1,200 | | | | 904 | | |
Global Partners LP/GLP Finance Corp. | |
7.00%, 8/1/27 | | | 840 | | | | 859 | | |
Jagged Peak Energy LLC | |
5.88%, 5/1/26 | | | 750 | | | | 748 | | |
Lonestar Resources America, Inc. | |
11.25%, 1/1/23 (a)(d)(e) | | | 1,115 | | | | 201 | | |
Magnolia Oil & Gas Operating LLC/
Magnolia Oil & Gas Finance Corp. | |
6.00%, 8/1/26 (a) | | | 700 | | | | 693 | | |
Martin Midstream Partners LP/
Martin Midstream Finance Corp., | |
10.00%, 2/29/24 (a) | | | 218 | | | | 227 | | |
11.50%, 2/28/25 (a) | | | 992 | | | | 903 | | |
Matador Resources Co. | |
5.88%, 9/15/26 | | | 800 | | | | 670 | | |
Murphy Oil Corp., | |
5.75%, 8/15/25 | | | 800 | | | | 700 | | |
5.88%, 12/1/27 | | | 200 | | | | 171 | | |
Murphy Oil USA, Inc. | |
5.63%, 5/1/27 | | | 800 | | | | 853 | | |
NuStar Logistics LP | |
6.38%, 10/1/30 | | | 185 | | | | 192 | | |
Occidental Petroleum Corp., | |
2.90%, 8/15/24 | | | 875 | | | | 744 | | |
6.95%, 7/1/24 | | | 875 | | | | 849 | | |
Oceaneering International, Inc. | |
6.00%, 2/1/28 | | | 775 | | | | 487 | | |
Parkland Fuel Corp. | |
5.88%, 7/15/27 (a) | | | 250 | | | | 263 | | |
Parsley Energy LLC/Parsley Finance Corp. | |
5.38%, 1/15/25 (a) | | | 500 | | | | 500 | | |
PBF Holding Co., LLC/PBF Finance Corp. | |
6.00%, 2/15/28 (a) | | | 750 | | | | 505 | | |
Rockies Express Pipeline LLC | |
3.60%, 5/15/25 (a) | | | 500 | | | | 491 | | |
Seven Generations Energy Ltd. | |
5.38%, 9/30/25 (a) | | | 700 | | | | 665 | | |
The accompanying notes are an integral part of the financial statements.
10
Morgan Stanley Institutional Fund Trust
Annual Report — September 30, 2020
Portfolio of Investments (cont'd)
High Yield Portfolio
| | | Face
Amount
(000) | | Value
(000) | |
Energy (cont'd) | |
Tallgrass Energy Partners LP/
Tallgrass Energy Finance Corp. | |
7.50%, 10/1/25 (a) | | $ | 200 | | | $ | 201 | | |
Targa Resources Partners LP/Targa
Resources Partners Finance Corp. | |
5.50%, 3/1/30 (a) | | | 500 | | | | 501 | | |
TransMontaigne Partners LP/TLP Finance Corp. | |
6.13%, 2/15/26 | | | 350 | | | | 364 | | |
Vermilion Energy, Inc. | |
5.63%, 3/15/25 (a) | | | 750 | | | | 625 | | |
Viper Energy Partners LP | |
5.38%, 11/1/27 (a) | | | 830 | | | | 819 | | |
WPX Energy, Inc., | |
4.50%, 1/15/30 | | | 300 | | | | 296 | | |
5.25%, 10/15/27 | | | 700 | | | | 712 | | |
| | | | 19,468 | | |
Finance (7.8%) | |
AHP Health Partners, Inc. | |
9.75%, 7/15/26 (a) | | | 940 | | | | 1,011 | | |
Alliant Holdings Intermediate LLC/
Alliant Holdings Co-Issuer | |
6.75%, 10/15/27 (a) | | | 650 | | | | 683 | | |
Compass Group Diversified Holdings LLC | |
8.00%, 5/1/26 (a) | | | 700 | | | | 737 | | |
CTR Partnership LP/CareTrust Capital Corp. | |
5.25%, 6/1/25 | | | 608 | | | | 625 | | |
Cushman & Wakefield US Borrower LLC | |
6.75%, 5/15/28 (a) | | | 400 | | | | 417 | | |
Fly Leasing Ltd. | |
5.25%, 10/15/24 | | | 675 | | | | 558 | | |
Freedom Mortgage Corp. | |
8.25%, 4/15/25 (a) | | | 500 | | | | 511 | | |
GTCR AP Finance, Inc. | |
8.00%, 5/15/27 (a) | | | 600 | | | | 635 | | |
HUB International Ltd. | |
7.00%, 5/1/26 (a) | | | 582 | | | | 604 | | |
Hunt Cos., Inc. | |
6.25%, 2/15/26 (a) | | | 661 | | | | 636 | | |
Icahn Enterprises LP/Icahn Enterprises Finance Corp. | |
5.25%, 5/15/27 | | | 250 | | | | 261 | | |
INTL FCStone, Inc. | |
8.63%, 6/15/25 (a) | | | 649 | | | | 702 | | |
Iron Mountain, Inc. | |
5.25%, 7/15/30 (a) | | | 300 | | | | 313 | | |
iStar, Inc. | |
4.25%, 8/1/25 | | | 250 | | | | 234 | | |
Kennedy-Wilson, Inc. | |
5.88%, 4/1/24 | | | 500 | | | | 498 | | |
Lions Gate Capital Holdings LLC, | |
5.88%, 11/1/24 (a) | | | 250 | | | | 247 | | |
6.38%, 2/1/24 (a) | | | 450 | | | | 447 | | |
| | | Face
Amount
(000) | | Value
(000) | |
MGIC Investment Corp. | |
5.25%, 8/15/28 | | $ | 300 | | | $ | 310 | | |
MGM Growth Properties Operating
Partnership LP/MGP Finance Co-Issuer, Inc. | |
5.75%, 2/1/27 | | | 325 | | | | 351 | | |
MGM Growth Properties Operating Partnership LP/
MGP Finance Co-Issuer, Inc. | |
4.63%, 6/15/25 (a) | | | 150 | | | | 153 | | |
MPT Operating Partnership LP/MPT Finance Corp. | |
4.63%, 8/1/29 | | | 500 | | | | 521 | | |
NMI Holdings, Inc. | |
7.38%, 6/1/25 (a) | | | 500 | | | | 535 | | |
Oxford Finance LLC/Oxford Finance Co-Issuer II, Inc. | |
6.38%, 12/15/22 (a) | | | 750 | | | | 734 | | |
PennyMac Financial Services, Inc. | |
5.38%, 10/15/25 (a) | | | 375 | | | | 380 | | |
Provident Funding Associates LP/PFG Finance Corp. | |
6.38%, 6/15/25 (a) | | | 462 | | | | 449 | | |
Radian Group, Inc. | |
6.63%, 3/15/25 | | | 450 | | | | 476 | | |
RHP Hotel Properties LP/RHP Finance Corp. | |
4.75%, 10/15/27 | | | 250 | | | | 231 | | |
SBA Communications Corp. | |
3.88%, 2/15/27 (a) | | | 425 | | | | 432 | | |
Vertical US Newco, Inc. | |
5.25%, 7/15/27 (a) | | | 550 | | | | 573 | | |
| | | | 14,264 | | |
Health Care (0.1%) | |
Encompass Health Corp. | |
4.63%, 4/1/31 | | | 150 | | | | 150 | | |
Industrials (16.8%) | |
American Woodmark Corp. | |
4.88%, 3/15/26 (a) | | | 250 | | | | 254 | | |
Apex Tool Group LLC/BC Mountain Finance, Inc. | |
9.00%, 2/15/23 (a) | | | 900 | | | | 835 | | |
Bombardier, Inc. | |
6.13%, 1/15/23 (a) | | | 600 | | | | 514 | | |
Brand Industrial Services, Inc. | |
8.50%, 7/15/25 (a) | | | 1,000 | | | | 947 | | |
Builders FirstSource, Inc. | |
5.00%, 3/1/30 (a) | | | 500 | | | | 518 | | |
Cargo Aircraft Management, Inc. | |
4.75%, 2/1/28 (a) | | | 500 | | | | 506 | | |
Cleaver-Brooks, Inc. | |
7.88%, 3/1/23 (a) | | | 850 | | | | 823 | | |
Core & Main LP | |
6.13%, 8/15/25 (a) | | | 600 | | | | 609 | | |
Cornerstone Building Brands, Inc. | |
8.00%, 4/15/26 (a) | | | 650 | | | | 684 | | |
Cornerstone Building Brands, Inc. | |
6.13%, 1/15/29 (a) | | | 275 | | | | 279 | | |
EnerSys | |
4.38%, 12/15/27 (a) | | | 350 | | | | 358 | | |
The accompanying notes are an integral part of the financial statements.
11
Morgan Stanley Institutional Fund Trust
Annual Report — September 30, 2020
Portfolio of Investments (cont'd)
High Yield Portfolio
| | | Face
Amount
(000) | | Value
(000) | |
Industrials (cont'd) | |
EnPro Industries, Inc. | |
5.75%, 10/15/26 | | $ | 650 | | | $ | 688 | | |
Flex Acquisition Co., Inc. | |
6.88%, 1/15/25 (a) | | | 600 | | | | 602 | | |
FXI Holdings, Inc. | |
7.88%, 11/1/24 (a) | | | 688 | | | | 655 | | |
GPC Merger Sub, Inc. | |
7.13%, 8/15/28 (a) | | | 550 | | | | 574 | | |
Greif, Inc. | |
6.50%, 3/1/27 (a) | | | 175 | | | | 182 | | |
Griffon Corp. | |
5.75%, 3/1/28 | | | 875 | | | | 915 | | |
Grinding Media, Inc./Moly-Cop AltaSteel Ltd. | |
7.38%, 12/15/23 (a) | | | 925 | | | | 939 | | |
Ingram Micro, Inc. | |
5.45%, 12/15/24 | | | 750 | | | | 803 | | |
Intelligent Packaging Ltd. Finco, Inc./Intelligent
Packaging Ltd. Co-Issuer LLC | |
6.00%, 9/15/28 (a) | | | 425 | | | | 432 | | |
Intertape Polymer Group, Inc. | |
7.00%, 10/15/26 (a) | | | 1,075 | | | | 1,133 | | |
JPW Industries Holding Corp. | |
9.00%, 10/1/24 (a) | | | 1,050 | | | | 993 | | |
KBR, Inc. | |
4.75%, 9/30/28 (a) | | | 330 | | | | 332 | | |
Kenan Advantage Group, Inc. (The) | |
7.88%, 7/31/23 (a) | | | 1,000 | | | | 974 | | |
Koppers, Inc. | |
6.00%, 2/15/25 (a) | | | 750 | | | | 762 | | |
Kratos Defense & Security Solutions, Inc. | |
6.50%, 11/30/25 (a) | | | 750 | | | | 786 | | |
Manitowoc Co., Inc. (The) | |
9.00%, 4/1/26 (a) | | | 575 | | | | 595 | | |
Mauser Packaging Solutions Holding Co. | |
7.25%, 4/15/25 (a) | | | 1,000 | | | | 943 | | |
Moog, Inc. | |
4.25%, 12/15/27 (a) | | | 500 | | | | 512 | | |
New Enterprise Stone & Lime Co., Inc., | |
6.25%, 3/15/26 (a) | | | 575 | | | | 593 | | |
9.75%, 7/15/28 (a) | | | 500 | | | | 543 | | |
Owens-Brockway Glass Container, Inc. | |
6.63%, 5/13/27 (a) | | | 500 | | | | 543 | | |
PGT Escrow Issuer, Inc. | |
6.75%, 8/1/26 (a) | | | 750 | | | | 801 | | |
Plastipak Holdings, Inc. | |
6.25%, 10/15/25 (a) | | | 750 | | | | 751 | | |
Standard Industries, Inc. | |
5.00%, 2/15/27 (a) | | | 500 | | | | 521 | | |
Stevens Holding Co., Inc. | |
6.13%, 10/1/26 (a) | | | 350 | | | | 376 | | |
| | | Face
Amount
(000) | | Value
(000) | |
Summit Materials LLC/Summit Materials
Finance Corp. | |
5.25%, 1/15/29 (a) | | $ | 500 | | | $ | 522 | | |
TopBuild Corp. | |
5.63%, 5/1/26 (a) | | | 500 | | | | 518 | | |
TransDigm, Inc. | |
5.50%, 11/15/27 | | | 750 | | | | 722 | | |
TriMas Corp. | |
4.88%, 10/15/25 (a) | | | 350 | | | | 355 | | |
Triumph Group, Inc., | |
6.25%, 9/15/24 (a) | | | 500 | | | | 427 | | |
8.88%, 6/1/24 (a) | | | 275 | | | | 294 | | |
Trivium Packaging Finance BV | |
8.50%, 8/15/27 (a) | | | 550 | | | | 594 | | |
TTM Technologies, Inc. | |
5.63%, 10/1/25 (a) | | | 1,013 | | | | 1,037 | | |
Tutor Perini Corp. | |
6.88%, 5/1/25 (a) | | | 750 | | | | 691 | | |
US Concrete, Inc., | |
5.13%, 3/1/29 (a) | | | 375 | | | | 377 | | |
6.38%, 6/1/24 | | | 250 | | | | 258 | | |
Waste Pro USA, Inc. | |
5.50%, 2/15/26 (a) | | | 475 | | | | 482 | | |
Watco Cos. LLC/Watco Finance Corp. | |
6.50%, 6/15/27 (a) | | | 750 | | | | 769 | | |
WESCO Distribution, Inc. | |
7.13%, 6/15/25 (a) | | | 250 | | | | 273 | | |
XPO Logistics, Inc. | |
6.25%, 5/1/25 (a) | | | 300 | | | | 321 | | |
| | | | 30,915 | | |
Technology (3.1%) | |
Black Knight InfoServ LLC | |
3.63%, 9/1/28 (a) | | | 350 | | | | 354 | | |
Boxer Parent Co., Inc. | |
7.13%, 10/2/25 (a) | | | 725 | | | | 775 | | |
BY Crown Parent LLC | |
7.38%, 10/15/24 (a) | | | 428 | | | | 436 | | |
CDK Global, Inc. | |
5.25%, 5/15/29 (a) | | | 250 | | | | 266 | | |
Change Healthcare Holdings LLC/Change
Healthcare Finance, Inc. | |
5.75%, 3/1/25 (a) | | | 500 | | | | 508 | | |
Diebold Nixdorf, Inc., | |
8.50%, 4/15/24 | | | 350 | | | | 320 | | |
9.38%, 7/15/25 (a) | | | 325 | | | | 344 | | |
IQVIA, Inc. | |
5.00%, 5/15/27 (a) | | | 250 | | | | 263 | | |
j2 Cloud Services LLC/j2 Global Co-Obligor, Inc. | |
6.00%, 7/15/25 (a) | | | 750 | | | | 781 | | |
MSCI, Inc. | |
4.75%, 8/1/26 (a) | | | 150 | | | | 156 | | |
MTS Systems Corp. | |
5.75%, 8/15/27 (a) | | | 750 | | | | 741 | | |
The accompanying notes are an integral part of the financial statements.
12
Morgan Stanley Institutional Fund Trust
Annual Report — September 30, 2020
Portfolio of Investments (cont'd)
High Yield Portfolio
| | | Face
Amount
(000) | | Value
(000) | |
Technology (cont'd) | |
ON Semiconductor Corp. | |
3.88%, 9/1/28 (a) | | $ | 325 | | | $ | 330 | | |
Rackspace Hosting, Inc. | |
8.63%, 11/15/24 (a) | | | 500 | | | | 524 | | |
| | | | 5,798 | | |
Utilities (1.0%) | |
Calpine Corp. | |
5.00%, 2/1/31 (a) | | | 300 | | | | 307 | | |
LBC Tank Terminals Holding Netherlands BV | |
6.88%, 5/15/23 (a) | | | 950 | | | | 946 | | |
PG&E Corp. | |
5.25%, 7/1/30 | | | 600 | | | | 581 | | |
| | | | 1,834 | | |
| | | 173,757 | | |
Variable Rate Senior Loan Interests (3.2%) | |
Communication Services (0.2%) | |
CommScope, Inc., | |
2019 Term B
1 Month USD LIBOR + 3.25%, 3.40%, 4/6/26 (f) | | | 347 | | | | 339 | | |
Connect Finco Sarl, | |
Term Loan B
1 Month USD LIBOR + 4.50%, 4.65%, 12/11/26 (f) | | | 1 | | | | 1 | | |
| | | | 340 | | |
Communications (0.4%) | |
Terrier Media Buyer, Inc., | |
Term B
1 Month USD LIBOR + 4.25%, 4.40%, 12/17/26 (f) | | | 703 | | | | 688 | | |
Consumer, Cyclical (0.9%) | |
Playa Resorts Holding BV, | |
2017 Term Loan B
3 Month USD LIBOR + 2.75%, 3.75%, 4/29/24 (f) | | | 630 | | | | 558 | | |
Thor Industries, Inc., | |
Term B
3 Month USD LIBOR + 3.75%, 3.94%, 2/1/26 (f) | | | 629 | | | | 627 | | |
Topgolf International, Inc., | |
Term B
3 Month USD LIBOR + 6.25%, 7.00%, 2/8/26 (f) | | | 493 | | | | 485 | | |
| | | | 1,670 | | |
Consumer, Non-Cyclical (0.3%) | |
H Food Holdings LLC, | |
2018 Term Loan B
1 Month USD LIBOR + 3.68%, 3.83%, 5/23/25 (f) | | | 660 | | | | 643 | | |
Energy (0.0%) | |
Gavilan Resources LLC, | |
2nd Lien Term
3 Month USD LIBOR + 6.00%, 7.00%, 3/1/24 (d)(e) | | | 1,000 | | | | 13 | | |
Industrials (1.1%) | |
Airxcel, Inc., | |
1st Lien Term
3 Month USD LIBOR + 4.50%, 4.69%, 4/28/25 (f) | | | 634 | | | | 599 | | |
| | | Face
Amount
(000) | | Value
(000) | |
Associated Asphalt Partners LLC, | |
Term B | |
3 Month USD LIBOR + 5.25%, 6.25%, 4/5/24 (f) | | $ | 966 | | | $ | 783 | | |
SAExploration Holdings, Inc., | |
Term Loan
Fixed + 10.00%, 1/4/21 (d)(e) | | | 500 | | | | 75 | | |
Titan Acquisition Limited, | |
2018 Term Loan B
3 Month USD LIBOR + 3.00%, 3.22%, 3/28/25 (f) | | | 511 | | | | 485 | | |
| | | | 1,942 | | |
Technology (0.3%) | |
DynCorp International, Inc., | |
2019 Term Loan B
1 Month USD LIBOR + 6.00%, 7.00%,
8/18/25 (f) | | | 570 | | | | 568 | | |
| | | | 5,864 | | |
| Total Fixed Income Securities (Cost $182,168) | | | 179,621 | | |
| | | Shares | | | |
Common Stocks (0.2%) | |
Auto Components (0.0%) | |
Exide Technologies (g) | | | 592 | | | | 0 | | |
Equity Real Estate Investment Trusts (REITs) (0.1%) | |
American Gilsonite Co. (g) | | | 500 | | | | 200 | | |
Machinery (0.0%) | |
Iracore International Holdings, Inc., Class A (g)(h) | | | 470 | | | | 60 | | |
Semiconductors & Semiconductor Equipment (0.0%) | |
UC Holdings, Inc. (g) | | | 2,826 | | | | 29 | | |
Transportation (0.1%) | |
Sycreon Group BV/Syncreon Global
Finance US, Inc. (g) | | | 1,441 | | | | 66 | | |
Total Common Stocks (Cost $151) | | | 355 | | |
| | | No. of
Warrants | | | |
Warrant (0.0%) | |
Transportation (0.0%) | |
Sncreon Group BV/Syncreon Global
Finance US, Inc. expires 10/2/24 (Cost $—) | | | 2,266 | | | | 35 | | |
| | | Shares | | | |
Short-Term Investment (0.6%) | |
Investment Company (0.6%) | |
Morgan Stanley Institutional Liquidity Funds —
Government Portfolio — Institutional Class
(See Note G) (Cost $1,083) | | | 1,083,228 | | | | 1,083 | | |
| Total Investments (98.6%) (Cost $183,402) (i)(j) | | | 181,094 | | |
| Other Assets in Excess of Liabilities (1.4%) | | | 2,579 | | |
Net Assets (100.0%) | | $ | 183,673 | | |
(a) 144A security — Certain conditions for public sale may exist. Unless otherwise noted, these securities are deemed to be liquid.
(b) When-issued security.
(c) PIK: Payment-in-kind security for which part of the income earned may be paid as additional principal.
The accompanying notes are an integral part of the financial statements.
13
Morgan Stanley Institutional Fund Trust
Annual Report — September 30, 2020
Portfolio of Investments (cont'd)
High Yield Portfolio
(d) Non-income producing security; bond in default.
(e) Issuer in bankruptcy.
(f) Floating or variable rate securities: The rates disclosed are as of September 30, 2020. For securities based on a published reference rate and spread, the reference rate and spread are indicated in the description in the Portfolio of Investments. Certain variable rate securities may not be based on a published reference rate and spread but are determined by the issuer or agent and are based on current market conditions. These securities do not indicate a reference rate and spread in their description in the Portfolio of Investments.
(g) Non-income producing security.
(h) At September 30, 2020, the Fund held a fair valued security valued at approximately $60,000 representing 0.03% of net assets. This security has been fair valued as determined in good faith under procedures established by and under the general supervision of the Trust's (as defined herein) Trustees.
(i) Securities are available for collateral in connection with purchase of a when-issued securities.
(j) At September 30, 2020, the aggregate cost for federal income tax purposes is approximately $183,785,000. The aggregate gross unrealized appreciation is approximately $5,300,000 and the aggregate gross unrealized depreciation is approximately $7,991,000, resulting in net unrealized depreciation of approximately $2,691,000.
LIBOR London Interbank Offered Rate.
PIK Payment-in-Kind. Income may be paid in additional securities or cash at the discretion of the issuer.
REITs Real Estate Investment Trusts.
USD United States Dollar.
Portfolio Composition
Classification | | Percentage of
Total Investments | |
Consumer, Cyclical | | | 24.5 | % | |
Industrials | | | 17.2 | | |
Communications | | | 12.5 | | |
Consumer, Non-Cyclical | | | 12.4 | | |
Energy | | | 10.7 | | |
Other* | | | 9.1 | | |
Finance | | | 7.9 | | |
Basic Materials | | | 5.7 | | |
Total Investments | | | 100.0 | % | |
* Industries and/or investment types representing less than 5% of total investments.
The accompanying notes are an integral part of the financial statements.
14
Morgan Stanley Institutional Fund Trust
Annual Report — September 30, 2020
Statement of Assets and Liabilities | | September 30, 2020
(000) | |
Assets: | |
Investments in Securities of Unaffiliated Issuers, at Value (Cost $182,319) | | $ | 180,011 | | |
Investment in Security of Affiliated Issuer, at Value (Cost $1,083) | | | 1,083 | | |
Total Investments in Securities, at Value (Cost $183,402) | | | 181,094 | | |
Interest Receivable | | | 3,136 | | |
Receivable for Investments Sold | | | 1,256 | | |
Receivable for Fund Shares Sold | | | 58 | | |
Receivable from Affiliate | | | — | @ | |
Other Assets | | | 55 | | |
Total Assets | | | 185,599 | | |
Liabilities: | |
Payable for Investments Purchased | | | 1,625 | | |
Payable for Professional Fees | | | 82 | | |
Payable for Fund Shares Redeemed | | | 72 | | |
Payable for Advisory Fees | | | 62 | | |
Payable for Sub Transfer Agency Fees — Class I | | | 20 | | |
Payable for Sub Transfer Agency Fees — Class A | | | 4 | | |
Payable for Sub Transfer Agency Fees — Class L | | | — | @ | |
Payable for Sub Transfer Agency Fees — Class C | | | 1 | | |
Payable for Administration Fees | | | 12 | | |
Payable for Shareholder Services Fees — Class A | | | 3 | | |
Payable for Distribution and Shareholder Services Fees — Class L | | | — | @ | |
Payable for Distribution and Shareholder Services Fees — Class C | | | 6 | | |
Payable for Transfer Agency Fees — Class I | | | 2 | | |
Payable for Transfer Agency Fees — Class A | | | 1 | | |
Payable for Transfer Agency Fees — Class L | | | — | @ | |
Payable for Transfer Agency Fees — Class C | | | 1 | | |
Payable for Transfer Agency Fees — Class IS | | | 1 | | |
Payable for Transfer Agency Fees — Class IR | | | — | @ | |
Payable for Custodian Fees | | | 4 | | |
Other Liabilities | | | 30 | | |
Total Liabilities | | | 1,926 | | |
Net Assets | | $ | 183,673 | | |
Net Assets Consist of: | |
Paid-in-Capital | | $ | 200,306 | | |
Total Accumulated Loss | | | (16,633 | ) | |
Net Assets | | $ | 183,673 | | |
The accompanying notes are an integral part of the financial statements.
15
Morgan Stanley Institutional Fund Trust
Annual Report — September 30, 2020
Statement of Assets and Liabilities (cont'd) | | September 30, 2020
(000) | |
CLASS I: | |
Net Assets | | $ | 155,539 | | |
| Shares Outstanding (unlimited number of shares authorized, no par value) (not in 000's) | | | 16,931,014 | | |
Net Asset Value, Offering and Redemption Price Per Share | | $ | 9.19 | | |
CLASS A: | |
Net Assets | | $ | 14,595 | | |
| Shares Outstanding (unlimited number of shares authorized, no par value) (not in 000's) | | | 1,591,636 | | |
Net Asset Value, Redemption Price Per Share | | $ | 9.17 | | |
Maximum Sales Load | | | 3.25 | % | |
Maximum Sales Charge | | $ | 0.31 | | |
Maximum Offering Price Per Share | | $ | 9.48 | | |
CLASS L: | |
Net Assets | | $ | 425 | | |
| Shares Outstanding (unlimited number of shares authorized, no par value) (not in 000's) | | | 46,285 | | |
Net Asset Value, Offering and Redemption Price Per Share | | $ | 9.17 | | |
CLASS C: | |
Net Assets | | $ | 7,633 | | |
| Shares Outstanding (unlimited number of shares authorized, no par value) (not in 000's) | | | 833,597 | | |
Net Asset Value, Offering and Redemption Price Per Share | | $ | 9.16 | | |
CLASS IS: | |
Net Assets | | $ | 5,471 | | |
| Shares Outstanding (unlimited number of shares authorized, no par value) (not in 000's) | | | 595,345 | | |
Net Asset Value, Offering and Redemption Price Per Share | | $ | 9.19 | | |
CLASS IR: | |
Net Assets | | $ | 10 | | |
| Shares Outstanding (unlimited number of shares authorized, no par value) (not in 000's) | | | 1,108 | | |
Net Asset Value, Offering and Redemption Price Per Share | | $ | 9.19 | | |
@ Amount is less than $500.
The accompanying notes are an integral part of the financial statements.
16
Morgan Stanley Institutional Fund Trust
Annual Report — September 30, 2020
Statement of Operations | | Year Ended
September 30, 2020
(000) | |
Investment Income: | |
Interest from Securities of Unaffiliated Issuers | | $ | 13,021 | | |
Dividends from Security of Affiliated Issuer (Note G) | | | 14 | | |
Total Investment Income | | | 13,035 | | |
Expenses: | |
Advisory Fees (Note B) | | | 1,142 | | |
Sub Transfer Agency Fees — Class I | | | 188 | | |
Sub Transfer Agency Fees — Class A | | | 28 | | |
Sub Transfer Agency Fees — Class L | | | — | @ | |
Sub Transfer Agency Fees — Class C | | | 4 | | |
Professional Fees | | | 196 | | |
Administration Fees (Note C) | | | 152 | | |
Shareholder Services Fees — Class A (Note D) | | | 48 | | |
Distribution and Shareholder Services Fees — Class L (Note D) | | | 2 | | |
Distribution and Shareholder Services Fees — Class C (Note D) | | | 58 | | |
Registration Fees | | | 96 | | |
Shareholder Reporting Fees | | | 35 | | |
Pricing Fees | | | 31 | | |
Transfer Agency Fees — Class I (Note E) | | | 9 | | |
Transfer Agency Fees — Class A (Note E) | | | 3 | | |
Transfer Agency Fees — Class L (Note E) | | | 2 | | |
Transfer Agency Fees — Class C (Note E) | | | 3 | | |
Transfer Agency Fees — Class IS (Note E) | | | 2 | | |
Transfer Agency Fees — Class IR (Note E) | | | 2 | | |
Custodian Fees (Note F) | | | 16 | | |
Trustees' Fees and Expenses | | | 8 | | |
Other Expenses | | | 29 | | |
Expenses Before Non Operating Expenses | | | 2,054 | | |
Bank Overdraft Expense | | | 7 | | |
Total Expenses | | | 2,061 | | |
Waiver of Advisory Fees (Note B) | | | (522 | ) | |
Reimbursement of Class Specific Expenses — Class I (Note B) | | | (150 | ) | |
Reimbursement of Class Specific Expenses — Class A (Note B) | | | (7 | ) | |
Reimbursement of Class Specific Expenses — Class L (Note B) | | | (2 | ) | |
Reimbursement of Class Specific Expenses — Class IS (Note B) | | | (2 | ) | |
Reimbursement of Class Specific Expenses — Class IR (Note B) | | | (2 | ) | |
Rebate from Morgan Stanley Affiliate (Note G) | | | (3 | ) | |
Net Expenses | | | 1,373 | | |
Net Investment Income | | | 11,662 | | |
Realized Loss: | |
Investments Sold | | | (12,570 | ) | |
Change in Unrealized Appreciation (Depreciation): | |
Investments | | | (417 | ) | |
Net Realized Loss and Change in Unrealized Appreciation (Depreciation) | | | (12,987 | ) | |
Net Decrease in Net Assets Resulting from Operations | | $ | (1,325 | ) | |
@ Amount is less than $500.
The accompanying notes are an integral part of the financial statements.
17
Morgan Stanley Institutional Fund Trust
Annual Report — September 30, 2020
Statements of Changes in Net Assets | | Year Ended
September 30, 2020
(000) | | Year Ended
September 30, 2019
(000) | |
Increase (Decrease) in Net Assets: | |
Operations: | |
Net Investment Income | | $ | 11,662 | | | $ | 12,487 | | |
Net Realized Loss | | | (12,570 | ) | | | (1,825 | ) | |
Net Change in Unrealized Appreciation (Depreciation) | | | (417 | ) | | | (1,440 | ) | |
Net Increase (Decrease) in Net Assets Resulting from Operations | | | (1,325 | ) | | | 9,222 | | |
Dividends and Distributions to Shareholders: | |
Class I | | | (10,175 | ) | | | (10,591 | ) | |
Class A | | | (1,185 | ) | | | (1,287 | ) | |
Class L | | | (25 | ) | | | (28 | ) | |
Class C | | | (300 | ) | | | (293 | ) | |
Class IS | | | (284 | ) | | | (54 | ) | |
Class IR | | | (1 | ) | | | (1 | ) | |
Total Dividends and Distributions to Shareholders | | | (11,970 | ) | | | (12,254 | ) | |
Capital Share Transactions:(1) | |
Class I: | |
Subscribed | | | 47,804 | | | | 86,572 | | |
Distributions Reinvested | | | 10,167 | | | | 10,572 | | |
Redeemed | | | (66,806 | ) | | | (68,177 | ) | |
Class A: | |
Subscribed | | | 11,003 | | | | 19,852 | | |
Distributions Reinvested | | | 1,080 | | | | 1,161 | | |
Redeemed | | | (19,692 | ) | | | (26,116 | ) | |
Class L: | |
Exchanged | | | — | | | | 5 | | |
Distributions Reinvested | | | 25 | | | | 27 | | |
Redeemed | | | (40 | ) | | | (58 | ) | |
Class C: | |
Subscribed | | | 4,023 | | | | 1,053 | | |
Distributions Reinvested | | | 297 | | | | 289 | | |
Redeemed | | | (1,823 | ) | | | (1,820 | ) | |
Class IS: | |
Subscribed | | | 13,072 | | | | 652 | | |
Distributions Reinvested | | | 284 | | | | 18 | | |
Redeemed | | | (9,316 | ) | | | (1,224 | ) | |
Class IR: | |
Distributions Reinvested | | | 1 | | | | — | @ | |
Net Increase (Decrease) in Net Assets Resulting from Capital Share Transactions | | | (9,921 | ) | | | 22,806 | | |
Total Increase (Decrease) in Net Assets | | | (23,216 | ) | | | 19,774 | | |
Net Assets: | |
Beginning of Period | | | 206,889 | | | | 187,115 | | |
End of Period | | $ | 183,673 | | | $ | 206,889 | | |
The accompanying notes are an integral part of the financial statements.
18
Morgan Stanley Institutional Fund Trust
Annual Report — September 30, 2020
Statements of Changes in Net Assets (cont'd) | | Year Ended
September 30, 2020
(000) | | Year Ended
September 30, 2019
(000) | |
(1) Capital Share Transactions: | |
Class I: | |
Shares Subscribed | | | 5,249 | | | | 9,003 | | |
Shares Issued on Distributions Reinvested | | | 1,101 | | | | 1,094 | | |
Shares Redeemed | | | (7,471 | ) | | | (7,076 | ) | |
Net Increase (Decrease) in Class I Shares Outstanding | | | (1,121 | ) | | | 3,021 | | |
Class A: | |
Shares Subscribed | | | 1,208 | | | | 2,058 | | |
Shares Issued on Distributions Reinvested | | | 117 | | | | 120 | | |
Shares Redeemed | | | (2,234 | ) | | | (2,721 | ) | |
Net Decrease in Class A Shares Outstanding | | | (909 | ) | | | (543 | ) | |
Class L: | |
Shares Exchanged | | | — | | | | — | @@ | |
Shares Issued on Distributions Reinvested | | | 3 | | | | 3 | | |
Shares Redeemed | | | (5 | ) | | | (6 | ) | |
Net Decrease in Class L Shares Outstanding | | | (2 | ) | | | (3 | ) | |
Class C: | |
Shares Subscribed | | | 466 | | | | 110 | | |
Shares Issued on Distributions Reinvested | | | 32 | | | | 30 | | |
Shares Redeemed | | | (201 | ) | | | (189 | ) | |
Net Increase (Decrease) in Class C Shares Outstanding | | | 297 | | | | (49 | ) | |
Class IS: | |
Shares Subscribed | | | 1,547 | | | | 67 | | |
Shares Issued on Distributions Reinvested | | | 32 | | | | 2 | | |
Shares Redeemed | | | (1,014 | ) | | | (125 | ) | |
Net Increase (Decrease) in Class IS Shares Outstanding | | | 565 | | | | (56 | ) | |
Class IR: | |
Shares Issued on Distributions Reinvested | | | — | @@ | | | — | @@ | |
@ Amount is less than $500.
@@ Amount is less than 500 shares.
The accompanying notes are an integral part of the financial statements.
19
Morgan Stanley Institutional Fund Trust
Annual Report — September 30, 2020
Financial Highlights
High Yield Portfolio
| | | Class I | |
| | | Year Ended September 30, | |
Selected Per Share Data and Ratios | | 2020 | | 2019 | | 2018 | | 2017 | | 2016(1) | |
Net Asset Value, Beginning of Period | | $ | 9.78 | | | $ | 9.96 | | | $ | 10.15 | | | $ | 9.92 | | | $ | 9.80 | | |
Income (Loss) from Investment Operations: | |
Net Investment Income(2) | | | 0.57 | | | | 0.63 | | | | 0.65 | | | | 0.70 | | | | 0.67 | | |
Net Realized and Unrealized Gain (Loss) | | | (0.57 | ) | | | (0.19 | ) | | | (0.16 | ) | | | 0.20 | | | | 0.13 | | |
Total from Investment Operations | | | 0.00 | | | | 0.44 | | | | 0.49 | | | | 0.90 | | | | 0.80 | | |
Distributions from and/or in Excess of: | |
Net Investment Income | | | (0.59 | ) | | | (0.62 | ) | | | (0.68 | ) | | | (0.67 | ) | | | (0.68 | ) | |
Net Asset Value, End of Period | | $ | 9.19 | | | $ | 9.78 | | | $ | 9.96 | | | $ | 10.15 | | | $ | 9.92 | | |
Total Return(3) | | | 0.15 | % | | | 4.68 | % | | | 5.01 | % | | | 9.40 | % | | | 8.72 | % | |
Ratios to Average Net Assets and Supplemental Data: | |
Net Assets, End of Period (Thousands) | | $ | 155,539 | | | $ | 176,483 | | | $ | 149,683 | | | $ | 64,007 | | | $ | 49,990 | | |
Ratio of Expenses Before Expense Limitation | | | 1.02 | % | | | 0.98 | % | | | 1.00 | % | | | 1.06 | % | | | 1.02 | % | |
Ratio of Expenses After Expense Limitation | | | 0.65 | %(4) | | | 0.65 | %(4) | | | 0.65 | %(4) | | | 0.66 | %(4) | | | 0.66 | %(4)(5) | |
Ratio of Expenses After Expense Limitation Excluding Non-Operating Expenses | | | 0.65 | %(4) | | | 0.65 | %(4) | | | 0.65 | %(4) | | | 0.65 | %(4) | | | N/A | | |
Ratio of Net Investment Income | | | 6.20 | %(4) | | | 6.51 | %(4) | | | 6.49 | %(4) | | | 7.01 | %(4) | | | 7.09 | %(4)(5) | |
Ratio of Rebate from Morgan Stanley Affiliates | | | 0.00 | %(6) | | | 0.00 | %(6) | | | 0.00 | %(6) | | | 0.00 | %(6) | | | 0.00 | %(6) | |
Portfolio Turnover Rate | | | 69 | % | | | 42 | % | | | 39 | % | | | 73 | % | | | 74 | % | |
(1) Reflects prior period custodian out-of-pocket expenses that were reimbursed in September 2016. The amount of the reimbursement was immaterial on a per share basis and did not impact the total return of Class I shares. The Ratio of Expenses After Expense Limitation and the Ratio of Net Investment Income would be unchanged as the reimbursement of custodian fees was offset against expense waivers/reimbursements with no impact to net expenses or net investment income.
(2) Per share amount is based on average shares outstanding.
(3) Calculated based on the net asset value as of the last business day of the period.
(4) The Ratio of Expenses After Expense Limitation and Ratio of Net Investment Income reflect the rebate of certain Fund expenses in connection with the investments in Morgan Stanley affiliates during the period. The effect of the rebate on the ratios is disclosed in the above table as "Ratio of Rebate from Morgan Stanley Affiliates."
(5) Effective January 4, 2016, the Adviser has agreed to limit the ratio of expenses to average net assets to the maximum ratio of 0.65% for Class I shares. Prior to January 4, 2016, the maximum ratio was 0.75% for Class I shares.
(6) Amount is less than 0.005%.
The accompanying notes are an integral part of the financial statements.
20
Morgan Stanley Institutional Fund Trust
Annual Report — September 30, 2020
Financial Highlights
High Yield Portfolio
| | | Class A | |
| | | Year Ended September 30, | |
Selected Per Share Data and Ratios | | 2020 | | 2019 | | 2018 | | 2017 | | 2016(1) | |
Net Asset Value, Beginning of Period | | $ | 9.76 | | | $ | 9.94 | | | $ | 10.13 | | | $ | 9.90 | | | $ | 9.78 | | |
Income (Loss) from Investment Operations: | |
Net Investment Income(2) | | | 0.55 | | | | 0.60 | | | | 0.61 | | | | 0.67 | | | | 0.64 | | |
Net Realized and Unrealized Gain (Loss) | | | (0.58 | ) | | | (0.20 | ) | | | (0.16 | ) | | | 0.20 | | | | 0.12 | | |
Total from Investment Operations | | | (0.03 | ) | | | 0.40 | | | | 0.45 | | | | 0.87 | | | | 0.76 | | |
Distributions from and/or in Excess of: | |
Net Investment Income | | | (0.56 | ) | | | (0.58 | ) | | | (0.64 | ) | | | (0.64 | ) | | | (0.64 | ) | |
Net Asset Value, End of Period | | $ | 9.17 | | | $ | 9.76 | | | $ | 9.94 | | | $ | 10.13 | | | $ | 9.90 | | |
Total Return(3) | | | (0.22 | )% | | | 4.28 | % | | | 4.64 | % | | | 9.04 | % | | | 8.24 | % | |
Ratios to Average Net Assets and Supplemental Data: | |
Net Assets, End of Period (Thousands) | | $ | 14,595 | | | $ | 24,401 | | | $ | 30,242 | | | $ | 68,878 | | | $ | 59,139 | | |
Ratio of Expenses Before Expense Limitation | | | 1.31 | % | | | 1.23 | % | | | 1.29 | % | | | 1.34 | % | | | 1.33 | % | |
Ratio of Expenses After Expense Limitation | | | 1.00 | %(4) | | | 0.99 | %(4) | | | 1.00 | %(4) | | | 1.01 | %(4) | | | 1.02 | %(4)(5) | |
Ratio of Expenses After Expense Limitation Excluding Non-Operating Expenses | | | 1.00 | %(4) | | | 0.99 | %(4) | | | 1.00 | %(4) | | | 1.00 | %(4) | | | N/A | | |
Ratio of Net Investment Income | | | 5.87 | %(4) | | | 6.17 | %(4) | | | 6.14 | %(4) | | | 6.65 | %(4) | | | 6.76 | %(4)(5) | |
Ratio of Rebate from Morgan Stanley Affiliates | | | 0.00 | %(6) | | | 0.00 | %(6) | | | 0.00 | %(6) | | | 0.00 | %(6) | | | 0.00 | %(6) | |
Portfolio Turnover Rate | | | 69 | % | | | 42 | % | | | 39 | % | | | 73 | % | | | 74 | % | |
(1) Reflects prior period custodian out-of-pocket expenses that were reimbursed in September 2016. The amount of the reimbursement was immaterial on a per share basis and did not impact the total return of Class A shares. The Ratio of Expenses After Expense Limitation and the Ratio of Net Investment Income would be unchanged as the reimbursement of custodian fees was offset against expense waivers/reimbursements with no impact to net expenses or net investment income.
(2) Per share amount is based on average shares outstanding.
(3) Calculated based on the net asset value which does not reflect sales charges, if applicable, as of the last business day of the period.
(4) The Ratio of Expenses After Expense Limitation and Ratio of Net Investment Income reflect the rebate of certain Fund expenses in connection with the investments in Morgan Stanley affiliates during the period. The effect of the rebate on the ratios is disclosed in the above table as "Ratio of Rebate from Morgan Stanley Affiliates."
(5) Effective January 4, 2016, the Adviser has agreed to limit the ratio of expenses to average net assets to the maximum ratio of 1.00% for Class A shares. Prior to January 4, 2016, the maximum ratio was 1.10% for Class A shares.
(6) Amount is less than 0.005%.
The accompanying notes are an integral part of the financial statements.
21
Morgan Stanley Institutional Fund Trust
Annual Report — September 30, 2020
Financial Highlights
High Yield Portfolio
| | | Class L | |
| | | Year Ended September 30, | |
Selected Per Share Data and Ratios | | 2020 | | 2019 | | 2018 | | 2017 | | 2016(1) | |
Net Asset Value, Beginning of Period | | $ | 9.76 | | | $ | 9.94 | | | $ | 10.13 | | | $ | 9.91 | | | $ | 9.78 | | |
Income (Loss) from Investment Operations: | |
Net Investment Income(2) | | | 0.52 | | | | 0.57 | | | | 0.59 | | | | 0.64 | | | | 0.62 | | |
Net Realized and Unrealized Gain (Loss) | | | (0.58 | ) | | | (0.19 | ) | | | (0.16 | ) | | | 0.19 | | | | 0.13 | | |
Total from Investment Operations | | | (0.06 | ) | | | 0.38 | | | | 0.43 | | | | 0.83 | | | | 0.75 | | |
Distributions from and/or in Excess of: | |
Net Investment Income | | | (0.53 | ) | | | (0.56 | ) | | | (0.62 | ) | | | (0.61 | ) | | | (0.62 | ) | |
Net Asset Value, End of Period | | $ | 9.17 | | | $ | 9.76 | | | $ | 9.94 | | | $ | 10.13 | | | $ | 9.91 | | |
Total Return(3) | | | (0.46 | )% | | | 4.06 | % | | | 4.37 | % | | | 8.75 | % | | | 7.95 | % | |
Ratios to Average Net Assets and Supplemental Data: | |
Net Assets, End of Period (Thousands) | | $ | 425 | | | $ | 468 | | | $ | 504 | | | $ | 502 | | | $ | 628 | | |
Ratio of Expenses Before Expense Limitation | | | 1.91 | % | | | 1.86 | % | | | 1.91 | % | | | 1.90 | % | | | 1.83 | % | |
Ratio of Expenses After Expense Limitation | | | 1.25 | %(4) | | | 1.25 | %(4) | | | 1.25 | %(4) | | | 1.26 | %(4) | | | 1.28 | %(4)(5) | |
Ratio of Expenses After Expense Limitation Excluding Non-Operating Expenses | | | 1.25 | %(4) | | | 1.25 | %(4) | | | 1.25 | %(4) | | | 1.25 | %(4) | | | N/A | | |
Ratio of Net Investment Income | | | 5.60 | %(4) | | | 5.93 | %(4) | | | 5.90 | %(4) | | | 6.40 | %(4) | | | 6.51 | %(4)(5) | |
Ratio of Rebate from Morgan Stanley Affiliates | | | 0.00 | %(6) | | | 0.00 | %(6) | | | 0.00 | %(6) | | | 0.00 | %(6) | | | 0.00 | %(6) | |
Portfolio Turnover Rate | | | 69 | % | | | 42 | % | | | 39 | % | | | 73 | % | | | 74 | % | |
(1) Reflects prior period custodian out-of-pocket expenses that were reimbursed in September 2016. The amount of the reimbursement was immaterial on a per share basis and did not impact the total return of Class L shares. The Ratio of Expenses After Expense Limitation and the Ratio of Net Investment Income would be unchanged as the reimbursement of custodian fees was offset against expense waivers/reimbursements with no impact to net expenses or net investment income.
(2) Per share amount is based on average shares outstanding.
(3) Calculated based on the net asset value as of the last business day of the period.
(4) The Ratio of Expenses After Expense Limitation and Ratio of Net Investment Income reflect the rebate of certain Fund expenses in connection with the investments in Morgan Stanley affiliates during the period. The effect of the rebate on the ratios is disclosed in the above table as "Ratio of Rebate from Morgan Stanley Affiliates."
(5) Effective January 4, 2016, the Adviser has agreed to limit the ratio of expenses to average net assets to the maximum ratio of 1.25% for Class L shares. Prior to January 4, 2016, the maximum ratio was 1.35% for Class L shares.
(6) Amount is less than 0.005%.
The accompanying notes are an integral part of the financial statements.
22
Morgan Stanley Institutional Fund Trust
Annual Report — September 30, 2020
Financial Highlights
High Yield Portfolio
| | | Class C | |
| | | Year Ended September 30, | |
Selected Per Share Data and Ratios | | 2020 | | 2019 | | 2018 | | 2017 | | 2016(1) | |
Net Asset Value, Beginning of Period | | $ | 9.75 | | | $ | 9.93 | | | $ | 10.12 | | | $ | 9.89 | | | $ | 9.78 | | |
Income (Loss) from Investment Operations: | |
Net Investment Income(2) | | | 0.46 | | | | 0.52 | | | | 0.54 | | | | 0.59 | | | | 0.57 | | |
Net Realized and Unrealized Gain (Loss) | | | (0.56 | ) | | | (0.19 | ) | | | (0.16 | ) | | | 0.20 | | | | 0.12 | | |
Total from Investment Operations | | | (0.10 | ) | | | 0.33 | | | | 0.38 | | | | 0.79 | | | | 0.69 | | |
Distributions from and/or in Excess of: | |
Net Investment Income | | | (0.49 | ) | | | (0.51 | ) | | | (0.57 | ) | | | (0.56 | ) | | | (0.58 | ) | |
Net Asset Value, End of Period | | $ | 9.16 | | | $ | 9.75 | | | $ | 9.93 | | | $ | 10.12 | | | $ | 9.89 | | |
Total Return(3) | | | (0.93 | )% | | | 3.55 | % | | | 3.91 | % | | | 8.24 | % | | | 7.47 | % | |
Ratios to Average Net Assets and Supplemental Data: | |
Net Assets, End of Period (Thousands) | | $ | 7,633 | | | $ | 5,226 | | | $ | 5,811 | | | $ | 3,585 | | | $ | 2,908 | | |
Ratio of Expenses Before Expense Limitation | | | 2.02 | % | | | 1.98 | % | | | 2.01 | % | | | 2.09 | % | | | 2.12 | % | |
Ratio of Expenses After Expense Limitation | | | 1.74 | %(4) | | | 1.74 | %(4) | | | 1.73 | %(4) | | | 1.76 | %(4) | | | 1.77 | %(4)(5) | |
Ratio of Expenses After Expense Limitation Excluding Non-Operating Expenses | | | 1.74 | %(4) | | | 1.74 | %(4) | | | 1.73 | %(4) | | | 1.75 | %(4) | | | N/A | | |
Ratio of Net Investment Income | | | 5.06 | %(4) | | | 5.43 | %(4) | | | 5.41 | %(4) | | | 5.90 | %(4) | | | 6.00 | %(4)(5) | |
Ratio of Rebate from Morgan Stanley Affiliates | | | 0.00 | %(6) | | | 0.00 | %(6) | | | 0.00 | %(6) | | | 0.00 | %(6) | | | 0.00 | %(6) | |
Portfolio Turnover Rate | | | 69 | % | | | 42 | % | | | 39 | % | | | 73 | % | | | 74 | % | |
(1) Reflects prior period custodian out-of-pocket expenses that were reimbursed in September 2016. The amount of the reimbursement was immaterial on a per share basis and did not impact the total return of Class C shares. The Ratio of Expenses After Expense Limitation and the Ratio of Net Investment Income would be unchanged as the reimbursement of custodian fees was offset against expense waivers/reimbursements with no impact to net expenses or net investment income.
(2) Per share amount is based on average shares outstanding.
(3) Calculated based on the net asset value which does not reflect sales charges, if applicable, as of the last business day of the period.
(4) The Ratio of Expenses After Expense Limitation and Ratio of Net Investment Income reflect the rebate of certain Fund expenses in connection with the investments in Morgan Stanley affiliates during the period. The effect of the rebate on the ratios is disclosed in the above table as "Ratio of Rebate from Morgan Stanley Affiliates."
(5) Effective January 4, 2016, the Adviser has agreed to limit the ratio of expenses to average net assets to the maximum ratio of 1.75% for Class C shares. Prior to January 4, 2016, the maximum ratio was 1.85% for Class C shares.
(6) Amount is less than 0.005%.
The accompanying notes are an integral part of the financial statements.
23
Morgan Stanley Institutional Fund Trust
Annual Report — September 30, 2020
Financial Highlights
High Yield Portfolio
| | | Class IS | |
| | | Year Ended September 30, | |
Selected Per Share Data and Ratios | | 2020 | | 2019 | | 2018 | | 2017 | | 2016(1) | |
Net Asset Value, Beginning of Period | | $ | 9.78 | | | $ | 9.96 | | | $ | 10.15 | | | $ | 9.92 | | | $ | 9.79 | | |
Income (Loss) from Investment Operations: | |
Net Investment Income(2) | | | 0.55 | | | | 0.64 | | | | 0.65 | | | | 0.69 | | | | 0.67 | | |
Net Realized and Unrealized Gain (Loss) | | | (0.55 | ) | | | (0.20 | ) | | | (0.16 | ) | | | 0.21 | | | | 0.14 | | |
Total from Investment Operations | | | 0.00 | | | | 0.44 | | | | 0.49 | | | | 0.90 | | | | 0.81 | | |
Distributions from and/or in Excess of: | |
Net Investment Income | | | (0.59 | ) | | | (0.62 | ) | | | (0.68 | ) | | | (0.67 | ) | | | (0.68 | ) | |
Net Asset Value, End of Period | | $ | 9.19 | | | $ | 9.78 | | | $ | 9.96 | | | $ | 10.15 | | | $ | 9.92 | | |
Total Return(3) | | | 0.18 | % | | | 4.71 | % | | | 5.04 | % | | | 9.43 | % | | | 8.75 | % | |
Ratios to Average Net Assets and Supplemental Data: | |
Net Assets, End of Period (Thousands) | | $ | 5,471 | | | $ | 301 | | | $ | 865 | | | $ | 560 | | | $ | 13,789 | | |
Ratio of Expenses Before Expense Limitation | | | 0.94 | % | | | 1.11 | % | | | 1.15 | % | | | 0.99 | % | | | 0.93 | % | |
Ratio of Expenses After Expense Limitation | | | 0.62 | %(4) | | | 0.62 | %(4) | | | 0.62 | %(4) | | | 0.62 | %(4) | | | 0.62 | %(4)(5) | |
Ratio of Expenses After Expense Limitation Excluding Non-Operating Expenses | | | 0.62 | %(4) | | | 0.62 | %(4) | | | 0.62 | %(4) | | | 0.62 | %(4) | | | N/A | | |
Ratio of Net Investment Income | | | 6.20 | %(4) | | | 6.55 | %(4) | | | 6.52 | %(4) | | | 6.93 | %(4) | | | 7.05 | %(4)(5) | |
Ratio of Rebate from Morgan Stanley Affiliates | | | 0.00 | %(6) | | | 0.00 | %(6) | | | 0.00 | %(6) | | | 0.00 | %(6) | | | 0.00 | %(6) | |
Portfolio Turnover Rate | | | 69 | % | | | 42 | % | | | 39 | % | | | 73 | % | | | 74 | % | |
(1) Reflects prior period custodian out-of-pocket expenses that were reimbursed in September 2016. The amount of the reimbursement was immaterial on a per share basis and did not impact the total return of Class IS shares. The Ratio of Expenses After Expense Limitation and the Ratio of Net Investment Income would be unchanged as the reimbursement of custodian fees was offset against expense waivers/reimbursements with no impact to net expenses or net investment income.
(2) Per share amount is based on average shares outstanding.
(3) Calculated based on the net asset value as of the last business day of the period.
(4) The Ratio of Expenses After Expense Limitation and Ratio of Net Investment Income reflect the rebate of certain Fund expenses in connection with the investments in Morgan Stanley affiliates during the period. The effect of the rebate on the ratios is disclosed in the above table as "Ratio of Rebate from Morgan Stanley Affiliates."
(5) Effective January 4, 2016, the Adviser has agreed to limit the ratio of expenses to average net assets to the maximum ratio of 0.62% for Class IS shares. Prior to January 4, 2016, the maximum ratio was 0.72% for Class IS shares.
(6) Amount is less than 0.005%.
The accompanying notes are an integral part of the financial statements.
24
Morgan Stanley Institutional Fund Trust
Annual Report — September 30, 2020
Financial Highlights
High Yield Portfolio
| | | Class IR | |
| | | Year Ended September 30, | | Period from
June 15, 2018(1) to | |
Selected Per Share Data and Ratios | | 2020 | | 2019 | | September 30, 2018 | |
Net Asset Value, Beginning of Period | | $ | 9.78 | | | $ | 9.96 | | | $ | 9.93 | | |
Income (Loss) from Investment Operations: | |
Net Investment Income(2) | | | 0.52 | | | | 0.56 | | | | 0.16 | | |
Net Realized and Unrealized Gain (Loss) | | | (0.52 | ) | | | (0.12 | ) | | | 0.03 | | |
Total from Investment Operations | | | 0.00 | | | | 0.44 | | | | 0.19 | | |
Distributions from and/or in Excess of: | |
Net Investment Income | | | (0.59 | ) | | | (0.62 | ) | | | (0.16 | ) | |
Net Asset Value, End of Period | | $ | 9.19 | | | $ | 9.78 | | | $ | 9.96 | | |
Total Return(3) | | | 0.18 | % | | | 4.71 | % | | | 1.92 | %(6) | |
Ratios to Average Net Assets and Supplemental Data: | |
Net Assets, End of Period, (Thousands) | | $ | 10 | | | $ | 10 | | | $ | 10 | | |
Ratio of Expenses Before Expense Limitation | | | 20.43 | % | | | 20.17 | % | | | 18.62 | %(7) | |
Ratio of Expenses After Expense Limitation | | | 0.62 | %(4) | | | 0.62 | %(4) | | | 0.62 | %(4)(7) | |
Ratios of Expenses After Expense Limitation Excluding Non-Operating Expenses | | | 0.62 | %(4) | | | 0.62 | %(4) | | | 0.62 | %(4)(7) | |
Ratio of Net Investment Income | | | 5.70 | %(4) | | | 5.80 | %(4) | | | 5.75 | %(4)(7) | |
Ratio of Rebate from Morgan Stanley Affiliates | | | 0.00 | %(5) | | | 0.00 | %(5) | | | 0.00 | %(5)(7) | |
Portfolio Turnover Rate | | | 69 | % | | | 42 | % | | | 39 | %(6) | |
(1) Commencement of Offering
(2) Per share amount is based on average shares outstanding
(3) Calculated based on the net asset value as of the last business day of the period.
(4) The Ratio of Expenses After Expense Limitation and Ratio of Net Investment Income reflect the rebate of certain Fund expenses in connection with the investments in Morgan Stanley affiliates during the period. The effect of the rebate on the ratios is disclosed in the above table as "Ratio of Rebate from Morgan Stanley Affiliates
(5) Amount is less than $0.005 per share.
(6) Not annualized.
(7) Annualized.
The accompanying notes are an integral part of the financial statements.
25
Morgan Stanley Institutional Fund Trust
Annual Report — September 30, 2020
Notes to Financial Statements
Morgan Stanley Institutional Fund Trust ("Trust'') is registered under the Investment Company Act of 1940, as amended (the "Act"), as an open-end management investment company. The Trust is comprised of twelve separate, active funds (individually referred to as a "Fund," collectively as the "Funds"). The Trust applies investment company accounting and reporting guidance. All Funds are considered diversified for purposes of the Act.
The accompanying financial statements relate to the High Yield Portfolio. The Fund seeks total return. The Fund offers six classes of shares — Class I, Class A, Class L, Class C, Class IS and Class IR.
The Fund has suspended offering Class L shares for sale to all investors. Class L shareholders of the Fund do not have the option to purchasing additional Class L shares. However, existing Class L shareholders may invest in additional Class L shares through reinvestment of dividends and distributions.
A. Significant Accounting Policies: The following significant accounting policies are in conformity with U.S. generally accepted accounting principles ("GAAP"). Such policies are consistently followed by the Trust in the preparation of its financial statements. GAAP may require management to make estimates and assumptions that affect the reported amounts and disclosures in the financial statements. Actual results may differ from those estimates.
In March 2017, the Financial Accounting Standards Board ("FASB") issued an Accounting Standard Update, ASU 2017-08, Receivables-Nonrefundable Fees and Other Costs (Subtopic 310-20), Premium Amortization on Purchased Callable Debt Securities ("ASU 2017-08") which amends the amortization period for certain purchased callable debt securities held at a premium, shortening such period to the earliest call date. ASU 2017-08 does not require any accounting change for debt securities held at a discount; the discount continues to be accreted to maturity. ASU 2017-08 is effective for fiscal years, and interim periods within those fiscal years, beginning after December 15, 2018. The adoption resulted in a change in accounting principle, since the Fund had historically amortized such premiums to maturity for U.S. GAAP. Accordingly, the Fund has adopted ASU 2017-08 to amend the premium amortization period for certain purchased callable debt securities with non-contingent call features to the earliest call date. It is impracticable to evaluate the effect on individual prior periods, therefore the Fund applied the amendments on a modified retrospective basis by recognizing a cumulative effect adjustment
that decreased the beginning of period cost of investments and increased the unrealized appreciation on investments of approximately $84,000.
This change in accounting policy has been made to comply with the newly issued accounting standard and had no impact on total accumulated earnings (loss) or the net asset value of the Fund. With respect to the Fund's results of operations, amortization of premium to first call date accelerates amortization with the intent of more closely aligning the recognition of income on such bonds with the economics of the instrument.
In March 2020, FASB issued an Accounting Standard Update, ASU 2020-04, Reference Rate Reform (Topic 848) — Facilitation of the Effects of Reference Rate Reform on Financial Reporting ("ASU 2020-04"), which provides optional, temporary relief with respect to the financial reporting of contracts subject to certain types of modifications due to the planned discontinuation of the London Interbank Offered Rate ("LIBOR") and other IBOR-based reference rates at the end of 2021. The temporary relief provided by ASU 2020-04 is effective for certain reference rate-related contract modifications that occur during the period from March 12, 2020 through December 31, 2022. Management is evaluating the impact of ASU 2020-04 on the Fund's investments, derivatives, debt and other contracts that will undergo reference rate-related modifications as a result of the reference rate reform.
1. Security Valuation: (1) Certain portfolio securities may be valued by an outside pricing service/vendor approved by the Trust's Board of Trustees (the "Trustees"). The pricing service/vendor may employ a pricing model that takes into account, among other things, bids, yield spreads and/or other market data and specific security characteristics. Alternatively, if a valuation is not available from an outside pricing service/vendor, and the security trades on an exchange, the security may be valued at its latest reported sale price (or at the exchange official closing price if such exchange reports an official closing price), prior to the time when assets are valued. If there are no sales on a given day and if there is no official exchange closing price for that day, the security is valued at the mean between the last reported bid and asked prices if such bid and asked prices are available in the relevant exchanges. If only bid prices are available then the latest bid price may be used. If Morgan Stanley Investment Management Inc. (the "Adviser"), a wholly-owned subsidiary of Morgan Stanley, determines that the price provided by the outside pricing service/vendor or exchange does not reflect the security's
26
Morgan Stanley Institutional Fund Trust
Annual Report — September 30, 2020
Notes to Financial Statements (cont'd)
fair value or is unable to provide a price, prices from brokers or dealers may also be utilized. In these circumstances, the value of the security will be the mean of bid and asked prices obtained from brokers or dealers; (2) an equity portfolio security listed or traded on an exchange is valued at its latest reported sales price (or at the exchange official closing price if such exchange reports an official closing price), and if there were no sales on a given day and if there is no official exchange closing price for that day, the security is valued at the mean between the last reported bid and asked prices if such bid and asked prices are available on the relevant exchanges. If only bid prices are available then the latest bid price may be used. Listed equity securities not traded on the valuation date with no reported bid and asked prices available on the exchange are valued at the mean between the current bid and asked prices obtained from one or more reputable brokers or dealers. In cases where a security is traded on more than one exchange, the security is valued on the exchange designated as the primary market; (3) all other equity portfolio securities for which over-the-counter ("OTC") market quotations are readily available are valued at the latest reported sales price (or at the market official closing price if such market reports an official closing price), and if there was no trading in the security on a given day and if there is no official closing price from relevant markets for that day, the security is valued at the mean between the last reported bid and asked prices if such bid and asked prices are available on the relevant markets. An unlisted equity security that does not trade on the valuation date and for which bid and asked prices from the relevant markets are unavailable is valued at the mean between the current bid and asked prices obtained from one or more reputable brokers or dealers; (4) certain senior collateralized loans ("Senior Loans") are valued based on quotations received from an independent pricing service; (5) when market quotations are not readily available, including circumstances under which the Adviser determines that the closing price, last sale price or the mean between the last reported bid and asked prices are not reflective of a security's market value, portfolio securities are valued at their fair value as determined in good faith under procedures established by and under the general supervision of the Trustees. Occasionally, developments affecting the closing prices of securities and other assets may occur between the times at which valuations of such securities are determined (that is, close of the foreign market on which the securities
trade) and the close of business of the New York Stock Exchange ("NYSE"). If developments occur during such periods that are expected to materially affect the value of such securities, such valuations may be adjusted to reflect the estimated fair value of such securities as of the close of the NYSE, as determined in good faith by the Trustees or by the Adviser using a pricing service and/or procedures approved by the Trustees; and (6) investments in mutual funds, including the Morgan Stanley Institutional Liquidity Funds, are valued at the net asset value ("NAV") as of the close of each business day.
The Trustees have responsibility for determining in good faith the fair value of the investments, and the Trustees may appoint others, such as the Trust's Adviser or a valuation committee, to assist the Trustees in determining fair value and to make the actual calculations pursuant to the fair valuation methodologies previously approved by the Trustees. Under procedures approved by the Trustees, the Trust's Adviser has formed a Valuation Committee whose members are approved by the Trustees. The Valuation Committee provides administration and oversight of the Trust's valuation policies and procedures, which are reviewed at least annually by the Trustees. These procedures allow the Trust to utilize independent pricing services, quotations from securities and financial instrument dealers and other market sources to determine fair value.
2. Fair Value Measurement: FASB Accounting Standards CodificationTM ("ASC") 820, "Fair Value Measurement" ("ASC 820"), defines fair value as the value that the Fund would receive to sell an investment or pay to transfer a liability in a timely transaction with an independent buyer in the principal market, or in the absence of a principal market, the most advantageous market for the investment or liability. ASC 820 establishes a three-tier hierarchy to distinguish between (1) inputs that reflect the assumptions market participants would use in valuing an asset or liability developed based on market data obtained from sources independent of the reporting entity (observable inputs) and (2) inputs that reflect the reporting entity's own assumptions about the assumptions market participants would use in valuing an asset or liability developed based on the best information available in the circumstances (unobservable inputs) and to establish classification of fair value measurements for disclosure purposes. Various inputs are used in determining the value of
27
Morgan Stanley Institutional Fund Trust
Annual Report — September 30, 2020
Notes to Financial Statements (cont'd)
the Fund's investments. The inputs are summarized in the three broad levels listed below:
• Level 1 – unadjusted quoted prices in active markets for identical investments
• Level 2 – other significant observable inputs (including quoted prices for similar investments, interest rates, prepayment speeds, credit risk, etc.)
• Level 3 – significant unobservable inputs including the Fund's own assumptions in determining the fair value of investments. Factors considered in making this determination may include, but are not limited to, information obtained by contacting the issuer, analysts, or the appropriate stock exchange (for exchange-traded securities), analysis of the issuer's financial statements or other available documents and, if necessary, available information concerning other securities in similar circumstances.
The inputs or methodology used for valuing securities are not necessarily an indication of the risk associated with investing in those securities and the determination of the significance of a particular input to the fair value measurement in its entirety requires judgment and considers factors specific to each security.
The following is a summary of the inputs used to value the Fund's investments as of September 30, 2020:
Investment Type | | Level 1
Unadjusted
quoted
prices
(000) | | Level 2
Other
significant
observable
inputs
(000) | | Level 3
Significant
unobservable
inputs
(000) | | Total
(000) | |
Assets: | |
Fixed Income Securities | |
Corporate Bonds | | $ | — | | | $ | 173,757 | | | $ | — | | | $ | 173,757 | | |
Variable Rate Senior
Loan Interests | | | — | | | | 5,864 | | | | — | | | | 5,864 | | |
Total Fixed Income
Securities | | | — | | | | 179,621 | | | | — | | | | 179,621 | | |
Investment Type | | Level 1
Unadjusted
quoted
prices
(000) | | Level 2
Other
significant
observable
inputs
(000) | | Level 3
Significant
unobservable
inputs
(000) | | Total
(000) | |
Common Stocks | |
Auto Components | | $ | — | | | $ | — | † | | $ | — | | | $ | — | † | |
Equity Real Estate
Investment Trusts
(REITs) | | | — | | | | 200 | | | | — | | | | 200 | | |
Machinery | | | — | | | | — | | | | 60 | | | | 60 | | |
Semiconductors &
Semiconductor
Equipment | | | — | | | | 29 | | | | — | | | | 29 | | |
Transportation | | | — | | | | 66 | | | | — | | | | 66 | | |
Total Common Stocks | | | — | | | | 295 | † | | | 60 | | | | 355 | † | |
Warrant | | | — | | | | 35 | | | | — | | | | 35 | | |
Short-Term Investment | |
Investment Company | | | 1,083 | | | | — | | | | — | | | | 1,083 | | |
Total Assets | | $ | 1,083 | | | $ | 179,951 | † | | $ | 60 | | | $ | 181,094 | † | |
† Includes a security valued at zero.
Transfers between investment levels may occur as the markets fluctuate and/or the availability of data used in an investment's valuation changes.
Following is a reconciliation of investments in which significant unobservable inputs (Level 3) were used in determining fair value:
| | | Common
Stock
(000) | |
Beginning Balance | | $ | — | | |
Purchases | | | — | | |
Sales | | | — | | |
Amortization of discount | | | — | | |
Transfers in | | | — | | |
Transfers out | | | — | | |
Corporate actions | | | — | | |
Change in unrealized appreciation (depreciation) | | | 60 | | |
Realized gains (losses) | | | — | | |
Ending Balance | | $ | 60 | | |
Net change in unrealized appreciation (depreciation) from investments
still held as of September 30, 2020 | | $ | 60 | | |
28
Morgan Stanley Institutional Fund Trust
Annual Report — September 30, 2020
Notes to Financial Statements (cont'd)
The following table presents additional information about valuation techniques and inputs used for investments that are measured at fair value and categorized within Level 3 as of September 30, 2020:
| | | Fair Value at
September 30, 2020
(000) | | Valuation
Technique | | Unobservable
Input | | Amount* | | Impact to
Valuation from an
Increase in Input** | |
Common Stock | | | $60 | | | Market Comparable
Companies | | Enterprise Value/
EBITDA | | | 5.1x | | | Increase | |
| | | | | | | Discount for Lack of
Marketability | | | 40.0 | % | | Decrease | |
* Amount is indicative of the weighted average.
** Represents the expected directional change in the fair value of the Level 3 investments that would result from an increase in the corresponding input. A decrease to the unobservable input would have the opposite effect. Significant changes in these inputs could result in significantly higher or lower fair value measurements.
3. Senior Loans: Senior Loans are typically structured by a syndicate of lenders ("Lenders"), one or more of which administers the Senior Loan on behalf of the Lenders ("Agent"). Lenders may sell interests in Senior Loans to third parties ("Participations") or may assign all or a portion of their interest in a Senior Loan to third parties ("Assignments"). Senior Loans are exempt from registration under the Securities Act of 1933. Presently, Senior Loans are not readily marketable and are often subject to restrictions on resale.
4. Structured Investments: The Fund invested a portion of its assets in structured investments. A structured investment is a derivative security designed to offer a return linked to a particular underlying security, currency, commodity or market. Structured investments may come in various forms including notes (such as exchange-traded notes), warrants and options to purchase securities. The Fund will typically use structured investments to gain exposure to a permitted underlying security, currency, commodity or market when direct access to a market is limited or inefficient from a tax or cost standpoint. There can be no assurance that structured investments will trade at the same price or have the same value as the underlying security, currency, commodity or market. Investments in structured investments involve risks including issuer risk, counterparty risk and market risk. Holders of structured investments bear risks of the underlying investment and are subject to issuer or counterparty risk because the Fund is relying on the creditworthiness of such issuer or counterparty and has no rights with respect to the underlying investment. Certain structured investments may be thinly traded or have a limited trading market and may have the effect of increasing the Fund's illiquidity to the extent that
the Fund, at a particular time, may be unable to find qualified buyers for these securities.
5. When-Issued/Delayed Delivery Securities: The Fund purchases and sells when-issued and delayed delivery securities. Securities purchased on a when-issued or delayed delivery basis are purchased for delivery beyond the normal settlement date at a stated price and yield, and no income accrues to the Fund on such securities prior to delivery date. Payment and delivery for when-issued and delayed delivery securities can take place a month or more after the date of the transaction. When the Fund enters into a purchase transaction on a when-issued or delayed delivery basis, securities are available for collateral in an amount at least equal in value to the Fund's commitments to purchase such securities. Purchasing securities on a when-issued or delayed delivery basis may involve a risk that the market price at the time of delivery may be lower than the agreed upon purchase price, in which case there could be an unrealized loss at the time of delivery. Purchasing investments on a when-issued or delayed delivery basis may be considered a form of leverage which may increase the impact that gains (losses) may have on the Fund.
6. Indemnifications: The Trust enters into contracts that contain a variety of indemnifications. The Trust's maximum exposure under these arrangements is unknown. However, the Trust has not had prior claims or losses pursuant to these contracts and expects the risk of loss to be remote.
7. Dividends and Distributions to Shareholders: Dividends and distributions to shareholders are recorded on the ex-dividend date. Dividends from net investment
29
Morgan Stanley Institutional Fund Trust
Annual Report — September 30, 2020
Notes to Financial Statements (cont'd)
income, if any, are declared and paid monthly. Net realized capital gains, if any, are distributed at least annually.
8. Security Transactions, Income and Expenses: Security transactions are accounted for on the trade date (date the order to buy or sell is executed). Realized gains and losses on the sale of investment securities are determined on the specific identified cost method. When the Fund buys an interest in a Senior Loan, it may receive a commitment fee which is paid to lenders on an ongoing basis based upon the undrawn portion committed by the lenders of the underlying Senior Loan. The Fund accrues the commitment fee over the expected term of the loan. When the Fund sells an interest in a Senior Loan, it may be required to pay fees or commissions to the purchaser of the interest. Fees received in connection with loan amendments are accrued as earned. Dividend income and other distributions are recorded on the ex-dividend date (except for certain foreign dividends which may be recorded as soon as the Fund is informed of such dividends) net of applicable withholding taxes. Interest income is recognized on the accrual basis except where collection is in doubt. Discounts are accreted and premiums are amortized over the life of the respective securities. Most expenses of the Fund can be directly attributed to a particular Fund. Expenses which cannot be directly attributed are apportioned among the Funds based upon relative net assets or other appropriate methods. Income, expenses (other than class specific expenses — distribution and shareholder services, transfer agency and sub transfer agency fees) and realized and unrealized gains or losses are allocated to each class of shares based upon their relative net assets.
The Fund owns shares of real estate investment trusts ("REITs") which report information on the source of their distributions annually in the following calendar year. A portion of distributions received from REITs during the year is estimated to be a return of capital and is recorded as a reduction of their cost.
B. Advisory Fees: The Adviser, a wholly-owned subsidiary of Morgan Stanley, provides the Fund with advisory services under the terms of an Investment Advisory Agreement, paid quarterly, at an annual rate of 0.60% of the average daily net assets of the Fund.
The Adviser has agreed to reduce its advisory fee and/or reimburse the Fund so that total annual Fund operating expenses,
excluding certain investment related expenses, taxes, interest and other extraordinary expenses (including litigation), will not exceed 0.65% for Class I shares, 1.00% for Class A shares, 1.25% for Class L shares, 1.75% for Class C shares, 0.62% for Class IS shares and 0.62% for Class IR shares. The fee waivers and/or expense reimbursements will continue for at least one year from the date of the Fund's prospectus or until such time as the Trustees act to discontinue all or a portion of such waivers and/or reimbursements when they deem such action is appropriate. For the year ended September 30, 2020, approximately $522,000 of advisory fees were waived and approximately $163,000 of other expenses were reimbursed by the Adviser pursuant to this arrangement.
C. Administration Fees: The Adviser also serves as Administrator to the Trust and provides administrative services pursuant to an Administration Agreement for an annual fee, accrued daily and paid monthly, of 0.08% of the Fund's average daily net assets. Under a Sub-Administration Agreement between the Administrator and State Street Bank and Trust Company ("State Street"), State Street provides certain administrative services to the Trust. For such services, the Administrator pays State Street a portion of the fee the Administrator receives from the Fund.
D. Distribution and Shareholder Services Fees: Morgan Stanley Distribution, Inc. ("MSDI" or the "Distributor"), a wholly-owned subsidiary of the Adviser, and an indirect subsidiary of Morgan Stanley, serves as the Trust's Distributor of Fund shares pursuant to a Distribution Agreement. The Trust has adopted a Shareholder Services Plan with respect to Class A shares pursuant to Rule 12b-1 under the Act. Under the Shareholder Services Plan, the Fund pays the Distributor a shareholder services fee, accrued daily and paid monthly, at an annual rate of 0.25% of the Fund's average daily net assets attributable to Class A shares.
The Trust has adopted a Distribution and Shareholder Services Plan with respect to Class L shares pursuant to Rule 12b-1 under the Act. Under the Distribution and Shareholder Services Plan, the Fund pays the Distributor a distribution fee, accrued daily and paid monthly, at an annual rate of 0.25% and a shareholder services fee, accrued daily and paid monthly, at an annual rate of 0.25% of the Fund's average daily net assets attributable to Class L shares.
The Trust has adopted a Distribution and Shareholder Services Plan with respect to Class C shares pursuant to Rule 12b-1
30
Morgan Stanley Institutional Fund Trust
Annual Report — September 30, 2020
Notes to Financial Statements (cont'd)
under the Act. Under the Distribution and Shareholder Services Plan, the Fund pays the Distributor a distribution fee, accrued daily and paid monthly, at an annual rate of 0.75% and a shareholder services fee, accrued daily and paid monthly, at an annual rate of 0.25% of the Fund's average daily net assets attributable to Class C shares.
The distribution and shareholder services fees are used to support the expenses associated with servicing and maintaining accounts. The Distributor may compensate other parties for providing shareholder support services to investors who purchase Class A, Class L and Class C shares.
E. Dividend Disbursing and Transfer Agent: The Trust's dividend disbursing and transfer agent is DST Asset Manager Solutions, Inc. ("DST"). Pursuant to a Transfer Agency Agreement, the Trust pays DST a fee based on the number of classes, accounts and transactions relating to the Funds of the Trust.
F. Custodian Fees: State Street (the "Custodian") also serves as Custodian for the Trust in accordance with a Custodian Agreement. The Custodian holds cash, securities, and other assets of the Trust as required by the Act. Custody fees are payable monthly based on assets held in custody, investment purchases and sales activity and account maintenance fees, plus reimbursement for certain out-of-pocket expenses.
G. Security Transactions and Transactions with Affiliates: For the year ended September 30, 2020, purchases and sales of investment securities for the Fund, other than long-term U.S. Government securities and short-term investments were approximately $130,680,000 and $142,764,000, respectively. There were no purchases and sales of long-term U.S. Government securities for the year ended September 30, 2020.
The Fund invests in the Institutional Class of the Morgan Stanley Institutional Liquidity Funds — Government Portfolio (the "Liquidity Funds"), an open-end management investment company managed by the Adviser. Advisory fees paid by the Fund are reduced by an amount equal to its pro-rata share of the advisory and administration fees paid by the Fund due to its investment in the Liquidity Funds. For the year ended September 30, 2020, advisory fees paid were reduced by approximately $3,000 relating to the Fund's investment in the Liquidity Funds.
A summary of the Fund's transactions in shares of affiliated investments during the year ended September 30, 2020 is as follows:
Affiliated
Investment
Company | | Value
September 30,
2019
(000) | | Purchases
at Cost
(000) | | Proceeds
from
Sales
(000) | | Dividend
Income
(000) | |
Liquidity Funds | | $ | — | | | $ | 76,179 | | | $ | 75,096 | | | $ | 14 | | |
Affiliated
Investment
Company (cont'd) | | Realized
Gain (Loss)
(000) | | Change in
Unrealized
Appreciation
(Depreciation)
(000) | | Value
September 30,
2020
(000) | |
Liquidity Funds | | $ | — | | | $ | — | | | $ | 1,083 | | |
The Fund is permitted to purchase and sell securities ("cross-trade") from and to other Morgan Stanley funds as well as other funds and client accounts for which the Adviser or an affiliate of the Adviser serves as investment adviser, pursuant to procedures approved by the Trustees in compliance with Rule 17a-7 under the Act (the "Rule"). Each cross-trade is executed at the current market price in compliance with provisions of the Rule. For the year ended September 30, 2020, the Fund did not engage in any cross-trade transactions.
The Fund has an unfunded Deferred Compensation Plan (the "Compensation Plan"), which allows each independent Trustee to defer payment of all, or a portion, of the fees he or she receives for serving on the Board of Trustees. Each eligible Trustee generally may elect to have the deferred amounts credited with a return equal to the total return on one or more of the Morgan Stanley funds that are offered as investment options under the Compensation Plan. Appreciation/depreciation and distributions received from these investments are recorded with an offsetting increase/decrease in the deferred compensation obligation and do not affect the NAV of the Fund.
H. Federal Income Taxes: It is the Fund's intention to continue to qualify as a regulated investment company and distribute all of its taxable and tax-exempt income. Accordingly, no provision for federal income taxes is required in the financial statements.
The Fund may be subject to taxes imposed by countries in which it invests. Such taxes are generally based on income and/or capital gains earned or repatriated. Taxes are accrued based on net investment income, net realized gains and net unrealized appreciation as such income and/or gains are earned. Taxes may also be based on transactions in foreign currency
31
Morgan Stanley Institutional Fund Trust
Annual Report — September 30, 2020
Notes to Financial Statements (cont'd)
and are accrued based on the value of investments denominated in such currency.
FASB ASC 740-10, "Income Taxes — Overall", sets forth a minimum threshold for financial statement recognition of the benefit of a tax position taken or expected to be taken in a tax return. Management has concluded there are no significant uncertain tax positions that would require recognition in the financial statements. If applicable, the Fund recognizes interest accrued related to unrecognized tax benefits in "Interest Expense" and penalties in "Other Expenses" in the Statement of Operations. The Fund files tax returns with the U.S. Internal Revenue Service, New York and various states. Generally, each of the tax years in the four-year period ended September 30, 2020 remains subject to examination by taxing authorities.
The tax character of distributions paid may differ from the character of distributions shown for GAAP purposes due to short-term capital gains being treated as ordinary income for tax purposes. The tax character of distributions paid during fiscal years 2020 and 2019 was as follows:
2020 Distributions
Paid From:
Ordinary Income
(000) | | 2019 Distributions
Paid From:
Ordinary Income
(000) | |
| $ | 11,970 | | | $ | 12,254 | | |
The amount and character of income and gains to be distributed are determined in accordance with income tax regulations which may differ from GAAP. These book/tax differences are either considered temporary or permanent in nature.
Temporary differences are attributable to differing book and tax treatments for the timing of the recognition of gains (losses) on certain investment transactions and the timing of the deductibility of certain expenses.
The Fund had no permanent differences causing reclassifications among the components of net assets for the year ended September 30, 2020.
At September 30, 2020, the components of distributable earnings for the Fund on a tax basis were as follows:
Undistributed
Ordinary
Income
(000) | | Undistributed
Long-Term
Capital Gain
(000) | |
| $ | 1,067 | | | $ | — | | |
At September 30, 2020, the Fund had available for federal income tax purposes unused short-term and long-term capital losses of approximately $2,758,000 and $12,246,000, respectively, that do not have an expiration date.
To the extent that capital loss carryforwards are used to offset any future capital gains realized, no capital gains tax liability will be incurred by the Fund for gains realized and not distributed. To the extent that capital gains are offset, such gains will not be distributed to the shareholders.
I. Credit Facility: The Trust and other Morgan Stanley funds participated in a $300,000,000 committed, unsecured revolving line of credit facility (the "Facility") with State Street. This Facility is to be used for temporary emergency purposes or funding of shareholder redemption requests. The interest rate on borrowings is based on the federal funds rate or 1 month LIBOR rate plus a spread. The Facility also has a commitment fee of 0.25% per annum based on the unused portion of the Facility. During the year ended September 30, 2020, the Fund did not have any borrowings under the Facility.
J. Other: At September 30, 2020, the Fund had record owners of 10% or greater. Investment activities of these shareholders could have a material impact on the Fund. The aggregate percentage of such owners was 60.1%.
K. Market Risk: Certain impacts to public health conditions particular to the coronavirus (COVID-19) outbreak could impact the operations and financial performance of certain of the Fund's investments. The extent of the impact to the financial performance of the Fund's investments will depend on future developments, including (i) the duration and spread of the outbreak, (ii) the restrictions and advisories, (iii) the effects on the financial markets, and (iv) the effects on the economy overall, all of which are highly uncertain and cannot be predicted. If the financial performance of the Fund's investments is impacted because of these factors for an extended period, the Fund's investment results may be adversely affected.
L. LIBOR Risk: The Fund's investments, payment obligations and financing terms may be based on floating rates, such as London Interbank Offer Rate ("LIBOR"), Euro Interbank Offered Rate and other similar types of reference rates (each, a "Reference Rate"). These Reference Rates are generally intended to represent the rate at which contributing banks may obtain short-term borrowings from each other within certain financial markets. On July 27, 2017, the Chief Executive of the UK Financial Conduct Authority ("FCA"), which regulates LIBOR, announced that the FCA will no longer persuade nor require banks to submit rates for the calculation of LIBOR and certain other Reference Rates after 2021. Such announcement indicates that the continuation of LIBOR and other Reference
32
Morgan Stanley Institutional Fund Trust
Annual Report — September 30, 2020
Notes to Financial Statements (cont'd)
Rates on the current basis cannot and will not be guaranteed after the end of 2021. This announcement and any additional regulatory or market changes may have an adverse impact on the Fund or its investments.
In advance of 2022, regulators and market participants are currently engaged in identifying successor Reference Rates ("Alternative Reference Rates"). Additionally, prior to the end of 2021, it is expected that market participants will focus on the transition mechanisms by which the Reference Rates in existing contracts or instruments may be amended, whether through marketwide protocols, fallback contractual provisions,
bespoke negotiations or amendments or otherwise. Nonetheless, the termination of certain Reference Rates presents risks to the Fund. At this time, it is not possible to completely identify or predict the effect of any such changes, any establishment of Alternative Reference Rates or any other reforms to Reference Rates that may be enacted in the UK or elsewhere. The elimination of a Reference Rate or any other changes or reforms to the determination or supervision of Reference Rates could have an adverse impact on the market for or value of any securities or payments linked to those Reference Rates and other financial obligations held by the Fund or on its overall financial condition or results of operations.
33
Morgan Stanley Institutional Fund Trust
Annual Report — September 30, 2020
Report of Independent Registered Public Accounting Firm
To the Shareholders and Board of Trustees of
Morgan Stanley Institutional Fund Trust —
High Yield Portfolio
Opinion on the Financial Statements
We have audited the accompanying statement of assets and liabilities of High Yield Portfolio (the "Fund") (one of the funds constituting Morgan Stanley Institutional Fund Trust (the "Trust")), including the portfolio of investments, as of September 30, 2020, and the related statement of operations for the year then ended, the statements of changes in net assets for each of the two years in the period then ended, the financial highlights for each of the five years in the period then ended and the related notes (collectively referred to as the "financial statements"). In our opinion, the financial statements present fairly, in all material respects, the financial position of the Fund (one of the funds constituting Morgan Stanley Institutional Fund Trust) at September 30, 2020, the results of its operations for the year then ended, the changes in its net assets for each of the two years in the period then ended and its financial highlights for each of the five years in the period then ended, in conformity with U.S. generally accepted accounting principles.
Basis for Opinion
These financial statements are the responsibility of the Trust's management. Our responsibility is to express an opinion on the Fund's financial statements based on our audits. We are a public accounting firm registered with the Public Company Accounting Oversight Board (United States) ("PCAOB") and are required to be independent with respect to the Trust in accordance with the U.S. federal securities law and the applicable rules and regulations of the Securities and Exchange Commission and the PCAOB.
We conducted our audits in accordance with the standards of the PCAOB. Those standards require that we plan and perform the audit to obtain reasonable assurance about whether the financial statements are free of material misstatement, whether due to error or fraud. The Trust is not required to have, nor were we engaged to perform, an audit of the Trust's internal control over financial reporting. As part of our audits we are required to obtain an understanding of internal control over financial reporting but not for the purpose of expressing an opinion on the effectiveness of the Trust's internal control over financial reporting. Accordingly, we express no such opinion.
Our audits included performing procedures to assess the risks of material misstatement of the financial statements, whether due to error or fraud, and performing procedures that respond to those risks. Such procedures included examining, on a test basis, evidence regarding the amounts and disclosures in the financial statements. Our procedures included confirmation of securities owned as of September 30, 2020 by correspondence with the custodian and brokers or by other appropriate auditing procedures where replies from brokers were not received. Our audits also included evaluating the accounting principles used and significant estimates made by management, as well as evaluating the overall presentation of the financial statements. We believe that our audits provide a reasonable basis for our opinion.

We have served as the auditor of one or more Morgan Stanley investment companies since 2000.
Boston, Massachusetts
November 24, 2020
34
Morgan Stanley Institutional Fund Trust
Annual Report — September 30, 2020
Investment Advisory Agreement Approval (unaudited)
Nature, Extent and Quality of Services
The Board reviewed and considered the nature and extent of the investment advisory services provided by the Adviser under the advisory agreement, including portfolio management, investment research and equity and fixed income securities trading. The Board also reviewed and considered the nature and extent of the non-advisory, administrative services provided by the Administrator under the administration agreement, including accounting, operations, clerical, bookkeeping, compliance, business management and planning, legal services and the provision of supplies, office space and utilities at the Adviser's expense. The Board also considered the Adviser's investment in personnel and infrastructure that benefits the Fund. (The Adviser and Administrator together are referred to as the "Adviser" and the advisory and administration agreements together are referred to as the "Management Agreement.") The Board also considered that the Adviser serves a variety of other investment advisory clients and has experience overseeing service providers. The Board also compared the nature of the services provided by the Adviser with similar services provided by non-affiliated advisers as prepared by Broadridge Financial Solutions, Inc. ("Broadridge").
The Board reviewed and considered the qualifications of the portfolio managers, the senior administrative managers and other key personnel of the Adviser who provide the advisory and administrative services to the Fund. The Board determined that the Adviser's portfolio managers and key personnel are well qualified by education and/or training and experience to perform the services in an efficient and professional manner. The Board concluded that the nature and extent of the advisory and administrative services provided were necessary and appropriate for the conduct of the business and investment activities of the Fund and supported its decision to approve the Management Agreement.
Performance, Fees and Expenses of the Fund
The Board reviewed the performance, fees and expenses of the Fund compared to its peers, as prepared by Broadridge, and to appropriate benchmarks where applicable. The Board discussed with the Adviser the performance goals and the actual results achieved in managing the Fund. When considering a fund's performance, the Board and the Adviser place emphasis on trends and longer-term returns (focusing on one-year, three-year and five-year performance, as of December 31, 2019, or since inception, as applicable). When a fund underperforms its benchmark and/or its peer group average, the Board and the Adviser discuss the causes of such underperformance and, where necessary, they discuss specific changes to investment strategy or investment personnel. The Board noted that the Fund's performance was better than its peer group average for the one-, three- and five-year periods. The Board discussed with the Adviser the level of the advisory and administration fees (together, the "management fee") for this Fund relative to comparable funds and/or other accounts advised by the Adviser and/or compared to its peers as prepared by Broadridge. In addition to the management fee, the Board also reviewed the Fund's total expense ratio. When a fund's management fee and/or its total expense ratio are higher than its peers, the Board and the Adviser discuss the reasons for this and, where appropriate, they discuss possible waivers and/or caps. The Board noted that the Fund's contractual management fee was higher than its peer group average and the actual management fee and total expense ratio were lower than its peer group averages. After discussion, the Board concluded that the Fund's performance, management fee and total expense ratio were competitive with its peer group averages.
Economies of Scale
The Board considered the size and growth prospects of the Fund and how that relates to the Fund's total expense ratio and particularly the Fund's management fee rate, which does not include breakpoints. In conjunction with its review of the Adviser's profitability, the Board discussed with the Adviser how a change in assets can affect the efficiency or effectiveness of managing the Fund and whether the management fee level is appropriate relative to current and projected asset levels and/or whether the management fee structure reflects economies of scale as asset levels change. The Board has determined that its review of the actual and/or potential economies of scale of the Fund supports its decision to approve the Management Agreement.
Profitability of the Adviser and Affiliates
The Board considered information concerning the costs incurred and profits realized by the Adviser and its affiliates during the last year from their relationship with the Fund and during the last two years from their relationship with the Morgan Stanley Fund Complex and reviewed with the Adviser the cost allocation methodology used to determine the profitability of the Adviser and affiliates. The Board has determined that its review of the analysis of the Adviser's expenses and profitability supports its decision to approve the Management Agreement.
35
Morgan Stanley Institutional Fund Trust
Annual Report — September 30, 2020
Investment Advisory Agreement Approval (unaudited) (cont'd)
Other Benefits of the Relationship
The Board considered other direct and indirect benefits to the Adviser and/or its affiliates derived from their relationship with the Fund and other funds advised by the Adviser. These benefits may include, among other things, fees for trading, distribution and/or shareholder servicing and for transaction processing and reporting platforms used by securities lending agents, and research received by the Adviser generated from commission dollars spent on funds' portfolio trading. The Board reviewed with the Adviser these arrangements and the reasonableness of the Adviser's costs relative to the services performed. The Board has determined that its review of the other benefits received by the Adviser or its affiliates supports its decision to approve the Management Agreement.
Resources of the Adviser and Historical Relationship Between the Fund and the Adviser
The Board considered whether the Adviser is financially sound and has the resources necessary to perform its obligations under the Management Agreement. The Board also reviewed and considered the historical relationship between the Fund and the Adviser, including the organizational structure of the Adviser, the policies and procedures formulated and adopted by the Adviser for managing the Fund's operations and the Board's confidence in the competence and integrity of the senior managers and key personnel of the Adviser. The Board concluded that the Adviser has the financial resources necessary to fulfill its obligations under the Management Agreement and that it is beneficial for the Fund to continue its relationship with the Adviser.
Other Factors and Current Trends
The Board considered the controls and procedures adopted and implemented by the Adviser and monitored by the Fund's Chief Compliance Officer and concluded that the conduct of business by the Adviser indicates a good faith effort on its part to adhere to high ethical standards in the conduct of the Fund's business.
As part of the Board's review, the Board received information from management on the impact of COVID-19 on the firm generally and the Adviser and the Fund in particular including, among other information, the pandemic's current and expected impact on the Fund's performance and operations.
General Conclusion
After considering and weighing all of the above factors, with various written materials and verbal information presented by the Adviser, the Board concluded that it would be in the best interest of the Fund and its shareholders to approve renewal of the Management Agreement for another year. In reaching this conclusion the Board did not give particular weight to any single piece of information or factor referenced above. The Board considered these factors and information over the course of the year and in numerous meetings, some of which were in executive session with only the independent Board members and their counsel present. It is possible that individual Board members may have weighed these factors, and the information presented, differently in reaching their individual decisions to approve the Management Agreement.
36
Morgan Stanley Institutional Fund Trust
Annual Report — September 30, 2020
Liquidity Risk Management Program (unaudited)
In compliance with Rule 22e-4 under the Investment Company Act of 1940, as amended (the "Liquidity Rule"), the Fund has adopted and implemented a liquidity risk management program (the "Program"), which is reasonably designed to assess and manage the risk that the Fund could not meet requests to redeem shares issued by the Fund without significant dilution of remaining investors' interests in the Fund (i.e., liquidity risk). The Fund's Board of Trustees (the "Board") previously approved the designation of the Liquidity Risk Subcommittee (the "LRS") as Program administrator. The LRS is comprised of representatives from various divisions within Morgan Stanley Investment Management.
At a meeting held on April 22-23, 2020, the Board reviewed a written report prepared by the LRS that addressed the Program's operation and assessed its adequacy, and effectiveness of implementation for the period from December 1, 2018, through December 31, 2019, as required under the Liquidity Rule. The report concluded that the Program operated effectively and was adequately and effectively implemented in all material aspects, and that the relevant controls and safeguards were appropriately designed to enable the LRS to administer the Program in compliance with the Liquidity Rule.
In accordance with the Program, the LRS assessed each Fund's liquidity risk no less frequently than annually taking into consideration certain factors, as applicable, such as (i) investment strategy and liquidity of portfolio investments, (ii) short-term and long-term cash flow projections and (iii) holdings of cash and cash equivalents and borrowing arrangements and other funding sources. Certain factors are considered under both normal and reasonably foreseeable stressed conditions.
Each Fund portfolio investment is classified into one of four liquidity categories, which classification is assessed at least monthly by the LRS. The classification is based on a determination of the number of days it is reasonably expected to take to convert the investment into cash, or sell or dispose of the investment, in current market conditions without significantly changing the market value of the investment. Liquidity classification determinations take into account various market, trading and investment-specific considerations, as well as market depth, and in some cases utilize third-party vendor data.
The Liquidity Rule limits a fund's investments in illiquid investments to 15% of its net assets and requires funds that do not primarily hold assets that are highly liquid investments to determine and maintain a minimum percentage of the fund's net assets to be invested in highly liquid investments (highly liquid investment minimum or "HLIM"). The LRS believes that the Program includes provisions reasonably designed to review, monitor and comply with the 15% limit on illiquid investments and for determining, periodically reviewing and complying with the HLIM requirement, as applicable.
There can be no assurance that the Program will achieve its objectives under all circumstances in the future. Please refer to the Fund's prospectus for more information regarding the Fund's exposure to liquidity risk and other risks to which it may be subject.
37
Morgan Stanley Institutional Fund Trust
Annual Report — September 30, 2020
Privacy Notice (unaudited) April 2019
FACTS | | WHAT DOES MSIM DO WITH YOUR PERSONAL INFORMATION? | |
Why? | | Financial companies choose how they share your personal information. Federal law gives consumers the right to limit some but not all sharing. Federal law also requires us to tell you how we collect, share, and protect your personal information. Please read this notice carefully to understand what we do. | |
What? | | The types of personal information we collect and share depend on the product or service you have with us. This information can include:
n Social Security number and income
n investment experience and risk tolerance
n checking account number and wire transfer instructions | |
How? | | All financial companies need to share customers' personal information to run their everyday business. In the section below, we list the reasons financial companies can share their customers' personal information; the reasons MSIM chooses to share; and whether you can limit this sharing. | |
Reasons we can share your personal information | | Does MSIM share? | | Can you limit this sharing? | |
For our everyday business purposes —
such as to process your transactions, maintain your account(s), respond to court orders and legal investigations, or report to credit bureaus | | Yes | | No | |
For our marketing purposes —
to offer our products and services to you | | Yes | | No | |
For joint marketing with other financial companies | | No | | We don't share | |
For our affiliates' everyday business purposes —
information about your transactions and experiences | | Yes | | No | |
For our affiliates' everyday business purposes —
information about your creditworthiness | | No | | We don't share | |
For our affiliates to market to you | | No | | We don't share | |
For non-affiliates to market to you | | No | | We don't share | |
Questions? Call toll-free (844) 312-6327 or email: imprivacyinquiries@morganstanley.com
38
Morgan Stanley Institutional Fund Trust
Annual Report — September 30, 2020
Privacy Notice (unaudited) (cont'd) April 2019
Who we are
Who is providing this notice? | | Morgan Stanley Investment Management, Inc. and its affiliated registered investment advisers, registered broker-dealers, and registered and unregistered funds ("MSIM") | |
What we do
How does MSIM protect my personal information? | | To protect your personal information from unauthorized access and use, we use security measures that comply with federal law. These measures include computer safeguards and secured files and buildings. We have policies governing the proper handling of customer information by personnel and requiring third parties that provide support to adhere to appropriate security standards with respect to such information. | |
How does MSIM collect my personal information? | | We collect your personal information, for example, when you
n open an account or make deposits or withdrawals from your account
n buy securities from us or make a wire transfer
n give us your contact information
We also collect your personal information from others, such as credit bureaus, affiliates, or other companies. | |
Why can't I limit all sharing? | | Federal law gives you the right to limit only
n sharing for affiliates' everyday business purposes — information about your creditworthiness
n affiliates from using your information to market to you
n sharing for non-affiliates to market to you
State laws and individual companies may give you additional rights to limit sharing. See below for more on your rights under state law. | |
Definitions
Affiliates | | Companies related by common ownership or control. They can be financial and non-financial companies.
n Our affiliates include companies with a Morgan Stanley name and financial companies such as Morgan Stanley Smith Barney LLC and Morgan Stanley & Co. | |
Non-affiliates | | Companies not related by common ownership or control. They can be financial and non-financial companies.
n MSIM does not share with non-affiliates so they can market to you. | |
Joint marketing | | A formal agreement between non-affiliated financial companies that together market financial products or services to you.
n MSIM doesn't jointly market | |
Other Important Information
Vermont: Except as permitted by law, we will not share personal information we collect about Vermont residents with Non-affiliates unless you provide us with your written consent to share such information.
California: Except as permitted by law, we will not share personal information we collect about California residents with Non-affiliates and we will limit sharing such personal information with our Affiliates to comply with California privacy laws that apply to us.
39
Morgan Stanley Institutional Fund Trust
Annual Report — September 30, 2020
Trustee and Officer Information (unaudited)
Independent Trustees:
Name, Address and Birth Year
of Independent Trustee | | Position(s)
Held with
Registrant | | Length of Time
Served* | | Principal Occupation(s) During Past 5 Years
and Other Relevant Professional Experience | | Number of
Funds in
Fund Complex
Overseen by
Independent
Trustee** | | Other Directorships
Held by Independent
Trustee*** | |
Frank L. Bowman
c/o Perkins Coie LLP
Counsel to the Independent Trustees
1155 Avenue of the Americas, 22nd Floor
New York, NY 10036
Birth Year 1944 | | Trustee | | Since
August
2006 | | President, Strategic Decisions, LLC (consulting) (since February 2009); Director or Trustee of various Morgan Stanley Funds (since August 2006); Chairperson of the Compliance and Insurance Committee (since October 2015); formerly, Chairperson of the Insurance Sub-Committee of the Compliance and Insurance Committee (2007-2015); served as President and Chief Executive Officer of the Nuclear Energy Institute (policy organization) (February 2005-November 2008); retired as Admiral, U.S. Navy after serving over 38 years on active duty including 8 years as Director of the Naval Nuclear Propulsion Program in the Department of the Navy and the U.S. Department of Energy (1996-2004); served as Chief of Naval Personnel (July 1994-September 1996) and on the Joint Staff as Director of Political Military Affairs (June 1992-July 1994); knighted as Honorary Knight Commander of the Most Excellent Order of the British Empire; awarded the Officier de l'Orde National du Mérite by the French Government; elected to the National Academy of Engineering (2009). | | | 86 | | | Director of Naval and Nuclear Technologies LLP; Director Emeritus of the Armed Services YMCA; Member of the National Security Advisory Council of the Center for U.S. Global Engagement and a member of the CNA Military Advisory Board; Trustee of Fairhaven United Methodist Church; Member of the Board of Advisors of the Dolphin Scholarship Foundation; Director of other various non-profit organizations; Formerly, Director of BP p.l.c. (November 2010-May 2019). | |
Kathleen A. Dennis
c/o Perkins Coie LLP
Counsel to the Independent Trustees
1155 Avenue of the Americas, 22nd Floor
New York, NY 10036
Birth Year 1953 | | Trustee | | Since
August
2006 | | President, Cedarwood Associates (mutual fund and investment management consulting) (since July 2006); Chairperson of the Liquidity and Alternatives Sub-Committee of the Investment Committee (since October 2006) and Director or Trustee of various Morgan Stanley Funds (since August 2006); formerly, Senior Managing Director of Victory Capital Management (1993-2006). | | | 86 | | | Director of various
non-profit organizations. | |
Nancy C. Everett
c/o Perkins Coie LLP
Counsel to the Independent Trustees
1155 Avenue of the Americas, 22nd Floor
New York, NY 10036
Birth Year 1955 | | Trustee | | Since
January
2015 | | Chief Executive Officer, Virginia Commonwealth University Investment Company (since November 2015); Owner, OBIR, LLC (institutional investment management consulting) (since June 2014); formerly, Managing Director, BlackRock, Inc. (February 2011-December 2013); and Chief Executive Officer, General Motors Asset Management (a/k/a Promark Global Advisors, Inc.) (June 2005-May 2010). | | | 87 | | | Formerly, Member of Virginia Commonwealth University School of Business Foundation (2005-2016); Member of Virginia Commonwealth University Board of Visitors (2013-2015); Member of Committee on Directors for Emerging Markets Growth Fund, Inc. (2007-2010); Chairperson of Performance Equity Management, LLC (2006-2010); and Chairperson, GMAM Absolute Return Strategies Fund, LLC (2006-2010). | |
40
Morgan Stanley Institutional Fund Trust
Annual Report — September 30, 2020
Trustee and Officer Information (unaudited) (cont'd)
Independent Trustees: (cont'd)
Name, Address and Birth Year
of Independent Trustee | | Position(s)
Held with
Registrant | | Length of Time
Served* | | Principal Occupation(s) During Past 5 Years
and Other Relevant Professional Experience | | Number of
Funds in
Fund Complex
Overseen by
Independent
Trustee** | | Other Directorships
Held by Independent
Trustee*** | |
Jakki L. Haussler
c/o Perkins Coie LLP
Counsel to the Independent Trustees
1155 Avenue of the Americas, 22nd Floor
New York, NY 10036
Birth Year 1957 | | Trustee | | Since
January
2015 | | Chairman, Opus Capital Group (since January 1996); formerly, Chief Executive Officer, Opus Capital Group (1996-2019); Director, Capvest Venture Fund, LP (May 2000-December 2011); Partner, Adena Ventures, LP (July 1999-December 2010); Director, The Victory Funds (February 2005-July 2008). | | | 87 | | | Director of Service Corporation International and Member, Audit Committee and Investment Committee; Director of Cincinnati Bell Inc. and Member, Audit Committee and Governance and Nominating Committee; Director of Northern Kentucky University Foundation and Member, Investment Committee; Member of Chase College of Law Transactional Law Practice Center Board of Advisors; Director of Chase College of Law Board of Visitors; formerly, Member, University of Cincinnati Foundation Investment Committee; Member, Miami University Board of Visitors (2008-2011); Trustee of Victory Funds (2005-2008) and Chairman, Investment Committee (2007-2008); Member, Service Provider Committee (2005-2008) and Director of Best Transport (2006-2019). | |
Dr. Manuel H. Johnson
c/o Johnson Smick
International, Inc.
220 I Street, NE — Suite 200 Washington, D.C. 20002
Birth Year 1949 | | Trustee | | Since
July
1991 | | Senior Partner, Johnson Smick International, Inc. (consulting firm); Chairperson of the Investment Committee (since October 2006) and Director or Trustee of various Morgan Stanley Funds (since July 1991); Co-Chairman and a founder of the Group of Seven Council (G7C) (international economic commission); formerly, Chairperson of the Audit Committee (July 1991-September 2006), Vice Chairman of the Board of Governors of the Federal Reserve System and Assistant Secretary of the U.S. Treasury. | | | 86 | | | Director of NVR, Inc. (home construction). | |
Joseph J. Kearns
c/o Perkins Coie LLP
Counsel to the Independent Trustees
1155 Avenue of the Americas, 22nd Floor
New York, NY 10036
Birth Year 1942 | | Trustee | | Since
August
1994 | | Senior Adviser, Kearns & Associates LLC (investment consulting); Chairperson of the Audit Committee (since October 2006) and Director or Trustee of various Morgan Stanley Funds (since August 1994); Director, Rubicorn Investments (since February 2019); formerly, Deputy Chairperson of the Audit Committee (July 2003-September 2006) and Chairperson of the Audit Committee of various Morgan Stanley Funds (since August 1994); CFO of the J. Paul Getty Trust (1982-1999). | | | 87 | | | Prior to August 10, 2016, Director of Electro Rent Corporation (equipment leasing); Prior to December 31, 2013, Director of The Ford Family Foundation. | |
41
Morgan Stanley Institutional Fund Trust
Annual Report — September 30, 2020
Trustee and Officer Information (unaudited) (cont'd)
Independent Trustees: (cont'd)
Name, Address and Birth Year
of Independent Trustee | | Position(s)
Held with
Registrant | | Length of Time
Served* | | Principal Occupation(s) During Past 5 Years
and Other Relevant Professional Experience | | Number of
Funds in
Fund Complex
Overseen by
Independent
Trustee** | | Other Directorships
Held by Independent
Trustee*** | |
Michael F. Klein
c/o Perkins Coie LLP
Counsel to the Independent Trustees
1155 Avenue of the Americas, 22nd Floor
New York, NY 10036
Birth Year 1958 | | Trustee | | Since
August
2006 | | Managing Director, Aetos Alternatives Management, LP (since March 2000); Co-President, Aetos Alternatives Management, LP (since January 2004) and Co-Chief Executive Officer of Aetos Alternatives Management, LP (since August 2013); Chairperson of the Fixed Income Sub-Committee of the Investment Committee (since October 2006) and Director or Trustee of various Morgan Stanley Funds (since August 2006); formerly, Managing Director, Morgan Stanley & Co. Inc. and Morgan Stanley Dean Witter Investment Management and President, various Morgan Stanley Funds (June 1998-March 2000); Principal, Morgan Stanley & Co. Inc. and Morgan Stanley Dean Witter Investment Management (August 1997-December 1999). | | | 86 | | | Director of certain investment funds managed or sponsored by Aetos Alternatives Management, LP; Director of Sanitized AG and Sanitized Marketing AG (specialty chemicals). | |
Patricia Maleski
c/o Perkins Coie LLP
Counsel to the Independent Trustees
1155 Avenue of the Americas, 22nd Floor
New York, NY 10036
Birth Year 1960 | | Trustee | | Since
January
2017 | | Managing Director, JPMorgan Asset Management (2004-2016); Oversight and Control Head of Fiduciary and Conflicts of Interest Program (2015-2016); Chief Control Officer-Global Asset Management (2013-2015); President, JPMorgan Funds (2010-2013); Chief Administrative Officer (2004-2013); various other positions including Treasurer and Board Liaison (since 2001). | | | 87 | | | None. | |
W. Allen Reed
c/o Perkins Coie LLP
Counsel to the Independent Trustees
1155 Avenue of the Americas, 22nd Floor
New York, NY 10036
Birth Year 1947 | | Chair of the Board and Trustee | | Chair of the Boards since August 2020 and Trustee since August 2006 | | Chair of the Boards of various Morgan Stanley Funds (since August 2020); Chairperson of the Governance Committee; Chairperson of the Equity Sub-Committee of the Investment Committee (since October 2006) and Director or Trustee of various Morgan Stanley Funds (since August 2006); formerly, Vice Chair of the Boards of various Morgan Stanley Funds (January 2020-August 2020); President and Chief Executive Officer of General Motors Asset Management; Chairman and Chief Executive Officer of the GM Trust Bank and Corporate Vice President of General Motors Corporation (August 1994-December 2005). | | | 86 | | | Formerly, Director of Legg Mason, Inc. (2006-2019); and Director of the Auburn University Foundation (2010-2015). | |
* This is the earliest date the Trustee began serving the Morgan Stanley Funds. Each Trustee serves an indefinite term, until his or her successor is elected.
** The Fund Complex includes (as of December 31, 2019) all open-end and closed-end funds (including all of their portfolios) advised by Morgan Stanley Investment Management Inc. (the "Adviser") and any funds that have an adviser that is an affiliated person of the Adviser (including, but not limited to, Morgan Stanley AIP GP LP).
*** This includes any directorships at public companies and registered investment companies held by the Trustee at any time during the past five years.
42
Morgan Stanley Institutional Fund Trust
Annual Report — September 30, 2020
Trustee and Officer Information (unaudited) (cont'd)
Executive Officers:
Name, Address and Birth Year
of Executive Officer | | Position(s) Held
with
Registrant | | Length of
Time Served* | | Principal Occupation(s) During Past 5 Years | |
John H. Gernon
522 Fifth Avenue
New York, NY 10036
Birth Year 1963 | | President and Principal Executive Officer | | Since September 2013 | | President and Principal Executive Officer of the Equity and Fixed Income Funds and the Morgan Stanley AIP Funds (since September 2013) and the Liquidity Funds and various money market funds (since May 2014) in the Fund Complex; Managing Director of the Adviser; Head of Public Markets Product Development (since 2006). | |
Timothy J. Knierim
522 Fifth Avenue
New York, NY 10036
Birth Year 1959 | | Chief Compliance Officer | | Since December 2016 | | Managing Director of the Adviser and various entities affiliated with the Adviser; Chief Compliance Officer of various Morgan Stanley Funds and the Adviser (since December 2016) and Chief Compliance Officer of Morgan Stanley AIP GP LP (since 2014). Formerly, Managing Director and Deputy Chief Compliance Officer of the Adviser (2014-2016); and formerly, Chief Compliance Officer of Prudential Investment Management, Inc. (2007-2014). | |
Francis J. Smith
522 Fifth Avenue
New York, NY 10036
Birth Year 1965 | | Treasurer and Principal Financial Officer | | Treasurer since July 2003 and Principal Financial Officer since September 2002 | | Managing Director of the Adviser and various entities affiliated with the Adviser; Treasurer (since July 2003) and Principal Financial Officer of various Morgan Stanley Funds (since September 2002). | |
Mary E. Mullin
522 Fifth Avenue
New York, NY 10036
Birth Year 1967 | | Secretary | | Since
June
1999 | | Managing Director of the Adviser; Secretary of various Morgan Stanley Funds (since June 1999). | |
Michael J. Key
522 Fifth Avenue
New York, NY 10036
Birth Year 1979 | | Vice President | | Since
June
2017 | | Vice President of the Equity and Fixed Income Funds, Liquidity Funds, various money market funds and the Morgan Stanley AIP Funds in the Fund Complex (since June 2017); Executive Director of the Adviser; Head of Product Development for Equity and Fixed Income Funds (since August 2013). | |
* This is the earliest date the officer began serving the Morgan Stanley Funds. Each officer serves a one-year term, until his or her successor is elected and qualifies.
43
Morgan Stanley Institutional Fund Trust
Annual Report — September 30, 2020
Adviser and Administrator
Morgan Stanley Investment Management Inc.
522 Fifth Avenue
New York, New York 10036
Distributor
Morgan Stanley Distribution, Inc.
522 Fifth Avenue
New York, New York 10036
Dividend Disbursing and Transfer Agent
DST Asset Manager Solutions, Inc.
2000 Crown Colony Drive
Quincy, Massachusetts 02169
Custodian
State Street Bank and Trust Company
One Lincoln Street
Boston, Massachusetts 02111
Legal Counsel
Dechert LLP
1095 Avenue of the Americas
New York, New York 10036
Counsel to the Independent Trustees
Perkins Coie LLP
1155 Avenue of the Americas,
22nd Floor
New York, New York 10036
Independent Registered Public Accounting Firm
Ernst & Young LLP
200 Clarendon Street
Boston, Massachusetts 02116
Reporting to Shareholders
Each Morgan Stanley fund provides a complete schedule of portfolio holdings in its Semi-Annual and the Annual Reports within 60 days of the end of the fund's second and fourth fiscal quarters. The Semi-Annual and Annual Reports are filed electronically with the Securities and Exchange Commission ("SEC") on Form N-CSRS and Form N-CSR, respectively. Morgan Stanley also delivers the Semi-Annual and Annual Reports to fund shareholders and makes these reports available on its public website, www.morganstanley.com/im/shareholderreports. Each Morgan Stanley non-money market fund also files a complete schedule of portfolio holdings with the SEC for the fund's first and third fiscal quarters as an attachment to Form N-PORT. Morgan Stanley does not deliver the reports for the first and third fiscal quarters to shareholders, nor are the reports posted to the Morgan Stanley public website. However, the holdings for each money market fund are posted to the Morgan Stanley public website. You may obtain the Form N-PORT filings (as well as the Form N-CSR and N-CSRS filings) by accessing the SEC's website, www.sec.gov. You can also request copies of these materials, upon payment of a duplicating fee, by electronic request at the SEC's email address (publicinfo@sec.gov).
Proxy Voting Policies and Procedures and Proxy Voting Record
You may obtain a copy of the Trust's Proxy Voting Policy and Procedures and information regarding how the Trust voted proxies relating to portfolio securities during the most recent twelve-month period ended June 30, without charge, upon request, by calling toll free 1 (800) 548-7786 or by visiting our website at www.morganstanley.com/im/shareholderreports. This information is also available on the SEC's website at www.sec.gov.
This report is authorized for distribution only when preceded or accompanied by a prospectus or summary prospectus of the applicable fund of Morgan Stanley Institutional Fund Trust, which describes in detail the fund's investment policies, risks, fees and expenses. Please read the prospectus carefully before you invest or send money. For additional information, including information regarding the investments comprising the Fund, please visit our website at www.morganstanley.com/im/shareholderreports or call toll free 1 (800) 548-7786.
44
Printed in U.S.A.
This Report has been prepared for shareholders and may be distributed to others only if preceded or accompanied by a current prospectus.
Morgan Stanley Investment Management Inc.
522 Fifth Avenue
New York, New York 10036
© 2020 Morgan Stanley. Morgan Stanley Distribution, Inc.

IFTHYANN
3299130 EXP 11.30.21

Morgan Stanley Institutional Fund Trust
Intermediate Municipal Income Portfolio
Annual Report
September 30, 2020
Beginning on January 1, 2021, as permitted by regulations adopted by the Securities and Exchange Commission ("SEC"), paper copies of the Fund's Annual and Semi-Annual Reports to Shareholders ("Shareholder Reports") will no longer be sent by mail, unless you specifically request paper copies of the Shareholder Reports from the Fund or from your financial intermediary, such as a broker-dealer or a bank. Instead, the Shareholder Reports will be made available on the Fund's website, https://www.morganstanley.com/im/shareholderreports and you will be notified by mail each time a Shareholder Report is posted and provided with a website link to access the Shareholder Report. If you already elected to receive Shareholder Reports electronically, you will not be affected by this change and you need not take any action. You may elect to receive Shareholder Reports and other communications from the Fund electronically anytime by contacting your financial intermediary or, if you are a direct investor, please follow the instructions on the envelope.
Beginning on January 1, 2019, you may elect to receive all future Shareholder Reports in paper free of charge. If you invest through a financial intermediary, you can contact your financial intermediary to request that you continue to receive paper copies of your Shareholder Reports. If you invest directly with the Fund, please follow the instructions on the envelope to let the Fund know you wish to continue receiving paper copies of your Shareholder Reports. Your election to receive Shareholder Reports in paper will apply to all funds held in your account if you invest through your financial intermediary or all funds held with the fund complex if you invest directly with a fund.

Morgan Stanley Institutional Fund Trust
Annual Report — September 30, 2020
Shareholders' Letter | | | 2 | | |
Expense Example | | | 3 | | |
Investment Overview | | | 4 | | |
Portfolio of Investments | | | 5 | | |
Statement of Assets and Liabilities | | | 7 | | |
Statement of Operations | | | 8 | | |
Statement of Changes in Net Assets | | | 9 | | |
Financial Highlights | | | 10 | | |
Notes to Financial Statements | | | 14 | | |
Report of Independent Registered Public Accounting Firm | | | 19 | | |
Investment Advisory Agreement Approval | | | 20 | | |
Liquidity Risk Management Program | | | 22 | | |
Privacy Notice | | | 23 | | |
Trustee and Officer Information | | | 25 | | |
This report is authorized for distribution only when preceded or accompanied by a prospectus or summary prospectus of the applicable Fund of the Morgan Stanley Institutional Fund Trust. To receive a prospectus and/or statement of additional information ("SAI"), which contains more complete information such as investment objectives, charges, expenses, policies for voting proxies, risk considerations and describes in detail each of the Fund's investment policies to the prospective investor, please call toll free 1 (800) 548-7786. Please read the prospectuses carefully before you invest or send money.
Additionally, you can access information about the Fund, including performance, characteristics and investment team commentary, through Morgan Stanley Investment Management's website: www.morganstanley.com/im/shareholderreports.
Market forecasts provided in this report may not necessarily come to pass. There is no guarantee that any sectors mentioned will continue to perform as discussed herein or that securities in such sectors will be held by the Fund in the future. There is no assurance that a fund will achieve its investment objective. Funds are subject to market risk, which is the possibility that market values of securities owned by the Fund will decline and, therefore, the value of the Fund's shares may be less than what you paid for them. Accordingly, you can lose money investing in this Fund. Please see the prospectus for more complete information on investment risks.
1
Morgan Stanley Institutional Fund Trust
Annual Report — September 30, 2020
Shareholders' Letter (unaudited)
Dear Shareholders,
We are pleased to provide this Annual Report, in which you will learn how your investment in Intermediate Municipal Income Portfolio (the "Fund") performed during the period ended September 30, 2020 (when the Fund commenced operations).
Morgan Stanley Investment Management is a client-centric, investor-led organization. Our global presence, intellectual capital, and breadth of products and services enable us to partner with investors to meet the evolving challenges of today's financial markets. We aim to deliver superior investment service and to empower our clients to make the informed decisions that help them reach their investment goals.
As always, we thank you for selecting Morgan Stanley Investment Management, and look forward to working with you in the months and years ahead.
Sincerely,

John H. Gernon
President and Principal Executive Officer
October 2020
2
Morgan Stanley Institutional Fund Trust
Annual Report — September 30, 2020
Expense Example (unaudited)
Intermediate Municipal Income Portfolio
As a shareholder of the Fund, you may incur two types of costs: (1) transactional costs, including sales charge (loads) on purchase payments; and (2) ongoing costs, which may include advisory fees, administration fees, distribution and shareholder services fees; and other Fund expenses. This example is intended to help you understand your ongoing costs (in dollars) of investing in the Fund and to compare these costs with the ongoing costs of investing in other mutual funds.
This example is based on an investment of $1,000 invested at the beginning of the period and held for the entire period 9/30/20-9/30/20.
Actual Expenses
The table below provides information about actual account values and actual expenses. You may use the information in this table, together with the amount you invested, to estimate the expenses that you paid over the period. Simply divide your account value by $1,000 (for example, an $8,600 account value divided by $1,000 = 8.6), then multiply the result by the number in the table under the heading entitled "Actual Expenses Paid During Period" to estimate the expenses you paid on your account during this period.
Hypothetical Example for Comparison Purposes
The table below provides information about hypothetical account values and hypothetical expenses based on the Fund's actual expense ratio and an assumed rate of return of 5% per year before expenses, which is not the Fund's actual return. The hypothetical account values and expenses may not be used to estimate the actual ending account balance or expenses you paid for the period. You may use this information to compare the ongoing costs of investing in the Fund and other funds. To do so, compare this 5% hypothetical example with the 5% hypothetical examples that appear in the shareholder reports of the other funds.
Please note that the expenses shown in the table are meant to highlight your ongoing costs only and do not reflect any transactional costs, such as sales charges (loads, if applicable). Therefore, the information for each class in the table is useful in comparing ongoing costs only, and will not help you determine the relative total costs of owning different funds. In addition, if these transactional costs were included, your costs would have been higher.
| | | Beginning
Account
Value
9/30/20 | | Actual Ending
Account
Value
9/30/20 | | Hypothetical
Ending Account
Value | | Actual
Expenses
Paid
During
Period* | | Hypothetical
Expenses Paid
During Period* | | Net
Expense
Ratio
During
Period** | |
Intermediate Municipal Income Portfolio Class I^ | | $ | 1,000.00 | | | $ | 1,000.00 | | | $ | 1,000.13 | | | $ | 0.01 | | | $ | 0.01 | | | | 0.41 | % | |
Intermediate Municipal Income Portfolio Class A^ | | | 1,000.00 | | | | 1,000.00 | | | | 1,000.11 | | | | 0.02 | | | | 0.02 | | | | 0.80 | | |
Intermediate Municipal Income Portfolio Class C^ | | | 1,000.00 | | | | 1,000.00 | | | | 1,000.09 | | | | 0.04 | | | | 0.04 | | | | 1.55 | | |
Intermediate Municipal Income Portfolio Class IS^ | | | 1,000.00 | | | | 1,000.00 | | | | 1,000.13 | | | | 0.01 | | | | 0.01 | | | | 0.40 | | |
* Expenses are calculated using each Fund Class' annualized net expense ratio (as disclosed), multiplied by the average account value over the period and multiplied by 1/366 (to reflect the actual days in the period).
** Annualized.
^ The Fund commenced operations on September 30, 2020.
3
Morgan Stanley Institutional Fund Trust
Annual Report — September 30, 2020
Investment Overview (unaudited)
Intermediate Municipal Income Portfolio
The Fund seeks to provide a high level of current income exempt from federal income tax, consistent with the preservation of capital.
Performance
The Fund's inception (September 30, 2020) was the same day as the close of the fiscal year on September 30, 2020.
Factors Affecting Performance
• As of the end of the reporting period, the Fund did not have any performance history.
Management Strategies
• The Fund invests in municipal securities, the income from which is exempt from federal income tax, using a combination of top-down and bottom-up research to determine duration and yield positioning, sector and credit quality allocation, and security selection. The Fund targets an average portfolio duration of +/- 3 years of the average duration of its benchmark, the Bloomberg Barclays Municipal Bond 1-15 Year Index.
4
Morgan Stanley Institutional Fund Trust
Annual Report — September 30, 2020
Portfolio of Investments
Intermediate Municipal Income Portfolio
| | | Face
Amount
(000) | | Value
(000) | |
Fixed Income Securities (22.2%) | |
Municipal Bonds (22.2%) | |
Arizona (1.1%) | |
Salt Verde Financial Corp.
Senior Gas Revenue Bonds 2007-1
5.00%, 12/1/37 | | $ | 200 | | | $ | 271 | | |
California (2.6%) | |
California Los Angeles International
Airport Subordinate Revenue Bonds
2018 Series A (AMT) | |
5.00%, 5/15/28 | | | 250 | | | | 318 | | |
State of California Various Purpose
General Obligation Refunding Bonds | |
5.00%, 11/1/30 | | | 250 | | | | 341 | | |
| | | | 659 | | |
Connecticut (1.0%) | |
Connecticut State General Obligation
Bonds 2019 Series A | |
5.00%, 4/15/31 | | | 200 | | | | 258 | | |
Florida (3.3%) | |
County of Miami-Dade Aviation Revenue
Refunding Bonds Series 2016A | |
5.00%, 10/1/24 | | | 225 | | | | 261 | | |
Jacksonville Special Revenue and
Refunding Bonds, Series 2020A | |
5.00%, 10/1/26 | | | 250 | | | | 314 | | |
School Board of Miami-Dade County (The)
TANs, Series 2020 | |
2.00%, 2/25/21 | | | 250 | | | | 252 | | |
| | | | 827 | | |
Massachusetts (1.3%) | |
University of Massachusetts Building
Authority Refunding Revenue
Bonds Senior Series 2019-1 | |
5.00%, 5/1/29 | | | 250 | | | | 335 | | |
Nevada (1.4%) | |
Clark County School District Nevada
General Obligation Building and
Refunding Bonds Series 2017A | |
5.00%, 6/15/25 | | | 300 | | | | 357 | | |
New York (3.8%) | |
City of New York General Obligation
Bonds Fiscal 2018 Series C | |
5.00%, 8/1/29 | | | 250 | | | | 316 | | |
Hudson Yards Infrastructure Corp.
Second Indenture Revenue Bonds
Fiscal 2017 Series A | |
5.00%, 2/15/31 | | | 250 | | | | 301 | | |
New York City Transitional Finance
Authority Future Tax Secured
Revenue 2021 Series A | |
5.00%, 11/1/27 | | | 250 | | | | 321 | | |
| | | | 938 | | |
| | | Face
Amount
(000) | | Value
(000) | |
Pennsylvania (1.4%) | |
Pennsylvania State General Obligation Bonds,
First Series of 2020 | |
5.00%, 5/1/31 | | $ | 250 | | | $ | 337 | | |
South Carolina (1.0%) | |
South Carolina Transportation Infrastructure
Bank Revenue Refunding
Bonds, Series 2003B | |
1 Month USD LIBOR + 0.45%,
0.55%, 10/1/31 (a) | | | 250 | | | | 249 | | |
Texas (5.3%) | |
Austin Electric Utility System Revenue
Series 2015A | |
5.00%, 11/15/25 | | | 250 | | | | 309 | | |
Georgetown Independent School District
Variable Rate Unlimited Tax
School Building Bonds Series 2016-B | |
2.00%, 8/1/41 | | | 250 | | | | 262 | | |
Harris County Cultural Education
Facilities Finance Corp. Hospital
Revenue Bonds Series 2014A | |
5.00%, 12/1/25 | | | 160 | | | | 189 | | |
Love Field Airport Modernization Corp.
General Airport Revenue Bonds,
Series 2017 (AMT) | |
5.00%, 11/1/31 | | | 250 | | | | 291 | | |
Pasadena Independent School District
Variable Rate Unlimited Tax
School Building Bonds, Series 2015B | |
1.50%, 2/15/44 | | | 260 | | | | 272 | | |
| | | | 1,323 | | |
Total Fixed Income Securities (Cost $5,553) | | | 5,554 | | |
Total Investments (22.2%) (Cost $5,553) (b) | | | 5,554 | | |
Other Assets in Excess of Liabilities (77.8%) | | | 19,446 | | |
Net Assets (100.0%) | | $ | 25,000 | | |
(a) Floating or variable rate securities: The rates disclosed are as of September 30, 2020. For securities based on a published reference rate and spread, the reference rate and spread are indicated in the description in the Portfolio of Investments. Certain variable rate securities may not be based on a published reference rate and spread but are determined by the issuer or agent and are based on current market conditions. These securities do not indicate a reference rate and spread in their description in the Portfolio of Investments.
(b) At September 30, 2020, the aggregate cost for federal income tax purposes is approximately $5,553,000. The aggregate gross unrealized appreciation is approximately $8,000 and the aggregate gross unrealized depreciation is approximately $7,000, resulting in net unrealized appreciation of approximately $1,000.
AMT Alternative Minimum Tax.
LIBOR London Interbank Offered Rate.
TANs Tax Anticipation Notes.
USD United States Dollar
The accompanying notes are an integral part of the financial statements.
5
Morgan Stanley Institutional Fund Trust
Annual Report — September 30, 2020
Portfolio of Investments (cont'd)
Intermediate Municipal Income Portfolio
Summary of Investments by State
Classification | | Percentage of
Total Investments | |
Texas | | | 23.8 | % | |
New York | | | 16.9 | | |
Florida | | | 14.9 | | |
Other* | | | 14.0 | | |
California | | | 11.9 | | |
Nevada | | | 6.4 | | |
Pennsylvania | | | 6.1 | | |
Massachusetts | | | 6.0 | | |
Total Investments | | | 100.0 | % | |
* Industries and/or investment types representing less than 5% of total investments.
The accompanying notes are an integral part of the financial statements.
6
Morgan Stanley Institutional Fund Trust
Annual Report — September 30, 2020
Intermediate Municipal Income Portfolio
Statement of Assets and Liabilities | | September 30, 2020
(000) | |
Assets: | |
Investments in Securities of Unaffiliated Issuers, at Value (Cost $5,553) | | $ | 5,554 | | |
Cash | | | 25,000 | | |
Prepaid Offering Costs | | | 131 | | |
Due from Adviser | | | 73 | | |
Interest Receivable | | | 43 | | |
Total Assets | | | 30,801 | | |
Liabilities: | |
Payable for Investments Purchased | | | 5,596 | | |
Payable for Offering Costs | | | 132 | | |
Payable for Professional Fees | | | 67 | | |
Payable for Transfer Agency Fees — Class I | | | — | @ | |
Payable for Transfer Agency Fees — Class A | | | — | @ | |
Payable for Transfer Agency Fees — Class C | | | — | @ | |
Payable for Shareholder Services Fees — Class A | | | — | @ | |
Payable for Distribution and Shareholder Services Fees — Class C | | | — | @ | |
Payable for Custodian Fees | | | — | @ | |
Payable for Administration Fees | | | — | @ | |
Other Liabilities | | | 6 | | |
Total Liabilities | | | 5,801 | | |
Net Assets | | $ | 25,000 | | |
Net Assets Consist of: | |
Paid-in-Capital | | $ | 25,000 | | |
Total Accumulated Loss | | | (— | @) | |
Net Assets | | $ | 25,000 | | |
CLASS I: | |
Net Assets | | $ | 24,970 | | |
| Shares Outstanding (unlimited number of shares authorized, no par value) (not in 000's) | | | 2,497,000 | | |
Net Asset Value, Offering and Redemption Price Per Share | | $ | 10.00 | | |
CLASS A: | |
Net Assets | | $ | 10 | | |
| Shares Outstanding (unlimited number of shares authorized, no par value) (not in 000's) | | | 1,000 | | |
Net Asset Value, Redemption Price Per Share | | $ | 10.00 | | |
Maximum Sales Load | | | 3.25 | % | |
Maximum Sales Charge | | $ | 0.34 | | |
Maximum Offering Price Per Share | | $ | 10.34 | | |
CLASS C: | |
Net Assets | | $ | 10 | | |
| Shares Outstanding (unlimited number of shares authorized, no par value) (not in 000's) | | | 1,000 | | |
Net Asset Value, Offering and Redemption Price Per Share | | $ | 10.00 | | |
CLASS IS: | |
Net Assets | | $ | 10 | | |
| Shares Outstanding (unlimited number of shares authorized, no par value) (not in 000's) | | | 1,000 | | |
Net Asset Value, Offering and Redemption Price Per Share | | $ | 10.00 | | |
@ Amount is less than $500.
The accompanying notes are an integral part of the financial statements.
7
Morgan Stanley Institutional Fund Trust
Annual Report — September 30, 2020
Intermediate Municipal Income Portfolio
Statement of Operations | | Period Ended
September 30, 2020^
(000) | |
Expenses: | |
Professional Fees | | $ | 67 | | |
Shareholder Reporting Fees | | | 5 | | |
Transfer Agency Fees — Class I (Note E) | | | — | @ | |
Transfer Agency Fees — Class A (Note E) | | | — | @ | |
Transfer Agency Fees — Class C (Note E) | | | — | @ | |
Transfer Agency Fees — Class IS (Note E) | | | — | @ | |
Shareholder Services Fees — Class A (Note D) | | | — | @ | |
Distribution and Shareholder Services Fees — Class C (Note D) | | | — | @ | |
Advisory Fees (Note B) | | | — | @ | |
Custodian Fees (Note F) | | | — | @ | |
Administration Fees (Note C) | | | — | @ | |
Pricing Fees | | | — | @ | |
Offering Costs | | | — | @ | |
Other Expenses | | | 2 | | |
Total Expenses | | | 74 | | |
Expenses Reimbursed by Adviser (Note B) | | | (73 | ) | |
Reimbursement of Class Specific Expenses — Class A (Note B) | | | (— | @) | |
Reimbursement of Class Specific Expenses — Class C (Note B) | | | (— | @) | |
Reimbursement of Class Specific Expenses — Class IS (Note B) | | | (— | @) | |
Waiver of Advisory Fees (Note B) | | | (— | @) | |
Net Expenses | | | 1 | | |
Net Investment Loss | | | (1 | ) | |
Change in Unrealized Appreciation (Depreciation): | |
Investments | | | 1 | | |
Net Decrease in Net Assets Resulting from Operations | | $ | (— | @) | |
^ Commencement of Operations.
@ Amount is less than $500.
The accompanying notes are an integral part of the financial statements.
8
Morgan Stanley Institutional Fund Trust
Annual Report — September 30, 2020
Intermediate Municipal Income Portfolio
Statement of Changes in Net Assets | | Period Ended
September 30, 2020^
(000) | |
Increase (Decrease) in Net Assets: | |
Operations: | |
Net Investment Loss | | $ | (1 | ) | |
Net Change in Unrealized Appreciation (Depreciation) | | | 1 | | |
Net Decrease in Net Assets Resulting from Operations | | | (— | @) | |
Capital Share Transactions:(1) | |
Class I: | |
Subscribed | | | 24,970 | | |
Class A: | |
Subscribed | | | 10 | | |
Class C: | |
Subscribed | | | 10 | | |
Class IS: | |
Subscribed | | | 10 | | |
Net Increase in Net Assets Resulting from Capital Share Transactions | | | 25,000 | | |
Total Increase in Net Assets | | | 25,000 | | |
Net Assets: | |
Beginning of Period | | | — | | |
End of Period | | $ | 25,000 | | |
(1) Capital Share Transactions: | |
Class I: | |
Shares Subscribed | | | 2,497 | | |
Class A: | |
Shares Subscribed | | | 1 | | |
Class C: | |
Shares Subscribed | | | 1 | | |
Class IS: | |
Shares Subscribed | | | 1 | | |
^ Commencement of Operations.
@ Amount is less than $500.
The accompanying notes are an integral part of the financial statements.
9
Morgan Stanley Institutional Fund Trust
Annual Report — September 30, 2020
Financial Highlights
Intermediate Municipal Income Portfolio
| | | Class I | |
Selected Per Share Data and Ratios | | Period Ended
September 30, 2020(1) | |
Net Asset Value, Beginning of Period | | $ | 10.00 | | |
Loss from Investment Operations: | |
Net Investment Loss(2) | | | (0.00 | )(3) | |
Net Realized and Unrealized Gain | | | 0.00 | (3) | |
Total from Investment Operations | | | (0.00 | )(3) | |
Net Asset Value, End of Period | | $ | 10.00 | | |
Total Return(4) | | | 0.00 | %(5) | |
Ratios to Average Net Assets and Supplemental Data: | |
Net Assets, End of Period (Thousands) | | $ | 24,970 | | |
Ratio of Expenses Before Expense Limitation | | | 2.03 | %(6) | |
Ratio of Expenses After Expense Limitation | | | 0.41 | %(6) | |
Ratio of Net Investment Loss | | | (0.41 | )%(6) | |
Portfolio Turnover Rate | | | 0 | %(5) | |
(1) Commencement of Operations.
(2) Per share amount is based on average shares outstanding.
(3) Amount is less than $0.005 per share.
(4) Calculated based on the net asset value as of the last business day of the period.
(5) Not annualized.
(6) Annualized.
The accompanying notes are an integral part of the financial statements.
10
Morgan Stanley Institutional Fund Trust
Annual Report — September 30, 2020
Financial Highlights
Intermediate Municipal Income Portfolio
| | | Class A | |
Selected Per Share Data and Ratios | | Period Ended
September 30, 2020(1) | |
Net Asset Value, Beginning of Period | | $ | 10.00 | | |
Loss from Investment Operations: | |
Net Investment Loss(2) | | | (0.00 | )(3) | |
Net Realized and Unrealized Gain | | | 0.00 | (3) | |
Total from Investment Operations | | | (0.00 | )(3) | |
Net Asset Value, End of Period | | $ | 10.00 | | |
Total Return(4) | | | 0.00 | %(5) | |
Ratios to Average Net Assets and Supplemental Data: | |
Net Assets, End of Period (Thousands) | | $ | 10 | | |
Ratio of Expenses Before Expense Limitation | | | 16.15 | %(6) | |
Ratio of Expenses After Expense Limitation | | | 0.80 | %(6) | |
Ratio of Net Investment Loss | | | (0.80 | )%(6) | |
Portfolio Turnover Rate | | | 0 | %(5) | |
(1) Commencement of Operations.
(2) Per share amount is based on average shares outstanding.
(3) Amount is less than $0.005 per share.
(4) Calculated based on the net asset value which does not reflect sales charges, if applicable, as of the last business day of the period.
(5) Not annualized.
(6) Annualized.
The accompanying notes are an integral part of the financial statements.
11
Morgan Stanley Institutional Fund Trust
Annual Report — September 30, 2020
Financial Highlights
Intermediate Municipal Income Portfolio
| | | Class C | |
Selected Per Share Data and Ratios | | Period Ended
September 30, 2020(1) | |
Net Asset Value, Beginning of Period | | $ | 10.00 | | |
Loss from Investment Operations: | |
Net Investment Loss(2) | | | (0.00 | )(3) | |
Net Realized and Unrealized Gain | | | 0.00 | (3) | |
Total from Investment Operations | | | (0.00 | )(3) | |
Net Asset Value, End of Period | | $ | 10.00 | | |
Total Return(4) | | | 0.00 | %(5) | |
Ratios to Average Net Assets and Supplemental Data: | |
Net Assets, End of Period (Thousands) | | $ | 10 | | |
Ratio of Expenses Before Expense Limitation | | | 16.88 | %(6) | |
Ratio of Expenses After Expense Limitation | | | 1.55 | %(6) | |
Ratio of Net Investment Loss | | | (1.55 | )%(6) | |
Portfolio Turnover Rate | | | 0 | %(5) | |
(1) Commencement of Operations.
(2) Per share amount is based on average shares outstanding.
(3) Amount is less than $0.005 per share.
(4) Calculated based on the net asset value which does not reflect sales charges, if applicable, as of the last business day of the period.
(5) Not annualized.
(6) Annualized.
The accompanying notes are an integral part of the financial statements.
12
Morgan Stanley Institutional Fund Trust
Annual Report — September 30, 2020
Financial Highlights
Intermediate Municipal Income Portfolio
| | | Class IS | |
Selected Per Share Data and Ratios | | Period Ended
September 30, 2020(1) | |
Net Asset Value, Beginning of Period | | $ | 10.00 | | |
Loss from Investment Operations: | |
Net Investment Loss(2) | | | (0.00 | )(3) | |
Net Realized and Unrealized Gain | | | 0.00 | (3) | |
Total from Investment Operations | | | (0.00 | )(3) | |
Net Asset Value, End of Period | | $ | 10.00 | | |
Total Return(4) | | | 0.00 | %(5) | |
Ratios to Average Net Assets and Supplemental Data: | |
Net Assets, End of Period (Thousands) | | $ | 10 | | |
Ratio of Expenses Before Expense Limitation | | | 15.89 | %(6) | |
Ratio of Expenses After Expense Limitation | | | 0.40 | %(6) | |
Ratio of Net Investment Loss | | | (0.40 | )%(6) | |
Portfolio Turnover Rate | | | 0 | %(5) | |
(1) Commencement of Operations.
(2) Per share amount is based on average shares outstanding.
(3) Amount is less than $0.005 per share.
(4) Calculated based on the net asset value as of the last business day of the period.
(5) Not annualized.
(6) Annualized.
The accompanying notes are an integral part of the financial statements.
13
Morgan Stanley Institutional Fund Trust
Annual Report — September 30, 2020
Notes to Financial Statements
Morgan Stanley Institutional Fund Trust ("Trust'') is registered under the Investment Company Act of 1940, as amended (the "Act''), as an open-end management investment company. The Trust is comprised of twelve separate, active funds (individually referred to as a "Fund," collectively as the "Funds"). The Trust applies investment company accounting and reporting guidance. All Funds are considered diversified for purposes of the Act.
The accompanying financial statements relate to the Intermediate Municipal Income Portfolio. The Fund seeks to provide a high level of current income exempt from federal income tax, consistent with the preservation of capital.
The Fund commenced operations on September 30, 2020 and offers four classes of shares — Class I, Class A, Class C and Class IS.
A. Significant Accounting Policies: The following significant accounting policies are in conformity with U.S. generally accepted accounting principles ("GAAP"). Such policies are consistently followed by the Trust in the preparation of its financial statements. GAAP may require management to make estimates and assumptions that affect the reported amounts and disclosures in the financial statements. Actual results may differ from those estimates.
In March 2020, the Financial Accounting Standards Board ("FASB") issued an Accounting Standard Update, ASU 2020-04, Reference Rate Reform (Topic 848) — Facilitation of the Effects of Reference Rate Reform on Financial Reporting ("ASU 2020-04"), which provides optional, temporary relief with respect to the financial reporting of contracts subject to certain types of modifications due to the planned discontinuation of the London Interbank Offered Rate ("LIBOR") and other IBOR-based reference rates at the end of 2021. The temporary relief provided by ASU 2020-04 is effective for certain reference rate-related contract modifications that occur during the period from March 12, 2020 through December 31, 2022. Management is evaluating the impact of ASU 2020-04 on the Fund's investments, derivatives, debt and other contracts that will undergo reference rate-related modifications as a result of the reference rate reform.
In August 2018, FASB issued Accounting Standards Update ("ASU") 2018-13, Fair Value Measurement (Topic 820) — Disclosures Framework — Changes to Disclosure Requirements of Fair Value Measurement ("ASU 2018-13") which introduces new fair value disclosure requirements as well as eliminates and modifies certain existing fair value disclosure requirements. ASU 2018-13 would be effective for fiscal years
beginning after December 15, 2019 and for interim periods within those fiscal years; however, management has elected to early adopt ASU 2018-13 as permitted by the standard. The impact of the Fund's adoption was limited to changes in the Fund's financial statement disclosures regarding fair value, primarily those disclosures related to transfers between levels of the fair value hierarchy and disclosure of the range and weighted average used to develop significant unobservable inputs for Level 3 fair value measurements, when applicable.
1. Security Valuation: (1) Certain portfolio securities may be valued by an outside pricing service/vendor approved by the Trust's Board of Trustees (the "Trustees"). The pricing service/vendor may employ a pricing model that takes into account, among other things, bids, yield spreads and/or other market data and specific security characteristics. Alternatively, if a valuation is not available from an outside pricing service/vendor, and the security trades on an exchange, the security may be valued at its latest reported sale price (or at the exchange official closing price if such exchange reports an official closing price), prior to the time when assets are valued. If there are no sales on a given day and if there is no official exchange closing price for that day, the security is valued at the mean between the last reported bid and asked prices if such bid and asked prices are available in the relevant exchanges. If only bid prices are available then the latest bid price may be used. If Morgan Stanley Investment Management Inc. (the "Adviser"), a wholly-owned subsidiary of Morgan Stanley, determines that the price provided by the outside pricing service/vendor or exchange does not reflect the security's fair value or is unable to provide a price, prices from brokers or dealers may also be utilized. In these circumstances, the value of the security will be the mean of bid and asked prices obtained from brokers or dealers; and (2) when market quotations are not readily available, including circumstances under which the Adviser determines that the closing price, last sale price or the mean between the last reported bid and asked prices are not reflective of a security's market value, portfolio securities are valued at their fair value as determined in good faith under procedures established by and under the general supervision of the Trustees. Occasionally, developments affecting the closing prices of securities and other assets may occur between the times at which valuations of such securities are determined (that is, close of the foreign market on which the securities trade) and the close of business of the New York Stock Exchange ("NYSE"). If
14
Morgan Stanley Institutional Fund Trust
Annual Report — September 30, 2020
Notes to Financial Statements (cont'd)
developments occur during such periods that are expected to materially affect the value of such securities, such valuations may be adjusted to reflect the estimated fair value of such securities as of the close of the NYSE, as determined in good faith by the Trustees or by the Adviser using a pricing service and/or procedures approved by the Trustees.
The Trustees have responsibility for determining in good faith the fair value of the investments, and the Trustees may appoint others, such as the Trust's Adviser or a valuation committee, to assist the Trustees in determining fair value and to make the actual calculations pursuant to the fair valuation methodologies previously approved by the Trustees. Under procedures approved by the Trustees, the Trust's Adviser has formed a Valuation Committee whose members are approved by the Trustees. The Valuation Committee provides administration and oversight of the Trust's valuation policies and procedures, which are reviewed at least annually by the Trustees. These procedures allow the Trust to utilize independent pricing services, quotations from securities and financial instrument dealers and other market sources to determine fair value.
2. Fair Value Measurement: FASB Accounting Standards CodificationTM ("ASC") 820, "Fair Value Measurement" ("ASC 820"), defines fair value as the value that the Fund would receive to sell an investment or pay to transfer a liability in a timely transaction with an independent buyer in the principal market, or in the absence of a principal market, the most advantageous market for the investment or liability. ASC 820 establishes a three-tier hierarchy to distinguish between (1) inputs that reflect the assumptions market participants would use in valuing an asset or liability developed based on market data obtained from sources independent of the reporting entity (observable inputs) and (2) inputs that reflect the reporting entity's own assumptions about the assumptions market participants would use in valuing an asset or liability developed based on the best information available in the circumstances (unobservable inputs) and to establish classification of fair value measurements for disclosure purposes. Various inputs are used in determining the value of the Fund's investments. The inputs are summarized in the three broad levels listed below:
• Level 1 – unadjusted quoted prices in active markets for identical investments
• Level 2 – other significant observable inputs (including quoted prices for similar investments, interest rates, prepayment speeds, credit risk, etc.)
• Level 3 – significant unobservable inputs including the Fund's own assumptions in determining the fair value of investments. Factors considered in making this determination may include, but are not limited to, information obtained by contacting the issuer, analysts, or the appropriate stock exchange (for exchange-traded securities), analysis of the issuer's financial statements or other available documents and, if necessary, available information concerning other securities in similar circumstances.
The inputs or methodology used for valuing securities are not necessarily an indication of the risk associated with investing in those securities and the determination of the significance of a particular input to the fair value measurement in its entirety requires judgment and considers factors specific to each security.
The following is a summary of the inputs used to value the Fund's investments as of September 30, 2020:
Investment Type | | Level 1
Unadjusted
quoted
prices
(000) | | Level 2
Other
significant
observable
inputs
(000) | | Level 3
Significant
unobservable
inputs
(000) | | Total
(000) | |
Assets: | |
Fixed Income Securities | |
Municipal Bonds | | $ | — | | | $ | 5,554 | | | $ | — | | | $ | 5,554 | | |
Total Assets | | $ | — | | | $ | 5,554 | | | $ | — | | | $ | 5,554 | | |
Transfers between investment levels may occur as the markets fluctuate and/or the availability of data used in an investment's valuation changes.
3. Indemnifications: The Trust enters into contracts that contain a variety of indemnifications. The Trust's maximum exposure under these arrangements is unknown. However, the Trust has not had prior claims or losses pursuant to these contracts and expects the risk of loss to be remote.
4. Dividends and Distributions to Shareholders: Dividends and distributions to shareholders are recorded on the ex-dividend date. Dividends from net investment
15
Morgan Stanley Institutional Fund Trust
Annual Report — September 30, 2020
Notes to Financial Statements (cont'd)
income, if any, are declared and paid monthly. Net realized capital gains, if any, are distributed at least annually.
5. Security Transactions, Income and Expenses: Security transactions are accounted for on the trade date (date the order to buy or sell is executed). Realized gains and losses on the sale of investment securities are determined on the specific identified cost method. Dividend income and other distributions are recorded on the ex-dividend date (except for certain foreign dividends which may be recorded as soon as the Fund is informed of such dividends) net of applicable withholding taxes. Interest income is recognized on the accrual basis except where collection is in doubt. Discounts are accreted and premiums are amortized over the life of the respective securities. Most expenses of the Trust can be directly attributed to a particular Fund. Expenses which cannot be directly attributed are apportioned among the Funds based upon relative net assets or other appropriate methods. Income, expenses (other than class specific expenses — distribution and shareholder services, transfer agency and sub transfer agency fees) and realized and unrealized gains or losses are allocated to each class of shares based upon their relative net assets.
B. Advisory Fees: The Adviser, a wholly-owned subsidiary of Morgan Stanley, provides the Fund with advisory services under the terms of an Investment Advisory Agreement, paid quarterly, at an annual rate of 0.35% of the average daily net assets of the Fund.
The Adviser has agreed to reduce its advisory fee and/or reimburse the Fund so that total annual Fund operating expenses, excluding certain investment related expenses, taxes, interest and other extraordinary expenses (including litigation), will not exceed 0.45% for Class I shares, 0.80% for Class A shares, 1.55% for Class C shares and 0.40% for Class IS shares. The fee waivers and/or expense reimbursements will continue for at least one year from the date of the Fund's prospectus or until such time as the Trustees act to discontinue all or a portion of such waivers and/or reimbursements when they deem such action is appropriate. The Adviser may make additional voluntary fee waivers and/or expense reimbursements and may discontinue these voluntary fee waivers and/or expense reimbursements at any time in the future. For the period ended September 30, 2020, less than $500 of advisory fees were waived and approximately $73,000 of other expenses were reimbursed by the Adviser pursuant to this arrangement.
C. Administration Fees: The Adviser also serves as Administrator to the Trust and provides administrative services pursuant to an Administration Agreement for an annual fee, accrued daily and paid monthly, of 0.08% of the Fund's average daily net assets. Under a Sub-Administration Agreement between the Administrator and State Street, State Street provides certain administrative services to the Trust. For such services, the Administrator pays State Street a portion of the fee the Administrator receives from the Fund.
D. Distribution and Shareholder Services Fees: Morgan Stanley Distribution, Inc. ("MSDI" or the "Distributor"), a wholly-owned subsidiary of the Adviser, and an indirect subsidiary of Morgan Stanley, serves as the Trust's Distributor of Fund shares pursuant to a Distribution Agreement. The Trust has adopted a Shareholder Services Plan with respect to Class A shares pursuant to Rule 12b-1 under the Act. Under the Shareholder Services Plan, the Fund pays the Distributor a shareholder services fee, accrued daily and paid monthly, at an annual rate of 0.25% of the Fund's average daily net assets attributable to Class A shares.
The Trust has adopted a Distribution and Shareholder Services Plan with respect to Class C shares pursuant to Rule 12b-1 under the Act. Under the Distribution and Shareholder Services Plan, the Fund pays the Distributor a distribution fee, accrued daily and paid monthly, at an annual rate of 0.75% and a shareholder services fee, accrued daily and paid monthly, at an annual rate of 0.25% of the Fund's average daily net assets attributable to Class C shares.
The distribution and shareholder services fees are used to support the expenses associated with servicing and maintaining accounts. The Distributor may compensate other parties for providing shareholder support services to investors who purchase Class A and Class C shares.
E. Dividend Disbursing and Transfer Agent: The Trust's dividend disbursing and transfer agent is DST Asset Manager Solutions, Inc. ("DST"). Pursuant to a Transfer Agency Agreement, the Trust pays DST a fee based on the number of classes, accounts and transactions relating to the Funds of the Trust.
F. Custodian Fees: State Street (the "Custodian") also serves as Custodian for the Trust in accordance with a Custodian Agreement. The Custodian holds cash, securities and other assets of the Trust as required by the Act. Custody fees are payable monthly based on assets held in custody, invest-
16
Morgan Stanley Institutional Fund Trust
Annual Report — September 30, 2020
Notes to Financial Statements (cont'd)
ment purchases and sales activity and account maintenance fees, plus reimbursement for certain out-of-pocket expenses.
G. Security Transactions and Transactions with Affiliates: For the period ended September 30, 2020, purchases and sales of investment securities for the Fund, other than long-term U.S. Government securities and short-term investments were approximately $5,553,000 and $0, respectively. There were no purchases and sales of long-term U.S. Government securities for the period ended September 30, 2020. For the period ended September 30, 2020, the Fund did not have any transactions in affiliated investments.
The Fund is permitted to purchase and sell securities ("cross-trade") from and to other Morgan Stanley funds as well as other funds and client accounts for which the Adviser or an affiliate of the Adviser serves as investment adviser, pursuant to procedures approved by the Trustees in compliance with Rule 17a-7 under the Act (the "Rule"). Each cross-trade is executed at the current market price in compliance with provisions of the Rule. For the period ended September 30, 2020, the Fund did not engage in any cross-trade transactions.
The Fund has an unfunded Deferred Compensation Plan (the "Compensation Plan"), which allows each independent Trustee to defer payment of all, or a portion, of the fees he or she receives for serving on the Board of Trustees. Each eligible Trustee generally may elect to have the deferred amounts credited with a return equal to the total return on one or more of the Morgan Stanley funds that are offered as investment options under the Compensation Plan. Appreciation/depreciation and distributions received from these investments are recorded with an offsetting increase/decrease in the deferred compensation obligation and do not affect the NAV of the Fund.
H. Federal Income Taxes: It is the Fund's intention to continue to qualify as a regulated investment company and distribute all of its taxable and tax-exempt income. Accordingly, no provision for federal income taxes is required in the financial statements.
The Fund may be subject to taxes imposed by countries in which it invests. Such taxes are generally based on income and/or capital gains earned or repatriated. Taxes are accrued based on net investment income, net realized gains and net unrealized appreciation as such income and/or gains are earned. Taxes may also be based on transactions in foreign currency and are accrued based on the value of investments denominated in such currency.
FASB ASC 740-10, "Income Taxes — Overall", sets forth a minimum threshold for financial statement recognition of the benefit of a tax position taken or expected to be taken in a tax return. Management has concluded there are no significant uncertain tax positions that would require recognition in the financial statements. If applicable, the Fund recognizes interest accrued related to unrecognized tax benefits in "Interest Expense" and penalties in "Other Expenses" in the Statement of Operations. The Fund files tax returns with the U.S. Internal Revenue Service, New York and various states. The tax period ended September 30, 2020, remains subject to examination by taxing authorities.
The tax character of distributions paid may differ from the character of distributions shown for GAAP purposes due to short-term capital gains being treated as ordinary income for tax purposes. There were no distributions paid during fiscal year 2020.
The amount and character of income and gains to be distributed are determined in accordance with income tax regulations which may differ from GAAP. These book/tax differences are either considered temporary or permanent in nature.
Temporary differences are attributable to differing book and tax treatments for the timing of the recognition of gains (losses) on certain investment transactions and the timing of the deductibility of certain expenses.
Permanent differences, due to a net operating loss, resulted in the following reclassifications among the components of net assets at September 30, 2020:
Total
Accumulated
Loss
(000) | | Paid-in-Capital
(000) | |
| $ | — | @ | | $ | (— | @) | |
@ Amount is less than $500.
At September 30, 2020, the Fund had no distributable earnings on a tax basis.
I. Other: At September 30, 2020, the Fund did not have record owners of 10% or greater.
J. Market Risk: Certain impacts to public health conditions particular to the coronavirus (COVID-19) outbreak could impact the operations and financial performance of certain of the Fund's investments. The extent of the impact to the financial performance of the Fund's investments will depend on future developments, including (i) the duration and spread of the outbreak, (ii) the restrictions and advisories, (iii) the effects on
17
Morgan Stanley Institutional Fund Trust
Annual Report — September 30, 2020
Notes to Financial Statements (cont'd)
the financial markets, and (iv) the effects on the economy overall, all of which are highly uncertain and cannot be predicted. If the financial performance of the Fund's investments is impacted because of these factors for an extended period, the Fund's investment results may be adversely affected.
K. LIBOR Risk: The Fund's investments, payment obligations and financing terms may be based on floating rates, such as London Interbank Offer Rate ("LIBOR"), Euro Interbank Offered Rate and other similar types of reference rates (each, a "Reference Rate"). These Reference Rates are generally intended to represent the rate at which contributing banks may obtain short-term borrowings from each other within certain financial markets. On July 27, 2017, the Chief Executive of the UK Financial Conduct Authority ("FCA"), which regulates LIBOR, announced that the FCA will no longer persuade nor require banks to submit rates for the calculation of LIBOR and certain other Reference Rates after 2021. Such announcement indicates that the continuation of LIBOR and other Reference Rates on the current basis cannot and will not be guaranteed after the end of 2021. This announcement and any additional regulatory or market changes may have an adverse impact on the Fund or its investments.
In advance of 2022, regulators and market participants are currently engaged in identifying successor Reference Rates ("Alternative Reference Rates"). Additionally, prior to the end of 2021, it is expected that market participants will focus on the transition mechanisms by which the Reference Rates in existing contracts or instruments may be amended, whether through marketwide protocols, fallback contractual provisions, bespoke negotiations or amendments or otherwise. Nonetheless, the termination of certain Reference Rates presents risks to the Fund. At this time, it is not possible to completely identify or predict the effect of any such changes, any establishment of Alternative Reference Rates or any other reforms to Reference Rates that may be enacted in the UK or elsewhere. The elimination of a Reference Rate or any other changes or reforms to the determination or supervision of Reference Rates could have an adverse impact on the market for or value of any securities or payments linked to those Reference Rates and other financial obligations held by the Fund or on its overall financial condition or results of operations.
18
Morgan Stanley Institutional Fund Trust
Annual Report — September 30, 2020
Report of Independent Registered Public Accounting Firm
To the Shareholders and Board of Trustees of
Morgan Stanley Institutional Fund Trust —
Intermediate Municipal Income Portfolio
Opinion on the Financial Statements
We have audited the accompanying statement of assets and liabilities of Intermediate Municipal Income Portfolio (the "Fund") (one of the funds constituting Morgan Stanley Institutional Fund Trust (the "Trust")), including the portfolio of investments, as of September 30, 2020, and the related statements of operations and changes in net assets and the financial highlights for the period from September 30, 2020 (commencement of operations) through September 30, 2020 and the related notes (collectively referred to as the "financial statements"). In our opinion, the financial statements present fairly, in all material respects, the financial position of Intermediate Municipal Income Portfolio (one of the funds constituting Morgan Stanley Institutional Fund Trust) at September 30, 2020, the results of its operations and the changes in its net assets and its financial highlights for the period from September 30, 2020 (commencement of operations) through September 30, 2020, in conformity with U.S. generally accepted accounting principles.
Basis for Opinion
These financial statements are the responsibility of the Trust's management. Our responsibility is to express an opinion on the Fund's financial statements based on our audit. We are a public accounting firm registered with the Public Company Accounting Oversight Board (United States) ("PCAOB") and are required to be independent with respect to the Trust in accordance with the U.S. federal securities law and the applicable rules and regulations of the Securities and Exchange Commission and the PCAOB.
We conducted our audit in accordance with the standards of the PCAOB. Those standards require that we plan and perform the audit to obtain reasonable assurance about whether the financial statements are free of material misstatement, whether due to error or fraud. The Trust is not required to have, nor were we engaged to perform, an audit of the Trust's internal control over financial reporting. As part of our audit, we are required to obtain an understanding of internal control over financial reporting, but not for the purpose of expressing an opinion on the effectiveness of the Trust's internal control over financial reporting. Accordingly, we express no such opinion.
Our audit included performing procedures to assess the risks of material misstatement of the financial statements, whether due to error or fraud, and performing procedures that respond to those risks. Such procedures included examining, on a test basis, evidence regarding the amounts and disclosures in the financial statements. Our procedures included confirmation of securities owned as of September 30, 2020 by correspondence with the custodian and brokers or by other appropriate auditing procedures where replies from brokers were not received. Our audit also included evaluating the accounting principles used and significant estimates made by management, as well as evaluating the overall presentation of the financial statements. We believe that our audit provides a reasonable basis for our opinion.

We have served as the auditor of one or more Morgan Stanley investment companies since 2000.
Boston, Massachusetts
November 24, 2020
19
Morgan Stanley Institutional Fund Trust
Annual Report — September 30, 2020
Investment Advisory Agreement Approval (unaudited)
The Board considered the following factors at the time of approval of the contracts which occurred prior to commencement of operations.
Nature, Extent and Quality of Services
The Board reviewed and considered the nature and extent of the investment advisory services to be provided by the Adviser under the advisory agreement, including portfolio management, investment research and equity and fixed income securities trading. The Board also reviewed and considered the nature and extent of the non-advisory, administrative services to be provided by the Administrator under the administration agreement, including accounting, operations, clerical, bookkeeping, compliance, business management and planning, legal services and the provision of supplies, office space and utilities at the Adviser's expense. The Board also considered the Adviser's investment in personnel and infrastructure that benefits the Fund. (The Adviser and Administrator together are referred to as the "Adviser" and the advisory and administration agreements together are referred to as the "Management Agreement.") The Board also considered that the Adviser serves a variety of other investment advisory clients and has experience overseeing service providers.
The Board reviewed and considered the qualifications of the portfolio managers, the senior administrative managers and other key personnel of the Adviser who will provide the advisory and administrative services to the Fund. The Board determined that the Adviser's portfolio managers and key personnel are well qualified by education and/or training and experience to perform the services in an efficient and professional manner. The Board concluded that the nature and extent of the advisory and administrative services to be provided were necessary and appropriate for the conduct of the business and investment activities of the Fund and supported its decision to approve the Management Agreement.
Performance, Fees and Expenses of the Fund
The Board considered that the Adviser plans to arrange for a public offering of shares of the Fund to raise assets for investment and that the offering had not yet begun and concluded that, since the Fund currently had no assets to invest (other than seed capital required under the Investment Company Act) and had no track record of performance, this was not a factor it needed to address at the present time.
The Board reviewed the advisory and administrative fee rates (the "management fee rates") proposed to be paid by the Fund under the Management Agreement relative to comparable funds advised by the Adviser, when applicable, and compared to their peers as determined by the Adviser, and reviewed the anticipated total expense ratio of the Fund. The Board considered that the Fund requires the Adviser to develop processes, invest in additional resources and incur additional risks to successfully manage the Fund and concluded that the proposed management fee rate and anticipated total expense ratio would be competitive with its peer group averages.
Economies of Scale
The Board considered the growth prospects of the Fund and the structure of the proposed management fee schedule, which does not include breakpoints. The Board considered that the Fund's potential growth was uncertain and concluded that it would be premature to consider economies of scale as a factor in approving the Management Agreement at the present time.
Profitability of the Adviser and Affiliates
Since the Fund had not begun operations and had not paid any fees to the Adviser, the Board concluded that this was not a factor that needed to be considered at the present time.
Other Benefits of the Relationship
The Board considered other direct and indirect benefits to the Adviser and/or its affiliates to be derived from their relationship with the Fund and other funds advised by the Adviser. These benefits may include, among other things, fees for trading, distribution and/or shareholder servicing and for transaction processing and reporting platforms used by securities lending agents, and research received by the Adviser generated from commission dollars spent on funds' portfolio trading. Since the Fund had not begun operations and had not paid any fees to the Adviser, the Board concluded that these benefits were not a factor that needed to be considered at the present time.
20
Morgan Stanley Institutional Fund Trust
Annual Report — September 30, 2020
Investment Advisory Agreement Approval (unaudited) (cont'd)
Resources of the Adviser and Historical Relationship Between the Fund and the Adviser
The Board considered whether the Adviser is financially sound and has the resources necessary to perform its obligations under the Management Agreement. The Board also reviewed and considered the organizational structure of the Adviser, the policies and procedures formulated and adopted by the Adviser for managing the Fund's operations and the Board's confidence in the competence and integrity of the senior managers and key personnel of the Adviser. The Board concluded that the Adviser has the financial resources necessary to fulfill its obligations under the Management Agreement and that it is beneficial for the Fund to enter into this relationship with the Adviser.
Other Factors and Current Trends
The Board considered the controls and procedures adopted and implemented by the Adviser and monitored by the Fund's Chief Compliance Officer and concluded that the conduct of business by the Adviser indicates a good faith effort on its part to adhere to high ethical standards in the conduct of the Fund's business.
As part of the Board's review, the Board received information from management on the impact of COVID-19 on the firm generally and the Adviser and the Fund in particular including, among other information, the pandemic's current and expected impact on the Fund's performance and operations.
General Conclusion
After considering and weighing all of the above factors, with various written materials and verbal information presented by the Adviser, the Board concluded that it would be in the best interest of the Fund and its future shareholders to approve the Management Agreement, which will remain in effect for two years and thereafter must be approved annually by the Board of the Fund if it is to continue in effect. In reaching this conclusion the Board did not give particular weight to any single piece of information or factor referenced above. It is possible that individual Board members may have weighed these factors, and the information presented, differently in reaching their individual decisions to approve the Management Agreement.
21
Morgan Stanley Institutional Fund Trust
Annual Report — September 30, 2020
Liquidity Risk Management Program (unaudited)
In compliance with Rule 22e-4 under the Investment Company Act of 1940, as amended (the "Liquidity Rule"), the Fund has adopted and implemented a liquidity risk management program (the "Program"), which is reasonably designed to assess and manage the risk that the Fund could not meet requests to redeem shares issued by the Fund without significant dilution of remaining investors' interests in the Fund (i.e., liquidity risk). The Fund's Board of Trustees (the "Board") previously approved the designation of the Liquidity Risk Subcommittee (the "LRS") as Program administrator. The LRS is comprised of representatives from various divisions within Morgan Stanley Investment Management.
At a meeting held on April 22-23, 2020, the Board reviewed a written report prepared by the LRS that addressed the Program's operation and assessed its adequacy, and effectiveness of implementation for the period from December 1, 2018, through December 31, 2019, as required under the Liquidity Rule. The report concluded that the Program operated effectively and was adequately and effectively implemented in all material aspects, and that the relevant controls and safeguards were appropriately designed to enable the LRS to administer the Program in compliance with the Liquidity Rule.
In accordance with the Program, the LRS assessed each Fund's liquidity risk no less frequently than annually taking into consideration certain factors, as applicable, such as (i) investment strategy and liquidity of portfolio investments, (ii) short-term and long-term cash flow projections and (iii) holdings of cash and cash equivalents and borrowing arrangements and other funding sources. Certain factors are considered under both normal and reasonably foreseeable stressed conditions.
Each Fund portfolio investment is classified into one of four liquidity categories, which classification is assessed at least monthly by the LRS. The classification is based on a determination of the number of days it is reasonably expected to take to convert the investment into cash, or sell or dispose of the investment, in current market conditions without significantly changing the market value of the investment. Liquidity classification determinations take into account various market, trading and investment-specific considerations, as well as market depth, and in some cases utilize third-party vendor data.
The Liquidity Rule limits a fund's investments in illiquid investments to 15% of its net assets and requires funds that do not primarily hold assets that are highly liquid investments to determine and maintain a minimum percentage of the fund's net assets to be invested in highly liquid investments (highly liquid investment minimum or "HLIM"). The LRS believes that the Program includes provisions reasonably designed to review, monitor and comply with the 15% limit on illiquid investments and for determining, periodically reviewing and complying with the HLIM requirement, as applicable.
There can be no assurance that the Program will achieve its objectives under all circumstances in the future. Please refer to the Fund's prospectus for more information regarding the Fund's exposure to liquidity risk and other risks to which it may be subject.
22
Morgan Stanley Institutional Fund Trust
Annual Report — September 30, 2020
Privacy Notice (unaudited) April 2019
FACTS | | WHAT DOES MSIM DO WITH YOUR PERSONAL INFORMATION? | |
Why? | | Financial companies choose how they share your personal information. Federal law gives consumers the right to limit some but not all sharing. Federal law also requires us to tell you how we collect, share, and protect your personal information. Please read this notice carefully to understand what we do. | |
What? | | The types of personal information we collect and share depend on the product or service you have with us. This information can include:
n Social Security number and income
n investment experience and risk tolerance
n checking account number and wire transfer instructions | |
How? | | All financial companies need to share customers' personal information to run their everyday business. In the section below, we list the reasons financial companies can share their customers' personal information; the reasons MSIM chooses to share; and whether you can limit this sharing. | |
Reasons we can share your personal information | | Does MSIM share? | | Can you limit this sharing? | |
For our everyday business purposes —
such as to process your transactions, maintain your account(s), respond to court orders and legal investigations, or report to credit bureaus | | Yes | | No | |
For our marketing purposes —
to offer our products and services to you | | Yes | | No | |
For joint marketing with other financial companies | | No | | We don't share | |
For our affiliates' everyday business purposes —
information about your transactions and experiences | | Yes | | No | |
For our affiliates' everyday business purposes —
information about your creditworthiness | | No | | We don't share | |
For our affiliates to market to you | | No | | We don't share | |
For non-affiliates to market to you | | No | | We don't share | |
Questions? Call toll-free (844) 312-6327 or email: imprivacyinquiries@morganstanley.com
23
Morgan Stanley Institutional Fund Trust
Annual Report — September 30, 2020
Privacy Notice (unaudited) (cont'd) April 2019
Who we are
Who is providing this notice? | | Morgan Stanley Investment Management, Inc. and its affiliated registered investment advisers, registered broker-dealers, and registered and unregistered funds ("MSIM") | |
What we do
How does MSIM protect my personal information? | | To protect your personal information from unauthorized access and use, we use security measures that comply with federal law. These measures include computer safeguards and secured files and buildings. We have policies governing the proper handling of customer information by personnel and requiring third parties that provide support to adhere to appropriate security standards with respect to such information. | |
How does MSIM collect my personal information? | | We collect your personal information, for example, when you
n open an account or make deposits or withdrawals from your account
n buy securities from us or make a wire transfer
n give us your contact information
We also collect your personal information from others, such as credit bureaus, affiliates, or other companies. | |
Why can't I limit all sharing? | | Federal law gives you the right to limit only
n sharing for affiliates' everyday business purposes — information about your creditworthiness
n affiliates from using your information to market to you
n sharing for non-affiliates to market to you
State laws and individual companies may give you additional rights to limit sharing. See below for more on your rights under state law. | |
Definitions
Affiliates | | Companies related by common ownership or control. They can be financial and non-financial companies.
n Our affiliates include companies with a Morgan Stanley name and financial companies such as Morgan Stanley Smith Barney LLC and Morgan Stanley & Co. | |
Non-affiliates | | Companies not related by common ownership or control. They can be financial and non-financial companies.
n MSIM does not share with non-affiliates so they can market to you. | |
Joint marketing | | A formal agreement between non-affiliated financial companies that together market financial products or services to you.
n MSIM doesn't jointly market | |
Other Important Information
Vermont: Except as permitted by law, we will not share personal information we collect about Vermont residents with Non-affiliates unless you provide us with your written consent to share such information.
California: Except as permitted by law, we will not share personal information we collect about California residents with Non-affiliates and we will limit sharing such personal information with our Affiliates to comply with California privacy laws that apply to us.
24
Morgan Stanley Institutional Fund Trust
Annual Report — September 30, 2020
Trustee and Officer Information (unaudited)
Independent Trustees:
Name, Address and Birth Year
of Independent Trustee | | Position(s)
Held with
Registrant | | Length of Time
Served* | | Principal Occupation(s) During Past 5 Years
and Other Relevant Professional Experience | | Number of
Funds in
Fund Complex
Overseen by
Independent
Trustee** | | Other Directorships
Held by Independent
Trustee*** | |
Frank L. Bowman
c/o Perkins Coie LLP
Counsel to the Independent Trustees
1155 Avenue of the Americas, 22nd Floor
New York, NY 10036
Birth Year 1944 | | Trustee | | Since
August
2006 | | President, Strategic Decisions, LLC (consulting) (since February 2009); Director or Trustee of various Morgan Stanley Funds (since August 2006); Chairperson of the Compliance and Insurance Committee (since October 2015); formerly, Chairperson of the Insurance Sub-Committee of the Compliance and Insurance Committee (2007-2015); served as President and Chief Executive Officer of the Nuclear Energy Institute (policy organization) (February 2005-November 2008); retired as Admiral, U.S. Navy after serving over 38 years on active duty including 8 years as Director of the Naval Nuclear Propulsion Program in the Department of the Navy and the U.S. Department of Energy (1996-2004); served as Chief of Naval Personnel (July 1994-September 1996) and on the Joint Staff as Director of Political Military Affairs (June 1992-July 1994); knighted as Honorary Knight Commander of the Most Excellent Order of the British Empire; awarded the Officier de l'Orde National du Mérite by the French Government; elected to the National Academy of Engineering (2009). | | 86 | | Director of Naval and Nuclear Technologies LLP; Director Emeritus of the Armed Services YMCA; Member of the National Security Advisory Council of the Center for U.S. Global Engagement and a member of the CNA Military Advisory Board; Trustee of Fairhaven United Methodist Church; Member of the Board of Advisors of the Dolphin Scholarship Foundation; Director of other various non-profit organizations; Formerly, Director of BP p.l.c. (November 2010-May 2019). | |
Kathleen A. Dennis
c/o Perkins Coie LLP
Counsel to the Independent Trustees
1155 Avenue of the Americas, 22nd Floor
New York, NY 10036
Birth Year 1953 | | Trustee | | Since
August
2006 | | President, Cedarwood Associates (mutual fund and investment management consulting) (since July 2006); Chairperson of the Liquidity and Alternatives Sub-Committee of the Investment Committee (since October 2006) and Director or Trustee of various Morgan Stanley Funds (since August 2006); formerly, Senior Managing Director of Victory Capital Management (1993-2006). | | 86 | | Director of various
non-profit organizations. | |
Nancy C. Everett
c/o Perkins Coie LLP
Counsel to the Independent Trustees
1155 Avenue of the Americas, 22nd Floor
New York, NY 10036
Birth Year 1955 | | Trustee | | Since
January
2015 | | Chief Executive Officer, Virginia Commonwealth University Investment Company (since November 2015); Owner, OBIR, LLC (institutional investment management consulting) (since June 2014); formerly, Managing Director, BlackRock, Inc. (February 2011-December 2013); and Chief Executive Officer, General Motors Asset Management (a/k/a Promark Global Advisors, Inc.) (June 2005-May 2010). | | 87 | | Formerly, Member of Virginia Commonwealth University School of Business Foundation (2005-2016); Member of Virginia Commonwealth University Board of Visitors (2013-2015); Member of Committee on Directors for Emerging Markets Growth Fund, Inc. (2007-2010); Chairperson of Performance Equity Management, LLC (2006-2010); and Chairperson, GMAM Absolute Return Strategies Fund, LLC (2006-2010). | |
25
Morgan Stanley Institutional Fund Trust
Annual Report — September 30, 2020
Trustee and Officer Information (unaudited) (cont'd)
Independent Trustees: (cont'd)
Name, Address and Birth Year
of Independent Trustee | | Position(s)
Held with
Registrant | | Length of Time
Served* | | Principal Occupation(s) During Past 5 Years
and Other Relevant Professional Experience | | Number of
Funds in
Fund Complex
Overseen by
Independent
Trustee** | | Other Directorships
Held by Independent
Trustee*** | |
Jakki L. Haussler
c/o Perkins Coie LLP
Counsel to the Independent Trustees
1155 Avenue of the Americas, 22nd Floor
New York, NY 10036
Birth Year 1957 | | Trustee | | Since
January
2015 | | Chairman, Opus Capital Group (since January 1996); formerly, Chief Executive Officer, Opus Capital Group (1996-2019); Director, Capvest Venture Fund, LP (May 2000-December 2011); Partner, Adena Ventures, LP (July 1999-December 2010); Director, The Victory Funds (February 2005-July 2008). | | 87 | | Director of Service Corporation International and Member, Audit Committee and Investment Committee; Director of Cincinnati Bell Inc. and Member, Audit Committee and Governance and Nominating Committee; Director of Northern Kentucky University Foundation and Member, Investment Committee; Member of Chase College of Law Transactional Law Practice Center Board of Advisors; Director of Chase College of Law Board of Visitors; formerly, Member, University of Cincinnati Foundation Investment Committee; Member, Miami University Board of Visitors (2008-2011); Trustee of Victory Funds (2005-2008) and Chairman, Investment Committee (2007-2008); Member, Service Provider Committee (2005-2008) and Director of Best Transport (2006-2019). | |
Dr. Manuel H. Johnson
c/o Johnson Smick
International, Inc.
220 I Street, NE — Suite 200 Washington, D.C. 20002
Birth Year 1949 | | Trustee | | Since
July
1991 | | Senior Partner, Johnson Smick International, Inc. (consulting firm); Chairperson of the Investment Committee (since October 2006) and Director or Trustee of various Morgan Stanley Funds (since July 1991); Co-Chairman and a founder of the Group of Seven Council (G7C) (international economic commission); formerly, Chairperson of the Audit Committee (July 1991-September 2006), Vice Chairman of the Board of Governors of the Federal Reserve System and Assistant Secretary of the U.S. Treasury. | | 86 | | Director of NVR, Inc. (home construction). | |
Joseph J. Kearns
c/o Perkins Coie LLP
Counsel to the Independent Trustees
1155 Avenue of the Americas, 22nd Floor
New York, NY 10036
Birth Year 1942 | | Trustee | | Since
August
1994 | | Senior Adviser, Kearns & Associates LLC (investment consulting); Chairperson of the Audit Committee (since October 2006) and Director or Trustee of various Morgan Stanley Funds (since August 1994); Director, Rubicorn Investments (since February 2019); formerly, Deputy Chairperson of the Audit Committee (July 2003-September 2006) and Chairperson of the Audit Committee of various Morgan Stanley Funds (since August 1994); CFO of the J. Paul Getty Trust (1982-1999). | | 87 | | Prior to August 10, 2016, Director of Electro Rent Corporation (equipment leasing); Prior to December 31, 2013, Director of The Ford Family Foundation. | |
26
Morgan Stanley Institutional Fund Trust
Annual Report — September 30, 2020
Trustee and Officer Information (unaudited) (cont'd)
Independent Trustees: (cont'd)
Name, Address and Birth Year
of Independent Trustee | | Position(s)
Held with
Registrant | | Length of Time
Served* | | Principal Occupation(s) During Past 5 Years
and Other Relevant Professional Experience | | Number of
Funds in
Fund Complex
Overseen by
Independent
Trustee** | | Other Directorships
Held by Independent
Trustee*** | |
Michael F. Klein
c/o Perkins Coie LLP
Counsel to the Independent Trustees
1155 Avenue of the Americas, 22nd Floor
New York, NY 10036
Birth Year 1958 | | Trustee | | Since
August
2006 | | Managing Director, Aetos Alternatives Management, LP (since March 2000); Co-President, Aetos Alternatives Management, LP (since January 2004) and Co-Chief Executive Officer of Aetos Alternatives Management, LP (since August 2013); Chairperson of the Fixed Income Sub-Committee of the Investment Committee (since October 2006) and Director or Trustee of various Morgan Stanley Funds (since August 2006); formerly, Managing Director, Morgan Stanley & Co. Inc. and Morgan Stanley Dean Witter Investment Management and President, various Morgan Stanley Funds (June 1998-March 2000); Principal, Morgan Stanley & Co. Inc. and Morgan Stanley Dean Witter Investment Management (August 1997-December 1999). | | 86 | | Director of certain investment funds managed or sponsored by Aetos Alternatives Management, LP; Director of Sanitized AG and Sanitized Marketing AG (specialty chemicals). | |
Patricia Maleski
c/o Perkins Coie LLP
Counsel to the Independent Trustees
1155 Avenue of the Americas, 22nd Floor
New York, NY 10036
Birth Year 1960 | | Trustee | | Since
January
2017 | | Managing Director, JPMorgan Asset Management (2004-2016); Oversight and Control Head of Fiduciary and Conflicts of Interest Program (2015-2016); Chief Control Officer-Global Asset Management (2013-2015); President, JPMorgan Funds (2010-2013); Chief Administrative Officer (2004-2013); various other positions including Treasurer and Board Liaison (since 2001). | | 87 | | None. | |
W. Allen Reed
c/o Perkins Coie LLP
Counsel to the Independent Trustees
1155 Avenue of the Americas, 22nd Floor
New York, NY 10036
Birth Year 1947 | | Chair of the Board and Trustee | | Chair of the Boards since August 2020 and Trustee since August 2006 | | Chair of the Boards of various Morgan Stanley Funds (since August 2020); Chairperson of the Governance Committee; Chairperson of the Equity Sub-Committee of the Investment Committee (since October 2006) and Director or Trustee of various Morgan Stanley Funds (since August 2006); formerly, Vice Chair of the Boards of various Morgan Stanley Funds (January 2020-August 2020); President and Chief Executive Officer of General Motors Asset Management; Chairman and Chief Executive Officer of the GM Trust Bank and Corporate Vice President of General Motors Corporation (August 1994-December 2005). | | 86 | | Formerly, Director of Legg Mason, Inc. (2006-2019); and Director of the Auburn University Foundation (2010-2015). | |
* This is the earliest date the Trustee began serving the Morgan Stanley Funds. Each Trustee serves an indefinite term, until his or her successor is elected.
** The Fund Complex includes (as of December 31, 2019) all open-end and closed-end funds (including all of their portfolios) advised by Morgan Stanley Investment Management Inc. (the "Adviser") and any funds that have an adviser that is an affiliated person of the Adviser (including, but not limited to, Morgan Stanley AIP GP LP).
*** This includes any directorships at public companies and registered investment companies held by the Trustee at any time during the past five years.
27
Morgan Stanley Institutional Fund Trust
Annual Report — September 30, 2020
Trustee and Officer Information (unaudited) (cont'd)
Executive Officers:
Name, Address and Birth Year
of Executive Officer | | Position(s) Held
with
Registrant | | Length of
Time Served* | | Principal Occupation(s) During Past 5 Years | |
John H. Gernon
522 Fifth Avenue
New York, NY 10036
Birth Year 1963 | | President and Principal Executive Officer | | Since September 2013 | | President and Principal Executive Officer of the Equity and Fixed Income Funds and the Morgan Stanley AIP Funds (since September 2013) and the Liquidity Funds and various money market funds (since May 2014) in the Fund Complex; Managing Director of the Adviser; Head of Public Markets Product Development (since 2006). | |
Timothy J. Knierim
522 Fifth Avenue
New York, NY 10036
Birth Year 1959 | | Chief Compliance Officer | | Since December 2016 | | Managing Director of the Adviser and various entities affiliated with the Adviser; Chief Compliance Officer of various Morgan Stanley Funds and the Adviser (since December 2016) and Chief Compliance Officer of Morgan Stanley AIP GP LP (since 2014). Formerly, Managing Director and Deputy Chief Compliance Officer of the Adviser (2014-2016); and formerly, Chief Compliance Officer of Prudential Investment Management, Inc. (2007-2014). | |
Francis J. Smith
522 Fifth Avenue
New York, NY 10036
Birth Year 1965 | | Treasurer and Principal Financial Officer | | Treasurer since July 2003 and Principal Financial Officer since September 2002 | | Managing Director of the Adviser and various entities affiliated with the Adviser; Treasurer (since July 2003) and Principal Financial Officer of various Morgan Stanley Funds (since September 2002). | |
Mary E. Mullin
522 Fifth Avenue
New York, NY 10036
Birth Year 1967 | | Secretary | | Since
June
1999 | | Managing Director of the Adviser; Secretary of various Morgan Stanley Funds (since June 1999). | |
Michael J. Key
522 Fifth Avenue
New York, NY 10036
Birth Year 1979 | | Vice President | | Since
June
2017 | | Vice President of the Equity and Fixed Income Funds, Liquidity Funds, various money market funds and the Morgan Stanley AIP Funds in the Fund Complex (since June 2017); Executive Director of the Adviser; Head of Product Development for Equity and Fixed Income Funds (since August 2013). | |
* This is the earliest date the officer began serving the Morgan Stanley Funds. Each officer serves a one-year term, until his or her successor is elected and qualifies.
28
Morgan Stanley Institutional Fund Trust
Annual Report — September 30, 2020
Adviser and Administrator
Morgan Stanley Investment Management Inc.
522 Fifth Avenue
New York, New York 10036
Distributor
Morgan Stanley Distribution, Inc.
522 Fifth Avenue
New York, New York 10036
Dividend Disbursing and Transfer Agent
DST Asset Manager Solutions, Inc.
2000 Crown Colony Drive
Quincy, Massachusetts 02169
Custodian
State Street Bank and Trust Company
One Lincoln Street
Boston, Massachusetts 02111
Legal Counsel
Dechert LLP
1095 Avenue of the Americas
New York, New York 10036
Counsel to the Independent Trustees
Perkins Coie LLP
1155 Avenue of the Americas,
22nd Floor
New York, New York 10036
Independent Registered Public Accounting Firm
Ernst & Young LLP
200 Clarendon Street
Boston, Massachusetts 02116
Reporting to Shareholders
Each Morgan Stanley fund provides a complete schedule of portfolio holdings in its Semi-Annual and the Annual Reports within 60 days of the end of the fund's second and fourth fiscal quarters. The Semi-Annual and Annual Reports are filed electronically with the Securities and Exchange Commission ("SEC") on Form N-CSRS and Form N-CSR, respectively. Morgan Stanley also delivers the Semi-Annual and Annual Reports to fund shareholders and makes these reports available on its public website, www.morganstanley.com/im/shareholderreports. Each Morgan Stanley non-money market fund also files a complete schedule of portfolio holdings with the SEC for the fund's first and third fiscal quarters as an attachment to Form N-PORT. Morgan Stanley does not deliver the reports for the first and third fiscal quarters to shareholders, nor are the reports posted to the Morgan Stanley public website. However, the holdings for each money market fund are posted to the Morgan Stanley public website. You may obtain the Form N-PORT filings (as well as the Form N-CSR and N-CSRS filings) by accessing the SEC's website, www.sec.gov. You can also request copies of these materials, upon payment of a duplicating fee, by electronic request at the SEC's email address (publicinfo@sec.gov).
Proxy Voting Policies and Procedures and Proxy Voting Record
You may obtain a copy of the Trust's Proxy Voting Policy and Procedures and information regarding how the Trust voted proxies relating to portfolio securities during the most recent twelve-month period ended June 30, without charge, upon request, by calling toll free 1 (800) 548-7786 or by visiting our website at www.morganstanley.com/im/shareholderreports. This information is also available on the SEC's website at www.sec.gov.
This report is authorized for distribution only when preceded or accompanied by a prospectus or summary prospectus of the applicable Fund of Morgan Stanley Institutional Fund Trust, which describes in detail the Fund's investment policies, risks, fees and expenses. Please read the prospectus carefully before you invest or send money. For additional information, including information regarding the investments comprising the Fund, please visit our website at www.morganstanley.com/im/shareholderreports or call toll free 1 (800) 548-7786.
29
Printed in U.S.A.
This Report has been prepared for shareholders and may be distributed to others only if preceded or accompanied by a current prospectus.
Morgan Stanley Investment Management Inc.
522 Fifth Avenue
New York, New York 10036
© 2020 Morgan Stanley. Morgan Stanley Distribution, Inc.

IFTIMIANN
3299188 EXP 11.30.21

Morgan Stanley Institutional Fund Trust
Municipal Income Portfolio
Annual Report
September 30, 2020
Beginning on January 1, 2021, as permitted by regulations adopted by the Securities and Exchange Commission ("SEC"), paper copies of the Fund's Annual and Semi-Annual Reports to Shareholders ("Shareholder Reports") will no longer be sent by mail, unless you specifically request paper copies of the Shareholder Reports from the Fund or from your financial intermediary, such as a broker-dealer or a bank. Instead, the Shareholder Reports will be made available on the Fund's website, https://www.morganstanley.com/im/shareholderreports and you will be notified by mail each time a Shareholder Report is posted and provided with a website link to access the Shareholder Report. If you already elected to receive Shareholder Reports electronically, you will not be affected by this change and you need not take any action. You may elect to receive Shareholder Reports and other communications from the Fund electronically anytime by contacting your financial intermediary or, if you are a direct investor, please follow the instructions on the envelope.
Beginning on January 1, 2019, you may elect to receive all future Shareholder Reports in paper free of charge. If you invest through a financial intermediary, you can contact your financial intermediary to request that you continue to receive paper copies of your Shareholder Reports. If you invest directly with the Fund, please follow the instructions on the envelope to let the Fund know you wish to continue receiving paper copies of your Shareholder Reports. Your election to receive Shareholder Reports in paper will apply to all funds held in your account if you invest through your financial intermediary or all funds held with the fund complex if you invest directly with a fund.

Morgan Stanley Institutional Fund Trust
Annual Report — September 30, 2020
Shareholders' Letter | | | 2 | | |
Expense Example | | | 3 | | |
Investment Overview | | | 4 | | |
Portfolio of Investments | | | 5 | | |
Statement of Assets and Liabilities | | | 7 | | |
Statement of Operations | | | 8 | | |
Statement of Changes in Net Assets | | | 9 | | |
Financial Highlights | | | 10 | | |
Notes to Financial Statements | | | 14 | | |
Report of Independent Registered Public Accounting Firm | | | 19 | | |
Investment Advisory Agreement Approval | | | 20 | | |
Liquidity Risk Management Program | | | 22 | | |
Privacy Notice | | | 23 | | |
Trustee and Officer Information | | | 25 | | |
This report is authorized for distribution only when preceded or accompanied by a prospectus or summary prospectus of the applicable Fund of the Morgan Stanley Institutional Fund Trust. To receive a prospectus and/or statement of additional information ("SAI"), which contains more complete information such as investment objectives, charges, expenses, policies for voting proxies, risk considerations and describes in detail each of the Fund's investment policies to the prospective investor, please call toll free 1 (800) 548-7786. Please read the prospectuses carefully before you invest or send money.
Additionally, you can access information about the Fund, including performance, characteristics and investment team commentary, through Morgan Stanley Investment Management's website: www.morganstanley.com/im/shareholderreports.
Market forecasts provided in this report may not necessarily come to pass. There is no guarantee that any sectors mentioned will continue to perform as discussed herein or that securities in such sectors will be held by the Fund in the future. There is no assurance that a fund will achieve its investment objective. Funds are subject to market risk, which is the possibility that market values of securities owned by the Fund will decline and, therefore, the value of the Fund's shares may be less than what you paid for them. Accordingly, you can lose money investing in this Fund. Please see the prospectus for more complete information on investment risks.
1
Morgan Stanley Institutional Fund Trust
Annual Report — September 30, 2020
Shareholders' Letter (unaudited)
Dear Shareholders,
We are pleased to provide this Annual Report, in which you will learn how your investment in Municipal Income Portfolio (the "Fund") performed during the period ended September 30, 2020 (when the Fund commenced operations).
Morgan Stanley Investment Management is a client-centric, investor-led organization. Our global presence, intellectual capital, and breadth of products and services enable us to partner with investors to meet the evolving challenges of today's financial markets. We aim to deliver superior investment service and to empower our clients to make the informed decisions that help them reach their investment goals.
As always, we thank you for selecting Morgan Stanley Investment Management, and look forward to working with you in the months and years ahead.
Sincerely,

John H. Gernon
President and Principal Executive Officer
October 2020
2
Morgan Stanley Institutional Fund Trust
Annual Report — September 30, 2020
Expense Example (unaudited)
Municipal Income Portfolio
As a shareholder of the Fund, you may incur two types of costs: (1) transactional costs, including sales charge (loads) on purchase payments; and (2) ongoing costs, which may include advisory fees, administration fees, distribution and shareholder services fees; and other Fund expenses. This example is intended to help you understand your ongoing costs (in dollars) of investing in the Fund and to compare these costs with the ongoing costs of investing in other mutual funds.
This example is based on an investment of $1,000 invested at the beginning of the period and held for the entire period 9/30/20-9/30/20.
Actual Expenses
The table below provides information about actual account values and actual expenses. You may use the information in this table, together with the amount you invested, to estimate the expenses that you paid over the period. Simply divide your account value by $1,000 (for example, an $8,600 account value divided by $1,000 = 8.6), then multiply the result by the number in the table under the heading entitled "Actual Expenses Paid During Period" to estimate the expenses you paid on your account during this period.
Hypothetical Example for Comparison Purposes
The table below provides information about hypothetical account values and hypothetical expenses based on the Fund's actual expense ratio and an assumed rate of return of 5% per year before expenses, which is not the Fund's actual return. The hypothetical account values and expenses may not be used to estimate the actual ending account balance or expenses you paid for the period. You may use this information to compare the ongoing costs of investing in the Fund and other funds. To do so, compare this 5% hypothetical example with the 5% hypothetical examples that appear in the shareholder reports of the other funds.
Please note that the expenses shown in the table are meant to highlight your ongoing costs only and do not reflect any transactional costs, such as sales charges (loads, if applicable). Therefore, the information for each class in the table is useful in comparing ongoing costs only, and will not help you determine the relative total costs of owning different funds. In addition, if these transactional costs were included, your costs would have been higher.
| | | Beginning
Account
Value
9/30/20 | | Actual Ending
Account
Value
9/30/20 | | Hypothetical
Ending Account
Value | | Actual
Expenses
Paid
During
Period* | | Hypothetical
Expenses Paid
During Period* | | Net
Expense
Ratio
During
Period** | |
Municipal Income Portfolio Class I^ | | $ | 1,000.00 | | | $ | 1,000.00 | | | $ | 1,000.12 | | | $ | 0.01 | | | $ | 0.01 | | | | 0.51 | % | |
Municipal Income Portfolio Class A^ | | | 1,000.00 | | | | 1,000.00 | | | | 1,000.11 | | | | 0.02 | | | | 0.02 | | | | 0.90 | | |
Municipal Income Portfolio Class C^ | | | 1,000.00 | | | | 1,000.00 | | | | 1,000.09 | | | | 0.05 | | | | 0.05 | | | | 1.65 | | |
Municipal Income Portfolio Class IS^ | | | 1,000.00 | | | | 1,000.00 | | | | 1,000.12 | | | | 0.01 | | | | 0.01 | | | | 0.50 | | |
* Expenses are calculated using each Fund Class' annualized net expense ratio (as disclosed), multiplied by the average account value over the period and multiplied by 1/366 (to reflect the actual days in the period).
** Annualized.
^ The Fund commenced operations on September 30, 2020.
3
Morgan Stanley Institutional Fund Trust
Annual Report — September 30, 2020
Investment Overview (unaudited)
Municipal Income Portfolio
The Fund seeks to provide a high level of current income exempt from federal income tax, consistent with the preservation of capital.
Performance
The Fund's inception (September 30, 2020) was the same day as the close of the fiscal year on September 30, 2020.
Factors Affecting Performance
• As of the end of the reporting period, the Fund did not have any performance history.
Management Strategies
• The Fund invests in municipal securities, the income from which is exempt from federal income tax, using a combination of top-down and bottom-up research to determine duration and yield positioning, sector and credit quality allocation, and security selection. The Fund targets an average portfolio duration of +/- 3 years of the average duration of its benchmark, the Bloomberg Barclays Municipal Bond Index.
4
Morgan Stanley Institutional Fund Trust
Annual Report — September 30, 2020
Portfolio of Investments
Municipal Income Portfolio
| | | Face
Amount
(000) | | Value
(000) | |
Fixed Income Securities (18.8%) | |
Municipal Bonds (18.8%) | |
Arizona (1.1%) | |
Salt Verde Financial Corp.
Senior Gas Revenue Bonds 2007-1
5.00%, 12/1/37 | | $ | 200 | | | $ | 271 | | |
California (1.4%) | |
State of California Various Purpose
General Obligation Refunding Bonds | |
5.00%, 11/1/30 | | | 250 | | | | 341 | | |
Colorado (1.3%) | |
City of Colorado Springs
Utilities System Revenue | |
5.00%, 11/15/50 | | | 250 | | | | 327 | | |
Connecticut (1.0%) | |
Connecticut State General Obligation
Bonds 2019 Series A | |
5.00%, 4/15/31 | | | 200 | | | | 258 | | |
Florida (2.3%) | |
Jacksonville Special Revenue and
Refunding Bonds Series 2020A | |
5.00%, 10/1/26 | | | 250 | | | | 315 | | |
School Board of Miami-Dade County (The)
TANs, Series 2020 | |
2.00%, 2/25/21 | | | 250 | | | | 252 | | |
| | | | 567 | | |
Massachusetts (1.3%) | |
University of Massachusetts Building
Authority Refunding Revenue
Bonds Senior Series 2019-1 | |
5.00%, 5/1/29 | | | 250 | | | | 335 | | |
New York (3.6%) | |
City of New York General Obligation
Bonds Fiscal 2020 Series D | |
5.00%, 3/1/43 | | | 250 | | | | 307 | | |
New York City Transitional Finance
Authority Future Tax Secured
Revenue 2021 Series C | |
4.00%, 5/1/44 | | | 250 | | | | 289 | | |
Port Authority of New York & New Jersey
Consolidated Bonds Two Hundred Twelfth Series | |
5.00%, 9/1/35 | | | 250 | | | | 314 | | |
| | | | 910 | | |
Pennsylvania (1.4%) | |
Pennsylvania State General Obligation Bonds,
First Series of 2020 | |
5.00%, 5/1/31 | | | 250 | | | | 336 | | |
South Carolina (1.0%) | |
South Carolina Transportation Infrastructure
Bank Revenue Refunding Bonds,
Series 2003B | |
1 Month USD LIBOR + 0.45%, 0.55%, 10/1/31 (a) | | | 250 | | | | 249 | | |
| | | Face
Amount
(000) | | Value
(000) | |
Texas (3.2%) | |
Georgetown Independent School District
Variable Rate Unlimited Tax
School Building Bonds,
Series 2016-B | |
2.00%, 8/1/41 | | $ | 250 | | | $ | 262 | | |
Love Field Airport Modernization Corp.
General Airport Revenue Bonds,
Series 2017 A (AMT) | |
5.00%, 11/1/31 | | | 250 | | | | 291 | | |
Pasadena Independent School District
Variable Rate Unlimited Tax
School Building Bonds,
Series 2015B | |
1.50%, 2/15/44 | | | 240 | | | | 251 | | |
| | | | 804 | | |
Washington (1.2%) | |
King County Sewer Improvement and
Refunding Revenue Bonds | |
4.00%, 1/1/46 | | | 250 | | | | 293 | | |
Total Fixed Income Securities (Cost $4,696) | | | 4,691 | | |
Total Investments (18.8%) (Cost $4,696) (b) | | | 4,691 | | |
Other Assets in Excess of Liabilities (81.2%) | | | 20,303 | | |
Net Assets (100.0%) | | $ | 24,994 | | |
(a) Floating or variable rate securities: The rates disclosed are as of September 30, 2020. For securities based on a published reference rate and spread, the reference rate and spread are indicated in the description in the Portfolio of Investments. Certain variable rate securities may not be based on a published reference rate and spread but are determined by the issuer or agent and are based on current market conditions. These securities do not indicate a reference rate and spread in their description in the Portfolio of Investments.
(b) At September 30, 2020, the aggregate cost for federal income tax purposes is approximately $4,696,000. The aggregate gross unrealized appreciation is approximately $7,000 and the aggregate gross unrealized depreciation is approximately $12,000, resulting in net unrealized depreciation of approximately $5,000.
AMT Alternative Minimum Tax.
LIBOR London Interbank Offered Rate.
TANs Tax Anticipation Notes.
USD United States Dollar
The accompanying notes are an integral part of the financial statements.
5
Morgan Stanley Institutional Fund Trust
Annual Report — September 30, 2020
Portfolio of Investments (cont'd)
Municipal Income Portfolio
Summary of Investments by State
Classification | | Percentage of
Total Investments | |
New York | | | 19.4 | % | |
Texas | | | 17.1 | | |
Florida | | | 12.1 | | |
California | | | 7.3 | | |
Pennsylvania | | | 7.2 | | |
Massachusetts | | | 7.1 | | |
Colorado | | | 7.0 | | |
Washington | | | 6.2 | | |
Arizona | | | 5.8 | | |
Connecticut | | | 5.5 | | |
South Carolina | | | 5.3 | | |
Total Investments | | | 100.0 | % | |
The accompanying notes are an integral part of the financial statements.
6
Morgan Stanley Institutional Fund Trust
Annual Report — September 30, 2020
Municipal Income Portfolio
Statement of Assets and Liabilities | | September 30, 2020
(000) | |
Assets: | |
Investments in Securities of Unaffiliated Issuers, at Value (Cost $4,696) | | $ | 4,691 | | |
Cash | | | 25,000 | | |
Prepaid Offering Costs | | | 131 | | |
Due from Adviser | | | 73 | | |
Interest Receivable | | | 27 | | |
Total Assets | | | 29,922 | | |
Liabilities: | |
Payable for Investments Purchased | | | 4,723 | | |
Payable for Offering Costs | | | 131 | | |
Payable for Professional Fees | | | 67 | | |
Payable for Transfer Agency Fees — Class I | | | — | @ | |
Payable for Transfer Agency Fees — Class A | | | — | @ | |
Payable for Transfer Agency Fees — Class C | | | — | @ | |
Payable for Shareholder Services Fees — Class A | | | — | @ | |
Payable for Distribution and Shareholder Services Fees — Class C | | | — | @ | |
Payable for Custodian Fees | | | — | @ | |
Payable for Administration Fees | | | — | @ | |
Other Liabilities | | | 7 | | |
Total Liabilities | | | 4,928 | | |
Net Assets | | $ | 24,994 | | |
Net Assets Consist of: | |
Paid-in-Capital | | $ | 25,000 | | |
Total Accumulated Loss | | | (6 | ) | |
Net Assets | | $ | 24,994 | | |
CLASS I: | |
Net Assets | | $ | 24,964 | | |
| Shares Outstanding (unlimited number of shares authorized, no par value) (not in 000's) | | | 2,497,000 | | |
Net Asset Value, Offering and Redemption Price Per Share | | $ | 10.00 | | |
CLASS A: | |
| Net Assets | | $ | 10 | | |
| Shares Outstanding (unlimited number of shares authorized, no par value) (not in 000's) | | | 1,000 | | |
Net Asset Value, Redemption Price Per Share | | $ | 10.00 | | |
Maximum Sales Load | | | 3.25 | % | |
Maximum Sales Charge | | $ | 0.33 | | |
Maximum Offering Price Per Share | | $ | 10.33 | | |
CLASS C: | |
Net Assets | | $ | 10 | | |
| Shares Outstanding (unlimited number of shares authorized, no par value) (not in 000's) | | | 1,000 | | |
Net Asset Value, Offering and Redemption Price Per Share | | $ | 10.00 | | |
CLASS IS: | |
Net Assets | | $ | 10 | | |
| Shares Outstanding (unlimited number of shares authorized, no par value) (not in 000's) | | | 1,000 | | |
Net Asset Value, Offering and Redemption Price Per Share | | $ | 10.00 | | |
@ Amount is less than $500.
The accompanying notes are an integral part of the financial statements.
7
Morgan Stanley Institutional Fund Trust
Annual Report — September 30, 2020
Municipal Income Portfolio
Statement of Operations | | Period Ended
September 30, 2020^
(000) | |
Expenses: | |
Professional Fees | | $ | 67 | | |
Shareholder Reporting Fees | | | 5 | | |
Transfer Agency Fees — Class I (Note E) | | | — | @ | |
Transfer Agency Fees — Class A (Note E) | | | — | @ | |
Transfer Agency Fees — Class C (Note E) | | | — | @ | |
Transfer Agency Fees — Class IS (Note E) | | | — | @ | |
Shareholder Services Fees — Class A (Note D) | | | — | @ | |
Distribution and Shareholder Services Fees — Class C (Note D) | | | — | @ | |
Advisory Fees (Note B) | | | — | @ | |
Custodian Fees (Note F) | | | — | @ | |
Administration Fees (Note C) | | | — | @ | |
Pricing Fees | | | — | @ | |
Offering Costs | | | — | @ | |
Other Expenses | | | 2 | | |
Total Expenses | | | 74 | | |
Expenses Reimbursed by Adviser (Note B) | | | (73 | ) | |
Reimbursement of Class Specific Expenses — Class A (Note B) | | | (— | @) | |
Reimbursement of Class Specific Expenses — Class C (Note B) | | | (— | @) | |
Reimbursement of Class Specific Expenses — Class IS (Note B) | | | (— | @) | |
Waiver of Advisory Fees (Note B) | | | (— | @) | |
Net Expenses | | | 1 | | |
Net Investment Loss | | | (1 | ) | |
Change in Unrealized Appreciation (Depreciation): | |
Investments | | | (5 | ) | |
Net Decrease in Net Assets Resulting from Operations | | $ | (6 | ) | |
^ Commencement of Operations.
@ Amount is less than $500.
The accompanying notes are an integral part of the financial statements.
8
Morgan Stanley Institutional Fund Trust
Annual Report — September 30, 2020
Municipal Income Portfolio
Statement of Changes in Net Assets | | Period Ended
September 30, 2020^
(000) | |
Increase (Decrease) in Net Assets: | |
Operations: | |
Net Investment Loss | | $ | (1 | ) | |
Net Change in Unrealized Appreciation (Depreciation) | | | (5 | ) | |
Net Decrease in Net Assets Resulting from Operations | | | (6 | ) | |
Capital Share Transactions:(1) | |
Class I: | |
Subscribed | | | 24,970 | | |
Class A: | |
Subscribed | | | 10 | | |
Class C: | |
Subscribed | | | 10 | | |
Class IS: | |
Subscribed | | | 10 | | |
Net Increase in Net Assets Resulting from Capital Share Transactions | | | 25,000 | | |
Total Increase in Net Assets | | | 24,994 | | |
Net Assets: | |
Beginning of Period | | | — | | |
End of Period | | $ | 24,994 | | |
(1) Capital Share Transactions: | |
Class I: | |
Shares Subscribed | | | 2,497 | | |
Class A: | |
Shares Subscribed | | | 1 | | |
Class C: | |
Shares Subscribed | | | 1 | | |
Class IS: | |
Shares Subscribed | | | 1 | | |
^ Commencement of Operations.
The accompanying notes are an integral part of the financial statements.
9
Morgan Stanley Institutional Fund Trust
Annual Report — September 30, 2020
Financial Highlights
Municipal Income Portfolio
| | | Class I | |
Selected Per Share Data and Ratios | | Period Ended
September 30, 2020(1) | |
Net Asset Value, Beginning of Period | | $ | 10.00 | | |
Loss from Investment Operations: | |
Net Investment Loss(2) | | | (0.00 | )(3) | |
Net Realized and Unrealized Loss | | | (0.00 | )(3) | |
Total from Investment Operations | | | (0.00 | )(3) | |
Net Asset Value, End of Period | | $ | 10.00 | | |
Total Return(4) | | | 0.00 | %(5) | |
Ratios to Average Net Assets and Supplemental Data: | |
Net Assets, End of Period (Thousands) | | $ | 24,964 | | |
Ratio of Expenses Before Expense Limitation | | | 2.13 | %(6) | |
Ratio of Expenses After Expense Limitation | | | 0.51 | %(6) | |
Ratio of Net Investment Loss | | | (0.51 | )%(6) | |
Portfolio Turnover Rate | | | 0 | %(5) | |
(1) Commencement of Operations.
(2) Per share amount is based on average shares outstanding.
(3) Amount is less than $0.005 per share.
(4) Calculated based on the net asset value as of the last business day of the period.
(5) Not annualized.
(6) Annualized.
The accompanying notes are an integral part of the financial statements.
10
Morgan Stanley Institutional Fund Trust
Annual Report — September 30, 2020
Financial Highlights
Municipal Income Portfolio
| | | Class A | |
Selected Per Share Data and Ratios | | Period Ended
September 30, 2020(1) | |
Net Asset Value, Beginning of Period | | $ | 10.00 | | |
Loss from Investment Operations: | |
Net Investment Loss(2) | | | (0.00 | )(3) | |
Net Realized and Unrealized Loss | | | (0.00 | )(3) | |
Total from Investment Operations | | | (0.00 | )(3) | |
Net Asset Value, End of Period | | $ | 10.00 | | |
Total Return(4) | | | 0.00 | %(5) | |
Ratios to Average Net Assets and Supplemental Data: | |
Net Assets, End of Period (Thousands) | | $ | 10 | | |
Ratio of Expenses Before Expense Limitation | | | 16.22 | %(6) | |
Ratio of Expenses After Expense Limitation | | | 0.90 | %(6) | |
Ratio of Net Investment Loss | | | (0.90 | )%(6) | |
Portfolio Turnover Rate | | | 0 | %(5) | |
(1) Commencement of Operations.
(2) Per share amount is based on average shares outstanding.
(3) Amount is less than $0.005 per share.
(4) Calculated based on the net asset value which does not reflect sales charges, if applicable, as of the last business day of the period.
(5) Not annualized.
(6) Annualized.
The accompanying notes are an integral part of the financial statements.
11
Morgan Stanley Institutional Fund Trust
Annual Report — September 30, 2020
Financial Highlights
Municipal Income Portfolio
| | | Class C | |
Selected Per Share Data and Ratios | | Period Ended
September 30, 2020(1) | |
Net Asset Value, Beginning of Period | | $ | 10.00 | | |
Loss from Investment Operations: | |
Net Investment Loss(2) | | | (0.00 | )(3) | |
Net Realized and Unrealized Loss | | | (0.00 | )(3) | |
Total from Investment Operations | | | (0.00 | )(3) | |
Net Asset Value, End of Period | | $ | 10.00 | | |
Total Return(4) | | | 0.00 | %(5) | |
Ratios to Average Net Assets and Supplemental Data: | |
Net Assets, End of Period (Thousands) | | $ | 10 | | |
Ratio of Expenses Before Expense Limitation | | | 16.95 | %(6) | |
Ratio of Expenses After Expense Limitation | | | 1.65 | %(6) | |
Ratio of Net Investment Loss | | | (1.65 | )%(6) | |
Portfolio Turnover Rate | | | 0 | %(5) | |
(1) Commencement of Operations.
(2) Per share amount is based on average shares outstanding.
(3) Amount is less than $0.005 per share.
(4) Calculated based on the net asset value which does not reflect sales charges, if applicable, as of the last business day of the period.
(5) Not annualized.
(6) Annualized.
The accompanying notes are an integral part of the financial statements.
12
Morgan Stanley Institutional Fund Trust
Annual Report — September 30, 2020
Financial Highlights
Municipal Income Portfolio
| | | Class IS | |
Selected Per Share Data and Ratios | | Period Ended
September 30, 2020(1) | |
Net Asset Value, Beginning of Period | | $ | 10.00 | | |
Loss from Investment Operations: | |
Net Investment Loss(2) | | | (0.00 | )(3) | |
Net Realized and Unrealized Loss | | | (0.00 | )(3) | |
Total from Investment Operations | | | (0.00 | )(3) | |
Net Asset Value, End of Period | | $ | 10.00 | | |
Total Return(4) | | | 0.00 | %(5) | |
Ratios to Average Net Assets and Supplemental Data: | |
Net Assets, End of Period (Thousands) | | $ | 10 | | |
Ratio of Expenses Before Expense Limitation | | | 15.96 | %(6) | |
Ratio of Expenses After Expense Limitation | | | 0.50 | %(6) | |
Ratio of Net Investment Loss | | | (0.50 | )%(6) | |
Portfolio Turnover Rate | | | 0 | %(5) | |
(1) Commencement of Operations.
(2) Per share amount is based on average shares outstanding.
(3) Amount is less than $0.005 per share.
(4) Calculated based on the net asset value as of the last business day of the period.
(5) Not annualized.
(6) Annualized.
The accompanying notes are an integral part of the financial statements.
13
Morgan Stanley Institutional Fund Trust
Annual Report — September 30, 2020
Notes to Financial Statements
Morgan Stanley Institutional Fund Trust ("Trust'') is registered under the Investment Company Act of 1940, as amended (the "Act"), as an open-end management investment company. The Trust is comprised of twelve separate, active funds (individually referred to as a "Fund," collectively as the "Funds"). The Trust applies investment company accounting and reporting guidance. All Funds are considered diversified for purposes of the Act.
The accompanying financial statements relate to the Municipal Income Portfolio. The Fund seeks to provide a high level of current income exempt from federal income tax, consistent with the preservation of capital.
The Fund commenced operations on September 30, 2020 and offers four classes of shares — Class I, Class A, Class C and Class IS.
A. Significant Accounting Policies: The following significant accounting policies are in conformity with U.S. generally accepted accounting principles ("GAAP"). Such policies are consistently followed by the Trust in the preparation of its financial statements. GAAP may require management to make estimates and assumptions that affect the reported amounts and disclosures in the financial statements. Actual results may differ from those estimates.
In March 2020, the Financial Accounting Standards Board ("FASB") issued an Accounting Standard Update, ASU 2020-04, Reference Rate Reform (Topic 848) — Facilitation of the Effects of Reference Rate Reform on Financial Reporting ("ASU 2020-04"), which provides optional, temporary relief with respect to the financial reporting of contracts subject to certain types of modifications due to the planned discontinuation of the London Interbank Offered Rate ("LIBOR") and other IBOR-based reference rates at the end of 2021. The temporary relief provided by ASU 2020-04 is effective for certain reference rate-related contract modifications that occur during the period from March 12, 2020 through December 31, 2022. Management is evaluating the impact of ASU 2020-04 on the Fund's investments, derivatives, debt and other contracts that will undergo reference rate-related modifications as a result of the reference rate reform.
In August 2018, FASB issued Accounting Standards Update ("ASU") 2018-13, Fair Value Measurement (Topic 820) — Disclosures Framework — Changes to Disclosure Requirements of Fair Value Measurement ("ASU 2018-13") which introduces new fair value disclosure requirements as well as
eliminates and modifies certain existing fair value disclosure requirements. ASU 2018-13 would be effective for fiscal years beginning after December 15, 2019 and for interim periods within those fiscal years; however, management has elected to early adopt ASU 2018-13 as permitted by the standard. The impact of the Fund's adoption was limited to changes in the Fund's financial statement disclosures regarding fair value, primarily those disclosures related to transfers between levels of the fair value hierarchy and disclosure of the range and weighted average used to develop significant unobservable inputs for Level 3 fair value measurements, when applicable.
1. Security Valuation: (1) Certain portfolio securities may be valued by an outside pricing service/vendor approved by the Trust's Board of Trustees (the "Trustees"). The pricing service/vendor may employ a pricing model that takes into account, among other things, bids, yield spreads and/or other market data and specific security characteristics. Alternatively, if a valuation is not available from an outside pricing service/vendor, and the security trades on an exchange, the security may be valued at its latest reported sale price (or at the exchange official closing price if such exchange reports an official closing price), prior to the time when assets are valued. If there are no sales on a given day and if there is no official exchange closing price for that day, the security is valued at the mean between the last reported bid and asked prices if such bid and asked prices are available in the relevant exchanges. If only bid prices are available then the latest bid price may be used. If Morgan Stanley Investment Management Inc. (the "Adviser"), a wholly-owned subsidiary of Morgan Stanley, determines that the price provided by the outside pricing service/vendor or exchange does not reflect the security's fair value or is unable to provide a price, prices from brokers or dealers may also be utilized. In these circumstances, the value of the security will be the mean of bid and asked prices obtained from brokers or dealers; and (2) when market quotations are not readily available, including circumstances under which the Adviser determines that the closing price, last sale price or the mean between the last reported bid and asked prices are not reflective of a security's market value, portfolio securities are valued at their fair value as determined in good faith under procedures established by and under the general supervision of the Trustees. Occasionally, developments affecting the closing prices of securities and other assets may occur between the times at which valuations of such securities
14
Morgan Stanley Institutional Fund Trust
Annual Report — September 30, 2020
Notes to Financial Statements (cont'd)
are determined (that is, close of the foreign market on which the securities trade) and the close of business of the New York Stock Exchange ("NYSE"). If developments occur during such periods that are expected to materially affect the value of such securities, such valuations may be adjusted to reflect the estimated fair value of such securities as of the close of the NYSE, as determined in good faith by the Trustees or by the Adviser using a pricing service and/or procedures approved by the Trustees.
The Trustees have responsibility for determining in good faith the fair value of the investments, and the Trustees may appoint others, such as the Trust's Adviser or a valuation committee, to assist the Trustees in determining fair value and to make the actual calculations pursuant to the fair valuation methodologies previously approved by the Trustees. Under procedures approved by the Trustees, the Trust's Adviser has formed a Valuation Committee whose members are approved by the Trustees. The Valuation Committee provides administration and oversight of the Trust's valuation policies and procedures, which are reviewed at least annually by the Trustees. These procedures allow the Trust to utilize independent pricing services, quotations from securities and financial instrument dealers and other market sources to determine fair value.
2. Fair Value Measurement: FASB Accounting Standards CodificationTM ("ASC") 820, "Fair Value Measurement" ("ASC 820"), defines fair value as the value that the Fund would receive to sell an investment or pay to transfer a liability in a timely transaction with an independent buyer in the principal market, or in the absence of a principal market, the most advantageous market for the investment or liability. ASC 820 establishes a three-tier hierarchy to distinguish between (1) inputs that reflect the assumptions market participants would use in valuing an asset or liability developed based on market data obtained from sources independent of the reporting entity (observable inputs) and (2) inputs that reflect the reporting entity's own assumptions about the assumptions market participants would use in valuing an asset or liability developed based on the best information available in the circumstances (unobservable inputs) and to establish classification of fair value measurements for disclosure purposes. Various inputs are used in determining the value
of the Fund's investments. The inputs are summarized in the three broad levels listed below:
• Level 1 – unadjusted quoted prices in active markets for identical investments
• Level 2 – other significant observable inputs (including quoted prices for similar investments, interest rates, prepayment speeds, credit risk, etc.)
• Level 3 – significant unobservable inputs including the Fund's own assumptions in determining the fair value of investments. Factors considered in making this determination may include, but are not limited to, information obtained by contacting the issuer, analysts, or the appropriate stock exchange (for exchange-traded securities), analysis of the issuer's financial statements or other available documents and, if necessary, available information concerning other securities in similar circumstances.
The inputs or methodology used for valuing securities are not necessarily an indication of the risk associated with investing in those securities and the determination of the significance of a particular input to the fair value measurement in its entirety requires judgment and considers factors specific to each security.
The following is a summary of the inputs used to value the Fund's investments as of September 30, 2020:
Investment Type | | Level 1
Unadjusted
quoted
prices
(000) | | Level 2
Other
significant
observable
inputs
(000) | | Level 3
Significant
unobservable
inputs
(000) | | Total
(000) | |
Assets: | |
Fixed Income Securities | |
Municipal Bonds | | $ | — | | | $ | 4,691 | | | $ | — | | | $ | 4,691 | | |
Total Assets | | $ | — | | | $ | 4,691 | | | $ | — | | | $ | 4,691 | | |
Transfers between investment levels may occur as the markets fluctuate and/or the availability of data used in an investment's valuation changes.
3. Indemnifications: The Trust enters into contracts that contain a variety of indemnifications. The Trust's maximum exposure under these arrangements is unknown. However, the Trust has not had prior claims or losses pursuant to these contracts and expects the risk of loss to be remote.
15
Morgan Stanley Institutional Fund Trust
Annual Report — September 30, 2020
Notes to Financial Statements (cont'd)
4. Dividends and Distributions to Shareholders: Dividends and distributions to shareholders are recorded on the ex-dividend date. Dividends from net investment income, if any, are declared and paid monthly. Net realized capital gains, if any, are distributed at least annually.
5. Security Transactions, Income and Expenses: Security transactions are accounted for on the trade date (date the order to buy or sell is executed). Realized gains and losses on the sale of investment securities are determined on the specific identified cost method. Dividend income and other distributions are recorded on the ex-dividend date (except for certain foreign dividends which may be recorded as soon as the Fund is informed of such dividends) net of applicable withholding taxes. Interest income is recognized on the accrual basis except where collection is in doubt. Discounts are accreted and premiums are amortized over the life of the respective securities. Most expenses of the Trust can be directly attributed to a particular Fund. Expenses which cannot be directly attributed are apportioned among the Funds based upon relative net assets or other appropriate methods. Income, expenses (other than class specific expenses — distribution and shareholder services, transfer agency and sub transfer agency fees) and realized and unrealized gains or losses are allocated to each class of shares based upon their relative net assets.
B. Advisory Fees: The Adviser, a wholly-owned subsidiary of Morgan Stanley, provides the Fund with advisory services under the terms of an Investment Advisory Agreement, paid quarterly, at an annual rate of 0.45% of the average daily net assets of the Fund.
The Adviser has agreed to reduce its advisory fee and/or reimburse the Fund so that total annual Fund operating expenses, excluding certain investment related expenses, taxes, interest and other extraordinary expenses (including litigation), will not exceed 0.55% for Class I shares, 0.90% for Class A shares, 1.65% for Class C shares and 0.50% for Class IS shares. The fee waivers and/or expense reimbursements will continue for at least one year from the date of the Fund's prospectus or until such time as the Trustees act to discontinue all or a portion of such waivers and/or reimbursements when they deem such action is appropriate. The Adviser may make additional voluntary fee waivers and/or expense reimbursements and may discontinue these voluntary fee waivers and/or expense reimbursements at any time in the future. For the period ended September 30, 2020, less than $500 of advisory fees were
waived and approximately $73,000 of other expenses were reimbursed by the Adviser pursuant to this arrangement.
C. Administration Fees: The Adviser also serves as Administrator to the Trust and provides administrative services pursuant to an Administration Agreement for an annual fee, accrued daily and paid monthly, of 0.08% of the Fund's average daily net assets. Under a Sub-Administration Agreement between the Administrator and State Street, State Street provides certain administrative services to the Trust. For such services, the Administrator pays State Street a portion of the fee the Administrator receives from the Fund.
D. Distribution and Shareholder Services Fees: Morgan Stanley Distribution, Inc. ("MSDI" or the "Distributor"), a wholly-owned subsidiary of the Adviser, and an indirect subsidiary of Morgan Stanley, serves as the Trust's Distributor of Fund shares pursuant to a Distribution Agreement. The Trust has adopted a Shareholder Services Plan with respect to Class A shares pursuant to Rule 12b-1 under the Act. Under the Shareholder Services Plan, the Fund pays the Distributor a shareholder services fee, accrued daily and paid monthly, at an annual rate of 0.25% of the Fund's average daily net assets attributable to Class A shares.
The Trust has adopted a Distribution and Shareholder Services Plan with respect to Class C shares pursuant to Rule 12b-1 under the Act. Under the Distribution and Shareholder Services Plan, the Fund pays the Distributor a distribution fee, accrued daily and paid monthly, at an annual rate of 0.75% and a shareholder services fee, accrued daily and paid monthly, at an annual rate of 0.25% of the Fund's average daily net assets attributable to Class C shares.
The distribution and shareholder services fees are used to support the expenses associated with servicing and maintaining accounts. The Distributor may compensate other parties for providing shareholder support services to investors who purchase Class A and Class C shares.
E. Dividend Disbursing and Transfer Agent: The Trust's dividend disbursing and transfer agent is DST Asset Manager Solutions, Inc. ("DST"). Pursuant to a Transfer Agency Agreement, the Trust pays DST a fee based on the number of classes, accounts and transactions relating to the Funds of the Trust.
F. Custodian Fees: State Street (the "Custodian") also serves as Custodian for the Trust in accordance with a Custodian Agreement. The Custodian holds cash, securities and other assets of the Trust as required by the Act. Custody fees
16
Morgan Stanley Institutional Fund Trust
Annual Report — September 30, 2020
Notes to Financial Statements (cont'd)
are payable monthly based on assets held in custody, investment purchases and sales activity and account maintenance fees, plus reimbursement for certain out-of-pocket expenses.
G. Security Transactions and Transactions with Affiliates: For the period ended September 30, 2020, purchases and sales of investment securities for the Fund, other than long-term U.S. Government securities and short-term investments were approximately $4,696,000 and $0, respectively. There were no purchases and sales of long-term U.S. Government securities for the period ended September 30, 2020. For the period ended September 30, 2020, the Fund did not have any transactions in affiliated investments.
The Fund is permitted to purchase and sell securities ("cross-trade") from and to other Morgan Stanley funds as well as other funds and client accounts for which the Adviser or an affiliate of the Adviser serves as investment adviser, pursuant to procedures approved by the Trustees in compliance with Rule 17a-7 under the Act (the "Rule"). Each cross-trade is executed at the current market price in compliance with provisions of the Rule. For the period ended September 30, 2020, the Fund did not engage in any cross-trade transactions.
The Fund has an unfunded Deferred Compensation Plan (the "Compensation Plan"), which allows each independent Trustee to defer payment of all, or a portion, of the fees he or she receives for serving on the Board of Trustees. Each eligible Trustee generally may elect to have the deferred amounts credited with a return equal to the total return on one or more of the Morgan Stanley funds that are offered as investment options under the Compensation Plan. Appreciation/depreciation and distributions received from these investments are recorded with an offsetting increase/decrease in the deferred compensation obligation and do not affect the NAV of the Fund.
H. Federal Income Taxes: It is the Fund's intention to continue to qualify as a regulated investment company and distribute all of its taxable and tax-exempt income. Accordingly, no provision for federal income taxes is required in the financial statements.
The Fund may be subject to taxes imposed by countries in which it invests. Such taxes are generally based on income and/or capital gains earned or repatriated. Taxes are accrued based on net investment income, net realized gains and net unrealized appreciation as such income and/or gains are earned. Taxes may also be based on transactions in foreign currency and are accrued based on the value of investments denominated in such currency.
FASB ASC 740-10, "Income Taxes — Overall", sets forth a minimum threshold for financial statement recognition of the benefit of a tax position taken or expected to be taken in a tax return. Management has concluded there are no significant uncertain tax positions that would require recognition in the financial statements. If applicable, the Fund recognizes interest accrued related to unrecognized tax benefits in "Interest Expense" and penalties in "Other Expenses" in the Statement of Operations. The Fund files tax returns with the U.S. Internal Revenue Service, New York and various states. The tax period ended September 30, 2020, remains subject to examination by taxing authorities.
The tax character of distributions paid may differ from the character of distributions shown for GAAP purposes due to short-term capital gains being treated as ordinary income for tax purposes. There were no distributions paid during fiscal year 2020.
The amount and character of income and gains to be distributed are determined in accordance with income tax regulations which may differ from GAAP. These book/tax differences are either considered temporary or permanent in nature.
Temporary differences are attributable to differing book and tax treatments for the timing of the recognition of gains (losses) on certain investment transactions and the timing of the deductibility of certain expenses.
Permanent differences, due to a net operating loss, resulted in the following reclassifications among the components of net assets at September 30, 2020:
Total
Accumulated
Loss
(000) | | Paid-in-
Capital
(000) | |
| $ | — | @ | | $ | (— | @) | |
@ Amount is less than $500.
At September 30, 2020, the Fund had no distributable earnings on a tax basis.
I. Other: At September 30, 2020, the Fund did not have record owners of 10% or greater.
J. Market Risk: Certain impacts to public health conditions particular to the coronavirus (COVID-19) outbreak could impact the operations and financial performance of certain of the Fund's investments. The extent of the impact to the financial performance of the Fund's investments will depend on future developments, including (i) the duration and spread of the outbreak, (ii) the restrictions and advisories, (iii) the effects on
17
Morgan Stanley Institutional Fund Trust
Annual Report — September 30, 2020
Notes to Financial Statements (cont'd)
the financial markets, and (iv) the effects on the economy overall, all of which are highly uncertain and cannot be predicted. If the financial performance of the Fund's investments is impacted because of these factors for an extended period, the Fund's investment results may be adversely affected.
K. LIBOR Risk. The Fund's investments, payment obligations and financing terms may be based on floating rates, such as London Interbank Offer Rate ("LIBOR"), Euro Interbank Offered Rate and other similar types of reference rates (each, a "Reference Rate"). These Reference Rates are generally intended to represent the rate at which contributing banks may obtain short-term borrowings from each other within certain financial markets. On July 27, 2017, the Chief Executive of the UK Financial Conduct Authority ("FCA"), which regulates LIBOR, announced that the FCA will no longer persuade nor require banks to submit rates for the calculation of LIBOR and certain other Reference Rates after 2021. Such announcement indicates that the continuation of LIBOR and other Reference Rates on the current basis cannot and will not be guaranteed after the end of 2021. This announcement and any additional regulatory or market changes may have an adverse impact on the Fund or its investments.
In advance of 2022, regulators and market participants are currently engaged in identifying successor Reference Rates ("Alternative Reference Rates"). Additionally, prior to the end of 2021, it is expected that market participants will focus on the transition mechanisms by which the Reference Rates in existing contracts or instruments may be amended, whether through marketwide protocols, fallback contractual provisions, bespoke negotiations or amendments or otherwise. Nonetheless, the termination of certain Reference Rates presents risks to the Fund. At this time, it is not possible to completely identify or predict the effect of any such changes, any establishment of Alternative Reference Rates or any other reforms to Reference Rates that may be enacted in the UK or elsewhere. The elimination of a Reference Rate or any other changes or reforms to the determination or supervision of Reference Rates could have an adverse impact on the market for or value of any securities or payments linked to those Reference Rates and other financial obligations held by the Fund or on its overall financial condition or results of operations.
18
Morgan Stanley Institutional Fund Trust
Annual Report — September 30, 2020
Report of Independent Registered Public Accounting Firm
To the Shareholders and Board of Trustees of
Morgan Stanley Institutional Fund Trust —
Municipal Income Portfolio
Opinion on the Financial Statements
We have audited the accompanying statement of assets and liabilities of Municipal Income Portfolio (the "Fund") (one of the funds constituting Morgan Stanley Institutional Fund Trust (the "Trust")), including the portfolio of investments, as of September 30, 2020, and the related statements of operations and changes in net assets and the financial highlights for the period from September 30, 2020 (commencement of operations) through September 30, 2020 and the related notes (collectively referred to as the "financial statements"). In our opinion, the financial statements present fairly, in all material respects, the financial position of Municipal Income Portfolio (one of the funds constituting Morgan Stanley Institutional Fund Trust) at September 30, 2020, the results of its operations and the changes in its net assets and its financial highlights for the period from September 30, 2020 (commencement of operations) through September 30, 2020, in conformity with U.S. generally accepted accounting principles.
Basis for Opinion
These financial statements are the responsibility of the Trust's management. Our responsibility is to express an opinion on the Fund's financial statements based on our audit. We are a public accounting firm registered with the Public Company Accounting Oversight Board (United States) ("PCAOB") and are required to be independent with respect to the Trust in accordance with the U.S. federal securities law and the applicable rules and regulations of the Securities and Exchange Commission and the PCAOB.
We conducted our audit in accordance with the standards of the PCAOB. Those standards require that we plan and perform the audit to obtain reasonable assurance about whether the financial statements are free of material misstatement, whether due to error or fraud. The Trust is not required to have, nor were we engaged to perform, an audit of the Trust's internal control over financial reporting. As part of our audit, we are required to obtain an understanding of internal control over financial reporting, but not for the purpose of expressing an opinion on the effectiveness of the Trust's internal control over financial reporting. Accordingly, we express no such opinion.
Our audit included performing procedures to assess the risks of material misstatement of the financial statements, whether due to error or fraud, and performing procedures that respond to those risks. Such procedures included examining, on a test basis, evidence regarding the amounts and disclosures in the financial statements. Our procedures included confirmation of securities owned as of September 30, 2020 by correspondence with the custodian and brokers or by other appropriate auditing procedures where replies from brokers were not received. Our audit also included evaluating the accounting principles used and significant estimates made by management, as well as evaluating the overall presentation of the financial statements. We believe that our audit provides a reasonable basis for our opinion.

We have served as the auditor of one or more Morgan Stanley investment companies since 2000.
Boston, Massachusetts
November 24, 2020
19
Morgan Stanley Institutional Fund Trust
Annual Report — September 30, 2020
Investment Advisory Agreement Approval (unaudited)
The Board considered the following factors at the time of approval of the contracts which occurred prior to commencement of operations.
Nature, Extent and Quality of Services
The Board reviewed and considered the nature and extent of the investment advisory services to be provided by the Adviser under the advisory agreement, including portfolio management, investment research and equity and fixed income securities trading. The Board also reviewed and considered the nature and extent of the non-advisory, administrative services to be provided by the Administrator under the administration agreement, including accounting, operations, clerical, bookkeeping, compliance, business management and planning, legal services and the provision of supplies, office space and utilities at the Adviser's expense. The Board also considered the Adviser's investment in personnel and infrastructure that benefits the Fund. (The Adviser and Administrator together are referred to as the "Adviser" and the advisory and administration agreements together are referred to as the "Management Agreement.") The Board also considered that the Adviser serves a variety of other investment advisory clients and has experience overseeing service providers.
The Board reviewed and considered the qualifications of the portfolio managers, the senior administrative managers and other key personnel of the Adviser who will provide the advisory and administrative services to the Fund. The Board determined that the Adviser's portfolio managers and key personnel are well qualified by education and/or training and experience to perform the services in an efficient and professional manner. The Board concluded that the nature and extent of the advisory and administrative services to be provided were necessary and appropriate for the conduct of the business and investment activities of the Fund and supported its decision to approve the Management Agreement.
Performance, Fees and Expenses of the Fund
The Board considered that the Adviser plans to arrange for a public offering of shares of the Fund to raise assets for investment and that the offering had not yet begun and concluded that, since the Fund currently had no assets to invest (other than seed capital required under the Investment Company Act) and had no track record of performance, this was not a factor it needed to address at the present time.
The Board reviewed the advisory and administrative fee rates (the "management fee rates") proposed to be paid by the Fund under the Management Agreement relative to comparable funds advised by the Adviser, when applicable, and compared to their peers as determined by the Adviser, and reviewed the anticipated total expense ratio of the Fund. The Board considered that the Fund requires the Adviser to develop processes, invest in additional resources and incur additional risks to successfully manage the Fund and concluded that the proposed management fee rate and anticipated total expense ratio would be competitive with its peer group averages.
Economies of Scale
The Board considered the growth prospects of the Fund and the structure of the proposed management fee schedule, which does not include breakpoints. The Board considered that the Fund's potential growth was uncertain and concluded that it would be premature to consider economies of scale as a factor in approving the Management Agreement at the present time.
Profitability of the Adviser and Affiliates
Since the Fund had not begun operations and had not paid any fees to the Adviser, the Board concluded that this was not a factor that needed to be considered at the present time.
Other Benefits of the Relationship
The Board considered other direct and indirect benefits to the Adviser and/or its affiliates to be derived from their relationship with the Fund and other funds advised by the Adviser. These benefits may include, among other things, fees for trading, distribution and/or shareholder servicing and for transaction processing and reporting platforms used by securities lending agents, and research received by the Adviser generated from commission dollars spent on funds' portfolio trading. Since the Fund had not begun operations and had not paid any fees to the Adviser, the Board concluded that these benefits were not a factor that needed to be considered at the present time.
20
Morgan Stanley Institutional Fund Trust
Annual Report — September 30, 2020
Investment Advisory Agreement Approval (unaudited) (cont'd)
Resources of the Adviser and Historical Relationship Between the Fund and the Adviser
The Board considered whether the Adviser is financially sound and has the resources necessary to perform its obligations under the Management Agreement. The Board also reviewed and considered the organizational structure of the Adviser, the policies and procedures formulated and adopted by the Adviser for managing the Fund's operations and the Board's confidence in the competence and integrity of the senior managers and key personnel of the Adviser. The Board concluded that the Adviser has the financial resources necessary to fulfill its obligations under the Management Agreement and that it is beneficial for the Fund to enter into this relationship with the Adviser.
Other Factors and Current Trends
The Board considered the controls and procedures adopted and implemented by the Adviser and monitored by the Fund's Chief Compliance Officer and concluded that the conduct of business by the Adviser indicates a good faith effort on its part to adhere to high ethical standards in the conduct of the Fund's business.
As part of the Board's review, the Board received information from management on the impact of COVID-19 on the firm generally and the Adviser and the Fund in particular including, among other information, the pandemic's current and expected impact on the Fund's performance and operations.
General Conclusion
After considering and weighing all of the above factors, with various written materials and verbal information presented by the Adviser, the Board concluded that it would be in the best interest of the Fund and its future shareholders to approve the Management Agreement, which will remain in effect for two years and thereafter must be approved annually by the Board of the Fund if it is to continue in effect. In reaching this conclusion the Board did not give particular weight to any single piece of information or factor referenced above. It is possible that individual Board members may have weighed these factors, and the information presented, differently in reaching their individual decisions to approve the Management Agreement.
21
Morgan Stanley Institutional Fund Trust
Annual Report — September 30, 2020
Liquidity Risk Management Program (unaudited)
In compliance with Rule 22e-4 under the Investment Company Act of 1940, as amended (the "Liquidity Rule"), the Fund has adopted and implemented a liquidity risk management program (the "Program"), which is reasonably designed to assess and manage the risk that the Fund could not meet requests to redeem shares issued by the Fund without significant dilution of remaining investors' interests in the Fund (i.e., liquidity risk). The Fund's Board of Trustees (the "Board") previously approved the designation of the Liquidity Risk Subcommittee (the "LRS") as Program administrator. The LRS is comprised of representatives from various divisions within Morgan Stanley Investment Management.
At a meeting held on April 22-23, 2020, the Board reviewed a written report prepared by the LRS that addressed the Program's operation and assessed its adequacy, and effectiveness of implementation for the period from December 1, 2018, through December 31, 2019, as required under the Liquidity Rule. The report concluded that the Program operated effectively and was adequately and effectively implemented in all material aspects, and that the relevant controls and safeguards were appropriately designed to enable the LRS to administer the Program in compliance with the Liquidity Rule.
In accordance with the Program, the LRS assessed each Fund's liquidity risk no less frequently than annually taking into consideration certain factors, as applicable, such as (i) investment strategy and liquidity of portfolio investments, (ii) short-term and long-term cash flow projections and (iii) holdings of cash and cash equivalents and borrowing arrangements and other funding sources. Certain factors are considered under both normal and reasonably foreseeable stressed conditions.
Each Fund portfolio investment is classified into one of four liquidity categories, which classification is assessed at least monthly by the LRS. The classification is based on a determination of the number of days it is reasonably expected to take to convert the investment into cash, or sell or dispose of the investment, in current market conditions without significantly changing the market value of the investment. Liquidity classification determinations take into account various market, trading and investment-specific considerations, as well as market depth, and in some cases utilize third-party vendor data.
The Liquidity Rule limits a fund's investments in illiquid investments to 15% of its net assets and requires funds that do not primarily hold assets that are highly liquid investments to determine and maintain a minimum percentage of the fund's net assets to be invested in highly liquid investments (highly liquid investment minimum or "HLIM"). The LRS believes that the Program includes provisions reasonably designed to review, monitor and comply with the 15% limit on illiquid investments and for determining, periodically reviewing and complying with the HLIM requirement, as applicable.
There can be no assurance that the Program will achieve its objectives under all circumstances in the future. Please refer to the Fund's prospectus for more information regarding the Fund's exposure to liquidity risk and other risks to which it may be subject.
22
Morgan Stanley Institutional Fund Trust
Annual Report — September 30, 2020
Privacy Notice (unaudited) April 2019
FACTS | | WHAT DOES MSIM DO WITH YOUR PERSONAL INFORMATION? | |
Why? | | Financial companies choose how they share your personal information. Federal law gives consumers the right to limit some but not all sharing. Federal law also requires us to tell you how we collect, share, and protect your personal information. Please read this notice carefully to understand what we do. | |
What? | | The types of personal information we collect and share depend on the product or service you have with us. This information can include:
n Social Security number and income
n investment experience and risk tolerance
n checking account number and wire transfer instructions | |
How? | | All financial companies need to share customers' personal information to run their everyday business. In the section below, we list the reasons financial companies can share their customers' personal information; the reasons MSIM chooses to share; and whether you can limit this sharing. | |
Reasons we can share your personal information | | Does MSIM share? | | Can you limit this sharing? | |
For our everyday business purposes —
such as to process your transactions, maintain your account(s), respond to court orders and legal investigations, or report to credit bureaus | | Yes | | No | |
For our marketing purposes —
to offer our products and services to you | | Yes | | No | |
For joint marketing with other financial companies | | No | | We don't share | |
For our affiliates' everyday business purposes —
information about your transactions and experiences | | Yes | | No | |
For our affiliates' everyday business purposes —
information about your creditworthiness | | No | | We don't share | |
For our affiliates to market to you | | No | | We don't share | |
For non-affiliates to market to you | | No | | We don't share | |
Questions? Call toll-free (844) 312-6327 or email: imprivacyinquiries@morganstanley.com
23
Morgan Stanley Institutional Fund Trust
Annual Report — September 30, 2020
Privacy Notice (unaudited) (cont'd) April 2019
Who we are
Who is providing this notice? | | Morgan Stanley Investment Management, Inc. and its affiliated registered investment advisers, registered broker-dealers, and registered and unregistered funds ("MSIM") | |
What we do
How does MSIM protect my personal information? | | To protect your personal information from unauthorized access and use, we use security measures that comply with federal law. These measures include computer safeguards and secured files and buildings. We have policies governing the proper handling of customer information by personnel and requiring third parties that provide support to adhere to appropriate security standards with respect to such information. | |
How does MSIM collect my personal information? | | We collect your personal information, for example, when you
n open an account or make deposits or withdrawals from your account
n buy securities from us or make a wire transfer
n give us your contact information
We also collect your personal information from others, such as credit bureaus, affiliates, or other companies. | |
Why can't I limit all sharing? | | Federal law gives you the right to limit only
n sharing for affiliates' everyday business purposes — information about your creditworthiness
n affiliates from using your information to market to you
n sharing for non-affiliates to market to you
State laws and individual companies may give you additional rights to limit sharing. See below for more on your rights under state law. | |
Definitions
Affiliates | | Companies related by common ownership or control. They can be financial and non-financial companies.
n Our affiliates include companies with a Morgan Stanley name and financial companies such as Morgan Stanley Smith Barney LLC and Morgan Stanley & Co. | |
Non-affiliates | | Companies not related by common ownership or control. They can be financial and non-financial companies.
n MSIM does not share with non-affiliates so they can market to you. | |
Joint marketing | | A formal agreement between non-affiliated financial companies that together market financial products or services to you.
n MSIM doesn't jointly market | |
Other Important Information
Vermont: Except as permitted by law, we will not share personal information we collect about Vermont residents with Non-affiliates unless you provide us with your written consent to share such information.
California: Except as permitted by law, we will not share personal information we collect about California residents with Non-affiliates and we will limit sharing such personal information with our Affiliates to comply with California privacy laws that apply to us.
24
Morgan Stanley Institutional Fund Trust
Annual Report — September 30, 2020
Trustee and Officer Information (unaudited)
Independent Trustees:
Name, Address and Birth Year
of Independent Trustee | | Position(s)
Held with
Registrant | | Length of Time
Served* | | Principal Occupation(s) During Past 5 Years
and Other Relevant Professional Experience | | Number of
Funds in
Fund Complex
Overseen by
Independent
Trustee** | | Other Directorships
Held by Independent
Trustee*** | |
Frank L. Bowman
c/o Perkins Coie LLP
Counsel to the Independent Trustees
1155 Avenue of the Americas, 22nd Floor
New York, NY 10036
Birth Year 1944 | | Trustee | | Since
August
2006 | | President, Strategic Decisions, LLC (consulting) (since February 2009); Director or Trustee of various Morgan Stanley Funds (since August 2006); Chairperson of the Compliance and Insurance Committee (since October 2015); formerly, Chairperson of the Insurance Sub-Committee of the Compliance and Insurance Committee (2007-2015); served as President and Chief Executive Officer of the Nuclear Energy Institute (policy organization) (February 2005-November 2008); retired as Admiral, U.S. Navy after serving over 38 years on active duty including 8 years as Director of the Naval Nuclear Propulsion Program in the Department of the Navy and the U.S. Department of Energy (1996-2004); served as Chief of Naval Personnel (July 1994-September 1996) and on the Joint Staff as Director of Political Military Affairs (June 1992-July 1994); knighted as Honorary Knight Commander of the Most Excellent Order of the British Empire; awarded the Officier de l'Orde National du Mérite by the French Government; elected to the National Academy of Engineering (2009). | | 86 | | Director of Naval and Nuclear Technologies LLP; Director Emeritus of the Armed Services YMCA; Member of the National Security Advisory Council of the Center for U.S. Global Engagement and a member of the CNA Military Advisory Board; Trustee of Fairhaven United Methodist Church; Member of the Board of Advisors of the Dolphin Scholarship Foundation; Director of other various non-profit organizations; Formerly, Director of BP p.l.c. (November 2010-May 2019). | |
Kathleen A. Dennis
c/o Perkins Coie LLP
Counsel to the Independent Trustees
1155 Avenue of the Americas, 22nd Floor
New York, NY 10036
Birth Year 1953 | | Trustee | | Since
August
2006 | | President, Cedarwood Associates (mutual fund and investment management consulting) (since July 2006); Chairperson of the Liquidity and Alternatives Sub-Committee of the Investment Committee (since October 2006) and Director or Trustee of various Morgan Stanley Funds (since August 2006); formerly, Senior Managing Director of Victory Capital Management (1993-2006). | | 86 | | Director of various non-profit organizations. | |
Nancy C. Everett
c/o Perkins Coie LLP
Counsel to the Independent Trustees
1155 Avenue of the Americas, 22nd Floor
New York, NY 10036
Birth Year 1955 | | Trustee | | Since
January
2015 | | Chief Executive Officer, Virginia Commonwealth University Investment Company (since November 2015); Owner, OBIR, LLC (institutional investment management consulting) (since June 2014); formerly, Managing Director, BlackRock, Inc. (February 2011-December 2013); and Chief Executive Officer, General Motors Asset Management (a/k/a Promark Global Advisors, Inc.) (June 2005-May 2010). | | 87 | | Formerly, Member of Virginia Commonwealth University School of Business Foundation (2005-2016); Member of Virginia Commonwealth University Board of Visitors (2013-2015); Member of Committee on Directors for Emerging Markets Growth Fund, Inc. (2007-2010); Chairperson of Performance Equity Management, LLC (2006-2010); and Chairperson, GMAM Absolute Return Strategies Fund, LLC (2006-2010). | |
25
Morgan Stanley Institutional Fund Trust
Annual Report — September 30, 2020
Trustee and Officer Information (unaudited) (cont'd)
Independent Trustees: (cont'd)
Name, Address and Birth Year
of Independent Trustee | | Position(s)
Held with
Registrant | | Length of Time
Served* | | Principal Occupation(s) During Past 5 Years
and Other Relevant Professional Experience | | Number of
Funds in
Fund Complex
Overseen by
Independent
Trustee** | | Other Directorships
Held by Independent
Trustee*** | |
Jakki L. Haussler
c/o Perkins Coie LLP
Counsel to the Independent Trustees
1155 Avenue of the Americas, 22nd Floor
New York, NY 10036
Birth Year 1957 | | Trustee | | Since
January
2015 | | Chairman, Opus Capital Group (since January 1996); formerly, Chief Executive Officer, Opus Capital Group (1996-2019); Director, Capvest Venture Fund, LP (May 2000-December 2011); Partner, Adena Ventures, LP (July 1999-December 2010); Director, The Victory Funds (February 2005-July 2008). | | 87 | | Director of Service Corporation International and Member, Audit Committee and Investment Committee; Director of Cincinnati Bell Inc. and Member, Audit Committee and Governance and Nominating Committee; Director of Northern Kentucky University Foundation and Member, Investment Committee; Member of Chase College of Law Transactional Law Practice Center Board of Advisors; Director of Chase College of Law Board of Visitors; formerly, Member, University of Cincinnati Foundation Investment Committee; Member, Miami University Board of Visitors (2008-2011); Trustee of Victory Funds (2005-2008) and Chairman, Investment Committee (2007-2008); Member, Service Provider Committee (2005-2008) and Director of Best Transport (2006-2019). | |
Dr. Manuel H. Johnson
c/o Johnson Smick
International, Inc.
220 I Street, NE — Suite 200 Washington, D.C. 20002
Birth Year 1949 | | Trustee | | Since
July
1991 | | Senior Partner, Johnson Smick International, Inc. (consulting firm); Chairperson of the Investment Committee (since October 2006) and Director or Trustee of various Morgan Stanley Funds (since July 1991); Co-Chairman and a founder of the Group of Seven Council (G7C) (international economic commission); formerly, Chairperson of the Audit Committee (July 1991-September 2006), Vice Chairman of the Board of Governors of the Federal Reserve System and Assistant Secretary of the U.S. Treasury. | | 86 | | Director of NVR, Inc. (home construction). | |
Joseph J. Kearns
c/o Perkins Coie LLP
Counsel to the Independent Trustees
1155 Avenue of the Americas, 22nd Floor
New York, NY 10036
Birth Year 1942 | | Trustee | | Since
August
1994 | | Senior Adviser, Kearns & Associates LLC (investment consulting); Chairperson of the Audit Committee (since October 2006) and Director or Trustee of various Morgan Stanley Funds (since August 1994); Director, Rubicorn Investments (since February 2019); formerly, Deputy Chairperson of the Audit Committee (July 2003-September 2006) and Chairperson of the Audit Committee of various Morgan Stanley Funds (since August 1994); CFO of the J. Paul Getty Trust (1982-1999). | | 87 | | Prior to August 10, 2016, Director of Electro Rent Corporation (equipment leasing); Prior to December 31, 2013, Director of The Ford Family Foundation. | |
26
Morgan Stanley Institutional Fund Trust
Annual Report — September 30, 2020
Trustee and Officer Information (unaudited) (cont'd)
Independent Trustees: (cont'd)
Name, Address and Birth Year
of Independent Trustee | | Position(s)
Held with
Registrant | | Length of Time
Served* | | Principal Occupation(s) During Past 5 Years
and Other Relevant Professional Experience | | Number of
Funds in
Fund Complex
Overseen by
Independent
Trustee** | | Other Directorships
Held by Independent
Trustee*** | |
Michael F. Klein
c/o Perkins Coie LLP
Counsel to the Independent Trustees
1155 Avenue of the Americas, 22nd Floor
New York, NY 10036
Birth Year 1958 | | Trustee | | Since
August
2006 | | Managing Director, Aetos Alternatives Management, LP (since March 2000); Co-President, Aetos Alternatives Management, LP (since January 2004) and Co-Chief Executive Officer of Aetos Alternatives Management, LP (since August 2013); Chairperson of the Fixed Income Sub-Committee of the Investment Committee (since October 2006) and Director or Trustee of various Morgan Stanley Funds (since August 2006); formerly, Managing Director, Morgan Stanley & Co. Inc. and Morgan Stanley Dean Witter Investment Management and President, various Morgan Stanley Funds (June 1998-March 2000); Principal, Morgan Stanley & Co. Inc. and Morgan Stanley Dean Witter Investment Management (August 1997-December 1999). | | 86 | | Director of certain investment funds managed or sponsored by Aetos Alternatives Management, LP; Director of Sanitized AG and Sanitized Marketing AG (specialty chemicals). | |
Patricia Maleski
c/o Perkins Coie LLP
Counsel to the Independent Trustees
1155 Avenue of the Americas, 22nd Floor
New York, NY 10036
Birth Year 1960 | | Trustee | | Since
January
2017 | | Managing Director, JPMorgan Asset Management (2004-2016); Oversight and Control Head of Fiduciary and Conflicts of Interest Program (2015-2016); Chief Control Officer-Global Asset Management (2013-2015); President, JPMorgan Funds (2010-2013); Chief Administrative Officer (2004-2013); various other positions including Treasurer and Board Liaison (since 2001). | | 87 | | None. | |
W. Allen Reed
c/o Perkins Coie LLP
Counsel to the Independent Trustees
1155 Avenue of the Americas, 22nd Floor
New York, NY 10036
Birth Year 1947 | | Chair of the Board and Trustee | | Chair of the Boards since August 2020 and Trustee since August 2006 | | Chair of the Boards of various Morgan Stanley Funds (since August 2020); Chairperson of the Governance Committee; Chairperson of the Equity Sub-Committee of the Investment Committee (since October 2006) and Director or Trustee of various Morgan Stanley Funds (since August 2006); formerly, Vice Chair of the Boards of various Morgan Stanley Funds (January 2020-August 2020); President and Chief Executive Officer of General Motors Asset Management; Chairman and Chief Executive Officer of the GM Trust Bank and Corporate Vice President of General Motors Corporation (August 1994-December 2005). | | 86 | | Formerly, Director of Legg Mason, Inc. (2006-2019); and Director of the Auburn University Foundation (2010-2015). | |
* This is the earliest date the Trustee began serving the Morgan Stanley Funds. Each Trustee serves an indefinite term, until his or her successor is elected.
** The Fund Complex includes (as of December 31, 2019) all open-end and closed-end funds (including all of their portfolios) advised by Morgan Stanley Investment Management Inc. (the "Adviser") and any funds that have an adviser that is an affiliated person of the Adviser (including, but not limited to, Morgan Stanley AIP GP LP).
*** This includes any directorships at public companies and registered investment companies held by the Trustee at any time during the past five years.
27
Morgan Stanley Institutional Fund Trust
Annual Report — September 30, 2020
Trustee and Officer Information (unaudited) (cont'd)
Executive Officers:
Name, Address and Birth Year
of Executive Officer | | Position(s) Held
with
Registrant | | Length of
Time Served* | | Principal Occupation(s) During Past 5 Years | |
John H. Gernon
522 Fifth Avenue
New York, NY 10036
Birth Year 1963 | | President and Principal Executive Officer | | Since September 2013 | | President and Principal Executive Officer of the Equity and Fixed Income Funds and the Morgan Stanley AIP Funds (since September 2013) and the Liquidity Funds and various money market funds (since May 2014) in the Fund Complex; Managing Director of the Adviser; Head of Public Markets Product Development (since 2006). | |
Timothy J. Knierim
522 Fifth Avenue
New York, NY 10036
Birth Year 1959 | | Chief Compliance Officer | | Since December 2016 | | Managing Director of the Adviser and various entities affiliated with the Adviser; Chief Compliance Officer of various Morgan Stanley Funds and the Adviser (since December 2016) and Chief Compliance Officer of Morgan Stanley AIP GP LP (since 2014). Formerly, Managing Director and Deputy Chief Compliance Officer of the Adviser (2014-2016); and formerly, Chief Compliance Officer of Prudential Investment Management, Inc. (2007-2014). | |
Francis J. Smith
522 Fifth Avenue
New York, NY 10036
Birth Year 1965 | | Treasurer and Principal Financial Officer | | Treasurer since July 2003 and Principal Financial Officer since September 2002 | | Managing Director of the Adviser and various entities affiliated with the Adviser; Treasurer (since July 2003) and Principal Financial Officer of various Morgan Stanley Funds (since September 2002). | |
Mary E. Mullin
522 Fifth Avenue
New York, NY 10036
Birth Year 1967 | | Secretary | | Since
June
1999 | | Managing Director of the Adviser; Secretary of various Morgan Stanley Funds (since June 1999). | |
Michael J. Key
522 Fifth Avenue
New York, NY 10036
Birth Year 1979 | | Vice President | | Since
June
2017 | | Vice President of the Equity and Fixed Income Funds, Liquidity Funds, various money market funds and the Morgan Stanley AIP Funds in the Fund Complex (since June 2017); Executive Director of the Adviser; Head of Product Development for Equity and Fixed Income Funds (since August 2013). | |
* This is the earliest date the officer began serving the Morgan Stanley Funds. Each officer serves a one-year term, until his or her successor is elected and qualifies.
28
Morgan Stanley Institutional Fund Trust
Annual Report — September 30, 2020
Adviser and Administrator
Morgan Stanley Investment Management Inc.
522 Fifth Avenue
New York, New York 10036
Distributor
Morgan Stanley Distribution, Inc.
522 Fifth Avenue
New York, New York 10036
Dividend Disbursing and Transfer Agent
DST Asset Manager Solutions, Inc.
2000 Crown Colony Drive
Quincy, Massachusetts 02169
Custodian
State Street Bank and Trust Company
One Lincoln Street
Boston, Massachusetts 02111
Legal Counsel
Dechert LLP
1095 Avenue of the Americas
New York, New York 10036
Counsel to the Independent Trustees
Perkins Coie LLP
1155 Avenue of the Americas,
22nd Floor
New York, New York 10036
Independent Registered Public Accounting Firm
Ernst & Young LLP
200 Clarendon Street
Boston, Massachusetts 02116
Reporting to Shareholders
Each Morgan Stanley fund provides a complete schedule of portfolio holdings in its Semi-Annual and the Annual Reports within 60 days of the end of the fund's second and fourth fiscal quarters. The Semi-Annual and Annual Reports are filed electronically with the Securities and Exchange Commission ("SEC") on Form N-CSRS and Form N-CSR, respectively. Morgan Stanley also delivers the Semi-Annual and Annual Reports to fund shareholders and makes these reports available on its public website, www.morganstanley.com/im/shareholderreports. Each Morgan Stanley non-money market fund also files a complete schedule of portfolio holdings with the SEC for the fund's first and third fiscal quarters as an attachment to Form N-PORT. Morgan Stanley does not deliver the reports for the first and third fiscal quarters to shareholders, nor are the reports posted to the Morgan Stanley public website. However, the holdings for each money market fund are posted to the Morgan Stanley public website. You may obtain the Form N-PORT filings (as well as the Form N-CSR and N-CSRS filings) by accessing the SEC's website, www.sec.gov. You can also request copies of these materials, upon payment of a duplicating fee, by electronic request at the SEC's email address (publicinfo@sec.gov).
Proxy Voting Policies and Procedures and Proxy Voting Record
You may obtain a copy of the Trust's Proxy Voting Policy and Procedures and information regarding how the Trust voted proxies relating to portfolio securities during the most recent twelve-month period ended June 30, without charge, upon request, by calling toll free 1 (800) 548-7786 or by visiting our website at www.morganstanley.com/im/shareholderreports. This information is also available on the SEC's website at www.sec.gov.
This report is authorized for distribution only when preceded or accompanied by a prospectus or summary prospectus of the applicable fund of Morgan Stanley Institutional Fund Trust, which describes in detail the fund's investment policies, risks, fees and expenses. Please read the prospectus carefully before you invest or send money. For additional information, including information regarding the investments comprising the Fund, please visit our website at www.morganstanley.com/im/shareholderreports or call toll free 1 (800) 548-7786.
29
Printed in U.S.A.
This Report has been prepared for shareholders and may be distributed to others only if preceded or accompanied by a current prospectus.
Morgan Stanley Investment Management Inc.
522 Fifth Avenue
New York, New York 10036
© 2020 Morgan Stanley. Morgan Stanley Distribution, Inc.

IFTMIANN
3300494 EXP 11.30.21

Morgan Stanley Institutional Fund Trust
Senior Loan Portfolio
Annual Report
September 30, 2020
Beginning on January 1, 2021, as permitted by regulations adopted by the Securities and Exchange Commission ("SEC"), paper copies of the Fund's Annual and Semi-Annual Reports to Shareholders ("Shareholder Reports") will no longer be sent by mail, unless you specifically request paper copies of the Shareholder Reports from the Fund or from your financial intermediary, such as a broker-dealer or a bank. Instead, the Shareholder Reports will be made available on the Fund's website, https://www.morganstanley.com/im/shareholderreports and you will be notified by mail each time a Shareholder Report is posted and provided with a website link to access the Shareholder Report. If you already elected to receive Shareholder Reports electronically, you will not be affected by this change and you need not take any action. You may elect to receive Shareholder Reports and other communications from the Fund electronically anytime by contacting your financial intermediary or, if you are a direct investor, please follow the instructions on the envelope.
Beginning on January 1, 2019, you may elect to receive all future Shareholder Reports in paper free of charge. If you invest through a financial intermediary, you can contact your financial intermediary to request that you continue to receive paper copies of your Shareholder Reports. If you invest directly with the Fund, please follow the instructions on the envelope to let the Fund know you wish to continue receiving paper copies of your Shareholder Reports. Your election to receive Shareholder Reports in paper will apply to all funds held in your account if you invest through your financial intermediary or all funds held with the fund complex if you invest directly with a fund.

Morgan Stanley Institutional Fund Trust
Annual Report — September 30, 2020
Shareholders' Letter | | | 2 | | |
Expense Example | | | 3 | | |
Investment Overview | | | 4 | | |
Portfolio of Investments | | | 6 | | |
Statement of Assets and Liabilities | | | 12 | | |
Statement of Operations | | | 13 | | |
Statement of Changes in Net Assets | | | 14 | | |
Financial Highlights | | | 15 | | |
Notes to Financial Statements | | | 19 | | |
Report of Independent Registered Public Accounting Firm | | | 25 | | |
Investment Advisory Agreement Approval | | | 26 | | |
Liquidity Risk Management Program | | | 28 | | |
Privacy Notice | | | 29 | | |
Trustee and Officer Information | | | 31 | | |
This report is authorized for distribution only when preceded or accompanied by a prospectus or summary prospectus of the applicable Fund of the Morgan Stanley Institutional Fund Trust. To receive a prospectus and/or statement of additional information ("SAI"), which contains more complete information such as investment objectives, charges, expenses, policies for voting proxies, risk considerations and describes in detail each of the Fund's investment policies to the prospective investor, please call toll free 1 (800) 548-7786. Please read the prospectuses carefully before you invest or send money.
Additionally, you can access information about the Fund, including performance, characteristics and investment team commentary, through Morgan Stanley Investment Management's website: www.morganstanley.com/im/shareholderreports.
Market forecasts provided in this report may not necessarily come to pass. There is no guarantee that any sectors mentioned will continue to perform as discussed herein or that securities in such sectors will be held by the Fund in the future. There is no assurance that a fund will achieve its investment objective. Funds are subject to market risk, which is the possibility that market values of securities owned by the Fund will decline and, therefore, the value of the Fund's shares may be less than what you paid for them. Accordingly, you can lose money investing in this Fund. Please see the prospectus for more complete information on investment risks.
1
Morgan Stanley Institutional Fund Trust
Annual Report — September 30, 2020
Shareholders' Letter (unaudited)
Dear Shareholders,
We are pleased to provide this Annual Report, in which you will learn how your investment in Senior Loan Portfolio (the "Fund") performed during the period beginning January 31, 2020 (when the Fund commenced operations) and ended September 30, 2020.
Morgan Stanley Investment Management is a client-centric, investor-led organization. Our global presence, intellectual capital, and breadth of products and services enable us to partner with investors to meet the evolving challenges of today's financial markets. We aim to deliver superior investment service and to empower our clients to make the informed decisions that help them reach their investment goals.
As always, we thank you for selecting Morgan Stanley Investment Management, and look forward to working with you in the months and years ahead.
Sincerely,

John H. Gernon
President and Principal Executive Officer
October 2020
2
Morgan Stanley Institutional Fund Trust
Annual Report — September 30, 2020
Expense Example (unaudited)
Senior Loan Portfolio
As a shareholder of the Fund, you may incur two types of costs: (1) transactional costs, including sales charge (loads) on purchase payments; and (2) ongoing costs, which may include advisory fees, administration fees, distribution and shareholder services fees; and other Fund expenses. This example is intended to help you understand your ongoing costs (in dollars) of investing in the Fund and to compare these costs with the ongoing costs of investing in other mutual funds.
This example is based on an investment of $1,000 invested at the beginning of the six-month period ended September 30, 2020 and held for the entire six-month period.
Actual Expenses
The table below provides information about actual account values and actual expenses. You may use the information in this table, together with the amount you invested, to estimate the expenses that you paid over the period. Simply divide your account value by $1,000 (for example, an $8,600 account value divided by $1,000 = 8.6), then multiply the result by the number in the table under the heading entitled "Actual Expenses Paid During Period" to estimate the expenses you paid on your account during this period.
Hypothetical Example for Comparison Purposes
The table below provides information about hypothetical account values and hypothetical expenses based on the Fund's actual expense ratio and an assumed rate of return of 5% per year before expenses, which is not the Fund's actual return. The hypothetical account values and expenses may not be used to estimate the actual ending account balance or expenses you paid for the period. You may use this information to compare the ongoing costs of investing in the Fund and other funds. To do so, compare this 5% hypothetical example with the 5% hypothetical examples that appear in the shareholder reports of the other funds.
Please note that the expenses shown in the table are meant to highlight your ongoing costs only and do not reflect any transactional costs, such as sales charges (loads, if applicable). Therefore, the information for each class in the table is useful in comparing ongoing costs only, and will not help you determine the relative total costs of owning different funds. In addition, if these transactional costs were included, your costs would have been higher.
| | | Beginning
Account
Value
4/1/20 | | Actual Ending
Account
Value
9/30/20 | | Hypothetical
Ending Account
Value | | Actual
Expenses
Paid
During
Period* | | Hypothetical
Expenses Paid
During Period* | | Net
Expense
Ratio
During
Period** | |
Senior Loan Portfolio Class I | | $ | 1,000.00 | | | $ | 1,121.70 | | | $ | 1,021.25 | | | $ | 3.98 | | | $ | 3.79 | | | | 0.75 | % | |
Senior Loan Portfolio Class A | | | 1,000.00 | | | | 1,119.40 | | | | 1,019.30 | | | | 6.04 | | | | 5.76 | | | | 1.14 | | |
Senior Loan Portfolio Class C | | | 1,000.00 | | | | 1,114.10 | | | | 1,015.50 | | | | 10.04 | | | | 9.57 | | | | 1.90 | | |
Senior Loan Portfolio Class IS | | | 1,000.00 | | | | 1,121.70 | | | | 1,021.25 | | | | 3.98 | | | | 3.79 | | | | 0.75 | | |
* Expenses are calculated using each Fund Class' annualized net expense ratio (as disclosed), multiplied by the average account value over the period and multiplied by 183/366 (to reflect the most recent one-half year period).
** Annualized.
3
Morgan Stanley Institutional Fund Trust
Annual Report — September 30, 2020
Investment Overview (unaudited)
Senior Loan Portfolio
The Fund seeks a high level of current income.
Performance
For the period from Fund inception on January 31, 2020 through September 30, 2020, the Fund's Class I shares had a total return based on net asset value and reinvestment of distributions per share of –1.84%, net of fees. The Fund's Class I shares underperformed against the Fund's benchmark, the S&P/LSTA Leveraged Loan Index (the "Index"), which returned –1.21%.
Factors Affecting Performance
• As of the end of the reporting period, the Fund had less than one year of performance history. Such a short time frame would not provide a meaningful performance analysis as short-term returns may not be indicative of the Fund's long-term performance potential.
Management Strategies
• The Fund aims to provide a high level of current income by investing in senior secured floating rate loans and other fixed income securities. To help achieve its objective, the investment team starts with a top-down macroeconomic assessment combined with rigorous bottom-up credit analysis.
• Given the current market environment, the Fund has been overweight higher quality BB credits. This defensive posture helped contribute to outperformance during the beginning of 2020, but as the market recovered, we saw spreads in the riskier part of the market compress and perform well, leading the Fund to underperform.
4
Morgan Stanley Institutional Fund Trust
Annual Report — September 30, 2020
Investment Overview (unaudited) (cont'd)
Senior Loan Portfolio

* Minimum Investment
** Commenced operations on January 31, 2020.
In accordance with SEC regulations, the Fund's performance shown assumes that all recurring fees (including management fees) were deducted and all dividends and distributions were reinvested. The performance of Class A, Class C and Class IS shares will vary from the performance of Class I shares and will be negatively impacted by additional fees assessed to those classes (where applicable).
Performance Compared to the S&P/LSTA Leveraged Loan Index(1) and the Lipper Loan Participation Funds Index(2)
| | | Period Ended September 30, 2020
Total Returns(3) | |
| | | One
Year | | Five
Years | | Ten
Years | | Since
Inception(5) | |
Fund — Class I Shares
w/o sales charges(4) | | | — | | | | — | | | | — | | | | –1.84 | % | |
Fund — Class A Shares
w/o sales charges(4) | | | — | | | | — | | | | — | | | | –2.07 | | |
Fund — Class A Shares with
maximum 3.25% sales charges(4) | | | — | | | | — | | | | — | | | | –5.29 | | |
Fund — Class C Shares
w/o sales charges(4) | | | — | | | | — | | | | — | | | | –2.59 | | |
Fund — Class C Shares with
maximum 1.00% deferred
sales charges(4) | | | — | | | | — | | | | — | | | | –3.56 | | |
Fund — Class IS Shares
w/o sales charges(4) | | | — | | | | — | | | | — | | | | –1.84 | | |
S&P/LSTA Leveraged Loan
Index | | | — | | | | — | | | | — | | | | –1.21 | | |
Lipper Loan Participation
Funds Index | | | — | | | | — | | | | — | | | | –3.08 | | |
Performance data quoted represents past performance, which is no guarantee of future results, and current performance may be lower or higher than the figures shown. Performance assumes that all dividends and distributions, if any, were reinvested. Returns for period less than one year are not annualized. For the most recent month-end performance figures, please visit www.morganstanley.com/im/shareholderreports. Investment returns and principal value will fluctuate so that Fund shares, when redeemed, may be worth more or less than their original cost. Total returns do not reflect the deduction of taxes that a shareholder would pay on Fund distributions or the redemption of Fund shares. Performance of share classes will vary due to differences in sales charges and expenses.
(1) The S&P/LSTA (Standard & Poor's/Loan Syndications and Trading Association) Leveraged Loan Index is an index that covers more than 1,100 loan facilities and reflects the market-value-weighted performance of U.S. dollar denominated institutional leveraged loans. The Index is unmanaged and its returns do not include any sales charges or fees. Such costs would lower performance. It is not possible to invest directly in an index.
(2) The Lipper Loan Participation Funds Index is an equally weighted performance index of the largest qualifying funds (based on net assets) in the Lipper Loan Participation Funds classification. The Index, which is adjusted for capital gains distributions and income dividends, is unmanaged and should not be considered an investment. There are currently 30 funds represented in this Index. As of the date of this report, the Fund was in the Lipper Loan Participation Funds classification.
(3) Total returns for the Fund reflect expenses waived and/or reimbursed, if applicable, by the Adviser. Without such waivers and/or reimbursements, total returns would have been lower.
(4) Commenced operations on January 31, 2020.
(5) For comparative purposes, average annual since inception returns listed for the Indexes refer to the inception date of the Fund, not the inception of the Indexes.
5
Morgan Stanley Institutional Fund Trust
Annual Report — September 30, 2020
Portfolio of Investments
Senior Loan Portfolio
| | | Face
Amount
(000) | | Value
(000) | |
Fixed Income Securities (100.0%) | |
Corporate Bonds (17.2%) | |
Communications (3.7%) | |
Altice France SA
7.38%, 5/1/26 (a) | | $ | 250 | | | $ | 262 | | |
Avaya, Inc.
6.13%, 9/15/28 (a) | | | 250 | | | | 256 | | |
CSC Holdings LLC
5.50%, 4/15/27 (a) | | | 250 | | | | 263 | | |
iHeartCommunications, Inc.
4.75%, 1/15/28 (a) | | | 500 | | | | 472 | | |
LCPR Senior Secured Financing DAC
6.75%, 10/15/27 (a) | | | 250 | | | | 262 | | |
MDC Partners, Inc.
6.50%, 5/1/24 (a) | | | 350 | | | | 320 | | |
| | | | 1,835 | | |
Consumer, Cyclical (5.1%) | |
At Home Holding III, Inc.
8.75%, 9/1/25 (a) | | | 500 | | | | 523 | | |
Boyne USA, Inc.
7.25%, 5/1/25 (a) | | | 225 | | | | 237 | | |
Delta Air Lines, Inc./SkyMiles IP Ltd.
4.75%, 10/20/28 (a) | | | 250 | | | | 260 | | |
Downstream Development Authority of the
Quapaw Tribe of Oklahoma
10.50%, 2/15/23 (a) | | | 175 | | | | 161 | | |
New Home Co., Inc. (The)
7.25%, 4/1/22 | | | 250 | | | | 249 | | |
Rite Aid Corp.
7.50%, 7/1/25 (a) | | | 250 | | | | 247 | | |
Spirit Loyalty Cayman Ltd./Spirit IP Cayman Ltd.
8.00%, 9/20/25 (a) | | | 100 | | | | 106 | | |
Station Casinos LLC
4.50%, 2/15/28 (a) | | | 500 | | | | 461 | | |
Sugarhouse HSP Gaming Prop Mezz LP/
Sugarhouse HSP Gaming Finance Corp.
5.88%, 5/15/25 (a) | | | 250 | | | | 245 | | |
| | | | 2,489 | | |
Consumer, Non-Cyclical (2.2%) | |
Air Medical Group Holdings, Inc.
6.38%, 5/15/23 (a) | | | 350 | | | | 351 | | |
Simmons Foods, Inc.
5.75%, 11/1/24 (a) | | | 250 | | | | 251 | | |
Sotheby's
7.38%, 10/15/27 (a) | | | 500 | | | | 501 | | |
| | | | 1,103 | | |
Energy (0.4%) | |
Global Partners LP/GLP Finance Corp.
7.00%, 8/1/27 | | | 175 | | | | 179 | | |
Finance (1.0%) | |
iStar, Inc.
4.75%, 10/1/24 | | | 250 | | | | 242 | | |
Oxford Finance LLC/Oxford Finance
Co-Issuer II, Inc.
6.38%, 12/15/22 (a) | | | 250 | | | | 245 | | |
| | | | 487 | | |
| | | Face
Amount
(000) | | Value
(000) | |
Industrials (4.3%) | |
Bombardier, Inc.
6.13%, 1/15/23 (a) | | $ | 200 | | | $ | 171 | | |
Builders FirstSource, Inc.
6.75%, 6/1/27 (a) | | | 100 | | | | 107 | | |
Cleaver-Brooks, Inc.
7.88%, 3/1/23 (a) | | | 150 | | | | 145 | | |
Grinding Media, Inc./Moly-Cop AltaSteel Ltd.
7.38%, 12/15/23 (a) | | | 225 | | | | 228 | | |
Kratos Defense & Security Solutions, Inc.
6.50%, 11/30/25 (a) | | | 100 | | | | 105 | | |
Mauser Packaging Solutions Holding Co.
5.50%, 4/15/24 (a) | | | 500 | | | | 503 | | |
Spirit AeroSystems, Inc.
7.50%, 4/15/25 (a) | | | 200 | | | | 203 | | |
Triumph Group, Inc.
6.25%, 9/15/24 (a) | | | 250 | | | | 213 | | |
TTM Technologies, Inc.
5.63%, 10/1/25 (a) | | | 400 | | | | 410 | | |
| | | | 2,085 | | |
Utilities (0.5%) | |
Calpine Corp.
5.25%, 6/1/26 (a) | | | 250 | | | | 260 | | |
| | | | 8,438 | | |
Variable Rate Senior Loan Interests (82.8%) | |
Basic Materials (2.7%) | |
Asplundh Tree Expert LLC,
Term Loan B
3 Month USD LIBOR + 2.50%,
2.65%, 9/7/27 (b) | | | 125 | | | | 125 | | |
Chemours Company (The),
Term Loan B2
3 Month USD LIBOR + 1.75%,
1.90%, 4/3/25 (b) | | | 496 | | | | 480 | | |
Cyanco Intermediate Corporation,
2020 Term Loan B
1 Month USD LIBOR + 3.50%,
3.65%, 3/16/25 (b) | | | 496 | | | | 491 | | |
Innophos, Inc.,
2020 Term Loan B
1 Month USD LIBOR + 3.75%,
3.90%, 2/7/27 (b) | | | 249 | | | | 247 | | |
| | | | 1,343 | | |
Communications (14.4%) | |
ABG Intermediate Holdings 2 LLC,
2017 1st Lien Add-On Term Loan
3 Month USD LIBOR + 3.50%,
4.50%, 9/27/24 (b) | | | 250 | | | | 245 | | |
Avaya, Inc.,
2018 Term Loan B
1 Month USD LIBOR + 4.25%,
4.40%, 12/15/24 (b) | | | 500 | | | | 498 | | |
Block Communications, Inc.,
2020 Term Loan
3 Month USD LIBOR + 2.25%,
2.47%, 2/11/27 (b) | | | 498 | | | | 491 | | |
The accompanying notes are an integral part of the financial statements.
6
Morgan Stanley Institutional Fund Trust
Annual Report — September 30, 2020
Portfolio of Investments (cont'd)
Senior Loan Portfolio
| | | Face
Amount
(000) | | Value
(000) | |
Communications (cont'd) | |
CenturyLink, Inc.,
2020 Term Loan B
1 Month USD LIBOR + 2.25%,
2.40%, 3/15/27 (b) | | $ | 496 | | | $ | 478 | | |
Clear Channel Outdoor Holdings, Inc.,
Term Loan B
3 Month USD LIBOR + 3.50%,
3.76%, 8/21/26 (b) | | | 496 | | | | 454 | | |
Cogeco Communications Finance (USA) II L.P.,
Term Loan B
1 Month USD LIBOR + 2.00%,
2.15%, 1/3/25 (b) | | | 496 | | | | 484 | | |
Coral-US Co-Borrower LLC,
2020 Term Loan B5
1 Month USD LIBOR + 2.25%,
2.40%, 1/31/28 (b) | | | 500 | | | | 485 | | |
Digicel International Finance Limited,
Term Loan B
6 Month USD LIBOR + 3.25%,
3.80%, 5/28/24 (b) | | | 248 | | | | 219 | | |
Go Daddy Operating Co. LLC,
2020 Term Loan B3
1 Month USD LIBOR + 2.50%,
2.65%, 8/10/27 (b) | | | 249 | | | | 246 | | |
Hargray Communications Group, Inc.,
2017 Term Loan B
1 Month USD LIBOR + 3.00%,
4.00%, 5/16/24 (b) | | | 248 | | | | 247 | | |
LCPR Loan Financing LLC,
Term Loan B
1 Month USD LIBOR + 5.00%,
5.15%, 10/15/26 (b) | | | 300 | | | | 300 | | |
Level 3 Financing Inc.,
2019 Term Loan B
1 Month USD LIBOR + 1.75%,
1.90%, 3/1/27 (b) | | | 250 | | | | 243 | | |
MH Sub I LLC,
2020 Incremental Term Loan
3 Month USD LIBOR + 3.75%,
4.75%, 9/13/24 (b) | | | 100 | | | | 99 | | |
NEP/NCP Holdco, Inc.,
2018 1st Lien Term Loan
3 Month USD LIBOR + 3.25%,
3.40%, 10/20/25 (b) | | | 496 | | | | 430 | | |
PUG LLC,
USD Term Loan
1 Month USD LIBOR + 3.50%,
3.65%, 2/12/27 (b) | | | 695 | | | | 617 | | |
Univision Communications Inc.,
Term Loan C5
1 Month USD LIBOR + 3.75%,
4.75%, 3/13/26 (b) | | | 360 | | | | 351 | | |
Virgin Media Bristol LLC,
USD Term Loan N
1 Month USD LIBOR + 2.50%,
2.65%, 1/31/28 (b) | | | 500 | | | | 486 | | |
Zacapa SARL,
2018 1st Lien Term Loan B
3 Month USD LIBOR + 4.50%,
4.77%, 7/2/25 (b) | | | 249 | | | | 248 | | |
| | | Face
Amount
(000) | | Value
(000) | |
Ziggo Financing Partnership,
USD Term Loan I
1 Month USD LIBOR + 2.50%,
2.65%, 4/30/28 (b) | | $ | 500 | | | $ | 482 | | |
| | | | 7,103 | | |
Consumer, Cyclical (15.7%) | |
1011778 B.C. Unlimited Liability Company,
Term Loan B4
1 Month USD LIBOR + 1.75%,
1.90%, 11/19/26 (b) | | | 248 | | | | 239 | | |
Aimbridge Acquisition Co., Inc.,
2019 Term Loan B
1 Month USD LIBOR + 3.75%,
3.89%, 2/2/26 (b) | | | 223 | | | | 201 | | |
Allegiant Travel Company,
2020 Term Loan
1 Month USD LIBOR + 3.00%,
3.25%, 2/5/24 (b) | | | 497 | | | | 464 | | |
American Airlines, Inc.,
2017 Replacement Term Loan
1 Month USD LIBOR + 1.75%,
1.90%, 1/29/27 (b) | | | 500 | | | | 369 | | |
American Builders & Contractors Supply Co., Inc.,
2019 Term Loan
1 Month USD LIBOR + 2.00%,
2.15%, 1/15/27 (b) | | | 397 | | | | 387 | | |
Aramark Services, Inc.,
2019 Term Loan B4
1 Month USD LIBOR + 1.75%,
1.90%, 1/15/27 (b) | | | 498 | | | | 478 | | |
Burlington Coat Factory Warehouse Corporation,
2017 Term Loan B5
1 Month USD LIBOR + 1.75%,
1.91%, 11/17/24 (b) | | | 250 | | | | 244 | | |
BW Gas & Convenience Holdings LLC,
Term Loan
1 Month USD LIBOR + 6.25%,
6.40%, 11/18/24 (b) | | | 674 | | | | 678 | | |
Carrols Restaurant Group, Inc.,
Term Loan B
3 Month USD LIBOR + 3.25%,
3.40% - 3.48%, 4/30/26 (b) | | | 496 | | | | 474 | | |
Core & Main LP,
2017 Term Loan B
3 Month USD LIBOR + 2.75%,
3.75%, 8/1/24 (b) | | | 496 | | | | 489 | | |
Delta 2 (LUX) S.a.r.l.,
Term Loan B
3 Month USD LIBOR + 2.50%,
3.50%, 2/1/24 (b) | | | 500 | | | | 487 | | |
Golden Nugget, Inc.,
2017 Incremental Term Loan B
1 Month USD LIBOR + 2.50%,
2.65% - 3.25%, 10/4/23 (b) | | | 545 | | | | 490 | | |
Harbor Freight Tools USA, Inc.,
2018 Term Loan B
3 Month USD LIBOR + 2.50%,
3.25%, 8/18/23 (b) | | | 497 | | | | 491 | | |
The accompanying notes are an integral part of the financial statements.
7
Morgan Stanley Institutional Fund Trust
Annual Report — September 30, 2020
Portfolio of Investments (cont'd)
Senior Loan Portfolio
| | | Face
Amount
(000) | | Value
(000) | |
Consumer, Cyclical (cont'd) | |
IRB Holding Corp,
2020 Term Loan B
1 Month USD LIBOR + 2.75%,
3.75%, 2/5/25 (b) | | $ | 496 | | | $ | 475 | | |
JetBlue Airways Corporation,
Term Loan
3 Month USD LIBOR + 5.25%,
6.25%, 6/17/24 (b) | | | 99 | | | | 98 | | |
Lions Gate Capital Holdings LLC,
2018 Term Loan B
3 Month USD LIBOR + 2.25%,
2.40%, 3/24/25 (b) | | | 244 | | | | 236 | | |
Playa Resorts Holding BV,
2017 Term Loan B
1 Month USD LIBOR + 2.75%,
3.75%, 4/29/24 (b) | | | 345 | | | | 305 | | |
Scientific Games International, Inc.,
2018 Term Loan B5
3 Month USD LIBOR + 2.75%,
2.90% - 3.61%, 8/14/24 (b) | | | 496 | | | | 468 | | |
Truck Hero, Inc.,
1st Lien Term Loan
3 Month USD LIBOR + 3.75%,
3.90%, 4/22/24 (b) | | | 496 | | | | 482 | | |
WMG Acquisition Corp.,
2018 Term Loan F
1 Month USD LIBOR + 2.12%,
2.27%, 11/1/23 (b) | | | 155 | | | | 152 | | |
| | | | 7,707 | | |
Consumer, Non-Cyclical (17.3%) | |
Acadia Healthcare Co., Inc.,
2018 Term Loan B4
3 Month USD LIBOR + 2.50%,
2.65%, 2/16/23 (b) | | | 496 | | | | 493 | | |
Agiliti Health, Inc,
Term Loan B
3 Month USD LIBOR + 3.00%,
3.15% - 3.19%, 1/4/26 (b) | | | 496 | | | | 483 | | |
Amneal Pharmaceuticals LLC,
2018 Term Loan B
1 Month USD LIBOR + 3.50%,
3.69%, 5/4/25 (b) | | | 224 | | | | 212 | | |
Bausch Health Cos., Inc.,
2018 Term Loan B
3 Month USD LIBOR + 3.00%,
3.15%, 6/2/25 (b) | | | 452 | | | | 444 | | |
Creative Artists Agency LLC,
2019 Term Loan B
1 Month USD LIBOR + 3.75%,
3.90%, 11/27/26 (b) | | | 496 | | | | 478 | | |
DaVita, Inc.,
2020 Term Loan B
1 Month USD LIBOR + 1.75%,
1.90%, 8/12/26 (b) | | | 248 | | | | 244 | | |
EyeCare Partners LLC,
2020 Delayed Draw Term Loan
3.75%, 2/18/27 (c) | | | 76 | | | | 72 | | |
| | | Face
Amount
(000) | | Value
(000) | |
EyeCare Partners LLC,
2020 Term Loan
1 Month USD LIBOR + 3.75%,
3.90%, 2/18/27 (b) | | $ | 323 | | | $ | 305 | | |
Froneri International Ltd.,
2020 USD Term Loan
1 Month USD LIBOR + 2.25%,
2.40%, 1/31/27 (b) | | | 499 | | | | 480 | | |
Garda World Security Corp.,
2019 1st Lien Term Loan B
3 Month USD LIBOR + 4.75%,
4.90%, 10/30/26 (b) | | | 375 | | | | 374 | | |
Gentiva Health Services, Inc.,
2020 Term Loan
1 Month USD LIBOR + 3.25%,
3.44%, 7/2/25 (b) | | | 498 | | | | 488 | | |
Grifols Worldwide Operations USA, Inc.,
2019 Term Loan B
1 Month USD LIBOR + 2.00%,
2.10%, 11/15/27 (b) | | | 248 | | | | 244 | | |
H Food Holdings LLC,
2018 Term Loan B
1 Month USD LIBOR + 3.68%,
3.83%, 5/23/25 (b) | | | 244 | | | | 238 | | |
HCA, Inc.,
Term Loan B12
1 Month USD LIBOR + 1.75%,
1.90%, 3/13/25 (b) | | | 496 | | | | 495 | | |
Jaguar Holding Company II,
2018 Term Loan
3 Month USD LIBOR + 2.50%,
3.50%, 8/18/22 (b) | | | 245 | | | | 245 | | |
Lineage Logistics Holdings LLC,
2018 Term Loan
3 Month USD LIBOR + 3.00%,
4.00%, 2/27/25 (b) | | | 496 | | | | 490 | | |
MMM Holdings, Inc.,
Term Loan B
1 Month USD LIBOR + 5.75, 6.75%,
12/24/26 | | | 100 | | | | 100 | | |
Pearl Intermediate Parent LLC,
2018 1st Lien Term Loan
3 Month USD LIBOR + 2.75%,
2.90%, 2/14/25 (b) | | | 496 | | | | 481 | | |
Pearl Intermediate Parent LLC,
2018 Incremental Term Loan
3 Month USD LIBOR + 3.25%,
5.01%, 2/14/25 (b) | | | 149 | | | | 146 | | |
Refinitiv US Holdings, Inc.,
2018 USD Term Loan
1 Month USD LIBOR + 3.25%,
3.40%, 10/1/25 (b) | | | 298 | | | | 296 | | |
Select Medical Corp.,
2017 Term Loan B
1 Month USD LIBOR + 2.50%,
2.78%, 3/6/25 (b) | | | 250 | | | | 244 | | |
Surgery Center Holdings, Inc.,
2017 Term Loan B
3 Month USD LIBOR + 3.25%,
4.25%, 9/3/24 (b) | | | 744 | | | | 704 | | |
The accompanying notes are an integral part of the financial statements.
8
Morgan Stanley Institutional Fund Trust
Annual Report — September 30, 2020
Portfolio of Investments (cont'd)
Senior Loan Portfolio
| | | Face
Amount
(000) | | Value
(000) | |
Consumer, Non-Cyclical (cont'd) | |
TMS International Corp.,
2018 Term Loan B2
3 Month USD LIBOR + 2.75%,
3.75%, 8/14/24 (b) | | $ | 496 | | | $ | 486 | | |
US Foods, Inc.,
2019 Term Loan B
3 Month USD LIBOR + 2.00%,
2.75%, 9/13/26 (b) | | | 249 | | | | 239 | | |
| | | | 8,481 | | |
Energy (3.4%) | |
Blackstone CQP Holdco LP,
Term Loan B
3 Month USD LIBOR + 3.50%,
3.73%, 9/30/24 (b) | | | 496 | | | | 487 | | |
Lower Cadence Holdings LLC,
Term Loan B
3 Month USD LIBOR + 4.00%,
4.15%, 5/22/26 (b) | | | 496 | | | | 461 | | |
Medallion Midland Acquisition LLC,
1st Lien Term Loan
3 Month USD LIBOR + 3.25%,
4.25%, 10/30/24 (b) | | | 496 | | | | 470 | | |
Stonepeak Lonestar Holdings LLC,
Term Loan B
3 Month USD LIBOR + 4.50%,
4.77%, 10/19/26 (b) | | | 244 | | | | 241 | | |
| | | | 1,659 | | |
Finance (8.1%) | |
AqGen Ascensus, Inc.,
2020 Term Loan
1 Month USD LIBOR + 4.00%,
5.00%, 12/13/26 (b) | | | 150 | | | | 149 | | |
Blackstone Mortgage Trust, Inc.,
2019 New Term Loan
1 Month USD LIBOR + 2.25%,
2.41%, 4/23/26 (b) | | | 496 | | | | 476 | | |
Brookfield Property REIT, Inc.,
1st Lien Term Loan B
3 Month USD LIBOR + 2.50%,
2.65%, 8/27/25 (b) | | | 496 | | | | 405 | | |
Charter Communications Operating LLC,
2019 Term Loan B1
1 Month USD LIBOR + 1.75%,
1.90%, 4/30/25 (b) | | | 224 | | | | 220 | | |
Citadel Securities LP,
2020 Term Loan B
1 Month USD LIBOR + 2.75%,
2.90%, 2/27/26 (b) | | | 248 | | | | 247 | | |
Hub International Limited,
2018 Term Loan B
3 Month USD LIBOR + 3.00%,
3.22% - 3.26%, 4/25/25 (b) | | | 496 | | | | 481 | | |
Illuminate Buyer LLC,
Term Loan
1 Month USD LIBOR + 4.00%,
4.22%, 6/16/27 (b) | | | 100 | | | | 99 | | |
Jefferies Finance LLC,
2020 Incremental Term Loan B
9/30/27 (d) | | | 250 | | | | 248 | | |
| | | Face
Amount
(000) | | Value
(000) | |
Jefferies Finance LLC,
2019 Term Loan
1 Month USD LIBOR + 3.25%,
3.44%, 6/3/26 (b) | | $ | 496 | | | $ | 478 | | |
Sedgwick Claims Management Services, Inc.,
2018 Term Loan B
3 Month USD LIBOR + 3.25%,
3.40%, 12/31/25 (b) | | | 496 | | | | 480 | | |
Vertical US Newco, Inc.,
Term Loan B
3 Month USD LIBOR + 4.25%,
4.57%, 7/30/27 (b) | | | 400 | | | | 397 | | |
VICI Properties 1 LLC,
Replacement Term Loan B
1 Month USD LIBOR + 1.75%,
1.91%, 12/20/24 (b) | | | 300 | | | | 291 | | |
| | | | 3,971 | | |
Industrials (11.4%) | |
ACProducts, Inc.,
2020 Term Loan B
1 Month USD LIBOR + 6.50%,
7.50%, 8/18/25 (b) | | | 123 | | | | 124 | | |
Brand Energy & Infrastructure Services, Inc.,
2017 Term Loan
3 Month USD LIBOR + 4.25%,
5.25%, 6/21/24 (b) | | | 397 | | | | 371 | | |
Cornerstone Building Brands, Inc.,
2018 Term Loan
1 Month USD LIBOR + 3.75%,
3.90%, 4/12/25 (b) | | | 496 | | | | 489 | | |
CPG International, Inc.,
2017 Term Loan
3 Month USD LIBOR + 3.75%,
4.75%, 5/5/24 (b) | | | 295 | | | | 295 | | |
Flex Acquisition Company, Inc.,
1st Lien Term Loan
3 Month USD LIBOR + 3.00%,
4.00%, 12/29/23 (b) | | | 482 | | | | 472 | | |
Generac Power Systems, Inc.,
2019 Term Loan B
1 Month USD LIBOR + 1.75%,
1.91%, 12/13/26 (b) | | | 500 | | | | 498 | | |
Ingersoll-Rand Services Co.,
2020 USD Spinco Term Loan
1 Month USD LIBOR + 1.75%,
1.90%, 3/1/27 (b) | | | 249 | | | | 241 | | |
Patriot Container Corp.,
2018 1st Lien Term Loan
3/20/25 (d) | | | 249 | | | | 245 | | |
Quikrete Holdings, Inc.,
2016 1st Lien Term Loan
1 Month USD LIBOR + 2.50%,
2.65%, 2/1/27 (b) | | | 496 | | | | 484 | | |
Reynolds Group Holdings, Inc.,
Term Loan
1 Month USD LIBOR + 2.75, 2.90%,
2/5/23 (b) | | | 194 | | | | 192 | | |
Tank Holding Corp.,
2020 Term Loan 3/26/26 (d) | | | 250 | | | | 247 | | |
Titan Acquisition Limited,
2018 Term Loan B
3 Month USD LIBOR + 3.00%,
3.22%, 3/28/25 (b) | | | 248 | | | | 235 | | |
The accompanying notes are an integral part of the financial statements.
9
Morgan Stanley Institutional Fund Trust
Annual Report — September 30, 2020
Portfolio of Investments (cont'd)
Senior Loan Portfolio
| | | Face
Amount
(000) | | Value
(000) | |
Industrials (cont'd) | |
TransDigm, Inc.,
2020 Term Loan F
1 Month USD LIBOR + 2.25%,
2.40%, 12/9/25 (b) | | $ | 496 | | | $ | 470 | | |
Trident TPI Holdings, Inc.,
2017 USD Term Loan B1
3 Month USD LIBOR + 3.00%,
4.00%, 10/17/24 (b) | | | 496 | | | | 485 | | |
Tutor Perini Corporation,
Term Loan B
3 Month USD LIBOR + 4.75%,
5.75%, 8/13/27 (b) | | | 250 | | | | 247 | | |
XPO Logistics, Inc.,
2018 Refinancing Term Loan
1 Month USD LIBOR + 2.00%,
2.15%, 2/24/25 (b) | | | 250 | | | | 246 | | |
Zekelman Industries, Inc.,
2020 Term Loan
1 Month USD LIBOR + 2.25%,
2.14%, 1/24/27 (b) | | | 249 | | | | 242 | | |
| | | | 5,583 | | |
Technology (9.6%) | |
Banff Merger Sub, Inc.,
2018 USD Term Loan B
1 Month USD LIBOR + 4.25%,
4.40%, 10/2/25 (b) | | | 398 | | | | 388 | | |
By Crown Parent LLC,
Term Loan B1
1 Month USD LIBOR + 3.00%,
4.00%, 1/31/26 (b) | | | 349 | | | | 346 | | |
Camelot U.S. Acquisition 1 Co.,
2020 Incremental Term Loan B
10/30/26 (d) | | | 125 | | | | 125 | | |
DCert Buyer, Inc.,
2019 Term Loan B
3 Month USD LIBOR + 4.00%,
4.15%, 10/16/26 (b) | | | 249 | | | | 246 | | |
Dell International LLC,
2019 Term Loan B
1 Month USD LIBOR + 2.00%,
2.75%, 9/19/25 (b) | | | 245 | | | | 244 | | |
Hyland Software, Inc.,
2018 1st Lien Term Loan 7/1/24 (d) | | | 150 | | | | 149 | | |
McAfee LLC,
2018 USD Term Loan B
1 Month USD LIBOR + 3.75%,
3.90%, 9/30/24 (b) | | | 497 | | | | 495 | | |
Rackspace Hosting, Inc.,
2017 Incremental 1st Lien Term Loan
3 Month USD LIBOR + 3.00%,
3.18% - 4.00%, 11/3/23 (b) | | | 447 | | | | 439 | | |
Redstone Buyer LLC,
Term Loan
3 Month USD LIBOR + 5.00%,
6.00%, 9/1/27 (b) | | | 400 | | | | 399 | | |
Surf Holdings LLC,
USD Term Loan
3 Month USD LIBOR + 3.50%,
3.75%, 3/5/27 (b) | | | 499 | | | | 489 | | |
| | | Face
Amount
(000) | | Value
(000) | |
Verifone Systems, Inc.,
2018 1st Lien Term Loan
3 Month USD LIBOR + 4.00%,
4.25%, 8/20/25 (b) | | $ | 497 | | | $ | 447 | | |
VS Buyer LLC,
Term Loan B
1 Month USD LIBOR + 3.25%,
3.40%, 2/28/27 (b) | | | 498 | | | | 491 | | |
Western Digital Corporation,
2018 Term Loan B4
3 Month USD LIBOR + 1.75%,
1.91%, 4/29/23 (b) | | | 456 | | | | 454 | | |
| | | | 4,712 | | |
Utilities (0.2%) | |
Pacific Gas & Electric Company,
2020 Term Loan
3 Month USD LIBOR + 4.50%,
5.50%, 6/23/25 (b) | | | 100 | | | | 98 | | |
| | | | 40,657 | | |
Total Fixed Income Securities (Cost $50,336) | | | 49,095 | | |
| | | Shares | | | |
Short-Term Investment (0.1%) | |
Investment Company (0.1%) | |
Morgan Stanley Institutional Liquidity Funds —
Government Portfolio — Institutional Class
(See Note G) (Cost $55) | | | 54,745 | | | | 55 | | |
Total Investments (100.1%) (Cost $50,391) (e) | | | 49,150 | | |
Liabilities in Excess of Other Assets (–0.1%) | | | (56 | ) | |
Net Assets (100.0%) | | $ | 49,094 | | |
(a) 144A security — Certain conditions for public sale may exist. Unless otherwise noted, these securities are deemed to be liquid.
(b) Floating or variable rate securities: The rates disclosed are as of September 30, 2020. For securities based on a published reference rate and spread, the reference rate and spread are indicated in the description in the Portfolio of Investments. Certain variable rate securities may not be based on a published reference rate and spread but are determined by the issuer or agent and are based on current market conditions. These securities do not indicate a reference rate and spread in their description in the Portfolio of Investments.
(c) In addition to the term loan, the fund has an unfunded loan commitment of approximately $72,000, which could be extended at the option of the borrower. As of September 30, 2020, EyeCare Partners, LLC, did not draw down any of the commitment.
(d) Unsettled Position. The contract rate does not take effect until settlement date.
(e) At September 30, 2020, the aggregate cost for federal income tax purposes is approximately $50,406,000. The aggregate gross unrealized appreciation is approximately $299,000 and the aggregate gross unrealized depreciation is approximately $1,555,000, resulting in net unrealized depreciation of approximately $1,256,000.
LIBOR London Interbank Offered Rate.
REIT Real Estate Investment Trust.
USD United States Dollar.
The accompanying notes are an integral part of the financial statements.
10
Morgan Stanley Institutional Fund Trust
Annual Report — September 30, 2020
Portfolio of Investments (cont'd)
Senior Loan Portfolio
Portfolio Composition
Classification | | Percentage of
Total Investments | |
Variable Rate Senior Loan Interests | | | 82.7 | % | |
Other* | | | 17.2 | | |
Short-Term Investment | | | 0.1 | | |
Total Investments | | | 100.0 | % | |
* Industries and/or investment types representing less than 5% of total investments.
The accompanying notes are an integral part of the financial statements.
11
Morgan Stanley Institutional Fund Trust
Annual Report — September 30, 2020
Statement of Assets and Liabilities | | September 30, 2020
(000) | |
Assets: | |
Investments in Securities of Unaffiliated Issuers, at Value (Cost $50,336) | | $ | 49,095 | | |
Investment in Security of Affiliated Issuer, at Value (Cost $55) | | | 55 | | |
Total Investments in Securities, at Value (Cost $50,391) | | | 49,150 | | |
Receivable for Investments Sold | | | 1,039 | | |
Interest Receivable | | | 269 | | |
Prepaid Offering Costs | | | 56 | | |
Due from Adviser | | | 7 | | |
Receivable from Affiliate | | | — | @ | |
Other Assets | | | 7 | | |
Total Assets | | | 50,528 | | |
Liabilities: | |
Payable for Investments Purchased | | | 1,107 | | |
Payable for Offering Costs | | | 151 | | |
Payable for Professional Fees | | | 88 | | |
Payable for Unfunded Loan Commitments | | | 76 | | |
Payable for Administration Fees | | | 3 | | |
Payable for Custodian Fees | | | 1 | | |
Payable for Transfer Agency Fees — Class I | | | — | @ | |
Payable for Transfer Agency Fees — Class A | | | — | @ | |
Payable for Transfer Agency Fees — Class C | | | — | @ | |
Payable for Transfer Agency Fees — Class IS | | | — | @ | |
Payable for Shareholder Services Fees — Class A | | | — | @ | |
Payable for Distribution and Shareholder Services Fees — Class C | | | — | @ | |
Other Liabilities | | | 8 | | |
Total Liabilities | | | 1,434 | | |
Net Assets | | $ | 49,094 | | |
Net Assets Consist of: | |
Paid-in-Capital | | $ | 50,946 | | |
Total Accumulated Loss | | | (1,852 | ) | |
Net Assets | | $ | 49,094 | | |
CLASS I: | |
Net Assets | | $ | 49,064 | | |
| Shares Outstanding (unlimited number of shares authorized, no par value) (not in 000's) | | | 5,098,814 | | |
Net Asset Value, Offering and Redemption Price Per Share | | $ | 9.62 | | |
CLASS A: | |
Net Assets | | $ | 10 | | |
| Shares Outstanding (unlimited number of shares authorized, no par value) (not in 000's) | | | 1,018 | | |
Net Asset Value, Redemption Price Per Share | | $ | 9.62 | | |
Maximum Sales Load | | | 3.25 | % | |
Maximum Sales Charge | | $ | 0.32 | | |
Maximum Offering Price Per Share | | $ | 9.94 | | |
CLASS C: | |
Net Assets | | $ | 10 | | |
| Shares Outstanding (unlimited number of shares authorized, no par value) (not in 000's) | | | 1,014 | | |
Net Asset Value, Offering and Redemption Price Per Share | | $ | 9.61 | | |
CLASS IS: | |
Net Assets | | $ | 10 | | |
| Shares Outstanding (unlimited number of shares authorized, no par value) (not in 000's) | | | 1,020 | | |
Net Asset Value, Offering and Redemption Price Per Share | | $ | 9.62 | | |
@ Amount is less than $500.
The accompanying notes are an integral part of the financial statements.
12
Morgan Stanley Institutional Fund Trust
Annual Report — September 30, 2020
Statement of Operations | | Period from
January 31, 2020^ to
September 30, 2020
(000) | |
Investment Income: | |
Interest from Securities of Unaffiliated Issuers | | $ | 1,275 | | |
Dividends from Security of Affiliated Issuer (Note G) | | | 51 | | |
Total Investment Income | | | 1,326 | | |
Expenses: | |
Advisory Fees (Note B) | | | 189 | | |
Professional Fees | | | 125 | | |
Offering Costs | | | 111 | | |
Administration Fees (Note C) | | | 25 | | |
Shareholder Reporting Fees | | | 13 | | |
Transfer Agency Fees — Class I (Note E) | | | 1 | | |
Transfer Agency Fees — Class A (Note E) | | | 1 | | |
Transfer Agency Fees — Class C (Note E) | | | 1 | | |
Transfer Agency Fees — Class IS (Note E) | | | 1 | | |
Pricing Fees | | | 5 | | |
Custodian Fees (Note F) | | | 2 | | |
Registration Fees | | | 2 | | |
Trustees' Fees and Expenses | | | 1 | | |
Shareholder Services Fees — Class A (Note D) | | | — | @ | |
Distribution and Shareholder Services Fees — Class C (Note D) | | | — | @ | |
Other Expenses | | | 3 | | |
Total Expenses | | | 480 | | |
Waiver of Advisory Fees (Note B) | | | (189 | ) | |
Expenses Reimbursed by Adviser (Note B) | | | (51 | ) | |
Rebate from Morgan Stanley Affiliate (Note G) | | | (8 | ) | |
Reimbursement of Class Specific Expenses — Class A (Note B) | | | (1 | ) | |
Reimbursement of Class Specific Expenses — Class C (Note B) | | | (1 | ) | |
Reimbursement of Class Specific Expenses — Class IS (Note B) | | | (1 | ) | |
Net Expenses | | | 229 | | |
Net Investment Income | | | 1,097 | | |
Realized Loss: | |
Investments Sold | | | (763 | ) | |
Change in Unrealized Appreciation (Depreciation): | |
Investments | | | (1,241 | ) | |
Net Realized Loss and Change in Unrealized Appreciation (Depreciation) | | | (2,004 | ) | |
Net Decrease in Net Assets Resulting from Operations | | $ | (907 | ) | |
^ Commencement of Operations.
@ Amount is less than $500.
The accompanying notes are an integral part of the financial statements.
13
Morgan Stanley Institutional Fund Trust
Annual Report — September 30, 2020
Statement of Changes in Net Assets | | Period from
January 31, 2020^ to
September 30, 2020
(000) | |
Increase (Decrease) in Net Assets: | |
Operations: | |
Net Investment Income | | $ | 1,097 | | |
Net Realized Loss | | | (763 | ) | |
Net Change in Unrealized Appreciation (Depreciation) | | | (1,241 | ) | |
Net Decrease in Net Assets Resulting from Operations | | | (907 | ) | |
Dividends and Distributions to Shareholders: | |
Class I | | | (945 | ) | |
Class A | | | (— | @) | |
Class C | | | (— | @) | |
Class IS | | | (— | @) | |
Total Dividends and Distributions to Shareholders | | | (945 | ) | |
Capital Share Transactions:(1) | |
Class I: | |
Subscribed | | | 49,971 | | |
Distributions Reinvested | | | 945 | | |
Class A: | |
Subscribed | | | 10 | | |
Distributions Reinvested | | | — | @ | |
Class C: | |
Subscribed | | | 10 | | |
Distributions Reinvested | | | — | @ | |
Class IS: | |
Subscribed | | | 10 | | |
Distributions Reinvested | | | — | @ | |
Net Increase in Net Assets Resulting from Capital Share Transactions | | | 50,946 | | |
Total Increase in Net Assets | | | 49,094 | | |
Net Assets: | |
Beginning of Period | | | — | | |
End of Period | | $ | 49,094 | | |
(1) Capital Share Transactions: | |
Class I: | |
Shares Subscribed | | | 4,997 | | |
Shares Issued on Distributions Reinvested | | | 102 | | |
Net Increase in Class I Shares Outstanding | | | 5,099 | | |
Class A: | |
Shares Subscribed | | | 1 | | |
Shares Issued on Distributions Reinvested | | | — | @@ | |
Net Increase in Class A Shares Outstanding | | | 1 | | |
Class C: | |
Shares Subscribed | | | 1 | | |
Shares Issued on Distributions Reinvested | | | — | @@ | |
Net Increase in Class C Shares Outstanding | | | 1 | | |
Class IS: | |
Shares Subscribed | | | 1 | | |
Shares Issued on Distributions Reinvested | | | — | @@ | |
Net Increase in Class IS Shares Outstanding | | | 1 | | |
^ Commencement of Operations.
@ Amount is less than $500.
@@ Amount is less than 500 shares.
The accompanying notes are an integral part of the financial statements.
14
Morgan Stanley Institutional Fund Trust
Annual Report — September 30, 2020
Financial Highlights
Senior Loan Portfolio
| | | Class I | |
Selected Per Share Data and Ratios | | Period from
January 31, 2020(1)
to September 30, 2020 | |
Net Asset Value, Beginning of Period | | $ | 10.00 | | |
Income (Loss) from Investment Operations: | |
Net Investment Income(2) | | | 0.22 | | |
Net Realized and Unrealized Loss | | | (0.41 | ) | |
Total from Investment Operations | | | (0.19 | ) | |
Distributions from and/or in Excess of: | |
Net Investment Income | | | (0.19 | ) | |
Net Asset Value, End of Period | | $ | 9.62 | | |
Total Return(3) | | | (1.84 | )%(5) | |
Ratios to Average Net Assets and Supplemental Data: | |
Net Assets, End of Period (Thousands) | | $ | 49,064 | | |
Ratio of Expenses Before Expense Limitation | | | 1.52 | %(6) | |
Ratio of Expenses After Expense Limitation | | | 0.73 | %(4)(6) | |
Ratio of Net Investment Income | | | 3.49 | %(4)(6) | |
Ratio of Rebate from Morgan Stanley Affiliates | | | 0.02 | %(6) | |
Portfolio Turnover Rate | | | 27 | %(5) | |
(1) Commencement of Operations.
(2) Per share amount is based on average shares outstanding.
(3) Calculated based on the net asset value as of the last business day of the period.
(4) The Ratio of Expenses After Expense Limitation and Ratio of Net Investment Income reflect the rebate of certain Fund expenses in connection with the investments in Morgan Stanley affiliates during the period. The effect of the rebate on the ratios is disclosed in the above table as "Ratio of Rebate from Morgan Stanley Affiliates."
(5) Not annualized.
(6) Annualized.
The accompanying notes are an integral part of the financial statements.
15
Morgan Stanley Institutional Fund Trust
Annual Report — September 30, 2020
Financial Highlights
Senior Loan Portfolio
| | | Class A | |
Selected Per Share Data and Ratios | | Period from
January 31, 2020(1)
to September 30, 2020 | |
Net Asset Value, Beginning of Period | | $ | 10.00 | | |
Income (Loss) from Investment Operations: | |
Net Investment Income(2) | | | 0.19 | | |
Net Realized and Unrealized Loss | | | (0.40 | ) | |
Total from Investment Operations | | | (0.21 | ) | |
Distributions from and/or in Excess of: | |
Net Investment Income | | | (0.17 | ) | |
Net Asset Value, End of Period | | $ | 9.62 | | |
Total Return(3) | | | (2.07 | )%(5) | |
Ratios to Average Net Assets and Supplemental Data: | |
Net Assets, End of Period (Thousands) | | $ | 10 | | |
Ratio of Expenses Before Expense Limitation | | | 22.54 | %(6) | |
Ratio of Expenses After Expense Limitation | | | 1.13 | %(4)(6) | |
Ratio of Net Investment Income | | | 3.09 | %(4)(6) | |
Ratio of Rebate from Morgan Stanley Affiliates | | | 0.02 | %(6) | |
Portfolio Turnover Rate | | | 27 | %(5) | |
(1) Commencement of Operations.
(2) Per share amount is based on average shares outstanding.
(3) Calculated based on the net asset value which does not reflect sales charges, if applicable, as of the last business day of the period.
(4) The Ratio of Expenses After Expense Limitation and Ratio of Net Investment Income reflect the rebate of certain Fund expenses in connection with the investments in Morgan Stanley affiliates during the period. The effect of the rebate on the ratios is disclosed in the above table as "Ratio of Rebate from Morgan Stanley Affiliates."
(5) Not annualized.
(6) Annualized.
The accompanying notes are an integral part of the financial statements.
16
Morgan Stanley Institutional Fund Trust
Annual Report — September 30, 2020
Financial Highlights
Senior Loan Portfolio
| | | Class C | |
Selected Per Share Data and Ratios | | Period from
January 31, 2020(1)
to September 30, 2020 | |
Net Asset Value, Beginning of Period | | $ | 10.00 | | |
Income (Loss) from Investment Operations: | |
Net Investment Income(2) | | | 0.15 | | |
Net Realized and Unrealized Loss | | | (0.42 | ) | |
Total from Investment Operations | | | (0.27 | ) | |
Distributions from and/or in Excess of: | |
Net Investment Income | | | (0.12 | ) | |
Net Asset Value, End of Period | | $ | 9.61 | | |
Total Return(3) | | | (2.59 | )%(5) | |
Ratios to Average Net Assets and Supplemental Data: | |
Net Assets, End of Period (Thousands) | | $ | 10 | | |
Ratio of Expenses Before Expense Limitation | | | 23.27 | %(6) | |
Ratio of Expenses After Expense Limitation | | | 1.88 | %(4)(6) | |
Ratio of Net Investment Income | | | 2.34 | %(4)(6) | |
Ratio of Rebate from Morgan Stanley Affiliates | | | 0.02 | %(6) | |
Portfolio Turnover Rate | | | 27 | %(5) | |
(1) Commencement of Operations.
(2) Per share amount is based on average shares outstanding.
(3) Calculated based on the net asset value which does not reflect sales charges, if applicable, as of the last business day of the period.
(4) The Ratio of Expenses After Expense Limitation and Ratio of Net Investment Income reflect the rebate of certain Fund expenses in connection with the investments in Morgan Stanley affiliates during the period. The effect of the rebate on the ratios is disclosed in the above table as "Ratio of Rebate from Morgan Stanley Affiliates."
(5) Not annualized.
(6) Annualized.
The accompanying notes are an integral part of the financial statements.
17
Morgan Stanley Institutional Fund Trust
Annual Report — September 30, 2020
Financial Highlights
Senior Loan Portfolio
| | | Class IS | |
Selected Per Share Data and Ratios | | Period from
January 31, 2020(1)
to September 30, 2020 | |
Net Asset Value, Beginning of Period | | $ | 10.00 | | |
Income (Loss) from Investment Operations: | |
Net Investment Income(2) | | | 0.22 | | |
Net Realized and Unrealized Loss | | | (0.41 | ) | |
Total from Investment Operations | | | (0.19 | ) | |
Distributions from and/or in Excess of: | |
Net Investment Income | | | (0.19 | ) | |
Net Asset Value, End of Period | | $ | 9.62 | | |
Total Return(3) | | | (1.84 | )%(5) | |
Ratios to Average Net Assets and Supplemental Data: | |
Net Assets, End of Period (Thousands) | | $ | 10 | | |
Ratio of Expenses Before Expense Limitation | | | 22.19 | %(6) | |
Ratio of Expenses After Expense Limitation | | | 0.72 | %(4)(6) | |
Ratio of Net Investment Income | | | 3.49 | %(4)(6) | |
Ratio of Rebate from Morgan Stanley Affiliates | | | 0.02 | %(6) | |
Portfolio Turnover Rate | | | 27 | %(5) | |
(1) Commencement of Operations.
(2) Per share amount is based on average shares outstanding.
(3) Calculated based on the net asset value as of the last business day of the period.
(4) The Ratio of Expenses After Expense Limitation and Ratio of Net Investment Income reflect the rebate of certain Fund expenses in connection with the investments in Morgan Stanley affiliates during the period. The effect of the rebate on the ratios is disclosed in the above table as "Ratio of Rebate from Morgan Stanley Affiliates."
(5) Not annualized.
(6) Annualized.
The accompanying notes are an integral part of the financial statements.
18
Morgan Stanley Institutional Fund Trust
Annual Report — September 30, 2020
Notes to Financial Statements
Morgan Stanley Institutional Fund Trust ("Trust'') is registered under the Investment Company Act of 1940, as amended (the "Act''), as an open-end management investment company. The Trust is comprised of twelve separate, active funds (individually referred to as a "Fund," collectively as the "Funds"). The Trust applies investment company accounting and reporting guidance. All Funds are considered diversified for purposes of the Act.
The accompanying financial statements relate to the Senior Loan Portfolio. The Fund seeks a high level of current income.
The Fund commenced operations on January 31, 2020 and offers four classes of shares — Class I, Class A, Class C and Class IS.
A. Significant Accounting Policies: The following significant accounting policies are in conformity with U.S. generally accepted accounting principles ("GAAP"). Such policies are consistently followed by the Trust in the preparation of its financial statements. GAAP may require management to make estimates and assumptions that affect the reported amounts and disclosures in the financial statements. Actual results may differ from those estimates.
In March 2017, the Financial Accounting Standards Board ("FASB") issued an Accounting Standard Update, ASU 2017-08, Receivables-Nonrefundable Fees and Other Costs (Subtopic 310-20), Premium Amortization on Purchased Callable Debt Securities (the "ASU") which amends the amortization period for certain purchased callable debt securities held at a premium, shortening such period to the earliest call date. The ASU does not require any accounting change for debt securities held at a discount; the discount continues to be amortized to maturity. The ASU is effective for fiscal years, and interim periods within those fiscal years, beginning after December 15, 2018. The Fund has adopted the ASU as of September 30, 2020 and it did not have an impact on the Fund's financial statements.
In March 2020, FASB issued an Accounting Standard Update, ASU 2020-04, Reference Rate Reform (Topic 848) — Facilitation of the Effects of Reference Rate Reform on Financial Reporting ("ASU 2020-04"), which provides optional, temporary relief with respect to the financial reporting of contracts subject to certain types of modifications due to the planned discontinuation of the London Interbank Offered Rate ("LIBOR") and other IBOR-based reference rates at the end of 2021. The temporary relief provided by ASU 2020-04 is effective for certain reference rate-related contract modifications
that occur during the period from March 12, 2020 through December 31, 2022. Management is evaluating the impact of ASU 2020-04 on the Fund's investments, derivatives, debt and other contracts that will undergo reference rate-related modifications as a result of the reference rate reform.
1. Security Valuation: (1) Certain portfolio securities may be valued by an outside pricing service/vendor approved by the Trust's Board of Trustees (the "Trustees"). The pricing service/vendor may employ a pricing model that takes into account, among other things, bids, yield spreads and/or other market data and specific security characteristics. Alternatively, if a valuation is not available from an outside pricing service/vendor, and the security trades on an exchange, the security may be valued at its latest reported sale price (or at the exchange official closing price if such exchange reports an official closing price), prior to the time when assets are valued. If there are no sales on a given day and if there is no official exchange closing price for that day, the security is valued at the mean between the last reported bid and asked prices if such bid and asked prices are available in the relevant exchanges. If only bid prices are available then the latest bid price may be used. If Morgan Stanley Investment Management Inc. (the "Adviser"), a wholly-owned subsidiary of Morgan Stanley, determines that the price provided by the outside pricing service/vendor or exchange does not reflect the security's fair value or is unable to provide a price, prices from brokers or dealers may also be utilized. In these circumstances, the value of the security will be the mean of bid and asked prices obtained from brokers or dealers; (2) certain senior collateralized loans ("Senior Loans") are valued based on quotations received from an independent pricing service; (3) when market quotations are not readily available, including circumstances under which the Adviser determines that the closing price, last sale price or the mean between the last reported bid and asked prices are not reflective of a security's market value, portfolio securities are valued at their fair value as determined in good faith under procedures established by and under the general supervision of the Trustees. Occasionally, developments affecting the closing prices of securities and other assets may occur between the times at which valuations of such securities are determined (that is, close of the foreign market on which the securities trade) and the close of business of the New York Stock Exchange ("NYSE"). If developments occur during such periods that are expected to materially affect the value of such securities, such valuations may be
19
Morgan Stanley Institutional Fund Trust
Annual Report — September 30, 2020
Notes to Financial Statements (cont'd)
adjusted to reflect the estimated fair value of such securities as of the close of the NYSE, as determined in good faith by the Trustees or by the Adviser using a pricing service and/or procedures approved by the Trustees; and (4) investments in mutual funds, including the Morgan Stanley Institutional Liquidity Funds, are valued at the net asset value ("NAV") as of the close of each business day.
The Trustees have responsibility for determining in good faith the fair value of the investments, and the Trustees may appoint others, such as the Trust's Adviser or a valuation committee, to assist the Trustees in determining fair value and to make the actual calculations pursuant to the fair valuation methodologies previously approved by the Trustees. Under procedures approved by the Trustees, the Trust's Adviser has formed a Valuation Committee whose members are approved by the Trustees. The Valuation Committee provides administration and oversight of the Trust's valuation policies and procedures, which are reviewed at least annually by the Trustees. These procedures allow the Trust to utilize independent pricing services, quotations from securities and financial instrument dealers and other market sources to determine fair value.
2. Fair Value Measurement: FASB Accounting Standards CodificationTM ("ASC") 820, "Fair Value Measurement" ("ASC 820"), defines fair value as the value that the Fund would receive to sell an investment or pay to transfer a liability in a timely transaction with an independent buyer in the principal market, or in the absence of a principal market, the most advantageous market for the investment or liability. ASC 820 establishes a three-tier hierarchy to distinguish between (1) inputs that reflect the assumptions market participants would use in valuing an asset or liability developed based on market data obtained from sources independent of the reporting entity (observable inputs) and (2) inputs that reflect the reporting entity's own assumptions about the assumptions market participants would use in valuing an asset or liability developed based on the best information available in the circumstances (unobservable inputs) and to establish classification of fair value measurements for disclosure purposes. Various inputs are used in determining the value of the Fund's investments. The inputs are summarized in the three broad levels listed below:
• Level 1 – unadjusted quoted prices in active markets for identical investments
• Level 2 – other significant observable inputs (including quoted prices for similar investments, interest rates, prepayment speeds, credit risk, etc.)
• Level 3 – significant unobservable inputs including the Fund's own assumptions in determining the fair value of investments. Factors considered in making this determination may include, but are not limited to, information obtained by contacting the issuer, analysts, or the appropriate stock exchange (for exchange-traded securities), analysis of the issuer's financial statements or other available documents and, if necessary, available information concerning other securities in similar circumstances.
The inputs or methodology used for valuing securities are not necessarily an indication of the risk associated with investing in those securities and the determination of the significance of a particular input to the fair value measurement in its entirety requires judgment and considers factors specific to each security.
The following is a summary of the inputs used to value the Fund's investments as of September 30, 2020:
Investment Type | | Level 1
Unadjusted
quoted
prices
(000) | | Level 2
Other
significant
observable
inputs
(000) | | Level 3
Significant
unobservable
inputs
(000) | | Total
(000) | |
Assets: | |
Fixed Income Securities | |
Corporate Bonds | | $ | — | | | $ | 8,438 | | | $ | — | | | $ | 8,438 | | |
Variable Rate Senior
Loan Interests | | | — | | | | 40,657 | | | | — | | | | 40,657 | | |
Total Fixed Income
Securities | | | — | | | | 49,095 | | | | — | | | | 49,095 | | |
Short-Term Investment | |
Investment Company | | | 55 | | | | — | | | | — | | | | 55 | | |
Total Assets | | $ | 55 | | | $ | 49,095 | | | $ | — | | | $ | 49,150 | | |
Transfers between investment levels may occur as the markets fluctuate and/or the availability of data used in an investment's valuation changes.
3. Senior Loans: Senior Loans are loans made to borrowers that may be corporations, partnerships or other entities. These borrowers operate in a variety of industries and geographic regions, although most Senior Loans are made to borrowers that are organized or located in the U.S. Sen-
20
Morgan Stanley Institutional Fund Trust
Annual Report — September 30, 2020
Notes to Financial Statements (cont'd)
ior Loans generally are negotiated between a borrower and several financial institution lenders represented by one or more lenders acting as agent of all the lenders. The agent is responsible for negotiating the loan agreement that establishes the terms and conditions of the Senior Loan and the rights of the borrower and the lenders. The Fund may purchase assignments of portions of Senior Loans from third parties and may invest in participations in Senior Loans. Senior Loans also may take the form of debt obligations of borrowers issued directly to investors in the form of debt securities (i.e., Senior Notes).
The purchaser of an assignment typically succeeds to all the rights and obligations under the loan agreement of the assigning lender and becomes a lender under the loan agreement. Assignments may, however, be arranged through private negotiations, and the rights and obligations acquired by the purchaser of an assignment may differ from, and be more limited than, those held by the assigning lender.
When the Fund purchases a participation in a Senior Loan, the Fund will usually have a contractual relationship only with the lender selling the participation and not with the borrower. The Fund may have the right to receive payments of principal, interest and any fees to which it is entitled only from the lender selling the participation and only upon receipt by the lender of such payments from the borrower. As a result, the Fund may assume the credit risk of both the borrower and the lender selling the participation. In the event of insolvency of the lender selling a participation, the Fund may be treated as a general creditor of the lender.
The Fund's investment in loans may include unfunded loan commitments, which are contractual obligations for funding. Unfunded loan commitments represent a future obligation in full, even though a percentage of the committed amount may not be utilized by the borrower. Unfunded loan commitments are reflected as a liability on the Statement of Assets and Liabilities.
4. Indemnifications: The Trust enters into contracts that contain a variety of indemnifications. The Trust's maximum exposure under these arrangements is unknown. However, the Trust has not had prior claims or losses pursuant to these contracts and expects the risk of loss to be remote.
5. Dividends and Distributions to Shareholders: Dividends and distributions to shareholders are recorded on the ex-dividend date. Dividends from net investment income, if any, are declared and paid monthly. Net realized capital gains, if any, are distributed at least annually.
6. Security Transactions, Income and Expenses: Security transactions are accounted for on the trade date (date the order to buy or sell is executed). Realized gains and losses on the sale of investment securities are determined on the specific identified cost method. When the Fund buys an interest in a Senior Loan, it may receive a commitment fee which is paid to lenders on an ongoing basis based upon the undrawn portion committed by the lenders of the underlying Senior Loan. The Fund accrues the commitment fee over the expected term of the loan. When the Fund sells an interest in a Senior Loan, it may be required to pay fees or commissions to the purchaser of the interest. Fees received in connection with loan amendments are accrued as earned. Dividend income and other distributions are recorded on the ex-dividend date (except for certain foreign dividends which may be recorded as soon as the Fund is informed of such dividends) net of applicable withholding taxes. Interest income is recognized on the accrual basis except where collection is in doubt. Discounts are accreted and premiums are amortized over the life of the respective securities. Most expenses of the Fund can be directly attributed to a particular Fund. Expenses which cannot be directly attributed are apportioned among the Funds based upon relative net assets or other appropriate methods. Income, expenses (other than class specific expenses — distribution and shareholder services, transfer agency and sub transfer agency fees) and realized and unrealized gains or losses are allocated to each class of shares based upon their relative net assets.
B. Advisory Fees: The Adviser, a wholly-owned subsidiary of Morgan Stanley, provides the Fund with advisory services under the terms of an Investment Advisory Agreement, paid quarterly, at the annual rate based on the daily net assets as follows:
First $1
billion | | Next $1.5
billion | | Over $2.5
billion | |
| | 0.60 | % | | | 0.55 | % | | | 0.50 | % | |
21
Morgan Stanley Institutional Fund Trust
Annual Report — September 30, 2020
Notes to Financial Statements (cont'd)
For the period ended September 30, 2020, the advisory fee rate (net of waivers/rebate) was equivalent to an annual effective rate of 0.00% of the Fund's average daily net assets.
The Adviser has agreed to reduce its advisory fee and/or reimburse the Fund so that total annual Fund operating expenses, excluding certain investment related expenses, taxes, interest and other extraordinary expenses (including litigation), will not exceed 0.80% for Class I shares, 1.15% for Class A shares, 1.90% for Class C shares and 0.75% for Class IS shares. The fee waivers and/or expense reimbursements will continue for at least one year from the date of the Fund's prospectus or until such time as the Trustees act to discontinue all or a portion of such waivers and/or reimbursements when they deem such action is appropriate. For the period ended September 30, 2020, approximately $189,000 of advisory fees were waived and approximately $54,000 of other expenses were reimbursed by the Adviser pursuant to this arrangement.
C. Administration Fees: The Adviser also serves as Administrator to the Trust and provides administrative services pursuant to an Administration Agreement for an annual fee, accrued daily and paid monthly, of 0.08% of the Fund's average daily net assets. Under a Sub-Administration Agreement between the Administrator and State Street Bank and Trust Company ("State Street"), State Street provides certain administrative services to the Trust. For such services, the Administrator pays State Street a portion of the fee the Administrator receives from the Fund.
D. Distribution and Shareholder Services Fees: Morgan Stanley Distribution, Inc. ("MSDI" or the "Distributor"), a wholly-owned subsidiary of the Adviser, and an indirect subsidiary of Morgan Stanley, serves as the Trust's Distributor of Fund shares pursuant to a Distribution Agreement. The Trust has adopted a Shareholder Services Plan with respect to Class A shares pursuant to Rule 12b-1 under the Act. Under the Shareholder Services Plan, the Fund pays the Distributor a shareholder services fee, accrued daily and paid monthly, at an annual rate of 0.25% of the Fund's average daily net assets attributable to Class A shares.
The Trust has adopted a Distribution and Shareholder Services Plan with respect to Class C shares pursuant to Rule 12b-1 under the Act. Under the Distribution and Shareholder Services Plan, the Fund pays the Distributor a distribution fee, accrued daily and paid monthly, at an annual rate of 0.75% and a shareholder services fee, accrued daily and paid monthly, at an
annual rate of 0.25% of the Fund's average daily net assets attributable to Class C shares.
The distribution and shareholder services fees are used to support the expenses associated with servicing and maintaining accounts. The Distributor may compensate other parties for providing shareholder support services to investors who purchase Class A and Class C shares.
E. Dividend Disbursing and Transfer/Co-Transfer Agent: The Trust's dividend disbursing and transfer agent is DST Asset Manager Solutions, Inc. ("DST"). Pursuant to a Transfer Agency Agreement, the Trust pays DST a fee based on the number of classes, accounts and transactions relating to the Funds of the Trust.
Morgan Stanley Services Company Inc. serves as Co-Transfer Agent and provides certain transfer agency services to the Fund with respect to certain direct transactions with the Fund.
F. Custodian Fees: State Street (the "Custodian") also serves as Custodian for the Trust in accordance with a Custodian Agreement. The Custodian holds cash, securities and other assets of the Trust as required by the Act. Custody fees are payable monthly based on assets held in custody, investment purchases and sales activity and account maintenance fees, plus reimbursement for certain out-of-pocket expenses.
G. Security Transactions and Transactions with Affiliates: For the period ended September 30, 2020, purchases and sales of investment securities for the Fund, other than long-term U.S. Government securities and short-term investments were approximately $62,997,000 and $11,906,000, respectively. There were no purchases and sales of long-term U.S. Government securities for the period ended September 30, 2020.
The Fund invests in the Institutional Class of the Morgan Stanley Institutional Liquidity Funds — Government Portfolio (the "Liquidity Funds"), an open-end management investment company managed by the Adviser. Advisory fees paid by the Fund are reduced by an amount equal to its pro-rata share of the advisory and administration fees paid by the Fund due to its investment in the Liquidity Funds. For the period ended September 30, 2020, advisory fees paid were reduced by approximately $8,000 relating to the Fund's investment in the Liquidity Funds.
22
Morgan Stanley Institutional Fund Trust
Annual Report — September 30, 2020
Notes to Financial Statements (cont'd)
A summary of the Fund's transactions in shares of affiliated investments during the period ended September 30, 2020 is as follows:
Affiliated
Investment
Company | | Value
January 31,
2020
(000) | | Purchases
at Cost
(000) | | Proceeds
from Sales
(000) | | Dividend
Income
(000) | |
Liquidity Funds | | $ | — | | | $ | 57,630 | | | $ | 57,575 | | | $ | 51 | | |
Affiliated
Investment
Company (cont'd) | | Realized
Gain
(Loss)
(000) | | Change in
Unrealized
Appreciation
(Depreciation)
(000) | | Value
September 30,
2020
(000) | |
Liquidity Funds | | $ | — | | | $ | — | | | $ | 55 | | |
The Fund is permitted to purchase and sell securities ("cross-trade") from and to other Morgan Stanley funds as well as other funds and client accounts for which the Adviser or an affiliate of the Adviser serves as investment adviser, pursuant to procedures approved by the Trustees in compliance with Rule 17a-7 under the Act (the "Rule"). Each cross-trade is executed at the current market price in compliance with provisions of the Rule. For the period ended September 30, 2020, the Fund did not engage in any cross-trade transactions.
The Fund has an unfunded Deferred Compensation Plan (the "Compensation Plan"), which allows each independent Trustee to defer payment of all, or a portion, of the fees he or she receives for serving on the Board of Trustees. Each eligible Trustee generally may elect to have the deferred amounts credited with a return equal to the total return on one or more of the Morgan Stanley funds that are offered as investment options under the Compensation Plan. Appreciation/depreciation and distributions received from these investments are recorded with an offsetting increase/decrease in the deferred compensation obligation and do not affect the NAV of the Fund.
H. Federal Income Taxes: It is the Fund's intention to continue to qualify as a regulated investment company and distribute all of its taxable and tax-exempt income. Accordingly, no provision for federal income taxes is required in the financial statements.
The Fund may be subject to taxes imposed by countries in which it invests. Such taxes are generally based on income and/or capital gains earned or repatriated. Taxes are accrued based on net investment income, net realized gains and net unrealized appreciation as such income and/or gains are earned. Taxes may also be based on transactions in foreign currency and are accrued based on the value of investments denominated in such currency.
FASB ASC 740-10, "Income Taxes — Overall", sets forth a minimum threshold for financial statement recognition of the benefit of a tax position taken or expected to be taken in a tax return. Management has concluded there are no significant uncertain tax positions that would require recognition in the financial statements. If applicable, the Fund recognizes interest accrued related to unrecognized tax benefits in "Interest Expense" and penalties in "Other Expenses" in the Statement of Operations. The Fund files tax returns with the U.S. Internal Revenue Service, New York and various states. The tax period ended September 30, 2020, remains subject to examination by taxing authorities.
The tax character of distributions paid may differ from the character of distributions shown for GAAP purposes due to short-term capital gains being treated as ordinary income for tax purposes. The tax character of distributions paid during fiscal year 2020 was as follows:
2020
Distributions
Paid From: | |
Ordinary
Income
(000) | |
| $ | 945 | | |
The amount and character of income and gains to be distributed are determined in accordance with income tax regulations which may differ from GAAP. These book/tax differences are either considered temporary or permanent in nature.
Temporary differences are attributable to differing book and tax treatments for the timing of the recognition of gains (losses) on certain investment transactions and the timing of the deductibility of certain expenses.
Permanent differences, due to a nondeductible expense, resulted in the following reclassifications among the components of net assets at September 30, 2020:
Total
Accumulated
Loss
(000) | | Paid-in-
Capital
(000) | |
| $ | — | @ | | $ | (— | @) | |
@ Amount is less than $500.
At September 30, 2020, the components of distributable earnings for the Fund on a tax basis were as follows:
Undistributed
Ordinary
Income
(000) | | Undistributed
Long-Term
Capital Gain
(000) | |
| $ | 275 | | | $ | — | | |
23
Morgan Stanley Institutional Fund Trust
Annual Report — September 30, 2020
Notes to Financial Statements (cont'd)
At September 30, 2020, the Fund had available for federal income tax purposes unused short-term capital losses of approximately $765,000 that do not have an expiration date.
To the extent that capital loss carryforwards are used to offset any future capital gains realized, no capital gains tax liability will be incurred by the Fund for gains realized and not distributed. To the extent that capital gains are offset, such gains will not be distributed to the shareholders.
I. Credit Facility: The Trust and other Morgan Stanley funds participated in a $300,000,000 committed, unsecured revolving line of credit facility (the "Facility") with State Street. This Facility is to be used for temporary emergency purposes or funding of shareholder redemption requests. The interest rate on borrowings is based on the federal funds rate or 1 month LIBOR rate plus a spread. The Facility also has a commitment fee of 0.25% per annum based on the unused portion of the Facility. During the period ended September 30, 2020, the Fund did not have any borrowings under the Facility.
J. Other: At September 30, 2020, the Fund did not have record owners of 10% or greater.
K. Market Risk: Certain impacts to public health conditions particular to the coronavirus (COVID-19) outbreak could impact the operations and financial performance of certain of the Fund's investments. The extent of the impact to the financial performance of the Fund's investments will depend on future developments, including (i) the duration and spread of the outbreak, (ii) the restrictions and advisories, (iii) the effects on the financial markets, and (iv) the effects on the economy overall, all of which are highly uncertain and cannot be predicted. If the financial performance of the Fund's investments is impacted because of these factors for an extended period, the Fund's investment results may be adversely affected.
L. LIBOR Risk: The Fund's investments, payment obligations and financing terms may be based on floating rates, such as London Interbank Offer Rate ("LIBOR"), Euro Interbank Offered Rate and other similar types of reference rates (each, a "Reference Rate"). These Reference Rates are generally intended to represent the rate at which contributing banks may obtain short-term borrowings from each other within certain financial markets. On July 27, 2017, the Chief Executive of the UK Financial Conduct Authority ("FCA"), which regulates LIBOR, announced that the FCA will no longer persuade nor require banks to submit rates for the calculation of LIBOR and certain other Reference Rates after 2021. Such announcement
indicates that the continuation of LIBOR and other Reference Rates on the current basis cannot and will not be guaranteed after the end of 2021. This announcement and any additional regulatory or market changes may have an adverse impact on the Fund or its investments.
In advance of 2022, regulators and market participants are currently engaged in identifying successor Reference Rates ("Alternative Reference Rates"). Additionally, prior to the end of 2021, it is expected that market participants will focus on the transition mechanisms by which the Reference Rates in existing contracts or instruments may be amended, whether through marketwide protocols, fallback contractual provisions, bespoke negotiations or amendments or otherwise. Nonetheless, the termination of certain Reference Rates presents risks to the Fund. At this time, it is not possible to completely identify or predict the effect of any such changes, any establishment of Alternative Reference Rates or any other reforms to Reference Rates that may be enacted in the UK or elsewhere. The elimination of a Reference Rate or any other changes or reforms to the determination or supervision of Reference Rates could have an adverse impact on the market for or value of any securities or payments linked to those Reference Rates and other financial obligations held by the Fund or on its overall financial condition or results of operations.
24
Morgan Stanley Institutional Fund Trust
Annual Report — September 30, 2020
Report of Independent Registered Public Accounting Firm
To the Shareholders and Board of Trustees of
Morgan Stanley Institutional Fund Trust —
Senior Loan Portfolio
Opinion on the Financial Statements
We have audited the accompanying statement of assets and liabilities of Senior Loan Portfolio (the "Fund") (one of the funds constituting Morgan Stanley Institutional Fund Trust (the "Trust")), including the portfolio of investments, as of September 30, 2020, and the related statements of operations and changes in net assets and the financial highlights for the period from January 31, 2020 (commencement of operations) through September 30, 2020 and the related notes (collectively referred to as the "financial statements"). In our opinion, the financial statements present fairly, in all material respects, the financial position of Senior Loan Portfolio (one of the funds constituting Morgan Stanley Institutional Fund Trust) at September 30, 2020, the results of its operations and the changes in its net assets and its financial highlights for the period from January 31, 2020 (commencement of operations) through September 30, 2020, in conformity with U.S. generally accepted accounting principles.
Basis for Opinion
These financial statements are the responsibility of the Trust's management. Our responsibility is to express an opinion on the Fund's financial statements based on our audit. We are a public accounting firm registered with the Public Company Accounting Oversight Board (United States) ("PCAOB") and are required to be independent with respect to the Trust in accordance with the U.S. federal securities law and the applicable rules and regulations of the Securities and Exchange Commission and the PCAOB.
We conducted our audit in accordance with the standards of the PCAOB. Those standards require that we plan and perform the audit to obtain reasonable assurance about whether the financial statements are free of material misstatement, whether due to error or fraud. The Trust is not required to have, nor were we engaged to perform, an audit of the Trust's internal control over financial reporting. As part of our audit, we are required to obtain an understanding of internal control over financial reporting, but not for the purpose of expressing an opinion on the effectiveness of the Trust's internal control over financial reporting. Accordingly, we express no such opinion.
Our audit included performing procedures to assess the risks of material misstatement of the financial statements, whether due to error or fraud, and performing procedures that respond to those risks. Such procedures included examining, on a test basis, evidence regarding the amounts and disclosures in the financial statements. Our procedures included confirmation of securities owned as of September 30, 2020 by correspondence with the custodian and brokers or by other appropriate auditing procedures where replies from brokers were not received. Our audit also included evaluating the accounting principles used and significant estimates made by management, as well as evaluating the overall presentation of the financial statements. We believe that our audit provides a reasonable basis for our opinion.

We have served as the auditor of one or more Morgan Stanley investment companies since 2000.
Boston, Massachusetts
November 24, 2020
25
Morgan Stanley Institutional Fund Trust
Annual Report — September 30, 2020
Investment Advisory Agreement Approval (unaudited)
The Board considered the following factors at the time of approval of the contracts which occurred prior to commencement of operations.
Nature, Extent and Quality of Services
The Board reviewed and considered the nature and extent of the investment advisory services to be provided by the Adviser under the advisory agreement, including portfolio management, investment research and equity and fixed income securities trading. The Board also reviewed and considered the nature and extent of the non-advisory, administrative services to be provided by the Administrator under the administration agreement, including accounting, operations, clerical, bookkeeping, compliance, business management and planning, legal services and the provision of supplies, office space and utilities at the Adviser's expense. The Board also considered the Adviser's investment in personnel and infrastructure that benefits the Fund. (The Adviser and Administrator together are referred to as the "Adviser" and the advisory and administration agreements together are referred to as the "Management Agreement.") The Board also considered that the Adviser serves a variety of other investment advisory clients and has experience overseeing service providers.
The Board reviewed and considered the qualifications of the portfolio managers, the senior administrative managers and other key personnel of the Adviser who will provide the advisory and administrative services to the Fund. The Board determined that the Adviser's portfolio managers and key personnel are well qualified by education and/or training and experience to perform the services in an efficient and professional manner. The Board concluded that the nature and extent of the advisory and administrative services to be provided were necessary and appropriate for the conduct of the business and investment activities of the Fund and supported its decision to approve the Management Agreement.
Performance, Fees and Expenses of the Fund
The Board considered that the Adviser plans to arrange for a public offering of shares of the Fund to raise assets for investment and that the offering had not yet begun and concluded that, since the Fund currently had no assets to invest (other than seed capital required under the Investment Company Act) and had no track record of performance, this was not a factor it needed to address at the present time.
The Board reviewed the advisory and administrative fee rates (the "management fee rates") proposed to be paid by the Fund under the Management Agreement relative to comparable funds advised by the Adviser, when applicable, and compared to their peers as determined by the Adviser, and reviewed the anticipated total expense ratio of the Fund. The Board considered that the Fund requires the Adviser to develop processes, invest in additional resources and incur additional risks to successfully manage the Fund and concluded that the proposed management fee rate and anticipated total expense ratio would be competitive with its peer group averages.
Economies of Scale
The Board considered the growth prospects of the Fund and the structure of the proposed management fee schedule, which does include breakpoints. The Board considered that the Fund's potential growth was uncertain and concluded that it would be premature to consider economies of scale as a factor in approving the Management Agreement at the present time.
Profitability of the Adviser and Affiliates
Since the Fund had not begun operations and had not paid any fees to the Adviser, the Board concluded that this was not a factor that needed to be considered at the present time.
Other Benefits of the Relationship
The Board considered other direct and indirect benefits to the Adviser and/or its affiliates to be derived from their relationship with the Fund and other funds advised by the Adviser. These benefits may include, among other things, fees for trading, distribution and/or shareholder servicing and for transaction processing and reporting platforms used by securities lending agents, and research received by the Adviser generated from commission dollars spent on funds' portfolio trading. Since the Fund had not begun operations and had not paid any fees to the Adviser, the Board concluded that these benefits were not a factor that needed to be considered at the present time.
26
Morgan Stanley Institutional Fund Trust
Annual Report — September 30, 2020
Investment Advisory Agreement Approval (unaudited) (cont'd)
Resources of the Adviser and Historical Relationship Between the Fund and the Adviser
The Board considered whether the Adviser is financially sound and has the resources necessary to perform its obligations under the Management Agreement. The Board also reviewed and considered the organizational structure of the Adviser, the policies and procedures formulated and adopted by the Adviser for managing the Fund's operations and the Board's confidence in the competence and integrity of the senior managers and key personnel of the Adviser. The Board concluded that the Adviser has the financial resources necessary to fulfill its obligations under the Management Agreement and that it is beneficial for the Fund to enter into this relationship with the Adviser.
Other Factors and Current Trends
The Board considered the controls and procedures adopted and implemented by the Adviser and monitored by the Fund's Chief Compliance Officer and concluded that the conduct of business by the Adviser indicates a good faith effort on its part to adhere to high ethical standards in the conduct of the Fund's business.
As part of the Board's review, the Board received information from management on the impact of COVID-19 on the firm generally and the Adviser and the Fund in particular including, among other information, the pandemic's current and expected impact on the Fund's performance and operations.
General Conclusion
After considering and weighing all of the above factors, with various written materials and verbal information presented by the Adviser, the Board concluded that it would be in the best interest of the Fund and its future shareholders to approve the Management Agreement, which will remain in effect for two years and thereafter must be approved annually by the Board of the Fund if it is to continue in effect. In reaching this conclusion the Board did not give particular weight to any single piece of information or factor referenced above. It is possible that individual Board members may have weighed these factors, and the information presented, differently in reaching their individual decisions to approve the Management Agreement.
27
Morgan Stanley Institutional Fund Trust
Annual Report — September 30, 2020
Liquidity Risk Management Program (unaudited)
In compliance with Rule 22e-4 under the Investment Company Act of 1940, as amended (the "Liquidity Rule"), the Fund has adopted and implemented a liquidity risk management program (the "Program"), which is reasonably designed to assess and manage the risk that the Fund could not meet requests to redeem shares issued by the Fund without significant dilution of remaining investors' interests in the Fund (i.e., liquidity risk). The Fund's Board of Trustees (the "Board") previously approved the designation of the Liquidity Risk Subcommittee (the "LRS") as Program administrator. The LRS is comprised of representatives from various divisions within Morgan Stanley Investment Management.
At a meeting held on April 22-23, 2020, the Board reviewed a written report prepared by the LRS that addressed the Program's operation and assessed its adequacy, and effectiveness of implementation for the period from December 1, 2018, through December 31, 2019, as required under the Liquidity Rule. The report concluded that the Program operated effectively and was adequately and effectively implemented in all material aspects, and that the relevant controls and safeguards were appropriately designed to enable the LRS to administer the Program in compliance with the Liquidity Rule.
In accordance with the Program, the LRS assessed each Fund's liquidity risk no less frequently than annually taking into consideration certain factors, as applicable, such as (i) investment strategy and liquidity of portfolio investments, (ii) short-term and long-term cash flow projections and (iii) holdings of cash and cash equivalents and borrowing arrangements and other funding sources. Certain factors are considered under both normal and reasonably foreseeable stressed conditions.
Each Fund portfolio investment is classified into one of four liquidity categories, which classification is assessed at least monthly by the LRS. The classification is based on a determination of the number of days it is reasonably expected to take to convert the investment into cash, or sell or dispose of the investment, in current market conditions without significantly changing the market value of the investment. Liquidity classification determinations take into account various market, trading and investment-specific considerations, as well as market depth, and in some cases utilize third-party vendor data.
The Liquidity Rule limits a fund's investments in illiquid investments to 15% of its net assets and requires funds that do not primarily hold assets that are highly liquid investments to determine and maintain a minimum percentage of the fund's net assets to be invested in highly liquid investments (highly liquid investment minimum or "HLIM"). The LRS believes that the Program includes provisions reasonably designed to review, monitor and comply with the 15% limit on illiquid investments and for determining, periodically reviewing and complying with the HLIM requirement, as applicable.
There can be no assurance that the Program will achieve its objectives under all circumstances in the future. Please refer to the Fund's prospectus for more information regarding the Fund's exposure to liquidity risk and other risks to which it may be subject.
28
Morgan Stanley Institutional Fund Trust
Annual Report — September 30, 2020
Privacy Notice (unaudited) April 2019
FACTS | | WHAT DOES MSIM DO WITH YOUR PERSONAL INFORMATION? | |
Why? | | Financial companies choose how they share your personal information. Federal law gives consumers the right to limit some but not all sharing. Federal law also requires us to tell you how we collect, share, and protect your personal information. Please read this notice carefully to understand what we do. | |
What? | | The types of personal information we collect and share depend on the product or service you have with us. This information can include:
n Social Security number and income
n investment experience and risk tolerance
n checking account number and wire transfer instructions | |
How? | | All financial companies need to share customers' personal information to run their everyday business. In the section below, we list the reasons financial companies can share their customers' personal information; the reasons MSIM chooses to share; and whether you can limit this sharing. | |
Reasons we can share your personal information | | Does MSIM share? | | Can you limit this sharing? | |
For our everyday business purposes —
such as to process your transactions, maintain your account(s), respond to court orders and legal investigations, or report to credit bureaus | | Yes | | No | |
For our marketing purposes —
to offer our products and services to you | | Yes | | No | |
For joint marketing with other financial companies | | No | | We don't share | |
For our affiliates' everyday business purposes —
information about your transactions and experiences | | Yes | | No | |
For our affiliates' everyday business purposes —
information about your creditworthiness | | No | | We don't share | |
For our affiliates to market to you | | No | | We don't share | |
For non-affiliates to market to you | | No | | We don't share | |
Questions? | | Call toll-free (844) 312-6327 or email: imprivacyinquiries@morganstanley.com | |
Who we are
Who is providing this notice? | | Morgan Stanley Investment Management, Inc. and its affiliated registered investment advisers, registered broker-dealers, and registered and unregistered funds ("MSIM") | |
29
Morgan Stanley Institutional Fund Trust
Annual Report — September 30, 2020
Privacy Notice (unaudited) (cont'd) April 2019
What we do
How does MSIM protect my personal information? | | To protect your personal information from unauthorized access and use, we use security measures that comply with federal law. These measures include computer safeguards and secured files and buildings. We have policies governing the proper handling of customer information by personnel and requiring third parties that provide support to adhere to appropriate security standards with respect to such information. | |
How does MSIM collect my personal information? | | We collect your personal information, for example, when you
n open an account or make deposits or withdrawals from your account
n buy securities from us or make a wire transfer
n give us your contact information
We also collect your personal information from others, such as credit bureaus, affiliates, or other companies. | |
Why can't I limit all sharing? | | Federal law gives you the right to limit only
n sharing for affiliates' everyday business purposes — information about your creditworthiness
n affiliates from using your information to market to you
n sharing for non-affiliates to market to you
State laws and individual companies may give you additional rights to limit sharing. See below for more on your rights under state law. | |
Definitions
Affiliates | | Companies related by common ownership or control. They can be financial and non-financial companies.
n Our affiliates include companies with a Morgan Stanley name and financial companies such as Morgan Stanley Smith Barney LLC and Morgan Stanley & Co. | |
Non-affiliates | | Companies not related by common ownership or control. They can be financial and non-financial companies.
n MSIM does not share with non-affiliates so they can market to you. | |
Joint marketing | | A formal agreement between non-affiliated financial companies that together market financial products or services to you.
n MSIM doesn't jointly market | |
Other Important Information
Vermont: Except as permitted by law, we will not share personal information we collect about Vermont residents with Non-affiliates unless you provide us with your written consent to share such information.
California: Except as permitted by law, we will not share personal information we collect about California residents with Non-affiliates and we will limit sharing such personal information with our Affiliates to comply with California privacy laws that apply to us.
30
Morgan Stanley Institutional Fund Trust
Annual Report — September 30, 2020
Trustee and Officer Information (unaudited)
Independent Trustees:
Name, Address and Birth Year
of Independent Trustee | | Position(s)
Held with
Registrant | | Length of Time
Served* | | Principal Occupation(s) During Past 5 Years
and Other Relevant Professional Experience | | Number of
Funds in
Fund Complex
Overseen by
Independent
Trustee** | | Other Directorships
Held by Independent
Trustee*** | |
Frank L. Bowman
c/o Perkins Coie LLP
Counsel to the Independent Trustees
1155 Avenue of the Americas, 22nd Floor
New York, NY 10036
Birth Year 1944 | | Trustee | | Since
August
2006 | | President, Strategic Decisions, LLC (consulting) (since February 2009); Director or Trustee of various Morgan Stanley Funds (since August 2006); Chairperson of the Compliance and Insurance Committee (since October 2015); formerly, Chairperson of the Insurance Sub-Committee of the Compliance and Insurance Committee (2007-2015); served as President and Chief Executive Officer of the Nuclear Energy Institute (policy organization) (February 2005-November 2008); retired as Admiral, U.S. Navy after serving over 38 years on active duty including 8 years as Director of the Naval Nuclear Propulsion Program in the Department of the Navy and the U.S. Department of Energy (1996-2004); served as Chief of Naval Personnel (July 1994-September 1996) and on the Joint Staff as Director of Political Military Affairs (June 1992-July 1994); knighted as Honorary Knight Commander of the Most Excellent Order of the British Empire; awarded the Officier de l'Orde National du Mérite by the French Government; elected to the National Academy of Engineering (2009). | | 86 | | Director of Naval and Nuclear Technologies LLP; Director Emeritus of the Armed Services YMCA; Member of the National Security Advisory Council of the Center for U.S. Global Engagement and a member of the CNA Military Advisory Board; Trustee of Fairhaven United Methodist Church; Member of the Board of Advisors of the Dolphin Scholarship Foundation; Director of other various non-profit organizations; Formerly, Director of BP p.l.c. (November 2010-May 2019). | |
Kathleen A. Dennis
c/o Perkins Coie LLP
Counsel to the Independent Trustees
1155 Avenue of the Americas, 22nd Floor
New York, NY 10036
Birth Year 1953 | | Trustee | | Since
August
2006 | | President, Cedarwood Associates (mutual fund and investment management consulting) (since July 2006); Chairperson of the Liquidity and Alternatives Sub-Committee of the Investment Committee (since October 2006) and Director or Trustee of various Morgan Stanley Funds (since August 2006); formerly, Senior Managing Director of Victory Capital Management (1993-2006). | | 86 | | Director of various non-profit organizations. | |
Nancy C. Everett
c/o Perkins Coie LLP
Counsel to the Independent Trustees
1155 Avenue of the Americas, 22nd Floor
New York, NY 10036
Birth Year 1955 | | Trustee | | Since
January
2015 | | Chief Executive Officer, Virginia Commonwealth University Investment Company (since November 2015); Owner, OBIR, LLC (institutional investment management consulting) (since June 2014); formerly, Managing Director, BlackRock, Inc. (February 2011-December 2013); and Chief Executive Officer, General Motors Asset Management (a/k/a Promark Global Advisors, Inc.) (June 2005-May 2010). | | 87 | | Formerly, Member of Virginia Commonwealth University School of Business Foundation (2005-2016); Member of Virginia Commonwealth University Board of Visitors (2013-2015); Member of Committee on Directors for Emerging Markets Growth Fund, Inc. (2007-2010); Chairperson of Performance Equity Management, LLC (2006-2010); and Chairperson, GMAM Absolute Return Strategies Fund, LLC (2006-2010). | |
31
Morgan Stanley Institutional Fund Trust
Annual Report — September 30, 2020
Trustee and Officer Information (unaudited) (cont'd)
Independent Trustees: (cont'd)
Name, Address and Birth Year
of Independent Trustee | | Position(s)
Held with
Registrant | | Length of Time
Served* | | Principal Occupation(s) During Past 5 Years
and Other Relevant Professional Experience | | Number of
Funds in
Fund Complex
Overseen by
Independent
Trustee** | | Other Directorships
Held by Independent
Trustee*** | |
Jakki L. Haussler
c/o Perkins Coie LLP
Counsel to the Independent Trustees
1155 Avenue of the Americas, 22nd Floor
New York, NY 10036
Birth Year 1957 | | Trustee | | Since
January
2015 | | Chairman, Opus Capital Group (since January 1996); formerly, Chief Executive Officer, Opus Capital Group (1996-2019); Director, Capvest Venture Fund, LP (May 2000-December 2011); Partner, Adena Ventures, LP (July 1999-December 2010); Director, The Victory Funds (February 2005-July 2008). | | 87 | | Director of Service Corporation International and Member, Audit Committee and Investment Committee; Director of Cincinnati Bell Inc. and Member, Audit Committee and Governance and Nominating Committee; Director of Northern Kentucky University Foundation and Member, Investment Committee; Member of Chase College of Law Transactional Law Practice Center Board of Advisors; Director of Chase College of Law Board of Visitors; formerly, Member, University of Cincinnati Foundation Investment Committee; Member, Miami University Board of Visitors (2008-2011); Trustee of Victory Funds (2005-2008) and Chairman, Investment Committee (2007-2008); Member, Service Provider Committee (2005-2008) and Director of Best Transport (2006-2019). | |
Dr. Manuel H. Johnson
c/o Johnson Smick
International, Inc.
220 I Street, NE — Suite 200 Washington, D.C. 20002
Birth Year 1949 | | Trustee | | Since
July
1991 | | Senior Partner, Johnson Smick International, Inc. (consulting firm); Chairperson of the Investment Committee (since October 2006) and Director or Trustee of various Morgan Stanley Funds (since July 1991); Co-Chairman and a founder of the Group of Seven Council (G7C) (international economic commission); formerly, Chairperson of the Audit Committee (July 1991-September 2006), Vice Chairman of the Board of Governors of the Federal Reserve System and Assistant Secretary of the U.S. Treasury. | | 86 | | Director of NVR, Inc. (home construction). | |
Joseph J. Kearns
c/o Perkins Coie LLP
Counsel to the Independent Trustees
1155 Avenue of the Americas, 22nd Floor
New York, NY 10036
Birth Year 1942 | | Trustee | | Since
August
1994 | | Senior Adviser, Kearns & Associates LLC (investment consulting); Chairperson of the Audit Committee (since October 2006) and Director or Trustee of various Morgan Stanley Funds (since August 1994); Director, Rubicorn Investments (since February 2019); formerly, Deputy Chairperson of the Audit Committee (July 2003-September 2006) and Chairperson of the Audit Committee of various Morgan Stanley Funds (since August 1994); CFO of the J. Paul Getty Trust (1982-1999). | | 87 | | Prior to August 10, 2016, Director of Electro Rent Corporation (equipment leasing); Prior to December 31, 2013, Director of The Ford Family Foundation. | |
32
Morgan Stanley Institutional Fund Trust
Annual Report — September 30, 2020
Trustee and Officer Information (unaudited) (cont'd)
Independent Trustees: (cont'd)
Name, Address and Birth Year
of Independent Trustee | | Position(s)
Held with
Registrant | | Length of Time
Served* | | Principal Occupation(s) During Past 5 Years
and Other Relevant Professional Experience | | Number of
Funds in
Fund Complex
Overseen by
Independent
Trustee** | | Other Directorships
Held by Independent
Trustee*** | |
Michael F. Klein
c/o Perkins Coie LLP
Counsel to the Independent Trustees
1155 Avenue of the Americas, 22nd Floor
New York, NY 10036
Birth Year 1958 | | Trustee | | Since
August
2006 | | Managing Director, Aetos Alternatives Management, LP (since March 2000); Co-President, Aetos Alternatives Management, LP (since January 2004) and Co-Chief Executive Officer of Aetos Alternatives Management, LP (since August 2013); Chairperson of the Fixed Income Sub-Committee of the Investment Committee (since October 2006) and Director or Trustee of various Morgan Stanley Funds (since August 2006); formerly, Managing Director, Morgan Stanley & Co. Inc. and Morgan Stanley Dean Witter Investment Management and President, various Morgan Stanley Funds (June 1998-March 2000); Principal, Morgan Stanley & Co. Inc. and Morgan Stanley Dean Witter Investment Management (August 1997-December 1999). | | 86 | | Director of certain investment funds managed or sponsored by Aetos Alternatives Management, LP; Director of Sanitized AG and Sanitized Marketing AG (specialty chemicals). | |
Patricia Maleski
c/o Perkins Coie LLP
Counsel to the Independent Trustees
1155 Avenue of the Americas, 22nd Floor
New York, NY 10036
Birth Year 1960 | | Trustee | | Since
January
2017 | | Managing Director, JPMorgan Asset Management (2004-2016); Oversight and Control Head of Fiduciary and Conflicts of Interest Program (2015-2016); Chief Control Officer-Global Asset Management (2013-2015); President, JPMorgan Funds (2010-2013); Chief Administrative Officer (2004-2013); various other positions including Treasurer and Board Liaison (since 2001). | | 87 | | None. | |
W. Allen Reed
c/o Perkins Coie LLP
Counsel to the Independent Trustees
1155 Avenue of the Americas, 22nd Floor
New York, NY 10036
Birth Year 1947 | | Chair of the Board and Trustee | | Chair of the Boards since August 2020 and Trustee since August 2006 | | Chair of the Boards of various Morgan Stanley Funds (since August 2020); Chairperson of the Governance Committee; Chairperson of the Equity Sub-Committee of the Investment Committee (since October 2006) and Director or Trustee of various Morgan Stanley Funds (since August 2006); formerly, Vice Chair of the Boards of various Morgan Stanley Funds (January 2020-August 2020); President and Chief Executive Officer of General Motors Asset Management; Chairman and Chief Executive Officer of the GM Trust Bank and Corporate Vice President of General Motors Corporation (August 1994-December 2005). | | 86 | | Formerly, Director of Legg Mason, Inc. (2006-2019); and Director of the Auburn University Foundation (2010-2015). | |
* This is the earliest date the Trustee began serving the Morgan Stanley Funds. Each Trustee serves an indefinite term, until his or her successor is elected.
** The Fund Complex includes (as of December 31, 2019) all open-end and closed-end funds (including all of their portfolios) advised by Morgan Stanley Investment Management Inc. (the "Adviser") and any funds that have an adviser that is an affiliated person of the Adviser (including, but not limited to, Morgan Stanley AIP GP LP).
*** This includes any directorships at public companies and registered investment companies held by the Trustee at any time during the past five years.
33
Morgan Stanley Institutional Fund Trust
Annual Report — September 30, 2020
Trustee and Officer Information (unaudited) (cont'd)
Executive Officers:
Name, Address and Birth Year
of Executive Officer | | Position(s) Held
with
Registrant | | Length of
Time Served* | | Principal Occupation(s) During Past 5 Years | |
John H. Gernon
522 Fifth Avenue
New York, NY 10036
Birth Year 1963 | | President and Principal Executive Officer | | Since September 2013 | | President and Principal Executive Officer of the Equity and Fixed Income Funds and the Morgan Stanley AIP Funds (since September 2013) and the Liquidity Funds and various money market funds (since May 2014) in the Fund Complex; Managing Director of the Adviser; Head of Public Markets Product Development (since 2006). | |
Timothy J. Knierim
522 Fifth Avenue
New York, NY 10036
Birth Year 1959 | | Chief Compliance Officer | | Since December 2016 | | Managing Director of the Adviser and various entities affiliated with the Adviser; Chief Compliance Officer of various Morgan Stanley Funds and the Adviser (since December 2016) and Chief Compliance Officer of Morgan Stanley AIP GP LP (since 2014). Formerly, Managing Director and Deputy Chief Compliance Officer of the Adviser (2014-2016); and formerly, Chief Compliance Officer of Prudential Investment Management, Inc. (2007-2014). | |
Francis J. Smith
522 Fifth Avenue
New York, NY 10036
Birth Year 1965 | | Treasurer and Principal Financial Officer | | Treasurer since July 2003 and Principal Financial Officer since September 2002 | | Managing Director of the Adviser and various entities affiliated with the Adviser; Treasurer (since July 2003) and Principal Financial Officer of various Morgan Stanley Funds (since September 2002). | |
Mary E. Mullin
522 Fifth Avenue
New York, NY 10036
Birth Year 1967 | | Secretary | | Since
June
1999 | | Managing Director of the Adviser; Secretary of various Morgan Stanley Funds (since June 1999). | |
Michael J. Key
522 Fifth Avenue
New York, NY 10036
Birth Year 1979 | | Vice President | | Since
June
2017 | | Vice President of the Equity and Fixed Income Funds, Liquidity Funds, various money market funds and the Morgan Stanley AIP Funds in the Fund Complex (since June 2017); Executive Director of the Adviser; Head of Product Development for Equity and Fixed Income Funds (since August 2013). | |
* This is the earliest date the officer began serving the Morgan Stanley Funds. Each officer serves a one-year term, until his or her successor is elected and qualifies.
34
Morgan Stanley Institutional Fund Trust
Annual Report — September 30, 2020
Adviser and Administrator
Morgan Stanley Investment Management Inc.
522 Fifth Avenue
New York, New York 10036
Distributor
Morgan Stanley Distribution, Inc.
522 Fifth Avenue
New York, New York 10036
Dividend Disbursing and Transfer Agent
DST Asset Manager Solutions, Inc.
2000 Crown Colony Drive
Quincy, Massachusetts 02169
Co-Transfer Agent
Morgan Stanley Services Company, Inc.
522 Fifth Avenue
New York, New York 10036
Custodian
State Street Bank and Trust Company
One Lincoln Street
Boston, Massachusetts 02111
Legal Counsel
Dechert LLP
1095 Avenue of the Americas
New York, New York 10036
Counsel to the Independent Trustees
Perkins Coie LLP
1155 Avenue of the Americas,
22nd Floor
New York, New York 10036
Independent Registered Public Accounting Firm
Ernst & Young LLP
200 Clarendon Street
Boston, Massachusetts 02116
Reporting to Shareholders
Each Morgan Stanley fund provides a complete schedule of portfolio holdings in its Semi-Annual and the Annual Reports within 60 days of the end of the fund's second and fourth fiscal quarters. The Semi-Annual and Annual Reports are filed electronically with the Securities and Exchange Commission ("SEC") on Form N-CSRS and Form N-CSR, respectively. Morgan Stanley also delivers the Semi-Annual and Annual Reports to fund shareholders and makes these reports available on its public website, www.morganstanley.com/im/shareholderreports. Each Morgan Stanley non-money market fund also files a complete schedule of portfolio holdings with the SEC for the fund's first and third fiscal quarters as an attachment to Form N-PORT. Morgan Stanley does not deliver the reports for the first and third fiscal quarters to shareholders, nor are the reports posted to the Morgan Stanley public website. However, the holdings for each money market fund are posted to the Morgan Stanley public website. You may obtain the Form N-PORT filings (as well as the Form N-CSR and N-CSRS filings) by accessing the SEC's website, www.sec.gov. You can also request copies of these materials, upon payment of a duplicating fee, by electronic request at the SEC's email address (publicinfo@sec.gov).
Proxy Voting Policies and Procedures and Proxy Voting Record
You may obtain a copy of the Trust's Proxy Voting Policy and Procedures and information regarding how the Trust voted proxies relating to portfolio securities during the most recent twelve-month period ended June 30, without charge, upon request, by calling toll free 1 (800) 548-7786 or by visiting our website at www.morganstanley.com/im/shareholderreports. This information is also available on the SEC's website at www.sec.gov.
This report is authorized for distribution only when preceded or accompanied by a prospectus or summary prospectus of the applicable Fund of Morgan Stanley Institutional Fund Trust, which describes in detail the Fund's investment policies, risks, fees and expenses. Please read the prospectus carefully before you invest or send money. For additional information, including information regarding the investments comprising the Fund, please visit our website at www.morganstanley.com/im/shareholderreports or call toll free 1 (800) 548-7786.
35
Printed in U.S.A.
This Report has been prepared for shareholders and may be distributed to others only if preceded or accompanied by a current prospectus.
Morgan Stanley Investment Management Inc.
522 Fifth Avenue
New York, New York 10036
© 2020 Morgan Stanley. Morgan Stanley Distribution, Inc.

IFTSLANN
3298773 EXP 11.30.21

Morgan Stanley Institutional Fund Trust
Short Duration Income Portfolio
Annual Report
September 30, 2020
Beginning on January 1, 2021, as permitted by regulations adopted by the Securities and Exchange Commission ("SEC"), paper copies of the Fund's Annual and Semi-Annual Reports to Shareholders ("Shareholder Reports") will no longer be sent by mail, unless you specifically request paper copies of the Shareholder Reports from the Fund or from your financial intermediary, such as a broker-dealer or a bank. Instead, the Shareholder Reports will be made available on the Fund's website, https://www.morganstanley.com/im/shareholderreports and you will be notified by mail each time a Shareholder Report is posted and provided with a website link to access the Shareholder Report. If you already elected to receive Shareholder Reports electronically, you will not be affected by this change and you need not take any action. You may elect to receive Shareholder Reports and other communications from the Fund electronically anytime by contacting your financial intermediary or, if you are a direct investor, please follow the instructions on the envelope.
Beginning on January 1, 2019, you may elect to receive all future Shareholder Reports in paper free of charge. If you invest through a financial intermediary, you can contact your financial intermediary to request that you continue to receive paper copies of your Shareholder Reports. If you invest directly with the Fund, please follow the instructions on the envelope to let the Fund know you wish to continue receiving paper copies of your Shareholder Reports. Your election to receive Shareholder Reports in paper will apply to all funds held in your account if you invest through your financial intermediary or all funds held with the fund complex if you invest directly with a fund.

Morgan Stanley Institutional Fund Trust
Annual Report — September 30, 2020
Shareholders' Letter | | | 2 | | |
Expense Example | | | 3 | | |
Investment Overview | | | 4 | | |
Portfolio of Investments | | | 7 | | |
Statement of Assets and Liabilities | | | 15 | | |
Statement of Operations | | | 17 | | |
Statements of Changes in Net Assets | | | 18 | | |
Financial Highlights | | | 20 | | |
Notes to Financial Statements | | | 25 | | |
Report of Independent Registered Public Accounting Firm | | | 33 | | |
Investment Advisory Agreement Approval | | | 34 | | |
Liquidity Risk Management Program | | | 36 | | |
Privacy Notice | | | 37 | | |
Trustee and Officer Information | | | 39 | | |
This report is authorized for distribution only when preceded or accompanied by a prospectus or summary prospectus of the applicable Fund of the Morgan Stanley Institutional Fund Trust. To receive a prospectus and/or statement of additional information ("SAI"), which contains more complete information such as investment objectives, charges, expenses, policies for voting proxies, risk considerations and describes in detail each of the Fund's investment policies to the prospective investor, please call toll free 1 (800) 548-7786. Please read the prospectuses carefully before you invest or send money.
Additionally, you can access information about the Fund, including performance, characteristics and investment team commentary, through Morgan Stanley Investment Management's website: www.morganstanley.com/im/shareholderreports.
Market forecasts provided in this report may not necessarily come to pass. There is no guarantee that any sectors mentioned will continue to perform as discussed herein or that securities in such sectors will be held by the Fund in the future. There is no assurance that a fund will achieve its investment objective. Funds are subject to market risk, which is the possibility that market values of securities owned by the Fund will decline and, therefore, the value of the Fund's shares may be less than what you paid for them. Accordingly, you can lose money investing in this Fund. Please see the prospectus for more complete information on investment risks.
1
Morgan Stanley Institutional Fund Trust
Annual Report — September 30, 2020
Shareholders' Letter (unaudited)
Dear Shareholders,
We are pleased to provide this Annual Report, in which you will learn how your investment in Short Duration Income Portfolio (the "Fund") performed during the latest twelve-month period.
Morgan Stanley Investment Management is a client-centric, investor-led organization. Our global presence, intellectual capital, and breadth of products and services enable us to partner with investors to meet the evolving challenges of today's financial markets. We aim to deliver superior investment service and to empower our clients to make the informed decisions that help them reach their investment goals.
As always, we thank you for selecting Morgan Stanley Investment Management, and look forward to working with you in the months and years ahead.
Sincerely,

John H. Gernon
President and Principal Executive Officer
October 2020
2
Morgan Stanley Institutional Fund Trust
Annual Report — September 30, 2020
Expense Example (unaudited)
Short Duration Income Portfolio
As a shareholder of the Fund, you may incur two types of costs: (1) transactional costs, including sales charge (loads) on purchase payments; and (2) ongoing costs, which may include advisory fees, administration fees, distribution and shareholder services fees; and other Fund expenses. This example is intended to help you understand your ongoing costs (in dollars) of investing in the Fund and to compare these costs with the ongoing costs of investing in other mutual funds.
This example is based on an investment of $1,000 invested at the beginning of the six-month period ended September 30, 2020 and held for the entire six-month period.
Actual Expenses
The table below provides information about actual account values and actual expenses. You may use the information in this table, together with the amount you invested, to estimate the expenses that you paid over the period. Simply divide your account value by $1,000 (for example, an $8,600 account value divided by $1,000 = 8.6), then multiply the result by the number in the table under the heading entitled "Actual Expenses Paid During Period" to estimate the expenses you paid on your account during this period.
Hypothetical Example for Comparison Purposes
The table below provides information about hypothetical account values and hypothetical expenses based on the Fund's actual expense ratio and an assumed rate of return of 5% per year before expenses, which is not the Fund's actual return. The hypothetical account values and expenses may not be used to estimate the actual ending account balance or expenses you paid for the period. You may use this information to compare the ongoing costs of investing in the Fund and other funds. To do so, compare this 5% hypothetical example with the 5% hypothetical examples that appear in the shareholder reports of the other funds.
Please note that the expenses shown in the table are meant to highlight your ongoing costs only and do not reflect any transactional costs, such as sales charges (loads, if applicable). Therefore, the information for each class in the table is useful in comparing ongoing costs only, and will not help you determine the relative total costs of owning different funds. In addition, if these transactional costs were included, your costs would have been higher.
| | | Beginning
Account
Value
4/1/20 | | Actual Ending
Account
Value
9/30/20 | | Hypothetical
Ending Account
Value | | Actual
Expenses
Paid
During
Period* | | Hypothetical
Expenses Paid
During Period* | | Net
Expense
Ratio
During
Period** | |
Short Duration Income Portfolio Class I | | $ | 1,000.00 | | | $ | 1,059.80 | | | $ | 1,023.55 | | | $ | 1.49 | | | $ | 1.47 | | | | 0.29 | % | |
Short Duration Income Portfolio Class A | | | 1,000.00 | | | | 1,059.70 | | | | 1,022.30 | | | | 2.78 | | | | 2.73 | | | | 0.54 | | |
Short Duration Income Portfolio Class L | | | 1,000.00 | | | | 1,058.50 | | | | 1,021.05 | | | | 4.07 | | | | 3.99 | | | | 0.79 | | |
Short Duration Income Portfolio Class C | | | 1,000.00 | | | | 1,054.50 | | | | 1,018.55 | | | | 6.63 | | | | 6.51 | | | | 1.29 | | |
Short Duration Income Portfolio Class IS | | | 1,000.00 | | | | 1,061.40 | | | | 1,023.75 | | | | 1.29 | | | | 1.26 | | | | 0.25 | | |
* Expenses are calculated using each Fund Class' annualized net expense ratio (as disclosed), multiplied by the average account value over the period and multiplied by 183/366 (to reflect the most recent one-half year period).
** Annualized.
3
Morgan Stanley Institutional Fund Trust
Annual Report — September 30, 2020
Investment Overview (unaudited)
Short Duration Income Portfolio
The Fund seeks above-average total return over a market cycle of three to five years.
Performance
For the fiscal year ended September 30, 2020, the Fund's Class I shares had a total return based on net asset value and reinvestment of distributions per share of 3.20%, net of fees. The Fund's Class I shares underperformed against the Fund's benchmark, the Bloomberg Barclays 1-3 Year U.S. Government/Credit Index (the "Index"), which returned 3.73%.
Factors Affecting Performance
• Government bond yields have declined significantly over the period in the U.S. and throughout the world, following a downturn in the first quarter of 2020 due to the coronavirus. This helped absolute performance for the portfolio and benchmark, as the portfolio had similar duration to the index over the period.
• The portfolio's overweight to investment grade corporate bonds contributed to relative performance as spreads have tightened significantly following the Federal Reserve's (Fed) intervention in the bond markets. In March 2020, rates were cut to the effective lower bound and trillions of dollars were injected into money markets and bond markets. New programs were begun with a whole new set of acronyms (TALF, MMCP, CPFF). These helped significantly calm markets, particularly government bond markets where yields had perversely rose significantly as virus and economic news got worse. By March 19, 2020, U.S. Treasury and other global government bond market yields began to fall, signaling success for the Fed's first objective, stabilizing money markets and lowering U.S. Treasury yields. Importantly, the rapid fall in U.S. Treasury yields allowed high quality corporate bond yields to fall as well, signaling help for the embattled private economy.
• The portfolio's exposure to securitized credit (non-agency and agency residential mortgage-backed securities) also contributed to relative performance, particularly in the second quarter of 2020 as certain areas of the securitized credit markets rebounded faster than others. For example, the portfolio's exposure to asset-backed securities and non-agency commercial mortgage-backed securities was a main detractor from relative performance due to these
areas' lagged recovery following the market sell-off in the first quarter of 2020.
Management Strategies
• We see little risk of government bond yields rising meaningfully anytime soon. Recent rises in yields during September 2020 appear to have been more technical in nature and/or related to shifting probabilities of who will be elected the next U.S. president. However, further declines in yields also seem unlikely, given that most central banks have now cut interest rates to as low as they feel comfortable doing. Nonetheless, further cuts and other policy innovations could still happen if there is a turn for the worse, so there is still a case, we believe, for owning high-quality government bonds as a hedge against further stress, even if much less than normal.
• The perception that the Fed is likely to pursue an exceptionally easy monetary policy relative to others has caused a cheapening of the U.S. dollar. However, heightened global risk aversion in September 2020 caused the dollar to recover some. While we remain longer-term modest-dollar bears, we do not think there is enough clarity on relative economic performances and resolution of who will lead the U.S. to be highly confident the dollar will fall meaningfully in the near term.
• We remain constructive on corporate credit. Although we continue to hold a positive and upbeat view with regard to the evolution of the economy and credit spreads, risks remain. Rising infection rates, leading to larger and more aggressive lockdowns, could easily slow economies and upend our views. We do not think this is likely, as all governments seem to be adopting more selective, targeted lockdowns to deal with local issues. As long as local issues do not spread and/or hospitalization rates/mortality rates do not climb too much, economies should be fine. Vaccines continue to be the linchpin of a broader solution to get sectors of the economy like travel, leisure and entertainment back to semi-normal, thus allowing national incomes to return back to pre-COVID-19 levels.
• In the securitized assets sector, we still have a positive fundamental credit outlook for U.S. residential and consumer credit conditions given various government support programs that have been put in place in response to the coronavirus pandemic.
4
Morgan Stanley Institutional Fund Trust
Annual Report — September 30, 2020
Investment Overview (unaudited) (cont'd)
Short Duration Income Portfolio

* Minimum Investment
In accordance with SEC regulations, the Fund's performance shown assumes that all recurring fees (including management fees) were deducted and all dividends and distributions were reinvested. The performance of Class A, Class L, Class C and Class IS shares will vary from the performance of Class I shares based upon their different inception dates and will be negatively impacted by additional fees assessed to those classes (where applicable).
Performance Compared to the Bloomberg Barclays 1-3 Year U.S. Government/Credit Index(1), the Short Duration Income Blend Index(2) and the Lipper Short Investment Grade Debt Funds Index(3)
| | | Period Ended September 30, 2020
Total Returns(4) | |
| | | | | Average Annual | |
| | | One
Year | | Five
Years | | Ten
Years | | Since
Inception(10) | |
Fund — Class I Shares
w/o sales charges(5) | | | 3.20 | % | | | 3.71 | % | | | 2.57 | % | | | 3.11 | % | |
Fund — Class A Shares
w/o sales charges(6) | | | 3.06 | | | | 3.49 | | | | 2.32 | | | | 0.64 | | |
Fund — Class A Shares
with maximum 2.00%
sales charges(6) | | | 0.98 | | | | 3.06 | | | | 2.11 | | | | 0.48 | | |
Fund — Class L Shares
w/o sales charges(7) | | | 2.69 | | | | 3.19 | | | | — | | | | 2.15 | | |
Fund — Class C Shares
w/o sales charges(8) | | | 2.16 | | | | 2.66 | | | | — | | | | 2.28 | | |
Fund — Class C Shares with
maximum 1.00% deferred
sales charges(8) | | | 1.16 | | | | 2.66 | | | | — | | | | 2.28 | | |
Fund — Class IS Shares
w/o sales charges(9) | | | 3.37 | | | | — | | | | — | | | | 4.02 | | |
Bloomberg Barclays 1-3 Year
U.S. Government/Credit Index | | | 3.73 | | | | 2.09 | | | | 1.57 | | | | 3.92 | | |
Short Duration Income Blend Index | | | 3.73 | | | | 1.85 | | | | 1.45 | | | | 3.87 | | |
Lipper Short Investment Grade
Debt Funds Index | | | 3.86 | | | | 2.51 | | | | 2.04 | | | | 3.76 | | |
Performance data quoted represents past performance, which is no guarantee of future results, and current performance may be lower or higher than the figures shown. Performance assumes that all dividends and distributions, if any, were reinvested. For the most recent month-end performance figures, please visit www.morganstanley.com/im/shareholderreports. Investment returns and principal value will fluctuate so that Fund shares, when redeemed, may be worth more or less than their original cost. Total returns do not reflect the deduction of taxes that a shareholder would pay on Fund distributions or the redemption of Fund shares. Performance of share classes will vary due to differences in sales charges and expenses.
(1) The Bloomberg Barclays 1-3 Year U.S. Government/Credit Index tracks the securities in the 1-3 year maturity range of the Bloomberg Barclays U.S. Government/Credit Index which tracks investment-grade (BBB-/Baa3) or higher publicly traded fixed rate U.S. government, U.S. agency, and corporate issues. The Index is unmanaged and its returns do not include any sales charges or fees. Such costs would lower performance. It is not possible to invest directly in an index.
5
Morgan Stanley Institutional Fund Trust
Annual Report — September 30, 2020
Investment Overview (unaudited) (cont'd)
Short Duration Income Portfolio
(2) The Short Duration Income Blend Index is a performance linked benchmark of the old benchmarks represented by Bloomberg Barclays 1-3 Year U.S. Government/Credit Index for periods from the Fund's inception to January 8, 2016, the ICE BofA 1-Year U.S. Treasury Note Index (benchmark that tracks one-year U.S. government securities) from January 9, 2016 to July 31, 2019 and the new benchmark represented by Bloomberg Barclays 1-3 Year U.S. Government/Credit index for periods thereafter. The Index is unmanaged and its returns do not include any sales charges or fees. Such costs would lower performance. It is not possible to invest directly in an index.
(3) The Lipper Short Investment Grade Debt Funds Index is an equally weighted performance index of the largest qualifying funds (based on net assets) in the Lipper Short Investment Grade Debt Funds classification. The Index, which is adjusted for capital gains distributions and income dividends, is unmanaged and should not be considered an investment. There are currently 30 funds represented in this Index. As of the date of this report, the Fund was in the Lipper Short Investment Grade Debt Funds classification.
(4) Total returns for the Fund reflect expenses waived and/or reimbursed, if applicable, by the Adviser. Without such waivers and/or reimbursements, total returns would have been lower.
(5) Commenced operations on March 31, 1992.
(6) Commenced offering on September 28, 2007.
(7) Commenced offering on April 27, 2012.
(8) Commenced offering on April 30, 2015.
(9) Commenced offering on January 11, 2016.
(10) For comparative purposes, average annual since inception returns listed for the Indexes refer to the inception date of Class I of the Fund, not the inception of the Indexes.
6
Morgan Stanley Institutional Fund Trust
Annual Report — September 30, 2020
Portfolio of Investments
Short Duration Income Portfolio
| | | Face
Amount
(000) | | Value
(000) | |
Fixed Income Securities (92.6%) | |
Agency Adjustable Rate Mortgages (0.2%) | |
Federal Home Loan Mortgage Corporation,
Conventional Pools:
1 Year CMT + 2.31%, 3.46%, 3/1/37 | | $ | 277 | | | $ | 294 | | |
1 Year CMT + 2.18%, 3.60%, 6/1/38 | | | 136 | | | | 143 | | |
1 Year CMT + 2.32%, 3.61%, 7/1/38 | | | 218 | | | | 231 | | |
1 Year CMT + 2.33%, 3.80%, 1/1/36 | | | 223 | | | | 236 | | |
| | | | 904 | | |
Agency Bond — Consumer Discretionary
(U.S. Government Guaranteed) (0.1%) | |
Safina Ltd. | |
2.00%, 12/30/23 | | | 290 | | | | 297 | | |
Agency Fixed Rate Mortgages (0.3%) | |
Federal Home Loan Mortgage Corporation,
Gold Pools: | |
4.50%, 12/1/24 | | | 155 | | | | 164 | | |
6.50%, 4/1/24 | | | — | @ | | | 1 | | |
7.50%, 5/1/35 | | | 18 | | | | 22 | | |
8.00%, 8/1/32 | | | 11 | | | | 13 | | |
8.50%, 8/1/31 | | | 11 | | | | 13 | | |
Federal National Mortgage Association,
Conventional Pools: | |
4.50%, 6/1/24 — 7/1/24 | | | 261 | | | | 275 | | |
5.00%, 12/1/23 — 12/1/24 | | | 125 | | | | 132 | | |
6.00%, 9/1/37 | | | 46 | | | | 54 | | |
6.50%, 2/1/28 — 10/1/32 | | | 152 | | | | 171 | | |
7.00%, 7/1/29 — 3/1/37 | | | 177 | | | | 203 | | |
7.50%, 8/1/37 | | | 23 | | | | 29 | | |
8.00%, 4/1/33 | | | 43 | | | | 53 | | |
8.50%, 10/1/32 | | | 20 | | | | 25 | | |
Government National Mortgage Association,
Various Pools: | |
6.00%, 11/15/38 | | | 80 | | | | 92 | | |
8.50%, 7/15/30 | | | 26 | | | | 28 | | |
| | | | 1,275 | | |
Asset-Backed Securities (13.2%) | |
Ajax Mortgage Loan Trust | |
1.70%, 5/25/59 (a) | | | 812 | | | | 814 | | |
Ally Auto Receivables Trust | |
1.75%, 12/15/21 | | | 37 | | | | 37 | | |
AMSR Trust | |
2.11%, 9/17/37 (a) | | | 975 | | | | 979 | | |
Aqua Finance Trust | |
3.14%, 7/16/40 (a) | | | 346 | | | | 354 | | |
Avant Loans Funding Trust | |
4.11%, 7/15/22 (a) | | | 211 | | | | 211 | | |
Bayview Opportunity Master Fund Trust | |
3.50%, 1/28/55 (a)(b) | | | 181 | | | | 185 | | |
CarMax Auto Owner Trust, | |
1.70%, 11/15/24 | | | 1,800 | | | | 1,843 | | |
1.98%, 11/15/21 | | | — | @ | | | — | @ | |
| | | Face
Amount
(000) | | Value
(000) | |
Cascade Funding Mortgage Trust
3.40%, 4/25/30 (a)(b) | | $ | 665 | | | $ | 675 | | |
| CFMT 2020-HB3 LLC | |
5.11%, 5/25/30 (a)(b) | | | 800 | | | | 808 | | |
| CNH Equipment Trust | |
2.01%, 12/16/24 | | | 1,528 | | | | 1,570 | | |
Consumer Loan Underlying Bond Credit Trust, | |
3.28%, 7/15/26 (a) | | | 845 | | | | 847 | | |
4.07%, 7/15/25 (a) | | | 260 | | | | 261 | | |
Fair Square Issuance Trust | |
2.90%, 9/20/24 (a) | | | 300 | | | | 300 | | |
Falcon Aerospace Ltd. | |
3.60%, 9/15/39 (a) | | | 401 | | | | 370 | | |
FCI Funding 2019-1 LLC | |
3.63%, 2/18/31 (a) | | | 229 | | | | 233 | | |
Finance of America HECM Buyout | |
2.01%, 2/25/30 (a)(b) | | | 1,309 | | | | 1,309 | | |
Foundation Finance Trust, | |
3.30%, 7/15/33 (a) | | | 194 | | | | 197 | | |
3.86%, 11/15/34 (a) | | | 370 | | | | 382 | | |
FREED ABS Trust, | |
3.19%, 11/18/26 (a) | | | 900 | | | | 894 | | |
3.87%, 6/18/26 (a) | | | 500 | | | | 501 | | |
4.61%, 10/20/25 (a) | | | 560 | | | | 562 | | |
GAIA Aviation Ltd. | |
3.97%, 12/15/44 (a) | | | 582 | | | | 518 | | |
GM Financial Automobile Leasing Trust | |
1.67%, 12/20/22 | | | 830 | | | | 843 | | |
GM Financial Automobile Leasing Trust 2020-2 | |
0.80%, 7/20/23 | | | 220 | | | | 222 | | |
GM Financial Consumer Automobile Receivables Trust | |
2.81%, 12/16/22 | | | 837 | | | | 848 | | |
Hyundai Auto Lease Securitization Trust | |
2.92%, 7/15/21 (a) | | | 108 | | | | 108 | | |
Hyundai Auto Receivables Trust | |
1.77%, 1/18/22 | | | 79 | | | | 79 | | |
Kubota Credit Owner Trust | |
0.59%, 10/15/24 (a) | | | 675 | | | | 678 | | |
LL ABS Trust | |
2.33%, 1/17/28 (a) | | | 700 | | | | 700 | | |
Lunar Aircraft Ltd. | |
3.38%, 2/15/45 (a) | | | 182 | | | | 170 | | |
MACH 1 Cayman Ltd. | |
3.47%, 10/15/39 (a) | | | 511 | | | | 470 | | |
Mercedes-Benz Auto Receivables Trust | |
0.55%, 2/18/25 | | | 330 | | | | 332 | | |
MFA LLC, | |
3.35%, 11/25/47 (a) | | | 358 | | | | 359 | | |
3.88%, 5/25/48 (a) | | | 510 | | | | 510 | | |
4.16%, 7/25/48 (a) | | | 358 | | | | 359 | | |
Mosaic Solar Loan Trust | |
2.10%, 4/20/46 (a) | | | 380 | | | | 390 | | |
The accompanying notes are an integral part of the financial statements.
7
Morgan Stanley Institutional Fund Trust
Annual Report — September 30, 2020
Portfolio of Investments (cont'd)
Short Duration Income Portfolio
| | | Face
Amount
(000) | | Value
(000) | |
Asset-Backed Securities (cont'd) | |
Nationstar HECM Loan Trust,
1.27%, 9/25/30 (a)(b) | | $ | 900 | | | $ | 900 | | |
2.27%, 11/25/29 (a)(b) | | | 122 | | | | 123 | | |
New Residential Advance Receivables Trust | |
1.43%, 8/15/53 (a) | | | 1,170 | | | | 1,173 | | |
2.80%, 10/15/51 (a) | | | 352 | | | | 352 | | |
Nissan Auto Receivables Owner Trust | |
1.75%, 10/15/21 | | | 87 | | | | 87 | | |
North Carolina State Education Assistance Authority | |
3 Month USD LIBOR + 0.80%,
1.04%, 7/25/25 (b) | | | 69 | | | | 69 | | |
NRZ Advance Receivables Trust | |
1.48%, 9/15/53 (a) | | | 1,380 | | | | 1,385 | | |
NRZ Excess Spread-Collateralized Notes, | |
4.37%, 1/25/23 (a) | | | 237 | | | | 234 | | |
4.59%, 2/25/23 (a) | | | 352 | | | | 340 | | |
NYCTL Trust | |
2.19%, 11/10/32 (a) | | | 580 | | | | 588 | | |
Ocwen Master Advance Receivables Trust | |
1.28%, 8/15/52 (a) | | | 1,150 | | | | 1,156 | | |
OnDeck Asset Securitization Trust II LLC | |
3.33%, 11/18/24 (a) | | | 900 | | | | 816 | | |
Option One Mortgage Loan Trust
Asset-Backed Certificates | |
1 Month USD LIBOR + 0.50%, 0.66%, 8/20/30 (b) | | | 86 | | | | 85 | | |
Oscar US Funding X LLC | |
3.18%, 5/10/23 (a) | | | 830 | | | | 851 | | |
Oscar US Funding XI LLC | |
2.49%, 8/10/22 (a) | | | 170 | | | | 171 | | |
Oxford Finance Funding LLC | |
3.10%, 2/15/28 (a) | | | 350 | | | | 356 | | |
PFS Financing Corp., | |
1.27%, 6/15/25 (a) | | | 1,500 | | | | 1,515 | | |
2.23%, 10/15/24 (a) | | | 1,160 | | | | 1,194 | | |
2.74%, 10/17/22 (a) | | | 440 | | | | 439 | | |
2.86%, 4/15/24 (a) | | | 230 | | | | 236 | | |
2.89%, 2/15/23 (a) | | | 275 | | | | 278 | | |
3.19%, 4/17/23 (a) | | | 300 | | | | 304 | | |
3.52%, 10/15/23 (a) | | | 162 | | | | 167 | | |
Pretium Mortgage Credit Partners I LLC | |
2.86%, 5/27/59 (a) | | | 699 | | | | 697 | | |
Prosper Marketplace Issuance Trust, | |
3.59%, 7/15/25 (a) | | | 700 | | | | 705 | | |
3.96%, 10/15/24 (a) | | | 97 | | | | 97 | | |
PRPM LLC, | |
3.75%, 4/25/23 (a)(b) | | | 235 | | | | 238 | | |
3.97%, 4/25/24 (a) | | | 616 | | | | 622 | | |
Raptor Aircraft Finance I LLC | |
4.21%, 8/23/44 (a) | | | 807 | | | | 722 | | |
RCO V Mortgage LLC, | |
3.47%, 11/25/24 (a) | | | 774 | | | | 774 | | |
4.46%, 10/25/23 (a) | | | 1 | | | | 1 | | |
| | | Face
Amount
(000) | | Value
(000) | |
ReadyCap Lending Small Business Loan Trust,
Daily U.S. Prime Rate – 0.50%,
2.75%, 12/27/44 (a)(b) | | $ | 249 | | | $ | 232 | | |
Republic FInance Issuance Trust | |
3.43%, 11/22/27 (a) | | | 800 | | | | 814 | | |
Santander Retail Auto Lease Trust | |
1.74%, 7/20/23 (a) | | | 1,330 | | | | 1,358 | | |
SFS Asset Securitization LLC | |
4.24%, 6/10/25 (a) | | | 814 | | | | 813 | | |
Small Business Lending Trust | |
2.85%, 7/15/26 (a) | | | 138 | | | | 136 | | |
Sofi Consumer Loan Program Trust, | |
3.14%, 2/25/27 (a) | | | 110 | | | | 111 | | |
3.35%, 4/26/27 (a) | | | 98 | | | | 99 | | |
3.67%, 8/25/27 (a) | | | 353 | | | | 357 | | |
SPS Servicer Advance Receivables Trust
Advance Receivables Backed Notes | |
2.77%, 10/15/52 (a) | | | 325 | | | | 322 | | |
TLF National Tax Lien Trust | |
3.09%, 12/15/29 (a) | | | 277 | | | | 278 | | |
Towd Point Mortgage Trust, | |
1 Month USD LIBOR + 0.60%,
0.75%, 2/25/57 (a)(b) | | | 248 | | | | 248 | | |
2.75%, 4/25/57 (a)(b) | | | 83 | | | | 86 | | |
Upgrade Receivables Trust, | |
4.09%, 3/15/25 (a) | | | 218 | | | | 218 | | |
4.53%, 11/15/24 (a) | | | 131 | | | | 131 | | |
Upstart Securitization Trust | |
3.73%, 9/20/29 (a) | | | 850 | | | | 848 | | |
VCAT LLC | |
3.67%, 8/25/50 (a) | | | 981 | | | | 983 | | |
Vericrest Opportunity Loan Trust, | |
2.98%, 2/25/50 (a) | | | 776 | | | | 777 | | |
3.18%, 10/25/49 (a) | | | 392 | | | | 393 | | |
3.35%, 9/25/49 (a) | | | 601 | | | | 603 | | |
Verizon Owner Trust, | |
1 Month USD LIBOR + 0.27%,
0.43%, 4/20/22 (a)(b) | | | 19 | | | | 19 | | |
0.47%, 2/20/25 | | | 950 | | | | 952 | | |
2.93%, 9/20/23 | | | 600 | | | | 615 | | |
Volkswagen Auto Lease Trust | |
1.99%, 11/21/22 | | | 1,280 | | | | 1,305 | | |
VOLT LXXX LLC | |
3.23%, 10/25/49 (a) | | | 412 | | | | 413 | | |
VOLT LXXXIII LLC | |
3.33%, 11/26/49 (a) | | | 625 | | | | 628 | | |
VOLT LXXXV LLC | |
3.23%, 1/25/50 (a) | | | 440 | | | | 442 | | |
VOLT LXXXVIII LLC | |
2.98%, 3/25/50 (a) | | | 642 | | | | 642 | | |
| | | | 50,416 | | |
The accompanying notes are an integral part of the financial statements.
8
Morgan Stanley Institutional Fund Trust
Annual Report — September 30, 2020
Portfolio of Investments (cont'd)
Short Duration Income Portfolio
| | | Face
Amount
(000) | | Value
(000) | |
Collateralized Mortgage Obligations — Agency
Collateral Series (0.3%) | |
Federal Home Loan Mortgage Corporation,
REMIC
7.50%, 9/15/29 | | $ | 319 | | | $ | 375 | | |
Government National Mortgage Association,
REMIC | |
1 Month USD LIBOR + 0.50%, 0.65%, 3/20/61 (b) | | | 118 | | | | 118 | | |
1 Month USD LIBOR + 0.56%, 0.71%, 9/20/62 (b) | | | 528 | | | | 530 | | |
| | | | 1,023 | | |
Commercial Mortgage-Backed Securities (1.2%) | |
CSMC Trust | |
3.53%, 8/15/37 (a) | | | 575 | | | | 597 | | |
CSWF 2018-TOP | |
1 Month USD LIBOR + 1.45%,
1.60%, 8/15/35 (a)(b) | | | 640 | | | | 612 | | |
Federal Home Loan Mortgage Corporation | |
3.03%, 10/25/20 (b) | | | 1 | | | | 1 | | |
HPLY Trust | |
1 Month USD LIBOR + 2.35%,
2.50%, 11/15/36 (a)(b)
cBBerg.mtg_reset_slope: 1.00 | | | 410 | | | | 379 | | |
Hudsons Bay Simon JV Trust | |
1 Month USD LIBOR + 1.83%,
1.99%, 8/5/34 (a)(b) | | | 185 | | | | 171 | | |
JP Morgan Chase Commercial
Mortgage Securities Corp. | |
4.13%, 7/5/31 (a) | | | 1,100 | | | | 1,173 | | |
Natixis Commercial Mortgage Securities Trust | |
1 Month USD LIBOR + 2.20%,
2.35%, 7/15/36 (a)(b) | | | 850 | | | | 819 | | |
VMC Finance 2019-FL3 LLC | |
1 Month USD LIBOR + 2.05%,
2.20%, 9/15/36 (a)(b) | | | 733 | | | | 709 | | |
| | | | 4,461 | | |
Corporate Bonds (70.0%) | |
Energy (0.1%) | |
Midwest Connector Capital Co. LLC | |
3.63%, 4/1/22 (a) | | | 475 | | | | 478 | | |
Finance (31.7%) | |
ABN Amro Bank N.V. | |
3.40%, 8/27/21 (a) | | | 650 | | | | 668 | | |
AerCap Ireland Capital DAC/AerCap
Global Aviation Trust | |
3.30%, 1/23/23 | | | 1,260 | | | | 1,265 | | |
Air Lease Corp. | |
2.63%, 7/1/22 | | | 1,440 | | | | 1,460 | | |
American Express Co., | |
3.00%, 2/22/21 | | | 700 | | | | 706 | | |
3.38%, 5/17/21 | | | 1,050 | | | | 1,067 | | |
3.70%, 11/5/21 | | | 665 | | | | 687 | | |
American International Group, Inc. | |
4.88%, 6/1/22 | | | 2,200 | | | | 2,359 | | |
American Tower Corp. | |
2.40%, 3/15/25 | | | 600 | | | | 635 | | |
| | | Face
Amount
(000) | | Value
(000) | |
Anthem, Inc.
3.50%, 8/15/24 | | $ | 1,200 | | | $ | 1,317 | | |
ANZ New Zealand International Ltd. | |
1.90%, 2/13/23 (a) | | | 1,510 | | | | 1,556 | | |
Aon Corp. | |
2.20%, 11/15/22 | | | 575 | | | | 595 | | |
Avolon Holdings Funding Ltd. | |
2.88%, 2/15/25 (a) | | | 625 | | | | 574 | | |
Banco Bilbao Vizcaya Argentaria SA | |
0.88%, 9/18/23 | | | 1,600 | | | | 1,600 | | |
Banco Santander Chile | |
2.70%, 1/10/25 (a) | | | 800 | | | | 845 | | |
Bank of America Corp., | |
3.88%, 8/1/25 | | | 1,700 | | | | 1,935 | | |
4.13%, 1/22/24 | | | 2,000 | | | | 2,217 | | |
MTN | | | | | | | | | |
3.30%, 1/11/23 | | | 1,220 | | | | 1,296 | | |
Bank of Montreal | |
2.90%, 3/26/22 | | | 1,030 | | | | 1,069 | | |
Bank of New York Mellon Corp. (The) | |
2.20%, 8/16/23 | | | 1,400 | | | | 1,469 | | |
Bank of Nova Scotia (The), | |
1.63%, 5/1/23 | | | 1,600 | | | | 1,643 | | |
2.00%, 11/15/22 | | | 1,175 | | | | 1,214 | | |
Banque Federative du Credit Mutuel SA | |
2.38%, 11/21/24 (a) | | | 1,350 | | | | 1,429 | | |
Barclays PLC | |
4.61%, 2/15/23 | | | 1,200 | | | | 1,256 | | |
BBVA USA | |
3.50%, 6/11/21 | | | 925 | | | | 942 | | |
BNP Paribas SA | |
3.50%, 3/1/23 (a) | | | 1,250 | | | | 1,326 | | |
| BPCE SA, | |
2.38%, 1/14/25 (a) | | | 625 | | | | 650 | | |
4.00%, 9/12/23 (a) | | | 1,200 | | | | 1,305 | | |
Canadian Imperial Bank of Commerce | |
2.25%, 1/28/25 | | | 1,130 | | | | 1,194 | | |
Capital One Financial Corp. | |
3.20%, 1/30/23 | | | 2,500 | | | | 2,641 | | |
Cigna Corp. | |
3.75%, 7/15/23 | | | 1,213 | | | | 1,316 | | |
Citigroup, Inc., | |
3.30%, 4/27/25 | | | 2,000 | | | | 2,200 | | |
3.35%, 4/24/25 | | | 1,540 | | | | 1,668 | | |
3.88%, 10/25/23 | | | 2,400 | | | | 2,632 | | |
Citizens Bank NA | |
3.25%, 2/14/22 | | | 575 | | | | 596 | | |
Cooperatieve Rabobank UA | |
3.95%, 11/9/22 | | | 1,340 | | | | 1,425 | | |
Credit Suisse AG, | |
1.00%, 5/5/23 | | | 2,360 | | | | 2,386 | | |
3.00%, 10/29/21 | | | 1,140 | | | | 1,172 | | |
The accompanying notes are an integral part of the financial statements.
9
Morgan Stanley Institutional Fund Trust
Annual Report — September 30, 2020
Portfolio of Investments (cont'd)
Short Duration Income Portfolio
| | | Face
Amount
(000) | | Value
(000) | |
Finance (cont'd) | |
DBS Group Holdings Ltd.
2.85%, 4/16/22 (a) | | $ | 360 | | | $ | 372 | | |
Deutsche Bank AG | |
4.25%, 2/4/21 | | | 650 | | | | 657 | | |
Equitable Financial Life Global Funding | |
1.40%, 7/7/25 (a) | | | 1,000 | | | | 1,022 | | |
Goldman Sachs Group, Inc. (The), | |
3.50%, 1/23/25 — 4/1/25 | | | 2,950 | | | | 3,249 | | |
3.63%, 1/22/23 | | | 1,275 | | | | 1,364 | | |
Guardian Life Global Funding | |
2.90%, 5/6/24 (a) | | | 1,200 | | | | 1,294 | | |
HSBC Holdings PLC | |
3.95%, 5/18/24 | | | 2,240 | | | | 2,397 | | |
Intercontinental Exchange, Inc. | |
0.70%, 6/15/23 | | | 1,420 | | | | 1,425 | | |
JPMorgan Chase & Co., | |
3.13%, 1/23/25 | | | 1,550 | | | | 1,692 | | |
3.63%, 5/13/24 | | | 1,170 | | | | 1,293 | | |
4.02%, 12/5/24 | | | 2,660 | | | | 2,921 | | |
KeyBank NA | |
2.30%, 9/14/22 | | | 475 | | | | 493 | | |
LeasePlan Corp. | |
2.88%, 10/24/24 (a) | | | 1,275 | | | | 1,317 | | |
Lloyds Banking Group PLC | |
1.33%, 6/15/23 | | | 2,575 | | | | 2,591 | | |
Macquarie Bank Ltd., | |
2.10%, 10/17/22 (a) | | | 1,500 | | | | 1,549 | | |
2.30%, 1/22/25 (a) | | | 1,075 | | | | 1,140 | | |
Metropolitan Life Global Funding I, | |
0.90%, 6/8/23 (a) | | | 1,140 | | | | 1,153 | | |
0.95%, 7/2/25 (a) | | | 1,275 | | | | 1,287 | | |
1.95%, 9/15/21 — 1/13/23 (a) | | | 2,210 | | | | 2,263 | | |
National Australia Bank Ltd. | |
1.88%, 12/13/22 | | | 950 | | | | 982 | | |
National Bank of Canada, | |
0.90%, 8/15/23 | | | 1,810 | | | | 1,818 | | |
2.10%, 2/1/23 | | | 1,485 | | | | 1,536 | | |
National Securities Clearing Corp. | |
1.20%, 4/23/23 (a) | | | 710 | | | | 723 | | |
Nationwide Building Society, | |
2.00%, 1/27/23 (a) | | | 2,030 | | | | 2,090 | | |
3.62%, 4/26/23 (a) | | | 1,600 | | | | 1,663 | | |
New York Life Global Funding, | |
1.10%, 5/5/23 (a) | | | 1,030 | | | | 1,048 | | |
2.25%, 7/12/22 (a) | | | 470 | | | | 486 | | |
2.95%, 1/28/21 (a) | | | 350 | | | | 353 | | |
NongHyup Bank | |
1.25%, 7/20/25 (a) | | | 690 | | | | 697 | | |
Nordea Bank Abp | |
1.00%, 6/9/23 (a) | | | 1,450 | | | | 1,471 | | |
PACCAR Financial Corp. | |
2.65%, 5/10/22 | | | 1,175 | | | | 1,218 | | |
| | | Face
Amount
(000) | | Value
(000) | |
People's United Financial, Inc.
3.65%, 12/6/22 | | $ | 1,660 | | | $ | 1,754 | | |
Protective Life Global Funding, | |
2.70%, 11/25/20 (a) | | | 525 | | | | 527 | | |
3.10%, 4/15/24 (a) | | | 1,225 | | | | 1,323 | | |
Royal Bank of Canada | |
2.55%, 7/16/24 | | | 1,275 | | | | 1,365 | | |
Santander UK Group Holdings PLC | |
4.80%, 11/15/24 | | | 1,200 | | | | 1,323 | | |
Santander UK PLC | |
2.10%, 1/13/23 | | | 1,100 | | | | 1,136 | | |
Skandinaviska Enskilda Banken AB, | |
2.20%, 12/12/22 (a) | | | 700 | | | | 725 | | |
3.05%, 3/25/22 (a) | | | 1,230 | | | | 1,277 | | |
Societe Generale SA | |
2.63%, 1/22/25 (a) | | | 1,175 | | | | 1,213 | | |
Standard Chartered PLC | |
2.74%, 9/10/22 (a) | | | 1,775 | | | | 1,804 | | |
Sumitomo Mitsui Financial Group, Inc. | |
2.35%, 1/15/25 | | | 3,360 | | | | 3,543 | | |
Sumitomo Mitsui Trust Bank Ltd. | |
0.80%, 9/12/23 (a) | | | 2,350 | | | | 2,355 | | |
Suncorp-Metway Ltd. | |
2.38%, 11/9/20 (a) | | | 670 | | | | 671 | | |
Synchrony Financial | |
4.25%, 8/15/24 | | | 625 | | | | 679 | | |
TD Ameritrade Holding Corp. | |
3.75%, 4/1/24 | | | 1,225 | | | | 1,352 | | |
Truist Bank, | |
2.15%, 12/6/24 | | | 1,525 | | | | 1,617 | | |
2.80%, 5/17/22 | | | 550 | | | | 572 | | |
UBS AG | |
2.45%, 12/1/20 (a) | | | 600 | | | | 601 | | |
United Overseas Bank Ltd. | |
3.20%, 4/23/21 (a) | | | 340 | | | | 345 | | |
Wells Fargo & Co., | |
1.65%, 6/2/24 | | | 650 | | | | 663 | | |
3.07%, 1/24/23 | | | 1,900 | | | | 1,960 | | |
Westpac Banking Corp. | |
2.00%, 1/13/23 | | | 680 | | | | 705 | | |
| | | | 121,389 | | |
Industrials (33.7%) | |
AbbVie, Inc. | |
2.60%, 11/21/24 (a) | | | 3,660 | | | | 3,881 | | |
Alibaba Group Holding Ltd. | |
2.80%, 6/6/23 | | | 1,275 | | | | 1,345 | | |
Alimentation Couche-Tard, Inc. | |
2.70%, 7/26/22 (a) | | | 800 | | | | 826 | | |
Altria Group, Inc., | |
2.35%, 5/6/25 | | | 1,500 | | | | 1,587 | | |
3.49%, 2/14/22 | | | 375 | | | | 390 | | |
American Honda Finance Corp. | |
1.00%, 9/10/25 | | | 1,200 | | | | 1,201 | | |
The accompanying notes are an integral part of the financial statements.
10
Morgan Stanley Institutional Fund Trust
Annual Report — September 30, 2020
Portfolio of Investments (cont'd)
Short Duration Income Portfolio
| | | Face
Amount
(000) | | Value
(000) | |
Industrials (cont'd) | |
Amgen, Inc.
1.90%, 2/21/25 | | $ | 1,350 | | | $ | 1,417 | | |
Amphenol Corp. | |
2.05%, 3/1/25 | | | 1,250 | | | | 1,314 | | |
Anheuser-Busch InBev Worldwide, Inc. | |
4.15%, 1/23/25 | | | 2,340 | | | | 2,650 | | |
Apple, Inc. | |
0.75%, 5/11/23 | | | 990 | | | | 1,001 | | |
AT&T, Inc. | |
3.80%, 3/1/24 | | | 2,450 | | | | 2,692 | | |
BAT International Finance PLC | |
3.25%, 6/7/22 (a) | | | 2,000 | | | | 2,085 | | |
Bayer US Finance II LLC | |
3.50%, 6/25/21 (a) | | | 330 | | | | 337 | | |
Bayer US Finance LLC | |
3.38%, 10/8/24 (a) | | | 1,000 | | | | 1,089 | | |
BMW US Capital LLC, | |
2.95%, 4/14/22 (a) | | | 770 | | | | 798 | | |
3.45%, 4/12/23 (a) | | | 1,471 | | | | 1,571 | | |
Boeing Co. (The) | |
4.51%, 5/1/23 | | | 1,660 | | | | 1,752 | | |
BP Capital Markets America, Inc. | |
3.19%, 4/6/25 | | | 2,565 | | | | 2,824 | | |
Bristol-Myers Squibb Co. | |
3.25%, 2/20/23 | | | 275 | | | | 293 | | |
Canadian Natural Resources Ltd. | |
2.95%, 1/15/23 | | | 1,250 | | | | 1,301 | | |
Caterpillar Financial Services Corp. | |
3.30%, 6/9/24 | | | 2,430 | | | | 2,658 | | |
CC Holdings GS V LLC/Crown Castle GS III Corp. | |
3.85%, 4/15/23 | | | 1,225 | | | | 1,320 | | |
Charter Communications Operating LLC/Charter
Communications Operating Capital | |
4.91%, 7/23/25 | | | 850 | | | | 984 | | |
Chevron Corp. | |
1.55%, 5/11/25 | | | 1,900 | | | | 1,971 | | |
Crown Castle International Corp. | |
5.25%, 1/15/23 | | | 1,175 | | | | 1,294 | | |
Cummins, Inc. | |
0.75%, 9/1/25 | | | 1,500 | | | | 1,506 | | |
Daimler Finance North America LLC, | |
2.55%, 8/15/22 (a) | | | 1,210 | | | | 1,248 | | |
2.85%, 1/6/22 (a) | | | 1,110 | | | | 1,140 | | |
3.35%, 2/22/23 (a) | | | 520 | | | | 551 | | |
3.75%, 11/5/21 (a) | | | 295 | | | | 305 | | |
Dell International LLC/EMC Corp. | |
4.42%, 6/15/21 (a) | | | 158 | | | | 162 | | |
Deutsche Telekom International Finance BV | |
1.95%, 9/19/21 (a) | | | 1,260 | | | | 1,274 | | |
Diageo Capital PLC | |
2.13%, 10/24/24 | | | 1,350 | | | | 1,433 | | |
| | | Face
Amount
(000) | | Value
(000) | |
DR Horton, Inc.
2.55%, 12/1/20 | | $ | 480 | | | $ | 482 | | |
DuPont de Nemours, Inc. | |
2.17%, 5/1/23 | | | 1,670 | | | | 1,688 | | |
Eaton Corp. | |
2.75%, 11/2/22 | | | 2,235 | | | | 2,344 | | |
Enbridge, Inc. | |
2.50%, 1/15/25 | | | 750 | | | | 790 | | |
Enterprise Products Operating LLC, | |
2.80%, 2/15/21 | | | 780 | | | | 787 | | |
3.90%, 2/15/24 | | | 1,200 | | | | 1,310 | | |
Fortune Brands Home & Security, Inc. | |
4.00%, 9/21/23 | | | 1,150 | | | | 1,258 | | |
Fox Corp. | |
4.03%, 1/25/24 | | | 1,200 | | | | 1,322 | | |
General Motors Financial Co., Inc. | |
3.95%, 4/13/24 | | | 1,250 | | | | 1,324 | | |
Georgia-Pacific LLC | |
1.75%, 9/30/25 (a) | | | 1,410 | | | | 1,471 | | |
Gilead Sciences, Inc. | |
0.75%, 9/29/23 | | | 2,210 | | | | 2,215 | | |
Glencore Funding LLC, | |
3.00%, 10/27/22 (a) | | | 1,275 | | | | 1,321 | | |
4.13%, 3/12/24 (a) | | | 1,225 | | | | 1,329 | | |
HCA, Inc. | |
5.00%, 3/15/24 | | | 1,600 | | | | 1,794 | | |
Hyundai Capital America, | |
1.25%, 9/18/23 (a) | | | 1,380 | | | | 1,378 | | |
2.38%, 2/10/23 (a) | | | 590 | | | | 606 | | |
2.85%, 11/1/22 (a) | | | 800 | | | | 828 | | |
3.95%, 2/1/22 (a) | | | 1,270 | | | | 1,318 | | |
Imperial Brands Finance PLC | |
3.13%, 7/26/24 (a) | | | 2,015 | | | | 2,133 | | |
International Business Machines Corp., | |
2.85%, 5/13/22 | | | 1,800 | | | | 1,875 | | |
3.00%, 5/15/24 | | | 1,175 | | | | 1,274 | | |
John Deere Capital Corp., | |
0.70%, 7/5/23 | | | 710 | | | | 719 | | |
3.45%, 1/10/24 | | | 1,225 | | | | 1,341 | | |
Keurig Dr Pepper, Inc. | |
3.55%, 5/25/21 | | | 930 | | | | 949 | | |
Kinder Morgan, Inc. | |
5.00%, 2/15/21 (a) | | | 1,170 | | | | 1,185 | | |
Las Vegas Sands Corp. | |
3.20%, 8/8/24 | | | 1,250 | | | | 1,265 | | |
Lockheed Martin Corp. | |
2.50%, 11/23/20 | | | 90 | | | | 90 | | |
Lowe's Cos., Inc. | |
3.13%, 9/15/24 | | | 1,230 | | | | 1,339 | | |
Mondelez International Holdings Netherlands BV, | |
2.13%, 9/19/22 (a) | | | 1,160 | | | | 1,198 | | |
2.25%, 9/19/24 (a) | | | 950 | | | | 1,000 | | |
The accompanying notes are an integral part of the financial statements.
11
Morgan Stanley Institutional Fund Trust
Annual Report — September 30, 2020
Portfolio of Investments (cont'd)
Short Duration Income Portfolio
| | | Face
Amount
(000) | | Value
(000) | |
Industrials (cont'd) | |
Mondelez International, Inc.
0.63%, 7/1/22 | | $ | 1,270 | | | $ | 1,275 | | |
NetApp, Inc. | |
1.88%, 6/22/25 | | | 1,000 | | | | 1,037 | | |
Nissan Motor Co. Ltd. | |
3.04%, 9/15/23 (a) | | | 1,750 | | | | 1,775 | | |
Northrop Grumman Corp., | |
2.08%, 10/15/20 | | | 580 | | | | 580 | | |
3.50%, 3/15/21 | | | 1,220 | | | | 1,238 | | |
Nucor Corp. | |
2.00%, 6/1/25 | | | 975 | | | | 1,019 | | |
NXP BV/NXP Funding LLC/NXP USA, Inc. | |
2.70%, 5/1/25 (a) | | | 1,540 | | | | 1,633 | | |
PACCAR Financial Corp. | |
0.80%, 6/8/23 | | | 380 | | | | 383 | | |
PayPal Holdings, Inc. | |
2.40%, 10/1/24 | | | 1,300 | | | | 1,379 | | |
PepsiCo,Inc. | |
0.75%, 5/1/23 | | | 630 | | | | 637 | | |
Philip Morris International, Inc., | |
1.13%, 5/1/23 | | | 550 | | | | 559 | | |
2.63%, 3/6/23 | | | 1,700 | | | | 1,786 | | |
Raytheon Technologies Corp. | |
2.80%, 3/15/22 (a) | | | 1,275 | | | | 1,315 | | |
Reckitt Benckiser Treasury Services PLC | |
2.38%, 6/24/22 (a) | | | 1,620 | | | | 1,669 | | |
Reynolds American, Inc. | |
4.00%, 6/12/22 | | | 1,625 | | | | 1,713 | | |
Roper Technologies, Inc. | |
1.00%, 9/15/25 | | | 950 | | | | 953 | | |
Royalty Pharma PLC | |
1.20%, 9/2/25 (a) | | | 1,475 | | | | 1,472 | | |
Sabine Pass Liquefaction LLC | |
5.63%, 4/15/23 | | | 1,320 | | | | 1,447 | | |
Schlumberger Finance Canada Ltd. | |
2.20%, 11/20/20 (a) | | | 410 | | | | 411 | | |
Seven & i Holdings Co., Ltd. | |
3.35%, 9/17/21 (a) | | | 1,750 | | | | 1,794 | | |
Siemens Financieringsmaatschappij N.V. | |
3.25%, 5/27/25 (a) | | | 1,500 | | | | 1,668 | | |
Sky Ltd. | |
3.75%, 9/16/24 (a) | | | 2,330 | | | | 2,602 | | |
Starbucks Corp. | |
2.10%, 2/4/21 | | | 2,080 | | | | 2,090 | | |
Takeda Pharmaceutical Co. Ltd. | |
4.00%, 11/26/21 | | | 725 | | | | 753 | | |
Takeda Pharmaceutical Co., Ltd. | |
4.40%, 11/26/23 | | | 1,775 | | | | 1,973 | | |
Toyota Motor Credit Corp., | |
0.50%, 8/14/23 | | | 1,490 | | | | 1,494 | | |
1.15%, 5/26/22 | | | 1,260 | | | | 1,276 | | |
2.90%, 3/30/23 | | | 1,300 | | | | 1,379 | | |
| | | Face
Amount
(000) | | Value
(000) | |
TSMC Global Ltd.
0.75%, 9/28/25 (a) | | $ | 1,575 | | | $ | 1,562 | | |
Union Pacific Corp. | |
3.50%, 6/8/23 | | | 1,225 | | | | 1,321 | | |
Volkswagen Group of America Finance LLC, | |
2.70%, 9/26/22 (a) | | | 1,420 | | | | 1,473 | | |
3.88%, 11/13/20 (a) | | | 755 | | | | 758 | | |
Walt Disney Co. (The) | |
1.75%, 8/30/24 | | | 1,225 | | | | 1,276 | | |
Williams Cos., Inc. (The) | |
4.30%, 3/4/24 | | | 1,330 | | | | 1,456 | | |
| | | | 129,289 | | |
Utilities (4.5%) | |
Ameren Corp. | |
2.50%, 9/15/24 | | | 2,510 | | | | 2,662 | | |
CenterPoint Energy, Inc. | |
2.50%, 9/1/24 | | | 1,500 | | | | 1,597 | | |
DTE Energy Co. | |
0.55%, 11/1/22 | | | 1,710 | | | | 1,710 | | |
DTE Energy Co. | |
2.25%, 11/1/22 | | | 1,800 | | | | 1,862 | | |
Enel Finance International N.V. | |
4.63%, 9/14/25 (a) | | | 1,380 | | | | 1,596 | | |
FirstEnergy Corp. | |
2.05%, 3/1/25 | | | 625 | | | | 636 | | |
NextEra Energy Capital Holdings, Inc. | |
2.40%, 9/1/21 | | | 1,550 | | | | 1,580 | | |
NiSource, Inc. | |
0.95%, 8/15/25 | | | 1,550 | | | | 1,551 | | |
Southern Co. (The) | |
2.95%, 7/1/23 | | | 1,260 | | | | 1,341 | | |
WEC Energy Group, Inc. | |
0.55%, 9/15/23 | | | 2,840 | | | | 2,847 | | |
| | | | 17,382 | | |
| | | | 268,538 | | |
Mortgages — Other (6.0%) | |
Bunker Hill Loan Depositary Trust | |
1.72%, 2/25/55 (a)(b) | | | 869 | | | | 880 | | |
Cascade Funding Mortgage Trust, | |
2.80%, 6/25/69 (a)(b) | | | 650 | | | | 652 | | |
4.00%, 10/25/68 (a)(b) | | | 545 | | | | 568 | | |
| CFMT 2020-ABC1 LLC | |
1.94%, 9/25/50 (a)(b) | | | 1,725 | | | | 1,725 | | |
CHL Mortgage Pass-Through Trust | |
5.50%, 5/25/34 | | | 94 | | | | 95 | | |
CIM Trust | |
3.00%, 4/25/57 (a)(b) | | | 356 | | | | 365 | | |
Federal Home Loan Mortgage Corporation | |
1 Month USD LIBOR + 1.20%,
1.35%, 10/25/29 (b) | | | 51 | | | | 51 | | |
FMC GMSR Issuer Trust | |
4.23%, 9/25/24 (a)(b) | | | 900 | | | | 883 | | |
The accompanying notes are an integral part of the financial statements.
12
Morgan Stanley Institutional Fund Trust
Annual Report — September 30, 2020
Portfolio of Investments (cont'd)
Short Duration Income Portfolio
| | | Face
Amount
(000) | | Value
(000) | |
Mortgages — Other (cont'd) | |
Galton Funding Mortgage Trust,
3.50%, 11/25/57 (a)(b) | | $ | 177 | | | $ | 179 | | |
4.00%, 2/25/59 (a)(b) | | | 135 | | | | 137 | | |
GCAT Trust | |
2.65%, 10/25/68 (a)(b) | | | 471 | | | | 491 | | |
Gosforth Funding PLC | |
3 Month USD LIBOR + 0.45%,
0.70%, 8/25/60 (a)(b) | | | 178 | | | | 178 | | |
Government National Mortgage Association, | |
1 Month USD LIBOR + 0.28%,
0.43%, 5/20/63 (b) | | | 15 | | | | 15 | | |
1 Month USD LIBOR + 0.45%,
0.60%, 5/20/62 (b) | | | 2 | | | | 2 | | |
1 Month USD LIBOR + 0.60%,
0.75%, 1/20/64 (b) | | | 171 | | | | 171 | | |
Headlands Residential LLC | |
3.97%, 6/25/24 (a) | | | 200 | | | | 202 | | |
Homeward Opportunities Fund Trust | |
3.23%, 8/25/25 (a) | | | 1,200 | | | | 1,203 | | |
Lanark Master Issuer PLC, | |
3 Month USD LIBOR + 0.42%,
0.68%, 12/22/69 (b) | | | 450 | | | | 450 | | |
3 Month USD LIBOR + 0.77%,
1.03%, 12/22/69 (a)(b) | | | 358 | | | | 359 | | |
2.28%, 12/22/69 (a)(b) | | | 360 | | | | 367 | | |
LHOME Mortgage Trust | |
3.23%, 10/25/24 (a) | | | 235 | | | | 236 | | |
New Residential Mortgage Loan Trust | |
3.23%, 8/25/60 (a) | | | 205 | | | | 206 | | |
New Residential Mortgage Loan Trust, | |
3.75%, 5/28/52 — 8/25/55 (a)(b) | | | 235 | | | | 255 | | |
4.00%, 9/25/57 (a)(b) | | | 451 | | | | 498 | | |
NRPL Trust | |
4.25%, 7/25/67 (a) | | | 554 | | | | 572 | | |
OBX Trust | |
4.00%, 7/25/58 (a)(b) | | | 278 | | | | 283 | | |
Oceanview Mortgage Loan Trust | |
1.73%, 5/28/50 (a) | | | 900 | | | | 902 | | |
Pepper Residential Securities Trust, | |
1 Month USD LIBOR + 0.88%,
1.03%, 1/16/60 (a)(b) | | | 240 | | | | 239 | | |
1 Month USD LIBOR + 0.93%,
1.08%, 3/12/61 (a)(b) | | | 595 | | | | 593 | | |
1 Month USD LIBOR + 0.95%,
1.10%, 8/18/60 (a)(b) | | | 306 | | | | 305 | | |
1 Month USD LIBOR + 1.00%,
1.16%, 6/20/60 (a)(b) | | | 327 | | | | 326 | | |
Preston Ridge Partners LLC | |
1.00%, 9/25/25 | | | 1,200 | | | | 1,200 | | |
PRPM LLC, | |
3.50%, 10/25/24 (a)(b) | | | 693 | | | | 695 | | |
4.50%, 1/25/24 (a) | | | 498 | | | | 502 | | |
| | | Face
Amount
(000) | | Value
(000) | |
Resimac,
Series 19-2A
1 Month USD LIBOR + 0.95%,
1.11%, 2/10/51 (a)(b) | | $ | 539 | | | $ | 538 | | |
RESIMAC Bastille Trust, | |
1 Month USD LIBOR + 0.85%,
1.00%, 12/5/59 (a)(b) | | | 199 | | | | 198 | | |
1 Month USD LIBOR + 0.93%,
1.08%, 9/5/57 (a)(b) | | | 382 | | | | 382 | | |
RMF Buyout Issuance Trust, | |
1.71%, 6/25/30 (a)(b) | | | 632 | | | | 634 | | |
2.16%, 2/25/30 (a)(b) | | | 1,724 | | | | 1,728 | | |
Seasoned Credit Risk Transfer Trust | |
3.00%, 2/25/59 | | | 814 | | | | 869 | | |
Sequoia Mortgage Trust | |
1 Month USD LIBOR + 0.62%,
0.78%, 8/20/34 (b) | | | 168 | | | | 163 | | |
Silver Hill Trust | |
3.10%, 11/25/49 (a)(b) | | | 1,146 | | | | 1,169 | | |
TVC Mortgage Trust | |
3.47%, 9/25/24 (a) | | | 300 | | | | 306 | | |
Vista Point Securitization Trust | |
1.76%, 3/25/65 (a)(b) | | | 1,154 | | | | 1,163 | | |
| | | | 22,935 | | |
Sovereign (1.3%) | |
Corp. Andina de Fomento, | |
1.63%, 9/23/25 | | | 1,750 | | | | 1,756 | | |
2.38%, 5/12/23 | | | 1,170 | | | | 1,215 | | |
Korea Development Bank (The) | |
3.00%, 3/19/22 | | | 410 | | | | 424 | | |
Korea National Oil Corp. | |
0.88%, 10/5/25 (a)(c) | | | 1,680 | | | | 1,674 | | |
| | | | 5,069 | | |
Total Fixed Income Securities (Cost $350,070) | | | 354,918 | | |
| | | Shares | | | |
Investment Company (3.0%) | |
iShares Short-Term Corporate Bond ETF
(Cost $11,547) | | | 210,000 | | | | 11,531 | | |
Short-Term Investments (5.0%) | |
Investment Company (2.4%) | |
Morgan Stanley Institutional Liquidity
Funds — Government Portfolio —
Institutional Class (See Note G)
(Cost $9,160)9,159,604 | | | 9,160 | | |
| | | Face
Amount
(000) | | | |
U.S. Treasury Securities (2.3%) | |
U.S. Treasury Bill
0.16%, 1/28/21 (d) | | $ | 1,350 | | | | 1,350 | | |
U.S. Treasury Notes | |
0.13%, 7/31/22 | | | 7,500 | | | | 7,500 | | |
Total U.S. Treasury Securities (Cost $8,846) | | | 8,850 | | |
The accompanying notes are an integral part of the financial statements.
13
Morgan Stanley Institutional Fund Trust
Annual Report — September 30, 2020
Portfolio of Investments (cont'd)
Short Duration Income Portfolio
| | | Face
Amount
(000) | | Value
(000) | |
Corporate Bond (0.3%) | |
Industrial (0.3%) | |
Marathon Petroleum Corp.
3.40%, 12/15/20 (Cost $1,278) | | $ | 1,275 | | | $ | 1,279 | | |
Total Short-Term Investments (Cost $19,284) | | | 19,289 | | |
Total Investments (100.6%) (Cost $380,901) (e)(f) | | | 385,738 | | |
Liabilities in Excess of Other Assets (–0.6%) | | | (2,271 | ) | |
Net Assets (100.0%) | | $ | 383,467 | | |
(a) 144A security — Certain conditions for public sale may exist. Unless otherwise noted, these securities are deemed to be liquid.
(b) Floating or variable rate securities: The rates disclosed are as of September 30, 2020. For securities based on a published reference rate and spread, the reference rate and spread are indicated in the description in the Portfolio of Investments. Certain variable rate securities may not be based on a published reference rate and spread but are determined by the issuer or agent and are based on current market conditions. These securities do not indicate a reference rate and spread in their description in the Portfolio of Investments.
(c) When-issued security.
(d) Rate shown is the yield to maturity at September 30, 2020.
(e) Securities are available for collateral in connection with purchase of when-issued security and futures contracts.
(f) At September 30, 2020, the aggregate cost for federal income tax purposes is approximately $380,798,000. The aggregate gross unrealized appreciation is approximately $5,800,000 and the aggregate gross unrealized depreciation is approximately $967,000, resulting in net unrealized appreciation of approximately $4,833,000.
@ Face Amount/Value is less than $500.
CMT Constant Maturity Treasury Note Rate.
ETF Exchange Traded Fund.
LIBOR London Interbank Offered Rate.
MTN Medium Term Note.
REMIC Real Estate Mortgage Investment Conduit.
USD United States Dollar.
Futures Contracts:
The Fund had the following futures contracts open at September 30, 2020:
| | | Number
of
Contracts | | Expiration
Date | | Notional
Amount
(000) | | Value
(000) | | Unrealized
Appreciation
(Depreciation)
(000) | |
Long: | |
U.S. Treasury 2 yr. Note (United States) | | | 505 | | | Dec-20 | | $ | 101,000 | | | $ | 111,585 | | | $ | 50 | | |
Short: | |
U.S. Treasury 5 yr. Note (United States) | | | 724 | | | Dec-20 | | | (72,400 | ) | | | (91,246 | ) | | | (153 | ) | |
| | | | | | | | | | | $ | (103 | ) | |
Portfolio Composition
Classification | | Percentage of
Total Investments | |
Industrials | | | 33.5 | % | |
Finance | | | 31.5 | | |
Asset-Backed Securities | | | 13.1 | | |
Other* | | | 11.0 | | |
Mortgages — Other | | | 5.9 | | |
Short-Term Investments | | | 5.0 | | |
Total Investments | | | 100.0 | %** | |
* Industries and/or investment types representing less than 5% of total investments.
** Does not include open long/short futures contracts with a value of approximately $202,831,000 and net unrealized depreciation of approximately $103,000.
The accompanying notes are an integral part of the financial statements.
14
Morgan Stanley Institutional Fund Trust
Annual Report — September 30, 2020
Short Duration Income Portfolio
Statement of Assets and Liabilities | | September 30, 2020
(000) | |
Assets: | |
Investments in Securities of Unaffiliated Issuers, at Value (Cost $371,741) | | $ | 376,578 | | |
Investment in Security of Affiliated Issuer, at Value (Cost $9,160) | | | 9,160 | | |
Total Investments in Securities, at Value (Cost $380,901) | | | 385,738 | | |
Receivable for Investments Sold | | | 2,659 | | |
Receivable for Fund Shares Sold | | | 2,192 | | |
Interest and Paydown Receivable | | | 1,850 | | |
Receivable for Variation Margin on Futures Contracts | | | 61 | | |
Due from Adviser | | | 45 | | |
Receivable from Affiliate | | | — | @ | |
Other Assets | | | 77 | | |
Total Assets | | | 392,622 | | |
Liabilities: | |
Payable for Investments Purchased | | | 8,659 | | |
Payable for Fund Shares Redeemed | | | 247 | | |
Payable for Professional Fees | | | 72 | | |
Payable for Trustees' Fees and Expenses | | | 41 | | |
Payable for Sub Transfer Agency Fees — Class I | | | 25 | | |
Payable for Sub Transfer Agency Fees — Class A | | | 14 | | |
Payable for Sub Transfer Agency Fees — Class L | | | — | @ | |
Payable for Sub Transfer Agency Fees — Class C | | | — | @ | |
Payable for Shareholder Services Fees — Class A | | | 27 | | |
Payable for Distribution and Shareholder Services Fees — Class L | | | — | @ | |
Payable for Distribution and Shareholder Services Fees — Class C | | | — | @ | |
Payable for Administration Fees | | | 23 | | |
Payable for Transfer Agency Fees — Class I | | | 1 | | |
Payable for Transfer Agency Fees — Class A | | | 1 | | |
Payable for Transfer Agency Fees — Class L | | | — | @ | |
Payable for Transfer Agency Fees — Class C | | | 1 | | |
Payable for Transfer Agency Fees — Class IS | | | 1 | | |
Payable for Custodian Fees | | | 4 | | |
Other Liabilities | | | 39 | | |
Total Liabilities | | | 9,155 | | |
Net Assets | | $ | 383,467 | | |
Net Assets Consist of: | |
Paid-in-Capital | | $ | 382,768 | | |
Total Distributable Earnings | | | 699 | | |
Net Assets | | $ | 383,467 | | |
The accompanying notes are an integral part of the financial statements.
15
Morgan Stanley Institutional Fund Trust
Annual Report — September 30, 2020
Short Duration Income Portfolio
Statement of Assets and Liabilities (cont'd) | | September 30, 2020
(000) | |
CLASS I: | |
Net Assets | | $ | 233,816 | | |
| Shares Outstanding (unlimited number of shares authorized, no par value) (not in 000's) | | | 28,121,786 | | |
Net Asset Value, Offering and Redemption Price Per Share | | $ | 8.31 | | |
CLASS A: | |
Net Assets | | $ | 148,771 | | |
| Shares Outstanding (unlimited number of shares authorized, no par value) (not in 000's) | | | 17,845,843 | | |
Net Asset Value, Redemption Price Per Share | | $ | 8.34 | | |
Maximum Sales Load | | | 2.00 | % | |
Maximum Sales Charge | | $ | 0.17 | | |
Maximum Offering Price Per Share | | $ | 8.51 | | |
CLASS L: | |
Net Assets | | $ | 829 | | |
| Shares Outstanding (unlimited number of shares authorized, no par value) (not in 000's) | | | 99,764 | | |
Net Asset Value, Offering and Redemption Price Per Share | | $ | 8.31 | | |
CLASS C: | |
Net Assets | | $ | 37 | | |
| Shares Outstanding (unlimited number of shares authorized, no par value) (not in 000's) | | | 4,492 | | |
Net Asset Value, Offering and Redemption Price Per Share | | $ | 8.29 | | |
CLASS IS: | |
Net Assets | | $ | 14 | | |
| Shares Outstanding (unlimited number of shares authorized, no par value) (not in 000's) | | | 1,679 | | |
Net Asset Value, Offering and Redemption Price Per Share | | $ | 8.32 | | |
@ Amount is less than $500.
The accompanying notes are an integral part of the financial statements.
16
Morgan Stanley Institutional Fund Trust
Annual Report — September 30, 2020
Short Duration Income Portfolio
Statement of Operations | | Year Ended
September 30, 2020
(000) | |
Investment Income: | |
Interest from Securities of Unaffiliated Issuers (Net of $—@ of Foreign Taxes Withheld) | | $ | 6,363 | | |
Dividends from Security of Affiliated Issuer (Note G) | | | 46 | | |
Dividends from Securities of Unaffiliated Issuers | | | 10 | | |
Total Investment Income | | | 6,419 | | |
Expenses: | |
Advisory Fees (Note B) | | | 534 | | |
Shareholder Services Fees — Class A (Note D) | | | 224 | | |
Distribution and Shareholder Services Fees — Class L (Note D) | | | 4 | | |
Distribution and Shareholder Services Fees — Class C (Note D) | | | — | @ | |
Sub Transfer Agency Fees — Class I | | | 146 | | |
Sub Transfer Agency Fees — Class A | | | 68 | | |
Sub Transfer Agency Fees — Class L | | | — | @ | |
Sub Transfer Agency Fees — Class C | | | — | @ | |
Administration Fees (Note C) | | | 214 | | |
Professional Fees | | | 174 | | |
Registration Fees | | | 103 | | |
Shareholder Reporting Fees | | | 57 | | |
Pricing Fees | | | 35 | | |
Custodian Fees (Note F) | | | 23 | | |
Transfer Agency Fees — Class I (Note E) | | | 5 | | |
Transfer Agency Fees — Class A (Note E) | | | 5 | | |
Transfer Agency Fees — Class L (Note E) | | | 2 | | |
Transfer Agency Fees — Class C (Note E) | | | 2 | | |
Transfer Agency Fees — Class IS (Note E) | | | 2 | | |
Trustees' Fees and Expenses | | | 10 | | |
Other Expenses | | | 26 | | |
Total Expenses | | | 1,634 | | |
Waiver of Advisory Fees (Note B) | | | (508 | ) | |
Reimbursement of Class Specific Expenses — Class I (Note B) | | | (62 | ) | |
Reimbursement of Class Specific Expenses — Class A (Note B) | | | (28 | ) | |
Reimbursement of Class Specific Expenses — Class L (Note B) | | | (2 | ) | |
Reimbursement of Class Specific Expenses — Class C (Note B) | | | (2 | ) | |
Reimbursement of Class Specific Expenses — Class IS (Note B) | | | (2 | ) | |
Rebate from Morgan Stanley Affiliate (Note G) | | | (16 | ) | |
Net Expenses | | | 1,014 | | |
Net Investment Income | | | 5,405 | | |
Realized Loss: | |
Investments Sold | | | (113 | ) | |
Futures Contracts | | | (1,743 | ) | |
Net Realized Loss | | | (1,856 | ) | |
Change in Unrealized Appreciation (Depreciation): | |
Investments | | | 3,173 | | |
Foreign Currency Translation | | | — | @ | |
Futures Contracts | | | 133 | | |
Net Change in Unrealized Appreciation (Depreciation) | | | 3,306 | | |
Net Realized Loss and Change in Unrealized Appreciation (Depreciation) | | | 1,450 | | |
Net Increase in Net Assets Resulting from Operations | | $ | 6,855 | | |
@ Amount is less than $500.
The accompanying notes are an integral part of the financial statements.
17
Morgan Stanley Institutional Fund Trust
Annual Report — September 30, 2020
Short Duration Income Portfolio
Statements of Changes in Net Assets | | Year Ended
September 30, 2020
(000) | | Year Ended
September 30, 2019
(000) | |
Increase (Decrease) in Net Assets: | |
Operations: | |
Net Investment Income | | $ | 5,405 | | | $ | 5,662 | | |
Net Realized Gain (Loss) | | | (1,856 | ) | | | 750 | | |
Net Change in Unrealized Appreciation (Depreciation) | | | 3,306 | | | | 2,470 | | |
Net Increase in Net Assets Resulting from Operations | | | 6,855 | | | | 8,882 | | |
Dividends and Distributions to Shareholders: | |
Class I | | | (4,012 | ) | | | (3,777 | ) | |
Class A | | | (1,778 | ) | | | (1,635 | ) | |
Class L | | | (15 | ) | | | (13 | ) | |
Class C | | | (— | @) | | | (1 | ) | |
Class IS | | | (1 | ) | | | (— | @) | |
Total Dividends and Distributions to Shareholders | | | (5,806 | ) | | | (5,426 | ) | |
Capital Share Transactions:(1) | |
Class I: | |
Subscribed | | | 159,179 | | | | 140,638 | | |
Distributions Reinvested | | | 3,802 | | | | 3,751 | | |
Redeemed | | | (104,693 | ) | | | (90,693 | ) | |
Class A: | |
Subscribed | | | 92,883 | | | | 33,774 | | |
Distributions Reinvested | | | 1,770 | | | | 1,622 | | |
Redeemed | | | (29,414 | ) | | | (21,842 | ) | |
Class L: | |
Exchanged | | | 44 | | | | 656 | | |
Distributions Reinvested | | | 15 | | | | 13 | | |
Redeemed | | | (32 | ) | | | (270 | ) | |
Class C: | |
Distributions Reinvested | | | — | @ | | | 1 | | |
Redeemed | | | — | | | | (16 | ) | |
Class IS: | |
Subscribed | | | 35 | | | | 5 | | |
Distributions Reinvested | | | 1 | | | | — | @ | |
Redeemed | | | (39 | ) | | | (— | @) | |
Net Increase in Net Assets Resulting from Capital Share Transactions | | | 123,551 | | | | 67,639 | | |
Total Increase in Net Assets | | | 124,600 | | | | 71,095 | | |
Net Assets: | |
Beginning of Period | | | 258,867 | | | | 187,772 | | |
End of Period | | $ | 383,467 | | | $ | 258,867 | | |
The accompanying notes are an integral part of the financial statements.
18
Morgan Stanley Institutional Fund Trust
Annual Report — September 30, 2020
Short Duration Income Portfolio
Statements of Changes in Net Assets (cont'd) | | Year Ended
September 30, 2020
(000) | | Year Ended
September 30, 2019
(000) | |
(1) Capital Share Transactions: | |
Class I: | |
Shares Subscribed | | | 19,301 | | | | 17,226 | | |
Shares Issued on Distributions Reinvested | | | 463 | | | | 460 | | |
Shares Redeemed | | | (12,867 | ) | | | (11,081 | ) | |
Net Increase in Class I Shares Outstanding | | | 6,897 | | | | 6,605 | | |
Class A: | |
Shares Subscribed | | | 11,183 | | | | 4,121 | | |
Shares Issued on Distributions Reinvested | | | 215 | | | | 198 | | |
Shares Redeemed | | | (3,611 | ) | | | (2,670 | ) | |
Net Increase in Class A Shares Outstanding | | | 7,787 | | | | 1,649 | | |
Class L: | |
Shares Exchanged | | | 5 | | | | 81 | | |
Shares Issued on Distributions Reinvested | | | 2 | | | | 2 | | |
Shares Redeemed | | | (4 | ) | | | (34 | ) | |
Net Increase in Class L Shares Outstanding | | | 3 | | | | 49 | | |
Class C: | |
Shares Issued on Distributions Reinvested | | | — | @@ | | | — | @@ | |
Shares Redeemed | | | — | | | | (2 | ) | |
Net Increase (Decrease) in Class C Shares Outstanding | | | — | @@ | | | (2 | ) | |
Class IS: | |
Shares Subscribed | | | 5 | | | | 1 | | |
Shares Issued on Distributions Reinvested | | | — | @@ | | | — | @@ | |
Shares Redeemed | | | (5 | ) | | | (— | @@) | |
Net Increase (Decrease) in Class IS Shares Outstanding | | | (— | @@) | | | 1 | | |
@ Amount is less than $500.
@@ Amount is less than 500 shares.
The accompanying notes are an integral part of the financial statements.
19
Morgan Stanley Institutional Fund Trust
Annual Report — September 30, 2020
Financial Highlights
Short Duration Income Portfolio
| | | Class I | |
| | | Year Ended September 30, | |
Selected Per Share Data and Ratios | | 2020 | | 2019 | | 2018 | | 2017 | | 2016(1) | |
Net Asset Value, Beginning of Period | | $ | 8.24 | | | $ | 8.13 | | | $ | 8.15 | | | $ | 8.12 | | | $ | 7.71 | | |
Income (Loss) from Investment Operations: | |
Net Investment Income(2) | | | 0.17 | | | | 0.21 | | | | 0.17 | | | | 0.16 | | | | 0.15 | | |
Net Realized and Unrealized Gain (Loss) | | | 0.09 | | | | 0.10 | | | | (0.03 | ) | | | 0.02 | | | | 0.41 | | |
Total from Investment Operations | | | 0.26 | | | | 0.31 | | | | 0.14 | | | | 0.18 | | | | 0.56 | | |
Distributions from and/or in Excess of: | |
Net Investment Income | | | (0.19 | ) | | | (0.20 | ) | | | (0.16 | ) | | | (0.15 | ) | | | (0.15 | ) | |
Net Asset Value, End of Period | | $ | 8.31 | | | $ | 8.24 | | | $ | 8.13 | | | $ | 8.15 | | | $ | 8.12 | | |
Total Return(3) | | | 3.20 | % | | | 3.93 | %(4) | | | 1.79 | %(5) | | | 2.29 | %(6) | | | 7.43 | %(7) | |
Ratios to Average Net Assets and Supplemental Data: | |
Net Assets, End of Period (Thousands) | | $ | 233,816 | | | $ | 174,909 | | | $ | 118,810 | | | $ | 103,131 | | | $ | 98,603 | | |
Ratio of Expenses Before Expense Limitation | | | 0.53 | % | | | 0.49 | % | | | 0.50 | % | | | 0.53 | % | | | 0.65 | % | |
Ratio of Expenses After Expense Limitation | | | 0.29 | %(8) | | | 0.30 | %(8) | | | 0.28 | %(8) | | | 0.30 | %(8) | | | 0.36 | %(8)(9) | |
Ratio of Net Investment Income | | | 2.12 | %(8) | | | 2.55 | %(8) | | | 2.13 | %(8) | | | 1.92 | %(8) | | | 1.97 | %(8)(9) | |
Ratio of Rebate from Morgan Stanley Affiliates | | | 0.01 | % | | | 0.00 | %(10) | | | 0.00 | %(10) | | | 0.00 | %(10) | | | 0.00 | %(10) | |
Portfolio Turnover Rate | | | 74 | % | | | 64 | % | | | 40 | % | | | 43 | % | | | 66 | % | |
(1) Reflects prior period custodian out-of-pocket expenses that were reimbursed in September 2016. The amount of the reimbursement was immaterial on a per share basis and did not impact the total return of Class I shares. The Ratio of Expenses After Expense Limitation and the Ratio of Net Investment Income would be unchanged as the reimbursement of custodian fees was offset against expense waivers/reimbursements with no impact to net expenses or net investment income.
(2) Per share amount is based on average shares outstanding.
(3) Calculated based on the net asset value as of the last business day of the period.
(4) Performance was positively impacted by approximately 0.13% due to the receipt of proceeds from the settlement of a class action suit involving the Fund's past holdings. This was a one-time settlement, and as a result, the impact on the NAV and consequently the performance will not likely be repeated in the future. Had this settlement not occurred, the total return for Class I shares would have been approximately 3.80%.
(5) Performance was positively impacted by approximately 0.25% due to the receipt of proceeds from the settlement of class action suits involving the Fund's past holdings. These were one-time settlements, and as a result, the impact on the NAV and consequently the performance will not likely be repeated in the future. Had these settlements not occurred, the total return for Class I shares would have been approximately 1.54%.
(6) Performance was positively impacted by approximately 0.51% due to the receipt of proceeds from the settlement of a class action suit involving the Fund's past holdings. This was a one-time settlement, and as a result, the impact on the NAV and consequently the performance will not likely be repeated in the future. Had this settlement not occurred, the total return for Class I shares would have been approximately 1.78%.
(7) Performance was positively impacted by approximately 5.97% due to the receipt of proceeds from the settlement of class action suits involving the Fund's past holdings. These were one-time settlements, and as a result, the impact on the NAV and consequently the performance will not likely be repeated in the future. Had these settlements not occurred, the total return for Class I shares would have been approximately 1.46%.
(8) The Ratio of Expenses After Expense Limitation and Ratio of Net Investment Income reflect the rebate of certain Fund expenses in connection with the investments in Morgan Stanley affiliates during the period. The effect of the rebate on the ratios is disclosed in the above table as "Ratio of Rebate from Morgan Stanley Affiliates."
(9) Effective January 11, 2016, the Adviser has agreed to limit the ratio of expenses to average net assets to the maximum ratio of 0.30% for Class I shares. Prior to January 11, 2016, the maximum ratio was 0.53% for Class I shares.
(10) Amount is less than 0.005%.
The accompanying notes are an integral part of the financial statements.
20
Morgan Stanley Institutional Fund Trust
Annual Report — September 30, 2020
Financial Highlights
Short Duration Income Portfolio
| | | Class A | |
| | | Year Ended September 30, | |
Selected Per Share Data and Ratios | | 2020 | | 2019 | | 2018 | | 2017 | | 2016(1) | |
Net Asset Value, Beginning of Period | | $ | 8.26 | | | $ | 8.15 | | | $ | 8.17 | | | $ | 8.13 | | | $ | 7.72 | | |
Income (Loss) from Investment Operations: | |
Net Investment Income(2) | | | 0.15 | | | | 0.19 | | | | 0.15 | | | | 0.14 | | | | 0.14 | | |
Net Realized and Unrealized Gain (Loss) | | | 0.10 | | | | 0.10 | | | | (0.03 | ) | | | 0.03 | | | | 0.40 | | |
Total from Investment Operations | | | 0.25 | | | | 0.29 | | | | 0.12 | | | | 0.17 | | | | 0.54 | | |
Distributions from and/or in Excess of: | |
Net Investment Income | | | (0.17 | ) | | | (0.18 | ) | | | (0.14 | ) | | | (0.13 | ) | | | (0.13 | ) | |
Net Asset Value, End of Period | | $ | 8.34 | | | $ | 8.26 | | | $ | 8.15 | | | $ | 8.17 | | | $ | 8.13 | | |
Total Return(3) | | | 3.06 | % | | | 3.66 | %(4) | | | 1.51 | %(5) | | | 2.15 | %(6) | | | 7.15 | %(7) | |
Ratios to Average Net Assets and Supplemental Data: | |
Net Assets, End of Period (Thousands) | | $ | 148,771 | | | $ | 83,111 | | | $ | 68,517 | | | $ | 82,157 | | | $ | 66,821 | | |
Ratio of Expenses Before Expense Limitation | | | 0.77 | % | | | 0.76 | % | | | 0.80 | % | | | 0.80 | % | | | 0.80 | % | |
Ratio of Expenses After Expense Limitation | | | 0.54 | %(8) | | | 0.55 | %(8) | | | 0.55 | %(8) | | | 0.55 | %(8) | | | 0.52 | %(8)(9) | |
Ratio of Net Investment Income | | | 1.85 | %(8) | | | 2.30 | %(8) | | | 1.85 | %(8) | | | 1.66 | %(8) | | | 1.83 | %(8)(9) | |
Ratio of Rebate from Morgan Stanley Affiliates | | | 0.01 | % | | | 0.00 | %(10) | | | 0.00 | %(10) | | | 0.00 | %(10) | | | 0.00 | %(10) | |
Portfolio Turnover Rate | | | 74 | % | | | 64 | % | | | 40 | % | | | 43 | % | | | 66 | % | |
(1) Reflects prior period custodian out-of-pocket expenses that were reimbursed in September 2016. The amount of the reimbursement was immaterial on a per share basis and did not impact the total return of Class A shares. The Ratio of Expenses After Expense Limitation and the Ratio of Net Investment Income would be unchanged as the reimbursement of custodian fees was offset against expense waivers/reimbursements with no impact to net expenses or net investment income.
(2) Per share amount is based on average shares outstanding.
(3) Calculated based on the net asset value which does not reflect sales charges, if applicable, as of the last business day of the period.
(4) Performance was positively impacted by approximately 0.13% due to the receipt of proceeds from the settlement of a class action suit involving the Fund's past holdings. This was a one-time settlement, and as a result, the impact on the NAV and consequently the performance will not likely be repeated in the future. Had this settlement not occurred, the total return for Class A shares would have been approximately 3.53%.
(5) Performance was positively impacted by approximately 0.25% due to the receipt of proceeds from the settlement of class action suits involving the Fund's past holdings. These were one-time settlements, and as a result, the impact on the NAV and consequently the performance will not likely be repeated in the future. Had these settlements not occurred, the total return for Class A shares would have been approximately 1.26%.
(6) Performance was positively impacted by approximately 0.50% due to the receipt of proceeds from the settlement of a class action suit involving the Fund's past holdings. This was a one-time settlement, and as a result, the impact on the NAV and consequently the performance will not likely be repeated in the future. Had this settlement not occurred, the total return for Class A shares would have been approximately 1.65%.
(7) Performance was positively impacted by approximately 5.94% due to the receipt of proceeds from the settlement of class action suits involving the Fund's past holdings. These were one-time settlements, and as a result, the impact on the NAV and consequently the performance will not likely be repeated in the future. Had these settlements not occurred, the total return for Class A shares would have been approximately 1.21%.
(8) The Ratio of Expenses After Expense Limitation and Ratio of Net Investment Income reflect the rebate of certain Fund expenses in connection with the investments in Morgan Stanley affiliates during the period. The effect of the rebate on the ratios is disclosed in the above table as "Ratio of Rebate from Morgan Stanley Affiliates."
(9) Effective January 11, 2016, the Adviser has agreed to limit the ratio of expenses to average net assets to the maximum ratio of 0.55% for Class A shares. Prior to January 11, 2016, the maximum ratio was 0.88% for Class A shares.
(10) Amount is less than 0.005%.
The accompanying notes are an integral part of the financial statements.
21
Morgan Stanley Institutional Fund Trust
Annual Report — September 30, 2020
Financial Highlights
Short Duration Income Portfolio
| | | Class L | |
| | | Year Ended September 30, | |
Selected Per Share Data and Ratios | | 2020 | | 2019 | | 2018 | | 2017 | | 2016(1) | |
Net Asset Value, Beginning of Period | | $ | 8.24 | | | $ | 8.12 | | | $ | 8.15 | | | $ | 8.11 | | | $ | 7.70 | | |
Income (Loss) from Investment Operations: | |
Net Investment Income(2) | | | 0.13 | | | | 0.17 | | | | 0.13 | | | | 0.11 | | | | 0.11 | | |
Net Realized and Unrealized Gain (Loss) | | | 0.09 | | | | 0.11 | | | | (0.04 | ) | | | 0.04 | | | | 0.41 | | |
Total from Investment Operations | | | 0.22 | | | | 0.28 | | | | 0.09 | | | | 0.15 | | | | 0.52 | | |
Distributions from and/or in Excess of: | |
Net Investment Income | | | (0.15 | ) | | | (0.16 | ) | | | (0.12 | ) | | | (0.11 | ) | | | (0.11 | ) | |
Net Asset Value, End of Period | | $ | 8.31 | | | $ | 8.24 | | | $ | 8.12 | | | $ | 8.15 | | | $ | 8.11 | | |
Total Return(3) | | | 2.69 | % | | | 3.52 | %(4) | | | 1.14 | %(5) | | | 1.90 | %(6) | | | 6.79 | %(7) | |
Ratios to Average Net Assets and Supplemental Data: | |
Net Assets, End of Period (Thousands) | | $ | 829 | | | $ | 795 | | | $ | 382 | | | $ | 410 | | | $ | 403 | | |
Ratio of Expenses Before Expense Limitation | | | 1.26 | % | | | 1.25 | % | | | 1.52 | % | | | 1.70 | % | | | 1.83 | % | |
Ratio of Expenses After Expense Limitation | | | 0.79 | %(8) | | | 0.80 | %(8) | | | 0.80 | %(8) | | | 0.80 | %(8) | | | 0.92 | %(8)(9) | |
Ratio of Net Investment Income | | | 1.64 | %(8) | | | 2.07 | %(8) | | | 1.61 | %(8) | | | 1.41 | %(8) | | | 1.42 | %(8)(9) | |
Ratio of Rebate from Morgan Stanley Affiliates | | | 0.01 | % | | | 0.00 | %(10) | | | 0.00 | %(10) | | | 0.00 | %(10) | | | 0.00 | %(10) | |
Portfolio Turnover Rate | | | 74 | % | | | 64 | % | | | 40 | % | | | 43 | % | | | 66 | % | |
(1) Reflects prior period custodian out-of-pocket expenses that were reimbursed in September 2016. The amount of the reimbursement was immaterial on a per share basis and did not impact the total return of Class L shares. The Ratio of Expenses After Expense Limitation and the Ratio of Net Investment Income would be unchanged as the reimbursement of custodian fees was offset against expense waivers/reimbursements with no impact to net expenses or net investment income.
(2) Per share amount is based on average shares outstanding.
(3) Calculated based on the net asset value as of the last business day of the period.
(4) Performance was positively impacted by approximately 0.13% due to the receipt of proceeds from the settlement of a class action suit involving the Fund's past holdings. This was a one-time settlement, and as a result, the impact on the NAV and consequently the performance will not likely be repeated in the future. Had this settlement not occurred, the total return for Class L shares would have been approximately 3.39%.
(5) Performance was positively impacted by approximately 0.25% due to the receipt of proceeds from the settlement of class action suits involving the Fund's past holdings. These were one-time settlements, and as a result, the impact on the NAV and consequently the performance will not likely be repeated in the future. Had these settlements not occurred, the total return for Class L shares would have been approximately 0.89%.
(6) Performance was positively impacted by approximately 0.51% due to the receipt of proceeds from the settlement of a class action suit involving the Fund's past holdings. This was a one-time settlement, and as a result, the impact on the NAV and consequently the performance will not likely be repeated in the future. Had this settlement not occurred, the total return for Class L shares would have been approximately 1.39%.
(7) Performance was positively impacted by approximately 5.92% due to the receipt of proceeds from the settlement of class action suits involving the Fund's past holdings. These were one-time settlements, and as a result, the impact on the NAV and consequently the performance will not likely be repeated in the future. Had these settlements not occurred, the total return for Class L shares would have been approximately 0.87%.
(8) The Ratio of Expenses After Expense Limitation and Ratio of Net Investment Income reflect the rebate of certain Fund expenses in connection with the investments in Morgan Stanley affiliates during the period. The effect of the rebate on the ratios is disclosed in the above table as "Ratio of Rebate from Morgan Stanley Affiliates."
(9) Effective January 11, 2016, the Adviser has agreed to limit the ratio of expenses to average net assets to the maximum ratio of 0.80% for Class L shares. Prior to January 11, 2016, the maximum ratio was1.23% for Class L shares.
(10) Amount is less than 0.005%.
The accompanying notes are an integral part of the financial statements.
22
Morgan Stanley Institutional Fund Trust
Annual Report — September 30, 2020
Financial Highlights
Short Duration Income Portfolio
| | | Class C | |
| | | Year Ended September 30, | |
Selected Per Share Data and Ratios | | 2020 | | 2019 | | 2018 | | 2017 | | 2016(1) | |
Net Asset Value, Beginning of Period | | $ | 8.22 | | | $ | 8.10 | | | $ | 8.13 | | | $ | 8.09 | | | $ | 7.69 | | |
Income (Loss) from Investment Operations: | |
Net Investment Income(2) | | | 0.09 | | | | 0.13 | | | | 0.09 | | | | 0.07 | | | | 0.07 | | |
Net Realized and Unrealized Gain (Loss) | | | 0.09 | | | | 0.11 | | | | (0.04 | ) | | | 0.04 | | | | 0.41 | | |
Total from Investment Operations | | | 0.18 | | | | 0.24 | | | | 0.05 | | | | 0.11 | | | | 0.48 | | |
Distributions from and/or in Excess of: | |
Net Investment Income | | | (0.11 | ) | | | (0.12 | ) | | | (0.08 | ) | | | (0.07 | ) | | | (0.08 | ) | |
Net Asset Value, End of Period | | $ | 8.29 | | | $ | 8.22 | | | $ | 8.10 | | | $ | 8.13 | | | $ | 8.09 | | |
Total Return(3) | | | 2.16 | % | | | 3.01 | %(4) | | | 0.64 | %(5) | | | 1.34 | %(6) | | | 6.24 | %(7) | |
Ratios to Average Net Assets and Supplemental Data: | |
Net Assets, End of Period (Thousands) | | $ | 37 | | | $ | 36 | | | $ | 52 | | | $ | 52 | | | $ | 95 | | |
Ratio of Expenses Before Expense Limitation | | | 7.65 | % | | | 6.34 | % | | | 5.69 | % | | | 4.92 | % | | | 3.95 | % | |
Ratio of Expenses After Expense Limitation | | | 1.29 | %(8) | | | 1.30 | %(8) | | | 1.30 | %(8) | | | 1.30 | %(8) | | | 1.39 | %(8)(9) | |
Ratio of Net Investment Income | | | 1.14 | %(8) | | | 1.55 | %(8) | | | 1.11 | %(8) | | | 0.85 | %(8) | | | 0.93 | %(8)(9) | |
Ratio of Rebate from Morgan Stanley Affiliates | | | 0.01 | % | | | 0.00 | %(10) | | | 0.00 | %(10) | | | 0.00 | %(10) | | | 0.00 | %(10) | |
Portfolio Turnover Rate | | | 74 | % | | | 64 | % | | | 40 | % | | | 43 | % | | | 66 | % | |
(1) Reflects prior period custodian out-of-pocket expenses that were reimbursed in September 2016. The amount of the reimbursement was immaterial on a per share basis and did not impact the total return of Class C shares. The Ratio of Expenses After Expense Limitation and the Ratio of Net Investment Income would be unchanged as the reimbursement of custodian fees was offset against expense waivers/reimbursements with no impact to net expenses or net investment income.
(2) Per share amount is based on average shares outstanding.
(3) Calculated based on the net asset value which does not reflect sales charges, if applicable, as of the last business day of the period.
(4) Performance was positively impacted by approximately 0.13% due to the receipt of proceeds from the settlement of a class action suit involving the Fund's past holdings. This was a one-time settlement, and as a result, the impact on the NAV and consequently the performance will not likely be repeated in the future. Had this settlement not occurred, the total return for Class C shares would have been approximately 2.88%.
(5) Performance was positively impacted by approximately 0.25% due to the receipt of proceeds from the settlement of class action suits involving the Fund's past holdings. These were one-time settlements, and as a result, the impact on the NAV and consequently the performance will not likely be repeated in the future. Had these settlements not occurred, the total return for Class C shares would have been approximately 0.39%.
(6) Performance was positively impacted by approximately 0.50% due to the receipt of proceeds from the settlement of class action suits involving the Fund's past holdings. This was a one-time settlement, and as a result, the impact on the NAV and consequently the performance will not likely be repeated in the future. Had this settlement not occurred, the total return for Class C shares would have been approximately 0.84%.
(7) Performance was positively impacted by approximately 5.77% due to the receipt of proceeds from the settlement of class action suits involving the Fund's past holdings. These were one-time settlements, and as a result, the impact on the NAV and consequently the performance will not likely be repeated in the future. Had these settlements not occurred, the total return for Class C shares would have been approximately 0.47%.
(8) The Ratio of Expenses After Expense Limitation and Ratio of Net Investment Income reflect the rebate of certain Fund expenses in connection with the investments in Morgan Stanley affiliates during the period. The effect of the rebate on the ratios is disclosed in the above table as "Ratio of Rebate from Morgan Stanley Affiliates."
(9) Effective January 11, 2016, the Adviser has agreed to limit the ratio of expenses to average net assets to the maximum ratio of 1.30% for Class C shares. Prior to January 11, 2016, the maximum ratio was 1.63% for Class C shares.
(10) Amount is less than 0.005%.
The accompanying notes are an integral part of the financial statements.
23
Morgan Stanley Institutional Fund Trust
Annual Report — September 30, 2020
Financial Highlights
Short Duration Income Portfolio
| | | Class IS | |
| | | Year Ended September 30, | | Period from
January 11, 2016(2) to | |
Selected Per Share Data and Ratios | | 2020 | | 2019 | | 2018 | | 2017 | | September 30, 2016(1) | |
Net Asset Value, Beginning of Period | | $ | 8.24 | | | $ | 8.13 | | | $ | 8.15 | | | $ | 8.11 | | | $ | 7.65 | | |
Income (Loss) from Investment Operations: | |
Net Investment Income(3) | | | 0.18 | | | | 0.21 | | | | 0.18 | | | | 0.16 | | | | 0.17 | | |
Net Realized and Unrealized Gain (Loss) | | | 0.09 | | | | 0.11 | | | | (0.03 | ) | | | 0.04 | | | | 0.39 | | |
Total from Investment Operations | | | 0.27 | | | | 0.32 | | | | 0.15 | | | | 0.20 | | | | 0.56 | | |
Distributions from and/or in Excess of: | |
Net Investment Income | | | (0.19 | ) | | | (0.21 | ) | | | (0.17 | ) | | | (0.16 | ) | | | (0.10 | ) | |
Net Asset Value, End of Period | | $ | 8.32 | | | $ | 8.24 | | | $ | 8.13 | | | $ | 8.15 | | | $ | 8.11 | | |
Total Return(4) | | | 3.37 | % | | | 3.98 | %(5) | | | 1.83 | %(6) | | | 2.46 | %(7) | | | 7.42 | %(8)(11) | |
Ratios to Average Net Assets and Supplemental Data: | |
Net Assets, End of Period (Thousands) | | $ | 14 | | | $ | 16 | | | $ | 11 | | | $ | 11 | | | $ | 11 | | |
Ratio of Expenses Before Expense Limitation | | | 12.15 | % | | | 17.44 | % | | | 18.54 | % | | | 16.24 | % | | | 17.12 | %(12) | |
Ratio of Expenses After Expense Limitation | | | 0.24 | %(9) | | | 0.24 | %(9) | | | 0.25 | %(9) | | | 0.25 | %(9) | | | 0.25 | %(9)(12) | |
Ratio of Net Investment Income | | | 2.21 | %(9) | | | 2.61 | %(9) | | | 2.16 | %(9) | | | 1.96 | %(9) | | | 2.20 | %(9)(12) | |
Ratio of Rebate from Morgan Stanley Affiliates | | | 0.01 | % | | | 0.00 | %(10) | | | 0.00 | %(10) | | | 0.00 | %(10) | | | 0.00 | %(10)(12) | |
Portfolio Turnover Rate | | | 74 | % | | | 64 | % | | | 40 | % | | | 43 | % | | | 66 | %(11) | |
(1) Reflects prior period custodian out-of-pocket expenses that were reimbursed in September 2016. The amount of the reimbursement was immaterial on a per share basis and did not impact the total return of Class IS shares. The Ratio of Expenses After Expense Limitation and the Ratio of Net Investment Income would be unchanged as the reimbursement of custodian fees was offset against expense waivers/reimbursements with no impact to net expenses or net investment income.
(2) Commencement of Offering.
(3) Per share amount is based on average shares outstanding.
(4) Calculated based on the net asset value as of the last business day of the period.
(5) Performance was positively impacted by approximately 0.13% due to the receipt of proceeds from the settlement of a class action suit involving the Fund's past holdings. This was a one-time settlement, and as a result, the impact on the NAV and consequently the performance will not likely be repeated in the future. Had this settlement not occurred, the total return for Class IS shares would have been approximately 3.85%.
(6) Performance was positively impacted by approximately 0.25% due to the receipt of proceeds from the settlement of class action suits involving the Fund's past holdings. These were one-time settlements, and as a result, the impact on the NAV and consequently the performance will not likely be repeated in the future. Had these settlements not occurred, the total return for Class IS shares would have been approximately 1.58%.
(7) Performance was positively impacted by approximately 0.51% due to the receipt of proceeds from the settlement of a class action suit involving the Fund's past holdings. This was a one-time settlement, and as a result, the impact on the NAV and consequently the performance will not likely be repeated in the future. Had this settlement not occurred, the total return for Class IS shares would have been approximately 1.95%.
(8) Performance was positively impacted by approximately 5.96% due to the receipt of proceeds from the settlement of class action suits involving the Fund's past holdings. These were one-time settlements, and as a result, the impact on the NAV and consequently the performance will not likely be repeated in the future. Had these settlements not occurred, the total return for Class IS shares would have been approximately 1.46%.
(9) The Ratio of Expenses After Expense Limitation and Ratio of Net Investment Income reflect the rebate of certain Fund expenses in connection with the investments in Morgan Stanley affiliates during the period. The effect of the rebate on the ratios is disclosed in the above table as "Ratio of Rebate from Morgan Stanley Affiliates."
(10) Amount is less than 0.005%.
(11) Not annualized.
(12) Annualized.
The accompanying notes are an integral part of the financial statements.
24
Morgan Stanley Institutional Fund Trust
Annual Report — September 30, 2020
Notes to Financial Statements
Morgan Stanley Institutional Fund Trust ("Trust'') is registered under the Investment Company Act of 1940, as amended (the "Act''), as an open-end management investment company. The Trust is comprised of twelve separate, active funds (individually referred to as a "Fund," collectively as the "Funds"). The Trust applies investment company accounting and reporting guidance. All Funds are considered diversified for purposes of the Act.
The accompanying financial statements relate to the Short Duration Income Portfolio. The Fund seeks above-average total return over a market cycle of three to five years. The Fund offers five classes of shares — Class I, Class A, Class L, Class C and Class IS.
The Fund has suspended offering Class L and Class C shares to all investors. Class L and Class C shareholders of the Fund do not have the option of purchasing additional Class L and Class C shares, respectively. However, existing Class L and Class C shareholders may invest in additional Class L and Class C shares through reinvestment of dividends and distributions.
A. Significant Accounting Policies: The following significant accounting policies are in conformity with U.S. generally accepted accounting principles ("GAAP"). Such policies are consistently followed by the Trust in the preparation of its financial statements. GAAP may require management to make estimates and assumptions that affect the reported amounts and disclosures in the financial statements. Actual results may differ from those estimates.
In March 2017, the Financial Accounting Standards Board ("FASB") issued an Accounting Standard Update, ASU 2017-08, Receivables-Nonrefundable Fees and Other Costs (Subtopic 310-20), Premium Amortization on Purchased Callable Debt Securities ("ASU 2017-08") which amends the amortization period for certain purchased callable debt securities held at a premium, shortening such period to the earliest call date. ASU 2017-08 does not require any accounting change for debt securities held at a discount; the discount continues to be accreted to maturity. ASU 2017-08 is effective for fiscal years, and interim periods within those fiscal years, beginning after December 15, 2018. The adoption resulted in a change in accounting principle, since the Fund had historically amortized such premiums to maturity for U.S. GAAP. Accordingly, the Fund has adopted ASU 2017-08 to amend the premium amortization period for certain purchased callable debt securities with non-contingent call features to the
earliest call date. It is impracticable to evaluate the effect on individual prior periods, therefore the Fund applied the amendments on a modified retrospective basis by recognizing a cumulative effect adjustment that decreased the beginning of period cost of investments and increased the unrealized appreciation on investments of approximately $3,000.
This change in accounting policy has been made to comply with the newly issued accounting standard and had no impact on total accumulated earnings (loss) or the net asset value of the Fund. With respect to the Fund's results of operations, amortization of premium to first call date accelerates amortization with the intent of more closely aligning the recognition of income on such bonds with the economics of the instrument.
In March 2020, FASB issued an Accounting Standard Update, ASU 2020-04, Reference Rate Reform (Topic 848) — Facilitation of the Effects of Reference Rate Reform on Financial Reporting ("ASU 2020-04"), which provides optional, temporary relief with respect to the financial reporting of contracts subject to certain types of modifications due to the planned discontinuation of the London Interbank Offered Rate ("LIBOR") and other IBOR-based reference rates at the end of 2021. The temporary relief provided by ASU 2020-04 is effective for certain reference rate-related contract modifications that occur during the period from March 12, 2020 through December 31, 2022. Management is evaluating the impact of ASU 2020-04 on the Fund's investments, derivatives, debt and other contracts that will undergo reference rate-related modifications as a result of the reference rate reform.
1. Security Valuation: (1) Certain portfolio securities may be valued by an outside pricing service/vendor approved by the Trust's Board of Trustees (the "Trustees"). The pricing service/vendor may employ a pricing model that takes into account, among other things, bids, yield spreads and/or other market data and specific security characteristics. Alternatively, if a valuation is not available from an outside pricing service/vendor, and the security trades on an exchange, the security may be valued at its latest reported sale price (or at the exchange official closing price if such exchange reports an official closing price), prior to the time when assets are valued. If there are no sales on a given day and if there is no official exchange closing price for that day, the security is valued at the mean between the last reported bid and asked prices if such bid and asked prices are available in the relevant exchanges. If only bid prices are available then the latest bid price may be used. If
25
Morgan Stanley Institutional Fund Trust
Annual Report — September 30, 2020
Notes to Financial Statements (cont'd)
Morgan Stanley Investment Management Inc. (the "Adviser"), a wholly-owned subsidiary of Morgan Stanley, determines that the price provided by the outside pricing service/vendor or exchange does not reflect the security's fair value or is unable to provide a price, prices from brokers or dealers may also be utilized. In these circumstances, the value of the security will be the mean of bid and asked prices obtained from brokers or dealers; (2) futures are valued at the settlement price on the exchange on which they trade or, if a settlement price is unavailable, at the last sale price on the exchange; (3) when market quotations are not readily available, including circumstances under which the Adviser determines that the closing price, last sale price or the mean between the last reported bid and asked prices are not reflective of a security's market value, portfolio securities are valued at their fair value as determined in good faith under procedures established by and under the general supervision of the Trustees. Occasionally, developments affecting the closing prices of securities and other assets may occur between the times at which valuations of such securities are determined (that is, close of the foreign market on which the securities trade) and the close of business of the New York Stock Exchange ("NYSE"). If developments occur during such periods that are expected to materially affect the value of such securities, such valuations may be adjusted to reflect the estimated fair value of such securities as of the close of the NYSE, as determined in good faith by the Trustees or by the Adviser using a pricing service and/or procedures approved by the Trustees; (4) quotations of foreign portfolio securities, other assets and liabilities and forward contracts stated in foreign currency are translated into U.S. dollar equivalents at the prevailing market rates prior to the close of the NYSE; and (5) investments in mutual funds, including the Morgan Stanley Institutional Liquidity Funds, are valued at the net asset value ("NAV") as of the close of each business day.
The Trustees have responsibility for determining in good faith the fair value of the investments, and the Trustees may appoint others, such as the Trust's Adviser or a valuation committee, to assist the Trustees in determining fair value and to make the actual calculations pursuant to the fair valuation methodologies previously approved by the Trustees. Under procedures approved by the Trustees, the Trust's Adviser has formed a Valuation Committee whose members are approved by the Trustees. The Valuation Committee provides
administration and oversight of the Trust's valuation policies and procedures, which are reviewed at least annually by the Trustees. These procedures allow the Trust to utilize independent pricing services, quotations from securities and financial instrument dealers and other market sources to determine fair value.
2. Fair Value Measurement: FASB Accounting Standards CodificationTM ("ASC") 820, "Fair Value Measurement" ("ASC 820"), defines fair value as the value that the Fund would receive to sell an investment or pay to transfer a liability in a timely transaction with an independent buyer in the principal market, or in the absence of a principal market, the most advantageous market for the investment or liability. ASC 820 establishes a three-tier hierarchy to distinguish between (1) inputs that reflect the assumptions market participants would use in valuing an asset or liability developed based on market data obtained from sources independent of the reporting entity (observable inputs) and (2) inputs that reflect the reporting entity's own assumptions about the assumptions market participants would use in valuing an asset or liability developed based on the best information available in the circumstances (unobservable inputs) and to establish classification of fair value measurements for disclosure purposes. Various inputs are used in determining the value of the Fund's investments. The inputs are summarized in the three broad levels listed below:
• Level 1 – unadjusted quoted prices in active markets for identical investments
• Level 2 – other significant observable inputs (including quoted prices for similar investments, interest rates, prepayment speeds, credit risk, etc.)
• Level 3 – significant unobservable inputs including the Fund's own assumptions in determining the fair value of investments. Factors considered in making this determination may include, but are not limited to, information obtained by contacting the issuer, analysts, or the appropriate stock exchange (for exchange-traded securities), analysis of the issuer's financial statements or other available documents and, if necessary, available information concerning other securities in similar circumstances.
26
Morgan Stanley Institutional Fund Trust
Annual Report — September 30, 2020
Notes to Financial Statements (cont'd)
The inputs or methodology used for valuing securities are not necessarily an indication of the risk associated with investing in those securities and the determination of the significance of a particular input to the fair value measurement in its entirety requires judgment and considers factors specific to each security.
The following is a summary of the inputs used to value the Fund's investments as of September 30, 2020:
Investment Type | | Level 1
Unadjusted
quoted
prices
(000) | | Level 2
Other
significant
observable
inputs
(000) | | Level 3
Significant
unobservable
inputs
(000) | | Total
(000) | |
Assets: | |
Fixed Income Securities | |
Agency Adjustable Rate
Mortgages | | $ | — | | | $ | 904 | | | $ | — | | | $ | 904 | | |
Agency Bond — Consumer
Discretionary
(U.S. Government
Guaranteed) | | | — | | | | 297 | | | | — | | | | 297 | | |
Agency Fixed Rate
Mortgages | | | — | | | | 1,275 | | | | — | | | | 1,275 | | |
Asset-Backed Securities | | | — | | | | 50,416 | | | | — | | | | 50,416 | | |
Collateralized Mortgage
Obligations — Agency
Collateral Series | | | — | | | | 1,023 | | | | — | | | | 1,023 | | |
Commercial
Mortgage-Backed
Securities | | | — | | | | 4,461 | | | | — | | | | 4,461 | | |
Corporate Bonds | | | — | | | | 268,538 | | | | — | | | | 268,538 | | |
Mortgages — Other | | | — | | | | 22,935 | | | | — | | | | 22,935 | | |
Sovereign | | | — | | | | 5,069 | | | | — | | | | 5,069 | | |
Total Fixed Income
Securities | | | — | | | | 354,918 | | | | — | | | | 354,918 | | |
Investment Company | | | 11,531 | | | | — | | | | — | | | | 11,531 | | |
Short-Term Investments | |
Corporate Bond | | | — | | | | 1,279 | | | | — | | | | 1,279 | | |
Investment Company | | | 9,160 | | | | — | | | | — | | | | 9,160 | | |
U.S. Treasury Securities | | | — | | | | 8,850 | | | | — | | | | 8,850 | | |
Total Short-Term
Investments | | | 9,160 | | | | 10,129 | | | | — | | | | 19,289 | | |
Futures Contracts | | | 50 | | | | — | | | | — | | | | 50 | | |
Total Assets | | | 20,741 | | | | 365,047 | | | | — | | | | 385,788 | | |
Liabilities: | |
Futures Contracts | | | (153 | ) | | | — | | | | — | | | | (153 | ) | |
Total | | $ | 20,588 | | | $ | 365,047 | | | $ | — | | | $ | 385,635 | | |
Transfers between investment levels may occur as the markets fluctuate and/or the availability of data used in an investment's valuation changes.
3. Foreign Currency Translation and Foreign Investments: The books and records of the Fund are maintained in U.S. dollars. Foreign currency amounts are translated into U.S. dollars as follows:
– investments, other assets and liabilities at the prevailing rate of exchange on the valuation date;
– investment transactions and investment income at the prevailing rates of exchange on the dates of such transactions.
Although the net assets of the Fund are presented at the foreign exchange rates and market values at the close of the period, the Fund does not isolate that portion of the results of operations arising as a result of changes in the foreign exchange rates from the fluctuations arising from changes in the market prices of securities held at period end. Similarly, the Fund does not isolate the effect of changes in foreign exchange rates from the fluctuations arising from changes in the market prices of securities sold during the period. Accordingly, realized and unrealized foreign currency gains (losses) on investments in securities are included in the reported net realized and unrealized gains (losses) on investment transactions and balances. However, pursuant to U.S. federal income tax regulations, gains and losses from certain foreign currency transactions and the foreign currency portion of gains and losses realized on sales and maturities of foreign denominated debt securities are treated as ordinary income for U.S. federal income tax purposes.
Net realized gains (losses) on foreign currency transactions represent net foreign exchange gains (losses) from currency gains (losses) realized between the trade and settlement dates on securities transactions, and the difference between the amount of investment income and foreign withholding taxes recorded on the Fund's books and the U.S. dollar equivalent amounts actually received or paid. The change in unrealized currency gains (losses) on foreign currency transactions for the period is reflected in the Statement of Operations.
Foreign security and currency transactions may involve certain considerations and risks not typically associated with those of U.S. dollar denominated transactions as a result of, among other factors, fluctuations of exchange rates in relation to the U.S. dollar, the possibility of lower levels of governmental supervision and regulation
27
Morgan Stanley Institutional Fund Trust
Annual Report — September 30, 2020
Notes to Financial Statements (cont'd)
of foreign securities markets and the possibility of political or economic instability.
Governmental approval for foreign investments may be required in advance of making an investment under certain circumstances in some countries, and the extent of foreign investments in domestic companies may be subject to limitation in other countries. Foreign ownership limitations also may be imposed by the charters of individual companies to prevent, among other concerns, violations of foreign investment limitations. As a result, an additional class of shares (identified as "Foreign" in the Portfolio of Investments) may be created and offered for investment. The "local" and "foreign shares" market values may differ. In the absence of trading of the foreign shares in such markets, the Fund values the foreign shares at the closing exchange price of the local shares.
4. Derivatives: The Fund may, but is not required to, use derivative instruments for a variety of purposes, including hedging, risk management, portfolio management or to earn income. Derivatives are financial instruments whose value is based, in part, on the value of an underlying asset, interest rate, index or financial instrument. Prevailing interest rates and volatility levels, among other things, also affect the value of derivative instruments. A derivative instrument often has risks similar to its underlying asset and may have additional risks, including imperfect correlation between the value of the derivative and the underlying asset, risks of default by the counterparty to certain transactions, magnification of losses incurred due to changes in the market value of the securities, instruments, indices or interest rates to which the derivative instrument relates, risks that the transactions may not be liquid and risks arising from margin requirements. The use of derivatives involves risks that are different from, and possibly greater than, the risks associated with other portfolio investments. Derivatives may involve the use of highly specialized instruments that require investment techniques and risk analyses different from those associated with other portfolio investments. All of the Fund's holdings, including derivative instruments, are marked-to-market each day with the change in value reflected in unrealized appreciation (depreciation). Upon disposition, a realized gain or loss is recognized.
Certain derivative transactions may give rise to a form of leverage. Leverage magnifies the potential for gain and the risk of loss. Leverage associated with derivative
transactions may cause the Fund to liquidate portfolio positions when it may not be advantageous to do so to satisfy its obligations or to meet earmarking or segregation requirements, pursuant to applicable Securities and Exchange Commission ("SEC") rules and regulations, or may cause the Fund to be more volatile than if the Fund had not been leveraged. Although the Adviser seeks to use derivatives to further the Fund's investment objectives, there is no assurance that the use of derivatives will achieve this result.
Following is a description of the derivative instruments and techniques that the Fund used during the period and their associated risks:
Futures: A futures contract is a standardized, exchange-traded agreement to buy or sell a specific quantity of an underlying asset, reference rate or index at a specific price at a specific future time. The value of a futures contract tends to increase and decrease in tandem with the value of the underlying instrument. Depending on the terms of the particular contract, futures contracts are settled through either physical delivery of the underlying instrument on the settlement date or by payment of a cash settlement amount on the settlement date. During the period the futures contract is open, payments are received from or made to the broker based upon changes in the value of the contract (the variation margin). A decision as to whether, when and how to use futures contracts involves the exercise of skill and judgment and even a well-conceived futures transaction may be unsuccessful because of market behavior or unexpected events. In addition to the derivatives risks discussed above, the prices of futures contracts can be highly volatile, using futures contracts can lower total return and the potential loss from futures contracts can exceed the Fund's initial investment in such contracts. No assurance can be given that a liquid market will exist for any particular futures contract at any particular time. There is also the risk of loss by the Fund of margin deposits in the event of bankruptcy of a broker with which the Fund has open positions in the futures contract.
FASB ASC 815, "Derivatives and Hedging" ("ASC 815"), is intended to improve financial reporting about derivative instruments by requiring enhanced disclosures to enable investors to better understand how and why the Fund uses derivative instruments, how these derivative instruments are accounted for and their
28
Morgan Stanley Institutional Fund Trust
Annual Report — September 30, 2020
Notes to Financial Statements (cont'd)
effects on the Fund's financial position and results of operations.
The following tables set forth the fair value of the Fund's derivative contracts by primary risk exposure as of September 30, 2020:
| | | Asset Derivatives
Statement of Assets and
Liabilities Location | | Primary Risk
Exposure | | Value
(000) | |
Futures Contract
| | Variation Margin on
Futures Contract | | Interest Rate Risk | | $ | 50 | (a) | |
| | | Liability Derivatives
Statement of Assets and
Liabilities Location | | Primary Risk
Exposure | | Value
(000) | |
Futures Contract
| | Variation Margin on
Futures Contract | | Interest Rate Risk | | $ | (153 | )(a) | |
(a) This amount represents the cumulative appreciation (depreciation) as reported in the Portfolio of Investments. The Statement of Assets and Liabilities only reflects the current day's net variation margin.
The following tables set forth by primary risk exposure the Fund's realized gains (losses) and change in unrealized appreciation (depreciation) by type of derivative contract for the year ended September 30, 2020 in accordance with ASC 815:
Realized Gain (Loss) | |
Primary Risk Exposure | | Derivative Type | | Value
(000) | |
Interest Rate Risk | | Futures Contracts | | $ | (1,743 | ) | |
Change in Unrealized Appreciation (Depreciation) | |
Primary Risk Exposure | | Derivative Type | | Value
(000) | |
Interest Rate Risk | | Futures Contracts | | $ | 133 | | |
For the year ended September 30, 2020, the approximate average monthly amount outstanding for each derivative type is as follows:
Futures Contracts: | |
Average monthly notional value | | $ | 157,935,000 | | |
5. When-Issued/Delayed Delivery Securities: The Fund purchases and sells when-issued and delayed delivery securities. Securities purchased on a when-issued or delayed delivery basis are purchased for delivery beyond the normal settlement date at a stated price and yield, and no income accrues to the Fund on such securities prior to delivery date. Payment and delivery for when-issued and delayed delivery securities can take place a month or more after the date of the transaction. When the Fund enters into a purchase transaction on a when-issued or delayed delivery basis, securities are available for collateral in an amount at least equal in value to the Fund's commitments to purchase such securities. Purchasing securities on a when-issued or delayed delivery basis may involve a risk
that the market price at the time of delivery may be lower than the agreed upon purchase price, in which case there could be an unrealized loss at the time of delivery. Purchasing investments on a when-issued or delayed delivery basis may be considered a form of leverage which may increase the impact that gains (losses) may have on the Fund.
6. Indemnifications: The Trust enters into contracts that contain a variety of indemnifications. The Trust's maximum exposure under these arrangements is unknown. However, the Trust has not had prior claims or losses pursuant to these contracts and expects the risk of loss to be remote.
7. Dividends and Distributions to Shareholders: Dividends and distributions to shareholders are recorded on the ex-dividend date. Dividends from net investment income, if any, are declared and paid monthly. Net realized capital gains, if any, are distributed at least annually.
8. Security Transactions, Income and Expenses: Security transactions are accounted for on the trade date (date the order to buy or sell is executed). Realized gains and losses on the sale of investment securities are determined on the specific identified cost method. Dividend income and other distributions are recorded on the ex-dividend date (except for certain foreign dividends which may be recorded as soon as the Fund is informed of such dividends) net of applicable withholding taxes. Interest income is recognized on the accrual basis except where collection is in doubt. Discounts are accreted and premiums are amortized over the life of the respective securities. Most expenses of the Trust can be directly attributed to a particular Fund. Expenses which cannot be directly attributed are apportioned among the Funds based upon relative net assets or other appropriate methods. Income, expenses (other than class specific expenses — distribution and shareholder services, transfer agency and sub transfer agency fees) and realized and unrealized gains or losses are allocated to each class of shares based upon their relative net assets.
B. Advisory Fees: The Adviser, a wholly-owned subsidiary of Morgan Stanley, provides the Fund with advisory services under the terms of an Investment Advisory Agreement, paid quarterly, at an annual rate of 0.20% of the average daily net assets of the Fund.
29
Morgan Stanley Institutional Fund Trust
Annual Report — September 30, 2020
Notes to Financial Statements (cont'd)
The Adviser has agreed to reduce its advisory fee and/or reimburse the Fund so that total annual Fund operating expenses, excluding certain investment related expenses, taxes, interest and other extraordinary expenses (including litigation), will not exceed 0.30% for Class I shares, 0.55% for Class A shares, 0.80% for Class L shares, 1.30% for Class C shares and 0.25% for Class IS shares. The fee waivers and/or expense reimbursements will continue for at least one year or until such time as the Trustees act to discontinue all or a portion of such waivers and/or reimbursements when they deem such action is appropriate. For the year ended September 30, 2020, approximately $508,000 of advisory fees were waived and approximately $96,000 of other expenses were reimbursed by the Adviser pursuant to this arrangement.
C. Administration Fees: The Adviser also serves as Administrator to the Trust and provides administrative services pursuant to an Administration Agreement for an annual fee, accrued daily and paid monthly, of 0.08% of the Fund's average daily net assets. Under a Sub-Administration Agreement between the Administrator and State Street Bank and Trust Company ("State Street"), State Street provides certain administrative services to the Trust. For such services, the Administrator pays State Street a portion of the fee the Administrator receives from the Fund.
D. Distribution and Shareholder Services Fees: Morgan Stanley Distribution, Inc. ("MSDI" or the "Distributor"), a wholly-owned subsidiary of the Adviser, and an indirect subsidiary of Morgan Stanley, serves as the Trust's Distributor of Fund shares pursuant to a Distribution Agreement. The Trust has adopted a Shareholder Services Plan with respect to Class A shares pursuant to Rule 12b-1 under the Act. Under the Shareholder Services Plan, the Fund pays the Distributor a shareholder services fee, accrued daily and paid monthly, at an annual rate of 0.25% of the Fund's average daily net assets attributable to Class A shares.
The Trust has adopted a Distribution and Shareholder Services Plan with respect to Class L shares pursuant to Rule 12b-1 under the Act. Under the Distribution and Shareholder Services Plan, the Fund pays the Distributor a distribution fee, accrued daily and paid monthly, at an annual rate of 0.25% and a shareholder services fee, accrued daily and paid monthly, at an annual rate of 0.25% of the Fund's average daily net assets attributable to Class L shares.
The Trust has adopted a Distribution and Shareholder Services Plan with respect to Class C shares pursuant to Rule 12b-1 under the Act. Under the Distribution and Shareholder Services
Plan, the Fund pays the Distributor a distribution fee, accrued daily and paid monthly, at an annual rate of 0.75% and a shareholder services fee, accrued daily and paid monthly, at an annual rate of 0.25% of the Fund's average daily net assets attributable to Class C shares.
The distribution and shareholder services fees are used to support the expenses associated with servicing and maintaining accounts. The Distributor may compensate other parties for providing shareholder support services to investors who purchase Class A, Class L and Class C shares.
E. Dividend Disbursing and Transfer/Co-Transfer Agent: The Trust's dividend disbursing and transfer agent is DST Asset Manager Solutions, Inc. ("DST"). Pursuant to a Transfer Agency Agreement, the Trust pays DST a fee based on the number of classes, accounts and transactions relating to the Funds of the Trust.
Morgan Stanley Services Company Inc. serves as Co-Transfer Agent and provides certain transfer agency services to the Fund with respect to certain direct transactions with the Fund.
F. Custodian Fees: State Street (the "Custodian") also serves as Custodian for the Trust in accordance with a Custodian Agreement. The Custodian holds cash, securities and other assets of the Trust as required by the Act. Custody fees are payable monthly based on assets held in custody, investment purchases and sales activity and account maintenance fees, plus reimbursement for certain out-of-pocket expenses.
G. Security Transactions and Transactions with Affiliates: For the year ended September 30, 2020, purchases and sales of investment securities for the Fund, other than long-term U.S. Government securities and short-term investments were approximately $303,448,000 and $175,180,000, respectively. For the year ended September 30, 2020, purchases and sales of long-term U.S. Government securities were approximately $5,286,000 and $12,926,000, respectively.
The Fund invests in the Institutional Class of the Morgan Stanley Institutional Liquidity Funds — Government Portfolio (the "Liquidity Funds"), an open-end management investment company managed by the Adviser. Advisory fees paid by the Fund are reduced by an amount equal to its pro-rata share of the advisory and administration fees paid by the Fund due to its investment in the Liquidity Funds. For the year ended September 30, 2020, advisory fees paid were reduced by approximately $16,000 relating to the Fund's investment in the Liquidity Funds.
30
Morgan Stanley Institutional Fund Trust
Annual Report — September 30, 2020
Notes to Financial Statements (cont'd)
A summary of the Fund's transactions in shares of affiliated investments during the year ended September 30, 2020 is as follows:
Affiliated
Investment
Company | | Value
September 30,
2019
(000) | | Purchases
at Cost
(000) | | Proceeds
from Sales
(000) | | Dividend
Income
(000) | |
Liquidity Funds | | $ | 10,033 | | | $ | 215,844 | | | $ | 216,717 | | | $ | 46 | | |
Affiliated
Investment
Company (cont'd) | | Realized
Gain (Loss)
(000) | | Change in
Unrealized
Appreciation
(Depreciation)
(000) | | Value
September 30,
2020
(000) | |
Liquidity Funds | | $ | — | | | $ | — | | | $ | 9,160 | | |
The Fund is permitted to purchase and sell securities ("cross-trade") from and to other Morgan Stanley funds as well as other funds and client accounts for which the Adviser or an affiliate of the Adviser serves as investment adviser, pursuant to procedures approved by the Trustees in compliance with Rule 17a-7 under the Act (the "Rule"). Each cross-trade is executed at the current market price in compliance with provisions of the Rule. For the year ended September 30, 2020, the Fund did not engage in any cross-trade transactions.
The Fund has an unfunded Deferred Compensation Plan (the "Compensation Plan"), which allows each independent Trustee to defer payment of all, or a portion, of the fees he or she receives for serving on the Board of Trustees. Each eligible Trustee generally may elect to have the deferred amounts credited with a return equal to the total return on one or more of the Morgan Stanley funds that are offered as investment options under the Compensation Plan. Appreciation/depreciation and distributions received from these investments are recorded with an offsetting increase/decrease in the deferred compensation obligation and do not affect the NAV of the Fund.
H. Federal Income Taxes: It is the Fund's intention to continue to qualify as a regulated investment company and distribute all of its taxable and tax-exempt income. Accordingly, no provision for federal income taxes is required in the financial statements.
The Fund may be subject to taxes imposed by countries in which it invests. Such taxes are generally based on income and/or capital gains earned or repatriated. Taxes are accrued based on net investment income, net realized gains and net unrealized appreciation as such income and/or gains are earned. Taxes may also be based on transactions in foreign currency and are accrued based on the value of investments denominated in such currency.
FASB ASC 740-10, "Income Taxes — Overall", sets forth a minimum threshold for financial statement recognition of the benefit of a tax position taken or expected to be taken in a tax return. Management has concluded there are no significant uncertain tax positions that would require recognition in the financial statements. If applicable, the Fund recognizes interest accrued related to unrecognized tax benefits in "Interest Expense" and penalties in "Other Expenses" in the Statement of Operations. The Fund files tax returns with the U.S. Internal Revenue Service, New York and various states. Generally, each of the tax years in the four-year period ended September 30, 2020 remains subject to examination by taxing authorities.
The tax character of distributions paid may differ from the character of distributions shown for GAAP purposes due to short-term capital gains being treated as ordinary income for tax purposes. The tax character of distributions paid during fiscal years 2020 and 2019 was as follows:
2020 Distributions
Paid From:
Ordinary Income
(000) | | 2019 Distributions
Paid From:
Ordinary Income
(000) | |
| $ | 5,806 | | | $ | 5,426 | | |
The amount and character of income and gains to be distributed are determined in accordance with income tax regulations which may differ from GAAP. These book/tax differences are either considered temporary or permanent in nature.
Temporary differences are attributable to differing book and tax treatments for the timing of the recognition of gains (losses) on certain investment transactions and the timing of the deductibility of certain expenses.
Permanent differences, due to tax adjustments on callable bonds, resulted in the following reclassifications among the components of net assets at September 30, 2020:
Total
Distributable
Earnings
(000) | | Paid-in-
Capital
(000) | |
| $ | 34 | | | $ | (34 | ) | |
At September 30, 2020, the components of distributable earnings for the Fund on a tax basis were as follows:
Undistributed
Ordinary
Income
(000) | | Undistributed
Long-Term
Capital Gain
(000) | |
| $ | 694 | | | $ | — | | |
31
Morgan Stanley Institutional Fund Trust
Annual Report — September 30, 2020
Notes to Financial Statements (cont'd)
At September 30, 2020, the Fund had available for federal income tax purposes unused short-term and long-term capital losses of approximately $1,728,000 and $3,046,000, respectively, that do not have an expiration date.
To the extent that capital loss carryforwards are used to offset any future capital gains realized, no capital gains tax liability will be incurred by the Fund for gains realized and not distributed. To the extent that capital gains are offset, such gains will not be distributed to the shareholders.
I. Credit Facility: The Trust and other Morgan Stanley funds participated in a $300,000,000 committed, unsecured revolving line of credit facility (the "Facility") with State Street. This Facility is to be used for temporary emergency purposes or funding of shareholder redemption requests. The interest rate on borrowings is based on the federal funds rate or 1 month LIBOR rate plus a spread. The Facility also has a commitment fee of 0.25% per annum based on the unused portion of the Facility. During the year ended September 30, 2020, the Fund did not have any borrowings under the Facility.
J. Other: At September 30, 2020, the Fund had record owners of 10% or greater. Investment activities of these shareholders could have a material impact on the Fund. The aggregate percentage of such owners was 67.2%.
K. Market Risk: Certain impacts to public health conditions particular to the coronavirus (COVID-19) outbreak could impact the operations and financial performance of certain of the Fund's investments. The extent of the impact to the financial performance of the Fund's investments will depend on future developments, including (i) the duration and spread of the outbreak, (ii) the restrictions and advisories, (iii) the effects on the financial markets, and (iv) the effects on the economy overall, all of which are highly uncertain and cannot be predicted. If the financial performance of the Fund's investments is impacted because of these factors for an extended period, the Fund's investment results may be adversely affected.
L. LIBOR Risk: The Fund's investments, payment obligations and financing terms may be based on floating rates, such as London Interbank Offer Rate ("LIBOR"), Euro Interbank Offered Rate and other similar types of reference rates (each, a "Reference Rate"). These Reference Rates are generally intended to represent the rate at which contributing banks may obtain short-term borrowings from each other within certain financial markets. On July 27, 2017, the Chief Executive of
the UK Financial Conduct Authority ("FCA"), which regulates LIBOR, announced that the FCA will no longer persuade nor require banks to submit rates for the calculation of LIBOR and certain other Reference Rates after 2021. Such announcement indicates that the continuation of LIBOR and other Reference Rates on the current basis cannot and will not be guaranteed after the end of 2021. This announcement and any additional regulatory or market changes may have an adverse impact on the Fund or its investments.
In advance of 2022, regulators and market participants are currently engaged in identifying successor Reference Rates ("Alternative Reference Rates"). Additionally, prior to the end of 2021, it is expected that market participants will focus on the transition mechanisms by which the Reference Rates in existing contracts or instruments may be amended, whether through marketwide protocols, fallback contractual provisions, bespoke negotiations or amendments or otherwise. Nonetheless, the termination of certain Reference Rates presents risks to the Fund. At this time, it is not possible to completely identify or predict the effect of any such changes, any establishment of Alternative Reference Rates or any other reforms to Reference Rates that may be enacted in the UK or elsewhere. The elimination of a Reference Rate or any other changes or reforms to the determination or supervision of Reference Rates could have an adverse impact on the market for or value of any securities or payments linked to those Reference Rates and other financial obligations held by the Fund or on its overall financial condition or results of operations.
32
Morgan Stanley Institutional Fund Trust
Annual Report — September 30, 2020
Report of Independent Registered Public Accounting Firm
To the Shareholders and Board of Trustees of
Morgan Stanley Institutional Fund Trust —
Short Duration Income Portfolio
Opinion on the Financial Statements
We have audited the accompanying statement of assets and liabilities of Short Duration Income Portfolio (the "Fund") (one of the funds constituting Morgan Stanley Institutional Fund Trust (the "Trust")), including the portfolio of investments, as of September 30, 2020, and the related statement of operations for the year then ended, the statements of changes in net assets for each of the two years in the period then ended, the financial highlights for each of the five years in the period then ended and the related notes (collectively referred to as the "financial statements"). In our opinion, the financial statements present fairly, in all material respects, the financial position of the Fund (one of the funds constituting Morgan Stanley Institutional Fund Trust) at September 30, 2020, the results of its operations for the year then ended, the changes in its net assets for each of the two years in the period then ended and its financial highlights for each of the five years in the period then ended, in conformity with U.S. generally accepted accounting principles.
Basis for Opinion
These financial statements are the responsibility of the Trust's management. Our responsibility is to express an opinion on the Fund's financial statements based on our audits. We are a public accounting firm registered with the Public Company Accounting Oversight Board (United States) ("PCAOB") and are required to be independent with respect to the Trust in accordance with the U.S. federal securities law and the applicable rules and regulations of the Securities and Exchange Commission and the PCAOB.
We conducted our audits in accordance with the standards of the PCAOB. Those standards require that we plan and perform the audit to obtain reasonable assurance about whether the financial statements are free of material misstatement, whether due to error or fraud. The Trust is not required to have, nor were we engaged to perform, an audit of the Trust's internal control over financial reporting. As part of our audits we are required to obtain an understanding of internal control over financial reporting but not for the purpose of expressing an opinion on the effectiveness of the Trust's internal control over financial reporting. Accordingly, we express no such opinion.
Our audits included performing procedures to assess the risks of material misstatement of the financial statements, whether due to error or fraud, and performing procedures that respond to those risks. Such procedures included examining, on a test basis, evidence regarding the amounts and disclosures in the financial statements. Our procedures included confirmation of securities owned as of September 30, 2020 by correspondence with the custodian and brokers or by other appropriate auditing procedures where replies from brokers were not received. Our audits also included evaluating the accounting principles used and significant estimates made by management, as well as evaluating the overall presentation of the financial statements. We believe that our audits provide a reasonable basis for our opinion.

We have served as the auditor of one or more Morgan Stanley investment companies since 2000.
Boston, Massachusetts
November 24, 2020
33
Morgan Stanley Institutional Fund Trust
Annual Report — September 30, 2020
Investment Advisory Agreement Approval (unaudited)
Nature, Extent and Quality of Services
The Board reviewed and considered the nature and extent of the investment advisory services provided by the Adviser under the advisory agreement, including portfolio management, investment research and equity and fixed income securities trading. The Board also reviewed and considered the nature and extent of the non-advisory, administrative services provided by the Administrator under the administration agreement, including accounting, operations, clerical, bookkeeping, compliance, business management and planning, legal services and the provision of supplies, office space and utilities at the Adviser's expense. The Board also considered the Adviser's investment in personnel and infrastructure that benefits the Fund. (The Adviser and Administrator together are referred to as the "Adviser" and the advisory and administration agreements together are referred to as the "Management Agreement.") The Board also considered that the Adviser serves a variety of other investment advisory clients and has experience overseeing service providers. The Board also compared the nature of the services provided by the Adviser with similar services provided by non-affiliated advisers as prepared by Broadridge Financial Solutions, Inc. ("Broadridge").
The Board reviewed and considered the qualifications of the portfolio managers, the senior administrative managers and other key personnel of the Adviser who provide the advisory and administrative services to the Fund. The Board determined that the Adviser's portfolio managers and key personnel are well qualified by education and/or training and experience to perform the services in an efficient and professional manner. The Board concluded that the nature and extent of the advisory and administrative services provided were necessary and appropriate for the conduct of the business and investment activities of the Fund and supported its decision to approve the Management Agreement.
Performance, Fees and Expenses of the Fund
The Board reviewed the performance, fees and expenses of the Fund compared to its peers, as prepared by Broadridge, and to appropriate benchmarks where applicable. The Board discussed with the Adviser the performance goals and the actual results achieved in managing the Fund. When considering a fund's performance, the Board and the Adviser place emphasis on trends and longer-term returns (focusing on one-year, three-year and five-year performance, as of December 31, 2019, or since inception, as applicable). When a fund underperforms its benchmark and/or its peer group average, the Board and the Adviser discuss the causes of such underperformance and, where necessary, they discuss specific changes to investment strategy or investment personnel. The Board noted that the Fund's performance was better than its peer group average for the three- and five-year periods but below its peer group average for the one-year period. The Board discussed with the Adviser the level of the advisory and administration fees (together, the "management fee") for this Fund relative to comparable funds and/or other accounts advised by the Adviser and/or compared to its peers as prepared by Broadridge. In addition to the management fee, the Board also reviewed the Fund's total expense ratio. The Board noted that the Fund's management fee and total expense ratio were lower than its peer group averages. After discussion, the Board concluded that the Fund's performance, management fee and total expense ratio were competitive with its peer group averages.
Economies of Scale
The Board considered the size and growth prospects of the Fund and how that relates to the Fund's total expense ratio and particularly the Fund's management fee rate, which does not include breakpoints. In conjunction with its review of the Adviser's profitability, the Board discussed with the Adviser how a change in assets can affect the efficiency or effectiveness of managing the Fund and whether the management fee level is appropriate relative to current and projected asset levels and/or whether the management fee structure reflects economies of scale as asset levels change. The Board has determined that its review of the actual and/or potential economies of scale of the Fund supports its decision to approve the Management Agreement.
Profitability of the Adviser and Affiliates
The Board considered information concerning the costs incurred and profits realized by the Adviser and its affiliates during the last year from their relationship with the Fund and during the last two years from their relationship with the Morgan Stanley Fund Complex and reviewed with the Adviser the cost allocation methodology used to determine the profitability of the Adviser and affiliates. The Board has determined that its review of the analysis of the Adviser's expenses and profitability supports its decision to approve the Management Agreement.
34
Morgan Stanley Institutional Fund Trust
Annual Report — September 30, 2020
Investment Advisory Agreement Approval (unaudited) (cont'd)
Other Benefits of the Relationship
The Board considered other direct and indirect benefits to the Adviser and/or its affiliates derived from their relationship with the Fund and other funds advised by the Adviser. These benefits may include, among other things, fees for trading, distribution and/or shareholder servicing and for transaction processing and reporting platforms used by securities lending agents, and research received by the Adviser generated from commission dollars spent on funds' portfolio trading. The Board reviewed with the Adviser these arrangements and the reasonableness of the Adviser's costs relative to the services performed. The Board has determined that its review of the other benefits received by the Adviser or its affiliates supports its decision to approve the Management Agreement.
Resources of the Adviser and Historical Relationship Between the Fund and the Adviser
The Board considered whether the Adviser is financially sound and has the resources necessary to perform its obligations under the Management Agreement. The Board also reviewed and considered the historical relationship between the Fund and the Adviser, including the organizational structure of the Adviser, the policies and procedures formulated and adopted by the Adviser for managing the Fund's operations and the Board's confidence in the competence and integrity of the senior managers and key personnel of the Adviser. The Board concluded that the Adviser has the financial resources necessary to fulfill its obligations under the Management Agreement and that it is beneficial for the Fund to continue its relationship with the Adviser.
Other Factors and Current Trends
The Board considered the controls and procedures adopted and implemented by the Adviser and monitored by the Fund's Chief Compliance Officer and concluded that the conduct of business by the Adviser indicates a good faith effort on its part to adhere to high ethical standards in the conduct of the Fund's business.
As part of the Board's review, the Board received information from management on the impact of COVID-19 on the firm generally and the Adviser and the Fund in particular including, among other information, the pandemic's current and expected impact on the Fund's performance and operations.
General Conclusion
After considering and weighing all of the above factors, with various written materials and verbal information presented by the Adviser, the Board concluded that it would be in the best interest of the Fund and its shareholders to approve renewal of the Management Agreement for another year. In reaching this conclusion the Board did not give particular weight to any single piece of information or factor referenced above. The Board considered these factors and information over the course of the year and in numerous meetings, some of which were in executive session with only the independent Board members and their counsel present. It is possible that individual Board members may have weighed these factors, and the information presented, differently in reaching their individual decisions to approve the Management Agreement.
35
Morgan Stanley Institutional Fund Trust
Annual Report — September 30, 2020
Liquidity Risk Management Program (unaudited)
In compliance with Rule 22e-4 under the Investment Company Act of 1940, as amended (the "Liquidity Rule"), the Fund has adopted and implemented a liquidity risk management program (the "Program"), which is reasonably designed to assess and manage the risk that the Fund could not meet requests to redeem shares issued by the Fund without significant dilution of remaining investors' interests in the Fund (i.e., liquidity risk). The Fund's Board of Trustees (the "Board") previously approved the designation of the Liquidity Risk Subcommittee (the "LRS") as Program administrator. The LRS is comprised of representatives from various divisions within Morgan Stanley Investment Management.
At a meeting held on April 22-23, 2020, the Board reviewed a written report prepared by the LRS that addressed the Program's operation and assessed its adequacy, and effectiveness of implementation for the period from December 1, 2018, through December 31, 2019, as required under the Liquidity Rule. The report concluded that the Program operated effectively and was adequately and effectively implemented in all material aspects, and that the relevant controls and safeguards were appropriately designed to enable the LRS to administer the Program in compliance with the Liquidity Rule.
In accordance with the Program, the LRS assessed each Fund's liquidity risk no less frequently than annually taking into consideration certain factors, as applicable, such as (i) investment strategy and liquidity of portfolio investments, (ii) short-term and long-term cash flow projections and (iii) holdings of cash and cash equivalents and borrowing arrangements and other funding sources. Certain factors are considered under both normal and reasonably foreseeable stressed conditions.
Each Fund portfolio investment is classified into one of four liquidity categories, which classification is assessed at least monthly by the LRS. The classification is based on a determination of the number of days it is reasonably expected to take to convert the investment into cash, or sell or dispose of the investment, in current market conditions without significantly changing the market value of the investment. Liquidity classification determinations take into account various market, trading and investment-specific considerations, as well as market depth, and in some cases utilize third-party vendor data.
The Liquidity Rule limits a fund's investments in illiquid investments to 15% of its net assets and requires funds that do not primarily hold assets that are highly liquid investments to determine and maintain a minimum percentage of the fund's net assets to be invested in highly liquid investments (highly liquid investment minimum or "HLIM"). The LRS believes that the Program includes provisions reasonably designed to review, monitor and comply with the 15% limit on illiquid investments and for determining, periodically reviewing and complying with the HLIM requirement, as applicable.
There can be no assurance that the Program will achieve its objectives under all circumstances in the future. Please refer to the Fund's prospectus for more information regarding the Fund's exposure to liquidity risk and other risks to which it may be subject.
36
Morgan Stanley Institutional Fund Trust
Annual Report — September 30, 2020
Privacy Notice (unaudited) April 2019
FACTS | | WHAT DOES MSIM DO WITH YOUR PERSONAL INFORMATION? | |
Why? | | Financial companies choose how they share your personal information. Federal law gives consumers the right to limit some but not all sharing. Federal law also requires us to tell you how we collect, share, and protect your personal information. Please read this notice carefully to understand what we do. | |
What? | | The types of personal information we collect and share depend on the product or service you have with us. This information can include:
n Social Security number and income
n investment experience and risk tolerance
n checking account number and wire transfer instructions | |
How? | | All financial companies need to share customers' personal information to run their everyday business. In the section below, we list the reasons financial companies can share their customers' personal information; the reasons MSIM chooses to share; and whether you can limit this sharing. | |
Reasons we can share your personal information | | Does MSIM share? | | Can you limit this sharing? | |
For our everyday business purposes —
such as to process your transactions, maintain your account(s), respond to court orders and legal investigations, or report to credit bureaus | | Yes | | No | |
For our marketing purposes —
to offer our products and services to you | | Yes | | No | |
For joint marketing with other financial companies | | No | | We don't share | |
For our affiliates' everyday business purposes —
information about your transactions and experiences | | Yes | | No | |
For our affiliates' everyday business purposes —
information about your creditworthiness | | No | | We don't share | |
For our affiliates to market to you | | No | | We don't share | |
For non-affiliates to market to you | | No | | We don't share | |
Questions? Call toll-free (844) 312-6327 or email: imprivacyinquiries@morganstanley.com
37
Morgan Stanley Institutional Fund Trust
Annual Report — September 30, 2020
Privacy Notice (unaudited) (cont'd) April 2019
Who we are
Who is providing this notice? | | Morgan Stanley Investment Management, Inc. and its affiliated registered investment advisers, registered broker-dealers, and registered and unregistered funds ("MSIM") | |
What we do
How does MSIM protect my personal information? | | To protect your personal information from unauthorized access and use, we use security measures that comply with federal law. These measures include computer safeguards and secured files and buildings. We have policies governing the proper handling of customer information by personnel and requiring third parties that provide support to adhere to appropriate security standards with respect to such information. | |
How does MSIM collect my personal information? | | We collect your personal information, for example, when you
n open an account or make deposits or withdrawals from your account
n buy securities from us or make a wire transfer
n give us your contact information
We also collect your personal information from others, such as credit bureaus, affiliates, or other companies. | |
Why can't I limit all sharing? | | Federal law gives you the right to limit only
n sharing for affiliates' everyday business purposes — information about your creditworthiness
n affiliates from using your information to market to you
n sharing for non-affiliates to market to you
State laws and individual companies may give you additional rights to limit sharing. See below for more on your rights under state law. | |
Definitions
Affiliates | | Companies related by common ownership or control. They can be financial and non-financial companies.
n Our affiliates include companies with a Morgan Stanley name and financial companies such as Morgan Stanley Smith Barney LLC and Morgan Stanley & Co. | |
Non-affiliates | | Companies not related by common ownership or control. They can be financial and non-financial companies.
n MSIM does not share with non-affiliates so they can market to you. | |
Joint marketing | | A formal agreement between non-affiliated financial companies that together market financial products or services to you.
n MSIM doesn't jointly market | |
Other Important Information
Vermont: Except as permitted by law, we will not share personal information we collect about Vermont residents with Non-affiliates unless you provide us with your written consent to share such information.
California: Except as permitted by law, we will not share personal information we collect about California residents with Non-affiliates and we will limit sharing such personal information with our Affiliates to comply with California privacy laws that apply to us.
38
Morgan Stanley Institutional Fund Trust
Annual Report — September 30, 2020
Trustee and Officer Information (unaudited)
Independent Trustees:
Name, Address and Birth Year
of Independent Trustee | | Position(s)
Held with
Registrant | | Length of Time
Served* | | Principal Occupation(s) During Past 5 Years
and Other Relevant Professional Experience | | Number of
Funds in
Fund Complex
Overseen by
Independent
Trustee** | | Other Directorships
Held by Independent
Trustee*** | |
Frank L. Bowman
c/o Perkins Coie LLP
Counsel to the Independent Trustees
1155 Avenue of the Americas, 22nd Floor
New York, NY 10036
Birth Year 1944 | | Trustee | | Since
August
2006 | | President, Strategic Decisions, LLC (consulting) (since February 2009); Director or Trustee of various Morgan Stanley Funds (since August 2006); Chairperson of the Compliance and Insurance Committee (since October 2015); formerly, Chairperson of the Insurance Sub-Committee of the Compliance and Insurance Committee (2007-2015); served as President and Chief Executive Officer of the Nuclear Energy Institute (policy organization) (February 2005-November 2008); retired as Admiral, U.S. Navy after serving over 38 years on active duty including 8 years as Director of the Naval Nuclear Propulsion Program in the Department of the Navy and the U.S. Department of Energy (1996-2004); served as Chief of Naval Personnel (July 1994-September 1996) and on the Joint Staff as Director of Political Military Affairs (June 1992- July 1994); knighted as Honorary Knight Commander of the Most Excellent Order of the British Empire; awarded the Officier de l'Orde National du Mérite by the French Government; elected to the National Academy of Engineering (2009). | | | 86 | | | Director of Naval and Nuclear Technologies LLP; Director Emeritus of the Armed Services YMCA; Member of the National Security Advisory Council of the Center for U.S. Global Engagement and a member of the CNA Military Advisory Board; Trustee of Fairhaven United Methodist Church; Member of the Board of Advisors of the Dolphin Scholarship Foundation; Director of other various non-profit organizations; Formerly, Director of BP p.l.c. (November 2010-May 2019). | |
Kathleen A. Dennis
c/o Perkins Coie LLP
Counsel to the Independent Trustees
1155 Avenue of the Americas, 22nd Floor
New York, NY 10036
Birth Year 1953 | | Trustee | | Since
August
2006 | | President, Cedarwood Associates (mutual fund and investment management consulting) (since July 2006); Chairperson of the Liquidity and Alternatives Sub-Committee of the Investment Committee (since October 2006) and Director or Trustee of various Morgan Stanley Funds (since August 2006); formerly, Senior Managing Director of Victory Capital Management (1993-2006). | | | 86 | | | Director of various
non-profit organizations. | |
Nancy C. Everett
c/o Perkins Coie LLP
Counsel to the Independent Trustees
1155 Avenue of the Americas, 22nd Floor
New York, NY 10036
Birth Year 1955 | | Trustee | | Since
January
2015 | | Chief Executive Officer, Virginia Commonwealth University Investment Company (since November 2015); Owner, OBIR, LLC (institutional investment management consulting) (since June 2014); formerly, Managing Director, BlackRock, Inc. (February 2011-December 2013); and Chief Executive Officer, General Motors Asset Management (a/k/a Promark Global Advisors, Inc.) (June 2005-May 2010). | | | 87 | | | Formerly, Member of Virginia Commonwealth University School of Business Foundation (2005-2016); Member of Virginia Commonwealth University Board of Visitors (2013-2015); Member of Committee on Directors for Emerging Markets Growth Fund, Inc. (2007-2010); Chairperson of Performance Equity Management, LLC (2006-2010); and Chairperson, GMAM Absolute Return Strategies Fund, LLC (2006-2010). | |
39
Morgan Stanley Institutional Fund Trust
Annual Report — September 30, 2020
Trustee and Officer Information (unaudited) (cont'd)
Independent Trustees: (cont'd)
Name, Address and Birth Year
of Independent Trustee | | Position(s)
Held with
Registrant | | Length of Time
Served* | | Principal Occupation(s) During Past 5 Years
and Other Relevant Professional Experience | | Number of
Funds in
Fund Complex
Overseen by
Independent
Trustee** | | Other Directorships
Held by Independent
Trustee*** | |
Jakki L. Haussler
c/o Perkins Coie LLP
Counsel to the Independent Trustees
1155 Avenue of the Americas, 22nd Floor
New York, NY 10036
Birth Year 1957 | | Trustee | | Since
January
2015 | | Chairman, Opus Capital Group (since January 1996); formerly, Chief Executive Officer, Opus Capital Group (1996-2019); Director, Capvest Venture Fund, LP (May 2000-December 2011); Partner, Adena Ventures, LP (July 1999-December 2010); Director, The Victory Funds (February 2005-July 2008). | | | 87 | | | Director of Service Corporation International and Member, Audit Committee and Investment Committee; Director of Cincinnati Bell Inc. and Member, Audit Committee and Governance and Nominating Committee; Director of Northern Kentucky University Foundation and Member, Investment Committee; Member of Chase College of Law Transactional Law Practice Center Board of Advisors; Director of Chase College of Law Board of Visitors; formerly, Member, University of Cincinnati Foundation Investment Committee; Member, Miami University Board of Visitors (2008-2011); Trustee of Victory Funds (2005-2008) and Chairman, Investment Committee (2007-2008); Member, Service Provider Committee (2005-2008) and Director of Best Transport (2006-2019). | |
Dr. Manuel H. Johnson
c/o Johnson Smick
International, Inc.
220 I Street, NE — Suite 200 Washington, D.C. 20002
Birth Year 1949 | | Trustee | | Since
July
1991 | | Senior Partner, Johnson Smick International, Inc. (consulting firm); Chairperson of the Investment Committee (since October 2006) and Director or Trustee of various Morgan Stanley Funds (since July 1991); Co-Chairman and a founder of the Group of Seven Council (G7C) (international economic commission); formerly, Chairperson of the Audit Committee (July 1991-September 2006), Vice Chairman of the Board of Governors of the Federal Reserve System and Assistant Secretary of the U.S. Treasury. | | | 86 | | | Director of NVR, Inc. (home construction). | |
Joseph J. Kearns
c/o Perkins Coie LLP
Counsel to the Independent Trustees
1155 Avenue of the Americas, 22nd Floor
New York, NY 10036
Birth Year 1942 | | Trustee | | Since
August
1994 | | Senior Adviser, Kearns & Associates LLC (investment consulting); Chairperson of the Audit Committee (since October 2006) and Director or Trustee of various Morgan Stanley Funds (since August 1994); Director, Rubicorn Investments (since February 2019); formerly, Deputy Chairperson of the Audit Committee (July 2003-September 2006) and Chairperson of the Audit Committee of various Morgan Stanley Funds (since August 1994); CFO of the J. Paul Getty Trust (1982-1999). | | | 87 | | | Prior to August 10, 2016, Director of Electro Rent Corporation (equipment leasing); Prior to December 31, 2013, Director of The Ford Family Foundation. | |
40
Morgan Stanley Institutional Fund Trust
Annual Report — September 30, 2020
Trustee and Officer Information (unaudited) (cont'd)
Independent Trustees: (cont'd)
Name, Address and Birth Year
of Independent Trustee | | Position(s)
Held with
Registrant | | Length of Time
Served* | | Principal Occupation(s) During Past 5 Years
and Other Relevant Professional Experience | | Number of
Funds in
Fund Complex
Overseen by
Independent
Trustee** | | Other Directorships
Held by Independent
Trustee*** | |
Michael F. Klein
c/o Perkins Coie LLP
Counsel to the Independent Trustees
1155 Avenue of the Americas, 22nd Floor
New York, NY 10036
Birth Year 1958 | | Trustee | | Since
August
2006 | | Managing Director, Aetos Alternatives Management, LP (since March 2000); Co-President, Aetos Alternatives Management, LP (since January 2004) and Co-Chief Executive Officer of Aetos Alternatives Management, LP (since August 2013); Chairperson of the Fixed Income Sub-Committee of the Investment Committee (since October 2006) and Director or Trustee of various Morgan Stanley Funds (since August 2006); formerly, Managing Director, Morgan Stanley & Co. Inc. and Morgan Stanley Dean Witter Investment Management and President, various Morgan Stanley Funds (June 1998-March 2000); Principal, Morgan Stanley & Co. Inc. and Morgan Stanley Dean Witter Investment Management (August 1997-December 1999). | | | 86 | | | Director of certain investment funds managed or sponsored by Aetos Alternatives Management, LP; Director of Sanitized AG and Sanitized Marketing AG (specialty chemicals). | |
Patricia Maleski
c/o Perkins Coie LLP
Counsel to the Independent Trustees
1155 Avenue of the Americas, 22nd Floor
New York, NY 10036
Birth Year 1960 | | Trustee | | Since
January
2017 | | Managing Director, JPMorgan Asset Management (2004-2016); Oversight and Control Head of Fiduciary and Conflicts of Interest Program (2015-2016); Chief Control Officer-Global Asset Management (2013-2015); President, JPMorgan Funds (2010-2013); Chief Administrative Officer (2004-2013); various other positions including Treasurer and Board Liaison (since 2001). | | | 87 | | | None. | |
W. Allen Reed
c/o Perkins Coie LLP
Counsel to the Independent Trustees
1155 Avenue of the Americas, 22nd Floor
New York, NY 10036
Birth Year 1947 | | Chair of the Board and Trustee | | Chair of the Boards since August 2020 and Trustee since August 2006 | | Chair of the Boards of various Morgan Stanley Funds (since August 2020); Chairperson of the Governance Committee; Chairperson of the Equity Sub-Committee of the Investment Committee (since October 2006) and Director or Trustee of various Morgan Stanley Funds (since August 2006); formerly, Vice Chair of the Boards of various Morgan Stanley Funds (January 2020-August 2020); President and Chief Executive Officer of General Motors Asset Management; Chairman and Chief Executive Officer of the GM Trust Bank and Corporate Vice President of General Motors Corporation (August 1994-December 2005). | | | 86 | | | Formerly, Director of Legg Mason, Inc. (2006-2019); and Director of the Auburn University Foundation (2010-2015). | |
* This is the earliest date the Trustee began serving the Morgan Stanley Funds. Each Trustee serves an indefinite term, until his or her successor is elected.
** The Fund Complex includes (as of December 31, 2019) all open-end and closed-end funds (including all of their portfolios) advised by Morgan Stanley Investment Management Inc. (the "Adviser") and any funds that have an adviser that is an affiliated person of the Adviser (including, but not limited to, Morgan Stanley AIP GP LP).
*** This includes any directorships at public companies and registered investment companies held by the Trustee at any time during the past five years.
41
Morgan Stanley Institutional Fund Trust
Annual Report — September 30, 2020
Trustee and Officer Information (unaudited) (cont'd)
Executive Officers:
Name, Address and Birth Year
of Executive Officer | | Position(s) Held
with
Registrant | | Length of
Time Served* | | Principal Occupation(s) During Past 5 Years | |
John H. Gernon
522 Fifth Avenue
New York, NY 10036
Birth Year 1963 | | President and Principal Executive Officer | | Since September 2013 | | President and Principal Executive Officer of the Equity and Fixed Income Funds and the Morgan Stanley AIP Funds (since September 2013) and the Liquidity Funds and various money market funds (since May 2014) in the Fund Complex; Managing Director of the Adviser; Head of Public Markets Product Development (since 2006). | |
Timothy J. Knierim
522 Fifth Avenue
New York, NY 10036
Birth Year 1959 | | Chief Compliance Officer | | Since December 2016 | | Managing Director of the Adviser and various entities affiliated with the Adviser; Chief Compliance Officer of various Morgan Stanley Funds and the Adviser (since December 2016) and Chief Compliance Officer of Morgan Stanley AIP GP LP (since 2014). Formerly, Managing Director and Deputy Chief Compliance Officer of the Adviser (2014-2016); and formerly, Chief Compliance Officer of Prudential Investment Management, Inc. (2007-2014). | |
Francis J. Smith
522 Fifth Avenue
New York, NY 10036
Birth Year 1965 | | Treasurer and Principal Financial Officer | | Treasurer since July 2003 and Principal Financial Officer since September 2002 | | Managing Director of the Adviser and various entities affiliated with the Adviser; Treasurer (since July 2003) and Principal Financial Officer of various Morgan Stanley Funds (since September 2002). | |
Mary E. Mullin
522 Fifth Avenue
New York, NY 10036
Birth Year 1967 | | Secretary | | Since
June
1999 | | Managing Director of the Adviser; Secretary of various Morgan Stanley Funds (since June 1999). | |
Michael J. Key
522 Fifth Avenue
New York, NY 10036
Birth Year 1979 | | Vice President | | Since
June
2017 | | Vice President of the Equity and Fixed Income Funds, Liquidity Funds, various money market funds and the Morgan Stanley AIP Funds in the Fund Complex (since June 2017); Executive Director of the Adviser; Head of Product Development for Equity and Fixed Income Funds (since August 2013). | |
* This is the earliest date the officer began serving the Morgan Stanley Funds. Each officer serves a one-year term, until his or her successor is elected and qualifies.
42
Morgan Stanley Institutional Fund Trust
Annual Report — September 30, 2020
Adviser and Administrator
Morgan Stanley Investment Management Inc.
522 Fifth Avenue
New York, New York 10036
Distributor
Morgan Stanley Distribution, Inc.
522 Fifth Avenue
New York, New York 10036
Dividend Disbursing and Transfer Agent
DST Asset Manager Solutions, Inc.
2000 Crown Colony Drive
Quincy, Massachusetts 02169
Co-Transfer Agent
Morgan Stanley Services Company, Inc.
522 Fifth Avenue
New York, New York 10036
Custodian
State Street Bank and Trust Company
One Lincoln Street
Boston, Massachusetts 02111
Legal Counsel
Dechert LLP
1095 Avenue of the Americas
New York, New York 10036
Counsel to the Independent Trustees
Perkins Coie LLP
1155 Avenue of the Americas,
22nd Floor
New York, New York 10036
Independent Registered Public Accounting Firm
Ernst & Young LLP
200 Clarendon Street
Boston, Massachusetts 02116
Reporting to Shareholders
Each Morgan Stanley fund provides a complete schedule of portfolio holdings in its Semi-Annual and the Annual Reports within 60 days of the end of the fund's second and fourth fiscal quarters. The Semi-Annual and Annual Reports are filed electronically with the Securities and Exchange Commission ("SEC") on Form N-CSRS and Form N-CSR, respectively. Morgan Stanley also delivers the Semi-Annual and Annual Reports to fund shareholders and makes these reports available on its public website, www.morganstanley.com/im/shareholderreports. Each Morgan Stanley non-money market fund also files a complete schedule of portfolio holdings with the SEC for the fund's first and third fiscal quarters as an attachment to Form N-PORT. Morgan Stanley does not deliver the reports for the first and third fiscal quarters to shareholders, nor are the reports posted to the Morgan Stanley public website. However, the holdings for each money market fund are posted to the Morgan Stanley public website. You may obtain the Form N-PORT filings (as well as the Form N-CSR and N-CSRS filings) by accessing the SEC's website, www.sec.gov. You can also request copies of these materials, upon payment of a duplicating fee, by electronic request at the SEC's email address (publicinfo@sec.gov).
Proxy Voting Policies and Procedures and Proxy Voting Record
You may obtain a copy of the Trust's Proxy Voting Policy and Procedures and information regarding how the Trust voted proxies relating to portfolio securities during the most recent twelve-month period ended June 30, without charge, upon request, by calling toll free 1 (800) 548-7786 or by visiting our website at www.morganstanley.com/im/shareholderreports. This information is also available on the SEC's website at www.sec.gov.
This report is authorized for distribution only when preceded or accompanied by a prospectus or summary prospectus of the applicable Fund of Morgan Stanley Institutional Fund Trust, which describes in detail the Fund's investment policies, risks, fees and expenses. Please read the prospectus carefully before you invest or send money. For additional information, including information regarding the investments comprising the Fund, please visit our website at www.morganstanley.com/im/shareholderreports or call toll free 1 (800) 548-7786.
43
Printed in U.S.A.
This Report has been prepared for shareholders and may be distributed to others only if preceded or accompanied by a current prospectus.
Morgan Stanley Investment Management Inc.
522 Fifth Avenue
New York, New York 10036
© 2020 Morgan Stanley. Morgan Stanley Distribution, Inc.

IFTLDANN
3298830 EXP 11.30.21

Morgan Stanley Institutional Fund Trust
Strategic Income Portfolio
Annual Report
September 30, 2020
Beginning on January 1, 2021, as permitted by regulations adopted by the Securities and Exchange Commission ("SEC"), paper copies of the Fund's Annual and Semi-Annual Reports to Shareholders ("Shareholder Reports") will no longer be sent by mail, unless you specifically request paper copies of the Shareholder Reports from the Fund or from your financial intermediary, such as a broker-dealer or a bank. Instead, the Shareholder Reports will be made available on the Fund's website, https://www.morganstanley.com/im/shareholderreports and you will be notified by mail each time a Shareholder Report is posted and provided with a website link to access the Shareholder Report. If you already elected to receive Shareholder Reports electronically, you will not be affected by this change and you need not take any action. You may elect to receive Shareholder Reports and other communications from the Fund electronically anytime by contacting your financial intermediary or, if you are a direct investor, please follow the instructions on the envelope.
Beginning on January 1, 2019, you may elect to receive all future Shareholder Reports in paper free of charge. If you invest through a financial intermediary, you can contact your financial intermediary to request that you continue to receive paper copies of your Shareholder Reports. If you invest directly with the Fund, please follow the instructions on the envelope to let the Fund know you wish to continue receiving paper copies of your Shareholder Reports. Your election to receive Shareholder Reports in paper will apply to all funds held in your account if you invest through your financial intermediary or all funds held with the fund complex if you invest directly with a fund.

Morgan Stanley Institutional Fund Trust
Annual Report — September 30, 2020
Shareholders' Letter | | | 2 | | |
Expense Example | | | 3 | | |
Investment Overview | | | 4 | | |
Portfolio of Investments | | | 8 | | |
Statement of Assets and Liabilities | | | 14 | | |
Statement of Operations | | | 16 | | |
Statements of Changes in Net Assets | | | 17 | | |
Financial Highlights | | | 18 | | |
Notes to Financial Statements | | | 22 | | |
Report of Independent Registered Public Accounting Firm | | | 33 | | |
Investment Advisory Agreement Approval | | | 34 | | |
Liquidity Risk Management Program | | | 36 | | |
Privacy Notice | | | 37 | | |
Trustee and Officer Information | | | 39 | | |
This report is authorized for distribution only when preceded or accompanied by a prospectus or summary prospectus of the applicable Fund of the Morgan Stanley Institutional Fund Trust. To receive a prospectus and/or statement of additional information ("SAI"), which contains more complete information such as investment objectives, charges, expenses, policies for voting proxies, risk considerations and describes in detail each of the Fund's investment policies to the prospective investor, please call toll free 1 (800) 548-7786. Please read the prospectuses carefully before you invest or send money.
Additionally, you can access information about the Fund, including performance, characteristics and investment team commentary, through Morgan Stanley Investment Management's website: www.morganstanley.com/im/shareholderreports.
Market forecasts provided in this report may not necessarily come to pass. There is no guarantee that any sectors mentioned will continue to perform as discussed herein or that securities in such sectors will be held by the Fund in the future. There is no assurance that a fund will achieve its investment objective. Funds are subject to market risk, which is the possibility that market values of securities owned by the Fund will decline and, therefore, the value of the Fund's shares may be less than what you paid for them. Accordingly, you can lose money investing in this Fund. Please see the prospectus for more complete information on investment risks.
1
Morgan Stanley Institutional Fund Trust
Annual Report — September 30, 2020
Shareholders' Letter (unaudited)
Dear Shareholders,
We are pleased to provide this Annual Report, in which you will learn how your investment in Strategic Income Portfolio (the "Fund") performed during the latest twelve-month period.
Morgan Stanley Investment Management is a client-centric, investor-led organization. Our global presence, intellectual capital, and breadth of products and services enable us to partner with investors to meet the evolving challenges of today's financial markets. We aim to deliver superior investment service and to empower our clients to make the informed decisions that help them reach their investment goals.
As always, we thank you for selecting Morgan Stanley Investment Management, and look forward to working with you in the months and years ahead.
Sincerely,

John H. Gernon
President and Principal Executive Officer
October 2020
2
Morgan Stanley Institutional Fund Trust
Annual Report — September 30, 2020
Expense Example (unaudited)
Strategic Income Portfolio
As a shareholder of the Fund, you may incur two types of costs: (1) transactional costs, including sales charge (loads) on purchase payments; and (2) ongoing costs, which may include advisory fees, administration fees, distribution and shareholder services fees; and other Fund expenses. This example is intended to help you understand your ongoing costs (in dollars) of investing in the Fund and to compare these costs with the ongoing costs of investing in other mutual funds.
This example is based on an investment of $1,000 invested at the beginning of the six-month period ended September 30, 2020 and held for the entire six-month period.
Actual Expenses
The table below provides information about actual account values and actual expenses. You may use the information in this table, together with the amount you invested, to estimate the expenses that you paid over the period. Simply divide your account value by $1,000 (for example, an $8,600 account value divided by $1,000 = 8.6), then multiply the result by the number in the table under the heading entitled "Actual Expenses Paid During Period" to estimate the expenses you paid on your account during this period.
Hypothetical Example for Comparison Purposes
The table below provides information about hypothetical account values and hypothetical expenses based on the Fund's actual expense ratio and an assumed rate of return of 5% per year before expenses, which is not the Fund's actual return. The hypothetical account values and expenses may not be used to estimate the actual ending account balance or expenses you paid for the period. You may use this information to compare the ongoing costs of investing in the Fund and other funds. To do so, compare this 5% hypothetical example with the 5% hypothetical examples that appear in the shareholder reports of the other funds.
Please note that the expenses shown in the table are meant to highlight your ongoing costs only and do not reflect any transactional costs, such as sales charges (loads, if applicable). Therefore, the information for each class in the table is useful in comparing ongoing costs only, and will not help you determine the relative total costs of owning different funds. In addition, if these transactional costs were included, your costs would have been higher.
| | | Beginning
Account
Value
4/1/20 | | Actual Ending
Account
Value
9/30/20 | | Hypothetical
Ending Account
Value | | Actual
Expenses
Paid
During
Period* | | Hypothetical
Expenses Paid
During Period* | | Net
Expense
Ratio
During
Period** | |
Strategic Income Portfolio Class I | | $ | 1,000.00 | | | $ | 1,134.10 | | | $ | 1,022.05 | | | $ | 3.15 | | | $ | 2.98 | | | | 0.59 | % | |
Strategic Income Portfolio Class A | | | 1,000.00 | | | | 1,132.10 | | | | 1,020.25 | | | | 5.06 | | | | 4.80 | | | | 0.95 | | |
Strategic Income Portfolio Class C | | | 1,000.00 | | | | 1,127.40 | | | | 1,016.50 | | | | 9.04 | | | | 8.57 | | | | 1.70 | | |
Strategic Income Portfolio Class IS | | | 1,000.00 | | | | 1,132.90 | | | | 1,022.15 | | | | 3.04 | | | | 2.88 | | | | 0.57 | | |
* Expenses are calculated using each Fund Class' annualized net expense ratio (as disclosed), multiplied by the average account value over the period and multiplied by 183/366 (to reflect the most recent one-half year period).
** Annualized.
3
Morgan Stanley Institutional Fund Trust
Annual Report — September 30, 2020
Investment Overview (unaudited)
Strategic Income Portfolio
The Fund seeks to maximize current income consistent with the preservation of capital.
Performance
For the fiscal year ended September 30, 2020, the Fund's Class I shares had a total return based on net asset value and reinvestment of distributions per share of 0.98%, net of fees. The Fund's Class I shares underperformed against the Fund's benchmark, the Bloomberg Barclays U.S. Aggregate Index, which returned 6.98%. Effective October 1, 2019, the Fund's primary benchmark changed to Bloomberg Barclays U.S. Aggregate Index because the Adviser believes the Bloomberg Barclays U.S. Aggregate Index is a more appropriate benchmark for the Fund's new investment objective and principal investment strategies also effective as of that date.i
Factors Affecting Performance
• The positive total return was driven by macro decisions, notably the long duration position in the U.S. Over the past year, the Fund has held a positive duration between 2.2 and 3.1 years, which helped in February and March 2020 when the 10-year U.S. Treasury yield fell 120 basis points (bps). Since then, Treasury rates have remained relatively range-bound between 60 and 80 bps.
• We expect rates to stay low, especially in the front end of the yield curve, for quite some time. In August 2020, the Federal Reserve (Fed) made the unprecedented, but widely expected, decision to revise its inflation strategy to achieve 2% inflation over time by allowing for intentional overshoots of the 2% target — called "flexible average inflation targeting." This revised framework implies that the Fed will not raise interest rates against a tight labor market without significant evidence of inflation.
• The largest detractors from performance were the allocation to securitized credit, as well as the high yield and investment grade corporate bond exposure.
• The allocation to securitized credit is composed of non-agency residential mortgage-backed securities (RMBS), asset-backed securities (ABS) and
commercial mortgage-backed securities (CMBS), with a bias to own housing credit. While this allocation has been the Fund's best performer over the past couple of months, the losses from the first quarter of 2020, when the pandemic led to a significant widening in risk assets, have not been fully recouped. The housing market has been resilient during the pandemic. As of September 30, 2020, the mortgage delinquency rate is at roughly 17%, well below the rate we saw in the 2008 financial crisis.ii
• We have slowly reduced securitized credit risk, as spreads have recovered significantly but conditions have not substantially improved.
• The allocation to high yield and investment grade corporate bonds shows a similar story. Although spreads have tightened significantly following the significant widening in the first quarter of 2020, the allocation has still not recouped the losses.
Management Strategies
• Global growth is expected to contract in 2020 as COVID-19 has resulted in deep recessions across economies globally. The pace of the economic recovery appears to be slowing, as the support from pent-up demand fades and economies have to deal with renewed lockdowns as infection rates start to increase once again. While economic data in general continues to be better than expected, it seems unlikely that the current pace of upside surprises can be sustained. Many of the geopolitical risks that have troubled investors in the past — U.S.-China tensions, deadlock over renewed U.S. fiscal stimulus measures, Brexit, tensions between Russia and Europe — persist.
• Corporate credit spreads have largely recovered to pre-pandemic levels as a result of the Fed's purchases of high yield and investment grade corporate exchange-traded funds. However, this good news is increasingly factored into prices, with credit spreads at, or below, their long-term averages in spite of the still challenging economic outlook, therefore offering investors yield advantage but limited capital gain potential. We remain long
i Effective October 1, 2019, the Fund's investment objective changed to: "The Fund seeks to maximize current income consistent with the preservation of capital." In addition, effective as of the same date, the Fund's investment process, which currently incorporates information about ESG issues via an integrated approach within the portfolio management team's fundamental
investment analysis framework, transitioned to an investment process that utilizes ESG factors as fundamental drivers of credit risk and, in turn, a bond's return. Please refer to the Fund's prospectus dated January 28, 2020 for additional information.
ii Source: Morgan Stanley Research
4
Morgan Stanley Institutional Fund Trust
Annual Report — September 30, 2020
Investment Overview (unaudited) (cont'd)
Strategic Income Portfolio
credit risk, as our base case reflects the consensus view that COVID-19 is transitory and monetary policy will remain credit risk friendly, likely driving spreads tighter in the medium term. The strong market rally experienced over recent months makes positioning sensitive to valuations and technicals of supply and demand. Within high yield corporate debt, we expect to see a meaningful increase in overall defaults in the coming year due to a significantly weaker economy stemming from the outbreak, as well as stress in the energy sector. However, with a significant reduction in default activity over the last two months and a far quicker recovery from the COVID-19 shock than initially anticipated, we expect default rates to be a more muted 6% to 8%, as opposed to the 10% to 12% initially forecasted. While we remain cautiously optimistic that developments could lead to even tighter spreads by year-end or in 2021, we expect some near-term volatility as we approach the November election.
• In the securitized assets sector, we remain cautiously optimistic as U.S. economic conditions remain weak, with jobless claims exceeding 60 million since March 2020 and COVID-19 infection rates continue to surge throughout the U.S. and Europe.iii While positive developments on potential vaccines and treatments continue to be made, with several vaccines undergoing large-scale third-stage trials, realistically, any vaccine-related recovery likely remains a 2021 potential event.
• U.S. non-agency mortgage-backed securities (MBS) valuations are mixed; newly originated, or 2.0 non-agency MBS, look expensive at current valuations, but attractive opportunities exist in legacy non-agency RMBS, non-performing loans and other non-traditional RMBS. We expect the U.S. housing market to remain stable and non-agency RMBS to continue to perform relatively well from a credit perspective in the fourth quarter of 2020.
• U.S. ABS such as auto loans, credit cards and consumer loans have performed reasonably well during the pandemic. In fact, some securities, such as prime auto loans, have fully recovered to January 2020 levels. We have taken profits on those positions. The bonds' fundamentals look strong, but risks are higher, and we believe spreads should reflect that.
• CMBS backed by hotels, retail shopping centers and aircraft ABS continue to lag behind sectors less impacted by the pandemic. Our largest allocation within CMBS is to multi-family housing and apartments. Single-family rentals are nearly back to pre-pandemic levels, and there is continued demand from people moving out of cities to the suburbs.
• We remain cautiously constructive on emerging markets debt in the near term on the back of loose monetary policy in the developed world, recently boosted by the Fed's new strategy of average inflation targeting. We believe lower real yields in the U.S. and the resulting weaker dollar should be supportive of emerging markets fixed income, particularly in the high yield segment and currencies. Positive headlines on new vaccines and treatments for COVID-19 could also lift sentiment further. However, several macro risks persist such as heightened U.S.-China tensions (trade and technology issues/geopolitics), which are inflamed by the proximity of U.S. elections, and geopolitical conflicts elsewhere (India-China, potential sanctions against Russia/Belarus) weighing on risk sentiment.
iii Source: U.S. Department of Labor
5
Morgan Stanley Institutional Fund Trust
Annual Report — September 30, 2020
Investment Overview (unaudited) (cont'd)
Strategic Income Portfolio

* Minimum Investment
** Commenced operations on December 30, 2014.
In accordance with SEC regulations, the Fund's performance shown assumes that all recurring fees (including management fees) were deducted and all dividends and distributions were reinvested. The performance of Class A, Class C and Class IS shares will vary from the performance of Class I shares based upon their different inception dates and will be negatively impacted by additional fees assessed to those classes (where applicable).
Performance Compared to the Bloomberg Barclays U.S. Aggregate Index(1), the Strategic Income Blended Index(2) and the Lipper Alternative Credit Focus Funds Index(3)
| | | Period Ended September 30, 2020
Total Returns(4) | |
| | | | | Average Annual | |
| | | One
Year | | Five
Years | | Ten
Years | | Since
Inception(7) | |
Fund — Class I Shares
w/o sales charges(5) | | | 0.98 | % | | | 3.70 | % | | | — | | | | 2.96 | % | |
Fund — Class A Shares
w/o sales charges(5) | | | 0.62 | | | | 3.33 | | | | — | | | | 2.61 | | |
Fund — Class A Shares
with maximum 3.25%
sales charges(5) | | | –2.66 | | | | 2.64 | | | | — | | | | 2.01 | | |
Fund — Class C Shares
w/o sales charges(6) | | | –0.13 | | | | 2.58 | | | | — | | | | 1.86 | | |
Fund — Class C Shares
with maximum 1.00% deferred
sales charges(6) | | | –1.11 | | | | 2.58 | | | | — | | | | 1.86 | | |
Fund — Class IS Shares
w/o sales charges(5) | | | 0.89 | | | | 3.75 | | | | — | | | | 3.01 | | |
Bloomberg Barclays U.S.
Aggregate Index | | | 6.98 | | | | 4.18 | | | | — | | | | 3.84 | | |
Strategic Income Blended Index | | | 6.82 | | | | 2.32 | | | | — | | | | 2.02 | | |
Lipper Alternative Credit Focus
Funds Index | | | 0.47 | | | | 2.64 | | | | — | | | | 2.04 | | |
Performance data quoted represents past performance, which is no guarantee of future results, and current performance may be lower or higher than the figures shown. Performance assumes that all dividends and distributions, if any, were reinvested. For the most recent month-end performance figures, please visit www.morganstanley.com/im/shareholderreports. Investment returns and principal value will fluctuate so that Fund shares, when redeemed, may be worth more or less than their original cost. Total returns do not reflect the deduction of taxes that a shareholder would pay on Fund distributions or the redemption of Fund shares. Performance of share classes will vary due to differences in sales charges and expenses.
(1) The Bloomberg Barclays U.S. Aggregate Index tracks the performance of U.S. government agency and Treasury securities, investment-grade corporate debt securities, agency mortgage-backed securities, asset-backed securities and commercial mortgage-backed securities. The Index is unmanaged and its returns do not include any sales charges or fees. Such costs would lower performance. It is not possible to invest directly in an index.
(2) The Strategic Income Blended Index is a performance linked benchmark of the old and new benchmark of the Fund. The old benchmark represented by ICE BofA 3-Month U.S. Treasury Bill Index (benchmark that tracks the performance of U.S. Treasury bills with a remaining maturity of three months) from Fund's inception to September 30, 2019 and the new benchmark represented by Bloomberg Barclays U.S. Aggregate Index for periods thereafter. The Index is unmanaged and its returns do not include any sales charges or fees. Such costs would lower performance. It is not possible to invest directly in an index.
6
Morgan Stanley Institutional Fund Trust
Annual Report — September 30, 2020
Investment Overview (unaudited) (cont'd)
Strategic Income Portfolio
(3) The Lipper Alternative Credit Focus Funds Index is an equally weighted performance index of the largest qualifying funds (based on net assets) in the Lipper Alternative Credit Focus Funds classification. The Index, which is adjusted for capital gains distributions and income dividends, is unmanaged and should not be considered an investment. There are currently 30 funds represented in this Index. As of the date of this report, the Fund was in the Lipper Alternative Credit Focus Funds classification.
(4) Total returns for the Fund reflect expenses waived and/or reimbursed, if applicable, by the Adviser. Without such waivers and/or reimbursements, total returns would have been lower.
(5) Commenced operations on December 30, 2014.
(6) Commenced offering on April 30, 2015.
(7) For comparative purposes, average annual since inception returns listed for the Indexes refer to the inception date of Class I of the Fund, not the inception of the Indexes.
7
Morgan Stanley Institutional Fund Trust
Annual Report — September 30, 2020
Portfolio of Investments
Strategic Income Portfolio
| | | Face
Amount
(000) | | Value
(000) | |
Fixed Income Securities (97.6%) | |
Asset-Backed Securities (31.7%) | |
Aegis Asset Backed Securities Trust Mortgage
Pass-Through Certificates, | |
1 Month USD LIBOR + 1.73%, 1.87%,
10/25/34 (a) | | $ | 39 | | | $ | 38 | | |
American Homes 4 Rent Trust, | |
5.64%, 4/17/52 (b) | | | 100 | | | | 111 | | |
Ameriquest Mortgage Securities, Inc., | |
1 Month USD LIBOR + 2.10%, 2.25%,
5/25/34 (a) | | | 222 | | | | 224 | | |
AMSR Trust, | |
3.87%, 1/19/39 (a)(b) | | | 200 | | | | 201 | | |
Bayview Financial Revolving Asset Trust, | |
1 Month USD LIBOR + 0.93%, 1.07%,
2/28/40 (a)(b) | | | 116 | | | | 109 | | |
BCMSC Trust, | |
7.51%, 1/15/29 (a) | | | 123 | | | | 118 | | |
Cascade Funding Mortgage Trust, | |
3.40%, 4/25/30 (a)(b) | | | 83 | | | | 84 | | |
4.49%, 12/25/29 (a)(b) | | | 205 | | | | 163 | | |
| CFMT 2020-HB3 LLC, | |
4.08%, 5/25/30 (a)(b) | | | 200 | | | | 202 | | |
Chase Funding Loan Acquisition Trust, | |
5.50%, 8/25/34 | | | 29 | | | | 30 | | |
Conn's Receivables Funding LLC, | |
3.62%, 6/17/24 (b) | | | 100 | | | | 99 | | |
4.60%, 6/17/24 (b) | | | 400 | | | | 393 | | |
Consumer Loan Underlying Bond
Credit Trust, | |
3.48%, 12/15/26 (b) | | | 100 | | | | 101 | | |
Credit-Based Asset Servicing &
Securitization LLC, | |
1 Month USD LIBOR + 0.75%, 0.90%,
2/25/33 (a) | | | 59 | | | | 57 | | |
1 Month USD LIBOR + 1.46%, 1.60%,
5/25/32 (a) | | | 33 | | | | 34 | | |
DT Auto Owner Trust, | |
5.33%, 11/17/25 (b) | | | 100 | | | | 104 | | |
ECAF I Ltd., | |
4.95%, 6/15/40 (b) | | | 235 | | | | 211 | | |
EquiFirst Mortgage Loan Trust, | |
1 Month USD LIBOR + 2.18%, 2.32%,
10/25/34 (a) | | | 44 | | | | 45 | | |
European Residential Loan Securitisation, | |
1 Month EURIBOR + 2.00%, 1.47%,
7/24/54 (a) | | EUR | 232 | | | | 245 | | |
Falcon Aerospace Ltd., | |
3.60%, 9/15/39 (b) | | $ | 200 | | | | 185 | | |
Finance of America HECM Buyout, | |
2.72%, 2/25/30 (a)(b) | | | 200 | | | | 182 | | |
3.09%, 7/25/30 (a)(b) | | | 100 | | | | 101 | | |
3.50%, 12/27/49 (b) | | | 200 | | | | 202 | | |
| | | Face
Amount
(000) | | Value
(000) | |
Financial Asset Securities Corp., | |
1 Month USD LIBOR + 0.38%, 0.53%,
2/27/35 (a)(b) | | $ | 19 | | | $ | 18 | | |
FREED ABS Trust, | |
3.19%, 11/18/26 (b) | | | 100 | | | | 99 | | |
Goodgreen Trust, | |
2.63%, 4/15/55 (b) | | | 200 | | | | 202 | | |
GSAA Home Equity Trust, | |
6.00%, 11/25/36 | | | 23 | | | | 13 | | |
GSAMP Trust, | |
1 Month USD LIBOR + 0.32%, 0.47%,
3/25/46 (a) | | | 100 | | | | 98 | | |
Home Partners of America Trust, | |
1 Month USD LIBOR + 2.65%, 2.80%,
7/17/34 (a)(b) | | | 100 | | | | 101 | | |
3.60%, 9/17/39 (b) | | | 96 | | | | 93 | | |
Invitation Homes Trust, | |
1 Month USD LIBOR + 2.20%, 2.35%,
1/17/38 (a)(b) | | | 252 | | | | 252 | | |
Loanpal Solar Loan 2020-2 Ltd., | |
2.75%, 7/20/47 (b) | | | 194 | | | | 199 | | |
MACH 1 Cayman Ltd., | |
3.47%, 10/15/39 (b) | | | 232 | | | | 213 | | |
MFA LLC, | |
4.16%, 7/25/48 (b) | | | 110 | | | | 110 | | |
Mosaic Solar Loan Trust, | |
2.10%, 4/20/46 (b) | | | 190 | | | | 195 | | |
Nationstar Home Equity Loan Trust, | |
1 Month USD LIBOR + 0.25%, 0.40%,
4/25/37 (a) | | | 8 | | | | 8 | | |
Newday Funding PLC, | |
1 Month GBP LIBOR + 2.40%, 2.46%,
9/15/27 (a)(b) | | GBP | 100 | | | | 126 | | |
Newtek Small Business Loan Trust, | |
1 Month USD LIBOR + 1.70%, 1.85%,
2/25/44 (a)(b) | | $ | 141 | | | | 138 | | |
NRZ Excess Spread-Collateralized Notes, | |
5.44%, 6/25/25 (b) | | | 92 | | | | 93 | | |
OnDeck Asset Securitization Trust II LLC, | |
3.14%, 11/18/24 (b) | | | 200 | | | | 190 | | |
Ownit Mortgage Loan Trust, | |
1 Month USD LIBOR + 0.27%, 0.42%,
3/25/37 (a) | | | 47 | | | | 46 | | |
PNMAC GMSR Issuer Trust, | |
1 Month USD LIBOR + 2.65%, 2.80%,
8/25/25 (a)(b) | | | 200 | | | | 193 | | |
1 Month USD LIBOR + 2.85%, 3.00%,
2/25/23 (a)(b) | | | 250 | | | | 246 | | |
Progress Residential Trust, | |
3.68%, 10/17/36 (b) | | | 200 | | | | 205 | | |
4.38%, 3/17/35 (b) | | | 100 | | | | 102 | | |
Prosper Marketplace Issuance Trust, | |
5.50%, 10/15/24 (b) | | | 100 | | | | 99 | | |
The accompanying notes are an integral part of the financial statements.
8
Morgan Stanley Institutional Fund Trust
Annual Report — September 30, 2020
Portfolio of Investments (cont'd)
Strategic Income Portfolio
| | | Face
Amount
(000) | | Value
(000) | |
Asset-Backed Securities (cont'd) | |
ReadyCap Lending Small Business
Loan Trust, | |
Daily U.S. Prime Rate –0.50%, 2.75%,
12/27/44 (a)(b) | | $ | 83 | | | $ | 77 | | |
Republic FInance Issuance Trust, | |
3.93%, 11/22/27 (b) | | | 100 | | | | 99 | | |
SFS Asset Securitization LLC, | |
4.24%, 6/10/25 (b) | | | 153 | | | | 153 | | |
Skopos Auto Receivables Trust, | |
3.63%, 9/16/24 (b) | | | 100 | | | | 102 | | |
SLM Student Loan Trust, | |
3 Month EURIBOR + 0.55%, 0.10%,
1/25/40 (a) | | EUR | 300 | | | | 313 | | |
Small Business Origination Loan Trust, | |
3.85%, 12/15/27 (a) | | GBP | 72 | | | | 51 | | |
Sprite Ltd., | |
4.25%, 12/15/37 (b) | | $ | 161 | | | | 147 | | |
Stanwich Mortgage Loan Trust, | |
3.48%, 11/16/24 (b) | | | 209 | | | | 208 | | |
START Ireland, | |
4.09%, 3/15/44 (b) | | | 165 | | | | 155 | | |
Tricon American Homes Trust, | |
5.10%, 1/17/36 (b) | | | 200 | | | | 208 | | |
5.77%, 11/17/33 (b) | | | 200 | | | | 199 | | |
Truman Capital Mortgage Loan Trust, | |
1 Month USD LIBOR + 2.55%, 2.70%,
1/25/34 (a)(b) | | | 33 | | | | 33 | | |
1 Month USD LIBOR + 2.78%, 2.95%,
11/25/31 (a)(b) | | | 36 | | | | 35 | | |
Upgrade Receivables Trust, | |
3.51%, 10/15/25 (b) | | | 100 | | | | 101 | | |
VCAT LLC, | |
3.57%, 11/25/49 (a)(b) | | | 83 | | | | 83 | | |
| | | | 8,242 | | |
Collateralized Mortgage Obligation — Agency Collateral Series (0.0%) | |
Government National Mortgage Association, IO | |
0.77%, 8/20/58 (a) | | | 306 | | | | 7 | | |
Commercial Mortgage-Backed Securities (4.8%) | |
BX Trust, | |
1 Month USD LIBOR + 3.15%, 3.30%,
7/15/34 (a)(b) | | | 85 | | | | 84 | | |
GS Mortgage Securities Corp. Trust, | |
1 Month USD LIBOR + 2.20%, 2.35%,
10/15/36 (a)(b) | | | 100 | | | | 92 | | |
GS Mortgage Securities Trust, | |
4.47%, 2/10/48 (a)(b) | | | 100 | | | | 85 | | |
4.85%, 6/10/47 (a) | | | 50 | | | | 49 | | |
MFT Trust, | |
3.39%, 8/10/40 (a)(b) | | | 180 | | | | 181 | | |
3.48%, 2/10/42 (a)(b) | | | 250 | | | | 233 | | |
MKT 2020-525M Mortgage Trust, | |
2.94%, 2/12/40 (a)(b) | | | 250 | | | | 227 | | |
| | | Face
Amount
(000) | | Value
(000) | |
Multifamily Connecticut Avenue Securities Trust, | |
1 Month USD LIBOR + 1.70%, 1.85%,
10/15/49 (a)(b) | | $ | 95 | | | $ | 91 | | |
Natixis Commercial Mortgage Securities Trust, | |
4.30%, 10/15/36 (b) | | | 150 | | | | 141 | | |
Wells Fargo Commercial Mortgage Trust, | |
4.28%, 5/15/48 (a) | | | 75 | | | | 71 | | |
| | | | 1,254 | | |
Corporate Bonds (43.4%) | |
Communications (0.2%) | |
TEGNA, Inc., | |
4.63%, 3/15/28 (b) | | | 45 | | | | 44 | | |
Finance (23.3%) | |
ABN Amro Bank N.V., | |
4.75%, 7/28/25 (b) | | | 200 | | | | 226 | | |
Aon Corp., | |
2.20%, 11/15/22 | | | 50 | | | | 52 | | |
Avolon Holdings Funding Ltd., | |
2.88%, 2/15/25 (b) | | | 50 | | | | 46 | | |
Bank of America Corp., | |
2.46%, 10/22/25 | | | 250 | | | | 264 | | |
4.25%, 10/22/26 | | | 350 | | | | 406 | | |
Barclays PLC, | |
2.85%, 5/7/26 | | | 200 | | | | 208 | | |
Belrose Funding Trust, | |
2.33%, 8/15/30 (b) | | | 125 | | | | 124 | | |
BNP Paribas SA, | |
1.13%, 6/11/26 | | EUR | 100 | | | | 122 | | |
Brown & Brown, Inc., | |
2.38%, 3/15/31 | | $ | 75 | | | | 76 | | |
4.20%, 9/15/24 | | | 50 | | | | 55 | | |
Citigroup, Inc., | |
1.68%, 5/15/24 | | | 250 | | | | 256 | | |
5.50%, 9/13/25 | | | 325 | | | | 386 | | |
CNO Financial Group, Inc., | |
5.25%, 5/30/29 | | | 125 | | | | 145 | | |
Cooperatieve Rabobank UA, | |
2.50%, 5/26/26 | | EUR | 100 | | | | 119 | | |
Credit Agricole SA, | |
1.38%, 3/13/25 | | | 100 | | | | 123 | | |
Crown Castle International Corp., | |
3.30%, 7/1/30 | | | 25 | | | | 27 | | |
CyrusOne LP/CyrusOne Finance Corp., | |
2.90%, 11/15/24 | | $ | 25 | | | | 26 | | |
DBS Group Holdings Ltd., | |
1.50%, 4/11/28 | | EUR | 100 | | | | 119 | | |
Deutsche Bank AG, | |
3.15%, 1/22/21 | | $ | 100 | | | | 101 | | |
Discover Financial Services, | |
3.95%, 11/6/24 | | | 25 | | | | 27 | | |
Equitable Holdings, Inc., | |
3.90%, 4/20/23 | | | 250 | | | | 269 | | |
The accompanying notes are an integral part of the financial statements.
9
Morgan Stanley Institutional Fund Trust
Annual Report — September 30, 2020
Portfolio of Investments (cont'd)
Strategic Income Portfolio
| | | Face
Amount
(000) | | Value
(000) | |
Finance (cont'd) | |
ERP Operating LP, | |
4.15%, 12/1/28 | | $ | 100 | | | $ | 119 | | |
Goldman Sachs Group, Inc. (The), | |
2.00%, 11/1/28 | | EUR | 100 | | | | 130 | | |
4.25%, 10/21/25 | | $ | 125 | | | | 142 | | |
Intesa Sanpaolo SpA, | |
6.50%, 2/24/21 (b) | | | 125 | | | | 128 | | |
Iron Mountain, Inc., | |
4.88%, 9/15/29 (b) | | | 75 | | | | 76 | | |
Itau Unibanco Holding SA, | |
2.90%, 1/24/23 (b) | | | 250 | | | | 253 | | |
Kimco Realty Corp., | |
2.70%, 10/1/30 | | | 125 | | | | 127 | | |
LeasePlan Corp., | |
2.88%, 10/24/24 (b) | | | 200 | | | | 207 | | |
Macquarie Bank Ltd., | |
2.10%, 10/17/22 (b) | | | 150 | | | | 155 | | |
Metropolitan Life Global Funding I, | |
0.95%, 7/2/25 (b) | | | 150 | | | | 151 | | |
PNC Financial Services Group, Inc. (The), | |
2.20%, 11/1/24 | | | 225 | | | | 238 | | |
Post Holdings, Inc., | |
5.50%, 12/15/29 (b) | | | 25 | | | | 27 | | |
Prologis LP, | |
1.25%, 10/15/30 | | | 150 | | | | 147 | | |
Shinhan Financial Group Co. Ltd., | |
1.35%, 1/10/26 (b) | | | 200 | | | | 200 | | |
SVB Financial Group, | |
3.13%, 6/5/30 | | | 50 | | | | 56 | | |
Synchrony Financial, | |
4.25%, 8/15/24 | | | 250 | | | | 272 | | |
Transurban Finance Co. Pty Ltd., | |
2.45%, 3/16/31 (b) | | | 100 | | | | 102 | | |
USAA Capital Corp., | |
1.50%, 5/1/23 (b) | | | 150 | | | | 154 | | |
Visa, Inc., | |
0.75%, 8/15/27 | | | 75 | | | | 75 | | |
Vonovia Finance BV, | |
4.00%, 12/17/21 (c) | | EUR | 100 | | | | 122 | | |
| | | | 6,058 | | |
Industrials (18.3%) | |
AbbVie, Inc., | |
2.95%, 11/21/26 (b) | | $ | 175 | | | | 191 | | |
3.60%, 5/14/25 | | | 125 | | | | 139 | | |
Albertsons Cos., Inc./Safeway, Inc./
New Albertson's, Inc./Albertson's LLC, | |
5.75%, 3/15/25 | | | 20 | | | | 21 | | |
Alphabet, Inc., | |
1.10%, 8/15/30 | | | 125 | | | | 125 | | |
American Axle & Manufacturing, Inc., | |
6.50%, 4/1/27 | | | 75 | | | | 73 | | |
Aviation Capital Group LLC, | |
4.38%, 1/30/24 (b) | | | 250 | | | | 249 | | |
| | | Face
Amount
(000) | | Value
(000) | |
Avis Budget Car Rental LLC/Avis Budget
Finance, Inc., | |
5.75%, 7/15/27 (b) | | $ | 49 | | | $ | 44 | | |
Berry Global, Inc., | |
4.50%, 2/15/26 (b) | | | 25 | | | | 25 | | |
Boyd Gaming Corp., | |
4.75%, 12/1/27 | | | 40 | | | | 39 | | |
CSX Corp., | |
2.40%, 2/15/30 | | | 75 | | | | 81 | | |
Diamond Sports Group LLC/Diamond Sports
Finance Co., | |
6.63%, 8/15/27 (b) | | | 75 | | | | 39 | | |
Ford Motor Credit Co., LLC, | |
3.10%, 5/4/23 | | | 200 | | | | 196 | | |
Garda World Security Corp., | |
9.50%, 11/1/27 (b) | | | 50 | | | | 53 | | |
Global Partners LP/GLP Finance Corp., | |
7.00%, 6/15/23 - 8/1/27 | | | 75 | | | | 77 | | |
Grifols SA, | |
2.25%, 11/15/27 (b) | | EUR | 100 | | | | 117 | | |
Grinding Media, Inc./Moly-Cop AltaSteel Ltd., | |
7.38%, 12/15/23 (b) | | $ | 75 | | | | 76 | | |
Hanesbrands, Inc., | |
4.88%, 5/15/26 (b) | | | 75 | | | | 80 | | |
HCA, Inc., | |
4.13%, 6/15/29 | | | 125 | | | | 141 | | |
Hudbay Minerals, Inc., | |
7.63%, 1/15/25 (b) | | | 75 | | | | 76 | | |
Johnson Controls International plc/Tyco Fire &
Security Finance SCA, | |
1.75%, 9/15/30 | | | 50 | | | | 50 | | |
Koppers, Inc., | |
6.00%, 2/15/25 (b) | | | 75 | | | | 76 | | |
Level 3 Financing, Inc., | |
3.40%, 3/1/27 (b) | | | 225 | | | | 243 | | |
Lions Gate Capital Holdings LLC, | |
5.88%, 11/1/24 (b) | | | 25 | | | | 25 | | |
Mauser Packaging Solutions Holding Co., | |
7.25%, 4/15/25 (b) | | | 25 | | | | 24 | | |
MDC Partners, Inc., | |
6.50%, 5/1/24 (b) | | | 75 | | | | 69 | | |
Mosaic Co. (The), | |
4.25%, 11/15/23 | | | 125 | | | | 136 | | |
Navistar International Corp., | |
6.63%, 11/1/25 (b) | | | 75 | | | | 77 | | |
NortonLifeLock, Inc., | |
5.00%, 4/15/25 (b) | | | 75 | | | | 77 | | |
NXP BV/NXP Funding LLC/NXP USA, Inc., | |
3.40%, 5/1/30 (b) | | | 125 | | | | 137 | | |
Oceaneering International, Inc., | |
6.00%, 2/1/28 | | | 75 | | | | 47 | | |
Q-Park Holding I BV, | |
1.50%, 3/1/25 (b) | | EUR | 100 | | | | 107 | | |
The accompanying notes are an integral part of the financial statements.
10
Morgan Stanley Institutional Fund Trust
Annual Report — September 30, 2020
Portfolio of Investments (cont'd)
Strategic Income Portfolio
| | | Face
Amount
(000) | | Value
(000) | |
Industrials (cont'd) | |
Rockies Express Pipeline LLC, | |
3.60%, 5/15/25 (b) | | $ | 75 | | | $ | 74 | | |
Royalty Pharma PLC, | |
1.20%, 9/2/25 (b) | | | 125 | | | | 125 | | |
Sabine Pass Liquefaction LLC, | |
4.20%, 3/15/28 | | | 130 | | | | 141 | | |
Sally Holdings LLC/Sally Capital, Inc., | |
5.63%, 12/1/25 | | | 75 | | | | 76 | | |
Select Medical Corp., | |
6.25%, 8/15/26 (b) | | | 75 | | | | 78 | | |
Silgan Holdings, Inc., | |
2.25%, 6/1/28 | | EUR | 100 | | | | 115 | | |
Sotheby's, | |
7.38%, 10/15/27 (b) | | | 200 | | | | 200 | | |
Sprint Spectrum Co., LLC/Sprint Spectrum Co.,
II LLC/Sprint Spectrum Co., III LLC, | |
4.74%, 9/20/29 (b) | | | 200 | | | | 217 | | |
Standard Industries, Inc., | |
2.25%, 11/21/26 (b) | | EUR | 100 | | | | 112 | | |
Thermo Fisher Scientific, Inc., | |
4.13%, 3/25/25 | | $ | 325 | | | | 370 | | |
Verizon Communications, Inc., | |
3.88%, 2/8/29 | | | 200 | | | | 237 | | |
Western Midstream Operating LP, | |
4.10%, 2/1/25 | | | 75 | | | | 72 | | |
Wolverine World Wide, Inc., | |
5.00%, 9/1/26 (b) | | | 25 | | | | 25 | | |
| | | | 4,752 | | |
Utilities (1.6%) | |
Greenko Investment Co., | |
4.88%, 8/16/23 | | | 200 | | | | 200 | | |
Liberty Utilities Finance GP 1, | |
2.05%, 9/15/30 (b) | | | 100 | | | | 99 | | |
ONEOK, Inc., | |
3.40%, 9/1/29 | | | 125 | | | | 123 | | |
| | | | 422 | | |
| | | | 11,276 | | |
Mortgages — Other (13.3%) | |
Alba PLC, | |
3 Month GBP LIBOR + 0.50%, 0.55%,
3/17/39 (a) | | GBP | 33 | | | | 38 | | |
Alternative Loan Trust, | |
4.15%, 3/25/35 (a) | | $ | 23 | | | | 23 | | |
5.75%, 3/25/34 | | | 32 | | | | 32 | | |
PAC | |
1 Month USD LIBOR + 0.45%, 0.60%,
10/25/36 (a) | | | 37 | | | | 16 | | |
Banc of America Alternative Loan Trust, | |
5.71%, 10/25/36 (a) | | | 69 | | | | 31 | | |
Banc of America Mortgage Trust, | |
3.21%, 6/25/35 (a) | | | 110 | | | | 107 | | |
4.37%, 3/25/33 (a) | | | 20 | | | | 19 | | |
| | | Face
Amount
(000) | | Value
(000) | |
Bear Stearns ARM Trust, | |
2.77%, 8/25/33 (a) | | $ | 118 | | | $ | 117 | | |
3.25%, 2/25/36 (a) | | | 26 | | | | 25 | | |
Bear Stearns Trust, | |
3.06%, 4/25/35 (a) | | | 27 | | | | 22 | | |
Cascade Funding Mortgage Trust, | |
2.80%, 6/25/69 (a)(b) | | | 173 | | | | 174 | | |
4.00%, 10/25/68 (a)(b) | | | 225 | | | | 220 | | |
5.80%, 6/25/48 (b) | | | 100 | | | | 99 | | |
Citigroup Mortgage Loan Trust, | |
3.35%, 6/25/36 (a) | | | 23 | | | | 13 | | |
Deephaven Residential Mortgage Trust, | |
3.49%, 12/26/46 (a)(b) | | | 79 | | | | 80 | | |
E-MAC Program BV, | |
3 Month EURIBOR + 0.17%, 1.51%,
4/25/39 (a) | | EUR | 65 | | | | 64 | | |
Eurohome Mortgages PLC, | |
3 Month EURIBOR + 0.21%, 0.00%,
8/2/50 (a) | | | 19 | | | | 20 | | |
FMC GMSR Issuer Trust, | |
5.07%, 5/25/24 (a)(b) | | $ | 200 | | | | 203 | | |
Galton Funding Mortgage Trust, | |
4.00%, 2/25/59 (a)(b) | | | 42 | | | | 43 | | |
GC Pastor Hipotecario 5 FTA, | |
3 Month EURIBOR + 0.17%, 0.00%,
6/21/46 (a) | | EUR | 33 | | | | 35 | | |
Grifonas Finance PLC, | |
6 Month EURIBOR + 0.28%, 0.00%,
8/28/39 (a) | | | 60 | | | | 68 | | |
GSR Mortgage Loan Trust, | |
3.86%, 12/25/34 (a) | | $ | 42 | | | | 42 | | |
HarborView Mortgage Loan Trust, | |
3.16%, 6/19/34 (a) | | | 57 | | | | 59 | | |
3.35%, 2/25/36 (a) | | | 27 | | | | 14 | | |
Hipocat 11 FTA, | |
3 Month EURIBOR + 0.13%, 0.00%,
1/15/50 (a) | | EUR | 19 | | | | 21 | | |
IM Pastor 3 FTH, | |
3 Month EURIBOR + 0.14%, 0.00%,
3/22/43 (a) | | | 65 | | | | 69 | | |
IM Pastor 4 FTA, | |
3 Month EURIBOR + 0.14%, 0.00%,
3/22/44 (a) | | | 55 | | | | 59 | | |
IndyMac INDX Mortgage Loan Trust, | |
3.72%, 12/25/34 (a) | | $ | 19 | | | | 19 | | |
Lansdowne Mortgage Securities No. 1 PLC, | |
3 Month EURIBOR + 0.30%, 0.00%,
6/15/45 (a) | | EUR | 13 | | | | 14 | | |
Lansdowne Mortgage Securities No. 2 PLC, | |
3 Month EURIBOR + 0.34%, 0.00%,
9/16/48 (a) | | | 38 | | | | 40 | | |
Lehman Mortgage Trust, | |
6.00%, 7/25/36 | | $ | 56 | | | | 40 | | |
The accompanying notes are an integral part of the financial statements.
11
Morgan Stanley Institutional Fund Trust
Annual Report — September 30, 2020
Portfolio of Investments (cont'd)
Strategic Income Portfolio
| | | Face
Amount
(000) | | Value
(000) | |
Mortgages — Other (cont'd) | |
LHOME Mortgage Trust, | |
3.87%, 7/25/24 (b) | | $ | 100 | | | $ | 101 | | |
National City Mortgage Capital Trust, | |
6.00%, 3/25/38 | | | 11 | | | | 12 | | |
Newgate Funding PLC, | |
3 Month GBP LIBOR + 3.00%, 3.06%,
12/15/50 (a) | | GBP | 111 | | | | 136 | | |
OBX Trust, | |
3.50%, 10/25/59 (a)(b) | | $ | 67 | | | | 69 | | |
PMC PLS ESR Issuer LLC, | |
5.07%, 11/25/24 (b) | | | 114 | | | | 112 | | |
PRPM LLC, | |
3.50%, 10/25/24 (a)(b) | | | 87 | | | | 87 | | |
RBSSP Resecuritization Trust, | |
3.32%, 12/25/35 (a)(b) | | | 112 | | | | 112 | | |
Reperforming Loan REMIC Trust, | |
8.50%, 6/25/35 (b) | | | 42 | | | | 46 | | |
ResLoC UK PLC, | |
3 Month EURIBOR + 0.45%, 0.00%,
12/15/43 (a) | | EUR | 100 | | | | 101 | | |
Seasoned Credit Risk Transfer Trust, | |
3.75%, 9/25/55 (a)(b) | | $ | 150 | | | | 148 | | |
4.75%, 5/25/57 (a) | | | 100 | | | | 98 | | |
4.75%, 7/25/58 (a)(b) | | | 200 | | | | 197 | | |
Silver Hill Trust, | |
3.10%, 11/25/49 (a)(b) | | | 132 | | | | 135 | | |
STARM Mortgage Loan Trust, | |
3.70%, 1/25/37 (a) | | | 15 | | | | 15 | | |
Uropa Securities PLC, | |
3 Month GBP LIBOR + 0.55%, 0.61%,
6/10/59 (a) | | GBP | 79 | | | | 93 | | |
3 Month GBP LIBOR + 0.55%, 0.64%,
10/10/40 (a) | | | 87 | | | | 95 | | |
3 Month GBP LIBOR + 0.75%, 0.81%,
6/10/59 (a) | | | 36 | | | | 43 | | |
Washington Mutual MSC Mortgage Pass-
Through Certificates, | |
5.50%, 3/25/33 | | $ | 20 | | | | 21 | | |
| | | | 3,447 | | |
Sovereign (4.4%) | |
Australia Government Bond, | |
2.75%, 11/21/28 | | AUD | 1 | | | | 1 | | |
Brazil Notas do Tesouro Nacional Series F, | |
10.00%, 1/1/29 | | BRL | 300 | | | | 62 | | |
Ghana Government International Bond, | |
8.13%, 1/18/26 | | $ | 200 | | | | 201 | | |
Guatemala Government Bond, | |
4.88%, 2/13/28 | | | 200 | | | | 221 | | |
Hellenic Republic Government Bond, | |
3.38%, 2/15/25 (b) | | EUR | 115 | | | | 152 | | |
3.45%, 4/2/24 (b) | | | 40 | | | | 52 | | |
Indonesia Treasury Bond, | |
6.13%, 5/15/28 | | IDR | 635,000 | | | | 41 | | |
8.25%, 5/15/29 | | | 465,000 | | | | 34 | | |
| | | Face
Amount
(000) | | Value
(000) | |
Peruvian Government International Bond, (Units) | |
5.40%, 8/12/34 (b)(d) | | PEN | 60 | | | $ | 17 | | |
Senegal Government International Bond, | |
6.25%, 5/23/33 | | $ | 200 | | | | 198 | | |
Ukraine Government International Bond, | |
7.75%, 9/1/23 | | | 150 | | | | 153 | | |
| | | | 1,132 | | |
Total Fixed Income Securities (Cost $25,338) | | | 25,358 | | |
| | | Shares | | | |
Short-Term Investments (1.5%) | |
Investment Company (0.5%) | |
Morgan Stanley Institutional Liquidity
Funds — Government Portfolio —
Institutional Class (See Note G)
(Cost $118) | | | 117,638 | | | | 118 | | |
| | | Face
Amount
(000) | | | |
U.S. Treasury Security (1.0%) | |
U.S. Treasury Bill | |
| 0.16%, 1/28/21 (e)(f) (Cost $255) | | $ | 255 | | | | 255 | | |
Total Short-Term Investments (Cost $373) | | | 373 | | |
Total Investments (99.1%) (Cost $25,711) (g)(h) | | | 25,731 | | |
Other Assets in Excess of Liabilities (0.9%) | | | 234 | | |
Net Assets (100.0%) | | $ | 25,965 | | |
(a) Floating or variable rate securities: The rates disclosed are as of September 30, 2020. For securities based on a published reference rate and spread, the reference rate and spread are indicated in the description in the Portfolio of Investments. Certain variable rate securities may not be based on a published reference rate and spread but are determined by the issuer or agent and are based on current market conditions. These securities do not indicate a reference rate and spread in their description in the Portfolio of Investments.
(b) 144A security — Certain conditions for public sale may exist. Unless otherwise noted, these securities are deemed to be liquid.
(c) Perpetual — One or more securities do not have a predetermined maturity date. Rates for these securities are fixed for a period of time, after which they revert to a floating rate. Interest rates in effect are as of September 30, 2020.
(d) Consists of one or more classes of securities traded together as a unit.
(e) Rate shown is the yield to maturity at September 30, 2020.
(f) All or a portion of the security was pledged to cover margin requirements for swap agreements.
(g) Securities are available for collateral in connection with open foreign currency forward exchange contracts, futures contracts and swap agreement.
(h) At September 30, 2020, the aggregate cost for federal income tax purposes is approximately $25,825,000. The aggregate gross unrealized appreciation is approximately $547,000 and the aggregate gross unrealized depreciation is approximately $533,000, resulting in net unrealized appreciation of approximately $14,000.
EURIBOR Euro Interbank Offered Rate.
IO Interest Only.
LIBOR London Interbank Offered Rate.
PAC Planned Amortization Class.
REMIC Real Estate Mortgage Investment Conduit.
The accompanying notes are an integral part of the financial statements.
12
Morgan Stanley Institutional Fund Trust
Annual Report — September 30, 2020
Portfolio of Investments (cont'd)
Strategic Income Portfolio
Foreign Currency Forward Exchange Contracts:
The Fund had the following foreign currency forward exchange contracts open at September 30, 2020:
Counterparty | | Contracts to
Deliver
(000) | | In Exchange
For
(000) | | Delivery
Date | | Unrealized
Appreciation
(Depreciation)
(000) | |
Australia and New Zealand Banking Group | | GBP | 489 | | | $ | 646 | | | 12/1/20 | | $ | 15 | | |
Barclays Bank PLC | | $ | 7 | | | GBP | 6 | | | 12/1/20 | | | — | @ | |
Citibank NA | | EUR | 2,222 | | | $ | 2,648 | | | 12/1/20 | | | 40 | | |
Citibank NA | | $ | 131 | | | EUR | 110 | | | 12/1/20 | | | (1 | ) | |
JPMorgan Chase Bank NA | | BRL | 367 | | | $ | 65 | | | 12/1/20 | | | — | @ | |
JPMorgan Chase Bank NA | | IDR | 1,132,494 | | | $ | 76 | | | 12/1/20 | | | 1 | | |
JPMorgan Chase Bank NA | | PEN | 65 | | | $ | 18 | | | 12/1/20 | | | — | @ | |
UBS AG | | $ | 12 | | | EUR | 10 | | | 12/1/20 | | | — | @ | |
| | | | | | | | | $ | 55 | | |
Futures Contracts:
The Fund had the following futures contracts open at September 30, 2020:
| | | Number
of
Contracts | | Expiration
Date | | Notional
Amount
(000) | | Value
(000) | | Unrealized
Depreciation
(000) | |
Short: | |
U.S. Treasury 10 yr. Ultra Long Bond (United States) | | | 3 | | | Dec-20 | | $ | (300 | ) | | $ | (480 | ) | | $ | (1 | ) | |
U.S. Treasury 10 yr. Note (United States) | | | 1 | | | Dec-20 | | | (100 | ) | | | (140 | ) | | | (— | @) | |
U.S. Treasury 5 yr. Note (United States) | | | 12 | | | Dec-20 | | | (1,200 | ) | | | (1,512 | ) | | | (3 | ) | |
German Euro Bund (Germany) | | | 2 | | | Dec-20 | | EUR | (200 | ) | | | (409 | ) | | | (3 | ) | |
| | | | | | | | | | | $ | (7 | ) | |
Credit Default Swap Agreement:
The Fund had the following credit default swap agreement open at September 30, 2020:
Swap Counterparty and
Reference Obligation | | Credit
Rating of
Reference
Obligation† | | Buy/Sell
Protection | | Pay/Receive
Fixed Rate | | Payment
Frequency | | Maturity
Date | | Notional
Amount
(000) | | Value
(000) | | Upfront
Payment
Received
(000) | | Unrealized
Appreciation
(000) | |
Morgan Stanley & Co. LLC*
CDX.NA.HY.34 | | NR | | Sell | | | 5.00 | % | | Monthly | | 6/20/25 | | $ | 1,219 | | | $ | 61 | | | $ | (54 | ) | | $ | 115 | | |
@ — Value is less than $500.
† — Credit rating as issued by Standard & Poor's.
* — Cleared swap agreement, the broker is Morgan Stanley & Co. LLC.
NR — Not rated.
AUD — Australian Dollar
BRL — Brazilian Real
EUR — Euro
GBP — British Pound
IDR — Indonesian Rupiah
PEN — Peruvian Nuevo Sol
USD — United States Dollar
Portfolio Composition
Classification | | Percentage of
Total Investments | |
Asset-Backed Securities | | | 32.0 | % | |
Finance | | | 23.5 | | |
Industrials | | | 18.5 | | |
Mortgages — Other | | | 13.4 | | |
Other** | | | 11.1 | | |
Short-Term Investments | | | 1.5 | | |
Total Investments | | | 100.0 | %*** | |
** Industries and/or investment types representing less than 5% of total investments.
*** Does not include open short futures contracts with a value of approximately $2,541,000 and with total unrealized depreciation of approximately $7,000. Does not include open foreign currency forward exchange contracts with net unrealized appreciation of approximately $55,000 Does not include open swap agreements with total unrealized appreciation of approximately $115,000.
The accompanying notes are an integral part of the financial statements.
13
Morgan Stanley Institutional Fund Trust
Annual Report — September 30, 2020
Strategic Income Portfolio
Statement of Assets and Liabilities | | September 30, 2020
(000) | |
Assets: | |
Investments in Securities of Unaffiliated Issuers, at Value (Cost $25,593) | | $ | 25,613 | | |
Investment in Security of Affiliated Issuer, at Value (Cost $118) | | | 118 | | |
Total Investments in Securities, at Value (Cost $25,711) | | | 25,731 | | |
Foreign Currency, at Value (Cost $5) | | | 5 | | |
Interest Receivable | | | 143 | | |
Due from Adviser | | | 78 | | |
Unrealized Appreciation on Foreign Currency Forward Exchange Contracts | | | 56 | | |
Receivable for Variation Margin on Futures Contracts | | | 28 | | |
Receivable for Variation Margin on Swap Agreements | | | 2 | | |
Tax Reclaim Receivable | | | 1 | | |
Receivable for Investments Sold | | | — | @ | |
Receivable from Affiliate | | | — | @ | |
Other Assets | | | 22 | | |
Total Assets | | | 26,066 | | |
Liabilities: | |
Payable for Professional Fees | | | 72 | | |
Payable for Custodian Fees | | | 9 | | |
Payable for Transfer Agency Fees — Class I | | | 1 | | |
Payable for Transfer Agency Fees — Class A | | | 1 | | |
Payable for Transfer Agency Fees — Class C | | | 1 | | |
Payable for Transfer Agency Fees — Class IS | | | 1 | | |
Payable for Administration Fees | | | 2 | | |
Unrealized Depreciation on Foreign Currency Forward Exchange Contracts | | | 1 | | |
Deferred Capital Gain Country Tax | | | 1 | | |
Payable for Shareholder Services Fees — Class A | | | — | @ | |
Payable for Distribution and Shareholder Services Fees — Class C | | | — | @ | |
Payable for Sub Transfer Agency Fees — Class A | | | — | @ | |
Payable for Sub Transfer Agency Fees — Class C | | | — | @ | |
Other Liabilities | | | 12 | | |
Total Liabilities | | | 101 | | |
Net Assets | | $ | 25,965 | | |
Net Assets Consist of: | |
Paid-in-Capital | | $ | 26,349 | | |
Total Accumulated Loss | | | (384 | ) | |
Net Assets | | $ | 25,965 | | |
The accompanying notes are an integral part of the financial statements.
14
Morgan Stanley Institutional Fund Trust
Annual Report — September 30, 2020
Strategic Income Portfolio
Statement of Assets and Liabilities (cont'd) | | September 30, 2020
(000) | |
CLASS I: | |
Net Assets | | $ | 15,145 | | |
| Shares Outstanding (unlimited number of shares authorized, no par value) (not in 000's) | | | 1,527,960 | | |
Net Asset Value, Offering and Redemption Price Per Share | | $ | 9.91 | | |
CLASS A: | |
Net Assets | | $ | 204 | | |
| Shares Outstanding (unlimited number of shares authorized, no par value) (not in 000's) | | | 20,643 | | |
Net Asset Value, Redemption Price Per Share | | $ | 9.90 | | |
Maximum Sales Load | | | 3.25 | % | |
Maximum Sales Charge | | $ | 0.33 | | |
Maximum Offering Price Per Share | | $ | 10.23 | | |
CLASS C: | |
Net Assets | | $ | 266 | | |
| Shares Outstanding (unlimited number of shares authorized, no par value) (not in 000's) | | | 26,997 | | |
Net Asset Value, Offering and Redemption Price Per Share | | $ | 9.87 | | |
CLASS IS: | |
Net Assets | | $ | 10,350 | | |
| Shares Outstanding (unlimited number of shares authorized, no par value) (not in 000's) | | | 1,043,918 | | |
Net Asset Value, Offering and Redemption Price Per Share | | $ | 9.91 | | |
@ Amount is less than $500.
The accompanying notes are an integral part of the financial statements.
15
Morgan Stanley Institutional Fund Trust
Annual Report — September 30, 2020
Strategic Income Portfolio
Statement of Operations | | Year Ended
September 30, 2020
(000) | |
Investment Income: | |
Interest from Securities of Unaffiliated Issuers (Net of $2 of Foreign Taxes Withheld) | | $ | 855 | | |
Dividends from Security of Affiliated Issuer (Note G) | | | 5 | | |
Total Investment Income | | | 860 | | |
Expenses: | |
Professional Fees | | | 242 | | |
Advisory Fees (Note B) | | | 81 | | |
Registration Fees | | | 56 | | |
Custodian Fees (Note F) | | | 31 | | |
Pricing Fees | | | 23 | | |
Shareholder Reporting Fees | | | 22 | | |
Administration Fees (Note C) | | | 20 | | |
Transfer Agency Fees — Class I (Note E) | | | 2 | | |
Transfer Agency Fees — Class A (Note E) | | | 2 | | |
Transfer Agency Fees — Class C (Note E) | | | 2 | | |
Transfer Agency Fees — Class IS (Note E) | | | 2 | | |
Trustees' Fees and Expenses | | | 5 | | |
Shareholder Services Fees — Class A (Note D) | | | 1 | | |
Distribution and Shareholder Services Fees — Class C (Note D) | | | 2 | | |
Sub Transfer Agency Fees — Class I | | | — | @ | |
Sub Transfer Agency Fees — Class A | | | — | @ | |
Sub Transfer Agency Fees — Class C | | | — | @ | |
Other Expenses | | | 21 | | |
Total Expenses | | | 512 | | |
Expenses Reimbursed by Adviser (Note B) | | | (273 | ) | |
Waiver of Advisory Fees (Note B) | | | (81 | ) | |
Reimbursement of Class Specific Expenses — Class A (Note B) | | | (2 | ) | |
Reimbursement of Class Specific Expenses — Class C (Note B) | | | (2 | ) | |
Reimbursement of Class Specific Expenses — Class IS (Note B) | | | (2 | ) | |
Rebate from Morgan Stanley Affiliate (Note G) | | | (1 | ) | |
Net Expenses | | | 151 | | |
Net Investment Income | | | 709 | | |
Realized Gain (Loss): | |
Investments Sold | | | 106 | | |
Foreign Currency Forward Exchange Contracts | | | (141 | ) | |
Foreign Currency Translation | | | (2 | ) | |
Futures Contracts | | | (61 | ) | |
Options Written | | | 15 | | |
Swap Agreements | | | (257 | ) | |
Net Realized Loss | | | (340 | ) | |
Change in Unrealized Appreciation (Depreciation): | |
Investments (Net of Increase in Deferred Capital Gain Country Tax of $1) | | | (243 | ) | |
Foreign Currency Forward Exchange Contracts | | | 14 | | |
Foreign Currency Translation | | | 3 | | |
Futures Contracts | | | (12 | ) | |
Swap Agreements | | | 117 | | |
Net Change in Unrealized Appreciation (Depreciation) | | | (121 | ) | |
Net Realized Loss and Change in Unrealized Appreciation (Depreciation) | | | (461 | ) | |
Net Increase in Net Assets Resulting from Operations | | $ | 248 | | |
@ Amount is less than $500.
The accompanying notes are an integral part of the financial statements.
16
Morgan Stanley Institutional Fund Trust
Annual Report — September 30, 2020
Strategic Income Portfolio
Statements of Changes in Net Assets | | Year Ended
September 30, 2020
(000) | | Year Ended
September 30, 2019
(000) | |
Increase (Decrease) in Net Assets: | |
Operations: | |
Net Investment Income | | $ | 709 | | | $ | 275 | | |
Net Realized Loss | | | (340 | ) | | | (35 | ) | |
Net Change in Unrealized Appreciation (Depreciation) | | | (121 | ) | | | 140 | | |
Net Increase in Net Assets Resulting from Operations | | | 248 | | | | 380 | | |
Dividends and Distributions to Shareholders: | |
Class I | | | (439 | ) | | | (1 | ) | |
Class A | | | (12 | ) | | | (6 | ) | |
Class C | | | (3 | ) | | | (1 | ) | |
Class IS | | | (301 | ) | | | (595 | ) | |
Total Dividends and Distributions to Shareholders | | | (755 | ) | | | (603 | ) | |
Capital Share Transactions:(1) | |
Class I: | |
Subscribed | | | 15,041 | | | | — | | |
Distributions Reinvested | | | 439 | | | | — | @ | |
Redeemed | | | (40 | ) | | | — | | |
Class A: | |
Subscribed | | | 1,505 | | | | 216 | | |
Distributions Reinvested | | | 12 | | | | 6 | | |
Redeemed | | | (1,529 | ) | | | (72 | ) | |
Class C: | |
Subscribed | | | 257 | | | | 36 | | |
Distributions Reinvested | | | 3 | | | | 1 | | |
Redeemed | | | (47 | ) | | | (5 | ) | |
Class IS: | |
Distributions Reinvested | | | 301 | | | | 153 | | |
Net Increase in Net Assets Resulting from Capital Share Transactions | | | 15,942 | | | | 335 | | |
Total Increase in Net Assets | | | 15,435 | | | | 112 | | |
Net Assets: | |
Beginning of Period | | | 10,530 | | | | 10,418 | | |
End of Period | | $ | 25,965 | | | $ | 10,530 | | |
(1) Capital Share Transactions: | |
Class I: | |
Shares Subscribed | | | 1,487 | | | | — | | |
Shares Issued on Distributions Reinvested | | | 45 | | | | — | @@ | |
Shares Redeemed | | | (5 | ) | | | — | | |
Net Increase in Class I Shares Outstanding | | | 1,527 | | | | — | @@ | |
Class A: | |
Shares Subscribed | | | 152 | | | | 21 | | |
Shares Issued on Distributions Reinvested | | | 1 | | | | 1 | | |
Shares Redeemed | | | (155 | ) | | | (7 | ) | |
Net Increase (Decrease) in Class A Shares Outstanding | | | (2 | ) | | | 15 | | |
Class C: | |
Shares Subscribed | | | 27 | | | | 4 | | |
Shares Issued on Distributions Reinvested | | | — | @@ | | | — | @@ | |
Shares Redeemed | | | (5 | ) | | | (1 | ) | |
Net Increase in Class C Shares Outstanding | | | 22 | | | | 3 | | |
Class IS: | |
Shares Issued on Distributions Reinvested | | | 31 | | | | 15 | | |
@ Amount is less than $500.
@@ Amount is less than 500 shares.
The accompanying notes are an integral part of the financial statements.
17
Morgan Stanley Institutional Fund Trust
Annual Report — September 30, 2020
Financial Highlights
Strategic Income Portfolio
| | | Class I | |
| | | Year Ended September 30, | |
Selected Per Share Data and Ratios | | 2020 | | 2019 | | 2018 | | 2017 | | 2016(1) | |
Net Asset Value, Beginning of Period | | $ | 10.11 | | | $ | 10.33 | | | $ | 10.21 | | | $ | 9.69 | | | $ | 9.79 | | |
Income (Loss) from Investment Operations: | |
Net Investment Income(2) | | | 0.27 | | | | 0.26 | | | | 0.28 | | | | 0.26 | | | | 0.22 | | |
Net Realized and Unrealized Gain (Loss) | | | (0.18 | ) | | | 0.10 | | | | 0.05 | | | | 0.47 | | | | 0.06 | | |
Total from Investment Operations | | | 0.09 | | | | 0.36 | | | | 0.33 | | | | 0.73 | | | | 0.28 | | |
Distributions from and/or in Excess of: | |
Net Investment Income | | | (0.29 | ) | | | (0.44 | ) | | | (0.21 | ) | | | (0.21 | ) | | | (0.38 | ) | |
Net Realized Gain | | | — | | | | (0.14 | ) | | | — | | | | — | | | | — | | |
Total Distributions | | | (0.29 | ) | | | (0.58 | ) | | | (0.21 | ) | | | (0.21 | ) | | | (0.38 | ) | |
Net Asset Value, End of Period | | $ | 9.91 | | | $ | 10.11 | | | $ | 10.33 | | | $ | 10.21 | | | $ | 9.69 | | |
Total Return(3) | | | 0.98 | % | | | 3.79 | % | | | 3.32 | % | | | 7.64 | % | | | 2.91 | % | |
Ratios to Average Net Assets and Supplemental Data: | |
Net Assets, End of Period (Thousands) | | $ | 15,145 | | | $ | 10 | | | $ | 10 | | | $ | 10 | | | $ | 10 | | |
Ratio of Expenses Before Expense Limitation | | | 1.98 | % | | | 24.26 | % | | | 25.49 | % | | | 21.19 | % | | | 7.28 | % | |
Ratio of Expenses After Expense Limitation | | | 0.58 | %(4)(5) | | | 0.99 | %(4) | | | 0.99 | %(4) | | | 0.99 | %(4) | | | 0.99 | %(4) | |
Ratio of Net Investment Income | | | 2.81 | %(4) | | | 2.61 | %(4) | | | 2.77 | %(4) | | | 2.63 | %(4) | | | 2.25 | %(4) | |
Ratio of Rebate from Morgan Stanley Affiliates | | | 0.00 | %(6) | | | 0.01 | % | | | 0.01 | % | | | 0.01 | % | | | 0.01 | % | |
Portfolio Turnover Rate | | | 161 | % | | | 97 | % | | | 75 | % | | | 64 | % | | | 47 | % | |
(1) Reflects prior period custodian out-of-pocket expenses that were reimbursed in September 2016. The amount of the reimbursement was immaterial on a per share basis and did not impact the total return of Class I shares. The Ratio of Expenses After Expense Limitation and the Ratio of Net Investment Income would be unchanged as the reimbursement of custodian fees was offset against expense waivers/reimbursements with no impact to net expenses or net investment income.
(2) Per share amount is based on average shares outstanding.
(3) Calculated based on the net asset value as of the last business day of the period.
(4) The Ratio of Expenses After Expense Limitation and Ratio of Net Investment Income reflect the rebate of certain Fund expenses in connection with the investments in Morgan Stanley affiliates during the period. The effect of the rebate on the ratios is disclosed in the above table as "Ratio of Rebate from Morgan Stanley Affiliates."
(5) Effective October 01, 2019, the Adviser has agreed to limit the ratio of expenses to average net assets to the maximum ratio of 0.60% for Class I shares. Prior to October 01, 2019, the maximum ratio was 1.00% for Class I shares.
(6) Amount is less than 0.005%.
The accompanying notes are an integral part of the financial statements.
18
Morgan Stanley Institutional Fund Trust
Annual Report — September 30, 2020
Financial Highlights
Strategic Income Portfolio
| | | Class A | |
| | | Year Ended September 30, | |
Selected Per Share Data and Ratios | | 2020 | | 2019 | | 2018 | | 2017 | | 2016(1) | |
Net Asset Value, Beginning of Period | | $ | 10.09 | | | $ | 10.31 | | | $ | 10.20 | | | $ | 9.69 | | | $ | 9.79 | | |
Income (Loss) from Investment Operations: | |
Net Investment Income(2) | | | 0.24 | | | | 0.22 | | | | 0.25 | | | | 0.20 | | | | 0.18 | | |
Net Realized and Unrealized Gain (Loss) | | | (0.17 | ) | | | 0.11 | | | | 0.04 | | | | 0.49 | | | | 0.06 | | |
Total from Investment Operations | | | 0.07 | | | | 0.33 | | | | 0.29 | | | | 0.69 | | | | 0.24 | | |
Distributions from and/or in Excess of: | |
Net Investment Income | | | (0.26 | ) | | | (0.41 | ) | | | (0.18 | ) | | | (0.18 | ) | | | (0.34 | ) | |
Net Realized Gain | | | — | | | | (0.14 | ) | | | — | | | | — | | | | — | | |
Total Distributions | | | (0.26 | ) | | | (0.55 | ) | | | (0.18 | ) | | | (0.18 | ) | | | (0.34 | ) | |
Net Asset Value, End of Period | | $ | 9.90 | | | $ | 10.09 | | | $ | 10.31 | | | $ | 10.20 | | | $ | 9.69 | | |
Total Return(3) | | | 0.62 | % | | | 3.52 | % | | | 2.92 | % | | | 7.18 | % | | | 2.51 | % | |
Ratios to Average Net Assets and Supplemental Data: | |
Net Assets, End of Period (Thousands) | | $ | 204 | | | $ | 224 | | | $ | 77 | | | $ | 10 | | | $ | 40 | | |
Ratio of Expenses Before Expense Limitation | | | 2.89 | % | | | 4.82 | % | | | 7.09 | % | | | 9.96 | % | | | 6.73 | % | |
Ratio of Expenses After Expense Limitation | | | 0.95 | %(4)(5) | | | 1.34 | %(4) | | | 1.34 | %(4) | | | 1.33 | %(4) | | | 1.34 | %(4) | |
Ratio of Net Investment Income | | | 2.44 | %(4) | | | 2.21 | %(4) | | | 2.40 | %(4) | | | 2.08 | %(4) | | | 1.86 | %(4) | |
Ratio of Rebate from Morgan Stanley Affiliates | | | 0.00 | %(6) | | | 0.01 | % | | | 0.01 | % | | | 0.02 | % | | | 0.01 | % | |
Portfolio Turnover Rate | | | 161 | % | | | 97 | % | | | 75 | % | | | 64 | % | | | 47 | % | |
(1) Reflects prior period custodian out-of-pocket expenses that were reimbursed in September 2016. The amount of the reimbursement was immaterial on a per share basis and did not impact the total return of Class A shares. The Ratio of Expenses After Expense Limitation and the Ratio of Net Investment Income would be unchanged as the reimbursement of custodian fees was offset against expense waivers/reimbursements with no impact to net expenses or net investment income.
(2) Per share amount is based on average shares outstanding.
(3) Calculated based on the net asset value which does not reflect sales charges, if applicable, as of the last business day of the period.
(4) The Ratio of Expenses After Expense Limitation and Ratio of Net Investment Income reflect the rebate of certain Fund expenses in connection with the investments in Morgan Stanley affiliates during the period. The effect of the rebate on the ratios is disclosed in the above table as "Ratio of Rebate from Morgan Stanley Affiliates."
(5) Effective October 01, 2019, the Adviser has agreed to limit the ratio of expenses to average net assets to the maximum ratio of 0.95% for Class A shares. Prior to October 01, 2019, the maximum ratio was 1.35% for Class A shares.
(6) Amount is less than 0.005%.
The accompanying notes are an integral part of the financial statements.
19
Morgan Stanley Institutional Fund Trust
Annual Report — September 30, 2020
Financial Highlights
Strategic Income Portfolio
| | | Class C | |
| | | Year Ended September 30, | |
Selected Per Share Data and Ratios | | 2020 | | 2019 | | 2018 | | 2017 | | 2016(1) | |
Net Asset Value, Beginning of Period | | $ | 10.07 | | | $ | 10.28 | | | $ | 10.17 | | | $ | 9.66 | | | $ | 9.76 | | |
Income (Loss) from Investment Operations: | |
Net Investment Income(2) | | | 0.16 | | | | 0.14 | | | | 0.17 | | | | 0.13 | | | | 0.11 | | |
Net Realized and Unrealized Gain (Loss) | | | (0.17 | ) | | | 0.11 | | | | 0.05 | | | | 0.49 | | | | 0.06 | | |
Total from Investment Operations | | | (0.01 | ) | | | 0.25 | | | | 0.22 | | | | 0.62 | | | | 0.17 | | |
Distributions from and/or in Excess of: | |
Net Investment Income | | | (0.19 | ) | | | (0.32 | ) | | | (0.11 | ) | | | (0.11 | ) | | | (0.27 | ) | |
Net Realized Gain | | | — | | | | (0.14 | ) | | | — | | | | — | | | | — | | |
Total Distributions | | | (0.19 | ) | | | (0.46 | ) | | | (0.11 | ) | | | (0.11 | ) | | | (0.27 | ) | |
Net Asset Value, End of Period | | $ | 9.87 | | | $ | 10.07 | | | $ | 10.28 | | | $ | 10.17 | | | $ | 9.66 | | |
Total Return(3) | | | (0.13 | )% | | | 2.78 | % | | | 2.11 | % | | | 6.46 | % | | | 1.77 | % | |
Ratios to Average Net Assets and Supplemental Data: | |
Net Assets, End of Period (Thousands) | | $ | 266 | | | $ | 50 | | | $ | 20 | | | $ | 22 | | | $ | 35 | | |
Ratio of Expenses Before Expense Limitation | | | 4.43 | % | | | 10.78 | % | | | 14.46 | % | | | 13.41 | % | | | 28.93 | % | |
Ratio of Expenses After Expense Limitation | | | 1.70 | %(4)(5) | | | 2.09 | %(4) | | | 2.09 | %(4) | | | 2.09 | %(4) | | | 2.09 | %(4) | |
Ratio of Net Investment Income | | | 1.70 | %(4) | | | 1.45 | %(4) | | | 1.69 | %(4) | | | 1.33 | %(4) | | | 1.14 | %(4) | |
Ratio of Rebate from Morgan Stanley Affiliates | | | 0.00 | %(6) | | | 0.01 | % | | | 0.01 | % | | | 0.01 | % | | | 0.01 | % | |
Portfolio Turnover Rate | | | 161 | % | | | 97 | % | | | 75 | % | | | 64 | % | | | 47 | % | |
(1) Reflects prior period custodian out-of-pocket expenses that were reimbursed in September 2016. The amount of the reimbursement was immaterial on a per share basis and did not impact the total return of Class C shares. The Ratio of Expenses After Expense Limitation and the Ratio of Net Investment Income would be unchanged as the reimbursement of custodian fees was offset against expense waivers/reimbursements with no impact to net expenses or net investment income.
(2) Per share amount is based on average shares outstanding.
(3) Calculated based on the net asset value which does not reflect sales charges, if applicable, as of the last business day of the period.
(4) The Ratio of Expenses After Expense Limitation and Ratio of Net Investment Income reflect the rebate of certain Fund expenses in connection with the investments in Morgan Stanley affiliates during the period. The effect of the rebate on the ratios is disclosed in the above table as "Ratio of Rebate from Morgan Stanley Affiliates."
(5) Effective October 01, 2019, the Adviser has agreed to limit the ratio of expenses to average net assets to the maximum ratio of 1.70% for Class C shares. Prior to October 01, 2019, the maximum ratio was 2.10% for Class C shares.
(6) Amount is less than 0.005%.
The accompanying notes are an integral part of the financial statements.
20
Morgan Stanley Institutional Fund Trust
Annual Report — September 30, 2020
Financial Highlights
Strategic Income Portfolio
| | | Class IS | |
| | | Year Ended September 30, | |
Selected Per Share Data and Ratios | | 2020 | | 2019 | | 2018 | | 2017 | | 2016(1) | |
Net Asset Value, Beginning of Period | | $ | 10.11 | | | $ | 10.33 | | | $ | 10.22 | | | $ | 9.69 | | | $ | 9.79 | | |
Income (Loss) from Investment Operations: | |
Net Investment Income(2) | | | 0.28 | | | | 0.27 | | | | 0.29 | | | | 0.27 | | | | 0.23 | | |
Net Realized and Unrealized Gain (Loss) | | | (0.19 | ) | | | 0.10 | | | | 0.04 | | | | 0.48 | | | | 0.05 | | |
Total from Investment Operations | | | 0.09 | | | | 0.37 | | | | 0.33 | | | | 0.75 | | | | 0.28 | | |
Distributions from and/or in Excess of: | |
Net Investment Income | | | (0.29 | ) | | | (0.45 | ) | | | (0.22 | ) | | | (0.22 | ) | | | (0.38 | ) | |
Net Realized Gain | | | — | | | | (0.14 | ) | | | — | | | | — | | | | — | | |
Total Distributions | | | (0.29 | ) | | | (0.59 | ) | | | (0.22 | ) | | | (0.22 | ) | | | (0.38 | ) | |
Net Asset Value, End of Period | | $ | 9.91 | | | $ | 10.11 | | | $ | 10.33 | | | $ | 10.22 | | | $ | 9.69 | | |
Total Return(3) | | | 0.89 | % | | | 3.95 | % | | | 3.27 | % | | | 7.80 | % | | | 2.96 | % | |
Ratios to Average Net Assets and Supplemental Data: | |
Net Assets, End of Period (Thousands) | | $ | 10,350 | | | $ | 10,246 | | | $ | 10,311 | | | $ | 10,197 | | | $ | 9,669 | | |
Ratio of Expenses Before Expense Limitation | | | 1.99 | % | | | 3.06 | % | | | 3.28 | % | | | 3.79 | % | | | 3.45 | % | |
Ratio of Expenses After Expense Limitation | | | 0.57 | %(4)(5) | | | 0.94 | %(4) | | | 0.94 | %(4) | | | 0.94 | %(4) | | | 0.94 | %(4) | |
Ratio of Net Investment Income | | | 2.81 | %(4) | | | 2.66 | %(4) | | | 2.83 | %(4) | | | 2.68 | %(4) | | | 2.35 | %(4) | |
Ratio of Rebate from Morgan Stanley Affiliates | | | 0.00 | %(6) | | | 0.01 | % | | | 0.01 | % | | | 0.01 | % | | | 0.01 | % | |
Portfolio Turnover Rate | | | 161 | % | | | 97 | % | | | 75 | % | | | 64 | % | | | 47 | % | |
(1) Reflects prior period custodian out-of-pocket expenses that were reimbursed in September 2016. The amount of the reimbursement was immaterial on a per share basis and did not impact the total return of Class IS shares. The Ratio of Expenses After Expense Limitation and the Ratio of Net Investment Income would be unchanged as the reimbursement of custodian fees was offset against expense waivers/reimbursements with no impact to net expenses or net investment income.
(2) Per share amount is based on average shares outstanding.
(3) Calculated based on the net asset value as of the last business day of the period.
(4) The Ratio of Expenses After Expense Limitation and Ratio of Net Investment Income reflect the rebate of certain Fund expenses in connection with the investments in Morgan Stanley affiliates during the period. The effect of the rebate on the ratios is disclosed in the above table as "Ratio of Rebate from Morgan Stanley Affiliates."
(5) Effective October 01, 2019, the Adviser has agreed to limit the ratio of expenses to average net assets to the maximum ratio of 0.57% for Class IS shares. Prior to October 01, 2019, the maximum ratio was 0.95% for Class IS shares.
(6) Amount is less than 0.005%.
The accompanying notes are an integral part of the financial statements.
21
Morgan Stanley Institutional Fund Trust
Annual Report — September 30, 2020
Notes to Financial Statements
Morgan Stanley Institutional Fund Trust ("Trust") is registered under the Investment Company Act of 1940, as amended (the "Act''), as an open-end management investment company. The Trust is comprised of twelve separate, active funds (individually referred to as a "Fund," collectively as the "Funds"). The Trust applies investment company accounting and reporting guidance. All Funds are considered diversified for purposes of the Act.
The accompanying financial statements relate to the Strategic Income Portfolio. The Fund seeks to maximize current income consistent with the preservation of capital. The Fund offers four classes of shares — Class I, Class A, Class C and Class IS.
A. Significant Accounting Policies: The following significant accounting policies are in conformity with U.S. generally accepted accounting principles ("GAAP"). Such policies are consistently followed by the Trust in the preparation of its financial statements. GAAP may require management to make estimates and assumptions that affect the reported amounts and disclosures in the financial statements. Actual results may differ from those estimates.
In March 2017, the Financial Accounting Standards Board ("FASB") issued an Accounting Standard Update, ASU 2017-08, Receivables-Nonrefundable Fees and Other Costs (Subtopic 310-20), Premium Amortization on Purchased Callable Debt Securities ("ASU 2017-08") which amends the amortization period for certain purchased callable debt securities held at a premium, shortening such period to the earliest call date. ASU 2017-08 does not require any accounting change for debt securities held at a discount; the discount continues to be accreted to maturity. ASU 2017-08 is effective for fiscal years, and interim periods within those fiscal years, beginning after December 15, 2018. The adoption resulted in a change in accounting principle, since the Fund had historically amortized such premiums to maturity for U.S. GAAP. Accordingly, the Fund has adopted ASU 2017-08 to amend the premium amortization period for certain purchased callable debt securities with non-contingent call features to the earliest call date. It is impracticable to evaluate the effect on individual prior periods, therefore the Fund applied the amendments on a modified retrospective basis by recognizing a cumulative effect adjustment that decreased the beginning of period cost of investments and increased the unrealized appreciation on investments of approximately $7,000.
This change in accounting policy has been made to comply with the newly issued accounting standard and had no impact on total accumulated earnings (loss) or the net asset value of
the Fund. With respect to the Fund's results of operations, amortization of premium to first call date accelerates amortization with the intent of more closely aligning the recognition of income on such bonds with the economics of the instrument.
In March 2020, FASB issued an Accounting Standard Update, ASU 2020-04, Reference Rate Reform (Topic 848) — Facilitation of the Effects of Reference Rate Reform on Financial Reporting ("ASU 2020-04"), which provides optional, temporary relief with respect to the financial reporting of contracts subject to certain types of modifications due to the planned discontinuation of the London Interbank Offered Rate ("LIBOR") and other IBOR-based reference rates at the end of 2021. The temporary relief provided by ASU 2020-04 is effective for certain reference rate-related contract modifications that occur during the period from March 12, 2020 through December 31, 2022. Management is evaluating the impact of ASU 2020-04 on the Fund's investments, derivatives, debt and other contracts that will undergo reference rate-related modifications as a result of the reference rate reform.
1. Security Valuation: (1) Certain portfolio securities may be valued by an outside pricing service/vendor approved by the Trust's Board of Trustees (the "Trustees"). The pricing service/vendor may employ a pricing model that takes into account, among other things, bids, yield spreads and/or other market data and specific security characteristics. Alternatively, if a valuation is not available from an outside pricing service/vendor, and the security trades on an exchange, the security may be valued at its latest reported sale price (or at the exchange official closing price if such exchange reports an official closing price), prior to the time when assets are valued. If there are no sales on a given day and if there is no official exchange closing price for that day, the security is valued at the mean between the last reported bid and asked prices if such bid and asked prices are available in the relevant exchanges. If only bid prices are available then the latest bid price may be used. If Morgan Stanley Investment Management Inc. (the "Adviser") or Morgan Stanley Investment Management Limited ("MSIM Limited") (the "Sub-Adviser"), (effective October 1, 2019, MSIM Limited is no longer a Sub-Adviser to the Fund, a wholly-owned subsidiary of Morgan Stanley), determines that the price provided by the outside pricing service/vendor or exchange does not reflect the security's fair value or is unable to provide a price, prices from brokers or dealers may also be utilized. In these circumstances, the value of the security will be the mean of bid and asked prices obtained from brokers or dealers;
22
Morgan Stanley Institutional Fund Trust
Annual Report — September 30, 2020
Notes to Financial Statements (cont'd)
(2) futures are valued at the settlement price on the exchange on which they trade or, if a settlement price is unavailable, at the last sale price on the exchange; (3) over-the-counter ("OTC") swaps may be valued by an outside pricing service approved by the Trustees or quotes from a broker or dealer. Swaps cleared on a clearinghouse or exchange may be valued using the closing price provided by the clearinghouse or exchange; (4) when market quotations are not readily available, including circumstances under which the Adviser or the Sub-Adviser determines that the closing price, last sale price or the mean between the last reported bid and asked prices are not reflective of a security's market value, portfolio securities are valued at their fair value as determined in good faith under procedures established by and under the general supervision of the Trustees. Occasionally, developments affecting the closing prices of securities and other assets may occur between the times at which valuations of such securities are determined (that is, close of the foreign market on which the securities trade) and the close of business of the New York Stock Exchange ("NYSE"). If developments occur during such periods that are expected to materially affect the value of such securities, such valuations may be adjusted to reflect the estimated fair value of such securities as of the close of the NYSE, as determined in good faith by the Trustees or by the Adviser using a pricing service and/or procedures approved by the Trustees; (5) quotations of foreign portfolio securities, other assets and liabilities and forward contracts stated in foreign currency are translated into U.S. dollar equivalents at the prevailing market rates prior to the close of the NYSE; and (6) investments in mutual funds, including the Morgan Stanley Institutional Liquidity Funds, are valued at the net asset value ("NAV") as of the close of each business day.
The Trustees have responsibility for determining in good faith the fair value of the investments, and the Trustees may appoint others, such as the Trust's Adviser or a valuation committee, to assist the Trustees in determining fair value and to make the actual calculations pursuant to the fair valuation methodologies previously approved by the Trustees. Under procedures approved by the Trustees, the Trust's Adviser has formed a Valuation Committee whose members are approved by the Trustees. The Valuation Committee provides administration and oversight of the Trust's valuation policies and procedures, which are reviewed at least annually by
the Trustees. These procedures allow the Trust to utilize independent pricing services, quotations from securities and financial instrument dealers and other market sources to determine fair value.
2. Fair Value Measurement: FASB Accounting Standards CodificationTM ("ASC") 820, "Fair Value Measurement" ("ASC 820"), defines fair value as the value that the Fund would receive to sell an investment or pay to transfer a liability in a timely transaction with an independent buyer in the principal market, or in the absence of a principal market, the most advantageous market for the investment or liability. ASC 820 establishes a three-tier hierarchy to distinguish between (1) inputs that reflect the assumptions market participants would use in valuing an asset or liability developed based on market data obtained from sources independent of the reporting entity (observable inputs) and (2) inputs that reflect the reporting entity's own assumptions about the assumptions market participants would use in valuing an asset or liability developed based on the best information available in the circumstances (unobservable inputs) and to establish classification of fair value measurements for disclosure purposes. Various inputs are used in determining the value of the Fund's investments. The inputs are summarized in the three broad levels listed below:
• Level 1 – unadjusted quoted prices in active markets for identical investments
• Level 2 – other significant observable inputs (including quoted prices for similar investments, interest rates, prepayment speeds, credit risk, etc.)
• Level 3 – significant unobservable inputs including the Fund's own assumptions in determining the fair value of investments. Factors considered in making this determination may include, but are not limited to, information obtained by contacting the issuer, analysts, or the appropriate stock exchange (for exchange-traded securities), analysis of the issuer's financial statements or other available documents and, if necessary, available information concerning other securities in similar circumstances.
The inputs or methodology used for valuing securities are not necessarily an indication of the risk associated
23
Morgan Stanley Institutional Fund Trust
Annual Report — September 30, 2020
Notes to Financial Statements (cont'd)
with investing in those securities and the determination of the significance of a particular input to the fair value measurement in its entirety requires judgment and considers factors specific to each security.
The following is a summary of the inputs used to value the Fund's investments as of September 30, 2020:
Investment Type | | Level 1
Unadjusted
quoted
prices
(000) | | Level 2
Other
significant
observable
inputs
(000) | | Level 3
Significant
unobservable
inputs
(000) | | Total
(000) | |
Assets: | |
Fixed Income Securities | |
Asset-Backed Securities | | $ | — | | | $ | 8,242 | | | $ | — | | | $ | 8,242 | | |
Collateralized Mortgage
Obligations — Agency
Collateral Series | | | — | | | | 7 | | | | — | | | | 7 | | |
Commercial
Mortgage-Backed
Securities | | | — | | | | 1,254 | | | | — | | | | 1,254 | | |
Corporate Bonds | | | — | | | | 11,276 | | | | — | | | | 11,276 | | |
Mortgages — Other | | | — | | | | 3,447 | | | | — | | | | 3,447 | | |
Sovereign | | | — | | | | 1,132 | | | | — | | | | 1,132 | | |
Total Fixed Income Securities | | | — | | | | 25,358 | | | | — | | | | 25,358 | | |
Short-Term Investments | |
Investment Company | | | 118 | | | | — | | | | — | | | | 118 | | |
U.S. Treasury Security | | | — | | | | 255 | | | | — | | | | 255 | | |
Total Short-Term
Investments | | | 118 | | | | 255 | | | | — | | | | 373 | | |
Foreign Currency
Forward Exchange
Contracts | | | — | | | | 56 | | | | — | | | | 56 | | |
Credit Default
Swap Agreement | | | — | | | | 115 | | | | — | | | | 115 | | |
Total Assets | | | 118 | | | | 25,784 | | | | — | | | | 25,902 | | |
Liabilities: | |
Foreign Currency
Forward Exchange
Contract | | | — | | | | (1 | ) | | | — | | | | (1 | ) | |
Futures Contracts | | | (7 | ) | | | — | | | | — | | | | (7 | ) | |
Total Liabilities | | | (7 | ) | | | (1 | ) | | | — | | | | (8 | ) | |
Total | | $ | 111 | | | $ | 25,783 | | | $ | — | | | $ | 25,894 | | |
Transfers between investment levels may occur as the markets fluctuate and/or the availability of data used in an investment's valuation changes.
3. Foreign Currency Translation and Foreign Investments: The books and records of the Fund are maintained in U.S. dollars. Foreign currency amounts are translated into U.S. dollars as follows:
– investments, other assets and liabilities at the prevailing rate of exchange on the valuation date;
– investment transactions and investment income at the prevailing rates of exchange on the dates of such transactions.
Although the net assets of the Fund are presented at the foreign exchange rates and market values at the close of the period, the Fund does not isolate that portion of the results of operations arising as a result of changes in the foreign exchange rates from the fluctuations arising from changes in the market prices of securities held at period end. Similarly, the Fund does not isolate the effect of changes in foreign exchange rates from the fluctuations arising from changes in the market prices of securities sold during the period. Accordingly, realized and unrealized foreign currency gains (losses) on investments in securities are included in the reported net realized and unrealized gains (losses) on investment transactions and balances. However, pursuant to U.S. federal income tax regulations, gains and losses from certain foreign currency transactions and the foreign currency portion of gains and losses realized on sales and maturities of foreign denominated debt securities are treated as ordinary income for U.S. federal income tax purposes.
Net realized gains (losses) on foreign currency transactions represent net foreign exchange gains (losses) from currency gains (losses) realized between the trade and settlement dates on securities transactions, and the difference between the amount of investment income and foreign withholding taxes recorded on the Fund's books and the U.S. dollar equivalent amounts actually received or paid. The change in unrealized currency gains (losses) on foreign currency transactions for the period is reflected in the Statement of Operations.
Foreign security and currency transactions may involve certain considerations and risks not typically associated with those of U.S. dollar denominated transactions as a result of, among other factors, fluctuations of exchange rates in relation to the U.S. dollar, the possibility of lower levels of governmental supervision and regulation of foreign securities markets and the possibility of political or economic instability.
Governmental approval for foreign investments may be required in advance of making an investment under certain circumstances in some countries, and the extent of foreign investments in domestic companies may be
24
Morgan Stanley Institutional Fund Trust
Annual Report — September 30, 2020
Notes to Financial Statements (cont'd)
subject to limitation in other countries. Foreign ownership limitations also may be imposed by the charters of individual companies to prevent, among other concerns, violations of foreign investment limitations. As a result, an additional class of shares (identified as "Foreign" in the Portfolio of Investments) may be created and offered for investment. The "local" and "foreign shares" market values may differ. In the absence of trading of the foreign shares in such markets, the Fund values the foreign shares at the closing exchange price of the local shares.
4. Derivatives: The Fund may, but is not required to, use derivative instruments for a variety of purposes, including hedging, risk management, portfolio management or to earn income. Derivatives are financial instruments whose value is based, in part, on the value of an underlying asset, interest rate, index or financial instrument. Prevailing interest rates and volatility levels, among other things, also affect the value of derivative instruments. A derivative instrument often has risks similar to its underlying asset and may have additional risks, including imperfect correlation between the value of the derivative and the underlying asset, risks of default by the counterparty to certain transactions, magnification of losses incurred due to changes in the market value of the securities, instruments, indices or interest rates to which the derivative instrument relates, risks that the transactions may not be liquid and risks arising from margin requirements. The use of derivatives involves risks that are different from, and possibly greater than, the risks associated with other portfolio investments. Derivatives may involve the use of highly specialized instruments that require investment techniques and risk analyses different from those associated with other portfolio investments. All of the Fund's holdings, including derivative instruments, are marked-to-market each day with the change in value reflected in unrealized appreciation (depreciation). Upon disposition, a realized gain or loss is recognized.
Certain derivative transactions may give rise to a form of leverage. Leverage magnifies the potential for gain and the risk of loss. Leverage associated with derivative transactions may cause the Fund to liquidate portfolio positions when it may not be advantageous to do so to satisfy its obligations or to meet earmarking or segregation requirements, pursuant to applicable Securities and Exchange Commission rules and regulations, or may cause the Fund to be more volatile than if the Fund had
not been leveraged. Although the Adviser and/or Sub-Adviser seek to use derivatives to further the Fund's investment objectives, there is no assurance that the use of derivatives will achieve this result.
Following is a description of the derivative instruments and techniques that the Fund used during the period and their associated risks:
Options: With respect to options, the Fund is subject to equity risk, interest rate risk and foreign currency exchange risk in the normal course of pursuing its investment objectives. If the Fund buys an option, it buys a legal contract giving it the right to buy or sell a specific amount of the underlying instrument or foreign currency, or futures contract on the underlying instrument or foreign currency, at an agreed-upon price during a period of time or on a specified date typically in exchange for a premium paid by the Fund. The Fund may purchase and/or sell put and call options. Purchasing call options tends to increase the Fund's exposure to the underlying (or similar) instrument. Purchasing put options tends to decrease the Fund's exposure to the underlying (or similar) instrument. When entering into purchased option contracts, the Fund bears the risk of interest or exchange rates or securities prices moving unexpectedly, in which case, the Fund may not achieve the anticipated benefits of the purchased option contracts; however the risk of loss is limited to the premium paid. Purchased options are reported as part of "Total Investments in Securities" in the Statement of Assets and Liabilities. Premium paid for purchasing options which expired are treated as realized losses. If the Fund sells an option, it sells to another party the right to buy from or sell to the Fund a specific amount of the underlying instrument or foreign currency, or futures contract on the underlying instrument or foreign currency, at an agreed-upon price during a period of time or on a specified date typically in exchange for a premium received by the Fund. The Fund may write call and put options on stock indexes, futures, securities or currencies it owns or in which it may invest. Writing put options tend to increase the Fund's exposure to the underlying instrument. Writing call options tend to decrease the Fund's exposure to the underlying instruments. When the Fund writes a call or put option, an amount equal to the premium received is recorded as a liability. Any liability recorded is subsequently adjusted to reflect the current
25
Morgan Stanley Institutional Fund Trust
Annual Report — September 30, 2020
Notes to Financial Statements (cont'd)
value of the options written. Premiums received from writing options which expire are treated as realized gains. Premiums received from writing options which are exercised or are closed are added to or offset against the proceeds or amount paid on the transaction to determine the net realized gain or loss. The Fund as a writer of an option has no control over whether the underlying future, security or currency may be sold (call) or purchased (put) and as a result bears the market risk of an unfavorable change in the price of the future, security or currency underlying the written option. When options are purchased OTC, the Fund bears the risk that the counterparty that wrote the option will be unable or unwilling to perform its obligations under the option contract. Options may also be illiquid and the Fund may have difficulty closing out its position. A decision as to whether, when and how to use options involves the exercise of skill and judgment and even a well-conceived option transaction may be unsuccessful because of market behavior or unexpected events. The prices of options can be highly volatile and the use of options can lower total returns.
As of September 30, 2020, the Fund did not have any outstanding options written.
Futures: A futures contract is a standardized, exchange-traded agreement to buy or sell a specific quantity of an underlying asset, reference rate or index at a specific price at a specific future time. The value of a futures contract tends to increase and decrease in tandem with the value of the underlying instrument. Depending on the terms of the particular contract, futures contracts are settled through either physical delivery of the underlying instrument on the settlement date or by payment of a cash settlement amount on the settlement date. During the period the futures contract is open, payments are received from or made to the broker based upon changes in the value of the contract (the variation margin). A decision as to whether, when and how to use futures contracts involves the exercise of skill and judgment and even a well-conceived futures transaction may be unsuccessful because of market behavior or unexpected events. In addition to the derivatives risks discussed above, the prices of futures contracts can be highly volatile, using futures contracts can lower total return and the potential loss from futures contracts can exceed the Fund's initial investment in such contracts. No assurance can be given
that a liquid market will exist for any particular futures contract at any particular time. There is also the risk of loss by the Fund of margin deposits in the event of bankruptcy of a broker with which the Fund has open positions in the futures contract.
Swaps: The Fund may enter into OTC swap contracts or cleared swap transactions. A swap contract is an agreement between two parties pursuant to which the parties exchange payments at specified dates on the basis of a specified notional amount, with the payments calculated by reference to specified securities, indices, reference rates, currencies or other instruments. Typically swap agreements provide that when the period payment dates for both parties are the same, the payments are made on a net basis (i.e., the two payment streams are netted out, with only the net amount paid by one party to the other). The Fund's obligations or rights under a swap contract entered into on a net basis will generally be equal only to the net amount to be paid or received under the agreement, based on the relative values of the positions held by each party. Cleared swap transactions may help reduce counterparty credit risk. In a cleared swap, the Fund's ultimate counterparty is a clearinghouse rather than a swap dealer, bank or other financial institution. OTC swap agreements are not entered into or traded on exchanges and often there is no central clearing or guaranty function for OTC swaps. These OTC swaps are often subject to credit risk or the risk of default or non-performance by the counterparty. Both OTC and cleared swaps could result in losses if interest rates, foreign currency exchange rates or other factors are not correctly anticipated by the Fund or if the reference index, security or investments do not perform as expected. During the period swap agreements are open, payments are received from or made to the clearinghouse or counterparty based upon changes in the value of the contract (variation margin). The Dodd-Frank Wall Street Reform and Consumer Protection Act and related regulatory developments require the clearing and exchange-trading of certain standardized swap transactions. Mandatory exchange-trading and clearing is occurring on a phased-in basis.
The Fund's use of swaps during the period included those based on the credit of an underlying security commonly referred to as "credit default swaps." The Fund may be either the buyer or seller in a credit default swap.
26
Morgan Stanley Institutional Fund Trust
Annual Report — September 30, 2020
Notes to Financial Statements (cont'd)
Where the Fund is the buyer of a credit default swap contract, it would typically be entitled to receive the par (or other agreed-upon) value of a referenced debt obligation from the counterparty to the contract only in the event of a default or similar event by the issuer of the debt obligation. If no default occurs, the Fund would have paid to the counterparty a periodic stream of payments over the term of the contract and received no benefit from the contract. When the Fund is the seller of a credit default swap contract, it typically receives the stream of payments but is obligated to pay an amount equal to the par (or other agreed-upon) value of a referenced debt obligation upon the default or similar event by the issuer of the referenced debt obligation. The use of credit default swaps could result in losses to the Fund if the Adviser fails to correctly evaluate the creditworthiness of the issuer of the referenced debt obligation.
If the Fund is a seller of protection and a credit event occurs, as defined under the terms of that particular swap agreement, the Fund will either (i) pay to the buyer of protection an amount equal to the notional amount of the swap agreement and take delivery of the referenced obligation, other deliverable obligations or underlying securities comprising the referenced index or (ii) pay a net settlement amount in the form of cash or securities equal to the notional amount of the swap agreement less the recovery value of the referenced obligation or underlying securities comprising the referenced index. If the Fund is a buyer of protection and a credit event occurs, as defined under the terms of that particular swap agreement, the Fund will either (i) receive from the seller of protection an amount equal to the notional amount of the swap agreement and deliver the referenced obligation, other deliverable obligations or underlying securities comprising the referenced index or (ii) receive a net settlement amount in the form of cash or securities equal to the notional amount of the swap agreement less the recovery value of the referenced obligation or underlying securities comprising the referenced index. Recovery values are estimated by market makers considering either industry standard recovery rates or entity specific factors and considerations until a credit event occurs. If a credit event has occurred, the recovery value is determined by a facilitated auction whereby a minimum number of allowable broker bids, together with a specified valuation method, are used to calculate the settlement value. The Fund's maximum
risk of loss from counterparty risk, either as the protection seller or as the protection buyer, is the fair value of the swap agreement.
The current credit rating of each individual issuer is listed in the table following the Portfolio of Investments and serves as an indicator of the current status of the payment/performance risk of the credit derivative. Alternatively, for credit default swaps on an index of credits, the quoted market prices and current values serve as an indicator of the current status of the payment/performance risk of the credit derivative. Generally, lower credit ratings and increasing market values, in absolute terms, represent a deterioration of the credit and a greater likelihood of an adverse credit event of the issuer.
When the Fund has an unrealized loss on a swap agreement, the Fund has instructed the custodian to pledge cash or liquid securities as collateral with a value approximately equal to the amount of the unrealized loss. Collateral pledges are monitored and subsequently adjusted if and when the swap valuations fluctuate. If applicable, cash collateral is included with "Due from (to) Broker" in the Statement of Assets and Liabilities.
Upfront payments paid or received by the Fund will be reflected as an asset or liability, respectively, in the Statement of Assets and Liabilities.
Foreign Currency Forward Exchange Contracts: In connection with its investments in foreign securities, the Fund also entered into contracts with banks, brokers or dealers to purchase or sell securities or foreign currencies at a future date. A foreign currency forward exchange contract ("currency contract") is a negotiated agreement between the contracting parties to exchange a specified amount of currency at a specified future time at a specified rate. The rate can be higher or lower than the spot rate between the currencies that are the subject of the contract. Currency contracts may be used to protect against uncertainty in the level of future foreign currency exchange rates or to gain or modify exposure to a particular currency. In addition, the Fund may use cross currency hedging or proxy hedging with respect to currencies in which the Fund has or expects to have portfolio or currency exposure. Cross currency hedges involve the sale of one currency against the positive exposure to a different currency and may be used for hedging purposes or to establish an active exposure to the exchange
27
Morgan Stanley Institutional Fund Trust
Annual Report — September 30, 2020
Notes to Financial Statements (cont'd)
rate between any two currencies. To the extent hedged by the use of currency contracts, the precise matching of the currency contract amounts and the value of the securities involved will not generally be possible because the future value of such securities in foreign currencies will change as a consequence of market movements in the value of those securities between the date on which the contract is entered into and the date it matures. Furthermore, such transactions may reduce or preclude the opportunity for gain if the value of the currency should move in the direction opposite to the position taken. There is additional risk to the extent that currency contracts create exposure to currencies in which the Fund's securities are not denominated. Unanticipated changes in currency prices may result in poorer overall performance for the Fund than if it had not entered into such contracts. The use of currency contracts involves the risk of loss from the insolvency or bankruptcy of the counterparty to the contract or the failure of the counterparty to make payments or otherwise comply with the terms of the contract. A currency contract is marked-to-market daily and the change in market value is recorded by the Fund as unrealized gain or loss. The Fund records realized gains (losses) when the currency contract is closed equal to the difference between the value of the currency contract at the time it was opened and the value at the time it was closed.
FASB ASC 815, "Derivatives and Hedging" ("ASC 815"), is intended to improve financial reporting about derivative instruments by requiring enhanced disclosures to enable investors to better understand how and why the Fund uses derivative instruments, how these derivative instruments are accounted for and their effects on the Fund's financial position and results of operations.
The following tables set forth the fair value of the Fund's derivative contracts by primary risk exposure as of September 30, 2020:
| | | Asset Derivatives
Statement of Assets and
Liabilities Location | | Primary Risk
Exposure | | Value
(000) | |
Foreign Currency
Forward Exchange
Contracts | | Unrealized Appreciation on
Foreign Currency Forward
Exchange Contracts | |
Currency Risk | | $ | 56 | | |
Swap Agreement
| | Variation Margin on
Swap Agreement | | Credit Risk | | | 115 | (a) | |
Total | | | | | | $ | 171 | | |
| | | Liability Derivatives
Statement of Assets and
Liabilities Location | | Primary Risk
Exposure | | Value
(000) | |
Foreign Currency
Forward Exchange
Contract | | Unrealized Depreciation on
Foreign Currency Forward
Exchange Contract | |
Currency Risk | | $ | (1 | ) | |
Futures Contracts | | Variation Margin on | | | | | |
| | | Futures Contracts | | Interest Rate Risk | | | (7 | )(a) | |
Total | | | | | | $ | (8 | ) | |
(a) This amount represents the cumulative appreciation (depreciation) as reported in the Portfolio of Investments. The Statement of Assets and Liabilities only reflects the current day's net variation margin.
The following tables set forth by primary risk exposure the Fund's realized gains (losses) and change in unrealized appreciation (depreciation) by type of derivative contract for the year ended September 30, 2020 in accordance with ASC 815:
Realized Gain (Loss) | |
Primary Risk Exposure | | Derivative Type | | Value
(000) | |
Currency Risk | | Foreign Currency Forward
Exchange Contracts | | $ | (141 | ) | |
Interest Rate Risk | | Futures Contracts | | | (61 | ) | |
Credit Risk | | Swap Agreements | | | (243 | ) | |
Interest Rate Risk | | Swap Agreements | | | (14 | ) | |
Interest Rate Risk | | Written Option | | | 15 | | |
| | | Total | | $ | (444 | ) | |
Change in Unrealized Appreciation (Depreciation) | |
Primary Risk Exposure | | Derivative Type | | Value
(000) | |
Currency Risk | | Foreign Currency Forward
Exchange Contracts | | $ | 14 | | |
Interest Rate Risk | | Futures Contracts | | | (12 | ) | |
Credit Risk | | Swap Agreements | | | 117 | | |
| | | Total | | $ | 119 | | |
At September 30, 2020, the Fund's derivative assets and liabilities are as follows:
Gross Amounts of Assets and Liabilities
Presented in the Statement of Assets and Liabilities | |
Derivatives(b) | | Assets(c)
(000) | | Liabilities(c)
(000) | |
Foreign Currency Forward
Exchange Contracts | | $ | 56 | | | $ | (1 | ) | |
(b) Excludes exchange-traded derivatives.
(c) Absent an event of default or early termination, OTC derivative assets and liabilities are presented gross and not offset in the Statement of Assets and Liabilities.
The Fund typically enters into International Swaps and Derivatives Association, Inc. Master Agreements ("ISDA Master Agreements") or similar master agreements (collectively, "Master Agreements") with its contract counterparties for certain OTC derivatives in order to, among other things, reduce its credit risk to counterparties. ISDA Master Agreements include provisions for general obligations, representations, collateral and events
28
Morgan Stanley Institutional Fund Trust
Annual Report — September 30, 2020
Notes to Financial Statements (cont'd)
of default or termination. Under an ISDA Master Agreement, the Fund typically may offset with the counterparty certain OTC derivative financial instruments' payables and/or receivables with collateral held and/or posted and create one single net payment (close-out netting) in the event of default, termination and/or potential deterioration in the credit quality of the counterparty. Various Master Agreements govern the terms of certain transactions with counterparties, including transactions such as swap, forward, repurchase and reverse repurchase agreements. These Master Agreements typically attempt to reduce the counterparty risk associated with such transactions by specifying credit protection mechanisms and providing standardization that improves legal certainty. Cross-termination provisions under Master Agreements typically provide that a default in connection with one transaction between the Fund and a counterparty gives the non-defaulting party the right to terminate any other transactions in place with the defaulting party to create one single net payment due to/due from the defaulting party and may be a feature in certain Master Agreements. In the event the Fund exercises its right to terminate a Master Agreement after a counterparty experiences a termination event as defined in the Master Agreement, the return of collateral with market value in excess of the Fund's net liability may be delayed or denied.
The following tables present derivative financial instruments that are subject to enforceable netting arrangements as of September 30, 2020:
Gross Amounts Not Offset in the Statement of Assets and Liabilities | |
Counterparty | | Gross Asset
Derivatives
Presented in
the Statement of
Assets and
Liabilities
(000) | | Financial
Instrument
(000) | | Collateral
Received
(000) | | Net Amount
(not less
than $0)
(000) | |
Australia and
New Zealand Banking Group | | $ | 15 | | | $ | — | | | $ | — | | | $ | 15 | | |
Barclays Bank PLC | | | — | @ | | | — | | | | — | | | | — | @ | |
Citibank NA | | | 40 | | | | (1 | ) | | | — | | | | 39 | | |
JPMorgan Chase Bank NA | | | 1 | | | | — | | | | — | | | | 1 | | |
UBS AG | | | — | @ | | | — | | | | — | | | | — | @ | |
Total | | $ | 56 | | | $ | (1 | ) | | $ | — | | | $ | 55 | | |
Gross Amounts Not Offset in the Statement of Assets and Liabilities | |
Counterparty | | Gross Liability
Derivatives
Presented in
the Statement of
Assets and
Liabilities
(000) | | Financial
Instrument
(000) | | Collateral
Pledged
(000) | | Net Amount
(not less
than $0)
(000) | |
Citibank NA | | $ | 1 | | | $ | (1 | ) | | $ | — | | | $ | 0 | | |
@ Amount is less than $500.
For the year ended September 30, 2020, the approximate average monthly amount outstanding for each derivative type is as follows:
Foreign Currency Forward Exchange Contracts: | |
Average monthly principal amount | | $ | 5,084,000 | | |
Futures Contracts: | |
Average monthly notional value | | $ | 1,723,000 | | |
Swap Agreements: | |
Average monthly notional amount | | $ | 1,844,000 | | |
Written Options: | |
Average monthly notional amount | | $ | 167,000 | | |
5. Indemnifications: The Trust enters into contracts that contain a variety of indemnifications. The Trust's maximum exposure under these arrangements is unknown. However, the Trust has not had prior claims or losses pursuant to these contracts and expects the risk of loss to be remote.
6. Dividends and Distributions to Shareholders: Dividends and distributions to shareholders are recorded on the ex-dividend date. Dividends from net investment income, if any, are declared and paid monthly. Net realized capital gains, if any, are distributed at least annually.
7. Security Transactions, Income and Expenses: Security transactions are accounted for on the trade date (date the order to buy or sell is executed). Realized gains and losses on the sale of investment securities are determined on the specific identified cost method. Dividend income and other distributions are recorded on the ex-dividend date (except for certain foreign dividends which may be recorded as soon as the Fund is informed of such dividends) net of applicable withholding taxes. Interest income is recognized on the accrual basis except where collection is in doubt. Discounts are accreted and premiums are amortized over the life of the respective securities. Most expenses of the Trust can be directly attributed to a
29
Morgan Stanley Institutional Fund Trust
Annual Report — September 30, 2020
Notes to Financial Statements (cont'd)
particular Fund. Expenses which cannot be directly attributed are apportioned among the Funds based upon relative net assets or other appropriate methods. Income, expenses (other than class specific expenses — distribution and shareholder services, transfer agency and sub transfer agency fees) and realized and unrealized gains or losses are allocated to each class of shares based upon their relative net assets.
B. Advisory/Sub-Advisory Fees: The Adviser, a wholly-owned subsidiary of Morgan Stanley, provides the Fund with advisory services under the terms of an Investment Advisory Agreement, paid quarterly, at the annual rate based on the daily net assets as follows:
First $500
million | | Over $500
million | |
| | 0.40 | % | | | 0.35 | % | |
Effective October 1, 2019, the Adviser will provide the Fund with advisory services under the terms of an Investment Advisory Agreement, paid quarterly, at an annual rate of 0.32% of the average daily net assets of the Fund.
For the year ended September 30, 2020, the advisory fee rate (net of waivers/rebate) was equivalent to an annual effective rate of 0.00% of the Fund's average daily net assets.
The Adviser has agreed to reduce its advisory fee and/or reimburse the Fund so that total annual Fund operating expenses, excluding certain investment related expenses, taxes, interest and other extraordinary expenses (including litigation), will not exceed 1.00% for Class I shares, 1.35% for Class A shares, 2.10% for Class C shares and 0.95% for Class IS shares. Effective October 1, 2019, the Adviser has agreed to reduce its advisory fee and/or reimburse the Fund so that total annual Fund operating expenses will not exceed 0.60% for Class I shares, 0.95% for Class A shares, 1.70% for Class C shares and 0.57% for Class IS shares. The fee waivers and/or expense reimbursements will continue for at least one year from the date of the Fund's prospectus or until such time as the Trustees act to discontinue all or a portion of such waivers and/or reimbursements when they deem such action is appropriate. For the year ended September 30, 2020, approximately $81,000 of advisory fees were waived and approximately $279,000 of other expenses were reimbursed by the Adviser pursuant to this arrangement.
The Adviser has entered into a Sub-Advisory Agreement with the Sub-Adviser, a wholly-owned subsidiary of Morgan Stanley. The Sub-Adviser provides the Fund with advisory services subject to the overall supervision of the Adviser and the Fund's
Officers and Trustees. The Adviser pays the Sub-Adviser on a monthly basis a portion of the net advisory fees the Adviser receives from the Fund.
Effective October 1, 2019, MSIM Limited is no longer a Sub-Adviser to the Fund.
C. Administration Fees: The Adviser also serves as Administrator to the Trust and provides administrative services pursuant to an Administration Agreement for an annual fee, accrued daily and paid monthly, of 0.08% of the Fund's average daily net assets. Under a Sub-Administration Agreement between the Administrator and State Street Bank and Trust Company ("State Street"), State Street provides certain administrative services to the Trust. For such services, the Administrator pays State Street a portion of the fee the Administrator receives from the Fund.
D. Distribution and Shareholder Services Fees: Morgan Stanley Distribution, Inc. ("MSDI" or the "Distributor"), a wholly-owned subsidiary of the Adviser and an indirect subsidiary of Morgan Stanley, serves as the Trust's Distributor of Fund shares pursuant to a Distribution Agreement. The Trust has adopted a Shareholder Services Plan with respect to Class A shares pursuant to Rule 12b-1 under the Act. Under the Shareholder Services Plan, the Fund pays the Distributor a shareholder services fee, accrued daily and paid monthly, at an annual rate of 0.25% of the Fund's average daily net assets attributable to Class A shares.
The Trust has adopted a Distribution and Shareholder Services Plan with respect to Class C shares pursuant to Rule 12b-1 under the Act. Under the Distribution and Shareholder Services Plan, the Fund pays the Distributor a distribution fee, accrued daily and paid monthly, at an annual rate of 0.75% and a shareholder services fee, accrued daily and paid monthly, at an annual rate of 0.25% of the Fund's average daily net assets attributable to Class C shares.
The distribution and shareholder services fees are used to support the expenses associated with servicing and maintaining accounts. The Distributor may compensate other parties for providing shareholder support services to investors who purchase Class A and Class C shares.
E. Dividend Disbursing and Transfer Agent: The Trust's dividend disbursing and transfer agent is DST Asset Manager Solutions, Inc. ("DST"). Pursuant to a Transfer Agency Agreement, the Trust pays DST a fee based on the number of classes, accounts and transactions relating to the Funds of the Trust.
30
Morgan Stanley Institutional Fund Trust
Annual Report — September 30, 2020
Notes to Financial Statements (cont'd)
F. Custodian Fees: State Street (the "Custodian") also serves as Custodian for the Trust in accordance with a Custodian Agreement. The Custodian holds cash, securities and other assets of the Trust as required by the Act. Custody fees are payable monthly based on assets held in custody, investment purchases and sales activity and account maintenance fees, plus reimbursement for certain out-of-pocket expenses.
G. Security Transactions and Transactions with Affiliates: For the year ended September 30, 2020, purchases and sales of investment securities for the Fund, other than long-term U.S. Government securities and short-term investments were approximately $27,300,000 and $10,611,000, respectively. For the year ended September 30, 2020, purchases and sales of long-term U.S. Government securities were approximately $25,505,000 and $25,910,000, respectively.
The Fund invests in the Institutional Class of the Morgan Stanley Institutional Liquidity Funds — Government Portfolio (the "Liquidity Funds"), an open-end management investment company managed by the Adviser. Advisory fees paid by the Fund are reduced by an amount equal to its pro-rata share of the advisory and administration fees paid by the Fund due to its investment in the Liquidity Funds. For the year ended September 30, 2020, advisory fees paid were reduced by approximately $1,000 relating to the Fund's investment in the Liquidity Funds.
A summary of the Fund's transactions in shares of affiliated investments during the year ended September 30, 2020 is as follows:
Affiliated
Investment
Company | | Value
September 30,
2019
(000) | | Purchases
at Cost
(000) | | Proceeds
from Sales
(000) | | Dividend
Income
(000) | |
Liquidity Funds | | $ | 614 | | | $ | 22,256 | | | $ | 22,752 | | | $ | 5 | | |
Affiliated
Investment
Company (cont'd) | | Realized
Gain
(Loss)
(000) | | Change in
Unrealized
Appreciation
(Depreciation)
(000) | | Value
September 30,
2020
(000) | |
Liquidity Funds | | $ | — | | | $ | — | | | $ | 118 | | |
The Fund is permitted to purchase and sell securities ("cross-trade") from and to other Morgan Stanley funds as well as other funds and client accounts for which the Adviser or an affiliate of the Adviser serves as investment adviser, pursuant to procedures approved by the Trustees in compliance with Rule 17a-7 under the Act (the "Rule"). Each cross-trade is executed at the current market price in compliance with provisions of the Rule. For the year ended September 30, 2020, the Fund did not engage in any cross-trade transactions.
The Fund has an unfunded Deferred Compensation Plan (the "Compensation Plan"), which allows each independent Trustee to defer payment of all, or a portion, of the fees he or she receives for serving on the Board of Trustees. Each eligible Trustee generally may elect to have the deferred amounts credited with a return equal to the total return on one or more of the Morgan Stanley funds that are offered as investment options under the Compensation Plan. Appreciation/depreciation and distributions received from these investments are recorded with an offsetting increase/decrease in the deferred compensation obligation and do not affect the NAV of the Fund.
H. Federal Income Taxes: It is the Fund's intention to continue to qualify as a regulated investment company and distribute all of its taxable and tax-exempt income. Accordingly, no provision for federal income taxes is required in the financial statements.
The Fund may be subject to taxes imposed by countries in which it invests. Such taxes are generally based on income and/or capital gains earned or repatriated. Taxes are accrued based on net investment income, net realized gains and net unrealized appreciation as such income and/or gains are earned. Taxes may also be based on transactions in foreign currency and are accrued based on the value of investments denominated in such currency.
FASB ASC 740-10, "Income Taxes — Overall", sets forth a minimum threshold for financial statement recognition of the benefit of a tax position taken or expected to be taken in a tax return. Management has concluded there are no significant uncertain tax positions that would require recognition in the financial statements. If applicable, the Fund recognizes interest accrued related to unrecognized tax benefits in "Interest Expense" and penalties in "Other Expenses" in the Statement of Operations. The Fund files tax returns with the U.S. Internal Revenue Service, New York and various states. Generally, each of the tax years in the four-year period ended September 30, 2020 remains subject to examination by taxing authorities.
The tax character of distributions paid may differ from the character of distributions shown for GAAP purposes due to short-term capital gains being treated as ordinary income for tax purposes. The tax character of distributions paid during fiscal years 2020 and 2019 was as follows:
2020
Distributions
Paid From: | | 2019
Distributions
Paid From: | |
Ordinary
Income
(000) | | Long-Term
Capital Gain
(000) | | Ordinary
Income
(000) | | Long-Term
Capital Gain
(000) | |
| $ | 755 | | | $ | — | | | $ | 457 | | | $ | 146 | | |
31
Morgan Stanley Institutional Fund Trust
Annual Report — September 30, 2020
Notes to Financial Statements (cont'd)
The amount and character of income and gains to be distributed are determined in accordance with income tax regulations which may differ from GAAP. These book/tax differences are either considered temporary or permanent in nature.
Temporary differences are attributable to differing book and tax treatments for the timing of the recognition of gains (losses) on certain investment transactions and the timing of the deductibility of certain expenses.
Permanent differences, due to tax adjustments on debt securities, resulted in the following reclassifications among the components of net assets at September 30, 2020:
Total
Accumulated
Loss
(000) | | Paid-in-
Capital
(000) | |
| $ | (2 | ) | | $ | 2 | | |
At September 30, 2020, the components of distributable earnings for the Fund on a tax basis were as follows:
Undistributed
Ordinary
Income
(000) | | Undistributed
Long-Term
Capital Gain
(000) | |
| $ | 184 | | | $ | — | | |
At September 30, 2020, the Fund had available for federal income tax purposes unused short-term and long-term capital losses of approximately $396,000 and $72,000, respectively, that do not have an expiration date.
To the extent that capital loss carryforwards are used to offset any future capital gains realized, no capital gains tax liability will be incurred by the Fund for gains realized and not distributed. To the extent that capital gains are offset, such gains will not be distributed to the shareholders.
I. Credit Facility: The Trust and other Morgan Stanley funds participated in a $300,000,000 committed, unsecured revolving line of credit facility (the "Facility") with State Street. This Facility is to be used for temporary emergency purposes or funding of shareholder redemption requests. The interest rate on borrowings is based on the federal funds rate or 1 month LIBOR rate plus a spread. The Facility also has a commitment fee of 0.25% per annum based on the unused portion of the Facility. During the year ended September 30, 2020, the Fund did not have any borrowings under the Facility.
J. Other: At September 30, 2020, the Fund did not have record owners of 10% or greater.
K. Market Risk: Certain impacts to public health conditions particular to the coronavirus (COVID-19) outbreak could
impact the operations and financial performance of certain of the Fund's investments. The extent of the impact to the financial performance of the Fund's investments will depend on future developments, including (i) the duration and spread of the outbreak, (ii) the restrictions and advisories, (iii) the effects on the financial markets, and (iv) the effects on the economy overall, all of which are highly uncertain and cannot be predicted. If the financial performance of the Fund's investments is impacted because of these factors for an extended period, the Fund's investment results may be adversely affected.
L. LIBOR Risk: The Fund's investments, payment obligations and financing terms may be based on floating rates, such as London Interbank Offer Rate ("LIBOR"), Euro Interbank Offered Rate and other similar types of reference rates (each, a "Reference Rate"). These Reference Rates are generally intended to represent the rate at which contributing banks may obtain short-term borrowings from each other within certain financial markets. On July 27, 2017, the Chief Executive of the UK Financial Conduct Authority ("FCA"), which regulates LIBOR, announced that the FCA will no longer persuade nor require banks to submit rates for the calculation of LIBOR and certain other Reference Rates after 2021. Such announcement indicates that the continuation of LIBOR and other Reference Rates on the current basis cannot and will not be guaranteed after the end of 2021. This announcement and any additional regulatory or market changes may have an adverse impact on the Fund or its investments.
In advance of 2022, regulators and market participants are currently engaged in identifying successor Reference Rates ("Alternative Reference Rates"). Additionally, prior to the end of 2021, it is expected that market participants will focus on the transition mechanisms by which the Reference Rates in existing contracts or instruments may be amended, whether through marketwide protocols, fallback contractual provisions, bespoke negotiations or amendments or otherwise. Nonetheless, the termination of certain Reference Rates presents risks to the Fund. At this time, it is not possible to completely identify or predict the effect of any such changes, any establishment of Alternative Reference Rates or any other reforms to Reference Rates that may be enacted in the UK or elsewhere. The elimination of a Reference Rate or any other changes or reforms to the determination or supervision of Reference Rates could have an adverse impact on the market for or value of any securities or payments linked to those Reference Rates and other financial obligations held by the Fund or on its overall financial condition or results of operations.
32
Morgan Stanley Institutional Fund Trust
Annual Report — September 30, 2020
Report of Independent Registered Public Accounting Firm
To the Shareholders and Board of Trustees of
Morgan Stanley Institutional Fund Trust —
Strategic Income Portfolio
Opinion on the Financial Statements
We have audited the accompanying statement of assets and liabilities of Strategic Income Portfolio (the "Fund") (one of the funds constituting Morgan Stanley Institutional Fund Trust (the "Trust")), including the portfolio of investments, as of September 30, 2020, and the related statement of operations for the year then ended, the statements of changes in net assets for each of the two years in the period then ended, the financial highlights for each of the five years in the period then ended and the related notes (collectively referred to as the "financial statements"). In our opinion, the financial statements present fairly, in all material respects, the financial position of Strategic Income Portfolio (one of the funds constituting Morgan Stanley Institutional Fund Trust) at September 30, 2020, the results of its operations for the year then ended, the changes in its net assets for each of the two years in the period then ended and its financial highlights for each of the five years in the period then ended, in conformity with U.S. generally accepted accounting principles.
Basis for Opinion
These financial statements are the responsibility of the Trust's management. Our responsibility is to express an opinion on the Fund's financial statements based on our audits. We are a public accounting firm registered with the Public Company Accounting Oversight Board (United States) ("PCAOB") and are required to be independent with respect to the Trust in accordance with the U.S. federal securities law and the applicable rules and regulations of the Securities and Exchange Commission and the PCAOB.
We conducted our audits in accordance with the standards of the PCAOB. Those standards require that we plan and perform the audit to obtain reasonable assurance about whether the financial statements are free of material misstatement, whether due to error or fraud. The Trust is not required to have, nor were we engaged to perform, an audit of the Trust's internal control over financial reporting. As part of our audits we are required to obtain an understanding of internal control over financial reporting but not for the purpose of expressing an opinion on the effectiveness of the Trust's internal control over financial reporting. Accordingly, we express no such opinion.
Our audits included performing procedures to assess the risks of material misstatement of the financial statements, whether due to error or fraud, and performing procedures that respond to those risks. Such procedures included examining, on a test basis, evidence regarding the amounts and disclosures in the financial statements. Our procedures included confirmation of securities owned as of September 30, 2020 by correspondence with the custodian and brokers or by other appropriate auditing procedures where replies from brokers were not received. Our audits also included evaluating the accounting principles used and significant estimates made by management, as well as evaluating the overall presentation of the financial statements. We believe that our audits provide a reasonable basis for our opinion.

We have served as the auditor of one or more Morgan Stanley investment companies since 2000.
Boston, Massachusetts
November 24, 2020
33
Morgan Stanley Institutional Fund Trust
Annual Report — September 30, 2020
Investment Advisory Agreement Approval (unaudited)
Nature, Extent and Quality of Services
The Board reviewed and considered the nature and extent of the investment advisory services provided by the Adviser under the advisory agreement, including portfolio management, investment research and equity and fixed income securities trading. The Board also reviewed and considered the nature and extent of the non-advisory, administrative services provided by the Administrator under the administration agreement, including accounting, operations, clerical, bookkeeping, compliance, business management and planning, legal services and the provision of supplies, office space and utilities at the Adviser's expense. The Board also considered the Adviser's investment in personnel and infrastructure that benefits the Fund. (The Adviser and Administrator together are referred to as the "Adviser" and the advisory and administration agreements together are referred to as the "Management Agreement.") The Board also considered that the Adviser serves a variety of other investment advisory clients and has experience overseeing service providers. The Board also compared the nature of the services provided by the Adviser with similar services provided by non-affiliated advisers as prepared by Broadridge Financial Solutions, Inc. ("Broadridge").
The Board reviewed and considered the qualifications of the portfolio managers, the senior administrative managers and other key personnel of the Adviser who provide the advisory and administrative services to the Fund. The Board determined that the Adviser's portfolio managers and key personnel are well qualified by education and/or training and experience to perform the services in an efficient and professional manner. The Board concluded that the nature and extent of the advisory and administrative services provided were necessary and appropriate for the conduct of the business and investment activities of the Fund and supported its decision to approve the Management Agreement.
Performance, Fees and Expenses of the Fund
The Board reviewed the performance, fees and expenses of the Fund compared to its peers, as prepared by Broadridge, and to appropriate benchmarks where applicable. The Board discussed with the Adviser the performance goals and the actual results achieved in managing the Fund. When considering a fund's performance, the Board and the Adviser place emphasis on trends and longer-term returns (focusing on one-year, three-year and five-year performance, as of December 31, 2019, or since inception, as applicable). When a fund underperforms its benchmark and/or its peer group average, the Board and the Adviser discuss the causes of such underperformance and, where necessary, they discuss specific changes to investment strategy or investment personnel. The Board noted that the Fund's performance was better than its peer group average for three- and five-year periods but below its peer group average for the one-year period. The Board discussed with the Adviser the level of the advisory and administration fees (together, the "management fee") for this Fund relative to comparable funds and/or other accounts advised by the Adviser and/or compared to its peers as prepared by Broadridge. In addition to the management fee, the Board also reviewed the Fund's total expense ratio. When a fund's management fee and/or its total expense ratio are higher than its peers, the Board and the Adviser discuss the reasons for this and, where appropriate, they discuss possible waivers and/or caps. The Board noted that the Fund's management fee was lower than its peer group average and the total expense ratio was higher than its peer group average. After discussion, the Board concluded that the Fund's (i) performance and management fee were competitive with its peer group averages and (ii) total expense ratio was acceptable.
Economies of Scale
The Board considered the size and growth prospects of the Fund and how that relates to the Fund's total expense ratio and particularly the Fund's management fee rate, which includes a breakpoint. In conjunction with its review of the Adviser's profitability, the Board discussed with the Adviser how a change in assets can affect the efficiency or effectiveness of managing the Fund and whether the management fee level is appropriate relative to current and projected asset levels and/or whether the management fee structure reflects economies of scale as asset levels change. The Board has determined that its review of the actual and/or potential economies of scale of the Fund supports its decision to approve the Management Agreement.
Profitability of the Adviser and Affiliates
The Board considered information concerning the costs incurred and profits realized by the Adviser and its affiliates during the last year from their relationship with the Fund and during the last two years from their relationship with the Morgan Stanley Fund Complex and reviewed with the Adviser the cost allocation methodology used to determine the profitability of the Adviser and affiliates. The Board has determined that its review of the analysis of the Adviser's expenses and profitability supports its decision to approve the Management Agreement.
34
Morgan Stanley Institutional Fund Trust
Annual Report — September 30, 2020
Investment Advisory Agreement Approval (unaudited) (cont'd)
Other Benefits of the Relationship
The Board considered other direct and indirect benefits to the Adviser and/or its affiliates derived from their relationship with the Fund and other funds advised by the Adviser. These benefits may include, among other things, fees for trading, distribution and/or shareholder servicing and for transaction processing and reporting platforms used by securities lending agents, and research received by the Adviser generated from commission dollars spent on funds' portfolio trading. The Board reviewed with the Adviser these arrangements and the reasonableness of the Adviser's costs relative to the services performed. The Board has determined that its review of the other benefits received by the Adviser or its affiliates supports its decision to approve the Management Agreement.
Resources of the Adviser and Historical Relationship Between the Fund and the Adviser
The Board considered whether the Adviser is financially sound and has the resources necessary to perform its obligations under the Management Agreement. The Board also reviewed and considered the historical relationship between the Fund and the Adviser, including the organizational structure of the Adviser, the policies and procedures formulated and adopted by the Adviser for managing the Fund's operations and the Board's confidence in the competence and integrity of the senior managers and key personnel of the Adviser. The Board concluded that the Adviser has the financial resources necessary to fulfill its obligations under the Management Agreement and that it is beneficial for the Fund to continue its relationship with the Adviser.
Other Factors and Current Trends
The Board considered the controls and procedures adopted and implemented by the Adviser and monitored by the Fund's Chief Compliance Officer and concluded that the conduct of business by the Adviser indicates a good faith effort on its part to adhere to high ethical standards in the conduct of the Fund's business.
As part of the Board's review, the Board received information from management on the impact of COVID-19 on the firm generally and the Adviser and the Fund in particular including, among other information, the pandemic's current and expected impact on the Fund's performance and operations.
General Conclusion
After considering and weighing all of the above factors, with various written materials and verbal information presented by the Adviser, the Board concluded that it would be in the best interest of the Fund and its shareholders to approve renewal of the Management Agreement for another year. In reaching this conclusion the Board did not give particular weight to any single piece of information or factor referenced above. The Board considered these factors and information over the course of the year and in numerous meetings, some of which were in executive session with only the independent Board members and their counsel present. It is possible that individual Board members may have weighed these factors, and the information presented, differently in reaching their individual decisions to approve the Management Agreement.
35
Morgan Stanley Institutional Fund Trust
Annual Report — September 30, 2020
Liquidity Risk Management Program (unaudited)
In compliance with Rule 22e-4 under the Investment Company Act of 1940, as amended (the "Liquidity Rule"), the Fund has adopted and implemented a liquidity risk management program (the "Program"), which is reasonably designed to assess and manage the risk that the Fund could not meet requests to redeem shares issued by the Fund without significant dilution of remaining investors' interests in the Fund (i.e., liquidity risk). The Fund's Board of Trustees (the "Board") previously approved the designation of the Liquidity Risk Subcommittee (the "LRS") as Program administrator. The LRS is comprised of representatives from various divisions within Morgan Stanley Investment Management.
At a meeting held on April 22-23, 2020, the Board reviewed a written report prepared by the LRS that addressed the Program's operation and assessed its adequacy, and effectiveness of implementation for the period from December 1, 2018, through December 31, 2019, as required under the Liquidity Rule. The report concluded that the Program operated effectively and was adequately and effectively implemented in all material aspects, and that the relevant controls and safeguards were appropriately designed to enable the LRS to administer the Program in compliance with the Liquidity Rule.
In accordance with the Program, the LRS assessed each Fund's liquidity risk no less frequently than annually taking into consideration certain factors, as applicable, such as (i) investment strategy and liquidity of portfolio investments, (ii) short-term and long-term cash flow projections and (iii) holdings of cash and cash equivalents and borrowing arrangements and other funding sources. Certain factors are considered under both normal and reasonably foreseeable stressed conditions.
Each Fund portfolio investment is classified into one of four liquidity categories, which classification is assessed at least monthly by the LRS. The classification is based on a determination of the number of days it is reasonably expected to take to convert the investment into cash, or sell or dispose of the investment, in current market conditions without significantly changing the market value of the investment. Liquidity classification determinations take into account various market, trading and investment-specific considerations, as well as market depth, and in some cases utilize third-party vendor data.
The Liquidity Rule limits a fund's investments in illiquid investments to 15% of its net assets and requires funds that do not primarily hold assets that are highly liquid investments to determine and maintain a minimum percentage of the fund's net assets to be invested in highly liquid investments (highly liquid investment minimum or "HLIM"). The LRS believes that the Program includes provisions reasonably designed to review, monitor and comply with the 15% limit on illiquid investments and for determining, periodically reviewing and complying with the HLIM requirement, as applicable.
There can be no assurance that the Program will achieve its objectives under all circumstances in the future. Please refer to the Fund's prospectus for more information regarding the Fund's exposure to liquidity risk and other risks to which it may be subject.
36
Morgan Stanley Institutional Fund Trust
Annual Report — September 30, 2020
Privacy Notice (unaudited) April 2019
FACTS | | WHAT DOES MSIM DO WITH YOUR PERSONAL INFORMATION? | |
Why? | | Financial companies choose how they share your personal information. Federal law gives consumers the right to limit some but not all sharing. Federal law also requires us to tell you how we collect, share, and protect your personal information. Please read this notice carefully to understand what we do. | |
What? | | The types of personal information we collect and share depend on the product or service you have with us. This information can include:
n Social Security number and income
n investment experience and risk tolerance
n checking account number and wire transfer instructions | |
How? | | All financial companies need to share customers' personal information to run their everyday business. In the section below, we list the reasons financial companies can share their customers' personal information; the reasons MSIM chooses to share; and whether you can limit this sharing. | |
Reasons we can share your personal information | | Does MSIM share? | | Can you limit this sharing? | |
For our everyday business purposes —
such as to process your transactions, maintain your account(s), respond to court orders and legal investigations, or report to credit bureaus | | Yes | | No | |
For our marketing purposes —
to offer our products and services to you | | Yes | | No | |
For joint marketing with other financial companies | | No | | We don't share | |
For our affiliates' everyday business purposes —
information about your transactions and experiences | | Yes | | No | |
For our affiliates' everyday business purposes —
information about your creditworthiness | | No | | We don't share | |
For our affiliates to market to you | | No | | We don't share | |
For non-affiliates to market to you | | No | | We don't share | |
Questions? Call toll-free (844) 312-6327 or email: imprivacyinquiries@morganstanley.com
37
Morgan Stanley Institutional Fund Trust
Annual Report — September 30, 2020
Privacy Notice (unaudited) (cont'd) April 2019
Who we are
Who is providing this notice? | | Morgan Stanley Investment Management, Inc. and its affiliated registered investment advisers, registered broker-dealers, and registered and unregistered funds ("MSIM") | |
What we do
How does MSIM protect my personal information? | | To protect your personal information from unauthorized access and use, we use security measures that comply with federal law. These measures include computer safeguards and secured files and buildings. We have policies governing the proper handling of customer information by personnel and requiring third parties that provide support to adhere to appropriate security standards with respect to such information. | |
How does MSIM collect my personal information? | | We collect your personal information, for example, when you
n open an account or make deposits or withdrawals from your account
n buy securities from us or make a wire transfer
n give us your contact information
We also collect your personal information from others, such as credit bureaus, affiliates, or other companies. | |
Why can't I limit all sharing? | | Federal law gives you the right to limit only
n sharing for affiliates' everyday business purposes — information about your creditworthiness
n affiliates from using your information to market to you
n sharing for non-affiliates to market to you
State laws and individual companies may give you additional rights to limit sharing. See below for more on your rights under state law. | |
Definitions
Affiliates | | Companies related by common ownership or control. They can be financial and non-financial companies.
n Our affiliates include companies with a Morgan Stanley name and financial companies such as Morgan Stanley Smith Barney LLC and Morgan Stanley & Co. | |
Non-affiliates | | Companies not related by common ownership or control. They can be financial and non-financial companies.
n MSIM does not share with non-affiliates so they can market to you. | |
Joint marketing | | A formal agreement between non-affiliated financial companies that together market financial products or services to you.
n MSIM doesn't jointly market | |
Other important information
Vermont: Except as permitted by law, we will not share personal information we collect about Vermont residents with Non-affiliates unless you provide us with your written consent to share such information.
California: Except as permitted by law, we will not share personal information we collect about California residents with Non-affiliates and we will limit sharing such personal information with our Affiliates to comply with California privacy laws that apply to us.
38
Morgan Stanley Institutional Fund Trust
Annual Report — September 30, 2020
Trustee and Officer Information (unaudited)
Independent Trustees:
Name, Address and Birth Year
of Independent Trustee | | Position(s)
Held with
Registrant | | Length of Time
Served* | | Principal Occupation(s) During Past 5 Years
and Other Relevant Professional Experience | | Number of
Funds in
Fund Complex
Overseen by
Independent
Trustee** | | Other Directorships
Held by Independent
Trustee*** | |
Frank L. Bowman
c/o Perkins Coie LLP
Counsel to the Independent Trustees
1155 Avenue of the Americas, 22nd Floor
New York, NY 10036
Birth Year 1944 | | Trustee | | Since
August
2006 | | President, Strategic Decisions, LLC (consulting) (since February 2009); Director or Trustee of various Morgan Stanley Funds (since August 2006); Chairperson of the Compliance and Insurance Committee (since October 2015); formerly, Chairperson of the Insurance Sub-Committee of the Compliance and Insurance Committee (2007-2015); served as President and Chief Executive Officer of the Nuclear Energy Institute (policy organization) (February 2005-November 2008); retired as Admiral, U.S. Navy after serving over 38 years on active duty including 8 years as Director of the Naval Nuclear Propulsion Program in the Department of the Navy and the U.S. Department of Energy (1996-2004); served as Chief of Naval Personnel (July 1994-September 1996) and on the Joint Staff as Director of Political Military Affairs (June 1992-July 1994); knighted as Honorary Knight Commander of the Most Excellent Order of the British Empire; awarded the Officier de l'Orde National du Mérite by the French Government; elected to the National Academy of Engineering (2009). | | | 86 | | | Director of Naval and Nuclear Technologies LLP; Director Emeritus of the Armed Services YMCA; Member of the National Security Advisory Council of the Center for U.S. Global Engagement and a member of the CNA Military Advisory Board; Trustee of Fairhaven United Methodist Church; Member of the Board of Advisors of the Dolphin Scholarship Foundation; Director of other various non-profit organizations; Formerly, Director of BP p.l.c. (November 2010-May 2019). | |
Kathleen A. Dennis
c/o Perkins Coie LLP
Counsel to the Independent Trustees
1155 Avenue of the Americas, 22nd Floor
New York, NY 10036
Birth Year 1953 | | Trustee | | Since
August
2006 | | President, Cedarwood Associates (mutual fund and investment management consulting) (since July 2006); Chairperson of the Liquidity and Alternatives Sub-Committee of the Investment Committee (since October 2006) and Director or Trustee of various Morgan Stanley Funds (since August 2006); formerly, Senior Managing Director of Victory Capital Management (1993-2006). | | | 86 | | | Director of various
non-profit organizations. | |
Nancy C. Everett
c/o Perkins Coie LLP
Counsel to the Independent Trustees
1155 Avenue of the Americas, 22nd Floor
New York, NY 10036
Birth Year 1955 | | Trustee | | Since
January
2015 | | Chief Executive Officer, Virginia Commonwealth University Investment Company (since November 2015); Owner, OBIR, LLC (institutional investment management consulting) (since June 2014); formerly, Managing Director, BlackRock, Inc. (February 2011-December 2013); and Chief Executive Officer, General Motors Asset Management (a/k/a Promark Global Advisors, Inc.) (June 2005-May 2010). | | | 87 | | | Formerly, Member of Virginia Commonwealth University School of Business Foundation (2005-2016); Member of Virginia Commonwealth University Board of Visitors (2013-2015); Member of Committee on Directors for Emerging Markets Growth Fund, Inc. (2007-2010); Chairperson of Performance Equity Management, LLC (2006-2010); and Chairperson, GMAM Absolute Return Strategies Fund, LLC (2006-2010). | |
39
Morgan Stanley Institutional Fund Trust
Annual Report — September 30, 2020
Trustee and Officer Information (unaudited) (cont'd)
Independent Trustees: (cont'd)
Name, Address and Birth Year
of Independent Trustee | | Position(s)
Held with
Registrant | | Length of Time
Served* | | Principal Occupation(s) During Past 5 Years
and Other Relevant Professional Experience | | Number of
Funds in
Fund Complex
Overseen by
Independent
Trustee** | | Other Directorships
Held by Independent
Trustee*** | |
Jakki L. Haussler
c/o Perkins Coie LLP
Counsel to the Independent Trustees
1155 Avenue of the Americas, 22nd Floor
New York, NY 10036
Birth Year 1957 | | Trustee | | Since
January
2015 | | Chairman, Opus Capital Group (since January 1996); formerly, Chief Executive Officer, Opus Capital Group (1996-2019); Director, Capvest Venture Fund, LP (May 2000-December 2011); Partner, Adena Ventures, LP (July 1999-December 2010); Director, The Victory Funds (February 2005-July 2008). | | | 87 | | | Director of Service Corporation International and Member, Audit Committee and Investment Committee; Director of Cincinnati Bell Inc. and Member, Audit Committee and Governance and Nominating Committee; Director of Northern Kentucky University Foundation and Member, Investment Committee; Member of Chase College of Law Transactional Law Practice Center Board of Advisors; Director of Chase College of Law Board of Visitors; formerly, Member, University of Cincinnati Foundation Investment Committee; Member, Miami University Board of Visitors (2008-2011); Trustee of Victory Funds (2005-2008) and Chairman, Investment Committee (2007-2008); Member, Service Provider Committee (2005-2008) and Director of Best Transport (2006-2019). | |
Dr. Manuel H. Johnson
c/o Johnson Smick
International, Inc.
220 I Street, NE — Suite 200 Washington, D.C. 20002
Birth Year 1949 | | Trustee | | Since
July
1991 | | Senior Partner, Johnson Smick International, Inc. (consulting firm); Chairperson of the Investment Committee (since October 2006) and Director or Trustee of various Morgan Stanley Funds (since July 1991); Co-Chairman and a founder of the Group of Seven Council (G7C) (international economic commission); formerly, Chairperson of the Audit Committee (July 1991-September 2006), Vice Chairman of the Board of Governors of the Federal Reserve System and Assistant Secretary of the U.S. Treasury. | | | 86 | | | Director of NVR, Inc. (home construction). | |
Joseph J. Kearns
c/o Perkins Coie LLP
Counsel to the Independent Trustees
1155 Avenue of the Americas, 22nd Floor
New York, NY 10036
Birth Year 1942 | | Trustee | | Since
August
1994 | | Senior Adviser, Kearns & Associates LLC (investment consulting); Chairperson of the Audit Committee (since October 2006) and Director or Trustee of various Morgan Stanley Funds (since August 1994); Director, Rubicorn Investments (since February 2019); formerly, Deputy Chairperson of the Audit Committee (July 2003-September 2006) and Chairperson of the Audit Committee of various Morgan Stanley Funds (since August 1994); CFO of the J. Paul Getty Trust (1982-1999). | | | 87 | | | Prior to August 10, 2016, Director of Electro Rent Corporation (equipment leasing); Prior to December 31, 2013, Director of The Ford Family Foundation. | |
40
Morgan Stanley Institutional Fund Trust
Annual Report — September 30, 2020
Trustee and Officer Information (unaudited) (cont'd)
Independent Trustees: (cont'd)
Name, Address and Birth Year
of Independent Trustee | | Position(s)
Held with
Registrant | | Length of Time
Served* | | Principal Occupation(s) During Past 5 Years
and Other Relevant Professional Experience | | Number of
Funds in
Fund Complex
Overseen by
Independent
Trustee** | | Other Directorships
Held by Independent
Trustee*** | |
Michael F. Klein
c/o Perkins Coie LLP
Counsel to the Independent Trustees
1155 Avenue of the Americas, 22nd Floor
New York, NY 10036
Birth Year 1958 | | Trustee | | Since
August
2006 | | Managing Director, Aetos Alternatives Management, LP (since March 2000); Co-President, Aetos Alternatives Management, LP (since January 2004) and Co-Chief Executive Officer of Aetos Alternatives Management, LP (since August 2013); Chairperson of the Fixed Income Sub-Committee of the Investment Committee (since October 2006) and Director or Trustee of various Morgan Stanley Funds (since August 2006); formerly, Managing Director, Morgan Stanley & Co. Inc. and Morgan Stanley Dean Witter Investment Management and President, various Morgan Stanley Funds (June 1998-March 2000); Principal, Morgan Stanley & Co. Inc. and Morgan Stanley Dean Witter Investment Management (August 1997-December 1999). | | | 86 | | | Director of certain investment funds managed or sponsored by Aetos Alternatives Management, LP; Director of Sanitized AG and Sanitized Marketing AG (specialty chemicals). | |
Patricia Maleski
c/o Perkins Coie LLP
Counsel to the Independent Trustees
1155 Avenue of the Americas, 22nd Floor
New York, NY 10036
Birth Year 1960 | | Trustee | | Since
January
2017 | | Managing Director, JPMorgan Asset Management (2004-2016); Oversight and Control Head of Fiduciary and Conflicts of Interest Program (2015-2016); Chief Control Officer-Global Asset Management (2013-2015); President, JPMorgan Funds (2010-2013); Chief Administrative Officer (2004-2013); various other positions including Treasurer and Board Liaison (since 2001). | | | 87 | | | None. | |
W. Allen Reed
c/o Perkins Coie LLP
Counsel to the Independent Trustees
1155 Avenue of the Americas, 22nd Floor
New York, NY 10036
Birth Year 1947 | | Chair of the Board and Trustee | | Chair of the Boards since August 2020 and Trustee since August 2006 | | Chair of the Boards of various Morgan Stanley Funds (since August 2020); Chairperson of the Governance Committee; Chairperson of the Equity Sub-Committee of the Investment Committee (since October 2006) and Director or Trustee of various Morgan Stanley Funds (since August 2006); formerly, Vice Chair of the Boards of various Morgan Stanley Funds (January 2020-August 2020); President and Chief Executive Officer of General Motors Asset Management; Chairman and Chief Executive Officer of the GM Trust Bank and Corporate Vice President of General Motors Corporation (August 1994-December 2005). | | | 86 | | | Formerly, Director of Legg Mason, Inc. (2006-2019); and Director of the Auburn University Foundation (2010-2015). | |
* This is the earliest date the Trustee began serving the Morgan Stanley Funds. Each Trustee serves an indefinite term, until his or her successor is elected.
** The Fund Complex includes (as of December 31, 2019) all open-end and closed-end funds (including all of their portfolios) advised by Morgan Stanley Investment Management Inc. (the "Adviser") and any funds that have an adviser that is an affiliated person of the Adviser (including, but not limited to, Morgan Stanley AIP GP LP).
*** This includes any directorships at public companies and registered investment companies held by the Trustee at any time during the past five years.
41
Morgan Stanley Institutional Fund Trust
Annual Report — September 30, 2020
Trustee and Officer Information (unaudited) (cont'd)
Executive Officers:
Name, Address and
Birth Year of Executive Officer | | Position(s) Held
with
Registrant | | Length of
Time Served* | | Principal Occupation(s) During Past 5 Years | |
John H. Gernon
522 Fifth Avenue
New York, NY 10036
Birth Year 1963 | | President and Principal Executive Officer | | Since September 2013 | | President and Principal Executive Officer of the Equity and Fixed Income Funds and the Morgan Stanley AIP Funds (since September 2013) and the Liquidity Funds and various money market funds (since May 2014) in the Fund Complex; Managing Director of the Adviser; Head of Public Markets Product Development (since 2006). | |
Timothy J. Knierim
522 Fifth Avenue
New York, NY 10036
Birth Year 1959 | | Chief Compliance Officer | | Since December 2016 | | Managing Director of the Adviser and various entities affiliated with the Adviser; Chief Compliance Officer of various Morgan Stanley Funds and the Adviser (since December 2016) and Chief Compliance Officer of Morgan Stanley AIP GP LP (since 2014). Formerly, Managing Director and Deputy Chief Compliance Officer of the Adviser (2014-2016); and formerly, Chief Compliance Officer of Prudential Investment Management, Inc. (2007-2014). | |
Francis J. Smith
522 Fifth Avenue
New York, NY 10036
Birth Year 1965 | | Treasurer and Principal Financial Officer | | Treasurer since July 2003 and Principal Financial Officer since September 2002 | | Managing Director of the Adviser and various entities affiliated with the Adviser; Treasurer (since July 2003) and Principal Financial Officer of various Morgan Stanley Funds (since September 2002). | |
Mary E. Mullin
522 Fifth Avenue
New York, NY 10036
Birth Year 1967 | | Secretary | | Since
June
1999 | | Managing Director of the Adviser; Secretary of various Morgan Stanley Funds (since June 1999). | |
Michael J. Key
522 Fifth Avenue
New York, NY 10036
Birth Year 1979 | | Vice President | | Since
June
2017 | | Vice President of the Equity and Fixed Income Funds, Liquidity Funds, various money market funds and the Morgan Stanley AIP Funds in the Fund Complex (since June 2017); Executive Director of the Adviser; Head of Product Development for Equity and Fixed Income Funds (since August 2013). | |
* This is the earliest date the officer began serving the Morgan Stanley Funds. Each officer serves a one-year term, until his or her successor is elected and qualifies.
42
Morgan Stanley Institutional Fund Trust
Annual Report — September 30, 2020
Adviser and Administrator
Morgan Stanley Investment Management Inc.
522 Fifth Avenue
New York, New York 10036
Distributor
Morgan Stanley Distribution, Inc.
522 Fifth Avenue
New York, New York 10036
Dividend Disbursing and Transfer Agent
DST Asset Manager Solutions, Inc.
2000 Crown Colony Drive
Quincy, Massachusetts 02169
Custodian
State Street Bank and Trust Company
One Lincoln Street
Boston, Massachusetts 02111
Legal Counsel
Dechert LLP
1095 Avenue of the Americas
New York, New York 10036
Counsel to the Independent Trustees
Perkins Coie LLP
1155 Avenue of the Americas,
22nd Floor
New York, New York 10036
Independent Registered Public Accounting Firm
Ernst & Young LLP
200 Clarendon Street
Boston, Massachusetts 02116
Reporting to Shareholders
Each Morgan Stanley fund provides a complete schedule of portfolio holdings in its Semi-Annual and the Annual Reports within 60 days of the end of the fund's second and fourth fiscal quarters. The Semi-Annual and Annual Reports are filed electronically with the Securities and Exchange Commission ("SEC") on Form N-CSRS and Form N-CSR, respectively. Morgan Stanley also delivers the Semi-Annual and Annual Reports to fund shareholders and makes these reports available on its public website, www.morganstanley.com/im/shareholderreports. Each Morgan Stanley non-money market fund also files a complete schedule of portfolio holdings with the SEC for the fund's first and third fiscal quarters as an attachment to Form N-PORT. Morgan Stanley does not deliver the reports for the first and third fiscal quarters to shareholders, nor are the reports posted to the Morgan Stanley public website. However, the holdings for each money market fund are posted to the Morgan Stanley public website. You may obtain the Form N-PORT filings (as well as the Form N-CSR and N-CSRS filings) by accessing the SEC's website, www.sec.gov. You can also request copies of these materials, upon payment of a duplicating fee, by electronic request at the SEC's email address (publicinfo@sec.gov).
Proxy Voting Policies and Procedures and Proxy Voting Record
You may obtain a copy of the Trust's Proxy Voting Policy and Procedures and information regarding how the Trust voted proxies relating to portfolio securities during the most recent twelve-month period ended June 30, without charge, upon request, by calling toll free 1 (800) 548-7786 or by visiting our website at www.morganstanley.com/im/shareholderreports. This information is also available on the SEC's website at www.sec.gov.
This report is authorized for distribution only when preceded or accompanied by a prospectus or summary prospectus of the applicable fund of Morgan Stanley Institutional Fund Trust, which describes in detail the fund's investment policies, risks, fees and expenses. Please read the prospectus carefully before you invest or send money. For additional information, including information regarding the investments comprising the Fund, please visit our website at www.morganstanley.com/im/shareholderreports or call toll free 1 (800) 548-7786.
43
Printed in U.S.A.
This Report has been prepared for shareholders and may be distributed to others only if preceded or accompanied by a current prospectus.
Morgan Stanley Investment Management Inc.
522 Fifth Avenue
New York, New York 10036
© 2020 Morgan Stanley. Morgan Stanley Distribution, Inc.

IFTSIPANN
3298681 EXP 11.30.21

Morgan Stanley Institutional Fund Trust
Ultra-Short Income Portfolio
Annual Report
September 30, 2020
Beginning on January 1, 2021, as permitted by regulations adopted by the Securities and Exchange Commission ("SEC"), paper copies of the Fund's Annual and Semi-Annual Reports to Shareholders ("Shareholder Reports") will no longer be sent by mail, unless you specifically request paper copies of the Shareholder Reports from the Fund or from your financial intermediary, such as a broker-dealer or a bank. Instead, the Shareholder Reports will be made available on the Fund's website, https://www.morganstanley.com/im/shareholderreports and you will be notified by mail each time a Shareholder Report is posted and provided with a website link to access the Shareholder Report. If you already elected to receive Shareholder Reports electronically, you will not be affected by this change and you need not take any action. You may elect to receive Shareholder Reports and other communications from the Fund electronically anytime by contacting your financial intermediary or, if you are a direct investor, please follow the instructions on the envelope.
Beginning on January 1, 2019, you may elect to receive all future Shareholder Reports in paper free of charge. If you invest through a financial intermediary, you can contact your financial intermediary to request that you continue to receive paper copies of your Shareholder Reports. If you invest directly with the Fund, please follow the instructions on the envelope to let the Fund know you wish to continue receiving paper copies of your Shareholder Reports. Your election to receive Shareholder Reports in paper will apply to all funds held in your account if you invest through your financial intermediary or all funds held with the fund complex if you invest directly with a fund.

Morgan Stanley Institutional Fund Trust
Annual Report — September 30, 2020
Shareholders' Letter | | | 2 | | |
Expense Example | | | 3 | | |
Investment Overview | | | 4 | | |
Portfolio of Investments | | | 9 | | |
Statement of Assets and Liabilities | | | 13 | | |
Statement of Operations | | | 14 | | |
Statements of Changes in Net Assets | | | 15 | | |
Financial Highlights | | | 16 | | |
Notes to Financial Statements | | | 19 | | |
Report of Independent Registered Public Accounting Firm | | | 25 | | |
Investment Advisory Agreement Approval | | | 26 | | |
Liquidity Risk Management Program | | | 28 | | |
Privacy Notice | | | 29 | | |
Trustee and Officer Information | | | 31 | | |
This report is authorized for distribution only when preceded or accompanied by a prospectus or summary prospectus of the applicable Fund of the Morgan Stanley Institutional Fund Trust. To receive a prospectus and/or statement of additional information ("SAI"), which contains more complete information such as investment objectives, charges, expenses, policies for voting proxies, risk considerations and describes in detail each of the Fund's investment policies to the prospective investor, please call toll free 1 (800) 548-7786. Please read the prospectuses carefully before you invest or send money.
Additionally, you can access information about the Fund, including performance, characteristics and investment team commentary, through Morgan Stanley Investment Management's website: www.morganstanley.com/im/shareholderreports.
Market forecasts provided in this report may not necessarily come to pass. There is no guarantee that any sectors mentioned will continue to perform as discussed herein or that securities in such sectors will be held by the Fund in the future. There is no assurance that a fund will achieve its investment objective. Funds are subject to market risk, which is the possibility that market values of securities owned by the Fund will decline and, therefore, the value of the Fund's shares may be less than what you paid for them. Accordingly, you can lose money investing in this Fund. Please see the prospectus for more complete information on investment risks.
1
Morgan Stanley Institutional Fund Trust
Annual Report — September 30, 2020
Shareholders' Letter (unaudited)
Dear Shareholders,
We are pleased to provide this Annual Report, in which you will learn how your investment in Ultra-Short Income Portfolio (the "Fund") performed during the latest twelve-month period.
Morgan Stanley Investment Management is a client-centric, investor-led organization. Our global presence, intellectual capital, and breadth of products and services enable us to partner with investors to meet the evolving challenges of today's financial markets. We aim to deliver superior investment service and to empower our clients to make the informed decisions that help them reach their investment goals.
As always, we thank you for selecting Morgan Stanley Investment Management, and look forward to working with you in the months and years ahead.
Sincerely,

John H. Gernon
President and Principal Executive Officer
October 2020
2
Morgan Stanley Institutional Fund Trust
Annual Report — September 30, 2020
Expense Example (unaudited)
Ultra-Short Income Portfolio
As a shareholder of the Fund, you may incur two types of costs: (1) transactional costs; and (2) ongoing costs, which may include advisory fees, administration fees, distribution and shareholder services fees; and other Fund expenses. This example is intended to help you understand your ongoing costs (in dollars) of investing in the Fund and to compare these costs with the ongoing costs of investing in other mutual funds.
This example is based on an investment of $1,000 invested at the beginning of the six-month period ended September 30, 2020 and held for the entire six-month period.
Actual Expenses
The table below provides information about actual account values and actual expenses. You may use the information in this table, together with the amount you invested, to estimate the expenses that you paid over the period. Simply divide your account value by $1,000 (for example, an $8,600 account value divided by $1,000 = 8.6), then multiply the result by the number in the table under the heading entitled "Actual Expenses Paid During Period" to estimate the expenses you paid on your account during this period.
Hypothetical Example for Comparison Purposes
The table below provides information about hypothetical account values and hypothetical expenses based on the Fund's actual expense ratio and an assumed rate of return of 5% per year before expenses, which is not the Fund's actual return. The hypothetical account values and expenses may not be used to estimate the actual ending account balance or expenses you paid for the period. You may use this information to compare the ongoing costs of investing in the Fund and other funds. To do so, compare this 5% hypothetical example with the 5% hypothetical examples that appear in the shareholder reports of the other funds.
Please note that the expenses shown in the table are meant to highlight your ongoing costs only and do not reflect any transactional costs. Therefore, the information for each class in the table is useful in comparing ongoing costs only, and will not help you determine the relative total costs of owning different funds. In addition, if these transactional costs were included, your costs would have been higher.
| | | Beginning
Account
Value
4/1/20 | | Actual Ending
Account
Value
9/30/20 | | Hypothetical
Ending Account
Value | | Actual
Expenses
Paid
During
Period* | | Hypothetical
Expenses Paid
During Period* | | Net
Expense
Ratio
During
Period** | |
Ultra-Short Income Portfolio Class IR | | $ | 1,000.00 | | | $ | 1,005.50 | | | $ | 1,023.85 | | | $ | 1.15 | | | $ | 1.16 | | | | 0.23 | % | |
Ultra-Short Income Portfolio Institutional Class | | | 1,000.00 | | | | 1,006.30 | | | | 1,023.60 | | | | 1.40 | | | | 1.42 | | | | 0.28 | | |
Ultra-Short Income Portfolio Class A | | | 1,000.00 | | | | 1,005.50 | | | | 1,022.90 | | | | 2.11 | | | | 2.12 | | | | 0.42 | | |
* Expenses are calculated using each Fund Class' annualized net expense ratio (as disclosed), multiplied by the average account value over the period and multiplied by 183/366 (to reflect the most recent one-half year period).
** Annualized.
3
Morgan Stanley Institutional Fund Trust
Annual Report — September 30, 2020
Investment Overview (unaudited)
Ultra-Short Income Portfolio
The Fund seeks current income with capital preservation while maintaining liquidity.
Performance
For the fiscal year ended September 30, 2020, the Fund's Institutional Share Class had a total return based on net asset value and reinvestment of distributions per share of 0.98%, net of fees. The Fund's Institutional Share Class underperformed against the Fund's benchmark, the ICE BofA 3-Month U.S. Treasury Bill Index (the "Index"), which returned 1.10%. For the seven-day period ended September 30, 2020, the Fund's Institutional Share Class provided an annualized current yield of 0.32% (subsidized) and 0.25% (non-subsidized), while its 30-day moving average annualized yield was 0.35% (subsidized) and 0.29% (non-subsidized). The 30-day SEC yield was 0.35% (subsidized) and 0.29% (non-subsidized). The non-subsidized yield reflects what the yield would have been had a fee and/or expense waiver not been in place during the period shown. Past performance is no guarantee of future results.
Factors Affecting Performance
• At the September 2019 Federal Open Market Committee (FOMC or Committee) meeting, the Committee cut policy rates by 25 basis points to 1.75% to 2.00% as members "judged that downside risks to the outlook for economic activity had increased since their July meeting, particularly those stemming from trade policy uncertainty and conditions abroad." Separately, September 2019 witnessed a spike in overnight repo funding levels, which is not unusual given seasonal pressures related to corporate tax payments and the end of the quarter. However, a confluence of other factors such as the market absorbing an increased supply of Treasury securities after the recent lifting of the debt ceiling, exacerbated by lower bank reserves and tight bank balance sheets, raised the Secured Overnight Financing Rate as high as 5.25%.i The Federal Reserve (Fed) intervened with temporary open market operations and normalized the repo market for the remainder of September 2019.
• Third quarter 2019 gross domestic product (GDP) expanded more than expected at a 2.6% annualized rate, largely due to strength in the consumer
spending sector, the biggest part of the economy.ii After an upward revision to 208,000 jobs created in September 2019, third quarter 2019 non-farm payrolls averaged 203,000, a promising sign that workers continue to find employment opportunities.iii The jobless rate unexpectedly dropped 0.2% to 3.5% in September 2019, the lowest reading since December 1969.
• As widely expected, the Fed cut interest rates for the third time in 2019 at its October FOMC meeting. In the prepared statement, the Committee dropped its pledge to "act as appropriate to sustain the expansion," while adding in promises to monitor incoming data as members "assess the appropriate path of the target for the federal funds rate." Changes to the statement suggested that policy makers were comfortable leaving interest rates on hold in the near term, while the market ended the month pricing in less than one additional rate cut over the next year. In addition, on October 11, 2019, the Fed announced that it would begin buying $60 billion of Treasury bills per month to improve its control over monetary policy, with a goal of expanding its balance sheet to $1.7 trillion by year-end 2019. While purely technical in nature, short-end Treasuries rallied on the back of the news, further flattening the yield curve. At the same time, the Fed also announced that it will "conduct term and overnight repurchase agreement operations at least through January of next year to ensure that the supply of reserves remains ample."
• The Fed convened on December 10, 2019, for its last meeting of the calendar year. Chairman Powell and the FOMC voted to keep the federal funds rate unchanged at 1.50% to 1.75%. Chairman Powell signaled to the market that the Fed was comfortable with current policy and would take a "wait and see" approach going forward. The Federal Reserve press release stated that the current stance of monetary policy was appropriate to support economic expansion, strong labor markets and inflation near the FOMC's symmetric 2% objective. Overall, 2019 was eventful for the Fed and Chairman Powell. Entering 2019, investors expected rates to rise systematically during the year, but received quite the opposite policy action.
i Source: Bloomberg L.P.
ii Source for GDP data used in this report: Bureau of Economic Analysis and Bloomberg L.P.
iii Source for employment data used in this report: Bureau of Labor Statistics and Bloomberg L.P.
4
Morgan Stanley Institutional Fund Trust
Annual Report — September 30, 2020
Investment Overview (unaudited) (cont'd)
Ultra-Short Income Portfolio
• For the fourth quarter of 2019, GDP growth came in at 2.4% (annualized), slightly above market estimates. Personal spending and business investment were weaker, but GDP growth was aided by the housing market. Non-farm payrolls averaged 197,000 during the fourth quarter with the unemployment rate remaining low at 3.5% in December 2019.
• On January 28, 2020, the Fed held its first policy meeting of the new decade. Although the federal funds rate was unchanged at 1.50% to 1.75%, policy committee members opted to increase the interest on excess reserves (IOER) rate by 5 basis points to 1.60%. The modification was a technical adjustment done in part to move the IOER rate closer to middle of the fed funds range from the lower end where it had trended in recent months. While most commentary was left unchanged in the accompanying press release, the Fed downgraded household spending from "strong" to "moderate." Similarly, the press release indicated that inflation needs to "return" to its 2% target rather than stay "near" the target, which had been used in previous press releases. Overall, the first meeting of 2020 was benign, as Chairman Powell viewed current policy as "appropriate." He reiterated that without any material change in the data going forward, policy was likely to remain unchanged. The January 2020 Fed statement did not address the emerging coronavirus epidemic, but Chairman Powell discussed the risk to the global economy in his press conference.
• Throughout February 2020, investors flocked into relative safe-haven securities as fears of COVID-19 took center stage, sending the yield on the 10-year Treasury to its lowest level since 2016. In Europe, the entire German yield curve fell back below 0%. On February 25, 2020, the 10-year U.S. Treasury yield fell to a record low amid concern that the global spread of the virus was threatening supply chains critical to economic growth. The 30-year U.S. Treasury ended the month at record lows of 1.676%.iv
• As COVID-19 continued to spread rapidly around the world in early 2020, central bankers' fears
surrounding potential impacts began to materialize. Responding to the economic impact of the virus, the Fed conducted two unscheduled meetings in March 2020, which resulted in monetary easing and more accommodative monetary policy. The Fed lowered the target range for the federal funds rate to 0.00% to 0.25%. In addition to the rate cut, the Fed implemented several facilities to alleviate stresses in the marketplace. Most notably for short-term fixed income markets, these include the Money Market Mutual Fund Liquidity Facility (MMLF), Commercial Paper Funding Facility (CPFF) and Primary Dealer Credit Facility (PDCF). The Fed's overall goal was to ease the flow of credit across the broader fixed income markets and increase market confidence with their actions. Additionally, the FOMC announced an open-ended quantitative easing program that will increase its holdings of Treasury securities, agency mortgage-backed securities and commercial mortgage-backed securities in the amount needed to support the smooth functioning of these markets. The governmental actions taken, not only on the monetary side but also through fiscal stimulus aid, served to calm markets and support improved liquidity in the market.
• First quarter 2020 GDP growth came in at –5.0% and initial jobless claims surged to around 30 million. While extraordinarily weak readings were anticipated as a result of the temporary pause across many parts of the economy, both data points underperformed expectations. Fed Chairman Powell noted in his press conference that the current policy was appropriate while acknowledging that "the ongoing public health crisis will weigh heavily on economic activity, employment and inflation in the near term, and poses considerable risks to the economic outlook over the medium term." The chairman also noted that the Committee will "maintain this target range until it is confident that the economy has weathered recent events."
• At the April 29, 2020 meeting, the FOMC decided to keep the target range for the federal funds rate unchanged at 0.00% to 0.25%. This was the first
iv Source: Bloomberg L.P.
5
Morgan Stanley Institutional Fund Trust
Annual Report — September 30, 2020
Investment Overview (unaudited) (cont'd)
Ultra-Short Income Portfolio
meeting since tangible economic data had been collected on the coronavirus impact. The Committee noted that the virus had catalyzed significant job losses and steep drawdowns in both consumer spending and consumer confidence.
• As expected, the FOMC kept the range for the federal funds rate unchanged at 0.00% to 0.25% at the conclusion of its June 2020 meeting. The FOMC pledged to "continue to monitor the implications of incoming information for the economic outlook, including information related to public health, as well as global developments and muted inflation pressures, and will use its tools and act as appropriate to support the economy." The press release stated the FOMC will "increase its holdings" of Treasury securities and agency mortgage-backed securities at paces of $80 billion and $40 billion, respectively. However, publicizing the dollar figure diverges from previous meetings, which stated purchases would be conducted "in the amounts needed." In their updated dot plot, officials unanimously expected to keep rates at current levels through 2021, while 15 of the 17 officials expected rates to remain unchanged through 2022. As a result, the average federal funds forecast for 2020 and 2021 fell significantly.
• Due to business shutdowns and stay-at-home orders, second quarter 2020 GDP contracted by –32.9%, the sharpest downturn since the 1940s. Personal spending fell by –34.5%, the largest slump on record. While the economic hit was well anticipated, the path of the recovery is linked to the complexity of the pandemic impact across the country. Ongoing unemployment benefits still remained high at 17 million at the end of July 2020, and the unemployment rate was at 10.2%. Personal spending has since improved, but uncertainty remained on how quickly and broadly the U.S. economy will fare in the second half of 2020.
• In the July 2020 meeting, the FOMC kept the range for the federal funds rate unchanged at 0.00% to 0.25%. Although no structural policy changes were made in the month, the Fed extended the duration of its pandemic lending facilities such as the MMLF, PDCF and others to December 31, 2020. Many of the pandemic lending facilities were
set to expire at the end of September 2020. Economic activity and employment have "picked up somewhat," the July 2020 release noted, but such data are "well below" pre-pandemic levels. While Chairman Powell and the Committee acknowledged positive economic data, they believe the "path of the economy will depend significantly on the course of the virus." Going forward, the FOMC continued to pledge that it "will use its tools and act as appropriate to support the economy."
• Minutes from the July 2020 FOMC meeting indicated that U.S. central bankers "agreed that the ongoing public health crisis would weigh heavily on economic activity, employment, and inflation in the near term and was posing considerable risks to the economic outlook over the medium term." Chairman Powell reiterated this sentiment when he said the path forward for the economy was "extraordinarily uncertain" and would remain dependent on containing the virus.
• The annual Jackson Hole conference in August 2020 was notable in that Chairman Powell announced a new approach to monetary policy, one that takes a more relaxed stance on inflation and unemployment. A highlight from the released text indicated that the "Committee seeks to achieve inflation that averages 2% over time, and therefore judges that, following periods when inflation has been running persistently below 2%, appropriate monetary policy will likely aim to achieve inflation moderately above 2% for some time." In essence, the Fed has adopted a flexible form of average inflation targets as the key driver of monetary policy going forward.
• Fed officials kept the benchmark policy rate unchanged at their September 2020 FOMC meeting, signaling they expect to maintain an accommodative stance of monetary policy until they achieve inflation averaging 2% over time and longer-term inflation expectations remain well anchored at 2%. The newly released dot plot showed that bankers expected near zero interest rates through 2023.
• The portfolio's duration was favorable in a declining rate environment, which positively contributed to the net asset value (NAV) of the Fund.
6
Morgan Stanley Institutional Fund Trust
Annual Report — September 30, 2020
Investment Overview (unaudited) (cont'd)
Ultra-Short Income Portfolio
• However, the changing rate environment has negatively affected Fund performance from a yield perspective, given the lower reinvestment rates available as monetary policy remains near zero and the market has fully normalized post-March 2020 volatility.
• Fund assets under management volatility and mark-to-market pricing in March 2020 put pressure on the NAV in the first half of 2020.
Management Strategies
• Our investment philosophy continues to revolve around prudent credit, duration and risk management.
• We continued to manage the Fund to minimize interest rate sensitivity in the changing rate environment.
• We remain comfortable managing the portfolio with an excess amount of daily and weekly liquidity to help ensure we meet our mandates of capital preservation and liquidity.
• Starting in the second quarter of 2020 and continuing through September 2020, we opportunistically extended the duration of the portfolio, remaining close to our Fund limit of 90 days weighted average maturity (WAM). Elevated WAM has enabled us to maintain what we consider to be cheap investments in the portfolio without worrying about the reset risk associated with floating-rate securities.
• The weighted average life of the portfolio has rolled down to near 100 days as liquidity has risen and we focus on year-end maturities. Historically, the wholesale funding market experiences seasonal volatility in the fourth quarter, creating investment opportunities.
• Exposure to LIBOR-based securities and inflows back into the Fund after the curve flattened in the third quarter of 2020 weighed on the yield of the portfolio, as attractive reinvestment options became scarce in the current zero interest rate environment.
• At the end of the reporting period, portfolio composition remained high rated and liquid, focused on money market instruments, with no exposure to China and minimal amounts of asset-backed commercial paper.
• A2/P2 rated bonds remained an attractive investment option, as they allowed us to diversify away from the financial sector that dominates the commercial paper/certificates of deposit market.v As of the end of the reporting period, holdings in A2/P2 rated paper were below our typical 5% exposure, as supply has remained light and the spread between A1/P1 and A2/P2 remained extremely tight and not appropriate for the incremental risk, in our opinion.
v Diversification neither assures a profit nor guarantees against loss in a declining market.
7
Morgan Stanley Institutional Fund Trust
Annual Report — September 30, 2020
Investment Overview (unaudited) (cont'd)
Ultra-Short Income Portfolio
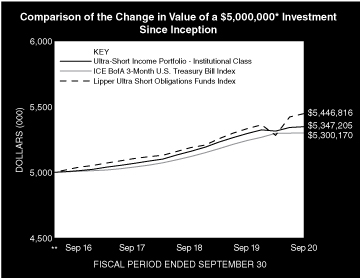
* Minimum Investment
** Commenced operations on April 28, 2016.
In accordance with SEC regulations, the Fund's performance shown assumes and distributions were reinvested. The performance of Class A and Class IR shares will vary from the performance of Institutional Class shares and will be negatively impacted by additional fees assessed to those classes (where applicable).
Performance Compared to the ICE BofA 3-Month U.S. Treasury Bill Index(1), and the Lipper Ultra Short Obligations Funds Index(2)
| | | Period Ended September 30, 2020
Total Returns(3) | |
| | | | | Average Annual | |
| | | One
Year | | Five
Years | | Ten
Years | | Since
Inception(5) | |
Fund — Class IR Shares
w/o sales charges(4) | | | 1.03 | % | | | — | | | | — | | | | 1.58 | % | |
Fund — Institutional Class Shares
w/o sales charges(4) | | | 0.98 | | | | — | | | | — | | | | 1.53 | | |
Fund — Class A Shares
w/o sales charges(4) | | | 0.80 | | | | — | | | | — | | | | 1.33 | | |
ICE BofA 3-Month U.S. Treasury
Bill Index | | | 1.10 | | | | — | | | | — | | | | 1.33 | | |
Lipper Ultra Short Obligations
Funds Index | | | 2.14 | | | | — | | | | — | | | | 1.96 | | |
Performance data quoted represents past performance, which is no guarantee of future results, and current performance may be lower or higher than the figures shown. Performance assumes that all dividends and distributions, if any, were reinvested. For the most recent month-end performance figures, please visit www.morganstanley.com/im/shareholderreports. Investment returns and principal value will fluctuate so that Fund shares, when redeemed, may be worth more or less than their original cost. Total returns do not reflect the deduction of taxes that a shareholder would pay on Fund distributions or the redemption of Fund shares. Performance of share classes will vary due to differences in expenses.
(1) The ICE BofA (Intercontinental Exchange Bank of America) 3-Month U.S. Treasury Bill Index tracks the performance of U.S. Treasury bills with a remaining maturity of three months. The Index is unmanaged and its returns do not include any sales charges or fees. Such costs would lower performance. It is not possible to invest directly in an index.
(2) The Lipper Ultra Short Obligations Funds Index is an equally weighted performance index of the largest qualifying funds (based on net assets) in the Lipper Ultra Short Obligations Funds classification. The Index, which is adjusted for capital gains distributions and income dividends, is unmanaged and should not be considered an investment. There are currently 30 funds represented in this Index. As of the date of this report, the Fund was in the Lipper Ultra Short Obligations' Funds classification.
(3) Total returns for the Fund reflect expenses waived and/or reimbursed, if applicable, by the Adviser. Without such waivers and/or reimbursements, total returns would have been lower.
(4) Commenced operations on April 28, 2016.
(5) For comparative purposes, average annual since inception returns listed for the Indexes refer to the inception date of the Fund, not the inception of the Indexes.
8
Morgan Stanley Institutional Fund Trust
Annual Report — September 30, 2020
Portfolio of Investments
Ultra-Short Income Portfolio
| | | Face
Amount
(000) | | Value
(000) | |
Certificates of Deposit (20.6%) | |
Domestic Banks (2.7%) | |
Credit Suisse NY, | |
0.29%, 5/28/21 | | $ | 75,000 | | | $ | 75,015 | | |
0.50%, 4/1/21 | | | 150,000 | | | | 150,212 | | |
1.40%, 1/19/21 | | | 123,500 | | | | 123,957 | | |
1.50%, 4/30/21 | | | 125,000 | | | | 125,924 | | |
| | | | 475,108 | | |
International Banks (17.9%) | |
Banque Federative du Credit Mutuel SA | |
1.94%, 1/6/21 | | | 135,000 | | | | 134,966 | | |
Barclays Bank PLC, | |
1.05%, 12/15/20 - 2/19/21 | | | 230,000 | | | | 230,557 | | |
1.10%, 2/1/21 | | | 125,000 | | | | 125,394 | | |
1.25%, 11/2/20 | | | 115,000 | | | | 115,119 | | |
Canadian Imperial Bank of Commerce | |
0.43%, 8/3/21 | | | 205,000 | | | | 205,338 | | |
Credit Industriel et Commercial, | |
1.88%, 1/19/21 | | | 175,000 | | | | 174,943 | | |
1.93%, 1/29/21 | | | 200,000 | | | | 199,922 | | |
Landesbank Hessen Thueringen | |
0.33%, 2/26/21 | | | 100,000 | | | | 99,981 | | |
Lloyds Bank PLC | |
0.65%, 11/2/20 | | | 15,000 | | | | 15,007 | | |
Mizuho Bank Ltd. | |
0.37%, 12/23/20 | | | 235,000 | | | | 235,115 | | |
National Bank of Kuwait Sakp, | |
0.38%, 12/4/20 | | | 250,000 | | | | 250,059 | | |
0.39%, 12/18/20 | | | 200,000 | | | | 200,049 | | |
Qatar National Bank, | |
0.68%, 9/15/21 | | | 220,000 | | | | 218,843 | | |
0.70%, 8/6/21 | | | 115,000 | | | | 114,505 | | |
2.30%, 12/16/20 - 1/4/21 | | | 400,000 | | | | 399,795 | | |
Societe Generale | |
0.10%, 10/6/20 | | | 175,000 | | | | 175,000 | | |
UBS AG Stamford Branch, | |
1.51%, 1/7/21 | | | 150,000 | | | | 150,541 | | |
1.54%, 2/8/21 | | | 150,000 | | | | 150,722 | | |
| | | | 3,195,856 | | |
Total Certificates of Deposit (Cost $3,661,167) | | | 3,670,964 | | |
Commercial Paper (a) (31.5%) | |
Asset-Backed Diversified Financial Services (5.0%) | |
Chesham Finance LLC, | |
0.12%, 10/1/20 | | | 450,000 | | | | 449,999 | | |
0.14%, 10/2/20 - 10/9/20 | | | 400,000 | | | | 399,995 | | |
Collateralized Commercial Paper FLEX Co. LLC | |
0.26%, 6/17/21 | | | 10,000 | | | | 9,984 | | |
2.04%, 10/14/20 | | | 25,000 | | | | 24,999 | | |
| | | 884,977 | | |
Automobiles (0.8%) | |
Toyota Credit Canada, Inc., | |
| 0.40%, 4/15/21 - 4/23/21 | | | 140,000 | | | | 139,690 | | |
| | | Face
Amount
(000) | | Value
(000) | |
Consumer Non-Cyclical (4.6%) | |
LVMH Moet Hennessy Louis Vuitton Inc., | |
| 0.33%, 8/9/21 - 8/11/21 | | $ | 180,000 | | | $ | 179,719 | | |
| 0.35%, 7/12/21 | | | 105,000 | | | | 104,856 | | |
| 0.37%, 12/22/20 - 12/24/20 | | | 285,000 | | | | 284,916 | | |
| 0.38%, 7/12/21 | | | 135,000 | | | | 134,815 | | |
| 0.50%, 12/21/20 (b) | | | 125,000 | | | | 124,965 | | |
| | | 829,271 | | |
Diversified Financial Services (2.5%) | |
Barclays Bank PLC, | |
| 0.12%, 10/7/20 (b) | | | 50,000 | | | | 49,998 | | |
| 1.11%, 10/19/20 (b) | | | 75,000 | | | | 74,994 | | |
Intercontinental Exchange Inc., | |
0.30%, 11/18/20 - 11/24/20 | | | 55,500 | | | | 55,476 | | |
0.35%, 11/16/20 | | | 40,000 | | | | 39,983 | | |
Jyske Bank A/S, | |
0.31%, 1/11/21 - 2/2/21 | | | 125,000 | | | | 124,891 | | |
0.33%, 2/26/21 - 3/8/21 | | | 100,000 | | | | 99,878 | | |
| | | | 445,220 | | |
Diversified Manufacturing (1.4%) | |
Honeywell International Inc., | |
| 1.16%, 12/15/20 | | | 135,000 | | | | 134,965 | | |
| 1.18%, 11/13/20 (b) | | | 22,000 | | | | 21,997 | | |
| 1.19%, 11/16/20 | | | 86,000 | | | | 85,988 | | |
| | | 242,950 | | |
Energy (4.1%) | |
Black Hills Corp. | |
0.12%, 10/1/20 | | | 4,000 | | | | 4,000 | | |
Chevron Corp. | |
1.56%, 10/13/20 | | | 95,000 | | | | 94,997 | | |
Exxon Mobil Corp. | |
1.99%, 10/16/20 | | | 80,000 | | | | 79,997 | | |
Shell International Finance B.V., | |
1.93%, 2/3/21 | | | 55,975 | | | | 55,929 | | |
2.24%, 1/26/21 - 1/27/21 | | | 300,000 | | | | 299,772 | | |
2.55%, 1/19/21 | | | 200,000 | | | | 199,852 | | |
| | | | 734,547 | | |
Insurance (0.1%) | |
Pacific Life Short Term | |
0.22%, 10/16/20 | | | 1,400 | | | | 1,400 | | |
Pricoa Short Term Funding LLC | |
0.28%, 6/7/21 | | | 12,000 | | | | 11,990 | | |
Prudential Financial, Inc. | |
0.13%, 10/1/20 | | | 12,000 | | | | 12,000 | | |
| | | | 25,390 | | |
International Banks (12.2%) | |
Barclays Bank PLC | |
0.40%, 2/5/21 (b) | | | 175,000 | | | | 174,885 | | |
BNG Bank NV | |
0.11%, 10/2/20 | | | 100,000 | | | | 99,999 | | |
The accompanying notes are an integral part of the financial statements.
9
Morgan Stanley Institutional Fund Trust
Annual Report — September 30, 2020
Portfolio of Investments (cont'd)
Ultra-Short Income Portfolio
| | | Face
Amount
(000) | | Value
(000) | |
International Banks (cont'd) | |
| BPCE SA, | |
0.29%, 6/4/21 (b) | | $ | 250,000 | | | $ | 249,614 | | |
0.46%, 3/19/21 | | | 160,000 | | | | 159,859 | | |
DBS Group Holdings Ltd. | |
0.72%, 12/14/20 | | | 175,000 | | | | 174,953 | | |
HSBC Bank PLC | |
0.60%, 5/18/21 | | | 50,000 | | | | 49,921 | | |
Lloyds Bank PLC | |
0.35%, 12/1/20 | | | 92,000 | | | | 91,981 | | |
Nationwide Building Society, | |
0.18%, 11/2/20 - 11/5/20 | | | 400,000 | | | | 399,947 | | |
Societe Generale | |
0.08%, 10/1/20 | | | 290,000 | | | | 289,999 | | |
Sumitomo Mitsui Trust Bank Ltd., | |
0.41%, 12/22/20 | | | 225,000 | | | | 224,920 | | |
0.43%, 12/18/20 | | | 75,000 | | | | 74,975 | | |
Toronto Dominion Bank | |
0.08%, 10/1/20 | | | 180,000 | | | | 179,999 | | |
| | | | 2,171,052 | | |
Wireless Telecommunications Services (0.8%) | |
AT&T, Inc. | |
1.47%, 12/18/20 | | | 150,000 | | | | 149,894 | | |
Total Commercial Paper (Cost $5,616,504) | | | 5,622,991 | | |
Corporate Bonds (6.0%) | |
Diversified Financial Services (0.7%) | |
Citigroup, Inc., | |
2.35%, 8/2/21 | | | 6,806 | | | | 6,923 | | |
2.70%, 3/30/21 | | | 26,519 | | | | 26,835 | | |
JPMorgan Chase & Co., | |
2.55%, 3/1/21 | | | 45,609 | | | | 45,953 | | |
4.63%, 5/10/21 | | | 9,150 | | | | 9,392 | | |
Sumitomo Mitsui Financial Group, Inc., | |
2.06%, 7/14/21 | | | 13,592 | | | | 13,780 | | |
2.93%, 3/9/21 | | | 19,216 | | | | 19,432 | | |
| | | | 122,315 | | |
Domestic Banks (4.1%) | |
Bank of America Corp., | |
2.63%, 10/19/20 - 4/19/21 | | | 71,691 | | | | 72,474 | | |
Bank of New York Mellon Corp. (The) | |
2.05%, 5/3/21 | | | 3,983 | | | | 4,020 | | |
Wells Fargo & Co., | |
2.10%, 7/26/21 | | | 256,632 | | | | 260,294 | | |
2.50%, 3/4/21 | | | 161,215 | | | | 162,717 | | |
3.00%, 1/22/21 | | | 58,816 | | | | 59,320 | | |
4.60%, 4/1/21 | | | 167,024 | | | | 170,580 | | |
| | | | 729,405 | | |
International Banks (1.2%) | |
| BPCE SA | |
2.65%, 2/3/21 | | | 6,600 | | | | 6,653 | | |
Credit Industriel et Commercial | |
1.88%, 12/18/20 | | | 200,000 | | | | 199,965 | | |
| | | Face
Amount
(000) | | Value
(000) | |
Mizuho Financial Group, Inc., | |
2.27%, 9/13/21 | | $ | 8,711 | | | $ | 8,872 | | |
2.63%, 4/12/21 (b) | | | 5,275 | | | | 5,340 | | |
| | | | 220,830 | | |
Total Corporate Bonds (Cost $1,070,846) | | | 1,072,550 | | |
Floating Rate Notes (c) (21.6%) | |
Automobiles (0.6%) | |
Toyota Motor Credit Corp., SOFR + 0.40% | |
0.48%, 10/23/20 | | | 113,000 | | | | 113,025 | | |
Diversified Financial Services (0.1%) | |
Sumitomo Mitsui Financial Group, Inc., | |
3 Month USD LIBOR + 1.11%,
1.38%, 7/14/21 | | | 9,353 | | | | 9,427 | | |
3 Month USD LIBOR + 1.68%,
1.92%, 3/9/21 | | | 5,642 | | | | 5,681 | | |
| | | | 15,108 | | |
Domestic Banks (4.5%) | |
Bank of America Corp., | |
3 Month USD LIBOR + 1.42%,
1.69%, 4/19/21 | | | 10,750 | | | | 10,831 | | |
First Abu Dhabi Bank USA, | |
3 Month USD LIBOR + 0.20%,
1.31%, 1/21/21 | | | 250,000 | | | | 250,049 | | |
HSBC Bank USA NA, | |
3 Month USD LIBOR + 0.38%,
0.65%, 4/29/21 | | | 100,000 | | | | 100,198 | | |
ING U.S. Funding LLC, | |
3 Month USD LIBOR + 0.20%,
0.47%, 10/19/20 (b) | | | 100,000 | | | | 100,009 | | |
Mizuho Securities USA LLC, | |
3 Month USD LIBOR + 0.16%,
0.41%, 9/27/21 (b) | | | 50,000 | | | | 50,008 | | |
1 Month USD LIBOR + 0.28%,
0.43%, 2/16/21 | | | 51,000 | | | | 51,037 | | |
3 Month USD LIBOR + 0.19%,
0.47%, 8/23/21 | | | 85,000 | | | | 85,012 | | |
Wells Fargo & Co., | |
3 Month USD LIBOR + 1.03%,
1.27%, 7/26/21 | | | 122,318 | | | | 123,226 | | |
3 Month USD LIBOR + 1.34%,
1.59%, 3/4/21 | | | 23,558 | | | | 23,682 | | |
| | | | 794,052 | | |
Insurance (0.1%) | |
Metropolitan Life Global Funding I, | |
SOFR + 0.50%, 0.58%, 5/28/21 (b) | | | 25,000 | | | | 25,045 | | |
International Banks (16.3%) | |
Bank of Montreal, | |
3 Month USD LIBOR + 0.13%,
0.43%, 7/6/21 | | | 30,000 | | | | 30,028 | | |
BNZ International Funding Ltd., | |
1 Month USD LIBOR + 0.27%,
0.41%, 10/27/20 (b) | | | 140,000 | | | | 140,029 | | |
3 Month USD LIBOR + 0.19%,
0.47%, 10/8/20 (b) | | | 125,000 | | | | 125,005 | | |
The accompanying notes are an integral part of the financial statements.
10
Morgan Stanley Institutional Fund Trust
Annual Report — September 30, 2020
Portfolio of Investments (cont'd)
Ultra-Short Income Portfolio
| | | Face
Amount
(000) | | Value
(000) | |
International Banks (cont'd) | |
Canadian Imperial Bank of Commerce, | |
3 Month USD LIBOR + 0.16%,
0.40%, 8/6/21 | | $ | 150,000 | | | $ | 150,197 | | |
Credit Suisse AG, | |
3 Month USD LIBOR + 0.23%,
0.47%, 12/30/20 | | | 300,000 | | | | 300,167 | | |
Gilead Sciences, Inc., | |
3 Month USD LIBOR + 0.15%,
0.36%, 9/17/21 | | | 40,000 | | | | 40,002 | | |
HSBC Bank PLC, | |
1 Month USD LIBOR + 0.40%,
0.55%, 10/6/20 (b) | | | 195,000 | | | | 195,014 | | |
3 Month USD LIBOR + 0.40%,
0.65%, 4/28/21 (b) | | | 100,000 | | | | 100,208 | | |
Lloyds Bank PLC, | |
1 Month USD LIBOR + 0.17%,
0.32%, 12/4/20 (b) | | | 115,000 | | | | 115,033 | | |
Mizuho Financial Group, Inc., | |
3 Month USD LIBOR + 1.14%,
1.39%, 9/13/21 | | | 10,320 | | | | 10,416 | | |
3 Month USD LIBOR + 1.48%,
1.75%, 4/12/21 (b) | | | 9,000 | | | | 9,065 | | |
Skandinaviska Enskilda Banken AB, | |
3 Month USD LIBOR + 0.15%,
0.45%, 10/5/20 | | | 195,000 | | | | 195,003 | | |
Societe Generale, | |
3 Month USD LIBOR + 0.23%,
0.48%, 2/2/21 (b) | | | 165,000 | | | | 165,086 | | |
3 Month USD LIBOR + 0.25%,
0.49%, 12/14/20 (b) | | | 250,000 | | | | 250,124 | | |
Sumitomo Mitsui Banking Corp., | |
3 Month USD LIBOR + 0.35%,
0.62%, 7/16/21 | | | 17,610 | | | | 17,645 | | |
0.66%, 4/6/21 | | | 131,391 | | | | 131,615 | | |
Svenska Handelsbanken, | |
3 Month USD LIBOR + 0.15%,
0.37%, 12/30/20 | | | 200,000 | | | | 200,091 | | |
3 Month USD LIBOR + 0.15%,
0.45%, 10/2/20 | | | 75,000 | | | | 75,000 | | |
Toronto-Dominion Bank, | |
3 Month USD LIBOR + 0.19%,
0.47%, 10/7/20 | | | 75,000 | | | | 75,003 | | |
Toyota Motor Finance, | |
3 Month USD LIBOR + 0.10%,
0.35%, 6/8/21 | | | 195,000 | | | | 195,020 | | |
UBS AG London, | |
3 Month USD LIBOR + 0.18%,
0.40%, 6/25/21 (b) | | | 390,000 | | | | 390,273 | | |
| | | | 2,910,024 | | |
Total Floating Rate Notes (Cost $3,855,332) | | | 3,857,254 | | |
| | | Face
Amount
(000) | | Value
(000) | |
Repurchase Agreements (14.7%) | |
ABN Amro Securities LLC, (0.28%,
dated 9/30/20, due 10/1/20;
proceeds $1,000; fully collateralized
by various Corporate Bonds;
1.66% - 6.63% due 9/1/21 - 9/1/50;
valued at $1,043) | | $ | 1,000 | | | $ | 1,000 | | |
Bank of America Securities, Inc., (0.40% (c),
dated 9/2/20, due 12/4/20;
proceeds $175,181; fully collateralized
by various Common Stocks and
Preferred Stocks; valued at $183,750)
(Demand 10/02/20) (d) | | | 175,000 | | | | 175,000 | | |
Bank of America Securities, Inc., (0.55% (c),
dated 7/27/20, due 7/27/21; proceeds
$301,673; fully collateralized by various
Common Stocks and Preferred Stocks;
valued at $317,047) (Demand 10/27/20) (d) | | | 300,000 | | | | 300,000 | | |
BMO Capital Markets Corp., (0.21%,
dated 9/30/20, due 10/1/20;
proceeds $1,000; fully collateralized
by various Corporate Bonds;
2.65% - 3.50% due 9/22/21 - 9/13/23;
valued at $1,051) | | | 1,000 | | | | 1,000 | | |
BNP Paribas Prime Brokerage, Inc., (0.38%,
dated 9/30/20, due 10/1/20;
proceeds $190,002; fully collateralized
by various Corporate Bonds;
2.31% - 12.00% due 6/12/21 - 10/7/79;
valued at $201,006) (d) | | | 190,000 | | | | 190,000 | | |
BNP Paribas Securities Corp., (0.48%,
dated 9/21/20, due 12/21/20;
proceeds $200,243; fully collateralized
by various Corporate Bonds;
3.88% - 11.50% due 6/15/21 - 11/1/48;
valued at $211,796) (d) | | | 200,000 | | | | 200,000 | | |
Credit Agricole Corporate and Investment
Bank, (0.22%, dated 9/17/20, due
10/19/20; proceeds $50,010; fully
collateralized by various Corporate
Bonds; 3.2% - 4.1% due
6/20/23 - 3/26/25; valued at $52,500)
(Demand 10/07/20) | | | 50,000 | | | | 50,000 | | |
Credit Agricole Corporate and Investment
Bank, (0.22%, dated 9/30/20, due
10/26/20; proceeds $100,016; fully
collateralized by various Corporate Bonds;
2.05% - 4.27% due 11/10/20 - 2/21/30;
valued at $105,001) (Demand 10/07/20) | | | 100,000 | | | | 100,000 | | |
Credit Agricole Corporate and Investment
Bank, (0.24%, dated 8/11/20, due
11/12/20; proceeds $200,124; fully
collateralized by various Corporate
Bonds;1.02% - 5.88% due
9/11/22 - 5/8/30; valued at $210,000)
(Demand 10/07/20) | | | 200,000 | | | | 200,000 | | |
JP Morgan Securities LLC, (0.46% (c), dated
8/17/20, due 12/4/20; proceeds
$250,348; fully collateralized by various
Common Stocks and Preferred Stocks;
valued at $262,601) (Demand 10/1/20) (d) | | | 250,000 | | | | 250,000 | | |
The accompanying notes are an integral part of the financial statements.
11
Morgan Stanley Institutional Fund Trust
Annual Report — September 30, 2020
Portfolio of Investments (cont'd)
Ultra-Short Income Portfolio
| | | Face
Amount
(000) | | Value
(000) | |
Repurchase Agreements (cont'd) | |
JP Morgan Securities LLC, (0.46% (c), dated
9/1/20, due 12/4/20; proceeds $100,120;
fully collateralized by various Common
Stocks and Preferred Stocks;
valued at $105,040)
(Demand 10/01/20) (d) | | $ | 100,000 | | | $ | 100,000 | | |
Mizuho Securities USA LLC, (0.23%, dated
9/30/20, due 10/1/20; proceeds $5,000;
fully collateralized by various Common
Stocks and Preferred Stocks; valued at
$5,250) (d) | | | 5,000 | | | | 5,000 | | |
Pershing LLC, (0.40%, dated 9/30/20 due
10/1/20; proceeds $100,001; fully
collateralized by various Corporate Bonds;
0.43% - 10.88% due 12/14/20 - 3/1/68;
valued at $105,797) (d) | | | 100,000 | | | | 100,000 | | |
Scotia Capital USA, Inc., (0.33%, dated
9/30/20, due 10/1/20; proceeds
$30,000; fully collateralized by various
Corporate Bonds; 0.75% - 4.75%
due 6/10/25 - 6/15/50;
valued at $31,500) | | | 30,000 | | | | 30,000 | | |
Scotia Capital USA, Inc., (0.43%, dated
9/30/20, due 10/1/20; proceeds
$850,010; fully collateralized by various
Corporate Bonds; 3.55% - 9.25% due
10/26/20 - 10/15/27;
valued at $900,883) | | | 850,000 | | | | 850,000 | | |
Wells Fargo Securities LLC, (0.55%, dated
9/9/20, due 12/7/20; proceeds $80,109;
fully collateralized by various Common
Stocks and Preferred Stocks; valued
at $84,000) (d) | | | 80,000 | | | | 80,000 | | |
Total Repurchase Agreements (Cost $2,632,000) | | | 2,632,000 | | |
Time Deposits (5.6%) | |
Domestic Bank (4.6%) | |
National Bank of Canada (Montreal Branch) | |
0.09%, 10/1/20 | | | 820,000 | | | | 820,000 | | |
| | | | 820,000 | | |
International Banks (1.0%) | |
Canadian Imperial Bank of Commerce | |
0.08%, 10/1/20 | | | 100,000 | | | | 100,000 | | |
Credit Agricole Corporate and Investment Bank | |
0.08%, 10/1/20 | | | 86,000 | | | | 86,000 | | |
Total International Banks (Cost $186,000) | | | 186,000 | | |
Total Time Deposits (Cost $1,006,000) | | | 1,006,000 | | |
Total Investments (100.0%) (Cost $17,841,849) (e) | | | 17,861,759 | | |
Liabilities in Excess of Other Assets (0.0%) (f) | | | (4,616 | ) | |
Net Assets (100.0%) | | $ | 17,857,143 | | |
(a) The rates shown are the effective yields at the date of purchase.
(b) 144A security — Certain conditions for public sale may exist. Unless otherwise noted, these securities are deemed to be liquid.
(c) Floating or variable rate securities: The rates disclosed are as of September 30, 2020. For securities based on a published reference rate and spread, the reference rate and spread are indicated in the description in the Portfolio of Investments. Certain variable rate securities may not be based on a published reference rate and spread but are determined by the issuer or agent and are based on current market conditions. These securities do not indicate a reference rate and spread in their description in the Portfolio of Investments.
(d) Perpetual — One or more securities do not have a predetermined maturity date. Rates for these securities are fixed for a period of time, after which they revert to a floating rate. Interest rates in effect are as of September 30, 2020.
(e) At September 30, 2020, the aggregate cost for federal income tax purposes is approximately $17,841,849,000. The aggregate gross unrealized appreciation is approximately $19,925,000 and the aggregate gross unrealized depreciation is approximately $15,000, resulting in net unrealized appreciation of approximately $19,910,000.
(f) Amount is less than 0.05%.
LIBOR London Interbank Offered Rate.
SOFR Secured Overnight Financing Rate.
USD United States Dollar.
Portfolio Composition
Classification | | Percentage of
Total Investments | |
Commercial Paper | | | 31.5 | % | |
Floating Rate Notes | | | 21.6 | | |
Certificates of Deposit | | | 20.6 | | |
Repurchase Agreements | | | 14.7 | | |
Corporate Bonds | | | 6.0 | | |
Time Deposits | | | 5.6 | | |
Total Investments | | | 100.0 | % | |
The accompanying notes are an integral part of the financial statements.
12
Morgan Stanley Institutional Fund Trust
Annual Report — September 30, 2020
Ultra-Short Income Portfolio
Statement of Assets and Liabilities | | September 30, 2020
(000) | |
Assets: | |
Investments in Securities of Unaffiliated Issuers, at Value (Cost $17,841,849, including value of repurchases agreements of $2,632,000) | | $ | 17,861,759 | | |
Cash | | | 405 | | |
Receivable for Fund Shares Sold | | | 58,483 | | |
Interest Receivable | | | 16,964 | | |
Other Assets | | | 1,565 | | |
Total Assets | | | 17,939,176 | | |
Liabilities: | |
Payable for Fund Shares Redeemed | | | 72,745 | | |
Payable for Advisory Fees | | | 5,911 | | |
Payable for Shareholder Services Fees — Institutional Class | | | 106 | | |
Payable for Shareholder Services Fees — Class A | | | 1,230 | | |
Payable for Administration Fees | | | 1,191 | | |
Dividends Payable | | | 256 | | |
Payable for Custodian Fees | | | 88 | | |
Payable for Professional Fees | | | 63 | | |
Payable for Transfer Agency Fees — Class IR | | | 11 | | |
Payable for Transfer Agency Fees — Institutional Class | | | 3 | | |
Payable for Transfer Agency Fees — Class A | | | 2 | | |
Other Liabilities | | | 427 | | |
Total Liabilities | | | 82,033 | | |
Net Assets | | $ | 17,857,143 | | |
Net Assets Consist of: | |
Paid-in-Capital | | $ | 17,903,049 | | |
Total Accumulated Loss | | | (45,906 | ) | |
Net Assets | | $ | 17,857,143 | | |
CLASS IR: | |
Net Assets | | $ | 5,388,750 | | |
| Shares Outstanding (unlimited number of shares authorized, no par value) (not in 000's) | | | 539,531,162 | | |
Net Asset Value, Offering and Redemption Price Per Share | | $ | 9.99 | | |
Institutional Class: | |
Net Assets | | $ | 2,544,657 | | |
| Shares Outstanding (unlimited number of shares authorized, no par value) (not in 000's) | | | 254,801,472 | | |
Net Asset Value, Offering and Redemption Price Per Share | | $ | 9.99 | | |
CLASS A: | |
Net Assets | | $ | 9,923,736 | | |
| Shares Outstanding (unlimited number of shares authorized, no par value) (not in 000's) | | | 993,748,846 | | |
Net Asset Value, Offering and Redemption Price Per Share | | $ | 9.99 | | |
The accompanying notes are an integral part of the financial statements.
13
Morgan Stanley Institutional Fund Trust
Annual Report — September 30, 2020
Ultra-Short Income Portfolio
Statement of Operations | | Year Ended
September 30, 2020
(000) | |
Investment Income: | |
Interest from Securities of Unaffiliated Issuers | | $ | 284,316 | | |
Expenses: | |
Advisory Fees (Note B) | | | 35,113 | | |
Shareholder Services Fees — Institutional Class (Note D) | | | 1,424 | | |
Shareholder Services Fees — Class A (Note D) | | | 25,276 | | |
Administration Fees (Note C) | | | 14,045 | | |
Registration Fees | | | 3,180 | | |
Custodian Fees (Note F) | | | 393 | | |
Trustees' Fees and Expenses | | | 339 | | |
Professional Fees | | | 168 | | |
Shareholder Reporting Fees | | | 157 | | |
Transfer Agency Fees — Class IR (Note E) | | | 43 | | |
Transfer Agency Fees — Institutional Class (Note E) | | | 11 | | |
Transfer Agency Fees — Class A (Note E) | | | 8 | | |
Pricing Fees | | | 16 | | |
Other Expenses | | | 479 | | |
Expenses Before Non Operating Expenses | | | 80,652 | | |
Bank Overdraft Expense | | | 1 | | |
Total Expenses | | | 80,653 | | |
Waiver of Advisory Fees (Note B) | | | (12,455 | ) | |
Reimbursement of Class Specific Expenses — Class IR (Note B) | | | (49 | ) | |
Reimbursement of Class Specific Expenses — Institutional Class (Note B) | | | (12 | ) | |
Waiver of Shareholder Servicing Fees — Class A (Note D) | | | (2,447 | ) | |
Net Expenses | | | 65,690 | | |
Net Investment Income | | | 218,626 | | |
Realized Loss: | |
Investments Sold | | | (67,256 | ) | |
Change in Unrealized Appreciation (Depreciation): | |
Investments | | | 7,979 | | |
Net Realized Loss and Change in Unrealized Appreciation (Depreciation) | | | (59,277 | ) | |
Net Increase in Net Assets Resulting from Operations | | $ | 159,349 | | |
The accompanying notes are an integral part of the financial statements.
14
Morgan Stanley Institutional Fund Trust
Annual Report — September 30, 2020
Ultra-Short Income Portfolio
Statements of Changes in Net Assets | | Year Ended
September 30, 2020
(000) | | Year Ended
September 30, 2019
(000) | |
Increase (Decrease) in Net Assets: | |
Operations: | |
Net Investment Income | | $ | 218,626 | | | $ | 351,961 | | |
Net Realized Gain (Loss) | | | (67,256 | ) | | | 769 | | |
Net Change in Unrealized Appreciation | | | 7,979 | | | | 8,581 | | |
Net Increase in Net Assets Resulting from Operations | | | 159,349 | | | | 361,311 | | |
Dividends and Distributions to Shareholders: | |
Class IR | | | (61,803 | ) | | | (81,786 | ) | |
Institutional Class | | | (39,633 | ) | | | (71,086 | ) | |
Class A | | | (117,190 | ) | | | (199,089 | ) | |
Total Dividends and Distributions to Shareholders | | | (218,626 | ) | | | (351,961 | ) | |
Capital Share Transactions:(1) | |
Class IR: | |
Subscribed | | | 9,745,593 | | | | 7,672,933 | | |
Distributions Reinvested | | | 49,827 | | | | 71,902 | | |
Redeemed | | | (9,159,258 | ) | | | (4,822,141 | ) | |
Institutional Class: | |
Subscribed | | | 4,112,421 | | | | 3,028,912 | | |
Distributions Reinvested | | | 39,629 | | | | 71,086 | | |
Redeemed | | | (4,681,680 | ) | | | (2,739,398 | ) | |
Class A: | |
Subscribed | | | 12,175,182 | | | | 12,220,046 | | |
Distributions Reinvested | | | 117,124 | | | | 198,964 | | |
Redeemed | | | (13,117,055 | ) | | | (7,906,616 | ) | |
Net Increase (Decrease) in Net Assets Resulting from Capital Share Transactions | | | (718,217 | ) | | | 7,795,688 | | |
Total Increase (Decrease) in Net Assets | | | (777,494 | ) | | | 7,805,038 | | |
Net Assets: | |
Beginning of Period | | | 18,634,637 | | | | 10,829,599 | | |
End of Period | | $ | 17,857,143 | | | $ | 18,634,637 | | |
(1) Capital Share Transactions: | |
Class IR: | |
Shares Subscribed | | | 974,475 | | | | 765,985 | | |
Shares Issued on Distributions Reinvested | | | 4,979 | | | | 7,177 | | |
Shares Redeemed | | | (915,518 | ) | | | (481,379 | ) | |
Net Increase in Class IR Shares Outstanding | | | 63,936 | | | | 291,783 | | |
Institutional Class: | |
Shares Subscribed | | | 410,877 | | | | 302,377 | | |
Shares Issued on Distributions Reinvested | | | 3,960 | | | | 7,097 | | |
Shares Redeemed | | | (468,012 | ) | | | (273,488 | ) | |
Net Increase (Decrease) in Institutional Class Shares Outstanding | | | (53,175 | ) | | | 35,986 | | |
Class A: | |
Shares Subscribed | | | 1,217,011 | | | | 1,220,000 | | |
Shares Issued on Distributions Reinvested | | | 11,703 | | | | 19,862 | | |
Shares Redeemed | | | (1,311,473 | ) | | | (789,334 | ) | |
Net Increase (Decrease) in Class A Shares Outstanding | | | (82,759 | ) | | | 450,528 | | |
The accompanying notes are an integral part of the financial statements.
15
Morgan Stanley Institutional Fund Trust
Annual Report — September 30, 2020
Financial Highlights
Ultra-Short Income Portfolio
| | | Class IR | |
| | | Year Ended September 30, | | Period from
April 28, 2016(1) to | |
Selected Per Share Data and Ratios | | 2020 | | 2019 | | 2018 | | 2017 | | September 30, 2016 | |
Net Asset Value, Beginning of Period | | $ | 10.02 | | | $ | 10.01 | | | $ | 10.01 | | | $ | 10.00 | | | $ | 10.00 | | |
Income (Loss) from Investment Operations: | |
Net Investment Income(2) | | | 0.13 | | | | 0.25 | | | | 0.19 | | | | 0.12 | | | | 0.03 | | |
Net Realized and Unrealized Gain (Loss) | | | (0.03 | ) | | | 0.01 | | | | (0.01 | ) | | | 0.00 | (3) | | | 0.00 | (3) | |
Total from Investment Operations | | | 0.10 | | | | 0.26 | | | | 0.18 | | | | 0.12 | | | | 0.03 | | |
Distributions from and/or in Excess of: | |
Net Investment Income | | | (0.13 | ) | | | (0.25 | ) | | | (0.18 | ) | | | (0.11 | ) | | | (0.03 | ) | |
Net Realized Gain | | | — | | | | — | | | | (0.00 | )(3) | | | (0.00 | )(3) | | | — | | |
Total Distributions | | | (0.13 | ) | | | (0.25 | ) | | | (0.18 | ) | | | (0.11 | ) | | | (0.03 | ) | |
Net Asset Value, End of Period | | $ | 9.99 | | | $ | 10.02 | | | $ | 10.01 | | | $ | 10.01 | | | $ | 10.00 | | |
Total Return(4) | | | 1.03 | % | | | 2.68 | % | | | 1.87 | % | | | 1.18 | % | | | 0.26 | %(5) | |
Ratios to Average Net Assets and Supplemental Data: | |
Net Assets, End of Period (Thousands) | | $ | 5,388,750 | | | $ | 4,765,201 | | | $ | 1,840,647 | | | $ | 1,122,452 | | | $ | 276,348 | | |
Ratio of Expenses Before Expense Limitation | | | 0.31 | % | | | 0.30 | % | | | 0.30 | % | | | 0.30 | % | | | 0.42 | %(6) | |
Ratio of Expenses After Expense Limitation | | | 0.24 | % | | | 0.24 | % | | | 0.23 | % | | | 0.22 | % | | | 0.18 | %(6) | |
Ratio of Expenses After Expense Limitation Excluding Non-Operating Expenses | | | 0.24 | % | | | 0.24 | % | | | N/A | | | | N/A | | | | N/A | | |
Ratio of Net Investment Income | | | 1.34 | % | | | 2.53 | % | | | 1.86 | % | | | 1.16 | % | | | 0.61 | %(6) | |
Portfolio Turnover Rate | | | N/A(7) | | | | N/A(7) | | | | N/A(7) | | | | N/A(7) | | | | N/A(7) | | |
(1) Commencement of Operations.
(2) Per share amount is based on average shares outstanding.
(3) Amount is less than $0.005 per share.
(4) Calculated based on the net asset value as of the last business day of the period.
(5) Not annualized.
(6) Annualized.
(7) During the reporting period, the Fund did not hold any long-term investments and accordingly portfolio turnover is not applicable.
The accompanying notes are an integral part of the financial statements.
16
Morgan Stanley Institutional Fund Trust
Annual Report — September 30, 2020
Financial Highlights
Ultra-Short Income Portfolio
| | | Institutional Class | |
| | | Year Ended September 30, | | Period from
April 28, 2016(1) to | |
Selected Per Share Data and Ratios | | 2020 | | 2019 | | 2018 | | 2017 | | September 30, 2016 | |
Net Asset Value, Beginning of Period | | $ | 10.02 | | | $ | 10.01 | | | $ | 10.01 | | | $ | 10.00 | | | $ | 10.00 | | |
Income (Loss) from Investment Operations: | |
Net Investment Income(2) | | | 0.14 | | | | 0.25 | | | | 0.18 | | | | 0.11 | | | | 0.02 | | |
Net Realized and Unrealized Gain (Loss) | | | (0.04 | ) | | | 0.01 | | | | 0.00 | (3) | | | 0.00 | (3) | | | 0.00 | (3) | |
Total from Investment Operations | | | 0.10 | | | | 0.26 | | | | 0.18 | | | | 0.11 | | | | 0.02 | | |
Distributions from and/or in Excess of: | |
Net Investment Income | | | (0.13 | ) | | | (0.25 | ) | | | (0.18 | ) | | | (0.10 | ) | | | (0.02 | ) | |
Net Realized Gain | | | — | | | | — | | | | (0.00 | )(3) | | | (0.00 | )(3) | | | — | | |
Total Distributions | | | (0.13 | ) | | | (0.25 | ) | | | (0.18 | ) | | | (0.10 | ) | | | (0.02 | ) | |
Net Asset Value, End of Period | | $ | 9.99 | | | $ | 10.02 | | | $ | 10.01 | | | $ | 10.01 | | | $ | 10.00 | | |
Total Return(4) | | | 0.98 | % | | | 2.62 | % | | | 1.82 | % | | | 1.13 | % | | | 0.24 | %(5) | |
Ratios to Average Net Assets and Supplemental Data: | |
Net Assets, End of Period (Thousands) | | $ | 2,544,657 | | | $ | 3,085,210 | | | $ | 2,722,775 | | | $ | 1,695,589 | | | $ | 196,092 | | |
Ratio of Expenses Before Expense Limitation | | | 0.36 | % | | | 0.34 | % | | | 0.35 | % | | | 0.35 | % | | | 0.48 | %(6) | |
Ratio of Expenses After Expense Limitation | | | 0.29 | % | | | 0.29 | % | | | 0.28 | % | | | 0.27 | % | | | 0.23 | %(6) | |
Ratio of Expenses After Expense Limitation Excluding Non-Operating Expenses | | | 0.29 | % | | | 0.29 | % | | | N/A | | | | N/A | | | | N/A | | |
Ratio of Net Investment Income | | | 1.39 | % | | | 2.48 | % | | | 1.84 | % | | | 1.09 | % | | | 0.65 | %(6) | |
Portfolio Turnover Rate | | | N/A(7) | | | | N/A(7) | | | | N/A(7) | | | | N/A(7) | | | | N/A(7) | | |
(1) Commencement of Operations.
(2) Per share amount is based on average shares outstanding.
(3) Amount is less than $0.005 per share.
(4) Calculated based on the net asset value as of the last business day of the period.
(5) Not annualized.
(6) Annualized.
(7) During the reporting period, the Fund did not hold any long-term investments and accordingly portfolio turnover is not applicable.
The accompanying notes are an integral part of the financial statements.
17
Morgan Stanley Institutional Fund Trust
Annual Report — September 30, 2020
Financial Highlights
Ultra-Short Income Portfolio
| | | Class A | |
| | | Year Ended September 30, | | Period from
April 28, 2016(1) to | |
Selected Per Share Data and Ratios | | 2020 | | 2019 | | 2018 | | 2017 | | September 30, 2016 | |
Net Asset Value, Beginning of Period | | $ | 10.02 | | | $ | 10.01 | | | $ | 10.01 | | | $ | 10.00 | | | $ | 10.00 | | |
Income (Loss) from Investment Operations: | |
Net Investment Income(2) | | | 0.12 | | | | 0.23 | | | | 0.17 | | | | 0.09 | | | | 0.01 | | |
Net Realized and Unrealized Gain (Loss) | | | (0.04 | ) | | | 0.01 | | | | (0.01 | ) | | | 0.00 | (3) | | | 0.00 | (3) | |
Total from Investment Operations | | | 0.08 | | | | 0.24 | | | | 0.16 | | | | 0.09 | | | | 0.01 | | |
Distributions from and/or in Excess of: | |
Net Investment Income | | | (0.11 | ) | | | (0.23 | ) | | | (0.16 | ) | | | (0.08 | ) | | | (0.01 | ) | |
Net Realized Gain | | | — | | | | — | | | | (0.00 | )(3) | | | (0.00 | )(3) | | | — | | |
Total Distributions | | | (0.11 | ) | | | (0.23 | ) | | | (0.16 | ) | | | (0.08 | ) | | | (0.01 | ) | |
Net Asset Value, End of Period | | $ | 9.99 | | | $ | 10.02 | | | $ | 10.01 | | | $ | 10.01 | | | $ | 10.00 | | |
Total Return(4) | | | 0.80 | % | | | 2.42 | % | | | 1.61 | % | | | 0.92 | % | | | 0.14 | %(5) | |
Ratios to Average Net Assets and Supplemental Data: | |
Net Assets, End of Period (Thousands) | | $ | 9,923,736 | | | $ | 10,784,226 | | | $ | 6,266,177 | | | $ | 2,581,479 | | | $ | 164,528 | | |
Ratio of Expenses Before Expense Limitation | | | 0.56 | % | | | 0.55 | % | | | 0.55 | % | | | 0.55 | % | | | 0.68 | %(6) | |
Ratio of Expenses After Expense Limitation | | | 0.46 | % | | | 0.49 | % | | | 0.48 | % | | | 0.47 | % | | | 0.44 | %(6) | |
Ratio of Expenses After Expense Limitation Excluding Non-Operating Expenses | | | 0.46 | % | | | 0.49 | % | | | N/A | | | | N/A | | | | N/A | | |
Ratio of Net Investment Income | | | 1.16 | % | | | 2.29 | % | | | 1.68 | % | | | 0.91 | % | | | 0.48 | %(6) | |
Portfolio Turnover Rate | | | N/A(7) | | | | N/A(7) | | | | N/A(7) | | | | N/A(7) | | | | N/A(7) | | |
(1) Commencement of Operations.
(2) Per share amount is based on average shares outstanding.
(3) Amount is less than $0.005 per share.
(4) Calculated based on the net asset value as of the last business day of the period.
(5) Not annualized.
(6) Annualized.
(7) During the reporting period, the Fund did not hold any long-term investments and accordingly portfolio turnover is not applicable.
The accompanying notes are an integral part of the financial statements.
18
Morgan Stanley Institutional Fund Trust
Annual Report — September 30, 2020
Notes to Financial Statements
Morgan Stanley Institutional Fund Trust ("Trust'') is registered under the Investment Company Act of 1940, as amended (the "Act''), as an open-end management investment company. The Trust is comprised of twelve separate, active funds (individually referred to as a "Fund," collectively as the "Funds"). The Trust applies investment company accounting and reporting guidance. All Funds are considered diversified for purposes of the Act.
The accompanying financial statements relate to the Ultra-Short Income Portfolio. The Fund seeks current income with capital preservation while maintaining liquidity. The Fund offers three classes of shares — Class IR, Institutional Class and Class A.
A. Significant Accounting Policies: The following significant accounting policies are in conformity with U.S. generally accepted accounting principles ("GAAP"). Such policies are consistently followed by the Trust in the preparation of its financial statements. GAAP may require management to make estimates and assumptions that affect the reported amounts and disclosures in the financial statements. Actual results may differ from those estimates.
In March 2017, the Financial Accounting Standards Board ("FASB") issued an Accounting Standard Update, ASU 2017-08, Receivables-Nonrefundable Fees and Other Costs (Subtopic 310-20), Premium Amortization on Purchased Callable Debt Securities (the "ASU") which amends the amortization period for certain purchased callable debt securities held at a premium, shortening such period to the earliest call date. The ASU does not require any accounting change for debt securities held at a discount; the discount continues to be amortized to maturity. The ASU is effective for fiscal years, and interim periods within those fiscal years, beginning after December 15, 2018. The Fund has adopted the ASU as of September 30, 2020 and it did not have an impact on the Fund's financial statements.
In March 2020, FASB issued an Accounting Standard Update, ASU 2020-04, Reference Rate Reform (Topic 848) — Facilitation of the Effects of Reference Rate Reform on Financial Reporting ("ASU 2020-04"), which provides optional, temporary relief with respect to the financial reporting of contracts subject to certain types of modifications due to the planned discontinuation of the London Interbank Offered Rate ("LIBOR") and other IBOR-based reference rates at the end of 2021. The temporary relief provided by ASU 2020-04 is effective for certain reference rate-related contract
modifications that occur during the period from March 12, 2020 through December 31, 2022. Management is evaluating the impact of ASU 2020-04 on the Fund's investments, derivatives, debt and other contracts that will undergo reference rate-related modifications as a result of the reference rate reform.
1. Security Valuation: (1) Certain portfolio securities may be valued by an outside pricing service/vendor approved by the Trust's Board of Trustees (the "Trustees"). The pricing service/vendor may employ a pricing model that takes into account, among other things, bids, yield spreads and/or other market data and specific security characteristics. Alternatively, if a valuation is not available from an outside pricing service/vendor, and the security trades on an exchange, the security may be valued at its latest reported sale price (or at the exchange official closing price if such exchange reports an official closing price), prior to the time when assets are valued. If there are no sales on a given day and if there is no official exchange closing price for that day, the security is valued at the mean between the last reported bid and asked prices if such bid and asked prices are available in the relevant exchanges. If only bid prices are available then the latest bid price may be used. If Morgan Stanley Investment Management Inc. (the "Adviser"), a wholly-owned subsidiary of Morgan Stanley, determines that the price provided by the outside pricing service/vendor or exchange does not reflect the security's fair value or is unable to provide a price, prices from brokers or dealers may also be utilized. In these circumstances, the value of the security will be the mean of bid and asked prices obtained from brokers or dealers; and (2) when market quotations are not readily available, including circumstances under which the Adviser determines that the closing price, last sale price or the mean between the last reported bid and asked prices are not reflective of a security's market value, portfolio securities are valued at their fair value as determined in good faith under procedures established by and under the general supervision of the Trustees. Occasionally, developments affecting the closing prices of securities and other assets may occur between the times at which valuations of such securities are determined (that is, close of the foreign market on which the securities trade) and the close of business of the New York Stock Exchange ("NYSE"). If developments occur during such periods that are expected to materially affect the value of such securities, such valuations may be adjusted to reflect the estimated fair value of such securities
19
Morgan Stanley Institutional Fund Trust
Annual Report — September 30, 2020
Notes to Financial Statements (cont'd)
as of the close of the NYSE, as determined in good faith by the Trustees or by the Adviser using a pricing service and/or procedures approved by the Trustees.
The Trustees have responsibility for determining in good faith the fair value of the investments, and the Trustees may appoint others, such as the Trust's Adviser or a valuation committee, to assist the Trustees in determining fair value and to make the actual calculations pursuant to the fair valuation methodologies previously approved by the Trustees. Under procedures approved by the Trustees, the Trust's Adviser has formed a Valuation Committee whose members are approved by the Trustees. The Valuation Committee provides administration and oversight of the Trust's valuation policies and procedures, which are reviewed at least annually by the Trustees. These procedures allow the Trust to utilize independent pricing services, quotations from securities and financial instrument dealers and other market sources to determine fair value.
2. Fair Value Measurement: FASB Accounting Standards CodificationTM ("ASC") 820, "Fair Value Measurement" ("ASC 820"), defines fair value as the value that the Fund would receive to sell an investment or pay to transfer a liability in a timely transaction with an independent buyer in the principal market, or in the absence of a principal market, the most advantageous market for the investment or liability. ASC 820 establishes a three-tier hierarchy to distinguish between (1) inputs that reflect the assumptions market participants would use in valuing an asset or liability developed based on market data obtained from sources independent of the reporting entity (observable inputs) and (2) inputs that reflect the reporting entity's own assumptions about the assumptions market participants would use in valuing an asset or liability developed based on the best information available in the circumstances (unobservable inputs) and to establish classification of fair value measurements for disclosure purposes. Various inputs are used in determining the value of the Fund's investments. The inputs are summarized in the three broad levels listed below:
• Level 1 – unadjusted quoted prices in active markets for identical investments
• Level 2 – other significant observable inputs (including quoted prices for similar investments,
interest rates, prepayment speeds, credit risk, etc.)
• Level 3 – significant unobservable inputs including the Fund's own assumptions in determining the fair value of investments. Factors considered in making this determination may include, but are not limited to, information obtained by contacting the issuer, analysts, or the appropriate stock exchange (for exchange-traded securities), analysis of the issuer's financial statements or other available documents and, if necessary, available information concerning other securities in similar circumstances.
The inputs or methodology used for valuing securities are not necessarily an indication of the risk associated with investing in those securities and the determination of the significance of a particular input to the fair value measurement in its entirety requires judgment and considers factors specific to each security.
The following is a summary of the inputs used to value the Fund's investments as of September 30, 2020:
Investment Type | | Level 1
Unadjusted
quoted
prices
(000) | | Level 2
Other
significant
observable
inputs
(000) | | Level 3
Significant
unobservable
inputs
(000) | | Total
(000) | |
Assets: | |
Short-Term
Investments | |
Certificates
of Deposit | | $ | — | | | $ | 3,670,964 | | | $ | — | | | $ | 3,670,964 | | |
Commercial Paper | | | — | | | | 5,622,991 | | | | — | | | | 5,622,991 | | |
Corporate Bonds | | | — | | | | 1,072,550 | | | | — | | | | 1,072,550 | | |
Floating Rate Notes | | | — | | | | 3,857,254 | | | | — | | | | 3,857,254 | | |
Repurchase
Agreements | | | — | | | | 2,632,000 | | | | — | | | | 2,632,000 | | |
Time Deposits | | | — | | | | 1,006,000 | | | | — | | | | 1,006,000 | | |
Total Short-Term
Investments | | | — | | | | 17,861,759 | | | | — | | | | 17,861,759 | | |
Total Assets | | $ | — | | | $ | 17,861,759 | | | $ | — | | | $ | 17,861,759 | | |
Transfers between investment levels may occur as the markets fluctuate and/or the availability of data used in an investment's valuation changes.
3. Repurchase Agreements: The Fund may enter into repurchase agreements under which the Fund lends cash and takes possession of securities with an agreement that the counterparty will repurchase such securities. In connection with transactions in repurchase agreements, a
20
Morgan Stanley Institutional Fund Trust
Annual Report — September 30, 2020
Notes to Financial Statements (cont'd)
bank as custodian for the Fund takes possession of the underlying securities which are held as collateral, with a market value at least equal to the amount of the repurchase transaction, including principal and accrued interest. To the extent that any repurchase transaction exceeds one business day, the value of the collateral is marked-to-market on a daily basis to determine that the value of the collateral does not decrease below the repurchase price plus accrued interest as earned. If such a decrease occurs, additional collateral will be requested and, when received, will be added to the account to maintain full collateralization. In the event of default on the obligation to repurchase, the Fund has the right to liquidate the collateral and apply the proceeds in satisfaction of the obligation. In the event of default or bankruptcy by the counterparty to the agreement, realization and/or retention of the collateral or proceeds may be subject to legal proceedings. The Fund, along with other affiliated investment companies, may utilize a joint trading account for the purpose of entering into repurchase agreements.
The Fund may enter into repurchase agreements in which eligible securities are transferred into joint trading accounts maintained by the custodian for investment companies advised by the Fund's Adviser. The Fund will participate on a pro rata basis with the other investment companies in its share of the securities transferred under such repurchase agreements and in its share of proceeds from any repurchase or other disposition of such securities.
Repurchase agreements are subject to Master Repurchase Agreements which are agreements between the Fund and its counterparties that typically include provisions which provide for the net settlement of all transactions and collateral with the Fund, through a single payment, in the event of default or termination. Amounts presented on the Portfolio of Investments and Statement of Assets and Liabilities are not net settlement amounts but gross. As indicated on the Portfolio of Investments, the cash or securities to be repurchased exceeds the repurchase price to be paid under the repurchase agreement reducing the net settlement amount to zero.
4. Indemnifications: The Trust enters into contracts that contain a variety of indemnifications. The Trust's maximum exposure under these arrangements is unknown. However, the Trust has not had prior claims or losses
pursuant to these contracts and expects the risk of loss to be remote.
5. Dividends and Distributions to Shareholders: Dividends and distributions to shareholders are recorded on the close of each business day. Dividends from net investment income are declared daily and paid monthly. Net realized capital gains, if any, are distributed at least annually.
6. Security Transactions, Income and Expenses: Security transactions are accounted for on the trade date (date the order to buy or sell is executed). Realized gains and losses on the sale of investment securities are determined on the specific identified cost method. Dividend income and other distributions are recorded on the ex-dividend date (except for certain foreign dividends which may be recorded as soon as the Fund is informed of such dividends) net of applicable withholding taxes. Interest income is recognized on the accrual basis except where collection is in doubt. Discounts are accreted and premiums are amortized over the life of the respective securities. Most expenses of the Trust can be directly attributed to a particular Fund. Expenses which cannot be directly attributed are apportioned among the Funds based upon relative net assets or other appropriate methods. Income, expenses (other than class specific expenses — distribution and shareholder services and transfer agency fees) and realized and unrealized gains or losses are allocated to each class of shares based upon their relative net assets.
B. Advisory Fees: The Adviser, a wholly-owned subsidiary of Morgan Stanley, provides the Fund with advisory services under the terms of an Investment Advisory Agreement, paid quarterly, at an annual rate of 0.20% of the average daily net assets of the Fund.
The Adviser has agreed to reduce its advisory fee and/or reimburse the Fund so that total annual Fund operating expenses, excluding certain investment related expenses, taxes, interest and other extraordinary expenses (including litigation), will not exceed 0.25% for Class IR shares, 0.30% for Institutional Class shares and 0.55% for Class A shares. Effective July 1, 2020, the Adviser has agreed to reduce its advisory fee and/or reimburse the Fund so that total annual Fund operating expenses will not exceed 0.45% for Class A shares. The fee waivers and/or expense reimbursements will continue for at least one year from the date of the Fund's prospectus or until
21
Morgan Stanley Institutional Fund Trust
Annual Report — September 30, 2020
Notes to Financial Statements (cont'd)
such time as the Trustees act to discontinue all or a portion of such waivers and/or reimbursements when they deem such action is appropriate. In addition, the Adviser may make additional voluntary fee waivers and/or expense reimbursements. The ratios of expenses to average net assets disclosed in the Fund's Financial Highlights may be lower than the maximum expense ratios due to these additional fee waivers and/or expense reimbursements. The Adviser may also waive additional advisory fees and/or reimburse expenses to enable the Fund to maintain a minimum level of daily net investment income. For the year ended September 30, 2020, approximately $12,455,000 of advisory fees were waived and approximately $61,000 of other expenses were reimbursed by the Adviser pursuant to this arrangement.
C. Administration Fees: The Adviser also serves as Administrator to the Trust and provides administrative services pursuant to an Administration Agreement for an annual fee, accrued daily and paid monthly, of 0.08% of the Fund's average daily net assets. Under a Sub-Administration Agreement between the Administrator and State Street Bank and Trust Company ("State Street"), State Street provides certain administrative services to the Trust. For such services, the Administrator pays State Street a portion of the fee the Administrator receives from the Fund.
D. Shareholder Services Fees: Morgan Stanley Distribution, Inc. ("MSDI" or the "Distributor"), a wholly-owned subsidiary of the Adviser, and an indirect subsidiary of Morgan Stanley, serves as the Trust's Distributor of Fund shares pursuant to a Distribution Agreement. The Trust has adopted a Shareholder Services Plan with respect to the Institutional Class shares pursuant to Rule 12b-1 under the Act. Under the Shareholder Services Plan, the Fund pays the Distributor a shareholder services fee, accrued daily and paid monthly, at an annual rate of 0.05% of the Fund's average daily net assets attributable to the Institutional Class shares.
The Trust has adopted a Shareholder Services Plan with respect to the Class A shares pursuant to Rule 12b-1 under the Act. Under the Shareholder Services Plan, the Fund pays the Distributor a shareholder services fee, accrued daily and paid monthly, at an annual rate of 0.25% of the Fund's average daily net assets attributable to the Class A shares. The Distributor has agreed to waive the 12b-1 fee on Class A shares of the Fund to the extent it exceeds 0.15% of the average daily net assets of such shares on an annualized basis. This waiver will continue for at least one year or until such time as the Trustees act to discontinue all or a portion of such waiver when it
deems such action is appropriate. For the year ended September 30, 2020, this waiver amounted to approximately $2,447,000.
The shareholder services fees are used to support the expenses associated with servicing and maintaining accounts. The Distributor may compensate other parties for providing shareholder support services to investors who purchase Institutional Class and Class A shares.
E. Dividend Disbursing and Transfer/Co-Transfer Agent: The Trust's dividend disbursing and transfer agent is DST Asset Manager Solutions, Inc. ("DST"). Pursuant to a Transfer Agency Agreement, the Trust pays DST a fee based on the number of classes, accounts and transactions relating to the Funds of the Trust.
Morgan Stanley Services Company Inc. serves as Co-Transfer Agent and provides certain transfer agency services to the Fund with respect to certain direct transactions with the Fund.
F. Custodian Fees: State Street (the "Custodian") also serves as Custodian for the Trust in accordance with a Custodian Agreement. The Custodian holds cash, securities and other assets of the Trust as required by the Act. Custody fees are payable monthly based on assets held in custody, investment purchases and sales activity and account maintenance fees, plus reimbursement for certain out-of-pocket expenses.
G. Security Transactions and Transactions with Affiliates: The Fund is permitted to purchase and sell securities ("cross-trade") from and to other Morgan Stanley funds as well as other funds and client accounts for which the Adviser or an affiliate of the Adviser serves as investment adviser, pursuant to procedures approved by the Trustees in compliance with Rule 17a-7 under the Act (the "Rule"). Each cross-trade is executed at the current market price in compliance with provisions of the Rule. For the year ended September 30, 2020, the Fund did not engage in any cross-trade transactions.
The Fund has an unfunded Deferred Compensation Plan (the "Compensation Plan"), which allows each independent Trustee to defer payment of all, or a portion, of the fees he or she receives for serving on the Board of Trustees. Each eligible Trustee generally may elect to have the deferred amounts credited with a return equal to the total return on one or more of the Morgan Stanley funds that are offered as investment options under the Compensation Plan. Appreciation/depreciation and distributions received from these investments are recorded with an offsetting increase/decrease in the deferred compensation obligation and do not affect the NAV of the Fund.
22
Morgan Stanley Institutional Fund Trust
Annual Report — September 30, 2020
Notes to Financial Statements (cont'd)
H. Federal Income Taxes: It is the Fund's intention to continue to qualify as a regulated investment company and distribute all of its taxable and tax-exempt income. Accordingly, no provision for federal income taxes is required in the financial statements.
The Fund may be subject to taxes imposed by countries in which it invests. Such taxes are generally based on income and/or capital gains earned or repatriated. Taxes are accrued based on net investment income, net realized gains and net unrealized appreciation as such income and/or gains are earned. Taxes may also be based on transactions in foreign currency and are accrued based on the value of investments denominated in such currency.
FASB ASC 740-10, "Income Taxes — Overall", sets forth a minimum threshold for financial statement recognition of the benefit of a tax position taken or expected to be taken in a tax return. Management has concluded there are no significant uncertain tax positions that would require recognition in the financial statements. If applicable, the Fund recognizes interest accrued related to unrecognized tax benefits in "Interest Expense" and penalties in "Other Expenses" in the Statement of Operations. The Fund files tax returns with the U.S. Internal Revenue Service, New York and various states. Generally, each of the tax years in the four-year period ended September 30, 2020, remains subject to examination by taxing authorities.
The tax character of distributions paid may differ from the character of distributions shown for GAAP purposes due to short-term capital gains being treated as ordinary income for tax purposes. The tax character of distributions paid during fiscal years 2020 and 2019 was as follows:
2020 Distributions
Paid From:
Ordinary Income
(000) | | 2019 Distributions
Paid From:
Ordinary Income
(000) | |
| $ | 218,626 | | | $ | 351,961 | | |
The amount and character of income and gains to be distributed are determined in accordance with income tax regulations which may differ from GAAP. These book/tax differences are either considered temporary or permanent in nature.
Temporary differences are attributable to differing book and tax treatments for the timing of the recognition of gains (losses) on certain investment transactions and the timing of the deductibility of certain expenses.
The Fund had no permanent differences causing reclassifications among the components of net assets for the year ended September 30, 2020.
At September 30, 2020, the components of distributable earnings for the Fund on a tax basis were as follows:
Undistributed
Ordinary
Income
(000) | | Undistributed
Long-Term
Capital Gain
(000) | |
| $ | 2,077 | | | $ | — | | |
At September 30, 2020, the Fund had available for federal income tax purposes unused short-term capital losses of approximately $67,256,000 that do not have an expiration date.
To the extent that capital loss carryforwards are used to offset any future capital gains realized, no capital gains tax liability will be incurred by the Fund for gains realized and not distributed. To the extent that capital gains are offset, such gains will not be distributed to the shareholders.
I. Credit Facility: The Trust and other Morgan Stanley funds participated in a $300,000,000 committed, unsecured revolving line of credit facility (the "Facility") with State Street. This Facility is to be used for temporary emergency purposes or funding of shareholder redemption requests. The interest rate on borrowings is based on the federal funds rate or 1 month LIBOR rate plus a spread. The Facility also has a commitment fee of 0.25% per annum based on the unused portion of the Facility. During the year ended September 30, 2020, the Fund did not have any borrowings under the Facility.
J. Other: At September 30, 2020, the Fund had record owners of 10% or greater. Investment activities of these shareholders could have a material impact on the Fund. The aggregate percentage of such owners was 78.2%.
K. Market Risk: Certain impacts to public health conditions particular to the coronavirus (COVID-19) outbreak could impact the operations and financial performance of certain of the Fund's investments. The extent of the impact to the financial performance of the Fund's investments will depend on future developments, including (i) the duration and spread of the outbreak, (ii) the restrictions and advisories, (iii) the effects on the financial markets, and (iv) the effects on the economy overall, all of which are highly uncertain and cannot be predicted. If the financial performance of the Fund's investments
23
Morgan Stanley Institutional Fund Trust
Annual Report — September 30, 2020
Notes to Financial Statements (cont'd)
is impacted because of these factors for an extended period, the Fund's investment results may be adversely affected.
L. LIBOR Risk: The Fund's investments, payment obligations and financing terms may be based on floating rates, such as London Interbank Offer Rate ("LIBOR"), Euro Interbank Offered Rate and other similar types of reference rates (each, a "Reference Rate"). These Reference Rates are generally intended to represent the rate at which contributing banks may obtain short-term borrowings from each other within certain financial markets. On July 27, 2017, the Chief Executive of the UK Financial Conduct Authority ("FCA"), which regulates LIBOR, announced that the FCA will no longer persuade nor require banks to submit rates for the calculation of LIBOR and certain other Reference Rates after 2021. Such announcement indicates that the continuation of LIBOR and other Reference Rates on the current basis cannot and will not be guaranteed after the end of 2021. This announcement and any additional regulatory or market changes may have an adverse impact on the Fund or its investments.
In advance of 2022, regulators and market participants are currently engaged in identifying successor Reference Rates ("Alternative Reference Rates"). Additionally, prior to the end of 2021, it is expected that market participants will focus on the transition mechanisms by which the Reference Rates in existing contracts or instruments may be amended, whether through marketwide protocols, fallback contractual provisions, bespoke negotiations or amendments or otherwise. Nonetheless, the termination of certain Reference Rates presents risks to the Fund. At this time, it is not possible to completely identify or predict the effect of any such changes, any establishment of Alternative Reference Rates or any other reforms to Reference Rates that may be enacted in the UK or elsewhere. The elimination of a Reference Rate or any other changes or reforms to the determination or supervision of Reference Rates could have an adverse impact on the market for or value of any securities or payments linked to those Reference Rates and other financial obligations held by the Fund or on its overall financial condition or results of operations.
24
Morgan Stanley Institutional Fund Trust
Annual Report — September 30, 2020
Report of Independent Registered Public Accounting Firm
To the Shareholders and Board of Trustees of
Morgan Stanley Institutional Fund Trust —
Ultra-Short Income Portfolio
Opinion on the Financial Statements
We have audited the accompanying statement of assets and liabilities of Ultra-Short Income Portfolio (the "Fund") (one of the funds constituting Morgan Stanley Institutional Fund Trust (the "Trust")), including the portfolio of investments, as of September 30, 2020, and the related statement of operations for the year then ended, the statements of changes in net assets for each of the two years in the period then ended, the financial highlights for each of the four years in the period then ended and the period from April 28, 2016 (commencement of operations) through September 30, 2016 and the related notes (collectively referred to as the "financial statements"). In our opinion, the financial statements present fairly, in all material respects, the financial position of the Fund (one of the funds constituting Morgan Stanley Institutional Fund Trust) at September 30, 2020, the results of its operations for the year then ended, the changes in its net assets for each of the two years in the period then ended and its financial highlights for each of the four years in the period then ended and the period from April 28, 2016 (commencement of operations) through September 30, 2016, in conformity with U.S. generally accepted accounting principles.
Basis for Opinion
These financial statements are the responsibility of the Trust's management. Our responsibility is to express an opinion on the Fund's financial statements based on our audits. We are a public accounting firm registered with the Public Company Accounting Oversight Board (United States) ("PCAOB") and are required to be independent with respect to the Trust in accordance with the U.S. federal securities law and the applicable rules and regulations of the Securities and Exchange Commission and the PCAOB.
We conducted our audits in accordance with the standards of the PCAOB. Those standards require that we plan and perform the audit to obtain reasonable assurance about whether the financial statements are free of material misstatement, whether due to error or fraud. The Trust is not required to have, nor were we engaged to perform, an audit of the Trust's internal control over financial reporting. As part of our audits we are required to obtain an understanding of internal control over financial reporting but not for the purpose of expressing an opinion on the effectiveness of the Trust's internal control over financial reporting. Accordingly, we express no such opinion.
Our audits included performing procedures to assess the risks of material misstatement of the financial statements, whether due to error or fraud, and performing procedures that respond to those risks. Such procedures included examining, on a test basis, evidence regarding the amounts and disclosures in the financial statements. Our procedures included confirmation of securities owned as of September 30, 2020 by correspondence with the custodian and brokers or by other appropriate auditing procedures where replies from brokers were not received. Our audits also included evaluating the accounting principles used and significant estimates made by management, as well as evaluating the overall presentation of the financial statements. We believe that our audits provide a reasonable basis for our opinion.

We have served as the auditor of one or more Morgan Stanley investment companies since 2000.
Boston, Massachusetts
November 24, 2020
25
Morgan Stanley Institutional Fund Trust
Annual Report — September 30, 2020
Investment Advisory Agreement Approval (unaudited)
Nature, Extent and Quality of Services
The Board reviewed and considered the nature and extent of the investment advisory services provided by the Adviser under the advisory agreement, including portfolio management, investment research and equity and fixed income securities trading. The Board also reviewed and considered the nature and extent of the non-advisory, administrative services provided by the Administrator under the administration agreement, including accounting, operations, clerical, bookkeeping, compliance, business management and planning, legal services and the provision of supplies, office space and utilities at the Adviser's expense. The Board also considered the Adviser's investment in personnel and infrastructure that benefits the Fund. (The Adviser and Administrator together are referred to as the "Adviser" and the advisory and administration agreements together are referred to as the "Management Agreement.") The Board also considered that the Adviser serves a variety of other investment advisory clients and has experience overseeing service providers. The Board also compared the nature of the services provided by the Adviser with similar services provided by non-affiliated advisers as prepared by Broadridge Financial Solutions, Inc. ("Broadridge").
The Board reviewed and considered the qualifications of the portfolio managers, the senior administrative managers and other key personnel of the Adviser who provide the advisory and administrative services to the Fund. The Board determined that the Adviser's portfolio managers and key personnel are well qualified by education and/or training and experience to perform the services in an efficient and professional manner. The Board concluded that the nature and extent of the advisory and administrative services provided were necessary and appropriate for the conduct of the business and investment activities of the Fund and supported its decision to approve the Management Agreement.
Performance, Fees and Expenses of the Fund
The Board reviewed the performance, fees and expenses of the Fund compared to its peers, as prepared by Broadridge, and to appropriate benchmarks where applicable. The Board discussed with the Adviser the performance goals and the actual results achieved in managing the Fund. When considering a fund's performance, the Board and the Adviser place emphasis on trends and longer-term returns (focusing on one-year, three-year and five-year performance, as of December 31, 2019, or since inception, as applicable). When a fund underperforms its benchmark and/or its peer group average, the Board and the Adviser discuss the causes of such underperformance and, where necessary, they discuss specific changes to investment strategy or investment personnel. The Board noted that the Fund's performance was better than its peer group average for the three-year period but below its peer group average for the one-year period and the period since the end of April 2016, the month of the Fund's inception. The Board discussed with the Adviser the level of the advisory and administration fees (together, the "management fee") for this Fund relative to comparable funds and/or other accounts advised by the Adviser and/or compared to its peers as prepared by Broadridge. In addition to the management fee, the Board also reviewed the Fund's total expense ratio. The Board noted that the Fund's management fee and total expense ratio were lower than its peer group averages. After discussion, the Board concluded that the Fund's (i) performance was acceptable and (ii) management fee and total expense ratio were competitive with its peer group averages.
Economies of Scale
The Board considered the size and growth prospects of the Fund and how that relates to the Fund's total expense ratio and particularly the Fund's management fee rate, which does not include breakpoints. In conjunction with its review of the Adviser's profitability, the Board discussed with the Adviser how a change in assets can affect the efficiency or effectiveness of managing the Fund and whether the management fee level is appropriate relative to current and projected asset levels and/or whether the management fee structure reflects economies of scale as asset levels change. The Board has determined that its review of the actual and/or potential economies of scale of the Fund supports its decision to approve the Management Agreement.
Profitability of the Adviser and Affiliates
The Board considered information concerning the costs incurred and profits realized by the Adviser and its affiliates during the last year from their relationship with the Fund and during the last two years from their relationship with the Morgan Stanley Fund Complex and reviewed with the Adviser the cost allocation methodology used to determine the profitability of the Adviser and affiliates. The Board has determined that its review of the analysis of the Adviser's expenses and profitability supports its decision to approve the Management Agreement.
26
Morgan Stanley Institutional Fund Trust
Annual Report — September 30, 2020
Investment Advisory Agreement Approval (unaudited) (cont'd)
Other Benefits of the Relationship
The Board considered other direct and indirect benefits to the Adviser and/or its affiliates derived from their relationship with the Fund and other funds advised by the Adviser. These benefits may include, among other things, fees for trading, distribution and/or shareholder servicing and for transaction processing and reporting platforms used by securities lending agents, and research received by the Adviser generated from commission dollars spent on funds' portfolio trading. The Board reviewed with the Adviser these arrangements and the reasonableness of the Adviser's costs relative to the services performed. The Board has determined that its review of the other benefits received by the Adviser or its affiliates supports its decision to approve the Management Agreement.
Resources of the Adviser and Historical Relationship Between the Fund and the Adviser
The Board considered whether the Adviser is financially sound and has the resources necessary to perform its obligations under the Management Agreement. The Board also reviewed and considered the historical relationship between the Fund and the Adviser, including the organizational structure of the Adviser, the policies and procedures formulated and adopted by the Adviser for managing the Fund's operations and the Board's confidence in the competence and integrity of the senior managers and key personnel of the Adviser. The Board concluded that the Adviser has the financial resources necessary to fulfill its obligations under the Management Agreement and that it is beneficial for the Fund to continue its relationship with the Adviser.
Other Factors and Current Trends
The Board considered the controls and procedures adopted and implemented by the Adviser and monitored by the Fund's Chief Compliance Officer and concluded that the conduct of business by the Adviser indicates a good faith effort on its part to adhere to high ethical standards in the conduct of the Fund's business.
As part of the Board's review, the Board received information from management on the impact of COVID-19 on the firm generally and the Adviser and the Fund in particular including, among other information, the pandemic's current and expected impact on the Fund's performance and operations.
General Conclusion
After considering and weighing all of the above factors, with various written materials and verbal information presented by the Adviser, the Board concluded that it would be in the best interest of the Fund and its shareholders to approve renewal of the Management Agreement for another year. In reaching this conclusion the Board did not give particular weight to any single piece of information or factor referenced above. The Board considered these factors and information over the course of the year and in numerous meetings, some of which were in executive session with only the independent Board members and their counsel present. It is possible that individual Board members may have weighed these factors, and the information presented, differently in reaching their individual decisions to approve the Management Agreement.
27
Morgan Stanley Institutional Fund Trust
Annual Report — September 30, 2020
Liquidity Risk Management Program (unaudited)
In compliance with Rule 22e-4 under the Investment Company Act of 1940, as amended (the "Liquidity Rule"), the Fund has adopted and implemented a liquidity risk management program (the "Program"), which is reasonably designed to assess and manage the risk that the Fund could not meet requests to redeem shares issued by the Fund without significant dilution of remaining investors' interests in the Fund (i.e., liquidity risk). The Fund's Board of Trustees (the "Board") previously approved the designation of the Liquidity Risk Subcommittee (the "LRS") as Program administrator. The LRS is comprised of representatives from various divisions within Morgan Stanley Investment Management.
At a meeting held on April 22-23, 2020, the Board reviewed a written report prepared by the LRS that addressed the Program's operation and assessed its adequacy, and effectiveness of implementation for the period from December 1, 2018, through December 31, 2019, as required under the Liquidity Rule. The report concluded that the Program operated effectively and was adequately and effectively implemented in all material aspects, and that the relevant controls and safeguards were appropriately designed to enable the LRS to administer the Program in compliance with the Liquidity Rule.
In accordance with the Program, the LRS assessed each Fund's liquidity risk no less frequently than annually taking into consideration certain factors, as applicable, such as (i) investment strategy and liquidity of portfolio investments, (ii) short-term and long-term cash flow projections and (iii) holdings of cash and cash equivalents and borrowing arrangements and other funding sources. Certain factors are considered under both normal and reasonably foreseeable stressed conditions.
Each Fund portfolio investment is classified into one of four liquidity categories, which classification is assessed at least monthly by the LRS. The classification is based on a determination of the number of days it is reasonably expected to take to convert the investment into cash, or sell or dispose of the investment, in current market conditions without significantly changing the market value of the investment. Liquidity classification determinations take into account various market, trading and investment-specific considerations, as well as market depth, and in some cases utilize third-party vendor data.
The Liquidity Rule limits a fund's investments in illiquid investments to 15% of its net assets and requires funds that do not primarily hold assets that are highly liquid investments to determine and maintain a minimum percentage of the fund's net assets to be invested in highly liquid investments (highly liquid investment minimum or "HLIM"). The LRS believes that the Program includes provisions reasonably designed to review, monitor and comply with the 15% limit on illiquid investments and for determining, periodically reviewing and complying with the HLIM requirement, as applicable.
There can be no assurance that the Program will achieve its objectives under all circumstances in the future. Please refer to the Fund's prospectus for more information regarding the Fund's exposure to liquidity risk and other risks to which it may be subject.
28
Morgan Stanley Institutional Fund Trust
Annual Report — September 30, 2020
Privacy Notice (unaudited) April 2019
FACTS | | WHAT DOES MSIM DO WITH YOUR PERSONAL INFORMATION? | |
Why? | | Financial companies choose how they share your personal information. Federal law gives consumers the right to limit some but not all sharing. Federal law also requires us to tell you how we collect, share, and protect your personal information. Please read this notice carefully to understand what we do. | |
What? | | The types of personal information we collect and share depend on the product or service you have with us. This information can include:
n Social Security number and income
n investment experience and risk tolerance
n checking account number and wire transfer instructions | |
How? | | All financial companies need to share customers' personal information to run their everyday business. In the section below, we list the reasons financial companies can share their customers' personal information; the reasons MSIM chooses to share; and whether you can limit this sharing. | |
Reasons we can share your personal information | | Does MSIM share? | | Can you limit this sharing? | |
For our everyday business purposes —
such as to process your transactions, maintain your account(s), respond to court orders and legal investigations, or report to credit bureaus | | Yes | | No | |
For our marketing purposes —
to offer our products and services to you | | Yes | | No | |
For joint marketing with other financial companies | | No | | We don't share | |
For our affiliates' everyday business purposes —
information about your transactions and experiences | | Yes | | No | |
For our affiliates' everyday business purposes —
information about your creditworthiness | | No | | We don't share | |
For our affiliates to market to you | | No | | We don't share | |
For non-affiliates to market to you | | No | | We don't share | |
Questions? Call toll-free (844) 312-6327 or email: imprivacyinquiries@morganstanley.com
29
Morgan Stanley Institutional Fund Trust
Annual Report — September 30, 2020
Privacy Notice (unaudited) (cont'd) April 2019
Who we are
Who is providing this notice? | | Morgan Stanley Investment Management, Inc. and its affiliated registered investment advisers, registered broker-dealers, and registered and unregistered funds ("MSIM") | |
What we do
How does MSIM protect my personal information? | | To protect your personal information from unauthorized access and use, we use security measures that comply with federal law. These measures include computer safeguards and secured files and buildings. We have policies governing the proper handling of customer information by personnel and requiring third parties that provide support to adhere to appropriate security standards with respect to such information. | |
How does MSIM collect my personal information? | | We collect your personal information, for example, when you
n open an account or make deposits or withdrawals from your account
n buy securities from us or make a wire transfer
n give us your contact information
We also collect your personal information from others, such as credit bureaus, affiliates, or other companies. | |
Why can't I limit all sharing? | | Federal law gives you the right to limit only
n sharing for affiliates' everyday business purposes — information about your creditworthiness
n affiliates from using your information to market to you
n sharing for non-affiliates to market to you
State laws and individual companies may give you additional rights to limit sharing. See below for more on your rights under state law. | |
Definitions
Affiliates | | Companies related by common ownership or control. They can be financial and non-financial companies.
n Our affiliates include companies with a Morgan Stanley name and financial companies such as Morgan Stanley Smith Barney LLC and Morgan Stanley & Co. | |
Non-affiliates | | Companies not related by common ownership or control. They can be financial and non-financial companies.
n MSIM does not share with non-affiliates so they can market to you. | |
Joint marketing | | A formal agreement between non-affiliated financial companies that together market financial products or services to you.
n MSIM doesn't jointly market | |
Other Important Information
Vermont: Except as permitted by law, we will not share personal information we collect about Vermont residents with Non-affiliates unless you provide us with your written consent to share such information.
California: Except as permitted by law, we will not share personal information we collect about California residents with Non-affiliates and we will limit sharing such personal information with our Affiliates to comply with California privacy laws that apply to us.
30
Morgan Stanley Institutional Fund Trust
Annual Report — September 30, 2020
Trustee and Officer Information (unaudited)
Independent Trustees:
Name, Address and Birth Year
of Independent Trustee | | Position(s)
Held with
Registrant | | Length of Time
Served* | | Principal Occupation(s) During Past 5 Years
and Other Relevant Professional Experience | | Number of
Funds in
Fund Complex
Overseen by
Independent
Trustee** | | Other Directorships
Held by Independent
Trustee*** | |
Frank L. Bowman
c/o Perkins Coie LLP
Counsel to the Independent Trustees
1155 Avenue of the Americas, 22nd Floor
New York, NY 10036
Birth Year 1944 | | Trustee | | Since
August
2006 | | President, Strategic Decisions, LLC (consulting) (since February 2009); Director or Trustee of various Morgan Stanley Funds (since August 2006); Chairperson of the Compliance and Insurance Committee (since October 2015); formerly, Chairperson of the Insurance Sub-Committee of the Compliance and Insurance Committee (2007-2015); served as President and Chief Executive Officer of the Nuclear Energy Institute (policy organization) (February 2005-November 2008); retired as Admiral, U.S. Navy after serving over 38 years on active duty including 8 years as Director of the Naval Nuclear Propulsion Program in the Department of the Navy and the U.S. Department of Energy (1996-2004); served as Chief of Naval Personnel (July 1994-September 1996) and on the Joint Staff as Director of Political Military Affairs (June 1992-July 1994); knighted as Honorary Knight Commander of the Most Excellent Order of the British Empire; awarded the Officier de l'Orde National du Mérite by the French Government; elected to the National Academy of Engineering (2009). | | | 86 | | | Director of Naval and Nuclear Technologies LLP; Director Emeritus of the Armed Services YMCA; Member of the National Security Advisory Council of the Center for U.S. Global Engagement and a member of the CNA Military Advisory Board; Trustee of Fairhaven United Methodist Church; Member of the Board of Advisors of the Dolphin Scholarship Foundation; Director of other various non-profit organizations; Formerly, Director of BP p.l.c. (November 2010-May 2019). | |
Kathleen A. Dennis
c/o Perkins Coie LLP
Counsel to the Independent Trustees
1155 Avenue of the Americas, 22nd Floor
New York, NY 10036
Birth Year 1953 | | Trustee | | Since
August
2006 | | President, Cedarwood Associates (mutual fund and investment management consulting) (since July 2006); Chairperson of the Liquidity and Alternatives Sub-Committee of the Investment Committee (since October 2006) and Director or Trustee of various Morgan Stanley Funds (since August 2006); formerly, Senior Managing Director of Victory Capital Management (1993-2006). | | | 86 | | | Director of various
non-profit organizations. | |
Nancy C. Everett
c/o Perkins Coie LLP
Counsel to the Independent Trustees
1155 Avenue of the Americas, 22nd Floor
New York, NY 10036
Birth Year 1955 | | Trustee | | Since
January
2015 | | Chief Executive Officer, Virginia Commonwealth University Investment Company (since November 2015); Owner, OBIR, LLC (institutional investment management consulting) (since June 2014); formerly, Managing Director, BlackRock, Inc. (February 2011-December 2013); and Chief Executive Officer, General Motors Asset Management (a/k/a Promark Global Advisors, Inc.) (June 2005-May 2010). | | | 87 | | | Formerly, Member of Virginia Commonwealth University School of Business Foundation (2005-2016); Member of Virginia Commonwealth University Board of Visitors (2013-2015); Member of Committee on Directors for Emerging Markets Growth Fund, Inc. (2007-2010); Chairperson of Performance Equity Management, LLC (2006-2010); and Chairperson, GMAM Absolute Return Strategies Fund, LLC (2006-2010). | |
31
Morgan Stanley Institutional Fund Trust
Annual Report — September 30, 2020
Trustee and Officer Information (unaudited) (cont'd)
Independent Trustees: (cont'd)
Name, Address and Birth Year
of Independent Trustee | | Position(s)
Held with
Registrant | | Length of Time
Served* | | Principal Occupation(s) During Past 5 Years
and Other Relevant Professional Experience | | Number of
Funds in
Fund Complex
Overseen by
Independent
Trustee** | | Other Directorships
Held by Independent
Trustee*** | |
Jakki L. Haussler
c/o Perkins Coie LLP
Counsel to the Independent Trustees
1155 Avenue of the Americas, 22nd Floor
New York, NY 10036
Birth Year 1957 | | Trustee | | Since
January
2015 | | Chairman, Opus Capital Group (since January 1996); formerly, Chief Executive Officer, Opus Capital Group (1996-2019); Director, Capvest Venture Fund, LP (May 2000-December 2011); Partner, Adena Ventures, LP (July 1999-December 2010); Director, The Victory Funds (February 2005-July 2008). | | | 87 | | | Director of Service Corporation International and Member, Audit Committee and Investment Committee; Director of Cincinnati Bell Inc. and Member, Audit Committee and Governance and Nominating Committee; Director of Northern Kentucky University Foundation and Member, Investment Committee; Member of Chase College of Law Transactional Law Practice Center Board of Advisors; Director of Chase College of Law Board of Visitors; formerly, Member, University of Cincinnati Foundation Investment Committee; Member, Miami University Board of Visitors (2008-2011); Trustee of Victory Funds (2005-2008) and Chairman, Investment Committee (2007-2008); Member, Service Provider Committee (2005-2008) and Director of Best Transport (2006-2019). | |
Dr. Manuel H. Johnson
c/o Johnson Smick
International, Inc.
220 I Street, NE — Suite 200 Washington, D.C. 20002
Birth Year 1949 | | Trustee | | Since
July
1991 | | Senior Partner, Johnson Smick International, Inc. (consulting firm); Chairperson of the Investment Committee (since October 2006) and Director or Trustee of various Morgan Stanley Funds (since July 1991); Co-Chairman and a founder of the Group of Seven Council (G7C) (international economic commission); formerly, Chairperson of the Audit Committee (July 1991-September 2006), Vice Chairman of the Board of Governors of the Federal Reserve System and Assistant Secretary of the U.S. Treasury. | | | 86 | | | Director of NVR, Inc. (home construction). | |
Joseph J. Kearns
c/o Perkins Coie LLP
Counsel to the Independent Trustees
1155 Avenue of the Americas, 22nd Floor
New York, NY 10036
Birth Year 1942 | | Trustee | | Since
August
1994 | | Senior Adviser, Kearns & Associates LLC (investment consulting); Chairperson of the Audit Committee (since October 2006) and Director or Trustee of various Morgan Stanley Funds (since August 1994); Director, Rubicorn Investments (since February 2019); formerly, Deputy Chairperson of the Audit Committee (July 2003-September 2006) and Chairperson of the Audit Committee of various Morgan Stanley Funds (since August 1994); CFO of the J. Paul Getty Trust (1982-1999). | | | 87 | | | Prior to August 10, 2016, Director of Electro Rent Corporation (equipment leasing); Prior to December 31, 2013, Director of The Ford Family Foundation. | |
32
Morgan Stanley Institutional Fund Trust
Annual Report — September 30, 2020
Trustee and Officer Information (unaudited) (cont'd)
Independent Trustees: (cont'd)
Name, Address and Birth Year
of Independent Trustee | | Position(s)
Held with
Registrant | | Length of Time
Served* | | Principal Occupation(s) During Past 5 Years
and Other Relevant Professional Experience | | Number of
Funds in
Fund Complex
Overseen by
Independent
Trustee** | | Other Directorships
Held by Independent
Trustee*** | |
Michael F. Klein
c/o Perkins Coie LLP
Counsel to the Independent Trustees
1155 Avenue of the Americas, 22nd Floor
New York, NY 10036
Birth Year 1958 | | Trustee | | Since
August
2006 | | Managing Director, Aetos Alternatives Management, LP (since March 2000); Co-President, Aetos Alternatives Management, LP (since January 2004) and Co-Chief Executive Officer of Aetos Alternatives Management, LP (since August 2013); Chairperson of the Fixed Income Sub-Committee of the Investment Committee (since October 2006) and Director or Trustee of various Morgan Stanley Funds (since August 2006); formerly, Managing Director, Morgan Stanley & Co. Inc. and Morgan Stanley Dean Witter Investment Management and President, various Morgan Stanley Funds (June 1998-March 2000); Principal, Morgan Stanley & Co. Inc. and Morgan Stanley Dean Witter Investment Management (August 1997-December 1999). | | | 86 | | | Director of certain investment funds managed or sponsored by Aetos Alternatives Management, LP; Director of Sanitized AG and Sanitized Marketing AG (specialty chemicals). | |
Patricia Maleski
c/o Perkins Coie LLP
Counsel to the Independent Trustees
1155 Avenue of the Americas, 22nd Floor
New York, NY 10036
Birth Year 1960 | | Trustee | | Since
January
2017 | | Managing Director, JPMorgan Asset Management (2004-2016); Oversight and Control Head of Fiduciary and Conflicts of Interest Program (2015-2016); Chief Control Officer-Global Asset Management (2013-2015); President, JPMorgan Funds (2010-2013); Chief Administrative Officer (2004-2013); various other positions including Treasurer and Board Liaison (since 2001). | | | 87 | | | None. | |
W. Allen Reed
c/o Perkins Coie LLP
Counsel to the Independent Trustees
1155 Avenue of the Americas, 22nd Floor
New York, NY 10036
Birth Year 1947 | | Chair of the Board and Trustee | | Chair of the Boards since August 2020 and Trustee since August 2006 | | Chair of the Boards of various Morgan Stanley Funds (since August 2020); Chairperson of the Governance Committee; Chairperson of the Equity Sub-Committee of the Investment Committee (since October 2006) and Director or Trustee of various Morgan Stanley Funds (since August 2006); formerly, Vice Chair of the Boards of various Morgan Stanley Funds (January 2020-August 2020); President and Chief Executive Officer of General Motors Asset Management; Chairman and Chief Executive Officer of the GM Trust Bank and Corporate Vice President of General Motors Corporation (August 1994-December 2005). | | | 86 | | | Formerly, Director of Legg Mason, Inc. (2006-2019); and Director of the Auburn University Foundation (2010-2015). | |
* This is the earliest date the Trustee began serving the Morgan Stanley Funds. Each Trustee serves an indefinite term, until his or her successor is elected.
** The Fund Complex includes (as of December 31, 2019) all open-end and closed-end funds (including all of their portfolios) advised by Morgan Stanley Investment Management Inc. (the "Adviser") and any funds that have an adviser that is an affiliated person of the Adviser (including, but not limited to, Morgan Stanley AIP GP LP).
*** This includes any directorships at public companies and registered investment companies held by the Trustee at any time during the past five years.
33
Morgan Stanley Institutional Fund Trust
Annual Report — September 30, 2020
Trustee and Officer Information (unaudited) (cont'd)
Executive Officers:
Name, Address and Birth Year
of Executive Officer | | Position(s) Held
with
Registrant | | Length of
Time Served* | | Principal Occupation(s) During Past 5 Years | |
John H. Gernon
522 Fifth Avenue
New York, NY 10036
Birth Year 1963 | | President and Principal Executive Officer | | Since September 2013 | | President and Principal Executive Officer of the Equity and Fixed Income Funds and the Morgan Stanley AIP Funds (since September 2013) and the Liquidity Funds and various money market funds (since May 2014) in the Fund Complex; Managing Director of the Adviser; Head of Public Markets Product Development (since 2006). | |
Timothy J. Knierim
522 Fifth Avenue
New York, NY 10036
Birth Year 1959 | | Chief Compliance Officer | | Since December 2016 | | Managing Director of the Adviser and various entities affiliated with the Adviser; Chief Compliance Officer of various Morgan Stanley Funds and the Adviser (since December 2016) and Chief Compliance Officer of Morgan Stanley AIP GP LP (since 2014). Formerly, Managing Director and Deputy Chief Compliance Officer of the Adviser (2014-2016); and formerly, Chief Compliance Officer of Prudential Investment Management, Inc. (2007-2014). | |
Francis J. Smith
522 Fifth Avenue
New York, NY 10036
Birth Year 1965 | | Treasurer and Principal Financial Officer | | Treasurer since July 2003 and Principal Financial Officer since September 2002 | | Managing Director of the Adviser and various entities affiliated with the Adviser; Treasurer (since July 2003) and Principal Financial Officer of various Morgan Stanley Funds (since September 2002). | |
Mary E. Mullin
522 Fifth Avenue
New York, NY 10036
Birth Year 1967 | | Secretary | | Since
June
1999 | | Managing Director of the Adviser; Secretary of various Morgan Stanley Funds (since June 1999). | |
Michael J. Key
522 Fifth Avenue
New York, NY 10036
Birth Year 1979 | | Vice President | | Since
June
2017 | | Vice President of the Equity and Fixed Income Funds, Liquidity Funds, various money market funds and the Morgan Stanley AIP Funds in the Fund Complex (since June 2017); Executive Director of the Adviser; Head of Product Development for Equity and Fixed Income Funds (since August 2013). | |
* This is the earliest date the officer began serving the Morgan Stanley Funds. Each officer serves a one-year term, until his or her successor is elected and qualifies.
34
Morgan Stanley Institutional Fund Trust
Annual Report — September 30, 2020
Adviser and Administrator
Morgan Stanley Investment Management Inc.
522 Fifth Avenue
New York, New York 10036
Distributor
Morgan Stanley Distribution, Inc.
522 Fifth Avenue
New York, New York 10036
Dividend Disbursing and Transfer Agent
DST Asset Manager Solutions, Inc.
2000 Crown Colony Drive
Quincy, Massachusetts 02169
Co-Transfer Agent
Morgan Stanley Services Company, Inc.
522 Fifth Avenue
New York, New York 10036
Custodian
State Street Bank and Trust Company
One Lincoln Street
Boston, Massachusetts 02111
Legal Counsel
Dechert LLP
1095 Avenue of the Americas
New York, New York 10036
Counsel to the Independent Trustees
Perkins Coie LLP
1155 Avenue of the Americas,
22nd Floor
New York, New York 10036
Independent Registered Public Accounting Firm
Ernst & Young LLP
200 Clarendon Street
Boston, Massachusetts 02116
Reporting to Shareholders
Each Morgan Stanley fund provides a complete schedule of portfolio holdings in its Semi-Annual and the Annual Reports within 60 days of the end of the fund's second and fourth fiscal quarters. The Semi-Annual and Annual Reports are filed electronically with the Securities and Exchange Commission ("SEC") on Form N-CSRS and Form N-CSR, respectively. Morgan Stanley also delivers the Semi-Annual and Annual Reports to fund shareholders and makes these reports available on its public website, www.morganstanley.com/im/shareholderreports. Each Morgan Stanley non-money market fund also files a complete schedule of portfolio holdings with the SEC for the fund's first and third fiscal quarters as an attachment to Form N-PORT. Morgan Stanley does not deliver the reports for the first and third fiscal quarters to shareholders, nor are the reports posted to the Morgan Stanley public website. However, the holdings for each money market fund are posted to the Morgan Stanley public website. You may obtain the Form N-PORT filings (as well as the Form N-CSR and N-CSRS filings) by accessing the SEC's website, www.sec.gov. You can also request copies of these materials, upon payment of a duplicating fee, by electronic request at the SEC's email address (publicinfo@sec.gov).
Proxy Voting Policies and Procedures and Proxy Voting Record
You may obtain a copy of the Trust's Proxy Voting Policy and Procedures and information regarding how the Trust voted proxies relating to portfolio securities during the most recent twelve-month period ended June 30, without charge, upon request, by calling toll free 1 (800) 548-7786 or by visiting our website at www.morganstanley.com/im/shareholderreports. This information is also available on the SEC's website at www.sec.gov.
This report is authorized for distribution only when preceded or accompanied by a prospectus or summary prospectus of the applicable Fund of Morgan Stanley Institutional Fund Trust, which describes in detail the Fund's investment policies, risks, fees and expenses. Please read the prospectus carefully before you invest or send money. For additional information, including information regarding the investments comprising the Fund, please visit our website at www.morganstanley.com/im/shareholderreports or call toll free 1 (800) 548-7786.
35
Printed in U.S.A.
This Report has been prepared for shareholders and may be distributed to others only if preceded or accompanied by a current prospectus.
Morgan Stanley Investment Management Inc.
522 Fifth Avenue
New York, New York 10036
© 2020 Morgan Stanley. Morgan Stanley Distribution, Inc.

IFTUSIANN
3299158 EXP 11.30.21

Morgan Stanley Institutional Fund Trust
Ultra-Short Municipal Income Portfolio
Annual Report
September 30, 2020
Beginning on January 1, 2021, as permitted by regulations adopted by the Securities and Exchange Commission ("SEC"), paper copies of the Fund's Annual and Semi-Annual Reports to Shareholders ("Shareholder Reports") will no longer be sent by mail, unless you specifically request paper copies of the Shareholder Reports from the Fund or from your financial intermediary, such as a broker-dealer or a bank. Instead, the Shareholder Reports will be made available on the Fund's website, https://www.morganstanley.com/im/shareholderreports and you will be notified by mail each time a Shareholder Report is posted and provided with a website link to access the Shareholder Report. If you already elected to receive Shareholder Reports electronically, you will not be affected by this change and you need not take any action. You may elect to receive Shareholder Reports and other communications from the Fund electronically anytime by contacting your financial intermediary or, if you are a direct investor, please follow the instructions on the envelope.
Beginning on January 1, 2019, you may elect to receive all future Shareholder Reports in paper free of charge. If you invest through a financial intermediary, you can contact your financial intermediary to request that you continue to receive paper copies of your Shareholder Reports. If you invest directly with the Fund, please follow the instructions on the envelope to let the Fund know you wish to continue receiving paper copies of your Shareholder Reports. Your election to receive Shareholder Reports in paper will apply to all funds held in your account if you invest through your financial intermediary or all funds held with the fund complex if you invest directly with a fund.

Morgan Stanley Institutional Fund Trust
Annual Report — September 30, 2020
Shareholders' Letter | | | 2 | | |
Expense Example | | | 3 | | |
Investment Overview | | | 4 | | |
Portfolio of Investments | | | 7 | | |
Statement of Assets and Liabilities | | | 10 | | |
Statement of Operations | | | 11 | | |
Statements of Changes in Net Assets | | | 12 | | |
Financial Highlights | | | 13 | | |
Notes to Financial Statements | | | 16 | | |
Report of Independent Registered Public Accounting Firm | | | 21 | | |
Investment Advisory Agreement Approval | | | 22 | | |
Liquidity Risk Management Program | | | 24 | | |
Federal Tax Notice | | | 25 | | |
Privacy Notice | | | 26 | | |
Trustee and Officer Information | | | 28 | | |
This report is authorized for distribution only when preceded or accompanied by a prospectus or summary prospectus of the applicable Fund of the Morgan Stanley Institutional Fund Trust. To receive a prospectus and/or statement of additional information ("SAI"), which contains more complete information such as investment objectives, charges, expenses, policies for voting proxies, risk considerations and describes in detail each of the Fund's investment policies to the prospective investor, please call toll free 1 (800) 548-7786. Please read the prospectuses carefully before you invest or send money.
Additionally, you can access information about the Fund, including performance, characteristics and investment team commentary, through Morgan Stanley Investment Management's website: www.morganstanley.com/im/shareholderreports.
Market forecasts provided in this report may not necessarily come to pass. There is no guarantee that any sectors mentioned will continue to perform as discussed herein or that securities in such sectors will be held by the Fund in the future. There is no assurance that a fund will achieve its investment objective. Funds are subject to market risk, which is the possibility that market values of securities owned by the Fund will decline and, therefore, the value of the Fund's shares may be less than what you paid for them. Accordingly, you can lose money investing in this Fund. Please see the prospectus for more complete information on investment risks.
1
Morgan Stanley Institutional Fund Trust
Annual Report — September 30, 2020
Shareholders' Letter (unaudited)
Dear Shareholders,
We are pleased to provide this Annual Report, in which you will learn how your investment in Ultra-Short Municipal Income Portfolio (the "Fund") performed during the latest twelve-month period.
Morgan Stanley Investment Management is a client-centric, investor-led organization. Our global presence, intellectual capital, and breadth of products and services enable us to partner with investors to meet the evolving challenges of today's financial markets. We aim to deliver superior investment service and to empower our clients to make the informed decisions that help them reach their investment goals.
As always, we thank you for selecting Morgan Stanley Investment Management, and look forward to working with you in the months and years ahead.
Sincerely,

John H. Gernon
President and Principal Executive Officer
October 2020
2
Morgan Stanley Institutional Fund Trust
Annual Report — September 30, 2020
Expense Example (unaudited)
Ultra-Short Municipal Income Portfolio
As a shareholder of the Fund, you may incur two types of costs: (1) transactional costs; and (2) ongoing costs, which may include advisory fees, administration fees, distribution and shareholder services fees; and other Fund expenses. This example is intended to help you understand your ongoing costs (in dollars) of investing in the Fund and to compare these costs with the ongoing costs of investing in other mutual funds.
This example is based on an investment of $1,000 invested at the beginning of the six-month period ended September 30, 2020 and held for the entire six-month period.
Actual Expenses
The table below provides information about actual account values and actual expenses. You may use the information in this table, together with the amount you invested, to estimate the expenses that you paid over the period. Simply divide your account value by $1,000 (for example, an $8,600 account value divided by $1,000 = 8.6), then multiply the result by the number in the table under the heading entitled "Actual Expenses Paid During Period" to estimate the expenses you paid on your account during this period.
Hypothetical Example for Comparison Purposes
The table below provides information about hypothetical account values and hypothetical expenses based on the Fund's actual expense ratio and an assumed rate of return of 5% per year before expenses, which is not the Fund's actual return. The hypothetical account values and expenses may not be used to estimate the actual ending account balance or expenses you paid for the period. You may use this information to compare the ongoing costs of investing in the Fund and other funds. To do so, compare this 5% hypothetical example with the 5% hypothetical examples that appear in the shareholder reports of the other funds.
Please note that the expenses shown in the table are meant to highlight your ongoing costs only and do not reflect any transactional costs. Therefore, the information for each class in the table is useful in comparing ongoing costs only, and will not help you determine the relative total costs of owning different funds. In addition, if these transactional costs were included, your costs would have been higher.
| | | Beginning
Account
Value
4/1/20 | | Actual Ending
Account
Value
9/30/20 | | Hypothetical
Ending Account
Value | | Actual
Expenses
Paid
During
Period* | | Hypothetical
Expenses Paid
During Period* | | Net
Expense
Ratio
During
Period** | |
Ultra-Short Municipal Income Portfolio Class IR | | $ | 1,000.00 | | | $ | 1,002.20 | | | $ | 1,024.35 | | | $ | 0.65 | | | $ | 0.66 | | | | 0.13 | % | |
Ultra-Short Municipal Income Portfolio Institutional Class | | | 1,000.00 | | | | 1,002.70 | | | | 1,023.85 | | | | 1.15 | | | | 1.16 | | | | 0.23 | | |
Ultra-Short Municipal Income Portfolio Class A | | | 1,000.00 | | | | 1,001.30 | | | | 1,023.50 | | | | 1.50 | | | | 1.52 | | | | 0.30 | | |
* Expenses are calculated using each Fund Class' annualized net expense ratio (as disclosed), multiplied by the average account value over the period and multiplied by 183/366 (to reflect the most recent one-half year period).
** Annualized.
3
Morgan Stanley Institutional Fund Trust
Annual Report — September 30, 2020
Investment Overview (unaudited)
Ultra-Short Municipal Income Portfolio
The Fund seeks current income exempt from federal income tax and capital preservation while maintaining liquidity.
Performance
For the fiscal year ended September 30, 2020, the Fund's Institutional Class Share had a total return based on net asset value and reinvestment of distributions per share of 1.01%, net of fees. The Fund's Institutional Class Share outperformed against the Fund's benchmark, the Bloomberg BVAL Municipal AAA Yield Curve (Callable) 3 Month Index (the "Index"), which returned 0.64%. For the seven-day period ended September 30, 2020, the Fund's Institutional Class Share provided an annualized current yield of 0.06% (subsidized) and –0.30% (non-subsidized), while its 30-day moving average annualized yield was 0.04% (subsidized) and –0.32% (non-subsidized). The 30-day SEC yield was 0.04% (subsidized) and –0.32% (non-subsidized). The 30-day taxable equivalent SEC yield was 0.06% (subsidized) and –0.50% (non-subsidized). The non-subsidized yield reflects what the yield would have been had a fee and/or expense waiver not been in place during the period shown. Past performance is no guarantee of future results.
Factors Affecting Performance
• Municipal bonds experienced significant volatility in the first half of 2020 triggered by the global pandemic. The increase in short-term tax-exempt yields in March 2020 was largely a supply and demand situation related to redemption activity across the money market fund industry. The Securities Industry and Financial Markets Association (SIFMA) Municipal Swap Index, which is a 7-day high-grade market index comprised of tax-exempt variable rate demand obligations (VRDOs), spiked to a high of 5.20% on March 18, 2020.i
• As fund flows stabilized across money markets and supply in tax-exempt securities became limited, yields dropped from the March highs. At the same time, the Federal Reserve (Fed) and central banks around the world injected liquidity into the short-term markets. To combat the economic slowdown from the prolonged shutdown, the Fed announced that it would extend asset purchases (known as quantitative easing) to support the economy to an unlimited amount, as well as include other assets such as corporate and municipal bonds. In addition, the Fed created the Money Market Liquidity
Facility to support prime and tax-exempt money markets. Importantly, the concerns in the overall money market industry were largely unrelated to tax-exempt/municipal securities; this was a liquidity crisis.
• On April 9, 2020, the Fed announced the creation of the Municipal Liquidity Facility (MLF) to help state and local governments better manage cash flow pressures to continue to serve households and businesses in their communities. With the creation of the MLF, the broader municipal market stabilized and began to normalize through May 2020.
• After a strong three-month recovery, the muni market began to cool in the later part of the third quarter of 2020. All-time low yields, uncertainty around additional fiscal support and less favorable supply-demand dynamics began to weigh on the market.
• Issuance remained high through the third quarter of 2020 (at $47.28 billion for the month of September, the highest monthly issuance since records began in 1986).ii Supply continued to outpace reinvestment of income from coupons, calls and maturities, negating the net negative supply that typically occurs at this time of year. Bid-wanted activity increased in the secondary market, while dealer inventories remained near multi-year lows, signaling a weaker appetite for municipal bonds among the broker-dealer community.
• Investor flows into municipal bond funds remained net positive but waned later in the third quarter of 2020 as valuations became stretched and fundamental concerns resurfaced. The inability of Congress to reach an agreement on another round of fiscal aid was causing concerns that cities and states will be ill-equipped to address an estimated $1 trillion of budgetary shortfalls.iii However, we note that most municipal issuers have ample capacity to meet their obligations without federal assistance.
i Source: Bloomberg L.P. The SIFMA Index is issued weekly and is compiled from the weekly interest rate resets of tax-exempt variable rate issues included in a database maintained by Municipal Market Data which meet specific criteria established from time to time by the Securities Industry and Financial Markets Association. The index performance is provided for illustrative purposes only and is not meant to depict the performance of a specific investment.
ii Source: The Bond Buyer, September 30, 2020.
iii Source: Barron's, "Cities and States are Facing a $1 Trillion Budget Mess. There Will Be More Trouble Ahead," Leslie P. Norton and Stephen Kleege, August 28, 2020.
4
Morgan Stanley Institutional Fund Trust
Annual Report — September 30, 2020
Investment Overview (unaudited) (cont'd)
Ultra-Short Municipal Income Portfolio
• While state and local governments will face significant headwinds as they finalize their 2021 and 2022 budgets, state governments have broad powers to recover lost revenues and cut spending to balance their budgets. Most municipal governments are highly rated and have the constitutional ability to incur debt until revenues recover. Issuance has spiked in recent months as borrowers take advantage of low rates to reduce their interest expense. Large lower-quality borrowers have tapped into the Fed's Municipal Liquidity Facility to cover operating costs at lower rates than those available in the traditional municipal bond market.
• Key positive contributors to the Fund's performance included its high exposure to floating- and variable-rate notes (63% of the portfolio as of September 30, 2020). The Fund's floating-rate note (FRN) holdings benefited from relatively low price volatility in the period, and the Fund captured strong income from FRN holdings.
• The Fund's sector and credit quality allocations were favorable to performance as credit rebounded in May and June 2020 after the sell-off in March 2020. The Fund's overweight allocation in corporate credit (industrial development revenue/pollution control revenue bonds), utility bonds and health care bonds outperformed as these sectors recovered.
• However, the declining interest rate environment has limited reinvestment opportunities, as coupon income and the proceeds from called and maturing bonds are reinvested into the lower yielding bonds on offer in the current market. Additionally, market technicals were a headwind to performance later in the period. Strong issuance in the third quarter of 2020 led to the refunding and call of many FRN holdings.
Management Strategies
• We anticipate increased volatility in the months ahead and a less favorable supply and demand dynamic that will likely act as a near-term drag on the market. We believe that clarity around the size and scope of additional federal stimulus is necessary to mitigate uncertainty and ease investor concerns.
• We maintain a short duration stance given stretched valuations and the potential for increased volatility in the coming months. We continue to hold a bias toward higher quality assets overall and continue to advocate careful security selection as the impact of the pandemic varies across market segments. We prefer essential service revenue issues such as water & sewer, public power and pollution control. With the front end of the municipal yield curve being flat, we believe the portfolio can continue to benefit in terms of liquidity and income. The Fund's exposures to variable-rate demand notes, FRNs and 3-month put and tender option bond rolls may contribute to higher income and principal stability, as well as provide the flexibility to adjust and take advantage of market opportunities as they present.
5
Morgan Stanley Institutional Fund Trust
Annual Report — September 30, 2020
Investment Overview (unaudited) (cont'd)
Ultra-Short Municipal Income Portfolio
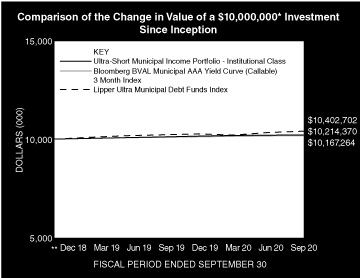
* Minimum Investment
** Commenced operations on December 19, 2018.
In accordance with SEC regulations, the Fund's performance shown assumes that all recurring fees (including management fees) were deducted and all dividends and distributions were reinvested. The performance of Class A and Class IR shares will vary from the performance of Institutional Class shares and will be negatively impacted by additional fees assessed to those classes (where applicable).
Performance Compared to the Bloomberg BVAL Municipal AAA Yield Curve (Callable) 3 Month Index(1), and the Lipper Short Municipal Debt Funds Index(2)
| | | Period Ended September 30, 2020
Total Returns(3) | |
| | | | | Average Annual | |
| | | One
Year | | Five
Years | | Ten
Years | | Since
Inception(5) | |
Fund — Class IR Shares
w/o sales charges(4) | | | 0.91 | % | | | — | | | | — | | | | 1.18 | % | |
Fund — Institutional Class Shares
w/o sales charges(4) | | | 1.01 | | | | — | | | | — | | | | 1.20 | | |
Fund — Class A Shares
w/o sales charges(4) | | | 0.73 | | | | — | | | | — | | | | 0.99 | | |
Bloomberg BVAL Municipal AAA
Yield Curve (Callable) 3 Month Index | | | 0.64 | | | | — | | | | — | | | | 0.94 | | |
Lipper Short Municipal Debt
Funds Index | | | 1.80 | | | | — | | | | — | | | | 2.24 | | |
Performance data quoted represents past performance, which is no guarantee of future results, and current performance may be lower or higher than the figures shown. Performance assumes that all dividends and distributions, if any, were reinvested. For the most recent month-end performance figures, please visit www.morganstanley.com/im/shareholderreports. Investment returns and principal value will fluctuate so that Fund shares, when redeemed, may be worth more or less than their original cost. Total returns do not reflect the deduction of taxes that a shareholder would pay on Fund distributions or the redemption of Fund shares. Performance of share classes will vary due to differences in expenses.
(1) Bloomberg BVAL Municipal AAA Yield Curve (Callable) 3 Month Index is Bloomberg's evaluated pricing service, BVAL, provides a municipal "AAA" 5% coupon benchmark yield curve that is the baseline curve for BVAL tax-exempt municipals. It is populated with high quality U.S. municipal bonds with an average rating of "AAA" from Moody's and S&P. The yield curve is built using non-parametric fit of market data obtained from the Municipal Securities Rulemaking Board, new issues and other proprietary contributed prices. The benchmark is updated hourly and utilizes eligible "AAA" traded observations throughout the day and accessible on through Bloomberg services. The Index is unmanaged and its returns do not include any sales charges or fees. Such costs would lower performance. It is not possible to invest directly in an index.
(2) The Lipper Short Municipal Debt Funds Index is an equally weighted performance index of the largest qualifying funds (based on net assets) in the Lipper Short Municipal Debt Funds classification. The Index, which is adjusted for capital gains distributions and income dividends, is unmanaged and should not be considered an investment. There are currently 30 funds represented in this Index. As of the date of this report, the Fund was in the Lipper Short Municipal Debt Funds classification.
(3) Total returns for the Fund reflect expenses waived and/or reimbursed, if applicable, by the Adviser. Without such waivers and/or reimbursements, total returns would have been lower.
(4) Commenced operations on December 19, 2018.
(5) For comparative purposes, average annual since inception returns listed for the Indexes refer to the inception date of the Fund, not the inception of the Indexes.
6
Morgan Stanley Institutional Fund Trust
Annual Report — September 30, 2020
Portfolio of Investments
Ultra-Short Municipal Income Portfolio
| | | Face
Amount
(000) | | Value
(000) | |
Weekly Variable Rate Bonds (a) (29.2%) | |
Ascension Parish, LA, BASF Corp.
Project Ser 1995 (AMT)
0.30%, 3/1/25 | | $ | 2,400 | | | $ | 2,400 | | |
Blytheville Arkansas Industrial, AR,
Development Revenue Variable
Refunding Revenue Bonds Nucor Corp. 2002
0.20%, 1/2/33 | | | 8,000 | | | | 8,000 | | |
Brazos, TX, River Harbor Navigation District
BASF Corp. Project Ser 1996 (AMT) | |
0.30%, 4/1/31 | | | 5,000 | | | | 5,000 | | |
Iowa State Finance Authority,
Midwestern Disaster Area Revenue
Bonds Archer-Daniels-Midland Company
Project Series 2012 | |
0.16%, 12/1/45 | | | 10,000 | | | | 10,000 | | |
Solid Waste Facilities Revenue Bonds,
Mid America Energy Company Project,
Ser 2016 B (AMT) | |
0.19%, 12/1/46 | | | 7,500 | | | | 7,500 | | |
Solid Waste Facilities Revenue Bonds,
Mid America Energy Company Project, Ser 2017 | |
0.17%, 12/1/47 | | | 7,500 | | | | 7,500 | | |
Kentucky Economic Development Finance
Authority, KY, Catholic Health Initiatives
Ser 2004 C | |
0.21%, 5/1/34 | | | 2,400 | | | | 2,400 | | |
Mississippi Business Finance Corporation,
MS, Solid Waste Disposal
Revenue Variable Bonds Waste
Management Inc 2003 | |
0.18%, 7/1/28 | | | 3,500 | | | | 3,500 | | |
Parish of St. James, State of Louisiana
Revenue Bonds, LA, Nucor Steel Louisiana
LLC Project, Series 2010B-1, Gulf
Opportunity Zone Bonds | |
0.20%, 11/1/40 | | | 1,500 | | | | 1,500 | | |
Port Arthur, TX, Navigation District Revenue
Multi-Modal Variable Rate
Demand Revenue Bonds BASF Corp. 1998 | |
0.30%, 4/1/33 | | | 7,600 | | | | 7,600 | | |
RBC Municipal Products Trust, Inc., NA,
Various States Certificates E-141 | |
0.15%, 12/1/23 (b) | | | 4,000 | | | | 4,000 | | |
Various States Certificates E-145 | |
0.15%, 9/8/21 (b) | | | 4,000 | | | | 4,000 | | |
RBC Municipal Products Trust, Inc., MA,
Partners Healthcare System Adjustable
Ser 2019 T-2 Floater Certificates
Ser 2018-E-130 | |
0.15%, 11/1/23 (b) | | | 1,000 | | | | 1,000 | | |
RBC Municipal Products Trust, Inc., MO,
Health and Educational Facilities Authority
of the State of Missouri SSM Health
Ser 2019 A Floater Certificates Ser 2019-C17 | |
0.17%, 12/1/39 (b) | | | 2,000 | | | | 2,000 | | |
| | | Face
Amount
(000) | | Value
(000) | |
RBC Municipal Products Trust, Inc., NY,
New York City Variable Ser 2006
Subser I-5 Floater Certificates Ser 2019-E133 | |
0.15%, 5/1/23 (b) | | $ | 4,000 | | | $ | 4,000 | | |
Tender Option Bond Trust, TX, Harris County
Cultural Education Facilities Financing
Corporation Baylor College of Medicine
Ser B Puttable Floating Rate Receipts
Ser 2019-BAML 5012 | |
0.17%, 11/15/46 (b) | | | 4,255 | | | | 4,255 | | |
Utah Water Finance Agency, Ser 2008 B | |
0.15%, 10/1/37 | | | 2,065 | | | | 2,065 | | |
Washington County, Nebraska Industrial
Development Revenue Bonds (Cargill, Inc.
Recovery Zone Facility Project) Series 2010B | |
0.15%, 12/1/40 | | | 15,000 | | | | 15,000 | | |
Total Weekly Variable Rate Bonds (Cost $91,720) | | | 91,720 | | |
Daily Variable Rate Bonds (a) (21.6%) | |
Bay County, Florida Industrial Development
Revenue Bonds (Gulf Power Company Project),
Series 2020 | |
0.17%, 6/1/50 | | | 15,000 | | | | 15,000 | | |
Harris County Cultural Education Facilities Finance
Corporation Revenue Bonds, TX, Houston
Methodist Series 2020B | |
0.14%, 12/1/59 | | | 4,000 | | | | 4,000 | | |
Indiana Finance Authority, Environmental Refunding
Duke Energy Indiana Inc Ser 2009 A-4 | |
0.13%, 12/1/39 | | | 5,000 | | | | 5,000 | | |
JP Morgan Chase Putters, NA,
Drivers Trust Various States Certificates 5032 | |
0.15%, 12/15/34 (b) | | | 15,000 | | | | 15,000 | | |
Drivers Trust Various States Certificates 5033 | |
0.34%, 2/16/22 (b) | | | 1,000 | | | | 1,000 | | |
Drivers Trust Various States Certificates 5035 | |
0.15%, 2/1/21 (b) | | | 5,000 | | | | 5,000 | | |
Louisville and Jefferson County, KY, Regional
Airport UPS Worldwide | |
0.15%, 1/1/29 | | | 8,000 | | | | 8,000 | | |
The Industrial Development Board of The Town of
Columbia Pollution Control Revenue Refunding
Bonds, AL, Alabama Power Company
Project Series 2014-C | |
0.15%, 12/1/37 | | | 5,000 | | | | 5,000 | | |
West Jefferson, AL, Industrial Development Board
Solid Waste Disposal Revenue Alabama
Power- Miller Plant Ser 2008 (AMT) | |
0.17%, 12/1/38 | | | 10,000 | | | | 10,000 | | |
Total Daily Variable Rate Bonds (Cost $68,000) | | | 68,000 | | |
Closed-End Investment Companies (a) (9.8%) | |
BlackRock MuniYield Investment Fund, Inc. (MYF),
OT, VRDP Ser W-7-594 (AMT) | |
0.22%, 6/1/41 (b) | | | 4,000 | | | | 4,000 | | |
BlackRock MuniYield Quality Fund III, Inc. (MYI),
OT, VRDP (AMT) | |
0.22%, 6/1/41 (b) | | | 2,400 | | | | 2,400 | | |
The accompanying notes are an integral part of the financial statements.
7
Morgan Stanley Institutional Fund Trust
Annual Report — September 30, 2020
Portfolio of Investments (cont'd)
Ultra-Short Municipal Income Portfolio
| | | Face
Amount
(000) | | Value
(000) | |
Closed-End Investment Companies (a) (cont'd) | |
JP Morgan Chase & Co., OT, Variable Rate
Muni Term Preferred- Invesco Value Municipal
Income Trust PUTTERs Ser 5027 (AMT) | |
0.34%, 6/1/21 (b) | | $ | 10,000 | | | $ | 10,000 | | |
Nuveen AMT-Free Municipal Credit Income Fund,
MFP Share Ser B | |
0.68%, 3/1/29 (b) | | | 5,000 | | | | 5,000 | | |
Nuveen New York AMT Free Quality Municipal
Income Fund 800, Ser E (AMT) | |
1.70%, 5/1/47 (b) | | | 5,000 | | | | 5,000 | | |
Nuveen Quality Municipal Income Fund,
Ser 2-2525 (AMT) | |
1.46%, 9/11/26 (b) | | | 2,400 | | | | 2,400 | | |
Western Asset Managed Municipals Fund Inc,
OT, VRDP Ser 1 (AMT) | |
0.20%, 3/4/45 (b) | | | 2,000 | | | | 2,000 | | |
Total Closed-End Investment Companies (Cost $30,800) | | | 30,800 | | |
Floating Rate Notes (a) (12.7%) | |
Colorado Health Facilities Authority Revenue Bonds,
CO, Series 2008C-2 | |
1.36%, 10/1/39 | | | 300 | | | | 300 | | |
Indiana Finance Authority Economic Development
Refunding Revenue Bonds, IN, Republic Services, Inc.
Project Series 2010A (AMT) | |
0.28%, 5/1/34 | | | 9,500 | | | | 9,507 | | |
Metropolitan Water District of Southern California,
Water Ser 2017 E | |
0.37%, 7/1/37 | | | 4,500 | | | | 4,502 | | |
Michigan Finance Authority Hospital Refunding
Bonds McLaren Health Care Ser 2015D-2 | |
0.62%, 10/15/38 | | | 7,500 | | | | 7,501 | | |
Michigan State Finance Authority, Trinity Health
Credit Group Ser 2015 | |
0.64%, 12/1/39 | | | 6,010 | | | | 6,009 | | |
New York City Cultural Resources Trust, NY,
American Museum of Natural History Ser 2014 B1 | |
0.32%, 4/1/44 | | | 5,000 | | | | 5,000 | | |
Public Finance Authority Solid Waste Disposal
Refunding Revenue Bonds, WI, Waste
Management, Inc. Project Series 2017A-2 | |
0.45%, 10/1/25 | | | 7,000 | | | | 7,000 | | |
Total Floating Rate Notes (Cost $39,810) | | | 39,819 | | |
Quarterly Variable Rate Bonds (a) (3.4%) | |
Miami-Dade County, FL, Industrial Development
Authority Solid Waste Management, Inc.
of Florida Ser 2011 (AMT) | |
1.60%, 11/1/41 | | | 4,500 | | | | 4,505 | | |
Pennsylvania Economic Development Financing
Authority, Republic Service, Inc. Ser 2019A (AMT) | |
0.60%, 4/1/34 | | | 1,100 | | | | 1,100 | | |
The Industrial Development Authority of The City of
Phoenix, AZ, Solid Waste Disposal Revenue
Refunding Bonds Series 2013 | |
0.48%, 12/1/35 | | | 5,000 | | | | 5,001 | | |
Total Quarterly Variable Rate Bonds (Cost $10,600) | | | 10,606 | | |
| | | Face
Amount
(000) | | Value
(000) | |
Semi-Annual Variable Rate Bonds (a) (3.6%) | |
RBC Municipal Products Trust, Inc., CO,
City and County of Denver, Airport
System — Subordinate Bonds Floater
Certificates Ser 2019-G114 | |
0.37%, 12/1/26 (b) | | $ | 6,000 | | | $ | 6,000 | | |
RBC Municipal Products Trust, Inc., FL,
Broward County Port Facilities Revenue
Ser B Floater Certificates Ser 2019-G115 | |
0.37%, 9/1/27 (b) | | | 4,000 | | | | 4,000 | | |
RBC Municipal Products Trust, Inc., SC,
Transportation Infrastructure Bank Ser 2017 A,
Floater Certificates Ser 2019-G109 | |
0.32%, 10/1/25 (b) | | | 1,500 | | | | 1,500 | | |
Total Semi-Annual Variable Rate Bond (Cost $11,500) | | | 11,500 | | |
Commercial Paper (c) (14.3%) | |
JEA FLA Electric System Revenue, FL,
Commercial Paper 3/A2 Sub Ser 2000-F-2 | |
0.20%, 10/1/20 | | | 4,000 | | | | 4,000 | | |
0.28%, 10/9/20 | | | 11,000 | | | | 11,000 | | |
Mercer County, ND, Pollution Control
Commercial Paper Notes 3/A2 Ser 1 | |
0.20%, 10/2/20 | | | 3,000 | | | | 3,000 | | |
0.21%, 10/8/20 | | | 12,000 | | | | 12,000 | | |
York County, SC, National Rural Utilities
Cooperative Finance Corporation Pollution
Control Revenue IAM Commercial Paper
3/A2 Ser 2000 | |
0.18%, 10/1/20 | | | 15,000 | | | | 15,000 | | |
Total Commercial Paper (Cost $45,000) | | | 45,000 | | |
Municipal Bonds & Notes (6.2%) | |
Dormitory Authority of The State of New York
State Personal Income Tax Subordinate RANs,
Ser 2020 B | |
5.00%, 3/31/21 | | | 2,900 | | | | 2,970 | | |
Miami-Dade County, FL, Aviation Revenue
Miami International Airport Series 2012 A (AMT) | |
5.00%, 10/1/20 | | | 1,950 | | | | 1,950 | | |
State of Texas Tax And Revenue Anticipation Notes,
Series 2020 (TX) | |
4.00%, 8/26/21 | | | 14,000 | | | | 14,481 | | |
Total Municipal Bonds & Notes (Cost $19,389) | | | 19,401 | | |
Total Investments (100.8%) (Cost $316,819) (d) | | | 316,846 | | |
Liabilities in Excess of Other Assets (–0.8%) | | | (2,648 | ) | |
Net Assets (100.0%) | | $ | 314,198 | | |
(a) Floating or variable rate securities: The rates disclosed are as of September 30, 2020. For securities based on a published reference rate and spread, the reference rate and spread are indicated in the description in the Portfolio of Investments. Certain variable rate securities may not be based on a published reference rate and spread but are determined by the issuer or agent and are based on current market conditions. These securities do not indicate a reference rate and spread in their description in the Portfolio of Investments.
(b) 144A security — Certain conditions for public sale may exist. Unless otherwise noted, these securities are deemed to be liquid.
The accompanying notes are an integral part of the financial statements.
8
Morgan Stanley Institutional Fund Trust
Annual Report — September 30, 2020
Portfolio of Investments (cont'd)
Ultra-Short Municipal Income Portfolio
(c) The rates shown are the effective yields at the date of purchase.
(d) At September 30, 2020, the aggregate cost for federal income tax purposes is approximately $316,819,000. The aggregate gross unrealized appreciation is approximately $28,000 and the aggregate gross unrealized depreciation is approximately $1,000, resulting in net unrealized appreciation of approximately $27,000.
AMT Alternative Minimum Tax.
PUTTERs Puttable Tax-Exempt Receipts.
RANs Revenue Anticipation Notes.
VRDP Variable Rate Demand Preferred.
Portfolio Composition
Classification | | Percentage of
Total Investments | |
Weekly Variable Rate Bonds | | | 28.9 | % | |
Daily Variable Rate Bonds | | | 21.5 | | |
Commercial Paper | | | 14.2 | | |
Floating Rate Notes | | | 12.6 | | |
Closed-End Investment Companies | | | 9.7 | | |
Other* | | | 7.0 | | |
Municipal Bonds & Notes | | | 6.1 | | |
Total Investments | | | 100.0 | % | |
* Industries and/or investment types representing less than 5% of total investments.
The accompanying notes are an integral part of the financial statements.
9
Morgan Stanley Institutional Fund Trust
Annual Report — September 30, 2020
Ultra-Short Municipal Income Portfolio
Statement of Assets and Liabilities | | September 30, 2020
(000) | |
Assets: | |
Investments in Securities of Unaffiliated Issuers, at Value (Cost $316,819) | | $ | 316,846 | | |
Cash | | | 120 | | |
Receivable for Fund Shares Sold | | | 645 | | |
Interest Receivable | | | 243 | | |
Due from Adviser | | | 85 | | |
Receivable for Investments Sold | | | 80 | | |
Other Assets | | | 47 | | |
Total Assets | | | 318,066 | | |
Liabilities: | |
Payable for Fund Shares Redeemed | | | 3,760 | | |
Payable for Professional Fees | | | 45 | | |
Payable for Shareholder Services Fees — Institutional Class | | | 1 | | |
Payable for Shareholder Services Fees — Class A | | | 24 | | |
Payable for Administration Fees | | | 21 | | |
Payable for Custodian Fees | | | 3 | | |
Payable for Transfer Agency Fees — Class IR | | | — | @ | |
Payable for Transfer Agency Fees — Institutional Class | | | 1 | | |
Payable for Transfer Agency Fees — Class A | | | 1 | | |
Other Liabilities | | | 12 | | |
Total Liabilities | | | 3,868 | | |
Net Assets | | $ | 314,198 | | |
Net Assets Consist of: | |
Paid-in-Capital | | $ | 314,130 | | |
Total Distributable Earnings | | | 68 | | |
Net Assets | | $ | 314,198 | | |
CLASS IR: | |
Net Assets | | $ | 118,335 | | |
| Shares Outstanding (unlimited number of shares authorized, no par value) (not in 000's) | | | 11,831,207 | | |
Net Asset Value, Offering and Redemption Price Per Share | | $ | 10.00 | | |
INSTITUTIONAL CLASS: | |
Net Assets | | $ | 9,997 | | |
| Shares Outstanding (unlimited number of shares authorized, no par value) (not in 000's) | | | 998,192 | | |
Net Asset Value, Offering and Redemption Price Per Share | | $ | 10.02 | | |
CLASS A: | |
Net Assets | | $ | 185,866 | | |
| Shares Outstanding (unlimited number of shares authorized, no par value) (not in 000's) | | | 18,580,220 | | |
Net Asset Value, Offering and Redemption Price Per Share | | $ | 10.00 | | |
@ Amount is less than $500.
The accompanying notes are an integral part of the financial statements.
10
Morgan Stanley Institutional Fund Trust
Annual Report — September 30, 2020
Ultra-Short Municipal Income Portfolio
Statement of Operations | | Year Ended
September 30, 2020
(000) | |
Investment Income: | |
Interest from Securities of Unaffiliated Issuers | | $ | 3,002 | | |
Expenses: | |
Advisory Fees (Note B) | | | 600 | | |
Shareholder Services Fees — Institutional Class (Note D) | | | 31 | | |
Shareholder Services Fees — Class A (Note D) | | | 379 | | |
Administration Fees (Note C) | | | 240 | | |
Professional Fees | | | 135 | | |
Registration Fees | | | 108 | | |
Offering Costs | | | 37 | | |
Custodian Fees (Note F) | | | 13 | | |
Shareholder Reporting Fees | | | 12 | | |
Trustees' Fees and Expenses | | | 7 | | |
Pricing Fees | | | 7 | | |
Transfer Agency Fees — Class IR (Note E) | | | 2 | | |
Transfer Agency Fees — Institutional Class (Note E) | | | 2 | | |
Transfer Agency Fees — Class A (Note E) | | | 2 | | |
Other Expenses | | | 19 | | |
Total Expenses | | | 1,594 | | |
Waiver of Advisory Fees (Note B) | | | (600 | ) | |
Expenses Reimbursed by Adviser (Note B) | | | (188 | ) | |
Reimbursement of Class Specific Expenses — Class IR (Note B) | | | (2 | ) | |
Reimbursement of Class Specific Expenses — Institutional Class (Note B) | | | (2 | ) | |
Waiver of Shareholder Servicing Fees — Class A (Note D) | | | (28 | ) | |
Net Expenses | | | 774 | | |
Net Investment Income | | | 2,228 | | |
Realized Gain: | |
Investments Sold | | | — | @ | |
Change in Unrealized Appreciation (Depreciation): | |
Investments | | | 26 | | |
Net Realized Gain and Change in Unrealized Appreciation (Depreciation) | | | 26 | | |
Net Increase in Net Assets Resulting from Operations | | $ | 2,254 | | |
@ Amount is less than $500.
The accompanying notes are an integral part of the financial statements.
11
Morgan Stanley Institutional Fund Trust
Annual Report — September 30, 2020
Ultra-Short Municipal Income Portfolio
Statements of Changes in Net Assets | | Year Ended
September 30, 2020
(000) | | Period from
December 19, 2018^ to
September 30, 2019
(000) | |
Increase (Decrease) in Net Assets: | |
Operations: | |
Net Investment Income | | $ | 2,228 | | | $ | 1,474 | | |
Net Realized Gain (Loss) | | | — | @ | | | (— | @) | |
Net Change in Unrealized Appreciation (Depreciation) | | | 26 | | | | 1 | | |
Net Increase in Net Assets Resulting from Operations | | | 2,254 | | | | 1,475 | | |
Dividends and Distributions to Shareholders: | |
Class IR | | | (623 | ) | | | (483 | ) | |
Institutional Class | | | (317 | ) | | | (276 | ) | |
Class A | | | (1,288 | ) | | | (715 | ) | |
Total Dividends and Distributions to Shareholders | | | (2,228 | ) | | | (1,474 | ) | |
Capital Share Transactions:(1) | |
Class IR: | |
Subscribed | | | 157,978 | | | | 96,053 | | |
Distributions Reinvested | | | 622 | | | | 440 | | |
Redeemed | | | (107,472 | ) | | | (29,320 | ) | |
Institutional Class: | |
Subscribed | | | 37,600 | | | | 40,000 | | |
Distributions Reinvested | | | 316 | | | | 235 | | |
Redeemed | | | (68,136 | ) | | | — | | |
Class A: | |
Subscribed | | | 299,894 | | | | 154,961 | | |
Distributions Reinvested | | | 1,286 | | | | 664 | | |
Redeemed | | | (248,222 | ) | | | (22,728 | ) | |
Net Increase in Net Assets Resulting from Capital Share Transactions | | | 73,866 | | | | 240,305 | | |
Total Increase in Net Assets | | | 73,892 | | | | 240,306 | | |
Net Assets: | |
Beginning of Period | | | 240,306 | | | | — | | |
End of Period | | $ | 314,198 | | | $ | 240,306 | | |
(1) Capital Share Transactions: | |
Class IR: | |
Shares Subscribed | | | 15,800 | | | | 9,605 | | |
Shares Issued on Distributions Reinvested | | | 62 | | | | 44 | | |
Shares Redeemed | | | (10,748 | ) | | | (2,932 | ) | |
Net Increase in Class IR Shares Outstanding | | | 5,114 | | | | 6,717 | | |
Institutional Class: | |
Shares Subscribed | | | 3,756 | | | | 4,000 | | |
Shares Issued on Distributions Reinvested | | | 32 | | | | 24 | | |
Shares Redeemed | | | (6,813 | ) | | | — | | |
Net Increase (Decrease) in Institutional Class Shares Outstanding | | | (3,025 | ) | | | 4,024 | | |
Class A: | |
Shares Subscribed | | | 29,992 | | | | 15,497 | | |
Shares Issued on Distributions Reinvested | | | 129 | | | | 66 | | |
Shares Redeemed | | | (24,830 | ) | | | (2,273 | ) | |
Net Increase in Class A Shares Outstanding | | | 5,291 | | | | 13,290 | | |
^ Commencement of Operations.
@ Amount is less than $500.
The accompanying notes are an integral part of the financial statements.
12
Morgan Stanley Institutional Fund Trust
Annual Report — September 30, 2020
Financial Highlights
Ultra-Short Municipal Income Portfolio
| | | Class IR | |
Selected Per Share Data and Ratios | | Year Ended
September 30, 2020 | | Period from
December 19, 2018(1) to
September 30, 2019 | |
Net Asset Value, Beginning of Period | | $ | 10.00 | | | $ | 10.00 | | |
Income from Investment Operations: | |
Net Investment Income(2) | | | 0.09 | | | | 0.12 | | |
Net Realized and Unrealized Gain | | | 0.00 | (3) | | | 0.00 | (3) | |
Total from Investment Operations | | | 0.09 | | | | 0.12 | | |
Distributions from and/or in Excess of: | |
Net Investment Income | | | (0.09 | ) | | | (0.12 | ) | |
Net Asset Value, End of Period | | $ | 10.00 | | | $ | 10.00 | | |
Total Return(4) | | | 0.91 | % | | | 1.19 | %(5) | |
Ratios to Average Net Assets and Supplemental Data: | |
Net Assets, End of Period (Thousands) | | $ | 118,335 | | | $ | 67,174 | | |
Ratio of Expenses Before Expense Limitation | | | 0.40 | % | | | 0.52 | %(6) | |
Ratio of Expenses After Expense Limitation | | | 0.13 | % | | | 0.13 | %(6) | |
Ratio of Net Investment Income | | | 0.78 | % | | | 1.49 | %(6) | |
Portfolio Turnover Rate | | | N/A(7) | | | | N/A(7) | | |
(1) Commencement of Operations.
(2) Per share amount is based on average shares outstanding.
(3) Amount is less than $0.005 per share.
(4) Calculated based on the net asset value as of the last business day of the period.
(5) Not annualized.
(6) Annualized.
(7) During the reporting period, the Fund did not hold any long-term investments and accordingly portfolio turnover is not applicable.
The accompanying notes are an integral part of the financial statements.
13
Morgan Stanley Institutional Fund Trust
Annual Report — September 30, 2020
Financial Highlights
Ultra-Short Municipal Income Portfolio
| | | Institutional Class | |
Selected Per Share Data and Ratios | | Year Ended
September 30, 2020 | | Period from
December 19, 2018(1) to
September 30, 2019 | |
Net Asset Value, Beginning of Period | | $ | 10.00 | | | $ | 10.00 | | |
Income from Investment Operations: | |
Net Investment Income(2) | | | 0.10 | | | | 0.11 | | |
Net Realized and Unrealized Gain | | | 0.00 | (3) | | | 0.00 | (3) | |
Total from Investment Operations | | | 0.10 | | | | 0.11 | | |
Distributions from and/or in Excess of: | |
Net Investment Income | | | (0.08 | ) | | | (0.11 | ) | |
Net Asset Value, End of Period | | $ | 10.02 | | | $ | 10.00 | | |
Total Return(4) | | | 1.01 | % | | | 1.11 | %(5) | |
Ratios to Average Net Assets and Supplemental Data: | |
Net Assets, End of Period (Thousands) | | $ | 9,997 | | | $ | 40,250 | | |
Ratio of Expenses Before Expense Limitation | | | 0.49 | % | | | 0.62 | %(6) | |
Ratio of Expenses After Expense Limitation | | | 0.23 | % | | | 0.23 | %(6) | |
Ratio of Net Investment Income | | | 1.03 | % | | | 1.39 | %(6) | |
Portfolio Turnover Rate | | | N/A(7) | | | | N/A(7) | | |
(1) Commencement of Operations.
(2) Per share amount is based on average shares outstanding.
(3) Amount is less than $0.005 per share.
(4) Calculated based on the net asset value as of the last business day of the period.
(5) Not annualized.
(6) Annualized.
(7) During the reporting period, the Fund did not hold any long-term investments and accordingly portfolio turnover is not applicable.
The accompanying notes are an integral part of the financial statements.
14
Morgan Stanley Institutional Fund Trust
Annual Report — September 30, 2020
Financial Highlights
Ultra-Short Municipal Income Portfolio
| | | Class A | |
Selected Per Share Data and Ratios | | Year Ended
September 30, 2020 | | Period from
December 19, 2018(1) to
September 30, 2019 | |
Net Asset Value, Beginning of Period | | $ | 10.00 | | | $ | 10.00 | | |
Income from Investment Operations: | |
Net Investment Income(2) | | | 0.07 | | | | 0.10 | | |
Net Realized and Unrealized Gain | | | 0.00 | (3) | | | 0.00 | (3) | |
Total from Investment Operations | | | 0.07 | | | | 0.10 | | |
Distributions from and/or in Excess of: | |
Net Investment Income | | | (0.07 | ) | | | (0.10 | ) | |
Net Asset Value, End of Period | | $ | 10.00 | | | $ | 10.00 | | |
Total Return(4) | | | 0.73 | % | | | 1.04 | %(5) | |
Ratios to Average Net Assets and Supplemental Data: | |
Net Assets, End of Period (Thousands) | | $ | 185,866 | | | $ | 132,882 | | |
Ratio of Expenses Before Expense Limitation | | | 0.59 | % | | | 0.72 | %(6) | |
Ratio of Expenses After Expense Limitation | | | 0.32 | % | | | 0.33 | %(6) | |
Ratio of Net Investment Income | | | 0.68 | % | | | 1.30 | %(6) | |
Portfolio Turnover Rate | | | N/A(7) | | | | N/A(7) | | |
(1) Commencement of Operations.
(2) Per share amount is based on average shares outstanding.
(3) Amount is less than $0.005 per share.
(4) Calculated based on the net asset value as of the last business day of the period.
(5) Not annualized.
(6) Annualized.
(7) During the reporting period, the Fund did not hold any long-term investments and accordingly portfolio turnover is not applicable.
The accompanying notes are an integral part of the financial statements.
15
Morgan Stanley Institutional Fund Trust
Annual Report — September 30, 2020
Notes to Financial Statements
Morgan Stanley Institutional Fund Trust ("Trust") is registered under the Investment Company Act of 1940, as amended (the "Act"), as an open-end management investment company. The Trust is comprised of twelve separate, active funds (individually referred to as a "Fund," collectively as the "Funds"). The Trust applies investment company accounting and reporting guidance. All Funds are considered diversified for purposes of the Act.
The accompanying financial statements relate to the Ultra-Short Municipal Income Portfolio. The Fund seeks current income exempt from federal income tax and capital preservation while maintaining liquidity. The Fund offers three classes of shares — Class IR, Institutional Class and Class A.
A. Significant Accounting Policies: The following significant accounting policies are in conformity with U.S. generally accepted accounting principles ("GAAP"). Such policies are consistently followed by the Trust in the preparation of its financial statements. GAAP may require management to make estimates and assumptions that affect the reported amounts and disclosures in the financial statements. Actual results may differ from those estimates.
In March 2017, the Financial Accounting Standards Board ("FASB") issued an Accounting Standard Update, ASU 2017-08, Receivables-Nonrefundable Fees and Other Costs (Subtopic 310-20), Premium Amortization on Purchased Callable Debt Securities (the "ASU") which amends the amortization period for certain purchased callable debt securities held at a premium, shortening such period to the earliest call date. The ASU does not require any accounting change for debt securities held at a discount; the discount continues to be amortized to maturity. The ASU is effective for fiscal years, and interim periods within those fiscal years, beginning after December 15, 2018. The Fund has adopted the ASU as of September 30, 2020 and it did not have an impact on the Fund's financial statements.
1. Security Valuation: (1) Certain portfolio securities may be valued by an outside pricing service/vendor approved by the Trust's Board of Trustees (the "Trustees"). The pricing service/vendor may employ a pricing model that takes into account, among other things, bids, yield spreads and/or other market data and specific security characteristics. Alternatively, if a valuation is not available from an outside pricing service/vendor, and the security trades on an exchange, the security may be valued at its latest reported sale price (or at the exchange official closing price if
such exchange reports an official closing price), prior to the time when assets are valued. If there are no sales on a given day and if there is no official exchange closing price for that day, the security is valued at the mean between the last reported bid and asked prices if such bid and asked prices are available in the relevant exchanges. If only bid prices are available then the latest bid price may be used. If Morgan Stanley Investment Management Inc. (the "Adviser"), a wholly-owned subsidiary of Morgan Stanley, determines that the price provided by the outside pricing service/vendor or exchange does not reflect the security's fair value or is unable to provide a price, prices from brokers or dealers may also be utilized. In these circumstances, the value of the security will be the mean of bid and asked prices obtained from brokers or dealers; and (2) when market quotations are not readily available, including circumstances under which the Adviser determines that the closing price, last sale price or the mean between the last reported bid and asked prices are not reflective of a security's market value, portfolio securities are valued at their fair value as determined in good faith under procedures established by and under the general supervision of the Trustees. Occasionally, developments affecting the closing prices of securities and other assets may occur between the times at which valuations of such securities are determined (that is, close of the foreign market on which the securities trade) and the close of business of the New York Stock Exchange ("NYSE"). If developments occur during such periods that are expected to materially affect the value of such securities, such valuations may be adjusted to reflect the estimated fair value of such securities as of the close of the NYSE, as determined in good faith by the Trustees or by the Adviser using a pricing service and/or procedures approved by the Trustees.
The Trustees have responsibility for determining in good faith the fair value of the investments, and the Trustees may appoint others, such as the Trust's Adviser or a valuation committee, to assist the Trustees in determining fair value and to make the actual calculations pursuant to the fair valuation methodologies previously approved by the Trustees. Under procedures approved by the Trustees, the Trust's Adviser has formed a Valuation Committee whose members are approved by the Trustees. The Valuation Committee provides administration and oversight of the Trust's valuation policies and procedures, which are reviewed at least annually by the Trustees. These procedures allow the
16
Morgan Stanley Institutional Fund Trust
Annual Report — September 30, 2020
Notes to Financial Statements (cont'd)
Trust to utilize independent pricing services, quotations from securities and financial instrument dealers and other market sources to determine fair value.
2. Fair Value Measurement: FASB Accounting Standards CodificationTM ("ASC") 820, "Fair Value Measurement" ("ASC 820"), defines fair value as the value that the Fund would receive to sell an investment or pay to transfer a liability in a timely transaction with an independent buyer in the principal market, or in the absence of a principal market, the most advantageous market for the investment or liability. ASC 820 establishes a three-tier hierarchy to distinguish between (1) inputs that reflect the assumptions market participants would use in valuing an asset or liability developed based on market data obtained from sources independent of the reporting entity (observable inputs) and (2) inputs that reflect the reporting entity's own assumptions about the assumptions market participants would use in valuing an asset or liability developed based on the best information available in the circumstances (unobservable inputs) and to establish classification of fair value measurements for disclosure purposes. Various inputs are used in determining the value of the Fund's investments. The inputs are summarized in the three broad levels listed below:
• Level 1 – unadjusted quoted prices in active markets for identical investments
• Level 2 – other significant observable inputs (including quoted prices for similar investments, interest rates, prepayment speeds, credit risk, etc.)
• Level 3 – significant unobservable inputs including the Fund's own assumptions in determining the fair value of investments. Factors considered in making this determination may include, but are not limited to, information obtained by contacting the issuer, analysts, or the appropriate stock exchange (for exchange-traded securities), analysis of the issuer's financial statements or other available documents and, if necessary, available information concerning other securities in similar circumstances.
The inputs or methodology used for valuing securities are not necessarily an indication of the risk associated with investing in those securities and the determination
of the significance of a particular input to the fair value measurement in its entirety requires judgment and considers factors specific to each security.
The following is a summary of the inputs used to value the Fund's investments as of September 30, 2020:
Investment Type | | Level 1
Unadjusted
quoted
prices
(000) | | Level 2
Other
significant
observable
inputs
(000) | | Level 3
Significant
unobservable
inputs
(000) | | Total
(000) | |
Assets: | |
Short-Term Investments | |
Weekly Variable Rate
Bonds | | $ | — | | | $ | 91,720 | | | $ | — | | | $ | 91,720 | | |
Daily Variable Rate Bonds | | | — | | | | 68,000 | | | | — | | | | 68,000 | | |
Closed-End Investment
Companies | | | — | | | | 30,800 | | | | — | | | | 30,800 | | |
Floating Rate Notes | | | — | | | | 39,819 | | | | — | | | | 39,819 | | |
Quarterly Variable Rate
Bonds | | | — | | | | 10,606 | | | | — | | | | 10,606 | | |
Semi-Annual Variable Rate
Bonds | | | — | | | | 11,500 | | | | — | | | | 11,500 | | |
Commercial Paper | | | — | | | | 45,000 | | | | — | | | | 45,000 | | |
Municipal Bonds & Notes | | | — | | | | 19,401 | | | | — | | | | 19,401 | | |
Total Short-Term
Investments | | | — | | | | 316,846 | | | | — | | | | 316,846 | | |
Total Assets | | $ | — | | | $ | 316,846 | | | $ | — | | | $ | 316,846 | | |
Transfers between investment levels may occur as the markets fluctuate and/or the availability of data used in an investment's valuation changes.
3. Indemnifications: The Trust enters into contracts that contain a variety of indemnifications. The Trust's maximum exposure under these arrangements is unknown. However, the Trust has not had prior claims or losses pursuant to these contracts and expects the risk of loss to be remote.
4. Dividends and Distributions to Shareholders: Dividends and distributions to shareholders are recorded on the close of each business day. Dividends from net investment income are declared daily and paid monthly. Net realized capital gains, if any, are distributed at least annually.
5. Security Transactions, Income and Expenses: Security transactions are accounted for on the trade date (date the order to buy or sell is executed). Realized gains and losses on the sale of investment securities are determined on the specific identified cost method. Dividend income and other distributions are recorded on the ex-dividend date (except for certain foreign dividends which may be recorded as soon as the Fund is informed of such
17
Morgan Stanley Institutional Fund Trust
Annual Report — September 30, 2020
Notes to Financial Statements (cont'd)
dividends) net of applicable withholding taxes. Interest income is recognized on the accrual basis except where collection is in doubt. Discounts are accreted and premiums are amortized over the life of the respective securities. Most expenses of the Trust can be directly attributed to a particular Fund. Expenses which cannot be directly attributed are apportioned among the Funds based upon relative net assets or other appropriate methods. Income, expenses (other than class specific expenses — distribution and shareholder services and transfer agency fees) and realized and unrealized gains or losses are allocated to each class of shares based upon their relative net assets.
B. Advisory Fees: The Adviser, a wholly-owned subsidiary of Morgan Stanley, provides the Fund with advisory services under the terms of an Investment Advisory Agreement, paid quarterly, at an annual rate of 0.20% of the average daily net assets of the Fund.
The Adviser has agreed to reduce its advisory fee and/or reimburse the Fund so that total annual Fund operating expenses, excluding certain investment related expenses, taxes, interest and other extraordinary expenses (including litigation), will not exceed 0.25% for Class IR shares, 0.35% for Institutional Class shares and 0.45% for Class A shares. Effective July 1, 2020, the Adviser has agreed to reduce its advisory fee and/or reimburse the Fund so that total annual Fund operating expenses will not exceed 0.40% for Class A shares. The fee waivers and/or expense reimbursements will continue for at least one year from the date of the Fund's prospectus or until such time as the Trustees act to discontinue all or a portion of such waivers and/or reimbursements when they deem such action is appropriate. In addition, the Adviser may make additional voluntary fee waivers and/or expense reimbursements. The ratios of expenses to average net assets disclosed in the Fund's Financial Highlights may be lower than the maximum expense ratios due to these additional fee waivers and/or expense reimbursements. The Adviser may also waive additional advisory fees and/or reimburse expenses to enable the Fund to maintain a minimum level of daily net investment income. For the year ended September 30, 2020, approximately $600,000 of advisory fees were waived and approximately $192,000 of other expenses were reimbursed by the Adviser pursuant to this arrangement.
C. Administration Fees: The Adviser also serves as Administrator to the Trust and provides administrative services pursuant to an Administration Agreement for an annual fee, accrued daily and paid monthly, of 0.08% of the Fund's average daily net assets. Under a Sub-Administration Agreement
between the Administrator and State Street Bank and Trust Company ("State Street"), State Street provides certain administrative services to the Trust. For such services, the Administrator pays State Street a portion of the fee the Administrator receives from the Fund.
D. Shareholder Services Fees: Morgan Stanley Distribution, Inc. ("MSDI" or the "Distributor"), a wholly-owned subsidiary of the Adviser, and an indirect subsidiary of Morgan Stanley, serves as the Trust's Distributor of Fund shares pursuant to a Distribution Agreement. The Trust has adopted a Shareholder Services Plan with respect to the Institutional Class shares pursuant to Rule 12b-1 under the Act. Under the Shareholder Services Plan, the Fund pays the Distributor a shareholder services fee, accrued daily and paid monthly, at an annual rate of 0.10% of the Fund's average daily net assets attributable to the Institutional Class shares.
The Trust has adopted a Shareholder Services Plan with respect to the Class A shares pursuant to Rule 12b-1 under the Act. Under the Shareholder Services Plan, the Fund pays the Distributor a shareholder services fee, accrued daily and paid monthly, at an annual rate of 0.20% of the Fund's average daily net assets attributable to the Class A shares. The Distributor has agreed to waive the 12b-1 fee on Class A shares of the Fund to the extent it exceeds 0.15% of the average daily net assets of such shares on an annualized basis. This waiver will continue for at least one year or until such time as the Trustees act to discontinue all or a portion of such waiver when it deems such action is appropriate. For the year ended September 30, 2020, this waiver amounted to approximately $25,000.
The Distributor has agreed to reduce its distribution fees to enable the Fund to maintain a minimum level of daily net investment income. For the year ended September 30, 2020, this waiver amounted to approximately $3,000.
The shareholder services fees are used to support the expenses associated with servicing and maintaining accounts. The Distributor may compensate other parties for providing shareholder support services to investors who purchase Institutional Class and Class A shares.
E. Dividend Disbursing and Transfer/Co-Transfer Agent: The Trust's dividend disbursing and transfer agent is DST Asset Manager Solutions, Inc. ("DST"). Pursuant to a Transfer Agency Agreement, the Trust pays DST a fee based on the number of classes, accounts and transactions relating to the Funds of the Trust.
18
Morgan Stanley Institutional Fund Trust
Annual Report — September 30, 2020
Notes to Financial Statements (cont'd)
Morgan Stanley Services Company Inc. serves as Co-Transfer Agent and provides certain transfer agency services to the Fund with respect to certain direct transactions with the Fund.
F. Custodian Fees: State Street (the "Custodian") also serves as Custodian for the Trust in accordance with a Custodian Agreement. The Custodian holds cash, securities and other assets of the Trust as required by the Act. Custody fees are payable monthly based on assets held in custody, investment purchases and sales activity and account maintenance fees, plus reimbursement for certain out-of-pocket expenses.
G. Security Transactions and Transactions with Affiliates: The Fund is permitted to purchase and sell securities ("cross-trade") from and to other Morgan Stanley funds as well as other funds and client accounts for which the Adviser or an affiliate of the Adviser serves as investment adviser, pursuant to procedures approved by the Trustees in compliance with Rule 17a-7 under the Act (the "Rule"). Each cross-trade is executed at the current market price in compliance with provisions of the Rule. For the year ended September 30, 2020, the Fund engaged in cross-trade purchases of approximately $18,750,000 and sales of approximately $16,300,000 which resulted in no net realized gains or losses.
The Fund has an unfunded Deferred Compensation Plan (the "Compensation Plan"), which allows each independent Trustee to defer payment of all, or a portion, of the fees he or she receives for serving on the Board of Trustees. Each eligible Trustee generally may elect to have the deferred amounts credited with a return equal to the total return on one or more of the Morgan Stanley funds that are offered as investment options under the Compensation Plan. Appreciation/depreciation and distributions received from these investments are recorded with an offsetting increase/decrease in the deferred compensation obligation and do not affect the NAV of the Fund.
H. Federal Income Taxes: It is the Fund's intention to continue to qualify as a regulated investment company and distribute all of its taxable and tax-exempt income. Accordingly, no provision for federal income taxes is required in the financial statements.
The Fund may be subject to taxes imposed by countries in which it invests. Such taxes are generally based on income and/or capital gains earned or repatriated. Taxes are accrued based on net investment income, net realized gains and net unrealized appreciation as such income and/or gains are earned.
Taxes may also be based on transactions in foreign currency and are accrued based on the value of investments denominated in such currency.
FASB ASC 740-10, "Income Taxes — Overall", sets forth a minimum threshold for financial statement recognition of the benefit of a tax position taken or expected to be taken in a tax return. Management has concluded there are no significant uncertain tax positions that would require recognition in the financial statements. If applicable, the Fund recognizes interest accrued related to unrecognized tax benefits in "Interest Expense" and penalties in "Other Expenses" in the Statement of Operations. The Fund files tax returns with the U.S. Internal Revenue Service, New York and various states. Each of the tax years in the two-year period ended September 30, 2020, remains subject to examination by taxing authorities.
The tax character of distributions paid may differ from the character of distributions shown for GAAP purposes due to short-term capital gains being treated as ordinary income for tax purposes. The tax character of distributions paid during fiscal years 2020 and 2019 was as follows:
2020 Distributions
Paid From:
Tax-Exempt Income
(000) | | 2019 Distributions
Paid From:
Tax-Exempt Income
(000) | |
| $ | 2,228 | | | $ | 1,474 | | |
The amount and character of income and gains to be distributed are determined in accordance with income tax regulations which may differ from GAAP. These book/tax differences are either considered temporary or permanent in nature.
Temporary differences are attributable to differing book and tax treatments for the timing of the recognition of gains (losses) on certain investment transactions and the timing of the deductibility of certain expenses.
The Fund had no permanent differences causing reclassifications among the components of net assets for the year ended September 30, 2020.
At September 30, 2020, the components of distributable earnings for the Fund on a tax basis were as follows:
Undistributed
Tax-Exempt
Income
(000) | | Undistributed
Long-Term
Capital Gain
(000) | |
| $ | 189 | | | $ | — | | |
19
Morgan Stanley Institutional Fund Trust
Annual Report — September 30, 2020
Notes to Financial Statements (cont'd)
At September 30, 2020, the Fund had available for federal income tax purposes unused short-term capital losses of approximately $1,000 that do not have an expiration date.
To the extent that capital loss carryforwards are used to offset any future capital gains realized, no capital gains tax liability will be incurred by the Fund for gains realized and not distributed. To the extent that capital gains are offset, such gains will not be distributed to the shareholders.
I. Credit Facility: The Trust and other Morgan Stanley funds participated in a $300,000,000 committed, unsecured revolving line of credit facility (the "Facility") with State Street. This Facility is to be used for temporary emergency purposes or funding of shareholder redemption requests. The interest rate on borrowings is based on the federal funds rate or 1 month LIBOR rate plus a spread. The Facility also has a commitment fee of 0.25% per annum based on the unused portion of the Facility. During the year ended September 30, 2020, the Fund did not have any borrowings under the Facility.
J. Other: At September 30, 2020, the Fund had record owners of 10% or greater. Investment activities of these shareholders could have a material impact on the Fund. The aggregate percentage of such owners was 92.8%.
K. Market Risk: Certain impacts to public health conditions particular to the coronavirus (COVID-19) outbreak could impact the operations and financial performance of certain of the Fund's investments. The extent of the impact to the financial performance of the Fund's investments will depend on future developments, including (i) the duration and spread of the outbreak, (ii) the restrictions and advisories, (iii) the effects on the financial markets, and (iv) the effects on the economy overall, all of which are highly uncertain and cannot be predicted. If the financial performance of the Fund's investments is impacted because of these factors for an extended period, the Fund's investment results may be adversely affected.
20
Morgan Stanley Institutional Fund Trust
Annual Report — September 30, 2020
Report of Independent Registered Public Accounting Firm
To the Shareholders and Board of Trustees of
Morgan Stanley Institutional Fund Trust —
Ultra-Short Municipal Income Portfolio
Opinion on the Financial Statements
We have audited the accompanying statement of assets and liabilities of Ultra-Short Municipal Income Portfolio (the "Fund") (one of the funds constituting Morgan Stanley Institutional Fund Trust (the "Trust")), including the portfolio of investments, as of September 30, 2020, and the related statement of operations for the year then ended and the statements of changes in net assets and the financial highlights for the year then ended and the period from December 19, 2018 (commencement of operations) through September 30, 2019 and the related notes (collectively referred to as the "financial statements"). In our opinion, the financial statements present fairly, in all material respects, the financial position of Ultra-Short Municipal Income Portfolio (one of the funds constituting Morgan Stanley Institutional Fund Trust) at September 30, 2020, the results of its operations for the year then ended and the changes in its net assets and its financial highlights for the year then ended and the period from December 19, 2018 (commencement of operations) through September 30, 2019, in conformity with U.S. generally accepted accounting principles.
Basis for Opinion
These financial statements are the responsibility of the Trust's management. Our responsibility is to express an opinion on the Fund's financial statements based on our audits. We are a public accounting firm registered with the Public Company Accounting Oversight Board (United States) ("PCAOB") and are required to be independent with respect to the Trust in accordance with the U.S. federal securities law and the applicable rules and regulations of the Securities and Exchange Commission and the PCAOB.
We conducted our audits in accordance with the standards of the PCAOB. Those standards require that we plan and perform the audit to obtain reasonable assurance about whether the financial statements are free of material misstatement, whether due to error or fraud. The Trust is not required to have, nor were we engaged to perform, an audit of the Trust's internal control over financial reporting. As part of our audits, we are required to obtain an understanding of internal control over financial reporting, but not for the purpose of expressing an opinion on the effectiveness of the Trust's internal control over financial reporting. Accordingly, we express no such opinion.
Our audits included performing procedures to assess the risks of material misstatement of the financial statements, whether due to error or fraud, and performing procedures that respond to those risks. Such procedures included examining, on a test basis, evidence regarding the amounts and disclosures in the financial statements. Our procedures included confirmation of securities owned as of September 30, 2020 by correspondence with the custodian and brokers or by other appropriate auditing procedures where replies from brokers were not received. Our audits also included evaluating the accounting principles used and significant estimates made by management, as well as evaluating the overall presentation of the financial statements. We believe that our audits provide a reasonable basis for our opinion.

We have served as the auditor of one or more Morgan Stanley investment companies since 2000.
Boston, Massachusetts
November 24, 2020
21
Morgan Stanley Institutional Fund Trust
Annual Report — September 30, 2020
Investment Advisory Agreement Approval (unaudited)
Nature, Extent and Quality of Services
The Board reviewed and considered the nature and extent of the investment advisory services provided by the Adviser under the advisory agreement, including portfolio management, investment research and equity and fixed income securities trading. The Board also reviewed and considered the nature and extent of the non-advisory, administrative services provided by the Administrator under the administration agreement, including accounting, operations, clerical, bookkeeping, compliance, business management and planning, legal services and the provision of supplies, office space and utilities at the Adviser's expense. The Board also considered the Adviser's investment in personnel and infrastructure that benefits the Fund. (The Adviser and Administrator together are referred to as the "Adviser" and the advisory and administration agreements together are referred to as the "Management Agreement.") The Board also considered that the Adviser serves a variety of other investment advisory clients and has experience overseeing service providers. The Board also compared the nature of the services provided by the Adviser with similar services provided by non-affiliated advisers as prepared by Broadridge Financial Solutions, Inc. ("Broadridge").
The Board reviewed and considered the qualifications of the portfolio managers, the senior administrative managers and other key personnel of the Adviser who provide the advisory and administrative services to the Fund. The Board determined that the Adviser's portfolio managers and key personnel are well qualified by education and/or training and experience to perform the services in an efficient and professional manner. The Board concluded that the nature and extent of the advisory and administrative services provided were necessary and appropriate for the conduct of the business and investment activities of the Fund and supported its decision to approve the Management Agreement.
Performance, Fees and Expenses of the Fund
The Board reviewed the performance, fees and expenses of the Fund compared to its peers, as prepared by Broadridge, and to appropriate benchmarks where applicable. The Board discussed with the Adviser the performance goals and the actual results achieved in managing the Fund. When considering a fund's performance, the Board and the Adviser place emphasis on trends and longer-term returns (focusing on one-year, three-year and five-year performance, as of December 31, 2019, or since inception, as applicable). When a fund underperforms its benchmark and/or its peer group average, the Board and the Adviser discuss the causes of such underperformance and, where necessary, they discuss specific changes to investment strategy or investment personnel. The Board noted that the Fund's performance was below its peer group average for one-year period and the period since the middle of December 2018, the month of the Fund's inception. The Board discussed with the Adviser the level of the advisory and administration fees (together, the "management fee") for this Fund relative to comparable funds and/or other accounts advised by the Adviser and/or compared to its peers as prepared by Broadridge. In addition to the management fee, the Board also reviewed the Fund's total expense ratio. The Board noted that the Fund's management fee and total expense ratio were lower than its peer group averages. After discussion, the Board concluded that the Fund's (i) performance was acceptable and (ii) management fee and total expense ratio were competitive with its peer group averages.
Economies of Scale
The Board considered the size and growth prospects of the Fund and how that relates to the Fund's total expense ratio and particularly the Fund's management fee rate, which does not include a breakpoint. In conjunction with its review of the Adviser's profitability, the Board discussed with the Adviser how a change in assets can affect the efficiency or effectiveness of managing the Fund and whether the management fee level is appropriate relative to current and projected asset levels and/or whether the management fee structure reflects economies of scale as asset levels change. The Board has determined that its review of the actual and/or potential economies of scale of the Fund supports its decision to approve the Management Agreement.
Profitability of the Adviser and Affiliates
The Board considered information concerning the costs incurred and profits realized by the Adviser and its affiliates during the last year from their relationship with the Fund and during the last two years from their relationship with the Morgan Stanley Fund Complex and reviewed with the Adviser the cost allocation methodology used to determine the profitability of the Adviser and affiliates. The Board has determined that its review of the analysis of the Adviser's expenses and profitability supports its decision to approve the Management Agreement.
22
Morgan Stanley Institutional Fund Trust
Annual Report — September 30, 2020
Investment Advisory Agreement Approval (unaudited) (cont'd)
Other Benefits of the Relationship
The Board considered other direct and indirect benefits to the Adviser and/or its affiliates derived from their relationship with the Fund and other funds advised by the Adviser. These benefits may include, among other things, fees for trading, distribution and/or shareholder servicing and for transaction processing and reporting platforms used by securities lending agents, and research received by the Adviser generated from commission dollars spent on funds' portfolio trading. The Board reviewed with the Adviser these arrangements and the reasonableness of the Adviser's costs relative to the services performed. The Board has determined that its review of the other benefits received by the Adviser or its affiliates supports its decision to approve the Management Agreement.
Resources of the Adviser and Historical Relationship Between the Fund and the Adviser
The Board considered whether the Adviser is financially sound and has the resources necessary to perform its obligations under the Management Agreement. The Board also reviewed and considered the historical relationship between the Fund and the Adviser, including the organizational structure of the Adviser, the policies and procedures formulated and adopted by the Adviser for managing the Fund's operations and the Board's confidence in the competence and integrity of the senior managers and key personnel of the Adviser. The Board concluded that the Adviser has the financial resources necessary to fulfill its obligations under the Management Agreement and that it is beneficial for the Fund to continue its relationship with the Adviser.
Other Factors and Current Trends
The Board considered the controls and procedures adopted and implemented by the Adviser and monitored by the Fund's Chief Compliance Officer and concluded that the conduct of business by the Adviser indicates a good faith effort on its part to adhere to high ethical standards in the conduct of the Fund's business.
As part of the Board's review, the Board received information from management on the impact of COVID-19 on the firm generally and the Adviser and the Fund in particular including, among other information, the pandemic's current and expected impact on the Fund's performance and operations.
General Conclusion
After considering and weighing all of the above factors, with various written materials and verbal information presented by the Adviser, the Board concluded that it would be in the best interest of the Fund and its shareholders to approve renewal of the Management Agreement for another year. In reaching this conclusion the Board did not give particular weight to any single piece of information or factor referenced above. The Board considered these factors and information over the course of the year and in numerous meetings, some of which were in executive session with only the independent Board members and their counsel present. It is possible that individual Board members may have weighed these factors, and the information presented, differently in reaching their individual decisions to approve the Management Agreement.
23
Morgan Stanley Institutional Fund Trust
Annual Report — September 30, 2020
Liquidity Risk Management Program (unaudited)
In compliance with Rule 22e-4 under the Investment Company Act of 1940, as amended (the "Liquidity Rule"), the Fund has adopted and implemented a liquidity risk management program (the "Program"), which is reasonably designed to assess and manage the risk that the Fund could not meet requests to redeem shares issued by the Fund without significant dilution of remaining investors' interests in the Fund (i.e., liquidity risk). The Fund's Board of Trustees (the "Board") previously approved the designation of the Liquidity Risk Subcommittee (the "LRS") as Program administrator. The LRS is comprised of representatives from various divisions within Morgan Stanley Investment Management.
At a meeting held on April 22-23, 2020, the Board reviewed a written report prepared by the LRS that addressed the Program's operation and assessed its adequacy, and effectiveness of implementation for the period from December 1, 2018, through December 31, 2019, as required under the Liquidity Rule. The report concluded that the Program operated effectively and was adequately and effectively implemented in all material aspects, and that the relevant controls and safeguards were appropriately designed to enable the LRS to administer the Program in compliance with the Liquidity Rule.
In accordance with the Program, the LRS assessed each Fund's liquidity risk no less frequently than annually taking into consideration certain factors, as applicable, such as (i) investment strategy and liquidity of portfolio investments, (ii) short-term and long-term cash flow projections and (iii) holdings of cash and cash equivalents and borrowing arrangements and other funding sources. Certain factors are considered under both normal and reasonably foreseeable stressed conditions.
Each Fund portfolio investment is classified into one of four liquidity categories, which classification is assessed at least monthly by the LRS. The classification is based on a determination of the number of days it is reasonably expected to take to convert the investment into cash, or sell or dispose of the investment, in current market conditions without significantly changing the market value of the investment. Liquidity classification determinations take into account various market, trading and investment-specific considerations, as well as market depth, and in some cases utilize third-party vendor data.
The Liquidity Rule limits a fund's investments in illiquid investments to 15% of its net assets and requires funds that do not primarily hold assets that are highly liquid investments to determine and maintain a minimum percentage of the fund's net assets to be invested in highly liquid investments (highly liquid investment minimum or "HLIM"). The LRS believes that the Program includes provisions reasonably designed to review, monitor and comply with the 15% limit on illiquid investments and for determining, periodically reviewing and complying with the HLIM requirement, as applicable.
There can be no assurance that the Program will achieve its objectives under all circumstances in the future. Please refer to the Fund's prospectus for more information regarding the Fund's exposure to liquidity risk and other risks to which it may be subject.
24
Morgan Stanley Institutional Fund Trust
Annual Report — September 30, 2020
Federal Tax Notice (unaudited)
For federal income tax purposes, the following information is furnished with respect to the distributions paid by the Fund during its taxable year ended September 30, 2020. The Fund designated 100.0% of its income dividends as tax-exempt income dividends.
In January, the Fund provides tax information to shareholders for the preceding calendar year.
25
Morgan Stanley Institutional Fund Trust
Annual Report — September 30, 2020
Privacy Notice (unaudited) April 2019
FACTS | | WHAT DOES MSIM DO WITH YOUR PERSONAL INFORMATION? | |
Why? | | Financial companies choose how they share your personal information. Federal law gives consumers the right to limit some but not all sharing. Federal law also requires us to tell you how we collect, share, and protect your personal information. Please read this notice carefully to understand what we do. | |
What? | | The types of personal information we collect and share depend on the product or service you have with us. This information can include:
n Social Security number and income
n investment experience and risk tolerance
n checking account number and wire transfer instructions | |
How? | | All financial companies need to share customers' personal information to run their everyday business. In the section below, we list the reasons financial companies can share their customers' personal information; the reasons MSIM chooses to share; and whether you can limit this sharing. | |
Reasons we can share your personal information | | Does MSIM share? | | Can you limit this sharing? | |
For our everyday business purposes —
such as to process your transactions, maintain your account(s), respond to court orders and legal investigations, or report to credit bureaus | | Yes | | No | |
For our marketing purposes —
to offer our products and services to you | | Yes | | No | |
For joint marketing with other financial companies | | No | | We don't share | |
For our affiliates' everyday business purposes —
information about your transactions and experiences | | Yes | | No | |
For our affiliates' everyday business purposes —
information about your creditworthiness | | No | | We don't share | |
For our affiliates to market to you | | No | | We don't share | |
For non-affiliates to market to you | | No | | We don't share | |
Questions? Call toll-free (844) 312-6327 or email: imprivacyinquiries@morganstanley.com
26
Morgan Stanley Institutional Fund Trust
Annual Report — September 30, 2020
Privacy Notice (unaudited) (cont'd) April 2019
Who we are
Who is providing this notice? | | Morgan Stanley Investment Management, Inc. and its affiliated registered investment advisers, registered broker-dealers, and registered and unregistered funds ("MSIM") | |
What we do
How does MSIM protect my personal information? | | To protect your personal information from unauthorized access and use, we use security measures that comply with federal law. These measures include computer safeguards and secured files and buildings. We have policies governing the proper handling of customer information by personnel and requiring third parties that provide support to adhere to appropriate security standards with respect to such information. | |
How does MSIM collect my personal information? | | We collect your personal information, for example, when you
n open an account or make deposits or withdrawals from your account
n buy securities from us or make a wire transfer
n give us your contact information
We also collect your personal information from others, such as credit bureaus, affiliates, or other companies. | |
Why can't I limit all sharing? | | Federal law gives you the right to limit only
n sharing for affiliates' everyday business purposes — information about your creditworthiness
n affiliates from using your information to market to you
n sharing for non-affiliates to market to you
State laws and individual companies may give you additional rights to limit sharing. See below for more on your rights under state law. | |
Definitions
Affiliates | | Companies related by common ownership or control. They can be financial and non-financial companies.
n Our affiliates include companies with a Morgan Stanley name and financial companies such as Morgan Stanley Smith Barney LLC and Morgan Stanley & Co. | |
Non-affiliates | | Companies not related by common ownership or control. They can be financial and non-financial companies.
n MSIM does not share with non-affiliates so they can market to you. | |
Joint marketing | | A formal agreement between non-affiliated financial companies that together market financial products or services to you.
n MSIM doesn't jointly market | |
Other Important Information
Vermont: Except as permitted by law, we will not share personal information we collect about Vermont residents with Non-affiliates unless you provide us with your written consent to share such information.
California: Except as permitted by law, we will not share personal information we collect about California residents with Non-affiliates and we will limit sharing such personal information with our Affiliates to comply with California privacy laws that apply to us.
27
Morgan Stanley Institutional Fund Trust
Annual Report — September 30, 2020
Trustee and Officer Information (unaudited)
Independent Trustees:
Name, Address and Birth Year
of Independent Trustee | | Position(s)
Held with
Registrant | | Length of Time
Served* | | Principal Occupation(s) During Past 5 Years
and Other Relevant Professional Experience | | Number of
Funds in
Fund Complex
Overseen by
Independent
Trustee** | | Other Directorships
Held by Independent
Trustee*** | |
Frank L. Bowman
c/o Perkins Coie LLP
Counsel to the Independent Trustees
1155 Avenue of the Americas, 22nd Floor
New York, NY 10036
Birth Year 1944 | | Trustee | | Since
August
2006 | | President, Strategic Decisions, LLC (consulting) (since February 2009); Director or Trustee of various Morgan Stanley Funds (since August 2006); Chairperson of the Compliance and Insurance Committee (since October 2015); formerly, Chairperson of the Insurance Sub-Committee of the Compliance and Insurance Committee (2007-2015); served as President and Chief Executive Officer of the Nuclear Energy Institute (policy organization) (February 2005-November 2008); retired as Admiral, U.S. Navy after serving over 38 years on active duty including 8 years as Director of the Naval Nuclear Propulsion Program in the Department of the Navy and the U.S. Department of Energy (1996-2004); served as Chief of Naval Personnel (July 1994-September 1996) and on the Joint Staff as Director of Political Military Affairs (June 1992-July 1994); knighted as Honorary Knight Commander of the Most Excellent Order of the British Empire; awarded the Officier de l'Orde National du Mérite by the French Government; elected to the National Academy of Engineering (2009). | | | 86 | | | Director of Naval and Nuclear Technologies LLP; Director Emeritus of the Armed Services YMCA; Member of the National Security Advisory Council of the Center for U.S. Global Engagement and a member of the CNA Military Advisory Board; Trustee of Fairhaven United Methodist Church; Member of the Board of Advisors of the Dolphin Scholarship Foundation; Director of other various non-profit organizations; Formerly, Director of BP p.l.c. (November 2010-May 2019). | |
Kathleen A. Dennis
c/o Perkins Coie LLP
Counsel to the Independent Trustees
1155 Avenue of the Americas, 22nd Floor
New York, NY 10036
Birth Year 1953 | | Trustee | | Since
August
2006 | | President, Cedarwood Associates (mutual fund and investment management consulting) (since July 2006); Chairperson of the Liquidity and Alternatives Sub-Committee of the Investment Committee (since October 2006) and Director or Trustee of various Morgan Stanley Funds (since August 2006); formerly, Senior Managing Director of Victory Capital Management (1993-2006). | | | 86 | | | Director of various
non-profit organizations. | |
Nancy C. Everett
c/o Perkins Coie LLP
Counsel to the Independent Trustees
1155 Avenue of the Americas, 22nd Floor
New York, NY 10036
Birth Year 1955 | | Trustee | | Since
January
2015 | | Chief Executive Officer, Virginia Commonwealth University Investment Company (since November 2015); Owner, OBIR, LLC (institutional investment management consulting) (since June 2014); formerly, Managing Director, BlackRock, Inc. (February 2011-December 2013); and Chief Executive Officer, General Motors Asset Management (a/k/a Promark Global Advisors, Inc.) (June 2005-May 2010). | | | 87 | | | Formerly, Member of Virginia Commonwealth University School of Business Foundation (2005-2016); Member of Virginia Commonwealth University Board of Visitors (2013-2015); Member of Committee on Directors for Emerging Markets Growth Fund, Inc. (2007-2010); Chairperson of Performance Equity Management, LLC (2006-2010); and Chairperson, GMAM Absolute Return Strategies Fund, LLC (2006-2010). | |
28
Morgan Stanley Institutional Fund Trust
Annual Report — September 30, 2020
Trustee and Officer Information (unaudited) (cont'd)
Independent Trustees: (cont'd)
Name, Address and Birth Year
of Independent Trustee | | Position(s)
Held with
Registrant | | Length of Time
Served* | | Principal Occupation(s) During Past 5 Years
and Other Relevant Professional Experience | | Number of
Funds in
Fund Complex
Overseen by
Independent
Trustee** | | Other Directorships
Held by Independent
Trustee*** | |
Jakki L. Haussler
c/o Perkins Coie LLP
Counsel to the Independent Trustees
1155 Avenue of the Americas, 22nd Floor
New York, NY 10036
Birth Year 1957 | | Trustee | | Since
January
2015 | | Chairman, Opus Capital Group (since January 1996); formerly, Chief Executive Officer, Opus Capital Group (1996-2019); Director, Capvest Venture Fund, LP (May 2000-December 2011); Partner, Adena Ventures, LP (July 1999-December 2010); Director, The Victory Funds (February 2005-July 2008). | | | 87 | | | Director of Service Corporation International and Member, Audit Committee and Investment Committee; Director of Cincinnati Bell Inc. and Member, Audit Committee and Governance and Nominating Committee; Director of Northern Kentucky University Foundation and Member, Investment Committee; Member of Chase College of Law Transactional Law Practice Center Board of Advisors; Director of Chase College of Law Board of Visitors; formerly, Member, University of Cincinnati Foundation Investment Committee; Member, Miami University Board of Visitors (2008-2011); Trustee of Victory Funds (2005-2008) and Chairman, Investment Committee (2007-2008); Member, Service Provider Committee (2005-2008) and Director of Best Transport (2006-2019). | |
Dr. Manuel H. Johnson
c/o Johnson Smick
International, Inc.
220 I Street, NE — Suite 200 Washington, D.C. 20002
Birth Year 1949 | | Trustee | | Since
July
1991 | | Senior Partner, Johnson Smick International, Inc. (consulting firm); Chairperson of the Investment Committee (since October 2006) and Director or Trustee of various Morgan Stanley Funds (since July 1991); Co-Chairman and a founder of the Group of Seven Council (G7C) (international economic commission); formerly, Chairperson of the Audit Committee (July 1991-September 2006), Vice Chairman of the Board of Governors of the Federal Reserve System and Assistant Secretary of the U.S. Treasury. | | | 86 | | | Director of NVR, Inc. (home construction). | |
Joseph J. Kearns
c/o Perkins Coie LLP
Counsel to the Independent Trustees
1155 Avenue of the Americas, 22nd Floor
New York, NY 10036
Birth Year 1942 | | Trustee | | Since
August
1994 | | Senior Adviser, Kearns & Associates LLC (investment consulting); Chairperson of the Audit Committee (since October 2006) and Director or Trustee of various Morgan Stanley Funds (since August 1994); Director, Rubicorn Investments (since February 2019); formerly, Deputy Chairperson of the Audit Committee (July 2003-September 2006) and Chairperson of the Audit Committee of various Morgan Stanley Funds (since August 1994); CFO of the J. Paul Getty Trust (1982-1999). | | | 87 | | | Prior to August 10, 2016, Director of Electro Rent Corporation (equipment leasing); Prior to December 31, 2013, Director of The Ford Family Foundation. | |
29
Morgan Stanley Institutional Fund Trust
Annual Report — September 30, 2020
Trustee and Officer Information (unaudited) (cont'd)
Independent Trustees: (cont'd)
Name, Address and Birth Year
of Independent Trustee | | Position(s)
Held with
Registrant | | Length of Time
Served* | | Principal Occupation(s) During Past 5 Years
and Other Relevant Professional Experience | | Number of
Funds in
Fund Complex
Overseen by
Independent
Trustee** | | Other Directorships
Held by Independent
Trustee*** | |
Michael F. Klein
c/o Perkins Coie LLP
Counsel to the Independent Trustees
1155 Avenue of the Americas, 22nd Floor
New York, NY 10036
Birth Year 1958 | | Trustee | | Since
August
2006 | | Managing Director, Aetos Alternatives Management, LP (since March 2000); Co-President, Aetos Alternatives Management, LP (since January 2004) and Co-Chief Executive Officer of Aetos Alternatives Management, LP (since August 2013); Chairperson of the Fixed Income Sub-Committee of the Investment Committee (since October 2006) and Director or Trustee of various Morgan Stanley Funds (since August 2006); formerly, Managing Director, Morgan Stanley & Co. Inc. and Morgan Stanley Dean Witter Investment Management and President, various Morgan Stanley Funds (June 1998-March 2000); Principal, Morgan Stanley & Co. Inc. and Morgan Stanley Dean Witter Investment Management (August 1997-December 1999). | | | 86 | | | Director of certain investment funds managed or sponsored by Aetos Alternatives Management, LP; Director of Sanitized AG and Sanitized Marketing AG (specialty chemicals). | |
Patricia Maleski
c/o Perkins Coie LLP
Counsel to the Independent Trustees
1155 Avenue of the Americas, 22nd Floor
New York, NY 10036
Birth Year 1960 | | Trustee | | Since
January
2017 | | Managing Director, JPMorgan Asset Management (2004-2016); Oversight and Control Head of Fiduciary and Conflicts of Interest Program (2015-2016); Chief Control Officer-Global Asset Management (2013-2015); President, JPMorgan Funds (2010-2013); Chief Administrative Officer (2004-2013); various other positions including Treasurer and Board Liaison (since 2001). | | | 87 | | | None. | |
W. Allen Reed
c/o Perkins Coie LLP
Counsel to the Independent Trustees
1155 Avenue of the Americas, 22nd Floor
New York, NY 10036
Birth Year 1947 | | Chair of the Board and Trustee | | Chair of the Boards since August 2020 and Trustee since August 2006 | | Chair of the Boards of various Morgan Stanley Funds (since August 2020); Chairperson of the Governance Committee; Chairperson of the Equity Sub-Committee of the Investment Committee (since October 2006) and Director or Trustee of various Morgan Stanley Funds (since August 2006); formerly, Vice Chair of the Boards of various Morgan Stanley Funds (January 2020-August 2020); President and Chief Executive Officer of General Motors Asset Management; Chairman and Chief Executive Officer of the GM Trust Bank and Corporate Vice President of General Motors Corporation (August 1994-December 2005). | | | 86 | | | Formerly, Director of Legg Mason, Inc. (2006-2019); and Director of the Auburn University Foundation (2010-2015). | |
* This is the earliest date the Trustee began serving the Morgan Stanley Funds. Each Trustee serves an indefinite term, until his or her successor is elected.
** The Fund Complex includes (as of December 31, 2019) all open-end and closed-end funds (including all of their portfolios) advised by Morgan Stanley Investment Management Inc. (the "Adviser") and any funds that have an adviser that is an affiliated person of the Adviser (including, but not limited to, Morgan Stanley AIP GP LP).
*** This includes any directorships at public companies and registered investment companies held by the Trustee at any time during the past five years.
30
Morgan Stanley Institutional Fund Trust
Annual Report — September 30, 2020
Trustee and Officer Information (unaudited) (cont'd)
Executive Officers:
Name, Address and Birth Year
of Executive Officer | | Position(s) Held
with
Registrant | | Length of
Time Served* | | Principal Occupation(s) During Past 5 Years | |
John H. Gernon
522 Fifth Avenue
New York, NY 10036
Birth Year 1963 | | President and Principal Executive Officer | | Since September 2013 | | President and Principal Executive Officer of the Equity and Fixed Income Funds and the Morgan Stanley AIP Funds (since September 2013) and the Liquidity Funds and various money market funds (since May 2014) in the Fund Complex; Managing Director of the Adviser; Head of Public Markets Product Development (since 2006). | |
Timothy J. Knierim
522 Fifth Avenue
New York, NY 10036
Birth Year 1959 | | Chief Compliance Officer | | Since December 2016 | | Managing Director of the Adviser and various entities affiliated with the Adviser; Chief Compliance Officer of various Morgan Stanley Funds and the Adviser (since December 2016) and Chief Compliance Officer of Morgan Stanley AIP GP LP (since 2014). Formerly, Managing Director and Deputy Chief Compliance Officer of the Adviser (2014-2016); and formerly, Chief Compliance Officer of Prudential Investment Management, Inc. (2007-2014). | |
Francis J. Smith
522 Fifth Avenue
New York, NY 10036
Birth Year 1965 | | Treasurer and Principal Financial Officer | | Treasurer since July 2003 and Principal Financial Officer since September 2002 | | Managing Director of the Adviser and various entities affiliated with the Adviser; Treasurer (since July 2003) and Principal Financial Officer of various Morgan Stanley Funds (since September 2002). | |
Mary E. Mullin
522 Fifth Avenue
New York, NY 10036
Birth Year 1967 | | Secretary | | Since
June
1999 | | Managing Director of the Adviser; Secretary of various Morgan Stanley Funds (since June 1999). | |
Michael J. Key
522 Fifth Avenue
New York, NY 10036
Birth Year 1979 | | Vice President | | Since
June
2017 | | Vice President of the Equity and Fixed Income Funds, Liquidity Funds, various money market funds and the Morgan Stanley AIP Funds in the Fund Complex (since June 2017); Executive Director of the Adviser; Head of Product Development for Equity and Fixed Income Funds (since August 2013). | |
* This is the earliest date the officer began serving the Morgan Stanley Funds. Each officer serves a one-year term, until his or her successor is elected and qualifies.
31
Morgan Stanley Institutional Fund Trust
Annual Report — September 30, 2020
Adviser and Administrator
Morgan Stanley Investment Management Inc.
522 Fifth Avenue
New York, New York 10036
Distributor
Morgan Stanley Distribution, Inc.
522 Fifth Avenue
New York, New York 10036
Dividend Disbursing and Transfer Agent
DST Asset Manager Solutions, Inc.
2000 Crown Colony Drive
Quincy, Massachusetts 02169
Co-Transfer Agent
Morgan Stanley Services Company, Inc.
522 Fifth Avenue
New York, New York 10036
Custodian
State Street Bank and Trust Company
One Lincoln Street
Boston, Massachusetts 02111
Legal Counsel
Dechert LLP
1095 Avenue of the Americas
New York, New York 10036
Counsel to the Independent Trustees
Perkins Coie LLP
1155 Avenue of the Americas,
22nd Floor
New York, New York 10036
Independent Registered Public Accounting Firm
Ernst & Young LLP
200 Clarendon Street
Boston, Massachusetts 02116
Reporting to Shareholders
Each Morgan Stanley fund provides a complete schedule of portfolio holdings in its Semi-Annual and the Annual Reports within 60 days of the end of the fund's second and fourth fiscal quarters. The Semi-Annual and Annual Reports are filed electronically with the Securities and Exchange Commission ("SEC") on Form N-CSRS and Form N-CSR, respectively. Morgan Stanley also delivers the Semi-Annual and Annual Reports to fund shareholders and makes these reports available on its public website, www.morganstanley.com/im/shareholderreports. Each Morgan Stanley non-money market fund also files a complete schedule of portfolio holdings with the SEC for the fund's first and third fiscal quarters as an attachment to Form N-PORT. Morgan Stanley does not deliver the reports for the first and third fiscal quarters to shareholders, nor are the reports posted to the Morgan Stanley public website. However, the holdings for each money market fund are posted to the Morgan Stanley public website. You may obtain the Form N-PORT filings (as well as the Form N-CSR and N-CSRS filings) by accessing the SEC's website, www.sec.gov. You can also request copies of these materials, upon payment of a duplicating fee, by electronic request at the SEC's email address (publicinfo@sec.gov).
Proxy Voting Policies and Procedures and Proxy Voting Record
You may obtain a copy of the Trust's Proxy Voting Policy and Procedures and information regarding how the Trust voted proxies relating to portfolio securities during the most recent twelve-month period ended June 30, without charge, upon request, by calling toll free 1 (800) 548-7786 or by visiting our website at www.morganstanley.com/im/shareholderreports. This information is also available on the SEC's website at www.sec.gov.
This report is authorized for distribution only when preceded or accompanied by a prospectus or summary prospectus of the applicable Fund of Morgan Stanley Institutional Fund Trust, which describes in detail the Fund's investment policies, risks, fees and expenses. Please read the prospectus carefully before you invest or send money. For additional information, including information regarding the investments comprising the Fund, please visit our website at www.morganstanley.com/im/shareholderreports or call toll free 1 (800) 548-7786.
32
Printed in U.S.A.
This Report has been prepared for shareholders and may be distributed to others only if preceded or accompanied by a current prospectus.
Morgan Stanley Investment Management Inc.
522 Fifth Avenue
New York, New York 10036
© 2020 Morgan Stanley. Morgan Stanley Distribution, Inc.

IFTUSMIANN
3300495 EXP 11.30.21
Item 2. Code of Ethics.
(a) The registrant has adopted a code of ethics (the "Code of Ethics") that applies to its principal executive officer, principal financial officer, principal accounting officer or controller, or persons performing similar functions, regardless of whether these individuals are employed by the registrant or a third party.
(b) No information need be disclosed pursuant to this paragraph.
(c) Not applicable.
(d) Not applicable.
(e) Not applicable.
(f)
(1) The registrant’s Code of Ethics is attached hereto as Exhibit 13 A.
(2) Not applicable.
(3) Not applicable.
Item 3. Audit Committee Financial Expert.
The registrant's Board of Trustees has determined that Joseph J. Kearns, an “independent” Trustee, is an “audit committee financial expert" serving on its audit committee. Under applicable securities laws, a person who is determined to be an audit committee financial expert will not be deemed an "expert" for any purpose, including without limitation for the purposes of Section 11 of the Securities Act of 1933, as a result of being designated or identified as an audit committee financial expert. The designation or identification of a person as an audit committee financial expert does not impose on such person any duties, obligations, or liabilities that are greater than the duties, obligations, and liabilities imposed on such person as a member of the audit committee and Board of Trustees in the absence of such designation or identification.
Item 4. Principal Accountant Fees and Services.
(a)(b)(c)(d) and (g). Based on fees billed for the periods shown:
2020
| | | Registrant | | | Covered Entities(1) | |
| Audit Fees | | $ | 734,650 | | | | N/A | |
| | | | | | | | | |
| Non-Audit Fees | | | | | | | | |
| Audit-Related Fees | | $ | — | (2) | | $ | — | (2) |
| Tax Fees | | $ | — | (3) | | $ | 306,320 | (4) |
| All Other Fees | | $ | — | | | $ | 30,000 | (5) |
| Total Non-Audit Fees | | $ | — | | | $ | 336,320 | |
| | | | | | | | | |
| Total | | $ | 734,650 | | | $ | 336,320 | |
2019
| | | Registrant | | | Covered Entities(1) | |
| Audit Fees | | $ | 570,650 | | | | N/A | |
| | | | | | | | | |
| Non-Audit Fees | | | | | | | | |
| Audit-Related Fees | | $ | — | (2) | | $ | — | (2) |
| Tax Fees | | $ | 53,684 | (3) | | $ | 507,296 | (4) |
| All Other Fees | | $ | — | | | $ | 144,110 | (5) |
| Total Non-Audit Fees | | $ | 53,684 | | | $ | 651,406 | |
| | | | | | | | | |
| Total | | $ | 624,334 | | | $ | 651,406 | |
_______________________________
N/A- Not applicable, as not required by Item 4.
| (1) | Covered Entities include the Adviser (excluding sub-advisors) and any entity controlling, controlled by or under common control with the Adviser that provides ongoing services to the Registrant. |
| (2) | Audit-Related Fees represent assurance and related services provided that are reasonably related to the performance of the audit of the financial statements of the Covered Entities' and funds advised by the Adviser or its affiliates, specifically data verification and agreed-upon procedures related to asset securitizations and agreed-upon procedures engagements. |
| (3) | Tax Fees represent tax compliance, tax planning and tax advice services provided in connection with the preparation and review of the Registrant’s tax returns. |
| (4) | Tax Fees represent tax compliance, tax planning and tax advice services provided in connection with the review of Covered Entities' tax returns. |
| (5) | All other fees represent project management for future business applications and improving business and operational processes. |
(e)(1) The audit committee’s pre-approval policies and procedures are as follows:
AUDIT COMMITTEE
AUDIT AND NON-AUDIT SERVICES
PRE-APPROVAL POLICY AND PROCEDURES
OF THE
MORGAN STANLEY FUNDS
AS ADOPTED AND AMENDED JULY 23, 2004 AND JUNE 12 AND 13, 20193
| 1. | Statement of Principles |
The Audit Committee of the Board is required to review and, in its sole discretion, pre-approve all Covered Services to be provided by the Independent Auditors to the Fund and Covered Entities in order to assure that services performed by the Independent Auditors do not impair the auditor’s independence from the Fund.
The SEC has issued rules specifying the types of services that an independent auditor may not provide to its audit client, as well as the audit committee’s administration of the engagement of the independent auditor. The SEC’s rules establish two different approaches to pre-approving services, which the SEC considers to be equally valid. Proposed services either: may be pre-approved without consideration of specific case-by-case services by the Audit Committee (“general pre-approval”); or require the specific pre-approval of the Audit Committee or its delegate (“specific pre-approval”). The Audit Committee believes that the combination of these two approaches in this Policy will result in an effective and efficient procedure to pre-approve services performed by the Independent Auditors. As set forth in this Policy, unless a type of service has received general pre-approval, it will require specific pre-approval by the Audit Committee (or by any member of the Audit Committee to which pre-approval authority has been delegated) if it is to be provided by the Independent Auditors. Any proposed services exceeding pre-approved cost levels or budgeted amounts will also require specific pre-approval by the Audit Committee.
The appendices to this Policy describe the Audit, Audit-related, Tax and All Other services that have the general pre-approval of the Audit Committee. The term of any general pre-approval is 12 months from the date of pre-approval, unless the Audit Committee considers and provides a different period and states otherwise. The Audit Committee will annually review and pre-approve the services that may be provided by the Independent Auditors without obtaining specific pre-approval from the Audit Committee. The Audit Committee will add to or subtract from the list of general pre-approved services from time to time, based on subsequent determinations.
The purpose of this Policy is to set forth the policy and procedures by which the Audit Committee intends to fulfill its responsibilities. It does not delegate the Audit Committee’s responsibilities to pre-approve services performed by the Independent Auditors to management.
The Fund’s Independent Auditors have reviewed this Policy and believes that implementation of the Policy will not adversely affect the Independent Auditors’ independence.
3 This Audit Committee Audit and Non-Audit Services Pre-Approval Policy and Procedures (the “Policy”), adopted as of the date above, supersedes and replaces all prior versions that may have been adopted from time to time.
As provided in the Act and the SEC’s rules, the Audit Committee may delegate either type of pre-approval authority to one or more of its members. The member to whom such authority is delegated must report, for informational purposes only, any pre-approval decisions to the Audit Committee at its next scheduled meeting.
The annual Audit services engagement terms and fees are subject to the specific pre-approval of the Audit Committee. Audit services include the annual financial statement audit and other procedures required to be performed by the Independent Auditors to be able to form an opinion on the Fund’s financial statements. These other procedures include information systems and procedural reviews and testing performed in order to understand and place reliance on the systems of internal control, and consultations relating to the audit. The Audit Committee will approve, if necessary, any changes in terms, conditions and fees resulting from changes in audit scope, Fund structure or other items.
In addition to the annual Audit services engagement approved by the Audit Committee, the Audit Committee may grant general pre-approval to other Audit services, which are those services that only the Independent Auditors reasonably can provide. Other Audit services may include statutory audits and services associated with SEC registration statements (on Forms N-1A, N-2, N-3, N-4, etc.), periodic reports and other documents filed with the SEC or other documents issued in connection with securities offerings.
The Audit Committee has pre-approved the Audit services in Appendix A. All other Audit services not listed in Appendix A must be specifically pre-approved by the Audit Committee (or by any member of the Audit Committee to which pre-approval has been delegated).
Audit-related services are assurance and related services that are reasonably related to the performance of the audit or review of the Fund’s financial statements and, to the extent they are Covered Services, the Covered Entities or that are traditionally performed by the Independent Auditors. Because the Audit Committee believes that the provision of Audit-related services does not impair the independence of the auditor and is consistent with the SEC’s rules on auditor independence, the Audit Committee may grant general pre-approval to Audit-related services. Audit-related services include, among others, accounting consultations related to accounting, financial reporting or disclosure matters not classified as “Audit services”; assistance with understanding and implementing new accounting and financial reporting guidance from rulemaking authorities; agreed-upon or expanded audit procedures related to accounting and/or billing records required to respond to or comply with financial, accounting or regulatory reporting matters; and assistance with internal control reporting requirements under Forms N-CEN and/or N-CSR.
The Audit Committee has pre-approved the Audit-related services in Appendix A. All other Audit-related services not listed in Appendix A must be specifically pre-approved by the Audit Committee (or by any member of the Audit Committee to which pre-approval has been delegated).
The Audit Committee believes that the Independent Auditors can provide Tax services to the Fund and, to the extent they are Covered Services, the Covered Entities, such as tax compliance, tax planning and tax advice without impairing the auditor’s independence, and the SEC has stated that the Independent Auditors may provide such services.
Pursuant to the preceding paragraph, the Audit Committee has pre-approved the Tax Services in Appendix A. All Tax services in Appendix A must be specifically pre-approved by the Audit Committee (or by any member of the Audit Committee to which pre-approval has been delegated).
The Audit Committee believes, based on the SEC’s rules prohibiting the Independent Auditors from providing specific non-audit services, that other types of non-audit services are permitted. Accordingly, the Audit Committee believes it may grant general pre-approval to those permissible non-audit services classified as All Other services that it believes are routine and recurring services, would not impair the independence of the auditor and are consistent with the SEC’s rules on auditor independence.
The Audit Committee has pre-approved the All Other services in Appendix A. Permissible All Other services not listed in Appendix A must be specifically pre-approved by the Audit Committee (or by any member of the Audit Committee to which pre-approval has been delegated).
| 7. | Pre-Approval Fee Levels or Budgeted Amounts |
Pre-approval fee levels or budgeted amounts for all services to be provided by the Independent Auditors will be established annually by the Audit Committee. Any proposed services exceeding these levels or amounts will require specific pre-approval by the Audit Committee. The Audit Committee is mindful of the overall relationship of fees for audit and non-audit services in determining whether to pre-approve any such services.
All requests or applications for services to be provided by the Independent Auditors that do not require specific approval by the Audit Committee will be submitted to the Fund’s Principal Financial and Accounting Officer and must include a detailed description of the services to be rendered. The Fund’s Principal Financial and Accounting Officer will determine whether such services are included within the list of services that have received the general pre-approval of the Audit Committee. The Audit Committee will be informed on a timely basis of any such services rendered by the Independent Auditors. Requests or applications to provide services that require specific approval by the Audit Committee or Chairperson of the Audit Committee will be submitted to the Audit Committee by the Fund's Principal Financial and Accounting Officer, who, after consultation with the Independent Auditors, will discuss whether, the request or application is consistent with the SEC’s rules on auditor independence.
The Audit Committee has designated the Fund’s Principal Financial and Accounting Officer to monitor the performance of all services provided by the Independent Auditors and to determine whether such services are in compliance with this Policy. The Fund’s Principal Financial and Accounting Officer will report to the Audit Committee on a periodic basis on the results of its monitoring. Both the Fund’s Principal Financial and Accounting Officer and management will immediately report to the Chairperson of the Audit Committee any breach of this Policy that comes to the attention of the Fund’s Principal Financial and Accounting Officer or any member of management.
| 9. | Additional Requirements |
The Audit Committee has determined to take additional measures on an annual basis to meet its responsibility to oversee the work of the Independent Auditors and to assure the auditor’s independence from the Fund, such as reviewing a formal written statement from the Independent Auditors delineating all relationships between the Independent Auditors and the Fund, consistent with the PCAOB’s Ethics and Independence Rule 3526, and discussing with the Independent Auditors its methods and procedures for ensuring independence.
Covered Entities include the Fund’s investment adviser(s) and any entity controlling, controlled by or under common control with the Fund’s investment adviser(s) that provides ongoing services to the Fund(s). Beginning with non-audit service contracts entered into on or after May 6, 2003, the Fund’s audit committee must pre-approve non-audit services provided not only to the Fund but also to the Covered Entities if the engagements relate directly to the operations and financial reporting of the Fund. This list of Covered Entities would include:
Morgan Stanley Funds
Morgan Stanley & Co. LLC
Morgan Stanley Investment Management Inc.
Morgan Stanley Investment Management Limited
Morgan Stanley Investment Management Private Limited
Morgan Stanley Asset & Investment Trust Management Co., Limited
Morgan Stanley Investment Management Company
Morgan Stanley Services Company, Inc.
Morgan Stanley Distribution, Inc.
Morgan Stanley AIP GP LP
Morgan Stanley Alternative Investment Partners LP
Morgan Stanley Smith Barney LLC
Morgan Stanley Capital Management LLC
Morgan Stanley Asia Limited
Morgan Stanley Services Group
(e)(2) Beginning with non-audit service contracts entered into on or after May 6, 2003, the audit committee also is required to pre-approve services to Covered Entities to the extent that the services are determined to have a direct impact on the operations or financial reporting of the Registrant. 100% of such services were pre-approved by the audit committee pursuant to the Audit Committee’s pre-approval policies and procedures (attached hereto).
(f) Not applicable.
(g) See table above.
(h) The audit committee of the Board of Trustees has considered whether the provision of services other than audit services performed by the auditors to the Registrant and Covered Entities is compatible with maintaining the auditors' independence in performing audit services.
APPENDIX A
Pre-Approved Audit Services
Service
Range of Fees |
| | The
Fund(s) | Covered
Entities |
Statutory audits or financial audits for the Funds | For a complete list of fees, please contact the legal department ** | N/A |
Services associated with SEC registration statements (including new fund filings/seed audits), periodic reports and other documents filed with the SEC or other documents issued in connection with securities offerings (e.g., comfort letters for closed-end fund offerings, consents), and assistance in responding to SEC comment letters | * | * |
Consultations by the Fund’s management as to the accounting or disclosure treatment of transactions or events and/or the actual or potential impact of final or proposed rules, standards or interpretations by the SEC, FASB, or other regulatory or standard setting bodies (Note: Under SEC rules, some consultations may be “audit related” services rather than “audit” services) | * | * |
Pre-Approved Audit-Related Services
Service
Range of Fees |
| | The
Fund(s) | Covered
Entities |
| Attest procedures not required by statute or regulation | * | * |
Due diligence services pertaining to potential fund mergers | * | * |
Consultations by the Fund’s management as to the accounting or disclosure treatment of transactions or events and/or the actual or potential impact of final or proposed rules, standards or interpretations by the SEC, FASB, or other regulatory or standard-setting bodies (Note: Under SEC rules, some consultations may be “audit” services rather than “audit-related” services) | * | * |
General assistance with implementation of the requirements of SEC rules or listing standards promulgated pursuant to the Sarbanes-Oxley Act | * | * |
Pre-Approved Tax Services
Service Range of Fees |
| | The
Fund(s) | Covered
Entities |
U.S. federal, state and local tax planning and advice | * | * |
U.S. federal, state and local tax compliance | * | * |
International tax planning and advice | * | * |
International tax compliance | * | * |
Review/preparation of federal, state, local and international income, franchise, and other tax returns | $400,000 PwC | N/A |
Identification of Passive Foreign Investment Companies PwC ITV Tool – assist in determining which Fund holdings have foreign capital gains tax exposure | $150,000 PwC $125,000 PwC | * * |
| Foreign Tax Services - Preparation of local foreign tax returns and assistance with local tax compliance issues (including maintenance of transaction schedules, assistance in periodic tax remittances, tax registration, representing funds before foreign revenue authorities and assistance with assessment orders) | $500,000 PwC/EY | * |
Assistance with tax audits and appeals before the IRS and similar state, local and foreign agencies | * | * |
Tax advice and assistance regarding statutory, regulatory or administrative developments (e.g., excise tax reviews, evaluation of Fund’s tax compliance function) | * | * |
Pre-Approved All Other Services
Service
Range of Fees |
| | The
Fund(s) | Covered
Entities |
Risk management advisory services, e.g., assessment and testing of security infrastructure controls | * | * |
*Aggregate fees related to the pre-approved services will be limited to 10% of the 2020/2021 annual fees for audit and tax services (see fee schedule distributed by the Auditors).
** Audit and tax services for new funds/portfolios will be subject to the maximum audit and tax fee for a fund/portfolio on fee schedule distributed by the Auditors.
Prohibited Non-Audit Services
| · | Bookkeeping or other services related to the accounting records or financial statements of the audit client |
| · | Financial information systems design and implementation |
| · | Appraisal or valuation services, fairness opinions or contribution-in-kind reports |
| · | Internal audit outsourcing services |
| · | Broker-dealer, investment adviser or investment banking services |
| · | Expert services unrelated to the audit |
Item 5. Audit Committee of Listed Registrants.
(a) The registrant has a separately-designated standing audit committee established in accordance with Section 3(a)(58)(A) of the Exchange Act whose members are:
Joseph J. Kearns, Jakki L. Haussler, Michael F. Klein and W. Allen Reed.
(b) Not applicable.
Item 6. Schedule of Investments
(a) Refer to Item 1.
(b) Not applicable.
Item 7. Disclosure of Proxy Voting Policies and Procedures for Closed-End Management Investment Companies.
Applicable only to reports filed by closed-end funds.
Item 8. Portfolio Managers of Closed-End Management Investment Companies
Applicable only to reports filed by closed-end funds.
Item 9. Closed-End Fund Repurchases
Applicable only to reports filed by closed-end funds.
Item 10. Submission of Matters to a Vote of Security Holders
There have been no material changes to the procedures by which shareholders may recommend nominee to the Fund’s Board of Trustees since the Fund last provided disclosure in response to this item.
Item 11. Controls and Procedures
(a) The registrant’s principal executive officer and principal financial officer have concluded that the registrant’s disclosure controls and procedures are sufficient to ensure that information required to be disclosed by the registrant in this Form N-CSR was recorded, processed, summarized and reported within the time periods specified in the Securities and Exchange Commission's rules and forms, based upon such officers' evaluation of these controls and procedures as of a date within 90 days of the filing date of the report.
(b) There were no changes in the registrant's internal control over financial reporting that occurred during the second fiscal quarter of the period covered by this report that has materially affected, or is reasonably likely to materially affect, the registrant's internal control over financial reporting.
Item 12. Disclosure of Securities Lending Activities for Closed End Management Investment Companies.
Not Applicable
Item 13. Exhibits
SIGNATURES
Pursuant to the requirements of the Securities Exchange Act of 1934 and the Investment Company Act of 1940, the registrant has duly caused this report to be signed on its behalf by the undersigned, thereunto duly authorized.
Morgan Stanley Institutional Fund Trust
John H. Gernon
Principal Executive Officer
November 17, 2020
Pursuant to the requirements of the Securities Exchange Act of 1934 and the Investment Company Act of 1940, this report has been signed by the following persons on behalf of the registrant and in the capacities and on the dates indicated.
John H. Gernon
Principal Executive Officer
November 17, 2020
Francis Smith
Principal Financial Officer
November 17, 2020